Notebookcheck Logo

NVIDIA GeForce RTX 4070 Laptop GPU

NVIDIA NVIDIA GeForce RTX 4070 Laptop GPU

Karta graficzna NVIDIA GeForce RTX 4070 do laptopów (nazwa kodowa GN21-X6) to wysokiej klasy procesor graficzny do laptopów. Bazuje on na układzie AD106 i wykorzystuje architekturę Ada Lovelace. RTX 4070 oferuje 4 608 rdzeni (z 7 680 w AD106) i 128-bitową magistralę pamięci. Mobilny RTX 4070 wykorzystuje 8 GB dedykowanej pamięci graficznej GDDR6 o taktowaniu 16 Gb/s (efektywnie). TGP (Total Graphics Power) można skonfigurować w zakresie od 35 do 115 W (+ 15-25 W Dynamic Boost z CPU), co prowadzi do różnych poziomów wydajności (desktopowy RTX 4070 Ti wykorzystuje 285 W do porównań). Prędkość zegara boost waha się od 1230 MHz (przy 35 W TGP) do 2175 MHz (115 W). W związku z tym wydajność zależy również w dużej mierze od ustawień zasilania używanych dla RTX 4080 mobile w laptopie.

Wydajność powinna być niższa od desktopowego RTX 4070 Ti i dlatego najlepiej nadaje się do 2k i maksymalnych detali w wymagających grach z 2022 roku.

Nasze syntetyczne testy porównawcze przeciętnej mobilnej karty RTX 4070 pokazują wydajność nieco poniżej mobilnej RTX 3080 Ti. Jednak przy zmniejszonych limitach mocy wydajność wyraźnie cierpi, np. tylko 70% w Time Spy dla wersji z 60W TDP. W grach szybki RTX 4070 najlepiej nadaje się do grania w rozdzielczości QHD, gdzie niektóre bardzo wymagające gry nie osiągną limitu 60 fps (i mogą być zmuszone do działania w rozdzielczości 1080p, przy obniżonych ustawieniach lub przy użyciu DLSS). Poniżej znajdują się szczegółowe testy porównawcze różnych kart.

RTX 4070 oferuje 144 rdzenie tensorowe (4. generacji), które umożliwiają DLSS 3, w tym generowanie klatek w obsługiwanych grach. Ponadto 36 rdzeni raytracingowych (4. generacji) może być wykorzystywanych do efektów raytracingu w obsługiwanych grach.

Układ AD106 jest produkowany w 5 nm procesie technologicznym TSMC (4N).

GeForce RTX 4000 Laptop GPU Rodzina

NVIDIA GeForce RTX 4090 Laptop GPU 9728 @ 2.04 GHz256 bit @ 20000 MHz
NVIDIA GeForce RTX 4080 Laptop GPU 7424 @ 1.86 - 2.28 GHz192 bit @ 20000 MHz
NVIDIA GeForce RTX 4070 Laptop GPU 4608 @ 1.61 - 2.18 GHz128 bit @ 16000 MHz
NVIDIA GeForce RTX 4060 Laptop GPU 3072 @ 2.37 GHz128 bit @ 16000 MHz
NVIDIA GeForce RTX 4050 Laptop GPU 2560 @ 2.37 GHz96 bit @ 16000 MHz
Nazwa roboczaGN21-X6
ArchitekturaAda Lovelace
Potoki4608 - ZJC
TMUs144
ROPs48
Raytracing Cores36
Tensor / AI Cores144
Zegar rdzenia1605 - 2175 (Boost) MHz
Theoretical Performance15.6 TFLOPS FP16, 15.6 TFLOPS FP32
CacheL2: 32 MB
Zegar pamięci16000 effective = 2000 MHz
Magistrala128 bit
Typ pamięciGDDR6
Maks. pamięci8 GB
Pamięć współdzielonanie
Memory Bandwidth256 GB/s
APIDirectX 12 Ultimate, Shader 6.7, OpenGL 4.6, OpenCL 3.0, Vulkan 1.3
Pobór prądu115 W (35 - 115 W TGP)
Technologia5 nm
PCIe4.0 x16
Displays4 Displays (max.), HDMI 2.1, DisplayPort 1.4a
Wielkość laptopaduży
Data premiery03.01.2023
Witryna producentawww.nvidia.com
PredecessorGeForce RTX 3070 Laptop GPU

Testy

Performance Rating - 3DMark 11 + Fire Strike + Time Spy
13.6 pt (41%)
0.06605 -100%
...
NVIDIA GeForce RTX 3070 Laptop GPU
11.6 -15%
11.6 -15%
11.8 -13%
12 -12%
AMD Radeon RX 6800S
12.1 -11%
NVIDIA GeForce RTX 3080 Laptop GPU
12.4 -9%
12.7 -7%
AMD Radeon RX 6700M
12.7 -7%
12.9 -5%
NVIDIA GeForce RTX 4070 Laptop GPU
13.6
14.1 4%
15 10%
AMD Radeon RX 6800M
15.6 15%
18.2 34%
18.6 37%
21.1 55%
max:
33.3 145%
0%
100%
3DMark - 3DMark Time Spy Score
min: 5860     avg: 11895     median: 12119.5 (35%)     max: 13756 Points
3DMark - 3DMark Time Spy Graphics
min: 6241     avg: 11728     median: 11981 (32%)     max: 13336 Points
113 -99%
...
NVIDIA RTX A5000 Laptop GPU
10043 -14%
10046 -14%
10206 -13%
NVIDIA GeForce RTX 2080 Super Mobile
10301 -12%
10455 -11%
10478 -11%
NVIDIA GeForce RTX 3080 Laptop GPU
10695 -9%
10783 -8%
AMD Radeon RX 6800M
11067 -6%
NVIDIA GeForce RTX 4070 Laptop GPU
11728
11837 1%
11850 1%
12640 8%
15540 33%
17606 50%
19434 66%
20991 79%
...
19434 66%
max:
36485 211%
0%
100%
3DMark - 3DMark Ice Storm Unlimited Graphics
min: 603749     avg: 612986     median: 612986 (69%)     max: 622222 Points
3DMark - 3DMark Ice Storm Extreme Graphics
min: 105935     avg: 293783     median: 293782 (38%)     max: 481630 Points
3DMark - 3DMark Cloud Gate Score
min: 34191     avg: 60926     median: 62921 (67%)     max: 70329 Points
3DMark - 3DMark Cloud Gate Graphics
min: 54238     avg: 149792     median: 161738 (43%)     max: 193851 Points
3DMark - 3DMark Fire Strike Standard Score
min: 13535     avg: 25556     median: 26016 (46%)     max: 29200 Points
3DMark - 3DMark Fire Strike Standard Graphics
min: 16212     avg: 29156     median: 29876 (34%)     max: 33451 Points
3DMark - 3DMark Ice Storm Graphics
min: 93493     avg: 208478     median: 173633 (21%)     max: 445451 Points
3DMark - 3DMark Wild Life Extreme Unlimited
min: 17684     avg: 21519     median: 22084 (26%)     max: 24275 Points
3DMark - 3DMark Night Raid
min: 48102     avg: 52618     median: 52211.5 (49%)     max: 57948 Points
3DMark - 3DMark Night Raid Graphics Score
min: 84468     avg: 106476     median: 99644.5 (38%)     max: 142145 Points
3DMark 11 - 3DM11 Performance Score
min: 22258     avg: 33548     median: 34341 (48%)     max: 36692 Points
3DMark 11 - 3DM11 Performance GPU
min: 24229     avg: 40234     median: 40995 (35%)     max: 45606 Points
171.8 -100%
...
35286 -12%
35743 -11%
35944 -11%
AMD Radeon RX 6800S
36101 -10%
NVIDIA RTX A5000 Laptop GPU
36164 -10%
37375 -7%
37918 -6%
NVIDIA GeForce RTX 3080 Laptop GPU
38345 -5%
39402 -2%
NVIDIA GeForce RTX 4070 Laptop GPU
40234
AMD Radeon RX 6800M
40391 0%
42016 4%
43219 7%
46877 17%
53053 32%
56535 41%
59943 49%
65041 62%
...
59943 49%
max:
106023 164%
0%
100%
3DMark Vantage
3DM Vant. Perf. total +
3DMark Vantage - 3DM Vant. Perf. total
min: 94245     avg: 97154     median: 97153.5 (28%)     max: 100062 Points
3DM Vant. Perf. GPU no PhysX +
3DMark Vantage - 3DM Vant. Perf. GPU no PhysX
min: 100299     avg: 106532     median: 106532 (60%)     max: 112764 Points
62 -100%
...
82368 -23%
NVIDIA GeForce RTX 3070 Laptop GPU
85013 -20%
85672 -20%
AMD Radeon RX 6800S
86536 -19%
88394 -17%
NVIDIA GeForce RTX 3080 Laptop GPU
88465 -17%
93680 -12%
96677 -9%
102426 -4%
NVIDIA GeForce RTX 4070 Laptop GPU
106532
129977 22%
132443 24%
max:
170928 60%
0%
100%
3DMark 05 - 3DMark 05 - Standard
53254 Points (58%)
133.4 -100%
...
42967 -19%
43138 -19%
AMD Radeon 680M
43450 -18%
AMD Radeon 660M
43616 -18%
NVIDIA GeForce RTX 3070 Laptop GPU
46269 -13%
NVIDIA GeForce RTX 3060 Laptop GPU
48758 -8%
50571 -5%
AMD Radeon RX 6600M
50971 -4%
AMD Radeon RX 6800M
52117 -2%
NVIDIA GeForce RTX 4070 Laptop GPU
53254
NVIDIA GeForce RTX 3080 Laptop GPU
54967 3%
55811 5%
61850 16%
max:
87172 64%
0%
100%
3DMark 06 3DMark 06 - Standard 1280x1024 +
3DMark 06
min: 47449     avg: 58072     median: 57775 (75%)     max: 64608 Points
Unigine Valley 1.0 - Unigine Valley 1.0 DX
min: 108.4     avg: 115.1     median: 115.1 (38%)     max: 121.7 fps
Blender - Blender 3.3 Classroom CUDA *
min: 32     avg: 43.7     median: 35 (5%)     max: 172 Seconds
Blender - Blender 3.3 Classroom OPTIX *
min: 18     avg: 21.6     median: 21 (8%)     max: 28 Seconds
Blender - Blender 3.3 Classroom HIP *
330 Seconds (27%)
SPECviewperf 12
specvp12 sw-03 +
SPECviewperf 12 - specvp12 sw-03
79.8 fps (20%)
specvp12 snx-02 +
SPECviewperf 12 - specvp12 snx-02
11.4 fps (2%)
specvp12 showcase-01 +
SPECviewperf 12 - specvp12 showcase-01
117 fps (25%)
specvp12 mediacal-01 +
SPECviewperf 12 - specvp12 mediacal-01
89.3 fps (23%)
specvp12 maya-04 +
SPECviewperf 12 - specvp12 maya-04
204 fps (56%)
specvp12 energy-01 +
SPECviewperf 12 - specvp12 energy-01
20.8 fps (19%)
specvp12 creo-01 +
specvp12 catia-04 +
SPECviewperf 12 - specvp12 catia-04
109 fps (18%)
specvp12 3dsmax-05 +
SPECviewperf 12 - specvp12 3dsmax-05
234 fps (41%)
SPECviewperf 13 specvp13 sw-04 +
SPECviewperf 13 - specvp13 sw-04
min: 109.63     avg: 113     median: 114 (31%)     max: 115.44 fps
specvp13 snx-03 +
SPECviewperf 13 - specvp13 snx-03
min: 20.7     avg: 22.1     median: 22.8 (3%)     max: 22.97 fps
specvp13 showcase-02 +
SPECviewperf 13 - specvp13 showcase-02
min: 111.17     avg: 116.8     median: 117 (25%)     max: 122.16 fps
specvp13 medical-02 +
SPECviewperf 13 - specvp13 medical-02
min: 74.35     avg: 77.5     median: 77.9 (16%)     max: 80.13 fps
specvp13 maya-05 +
SPECviewperf 13 - specvp13 maya-05
min: 319.16     avg: 337.8     median: 338 (38%)     max: 356.37 fps
specvp13 energy-02 +
SPECviewperf 13 - specvp13 energy-02
min: 41     avg: 41.7     median: 41.9 (14%)     max: 42.07 fps
specvp13 creo-02 +
SPECviewperf 13 - specvp13 creo-02
min: 241.03     avg: 251.1     median: 249 (36%)     max: 263.41 fps
specvp13 catia-05 +
SPECviewperf 13 - specvp13 catia-05
min: 150.22     avg: 154.3     median: 154 (17%)     max: 158.82 fps
specvp13 3dsmax-06 +
SPECviewperf 13 - specvp13 3dsmax-06
min: 215.97     avg: 231.1     median: 234 (41%)     max: 243.42 fps
SPECviewperf 2020 specvp2020 solidworks-05 1080p +
SPECviewperf 2020 - specvp2020 solidworks-05 1080p
min: 249.69     avg: 258.3     median: 254.4 (49%)     max: 271.1 fps
specvp2020 snx-04 1080p +
SPECviewperf 2020 - specvp2020 snx-04 1080p
min: 22     avg: 22.7     median: 22.5 (4%)     max: 24.4 fps
specvp2020 medical-03 1080p +
SPECviewperf 2020 - specvp2020 medical-03 1080p
min: 32.2     avg: 34.7     median: 34.8 (36%)     max: 36.9 fps
specvp2020 maya-06 1080p +
SPECviewperf 2020 - specvp2020 maya-06 1080p
min: 355.1     avg: 382.5     median: 390 (57%)     max: 407.77 fps
specvp2020 energy-03 1080p +
SPECviewperf 2020 - specvp2020 energy-03 1080p
min: 41.3     avg: 42     median: 42 (34%)     max: 42.9 fps
specvp2020 creo-03 1080p +
SPECviewperf 2020 - specvp2020 creo-03 1080p
min: 108.9     avg: 114.2     median: 113 (56%)     max: 121.2 fps
specvp2020 catia-06 1080p +
SPECviewperf 2020 - specvp2020 catia-06 1080p
min: 63.45     avg: 65.4     median: 64.2 (41%)     max: 68.6 fps
specvp2020 3dsmax-07 1080p +
SPECviewperf 2020 - specvp2020 3dsmax-07 1080p
min: 96.87     avg: 98.3     median: 97.8 (44%)     max: 99.85 fps
specvp2020 solidworks-05 4k +
SPECviewperf 2020 - specvp2020 solidworks-05 4k
min: 115.11     avg: 183.1     median: 183.1 (54%)     max: 251 fps
specvp2020 snx-04 4k +
SPECviewperf 2020 - specvp2020 snx-04 4k
min: 17.96     avg: 19.3     median: 19.3 (2%)     max: 20.6 fps
specvp2020 medical-03 4k +
SPECviewperf 2020 - specvp2020 medical-03 4k
min: 13.87     avg: 24.9     median: 24.9 (24%)     max: 35.9 fps
specvp2020 maya-06 4k +
SPECviewperf 2020 - specvp2020 maya-06 4k
min: 213.77     avg: 299.9     median: 299.9 (49%)     max: 386 fps
specvp2020 energy-03 4k +
SPECviewperf 2020 - specvp2020 energy-03 4k
min: 28.25     avg: 34.6     median: 34.6 (8%)     max: 41 fps
specvp2020 creo-03 4k +
SPECviewperf 2020 - specvp2020 creo-03 4k
min: 90.79     avg: 99.4     median: 99.4 (47%)     max: 108 fps
specvp2020 catia-06 4k +
SPECviewperf 2020 - specvp2020 catia-06 4k
min: 37.72     avg: 51.9     median: 51.9 (34%)     max: 66.1 fps
specvp2020 3dsmax-07 4k +
SPECviewperf 2020 - specvp2020 3dsmax-07 4k
min: 69.84     avg: 82.1     median: 82.1 (34%)     max: 94.3 fps
Cinebench R10 Cinebench R10 Shading (32bit) +
Cinebench R10 - Cinebench R10 Shading (32bit)
min: 17026     avg: 20292     median: 19835 (14%)     max: 24016 pkt.
Cinebench R11.5 Cinebench R11.5 OpenGL 64 Bit +
Cinebench R11.5 - Cinebench R11.5 OpenGL 64 Bit
min: 164.48     avg: 178.2     median: 178.2 (62%)     max: 191.9 fps
Cinebench R15
Cinebench R15 OpenGL 64 Bit +
Cinebench R15 - Cinebench R15 OpenGL 64 Bit
min: 138.8     avg: 224.4     median: 223.5 (13%)     max: 292 fps
Cinebench R15 OpenGL Ref. Match 64 Bit +
Cinebench R15 - Cinebench R15 OpenGL Ref. Match 64 Bit
99.6 % (100%)
GFXBench - GFXBench 5.0 4K Aztec Ruins High Tier Offscreen
127.6 fps (52%)
GFXBench - GFXBench Car Chase Offscreen
617 fps (69%)
GFXBench 3.1 - GFXBench Manhattan ES 3.1 Offscreen
743 fps (16%)
GFXBench 3.0 - GFXBench 3.0 Manhattan Offscreen
990 fps (58%)
GFXBench (DX / GLBenchmark) 2.7
GFXBench T-Rex HD Offscreen C24Z16 +
GFXBench (DX / GLBenchmark) 2.7 - GFXBench T-Rex HD Offscreen C24Z16
2674 fps (21%)
Basemark GPU 1.2 - Basemark GPU 1.2 Vulkan Official Medium Offscreen 1080
min: 104.6     avg: 476.9     median: 235 (1%)     max: 1452 fps
Basemark GPU 1.2 - Basemark GPU 1.2 Vulkan Official High Offscreen 2160
3.6 fps (1%)
Geekbench 6.2 - Geekbench 6.2 GPU OpenCL
min: 101474     avg: 115903     median: 116924 (34%)     max: 129836 pkt.
Geekbench 6.2 - Geekbench 6.2 GPU Vulkan
min: 9035     avg: 57355     median: 32288 (11%)     max: 113920 pkt.
LuxMark v2.0 64Bit - LuxMark v2.0 Room GPU
4727 Samples/s (21%)
LuxMark v2.0 64Bit - LuxMark v2.0 Sala GPU
10800 Samples/s (19%)
ComputeMark v2.1 - ComputeMark v2.1 Result
min: 24129     avg: 25731     median: 25731 (28%)     max: 27333 pkt.
Power Consumption - Furmark Stress Test Power Consumption - external Monitor *
min: 76.1     avg: 155.1     median: 162.5 (23%)     max: 276 Watt
0153045607590105120135150165180195210225Tooltip
Power Consumption - The Witcher 3 Power Consumption - external Monitor *
min: 81.2     avg: 154.2     median: 161.8 (23%)     max: 196.4 Watt
0153045607590105120135150165180195210225Tooltip
Power Consumption - Witcher 3 Power Consumption *
min: 95.4     avg: 162.5     median: 168.8 (37%)     max: 265 Watt
0153045607590105120135150165180195210225Tooltip
Power Consumption - Witcher 3 ultra Power Efficiency
min: 0.4151     avg: 0.7     median: 0.7 (67%)     max: 0.885 fps per Watt
Power Consumption - Witcher 3 ultra Power Efficiency - external Monitor
min: 0.553     avg: 0.7     median: 0.7 (60%)     max: 0.912 fps per Watt
Emissions Witcher 3 Fan Noise +
Emissions - Witcher 3 Fan Noise
min: 40.1     avg: 49.5     median: 49.2 (79%)     max: 57.94 dB(A)
Clock Speed - GPU Clock Witcher 3 ultra
min: 1860     avg: 2217     median: 2295 (90%)     max: 2460 MHz
- Zakres wyników testów referencyjnych dla tej karty graficznej
- Średnia wartość wyników testów referencyjnych dla tej karty graficzne
* Smaller numbers mean a higher performance

Testy gier

Zamieszczone niżej wyniki pochodzą z testów zrecenzowanych laptopów. Należy pamiętać, że osiągi poszczególnych konfiguracji zależą od zastosowanej pamięci własnej karty (VRAM), zegarów karty (mogą być różne), procesora, ustawień systemu, sterowników i wersji systemu operacyjnego. Tym samym uzyskane wyniki nie muszą być reprezentatywne dla wszystkich laptopów wyposażonych w daną kartę graficzną. By uzyskać szczegółowe informacje o wynikach testów, należy kliknąć na podaną wartość liczbową (fps, czyli kl/s).

Dragon's Dogma 2

Dragon's Dogma 2

2024
low 1920x1080
68.8 83.9 ~ 76 fps    + Porównaj + 📈 Graph
high 1920x1080
65.7 80 ~ 73 fps    + Porównaj + 📈 Graph
QHD 2560x1440
57.4 61.3 ~ 59 fps    + Porównaj + 📈 Graph
4K 3840x2160
32.9  fps    + Porównaj + 📈 Graph
3840x2160
39.8  fps    + Porównaj + 📈 Graph
» Na wszystkich testowanych laptopach grywalna przy ustawieniach high.
Additional Benchmarks
Low Preset 1280x720
87.4
Horizon Forbidden West

Horizon Forbidden West

2024
low 1920x1080
92.3 96.6 107.1 110.5 ~ 102 fps    + Porównaj + 📈 Graph
med. 1920x1080
77.3 83.7 94.3 103.4 104.2 ~ 93 fps    + Porównaj + 📈 Graph
high 1920x1080
58.5 71.7 73.2 73.4 75.4 ~ 70 fps    + Porównaj + 📈 Graph
ultra 1920x1080
53.2 64.4 65.4 70.3 71.1 ~ 65 fps    + Porównaj + 📈 Graph
QHD 2560x1440
40.3 49.9 54 54.5 56.1 ~ 51 fps    + Porównaj + 📈 Graph
4K 3840x2160
32.3  fps    + Porównaj + 📈 Graph
3840x2160
45.5  fps    + Porównaj + 📈 Graph
» Na wszystkich testowanych laptopach grywalna przy ustawieniach ultra.
Alone in the Dark

Alone in the Dark

2024
low 1920x1080
185.9 212 222 ~ 207 fps    + Porównaj + 📈 Graph
med. 1920x1080
157.3 191 209 ~ 186 fps    + Porównaj + 📈 Graph
high 1920x1080
151.1 178 196.5 ~ 175 fps    + Porównaj + 📈 Graph
ultra 1920x1080
114 124.7 126 ~ 122 fps    + Porównaj + 📈 Graph
QHD 2560x1440
64.7 72 76.6 ~ 71 fps    + Porównaj + 📈 Graph
4K 3840x2160
17  fps    + Porównaj
3840x2160
54  fps    + Porównaj
» Na wszystkich testowanych laptopach grywalna przy ustawieniach ultra.
Last Epoch

Last Epoch

2024
low 1920x1080
169.7  fps    + Porównaj + 📈 Graph
med. 1920x1080
156 196.6 ~ 176 fps    + Porównaj + 📈 Graph
high 1920x1080
155.9 177.5 ~ 167 fps    + Porównaj + 📈 Graph
ultra 1920x1080
133.8 140 ~ 137 fps    + Porównaj + 📈 Graph
QHD 2560x1440
80.4 81.1 ~ 81 fps    + Porównaj + 📈 Graph
4K 3840x2160
37.4  fps    + Porównaj + 📈 Graph
» Na wszystkich testowanych laptopach grywalna przy ustawieniach ultra.
Skull & Bones

Skull & Bones

2024
low 1920x1080
107  fps    + Porównaj
med. 1920x1080
101 116 ~ 109 fps    + Porównaj
high 1920x1080
94 97 ~ 96 fps    + Porównaj
ultra 1920x1080
75 81 ~ 78 fps    + Porównaj
QHD 2560x1440
59 63 ~ 61 fps    + Porównaj
4K 3840x2160
36  fps    + Porównaj
3840x2160
54  fps    + Porównaj
» Na wszystkich testowanych laptopach grywalna przy ustawieniach ultra.
Helldivers 2

Helldivers 2

2024
low 1920x1080
129.5  fps    + Porównaj + 📈 Graph
med. 1920x1080
117.3  fps    + Porównaj + 📈 Graph
high 1920x1080
91.5 107.5 ~ 100 fps    + Porównaj + 📈 Graph
ultra 1920x1080
91.1 105.3 ~ 98 fps    + Porównaj + 📈 Graph
QHD 2560x1440
69.2 75.2 ~ 72 fps    + Porównaj + 📈 Graph
4K 3840x2160
40  fps    + Porównaj + 📈 Graph
» Na wszystkich testowanych laptopach grywalna przy ustawieniach ultra.
Enshrouded

Enshrouded

2024
med. 1920x1080
75.2  fps    + Porównaj + 📈 Graph
high 1920x1080
62.7 66.6 ~ 65 fps    + Porównaj + 📈 Graph
ultra 1920x1080
51.3 56.5 ~ 54 fps    + Porównaj + 📈 Graph
QHD 2560x1440
38.9 42.3 ~ 41 fps    + Porównaj + 📈 Graph
4K 3840x2160
23.5  fps    + Porównaj + 📈 Graph
3840x2160
36.3  fps    + Porównaj + 📈 Graph
» Na wszystkich testowanych laptopach grywalna przy ustawieniach ultra.
Palworld

Palworld

2024
med. 1920x1080
118.4  fps    + Porównaj + 📈 Graph
high 1920x1080
102.2 111 ~ 107 fps    + Porównaj + 📈 Graph
ultra 1920x1080
96.6 108.5 ~ 103 fps    + Porównaj + 📈 Graph
QHD 2560x1440
69.1 81.3 ~ 75 fps    + Porównaj + 📈 Graph
4K 3840x2160
42.7  fps    + Porównaj + 📈 Graph
3840x2160
58.1  fps    + Porównaj + 📈 Graph
» Na wszystkich testowanych laptopach grywalna przy ustawieniach ultra.
Prince of Persia The Lost Crown

Prince of Persia The Lost Crown

2024
med. 1920x1080
358  fps    + Porównaj + 📈 Graph
high 1920x1080
358 358 ~ 358 fps    + Porównaj + 📈 Graph
ultra 1920x1080
357 358 ~ 358 fps    + Porównaj + 📈 Graph
QHD 2560x1440
325 354 ~ 340 fps    + Porównaj + 📈 Graph
4K 3840x2160
186.7  fps    + Porównaj + 📈 Graph
» Na wszystkich testowanych laptopach grywalna przy ustawieniach ultra.
Ready or Not

Ready or Not

2023
med. 1920x1080
220  fps    + Porównaj + 📈 Graph
high 1920x1080
194.2 208 ~ 201 fps    + Porównaj + 📈 Graph
ultra 1920x1080
134 161.5 ~ 148 fps    + Porównaj + 📈 Graph
QHD 2560x1440
84.8 95.6 ~ 90 fps    + Porównaj + 📈 Graph
4K 3840x2160
40.6  fps    + Porównaj + 📈 Graph
3840x2160
87.6  fps    + Porównaj + 📈 Graph
» Na wszystkich testowanych laptopach grywalna przy ustawieniach ultra.
The Finals

The Finals

2023
med. 1920x1080
186.6  fps    + Porównaj + 📈 Graph
high 1920x1080
168 180.6 ~ 174 fps    + Porównaj + 📈 Graph
ultra 1920x1080
130.2 156.7 ~ 143 fps    + Porównaj + 📈 Graph
QHD 2560x1440
82.8 94.6 ~ 89 fps    + Porównaj + 📈 Graph
4K 3840x2160
42.9  fps    + Porównaj + 📈 Graph
3840x2160
70.5  fps    + Porównaj + 📈 Graph
» Na wszystkich testowanych laptopach grywalna przy ustawieniach ultra.
Additional Benchmarks
Epic Preset + Epic RTX Global Illumination 1920x1080
142.2
Avatar Frontiers of Pandora

Avatar Frontiers of Pandora

2023
low 1920x1080
81 81 101 ~ 88 fps    + Porównaj
med. 1920x1080
74 75 90 94 ~ 83 fps    + Porównaj
high 1920x1080
65 66 78 82 ~ 73 fps    + Porównaj
ultra 1920x1080
49 49 54 58 62 ~ 54 fps    + Porównaj
QHD 2560x1440
32 33 38 41 42 ~ 37 fps    + Porównaj
4K 3840x2160
19 20 ~ 20 fps    + Porównaj
3840x2160
33  fps    + Porównaj
» Na wszystkich testowanych laptopach grywalna przy ustawieniach ultra.
Call of Duty Modern Warfare 3 2023

Call of Duty Modern Warfare 3 2023

2023
low 1920x1080
143 167 180 ~ 163 fps    + Porównaj
med. 1920x1080
130 150 156 158 ~ 149 fps    + Porównaj
high 1920x1080
101 113 119 124 ~ 114 fps    + Porównaj
ultra 1920x1080
94 104 108 114 ~ 105 fps    + Porównaj
QHD 2560x1440
64 72 78 82 ~ 74 fps    + Porównaj
4K 3840x2160
48 50 ~ 49 fps    + Porównaj
3840x2160
55  fps    + Porównaj
» Na wszystkich testowanych laptopach grywalna przy ustawieniach ultra.
EA Sports WRC

EA Sports WRC

2023
med. 1920x1080
90.6 94.9 ~ 93 fps    + Porównaj + 📈 Graph
high 1920x1080
85 89.6 ~ 87 fps    + Porównaj + 📈 Graph
ultra 1920x1080
77.1 81.2 ~ 79 fps    + Porównaj + 📈 Graph
QHD 2560x1440
59.6 68.8 ~ 64 fps    + Porównaj + 📈 Graph
4K 3840x2160
37.7  fps    + Porównaj + 📈 Graph
3840x2160
56.2  fps    + Porównaj + 📈 Graph
» Na wszystkich testowanych laptopach grywalna przy ustawieniach ultra.
Alan Wake 2

Alan Wake 2

2023
low 1920x1080
74.3 79.6 ~ 77 fps    + Porównaj + 📈 Graph
med. 1920x1080
66.9 71.4 75.7 ~ 71 fps    + Porównaj + 📈 Graph
high 1920x1080
65.1 70 70.1 ~ 68 fps    + Porównaj + 📈 Graph
QHD 2560x1440
40.2 42.3 42.8 ~ 42 fps    + Porównaj + 📈 Graph
4K 3840x2160
19.8  fps    + Porównaj + 📈 Graph
3840x2160
16.8  fps    + Porównaj + 📈 Graph
» Na wszystkich testowanych laptopach grywalna przy ustawieniach high.
Additional Benchmarks
High Preset + High Ray Tracing 1920x1080
31.7
Lords of the Fallen

Lords of the Fallen

2023
low 1920x1080
96.9  fps    + Porównaj + 📈 Graph
med. 1920x1080
84.1 85.1 ~ 85 fps    + Porównaj + 📈 Graph
high 1920x1080
62.6 63.4 ~ 63 fps    + Porównaj + 📈 Graph
ultra 1920x1080
44.3 45.9 ~ 45 fps    + Porównaj + 📈 Graph
QHD 2560x1440
29.1 29.8 ~ 29 fps    + Porównaj + 📈 Graph
4K 3840x2160
14.6  fps    + Porównaj + 📈 Graph
3840x2160
29.1  fps    + Porównaj + 📈 Graph
» Na wszystkich testowanych laptopach grywalna przy ustawieniach ultra.
Additional Benchmarks
Low Preset 1280x720
141.4
Total War Pharaoh

Total War Pharaoh

2023
low 1920x1080
385.9  fps    + Porównaj
med. 1920x1080
239.5 263 ~ 251 fps    + Porównaj
high 1920x1080
146.2 166 ~ 156 fps    + Porównaj
ultra 1920x1080
113.3 129 ~ 121 fps    + Porównaj
QHD 2560x1440
87.2 95.4 ~ 91 fps    + Porównaj
4K 3840x2160
47.1  fps    + Porównaj
» Na wszystkich testowanych laptopach grywalna przy ustawieniach ultra.
Additional Benchmarks
Low Preset 1280x720
446.1
Assassin's Creed Mirage

Assassin's Creed Mirage

2023
low 1920x1080
143  fps    + Porównaj
med. 1920x1080
132 137 ~ 135 fps    + Porównaj
high 1920x1080
125 129 ~ 127 fps    + Porównaj
ultra 1920x1080
97 97 99 ~ 98 fps    + Porównaj
QHD 2560x1440
74 75 78 ~ 76 fps    + Porównaj
4K 3840x2160
41  fps    + Porównaj
3840x2160
59  fps    + Porównaj
» Na wszystkich testowanych laptopach grywalna przy ustawieniach ultra.
EA Sports FC 24

EA Sports FC 24

2023
med. 1920x1080
192.7  fps    + Porównaj + 📈 Graph
high 1920x1080
162.3  fps    + Porównaj + 📈 Graph
ultra 1920x1080
150.1  fps    + Porównaj + 📈 Graph
QHD 2560x1440
138.4  fps    + Porównaj + 📈 Graph
4K 3840x2160
82.4  fps    + Porównaj + 📈 Graph
» Na wszystkich testowanych laptopach grywalna przy ustawieniach ultra.
Counter-Strike 2

Counter-Strike 2

2023
med. 1920x1080
160.2 182.9 ~ 172 fps    + Porównaj + 📈 Graph
high 1920x1080
151.5 170.7 ~ 161 fps    + Porównaj + 📈 Graph
ultra 1920x1080
121.5 141 ~ 131 fps    + Porównaj + 📈 Graph
QHD 2560x1440
87.9 100.6 ~ 94 fps    + Porównaj + 📈 Graph
4K 3840x2160
55.4  fps    + Porównaj + 📈 Graph
» Na wszystkich testowanych laptopach grywalna przy ustawieniach ultra.
Cyberpunk 2077 2.0 Phantom Liberty

Cyberpunk 2077 2.0 Phantom Liberty

2023
low 1920x1080
90.2 96.4 110.2 112 119.4 125.7 129.6 129.7 131.7 135.8 142.5 143.4 156.6 ~ 125 fps    + Porównaj
med. 1920x1080
81.6 87.6 90 99.4 106.3 106.8 113.2 114.1 117.1 118.1 118.9 120 124 124.5 ~ 109 fps    + Porównaj
high 1920x1080
74.7 76.9 77 84.4 90.5 91.5 95.6 96.4 98.3 99.4 99.6 100.2 102 102.2 103.6 ~ 93 fps    + Porównaj
ultra 1920x1080
64.3 69 73.9 75.8 76.9 83.1 83.3 83.5 84 85.2 86.3 87 87.1 87.9 88.6 89.5 ~ 82 fps    + Porównaj
QHD 2560x1440
39.6 43.6 43.7 47.8 49.4 51.4 51.7 51.8 51.9 52.1 52.6 52.7 52.8 54.9 55.4 57.1 ~ 51 fps    + Porównaj
4K 3840x2160
21 22.3 22.5 23.5 24 ~ 23 fps    + Porównaj
3840x2160
29.6  fps    + Porównaj
» Na wszystkich testowanych laptopach grywalna przy ustawieniach ultra.
Additional Benchmarks
Low Preset (FSR off) 1280x720
134.2
138.9
149.4
126.2
147.1
149.9
120.6
175.5
Ray Tracing Ultra Preset (DLSS off) 1920x1080
41.2
43.6
43.8
42.4
44.8
43.4
40.9
43.4
43.8
Steam Deck 1280x720
126.2
142.3
146.8
124.8
174.9
Ultra Preset (FSR on) 1920x1080
99.7
101.7
96.5
104
81.6
100.9
Ray Tracing Ultra Preset (DLSS off, no Path Tracing) 3840x2160
9.9
7
8.8
Lies of P

Lies of P

2023
low 1920x1080
206  fps    + Porównaj + 📈 Graph
med. 1920x1080
182 188.5 ~ 185 fps    + Porównaj + 📈 Graph
high 1920x1080
159.8 165.4 ~ 163 fps    + Porównaj + 📈 Graph
ultra 1920x1080
140.1 148.1 ~ 144 fps    + Porównaj + 📈 Graph
QHD 2560x1440
97.3 98.8 ~ 98 fps    + Porównaj + 📈 Graph
4K 3840x2160
49  fps    + Porównaj + 📈 Graph
3840x2160
75.5  fps    + Porównaj + 📈 Graph
» Na wszystkich testowanych laptopach grywalna przy ustawieniach ultra.
Additional Benchmarks
Low Preset 1280x720
255
The Crew Motorfest

The Crew Motorfest

2023
med. 1920x1080
60 60 ~ 60 fps    + Porównaj
high 1920x1080
60 60 ~ 60 fps    + Porównaj
ultra 1920x1080
60 60 ~ 60 fps    + Porównaj
QHD 2560x1440
59  fps    + Porównaj
4K 3840x2160
39  fps    + Porównaj
» Na wszystkich testowanych laptopach grywalna przy ustawieniach ultra.
Starfield

Starfield

2023
med. 1920x1080
62.3 66.7 ~ 65 fps    + Porównaj + 📈 Graph
high 1920x1080
51.2 52.3 ~ 52 fps    + Porównaj + 📈 Graph
ultra 1920x1080
46.6 46.6 ~ 47 fps    + Porównaj + 📈 Graph
QHD 2560x1440
37.2  fps    + Porównaj + 📈 Graph
4K 3840x2160
24  fps    + Porównaj + 📈 Graph
» Na wszystkich testowanych laptopach grywalna przy ustawieniach ultra.
med. 1920x1080
92.1 102.5 109.7 110.1 ~ 104 fps    + Porównaj + 📈 Graph
high 1920x1080
91.1 101.9 109.2 109.4 ~ 103 fps    + Porównaj + 📈 Graph
ultra 1920x1080
87.2 97 106.4 107 ~ 99 fps    + Porównaj + 📈 Graph
QHD 2560x1440
76.2 85 ~ 81 fps    + Porównaj + 📈 Graph
4K 3840x2160
45.2  fps    + Porównaj + 📈 Graph
» Na wszystkich testowanych laptopach grywalna przy ustawieniach ultra.
high 1920x1080
56 57.1 57.3 61.6 ~ 58 fps    + Porównaj + 📈 Graph
ultra 1920x1080
46.1 46.9 46.9 49.9 ~ 47 fps    + Porównaj + 📈 Graph
QHD 2560x1440
32 35 ~ 34 fps    + Porównaj + 📈 Graph
4K 3840x2160
19.7  fps    + Porównaj + 📈 Graph
3840x2160
39.5  fps    + Porównaj + 📈 Graph
» Na wszystkich testowanych laptopach grywalna przy ustawieniach ultra.
med. 1920x1080
113.2 124.7 133.8 143.1 ~ 129 fps    + Porównaj + 📈 Graph
high 1920x1080
106.5 119.9 126.7 132.4 ~ 121 fps    + Porównaj + 📈 Graph
ultra 1920x1080
105.3 106.1 106.6 111.1 ~ 107 fps    + Porównaj + 📈 Graph
QHD 2560x1440
80.6 89.5 ~ 85 fps    + Porównaj + 📈 Graph
4K 3840x2160
51  fps    + Porównaj + 📈 Graph
» Na wszystkich testowanych laptopach grywalna przy ustawieniach ultra.
low 1920x1080
135.7 137.1 155.6 157.2 162.1 166.3 168.7 176 ~ 157 fps    + Porównaj + 📈 Graph
med. 1920x1080
107.1 113.9 114.2 115.2 121.2 125.4 127.9 136.5 136.6 148.9 150.8 ~ 127 fps    + Porównaj + 📈 Graph
high 1920x1080
89.2 91.4 93.5 95.3 99.1 105.6 106.1 115.7 119.9 128.5 129.3 ~ 107 fps    + Porównaj + 📈 Graph
ultra 1920x1080
71.3 88.5 91.8 94.4 95.4 100.2 105 114.7 115 117.7 125.6 128.5 ~ 104 fps    + Porównaj + 📈 Graph
QHD 2560x1440
54.4 60.2 62.5 63.8 70.9 71.9 79.8 81.1 82.1 88.3 89.6 ~ 73 fps    + Porównaj + 📈 Graph
4K 3840x2160
34.2 34.5 41.1 44.3 45.2 ~ 40 fps    + Porównaj + 📈 Graph
3840x2160
58  fps    + Porównaj + 📈 Graph
» Na wszystkich testowanych laptopach grywalna przy ustawieniach ultra.
Additional Benchmarks
Low Preset 1280x720
162.7
low 1920x1080
90.4  fps    + Porównaj + 📈 Graph
med. 1920x1080
72.3 72.5 78.8 79.5 ~ 76 fps    + Porównaj + 📈 Graph
high 1920x1080
58 60.2 62.3 64.7 ~ 61 fps    + Porównaj + 📈 Graph
ultra 1920x1080
52.3 56.3 57.1 58.1 ~ 56 fps    + Porównaj + 📈 Graph
QHD 2560x1440
48.7 48.8 49.1 ~ 49 fps    + Porównaj + 📈 Graph
4K 3840x2160
33.2  fps    + Porównaj + 📈 Graph
» Na wszystkich testowanych laptopach grywalna przy ustawieniach ultra.
Additional Benchmarks
Very Low Preset 1280x720
109.7
Very High Preset + Very High Raytracing TAA 1920x1080
44.8
43.4
Very High Preset + Very High Raytracing + DLSS Quality + FG 3840x2160
13.3
F1 23

F1 23

2023
low 1920x1080
194.5 195.2 214 229 230 235 248 248 279 287 ~ 236 fps    + Porównaj
med. 1920x1080
189.7 193.8 205 232 239 240 251 251 255 261 284 ~ 237 fps    + Porównaj
high 1920x1080
153.4 165.4 175.1 189 198 198.2 199.2 206 209 209 222 ~ 193 fps    + Porównaj
ultra 1920x1080
49.5 55.5 55.8 62.5 67.6 68 68.9 70.1 71 71.7 77 100 ~ 68 fps    + Porównaj
QHD 2560x1440
35.2 36 36 39.4 43.9 44 45 45.6 46 46.3 49 ~ 42 fps    + Porównaj
4K 3840x2160
22 23 ~ 23 fps    + Porównaj
3840x2160
38  fps    + Porównaj
» Na wszystkich testowanych laptopach grywalna przy ustawieniach ultra.
Additional Benchmarks
Ultra Low Preset TAA 1280x720
232
221
237
281
Diablo 4

Diablo 4

2023
low 1920x1080
242 255 ~ 249 fps    + Porównaj + 📈 Graph
med. 1920x1080
227 233 ~ 230 fps    + Porównaj + 📈 Graph
high 1920x1080
207 208 ~ 208 fps    + Porównaj + 📈 Graph
ultra 1920x1080
177.8 182.9 ~ 180 fps    + Porównaj + 📈 Graph
QHD 2560x1440
105.4 120.7 ~ 113 fps    + Porównaj + 📈 Graph
4K 3840x2160
60.9  fps    + Porównaj + 📈 Graph
3840x2160
82.6  fps    + Porównaj + 📈 Graph
» Na wszystkich testowanych laptopach grywalna przy ustawieniach ultra.
Additional Benchmarks
Low Preset 1280x720
282
low 1920x1080
78.7 80.1 84 92.1 99.8 ~ 87 fps    + Porównaj + 📈 Graph
med. 1920x1080
69.9 70.5 76 80.6 91.7 94.9 ~ 81 fps    + Porównaj + 📈 Graph
high 1920x1080
65.1 67 72 75.6 79 79.1 86.5 ~ 75 fps    + Porównaj + 📈 Graph
ultra 1920x1080
61.5 63.5 67 71.1 73 75 77.9 80.1 ~ 71 fps    + Porównaj + 📈 Graph
QHD 2560x1440
39.5 39.8 44 45 46.7 47 50.4 51.1 ~ 45 fps    + Porównaj + 📈 Graph
4K 3840x2160
22.7 24.2 24.2 ~ 24 fps    + Porównaj + 📈 Graph
» Na wszystkich testowanych laptopach grywalna przy ustawieniach ultra.
Additional Benchmarks
Low Preset 1280x720
117.4
Epic Preset + Ray Tracing 1920x1080
56.7
57
Dead Island 2

Dead Island 2

2023
low 1920x1080
167.9  fps    + Porównaj + 📈 Graph
med. 1920x1080
161.7 224 ~ 193 fps    + Porównaj + 📈 Graph
high 1920x1080
151.9 190.7 ~ 171 fps    + Porównaj + 📈 Graph
ultra 1920x1080
143.4 178.5 ~ 161 fps    + Porównaj + 📈 Graph
QHD 2560x1440
106.6 116.7 ~ 112 fps    + Porównaj + 📈 Graph
4K 3840x2160
52.5  fps    + Porównaj + 📈 Graph
» Na wszystkich testowanych laptopach grywalna przy ustawieniach ultra.
Additional Benchmarks
Low Preset Low TAA 1280x720
171
The Last of Us

The Last of Us

2023
low 1920x1080
73.1 98.6 114.4 ~ 95 fps    + Porównaj + 📈 Graph
med. 1920x1080
60.9 85.9 96.5 ~ 81 fps    + Porównaj + 📈 Graph
high 1920x1080
56.9 77.7 85.5 ~ 73 fps    + Porównaj + 📈 Graph
ultra 1920x1080
56 69.5 69.9 75 ~ 68 fps    + Porównaj + 📈 Graph
QHD 2560x1440
41.7 41.7 43.9 53.3 ~ 45 fps    + Porównaj + 📈 Graph
4K 3840x2160
30.6  fps    + Porównaj
» Na wszystkich testowanych laptopach grywalna przy ustawieniach ultra.
Additional Benchmarks
Low Preset 1280x720
92.9
109.4
137.3
low 1920x1080
119.3 160.1 185.9 ~ 155 fps    + Porównaj + 📈 Graph
med. 1920x1080
108.3 117.6 123.4 133.5 ~ 121 fps    + Porównaj + 📈 Graph
high 1920x1080
105.5 111.5 113.1 120.8 ~ 113 fps    + Porównaj + 📈 Graph
ultra 1920x1080
74.8 80.5 82.4 86.7 ~ 81 fps    + Porównaj + 📈 Graph
QHD 2560x1440
58.5 61.3 61.5 ~ 60 fps    + Porównaj + 📈 Graph
» Na wszystkich testowanych laptopach grywalna przy ustawieniach ultra.
Additional Benchmarks
Prioritize Performance Preset 1280x720
231
120.6
189.7
low 1920x1080
211.8 228.9 ~ 220 fps    + Porównaj
med. 1920x1080
174 186 191.4 205.1 ~ 189 fps    + Porównaj
high 1920x1080
135 155 156.5 159.7 ~ 152 fps    + Porównaj
ultra 1920x1080
134 150 153.9 157.5 ~ 149 fps    + Porównaj
QHD 2560x1440
107 114.8 115.1 ~ 112 fps    + Porównaj
4K 3840x2160
63  fps    + Porównaj
» Na wszystkich testowanych laptopach grywalna przy ustawieniach ultra.
Additional Benchmarks
Minimum Settings 1280x720
307.4
237.2
low 1920x1080
98.3  fps    + Porównaj + 📈 Graph
med. 1920x1080
73.3 86.8 88.1 92.1 ~ 85 fps    + Porównaj + 📈 Graph
high 1920x1080
71.9 83.3 85.8 88.5 ~ 82 fps    + Porównaj + 📈 Graph
ultra 1920x1080
71.1 82.3 85.4 87.5 ~ 82 fps    + Porównaj + 📈 Graph
QHD 2560x1440
61 69.5 ~ 65 fps    + Porównaj + 📈 Graph
» Na wszystkich testowanych laptopach grywalna przy ustawieniach ultra.
Additional Benchmarks
Ultra Low Preset 1280x720
101.8
low 1920x1080
176.6 199.8 ~ 188 fps    + Porównaj + 📈 Graph
med. 1920x1080
131.7 132.5 147.4 158.3 ~ 142 fps    + Porównaj + 📈 Graph
high 1920x1080
86.2 95 95.1 96.4 ~ 93 fps    + Porównaj + 📈 Graph
ultra 1920x1080
70.4 74.2 78 79 ~ 75 fps    + Porównaj + 📈 Graph
QHD 2560x1440
51.6 58.6 58.9 ~ 56 fps    + Porównaj + 📈 Graph
» Na wszystkich testowanych laptopach grywalna przy ustawieniach ultra.
Additional Benchmarks
Low Preset 1280x720
208
181.7
Returnal

Returnal

2023
low 1920x1080
65 72 83 87 93 109 115 115 117 119 ~ 98 fps    + Porównaj
med. 1920x1080
69 71 81 85 90 111 112 114 115 115 117 ~ 98 fps    + Porównaj
high 1920x1080
64 67 76 81 85 101 101 102 104 104 106 ~ 90 fps    + Porównaj
ultra 1920x1080
54 59 61 73 77 79 85 87 88 88 90 ~ 76 fps    + Porównaj
QHD 2560x1440
39 41 52 52 55 63 63 64 64 66 66 ~ 57 fps    + Porównaj
4K 3840x2160
21 21 27 28 29 37 39 ~ 29 fps    + Porównaj
» Na wszystkich testowanych laptopach grywalna przy ustawieniach ultra.
Additional Benchmarks
Low Preset 1280x720
150
126
144
139
Epic Preset + Epic Ray-Tracing 1920x1080
75
73
74
71
med. 1920x1080
142.7  fps    + Porównaj + 📈 Graph
high 1920x1080
57 86 121.2 123 ~ 97 fps    + Porównaj + 📈 Graph
ultra 1920x1080
41 71 77.2 101.2 107 ~ 79 fps    + Porównaj + 📈 Graph
QHD 2560x1440
35 50 50 55.3 71 ~ 52 fps    + Porównaj + 📈 Graph
4K 3840x2160
27.7  fps    + Porównaj + 📈 Graph
» Na wszystkich testowanych laptopach grywalna przy ustawieniach ultra.
Additional Benchmarks
Ultra Preset + Full Ray Tracing High TAA 1920x1080
43.9
low 1920x1080
97 100.9 102.8 ~ 100 fps    + Porównaj + 📈 Graph
med. 1920x1080
94 95.7 98.2 ~ 96 fps    + Porównaj + 📈 Graph
high 1920x1080
81 85.3 86.7 ~ 84 fps    + Porównaj + 📈 Graph
ultra 1920x1080
80 82.4 86.5 ~ 83 fps    + Porównaj + 📈 Graph
QHD 2560x1440
51 53.1 56.5 ~ 54 fps    + Porównaj + 📈 Graph
4K 3840x2160
26  fps    + Porównaj
» Na wszystkich testowanych laptopach grywalna przy ustawieniach ultra.
Additional Benchmarks
Low Preset TAA 1280x720
135.5
133.4
low 1920x1080
271  fps    + Porównaj + 📈 Graph
med. 1920x1080
215  fps    + Porównaj + 📈 Graph
high 1920x1080
101 176.2 ~ 139 fps    + Porównaj + 📈 Graph
ultra 1920x1080
85 86.5 ~ 86 fps    + Porównaj + 📈 Graph
QHD 2560x1440
54  fps    + Porównaj
4K 3840x2160
28  fps    + Porównaj
» Na wszystkich testowanych laptopach grywalna przy ustawieniach ultra.
Additional Benchmarks
RT Ultra Preset / On FXAA 1920x1080
36
40.4
low 1920x1080
220 236 ~ 228 fps    + Porównaj + 📈 Graph
med. 1920x1080
166.2 178 178.7 185.9 ~ 177 fps    + Porównaj + 📈 Graph
high 1920x1080
126.7 131.6 134.1 141.6 ~ 134 fps    + Porównaj + 📈 Graph
ultra 1920x1080
101.9 108.5 110.6 114 ~ 109 fps    + Porównaj + 📈 Graph
QHD 2560x1440
64.5 66.9 68.5 ~ 67 fps    + Porównaj + 📈 Graph
4K 3840x2160
25.7  fps    + Porównaj + 📈 Graph
» Na wszystkich testowanych laptopach grywalna przy ustawieniach ultra.
Additional Benchmarks
Low Preset 1280x720
269
234
low 1920x1080
122.8 155.6 162.8 ~ 147 fps    + Porównaj
med. 1920x1080
113.8 127.5 142.2 ~ 128 fps    + Porównaj
high 1920x1080
111.8 121.8 136 ~ 123 fps    + Porównaj
ultra 1920x1080
78.9 79.7 83.5 88 ~ 83 fps    + Porównaj
QHD 2560x1440
58.4 59.1 66.7 68.3 ~ 63 fps    + Porównaj
4K 3840x2160
33  fps    + Porównaj
» Na wszystkich testowanych laptopach grywalna przy ustawieniach ultra.
Additional Benchmarks
Low Preset (without FSR Upscaling) 1280x720
168.4
128.5
170.9
Ultra Preset (without FSR Upscaling) + Full Ray-Tracing 1920x1080
50.8
58.1
56.8
70
low 1920x1080
118.1  fps    + Porównaj + 📈 Graph
med. 1920x1080
112.1 131.1 ~ 122 fps    + Porównaj + 📈 Graph
high 1920x1080
101 110.1 ~ 106 fps    + Porównaj + 📈 Graph
ultra 1920x1080
89.1 97.2 ~ 93 fps    + Porównaj + 📈 Graph
QHD 2560x1440
67.7 77.7 ~ 73 fps    + Porównaj + 📈 Graph
4K 3840x2160
36.2  fps    + Porównaj + 📈 Graph
» Na wszystkich testowanych laptopach grywalna przy ustawieniach ultra.
Additional Benchmarks
Low Preset 1280x720
119.6
high 1920x1080
115  fps    + Porównaj
ultra 1920x1080
82.3 90.5 110 ~ 94 fps    + Porównaj
QHD 2560x1440
53.1 68.9 86 ~ 69 fps    + Porównaj
4K 3840x2160
40.5 44 ~ 42 fps    + Porównaj
» Na wszystkich testowanych laptopach grywalna przy ustawieniach ultra.
Additional Benchmarks
Very High Preset + Ray-Tracing TAA 1920x0180
71.4
high 1920x1080
111  fps    + Porównaj
ultra 1920x1080
80 100 100 101 102 105 105 106 108 ~ 101 fps    + Porównaj
QHD 2560x1440
59 71 72 72 72 74 76 76 77 ~ 72 fps    + Porównaj
4K 3840x2160
39 41 44 47 ~ 43 fps    + Porównaj
3840x2160
71  fps    + Porównaj
» Na wszystkich testowanych laptopach grywalna przy ustawieniach ultra.
low 1920x1080
92.7 94 ~ 93 fps    + Porównaj + 📈 Graph
med. 1920x1080
89.4 92.4 ~ 91 fps    + Porównaj + 📈 Graph
high 1920x1080
84.4 86.2 ~ 85 fps    + Porównaj + 📈 Graph
ultra 1920x1080
82.1 82.7 ~ 82 fps    + Porównaj + 📈 Graph
QHD 2560x1440
61 61.2 ~ 61 fps    + Porównaj + 📈 Graph
» Na wszystkich testowanych laptopach grywalna przy ustawieniach ultra.
Additional Benchmarks
Low Preset 1280x720
102.9
med. 1920x1080
67.2 74.6 ~ 71 fps    + Porównaj + 📈 Graph
high 1920x1080
58.9 65.6 ~ 62 fps    + Porównaj + 📈 Graph
ultra 1920x1080
54.9 57.5 ~ 56 fps    + Porównaj + 📈 Graph
QHD 2560x1440
40.9  fps    + Porównaj + 📈 Graph
4K 3840x2160
23  fps    + Porównaj + 📈 Graph
» Na wszystkich testowanych laptopach grywalna przy ustawieniach ultra.
FIFA 23

FIFA 23

2022
QHD 2560x1440
166.2  fps    + Porównaj + 📈 Graph
med. 1920x1080
146  fps    + Porównaj + 📈 Graph
high 1920x1080
122.1  fps    + Porównaj + 📈 Graph
ultra 1920x1080
98  fps    + Porównaj + 📈 Graph
QHD 2560x1440
68.2  fps    + Porównaj + 📈 Graph
4K 3840x2160
28.7  fps    + Porównaj + 📈 Graph
» Na wszystkich testowanych laptopach grywalna przy ustawieniach ultra.
F1 22

F1 22

2022
low 1920x1080
138.5 151 155.1 192.3 192.9 194.5 206 220 225 232 235 239 247 256 256 258 262 275 279 301 310 311 320 ~ 237 fps    + Porównaj
med. 1920x1080
133.8 145.8 148.5 190 196.4 199.7 200 214 220 221 222 225 228 240 242 246 251 261 264 273 275 289 300 306 312 ~ 232 fps    + Porównaj
high 1920x1080
109 111.2 123.5 140.1 158.2 163 166.3 168.1 173.8 182 183 183.4 186.7 189.4 193.7 195.2 205 206 210 211 217 217 219 221 222 225 231 235 245 ~ 189 fps    + Porównaj
ultra 1920x1080
39.2 54 59.4 60.7 61.8 65.6 66.6 67 71 71.4 71.8 72.6 76.6 76.7 77.8 78.2 78.7 79.3 79.3 79.3 81.5 81.7 83.1 83.6 83.8 83.9 84.1 84.2 88.7 ~ 74 fps    + Porównaj
QHD 2560x1440
10.6 36 39.4 40.9 42.4 44.3 44.3 44.3 46.2 47 47.1 47.8 48.4 49 49.7 50.3 50.4 50.8 51.1 51.9 52.2 52.9 53.3 53.8 54.7 54.8 55.1 58.8 ~ 47 fps    + Porównaj
4K 3840x2160
4.7 18.8 21.5 24.5 24.7 25.4 25.9 25.9 26.3 26.4 26.5 26.5 26.6 27.6 ~ 24 fps    + Porównaj
» Na wszystkich testowanych laptopach grywalna przy ustawieniach ultra.
Additional Benchmarks
Ultra Low Preset 16xAF TAA 1280x720
296
256
368
333
63.1
365
199.1
308
312
398
254
277
276
321
196.4
366
335
287
282
394
med. 1920x1080
212  fps    + Porównaj + 📈 Graph
high 1920x1080
199.9  fps    + Porównaj + 📈 Graph
ultra 1920x1080
195.7  fps    + Porównaj + 📈 Graph
QHD 2560x1440
148.6  fps    + Porównaj + 📈 Graph
4K 3840x2160
78.5  fps    + Porównaj + 📈 Graph
» Na wszystkich testowanych laptopach grywalna przy ustawieniach ultra.
med. 1920x1080
172.7  fps    + Porównaj + 📈 Graph
high 1920x1080
171.7  fps    + Porównaj + 📈 Graph
ultra 1920x1080
165.9  fps    + Porównaj + 📈 Graph
QHD 2560x1440
108.7  fps    + Porównaj + 📈 Graph
4K 3840x2160
52.3  fps    + Porównaj + 📈 Graph
» Na wszystkich testowanych laptopach grywalna przy ustawieniach ultra.
Additional Benchmarks
Highest Settings + Maximum Ray Tracing 1920x1080
73
69.6
low 1920x1080
98.1 183.5 227.5 230 239.8 241.7 244 244.3 263.6 283.4 ~ 226 fps    + Porównaj
med. 1920x1080
92.5 153.3 190.1 193.9 195.6 201.5 202.8 204.8 217.3 230.6 ~ 188 fps    + Porównaj
high 1920x1080
74.3 104.9 130.3 132.5 132.5 137.8 138.3 143.7 144.5 151.4 ~ 129 fps    + Porównaj
ultra 1920x1080
58.6 79.7 82.4 98 101.7 102 103.2 107.6 107.7 109.4 112.1 113.9 115.9 ~ 99 fps    + Porównaj
QHD 2560x1440
49.8 55.7 57.6 69.1 70.4 70.5 71.4 73.7 74.6 75.6 76.9 78.1 79.5 ~ 69 fps    + Porównaj
4K 3840x2160
28.3 33.6 34.8 35.2 35.5 36.9 37 37.4 39.2 39.7 ~ 36 fps    + Porównaj
» Na wszystkich testowanych laptopach grywalna przy ustawieniach ultra.
Additional Benchmarks
Lowest Preset (DX12) 1280x720
319
low 1920x1080
55.3 102.1 106 128.5 129 130 135.4 138.3 147 147.8 155.9 182.8 185.8 ~ 134 fps    + Porównaj
med. 1920x1080
70 99.4 102 104 113 113.8 115 118.1 125.7 141.3 141.9 152.9 157.6 ~ 120 fps    + Porównaj
high 1920x1080
57.5 71 85.6 86 89 95 95.3 96 96.7 98 100.7 101 103 106.1 111.5 112 115.1 121.3 ~ 97 fps    + Porównaj
ultra 1920x1080
48 65 71 71.6 81.7 82 82 83.3 83.6 84.8 86 86.7 87 87.5 88.8 90 90.7 91 91 92.1 93.6 98.9 102.3 110 ~ 85 fps    + Porównaj
QHD 2560x1440
30 42 43 51.6 52 53.1 53.3 53.4 53.5 53.9 54 54 54.4 54.5 54.5 54.5 55.4 55.6 57 57.5 58.1 61 61 63.9 ~ 53 fps    + Porównaj
4K 3840x2160
12.8 18.7 19.6 23.1 23.3 23.5 23.9 24 24.4 24.7 26 ~ 22 fps    + Porównaj
» Na wszystkich testowanych laptopach grywalna przy ustawieniach ultra.
Additional Benchmarks
Low Preset 1280x720
148.4
129
161.3
Ray Tracing Ultra Preset (DLSS off) 1920x1080
65
42
36.2
57.1
41
Ray Tracing Ultra Preset (DLSS off) 3840x2160
7.8
Elex 2

Elex 2

2022
med. 1920x1080
118.7  fps    + Porównaj + 📈 Graph
high 1920x1080
118.2  fps    + Porównaj + 📈 Graph
ultra 1920x1080
112.9  fps    + Porównaj + 📈 Graph
QHD 2560x1440
78.9  fps    + Porównaj + 📈 Graph
4K 3840x2160
40  fps    + Porównaj + 📈 Graph
» Na wszystkich testowanych laptopach grywalna przy ustawieniach ultra.
low 1920x1080
182.9  fps    + Porównaj
med. 1920x1080
164.1  fps    + Porównaj
high 1920x1080
150.1  fps    + Porównaj
ultra 1920x1080
131.7  fps    + Porównaj
QHD 2560x1440
112.1  fps    + Porównaj
» Na wszystkich testowanych laptopach grywalna przy ustawieniach ultra.
Additional Benchmarks
Low Preset 1280x720
186.1
med. 1920x1080
59.6  fps    + Porównaj + 📈 Graph
high 1920x1080
59.5  fps    + Porównaj + 📈 Graph
ultra 1920x1080
59.5  fps    + Porównaj + 📈 Graph
QHD 2560x1440
59.5  fps    + Porównaj + 📈 Graph
4K 3840x2160
45  fps    + Porównaj + 📈 Graph
» Na wszystkich testowanych laptopach grywalna przy ustawieniach ultra.
high 1920x1080
95  fps    + Porównaj
QHD 2560x1440
64  fps    + Porównaj
4K 3840x2160
32  fps    + Porównaj
» Na wszystkich testowanych laptopach grywalna przy ustawieniach high.
Additional Benchmarks
High Quality Raytracing 1920x1080
42
med. 1920x1080
253  fps    + Porównaj
high 1920x1080
240  fps    + Porównaj
ultra 1920x1080
188  fps    + Porównaj
QHD 2560x1440
125  fps    + Porównaj
4K 3840x2160
64  fps    + Porównaj
» Na wszystkich testowanych laptopach grywalna przy ustawieniach ultra.
low 1920x1080
143.1  fps    + Porównaj + 📈 Graph
med. 1920x1080
119.5  fps    + Porównaj + 📈 Graph
high 1920x1080
95.6 109 ~ 102 fps    + Porównaj + 📈 Graph
ultra 1920x1080
68.8 80 ~ 74 fps    + Porównaj + 📈 Graph
QHD 2560x1440
58.5 65 ~ 62 fps    + Porównaj + 📈 Graph
4K 3840x2160
43  fps    + Porównaj
» Na wszystkich testowanych laptopach grywalna przy ustawieniach ultra.
Additional Benchmarks
Low Preset 1280x720
182.7
med. 1920x1080
172.7  fps    + Porównaj + 📈 Graph
high 1920x1080
149.1  fps    + Porównaj + 📈 Graph
ultra 1920x1080
140.6  fps    + Porównaj + 📈 Graph
QHD 2560x1440
102.5  fps    + Porównaj + 📈 Graph
4K 3840x2160
57.5  fps    + Porównaj + 📈 Graph
» Na wszystkich testowanych laptopach grywalna przy ustawieniach ultra.
med. 1920x1080
203  fps    + Porównaj + 📈 Graph
high 1920x1080
148.2  fps    + Porównaj + 📈 Graph
ultra 1920x1080
138.9  fps    + Porównaj + 📈 Graph
QHD 2560x1440
137  fps    + Porównaj + 📈 Graph
4K 3840x2160
94.1  fps    + Porównaj + 📈 Graph
» Na wszystkich testowanych laptopach grywalna przy ustawieniach ultra.
med. 1920x1080
160  fps    + Porównaj
high 1920x1080
135  fps    + Porównaj
ultra 1920x1080
121  fps    + Porównaj
QHD 2560x1440
87  fps    + Porównaj
4K 3840x2160
49  fps    + Porównaj
» Na wszystkich testowanych laptopach grywalna przy ustawieniach ultra.
med. 1920x1080
148  fps    + Porównaj
high 1920x1080
147  fps    + Porównaj
ultra 1920x1080
144  fps    + Porównaj
QHD 2560x1440
108  fps    + Porównaj
4K 3840x2160
60  fps    + Porównaj
» Na wszystkich testowanych laptopach grywalna przy ustawieniach ultra.
Additional Benchmarks
Ultra Preset + Ultra Ray-Tracing 1920x1080
85
med. 1920x1080
252  fps    + Porównaj + 📈 Graph
high 1920x1080
221  fps    + Porównaj + 📈 Graph
ultra 1920x1080
209  fps    + Porównaj + 📈 Graph
QHD 2560x1440
129.4  fps    + Porównaj + 📈 Graph
4K 3840x2160
73.7  fps    + Porównaj + 📈 Graph
» Na wszystkich testowanych laptopach grywalna przy ustawieniach ultra.
Far Cry 6

Far Cry 6

2021
low 1280x720
168.8  fps    + Porównaj + 📈 Graph
med. 1920x1080
143  fps    + Porównaj + 📈 Graph
high 1920x1080
126.5 144 ~ 135 fps    + Porównaj + 📈 Graph
ultra 1920x1080
89 92 103 105 110 114.5 126 ~ 106 fps    + Porównaj + 📈 Graph
QHD 2560x1440
70 77 82 86.7 87 88 91 ~ 83 fps    + Porównaj + 📈 Graph
4K 3840x2160
43 48 ~ 46 fps    + Porównaj
» Na wszystkich testowanych laptopach grywalna przy ustawieniach ultra.
Additional Benchmarks
Low Graphics Quality 1920x1080
158.5
Ultra Graphics Quality + HD Textures + DXR TAA 1920x1080
78
85.2
Deathloop

Deathloop

2021
med. 1920x1080
139.9  fps    + Porównaj + 📈 Graph
high 1920x1080
129.8  fps    + Porównaj + 📈 Graph
ultra 1920x1080
106.3  fps    + Porównaj + 📈 Graph
QHD 2560x1440
65.4  fps    + Porównaj + 📈 Graph
4K 3840x2160
37.4  fps    + Porównaj + 📈 Graph
» Na wszystkich testowanych laptopach grywalna przy ustawieniach ultra.
F1 2021

F1 2021

2021
low 1280x720
294 299 339 378 441 520 ~ 379 fps    + Porównaj
med. 1920x1080
182.6 262 270 276 300 336 407 ~ 291 fps    + Porównaj
high 1920x1080
162.5 220 220 234 238 264 306 ~ 235 fps    + Porównaj
ultra 1920x1080
118.4 123.1 129 133.1 139.5 149.8 157.5 ~ 136 fps    + Porównaj
QHD 2560x1440
88.6 95.2 96.6 104.3 108.5 110.9 114.7 ~ 103 fps    + Porównaj
4K 3840x2160
63.4  fps    + Porównaj
» Na wszystkich testowanych laptopach grywalna przy ustawieniach ultra.
Days Gone

Days Gone

2021
med. 1920x1080
173.2  fps    + Porównaj + 📈 Graph
high 1920x1080
154.7  fps    + Porównaj + 📈 Graph
ultra 1920x1080
119.2  fps    + Porównaj + 📈 Graph
QHD 2560x1440
83.8  fps    + Porównaj + 📈 Graph
4K 3840x2160
45  fps    + Porównaj + 📈 Graph
» Na wszystkich testowanych laptopach grywalna przy ustawieniach ultra.
med. 1920x1080
220  fps    + Porównaj + 📈 Graph
high 1920x1080
212  fps    + Porównaj + 📈 Graph
ultra 1920x1080
189.7  fps    + Porównaj + 📈 Graph
QHD 2560x1440
128.6  fps    + Porównaj + 📈 Graph
4K 3840x2160
62.7  fps    + Porównaj + 📈 Graph
» Na wszystkich testowanych laptopach grywalna przy ustawieniach ultra.
Additional Benchmarks
Ray Tracing Preset 1920x1080
115.6
Outriders

Outriders

2021
med. 1920x1080
165.3  fps    + Porównaj + 📈 Graph
high 1920x1080
145.2  fps    + Porównaj + 📈 Graph
ultra 1920x1080
129.4  fps    + Porównaj + 📈 Graph
QHD 2560x1440
90  fps    + Porównaj + 📈 Graph
4K 3840x2160
46.3  fps    + Porównaj + 📈 Graph
» Na wszystkich testowanych laptopach grywalna przy ustawieniach ultra.
Hitman 3

Hitman 3

2021
low 1280x720
294.3  fps    + Porównaj
med. 1920x1080
234  fps    + Porównaj
high 1920x1080
208.4  fps    + Porównaj
ultra 1920x1080
197.4  fps    + Porównaj
QHD 2560x1440
129.9  fps    + Porównaj
4K 3840x2160
68.5  fps    + Porównaj
» Na wszystkich testowanych laptopach grywalna przy ustawieniach ultra.
Additional Benchmarks
Minimum Settings 1920x1080
284.1
ultra 1920x1080
86 101 106 ~ 98 fps    + Porównaj
QHD 2560x1440
65 75 78 ~ 73 fps    + Porównaj
4K 3840x2160
41 43 ~ 42 fps    + Porównaj
» Na wszystkich testowanych laptopach grywalna przy ustawieniach ultra.
high 1920x1080
130  fps    + Porównaj
ultra 1920x1080
89  fps    + Porównaj
QHD 2560x1440
64  fps    + Porównaj
4K 3840x2160
33  fps    + Porównaj
» Na wszystkich testowanych laptopach grywalna przy ustawieniach ultra.
Additional Benchmarks
Ultra Preset + Ultra Ray Tracing (DX12) 1920x1080
45
low 1280x720
158.8  fps    + Porównaj + 📈 Graph
med. 1920x1080
117.2  fps    + Porównaj + 📈 Graph
high 1920x1080
82.5  fps    + Porównaj + 📈 Graph
ultra 1920x1080
64.8  fps    + Porównaj + 📈 Graph
QHD 2560x1440
50.1  fps    + Porównaj + 📈 Graph
» Na wszystkich testowanych laptopach grywalna przy ustawieniach ultra.
Additional Benchmarks
Low-End TAAAA 1920x1080
151.8
high 1920x1080
143  fps    + Porównaj
ultra 1920x1080
126  fps    + Porównaj
QHD 2560x1440
98  fps    + Porównaj
4K 3840x2160
52  fps    + Porównaj
» Na wszystkich testowanych laptopach grywalna przy ustawieniach ultra.
F1 2020

F1 2020

2020
low 1280x720
331  fps    + Porównaj
med. 1920x1080
276  fps    + Porównaj
high 1920x1080
235  fps    + Porównaj
ultra 1920x1080
183  fps    + Porównaj
QHD 2560x1440
142.6  fps    + Porównaj
» Na wszystkich testowanych laptopach grywalna przy ustawieniach ultra.
low 1280x720
175.9 258.5 ~ 217 fps    + Porównaj
med. 1920x1080
145.9 200.1 ~ 173 fps    + Porównaj
high 1920x1080
119.7 131.8 139 ~ 130 fps    + Porównaj
ultra 1920x1080
98.6 100.3 109 ~ 103 fps    + Porównaj
QHD 2560x1440
68.7 71.5 75 ~ 72 fps    + Porównaj
4K 3840x2160
35.7 40 ~ 38 fps    + Porównaj
» Na wszystkich testowanych laptopach grywalna przy ustawieniach ultra.
Additional Benchmarks
Very Low Overall Quality (DX11) 1920x1080
252.8
166.7
low 1280x720
165  fps    + Porównaj + 📈 Graph
med. 1920x1080
140  fps    + Porównaj + 📈 Graph
high 1920x1080
135  fps    + Porównaj + 📈 Graph
ultra 1920x1080
120  fps    + Porównaj + 📈 Graph
QHD 2560x1440
105  fps    + Porównaj + 📈 Graph
» Na wszystkich testowanych laptopach grywalna przy ustawieniach ultra.
low 1280x720
208.9 221 ~ 215 fps    + Porównaj
med. 1920x1080
139.8 141.3 ~ 141 fps    + Porównaj
high 1920x1080
109.7 109.8 117 ~ 112 fps    + Porównaj
ultra 1920x1080
86.8 87.2 91 ~ 88 fps    + Porównaj
QHD 2560x1440
69 69.1 72 ~ 70 fps    + Porównaj
4K 3840x2160
44 46 ~ 45 fps    + Porównaj
» Na wszystkich testowanych laptopach grywalna przy ustawieniach ultra.
Additional Benchmarks
Ultra Quality DXR 16xAF 1920x1080
78
74.4
74.3
low 1280x720
206  fps    + Porównaj
med. 1920x1080
163.4  fps    + Porównaj
high 1920x1080
158.1 172 ~ 165 fps    + Porównaj
ultra 1920x1080
117 131 137 145.9 153 158 158 158 168 ~ 147 fps    + Porównaj
QHD 2560x1440
86 99 102 103 104 107 110 119 129 ~ 107 fps    + Porównaj
4K 3840x2160
50 53 53 70 ~ 57 fps    + Porównaj
» Na wszystkich testowanych laptopach grywalna przy ustawieniach ultra.
Additional Benchmarks
Lowest Preset 1920x1080
183.7
Strange Brigade

Strange Brigade

2018
low 1280x720
315 334 340 362 367 370 375 390 393 414 418 423 427 431 436 455 464 468 470 476 481 483 485 490 490 496 537 544 558 567 636 ~ 448 fps    + Porównaj
med. 1920x1080
162.1 172.1 224 238 242 249 249 258 261 270 272 273 276 277 277 278 280 286 295 295 295 300 300 300 302 305 308 309 310 310 311 313 315 316 326 332 334 340 ~ 283 fps    + Porównaj
high 1920x1080
136.6 150.6 173.9 192 192.4 202 202 211 213 215 215 220 220 221 221 223 225 227 230 231 232 233 233 235 235 237 243 244 244 244 245 245 245 247 249 249 250 252 255 255 259 260 268 ~ 227 fps    + Porównaj
ultra 1920x1080
117.7 129.3 142.7 148.7 165.4 174.8 175 180.5 187.1 190.3 190.6 192 192.6 194 194.2 195 196.7 196.9 200 201 202 202 202 203 204 204 208 208 208 209 209 210 211 213 213 214 214 214 217 218 219 220 223 228 234 ~ 197 fps    + Porównaj
QHD 2560x1440
79.9 95.3 106.2 113.6 116 122.8 123.4 126.3 126.7 129 131.4 131.6 132 132 132.8 133.1 133.2 133.3 133.5 133.6 134.3 135.2 136.2 136.7 138.1 138.7 138.8 139 139.2 139.3 139.8 141.7 143 143.3 146.4 149.2 150.9 ~ 131 fps    + Porównaj
4K 3840x2160
42.7 61.7 67.6 70.4 71.4 71.9 72.6 73.8 74.7 75.3 75.7 76.8 77.9 ~ 70 fps    + Porównaj
» Na wszystkich testowanych laptopach grywalna przy ustawieniach ultra.
Far Cry 5

Far Cry 5

2018
low 1280x720
132 140 141 147 156 168 178 183 184 187 187 188 190 191 193 202 204 ~ 175 fps    + Porównaj + 📈 Graph
med. 1920x1080
115 119 120 124 126 126 133 134 134 138 146 156 157 157 161 162 163 163 166 168 176 179 183 ~ 148 fps    + Porównaj + 📈 Graph
high 1920x1080
98 110 114 116 117 118 121 122 122 127 130 133 134 141 145 149 150 151 153 154 154 154 157 159 166 169 170 ~ 138 fps    + Porównaj + 📈 Graph
ultra 1920x1080
92 103 103 109 109 112 115 116 116 120 121 123 123 123 132 136 140 141 143 144 144 145 145 146 149 157 158 158 ~ 129 fps    + Porównaj + 📈 Graph
QHD 2560x1440
79 94 94 95 95 98 102 102 108 109 111 112 113 113 114 114 114 115 115 115 117 117 118 122 124 128 ~ 109 fps    + Porównaj + 📈 Graph
4K 3840x2160
55 60 61 61 62 65 ~ 61 fps    + Porównaj + 📈 Graph
» Na wszystkich testowanych laptopach grywalna przy ustawieniach ultra.
Additional Benchmarks
Low Preset TAA 1920x1080
185
175
178
182
176
129
170
150
136
196
low 1280x720
100.5 106.3 107 109.9 114.7 119.9 121 121.6 121.8 123.6 123.7 125.1 132.3 133.9 134.2 136 142.5 143.4 144.7 146 147.6 154.6 154.8 158.5 160 162.3 164.9 165.7 166.6 166.7 169.3 172.4 181.6 182.3 182.9 186.3 188.3 189.4 191.5 192.8 194.4 198 203 205 212 ~ 155 fps    + Porównaj
med. 1920x1080
91.6 94.2 98 101.7 101.9 103.8 103.8 106.3 107.3 108.3 108.5 108.8 116 116.6 118.1 118.3 118.7 122.2 122.6 130.6 130.8 133.1 138.4 141.7 141.8 142.1 142.4 143.3 145.5 145.8 146.4 148 151.8 155.2 155.9 158.7 161.7 163 164.3 165.6 169.8 173.3 173.3 178.9 180.6 187.1 ~ 136 fps    + Porównaj
high 1920x1080
72.2 76.3 76.8 78.4 80.7 81.2 82 84.4 84.7 84.8 85.5 86.2 87.8 90.5 90.6 90.8 95.4 98 100.6 101.4 102 106.4 109.7 110.2 110.3 112.6 113.4 113.4 114.9 115.3 117.1 117.8 119.5 120.8 121.2 122.4 123 126.3 126.4 128.5 129.2 131.1 132.9 136.9 137.6 137.9 138.2 144.4 ~ 107 fps    + Porównaj
4K 3840x2160
65.2 67.3 68.6 68.9 73.4 76.6 78.2 85.7 89.7 90 98.5 99.5 102.2 103.4 105.7 109.2 114 117.7 120.3 122.7 ~ 93 fps    + Porównaj
» Na wszystkich testowanych laptopach grywalna przy ustawieniach high.
low 1280x720
108.6 150.2 174.8 175.3 176.6 184.6 186.2 189.6 191.3 198.5 202 205 205 208 212 213 213 215 216 219 220 220 223 226 227 227 229 231 ~ 202 fps    + Porównaj
med. 1920x1080
84 121.8 123.2 128.2 128.3 131.8 132.3 132.3 138 139.1 141.1 143.2 144.4 145 147.5 147.7 150.5 153.1 154.2 156.2 159.1 159.8 162.3 162.4 162.8 163.9 164.8 165.1 166.2 166.3 166.8 166.9 167.2 168.8 171.4 172.5 173.7 175.2 175.5 177.3 185.9 ~ 153 fps    + Porównaj
high 1920x1080
66 82 93.1 93.3 94.7 100.8 101.4 103.1 106.3 107.1 108.3 108.3 108.7 109 109.1 109.3 111.5 111.9 113.9 114.3 114.3 114.7 114.8 115 115.2 115.4 115.5 115.5 115.7 116.1 116.2 117.5 119.3 119.4 119.8 119.9 121.2 121.2 121.5 121.9 122.1 122.7 124.6 124.8 131 ~ 112 fps    + Porównaj
QHD 2560x1440
48.8 60.2 69.9 70 71.6 74.1 75.5 76.3 79.5 80.9 81.2 81.3 81.6 82 82.6 82.6 83.3 83.7 83.8 84.1 84.1 84.4 84.7 84.7 85.2 85.2 85.6 85.8 86.1 86.2 88.4 88.6 88.7 88.9 89 89.1 90.5 91 91.4 95.1 119.9 ~ 83 fps    + Porównaj
4K 3840x2160
26.6 38.2 40.3 46.1 46.1 46.6 46.7 46.9 47.1 47.5 47.5 48.5 48.5 48.8 49.2 49.4 51.5 52.8 ~ 46 fps    + Porównaj
» Na wszystkich testowanych laptopach grywalna przy ustawieniach high.
low 1280x720
89.8 135.8 137.7 149.5 149.6 161.2 161.6 162.3 164.1 164.7 165.3 166.4 166.8 171 171.7 173.9 174 178.3 178.4 186.9 189.5 189.6 191.9 192.8 193.5 199.2 202 203 203 205 210 212 213 215 225 230 231 232 233 233 234 238 ~ 188 fps    + Porównaj
med. 1366x768
89.6 122.8 130.5 131.9 140.6 144.5 146.4 146.8 147.9 149 149.2 149.8 152 152.5 153.5 155.7 157 158 161.3 163.1 167.6 169 173.2 174.3 174.5 178.9 181.1 182.3 183.2 183.3 185.1 187.5 187.9 192 192.8 200 203 205 205 206 207 208 208 ~ 169 fps    + Porównaj
high 1920x1080
89.5 99.7 114.5 118.9 126.3 127.7 135.9 138.1 139.3 140.7 142.2 142.8 143.6 144.1 145.3 146.3 147.6 148.1 149.5 150.9 152.4 160.5 161.1 162.4 164.4 165.9 167 168.7 169.8 169.9 171.5 172.5 175.8 176.5 177.3 184.4 187.2 188.4 191 191.8 193.4 194.9 195.4 196.5 196.7 199.1 ~ 159 fps    + Porównaj
ultra 1920x1080
89.7 97.4 108.3 114.8 119.5 120.7 126.9 130 131.6 131.6 134.8 135 136.1 136.1 137 137.8 138.5 139 139.7 143.8 144.5 149.4 149.9 154.1 154.7 154.7 156.9 158.3 158.8 162.2 162.8 163.4 164.5 165.3 166.3 168.4 170.2 171.6 178.6 179.5 180.6 180.9 181.7 182 182.1 185.3 ~ 149 fps    + Porównaj
4K 3840x2160
88.4 107 108 112.2 115.7 117.3 118.6 119.6 128.3 130.6 132.4 135.2 136.9 141.3 142.5 145.5 146.6 150.7 151.5 153.3 ~ 129 fps    + Porównaj
» Na wszystkich testowanych laptopach grywalna przy ustawieniach ultra.
low 1024x768
313.8 322.5 335.2 354.2 364.2 399 399.6 415.2 432.4 435 452.3 459.3 474.9 484.7 500.9 545 556.7 597 603.3 606.3 607.3 617 ~ 467 fps    + Porównaj + 📈 Graph
med. 1366x768
123.3 233.3 277.3 291.5 295.9 297.6 317 327 338 344.6 356.8 365.4 366.3 371.8 375.9 379 390.1 390.5 391.4 405.9 415.1 418.4 430.3 448.7 ~ 348 fps    + Porównaj + 📈 Graph
high 1920x1080
123.9 161 181.4 195 203 205 213.3 216 218.5 221 222.7 223 223 225.9 226 226 226.7 228.3 228.7 230.9 231.4 234.9 236 237 240.5 240.9 242 242.3 245.2 246 246.2 249 257.3 258 260.5 268.3 ~ 226 fps    + Porównaj + 📈 Graph
ultra 1920x1080
69.8 71 75 83.2 87.8 94 96.2 97.1 98.6 103 105.3 105.4 106.9 107.1 107.8 109.5 110 110 111.8 112 113.1 113.2 113.9 114 114 115 116 116 116.8 117 117 117.9 118.4 119 119 119.8 120 120.4 120.7 121 121.1 121.3 122 123.2 123.3 124 127 127.2 128 133.7 ~ 111 fps    + Porównaj + 📈 Graph
QHD 2560x1440
47 73 77.7 81.6 82.4 86.9 88.5 89 92 92 92.2 93.1 ~ 83 fps    + Porównaj + 📈 Graph
4K 3840x2160
26.5 59 60 65.7 68.5 69.4 70 72 72.5 75.2 76.2 78.8 83.5 ~ 67 fps    + Porównaj
» Na wszystkich testowanych laptopach grywalna przy ustawieniach ultra.
Additional Benchmarks
Ultra Graphics & Postprocessing (HBAO+) 3840x2160
46
50.6
Medium Graphics & Postprocessing 1920x1080
263
260.1
277.8
GTA V

GTA V

2015
low 1024x768
170.6 180 180.6 182.2 182.4 183.1 184 184.8 185.1 185.3 185.4 185.8 186.1 186.6 186.7 186.8 187 187 187.1 187.3 187.3 187.5 187.8 ~ 185 fps    + Porównaj
med. 1366x768
165.6 168.1 168.5 170 175.4 176 176.8 177 177.7 179 180.3 180.9 181.2 182.2 182.5 182.5 183.4 184.1 184.5 184.7 184.7 184.9 185.1 185.9 185.9 185.9 186.4 186.9 187 187 187.2 ~ 181 fps    + Porównaj
high 1920x1080
134.3 150.1 152.8 155.8 156.9 158.3 158.9 164.9 165.8 166.5 166.8 167.9 169 169.8 170.7 171.4 172.7 174.1 175 175.3 175.7 176.5 176.9 178.1 178.3 178.6 179 179.4 180.2 180.3 180.8 180.9 181.3 181.6 181.7 182.4 182.9 183.1 183.1 183.8 186.4 ~ 172 fps    + Porównaj
ultra 1920x1080
63.5 74.7 90.4 94.4 94.8 95.7 96.5 97.4 98.8 100.3 102.7 103.6 105.9 107.2 108.9 109.9 110.9 112.8 114 114.3 115.2 115.8 116.1 116.4 116.6 117.2 117.4 117.7 117.8 119.7 119.9 121.4 123 123.2 124.1 124.8 125.4 127.2 127.8 128 130.5 137.6 ~ 111 fps    + Porównaj
QHD 2560x1440
52.9 64.5 72.6 75.5 75.9 79.6 80.2 80.6 81.3 82.3 86.1 86.8 87.6 87.6 88.5 88.8 90 90.4 90.5 90.6 90.6 92.2 92.3 92.8 93.1 93.2 93.2 94.2 94.3 94.5 95.2 98.2 100.1 ~ 87 fps    + Porównaj
4K 3840x2160
53 75 76.9 87.7 88.5 90.1 92.5 93.6 93.7 98.7 99.8 ~ 86 fps    + Porównaj
» Na wszystkich testowanych laptopach grywalna przy ustawieniach ultra.
Additional Benchmarks
Highest Settings possible 16xAF 4xMSAA + FXAA 3840x2160
40.5
38.2
40.7
25.9
40.9
36.4
41.5
43.9
42.7
44.1
Normal/Off 4xAF 1920x1080
186.4
185.5
182.7
185.7
172.1
186.2
182.7
68.2
186.3
159.9
185.6
182.1
183.5
184.4
180
173.7
175.8
179.5
169
167
186
175.7
179.2
179.4
170.6
175.4
181.2
186
186.3
186.8
187.5
Lowest Settings possible 1920x1080
186.6
187
187.1
181.7
187.4
187.2
73.7
187.3
157.5
187
185.9
185.7
186.6
183
179.2
182.4
184.9
173
186.8
132.1
183.4
186.8
187
187.5
187.9
lowmed.highultraQHD4K
Dragon's Dogma 276735932.9
Horizon Forbidden West1029370655132.3
Alone in the Dark2071861751227117
Last Epoch169.71761671378137.4
Skull & Bones10710996786136
Helldivers 2129.5117.3100987240
Enshrouded75.265544123.5
Palworld118.41071037542.7
Prince of Persia The Lost Crown358358358340186.7
Ready or Not2202011489040.6
The Finals186.61741438942.9
Avatar Frontiers of Pandora888373543720
Call of Duty Modern Warfare 3 20231631491141057449
EA Sports WRC9387796437.7
Alan Wake 27771684219.8
Lords of the Fallen96.98563452914.6
Total War Pharaoh385.92511561219147.1
Assassin's Creed Mirage143135127987641
EA Sports FC 24192.7162.3150.1138.482.4
Counter-Strike 21721611319455.4
Cyberpunk 2077 2.0 Phantom Liberty12510993825123
Lies of P2061851631449849
The Crew Motorfest6060605939
Starfield65524737.224
Armored Core 6104103998145.2
Immortals of Aveum58473419.7
Atlas Fallen1291211078551
Baldur's Gate 31571271071047340
Ratchet & Clank Rift Apart90.47661564933.2
F1 23236237193684223
Diablo 424923020818011360.9
Star Wars Jedi Survivor878175714524
Dead Island 2167.919317116111252.5
The Last of Us958173684530.6
Resident Evil 4 Remake1551211138160
Company of Heroes 322018915214911263
Sons of the Forest98.385828265
Atomic Heart188142937556
Returnal989890765729
Hogwarts Legacy142.797795227.7
Dead Space Remake1009684835426
The Witcher 3 v4.00271215139865428
High On Life2281771341096725.7
The Callisto Protocol147128123836332.96
Need for Speed Unbound118.1122106937336.2
Spider-Man Miles Morales115946942
Call of Duty Modern Warfare 2 20221111017243
Uncharted Legacy of Thieves Collection9391858261
A Plague Tale Requiem71625640.923
FIFA 23166.2
The Quarry146122.19868.228.7
F1 22237232189744724
Vampire Bloodhunt212199.9195.7148.678.5
Ghostwire Tokyo172.7171.7165.9108.752.3
Tiny Tina's Wonderlands226188129996936
Cyberpunk 2077 1.613412097855322
Elex 2118.7118.2112.978.940
GRID Legends182.9164.1150.1131.7112.1
Elden Ring59.659.559.559.545
Dying Light 2956432
Rainbow Six Extraction25324018812564
God of War143.1119.5102746243
Halo Infinite172.7149.1140.6102.557.5
Farming Simulator 22203148.2138.913794.1
Riders Republic1601351218749
Guardians of the Galaxy14814714410860
Back 4 Blood252221209129.473.7
Far Cry 6168.81431351068346
Deathloop139.9129.8106.365.437.4
F1 202137929123513610363.4
Days Gone173.2154.7119.283.845
Resident Evil Village220212189.7128.662.7
Outriders165.3145.2129.49046.3
Hitman 3294.3234208.4197.4129.968.5
Assassin´s Creed Valhalla987342
Watch Dogs Legion130896433
Flight Simulator 2020158.8117.282.564.850.1
Horizon Zero Dawn1431269852
F1 2020331276235183142.6
Borderlands 32171731301037238
Far Cry New Dawn165140135120105
Metro Exodus215141112887045
Shadow of the Tomb Raider206163.416514710757
Strange Brigade44828322719713170
Far Cry 517514813812910961
X-Plane 11.1115513610793
Final Fantasy XV Benchmark2021531128346
Dota 2 Reborn188169159149129
The Witcher 34673482261118367
GTA V1851811721118786
< 30 fps
< 60 fps
< 120 fps
≥ 120 fps


14
39

1
24
56

3
37
48

8
44
32
1
23
53
11
19
44
16
2

Więcej informacji w rankingu płynności w grach

v1.26
log 26. 13:39:53

#0 no ids found in url (should be separated by "_") +0s ... 0s

#1 not redirecting to Ajax server +0s ... 0s

#2 did not recreate cache, as it is less than 5 days old! Created at Thu, 25 Apr 2024 05:40:10 +0200 +0.001s ... 0.001s

#3 no comparison url found in template nbc.compare_page_1 needed +0.067s ... 0.068s

#4 no comparison url found in template nbc.compare_page_1 needed +0s ... 0.068s

#5 no comparison url found in template nbc.compare_page_1 needed +0s ... 0.069s

#6 no comparison url found in template nbc.compare_page_1 needed +0s ... 0.069s

#7 composed specs +0.001s ... 0.07s

#8 did output specs +0s ... 0.07s

#9 start showIntegratedCPUs +0s ... 0.07s

#10 getting avg benchmarks for device 11453 +0.025s ... 0.095s

#11 got single benchmarks 11453 +0.206s ... 0.301s

#12 got avg benchmarks for devices +0s ... 0.301s

#13 min, max, avg, median took s +1.216s ... 1.517s

#14 before gaming benchmark output +0.001s ... 1.518s

#15 Got 2651 rows for game benchmarks. +0.873s ... 2.392s

#16 composed SQL query for gamebenchmarks +0s ... 2.392s

#17 got data and put it in $dataArray +0.071s ... 2.462s

#18 benchmarks composed for output. +4.161s ... 6.623s

#19 no comparison url found in template nbc.compare_page_1 needed +0.013s ... 6.636s

#20 return log +0s ... 6.636s

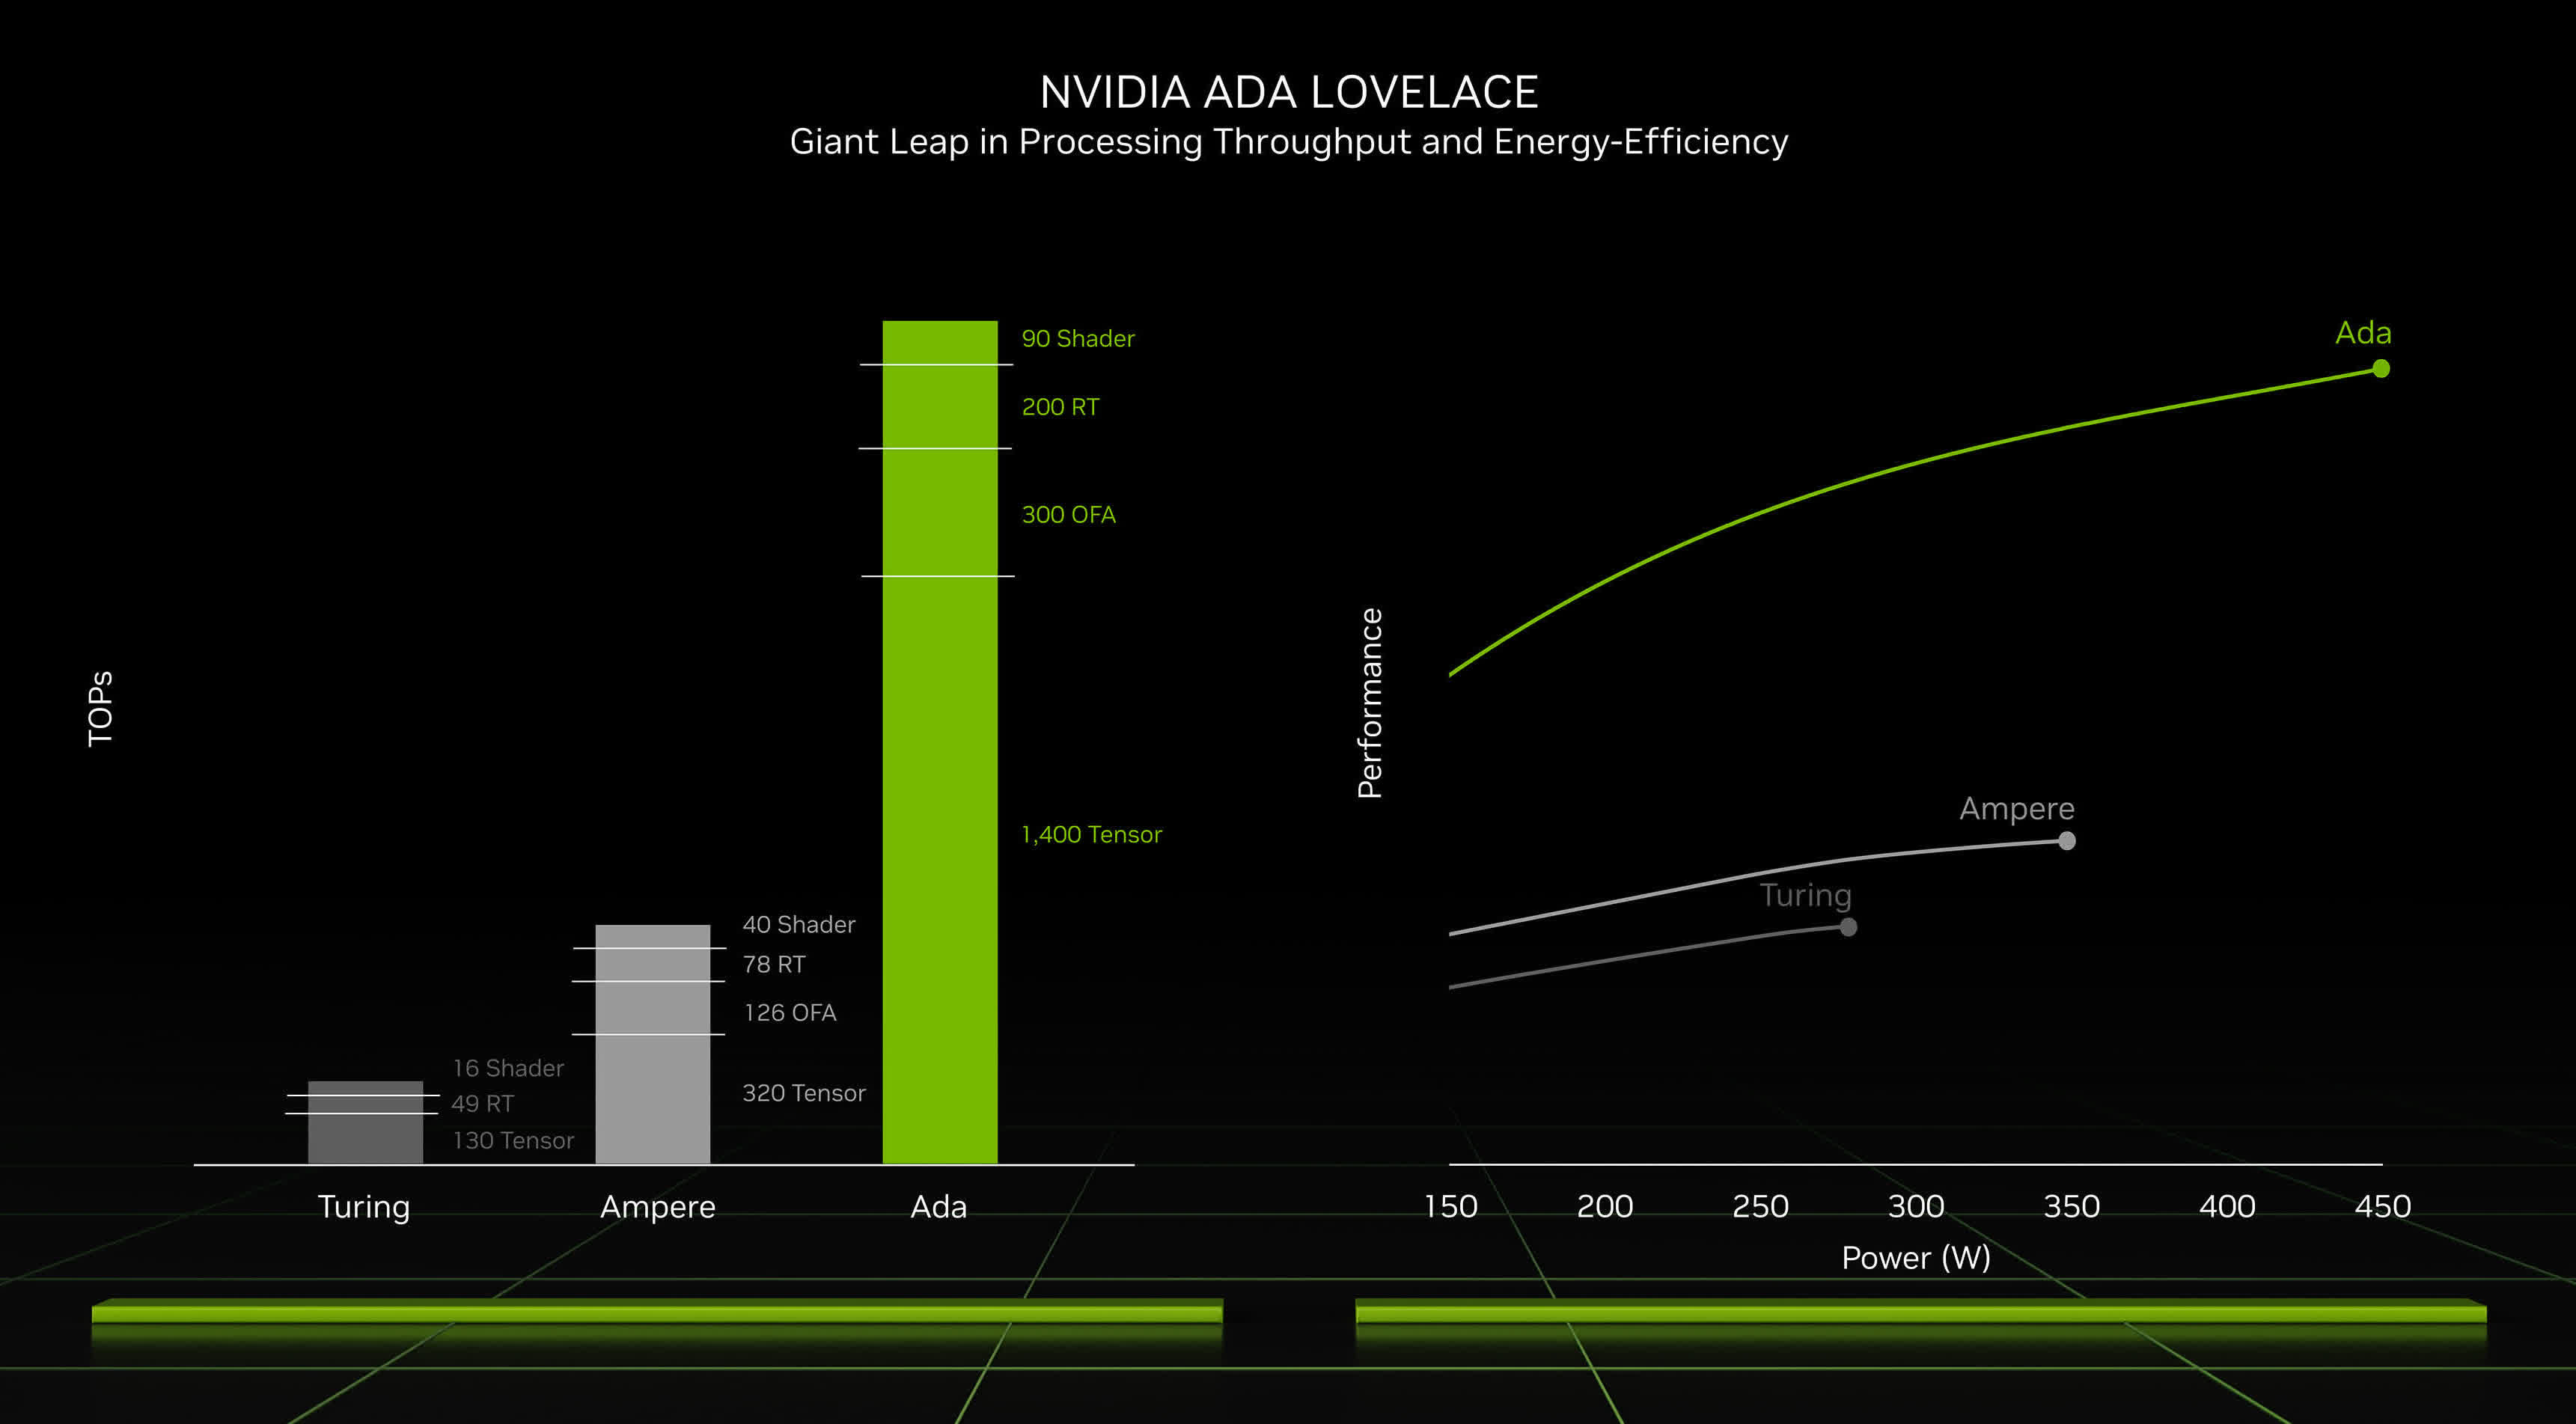
Recenzje laptopów NVIDIA GeForce RTX 4070 Laptop GPU z kartą graficzną

Recenzja laptopa Lenovo Yoga Pro 9i 16 G9: MiniLED z 1200 nitami i Core Ultra 9

Recenzja laptopa Lenovo Yoga Pro 9i 16 G9: MiniLED z 1200 nitami i Core Ultra 9

Lenovo ulepszyło swój multimedialny flagowiec Yoga Pro 9i 16 generacji G9 w kilku obszarach. Panel mini LED 3,2K o jasności 1200 nitów jest opcjonalnie matowy i...
Intel Core Ultra 9 185H | NVIDIA GeForce RTX 4070 Laptop GPU | 16.00" | 2.1 kg
Recenzja laptopa Lenovo Legion 7 16 G9 - gamingowa maszyna z wyświetlaczem 3,2K, procesorem HX i podkręconą kartą graficzną RTX 4070

Recenzja laptopa Lenovo Legion 7 16 G9 - gamingowa maszyna z wyświetlaczem 3,2K, procesorem HX i podkręconą kartą graficzną RTX 4070

Dzięki Legion 7 16 G9 Lenovo oferuje stosunkowo smukły i przyciągający wzrok laptop do gier, który jest również interesujący dla innych grup docelowych, takich ...
Intel Core i9-14900HX | NVIDIA GeForce RTX 4070 Laptop GPU | 16.00" | 2.3 kg
Recenzja Aorus 16X (2024): Core i9 i RTX 4070 za 2000 USD

Recenzja Aorus 16X (2024): Core i9 i RTX 4070 za 2000 USD

Core i9-14900HX i GeForce RTX 4070 wyposażają Aorus 16X (2024) do edycji wideo, gier i renderowania. Do tego dochodzi jasny 16-calowy wyświetlacz (16:10, 2560 x...
Intel Core i9-14900HX | NVIDIA GeForce RTX 4070 Laptop GPU | 16.00" | 2.3 kg
Recenzja Dell XPS 16 9640 - multimedialny laptop z ekranem OLED 4K i irytującym paskiem dotykowym

Recenzja Dell XPS 16 9640 - multimedialny laptop z ekranem OLED 4K i irytującym paskiem dotykowym

XPS 16 9640 to nowy multimedialny okręt flagowy firmy Dell, zastępujący stary XPS 15. Oprócz większego 16-calowego wyświetlacza, jest on również wyposażony w ak...
Intel Core Ultra 7 155H | NVIDIA GeForce RTX 4070 Laptop GPU | 16.30" | 2.3 kg
Recenzja laptopa Lenovo Legion Pro 5 16IRX9: Świetna wydajność, ale trochę ciężki

Recenzja laptopa Lenovo Legion Pro 5 16IRX9: Świetna wydajność, ale trochę ciężki

Legion Pro 5 16 G9 zawiera kilka zmian w stosunku do zeszłorocznego Legion Pro 5 16 G8, zarówno wewnątrz, jak i na zewnątrz. Nie da się jednak uciec od faktu, ż...
Intel Core i9-14900HX | NVIDIA GeForce RTX 4070 Laptop GPU | 16.00" | 2.5 kg

Alienware m16 R2: Intel Core Ultra 7 155H, 16.00", 2.5 kg
  Recenzja » Recenzja laptopa Alienware m16 R2: Duże i ryzykowne zmiany

Razer Blade 14 RZ09-0508: AMD Ryzen 9 8945HS, 14.00", 1.9 kg
  Recenzja » Recenzja laptopa Razer Blade 14 2024: Przyszłościowe rozwiązania z Ryzen AI

HP Omen Transcend 16-u1095ng: Intel Core i9-14900HX, 16.00", 2.3 kg
  Recenzja » Recenzja laptopa HP Omen Transcend 16 (2024): Maszyna do gier RTX 4070 z wyświetlaczem OLED

Asus ROG Zephyrus G14 2024 GA403U: AMD Ryzen 9 8945HS, 14.00", 1.5 kg
  Recenzja » Recenzja Asus ROG Zephyrus G14 2024 - Laptop do gier/multimediów z procesorem Ryzen 8000 i G-Sync OLED

Asus ROG Zephyrus G16 2024 GU605M: Intel Core Ultra 7 155H, 16.00", 1.8 kg
  Recenzja » Recenzja Asus ROG Zephyrus G16 2024 - laptop do gier teraz z G-Sync OLED i Intel Meteor Lake

Asus TUF Gaming A17 FA707XI-NS94: AMD Ryzen 9 7940HS, 17.30", 2.5 kg
  Recenzja » Recenzja laptopa Asus TUF Gaming A17 FA707XI: 140 W GeForce RTX 4070 za 1400 dolarów

MSI Stealth 16 Mercedes-AMG Motorsport A13VG: Intel Core i9-13900H, 16.00", 1.9 kg
  Recenzja » Recenzja laptopa MSI Stealth 16 Mercedes-AMG Motorsport: Mobilny samochód wyścigowy z wyświetlaczem OLED

XMG Pro 16 Studio (Mid 23): Intel Core i9-13900H, 16.00", 2.6 kg
  Recenzja » Recenzja XMG Pro 16 Studio (Mid 23): Laptop RTX 4070 dla graczy i twórców

SCHENKER XMG CORE 16 (L23): AMD Ryzen 7 7840HS, 16.00", 2.4 kg
  Recenzja » Recenzja laptopa do gier SCHENKER XMG Core 16 - prawdziwy konkurent dla Lenovo Legion Pro 5 16

HP Victus 16-r0077ng: Intel Core i7-13700H, 16.10", 2.4 kg
  Recenzja » Recenzja laptopa HP Victus 16: Gracz Full HD z RTX 4070

HP Omen 16-xf0376ng: AMD Ryzen 7 7840HS, 16.10", 2.4 kg
  Recenzja » Recenzja laptopa HP Omen 16: Dobry wybór dla graczy nawet z Zen 4

Acer Nitro 17 AN17-41-R9LN: AMD Ryzen 7 7735HS, 17.30", 3 kg
  Recenzja » Recenzja Acer Nitro 17 Ryzen Edition: Laptop do gier QHD z RTX 4070

Aorus 15 BSF: Intel Core i7-13700H, 15.60", 2.4 kg
  Recenzja » Recenzja Aorus 15 BSF: Laptop do gier QHD z RTX 4070 i świetnymi czasami pracy

HP Omen Transcend 16: Intel Core i9-13900HX, 16.00", 2.3 kg
  Recenzja » Recenzja laptopa HP Omen Transcend 16: Więcej niż tylko mała różnica w nazwie

SCHENKER VISION 16 Pro (M23): Intel Core i7-13700H, 16.00", 1.6 kg
  Recenzja » Recenzja Schenker Vision 16 Pro 2023: 1.6-kilogramowy, lekki i wydajny zestaw z laptopem RTX 4070

MSI Pulse 17 B13VGK: Intel Core i7-13700H, 17.30", 2.7 kg
  Recenzja » Recenzja gamingowego laptopa MSI Pulse 17 B13V: Z cichymi skrzydłami

MSI Stealth 16 Studio A13VG: Intel Core i7-13700H, 16.00", 2 kg
  Recenzja » Recenzja laptopa MSI Stealth 16 Studio: Niezwykle lekkie, 16-calowe urządzenie z Core i7 i RTX 4070 dla graczy i twórców

Lenovo Legion Slim 7i 16 Gen 8: Intel Core i9-13900H, 16.00", 2.1 kg
  Recenzja » Recenzja laptopa Lenovo Legion Slim 7i 16 Gen 8: Smuklejszy niż Razer Blade 16

Asus ProArt Studiobook 16 OLED H7604: Intel Core i9-13980HX, 16.00", 2.4 kg
  Recenzja » Recenzja Asus ProArt Studiobook 16 OLED: Multimedialny laptop z ekstremalną wydajnością procesora

Razer Blade 14 RTX 4070: AMD Ryzen 9 7940HS, 14.00", 1.8 kg
  Recenzja » Recenzja laptopa Razer Blade 14 Zen 4: Wiele zmian, które mają znaczenie

Acer Nitro 16 AN16-41: AMD Ryzen 7 7735HS, 16.00", 2.7 kg
  Recenzja » Recenzja Acer Nitro 16 AN16-41: Laptop do gier z RTX 4070 i długim czasem pracy na baterii

SCHENKER XMG Focus 17 (E23): Intel Core i9-13900HX, 17.30", 2.9 kg
  Recenzja » Recenzja Schenker XMG Focus 17 (E23): Laptop do gier z RTX 4070 nie oszczędza na wydajności

Asus Zenbook Pro 14 OLED UX6404VI: Intel Core i9-13900H, 14.50", 1.7 kg
  Recenzja » Recenzja laptopa Asus Zenbook Pro 14 OLED: Rywal MacBooka Pro z wyświetlaczem OLED 120 Hz

Dell XPS 17 9730 RTX 4070: Intel Core i7-13700H, 17.00", 2.5 kg
  Recenzja » Recenzja laptopa Dell XPS 17 9730: GeForce Multimedialny potwór RTX 4070

Lenovo Legion Pro 5 16ARX8: AMD Ryzen 7 7745HX, 16.00", 2.5 kg
  Recenzja » Debiut wydajności Ryzen 7 7745HX: Recenzja laptopa Lenovo Legion Pro 5 16 Gen 8

Samsung Galaxy Book3 Ultra 16, i9-13900H RTX 4070: Intel Core i9-13900H, 16.00", 1.8 kg
  Recenzja » Samsung Galaxy Book3 Ultra 16 z RTX 4070 w recenzji: Wysoka wydajność graficzna w biznesowym notebooku

Medion Erazer Major X20: Intel Core i9-13900HX, 16.00", 2.4 kg
  Recenzja » Recenzja Medion Erazer Major X20: Gamingowy notebook z RTX 4070 i solidnym sprzętem

Dell XPS 15 9530 RTX 4070: Intel Core i7-13700H, 15.60", 1.9 kg
  Recenzja » Recenzja laptopa Dell XPS 15 9530 RTX 4070: Zarówno imponujący, jak i niezadowalający

Asus ROG Flow Z13 ACRNM: Intel Core i9-13900H, 13.40", 1.7 kg
  Recenzja » Recenzja Asus ROG Flow Z13 ACRNM - laptop konwertowalny dla graczy z RTX 4070

Aorus 15X ASF: Intel Core i7-13700HX, 15.60", 2.3 kg
  Recenzja » Recenzja Aorus 15X ASF: Gamingowy laptop z mocą i wytrzymałością RTX 4070

Asus ROG Strix G17 G713PI: AMD Ryzen 9 7945HX, 17.30", 2.8 kg
  Recenzja » Analiza AMD Ryzen 9 7945HX - Zen4 Dragon Range jest szybszy i wydajniejszy od Intel Raptor Lake-HX

Uniwill GM6PX7X RTX 4070: Intel Core i7-13700HX, 16.00", 2.2 kg
  Recenzja » Debiut wydajnościowy Core i7-13700HX: Recenzja laptopa Uniwill GM6PX7X IDX

Asus ROG Strix G17 G713PI: AMD Ryzen 9 7945HX, 17.30", 2.8 kg
  Recenzja » Asus ROG Strix G17 G713PI: Gamingowy laptop robi wrażenie w teście z nowym Ryzenem 9

Gigabyte AERO 16 OLED BSF: Intel Core i9-13900H, 16.00", 2.1 kg
  Recenzja » Recenzja smukłego laptopa Gigabyte AERO 16 OLED: Wydajny RTX 4070 dla graczy i twórców

Asus ROG Strix G18 G814JI: Intel Core i7-13650HX, 18.00", 3 kg
  Recenzja » Recenzja laptopa Asus ROG Strix G18 G814JI: Światło i cień z 18-calową maszyną do gier

Razer Blade 18 RTX 4070: Intel Core i9-13950HX, 18.00", 3 kg
  Recenzja » Recenzja laptopa Razer Blade 18: Mniejszy niż wiele 17-calowych laptopów do gier

SCHENKER XMG Neo 17 2023 Engineering Sample: Intel Core i9-13900HX
  Recenzja » GeForce Analiza laptopów RTX 4070, 4060 i 4050 - przegląd nowych procesorów graficznych Nvidii dla laptopów głównego nurtu

Asus ROG Zephyrus G14 2024 GA403U: AMD Ryzen 9 8945HS, 14.00", 1.5 kg
   » Asus ROG Zephyrus G14 i G16 trafiają do sprzedaży z wyświetlaczami OLED w cenie od 1899 euro

Asus ROG Zephyrus G16 2024 GU605M: Intel Core Ultra 7 155H, 16.00", 1.8 kg
   » Asus ROG Zephyrus G14 i G16 trafiają do sprzedaży z wyświetlaczami OLED w cenie od 1899 euro

HP Omen Transcend 16: Intel Core i9-13900HX, 16.00", 2.3 kg
   » HP Omen Transcend 16 to trzy kroki do przodu i jeden do tyłu dla serii

Lenovo Legion Slim 7i 16 Gen 8: Intel Core i9-13900H, 16.00", 2.1 kg
   » Niewielka dbałość o szczegóły w Lenovo Legion Slim Gen 8 rozwiązuje irytujący problem w Alienware x16 r1

Please share our article, every link counts!

Klasa 1

GeForce RTX 3080 Laptop GPU
RTX A5000 Laptop GPU
Quadro RTX 6000 (Laptop)
Radeon RX 6800M
GeForce RTX 2080 Super Mobile
GeForce RTX 3070 Laptop GPU
RTX A4000 Laptop GPU *

Klasa 2

Radeon RX 6800S
Radeon RX 6700M
GeForce RTX 3060 Laptop GPU
M1 Max 32-Core GPU *
GeForce RTX 2070 Super Mobile
GeForce RTX 2080 Super Max-Q
RTX A3000 Laptop GPU
M1 Max 24-Core GPU *
Radeon RX 6600M
Radeon RX 5700M *
M1 Pro 16-Core GPU *
Radeon PRO W6600M *
GeForce RTX 2070 Super Max-Q
M1 Pro 14-Core GPU *
RTX A2000 Laptop GPU
Radeon Pro 5600M *
Radeon RX 5600M
GeForce GTX 1660 Ti Mobile
GeForce RTX 3050 Ti Laptop GPU
GeForce RTX 3050 4GB Laptop GPU
GeForce GTX 1660 Ti Max-Q
Quadro T2000 (Laptop) *
GeForce GTX 1650 Ti Mobile
Radeon RX 5500M
GeForce GTX 1650 Mobile
GeForce GTX 1650 Ti Max-Q *
GeForce GTX 1650 Max-Q *
T1200 Laptop GPU *
T600 Laptop GPU *

Klasa 3

Radeon Pro Vega 20
Radeon 680M
T500 Laptop GPU *
GeForce MX450 *
Radeon Pro Vega 16
Radeon 660M
Quadro P1000
Xe MAX
Iris Xe G7 96EUs
GeForce MX350
Quadro M1200
Radeon Pro 555X
GeForce MX250
GeForce MX330
Iris Xe G7 80EUs
Radeon 540X *
Iris Plus Graphics G7 (Ice Lake 64 EU) *
UHD Graphics Xe G4 48EUs *
UHD Graphics 32EUs
UHD Graphics Xe 32EUs (Tiger Lake-H) *
UHD Graphics 750
GeForce MX230
Vega 8 *
Vega 7
Iris Plus Graphics 655
Vega 6 *
UHD Graphics 24EUs (Alder Lake-N) *
Radeon 610M *
Vega 5 *
UHD Graphics Xe 16EUs (Tiger Lake-H) *
UHD Graphics G7 (Lakefield GT2 64 EU)
Adreno 690 *
Adreno 685 *
Adreno 680 *
UHD Graphics G4 (Lakefield GT1 48 EU) *

Klasa 4

UHD Graphics 730
Vega 2 *
UHD Graphics (Jasper Lake 32 EU) *
UHD Graphics (Jasper Lake 24 EU) *
UHD Graphics 610
UHD Graphics (Jasper Lake 16 EU)

Klasa 5

* lokata szacunkowa

> laptopy testy i recenzje notebooki > Rankingi > Zestawienie mobilnych układów graficznych > NVIDIA NVIDIA GeForce RTX 4070 Laptop GPU
Klaus Hinum (Update: 2023-11-22)