Recenzja Schenker Vision 16 Pro 2023: 1.6-kilogramowy, lekki i wydajny zestaw z laptopem RTX 4070
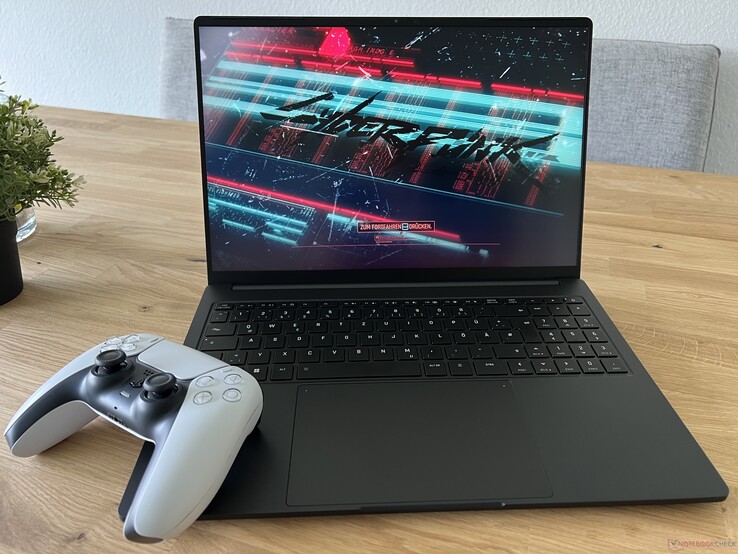
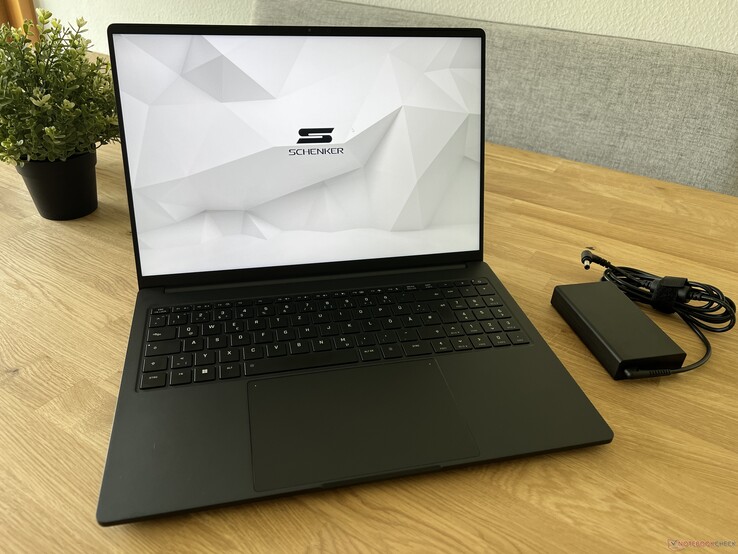
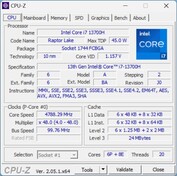
Schenker zaktualizował Vision 16 Pro na rok 2023, ponownie oferując niezwykle lekki 16-calowy laptop o bardzo wysokiej wydajności. Procesor został zaktualizowany do aktualnej wersji Intel Core i7-13700H Raptor Lake, a jako kartę graficzną można wybrać nowy układ GeForce RTX 4060 Laptop lubRTX 4070 Laptopkażdy z maksymalnym TGP wynoszącym 95 watów. Oprócz tych dwóch aktualizacji, wprowadzono również pewne ulepszenia w systemie chłodzenia (nowe wentylatory), a oprócz procesora, GPU wykorzystuje teraz również chłodzenie ciekłym metalem dla optymalnego transferu ciepła.
Cena nowego modelu z procesorem Core i7-13700H, laptopem GeForce RTX 4060, 16 GB pamięci RAM i dyskiem SSD 500 GB zaczyna się od 2099 euro (~ 2361 USD). Nasza konfiguracja testowa z szybszym RTX 4070 Laptop, 32 GB pamięci RAM i dyskiem SSD o pojemności 1 TB, a także preinstalowanym systemem Windows 11 kosztuje około 2600 euro (~ 2924 USD), co również odpowiada cenie poprzednika.
Potencjalni konkurenci w porównaniu
Ocena | Data | Model | Waga | Wysokość | Rozmiar | Rezolucja | Cena |
|---|---|---|---|---|---|---|---|
| 88.6 % v7 (old) | 07/2023 | Schenker VISION 16 Pro (M23) i7-13700H, GeForce RTX 4070 Laptop GPU | 1.6 kg | 17.1 mm | 16.00" | 2560x1600 | |
| 88.8 % v7 (old) | 05/2023 | Samsung Galaxy Book3 Ultra 16, i9-13900H RTX 4070 i9-13900H, GeForce RTX 4070 Laptop GPU | 1.8 kg | 16.8 mm | 16.00" | 2880x1800 | |
| 88.8 % v7 (old) | 07/2023 | MSI Stealth 16 Studio A13VG i7-13700H, GeForce RTX 4070 Laptop GPU | 2 kg | 19.95 mm | 16.00" | 2560x1600 | |
| 90.3 % v7 (old) | 04/2023 | Dell XPS 15 9530 RTX 4070 i7-13700H, GeForce RTX 4070 Laptop GPU | 1.9 kg | 18 mm | 15.60" | 3456x2160 | |
| 86.1 % v7 (old) | 06/2023 | Asus ProArt Studiobook 16 OLED H7604 i9-13980HX, GeForce RTX 4070 Laptop GPU | 2.4 kg | 23.9 mm | 16.00" | 3200x2000 | |
| 93.7 % v7 (old) | 03/2023 | Apple MacBook Pro 16 2023 M2 Max M2 Max, M2 Max 38-Core GPU | 2.2 kg | 16.8 mm | 16.20" | 3456x2234 |
Obudowa - Lekka obudowa magnezowa o wadze 1,6 kg (~3,5 lb)
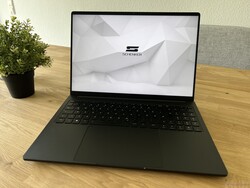
Od zeszłego roku Schenker nie zmienił nic w obudowie i tym razem w naszym teście mamy wersję czarną. Pozbawiona kontrastów, wygląda znacznie bardziej niepozornie niż wersja srebrna. Przy wadze zaledwie 1,6 kg (~ 3,5 funta), magnezowa obudowa (jednostka bazowa i pokrywa wyświetlacza) nadal jest niezwykle lekka jak na szybki 16-calowy laptop. Jednostka zasadnicza jest bardzo solidna i tylko środkowa część klawiatury może być minimalnie dociśnięta, co nie powoduje żadnych problemów w codziennej pracy. Cienka pokrywa wyświetlacza jest nieco bardziej elastyczna, a zawiasy nadal pozwalają na pewne widoczne chybotanie.
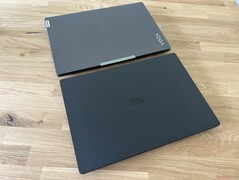
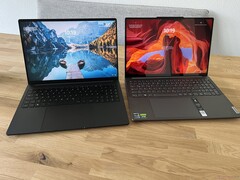
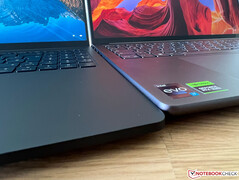
W porównaniu rozmiarów, Vision 16 Pro jest również najbardziej kompaktowym i jednocześnie zdecydowanie najlżejszym laptopem. Zrobiliśmy również kilka zdjęć porównawczych z nowym Lenovo Yoga Pro 9 16, który również obecnie testujemy. Ich wymiary są praktycznie identyczne, ale widać różnicę szczególnie w wysokości jednostki bazowej.
Sprzęt - Thunderbolt i czytnik kart
Pomimo smukłej obudowy, Vision 16 Pro oferuje wszystkie ważne złącza, w tym Thunderbolt 4 i 2x USB-A, dzięki czemu adaptery są w praktyce zbędne. Złącza są rozmieszczone po obu stronach i znajdują się z tyłu. W drodze można również ładować laptopa przez USB-C (min. 65 watów, maks. 100 watów). W porównaniu do zeszłorocznego modelu, czytnik kart stał się znacznie wolniejszy, co przetestowaliśmy z dwiema kartami SD. Trzeba również zaakceptować pewne niewielkie kompromisy w module WLAN, ponieważ konfiguracja anteny Vision 16 Pro nie obsługuje sieci 6 GHz (Wi-Fi 6E). Moduł AX201 od Intela nadal jest używany (Wi-Fi 6), a prędkości transferu są bardzo dobre. Kamera internetowa 1080p tworzy przyzwoite nagrania w rozsądnych warunkach oświetleniowych. Ponadto dostępny jest również moduł IR do rozpoznawania twarzy za pośrednictwem Windows Hello.
| SD Card Reader | |
| average JPG Copy Test (av. of 3 runs) | |
| Apple MacBook Pro 16 2023 M2 Max (Angelbird AV Pro V60) | |
| MSI Stealth 16 Studio A13VG | |
| Dell XPS 15 9530 RTX 4070 (Toshiba Exceria Pro SDXC 64 GB UHS-II) | |
| Średnia w klasie Multimedia (21.1 - 531, n=46, ostatnie 2 lata) | |
| Schenker Vision 16 Pro RTX 3070 Ti (AV Pro V60) | |
| Samsung Galaxy Book3 Ultra 16, i9-13900H RTX 4070 (AV Pro SD microSD 128 GB V60) | |
| Asus ProArt Studiobook 16 OLED H7604 (Angelibird AV Pro V60) | |
| Schenker VISION 16 Pro (M23) (Angelbird AV Pro V60) | |
| maximum AS SSD Seq Read Test (1GB) | |
| Apple MacBook Pro 16 2023 M2 Max (Angelbird AV Pro V60) | |
| Dell XPS 15 9530 RTX 4070 (Toshiba Exceria Pro SDXC 64 GB UHS-II) | |
| MSI Stealth 16 Studio A13VG | |
| Średnia w klasie Multimedia (27.4 - 1455, n=46, ostatnie 2 lata) | |
| Samsung Galaxy Book3 Ultra 16, i9-13900H RTX 4070 (AV Pro SD microSD 128 GB V60) | |
| Asus ProArt Studiobook 16 OLED H7604 (Angelibird AV Pro V60) | |
| Schenker Vision 16 Pro RTX 3070 Ti (AV Pro V60) | |
| Schenker VISION 16 Pro (M23) (Angelbird AV Pro V60) | |
| Networking | |
| Schenker VISION 16 Pro (M23) | |
| iperf3 transmit AXE11000 | |
| iperf3 receive AXE11000 | |
| Samsung Galaxy Book3 Ultra 16, i9-13900H RTX 4070 | |
| iperf3 transmit AXE11000 | |
| iperf3 receive AXE11000 | |
| iperf3 transmit AXE11000 6GHz | |
| iperf3 receive AXE11000 6GHz | |
| MSI Stealth 16 Studio A13VG | |
| iperf3 transmit AXE11000 | |
| iperf3 receive AXE11000 | |
| iperf3 transmit AXE11000 6GHz | |
| iperf3 receive AXE11000 6GHz | |
| Dell XPS 15 9530 RTX 4070 | |
| iperf3 transmit AXE11000 | |
| iperf3 receive AXE11000 | |
| Asus ProArt Studiobook 16 OLED H7604 | |
| iperf3 transmit AXE11000 | |
| iperf3 receive AXE11000 | |
| Apple MacBook Pro 16 2023 M2 Max | |
| iperf3 transmit AXE11000 6GHz | |
| iperf3 receive AXE11000 6GHz | |
| Schenker Vision 16 Pro RTX 3070 Ti | |
| iperf3 transmit AXE11000 | |
| iperf3 receive AXE11000 | |
Konserwacja
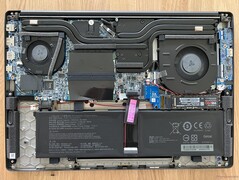
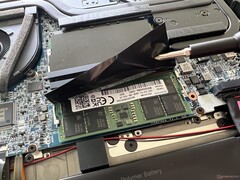
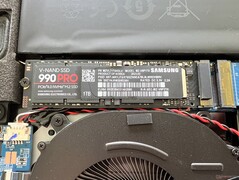
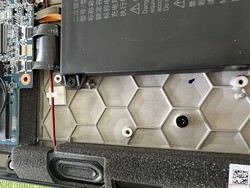
Spód obudowy jest zabezpieczony zwykłymi śrubami krzyżakowymi i można go łatwo usunąć. Wewnątrz widać, że poza niewielką zmianą w rozmieszczeniu rurek cieplnych, konfiguracja jest w zasadzie identyczna. Użytkownicy mają dostęp do dwóch wentylatorów, gniazd SO-DIMM i dwóch gniazd na dyski SSD M.2 2280, przy czym obsługiwany jest tylko jednostronny drugi dysk SSD.
Urządzenia wejściowe - Duży ClickPad i blok numeryczny
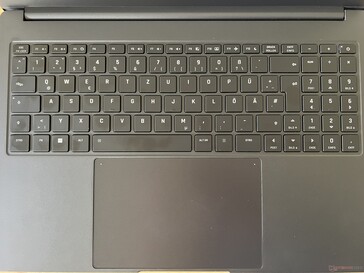
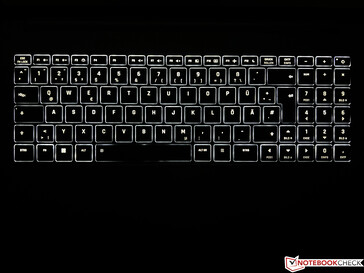
Pełnowymiarowa klawiatura oferuje dedykowany blok numeryczny, w tym duże klawisze strzałek, ale oznacza to również, że nie ma dodatkowego klawisza Enter, a rozmiar klawisza Shift jest zmniejszony. Ogólnie rzecz biorąc, klawiatura jest bardzo dokładna i wygodna, a uderzenia klawiszy są również komfortowo ciche, przy czym tylko klawisze spacji i Enter są nieco głośniejsze. W ciemniejszym otoczeniu pomocne jest białe, dwustopniowe podświetlenie klawiatury. Ogromny szklany ClickPad (15,4 x 10 cm, ~6 x 4 cale) może być łatwo obsługiwany i oferuje dużo miejsca na gesty i ruchy kursora. Jedynie odgłosy klikania są nieco głośne.
Wyświetlacz - panel WQHD o częstotliwości odświeżania 240 Hz
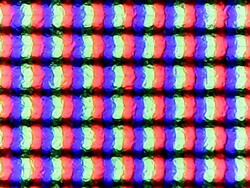
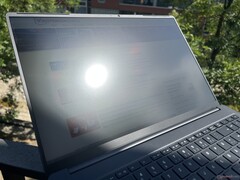
Wyświetlacz pozostał niezmieniony i nadal jest matowym panelem WQHD o rozdzielczości 2560 x 1600 pikseli i częstotliwości odświeżania 240 Hz. Subiektywne wrażenie obrazu jest bardzo dobre, ponieważ nawet jasne obszary są wyświetlane bez ziarnistości. Jasność panelu (NE160QDM-NZ1) jest określana na 350 cd/m², a nasz panel nawet nieznacznie ją przekracza, osiągając średnio 370 cd/m². Wartość czerni wynosi przyzwoite 0,3 cd/m², co prowadzi do dobrego współczynnika kontrastu przekraczającego 1200:1.
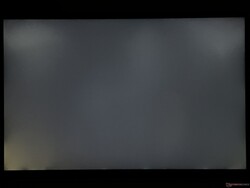
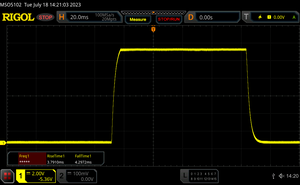
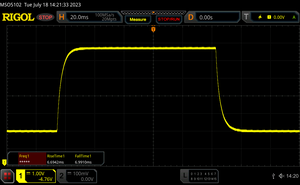
Częstotliwość odświeżania 240 Hz zapewnia bardzo płynne wrażenia z ruchów, a czasy reakcji są również szybkie. Lekkie aureole są widoczne tylko w ciemnych obrazach przy pełnej jasności, ale nie będzie to problemem w praktycznym użytkowaniu. PWM nie jest używany.
| |||||||||||||||||||||||||
rozświetlenie: 88 %
na akumulatorze: 384 cd/m²
kontrast: 1280:1 (czerń: 0.3 cd/m²)
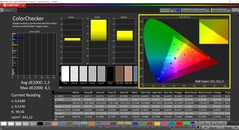
ΔE ColorChecker Calman: 3.4 | ∀{0.5-29.43 Ø4.76}
calibrated: 1.3
ΔE Greyscale Calman: 3.4 | ∀{0.09-98 Ø5}
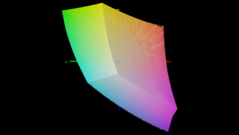
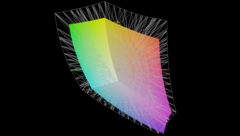
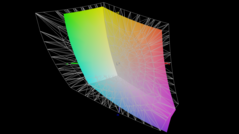
70% AdobeRGB 1998 (Argyll 3D)
98.8% sRGB (Argyll 3D)
68.8% Display P3 (Argyll 3D)
Gamma: 2.16
CCT: 7462 K
| Schenker VISION 16 Pro (M23) NE160QDM-NZ1, IPS, 2560x1600, 16" | Samsung Galaxy Book3 Ultra 16, i9-13900H RTX 4070 Samsung SDC4185 ATNA60CL03-0, OLED / AMOLED, 2880x1800, 16" | MSI Stealth 16 Studio A13VG AUO26A9, IPS, 2560x1600, 16" | Dell XPS 15 9530 RTX 4070 Samsung 156XG01, OLED, 3456x2160, 15.6" | Asus ProArt Studiobook 16 OLED H7604 ATNA60BX01-1, OLED, 3200x2000, 16" | Apple MacBook Pro 16 2023 M2 Max Mini-LED, 3456x2234, 16.2" | Schenker Vision 16 Pro RTX 3070 Ti N160QDM-NZ1, IPS, 2560x1600, 16" | |
|---|---|---|---|---|---|---|---|
| Display | 26% | 21% | 29% | 25% | 24% | -1% | |
| Display P3 Coverage (%) | 68.8 | 95.3 39% | 96.4 40% | 99.8 45% | 99.6 45% | 99 44% | 68.7 0% |
| sRGB Coverage (%) | 98.8 | 99.1 0% | 99.7 1% | 100 1% | 100 1% | 100 1% | 96.7 -2% |
| AdobeRGB 1998 Coverage (%) | 70 | 97.4 39% | 84.8 21% | 98.4 41% | 89.4 28% | 88.5 26% | 70 0% |
| Response Times | 80% | 50% | 82% | 93% | -486% | -5% | |
| Response Time Grey 50% / Grey 80% * (ms) | 13.7 ? | 2 ? 85% | 4.4 ? 68% | 1.68 ? 88% | 0.59 ? 96% | 80.5 ? -488% | 14.3 ? -4% |
| Response Time Black / White * (ms) | 8.1 ? | 2 ? 75% | 5.6 ? 31% | 1.94 ? 76% | 0.79 ? 90% | 47.2 ? -483% | 8.6 ? -6% |
| PWM Frequency (Hz) | 250 ? | 239 | 240 ? | 14880 ? | |||
| Screen | 21% | -16% | 0% | 159% | 4950% | -14% | |
| Brightness middle (cd/m²) | 384 | 403 5% | 424 10% | 389.5 1% | 349 -9% | 504 31% | 364 -5% |
| Brightness (cd/m²) | 371 | 408 10% | 411 11% | 392 6% | 350 -6% | 487 31% | 347 -6% |
| Brightness Distribution (%) | 88 | 98 11% | 88 0% | 98 11% | 95 8% | 94 7% | 89 1% |
| Black Level * (cd/m²) | 0.3 | 0.37 -23% | 0.02 93% | 0.001 100% | 0.3 -0% | ||
| Contrast (:1) | 1280 | 1146 -10% | 17450 1263% | 504000 39275% | 1213 -5% | ||
| Colorchecker dE 2000 * | 3.4 | 2.63 23% | 3.04 11% | 4.95 -46% | 2.1 38% | 1.5 56% | 3.3 3% |
| Colorchecker dE 2000 max. * | 9.2 | 4.07 56% | 7.5 18% | 8.65 6% | 5.5 40% | 3.3 64% | 6.6 28% |
| Colorchecker dE 2000 calibrated * | 1.3 | 3.04 -134% | 1.53 -18% | 2.1 -62% | 2.5 -92% | ||
| Greyscale dE 2000 * | 3.4 | 2.69 21% | 4.34 -28% | 2 41% | 1.2 65% | 2.1 38% | 5.2 -53% |
| Gamma | 2.16 102% | 2.48 89% | 2.32 95% | 2.27 97% | 2.19 100% | 2.25 98% | 2.14 103% |
| CCT | 7462 87% | 6907 94% | 6952 93% | 6265 104% | 6545 99% | 6882 94% | 6331 103% |
| Całkowita średnia (program / ustawienia) | 42% /
33% | 18% /
1% | 37% /
21% | 92% /
121% | 1496% /
2977% | -7% /
-10% |
* ... im mniej tym lepiej
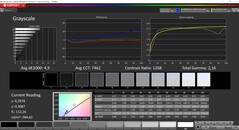
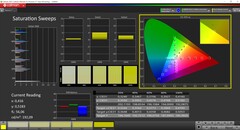
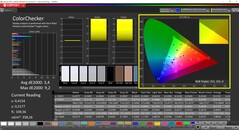
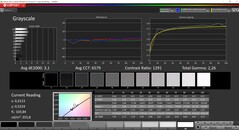
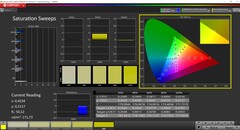
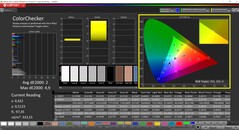
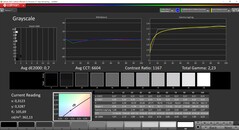
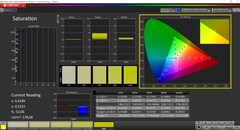
Mierzymy panel w stanie dostawy za pomocą profesjonalnego oprogramowania CalMAN. Ma on znaczny niebieski odcień, a temperatura barwowa jest również zbyt niska. Schenker oferuje pobranie skalibrowanego profilu w Control Center, a następnie jest on pobierany automatycznie przy użyciu numeru seryjnego. Chociaż poprawia to sytuację i eliminuje odcień kolorów, zmniejsza również maksymalną jasność o około 30 cd/m². Nie jest to tak naprawdę idealne rozwiązanie, jak zobaczymy wkrótce, ale ci, którzy nie są w stanie skalibrować swojego panelu (lub pobrać naszego skalibrowanego profilu z linku powyżej), nadal uzyskają tutaj zauważalną poprawę.
Korzystając z naszej własnej kalibracji, jesteśmy w stanie jeszcze bardziej ulepszyć wyświetlacz, przy czym skala szarości jest teraz na poziomie referencyjnym, a w szczególności odchylenia kolorów są jeszcze niższe. Nadal jednak istnieją pewne wartości odstające w odcieniach niebieskiego, gdzie odchylenia minimalnie przekraczają ważny docelowy limit 3. Ogólnie rzecz biorąc, panel nadal nadaje się do przetwarzania obrazu w małej przestrzeni kolorów sRGB, która jest praktycznie całkowicie pokryta.
Wyświetl czasy reakcji
| ↔ Czas reakcji od czerni do bieli | ||
|---|---|---|
| 8.1 ms ... wzrost ↗ i spadek ↘ łącznie | ↗ 3.8 ms wzrost | |
| ↘ 4.3 ms upadek | ||
| W naszych testach ekran wykazuje szybki czas reakcji i powinien nadawać się do gier. Dla porównania, wszystkie testowane urządzenia wahają się od 0.1 (minimum) do 240 (maksimum) ms. » 22 % wszystkich urządzeń jest lepszych. Oznacza to, że zmierzony czas reakcji jest lepszy od średniej wszystkich testowanych urządzeń (20.1 ms). | ||
| ↔ Czas reakcji 50% szarości do 80% szarości | ||
| 13.7 ms ... wzrost ↗ i spadek ↘ łącznie | ↗ 6.7 ms wzrost | |
| ↘ 7 ms upadek | ||
| W naszych testach ekran wykazuje dobry współczynnik reakcji, ale może być zbyt wolny dla graczy rywalizujących ze sobą. Dla porównania, wszystkie testowane urządzenia wahają się od 0.165 (minimum) do 636 (maksimum) ms. » 26 % wszystkich urządzeń jest lepszych. Oznacza to, że zmierzony czas reakcji jest lepszy od średniej wszystkich testowanych urządzeń (31.5 ms). | ||
Migotanie ekranu / PWM (modulacja szerokości impulsu)
| Migotanie ekranu/nie wykryto PWM | |||
Dla porównania: 53 % wszystkich testowanych urządzeń nie używa PWM do przyciemniania wyświetlacza. Jeśli wykryto PWM, zmierzono średnio 8036 (minimum: 5 - maksimum: 343500) Hz. | |||
Wydajność - laptop RTX 4070 o mocy 95 W
Warunki testu
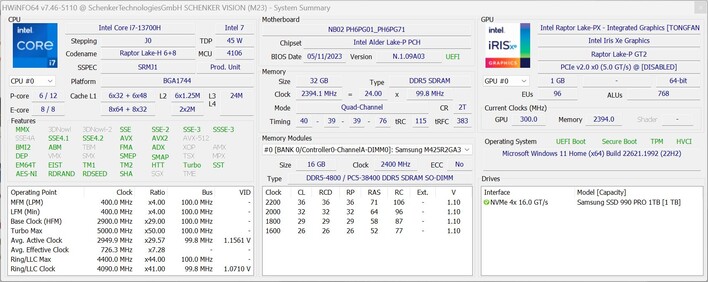
Schenker oferuje różne profile zasilania w Control Center, ale w przeciwieństwie do poprzednika, nie ma już profilu ręcznego, który pozwoliłby skonfigurować limity TDP procesora. Ponownie przeprowadziliśmy benchmarki i pomiary w trybie Enthusiast Performance, który ustawia wartości TDP procesora na 60/45 watów (lub 55/35 watów, gdy dGPU jest aktywowane). GPU jest tutaj w stanie zużyć 95 W (70 W TGP + 25 W Dynamic Boost), a w trybie Enthusiast Balanced jest to 85 W (60 + 25 W).
Procesor - Core i7-13700H
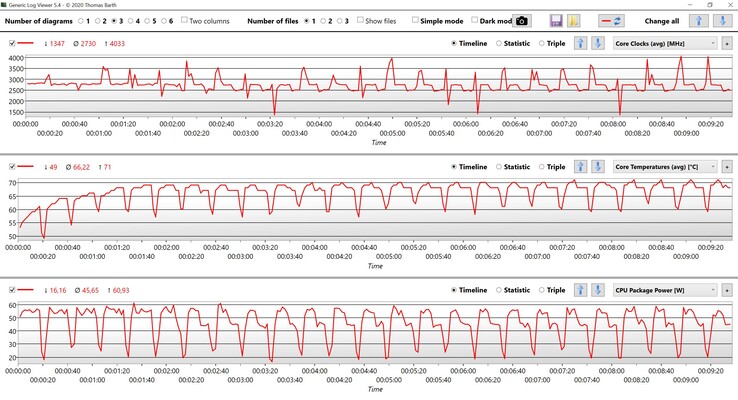
Core i7-13700H z obecnej generacji Intel Raptor Lake jest bezpośrednim następcą Core i7-12700H i nie ma żadnych zmian poza niewielkim wzrostem maksymalnych częstotliwości taktowania. Vision 16 Pro jest jednym z niewielu urządzeń bez ekstremalnie wysokich limitów mocy przekraczających 100 watów. Ma to pewne zalety w codziennej pracy, ponieważ temperatury nie rosną tak szybko, a także nie ma tak gwałtownego spadku wydajności przy stałym obciążeniu. Z drugiej strony, wydajność wielordzeniowa pod krótkim obciążeniem jest również niższa niż u konkurencji i tylko nieznacznie wyższa niż w starszym modelu. W trybie Turbo starszy model był nawet wyraźnie szybszy. Podczas pracy na baterii pobór mocy jest ograniczony do 36 W, przez co wydajność wielordzeniowa spada o 20% bez ładowarki. Dodatkowe testy porównawcze procesora można znaleźć w naszej sekcji technicznej.
Cinebench R15 Multi Constant Load Test
Cinebench R23: Multi Core | Single Core
Cinebench R20: CPU (Multi Core) | CPU (Single Core)
Cinebench R15: CPU Multi 64Bit | CPU Single 64Bit
Blender: v2.79 BMW27 CPU
7-Zip 18.03: 7z b 4 | 7z b 4 -mmt1
Geekbench 5.5: Multi-Core | Single-Core
HWBOT x265 Benchmark v2.2: 4k Preset
LibreOffice : 20 Documents To PDF
R Benchmark 2.5: Overall mean
| CPU Performance rating | |
| Asus ProArt Studiobook 16 OLED H7604 | |
| MSI Stealth 16 Studio A13VG | |
| Apple MacBook Pro 16 2023 M2 Max -6! | |
| Dell XPS 15 9530 RTX 4070 | |
| Schenker VISION 16 Pro (M23) | |
| Średnia w klasie Multimedia | |
| Przeciętny Intel Core i7-13700H | |
| Schenker Vision 16 Pro RTX 3070 Ti | |
| Samsung Galaxy Book3 Ultra 16, i9-13900H RTX 4070 | |
| Cinebench R23 / Multi Core | |
| Asus ProArt Studiobook 16 OLED H7604 | |
| MSI Stealth 16 Studio A13VG | |
| Średnia w klasie Multimedia (4861 - 33362, n=80, ostatnie 2 lata) | |
| Dell XPS 15 9530 RTX 4070 | |
| Przeciętny Intel Core i7-13700H (5890 - 20034, n=29) | |
| Apple MacBook Pro 16 2023 M2 Max | |
| Schenker VISION 16 Pro (M23) | |
| Samsung Galaxy Book3 Ultra 16, i9-13900H RTX 4070 | |
| Schenker Vision 16 Pro RTX 3070 Ti | |
| Cinebench R23 / Single Core | |
| Asus ProArt Studiobook 16 OLED H7604 | |
| Schenker VISION 16 Pro (M23) | |
| Średnia w klasie Multimedia (1128 - 2459, n=72, ostatnie 2 lata) | |
| MSI Stealth 16 Studio A13VG | |
| Dell XPS 15 9530 RTX 4070 | |
| Schenker Vision 16 Pro RTX 3070 Ti | |
| Przeciętny Intel Core i7-13700H (1323 - 1914, n=29) | |
| Apple MacBook Pro 16 2023 M2 Max | |
| Samsung Galaxy Book3 Ultra 16, i9-13900H RTX 4070 | |
| Cinebench R20 / CPU (Multi Core) | |
| Asus ProArt Studiobook 16 OLED H7604 | |
| MSI Stealth 16 Studio A13VG | |
| Średnia w klasie Multimedia (1887 - 12912, n=63, ostatnie 2 lata) | |
| Dell XPS 15 9530 RTX 4070 | |
| Przeciętny Intel Core i7-13700H (2322 - 7674, n=29) | |
| Schenker VISION 16 Pro (M23) | |
| Schenker Vision 16 Pro RTX 3070 Ti | |
| Samsung Galaxy Book3 Ultra 16, i9-13900H RTX 4070 | |
| Apple MacBook Pro 16 2023 M2 Max | |
| Cinebench R20 / CPU (Single Core) | |
| Asus ProArt Studiobook 16 OLED H7604 | |
| Schenker VISION 16 Pro (M23) | |
| MSI Stealth 16 Studio A13VG | |
| Średnia w klasie Multimedia (420 - 853, n=63, ostatnie 2 lata) | |
| Schenker Vision 16 Pro RTX 3070 Ti | |
| Dell XPS 15 9530 RTX 4070 | |
| Przeciętny Intel Core i7-13700H (508 - 741, n=29) | |
| Apple MacBook Pro 16 2023 M2 Max | |
| Samsung Galaxy Book3 Ultra 16, i9-13900H RTX 4070 | |
| Cinebench R15 / CPU Multi 64Bit | |
| Asus ProArt Studiobook 16 OLED H7604 | |
| MSI Stealth 16 Studio A13VG | |
| Schenker Vision 16 Pro RTX 3070 Ti | |
| Schenker Vision 16 Pro RTX 3070 Ti | |
| Dell XPS 15 9530 RTX 4070 | |
| Średnia w klasie Multimedia (856 - 5224, n=69, ostatnie 2 lata) | |
| Przeciętny Intel Core i7-13700H (905 - 2982, n=29) | |
| Schenker VISION 16 Pro (M23) | |
| Samsung Galaxy Book3 Ultra 16, i9-13900H RTX 4070 | |
| Apple MacBook Pro 16 2023 M2 Max | |
| Cinebench R15 / CPU Single 64Bit | |
| Asus ProArt Studiobook 16 OLED H7604 | |
| Schenker VISION 16 Pro (M23) | |
| MSI Stealth 16 Studio A13VG | |
| Dell XPS 15 9530 RTX 4070 | |
| Średnia w klasie Multimedia (99.6 - 326, n=66, ostatnie 2 lata) | |
| Schenker Vision 16 Pro RTX 3070 Ti | |
| Przeciętny Intel Core i7-13700H (213 - 278, n=29) | |
| Apple MacBook Pro 16 2023 M2 Max | |
| Samsung Galaxy Book3 Ultra 16, i9-13900H RTX 4070 | |
| Blender / v2.79 BMW27 CPU | |
| Schenker Vision 16 Pro RTX 3070 Ti | |
| Średnia w klasie Multimedia (100 - 557, n=64, ostatnie 2 lata) | |
| Samsung Galaxy Book3 Ultra 16, i9-13900H RTX 4070 | |
| Przeciętny Intel Core i7-13700H (169 - 555, n=29) | |
| Schenker VISION 16 Pro (M23) | |
| Dell XPS 15 9530 RTX 4070 | |
| MSI Stealth 16 Studio A13VG | |
| Asus ProArt Studiobook 16 OLED H7604 | |
| 7-Zip 18.03 / 7z b 4 | |
| Asus ProArt Studiobook 16 OLED H7604 | |
| MSI Stealth 16 Studio A13VG | |
| Schenker VISION 16 Pro (M23) | |
| Przeciętny Intel Core i7-13700H (27322 - 76344, n=29) | |
| Średnia w klasie Multimedia (29095 - 130368, n=62, ostatnie 2 lata) | |
| Dell XPS 15 9530 RTX 4070 | |
| Schenker Vision 16 Pro RTX 3070 Ti | |
| Samsung Galaxy Book3 Ultra 16, i9-13900H RTX 4070 | |
| 7-Zip 18.03 / 7z b 4 -mmt1 | |
| Asus ProArt Studiobook 16 OLED H7604 | |
| Schenker VISION 16 Pro (M23) | |
| MSI Stealth 16 Studio A13VG | |
| Dell XPS 15 9530 RTX 4070 | |
| Przeciętny Intel Core i7-13700H (4825 - 6238, n=29) | |
| Schenker Vision 16 Pro RTX 3070 Ti | |
| Średnia w klasie Multimedia (3666 - 7545, n=62, ostatnie 2 lata) | |
| Samsung Galaxy Book3 Ultra 16, i9-13900H RTX 4070 | |
| Geekbench 5.5 / Multi-Core | |
| Asus ProArt Studiobook 16 OLED H7604 | |
| Apple MacBook Pro 16 2023 M2 Max | |
| Dell XPS 15 9530 RTX 4070 | |
| MSI Stealth 16 Studio A13VG | |
| Średnia w klasie Multimedia (4652 - 20422, n=63, ostatnie 2 lata) | |
| Schenker VISION 16 Pro (M23) | |
| Przeciętny Intel Core i7-13700H (6165 - 14215, n=29) | |
| Schenker Vision 16 Pro RTX 3070 Ti | |
| Samsung Galaxy Book3 Ultra 16, i9-13900H RTX 4070 | |
| Geekbench 5.5 / Single-Core | |
| Asus ProArt Studiobook 16 OLED H7604 | |
| Apple MacBook Pro 16 2023 M2 Max | |
| Dell XPS 15 9530 RTX 4070 | |
| Średnia w klasie Multimedia (805 - 2974, n=63, ostatnie 2 lata) | |
| Schenker VISION 16 Pro (M23) | |
| MSI Stealth 16 Studio A13VG | |
| Schenker Vision 16 Pro RTX 3070 Ti | |
| Przeciętny Intel Core i7-13700H (1362 - 1919, n=29) | |
| Samsung Galaxy Book3 Ultra 16, i9-13900H RTX 4070 | |
| HWBOT x265 Benchmark v2.2 / 4k Preset | |
| Asus ProArt Studiobook 16 OLED H7604 | |
| MSI Stealth 16 Studio A13VG | |
| Średnia w klasie Multimedia (5.26 - 36.1, n=62, ostatnie 2 lata) | |
| Dell XPS 15 9530 RTX 4070 | |
| Schenker VISION 16 Pro (M23) | |
| Przeciętny Intel Core i7-13700H (6.72 - 21.2, n=29) | |
| Samsung Galaxy Book3 Ultra 16, i9-13900H RTX 4070 | |
| Schenker Vision 16 Pro RTX 3070 Ti | |
| LibreOffice / 20 Documents To PDF | |
| Samsung Galaxy Book3 Ultra 16, i9-13900H RTX 4070 | |
| MSI Stealth 16 Studio A13VG | |
| Średnia w klasie Multimedia (23.9 - 146.7, n=63, ostatnie 2 lata) | |
| Przeciętny Intel Core i7-13700H (31.3 - 62.4, n=29) | |
| Schenker VISION 16 Pro (M23) | |
| Asus ProArt Studiobook 16 OLED H7604 | |
| Dell XPS 15 9530 RTX 4070 | |
| Schenker Vision 16 Pro RTX 3070 Ti | |
| R Benchmark 2.5 / Overall mean | |
| Samsung Galaxy Book3 Ultra 16, i9-13900H RTX 4070 | |
| Średnia w klasie Multimedia (0.3604 - 0.947, n=62, ostatnie 2 lata) | |
| Przeciętny Intel Core i7-13700H (0.4308 - 0.607, n=29) | |
| Schenker Vision 16 Pro RTX 3070 Ti | |
| MSI Stealth 16 Studio A13VG | |
| Dell XPS 15 9530 RTX 4070 | |
| Schenker VISION 16 Pro (M23) | |
| Asus ProArt Studiobook 16 OLED H7604 | |
* ... im mniej tym lepiej
AIDA64: FP32 Ray-Trace | FPU Julia | CPU SHA3 | CPU Queen | FPU SinJulia | FPU Mandel | CPU AES | CPU ZLib | FP64 Ray-Trace | CPU PhotoWorxx
| Performance rating | |
| Asus ProArt Studiobook 16 OLED H7604 | |
| MSI Stealth 16 Studio A13VG | |
| Średnia w klasie Multimedia | |
| Schenker VISION 16 Pro (M23) | |
| Dell XPS 15 9530 RTX 4070 | |
| Przeciętny Intel Core i7-13700H | |
| Samsung Galaxy Book3 Ultra 16, i9-13900H RTX 4070 | |
| Schenker Vision 16 Pro RTX 3070 Ti | |
| AIDA64 / FP32 Ray-Trace | |
| Asus ProArt Studiobook 16 OLED H7604 | |
| MSI Stealth 16 Studio A13VG | |
| Średnia w klasie Multimedia (2214 - 50388, n=59, ostatnie 2 lata) | |
| Samsung Galaxy Book3 Ultra 16, i9-13900H RTX 4070 | |
| Dell XPS 15 9530 RTX 4070 | |
| Przeciętny Intel Core i7-13700H (4986 - 18908, n=29) | |
| Schenker VISION 16 Pro (M23) | |
| Schenker Vision 16 Pro RTX 3070 Ti | |
| AIDA64 / FPU Julia | |
| Asus ProArt Studiobook 16 OLED H7604 | |
| MSI Stealth 16 Studio A13VG | |
| Średnia w klasie Multimedia (12867 - 201874, n=60, ostatnie 2 lata) | |
| Schenker VISION 16 Pro (M23) | |
| Przeciętny Intel Core i7-13700H (25360 - 92359, n=29) | |
| Dell XPS 15 9530 RTX 4070 | |
| Schenker Vision 16 Pro RTX 3070 Ti | |
| Samsung Galaxy Book3 Ultra 16, i9-13900H RTX 4070 | |
| AIDA64 / CPU SHA3 | |
| Asus ProArt Studiobook 16 OLED H7604 | |
| MSI Stealth 16 Studio A13VG | |
| Średnia w klasie Multimedia (653 - 8623, n=60, ostatnie 2 lata) | |
| Samsung Galaxy Book3 Ultra 16, i9-13900H RTX 4070 | |
| Przeciętny Intel Core i7-13700H (1339 - 4224, n=29) | |
| Schenker VISION 16 Pro (M23) | |
| Dell XPS 15 9530 RTX 4070 | |
| Schenker Vision 16 Pro RTX 3070 Ti | |
| AIDA64 / CPU Queen | |
| Asus ProArt Studiobook 16 OLED H7604 | |
| MSI Stealth 16 Studio A13VG | |
| Dell XPS 15 9530 RTX 4070 | |
| Schenker VISION 16 Pro (M23) | |
| Przeciętny Intel Core i7-13700H (59324 - 107159, n=29) | |
| Schenker Vision 16 Pro RTX 3070 Ti | |
| Samsung Galaxy Book3 Ultra 16, i9-13900H RTX 4070 | |
| Średnia w klasie Multimedia (13483 - 181505, n=60, ostatnie 2 lata) | |
| AIDA64 / FPU SinJulia | |
| Asus ProArt Studiobook 16 OLED H7604 | |
| MSI Stealth 16 Studio A13VG | |
| Średnia w klasie Multimedia (1240 - 28794, n=60, ostatnie 2 lata) | |
| Schenker VISION 16 Pro (M23) | |
| Przeciętny Intel Core i7-13700H (4800 - 11050, n=29) | |
| Dell XPS 15 9530 RTX 4070 | |
| Schenker Vision 16 Pro RTX 3070 Ti | |
| Samsung Galaxy Book3 Ultra 16, i9-13900H RTX 4070 | |
| AIDA64 / FPU Mandel | |
| Asus ProArt Studiobook 16 OLED H7604 | |
| MSI Stealth 16 Studio A13VG | |
| Średnia w klasie Multimedia (6395 - 105740, n=59, ostatnie 2 lata) | |
| Samsung Galaxy Book3 Ultra 16, i9-13900H RTX 4070 | |
| Przeciętny Intel Core i7-13700H (12321 - 45118, n=29) | |
| Dell XPS 15 9530 RTX 4070 | |
| Schenker VISION 16 Pro (M23) | |
| Schenker Vision 16 Pro RTX 3070 Ti | |
| AIDA64 / CPU AES | |
| Asus ProArt Studiobook 16 OLED H7604 | |
| MSI Stealth 16 Studio A13VG | |
| Przeciętny Intel Core i7-13700H (28769 - 151254, n=29) | |
| Średnia w klasie Multimedia (4678 - 152179, n=60, ostatnie 2 lata) | |
| Schenker VISION 16 Pro (M23) | |
| Dell XPS 15 9530 RTX 4070 | |
| Schenker Vision 16 Pro RTX 3070 Ti | |
| Samsung Galaxy Book3 Ultra 16, i9-13900H RTX 4070 | |
| AIDA64 / CPU ZLib | |
| Asus ProArt Studiobook 16 OLED H7604 | |
| MSI Stealth 16 Studio A13VG | |
| Średnia w klasie Multimedia (167.2 - 2022, n=60, ostatnie 2 lata) | |
| Samsung Galaxy Book3 Ultra 16, i9-13900H RTX 4070 | |
| Schenker VISION 16 Pro (M23) | |
| Przeciętny Intel Core i7-13700H (389 - 1215, n=29) | |
| Dell XPS 15 9530 RTX 4070 | |
| Schenker Vision 16 Pro RTX 3070 Ti | |
| AIDA64 / FP64 Ray-Trace | |
| Asus ProArt Studiobook 16 OLED H7604 | |
| MSI Stealth 16 Studio A13VG | |
| Średnia w klasie Multimedia (1014 - 26875, n=60, ostatnie 2 lata) | |
| Dell XPS 15 9530 RTX 4070 | |
| Przeciętny Intel Core i7-13700H (2540 - 10135, n=29) | |
| Schenker VISION 16 Pro (M23) | |
| Schenker Vision 16 Pro RTX 3070 Ti | |
| Samsung Galaxy Book3 Ultra 16, i9-13900H RTX 4070 | |
| AIDA64 / CPU PhotoWorxx | |
| Asus ProArt Studiobook 16 OLED H7604 | |
| Samsung Galaxy Book3 Ultra 16, i9-13900H RTX 4070 | |
| MSI Stealth 16 Studio A13VG | |
| Średnia w klasie Multimedia (12860 - 65787, n=60, ostatnie 2 lata) | |
| Schenker VISION 16 Pro (M23) | |
| Dell XPS 15 9530 RTX 4070 | |
| Schenker Vision 16 Pro RTX 3070 Ti | |
| Przeciętny Intel Core i7-13700H (12872 - 52727, n=29) | |
Wydajność systemu
Wyniki testów w syntetycznych benchmarkach są bardzo dobre, ale porównywane urządzenia są bardzo zbliżone i w codziennym użytkowaniu nie będzie zauważalnych różnic. To po prostu bardzo responsywne komputery z nowoczesnymi podzespołami. Podczas naszych testów nie napotkaliśmy żadnych problemów ze stabilnością.
CrossMark: Overall | Productivity | Creativity | Responsiveness
| PCMark 10 / Score | |
| Asus ProArt Studiobook 16 OLED H7604 | |
| Przeciętny Intel Core i7-13700H, NVIDIA GeForce RTX 4070 Laptop GPU (7158 - 7956, n=8) | |
| Schenker VISION 16 Pro (M23) | |
| MSI Stealth 16 Studio A13VG | |
| Dell XPS 15 9530 RTX 4070 | |
| Średnia w klasie Multimedia (4325 - 10386, n=56, ostatnie 2 lata) | |
| Samsung Galaxy Book3 Ultra 16, i9-13900H RTX 4070 | |
| PCMark 10 / Essentials | |
| Dell XPS 15 9530 RTX 4070 | |
| Asus ProArt Studiobook 16 OLED H7604 | |
| Schenker VISION 16 Pro (M23) | |
| Przeciętny Intel Core i7-13700H, NVIDIA GeForce RTX 4070 Laptop GPU (10252 - 11449, n=8) | |
| MSI Stealth 16 Studio A13VG | |
| Średnia w klasie Multimedia (8025 - 11664, n=56, ostatnie 2 lata) | |
| Samsung Galaxy Book3 Ultra 16, i9-13900H RTX 4070 | |
| PCMark 10 / Productivity | |
| Średnia w klasie Multimedia (7323 - 18233, n=56, ostatnie 2 lata) | |
| Asus ProArt Studiobook 16 OLED H7604 | |
| Schenker VISION 16 Pro (M23) | |
| Przeciętny Intel Core i7-13700H, NVIDIA GeForce RTX 4070 Laptop GPU (8501 - 10769, n=8) | |
| MSI Stealth 16 Studio A13VG | |
| Dell XPS 15 9530 RTX 4070 | |
| Samsung Galaxy Book3 Ultra 16, i9-13900H RTX 4070 | |
| PCMark 10 / Digital Content Creation | |
| Przeciętny Intel Core i7-13700H, NVIDIA GeForce RTX 4070 Laptop GPU (10358 - 12908, n=8) | |
| MSI Stealth 16 Studio A13VG | |
| Schenker VISION 16 Pro (M23) | |
| Dell XPS 15 9530 RTX 4070 | |
| Asus ProArt Studiobook 16 OLED H7604 | |
| Średnia w klasie Multimedia (3651 - 16240, n=56, ostatnie 2 lata) | |
| Samsung Galaxy Book3 Ultra 16, i9-13900H RTX 4070 | |
| CrossMark / Overall | |
| Asus ProArt Studiobook 16 OLED H7604 | |
| Apple MacBook Pro 16 2023 M2 Max | |
| Schenker VISION 16 Pro (M23) | |
| Dell XPS 15 9530 RTX 4070 | |
| Przeciętny Intel Core i7-13700H, NVIDIA GeForce RTX 4070 Laptop GPU (1768 - 2073, n=6) | |
| MSI Stealth 16 Studio A13VG | |
| Średnia w klasie Multimedia (866 - 2426, n=64, ostatnie 2 lata) | |
| Schenker Vision 16 Pro RTX 3070 Ti | |
| Samsung Galaxy Book3 Ultra 16, i9-13900H RTX 4070 | |
| CrossMark / Productivity | |
| Asus ProArt Studiobook 16 OLED H7604 | |
| Schenker VISION 16 Pro (M23) | |
| Przeciętny Intel Core i7-13700H, NVIDIA GeForce RTX 4070 Laptop GPU (1645 - 2006, n=6) | |
| Dell XPS 15 9530 RTX 4070 | |
| MSI Stealth 16 Studio A13VG | |
| Średnia w klasie Multimedia (913 - 2344, n=64, ostatnie 2 lata) | |
| Apple MacBook Pro 16 2023 M2 Max | |
| Schenker Vision 16 Pro RTX 3070 Ti | |
| Samsung Galaxy Book3 Ultra 16, i9-13900H RTX 4070 | |
| CrossMark / Creativity | |
| Apple MacBook Pro 16 2023 M2 Max | |
| Asus ProArt Studiobook 16 OLED H7604 | |
| Dell XPS 15 9530 RTX 4070 | |
| Przeciętny Intel Core i7-13700H, NVIDIA GeForce RTX 4070 Laptop GPU (1936 - 2137, n=6) | |
| Średnia w klasie Multimedia (907 - 2820, n=64, ostatnie 2 lata) | |
| Schenker VISION 16 Pro (M23) | |
| MSI Stealth 16 Studio A13VG | |
| Schenker Vision 16 Pro RTX 3070 Ti | |
| Samsung Galaxy Book3 Ultra 16, i9-13900H RTX 4070 | |
| CrossMark / Responsiveness | |
| Asus ProArt Studiobook 16 OLED H7604 | |
| Schenker VISION 16 Pro (M23) | |
| Przeciętny Intel Core i7-13700H, NVIDIA GeForce RTX 4070 Laptop GPU (1451 - 2202, n=6) | |
| MSI Stealth 16 Studio A13VG | |
| Dell XPS 15 9530 RTX 4070 | |
| Średnia w klasie Multimedia (605 - 2024, n=64, ostatnie 2 lata) | |
| Apple MacBook Pro 16 2023 M2 Max | |
| Schenker Vision 16 Pro RTX 3070 Ti | |
| Samsung Galaxy Book3 Ultra 16, i9-13900H RTX 4070 | |
| PCMark 10 Score | 7368 pkt. | |
Pomoc | ||
| AIDA64 / Memory Copy | |
| Średnia w klasie Multimedia (21158 - 109252, n=59, ostatnie 2 lata) | |
| Asus ProArt Studiobook 16 OLED H7604 | |
| Samsung Galaxy Book3 Ultra 16, i9-13900H RTX 4070 | |
| MSI Stealth 16 Studio A13VG | |
| Dell XPS 15 9530 RTX 4070 | |
| Schenker VISION 16 Pro (M23) | |
| Schenker Vision 16 Pro RTX 3070 Ti | |
| Przeciętny Intel Core i7-13700H (24334 - 78081, n=29) | |
| AIDA64 / Memory Read | |
| Średnia w klasie Multimedia (19699 - 132641, n=60, ostatnie 2 lata) | |
| Asus ProArt Studiobook 16 OLED H7604 | |
| MSI Stealth 16 Studio A13VG | |
| Schenker VISION 16 Pro (M23) | |
| Samsung Galaxy Book3 Ultra 16, i9-13900H RTX 4070 | |
| Dell XPS 15 9530 RTX 4070 | |
| Schenker Vision 16 Pro RTX 3070 Ti | |
| Przeciętny Intel Core i7-13700H (23681 - 79656, n=29) | |
| AIDA64 / Memory Write | |
| Samsung Galaxy Book3 Ultra 16, i9-13900H RTX 4070 | |
| Średnia w klasie Multimedia (17733 - 134966, n=60, ostatnie 2 lata) | |
| Asus ProArt Studiobook 16 OLED H7604 | |
| MSI Stealth 16 Studio A13VG | |
| Przeciętny Intel Core i7-13700H (22986 - 99898, n=29) | |
| Dell XPS 15 9530 RTX 4070 | |
| Schenker VISION 16 Pro (M23) | |
| Schenker Vision 16 Pro RTX 3070 Ti | |
| AIDA64 / Memory Latency | |
| Średnia w klasie Multimedia (0 - 535, n=60, ostatnie 2 lata) | |
| Samsung Galaxy Book3 Ultra 16, i9-13900H RTX 4070 | |
| Przeciętny Intel Core i7-13700H (82.4 - 136.8, n=29) | |
| Schenker Vision 16 Pro RTX 3070 Ti | |
| MSI Stealth 16 Studio A13VG | |
| Dell XPS 15 9530 RTX 4070 | |
| Asus ProArt Studiobook 16 OLED H7604 | |
| Schenker VISION 16 Pro (M23) | |
* ... im mniej tym lepiej
Opóźnienia DPC
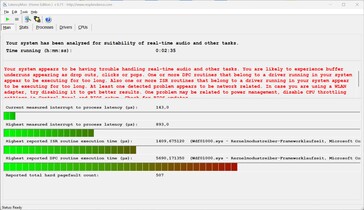
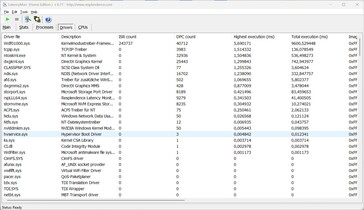
W naszym standardowym teście opóźnień (z surfowaniem po Internecie, odtwarzaniem filmów 4K z YouTube i obciążeniem procesora), z aktualną wersją BIOS-u w czasie testu, nasza jednostka testowa wykazała pewne niewielkie ograniczenia w korzystaniu z niej w aplikacjach audio w czasie rzeczywistym.
| DPC Latencies / LatencyMon - interrupt to process latency (max), Web, Youtube, Prime95 | |
| MSI Stealth 16 Studio A13VG | |
| Samsung Galaxy Book3 Ultra 16, i9-13900H RTX 4070 | |
| Asus ProArt Studiobook 16 OLED H7604 | |
| Dell XPS 15 9530 RTX 4070 | |
| Schenker VISION 16 Pro (M23) | |
| Schenker Vision 16 Pro RTX 3070 Ti | |
* ... im mniej tym lepiej
Rozwiązanie pamięci masowej
Vision 16 Pro oferuje dwa szybkie gniazda PCIe 4.0 dla dysków SSD, przy czym drugie gniazdo obok baterii może pomieścić tylko jednostronny dysk SSD. Nasza jednostka testowa wykorzystuje wersję Samsung 990 Pro o pojemności 1 TB, a po pierwszym uruchomieniu 870 GB pamięci jest nadal dostępne dla użytkownika. Szybkość transferu SSD jest bardzo wysoka, a wydajność pozostaje również całkowicie stabilna nawet po dłuższym obciążeniu, co nie jest bynajmniej oczywiste w przypadku obecnych wysokowydajnych dysków SSD. Dodatkowe testy porównawcze dysków SSD można znaleźć tutaj.
* ... im mniej tym lepiej
Disk Throttling: DiskSpd Read Loop, Queue Depth 8
Karta graficzna - RTX 4070 Laptop
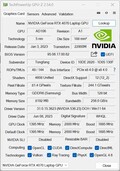
Podobnie jak w zeszłorocznym modelu, zastosowano aktualny procesor graficzny Nvidii o maksymalnym TGP wynoszącym 95 W (70 W TGP + 25 W Dynamic Boost z procesora), ale w tym roku nowy RTX 4070 Laptopjest używany. JednakżeRTX 4080 Laptopktóry jest bezpośrednim następcą RTX 3080 w multimedialnym laptopie nie ma przełącznika MUX, więc przełączanie grafiki odbywa się regularnie za pośrednictwem Optimusa.
Przy maksymalnej mocy 95 watów jest to szybka wersja laptopa RTX 4070, ponieważ jest to zbliżone do 105-watowego maksimum, które 4070 zwykle zużywa podczas grania. Tylko w niektórych testach syntetycznych, takich jak FurMark, zużycie może być wyższe, ale w praktyce nie odgrywa to żadnej roli. Można to również łatwo zauważyć w 3DMarks, gdzie Schenker Vision 16 Pro praktycznie kończy na tym samym poziomie co ProArt Studiobook 16, który określa TGP na 130 watów dla laptopa RTX 4070. W porównaniu do zeszłorocznego Vision 16 Proz kartą RTX 3070 Tiodnotowano wzrost prędkości o około 25-30%.
Nasza jednostka testowa przeszła test obciążeniowy Time Spy na poziomie 98,2% bez żadnych problemów, ale zużycie energii przez GPU jest ograniczone do 36 watów podczas pracy na baterii. Bez ładowarki, wydajność GPU jest niższa o około 40%. Dodatkowe testy porównawcze GPU można znaleźć tutaj.
| 3DMark 11 Performance | 32729 pkt. | |
| 3DMark Fire Strike Score | 24151 pkt. | |
| 3DMark Time Spy Score | 11566 pkt. | |
Pomoc | ||
| Blender / v3.3 Classroom METAL | |
| Apple MacBook Pro 16 2023 M2 Max | |
| Średnia w klasie Multimedia (17.8 - 68, n=3, ostatnie 2 lata) | |
| Blender / v3.3 Classroom OPTIX/RTX | |
| Średnia w klasie Multimedia (12 - 105, n=29, ostatnie 2 lata) | |
| Dell XPS 15 9530 RTX 4070 | |
| Schenker Vision 16 Pro RTX 3070 Ti | |
| Samsung Galaxy Book3 Ultra 16, i9-13900H RTX 4070 | |
| MSI Stealth 16 Studio A13VG | |
| Schenker VISION 16 Pro (M23) | |
| Asus ProArt Studiobook 16 OLED H7604 | |
| Przeciętny NVIDIA GeForce RTX 4070 Laptop GPU (18 - 30, n=68) | |
| Blender / v3.3 Classroom CUDA | |
| Średnia w klasie Multimedia (20 - 186, n=29, ostatnie 2 lata) | |
| Dell XPS 15 9530 RTX 4070 | |
| Schenker Vision 16 Pro RTX 3070 Ti | |
| Samsung Galaxy Book3 Ultra 16, i9-13900H RTX 4070 | |
| MSI Stealth 16 Studio A13VG | |
| Asus ProArt Studiobook 16 OLED H7604 | |
| Schenker VISION 16 Pro (M23) | |
| Przeciętny NVIDIA GeForce RTX 4070 Laptop GPU (32 - 50, n=67) | |
| Blender / v3.3 Classroom CPU | |
| Schenker Vision 16 Pro RTX 3070 Ti | |
| Samsung Galaxy Book3 Ultra 16, i9-13900H RTX 4070 | |
| Średnia w klasie Multimedia (160 - 1042, n=65, ostatnie 2 lata) | |
| Schenker VISION 16 Pro (M23) | |
| Dell XPS 15 9530 RTX 4070 | |
| Apple MacBook Pro 16 2023 M2 Max | |
| MSI Stealth 16 Studio A13VG | |
| Przeciętny NVIDIA GeForce RTX 4070 Laptop GPU (158 - 440, n=67) | |
| Asus ProArt Studiobook 16 OLED H7604 | |
* ... im mniej tym lepiej
Wydajność w grach
Stosunkowo niska wydajność procesora może mieć negatywny wpływ na wydajność w grach, ponieważ czasami wydajność Vision 16 Pro spada tutaj, w porównaniu do innych laptopów z RTX 4070 Laptop. Zasadniczo jednak wydajność jest w zupełności wystarczająca do płynnego grania w nowoczesne gry, takie jak Cyberpunk 2077 czy Star Wars: Jedi Survivor w rozdzielczości QHD, a także pozostaje stabilna podczas dłuższych sesji gamingowych.
| The Witcher 3 - 1920x1080 Ultra Graphics & Postprocessing (HBAO+) | |
| MSI Stealth 16 Studio A13VG | |
| Asus ProArt Studiobook 16 OLED H7604 | |
| Schenker VISION 16 Pro (M23) | |
| Schenker Vision 16 Pro RTX 3070 Ti | |
| Samsung Galaxy Book3 Ultra 16, i9-13900H RTX 4070 | |
| Dell XPS 15 9530 RTX 4070 | |
| Średnia w klasie Multimedia (11 - 121, n=25, ostatnie 2 lata) | |
The Witcher 3 FPS Chart
| low | med. | high | ultra | QHD | |
|---|---|---|---|---|---|
| GTA V (2015) | 170 | 156.9 | 96.5 | 80.6 | |
| The Witcher 3 (2015) | 226 | 105.4 | |||
| Dota 2 Reborn (2015) | 178.4 | 161.3 | 152.4 | 143.8 | |
| Final Fantasy XV Benchmark (2018) | 175.3 | 143.2 | 109 | 81.6 | |
| X-Plane 11.11 (2018) | 154.8 | 138.4 | 109.7 | ||
| Far Cry 5 (2018) | 168 | 134 | 127 | 120 | 108 |
| Strange Brigade (2018) | 362 | 270 | 223 | 196.7 | 131.6 |
| F1 2021 (2021) | 339 | 276 | 234 | 133.1 | 104.3 |
| Cyberpunk 2077 1.6 (2022) | 106 | 102 | 101 | 82 | 52 |
| F1 22 (2022) | 220 | 183 | 72.6 | 47 | |
| Star Wars Jedi Survivor (2023) | 84 | 76 | 72 | 67 | 44 |
Emisje - głośne wentylatory przy pełnej mocy
Emisja hałasu
W BIOS-ie można skonfigurować, czy dwa wentylatory mają pracować stale z niską prędkością, czy nie, co ma tę zaletę, że szczytowe obciążenia mogą być lepiej obsługiwane. Chociaż opcja ta była aktywowana w naszej jednostce testowej, wentylatory stały w miejscu w wielu przypadkach, nawet w najszybszym trybie wydajności. Wentylatory stają się wyraźnie słyszalne tylko pod obciążeniem, gdy GPU odgrywa większą rolę ze względu na wyższy pobór mocy. Przy około 53 dB(A) podczas grania i testu warunków skrajnych, Vision 16 Pro jest teraz tak samo głośny jak poprzednik w trybie Turbo. Pomiary dla różnych trybów przedstawiamy w poniższej tabeli:
| Zastosowanie | Silent | Performance Balanced | Performance Enthusiast |
|---|---|---|---|
| 3DMark 06 | 37,7 dB(A) | 47,2 dB(A) | 47,2 dB(A) |
| Witcher 3 | 37.7 dB(A) | 49,9 dB(A) | 53,1 dB(A) |
| Test obciążeniowy | 40,6 dB(A) | 49,9 dB(A) | 53,1 dB(A) |
Szczególnie w codziennej pracy, a także w przypadku niektórych starszych lub mniej wymagających gier, warto przełączyć się na tryb cichy (za pośrednictwem Centrum sterowania lub za pomocą klawisza F3), ponieważ wydajność nadal będzie wystarczająca, a wentylatory pozostaną znacznie cichsze przy około 38 do 40 dB (A). Nie zauważyliśmy żadnych innych odgłosów elektronicznych w naszej jednostce testowej.
Hałas
| luz |
| 25.9 / 25.9 / 32 dB |
| obciążenie |
| 47.2 / 53.1 dB |
 | ||
30 dB cichy 40 dB(A) słyszalny 50 dB(A) irytujący |
||
min: | ||
| Schenker VISION 16 Pro (M23) GeForce RTX 4070 Laptop GPU, i7-13700H, Samsung 990 Pro 1 TB | Samsung Galaxy Book3 Ultra 16, i9-13900H RTX 4070 GeForce RTX 4070 Laptop GPU, i9-13900H, Samsung PM9A1 MZVL21T0HCLR | MSI Stealth 16 Studio A13VG GeForce RTX 4070 Laptop GPU, i7-13700H, Micron 3400 2TB MTFDKBA2T0TFH | Dell XPS 15 9530 RTX 4070 GeForce RTX 4070 Laptop GPU, i7-13700H, SK hynix PC801 HFS001TEJ9X101N | Asus ProArt Studiobook 16 OLED H7604 GeForce RTX 4070 Laptop GPU, i9-13980HX, Phison EM2804TBMTCB47 | Apple MacBook Pro 16 2023 M2 Max M2 Max 38-Core GPU, M2 Max, Apple SSD AP2048Z | Schenker Vision 16 Pro RTX 3070 Ti GeForce RTX 3070 Ti Laptop GPU, i7-12700H, Samsung SSD 980 Pro 1TB MZ-V8P1T0BW | |
|---|---|---|---|---|---|---|---|
| Noise | 6% | 13% | 20% | 4% | 18% | 11% | |
| wyłączone / środowisko * (dB) | 25.9 | 25.2 3% | 24 7% | 23.1 11% | 24.5 5% | 23.9 8% | 22.9 12% |
| Idle Minimum * (dB) | 25.9 | 25.2 3% | 24 7% | 23.1 11% | 24.5 5% | 23.9 8% | 24.3 6% |
| Idle Average * (dB) | 25.9 | 25.2 3% | 24 7% | 23.1 11% | 24.5 5% | 23.9 8% | 24.3 6% |
| Idle Maximum * (dB) | 32 | 31.3 2% | 24 25% | 24.2 24% | 24.5 23% | 23.9 25% | 24.3 24% |
| Load Average * (dB) | 47.2 | 38.8 18% | 34.81 26% | 27.1 43% | 47.6 -1% | 36.6 22% | 38.5 18% |
| Witcher 3 ultra * (dB) | 53.1 | 44.05 17% | 40.1 24% | 55.9 -5% | 35.1 34% | 51 4% | |
| Load Maximum * (dB) | 53.1 | 51.2 4% | 51.57 3% | 44.6 16% | 56.7 -7% | 43.2 19% | 51 4% |
* ... im mniej tym lepiej
Temperatury
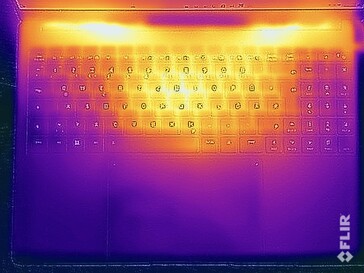
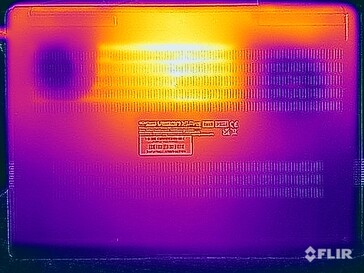
Podczas codziennej pracy nie występują problemy z temperaturą, ale nie należy umieszczać urządzenia na kolanach podczas grania lub przy dużym obciążeniu podzespołów. W skrajnym przypadku zmierzyliśmy temperatury wyższe niż 50 °C (122 °F) w centralnym obszarze na spodzie. Centralny obszar klawiatury również nagrzewa się do ponad 45 °C (113 °F), co staje się zauważalne podczas pisania. Ale typowe klawisze WASD pozostają znacznie chłodniejsze, co pomaga podczas grania. Znacznie bardziej kompaktowa ładowarka jest tylko nieznacznie cieplejsza niż w starym modelu i nie ma problemów z maksymalną temperaturą 44 °C (111 °F).
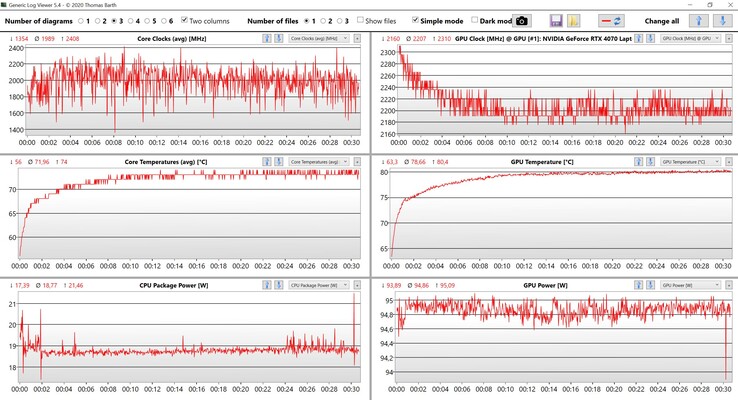
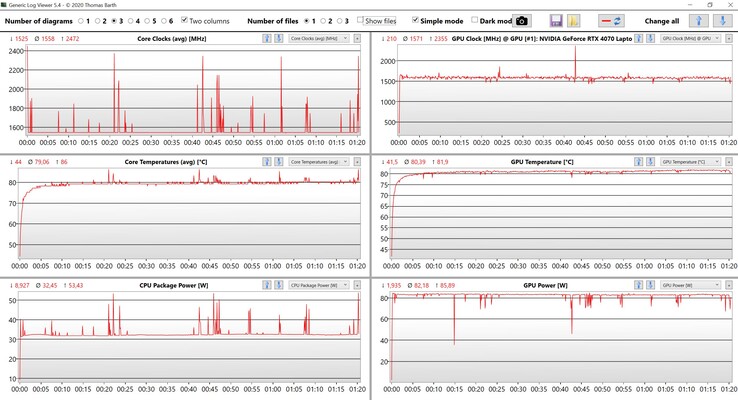
Podczas testu obciążeniowego karta graficzna jest traktowana priorytetowo, ponieważ działa stabilnie przy około 82 watach. Procesor, z drugiej strony, szybko osiąga poziom około ~32 watów. Ogólnie rzecz biorąc, jest to przyzwoity wynik jak na tak smukłe urządzenie.
(-) Maksymalna temperatura w górnej części wynosi 46.7 °C / 116 F, w porównaniu do średniej 36.9 °C / 98 F , począwszy od 21.1 do 71 °C dla klasy Multimedia.
(-) Dno nagrzewa się maksymalnie do 54.1 °C / 129 F, w porównaniu do średniej 39.2 °C / 103 F
(+) W stanie bezczynności średnia temperatura górnej części wynosi 24.7 °C / 76 F, w porównaniu ze średnią temperaturą urządzenia wynoszącą 31.3 °C / ### class_avg_f### F.
(±) Podczas gry w Wiedźmina 3 średnia temperatura górnej części wynosi 37.7 °C / 100 F, w porównaniu do średniej temperatury urządzenia wynoszącej 31.3 °C / ## #class_avg_f### F.
(+) Podpórki pod nadgarstki i touchpad są chłodniejsze niż temperatura skóry i maksymalnie 28 °C / 82.4 F i dlatego są chłodne w dotyku.
(±) Średnia temperatura obszaru podparcia dłoni w podobnych urządzeniach wynosiła 28.7 °C / 83.7 F (+0.7 °C / 1.3 F).
| Schenker VISION 16 Pro (M23) Intel Core i7-13700H, NVIDIA GeForce RTX 4070 Laptop GPU | Samsung Galaxy Book3 Ultra 16, i9-13900H RTX 4070 Intel Core i9-13900H, NVIDIA GeForce RTX 4070 Laptop GPU | MSI Stealth 16 Studio A13VG Intel Core i7-13700H, NVIDIA GeForce RTX 4070 Laptop GPU | Dell XPS 15 9530 RTX 4070 Intel Core i7-13700H, NVIDIA GeForce RTX 4070 Laptop GPU | Asus ProArt Studiobook 16 OLED H7604 Intel Core i9-13980HX, NVIDIA GeForce RTX 4070 Laptop GPU | Apple MacBook Pro 16 2023 M2 Max Apple M2 Max, Apple M2 Max 38-Core GPU | Schenker Vision 16 Pro RTX 3070 Ti Intel Core i7-12700H, NVIDIA GeForce RTX 3070 Ti Laptop GPU | |
|---|---|---|---|---|---|---|---|
| Heat | -10% | -32% | -8% | -9% | 15% | 1% | |
| Maximum Upper Side * (°C) | 46.7 | 45.9 2% | 60 -28% | 45.6 2% | 44.1 6% | 44.2 5% | 50.8 -9% |
| Maximum Bottom * (°C) | 54.1 | 50.9 6% | 61 -13% | 42 22% | 48 11% | 42.9 21% | 46.3 14% |
| Idle Upper Side * (°C) | 26.5 | 31.6 -19% | 38.2 -44% | 34.4 -30% | 32.7 -23% | 22.4 15% | 27.2 -3% |
| Idle Bottom * (°C) | 26.8 | 34.2 -28% | 37.7 -41% | 33.2 -24% | 34.9 -30% | 22.3 17% | 26.6 1% |
* ... im mniej tym lepiej
Głośniki
W systemie głośników nic się nie zmieniło, a szczególnie wysokie częstotliwości są bardzo dokładne. Ogólnie rzecz biorąc, wydajność jest tutaj również przyzwoita, ale Vision 16 Pro nadal nie jest w stanie osiągnąć doskonałej wydajnościMacBook Pro 16.
Schenker VISION 16 Pro (M23) analiza dźwięku
(±) | głośność głośnika jest średnia, ale dobra (77.6 dB)
Bas 100 - 315 Hz
(±) | zredukowany bas - średnio 14.7% niższy od mediany
(-) | bas nie jest liniowy (15% delta do poprzedniej częstotliwości)
Średnie 400 - 2000 Hz
(+) | zbalansowane środki średnie - tylko 3.1% od mediany
(+) | średnie są liniowe (4.6% delta do poprzedniej częstotliwości)
Wysokie 2–16 kHz
(+) | zrównoważone maksima - tylko 1.3% od mediany
(+) | wzloty są liniowe (4.1% delta do poprzedniej częstotliwości)
Ogólnie 100 - 16.000 Hz
(+) | ogólny dźwięk jest liniowy (13.1% różnicy w stosunku do mediany)
W porównaniu do tej samej klasy
» 24% wszystkich testowanych urządzeń w tej klasie było lepszych, 5% podobnych, 71% gorszych
» Najlepszy miał deltę 5%, średnia wynosiła ###średnia###%, najgorsza wynosiła 45%
W porównaniu do wszystkich testowanych urządzeń
» 13% wszystkich testowanych urządzeń było lepszych, 3% podobnych, 85% gorszych
» Najlepszy miał deltę 4%, średnia wynosiła ###średnia###%, najgorsza wynosiła 134%
Apple MacBook Pro 16 2023 M2 Max analiza dźwięku
(+) | głośniki mogą odtwarzać stosunkowo głośno (86.1 dB)
Bas 100 - 315 Hz
(+) | dobry bas - tylko 3.9% od mediany
(+) | bas jest liniowy (5.7% delta do poprzedniej częstotliwości)
Średnie 400 - 2000 Hz
(+) | zbalansowane środki średnie - tylko 1.2% od mediany
(+) | średnie są liniowe (1.5% delta do poprzedniej częstotliwości)
Wysokie 2–16 kHz
(+) | zrównoważone maksima - tylko 2.5% od mediany
(+) | wzloty są liniowe (1.7% delta do poprzedniej częstotliwości)
Ogólnie 100 - 16.000 Hz
(+) | ogólny dźwięk jest liniowy (4.9% różnicy w stosunku do mediany)
W porównaniu do tej samej klasy
» 0% wszystkich testowanych urządzeń w tej klasie było lepszych, 1% podobnych, 99% gorszych
» Najlepszy miał deltę 5%, średnia wynosiła ###średnia###%, najgorsza wynosiła 45%
W porównaniu do wszystkich testowanych urządzeń
» 0% wszystkich testowanych urządzeń było lepszych, 0% podobnych, 100% gorszych
» Najlepszy miał deltę 4%, średnia wynosiła ###średnia###%, najgorsza wynosiła 134%
Zarządzanie energią - dłuższa żywotność baterii
Zużycie energii
W naszych pomiarach zużycia energii nowy model 2023 okazuje się nieco bardziej wydajny, przy czym tylko maksymalne zużycie 173 watów jest praktycznie identyczne. Jednak wartość ta szybko spada do około 150 watów (również podczas grania), więc dołączona 180-watowa ładowarka jest wystarczająco duża. Nawiasem mówiąc, jest teraz nie tylko znacznie bardziej kompaktowy, ale także znacznie lżejszy (489 vs 811 gramów, 17,2 vs 28,6 uncji).
| wyłączony / stan wstrzymania | |
| luz | |
| obciążenie |
|
Legenda:
min: | |
| Schenker VISION 16 Pro (M23) i7-13700H, GeForce RTX 4070 Laptop GPU, Samsung 990 Pro 1 TB, IPS, 2560x1600, 16" | Samsung Galaxy Book3 Ultra 16, i9-13900H RTX 4070 i9-13900H, GeForce RTX 4070 Laptop GPU, Samsung PM9A1 MZVL21T0HCLR, OLED / AMOLED, 2880x1800, 16" | MSI Stealth 16 Studio A13VG i7-13700H, GeForce RTX 4070 Laptop GPU, Micron 3400 2TB MTFDKBA2T0TFH, IPS, 2560x1600, 16" | Dell XPS 15 9530 RTX 4070 i7-13700H, GeForce RTX 4070 Laptop GPU, SK hynix PC801 HFS001TEJ9X101N, OLED, 3456x2160, 15.6" | Asus ProArt Studiobook 16 OLED H7604 i9-13980HX, GeForce RTX 4070 Laptop GPU, Phison EM2804TBMTCB47, OLED, 3200x2000, 16" | Apple MacBook Pro 16 2023 M2 Max M2 Max, M2 Max 38-Core GPU, Apple SSD AP2048Z, Mini-LED, 3456x2234, 16.2" | Schenker Vision 16 Pro RTX 3070 Ti i7-12700H, GeForce RTX 3070 Ti Laptop GPU, Samsung SSD 980 Pro 1TB MZ-V8P1T0BW, IPS, 2560x1600, 16" | Przeciętny NVIDIA GeForce RTX 4070 Laptop GPU | Średnia w klasie Multimedia | |
|---|---|---|---|---|---|---|---|---|---|
| Power Consumption | 28% | -28% | -38% | -53% | -3% | -12% | -50% | 18% | |
| Idle Minimum * (Watt) | 8.6 | 4.3 50% | 11 -28% | 20 -133% | 12.8 -49% | 5.2 40% | 9 -5% | 13.2 ? -53% | 6.01 ? 30% |
| Idle Average * (Watt) | 12 | 4.6 62% | 18 -50% | 20.7 -73% | 19.9 -66% | 16.5 -38% | 13.3 -11% | 18.2 ? -52% | 10.4 ? 13% |
| Idle Maximum * (Watt) | 12.4 | 11.4 8% | 19 -53% | 22.4 -81% | 20.3 -64% | 16.8 -35% | 14.3 -15% | 24.6 ? -98% | 12.5 ? -1% |
| Load Average * (Watt) | 80 | 97 -21% | 91 -14% | 77.1 4% | 131.4 -64% | 113 -41% | 107 -34% | 97 ? -21% | 68.5 ? 14% |
| Witcher 3 ultra * (Watt) | 147.7 | 100.9 32% | 130 12% | 95.4 35% | 196.5 -33% | 92 38% | 155.2 -5% | ||
| Load Maximum * (Watt) | 173.1 | 107 38% | 228 -32% | 133.4 23% | 246.8 -43% | 145 16% | 172 1% | 221 ? -28% | 114.9 ? 34% |
* ... im mniej tym lepiej
Power Consumption The Witcher 3 / Stress Test
Power Consumption With External Monitor
Żywotność baterii
Odpowiednio do nieco bardziej wydajnych wartości zużycia, żywotność baterii również okazuje się nieco lepsza. Przy dostosowanej jasności 150 cd/m² (odpowiadającej 39% maksymalnej jasności naszej jednostki testowej), nasz test WLAN działa nieco dłużej niż 7,5 godziny zarówno przy 60, jak i 240 Hz, dzięki czemu Vision 16 Pro 2023 jest znacznie bardziej konkurencyjny. Tylko MacBook Pro 16 gra w innej lidze, trwając tutaj prawie 15 godzin. Test wideo przy 150 cd/m² również trwa prawie 8 godzin.
Przy maksymalnej jasności wyświetlacza częstotliwość odświeżania robi różnicę, ponieważ test WLAN przy 240 Hz trwa zaledwie 6 godzin, podczas gdy przy 60 Hz jest to ponad 7 godzin. Chcielibyśmy, aby podobnie jak w mniejszym Vision 14, Schenker mógł również zaoferować wersję Vision 16 Pro z większą baterią, rezygnując z dodatkowego gniazda M.2.
| Schenker VISION 16 Pro (M23) i7-13700H, GeForce RTX 4070 Laptop GPU, 80 Wh | Samsung Galaxy Book3 Ultra 16, i9-13900H RTX 4070 i9-13900H, GeForce RTX 4070 Laptop GPU, 76 Wh | MSI Stealth 16 Studio A13VG i7-13700H, GeForce RTX 4070 Laptop GPU, 99.9 Wh | Dell XPS 15 9530 RTX 4070 i7-13700H, GeForce RTX 4070 Laptop GPU, 86 Wh | Asus ProArt Studiobook 16 OLED H7604 i9-13980HX, GeForce RTX 4070 Laptop GPU, 90 Wh | Apple MacBook Pro 16 2023 M2 Max M2 Max, M2 Max 38-Core GPU, 99.6 Wh | Schenker Vision 16 Pro RTX 3070 Ti i7-12700H, GeForce RTX 3070 Ti Laptop GPU, 80 Wh | Średnia w klasie Multimedia | |
|---|---|---|---|---|---|---|---|---|
| Czasy pracy | -4% | 28% | 9% | -22% | 72% | -15% | 60% | |
| H.264 (h) | 7.8 | 9 15% | 7.7 -1% | 6 -23% | 18.7 140% | 6.1 -22% | 16 ? 105% | |
| WiFi v1.3 (h) | 7.8 | 8 3% | 7.8 0% | 8 3% | 5.6 -28% | 14.8 90% | 6 -23% | 11.4 ? 46% |
| Load (h) | 1.3 | 0.9 -31% | 2.4 85% | 1.5 15% | 1.1 -15% | 1.1 -15% | 1.3 0% | 1.667 ? 28% |
Za
Przeciw
Werdykt - Vision 16 Pro nadal jest imponująco lekki i smukły
Podczas gdy nowy model 2023 Vision 16 Pro zawiera oczekiwane aktualizacje z procesorem Intel Raptor Lake i nowym laptopem Nvidia GeForce RTX 4070, wprowadzono również pewne dodatkowe zmiany w profilach zasilania. Vision 16 Pro jest jednym z rzadkich przypadków, w których 45-watowy procesor naprawdę działa przy tej wartości bez absurdalnie wysokiego krótkoterminowego limitu mocy. Oznacza to, że wydajność pozostaje dość stała, a temperatury nie skaczą tak szybko, ale jednocześnie wydajność jest również nieco niższa, szczególnie w krótkich testach porównawczych. Nie odgrywa to jednak żadnej roli w codziennym użytkowaniu. Z drugiej strony, nie do końca rozumiemy, dlaczego Schenker usunął tryb ręczny lub Turbo, który pozwalał na dostosowanie wartości TDP procesora. W poprzednim modelu pozwalało to również na dalsze zauważalne zwiększenie wydajności procesora.
Przy tym samym maksymalnym TDP wynoszącym 95 W, nowy laptop GeForce RTX 4070 zapewnia o około 25-30% wyższą wydajność niż stary RTX 3070 Ti, ale nie ma bezpośredniego następcy starego RTX 3080. Poza tym nie ma zbyt wielu powodów do narzekań na ogólną wydajność, a prędkości transferu szybkich dysków SSD PCIe 4.0 również pozostają na stałym poziomie. Nie rozumiemy jednak, dlaczego czytnik kart jest teraz znacznie wolniejszy.
Schenker Vision 16 Pro oferuje dużą wydajność w bardzo smukłej i lekkiej obudowie, również w wersji 2023. Mimo to nie ma żadnych kompromisów w zakresie połączeń lub opcji konserwacji.
Matowy wyświetlacz IPS z 240 Hz subiektywnie zapewnia dobrą jakość obrazu, a dzięki dołączonemu skalibrowanemu profilowi firmy Schenker można również naprawić odcień kolorów, ale niskie pokrycie przestrzeni kolorów i brak obsługi HDR są nadal wadami. Ale przynajmniej PWM nie jest używany.
Opcje wyświetlania to również największe zalety konkurencji, która często oferuje panele OLED lub MiniLED. Czy zawsze jest to lepsze (słowo kluczowe: PWM) jest dyskusyjne, ale subiektywne wrażenie obrazu jest nieco lepsze i są zalety w przestrzeni kolorów i HDR. Czysta wydajność procesora (wielordzeniowa) jest również często lepsza u konkurencji, ale szczególnie pod względem wydajności graficznej Vision 16 Pro nie musi chować się za urządzeniami porównawczymi Asus ProArt Studiobook 16 lub MSI Stealth 16 Studio. ZwłaszczaDell XPS 15z 50-watową wersją RTX 4070 Laptop wypada pod tym względem znacznie gorzej.
Cena i dostępność
Nowy Vision 16 Pro M23 można skonfigurować na stronie Bestware już od 2 099 euro (~$2,361). W przypadku naszej konfiguracji testowej z aktualizacjami do RTX 4070 Laptoporaz większą ilością pamięci RAM i SSD, trzeba zapłacić około 2600 euro (~2 924 USD).
Schenker VISION 16 Pro (M23)
- 18/07/2023 v7 (old)
Andreas Osthoff
Przezroczystość
Wyboru urządzeń do recenzji dokonuje nasza redakcja. Próbka testowa została udostępniona autorowi jako pożyczka od producenta lub sprzedawcy detalicznego na potrzeby tej recenzji. Pożyczkodawca nie miał wpływu na tę recenzję, producent nie otrzymał też kopii tej recenzji przed publikacją. Nie było obowiązku publikowania tej recenzji. Jako niezależna firma medialna, Notebookcheck nie podlega władzy producentów, sprzedawców detalicznych ani wydawców.
Tak testuje Notebookcheck
Każdego roku Notebookcheck niezależnie sprawdza setki laptopów i smartfonów, stosując standardowe procedury, aby zapewnić porównywalność wszystkich wyników. Od około 20 lat stale rozwijamy nasze metody badawcze, ustanawiając przy tym standardy branżowe. W naszych laboratoriach testowych doświadczeni technicy i redaktorzy korzystają z wysokiej jakości sprzętu pomiarowego. Testy te obejmują wieloetapowy proces walidacji. Nasz kompleksowy system ocen opiera się na setkach uzasadnionych pomiarów i benchmarków, co pozwala zachować obiektywizm.

