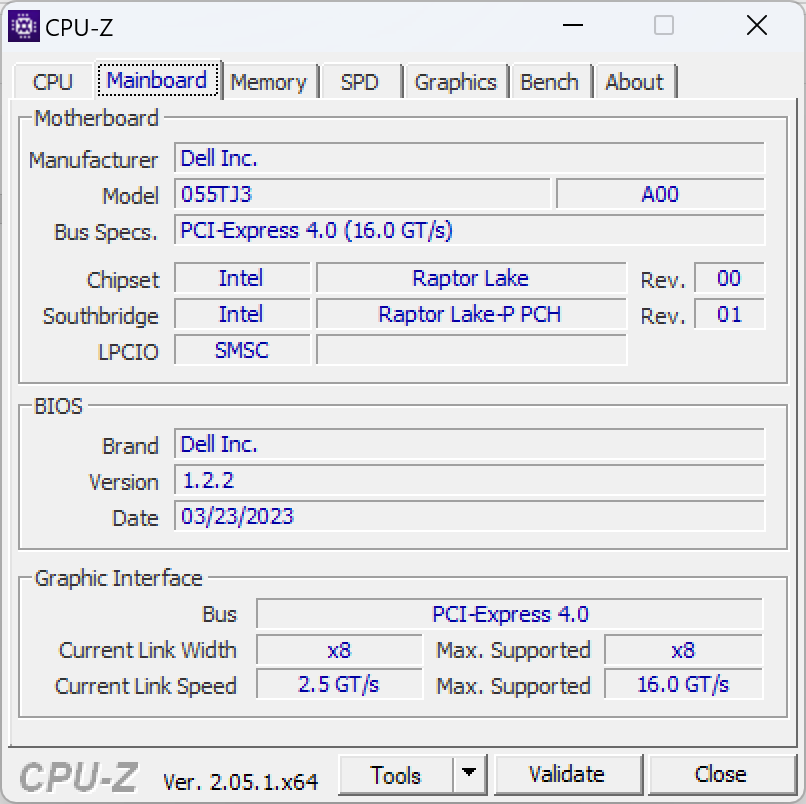
Recenzja laptopa Dell XPS 17 9730: GeForce Multimedialny potwór RTX 4070

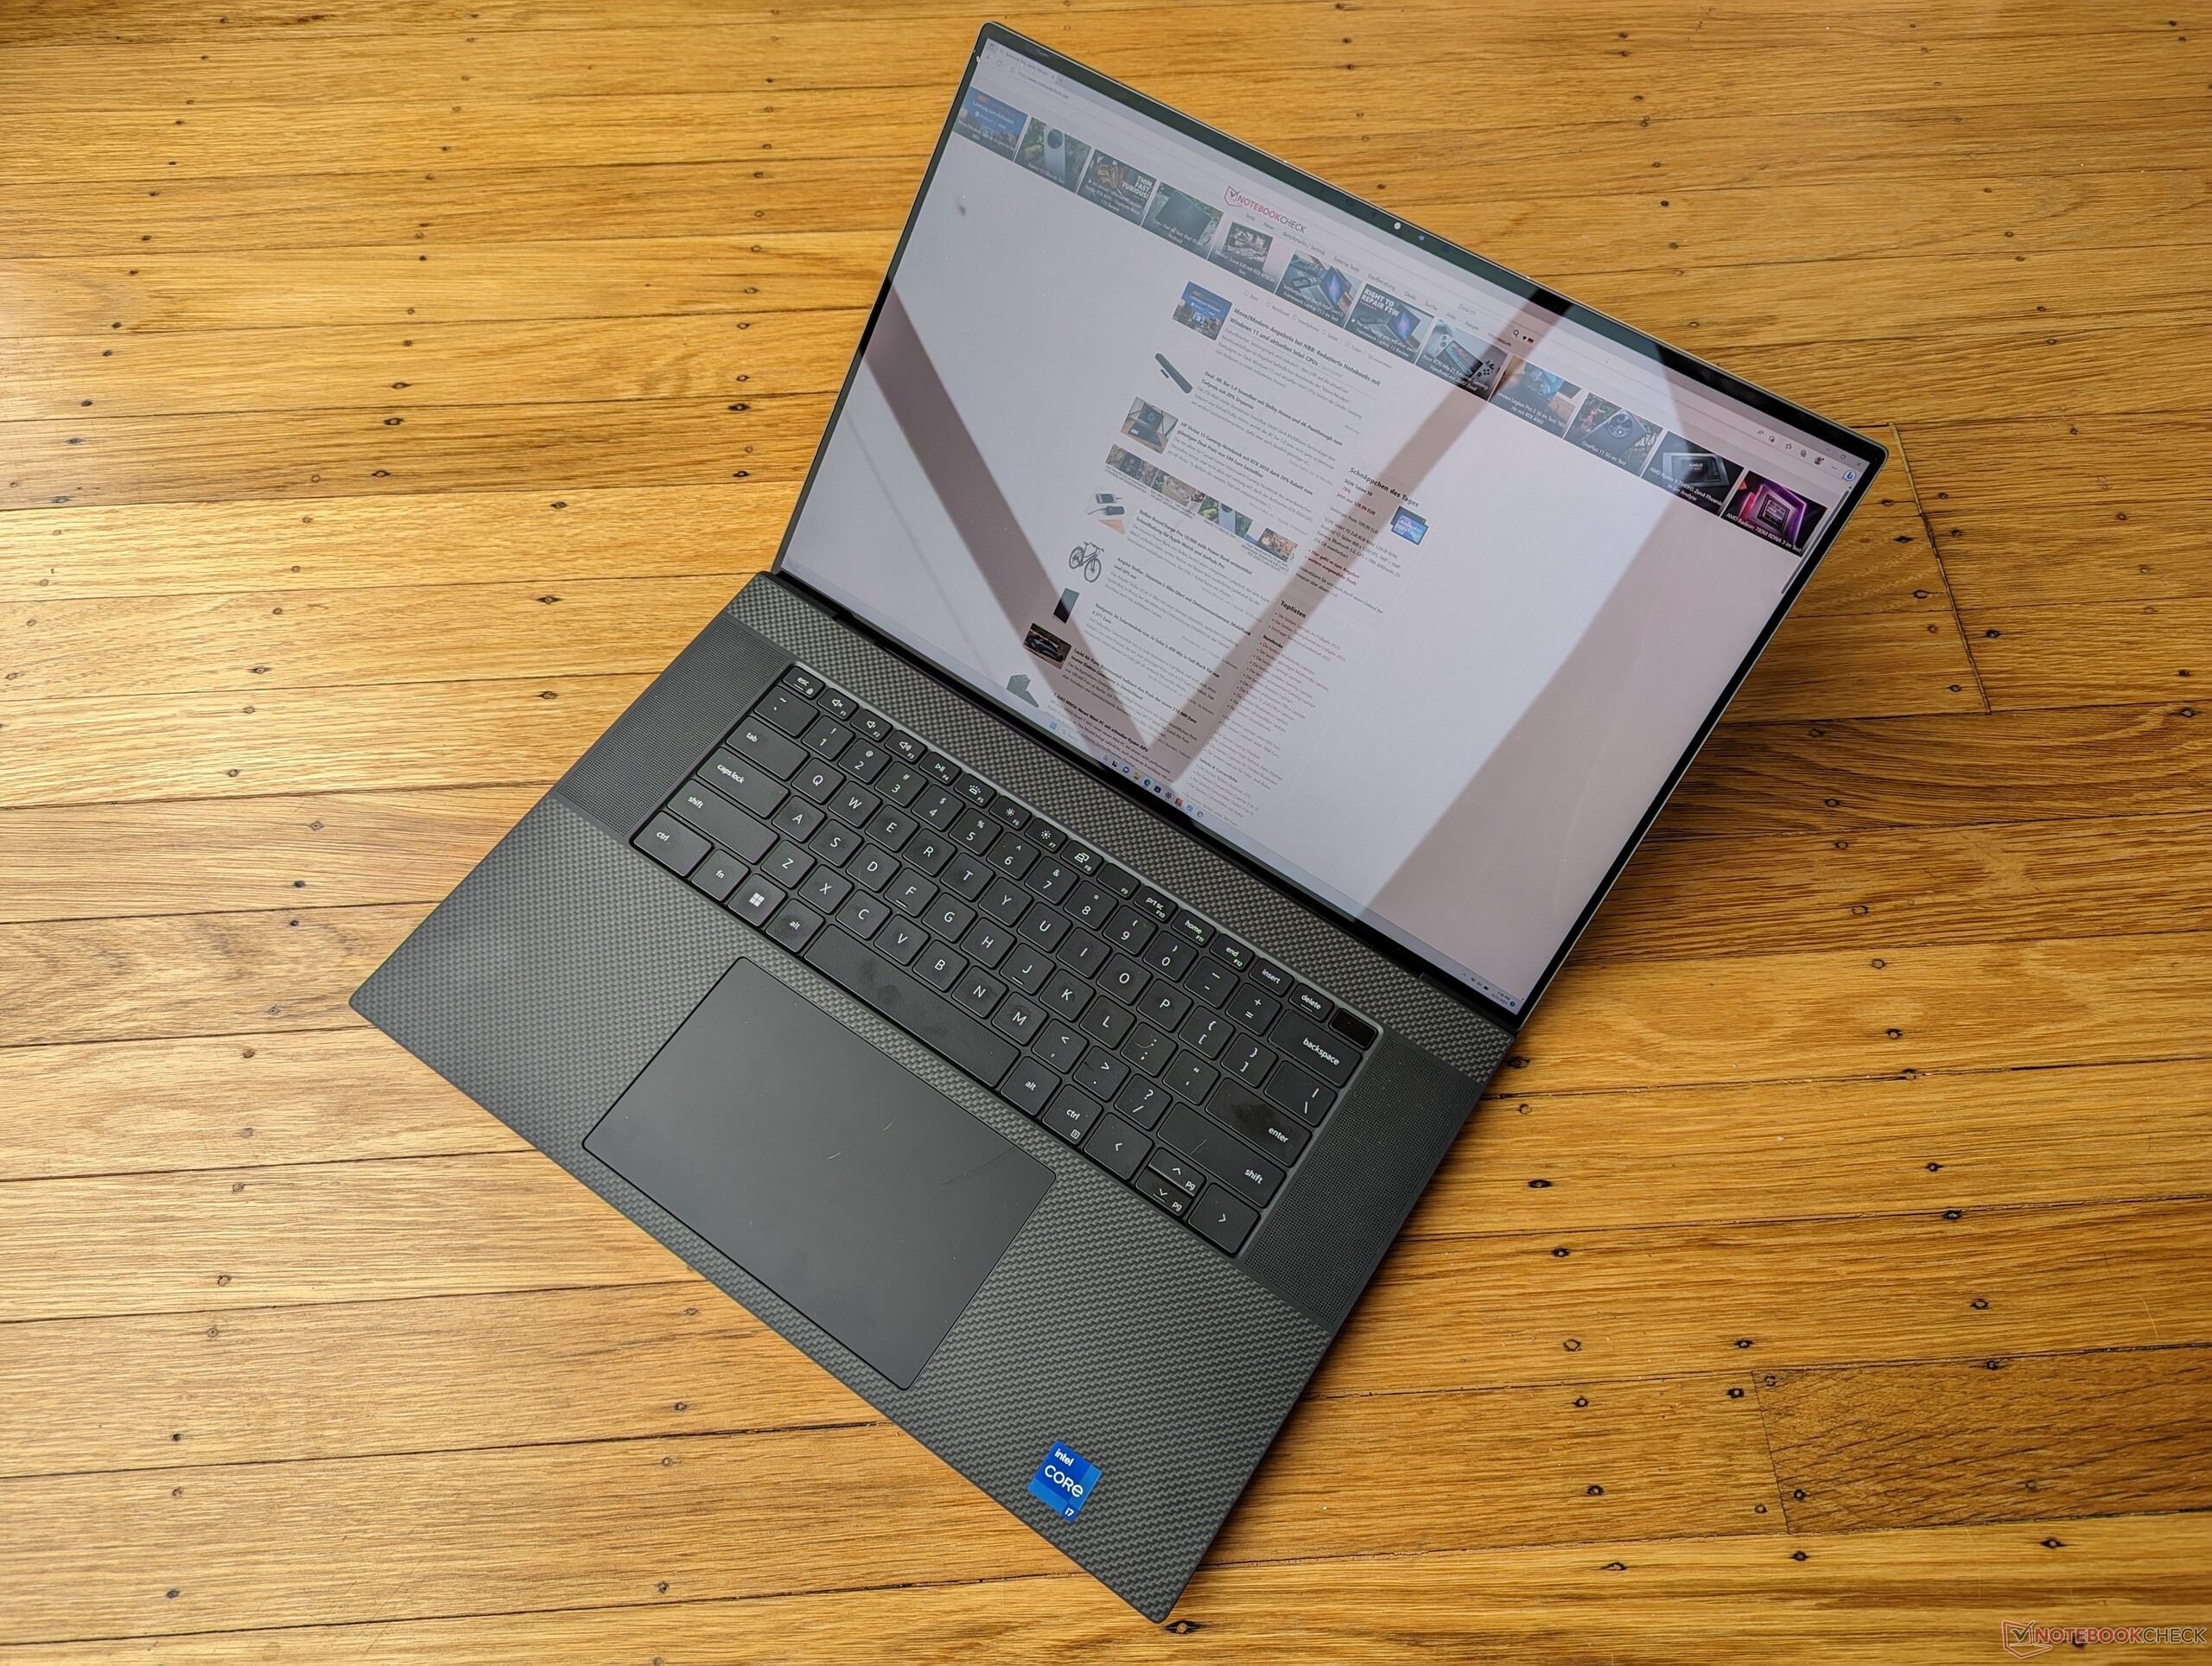
XPS 17 9730 z 2023 roku jest czwartą iteracją oryginalnego modelu 2020 XPS 17 9700 design. Jest to wewnętrzna aktualizacja z procesorami Intel Raptor Lake-H 13. generacji i procesorami graficznymi Nvidia Ada Lovelace, które zastąpiły odpowiednio zeszłoroczne opcje Alder Lake-H i Ampere 12. generacji. Poza tym nie ma żadnych większych powierzchownych zmian, dlatego zalecamy zapoznanie się z naszą recenzją na temat oryginalnego XPS 17 9700 aby dowiedzieć się więcej o fizycznych cechach laptopa. Wszelkie przyszłe przeprojektowania będą prawdopodobnie czerpać inspirację z najnowszej serii XPS 13 Plus.
Nasza konkretna konfiguracja w recenzji to wyższej klasy SKU z Core i7-13700H, GeForce RTX 4070 i błyszczącym ekranem dotykowym UHD + 2400p za około 3500 USD w sprzedaży detalicznej. Inne jednostki SKU są dostępne z RTX 4050, RTX 4060, RTX 4080, Core i9-13900H lub matowym wyświetlaczem 1200p. Co ciekawe, wszystkie konfiguracje muszą być wyposażone w oddzielną grafikę, podczas gdy poprzednie modele XPS 17 miały tańsze zintegrowane opcje UHD lub Iris Xe.
Konkurenci w tej przestrzeni obejmują inne flagowe 17-calowe laptopy multimedialne, takie jak LG Gram 17, HP Envy 17,MSI Creator Z17lub 16-calowyApple MacBook Pro 16.
Więcej recenzji Dell:
Potencjalni konkurenci w porównaniu
Ocena | Data | Model | Waga | Wysokość | Rozmiar | Rezolucja | Cena |
|---|---|---|---|---|---|---|---|
| 90 % v7 (old) | 05/2023 | Dell XPS 17 9730 RTX 4070 i7-13700H, GeForce RTX 4070 Laptop GPU | 2.5 kg | 19.5 mm | 17.00" | 3840x2400 | |
| 88.8 % v7 (old) | 02/2023 | Dell XPS 17 9720 RTX 3060 i7-12700H, GeForce RTX 3060 Laptop GPU | 2.5 kg | 19.5 mm | 17.00" | 3840x2400 | |
| 86.4 % v7 (old) | 05/2023 | LG Gram 17 (2023) i7-1360P, Iris Xe G7 96EUs | 1.4 kg | 17.8 mm | 17.00" | 2560x1600 | |
| 86.3 % v7 (old) | 04/2023 | HP Envy 17-cr0079ng i7-1255U, GeForce RTX 2050 Mobile | 2.6 kg | 19.6 mm | 17.30" | 3840x2160 | |
| 83.8 % v7 (old) | 09/2022 | MSI Creator Z17 A12UGST-054 i9-12900H, GeForce RTX 3070 Ti Laptop GPU | 2.5 kg | 19 mm | 17.00" | 2560x1600 | |
| 93.7 % v7 (old) | 03/2023 | Apple MacBook Pro 16 2023 M2 Max M2 Max, M2 Max 38-Core GPU | 2.2 kg | 16.8 mm | 16.20" | 3456x2234 |
Przypadek - ten sam projekt od trzech lat
Czytnik kart SD
| SD Card Reader | |
| average JPG Copy Test (av. of 3 runs) | |
| Dell XPS 17 9720 RTX 3060 (Toshiba Exceria Pro SDXC 64 GB UHS-II) | |
| Dell XPS 17 9730 RTX 4070 (Toshiba Exceria Pro SDXC 64 GB UHS-II) | |
| Apple MacBook Pro 16 2023 M2 Max (Angelbird AV Pro V60) | |
| MSI Creator Z17 A12UGST-054 (AV Pro SD microSD 128 GB V60) | |
| HP Envy 17-cr0079ng (AV Pro SD microSD 128 GB V60) | |
| LG Gram 17 (2023) (AV Pro SD microSD 128 GB V60) | |
| maximum AS SSD Seq Read Test (1GB) | |
| Apple MacBook Pro 16 2023 M2 Max (Angelbird AV Pro V60) | |
| Dell XPS 17 9730 RTX 4070 (Toshiba Exceria Pro SDXC 64 GB UHS-II) | |
| Dell XPS 17 9720 RTX 3060 (Toshiba Exceria Pro SDXC 64 GB UHS-II) | |
| LG Gram 17 (2023) (AV Pro SD microSD 128 GB V60) | |
| MSI Creator Z17 A12UGST-054 (AV Pro SD microSD 128 GB V60) | |
| HP Envy 17-cr0079ng (AV Pro SD microSD 128 GB V60) | |
Komunikacja - brak Wi-Fi 6E
XPS 15 i XPS 17 pozostają jedynymi laptopami w ostatnim czasie, które są dostarczane z modułami Wi-Fi 6E WLAN, a mimo to NIE obsługują łączności Wi-Fi 6E. W związku z tym nie będzie można połączyć się z żadną siecią Wi-Fi 6 GHz. Nie powinno to stanowić większego problemu dla większości użytkowników, ale mimo wszystko jest to rozczarowujące w przypadku laptopa kosztującego ponad 3500 USD.
| Networking | |
| iperf3 transmit AXE11000 | |
| LG Gram 17 (2023) | |
| Dell XPS 17 9720 RTX 3060 | |
| HP Envy 17-cr0079ng | |
| Dell XPS 17 9730 RTX 4070 | |
| iperf3 receive AXE11000 | |
| LG Gram 17 (2023) | |
| HP Envy 17-cr0079ng | |
| Dell XPS 17 9720 RTX 3060 | |
| Dell XPS 17 9730 RTX 4070 | |
| iperf3 transmit AXE11000 6GHz | |
| Apple MacBook Pro 16 2023 M2 Max | |
| LG Gram 17 (2023) | |
| HP Envy 17-cr0079ng | |
| MSI Creator Z17 A12UGST-054 | |
| iperf3 receive AXE11000 6GHz | |
| Apple MacBook Pro 16 2023 M2 Max | |
| MSI Creator Z17 A12UGST-054 | |
| HP Envy 17-cr0079ng | |
| LG Gram 17 (2023) | |
Kamera internetowa - tylko 720p
XPS 15 i XPS 17 są prawdopodobnie jedynymi flagowymi laptopami, które nadal są dostarczane z kamerami internetowymi o niskiej rozdzielczości 1 MP lub 720p i bez migawki prywatności. Konkurencyjni producenci, tacy jak Lenovo, HP, Asus i inni, przeszli już na rozwiązania 2 MP lub nawet 8 MP. Dell twierdzi, że bardzo wąska ramka wyświetlacza w konstrukcji XPS ogranicza jakość czujnika kamery internetowej.


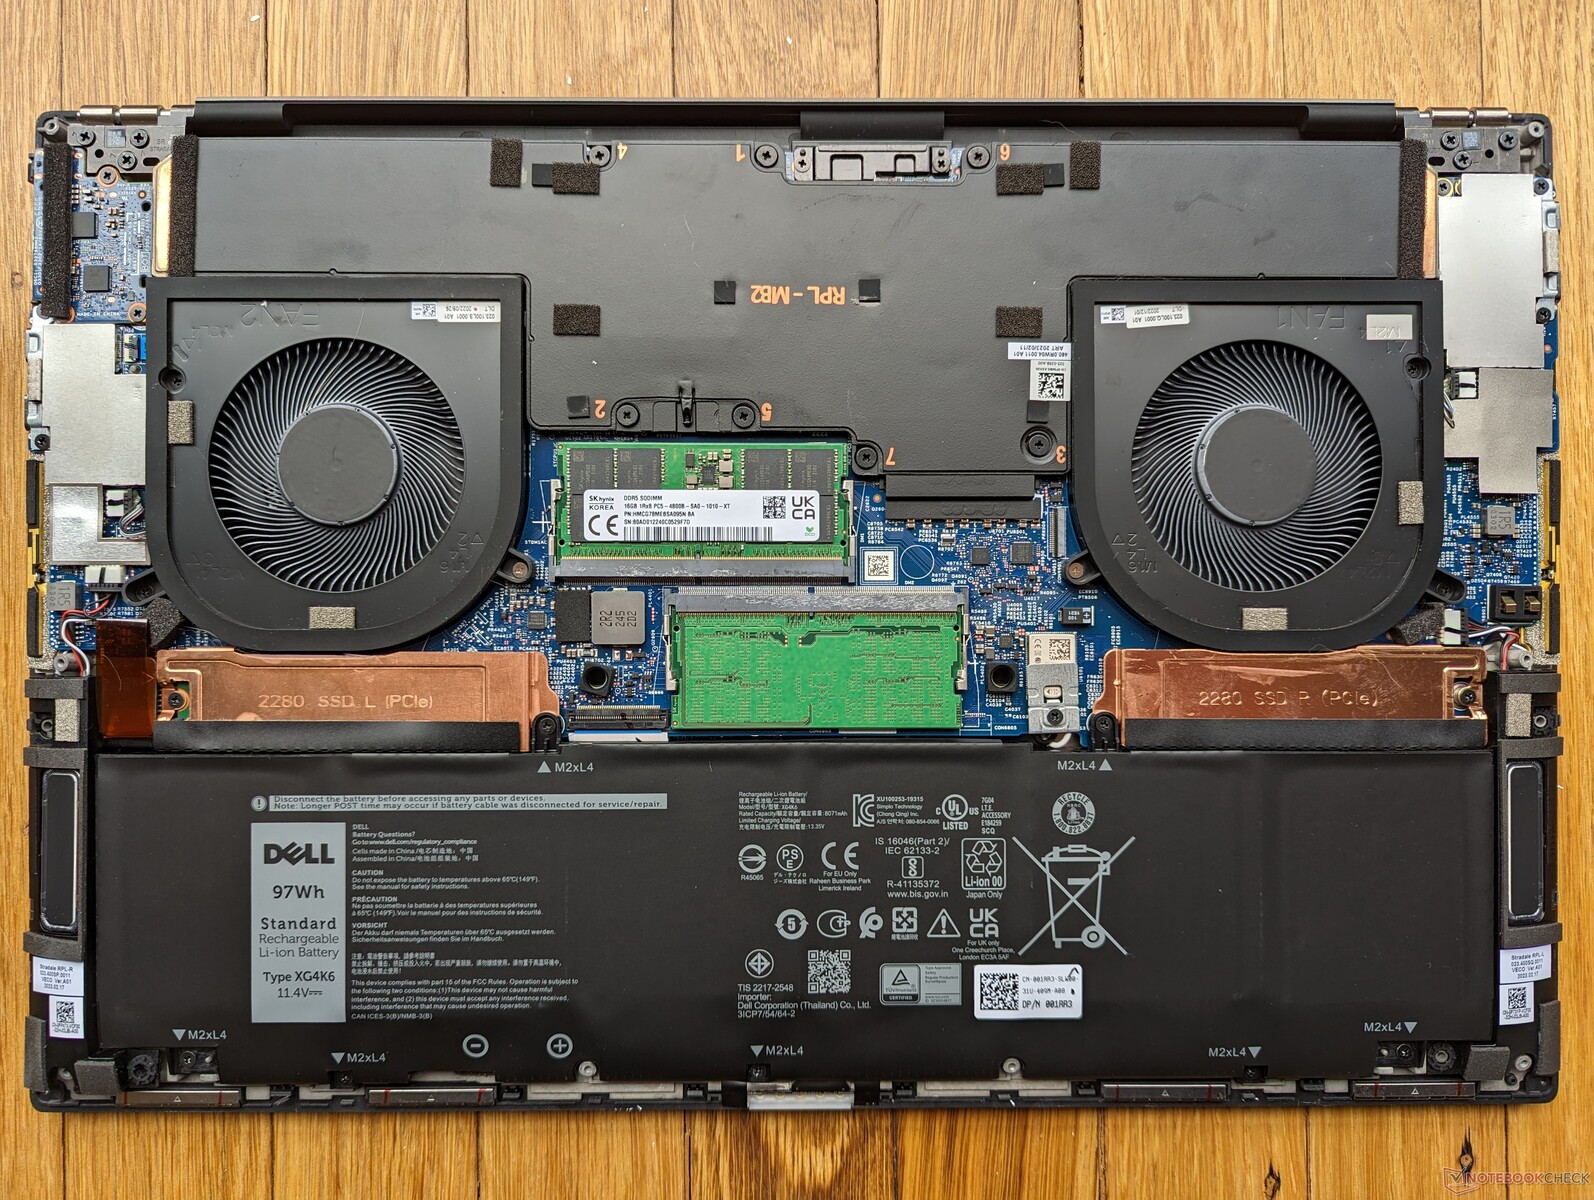
Konserwacja
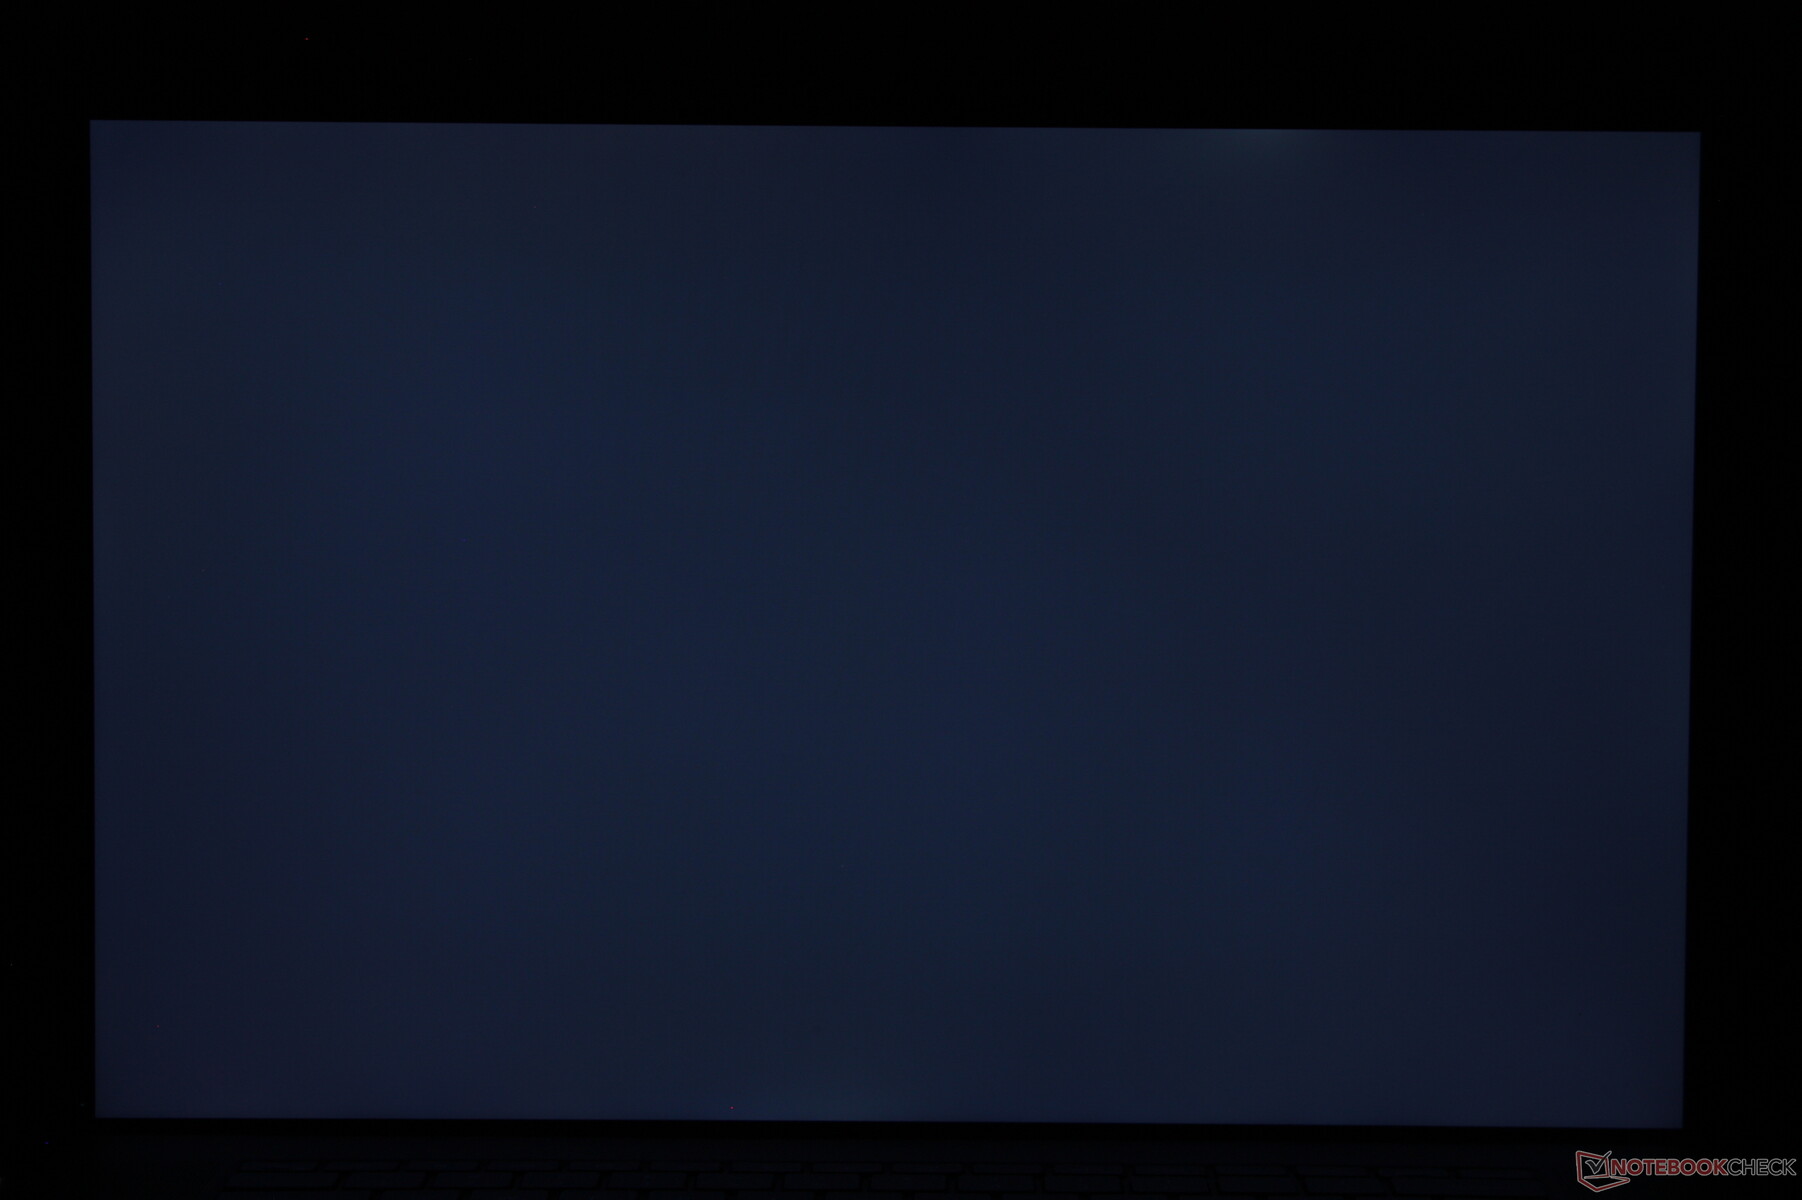
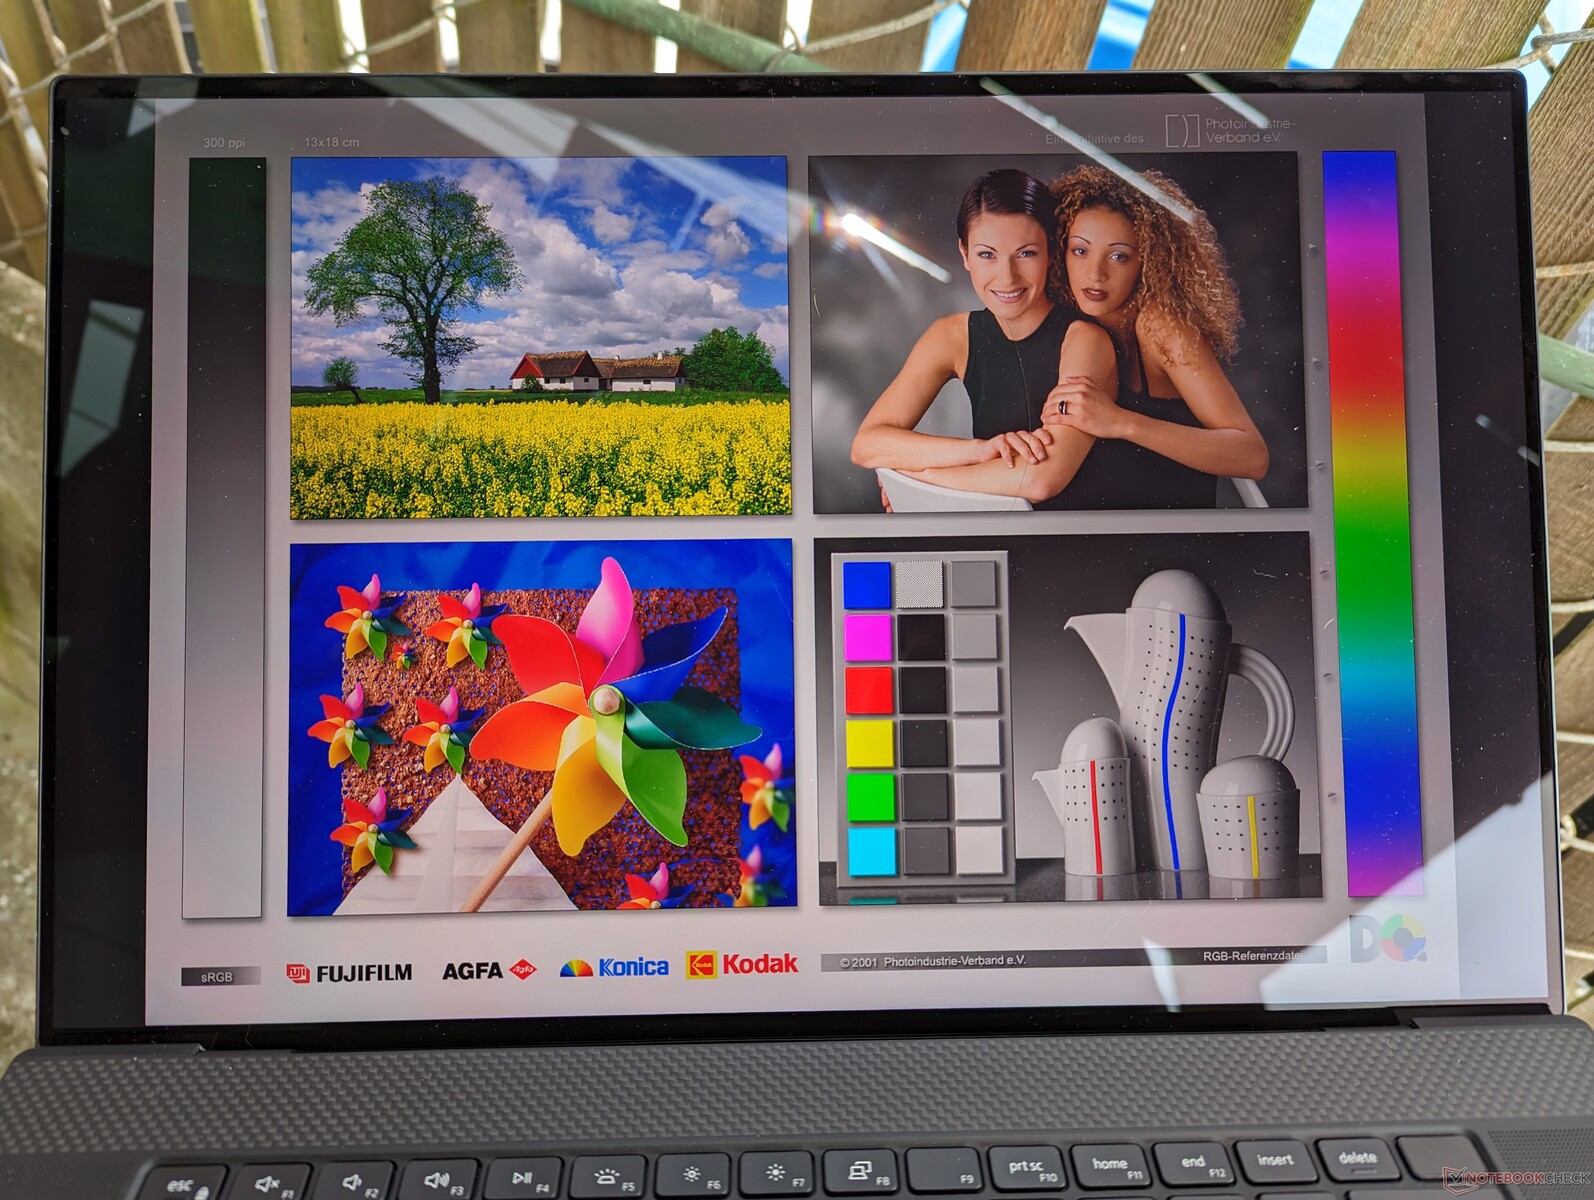
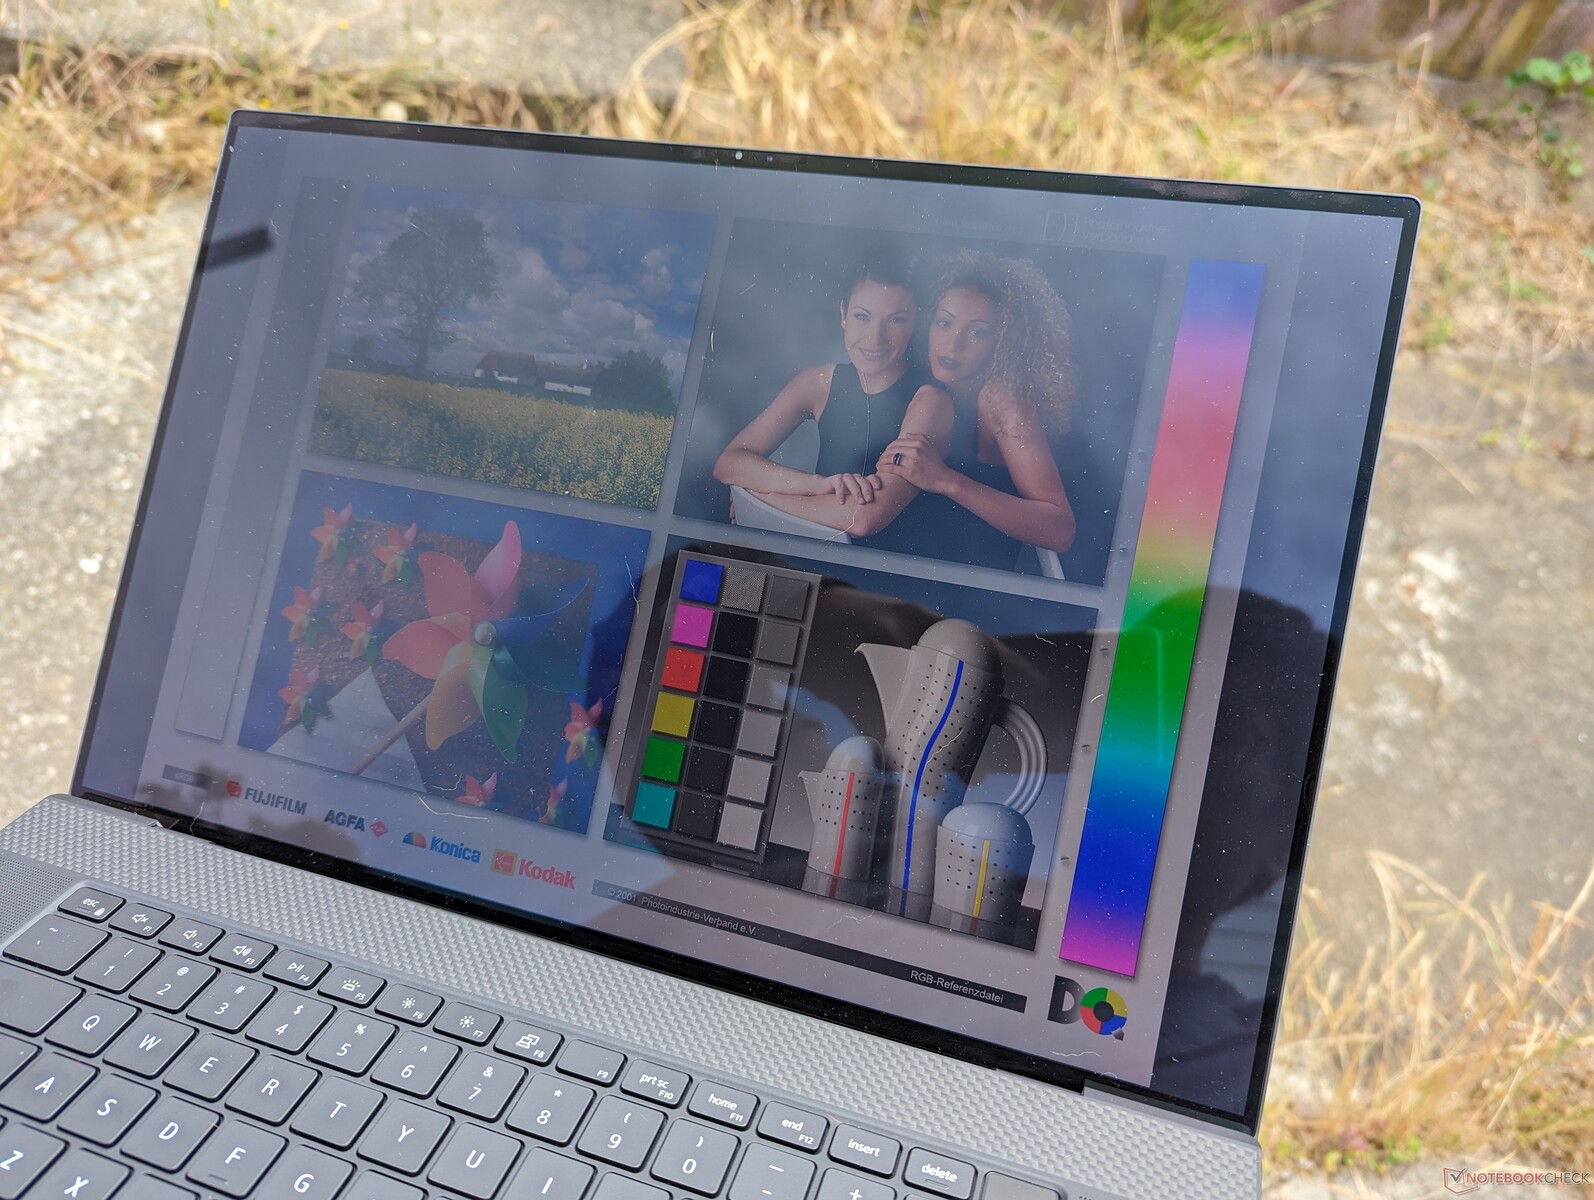
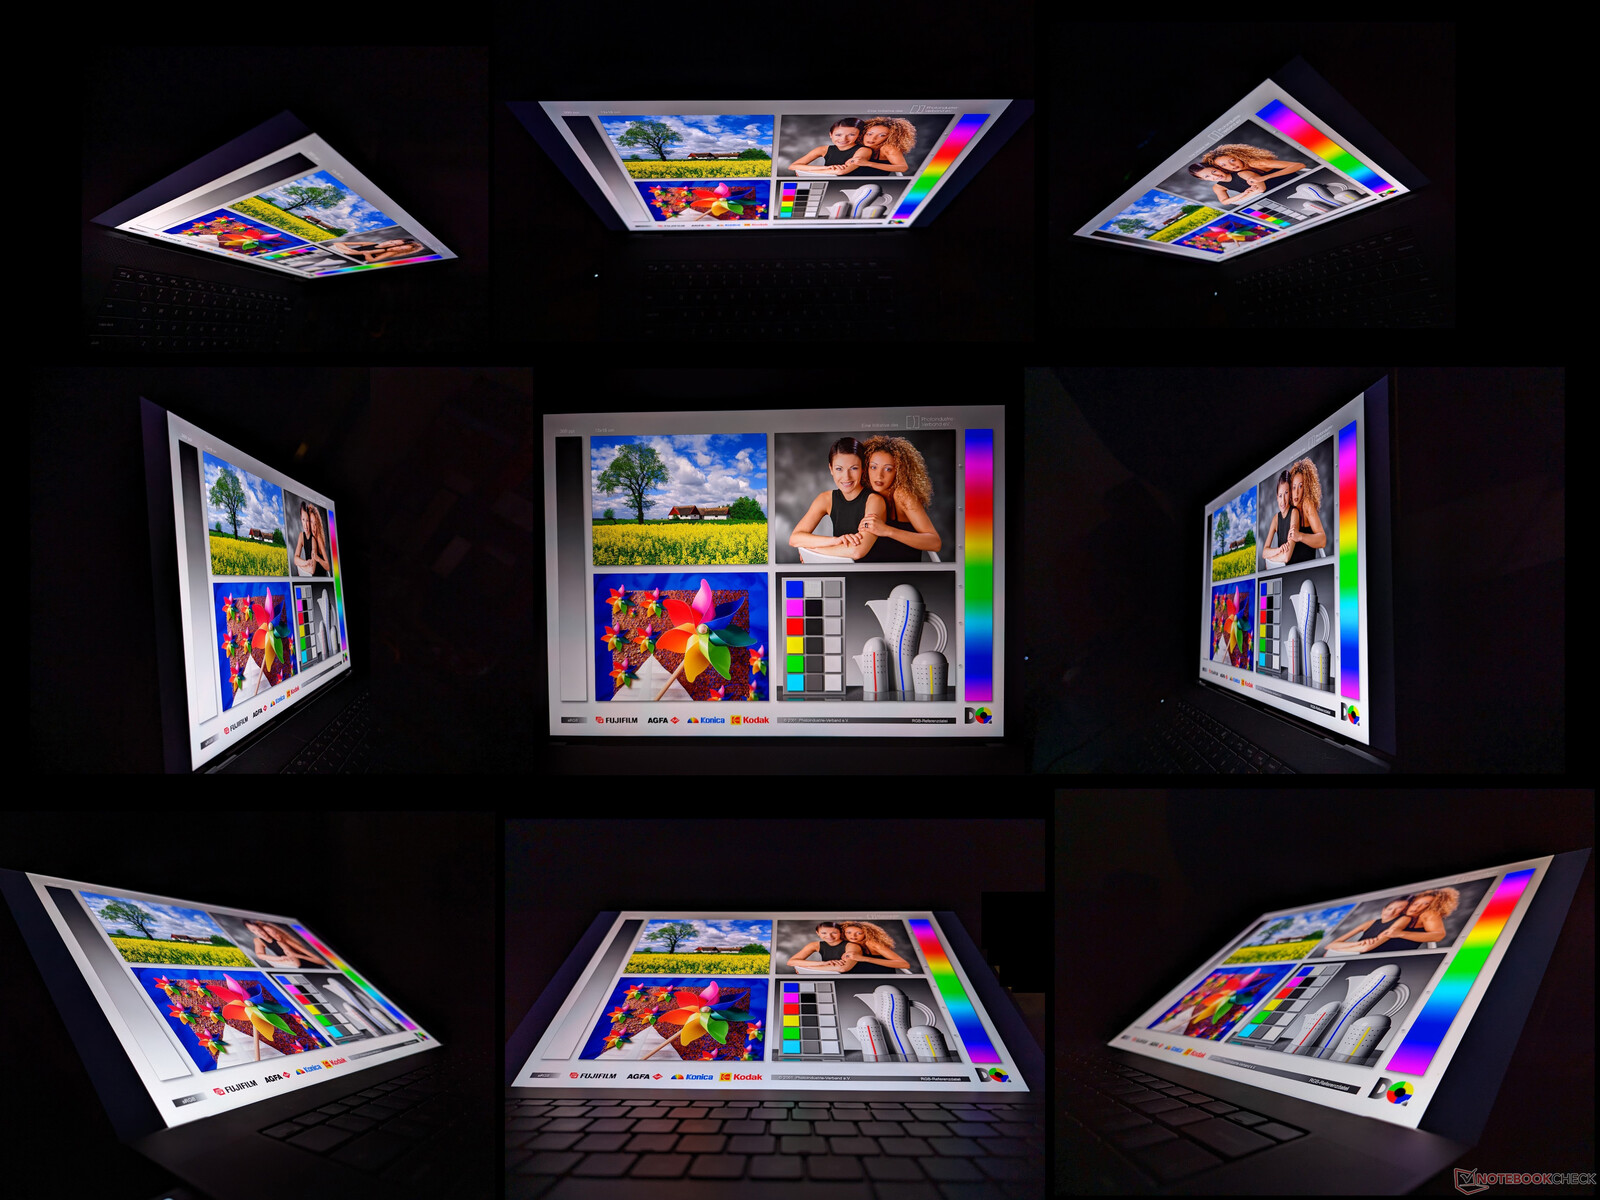
Wyświetlacz - wciąż dobry, ale bez opcji 120 Hz
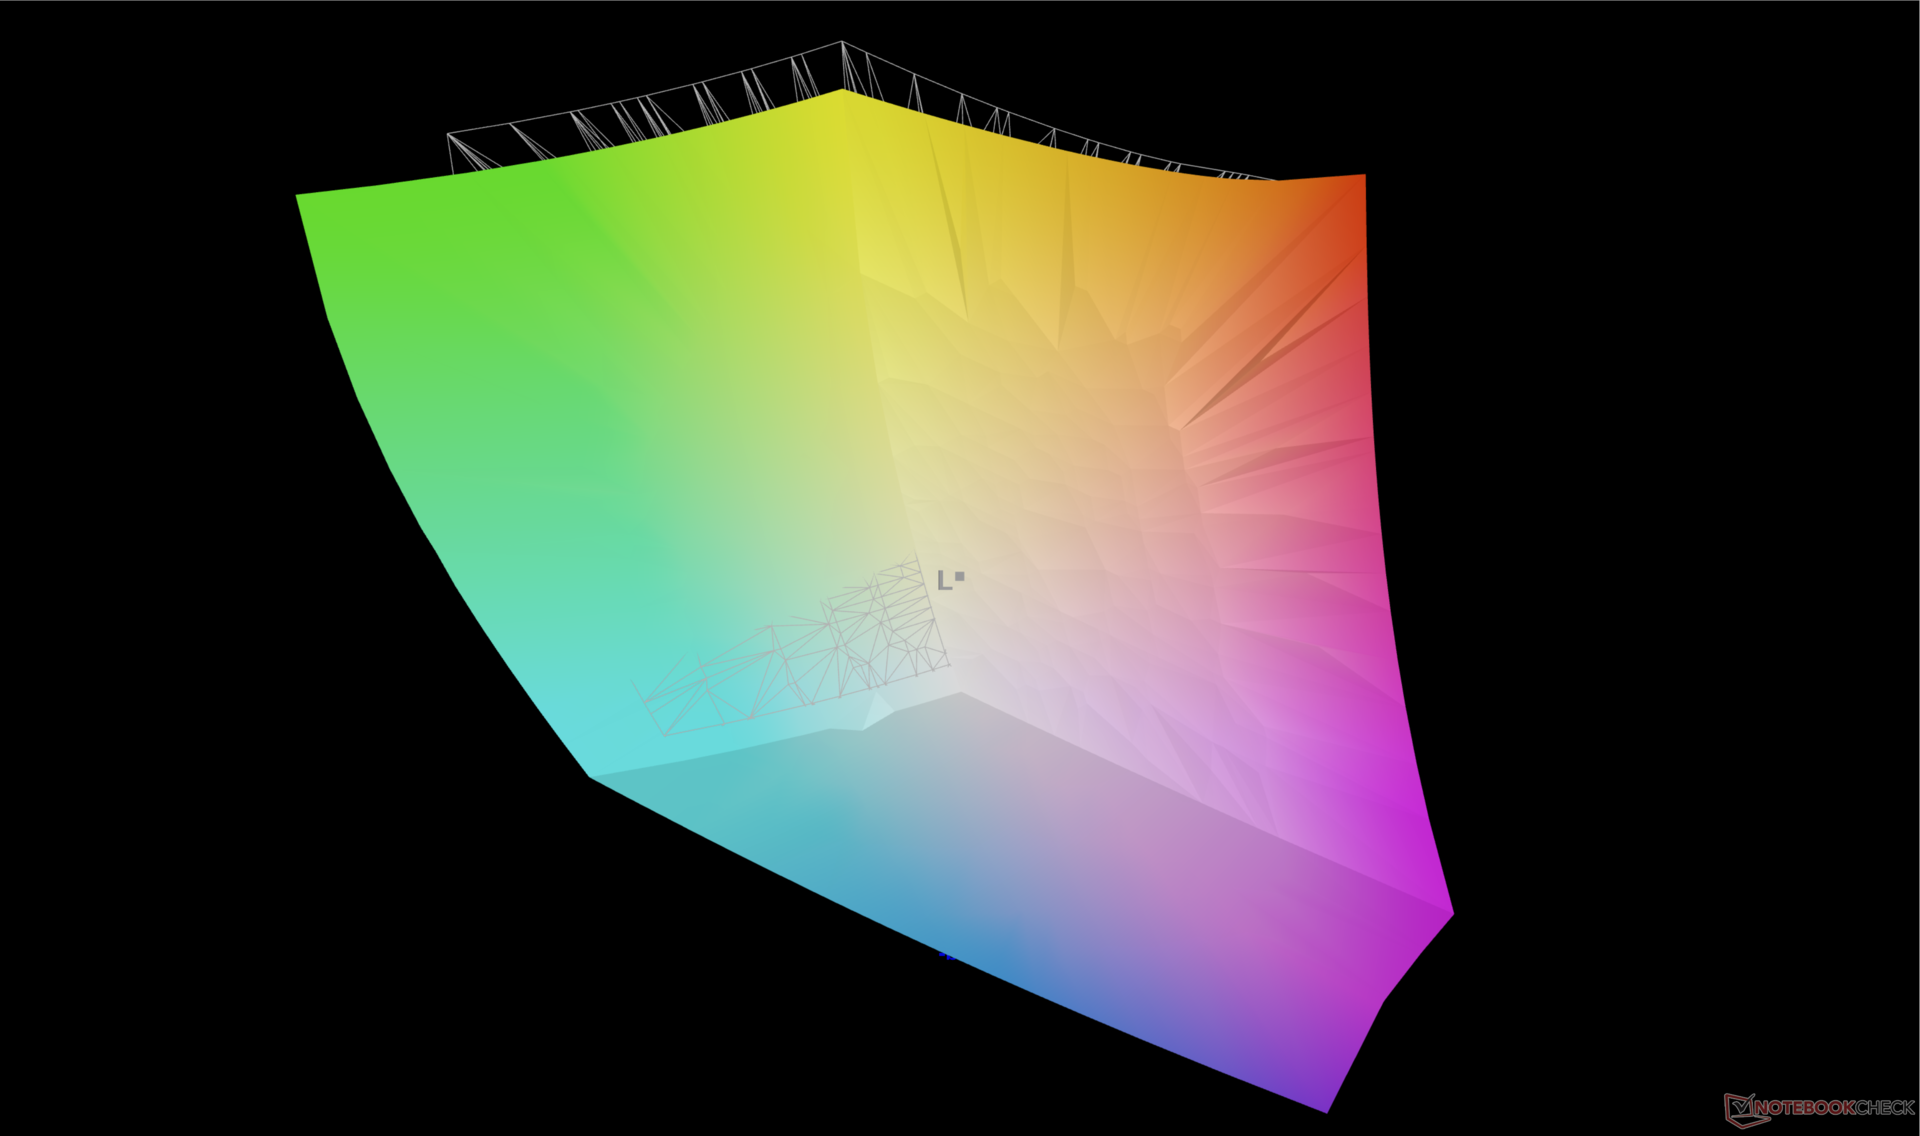
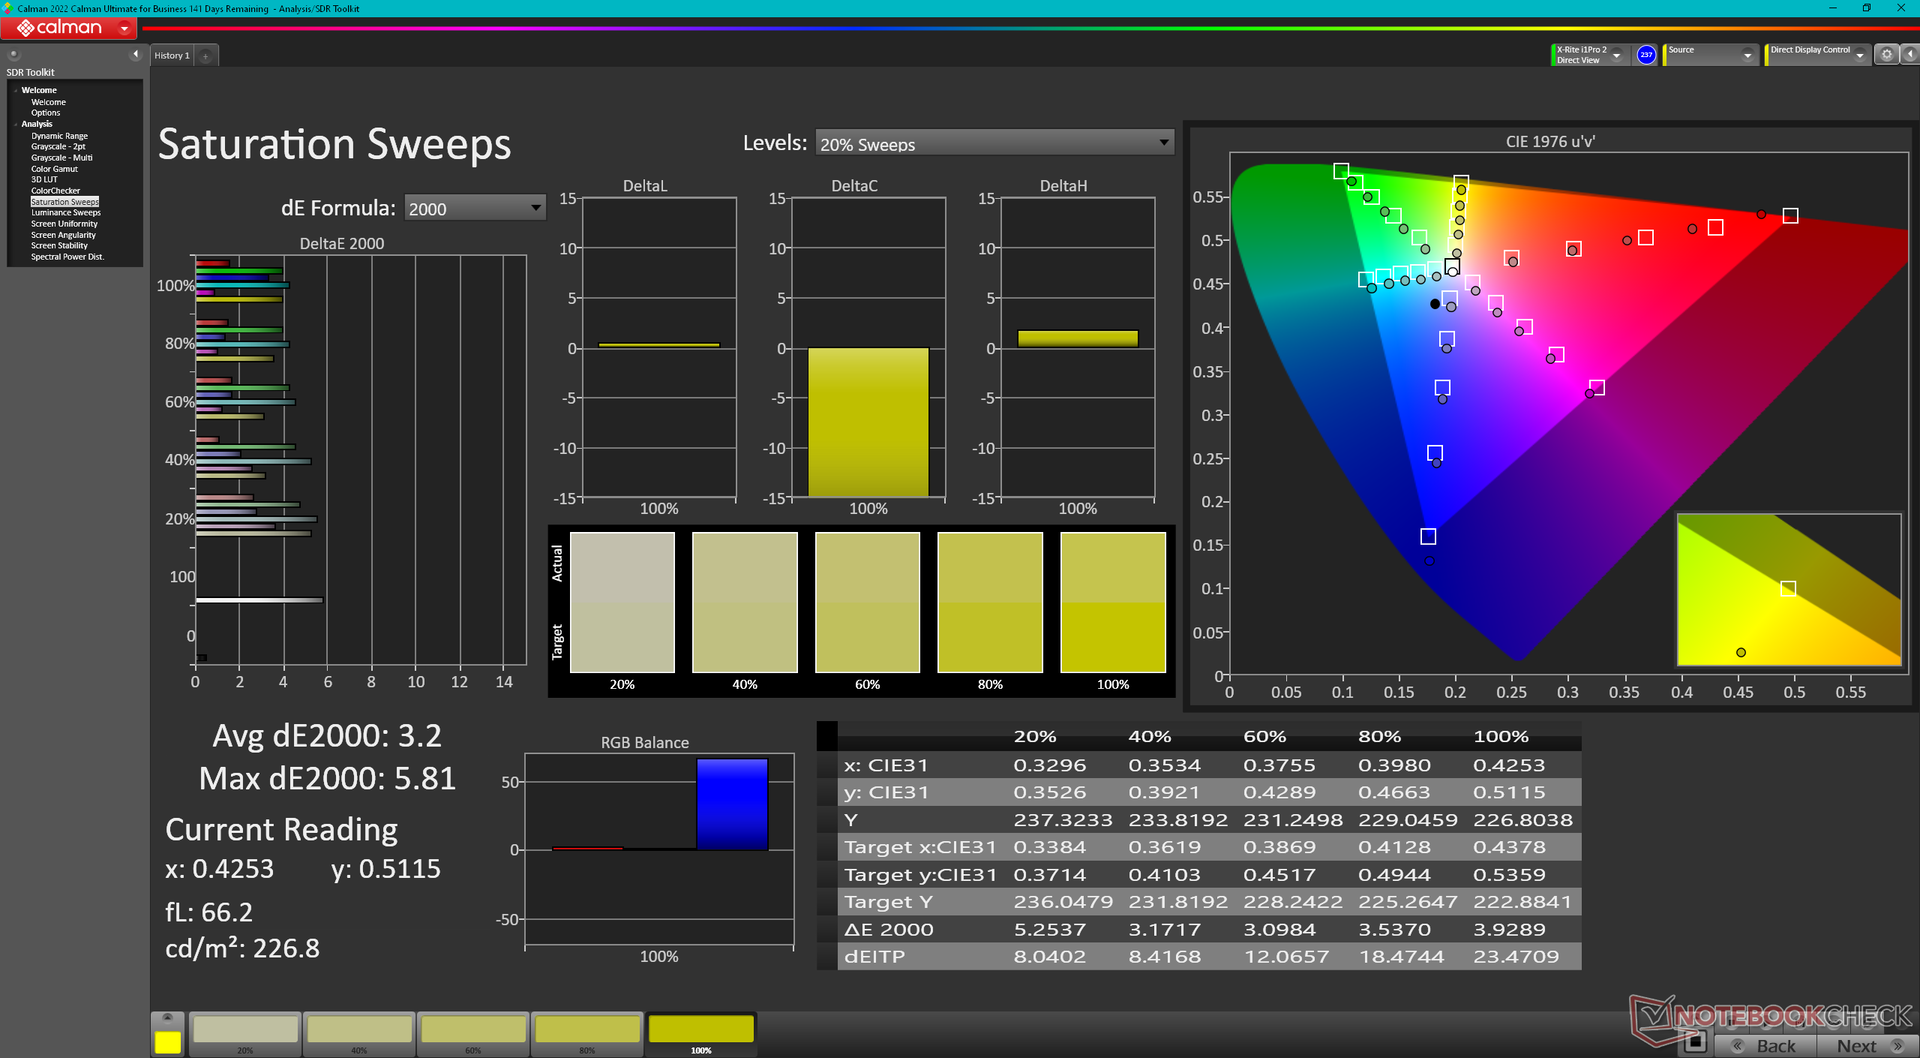
Dell używa dokładnie tego samego 17,0-calowego panelu dotykowego Sharp LQ170R1 IPS w swojej serii XPS 17 od oryginalnego modelu z 2020 roku. W związku z tym wrażenia wizualne pozostają identyczne od tamtej pory i zalecamy zapoznanie się z naszymi istniejącymi recenzjami na temat 9720, 9710lub 9700 aby dowiedzieć się więcej na temat wyświetlacza. Chociaż szerokie kolory DCI-P3, dobra maksymalna jasność, ostra rozdzielczość UHD + i dobry współczynnik kontrastu 1500: 1 są nadal świetne do dziś, częstotliwość odświeżania 60 Hz zaczyna pokazywać swój wiek, ponieważ panele 90 Hz lub szybsze stają się powszechne w innych laptopach multimedialnych, takich jak Asus ZenBook 14 lub Lenovo Slim 7i.

| |||||||||||||||||||||||||
rozświetlenie: 85 %
na akumulatorze: 457.4 cd/m²
kontrast: 1475:1 (czerń: 0.31 cd/m²)
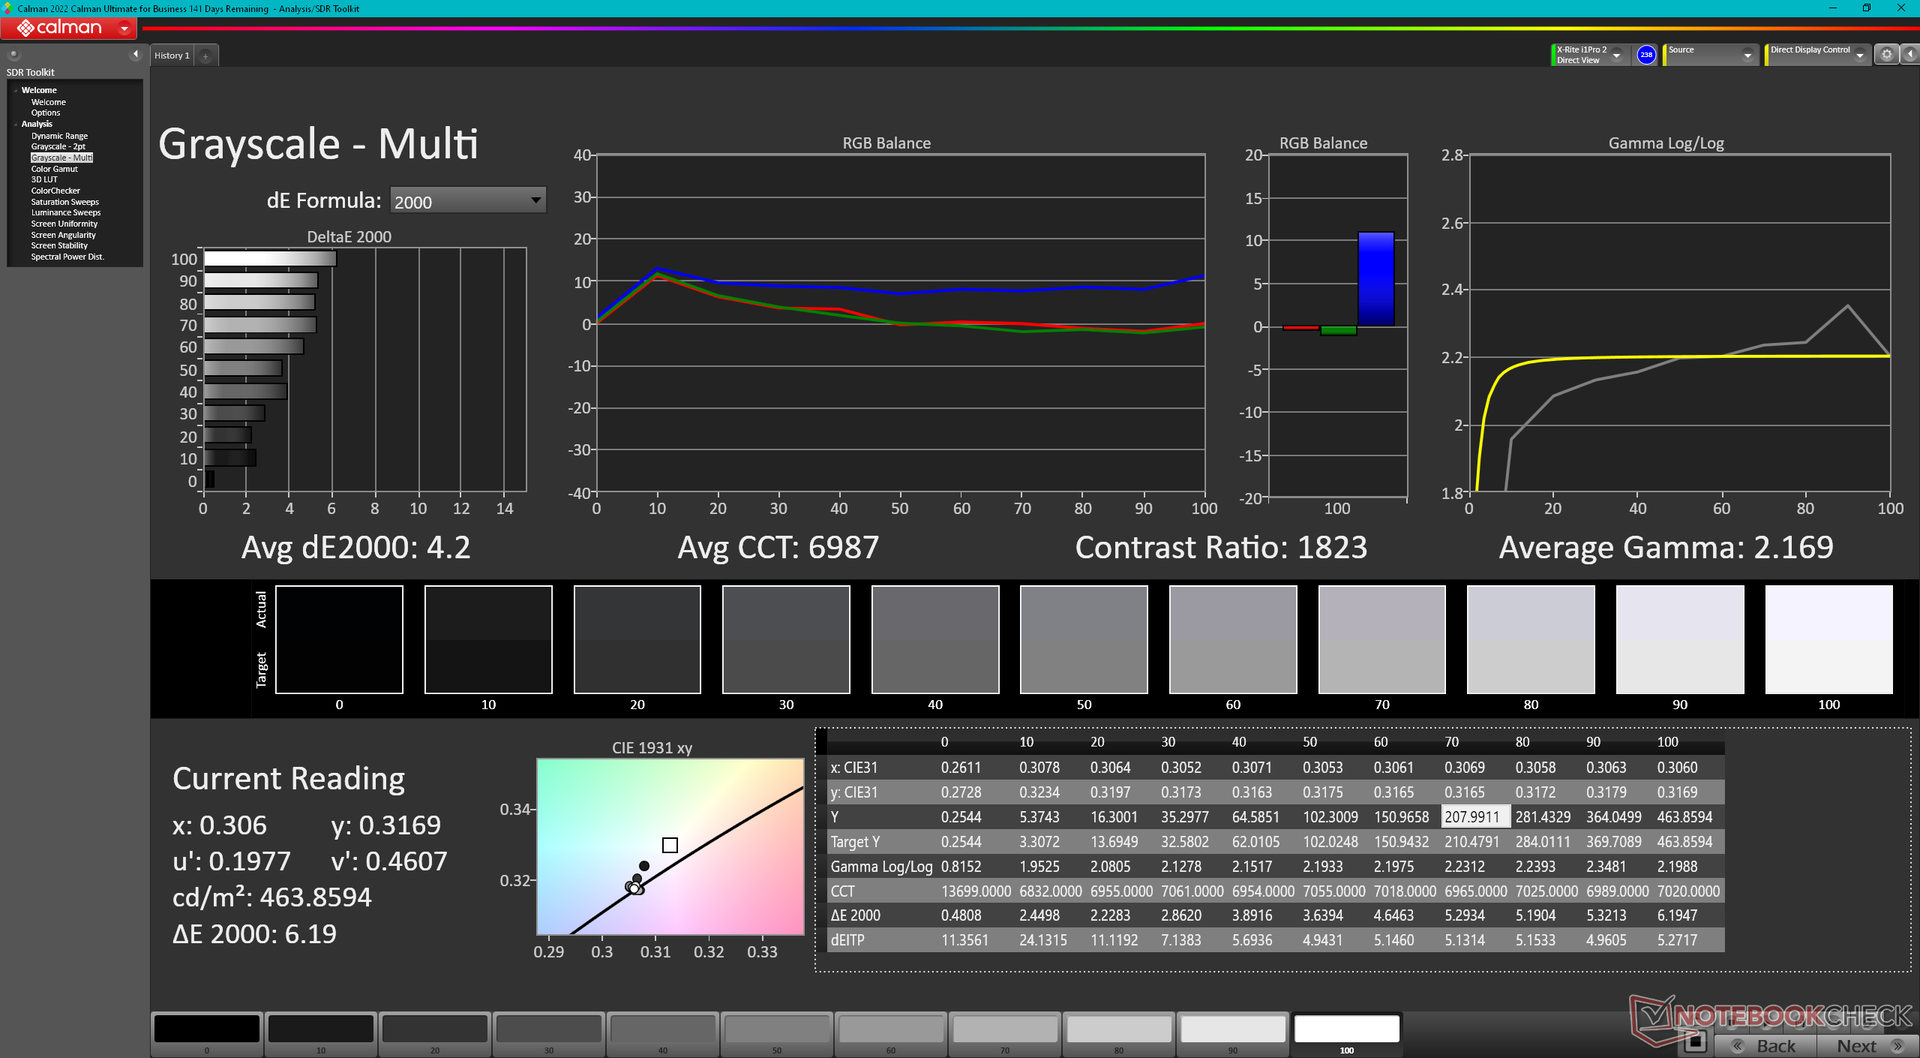
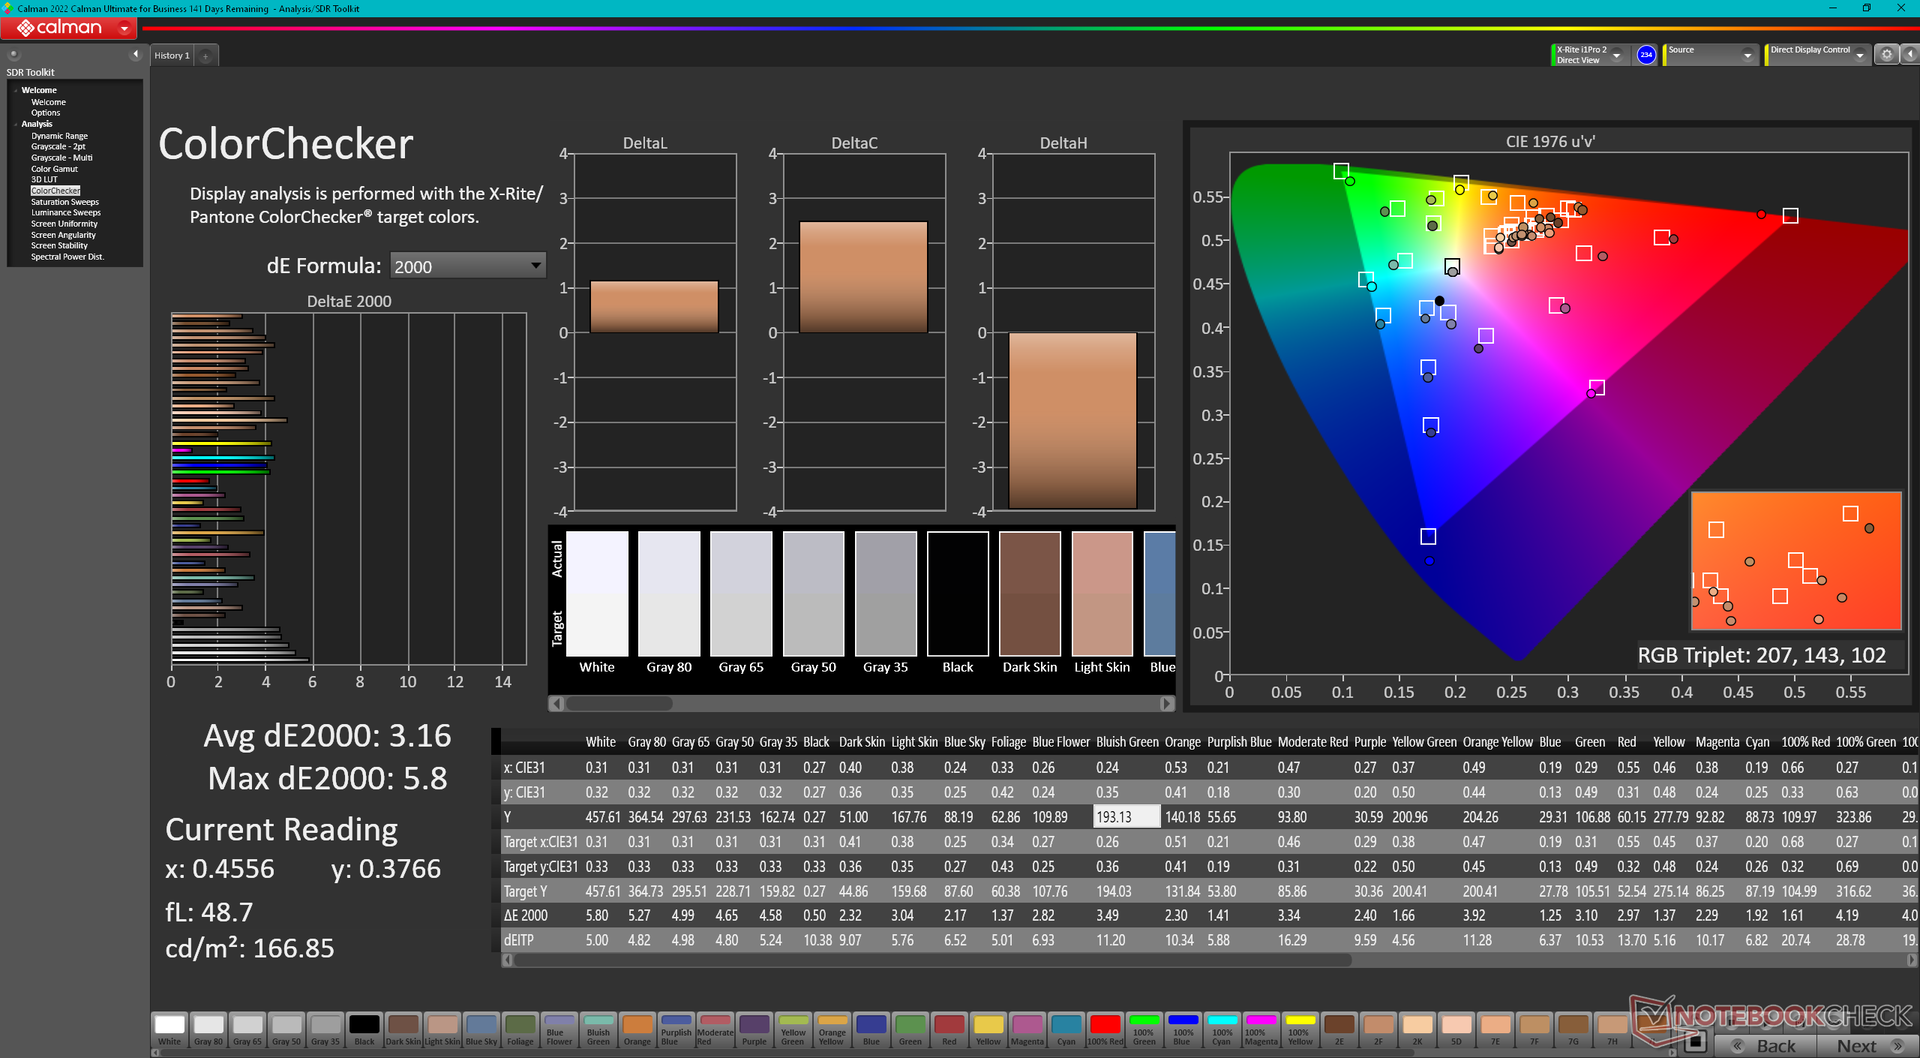
ΔE ColorChecker Calman: 3.16 | ∀{0.5-29.43 Ø4.73}
ΔE Greyscale Calman: 4.2 | ∀{0.09-98 Ø4.97}
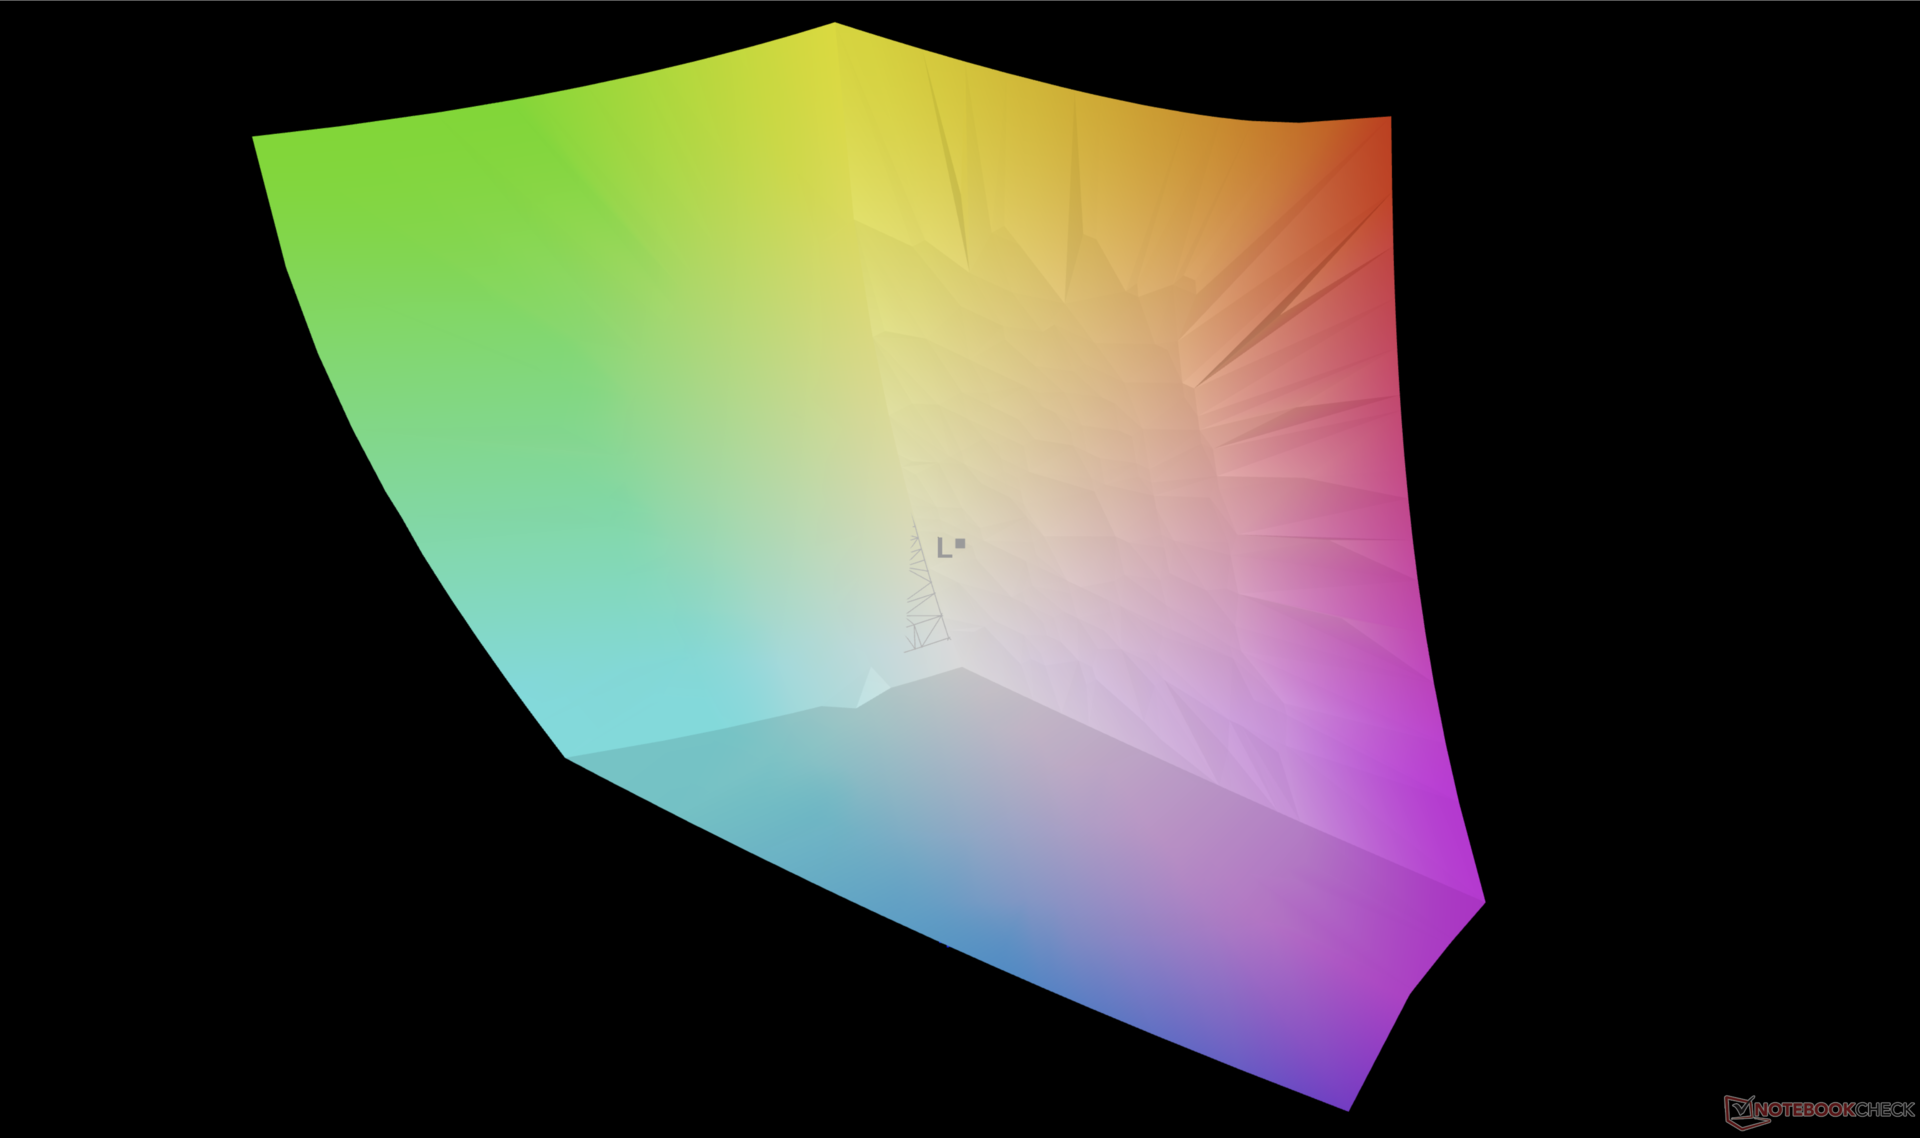
100% AdobeRGB 1998 (Argyll 3D)
100% sRGB (Argyll 3D)
95.2% Display P3 (Argyll 3D)
Gamma: 2.17
CCT: 6987 K
| Dell XPS 17 9730 RTX 4070 10-point capacitive, Sharp LQ170R1, 3840x2400, 17" | Dell XPS 17 9720 RTX 3060 Sharp LQ170R1, IPS, 3840x2400, 17" | LG Gram 17 (2023) LG Display LP170WQ1-SPF2, IPS, 2560x1600, 17" | HP Envy 17-cr0079ng BOE0A66, IPS, 3840x2160, 17.3" | MSI Creator Z17 A12UGST-054 AUO3C9B (B170QAN01.0), IPS, 2560x1600, 17" | Apple MacBook Pro 16 2023 M2 Max Mini-LED, 3456x2234, 16.2" | |
|---|---|---|---|---|---|---|
| Display | -6% | -4% | -3% | -3% | -2% | |
| Display P3 Coverage (%) | 95.2 | 92.9 -2% | 97 2% | 98.31 3% | 98.9 4% | 99 4% |
| sRGB Coverage (%) | 100 | 100 0% | 99.8 0% | 100 0% | 99.9 0% | 100 0% |
| AdobeRGB 1998 Coverage (%) | 100 | 85.3 -15% | 84.9 -15% | 87.03 -13% | 86.4 -14% | 88.5 -11% |
| Response Times | -16% | 80% | 88% | 79% | -70% | |
| Response Time Grey 50% / Grey 80% * (ms) | 42.9 ? | 51.2 ? -19% | 2 ? 95% | 1 98% | 11 ? 74% | 80.5 ? -88% |
| Response Time Black / White * (ms) | 31.3 ? | 35.2 ? -12% | 11 ? 65% | 7 ? 78% | 5 ? 84% | 47.2 ? -51% |
| PWM Frequency (Hz) | 14880 ? | |||||
| Screen | -30% | -6% | 9% | -13% | 4294% | |
| Brightness middle (cd/m²) | 457.4 | 512.7 12% | 405 -11% | 390 -15% | 444 -3% | 504 10% |
| Brightness (cd/m²) | 430 | 463 8% | 363 -16% | 385 -10% | 415 -3% | 487 13% |
| Brightness Distribution (%) | 85 | 85 0% | 82 -4% | 86 1% | 88 4% | 94 11% |
| Black Level * (cd/m²) | 0.31 | 0.32 -3% | 0.225 27% | 0.395 -27% | 0.7 -126% | 0.001 100% |
| Contrast (:1) | 1475 | 1602 9% | 1800 22% | 987 -33% | 634 -57% | 504000 34069% |
| Colorchecker dE 2000 * | 3.16 | 5.98 -89% | 3.35 -6% | 1.66 47% | 2.48 22% | 1.5 53% |
| Colorchecker dE 2000 max. * | 5.8 | 12.09 -108% | 7.96 -37% | 2.9 50% | 3.52 39% | 3.3 43% |
| Greyscale dE 2000 * | 4.2 | 7.2 -71% | 5.28 -26% | 1.83 56% | 3.33 21% | 2.1 50% |
| Gamma | 2.17 101% | 2.54 87% | 2.43 91% | 2.25 98% | 2.33 94% | 2.25 98% |
| CCT | 6987 93% | 6914 94% | 7424 88% | 6727 97% | 6230 104% | 6882 94% |
| Colorchecker dE 2000 calibrated * | 1.34 | 1.16 | 2.91 | |||
| Całkowita średnia (program / ustawienia) | -17% /
-22% | 23% /
7% | 31% /
18% | 21% /
3% | 1407% /
2631% |
* ... im mniej tym lepiej
Wyświetl czasy reakcji
| ↔ Czas reakcji od czerni do bieli | ||
|---|---|---|
| 31.3 ms ... wzrost ↗ i spadek ↘ łącznie | ↗ 16.9 ms wzrost | 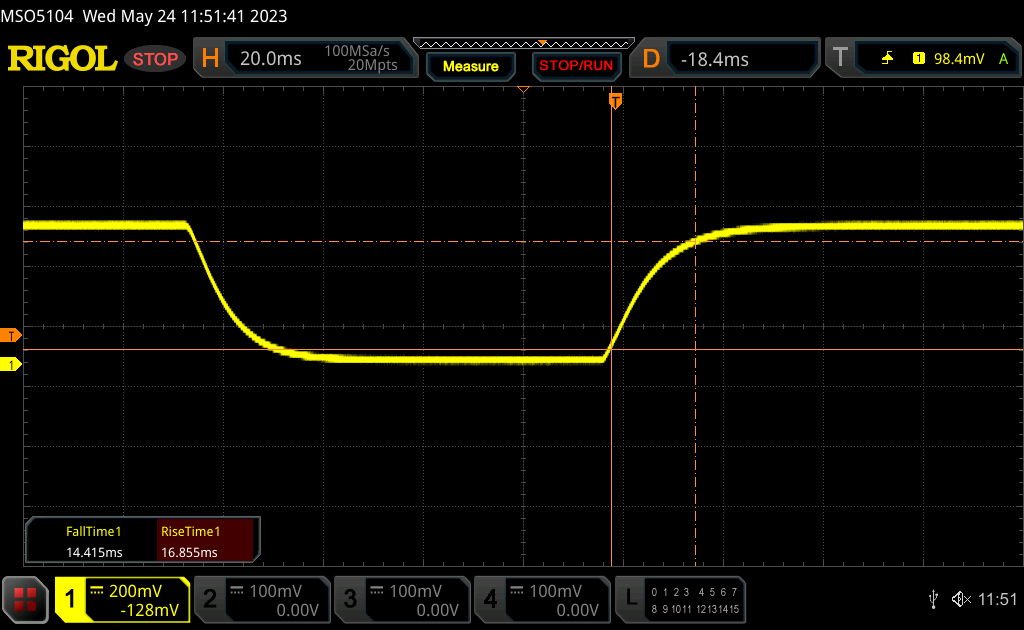 |
| ↘ 14.4 ms upadek | ||
| W naszych testach ekran wykazuje powolne tempo reakcji, co będzie niezadowalające dla graczy. Dla porównania, wszystkie testowane urządzenia wahają się od 0.1 (minimum) do 240 (maksimum) ms. » 85 % wszystkich urządzeń jest lepszych. Oznacza to, że zmierzony czas reakcji jest gorszy od średniej wszystkich testowanych urządzeń (19.9 ms). | ||
| ↔ Czas reakcji 50% szarości do 80% szarości | ||
| 42.9 ms ... wzrost ↗ i spadek ↘ łącznie | ↗ 19.9 ms wzrost | 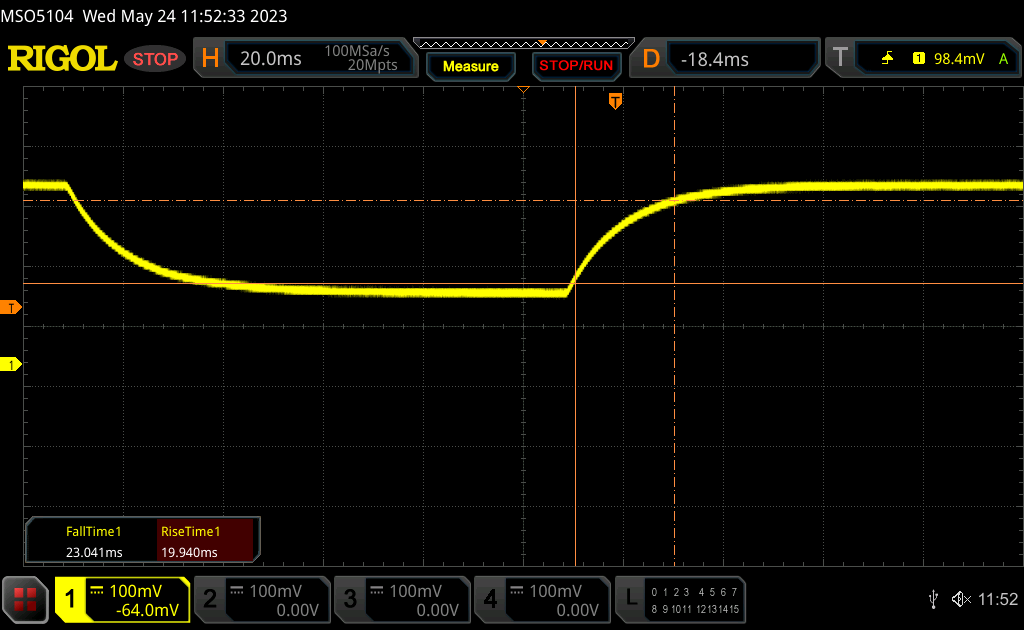 |
| ↘ 23 ms upadek | ||
| W naszych testach ekran wykazuje powolne tempo reakcji, co będzie niezadowalające dla graczy. Dla porównania, wszystkie testowane urządzenia wahają się od 0.165 (minimum) do 636 (maksimum) ms. » 71 % wszystkich urządzeń jest lepszych. Oznacza to, że zmierzony czas reakcji jest gorszy od średniej wszystkich testowanych urządzeń (31.1 ms). | ||
Migotanie ekranu / PWM (modulacja szerokości impulsu)
| Migotanie ekranu/nie wykryto PWM | 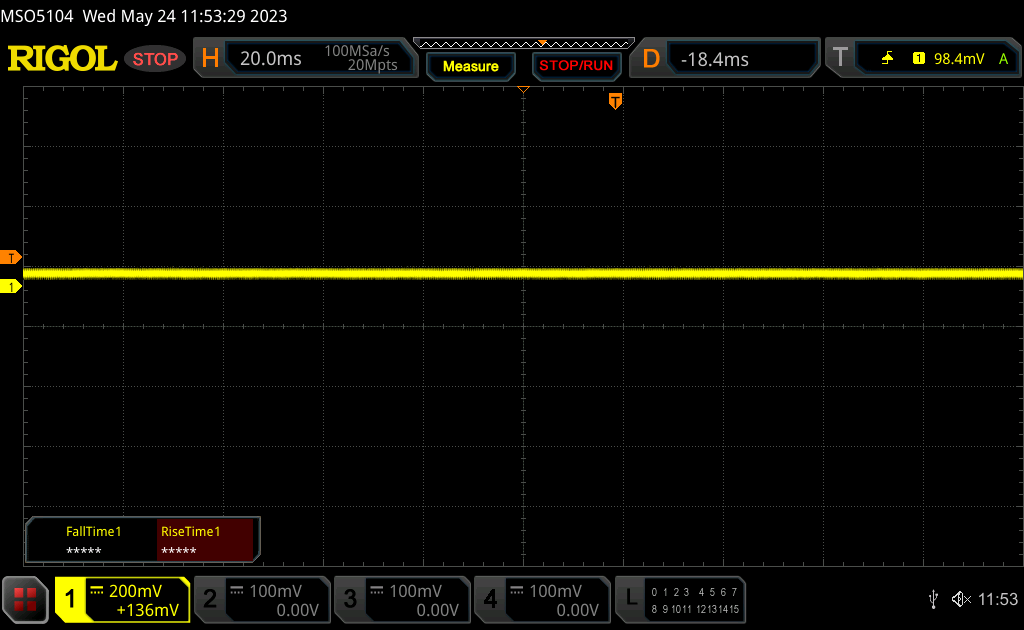 | ||
Dla porównania: 52 % wszystkich testowanych urządzeń nie używa PWM do przyciemniania wyświetlacza. Jeśli wykryto PWM, zmierzono średnio 7798 (minimum: 5 - maksimum: 343500) Hz. | |||
Wydajność - Intel 13. generacji + Nvidia Ada Lovelace
Warunki testowania
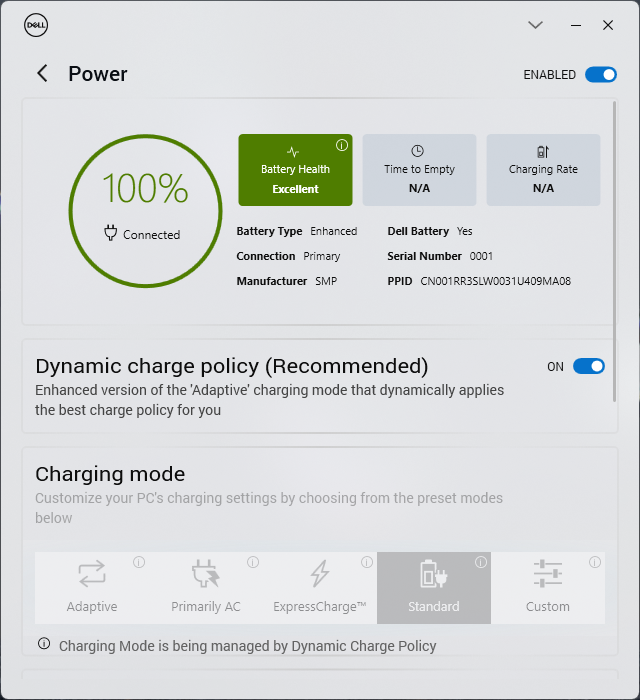
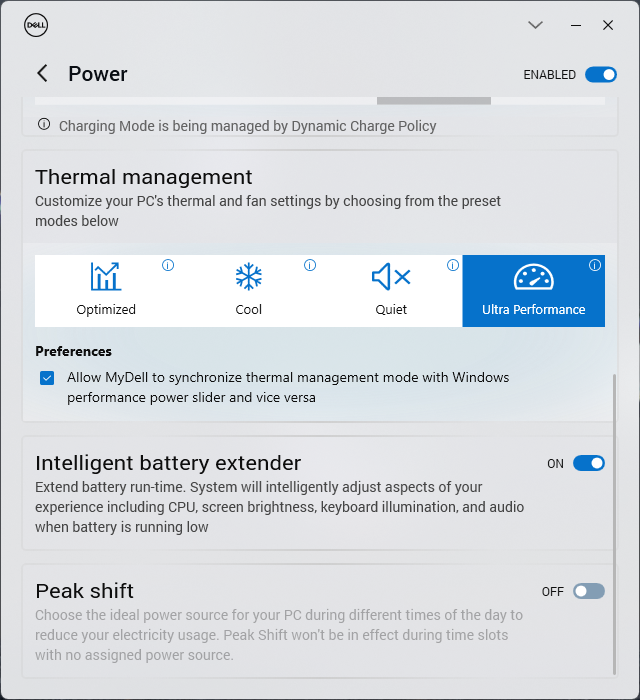
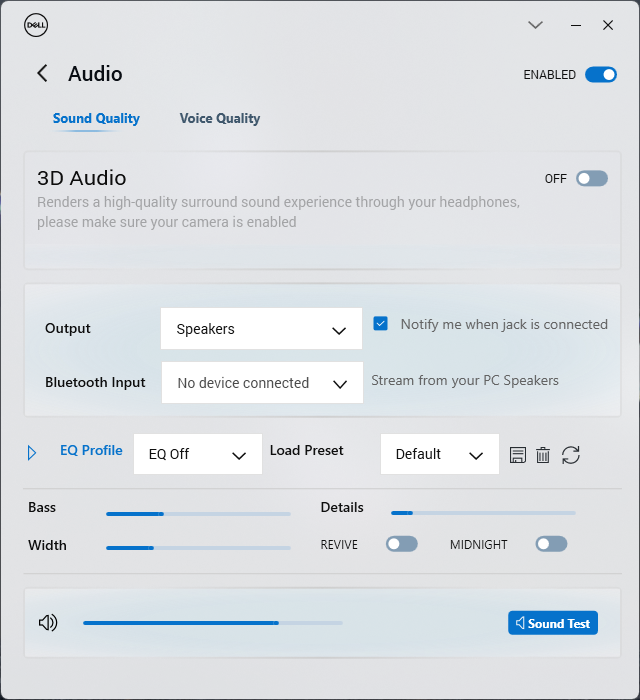
Ustawiliśmy naszą jednostkę w tryb wydajności za pomocą oprogramowania MyDell przed uruchomieniem poniższych testów porównawczych. Ustawienia profilu zasilania Dell są wygodnie zsynchronizowane z ustawieniami profilu zasilania Windows, w przeciwieństwie do większości innych laptopów.
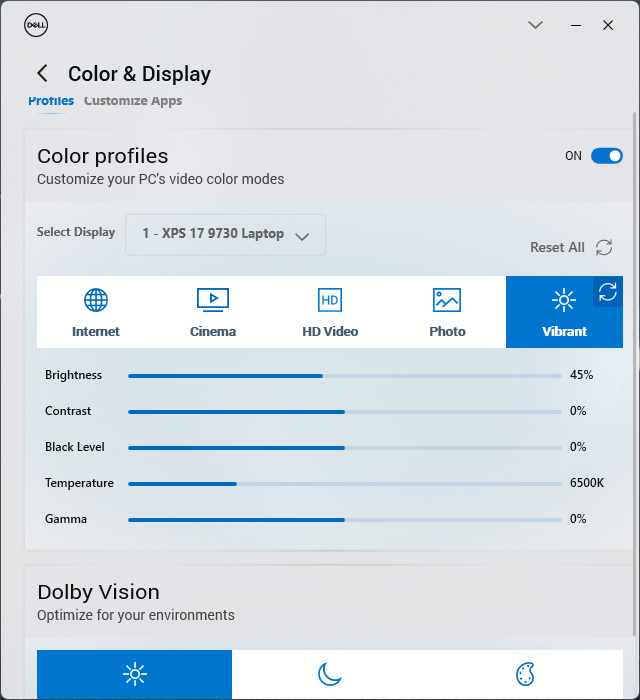
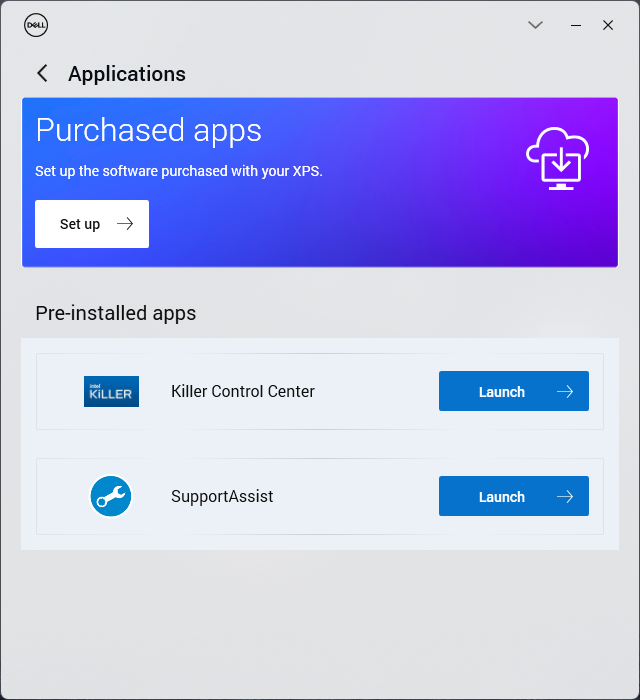
Zaleca się, aby użytkownicy zapoznali się z MyDell, ponieważ jest to centralne centrum regulacji dźwięku, kolorów, zasilania i innych wstępnie zainstalowanych aplikacji Dell, takich jak SupportAssist. Firma Dell ponownie przeprojektowała interfejs użytkownika MyDell, aby był bardziej podobny do oprogramowania Dell Optimizer, które jest dostarczane z wieloma laptopami biznesowymi tego samego producenta. Irytujące jest to, że okno aplikacji jest bardzo małe i nie można go zmaksymalizować.
Optimus jest standardowo wyposażony w funkcję automatycznego przełączania między iGPU i dGPU. Nie ma wsparcia dla Advanced Optimus lub MUX.
Procesor
Procesor Core i7-13700H w XPS 17 osiąga bardzo dobre wyniki w testach porównawczych, które są nieco wyższe niż w przypadku większości innych laptopów w naszej bazie danych wyposażonych w ten sam procesor, w tym niedawnego XPS 15 9530. W szczególności Turbo Boost jest imponujący z 25-procentową przewagą wydajności nad Core i7-12700H w zeszłorocznym XPS 17 9720 model.
Jest jednak pewien istotny haczyk, o którym należy pamiętać. Turbo Boost procesora nie jest nieograniczony, co pokazuje poniższy wykres podczas uruchamiania CineBench R15 xT w pętli. Wydajność spadłaby o około 25 procent po 9 lub 10 uruchomieniach, co jest bardziej strome w porównaniu do większości innych laptopów wyposażonych w procesory z serii H. Biorąc pod uwagę ten throttling, Core i7-13700H w rzeczywistości działałby niemal identycznie jak Core i7-12700H. Tym samym, Core i7-13700H sprawdza się najlepiej, gdy wysoka wydajność jest potrzebna w krótkich seriach, takich jak uruchamianie programów, edycja zdjęć lub kodowanie krótkich filmów. W przeciwnym razie oferuje on tylko niewielkie korzyści w zakresie wydajności w porównaniu z zeszłorocznym Core i7-12700H.
Aktualizacja do Core i9-13900H zwiększy wydajność wielowątkową o około 10 do 20 procent, bazując na naszych doświadczeniach z laptopemMSI Stealth 17 Studio. Wydajność jednowątkowa pozostanie jednak mniej więcej taka sama, jeśli nie nieco wolniejsza w przypadku Core i9.
Cinebench R15 Multi Loop
Cinebench R23: Multi Core | Single Core
Cinebench R20: CPU (Multi Core) | CPU (Single Core)
Cinebench R15: CPU Multi 64Bit | CPU Single 64Bit
Blender: v2.79 BMW27 CPU
7-Zip 18.03: 7z b 4 | 7z b 4 -mmt1
Geekbench 5.5: Multi-Core | Single-Core
HWBOT x265 Benchmark v2.2: 4k Preset
LibreOffice : 20 Documents To PDF
R Benchmark 2.5: Overall mean
| HWBOT x265 Benchmark v2.2 / 4k Preset | |
| Asus ROG Strix G17 G713PI | |
| Aorus 17X AZF | |
| Lenovo Legion Pro 5 16ARX8 | |
| MSI Stealth 17 Studio A13VH-014 | |
| Medion Erazer Defender P40 | |
| Dell XPS 17 9730 RTX 4070 | |
| Lenovo Legion 5 Pro 16ARH7H RTX 3070 Ti | |
| MSI Creator Z17 A12UGST-054 | |
| Dell XPS 15 9530 RTX 4070 | |
| Alienware m17 R5 (R9 6900HX, RX 6850M XT) | |
| Przeciętny Intel Core i7-13700H (6.72 - 21.2, n=29) | |
| Dell XPS 17 9720 RTX 3060 | |
| Dell XPS 17 9710 Core i7 RTX 3060 | |
| Dell XPS 17 9700 Core i7 RTX 2060 Max-Q | |
| LG Gram 17 (2023) | |
| HP Envy 17-cr0079ng | |
| LibreOffice / 20 Documents To PDF | |
| Alienware m17 R5 (R9 6900HX, RX 6850M XT) | |
| Lenovo Legion 5 Pro 16ARH7H RTX 3070 Ti | |
| MSI Stealth 17 Studio A13VH-014 | |
| Medion Erazer Defender P40 | |
| Przeciętny Intel Core i7-13700H (31.3 - 62.4, n=29) | |
| HP Envy 17-cr0079ng | |
| Dell XPS 17 9700 Core i7 RTX 2060 Max-Q | |
| LG Gram 17 (2023) | |
| Asus ROG Strix G17 G713PI | |
| Dell XPS 17 9730 RTX 4070 | |
| Dell XPS 17 9710 Core i7 RTX 3060 | |
| Aorus 17X AZF | |
| Dell XPS 15 9530 RTX 4070 | |
| Dell XPS 17 9720 RTX 3060 | |
| MSI Creator Z17 A12UGST-054 | |
| Lenovo Legion Pro 5 16ARX8 | |
Cinebench R23: Multi Core | Single Core
Cinebench R20: CPU (Multi Core) | CPU (Single Core)
Cinebench R15: CPU Multi 64Bit | CPU Single 64Bit
Blender: v2.79 BMW27 CPU
7-Zip 18.03: 7z b 4 | 7z b 4 -mmt1
Geekbench 5.5: Multi-Core | Single-Core
HWBOT x265 Benchmark v2.2: 4k Preset
LibreOffice : 20 Documents To PDF
R Benchmark 2.5: Overall mean
* ... im mniej tym lepiej
AIDA64: FP32 Ray-Trace | FPU Julia | CPU SHA3 | CPU Queen | FPU SinJulia | FPU Mandel | CPU AES | CPU ZLib | FP64 Ray-Trace | CPU PhotoWorxx
| Performance rating | |
| Dell XPS 17 9730 RTX 4070 | |
| Przeciętny Intel Core i7-13700H | |
| MSI Creator Z17 A12UGST-054 | |
| Dell XPS 17 9720 RTX 3060 | |
| LG Gram 17 (2023) | |
| HP Envy 17-cr0079ng | |
| AIDA64 / FP32 Ray-Trace | |
| Dell XPS 17 9730 RTX 4070 | |
| Przeciętny Intel Core i7-13700H (4986 - 18908, n=29) | |
| LG Gram 17 (2023) | |
| MSI Creator Z17 A12UGST-054 | |
| HP Envy 17-cr0079ng | |
| Dell XPS 17 9720 RTX 3060 | |
| AIDA64 / FPU Julia | |
| Dell XPS 17 9730 RTX 4070 | |
| Przeciętny Intel Core i7-13700H (25360 - 92359, n=29) | |
| HP Envy 17-cr0079ng | |
| LG Gram 17 (2023) | |
| MSI Creator Z17 A12UGST-054 | |
| Dell XPS 17 9720 RTX 3060 | |
| AIDA64 / CPU SHA3 | |
| Dell XPS 17 9730 RTX 4070 | |
| Przeciętny Intel Core i7-13700H (1339 - 4224, n=29) | |
| MSI Creator Z17 A12UGST-054 | |
| Dell XPS 17 9720 RTX 3060 | |
| HP Envy 17-cr0079ng | |
| LG Gram 17 (2023) | |
| AIDA64 / CPU Queen | |
| MSI Creator Z17 A12UGST-054 | |
| Dell XPS 17 9720 RTX 3060 | |
| Dell XPS 17 9730 RTX 4070 | |
| Przeciętny Intel Core i7-13700H (59324 - 107159, n=29) | |
| LG Gram 17 (2023) | |
| HP Envy 17-cr0079ng | |
| AIDA64 / FPU SinJulia | |
| Dell XPS 17 9730 RTX 4070 | |
| MSI Creator Z17 A12UGST-054 | |
| Dell XPS 17 9720 RTX 3060 | |
| Przeciętny Intel Core i7-13700H (4800 - 11050, n=29) | |
| LG Gram 17 (2023) | |
| HP Envy 17-cr0079ng | |
| AIDA64 / FPU Mandel | |
| Dell XPS 17 9730 RTX 4070 | |
| Przeciętny Intel Core i7-13700H (12321 - 45118, n=29) | |
| MSI Creator Z17 A12UGST-054 | |
| LG Gram 17 (2023) | |
| Dell XPS 17 9720 RTX 3060 | |
| HP Envy 17-cr0079ng | |
| AIDA64 / CPU AES | |
| MSI Creator Z17 A12UGST-054 | |
| Dell XPS 17 9720 RTX 3060 | |
| Przeciętny Intel Core i7-13700H (28769 - 151254, n=29) | |
| Dell XPS 17 9730 RTX 4070 | |
| LG Gram 17 (2023) | |
| HP Envy 17-cr0079ng | |
| AIDA64 / CPU ZLib | |
| Dell XPS 17 9730 RTX 4070 | |
| MSI Creator Z17 A12UGST-054 | |
| Przeciętny Intel Core i7-13700H (389 - 1215, n=29) | |
| Dell XPS 17 9720 RTX 3060 | |
| HP Envy 17-cr0079ng | |
| LG Gram 17 (2023) | |
| AIDA64 / FP64 Ray-Trace | |
| Dell XPS 17 9730 RTX 4070 | |
| Przeciętny Intel Core i7-13700H (2540 - 10135, n=29) | |
| LG Gram 17 (2023) | |
| MSI Creator Z17 A12UGST-054 | |
| Dell XPS 17 9720 RTX 3060 | |
| HP Envy 17-cr0079ng | |
| AIDA64 / CPU PhotoWorxx | |
| LG Gram 17 (2023) | |
| Dell XPS 17 9730 RTX 4070 | |
| Dell XPS 17 9720 RTX 3060 | |
| Przeciętny Intel Core i7-13700H (12872 - 52727, n=29) | |
| MSI Creator Z17 A12UGST-054 | |
| HP Envy 17-cr0079ng | |
Wydajność systemu
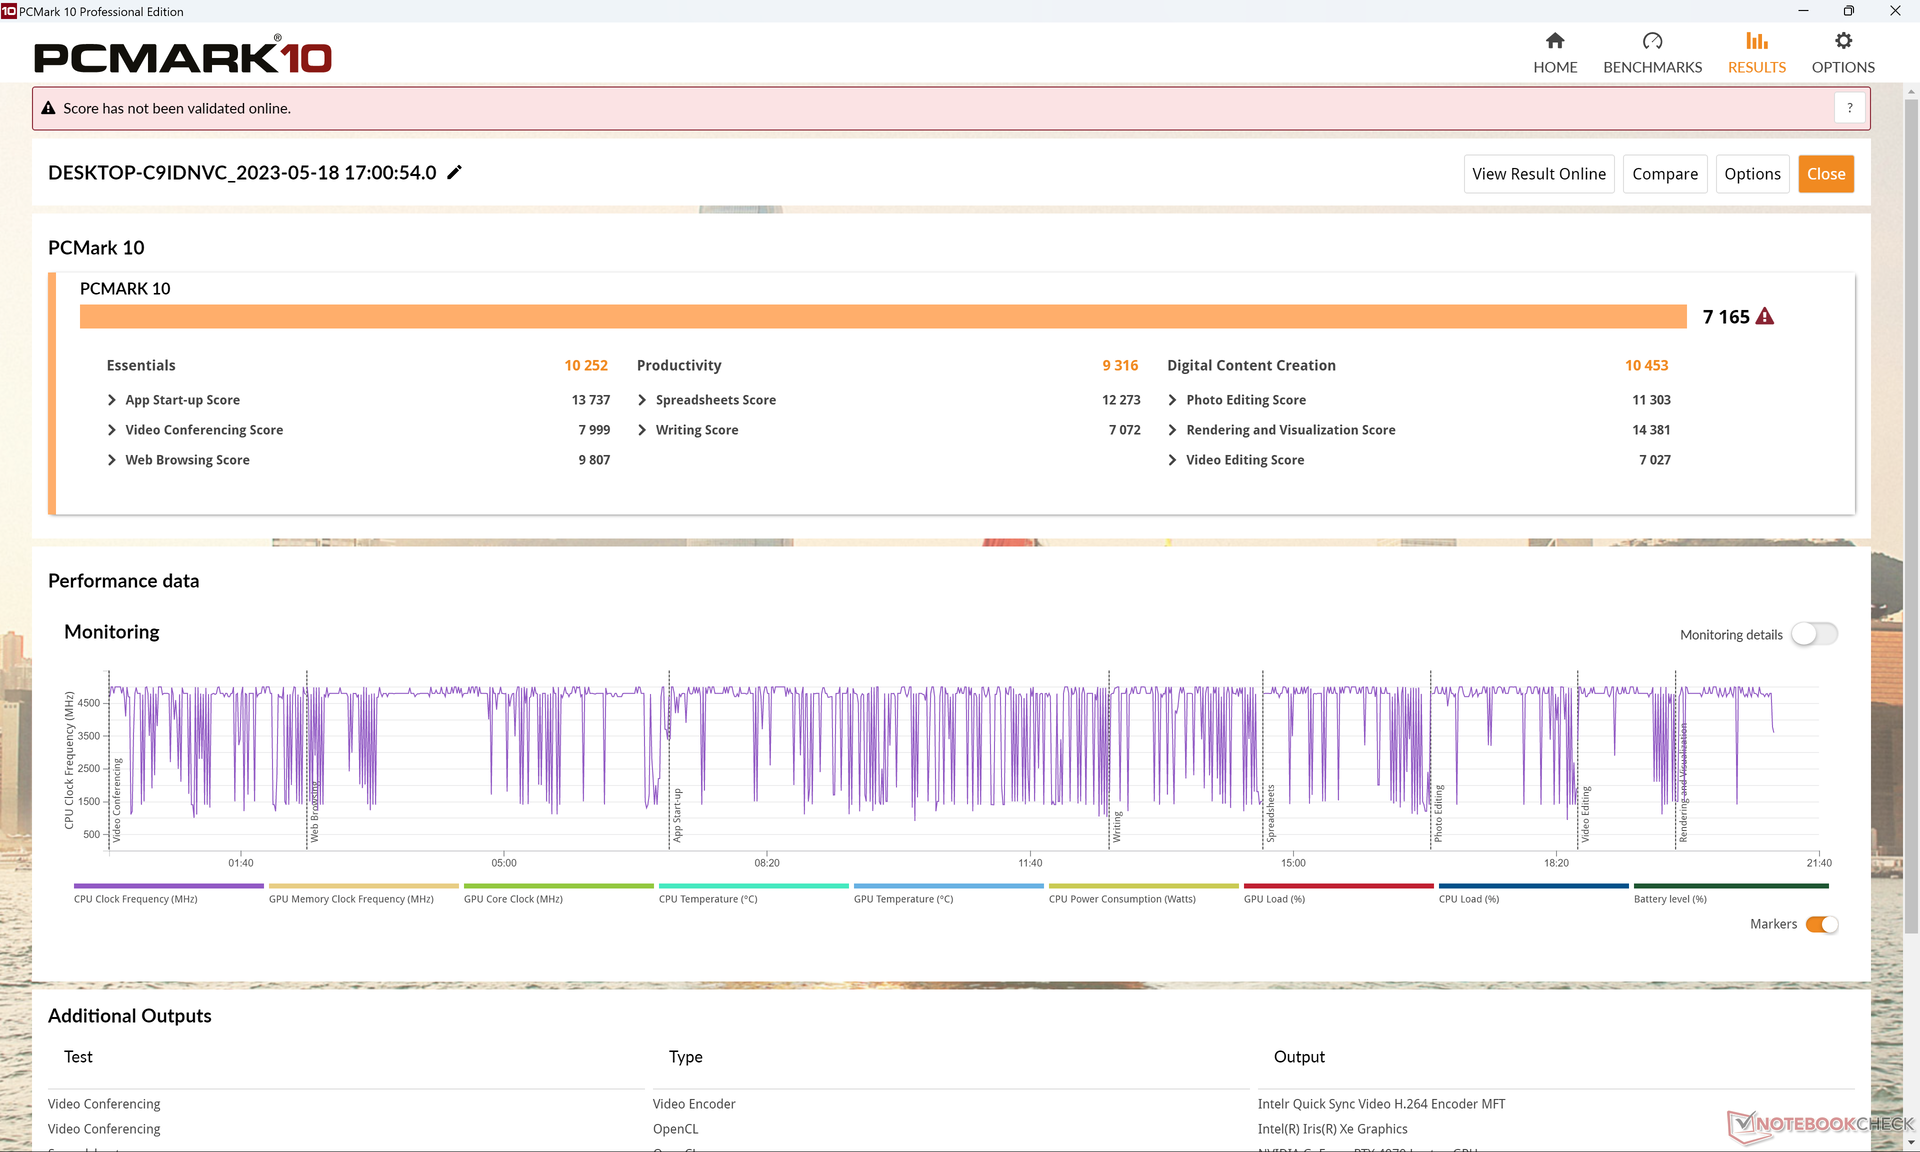
Wyniki PCMark są niemal identyczne jak w przypadku zeszłorocznego XPS 17 9720, pomimo poprawy wydajności z roku na rok. Sugeruje to, że codzienne obciążenia i lekkie czynności biurowe nie są zauważalnie szybsze na najnowszym modelu. Jeśli twoje obciążenia obejmują głównie przeglądanie stron internetowych, arkusze kalkulacyjne i przetwarzanie tekstu, to mniejsza konfiguracja XPS 17 z RTX 4050 może być bardziej odpowiednia niż nasza konfiguracja RTX 4070.
CrossMark: Overall | Productivity | Creativity | Responsiveness
| PCMark 10 / Score | |
| Przeciętny Intel Core i7-13700H, NVIDIA GeForce RTX 4070 Laptop GPU (7158 - 7956, n=8) | |
| Dell XPS 17 9720 RTX 3060 | |
| Dell XPS 17 9730 RTX 4070 | |
| MSI Creator Z17 A12UGST-054 | |
| HP Envy 17-cr0079ng | |
| LG Gram 17 (2023) | |
| PCMark 10 / Essentials | |
| LG Gram 17 (2023) | |
| Dell XPS 17 9720 RTX 3060 | |
| Przeciętny Intel Core i7-13700H, NVIDIA GeForce RTX 4070 Laptop GPU (10252 - 11449, n=8) | |
| HP Envy 17-cr0079ng | |
| MSI Creator Z17 A12UGST-054 | |
| Dell XPS 17 9730 RTX 4070 | |
| PCMark 10 / Productivity | |
| Przeciętny Intel Core i7-13700H, NVIDIA GeForce RTX 4070 Laptop GPU (8501 - 10769, n=8) | |
| MSI Creator Z17 A12UGST-054 | |
| Dell XPS 17 9720 RTX 3060 | |
| Dell XPS 17 9730 RTX 4070 | |
| HP Envy 17-cr0079ng | |
| LG Gram 17 (2023) | |
| PCMark 10 / Digital Content Creation | |
| Przeciętny Intel Core i7-13700H, NVIDIA GeForce RTX 4070 Laptop GPU (10358 - 12908, n=8) | |
| Dell XPS 17 9730 RTX 4070 | |
| Dell XPS 17 9720 RTX 3060 | |
| MSI Creator Z17 A12UGST-054 | |
| HP Envy 17-cr0079ng | |
| LG Gram 17 (2023) | |
| CrossMark / Overall | |
| MSI Creator Z17 A12UGST-054 | |
| Apple MacBook Pro 16 2023 M2 Max | |
| Przeciętny Intel Core i7-13700H, NVIDIA GeForce RTX 4070 Laptop GPU (1768 - 2073, n=6) | |
| Dell XPS 17 9720 RTX 3060 | |
| Dell XPS 17 9730 RTX 4070 | |
| LG Gram 17 (2023) | |
| HP Envy 17-cr0079ng | |
| CrossMark / Productivity | |
| MSI Creator Z17 A12UGST-054 | |
| Przeciętny Intel Core i7-13700H, NVIDIA GeForce RTX 4070 Laptop GPU (1645 - 2006, n=6) | |
| Dell XPS 17 9720 RTX 3060 | |
| Dell XPS 17 9730 RTX 4070 | |
| Apple MacBook Pro 16 2023 M2 Max | |
| LG Gram 17 (2023) | |
| HP Envy 17-cr0079ng | |
| CrossMark / Creativity | |
| Apple MacBook Pro 16 2023 M2 Max | |
| MSI Creator Z17 A12UGST-054 | |
| Dell XPS 17 9720 RTX 3060 | |
| Przeciętny Intel Core i7-13700H, NVIDIA GeForce RTX 4070 Laptop GPU (1936 - 2137, n=6) | |
| Dell XPS 17 9730 RTX 4070 | |
| LG Gram 17 (2023) | |
| HP Envy 17-cr0079ng | |
| CrossMark / Responsiveness | |
| MSI Creator Z17 A12UGST-054 | |
| Przeciętny Intel Core i7-13700H, NVIDIA GeForce RTX 4070 Laptop GPU (1451 - 2202, n=6) | |
| Dell XPS 17 9720 RTX 3060 | |
| Dell XPS 17 9730 RTX 4070 | |
| LG Gram 17 (2023) | |
| Apple MacBook Pro 16 2023 M2 Max | |
| HP Envy 17-cr0079ng | |
| PCMark 10 Score | 7165 pkt. | |
Pomoc | ||
| AIDA64 / Memory Copy | |
| LG Gram 17 (2023) | |
| Dell XPS 17 9730 RTX 4070 | |
| Dell XPS 17 9720 RTX 3060 | |
| MSI Creator Z17 A12UGST-054 | |
| Przeciętny Intel Core i7-13700H (24334 - 78081, n=29) | |
| HP Envy 17-cr0079ng | |
| AIDA64 / Memory Read | |
| Dell XPS 17 9730 RTX 4070 | |
| Dell XPS 17 9720 RTX 3060 | |
| MSI Creator Z17 A12UGST-054 | |
| Przeciętny Intel Core i7-13700H (23681 - 79656, n=29) | |
| LG Gram 17 (2023) | |
| HP Envy 17-cr0079ng | |
| AIDA64 / Memory Write | |
| LG Gram 17 (2023) | |
| Dell XPS 17 9730 RTX 4070 | |
| Przeciętny Intel Core i7-13700H (22986 - 99898, n=29) | |
| MSI Creator Z17 A12UGST-054 | |
| Dell XPS 17 9720 RTX 3060 | |
| HP Envy 17-cr0079ng | |
| AIDA64 / Memory Latency | |
| LG Gram 17 (2023) | |
| MSI Creator Z17 A12UGST-054 | |
| Dell XPS 17 9730 RTX 4070 | |
| Przeciętny Intel Core i7-13700H (82.4 - 136.8, n=29) | |
| Dell XPS 17 9720 RTX 3060 | |
| HP Envy 17-cr0079ng | |
* ... im mniej tym lepiej
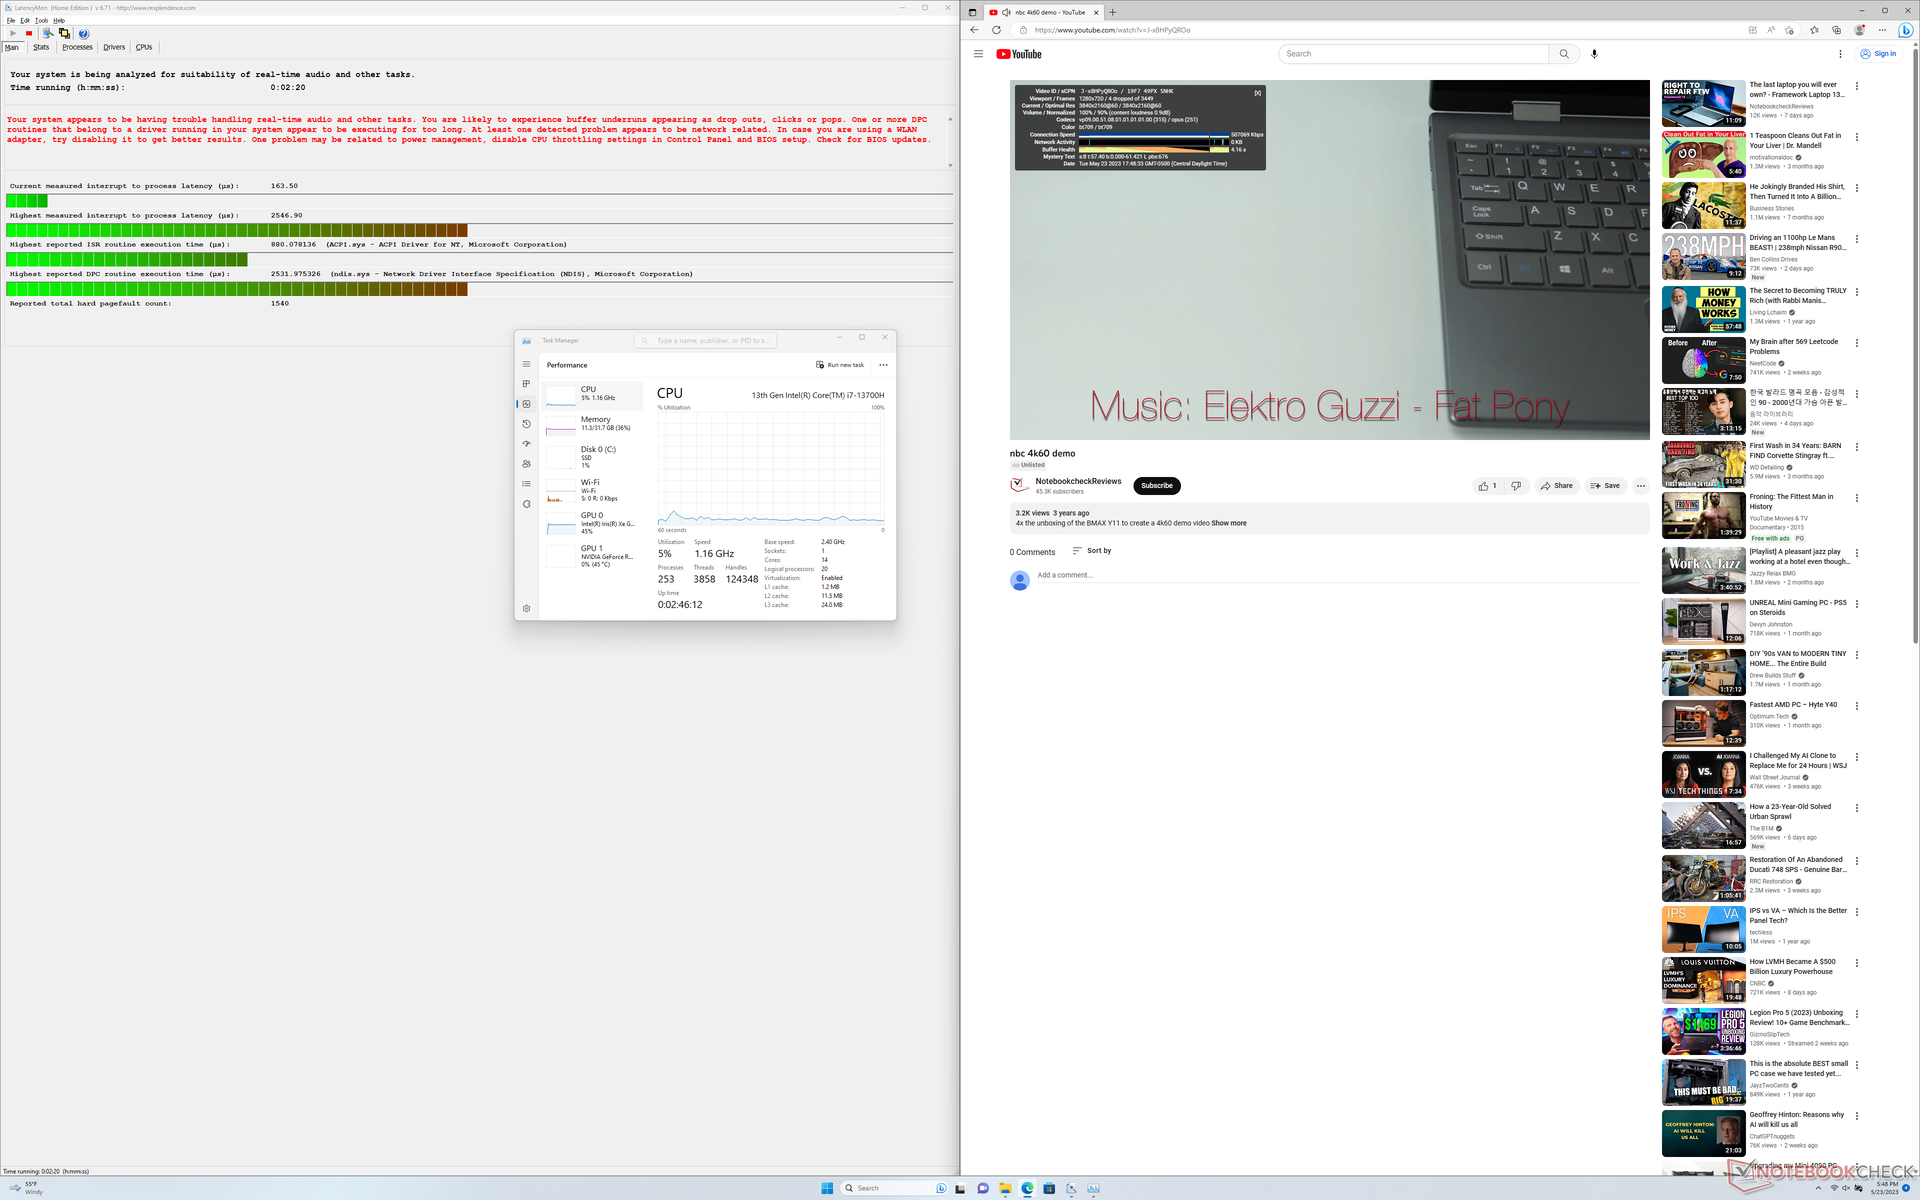
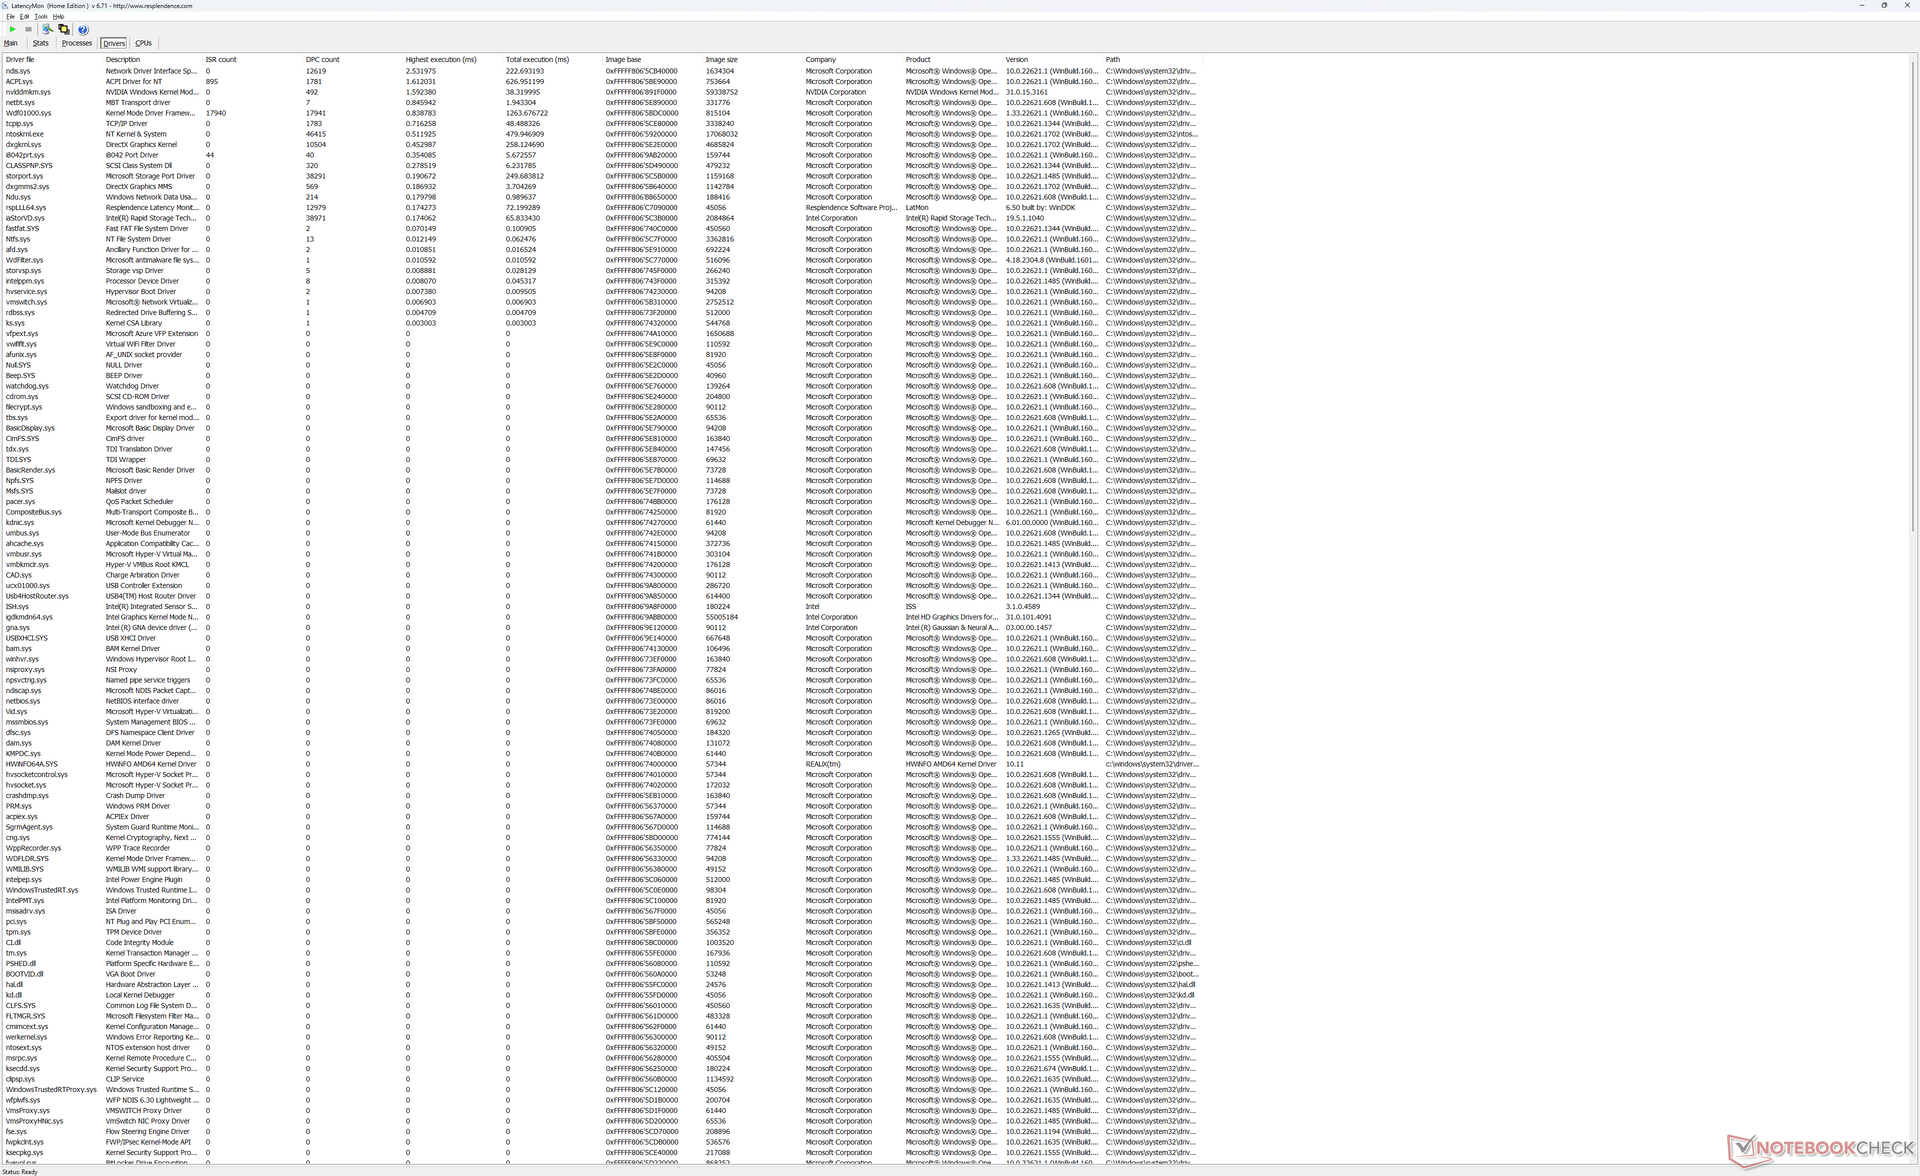
Opóźnienie DPC
LatencyMon ujawnia problemy z DPC podczas otwierania wielu kart przeglądarki na naszej stronie głównej, nawet po wielu próbach. Wyniki są rozczarowujące, biorąc pod uwagę, że nie napotkaliśmy żadnych problemów na najnowszym XPS 15 9530 ani na zeszłorocznym XPS 17 9720.
odtwarzanie wideo 4K przy 60 FPS jest idealne, z wyjątkiem początku, w którym zawsze spadały 4 klatki. Co ciekawe, ten sam problem pojawiał się również na XPS 15 9530.
| DPC Latencies / LatencyMon - interrupt to process latency (max), Web, Youtube, Prime95 | |
| HP Envy 17-cr0079ng | |
| Dell XPS 17 9730 RTX 4070 | |
| LG Gram 17 (2023) | |
| MSI Creator Z17 A12UGST-054 | |
| Dell XPS 15 9530 RTX 4070 | |
| Dell XPS 17 9720 RTX 3060 | |
* ... im mniej tym lepiej
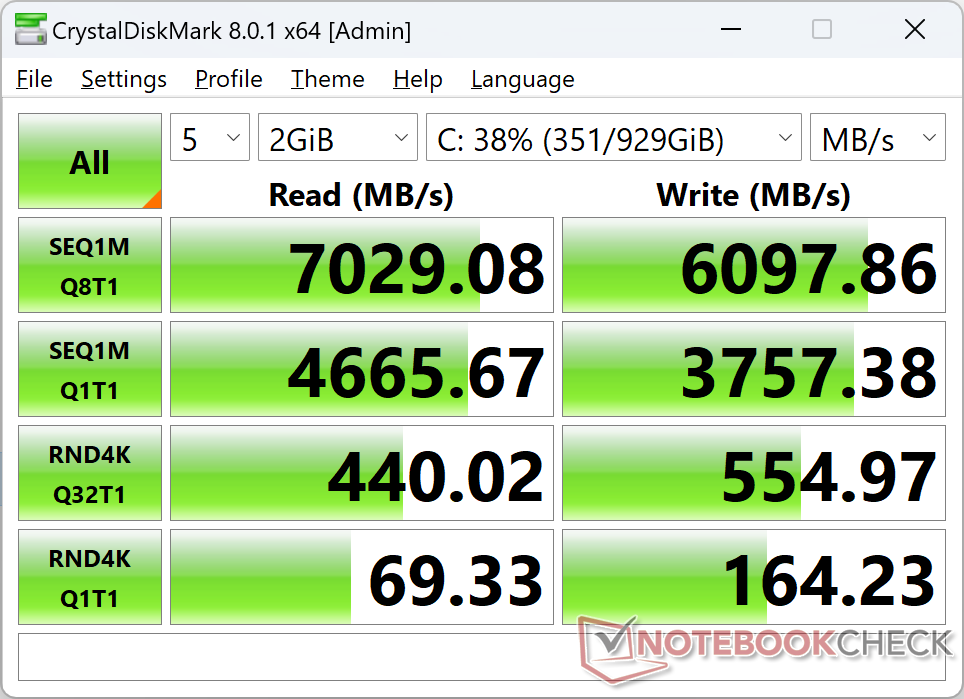
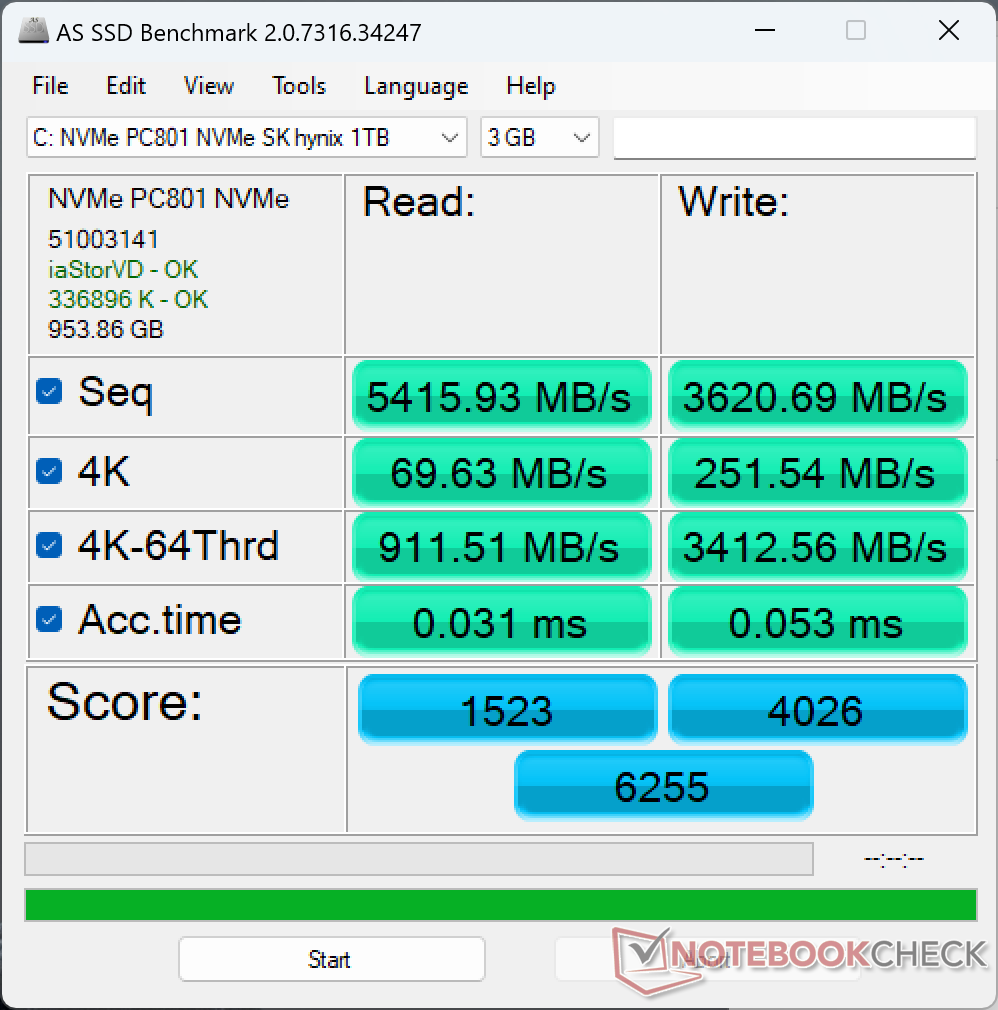
Urządzenia pamięci masowej
Jednostki XPS mogą być dostarczane z dyskami SSD firm Samsung, Micron, Western Digital lub SK Hynix. W naszym konkretnym przypadku, nasza jednostka testowa jest dostarczana z dyskiem SK Hynix PC801 PCIe4 x4 NVMe SSD. Wydajność jest doskonała i porównywalna z Samsung PM9A1, bez spadków szybkości transferu przy obciążeniu.
W razie potrzeby można zainstalować drugi dysk SSD M.2. Każde z dwóch gniazd M.2 jest wyposażone w rozpraszacz ciepła, który pomaga w chłodzeniu dysków.

| Drive Performance rating - Percent | |
| LG Gram 17 (2023) | |
| MSI Creator Z17 A12UGST-054 | |
| Dell XPS 17 9730 RTX 4070 | |
| Dell XPS 17 9720 RTX 3060 | |
| HP Envy 17-cr0079ng | |
* ... im mniej tym lepiej
Disk Throttling: DiskSpd Read Loop, Queue Depth 8
Wydajność GPU - znacznie szybsza niż w XPS 15 9530
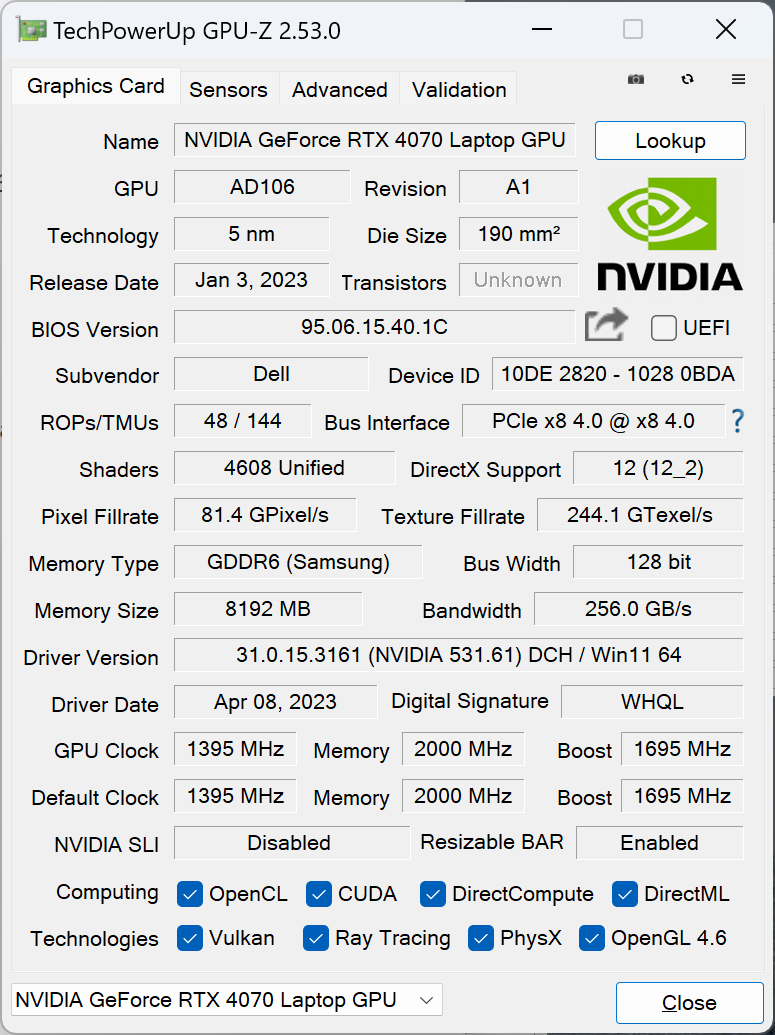
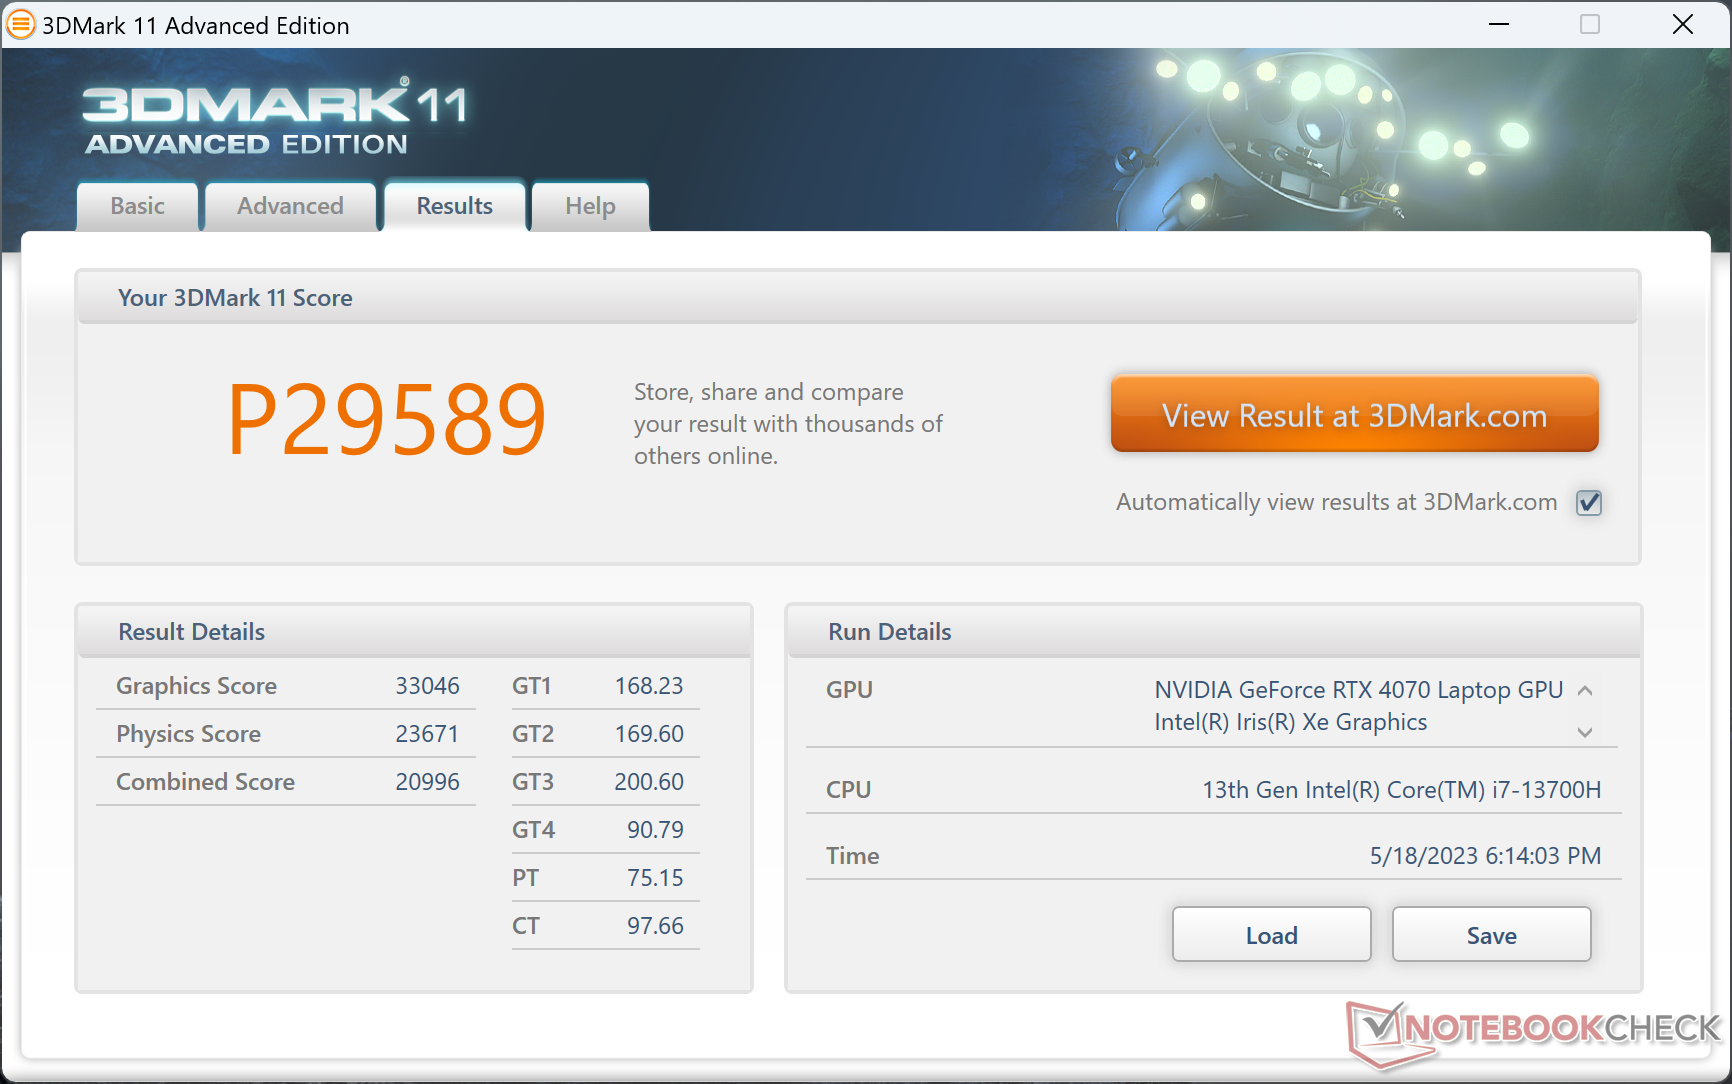
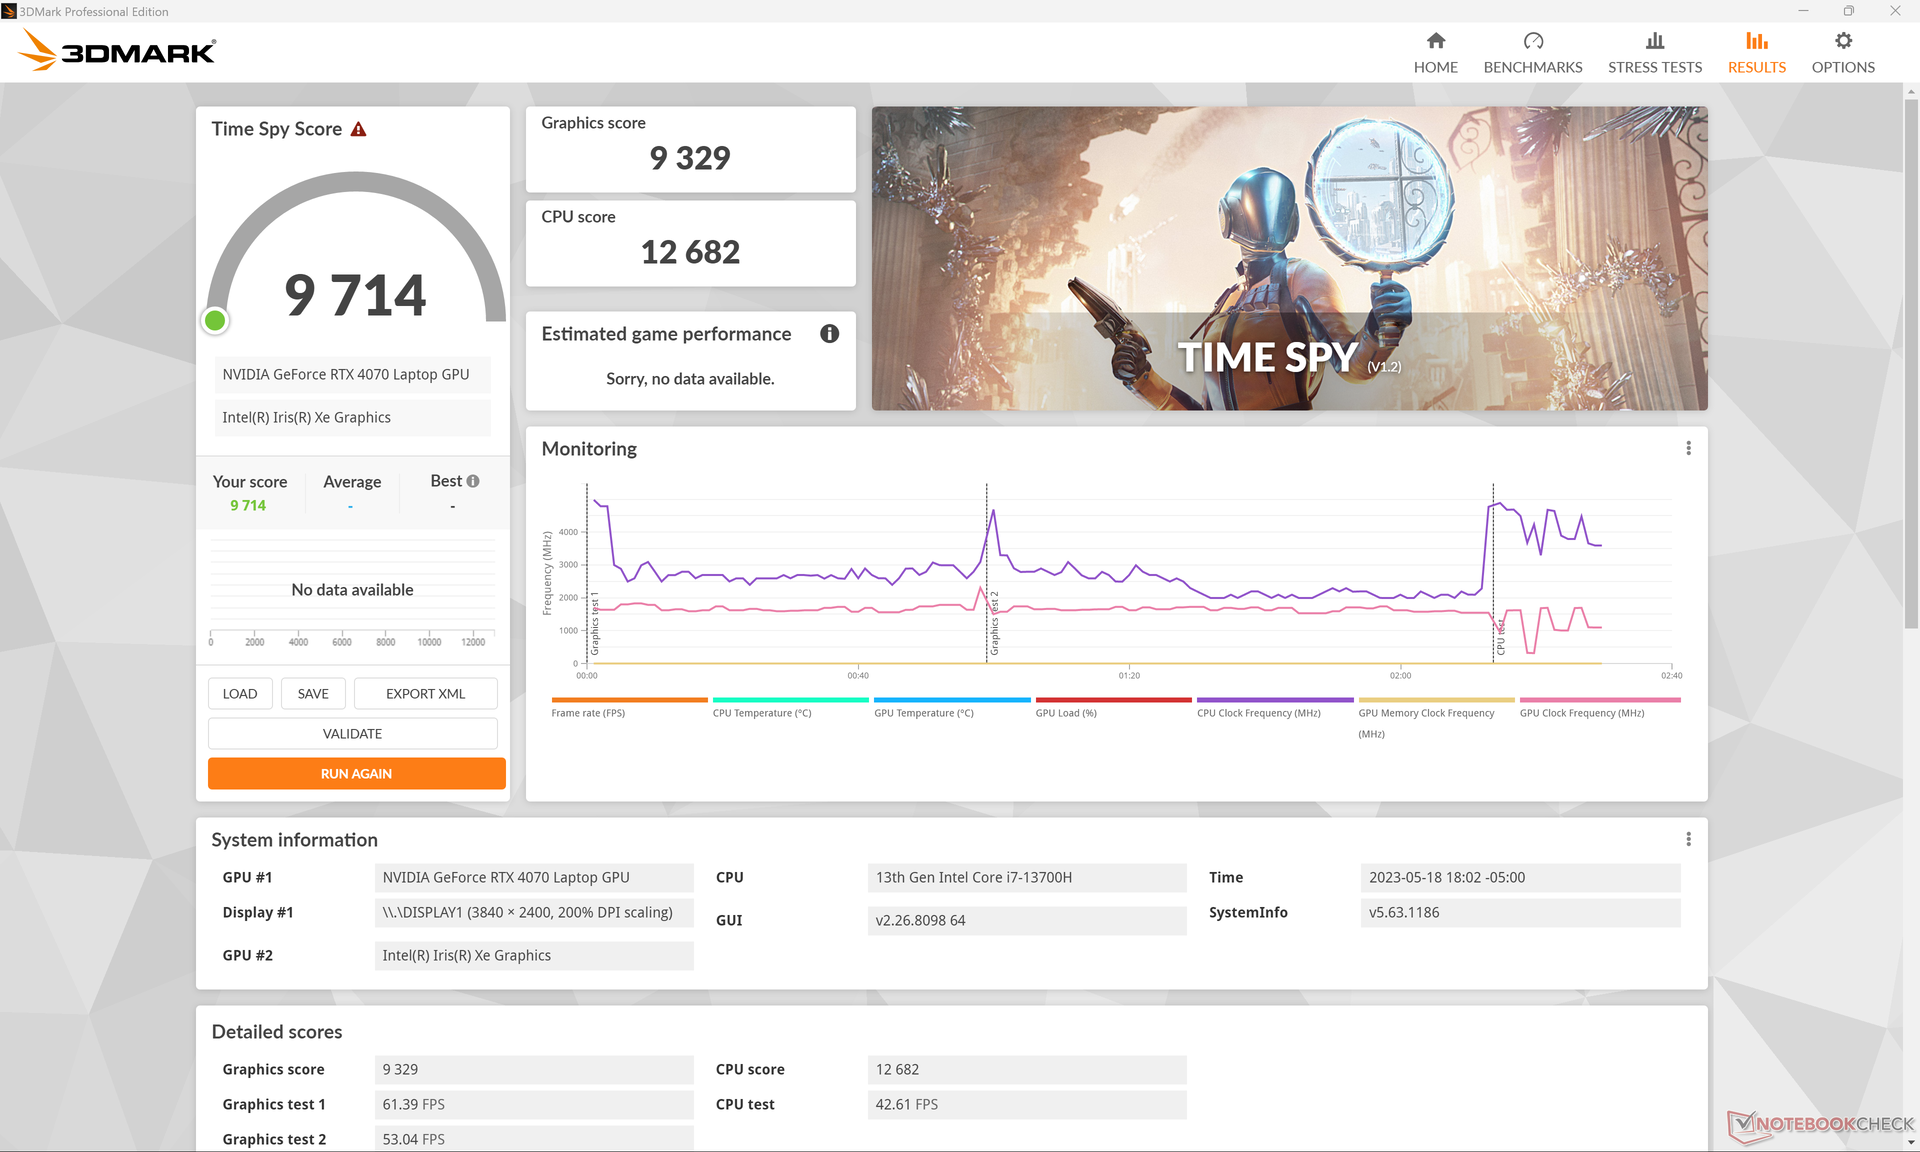
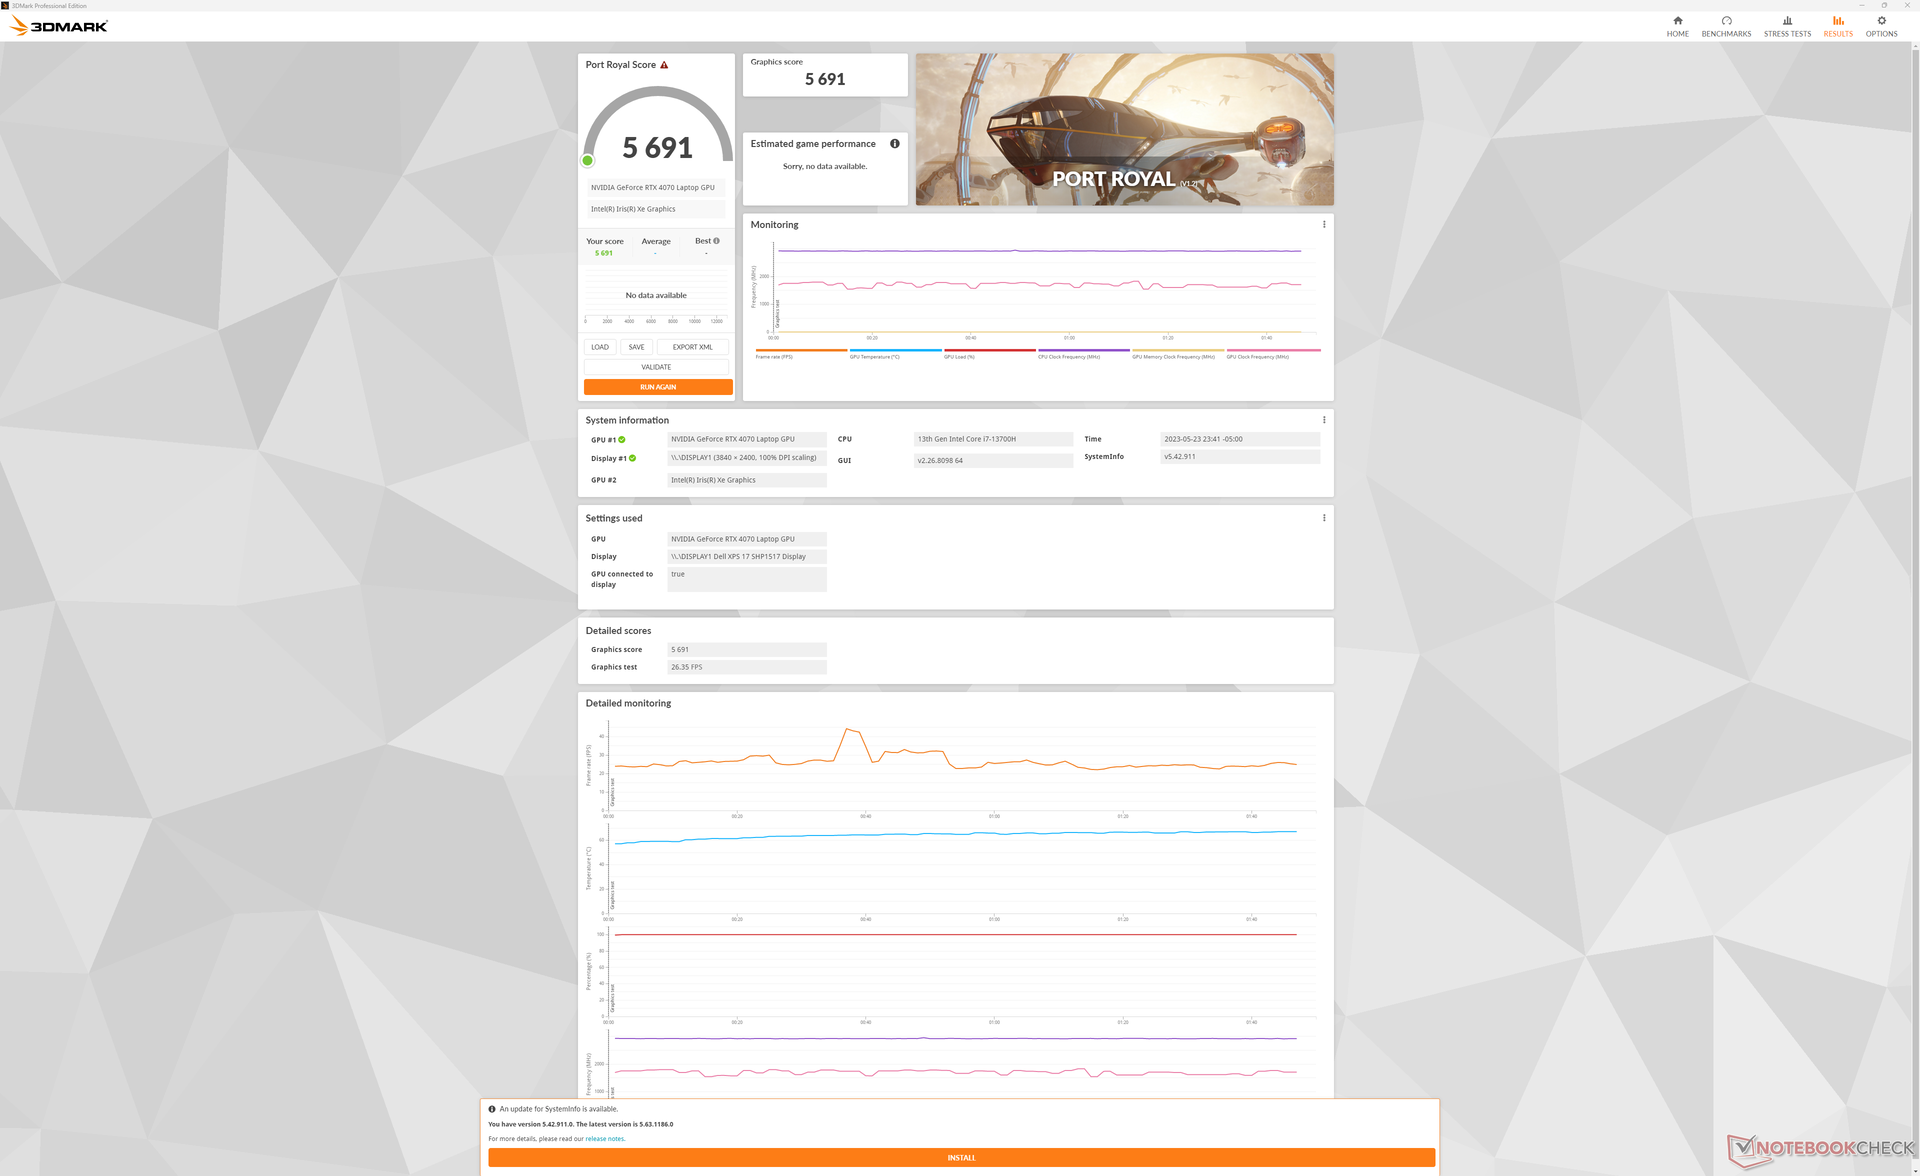
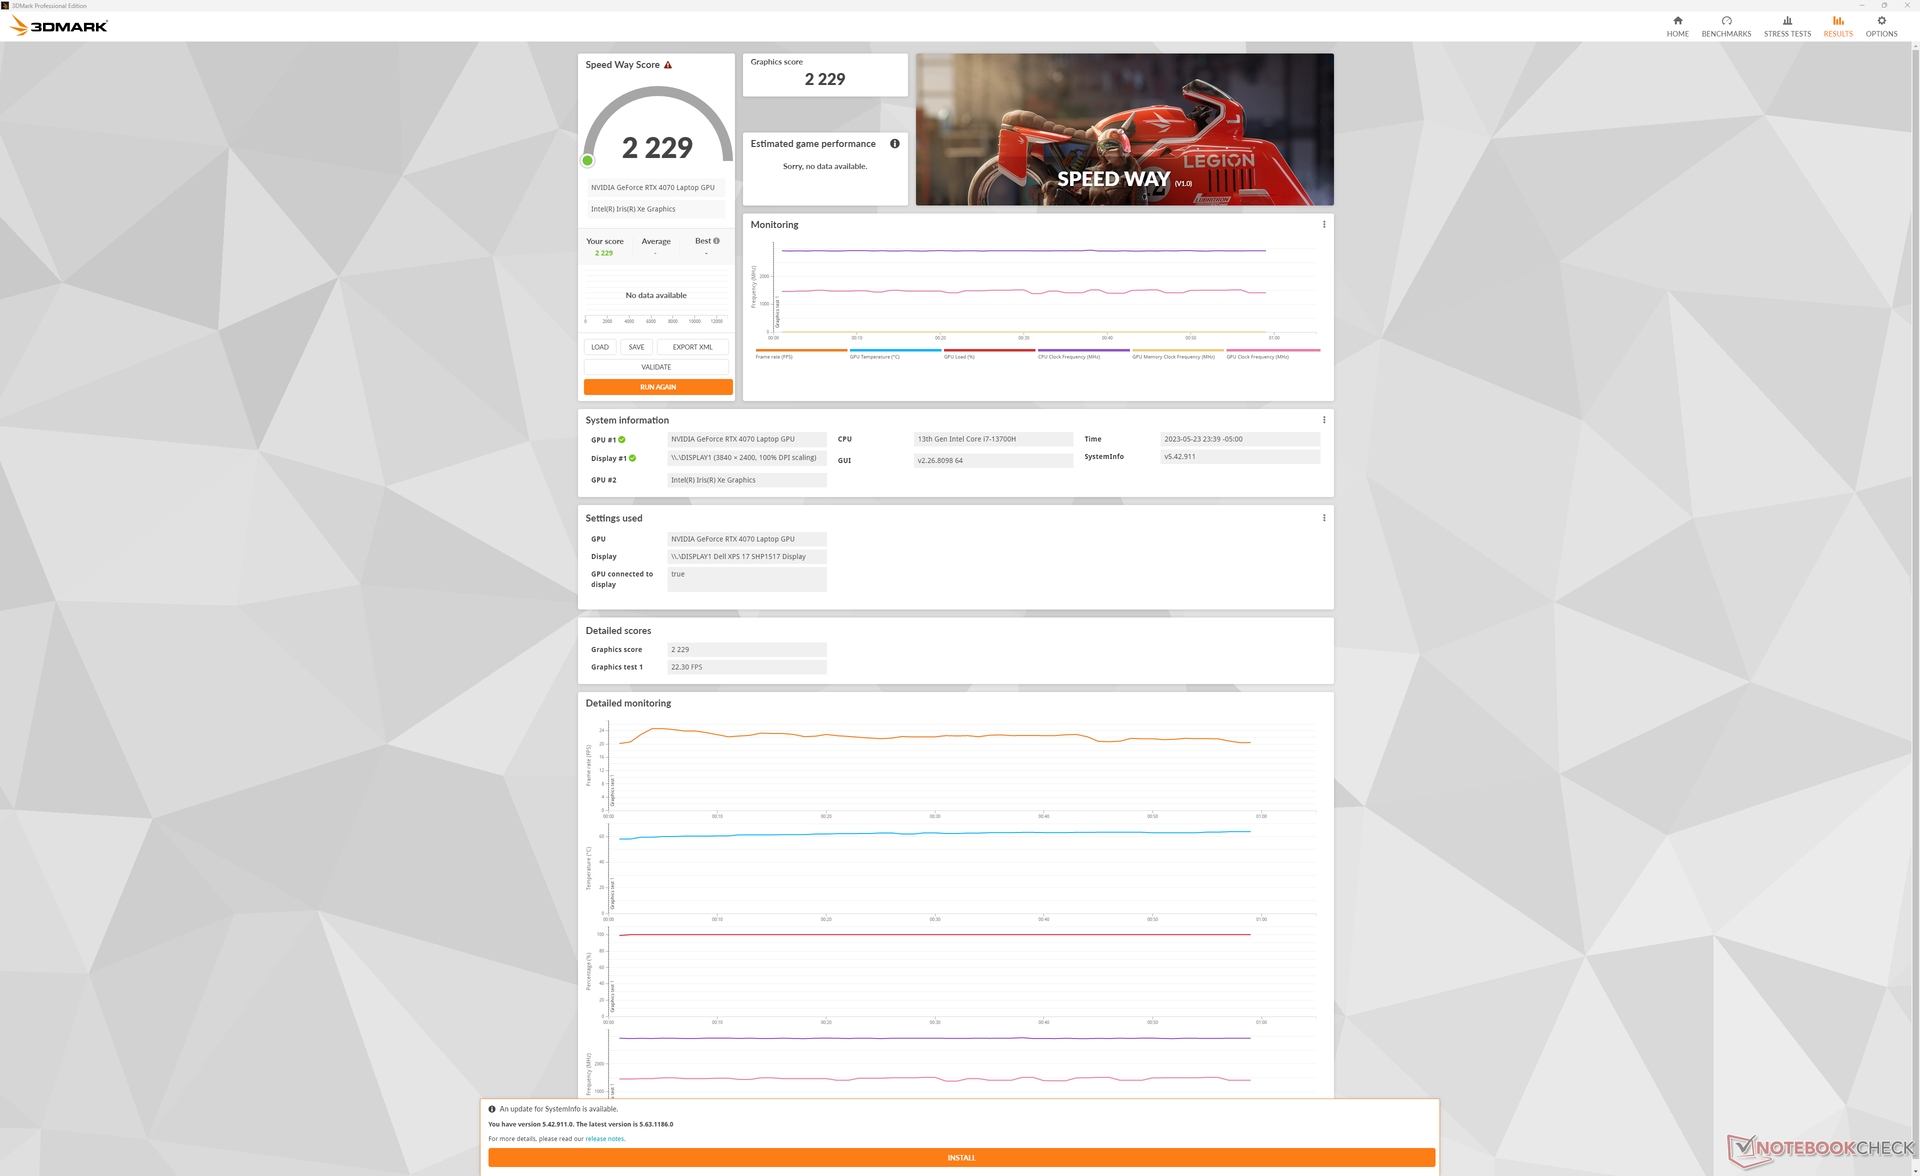
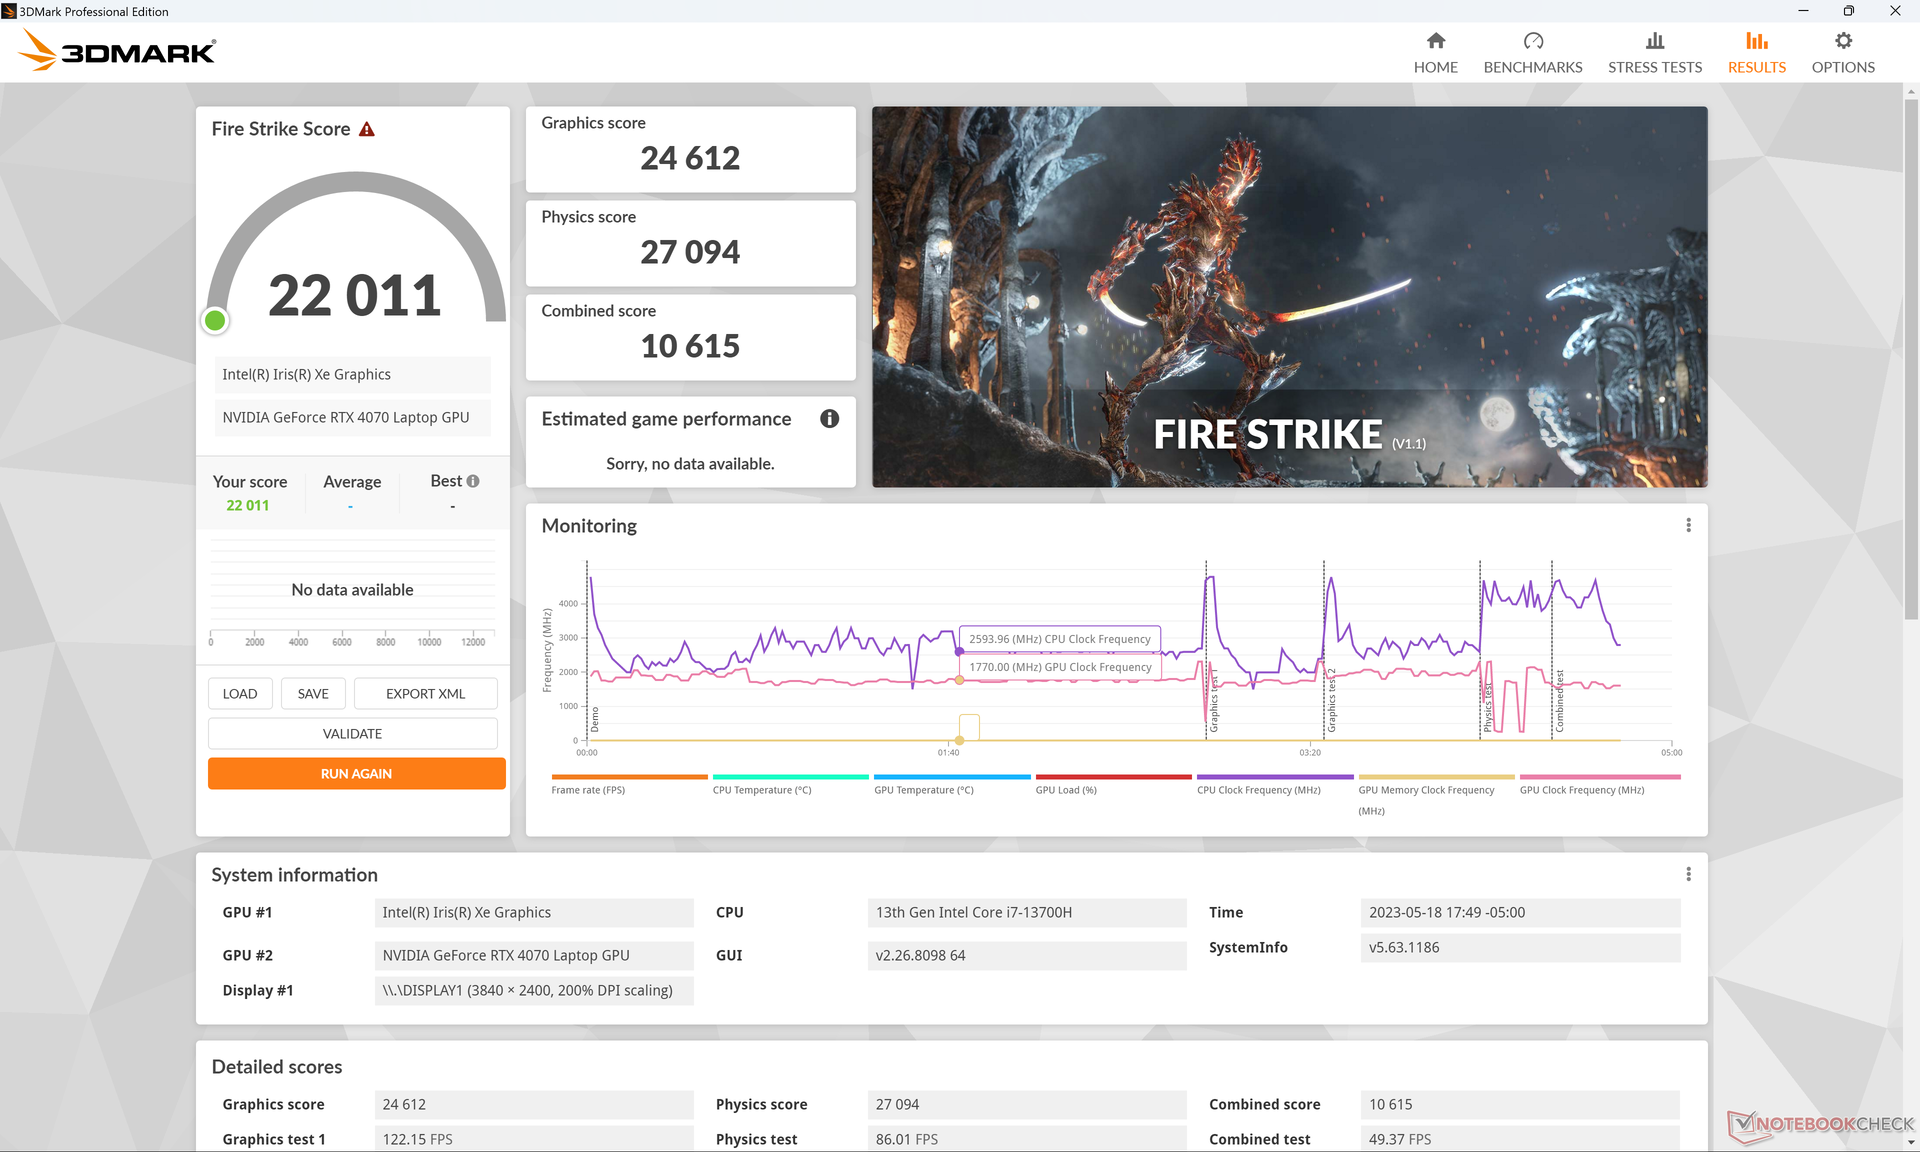
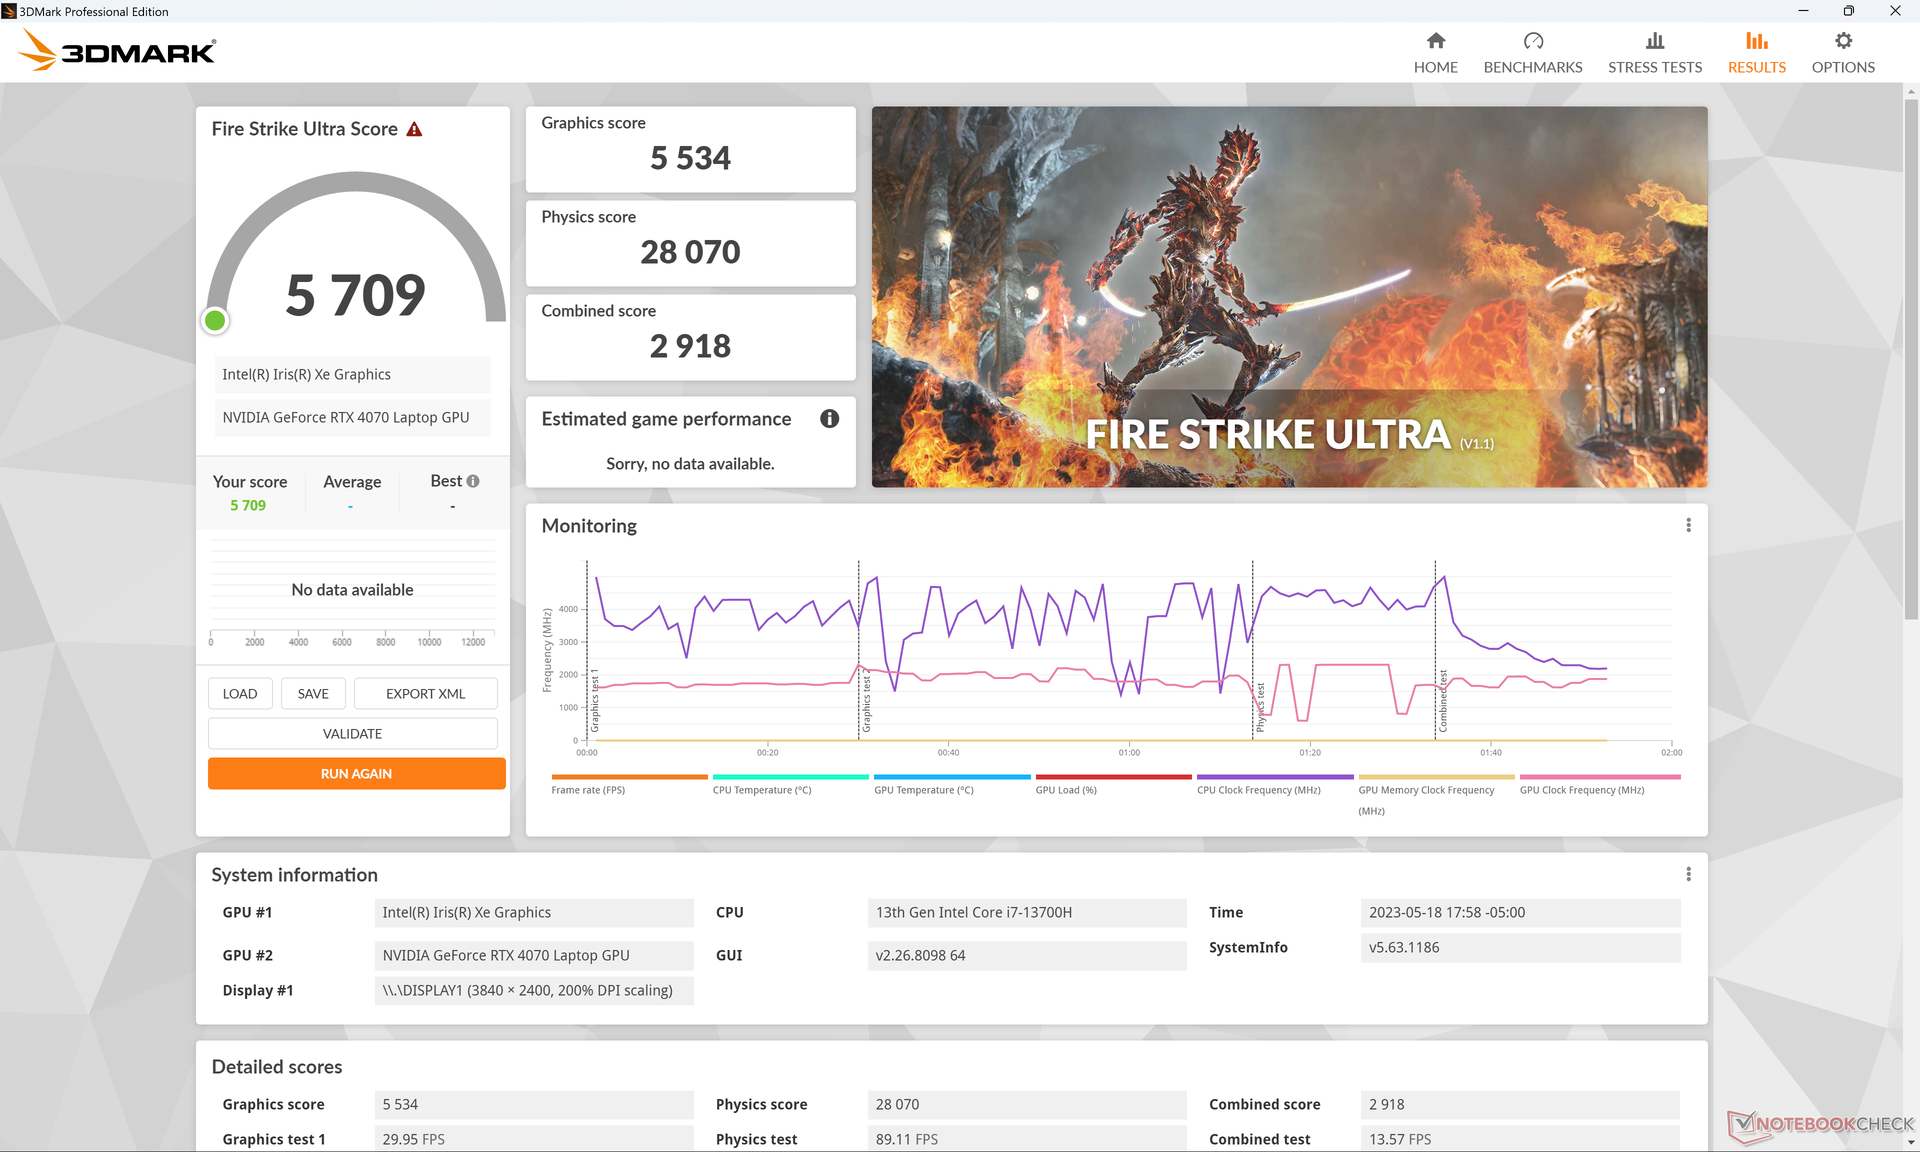
The mobilny GeForce RTX 4070 w XPS 17 jest ukierunkowany na TGP od 60 W do 70 W, podczas gdy ten sam GPU w mniejszym XPS 15 jest ukierunkowany na 40 W. Ta pozornie niewielka zmiana robi światową różnicę, ponieważ wyniki 3DMark zarówno dla DirectX, jak i benchmarków ray tracingu są o 50 do 60 procent szybsze na XPS 17 9730 w porównaniu do XPS 15. Wzrost wydajności jest tak duży, że RTX 4070 w XPS 17 jest tylko 10 do 15 procent za przeciętnym laptopem do gier wyposażonym w ten sam GPU. Jest to zakres wydajności, który mieliśmy nadzieję zobaczyć w XPS 15 9530.
Akceleracja GPU Blendera również zyskuje na wydajności w porównaniu do tego samego GPU w XPS 15. Jest to mniejszy, 20-procentowy wzrost wydajności, dzięki któremu XPS 17 jest zgodny z większością innych laptopów z RTX 4070.
Dell oferuje jeszcze wyższą opcję RTX 4080 dla XPS 17, ale w pełni spodziewamy się, że będzie ona gorsza w porównaniu do większości innych laptopów RTX 4080 ze względu na ograniczony zasilacz USB-C o mocy 130 W. TheMSI Stealth 17 Studiooferuje na przykład RTX 4080, aczkolwiek ze znacznie bardziej wydajnym zasilaczem 240 W.
Najwyższą opcją GPU dla serii XPS 17 przed XPS 17 9730 był model RTX 3060. W porównaniu do tej konfiguracji, nasz RTX 4070 może zaoferować odpowiednio o 20% i 30% szybsze tworzenie treści i wydajność graficzną.
| 3DMark Performance rating - Percent | |
| Aorus 17X AZF -2! | |
| MSI Stealth 17 Studio A13VH-014 | |
| Przeciętny NVIDIA GeForce RTX 4070 Laptop GPU | |
| Alienware m17 R5 (R9 6900HX, RX 6850M XT) -2! | |
| Lenovo Legion 5 Pro 16ARH7H RTX 3070 Ti -2! | |
| Asus ROG Strix G17 G713PI -2! | |
| Medion Erazer Defender P40 | |
| Dell XPS 17 9730 RTX 4070 | |
| MSI Creator Z17 A12UGST-054 -2! | |
| Dell XPS 17 9710 Core i7 RTX 3060 -1! | |
| Dell XPS 15 9530 RTX 4070 | |
| Dell XPS 17 9720 RTX 3060 -1! | |
| Dell XPS 17 9700 Core i7 RTX 2060 Max-Q -1! | |
| HP Envy 17-cr0079ng -2! | |
| LG Gram 17 (2023) -2! | |
| 3DMark 11 Performance | 29589 pkt. | |
| 3DMark Fire Strike Score | 22011 pkt. | |
| 3DMark Time Spy Score | 9714 pkt. | |
Pomoc | ||
* ... im mniej tym lepiej
Wydajność w grach
System dobrze sprawdza się jako dodatkowa maszyna do gier. Ponieważ 70 W RTX 4070 nie jest tak słabo zasilany jak 40 W wersja w XPS 15, XPS 17 jest w stanie uruchomić najnowsze gry w rozdzielczości QHD i 60 FPS na średnich i średnio-wysokich ustawieniach. rozdzielczość 4K UHD jest nadal poza zasięgiem, ale GPU dobrze współpracuje z zewnętrznymi monitorami FHD lub QHD do gier.
Być może dwoma znaczącymi czynnikami, które powstrzymują XPS 17 przed byciem "właściwym" laptopem do gier, są stosunkowo wolne czasy reakcji wyświetlacza i brak obsługi G-Sync dla wewnętrznego wyświetlacza. Utrata klatek, rozrywanie ekranu i ghosting są zatem bardziej powszechne podczas grania na XPS 17. Oczywiście wielu z tych problemów można uniknąć, po prostu grając na zewnętrznym monitorze.
| The Witcher 3 - 1920x1080 Ultra Graphics & Postprocessing (HBAO+) | |
| Aorus 17X AZF | |
| Alienware m17 R5 (R9 6900HX, RX 6850M XT) | |
| Asus ROG Strix G17 G713PI | |
| Lenovo Legion 5 Pro 16ARH7H RTX 3070 Ti | |
| Medion Erazer Defender P40 | |
| Dell XPS 17 9730 RTX 4070 | |
| MSI Creator Z17 A12UGST-054 | |
| Apple MacBook Pro 16 2023 M2 Max | |
| Dell XPS 17 9710 Core i7 RTX 3060 | |
| Dell XPS 17 9720 RTX 3060 | |
| Dell XPS 17 9700 Core i7 RTX 2060 Max-Q | |
| HP Envy 17-cr0079ng | |
| LG Gram 17 (2023) | |
| GTA V - 1920x1080 Highest AA:4xMSAA + FX AF:16x | |
| Aorus 17X AZF | |
| MSI Creator Z17 A12UGST-054 | |
| Asus ROG Strix G17 G713PI | |
| Medion Erazer Defender P40 | |
| Lenovo Legion 5 Pro 16ARH7H RTX 3070 Ti | |
| Dell XPS 17 9730 RTX 4070 | |
| Alienware m17 R5 (R9 6900HX, RX 6850M XT) | |
| Dell XPS 17 9720 RTX 3060 | |
| Dell XPS 17 9710 Core i7 RTX 3060 | |
| HP Envy 17-cr0079ng | |
| LG Gram 17 (2023) | |
| Final Fantasy XV Benchmark - 1920x1080 High Quality | |
| Aorus 17X AZF | |
| Lenovo Legion 5 Pro 16ARH7H RTX 3070 Ti | |
| Asus ROG Strix G17 G713PI | |
| Alienware m17 R5 (R9 6900HX, RX 6850M XT) | |
| Medion Erazer Defender P40 | |
| Dell XPS 17 9730 RTX 4070 | |
| MSI Creator Z17 A12UGST-054 | |
| Dell XPS 17 9710 Core i7 RTX 3060 | |
| Dell XPS 17 9720 RTX 3060 | |
| HP Envy 17-cr0079ng | |
| LG Gram 17 (2023) | |
| Strange Brigade - 1920x1080 ultra AA:ultra AF:16 | |
| Aorus 17X AZF | |
| Alienware m17 R5 (R9 6900HX, RX 6850M XT) | |
| Lenovo Legion 5 Pro 16ARH7H RTX 3070 Ti | |
| Asus ROG Strix G17 G713PI | |
| Medion Erazer Defender P40 | |
| Dell XPS 17 9730 RTX 4070 | |
| MSI Creator Z17 A12UGST-054 | |
| Dell XPS 17 9710 Core i7 RTX 3060 | |
| Dell XPS 17 9720 RTX 3060 | |
| HP Envy 17-cr0079ng | |
| LG Gram 17 (2023) | |
| Dota 2 Reborn - 1920x1080 ultra (3/3) best looking | |
| Aorus 17X AZF | |
| Asus ROG Strix G17 G713PI | |
| MSI Creator Z17 A12UGST-054 | |
| Dell XPS 17 9730 RTX 4070 | |
| Medion Erazer Defender P40 | |
| Dell XPS 17 9720 RTX 3060 | |
| Lenovo Legion 5 Pro 16ARH7H RTX 3070 Ti | |
| Dell XPS 17 9710 Core i7 RTX 3060 | |
| Dell XPS 17 9700 Core i7 RTX 2060 Max-Q | |
| HP Envy 17-cr0079ng | |
| Alienware m17 R5 (R9 6900HX, RX 6850M XT) | |
| LG Gram 17 (2023) | |
| X-Plane 11.11 - 1920x1080 high (fps_test=3) | |
| Aorus 17X AZF | |
| Asus ROG Strix G17 G713PI | |
| Medion Erazer Defender P40 | |
| MSI Creator Z17 A12UGST-054 | |
| Dell XPS 17 9730 RTX 4070 | |
| Dell XPS 17 9720 RTX 3060 | |
| Dell XPS 17 9710 Core i7 RTX 3060 | |
| Lenovo Legion 5 Pro 16ARH7H RTX 3070 Ti | |
| Dell XPS 17 9700 Core i7 RTX 2060 Max-Q | |
| HP Envy 17-cr0079ng | |
| Alienware m17 R5 (R9 6900HX, RX 6850M XT) | |
| LG Gram 17 (2023) | |
| Returnal | |
| 1280x720 Low Preset | |
| Aorus 17X AZF | |
| Przeciętny NVIDIA GeForce RTX 4070 Laptop GPU (126 - 150, n=5) | |
| 1920x1080 Low Preset | |
| Aorus 17X AZF | |
| Przeciętny NVIDIA GeForce RTX 4070 Laptop GPU (65 - 119, n=11) | |
| Dell XPS 17 9730 RTX 4070 | |
| 1920x1080 Medium Preset | |
| Aorus 17X AZF | |
| Przeciętny NVIDIA GeForce RTX 4070 Laptop GPU (69 - 117, n=12) | |
| Dell XPS 17 9730 RTX 4070 | |
| 1920x1080 High Preset | |
| Aorus 17X AZF | |
| Przeciętny NVIDIA GeForce RTX 4070 Laptop GPU (64 - 106, n=12) | |
| Dell XPS 17 9730 RTX 4070 | |
| 1920x1080 Epic Preset | |
| Aorus 17X AZF | |
| Przeciętny NVIDIA GeForce RTX 4070 Laptop GPU (54 - 90, n=12) | |
| Dell XPS 17 9730 RTX 4070 | |
| 2560x1440 Epic Preset | |
| Aorus 17X AZF | |
| Przeciętny NVIDIA GeForce RTX 4070 Laptop GPU (39 - 66, n=12) | |
| Dell XPS 17 9730 RTX 4070 | |
| 3840x2160 Epic Preset | |
| Aorus 17X AZF | |
| Przeciętny NVIDIA GeForce RTX 4070 Laptop GPU (21 - 39, n=8) | |
| Dell XPS 17 9730 RTX 4070 | |
| Tiny Tina's Wonderlands | |
| 1920x1080 Low Preset (DX12) | |
| Aorus 17X AZF | |
| Przeciętny NVIDIA GeForce RTX 4070 Laptop GPU (98.1 - 283, n=15) | |
| Dell XPS 17 9730 RTX 4070 | |
| 1920x1080 Medium Preset (DX12) | |
| Aorus 17X AZF | |
| Przeciętny NVIDIA GeForce RTX 4070 Laptop GPU (92.5 - 231, n=15) | |
| Dell XPS 17 9730 RTX 4070 | |
| 1920x1080 High Preset (DX12) | |
| Aorus 17X AZF | |
| Przeciętny NVIDIA GeForce RTX 4070 Laptop GPU (74.3 - 151.4, n=15) | |
| Dell XPS 17 9730 RTX 4070 | |
| 1920x1080 Badass Preset (DX12) | |
| Aorus 17X AZF | |
| Przeciętny NVIDIA GeForce RTX 4070 Laptop GPU (58.6 - 115.9, n=18) | |
| Dell XPS 17 9730 RTX 4070 | |
| 2560x1440 Badass Preset (DX12) | |
| Aorus 17X AZF | |
| Przeciętny NVIDIA GeForce RTX 4070 Laptop GPU (49.8 - 79.5, n=17) | |
| Dell XPS 17 9730 RTX 4070 | |
| 3840x2160 Badass Preset (DX12) | |
| Aorus 17X AZF | |
| Przeciętny NVIDIA GeForce RTX 4070 Laptop GPU (28.3 - 39.7, n=13) | |
| Dell XPS 17 9730 RTX 4070 | |
Witcher 3 FPS Chart
| low | med. | high | ultra | QHD | 4K | |
|---|---|---|---|---|---|---|
| GTA V (2015) | 186.6 | 182.5 | 167.9 | 102.7 | 75.5 | 76.9 |
| The Witcher 3 (2015) | 415.2 | 297.6 | 181.4 | 96.2 | 59 | |
| Dota 2 Reborn (2015) | 193.5 | 174.5 | 165.9 | 156.9 | 108 | |
| Final Fantasy XV Benchmark (2018) | 174.8 | 128.3 | 94.7 | 69.9 | 38.2 | |
| X-Plane 11.11 (2018) | 154.6 | 133.1 | 106.4 | 90 | ||
| Strange Brigade (2018) | 431 | 238 | 192 | 165.4 | 113.6 | 61.7 |
| Cyberpunk 2077 1.6 (2022) | 102.1 | 99.4 | 85.6 | 71 | 43 | 18.7 |
| Tiny Tina's Wonderlands (2022) | 183.5 | 153.3 | 104.9 | 82.4 | 55.7 | 28.3 |
| F1 22 (2022) | 206 | 196.4 | 158.2 | 60.7 | 39.4 | 18.8 |
| Returnal (2023) | 72 | 71 | 67 | 59 | 41 | 21 |
Emisje
Hałas systemowy - głośny tylko wtedy, gdy jest to konieczne
Hałas wentylatora nie zmienił się drastycznie pomimo poprawy wydajności. XPS 17 zazwyczaj oscyluje wokół ledwo słyszalnego poziomu 25,6 dB(A) na cichym tle 22,7 dB(A) podczas przeglądania stron internetowych lub strumieniowania wideo. Jeśli jednak uruchomimy bardzo wymagające obciążenia, takie jak gry, hałas wentylatora zacznie zbliżać się do poziomu niektórych laptopów do gier, osiągając nawet 50 dB(A). W końcu model XPS oferuje specyfikację na poziomie gamingowym.
Hałas
| luz |
| 22.8 / 22.8 / 22.8 dB |
| obciążenie |
| 38.9 / 50.2 dB |
 | ||
30 dB cichy 40 dB(A) słyszalny 50 dB(A) irytujący |
||
min: | ||
| Dell XPS 17 9730 RTX 4070 GeForce RTX 4070 Laptop GPU, i7-13700H, SK hynix PC801 HFS001TEJ9X101N | Dell XPS 17 9720 RTX 3060 GeForce RTX 3060 Laptop GPU, i7-12700H, Samsung PM9A1 MZVL21T0HCLR | LG Gram 17 (2023) Iris Xe G7 96EUs, i7-1360P, Samsung PM9A1 MZVL21T0HCLR | HP Envy 17-cr0079ng GeForce RTX 2050 Mobile, i7-1255U, Samsung PM991a MZVLQ1T0HBLB | MSI Creator Z17 A12UGST-054 GeForce RTX 3070 Ti Laptop GPU, i9-12900H, Micron 3400 1TB MTFDKBA1T0TFH | Apple MacBook Pro 16 2023 M2 Max M2 Max 38-Core GPU, M2 Max, Apple SSD AP2048Z | |
|---|---|---|---|---|---|---|
| Noise | -4% | -11% | -16% | -28% | 4% | |
| wyłączone / środowisko * (dB) | 22.7 | 23.8 -5% | 25.2 -11% | 26.5 -17% | 26 -15% | 23.9 -5% |
| Idle Minimum * (dB) | 22.8 | 24.1 -6% | 25.2 -11% | 28.5 -25% | 31.8 -39% | 23.9 -5% |
| Idle Average * (dB) | 22.8 | 24.1 -6% | 25.7 -13% | 28.5 -25% | 31.8 -39% | 23.9 -5% |
| Idle Maximum * (dB) | 22.8 | 24.1 -6% | 29.3 -29% | 29.7 -30% | 31.8 -39% | 23.9 -5% |
| Load Average * (dB) | 38.9 | 43.2 -11% | 44.4 -14% | 39.5 -2% | 53.9 -39% | 36.6 6% |
| Witcher 3 ultra * (dB) | 47.4 | 48 -1% | 53.9 -14% | 35.1 26% | ||
| Load Maximum * (dB) | 50.2 | 48 4% | 45.2 10% | 48 4% | 54.9 -9% | 43.2 14% |
* ... im mniej tym lepiej
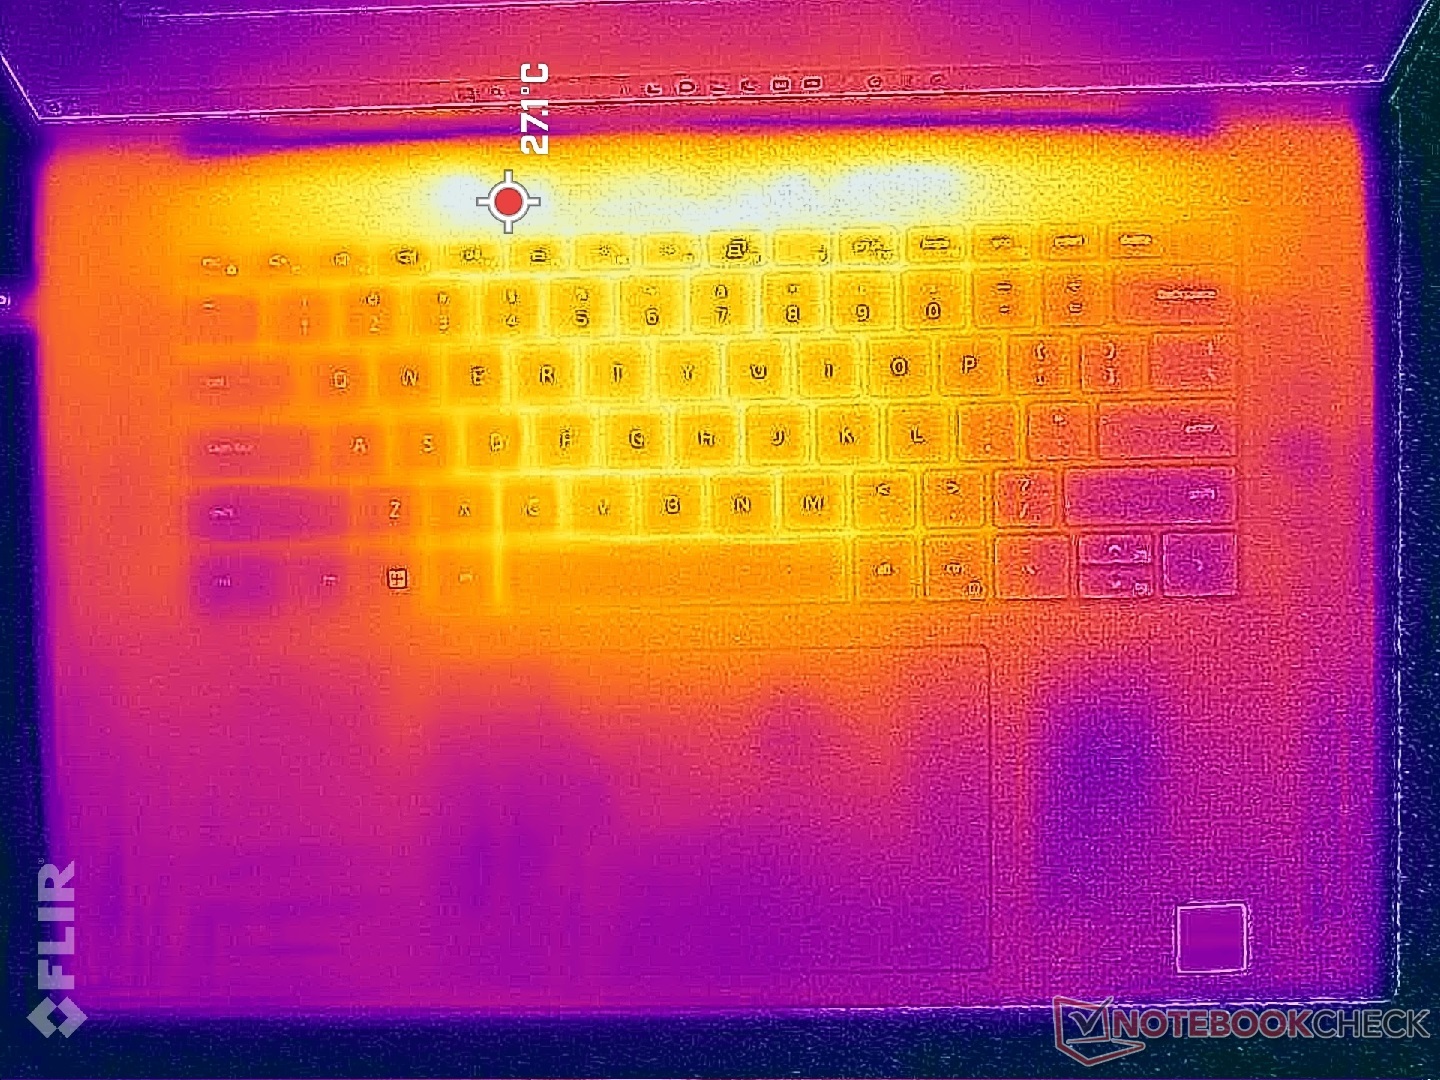
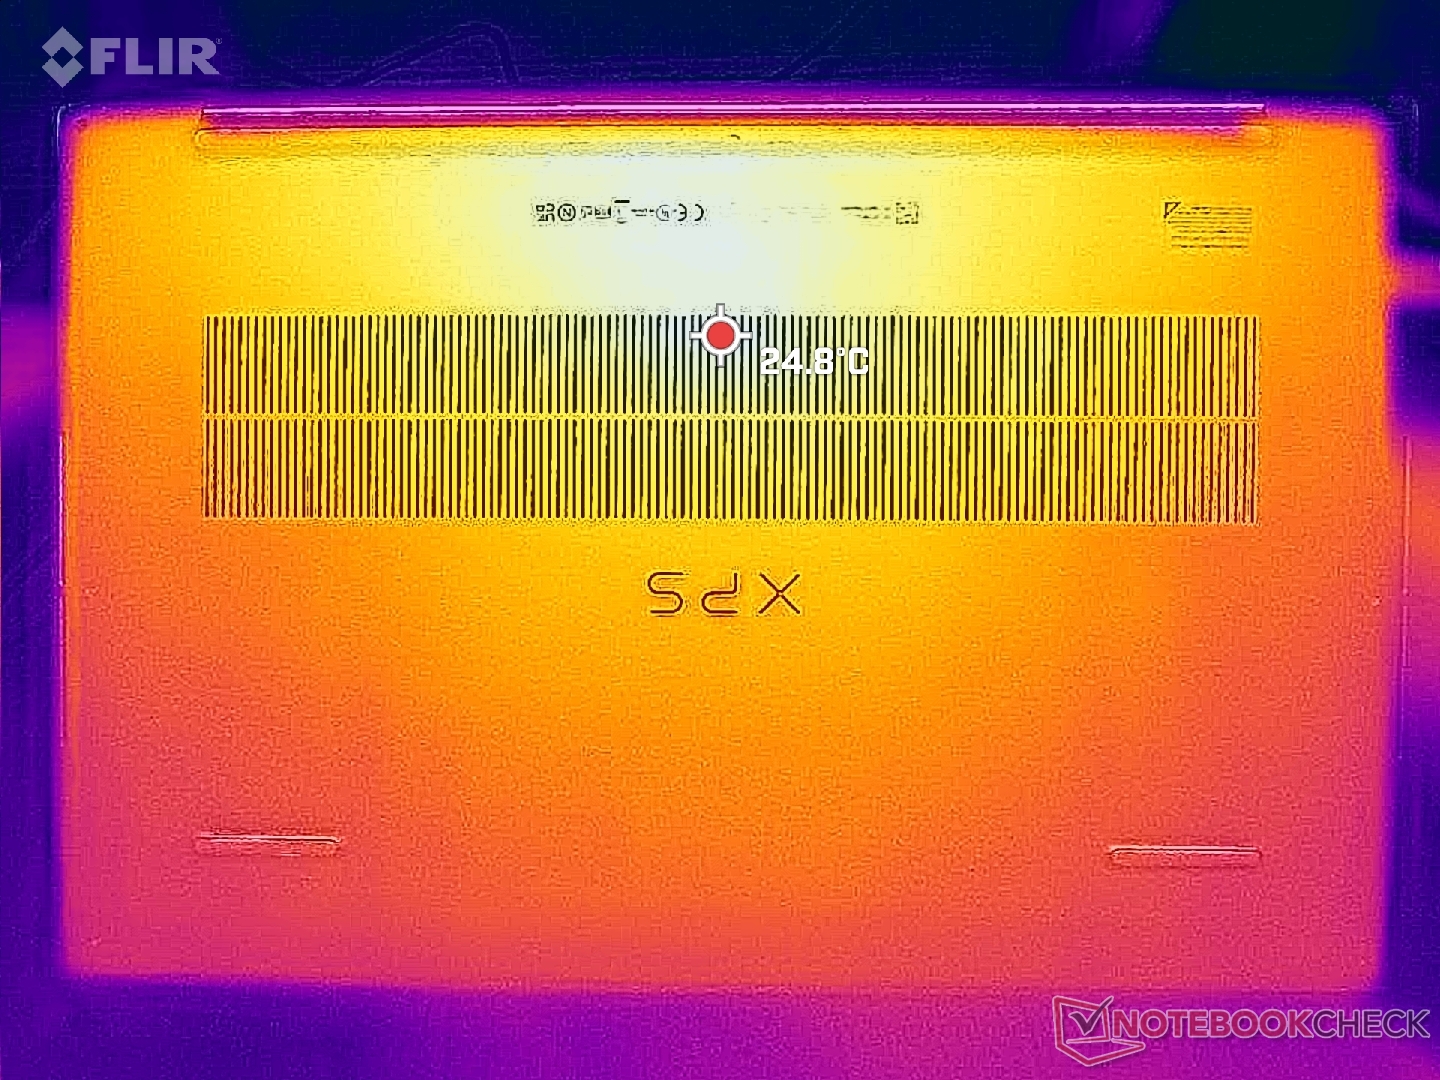
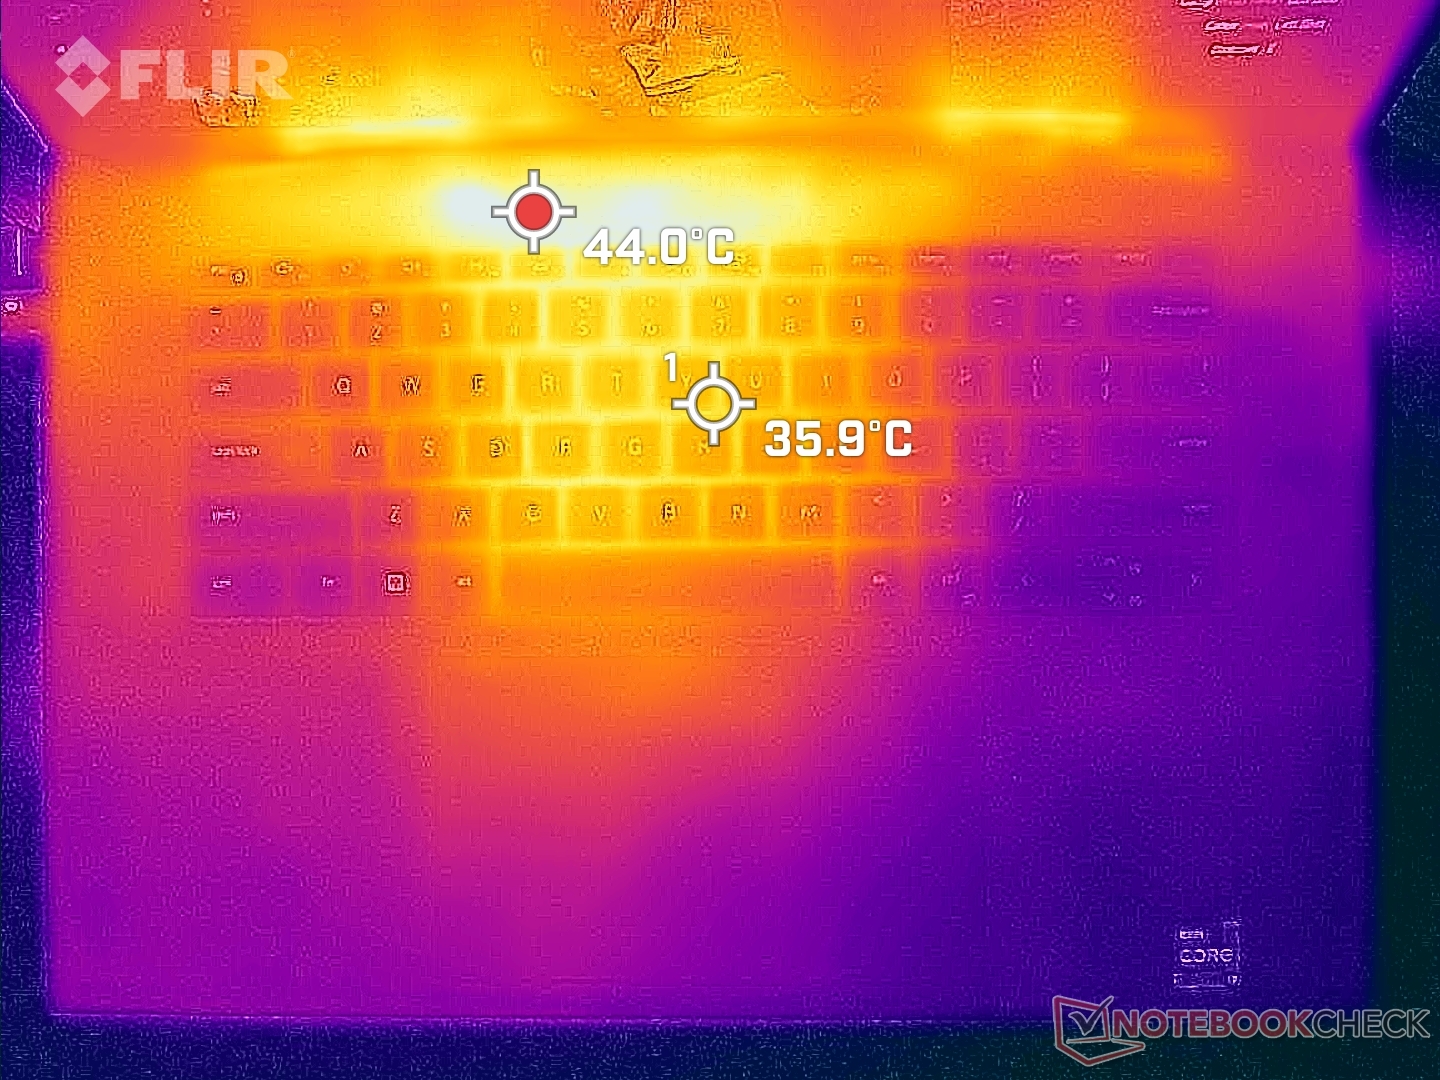
Temperatura
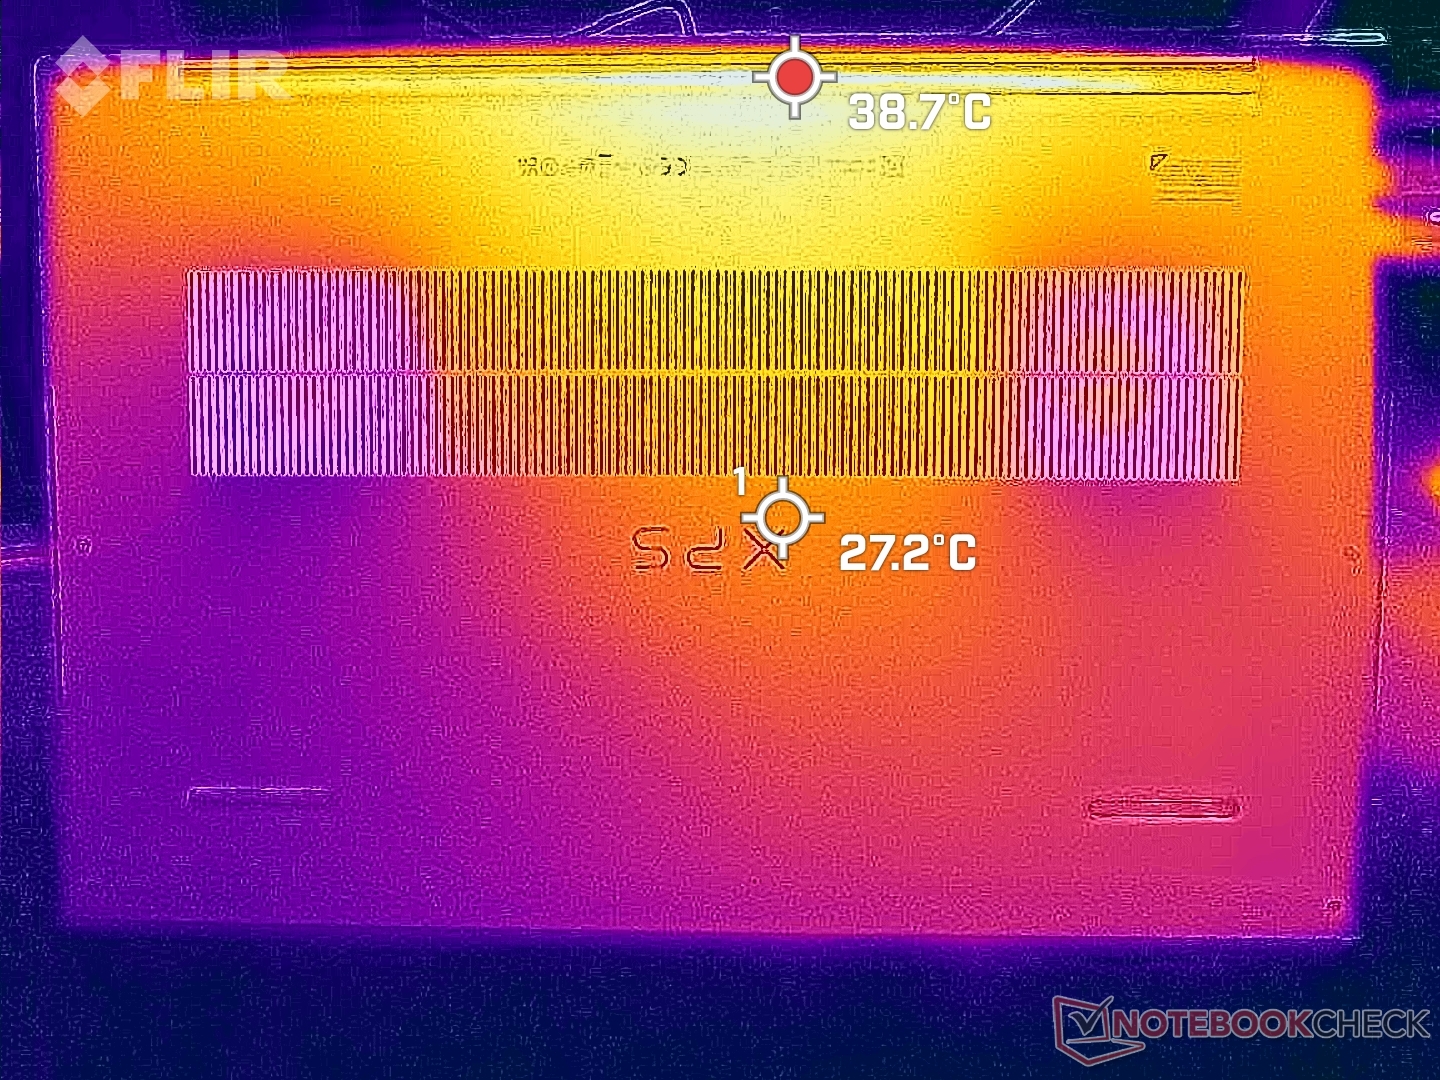
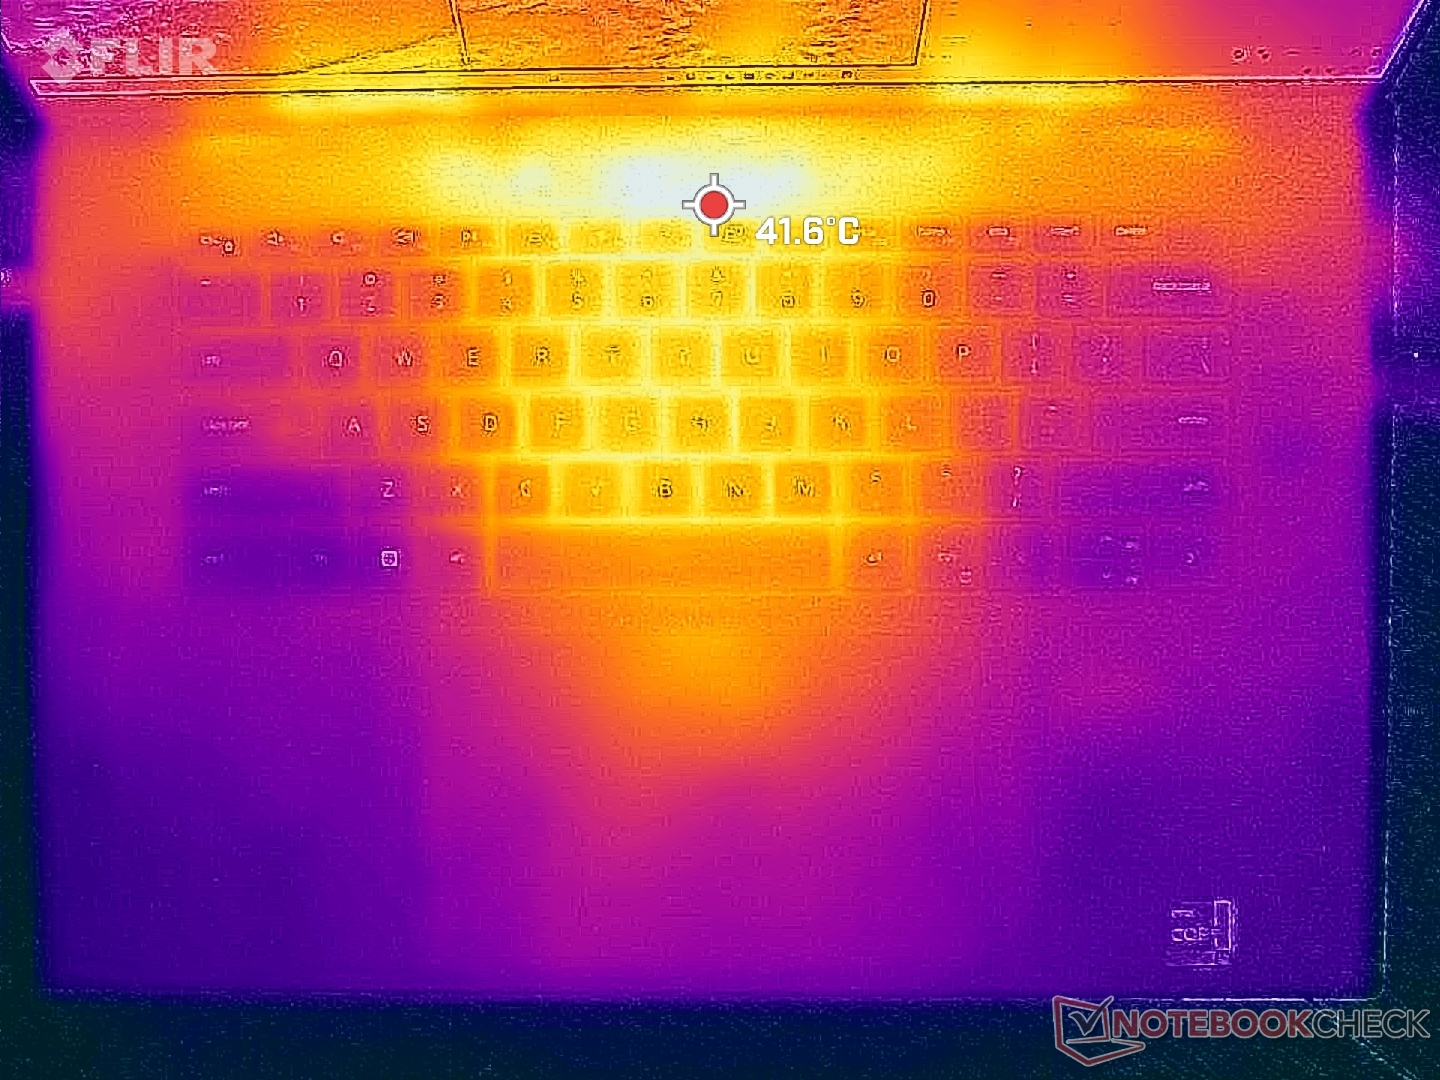
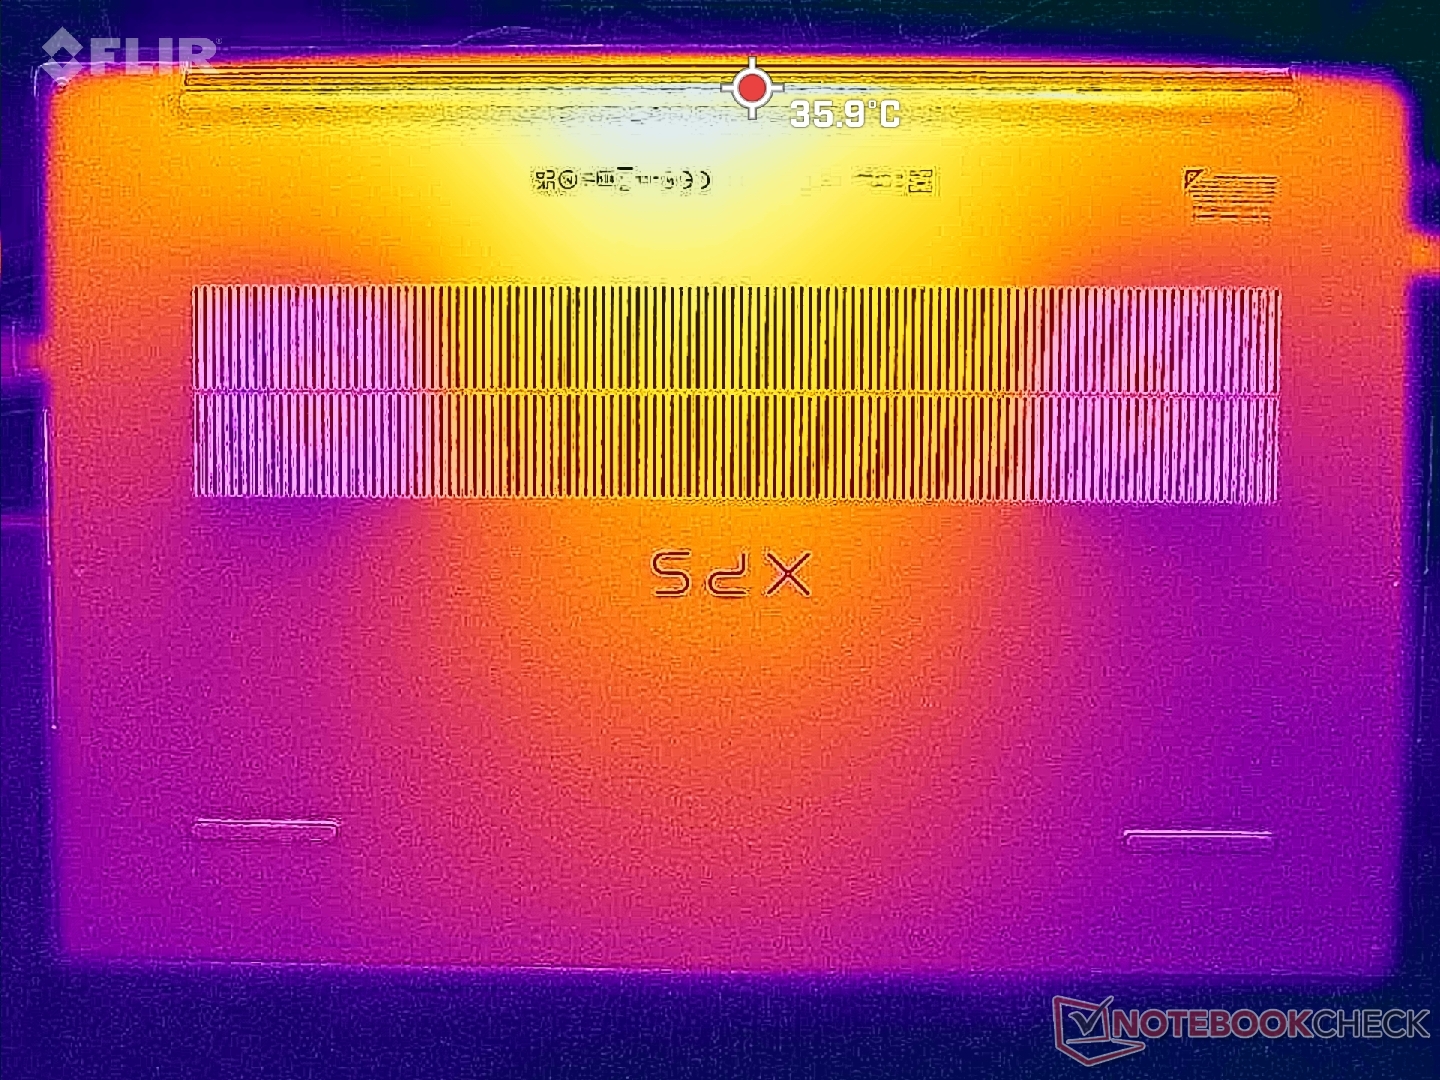
Temperatury powierzchni są niższe niż oczekiwano w porównaniu do innych laptopów napędzanych podobnymi procesorami Core z serii H i układami graficznymi RTX GeForce. KonkurencyjnyMSI Creator Z17na przykład, miałby gorące punkty o temperaturze nawet 60+ C, podczas gdy nasz Dell miałby tylko 43 C przy podobnym dużym obciążeniu. Niższe temperatury powierzchniowe na Dellu można przypisać chłodnicy komory parowej, izolacji termicznej GORE i ogólnie niższej obwiedni mocy.
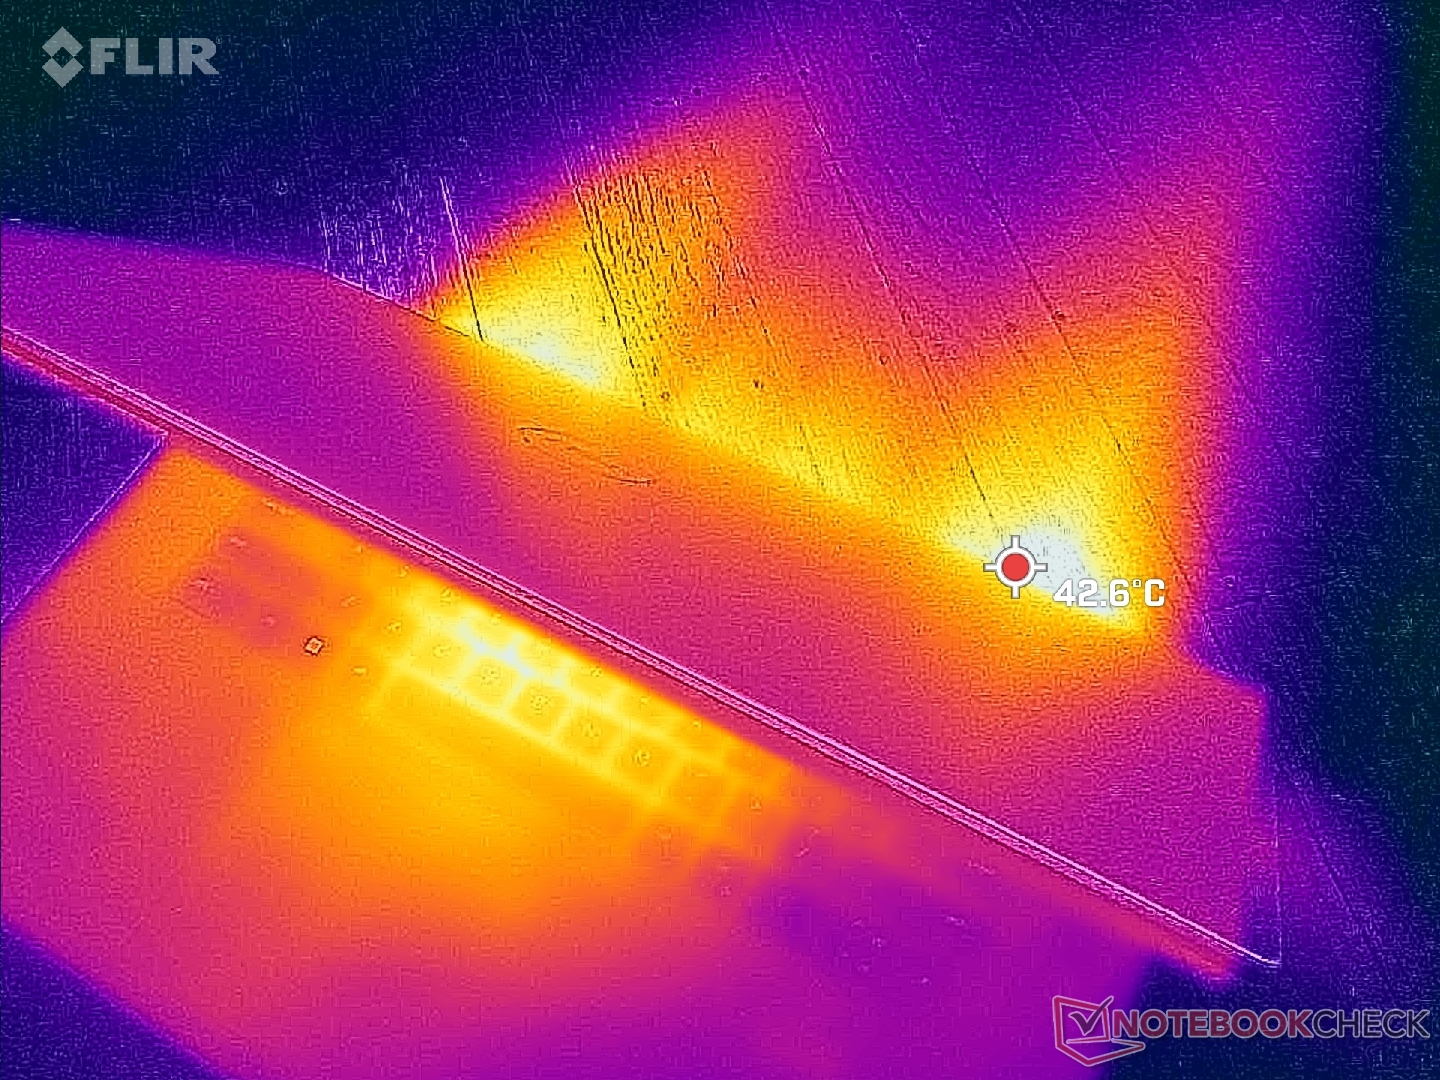
(±) Maksymalna temperatura w górnej części wynosi 43.2 °C / 110 F, w porównaniu do średniej 36.8 °C / 98 F , począwszy od 21 do 71 °C dla klasy Multimedia.
(+) Dno nagrzewa się maksymalnie do 31.8 °C / 89 F, w porównaniu do średniej 39.1 °C / 102 F
(+) W stanie bezczynności średnia temperatura górnej części wynosi 28.2 °C / 83 F, w porównaniu ze średnią temperaturą urządzenia wynoszącą 31.3 °C / ### class_avg_f### F.
(±) Podczas gry w Wiedźmina 3 średnia temperatura górnej części wynosi 33.7 °C / 93 F, w porównaniu do średniej temperatury urządzenia wynoszącej 31.3 °C / ## #class_avg_f### F.
(+) Podpórki pod nadgarstki i touchpad są chłodniejsze niż temperatura skóry i maksymalnie 31 °C / 87.8 F i dlatego są chłodne w dotyku.
(-) Średnia temperatura obszaru podparcia dłoni w podobnych urządzeniach wynosiła 28.7 °C / 83.7 F (-2.3 °C / -4.1 F).
| Dell XPS 17 9730 RTX 4070 Intel Core i7-13700H, NVIDIA GeForce RTX 4070 Laptop GPU | Dell XPS 17 9720 RTX 3060 Intel Core i7-12700H, NVIDIA GeForce RTX 3060 Laptop GPU | LG Gram 17 (2023) Intel Core i7-1360P, Intel Iris Xe Graphics G7 96EUs | HP Envy 17-cr0079ng Intel Core i7-1255U, NVIDIA GeForce RTX 2050 Mobile | MSI Creator Z17 A12UGST-054 Intel Core i9-12900H, NVIDIA GeForce RTX 3070 Ti Laptop GPU | Apple MacBook Pro 16 2023 M2 Max Apple M2 Max, Apple M2 Max 38-Core GPU | |
|---|---|---|---|---|---|---|
| Heat | -19% | -7% | -3% | -37% | 5% | |
| Maximum Upper Side * (°C) | 43.2 | 51.8 -20% | 43.9 -2% | 47.1 -9% | 63.9 -48% | 44.2 -2% |
| Maximum Bottom * (°C) | 31.8 | 44.2 -39% | 45.5 -43% | 43.8 -38% | 68 -114% | 42.9 -35% |
| Idle Upper Side * (°C) | 32.8 | 34.8 -6% | 28.4 13% | 25.2 23% | 28.3 14% | 22.4 32% |
| Idle Bottom * (°C) | 29.8 | 33.2 -11% | 28.2 5% | 25.9 13% | 30.2 -1% | 22.3 25% |
* ... im mniej tym lepiej
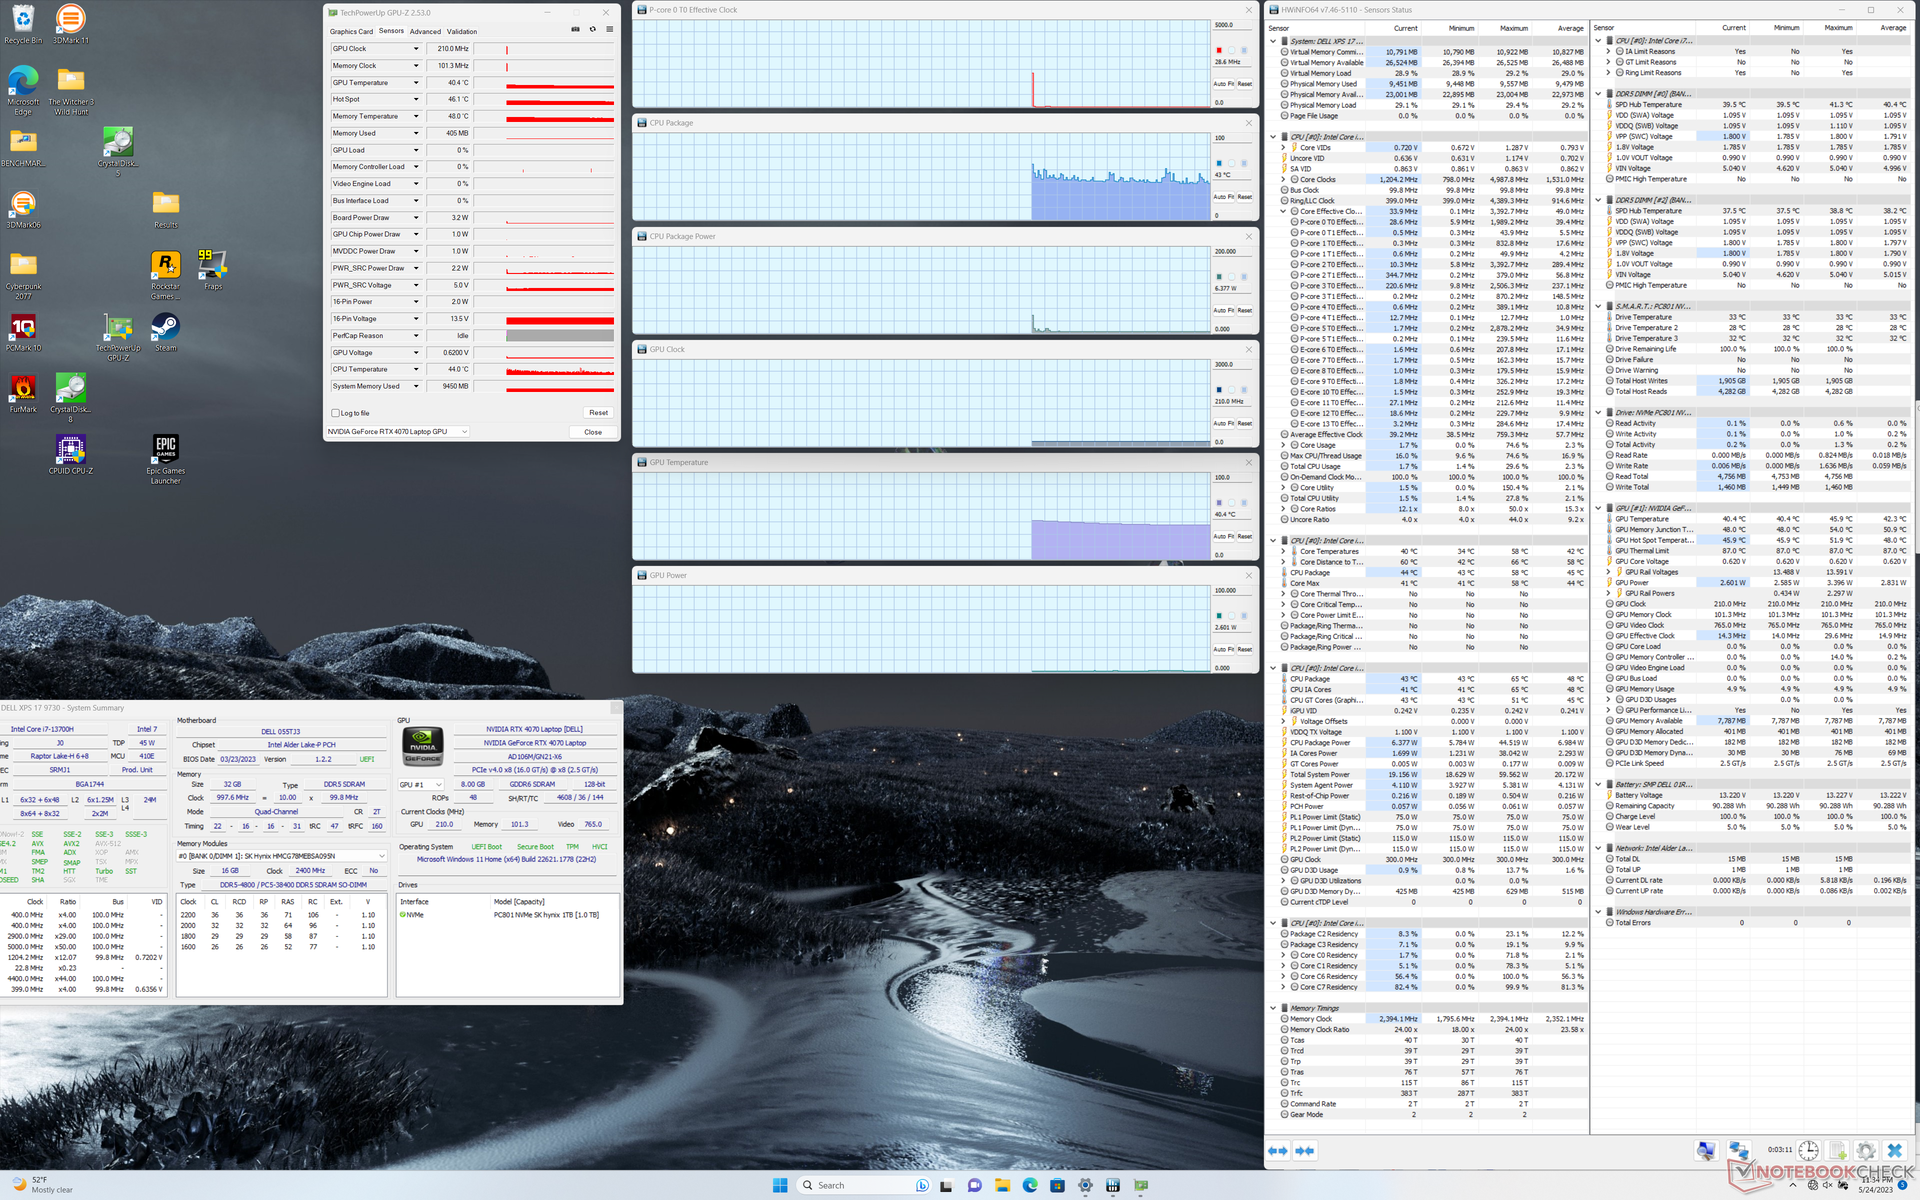
Test warunków skrajnych
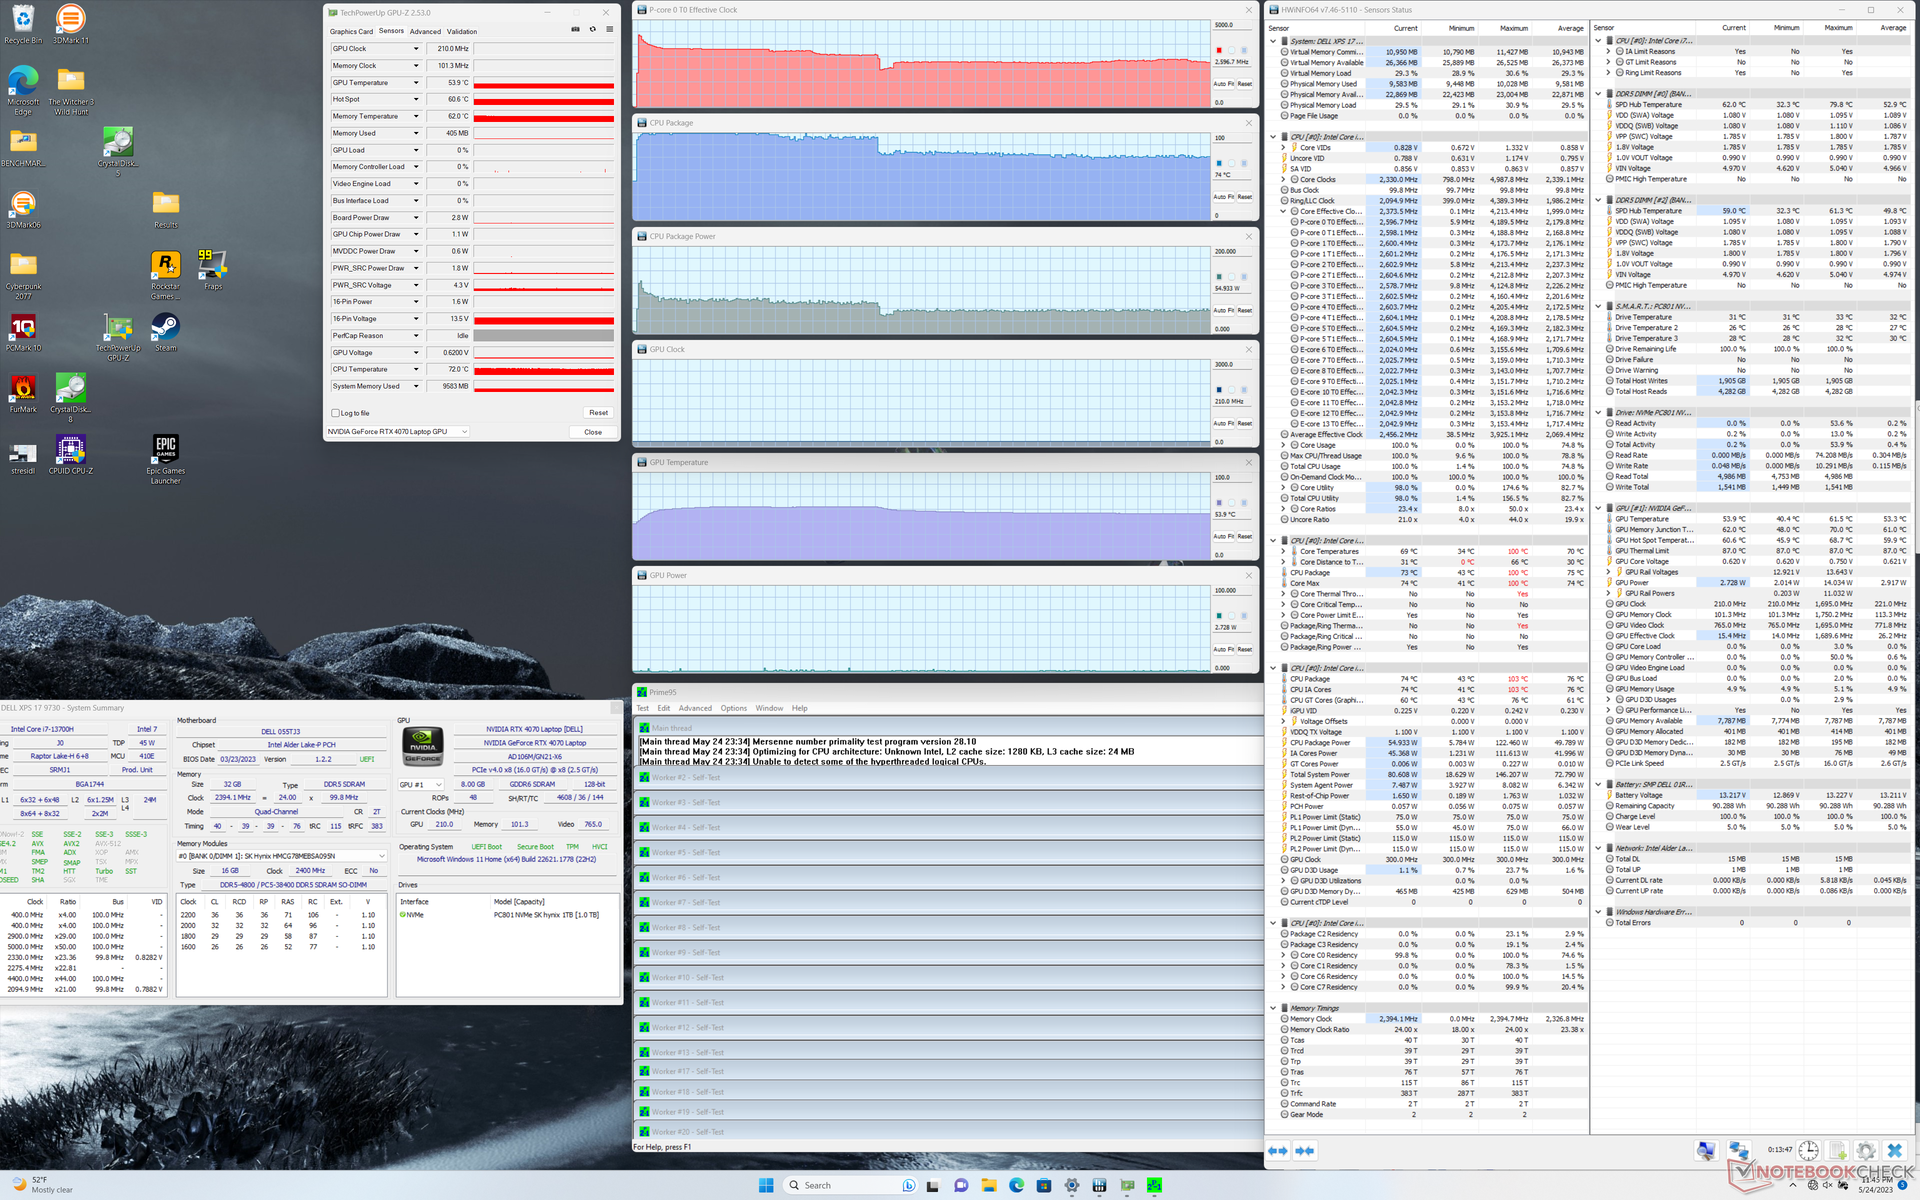
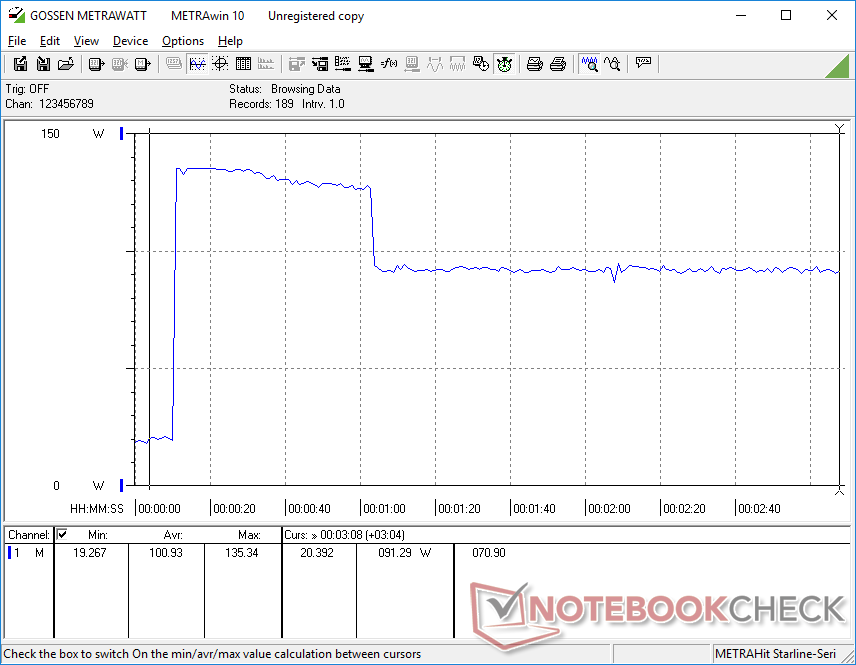
Po uruchomieniu Prime95 w celu obciążenia procesora, częstotliwość taktowania i moc pakietu wzrosły odpowiednio do 4,1 GHz i 122 W, trwając zaledwie kilka sekund. Następnie procesor systematycznie spadał do 3,4 GHz i 80 W, a kilka minut później do 2,6 GHz i 55 W. Ostateczny stabilny pobór mocy wynoszący 55 W odpowiada temu, co zaobserwowaliśmy w zeszłorocznym XPS 19 9720 co wyjaśniałoby ich podobną wydajność procesora po uwzględnieniu dławienia, jak wspomniano powyżej. Temperatura rdzenia była bardzo wysoka i wynosiła od 95 C do 100 C w ciągu pierwszych kilku minut testu, kiedy Turbo Boost był najbardziej aktywny, a następnie spadła i ustabilizowała się na poziomie 74 C.
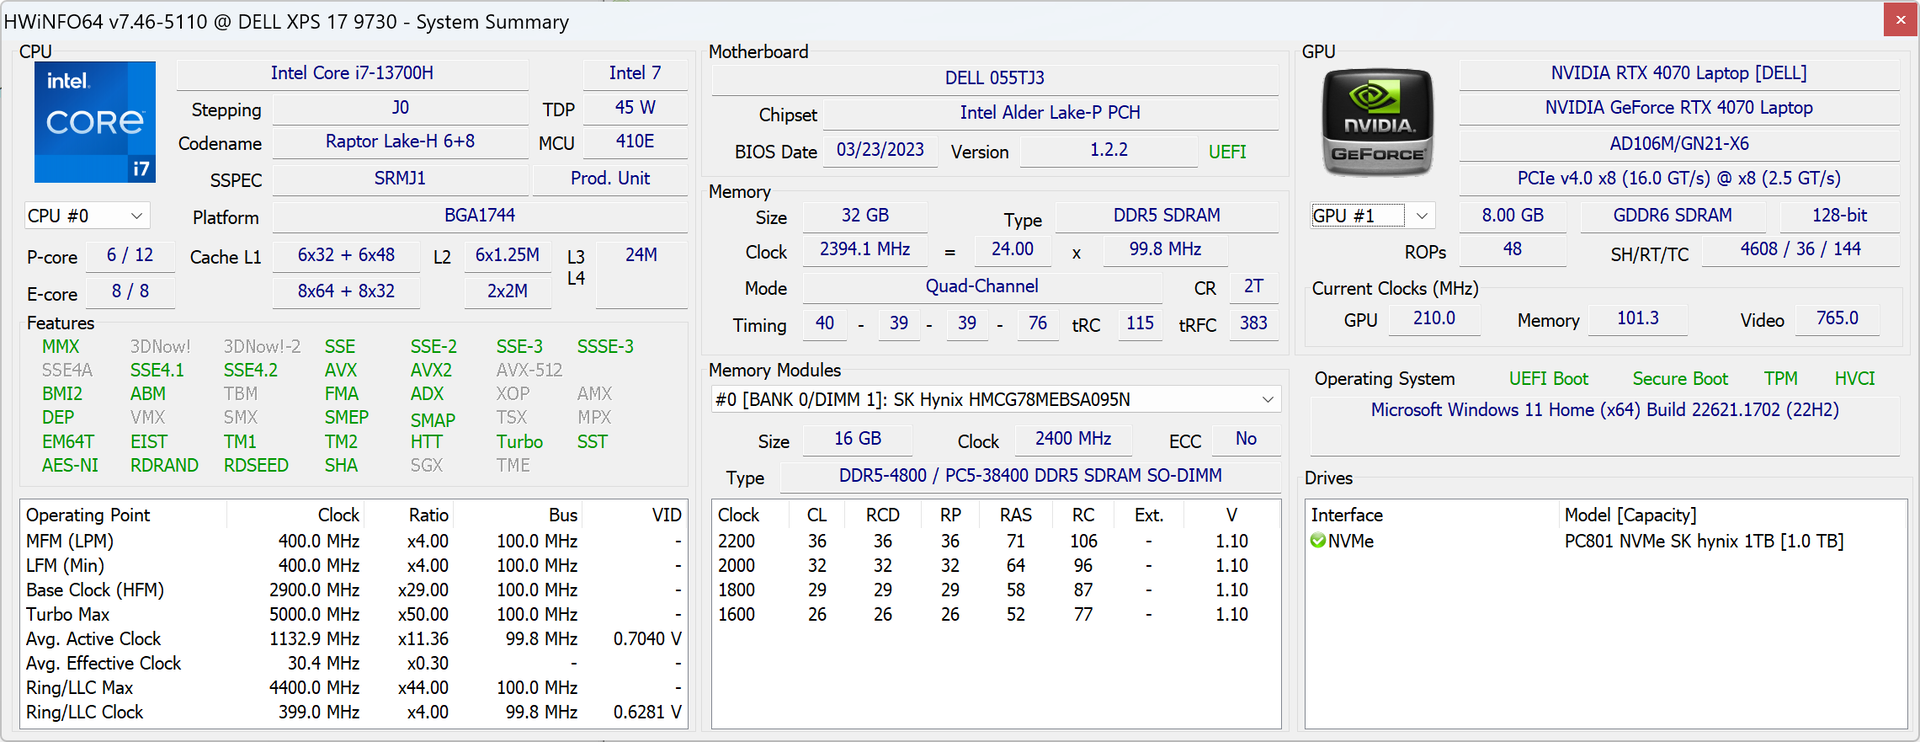
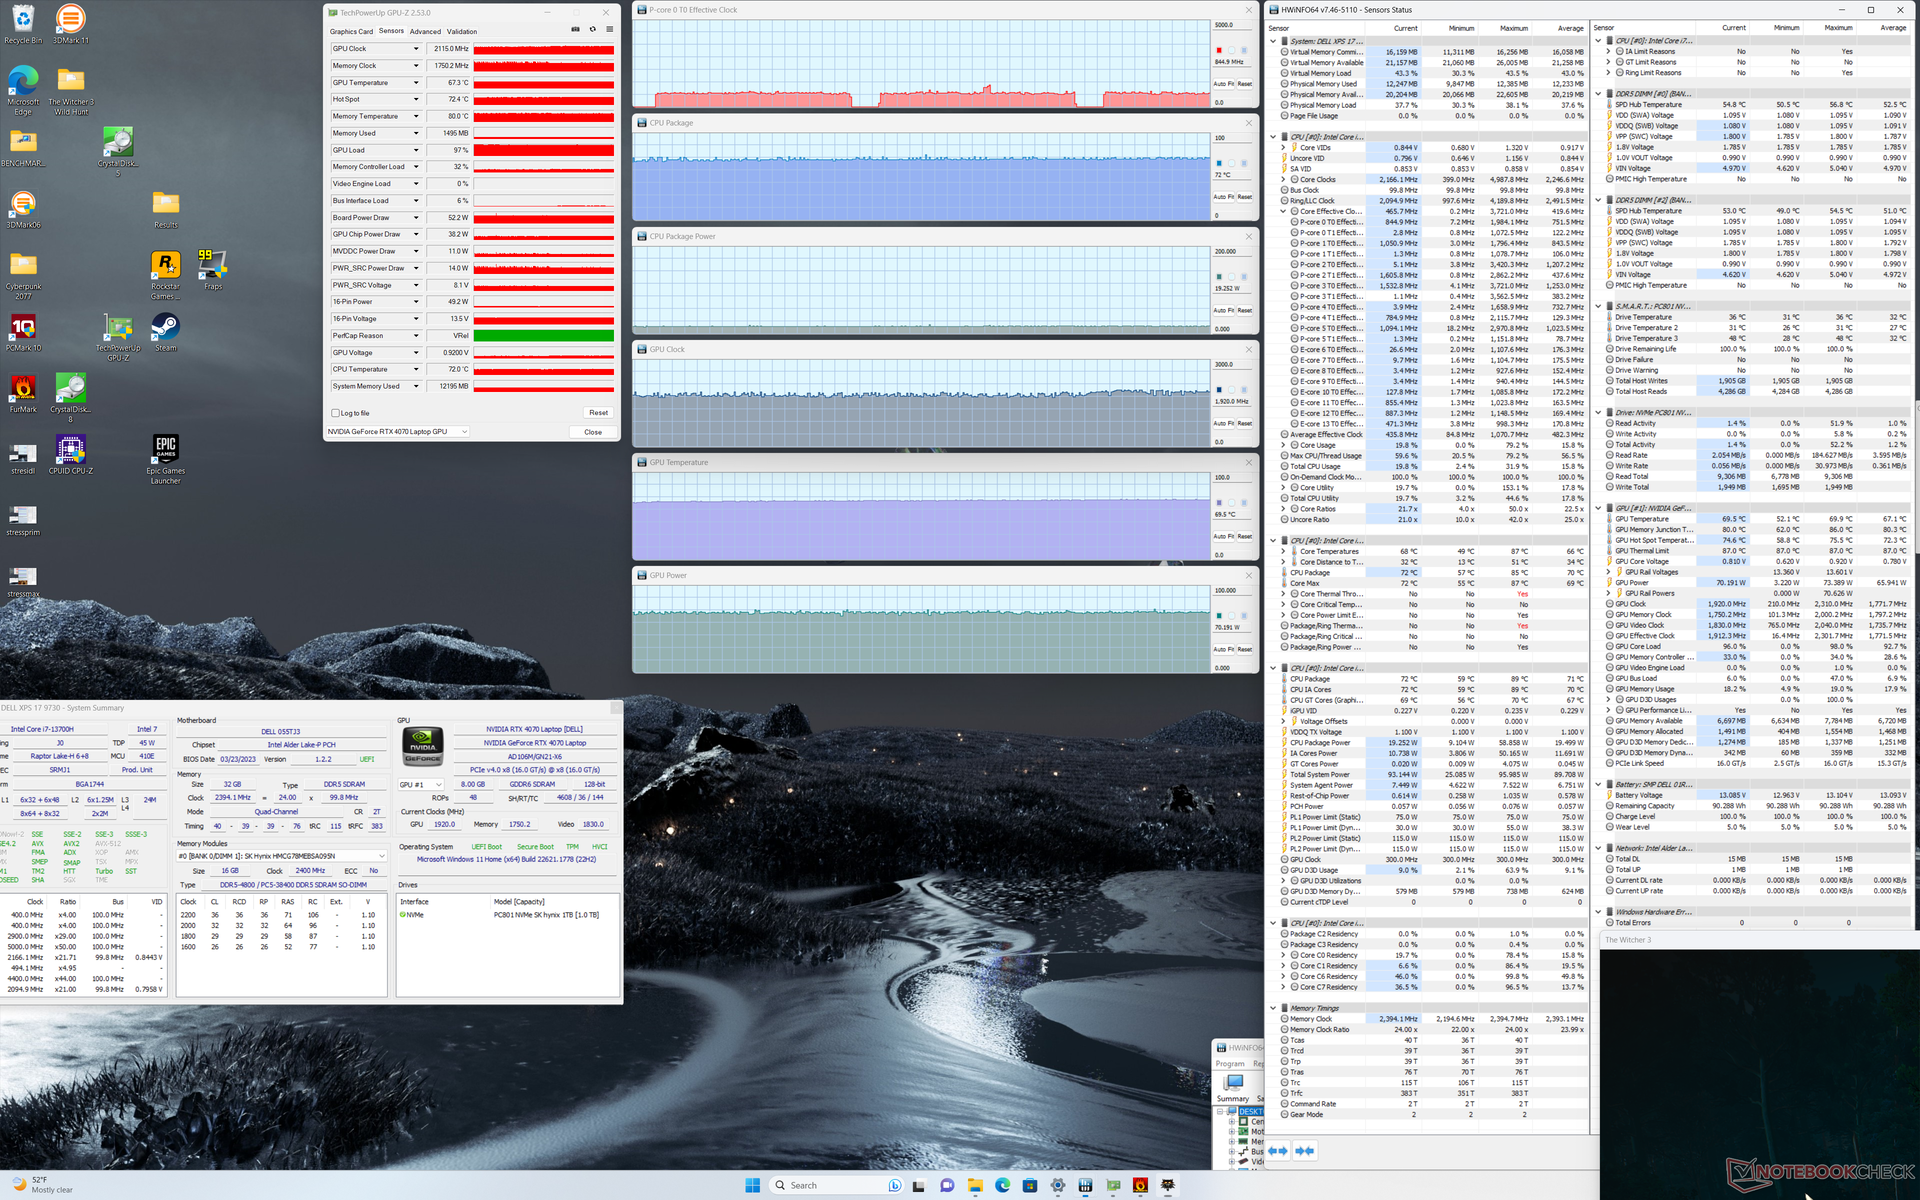
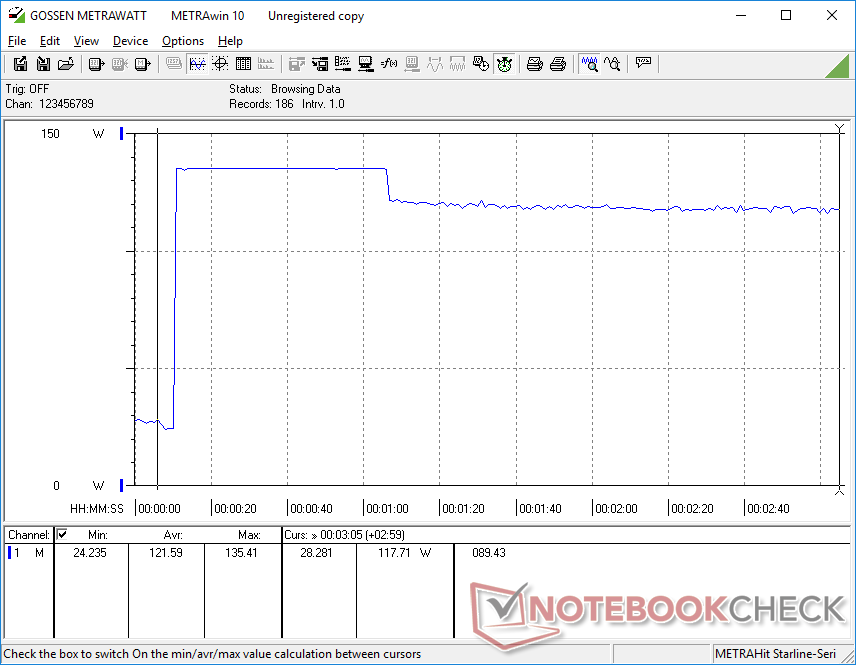
Częstotliwość taktowania GPU i temperatura podczas pracy Witcher 3 ustabilizowałyby się odpowiednio na poziomie 2115 MHz i 67 C, z których ten drugi odpowiada temu, co zaobserwowaliśmy w zeszłorocznym XPS 17 9720 z RTX 3060. Co ciekawe, GPU-Z zgłosiłby niższy pobór mocy na płycie wynoszący 52 W, podczas gdy HWiNFO zgłosiłby 70 W, jak pokazano na naszym zrzucie ekranu poniżej. Obie wartości wydają się być jednak stabilne.
Praca na zasilaniu bateryjnym ogranicza wydajność. Test Fire Strike na baterii zwróciłby wyniki fizyki i grafiki na poziomie odpowiednio 24847 i 21172 punktów, w porównaniu do 27094 i 24612 punktów przy zasilaniu sieciowym.
| Taktowanie CPU (GHz) | Taktowanie GPU (MHz) | Średnia temperatura CPU (°C) | Średnia temperatura GPU (°C) | |
| System w stanie spoczynku | -- | -- | 43 | 40 |
| Prime95Stress | 2.6 | -- | 74 | 54 |
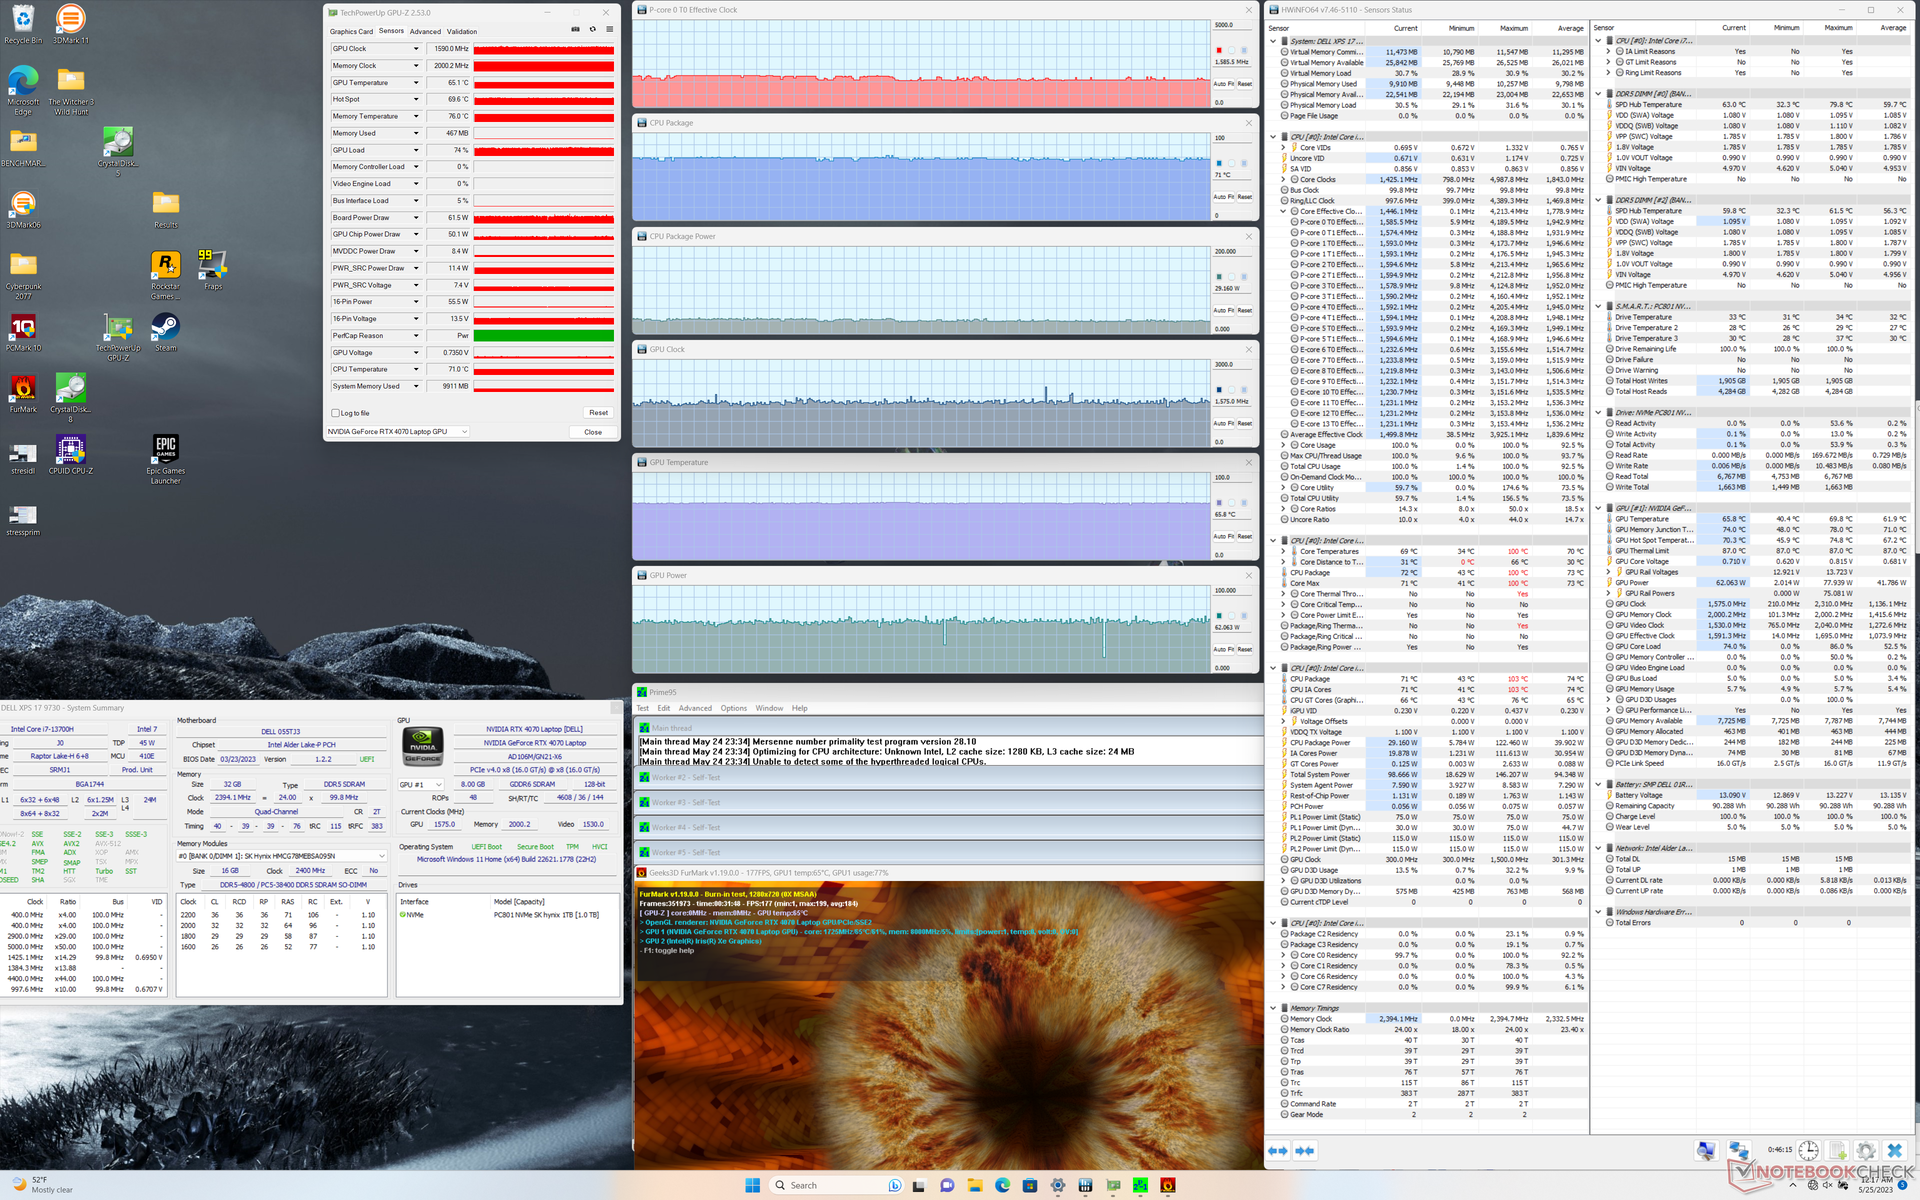
| Prime95+ FurMark Stress | 1.6 | 1590 | 71 | 65 |
| Witcher 3 Stres | 0.8 | 2115 | 72 | 67 |
Głośniki
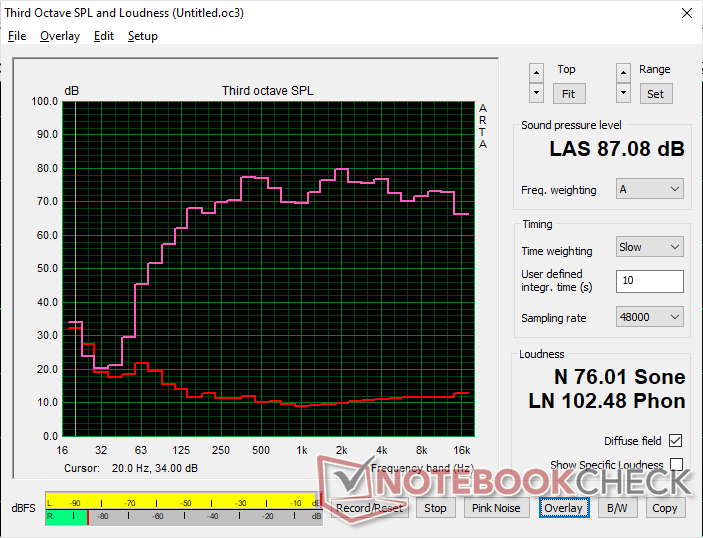
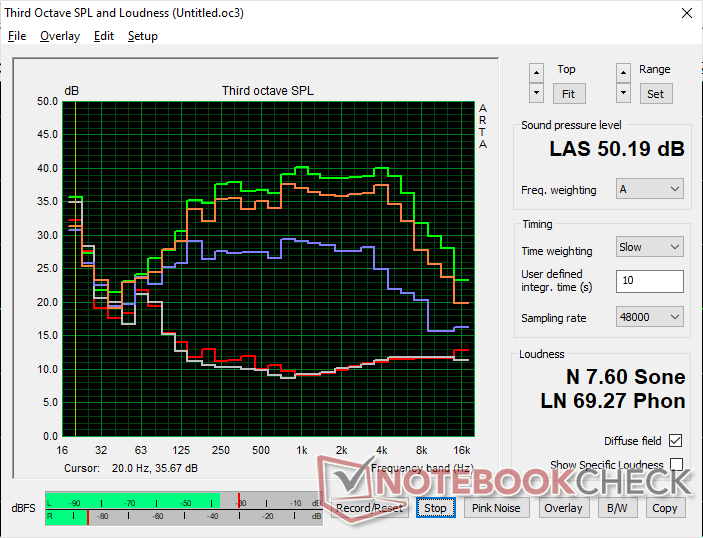
Dell XPS 17 9730 RTX 4070 analiza dźwięku
(+) | głośniki mogą odtwarzać stosunkowo głośno (87.1 dB)
Bas 100 - 315 Hz
(±) | zredukowany bas - średnio 7.2% niższy od mediany
(+) | bas jest liniowy (5.9% delta do poprzedniej częstotliwości)
Średnie 400 - 2000 Hz
(+) | zbalansowane środki średnie - tylko 3.3% od mediany
(+) | średnie są liniowe (5.1% delta do poprzedniej częstotliwości)
Wysokie 2–16 kHz
(+) | zrównoważone maksima - tylko 1.9% od mediany
(+) | wzloty są liniowe (3.4% delta do poprzedniej częstotliwości)
Ogólnie 100 - 16.000 Hz
(+) | ogólny dźwięk jest liniowy (7% różnicy w stosunku do mediany)
W porównaniu do tej samej klasy
» 5% wszystkich testowanych urządzeń w tej klasie było lepszych, 1% podobnych, 94% gorszych
» Najlepszy miał deltę 5%, średnia wynosiła ###średnia###%, najgorsza wynosiła 45%
W porównaniu do wszystkich testowanych urządzeń
» 1% wszystkich testowanych urządzeń było lepszych, 0% podobnych, 99% gorszych
» Najlepszy miał deltę 4%, średnia wynosiła ###średnia###%, najgorsza wynosiła 134%
Apple MacBook Pro 16 2021 M1 Pro analiza dźwięku
(+) | głośniki mogą odtwarzać stosunkowo głośno (84.7 dB)
Bas 100 - 315 Hz
(+) | dobry bas - tylko 3.8% od mediany
(+) | bas jest liniowy (5.2% delta do poprzedniej częstotliwości)
Średnie 400 - 2000 Hz
(+) | zbalansowane środki średnie - tylko 1.3% od mediany
(+) | średnie są liniowe (2.1% delta do poprzedniej częstotliwości)
Wysokie 2–16 kHz
(+) | zrównoważone maksima - tylko 1.9% od mediany
(+) | wzloty są liniowe (2.7% delta do poprzedniej częstotliwości)
Ogólnie 100 - 16.000 Hz
(+) | ogólny dźwięk jest liniowy (4.6% różnicy w stosunku do mediany)
W porównaniu do tej samej klasy
» 0% wszystkich testowanych urządzeń w tej klasie było lepszych, 0% podobnych, 100% gorszych
» Najlepszy miał deltę 5%, średnia wynosiła ###średnia###%, najgorsza wynosiła 45%
W porównaniu do wszystkich testowanych urządzeń
» 0% wszystkich testowanych urządzeń było lepszych, 0% podobnych, 100% gorszych
» Najlepszy miał deltę 4%, średnia wynosiła ###średnia###%, najgorsza wynosiła 134%
Zarządzanie energią - USB-C w pracy
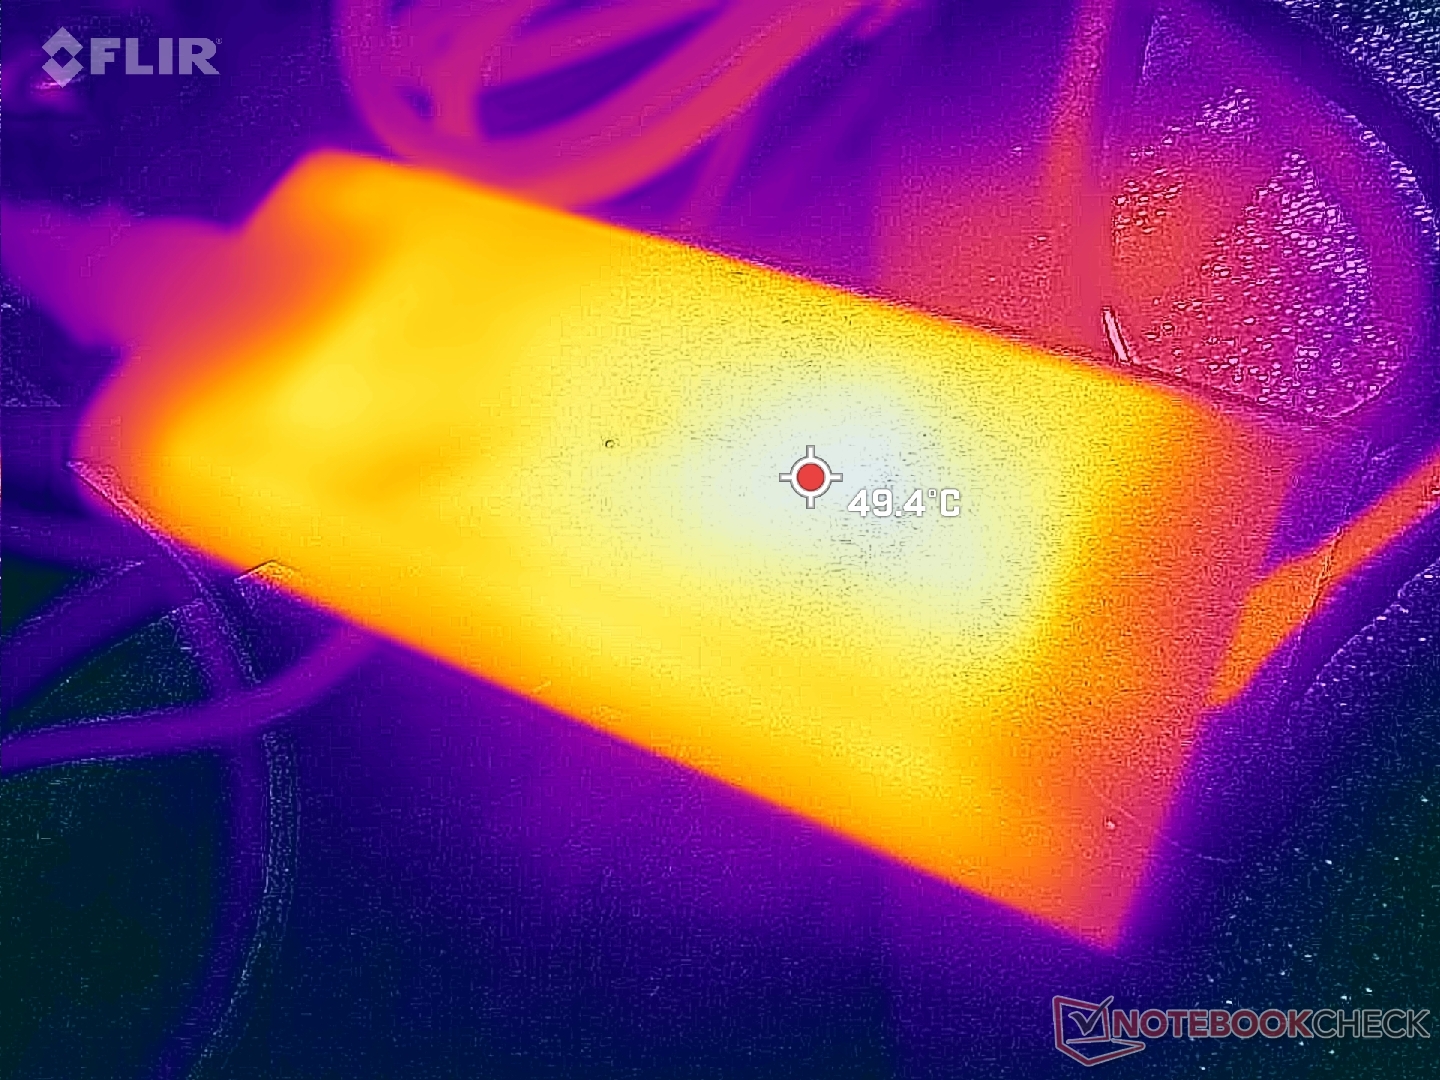
Pobór mocy - czy 130 W wystarczy?
Zużycie energii nie zmieniło się drastycznie w porównaniu ze starszym XPS 17 9720, ponieważ wszystkie dotychczasowe modele XPS 17 są dostarczane z tym samym zasilaczem USB-C o mocy 130 W. W porównaniu do innych laptopów z procesorami z serii H i kartami graficznymi GeForce RTX, zasilacz Dell o mocy 130 W jest jednym z najmniejszych zarówno pod względem rozmiaru, jak i mocy wyjściowej. Mały zasilacz rezygnuje z wyższej wydajności i szybszego ładowania na rzecz przenośności.
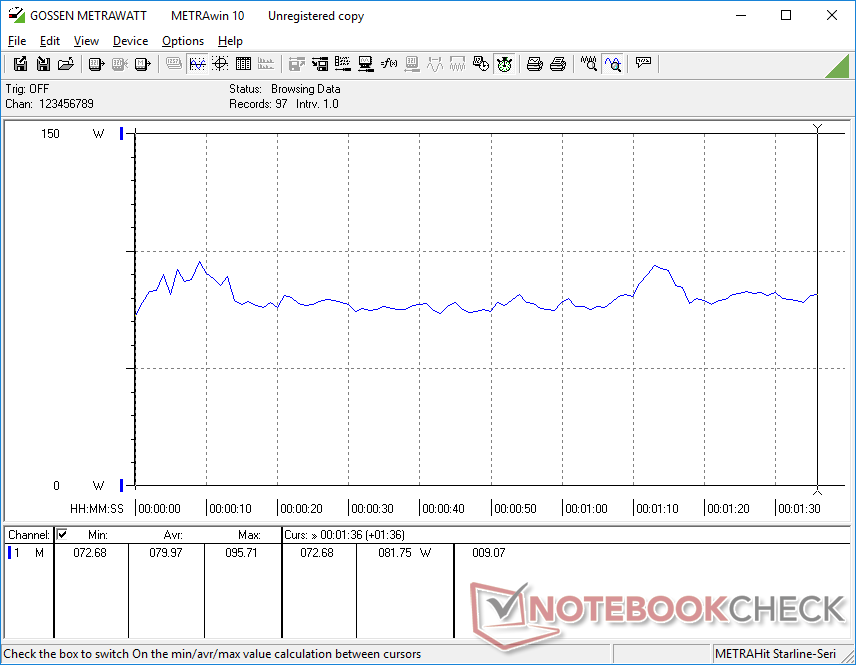
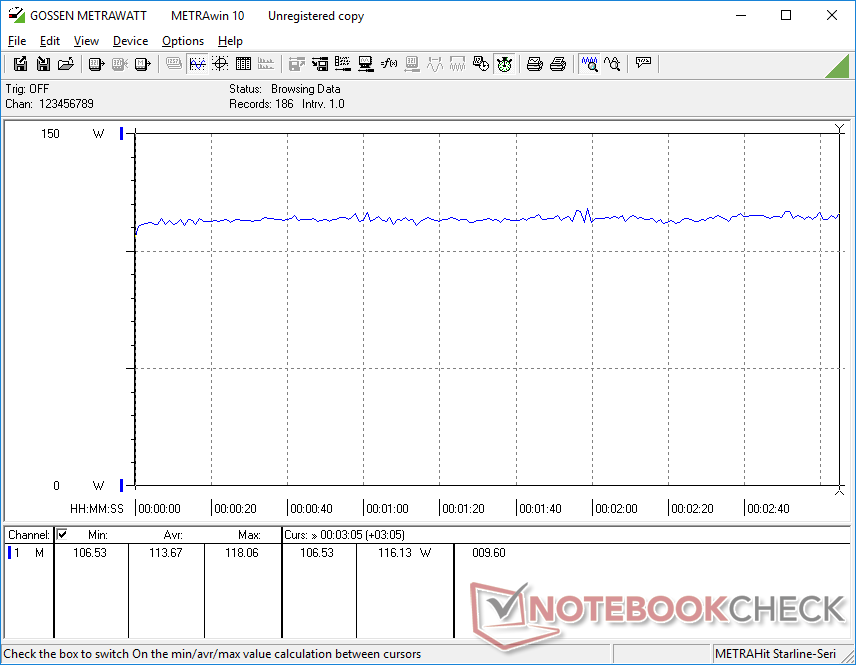
Mimo to, wyższa wydajność na wat Ada Lovelace w porównaniu do Ampere nadal pozwala XPS 17 9730 działać lepiej niż zeszłoroczny model przy tej samej kopercie mocy. Uruchamianie Witcher 3zużywa około 114 W zarówno na XPS 17 9720, jak i 9730, mimo że ten drugi oferuje o 30 procent wyższą wydajność graficzną. Zużycie energii przez procesor byłoby również bardziej stabilne dzięki dłuższej żywotności Turbo Boost w porównaniu do Core i7-12700H, jak wspomniano powyżej. Dell zdecydowanie zoptymalizował procesor i kartę graficzną najlepiej jak potrafił, aby zmieścić się w ograniczonym budżecie mocy.
| wyłączony / stan wstrzymania | |
| luz | |
| obciążenie |
|
Legenda:
min: | |
| Dell XPS 17 9730 RTX 4070 i7-13700H, GeForce RTX 4070 Laptop GPU, SK hynix PC801 HFS001TEJ9X101N, Sharp LQ170R1, 3840x2400, 17" | Dell XPS 17 9720 RTX 3060 i7-12700H, GeForce RTX 3060 Laptop GPU, Samsung PM9A1 MZVL21T0HCLR, IPS, 3840x2400, 17" | LG Gram 17 (2023) i7-1360P, Iris Xe G7 96EUs, Samsung PM9A1 MZVL21T0HCLR, IPS, 2560x1600, 17" | HP Envy 17-cr0079ng i7-1255U, GeForce RTX 2050 Mobile, Samsung PM991a MZVLQ1T0HBLB, IPS, 3840x2160, 17.3" | MSI Creator Z17 A12UGST-054 i9-12900H, GeForce RTX 3070 Ti Laptop GPU, Micron 3400 1TB MTFDKBA1T0TFH, IPS, 2560x1600, 17" | Apple MacBook Pro 16 2023 M2 Max M2 Max, M2 Max 38-Core GPU, Apple SSD AP2048Z, Mini-LED, 3456x2234, 16.2" | |
|---|---|---|---|---|---|---|
| Power Consumption | 6% | 59% | 34% | -79% | 16% | |
| Idle Minimum * (Watt) | 15 | 5.9 61% | 2.2 85% | 5.8 61% | 34.6 -131% | 5.2 65% |
| Idle Average * (Watt) | 23.6 | 15.8 33% | 8.9 62% | 14.3 39% | 43 -82% | 16.5 30% |
| Idle Maximum * (Watt) | 24.3 | 26.7 -10% | 11 55% | 18.4 24% | 44.9 -85% | 16.8 31% |
| Load Average * (Watt) | 80 | 117.4 -47% | 53 34% | 70 12% | 145 -81% | 113 -41% |
| Witcher 3 ultra * (Watt) | 113.7 | 114.8 -1% | 42.5 63% | 69.4 39% | 152.4 -34% | 92 19% |
| Load Maximum * (Watt) | 135.4 | 136.6 -1% | 64 53% | 93 31% | 220 -62% | 145 -7% |
* ... im mniej tym lepiej
Power Consumption Witcher 3 / Stresstest
Power Consumption external Monitor
Żywotność baterii - Długa żywotność, powolne ładowanie
Czas pracy w sieci WLAN jest o około godzinę dłuższy niż w zeszłorocznym XPS 17 9720, co daje łącznie 10 godzin przeglądania w świecie rzeczywistym. Dobrze jest widzieć, że żywotność baterii nie ucierpiała pomimo corocznego wzrostu ogólnej wydajności.
Ładowanie od pustego do pełnego naładowania trwa około 2 do 2,5 godziny w porównaniu do 1,5 godziny w przypadku większości innych laptopów. Należy pamiętać, że ładowanie byłoby jeszcze wolniejsze w przypadku wymagających obciążeń, takich jak gry, ze względu na ograniczony zasilacz sieciowy o mocy 130 W.
Warto zauważyć, że bateria nie będzie się powoli rozładowywać po podłączeniu do sieci i uruchomieniu gier lub innych wymagających obciążeń. Ten problem był specyficzny dla oryginalnego XPS 9700 i został rozwiązany począwszy od XPS 17 9710.
| Dell XPS 17 9730 RTX 4070 i7-13700H, GeForce RTX 4070 Laptop GPU, 97 Wh | Dell XPS 17 9720 RTX 3060 i7-12700H, GeForce RTX 3060 Laptop GPU, 97 Wh | LG Gram 17 (2023) i7-1360P, Iris Xe G7 96EUs, 80 Wh | HP Envy 17-cr0079ng i7-1255U, GeForce RTX 2050 Mobile, 55 Wh | MSI Creator Z17 A12UGST-054 i9-12900H, GeForce RTX 3070 Ti Laptop GPU, 90 Wh | Apple MacBook Pro 16 2023 M2 Max M2 Max, M2 Max 38-Core GPU, 99.6 Wh | |
|---|---|---|---|---|---|---|
| Czasy pracy | -11% | 63% | -4% | 28% | 24% | |
| Reader / Idle (h) | 19.1 | 25.7 35% | ||||
| WiFi v1.3 (h) | 10 | 8.7 -13% | 12.8 28% | 4.7 -53% | 5.5 -45% | 14.8 48% |
| Load (h) | 1.1 | 1 -9% | 2.5 127% | 1.6 45% | 2.2 100% | 1.1 0% |
| H.264 (h) | 14.5 | 5.5 | 5.5 | 18.7 |
Za
Przeciw
Werdykt - zrównoważony i zoptymalizowany
Jest takie powiedzenie, że nie powinno się wskakiwać w produkt lub projekt pierwszej generacji ze względu na potencjalne problemy lub niedociągnięcia, które wymagają dopracowania. Oryginalny oryginalny XPS 17 9700miał na przykład problemy z wyczerpywaniem się baterii, stabilnością liczby klatek na sekundę i słabą wydajnością Turbo Boost procesora. Po trzech pełnych latach ciągłych optymalizacji, najnowszy XPS 17 9730 bezpośrednio wyeliminował wszystkie te niedociągnięcia, aby być znacznie łatwiejszą rekomendacją. Zużycie energii nie jest już problemem, liczba klatek na sekundę jest stabilna, a Turbo Boost działa dłużej i bardziej spójnie.
XPS 17 9730 równoważy wysoką wydajność z ograniczonym budżetem mocy 130 W znacznie lepiej niż w przypadku XPS 15 9530. Wyposażony w dokładnie ten sam procesor Core i7 i kartę graficzną GeForce RTX 4070, nasz XPS 17 przewyższyłby swojego mniejszego brata odpowiednio o 10 do 15 procent i 50 do 60 procent. W szczególności wzrost GPU jest ogromny po prostu ze względu na wyższy docelowy TGP XPS 17. Jeśli wahasz się między XPS 15 i XPS 17, a wydajność graficzna ma ogromne znaczenie, to XPS 17 jest zdecydowanym zwycięzcą.
XPS 17 9730 ma wydajność, przenośność, wyświetlacz i potencjał do gier, aby zadowolić większość użytkowników domowych i biurowych. Niemniej jednak niektóre aspekty trzyletniego projektu stają się przestarzałe.
Wady modelu nie mogą być ignorowane. Jak na laptopa za ponad 3000 USD, marna kamera internetowa 1 MP bez migawki prywatności i brak obsługi Wi-Fi 6E są żenujące w tym przedziale cenowym. Wyświetlacz IPS 60 Hz również staje się przestarzały, gdy panele OLED i panele o wyższej częstotliwości odświeżania są obecnie powszechne. Zasilacz sieciowy o mocy 130 W jest bardziej jak ściana z cegieł, która uniemożliwia serii XPS 17 osiągnięcie zarówno szybszego ładowania, jak i wyższych docelowych wartości TGP. Bez wątpienia jest wiele rzeczy, które można poprawić, ale przynajmniej strona wydajnościowa jest na komfortowym poziomie, biorąc pod uwagę cienką konstrukcję.
Cena i dostępność
XPS 17 9730 nie jest jeszcze powszechnie dostępny u sprzedawców. Aby uzyskać najbardziej konfigurowalne opcje i natychmiastową wysyłkę, zalecamy zakup bezpośrednio od firmy Dell. Ceny zaczynają się od 2450 USD za najniższy SKU do 4300-5100 USD w przypadku pełnej konfiguracji.
Dell XPS 17 9730 RTX 4070
- 27/05/2023 v7 (old)
Allen Ngo
Przezroczystość
Wyboru urządzeń do recenzji dokonuje nasza redakcja. Próbka testowa została udostępniona autorowi jako pożyczka od producenta lub sprzedawcy detalicznego na potrzeby tej recenzji. Pożyczkodawca nie miał wpływu na tę recenzję, producent nie otrzymał też kopii tej recenzji przed publikacją. Nie było obowiązku publikowania tej recenzji. Jako niezależna firma medialna, Notebookcheck nie podlega władzy producentów, sprzedawców detalicznych ani wydawców.
Tak testuje Notebookcheck
Każdego roku Notebookcheck niezależnie sprawdza setki laptopów i smartfonów, stosując standardowe procedury, aby zapewnić porównywalność wszystkich wyników. Od około 20 lat stale rozwijamy nasze metody badawcze, ustanawiając przy tym standardy branżowe. W naszych laboratoriach testowych doświadczeni technicy i redaktorzy korzystają z wysokiej jakości sprzętu pomiarowego. Testy te obejmują wieloetapowy proces walidacji. Nasz kompleksowy system ocen opiera się na setkach uzasadnionych pomiarów i benchmarków, co pozwala zachować obiektywizm.Price comparison

