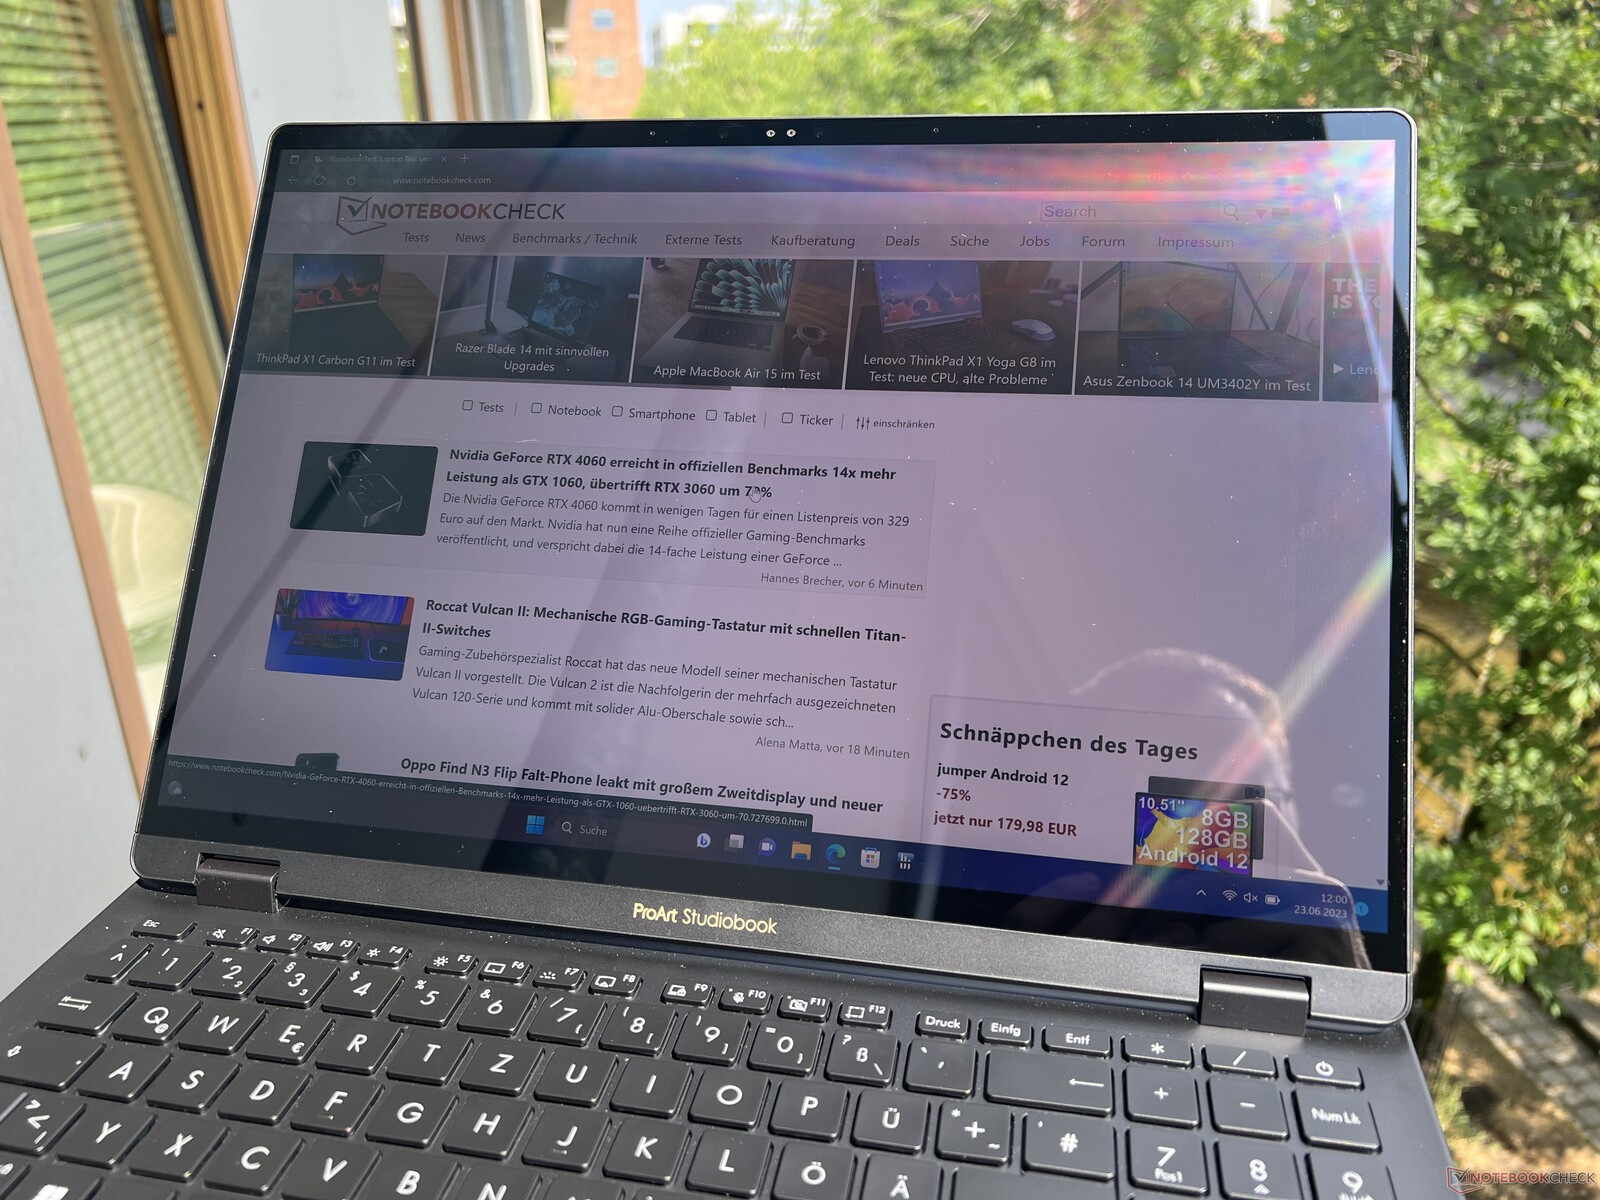
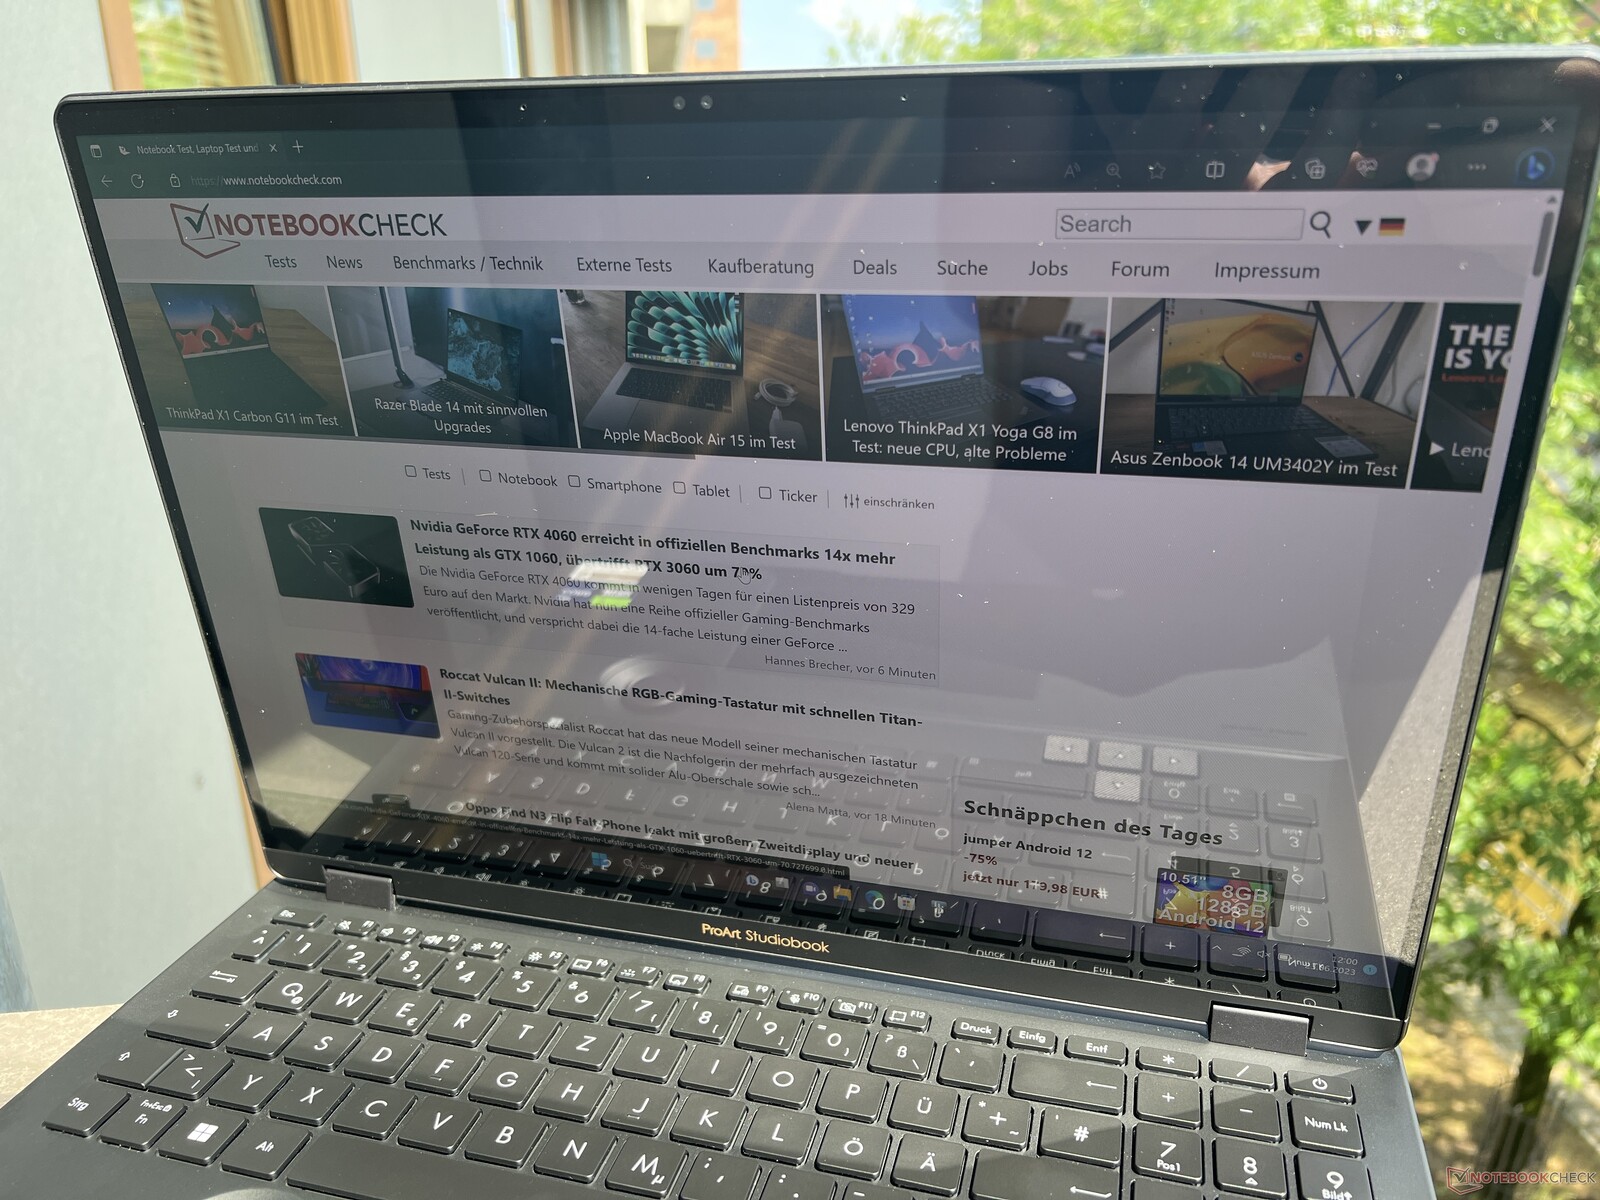
Recenzja Asus ProArt Studiobook 16 OLED: Multimedialny laptop z ekstremalną wydajnością procesora
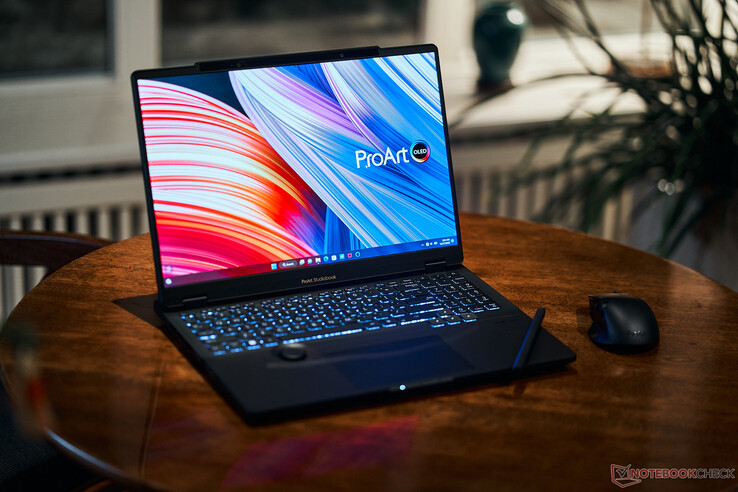
Asus kieruje ProArt Studiobook 16 przede wszystkim do kreatywnych użytkowników i oferuje dodatkową funkcję wprowadzania danych w DialPad. Obecny Studiobook 16 OLED 2023 wykorzystuje najszybszy mobilny procesor Intela, modelCore i9-13980HXw połączeniu z nowym GeForce RTX 4070 Laptop.wyświetlacz również uległ zmianie, ponieważ 4K OLED został zamieniony na model z ekranem dotykowym 3K o częstotliwości odświeżania 120 Hz. Nasze urządzenie testowe to wysokiej klasy model z 64 GB pamięci RAM i dyskiem SSD PCIe 4 TB za 3999 EUR (4380 USD). Alternatywnie, dostępny jest również wariant z RTX 4070 Laptop, 32 GB RAM i 2 TB SSD za 3499 EUR (3800 USD) lub RTX 4060 Laptopz 32 GB pamięci RAM i dyskiem SSD 1 TB za 2999 EUR (3300 USD).
Potencjalni konkurenci w porównaniu
Ocena | Data | Model | Waga | Wysokość | Rozmiar | Rezolucja | Cena |
|---|---|---|---|---|---|---|---|
| 86.1 % v7 (old) | 06/2023 | Asus ProArt Studiobook 16 OLED H7604 i9-13980HX, GeForce RTX 4070 Laptop GPU | 2.4 kg | 23.9 mm | 16.00" | 3200x2000 | |
| 86.2 % v7 (old) | 03/2023 | Gigabyte AERO 16 OLED BSF i9-13900H, GeForce RTX 4070 Laptop GPU | 2.1 kg | 18 mm | 16.00" | 3840x2400 | |
| 89.4 % v7 (old) | 04/2023 | Samsung Galaxy Book3 Ultra 16 i7-13700H, GeForce RTX 4050 Laptop GPU | 1.8 kg | 16.5 mm | 16.00" | 2880x1800 | |
| 89.2 % v7 (old) | 04/2023 | MSI Stealth 17 Studio A13VH-014 i9-13900H, GeForce RTX 4080 Laptop GPU | 3 kg | 21.3 mm | 17.30" | 3840x2160 | |
| 93.7 % v7 (old) | 03/2023 | Apple MacBook Pro 16 2023 M2 Max M2 Max, M2 Max 38-Core GPU | 2.2 kg | 16.8 mm | 16.20" | 3456x2234 | |
| 88 % v7 (old) | 04/2023 | Asus Zephyrus Duo 16 GX650PY-NM006W R9 7945HX, GeForce RTX 4090 Laptop GPU | 2.7 kg | 29.7 mm | 16.00" | 2560x1600 |
Sprawa - ProArt jest ograniczony
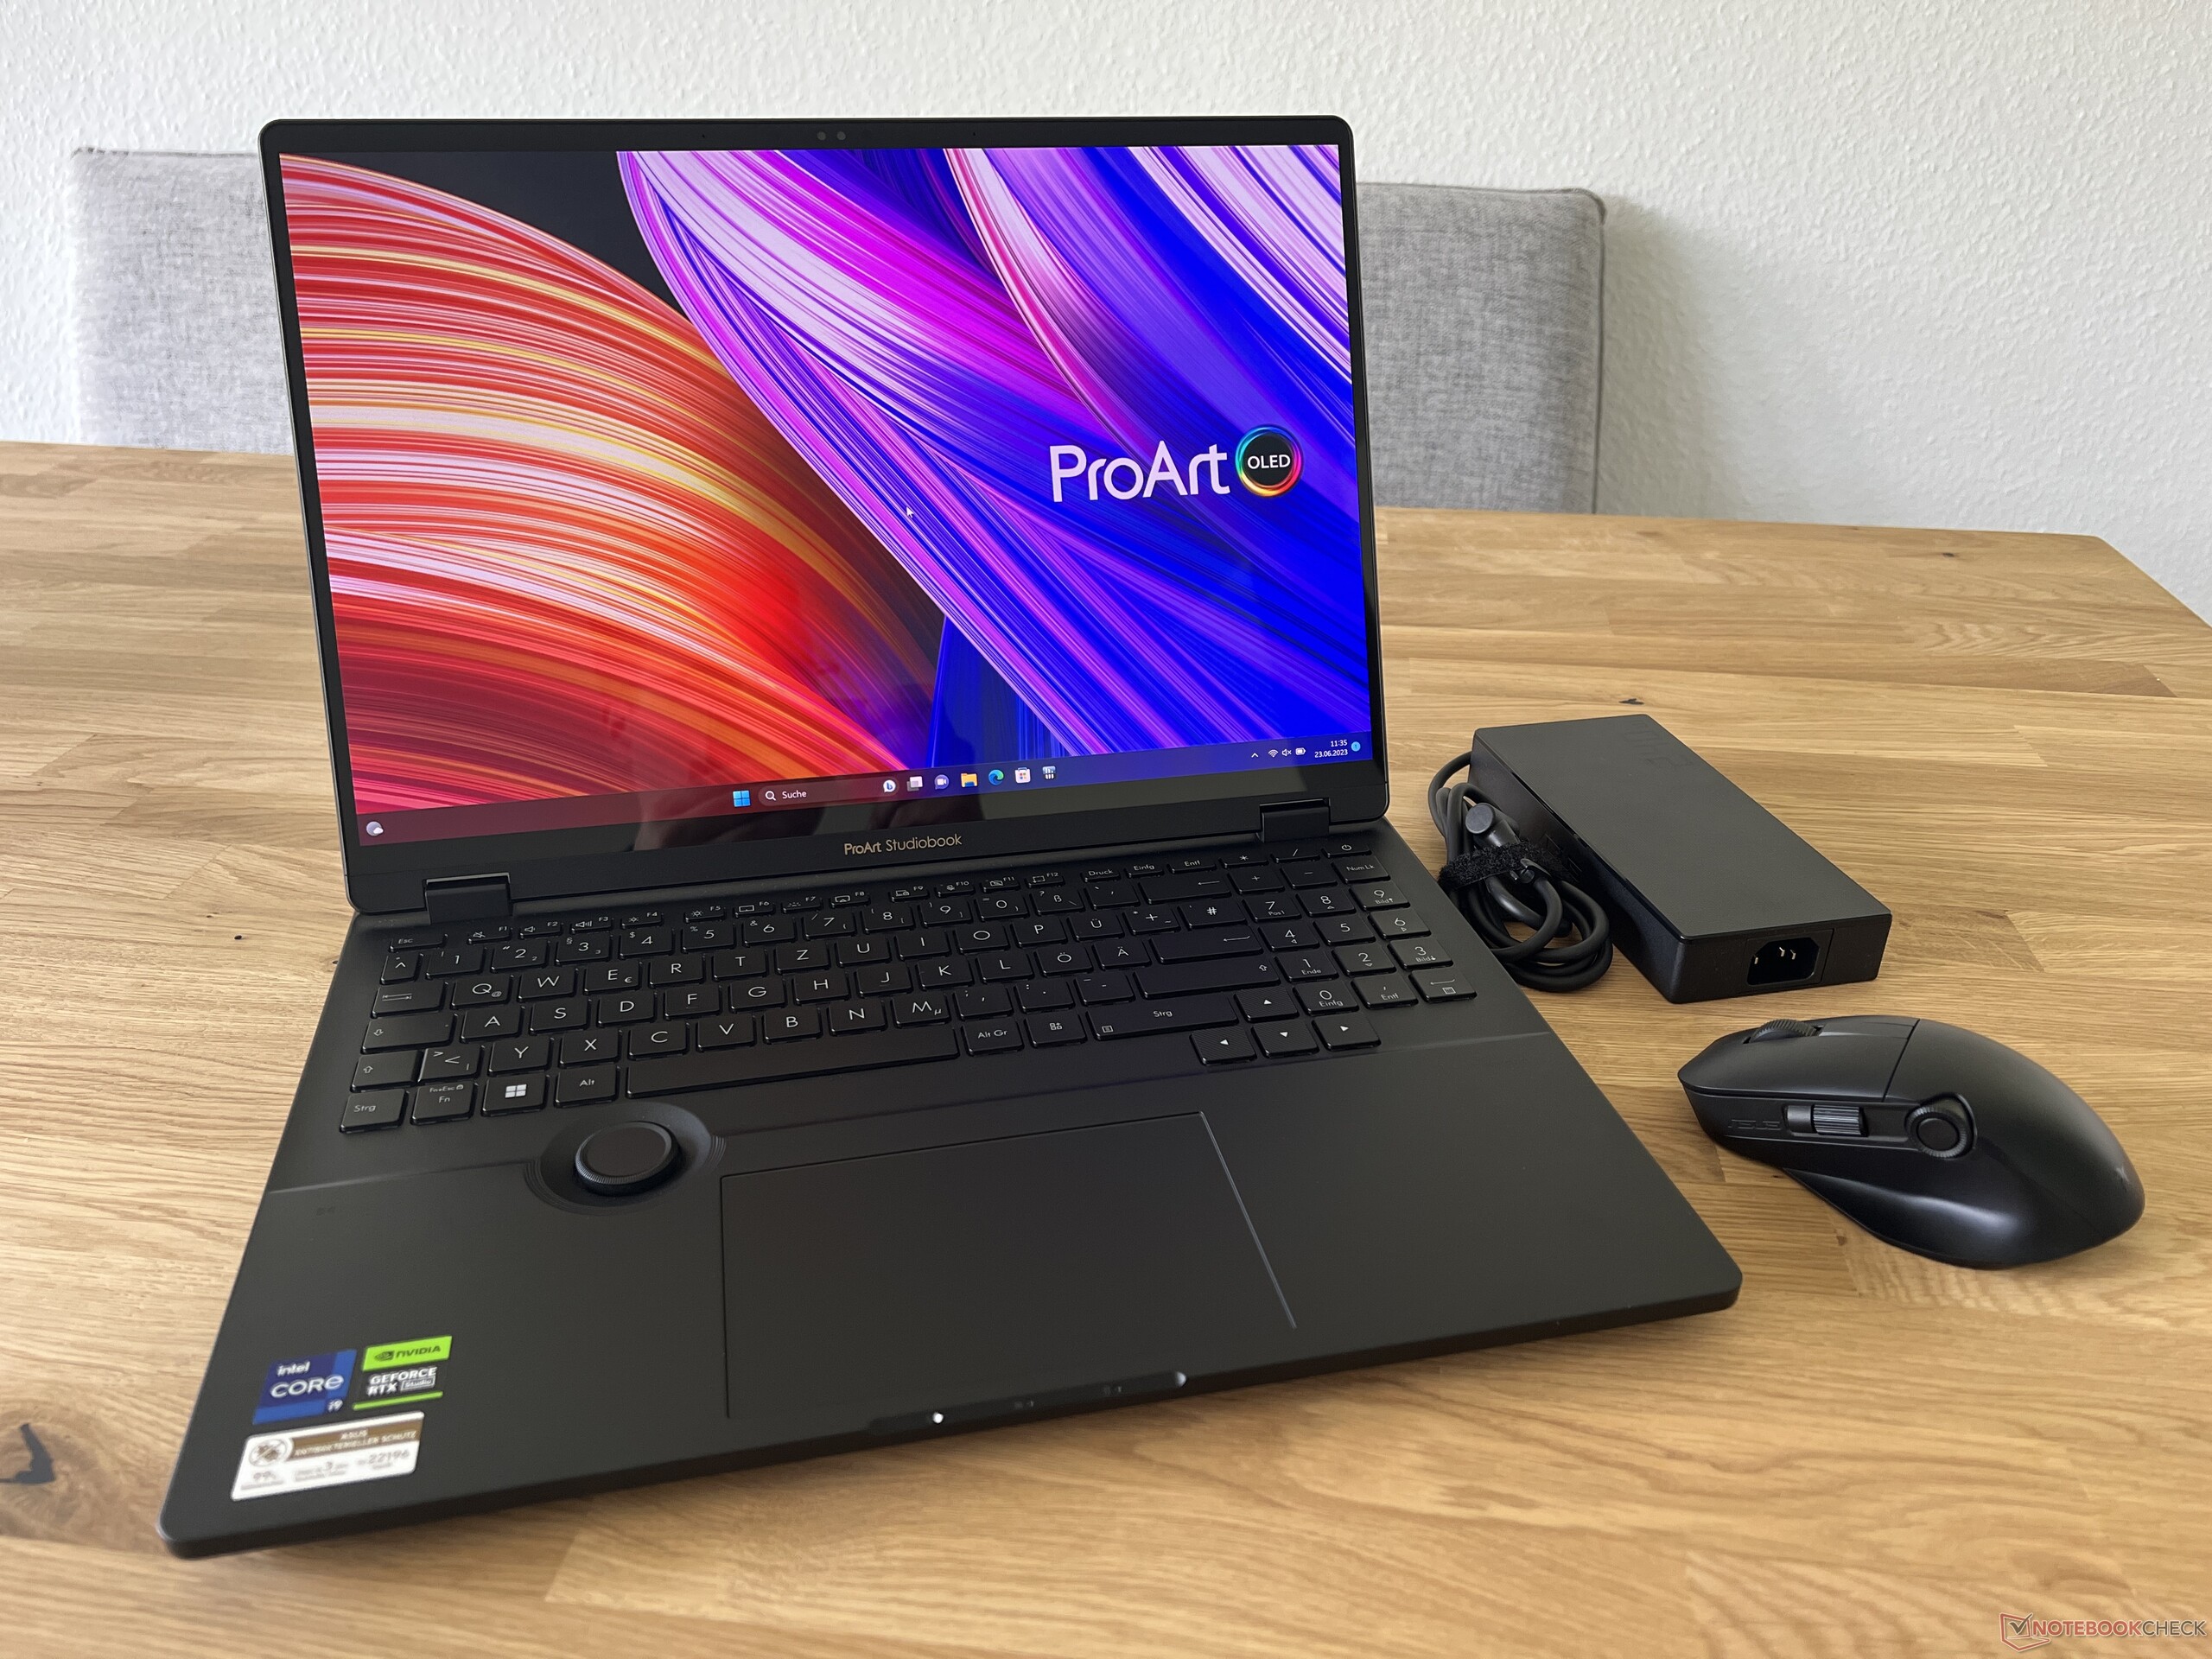
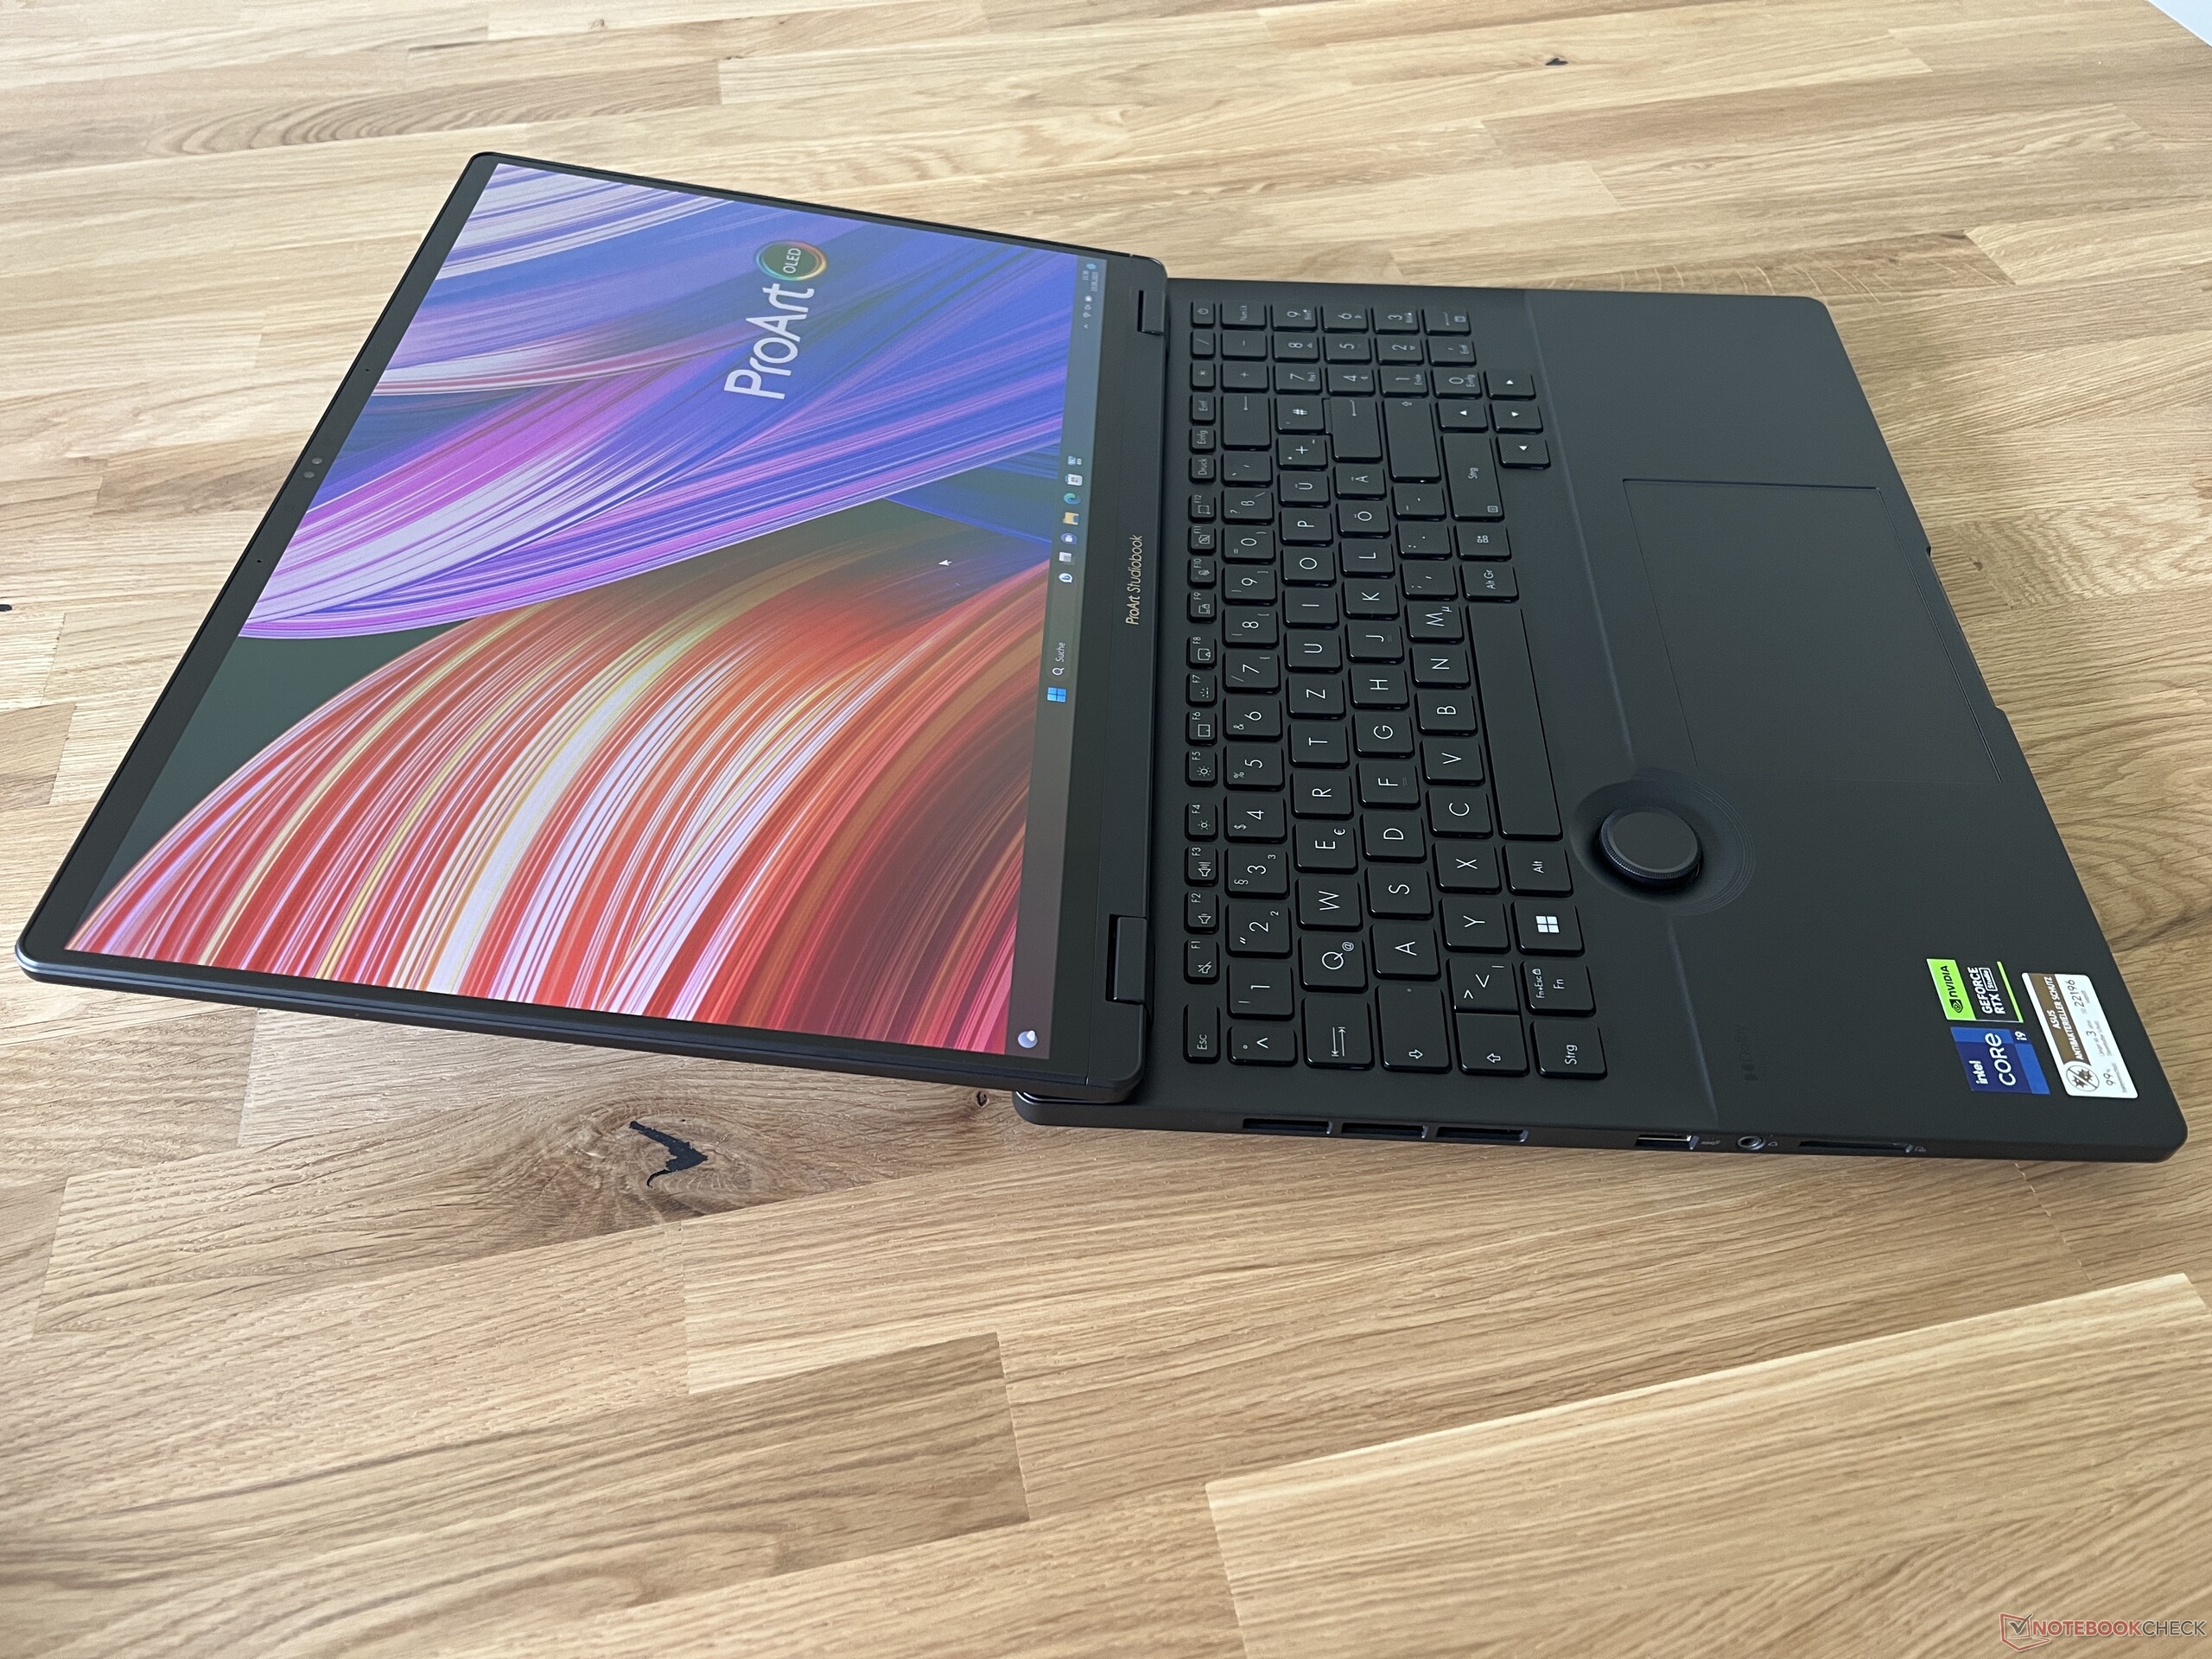
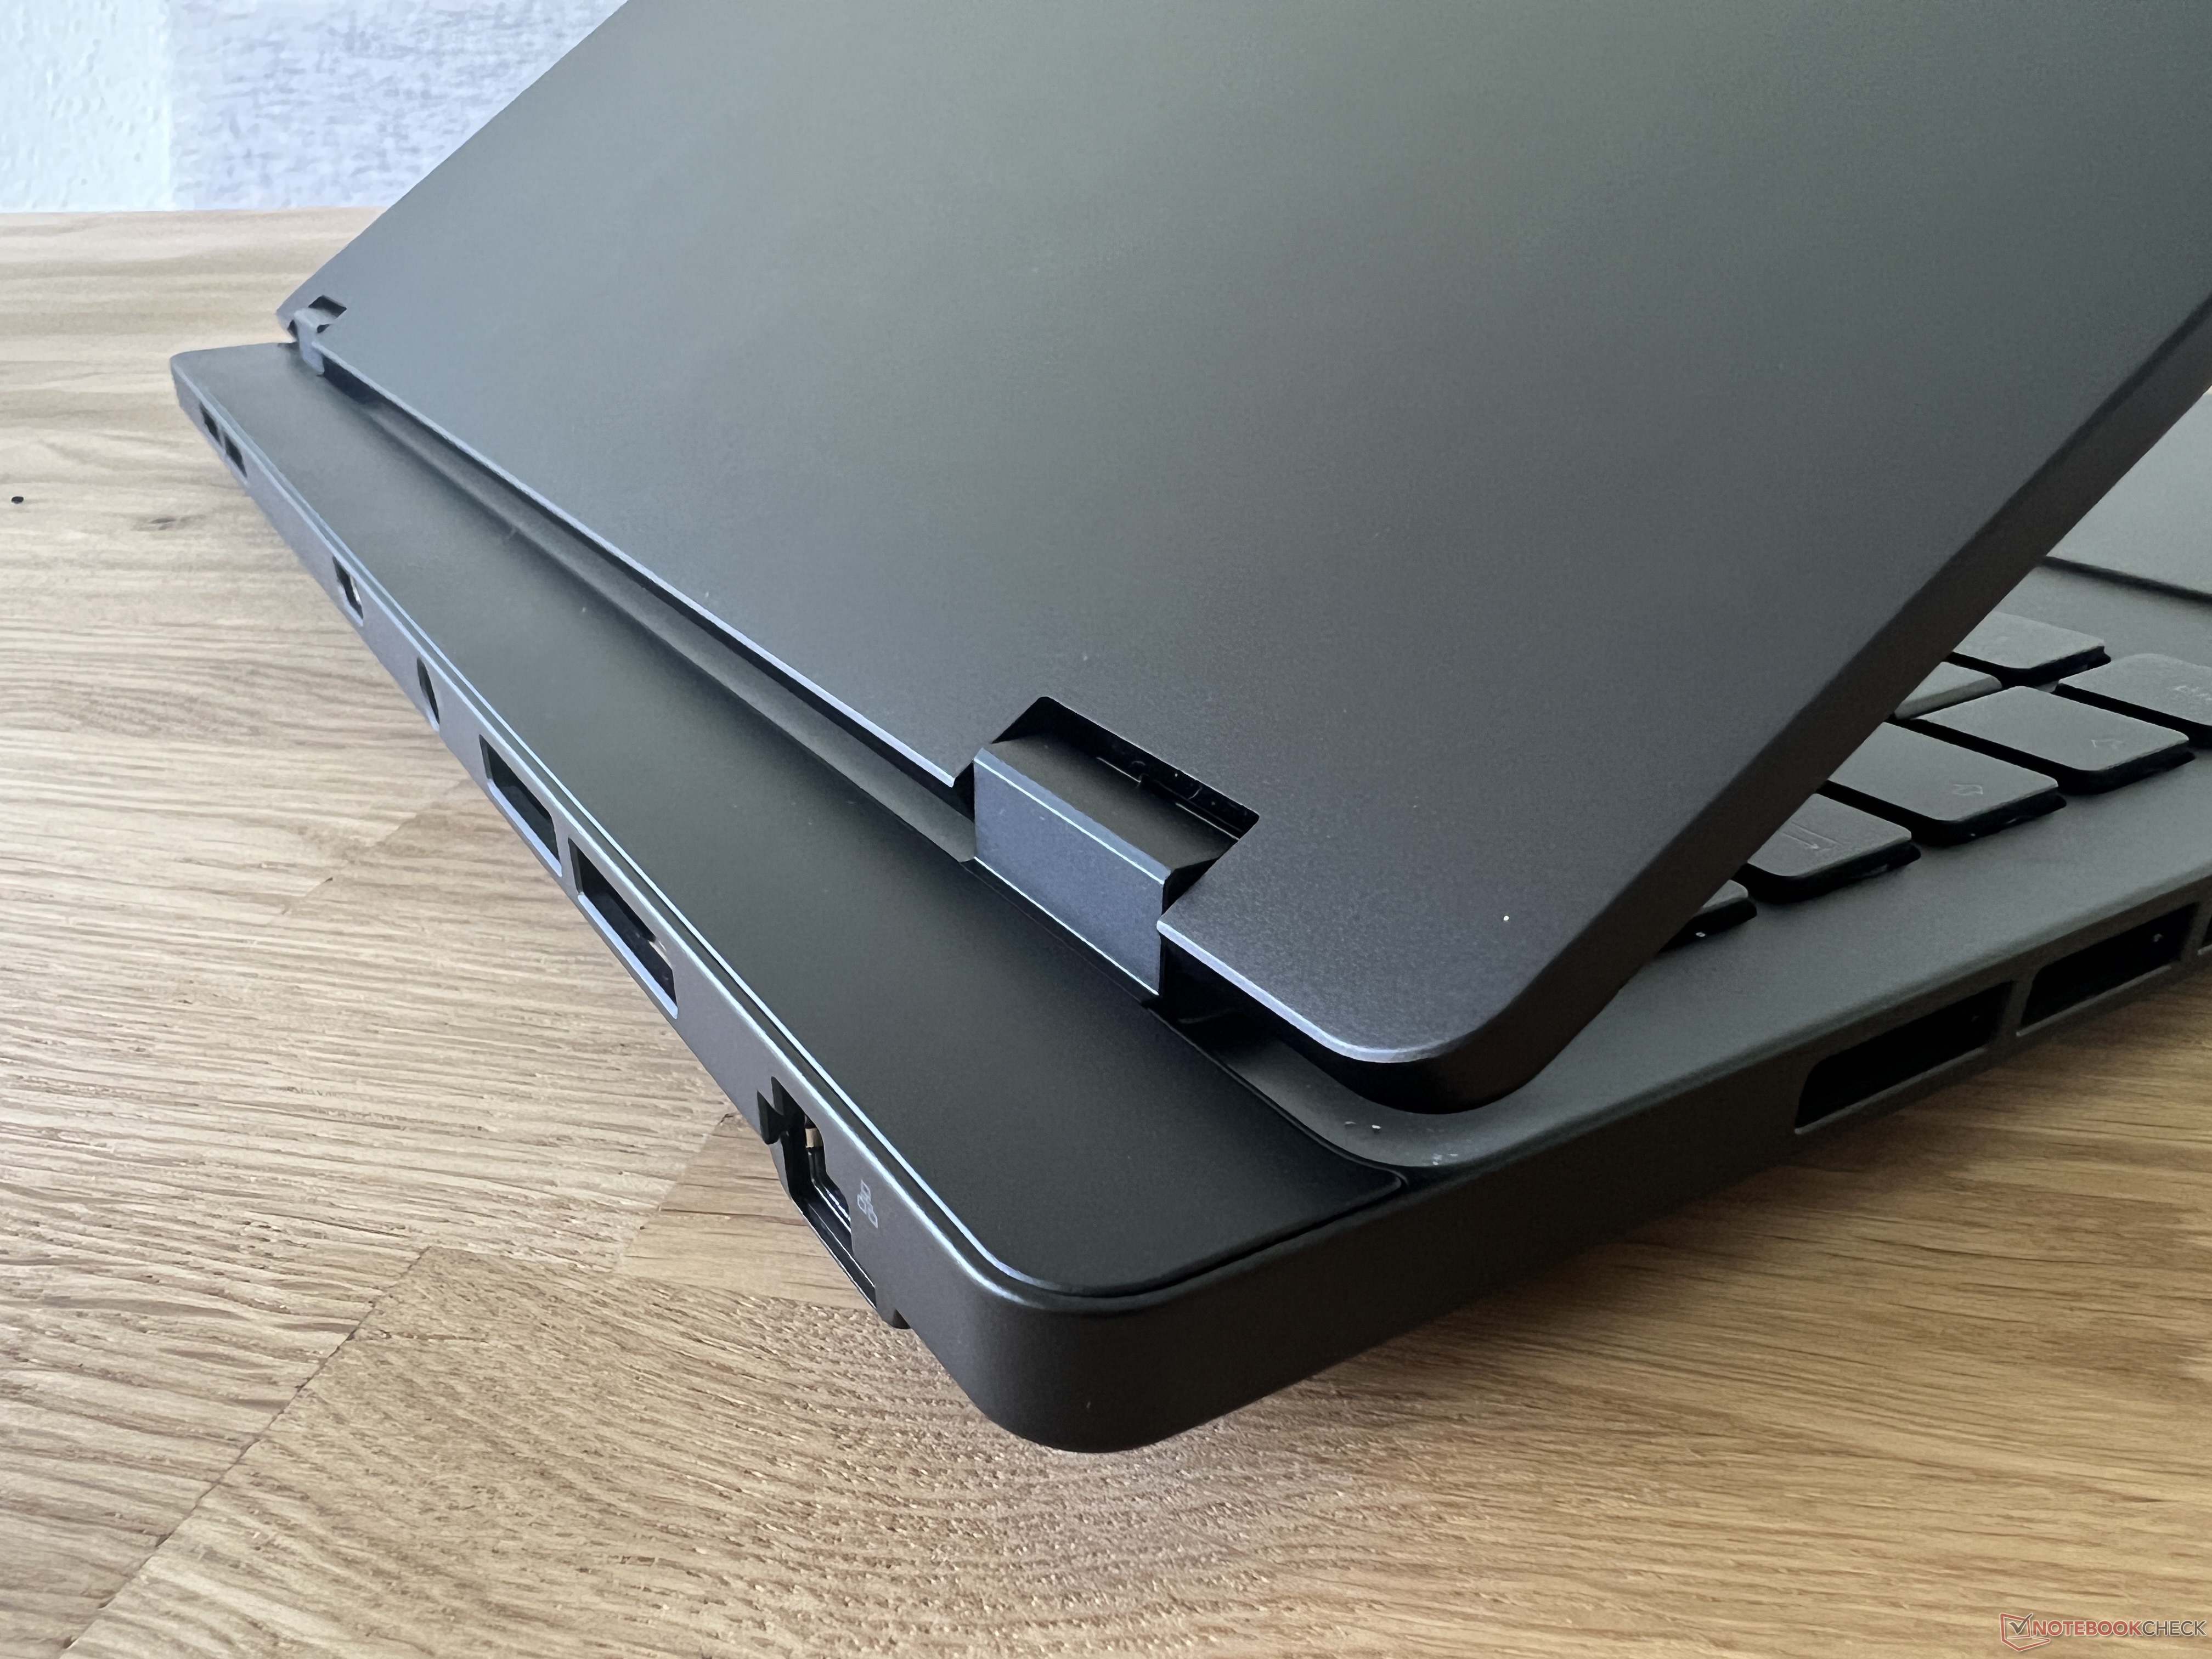
Asus zastosował w ProArt Studiobook 16 czarny plastik, który sprawia wrażenie wysokiej jakości. Jedynym problemem są gładkie powierzchnie, które są bardzo podatne na odciski palców. Ogólnie rzecz biorąc, projekt jest bardzo powściągliwy i poza logo ProArt na pokrywie nie ma innych wizualnych akcentów. Gdy tylko otworzysz pokrywę, duży DialPad pod klawiaturą natychmiast przyciąga wzrok. Pokrywa znajduje się nieco z przodu jednostki bazowej, ale pozwala to również na maksymalny kąt otwarcia wynoszący prawie 180 stopni
Stabilność jest doskonała, zarówno jednostki bazowej, jak i pokrywy. Pod wpływem naprężeń skrętnych nie słychać żadnych skrzypnięć, nie ma też mowy o wgnieceniach. Zawiasy są dobrze wyregulowane: skutecznie zapobiegają kołysaniu i utrzymują ekran bezpiecznie na miejscu. Tylko przy bardzo małych kątach (poniżej 20 stopni) pokrywa opada samoczynnie pod wpływem ciężaru.
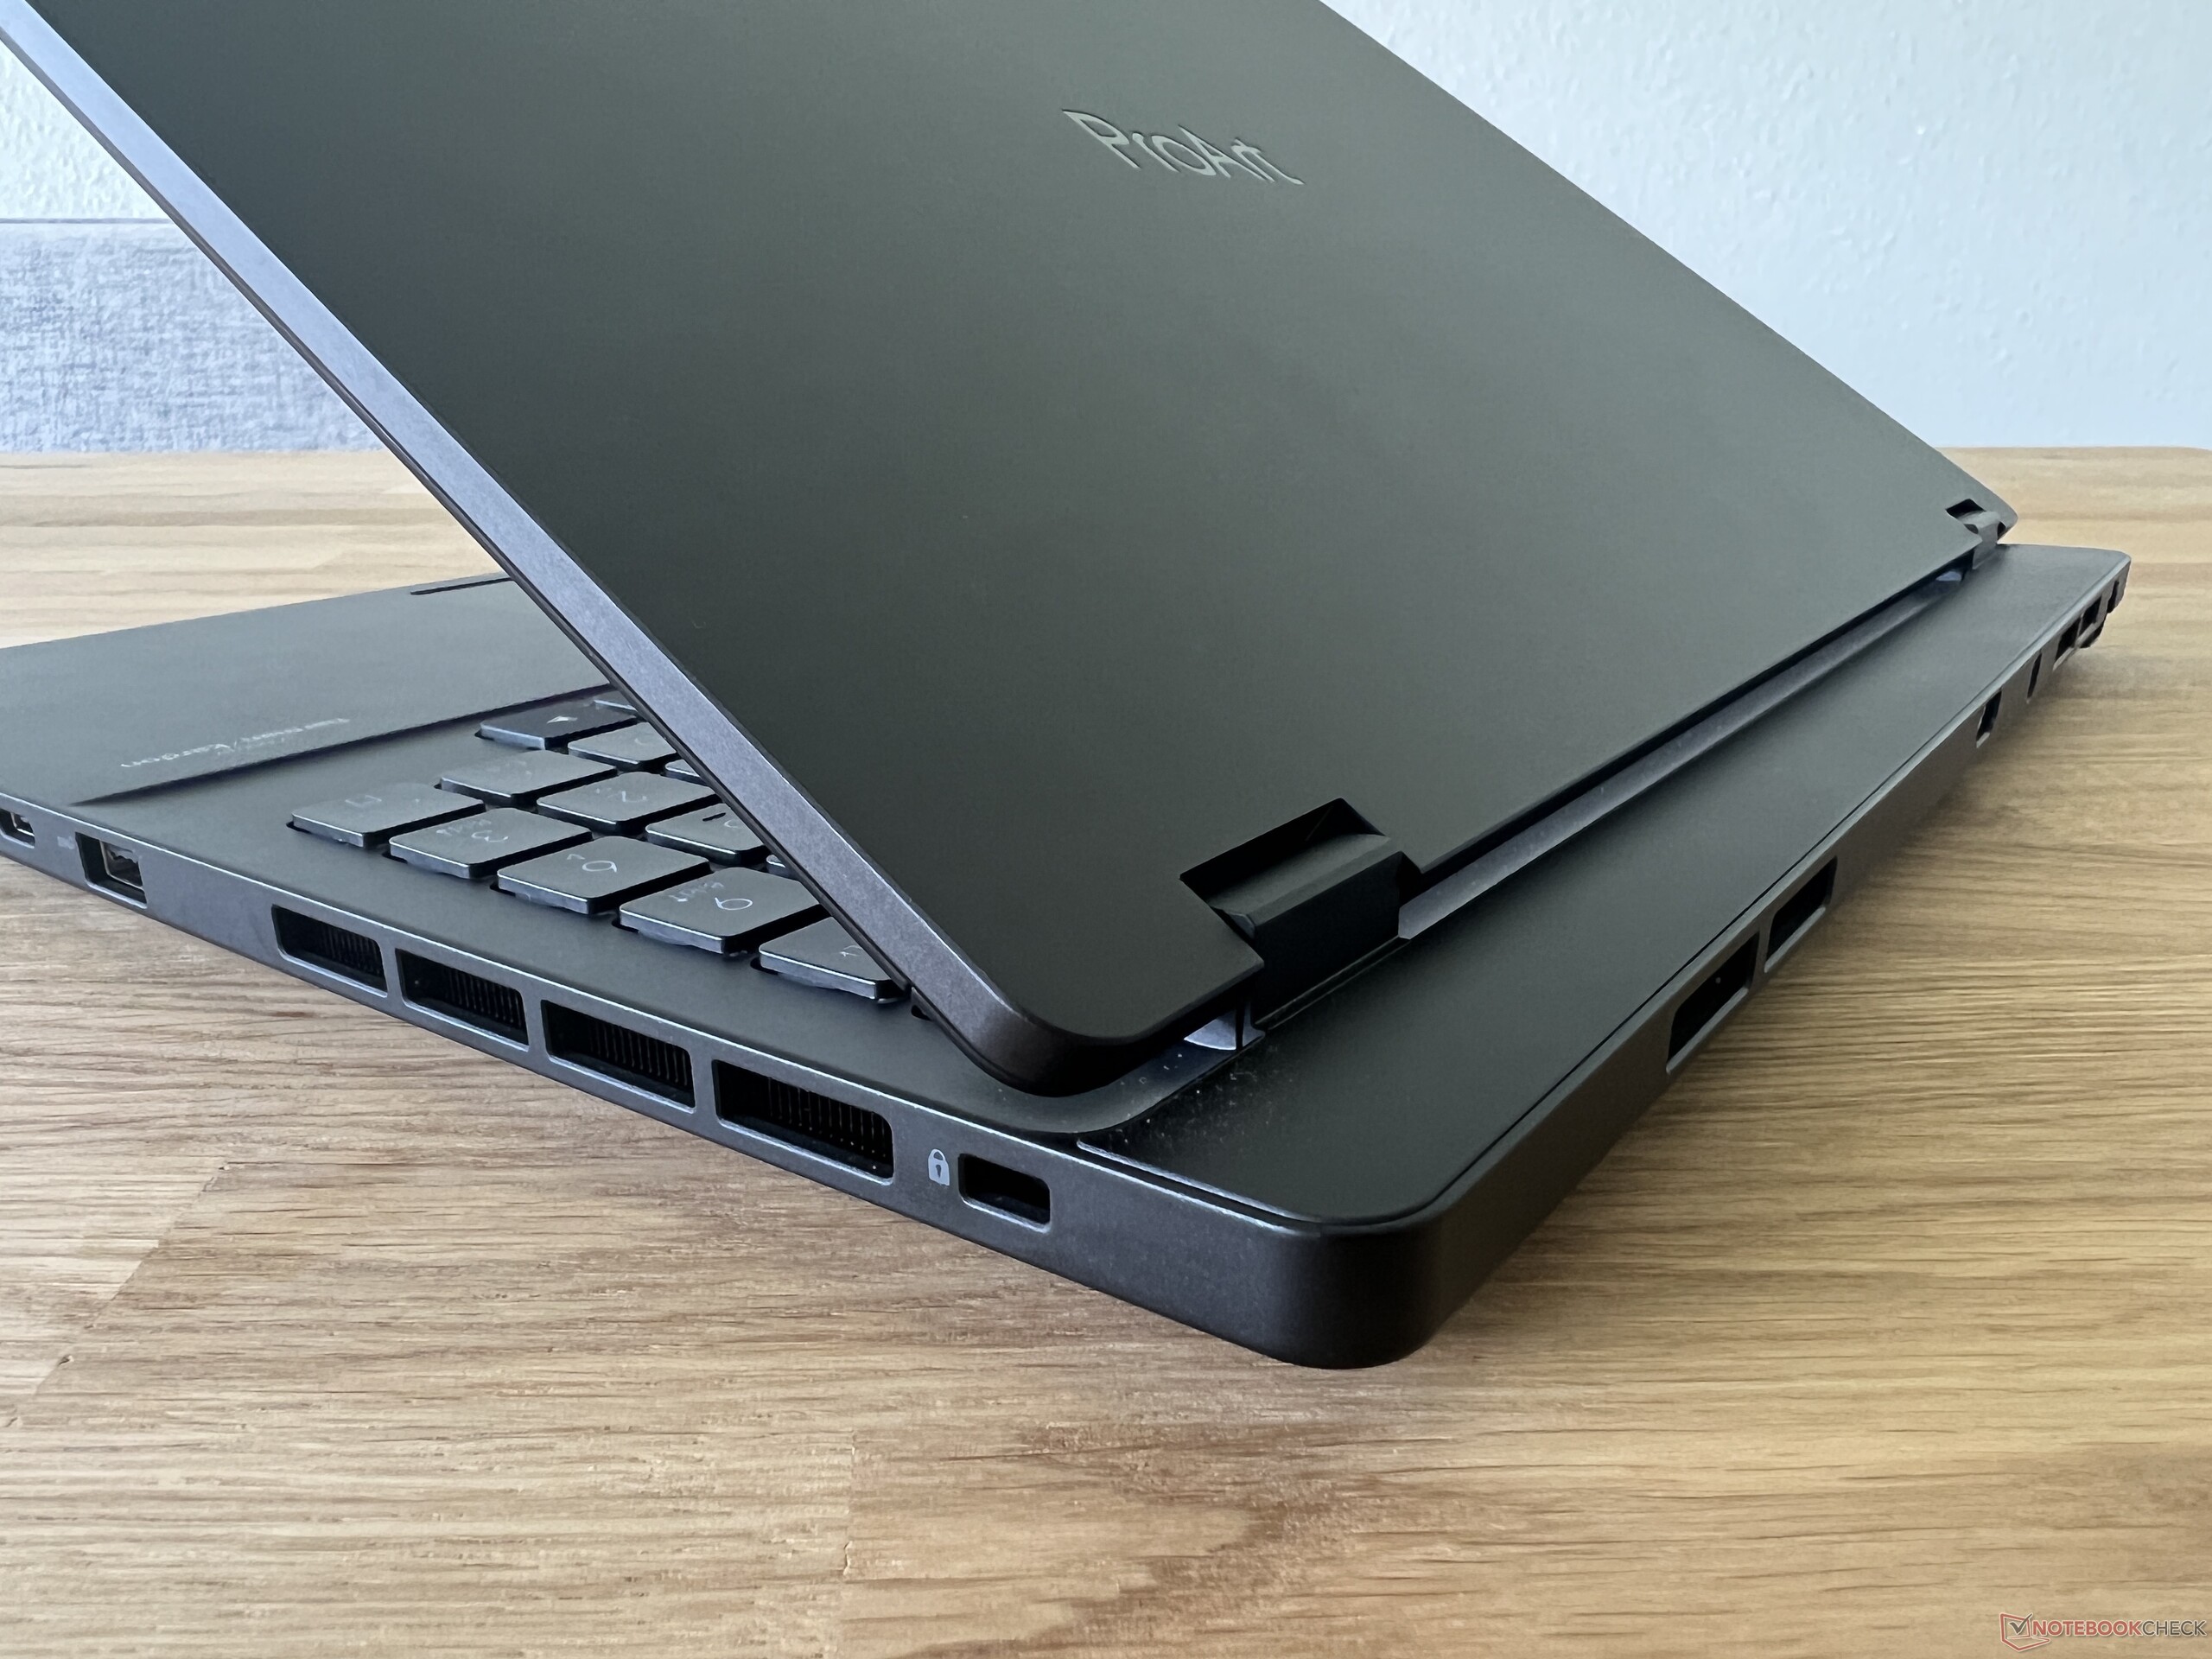
Przy wadze nieco poniżej 2,5 kg, Studiobook nie jest lekki, a ze względu na swój rozmiar nie jest też szczególnie przenośny. Notebook nadal mieści się w dużych plecakach, ale oczywiście zajmuje dużo miejsca jako 16-calowy komputer. Jest to również największy 16-calowy laptop w grupie porównawczej i niewiele mniejszy od 17-calowych urządzeń. Laptop jest również dość gruby na około 2,5 cm i ustępuje tylkoZephyrus Duoz drugim ekranem. W przypadku 240-watowego zasilacza trzeba doliczyć dodatkowe 740 gramów na transport.
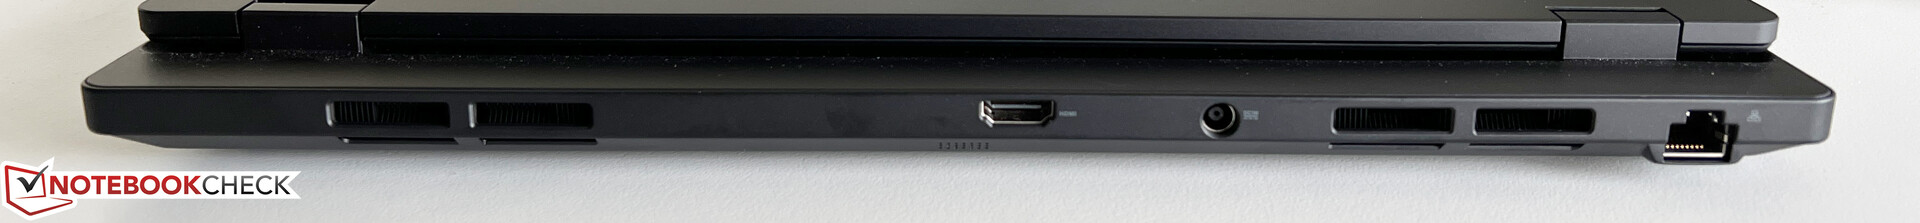
Sprzęt - Thunderbolt 4 i HDMI 2.1
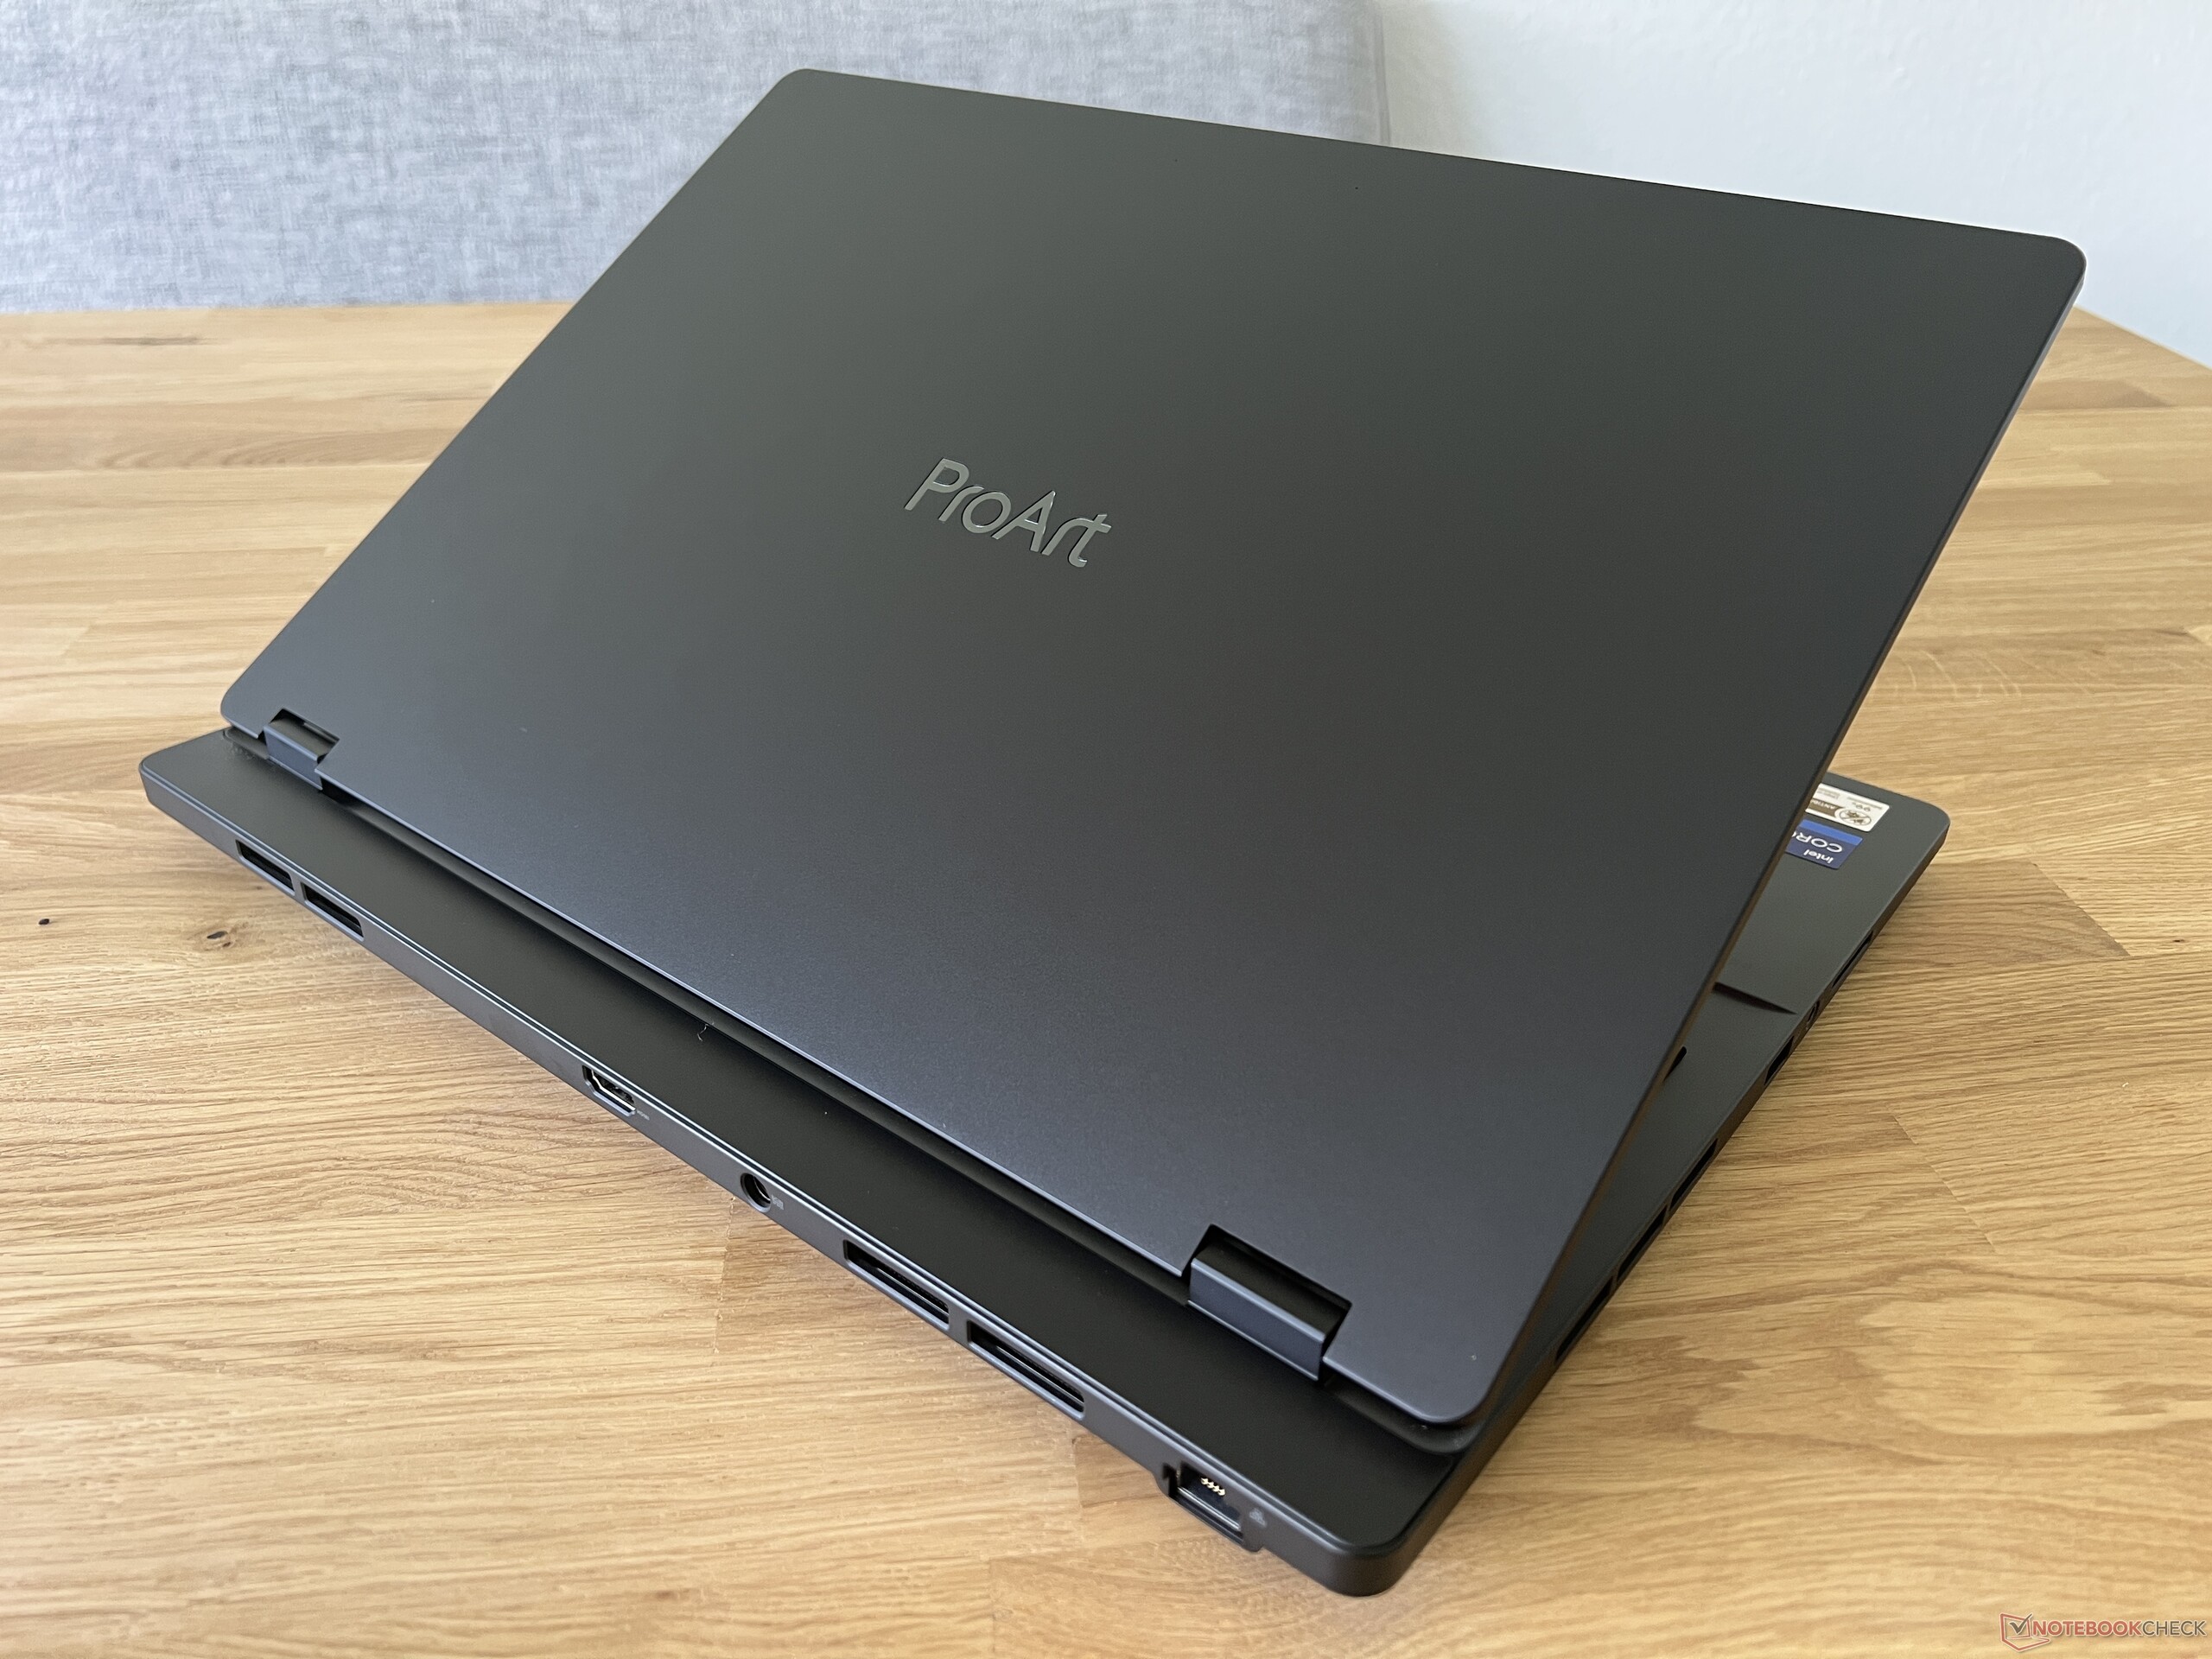
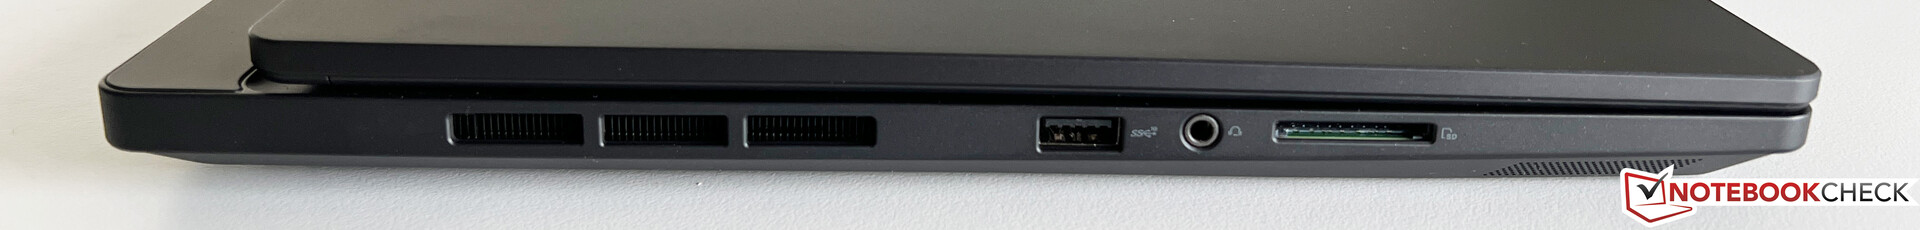
Porty są rozmieszczone na przednich obszarach po obu stronach i z tyłu. Większość portów USB znajduje się z przodu po prawej stronie, co może być zatłoczone, gdy są w pełni zajęte. Z drugiej strony, Asus umieścił gniazdo zasilania, port Ethernet i wyjście HDMI z tyłu, gdzie nie przeszkadzają.
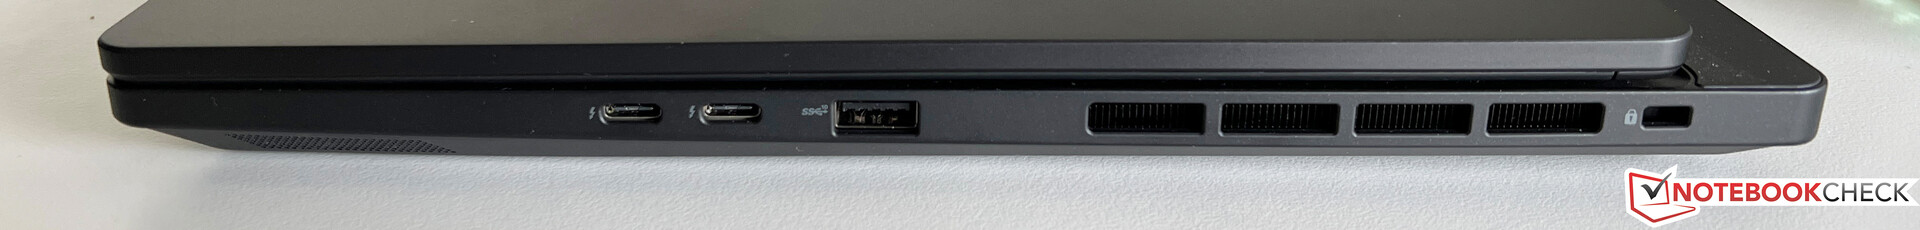
Czytnik kart SD
Po lewej stronie znajduje się pełnoprawny czytnik kart SD, który osiąga jedynie średnie prędkości transferu za pośrednictwem naszej karty referencyjnej (Angelbird AV Pro V60). Jak pokazuje konkurencja, tutaj możliwe jest znacznie więcej.
| SD Card Reader | |
| average JPG Copy Test (av. of 3 runs) | |
| Apple MacBook Pro 16 2023 M2 Max (Angelbird AV Pro V60) | |
| Asus Zephyrus Duo 16 GX650PY-NM006W (Angelbird AV Pro V60) | |
| Gigabyte AERO 16 OLED BSF | |
| Średnia w klasie Multimedia (23 - 531, n=42, ostatnie 2 lata) | |
| Samsung Galaxy Book3 Ultra 16 (AV PRO microSD 128 GB V60) | |
| Asus ProArt Studiobook 16 OLED H7604 (Angelibird AV Pro V60) | |
| MSI Stealth 17 Studio A13VH-014 | |
| maximum AS SSD Seq Read Test (1GB) | |
| Asus Zephyrus Duo 16 GX650PY-NM006W (Angelbird AV Pro V60) | |
| Apple MacBook Pro 16 2023 M2 Max (Angelbird AV Pro V60) | |
| Średnia w klasie Multimedia (37.3 - 1455, n=41, ostatnie 2 lata) | |
| Gigabyte AERO 16 OLED BSF | |
| Asus ProArt Studiobook 16 OLED H7604 (Angelibird AV Pro V60) | |
| Samsung Galaxy Book3 Ultra 16 (AV PRO microSD 128 GB V60) | |
| MSI Stealth 17 Studio A13VH-014 | |
Komunikacja
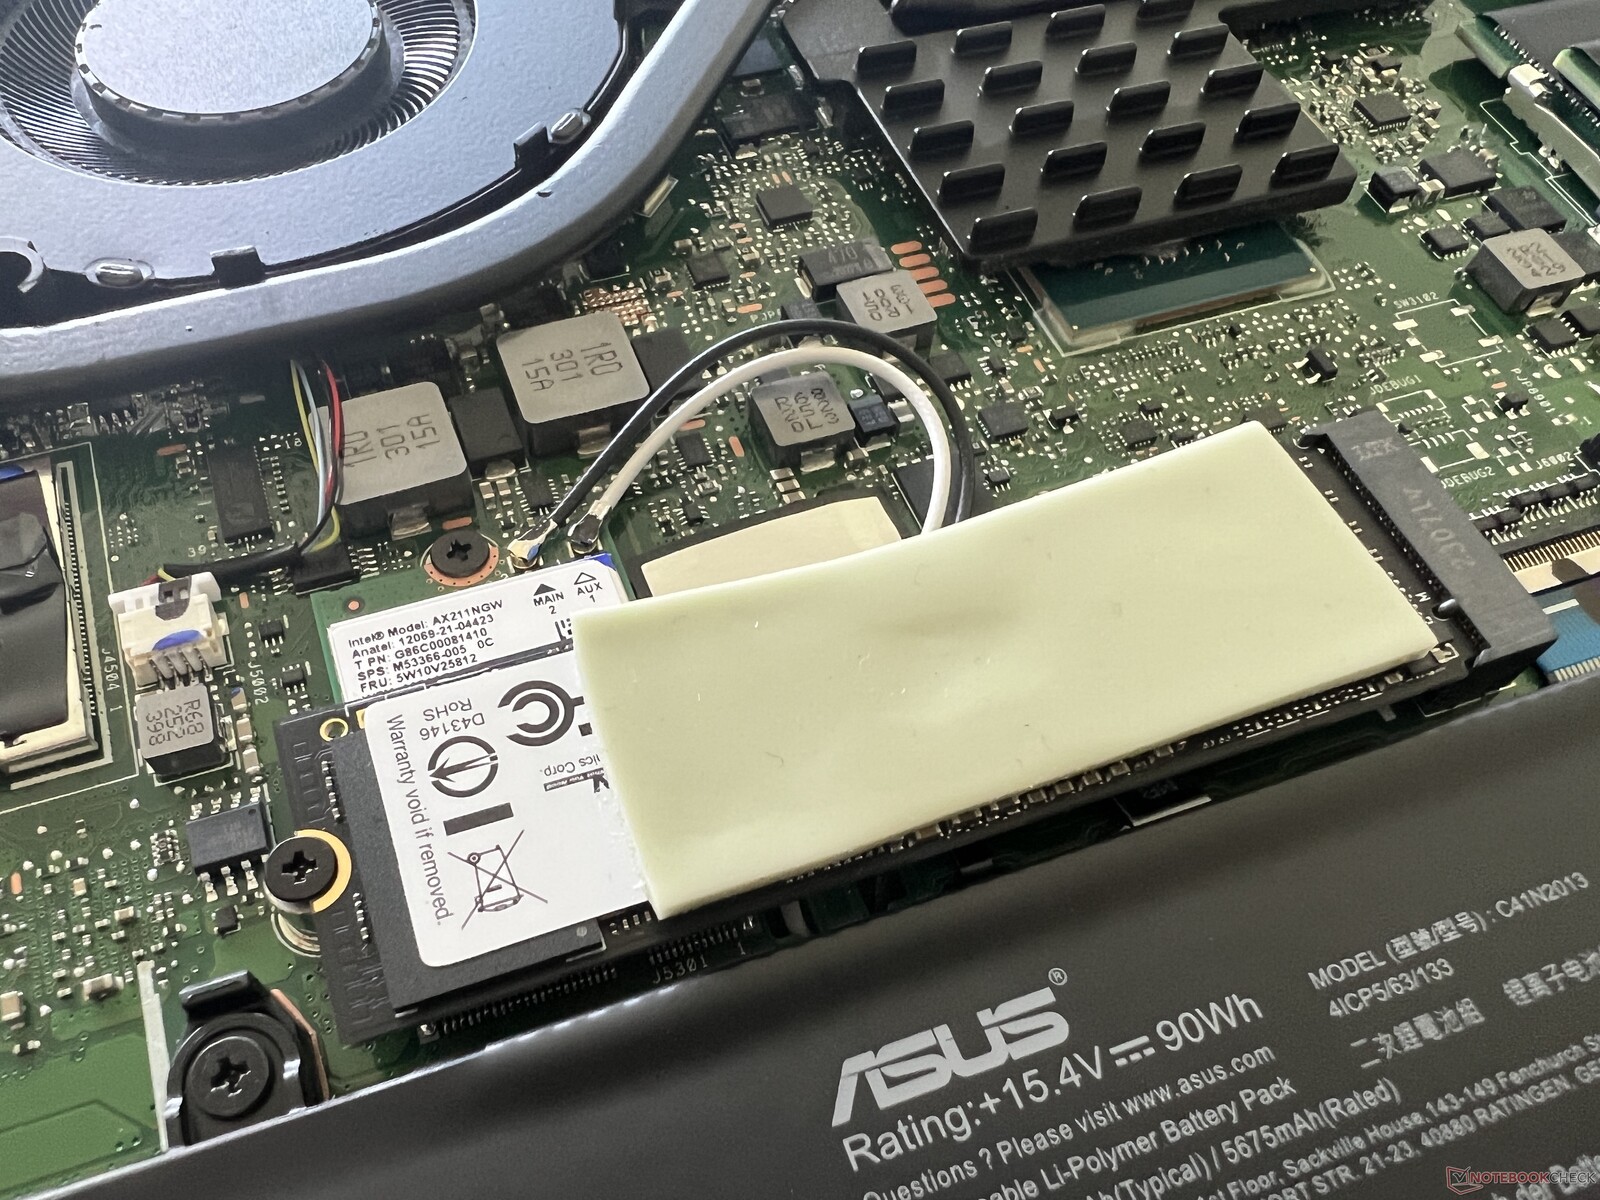
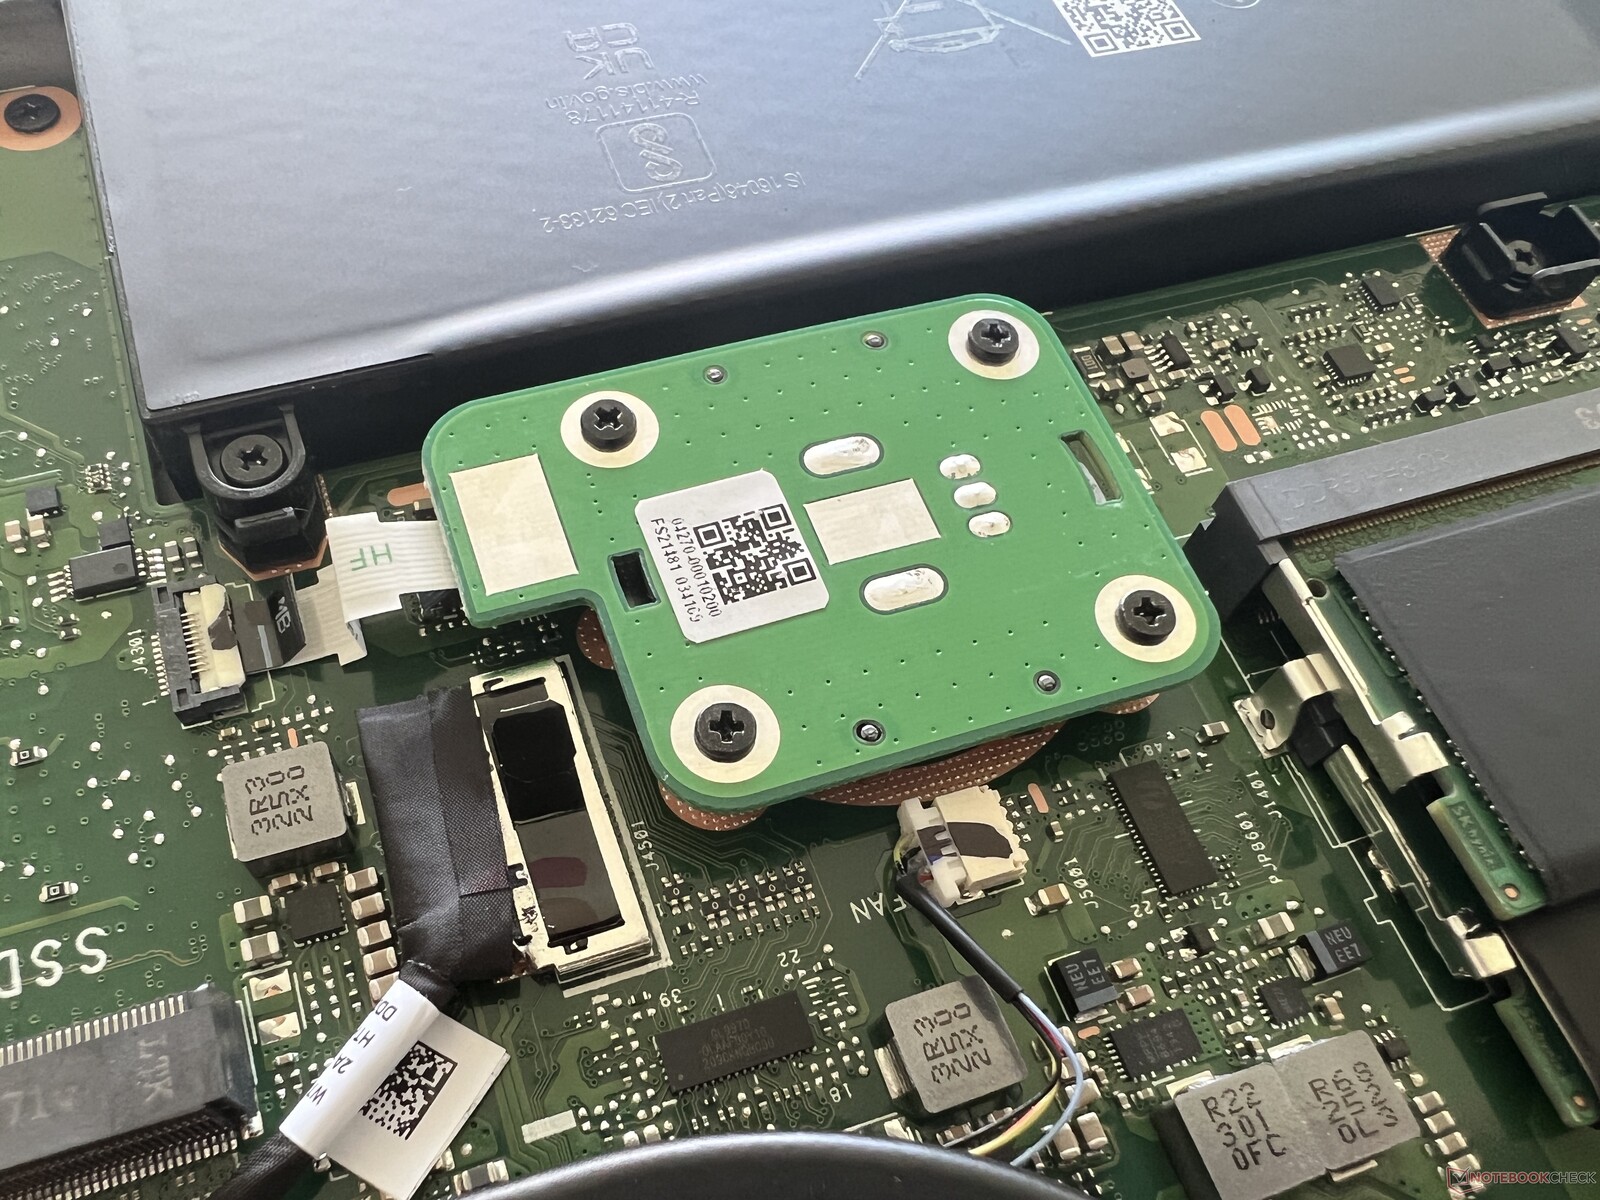
Asus instaluje nowoczesny moduł WLAN Intel AX211, który znajduje się pod głównym dyskiem SSD i można go wymienić. W połączeniu z naszym referencyjnym routerem od Asusa, prędkości transferu są bardzo wysokie i stabilne. Podczas naszej recenzji nie doświadczyliśmy żadnych problemów ze stabilnością sieci WLAN. Port Ethernet 2,5 Gbit/s dla sieci przewodowych jest również dostępny z tyłu.
| Networking | |
| Asus ProArt Studiobook 16 OLED H7604 | |
| iperf3 transmit AXE11000 | |
| iperf3 receive AXE11000 | |
| Gigabyte AERO 16 OLED BSF | |
| iperf3 transmit AXE11000 6GHz | |
| iperf3 receive AXE11000 6GHz | |
| Samsung Galaxy Book3 Ultra 16 | |
| iperf3 transmit AXE11000 | |
| iperf3 receive AXE11000 | |
| MSI Stealth 17 Studio A13VH-014 | |
| iperf3 transmit AXE11000 | |
| iperf3 receive AXE11000 | |
| iperf3 transmit AXE11000 6GHz | |
| iperf3 receive AXE11000 6GHz | |
| Apple MacBook Pro 16 2023 M2 Max | |
| iperf3 transmit AXE11000 6GHz | |
| iperf3 receive AXE11000 6GHz | |
| Asus Zephyrus Duo 16 GX650PY-NM006W | |
| iperf3 transmit AXE11000 6GHz | |
| iperf3 receive AXE11000 6GHz | |
Kamera internetowa
Kamera internetowa 1080p robi przyzwoite zdjęcia w dobrych warunkach oświetleniowych, ale są one również nieco zniekształcone. Zainstalowano również moduł IR, który obsługuje rozpoznawanie twarzy za pośrednictwem Windows Hello.


Akcesoria
Nasze urządzenie testowe zostało dostarczone z piórem Asus Pen 2.0, a także bezprzewodową myszą ProArt MD300, której cena detaliczna wynosi 180 USD. Podobnie jak sam laptop, mysz ma mały DialPad zainstalowany z boku. To, czy można z niego sensownie korzystać, zależy od używanego oprogramowania. Trochę irytujące jest to, że trzeba zainstalować ArmoryCrate, aby dostosować ustawienia myszy i że nie można tego zrobić w ProArt Creator Hub. Podczas testów mysz działała idealnie, a kliknięcia były bardzo precyzyjne, ale też głośne. Na przykład ciche przyciski myszy Logitech są znacznie cichsze.
Konserwacja
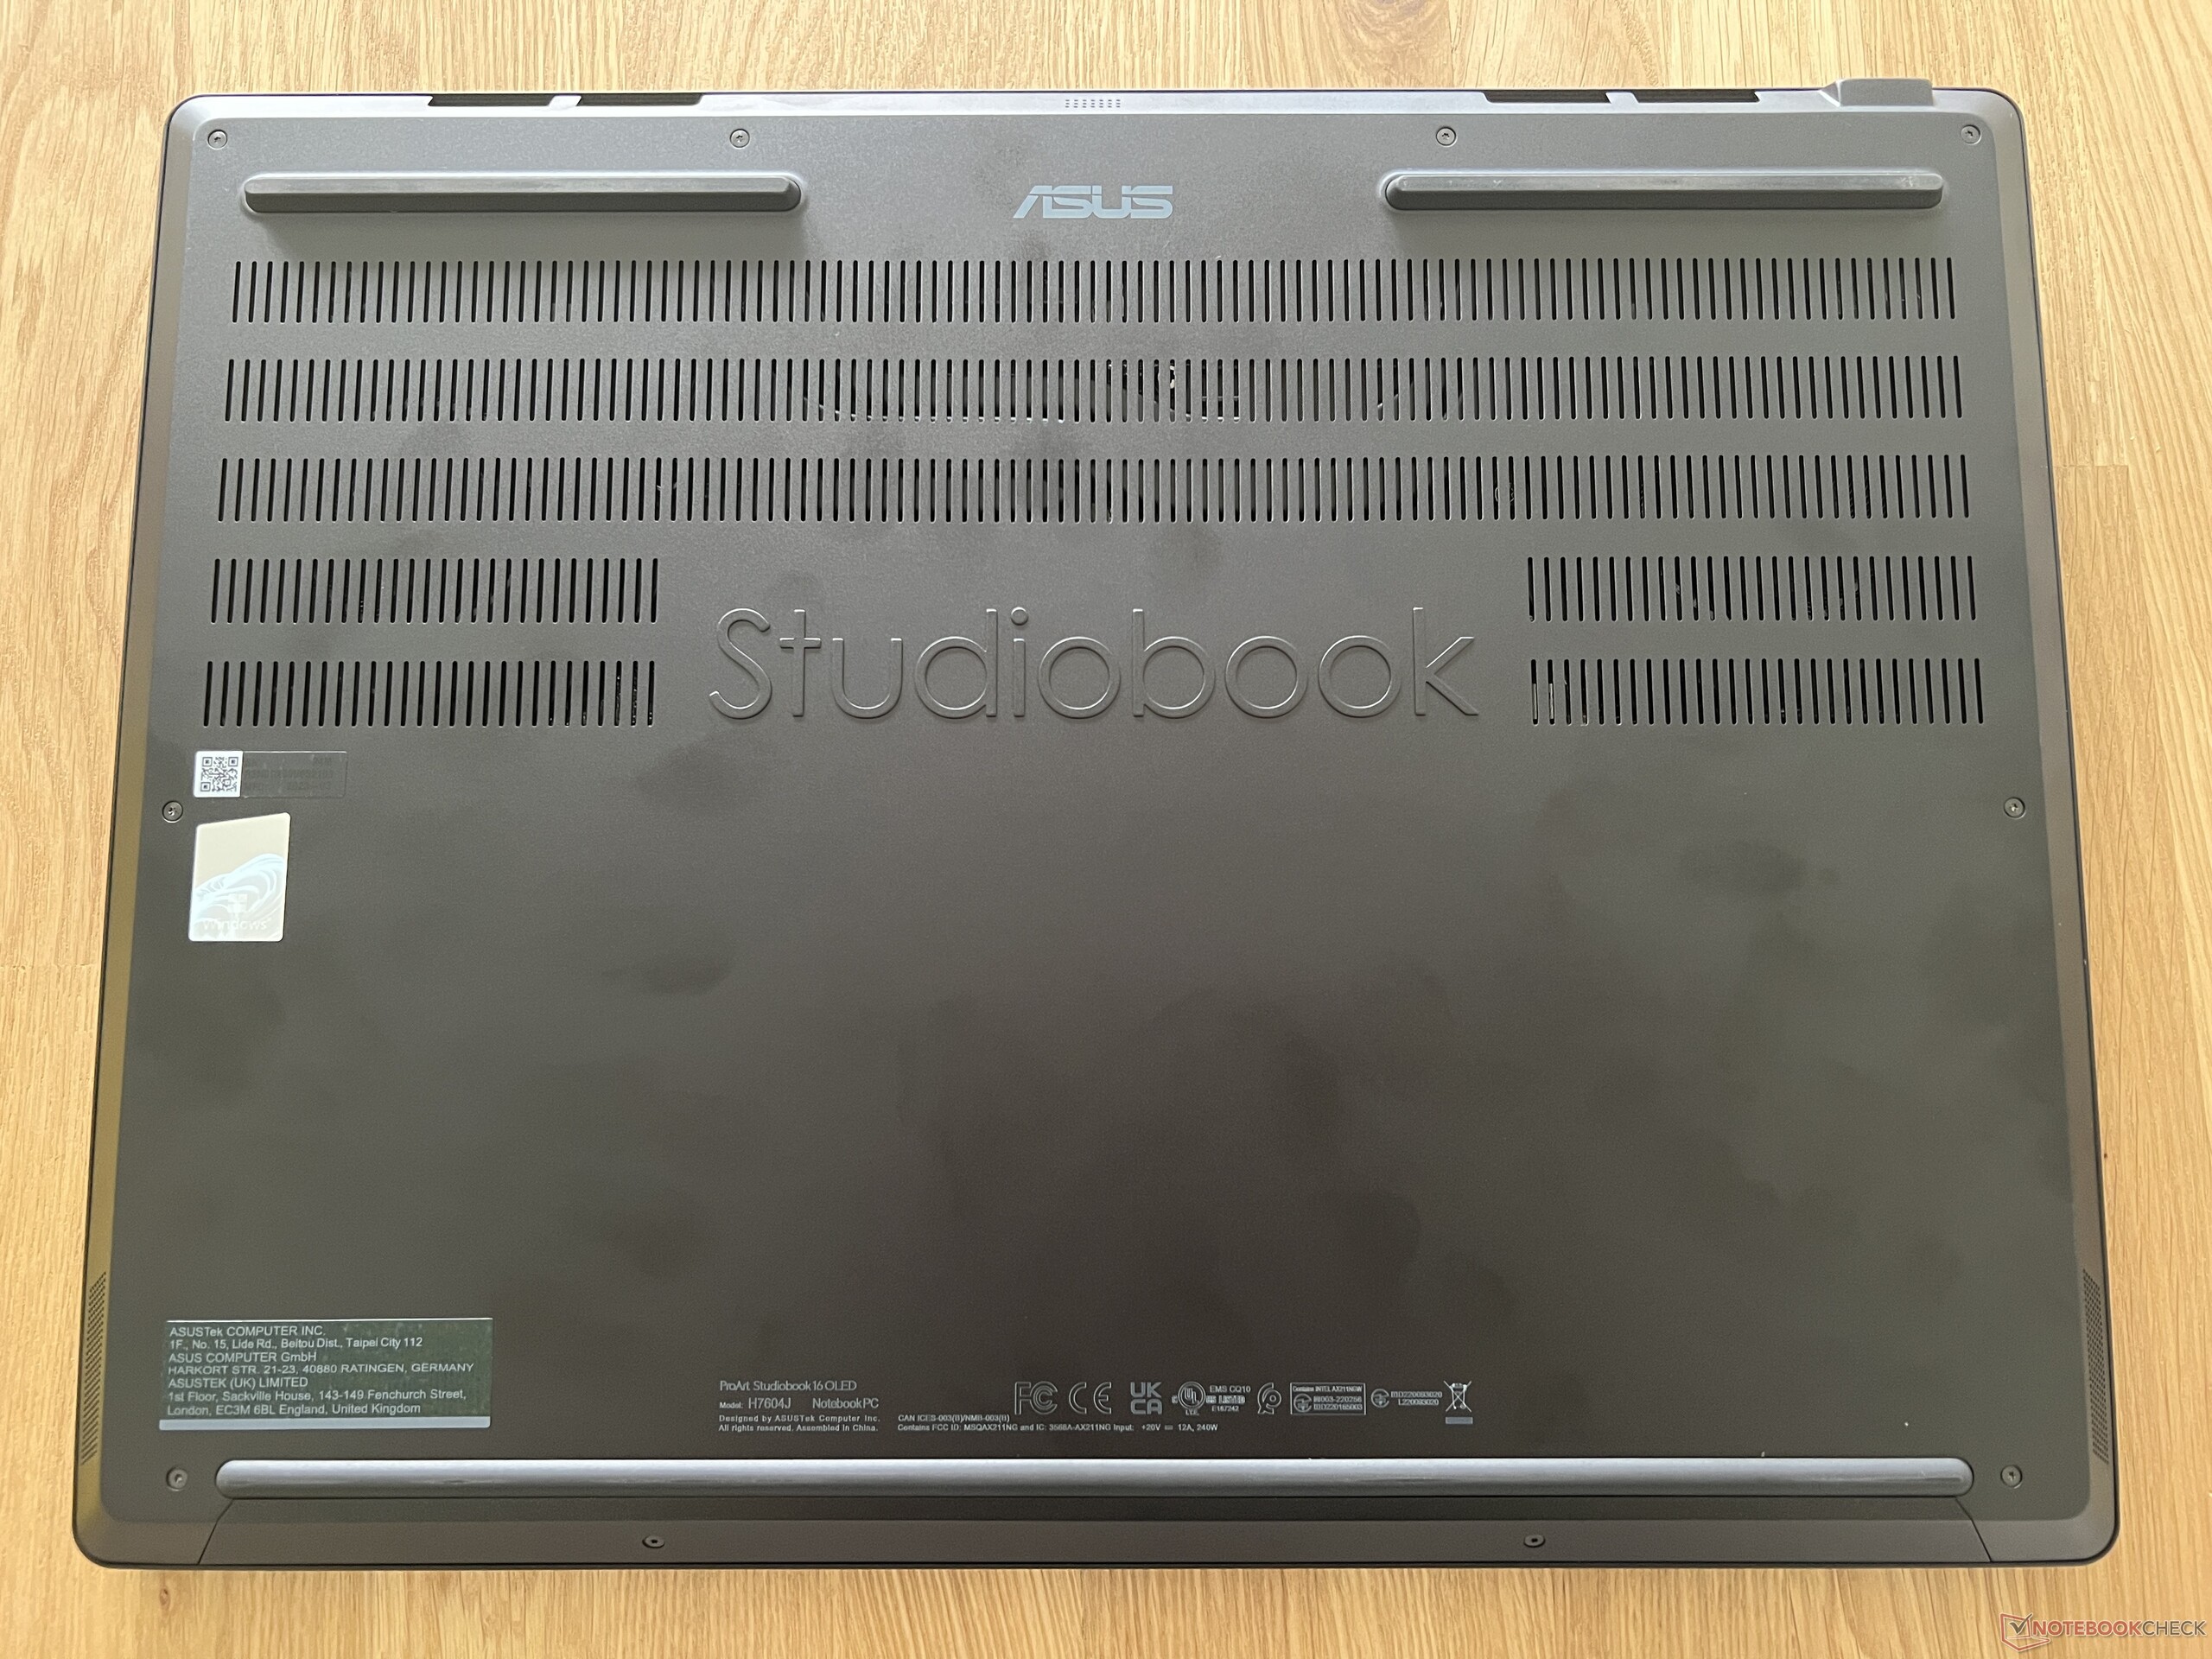
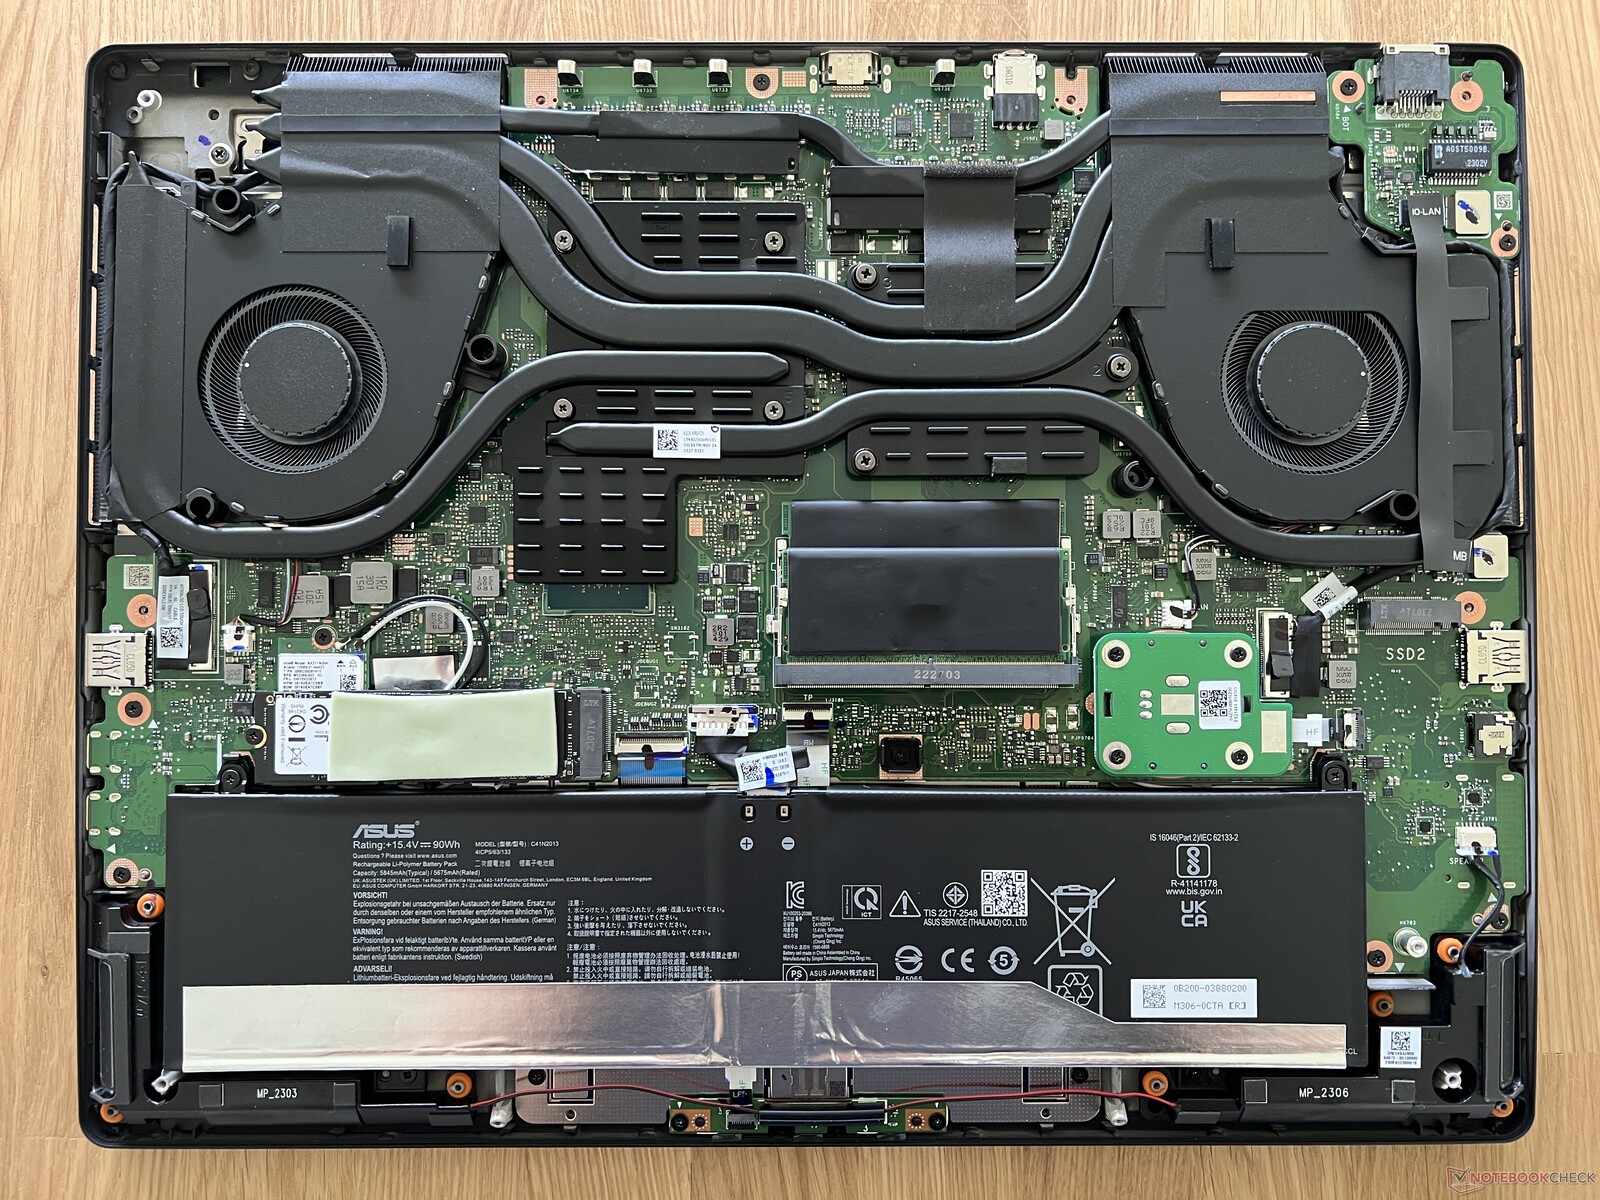
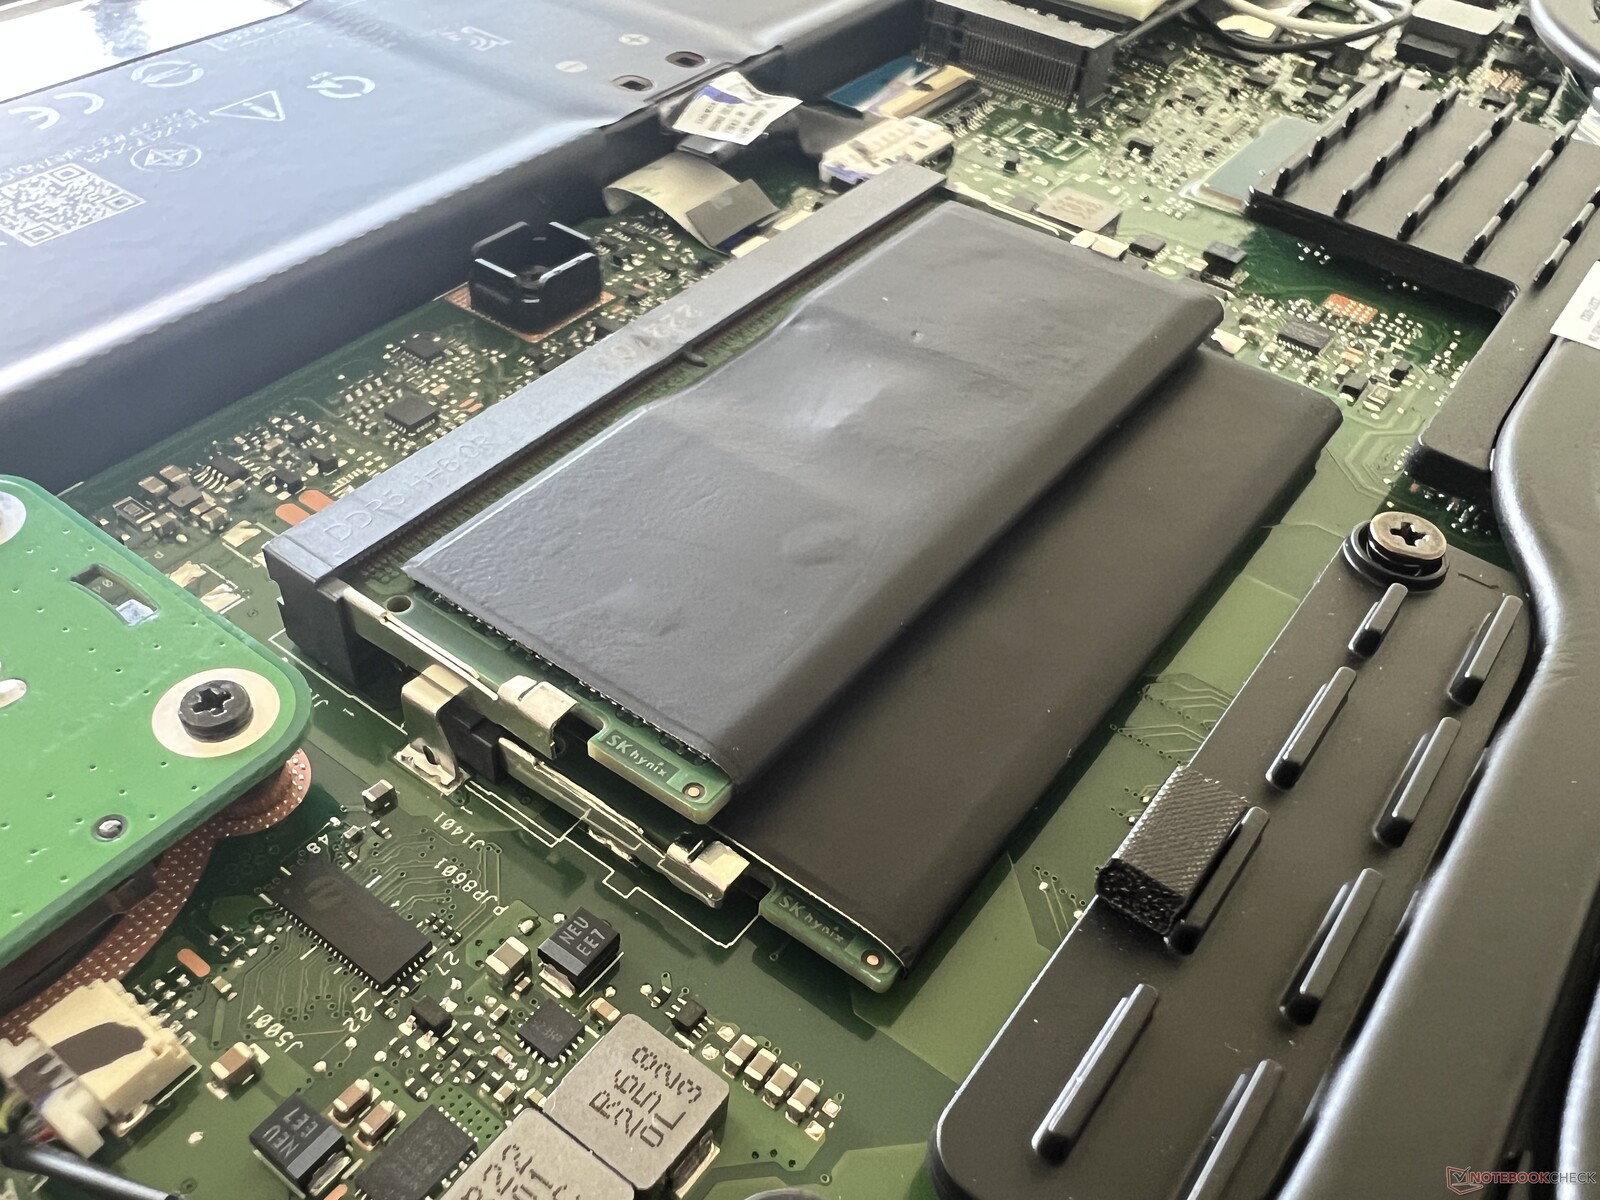
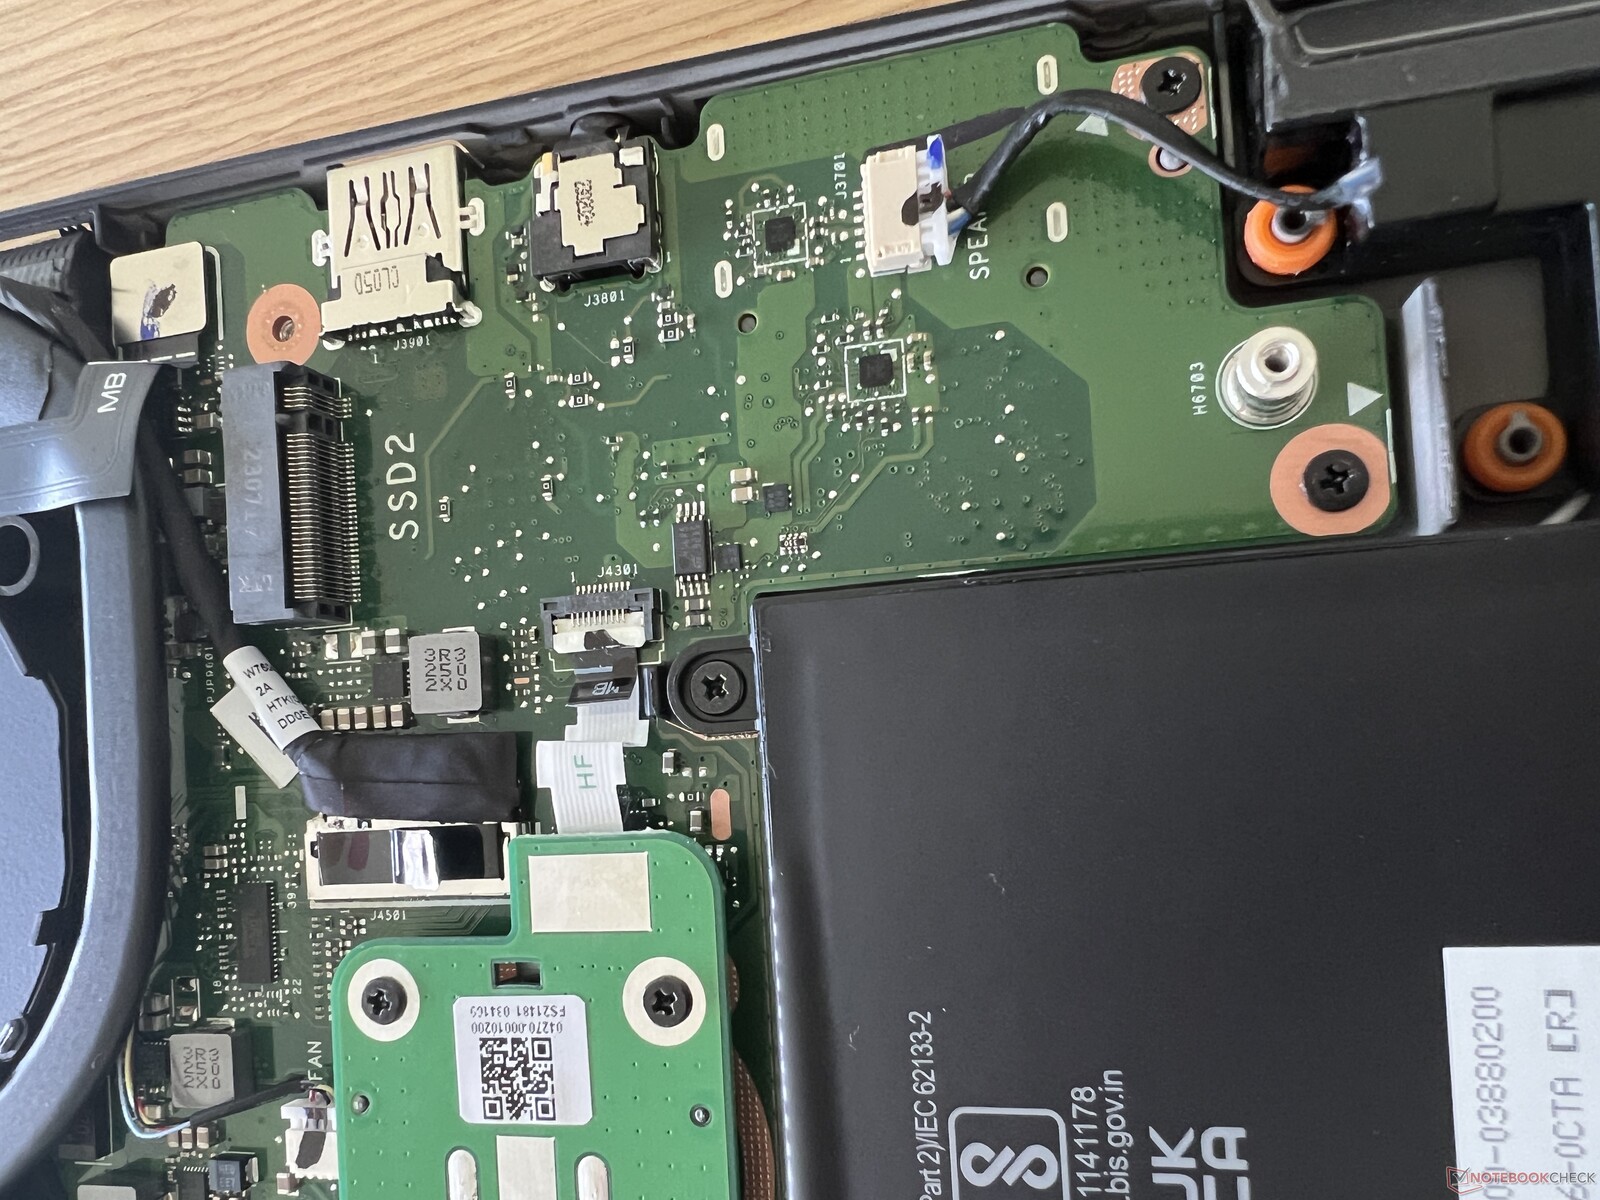
Dolna pokrywa obudowy jest zabezpieczona 10 śrubami Torx (T5) i po ich odkręceniu jest nadal bardzo mocno dokręcona. Najłatwiej podważyć pokrywę przy tylnych wylotach wentylatorów. Wewnątrz dominuje duży system chłodzenia, a opcje konserwacji są również bardzo dobre, począwszy od modułu WLAN (poniżej głównego dysku SSD), dwóch gniazd SO DIMM, a skończywszy na dwóch gniazdach M.2 2280 dla dysków SSD. Uderzające jest również to, ile miejsca zajmuje dodatkowy DialPad
Urządzenia wejściowe - DialPad i klawiatura numeryczna
Klawiatura
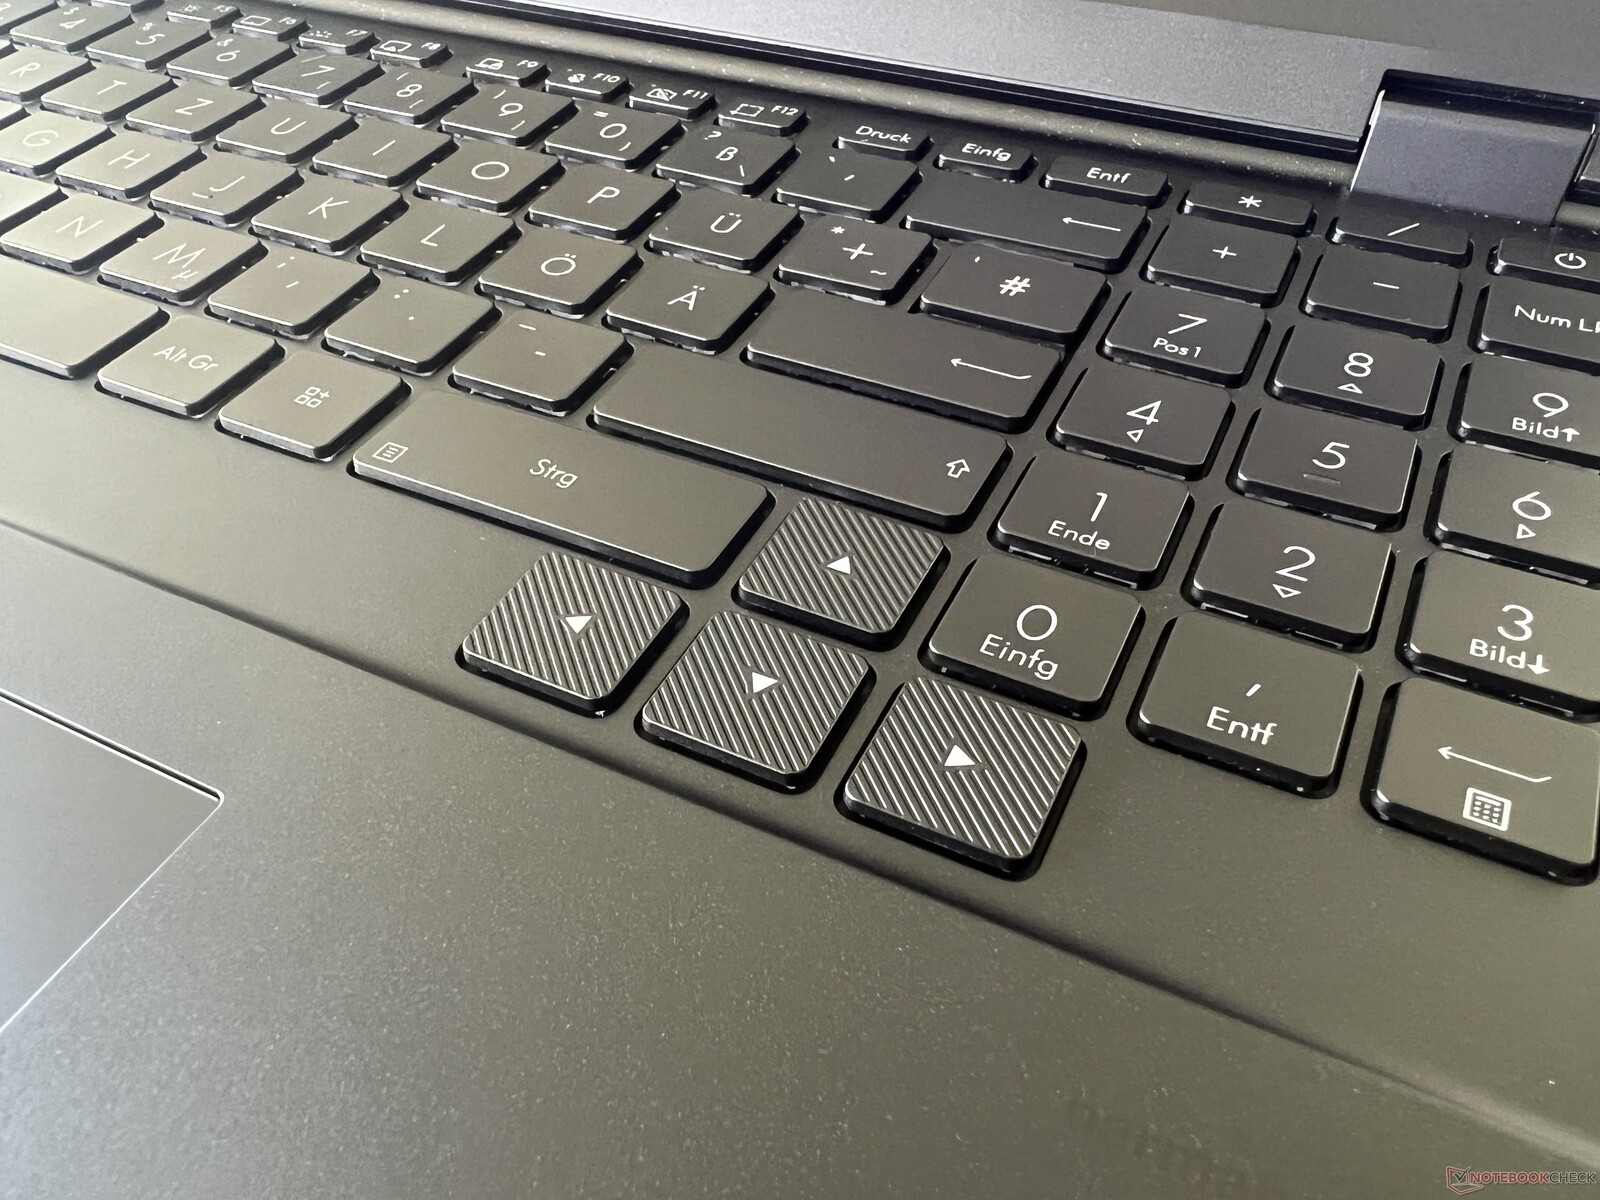
Klawiatura ma skok 1,4 mm i dedykowany numpad. Odczucia podczas pisania są przyzwoite, ale naciśnięcia klawiszy nie należą do najcichszych, a spacja w szczególności jest dość głośna. Układ klawiatury również wymaga przyzwyczajenia, ponieważ klawisze strzałek są duże, ale zostały przesunięte w dół. Jednorzędowy klawisz Enter również nie jest idealny. Klawiatura posiada trzystopniowe białe podświetlenie, ale nie jest ono automatycznie aktywowane przez czujnik.
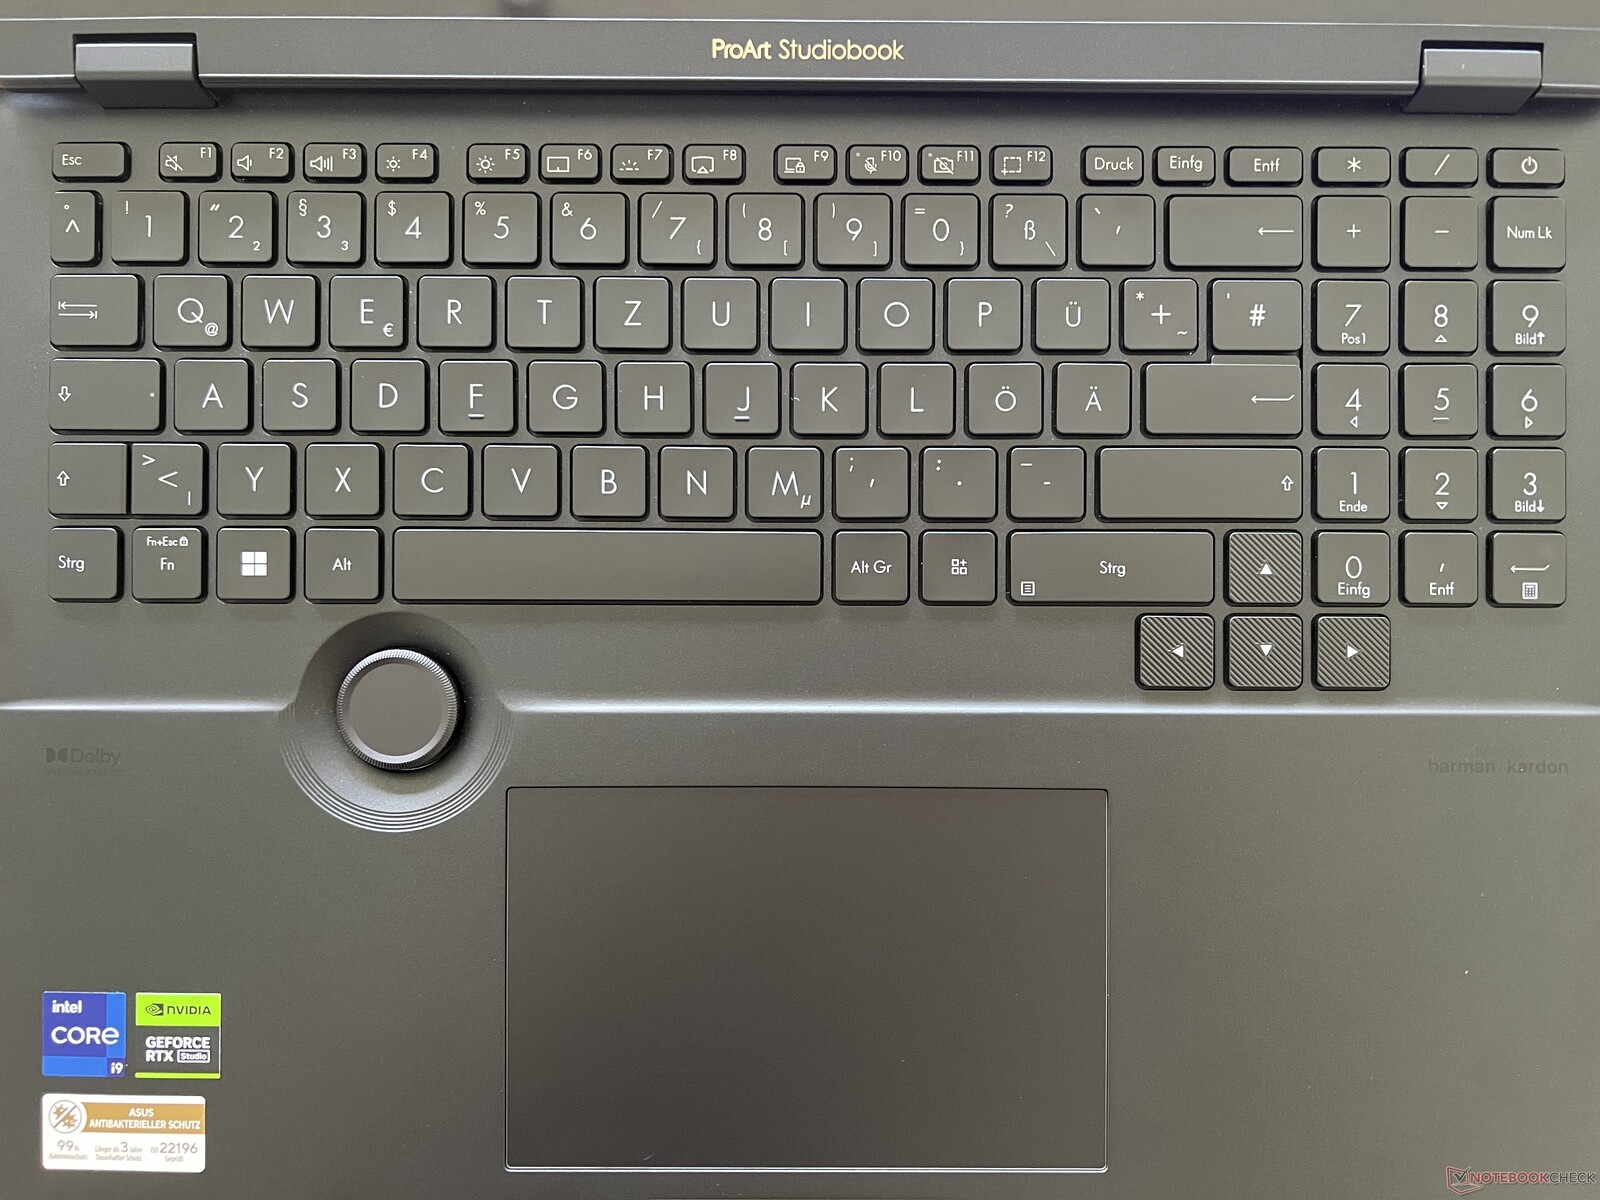
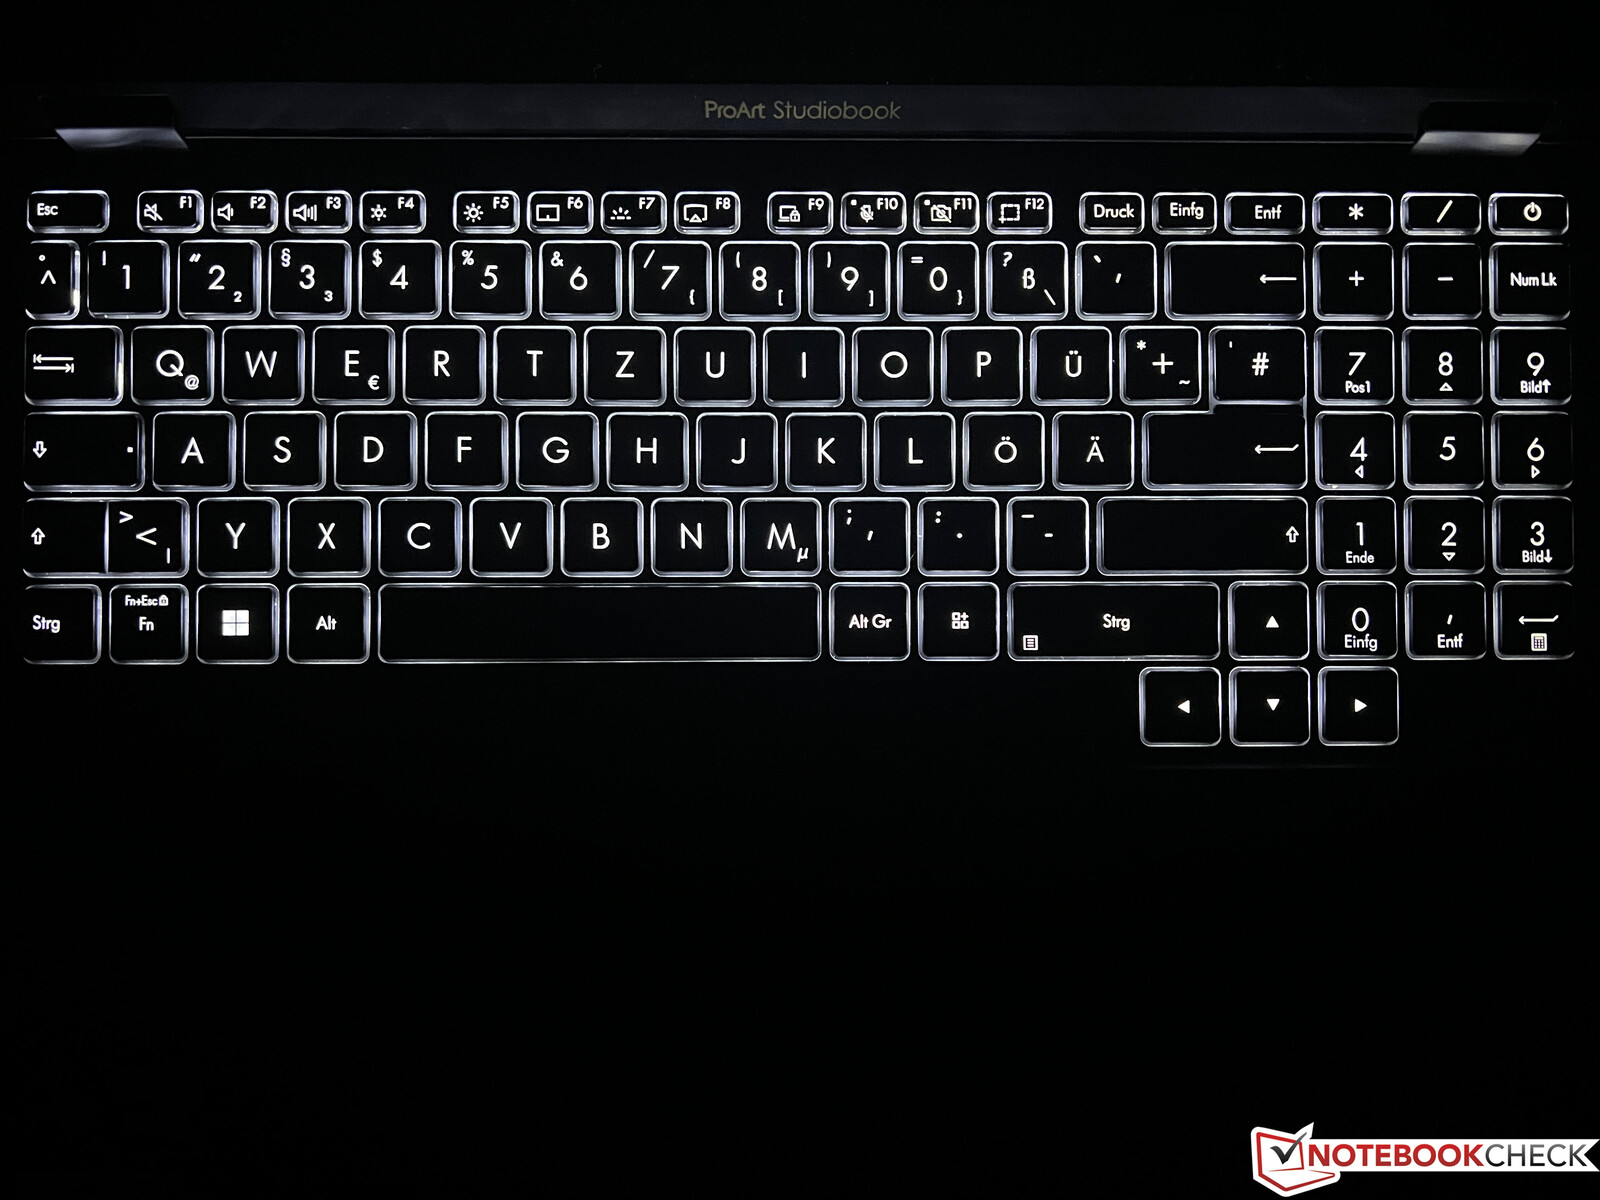
Touchpad
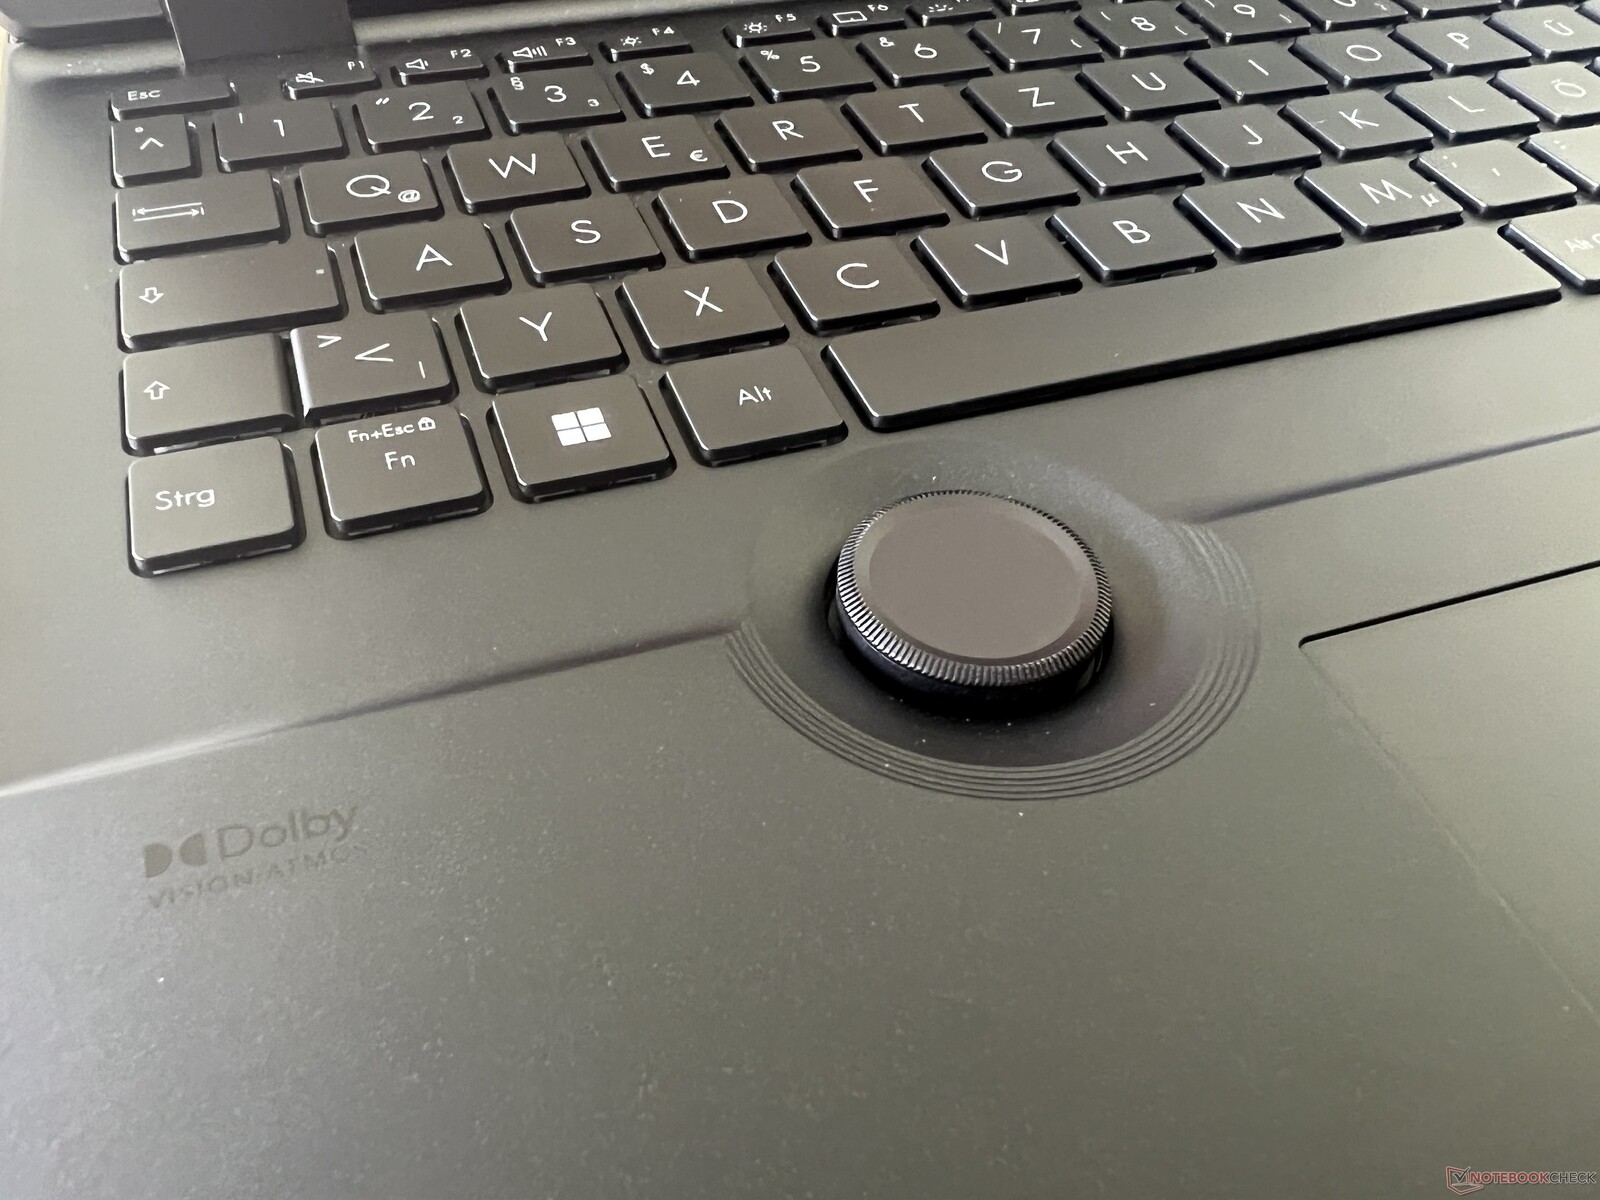
Duży touchpad działa doskonale i można go kliknąć wszędzie, co charakteryzuje się bogatym i cichym odgłosem klikania. Szczególną cechą jest DialPad, duży obrotowy przycisk między touchpadem a klawiaturą. Implementacja z aplikacjami Adobe działa dobrze, ale kombinacja myszy i klawiszy jest zwykle szybsza. W normalnym użytkowaniu pulpitu jasność i głośność można również regulować za pomocą DialPada, ale jest to znacznie szybsze za pomocą zwykłych klawiszy specjalnych lub klawiszy F.
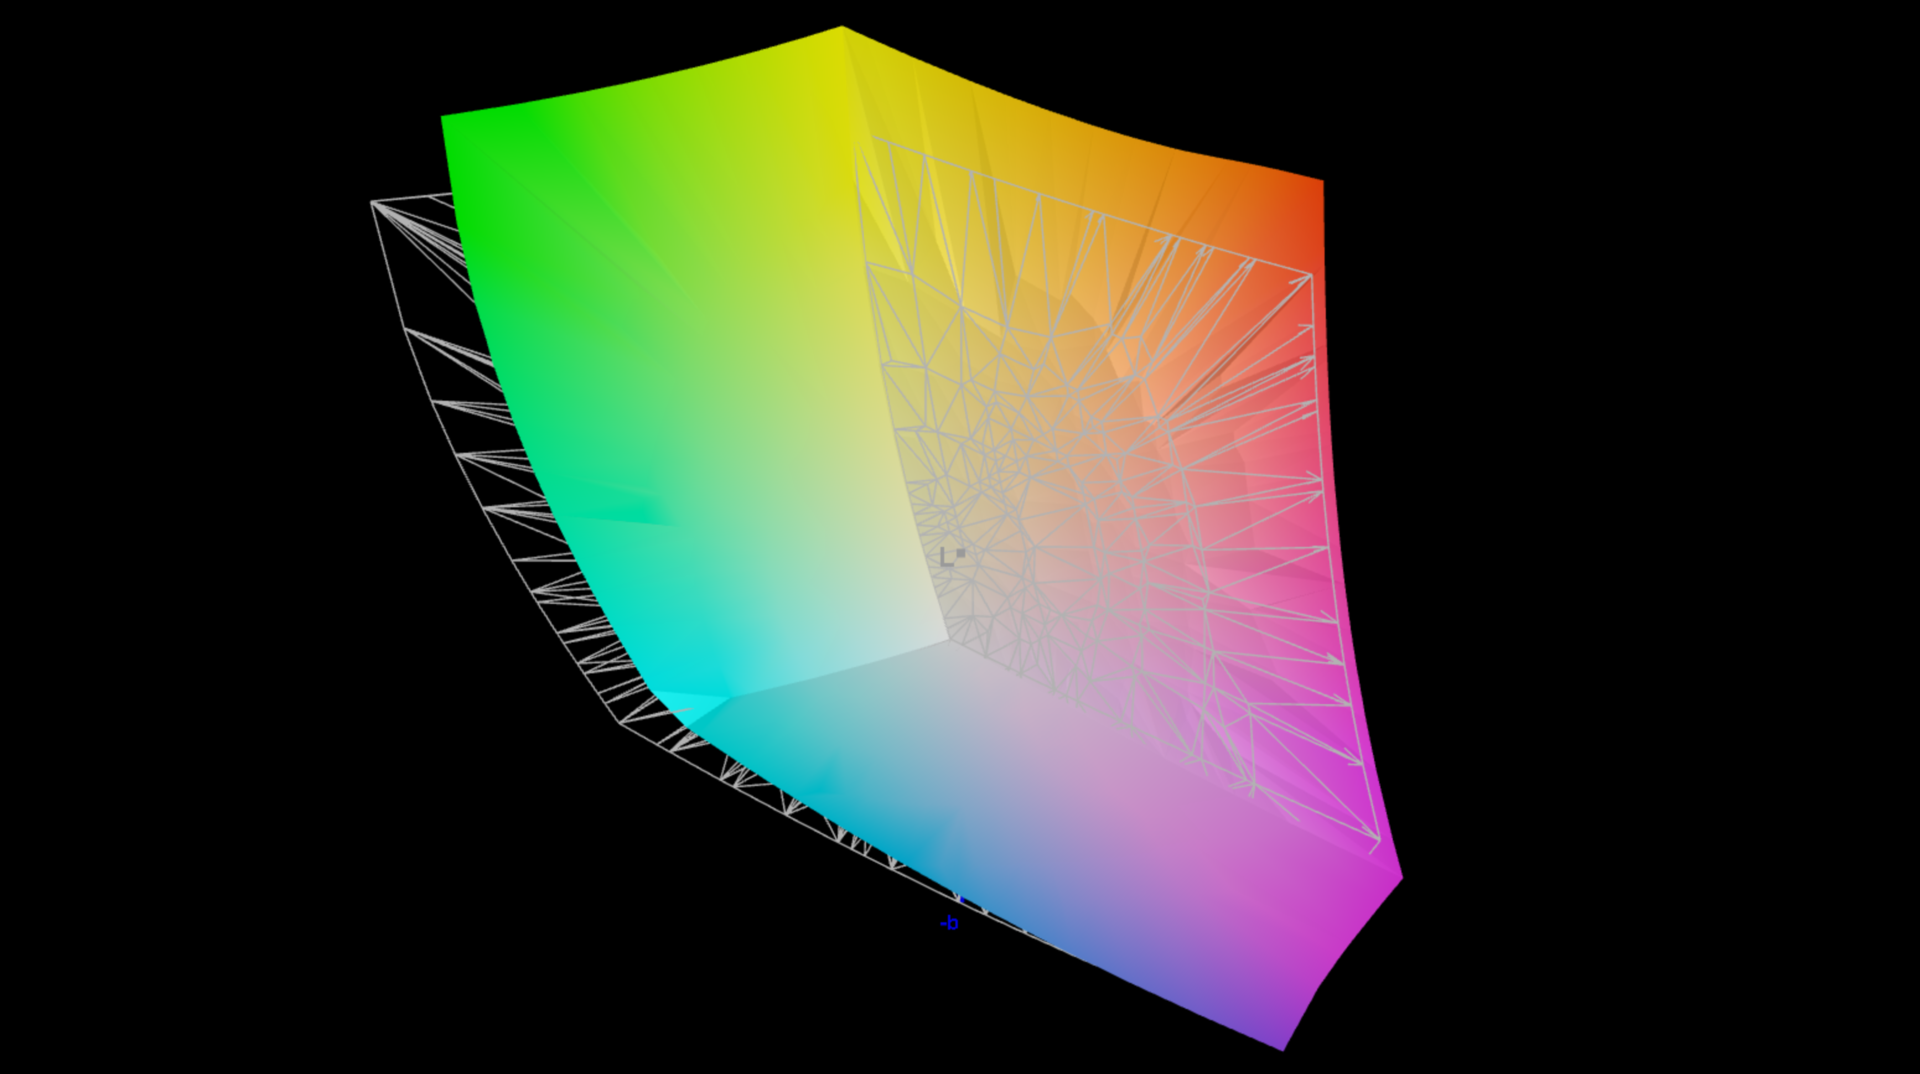
Wyświetlacz - panel OLED o częstotliwości odświeżania 120 Hz
Asus jest obecnie w pełni zaangażowany w ekrany OLED, a Studiobook nie jest wyjątkiem. W przeciwieństwie do poprzednika z wyświetlaczem OLED 4K, tutaj zastosowano ekran dotykowy OLED o rozdzielczości 3200 x 2000 pikseli i wyższej częstotliwości 120 Hz. Subiektywna jakość obrazu jest bardzo dobra, ale podobnie jak w niedawno recenzowanym ZenBooku Pro 14, jasne obszary wydają się nieco ziarniste po bliższym przyjrzeniu się, co wynika z warstwy dotykowej. Jasność nie dostosowuje się automatycznie do oświetlenia otoczenia.
Ustaliliśmy średnią jasność na poziomie 350 cd/m² w normalnym trybie SDR, ale dzięki wyjątkowo niskiej wartości czerni paneli OLED, współczynnik kontrastu jest bardzo wysoki. W trybie HDR maksimum wynosi prawie 580 cd/m² w małym wycinku obrazu i około 480 cd/m² w niemal całkowicie białym obrazie. Tryb HDR należy jednak najpierw włączyć ręcznie w ustawieniach systemu Windows, po czym nie można już korzystać z profili kolorów. Na panelach OLED nie występują aureole.
| |||||||||||||||||||||||||
rozświetlenie: 95 %
na akumulatorze: 346 cd/m²
kontrast: 17450:1 (czerń: 0.02 cd/m²)
ΔE ColorChecker Calman: 2.1 | ∀{0.5-29.43 Ø4.72}
calibrated: 2.1
ΔE Greyscale Calman: 1.2 | ∀{0.09-98 Ø4.97}
89.4% AdobeRGB 1998 (Argyll 3D)
100% sRGB (Argyll 3D)
99.6% Display P3 (Argyll 3D)
Gamma: 2.19
CCT: 6545 K
| Asus ProArt Studiobook 16 OLED H7604 ATNA60BX01-1, OLED, 3200x2000, 16" | Gigabyte AERO 16 OLED BSF Samsung SDC4191 (ATNA60YV09-0, OLED, 3840x2400, 16" | Samsung Galaxy Book3 Ultra 16 Samsung ATNA60CL03-0, AMOLED, 2880x1800, 16" | MSI Stealth 17 Studio A13VH-014 AUO41A2 B173ZAN06.C, Mini LED, 3840x2160, 17.3" | Apple MacBook Pro 16 2023 M2 Max Mini-LED, 3456x2234, 16.2" | Asus Zephyrus Duo 16 GX650PY-NM006W NE160QDM-NM4, MiniLED, 2560x1600, 16" | |
|---|---|---|---|---|---|---|
| Display | 3% | 3% | -1% | -1% | 1% | |
| Display P3 Coverage (%) | 99.6 | 99.9 0% | 99.9 0% | 92 -8% | 99 -1% | 99.4 0% |
| sRGB Coverage (%) | 100 | 100 0% | 100 0% | 99.1 -1% | 100 0% | 100 0% |
| AdobeRGB 1998 Coverage (%) | 89.4 | 96.4 8% | 96.3 8% | 94.07 5% | 88.5 -1% | 90.8 2% |
| Response Times | -195% | 18% | -3871% | -9710% | -2391% | |
| Response Time Grey 50% / Grey 80% * (ms) | 0.59 ? | 2 ? -239% | 0.49 ? 17% | 46.4 ? -7764% | 80.5 ? -13544% | 15.2 ? -2476% |
| Response Time Black / White * (ms) | 0.79 ? | 1.98 ? -151% | 0.65 ? 18% | 0.62 ? 22% | 47.2 ? -5875% | 19 ? -2305% |
| PWM Frequency (Hz) | 240 ? | 60 | 240 ? | 2400 | 14880 ? | 12000 ? |
| Screen | -9% | -15% | -12% | 370% | -15% | |
| Brightness middle (cd/m²) | 349 | 389.97 12% | 400 15% | 397.29 14% | 504 44% | 712 104% |
| Brightness (cd/m²) | 350 | 395 13% | 399 14% | 392 12% | 487 39% | 703 101% |
| Brightness Distribution (%) | 95 | 97 2% | 93 -2% | 93 -2% | 94 -1% | 95 0% |
| Black Level * (cd/m²) | 0.02 | 0.03 -50% | 0.03 -50% | 0.02 -0% | 0.001 95% | 0.07 -250% |
| Contrast (:1) | 17450 | 12999 -26% | 13333 -24% | 19865 14% | 504000 2788% | 10171 -42% |
| Colorchecker dE 2000 * | 2.1 | 2 5% | 2.3 -10% | 2.52 -20% | 1.5 29% | 1.7 19% |
| Colorchecker dE 2000 max. * | 5.5 | 4.1 25% | 4.15 25% | 3.91 29% | 3.3 40% | 4 27% |
| Colorchecker dE 2000 calibrated * | 2.1 | 1.68 20% | 1.66 21% | 2.52 -20% | 1.2 43% | |
| Greyscale dE 2000 * | 1.2 | 2.23 -86% | 2.7 -125% | 2.78 -132% | 2.1 -75% | 2.8 -133% |
| Gamma | 2.19 100% | 2.41 91% | 2.266 97% | 2.63 84% | 2.25 98% | 2.21 100% |
| CCT | 6545 99% | 6323 103% | 7047 92% | 6412 101% | 6882 94% | 6978 93% |
| Całkowita średnia (program / ustawienia) | -67% /
-33% | 2% /
-7% | -1295% /
-561% | -3114% /
-1266% | -802% /
-351% |
* ... im mniej tym lepiej
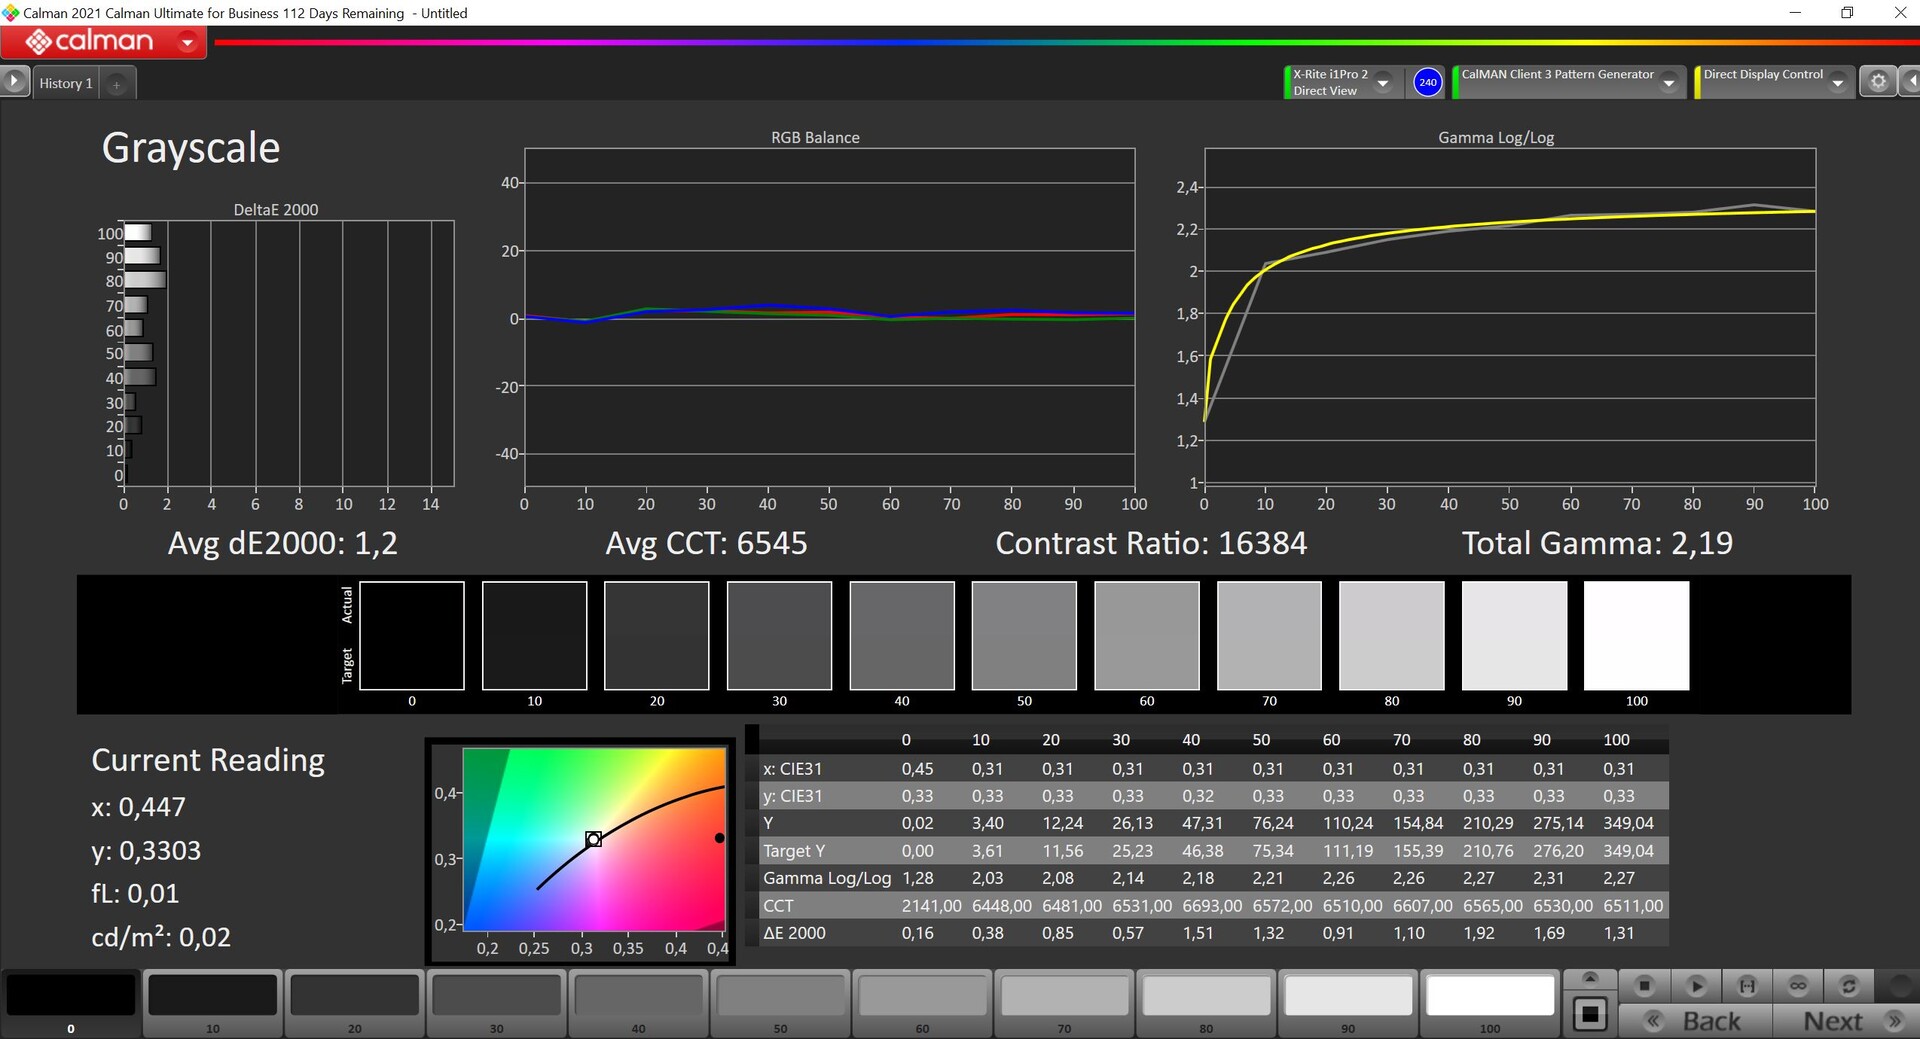
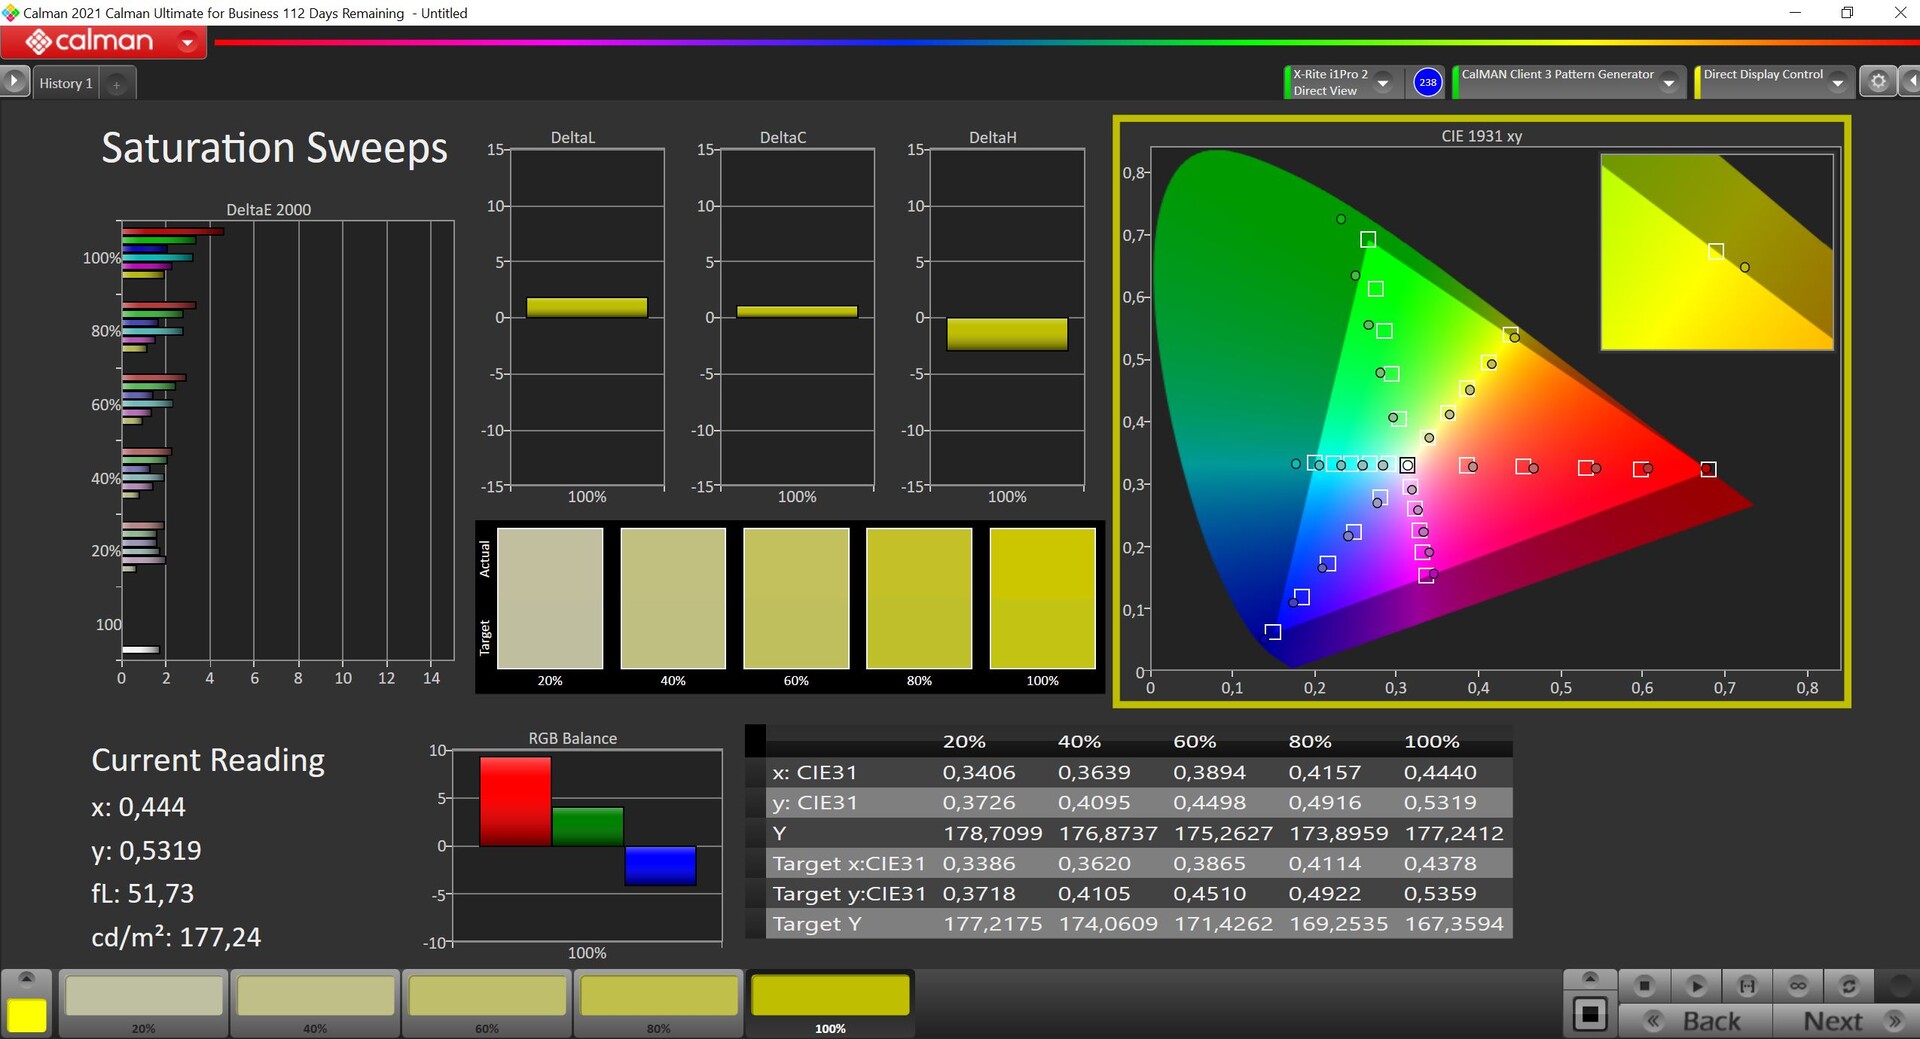
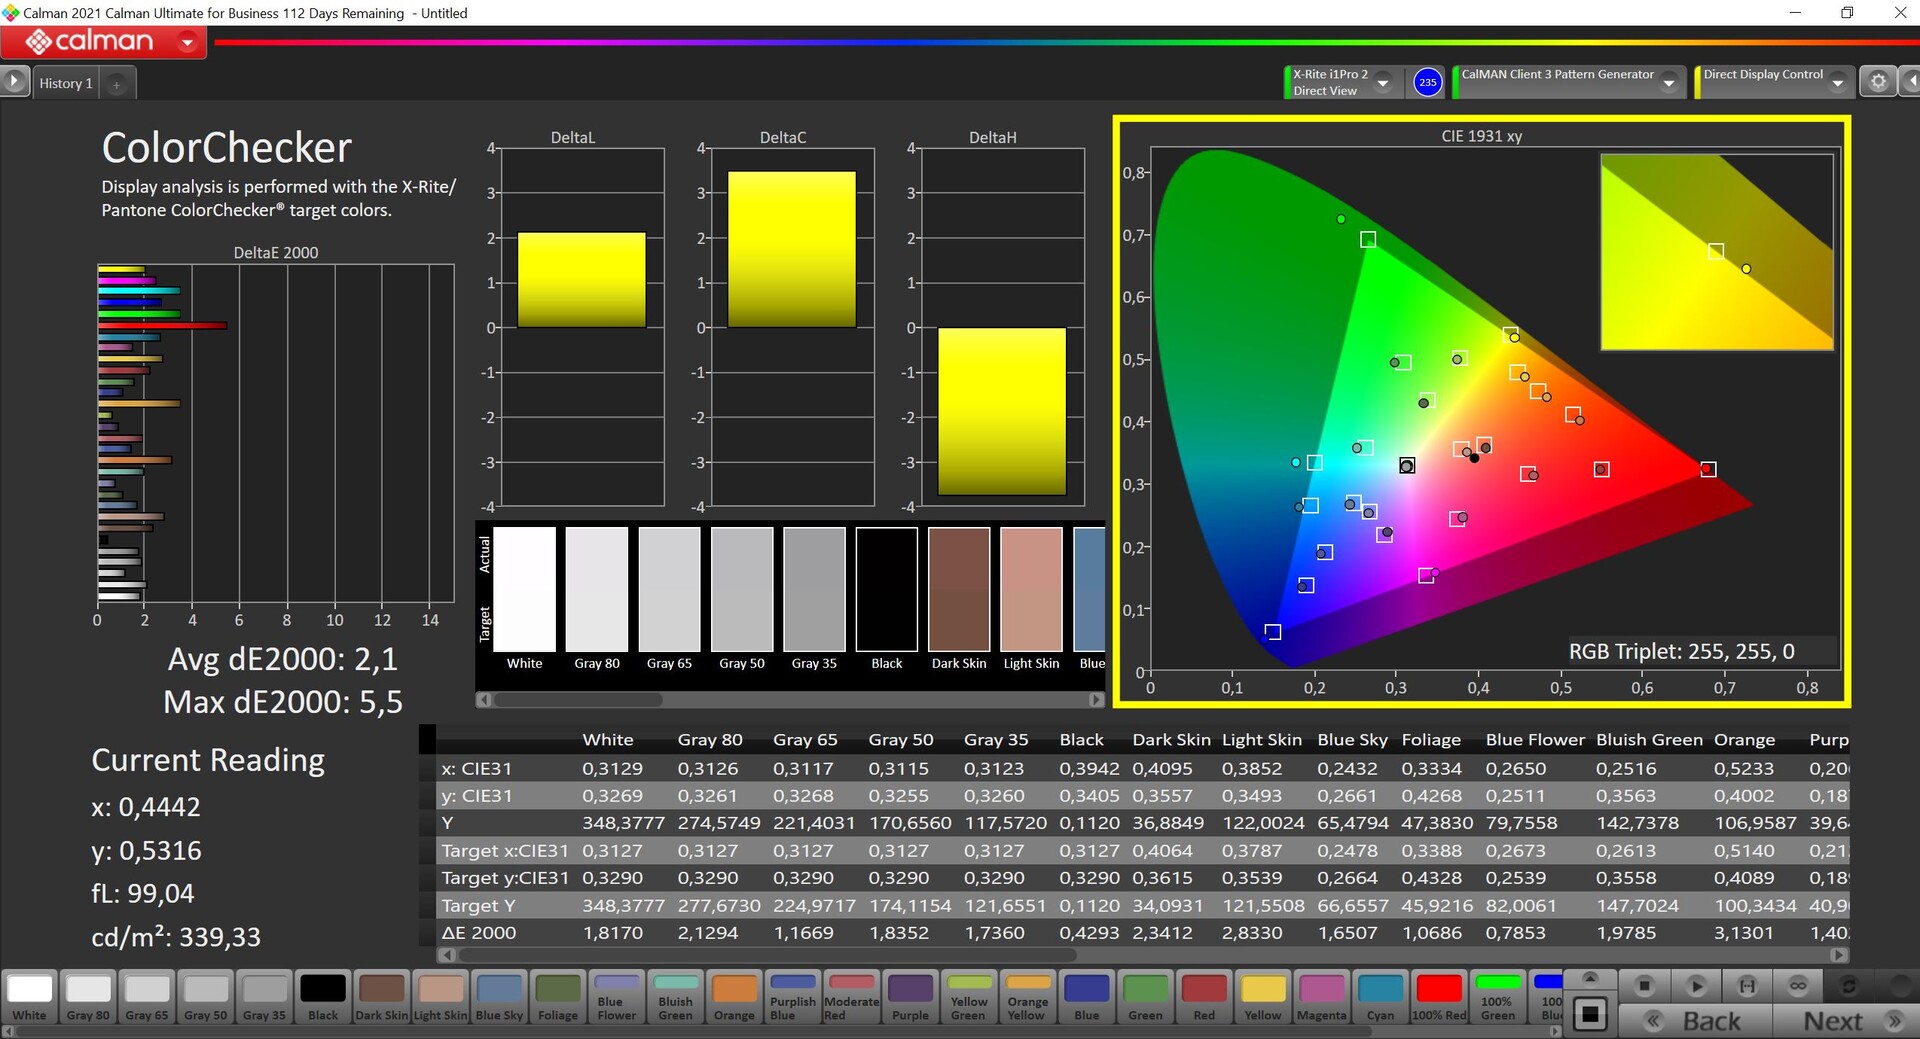
Jak zwykle, w oprogramowaniu MyAsus dostępnych jest kilka profili kolorów, z których domyślnie ustawiony jest "Natywny". Tutaj kolory są nieco przesycone, co powinno skutkować nieco mocniejszym obrazem w praktyce. Najdokładniejszym profilem jest DisplayP3, który wykorzystaliśmy również do naszych pomiarów za pomocą profesjonalnego oprogramowania CalMAN (X-Rite i1 Pro 2). Zasadniczo wyniki są już bardzo dobre i nie ma żadnych problemów z rzutowaniem kolorów ani temperaturą barwową, chociaż niektóre pojedyncze kolory przekraczają ważne odchylenie 3. Nie byliśmy w stanie tego skorygować za pomocą własnej kalibracji, dlatego w tym konkretnym przypadku nie udostępniamy profilu do pobrania. Przestrzeń kolorów P3 jest całkowicie pokryta.
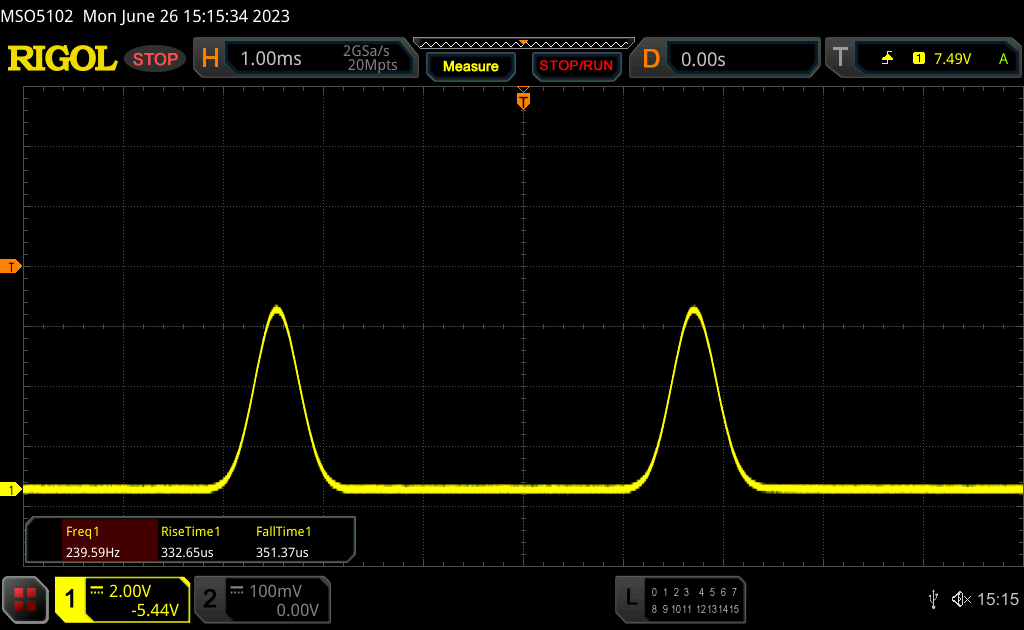
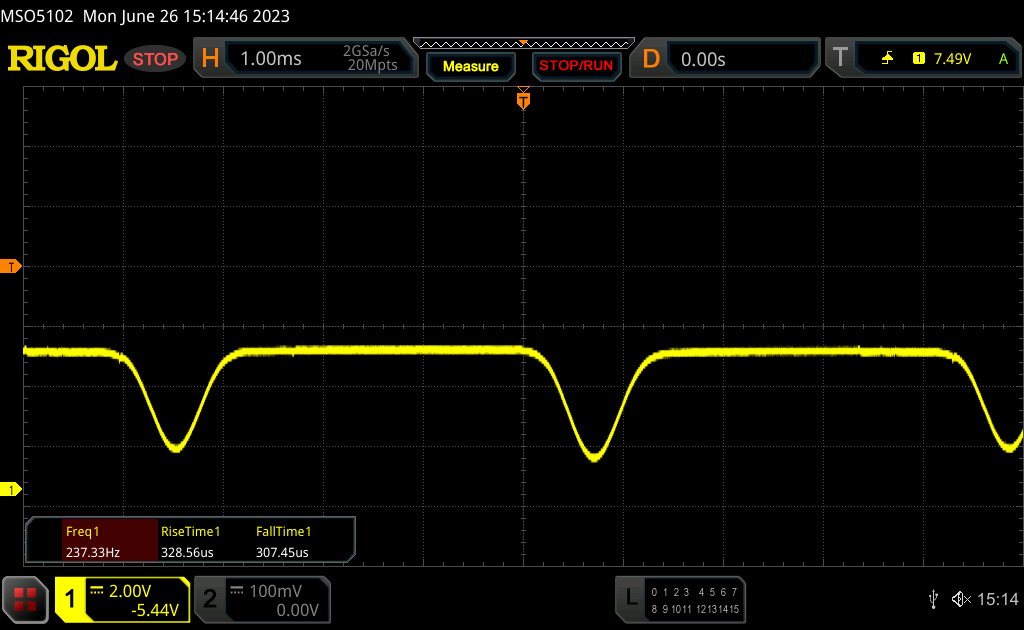
Wyświetl czasy reakcji
| ↔ Czas reakcji od czerni do bieli | ||
|---|---|---|
| 0.79 ms ... wzrost ↗ i spadek ↘ łącznie | ↗ 0.34 ms wzrost | 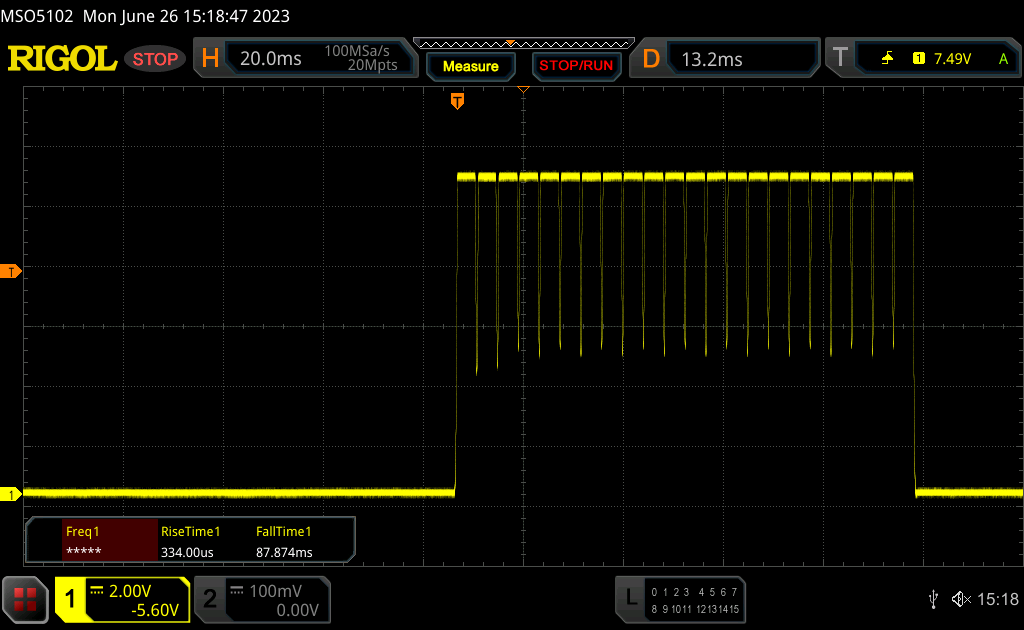 |
| ↘ 0.45 ms upadek | ||
| W naszych testach ekran wykazuje bardzo szybką reakcję i powinien bardzo dobrze nadawać się do szybkich gier. Dla porównania, wszystkie testowane urządzenia wahają się od 0.1 (minimum) do 240 (maksimum) ms. » 2 % wszystkich urządzeń jest lepszych. Oznacza to, że zmierzony czas reakcji jest lepszy od średniej wszystkich testowanych urządzeń (19.8 ms). | ||
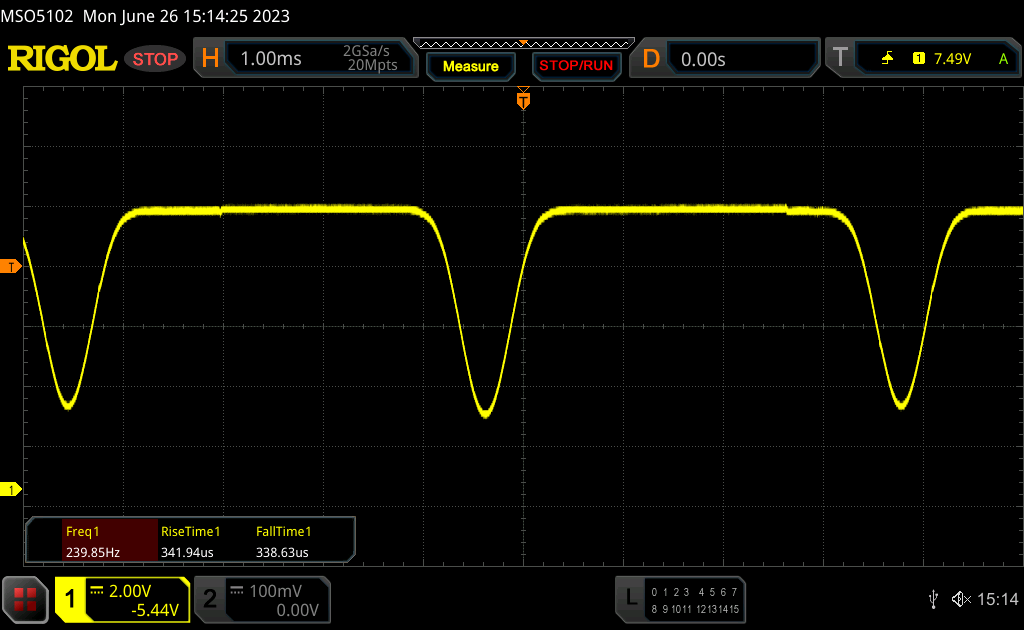
| ↔ Czas reakcji 50% szarości do 80% szarości | ||
| 0.59 ms ... wzrost ↗ i spadek ↘ łącznie | ↗ 0.29 ms wzrost | 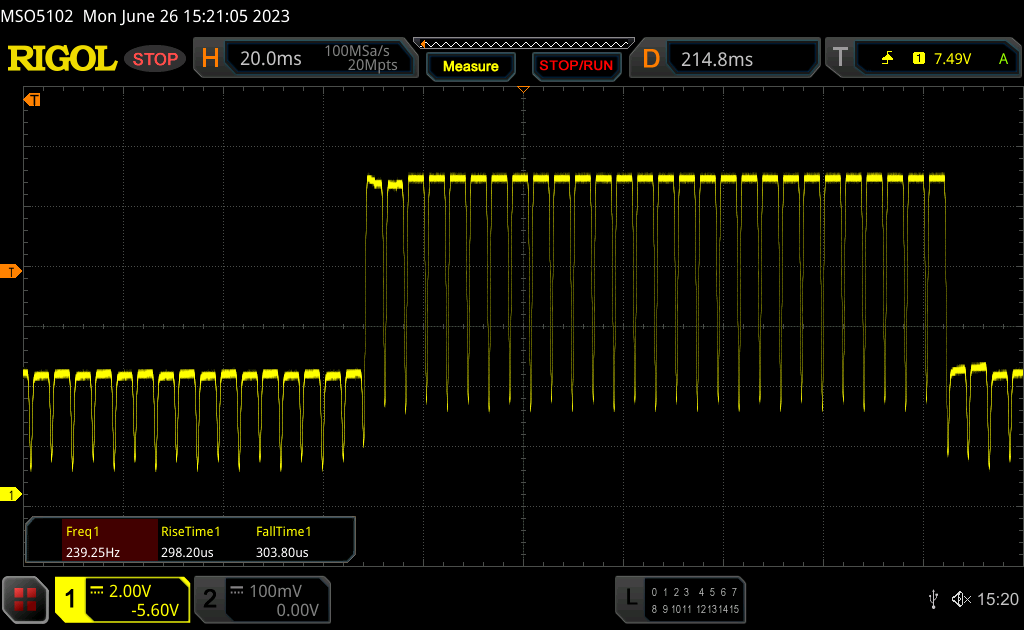 |
| ↘ 0.3 ms upadek | ||
| W naszych testach ekran wykazuje bardzo szybką reakcję i powinien bardzo dobrze nadawać się do szybkich gier. Dla porównania, wszystkie testowane urządzenia wahają się od 0.165 (minimum) do 636 (maksimum) ms. » 1 % wszystkich urządzeń jest lepszych. Oznacza to, że zmierzony czas reakcji jest lepszy od średniej wszystkich testowanych urządzeń (31 ms). | ||
Migotanie ekranu / PWM (modulacja szerokości impulsu)
| Wykryto migotanie ekranu/wykryto PWM | 240 Hz | ≤ 100 % ustawienia jasności | 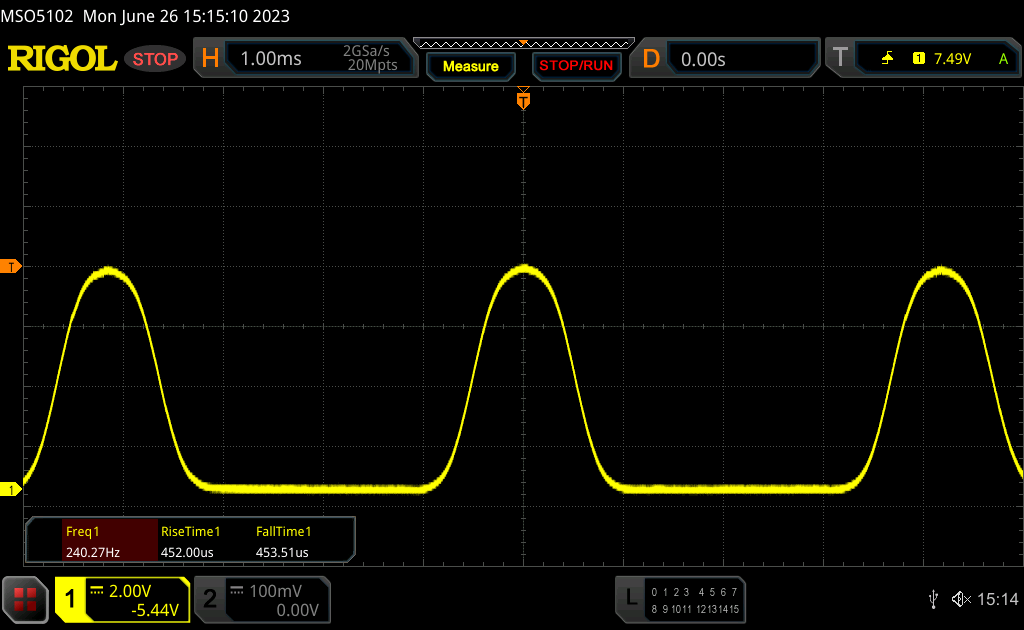 |
Podświetlenie wyświetlacza miga z częstotliwością 240 Hz (najgorszy przypadek, np. przy użyciu PWM) Wykryto migotanie przy ustawieniu jasności 100 % i poniżej. Powyżej tego ustawienia jasności nie powinno być żadnego migotania ani PWM. Częstotliwość 240 Hz jest stosunkowo niska, więc wrażliwi użytkownicy prawdopodobnie zauważą migotanie i odczują zmęczenie oczu przy podanym ustawieniu jasności i poniżej. Dla porównania: 52 % wszystkich testowanych urządzeń nie używa PWM do przyciemniania wyświetlacza. Jeśli wykryto PWM, zmierzono średnio 7753 (minimum: 5 - maksimum: 343500) Hz. | |||
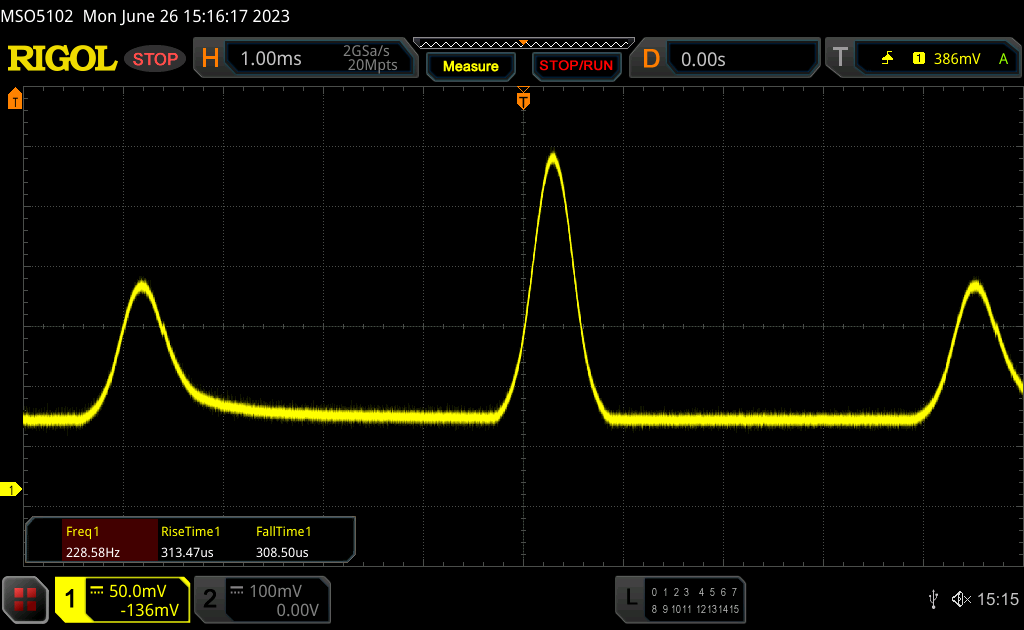
Przyciemnianie DC jest używane w zakresie jasności od 100 do 60%, a klasyczne migotanie PWM z częstotliwością 240 Hz poniżej tego zakresu. Gdy jasność spada poniżej 60%, pojawia się ostrzeżenie, że przyciemnianie DC nie jest już dostępne. Alternatywą jest tak zwane przyciemnianie OLED bez migotania dostępne w oprogramowaniu MyAsus, które sprawdziliśmy w naszej recenzji Zenbook S 13 OLED. Rzeczywiście, jest to przydatny dodatek, ale uciążliwe jest również ciągłe przechodzenie przez oprogramowanie.
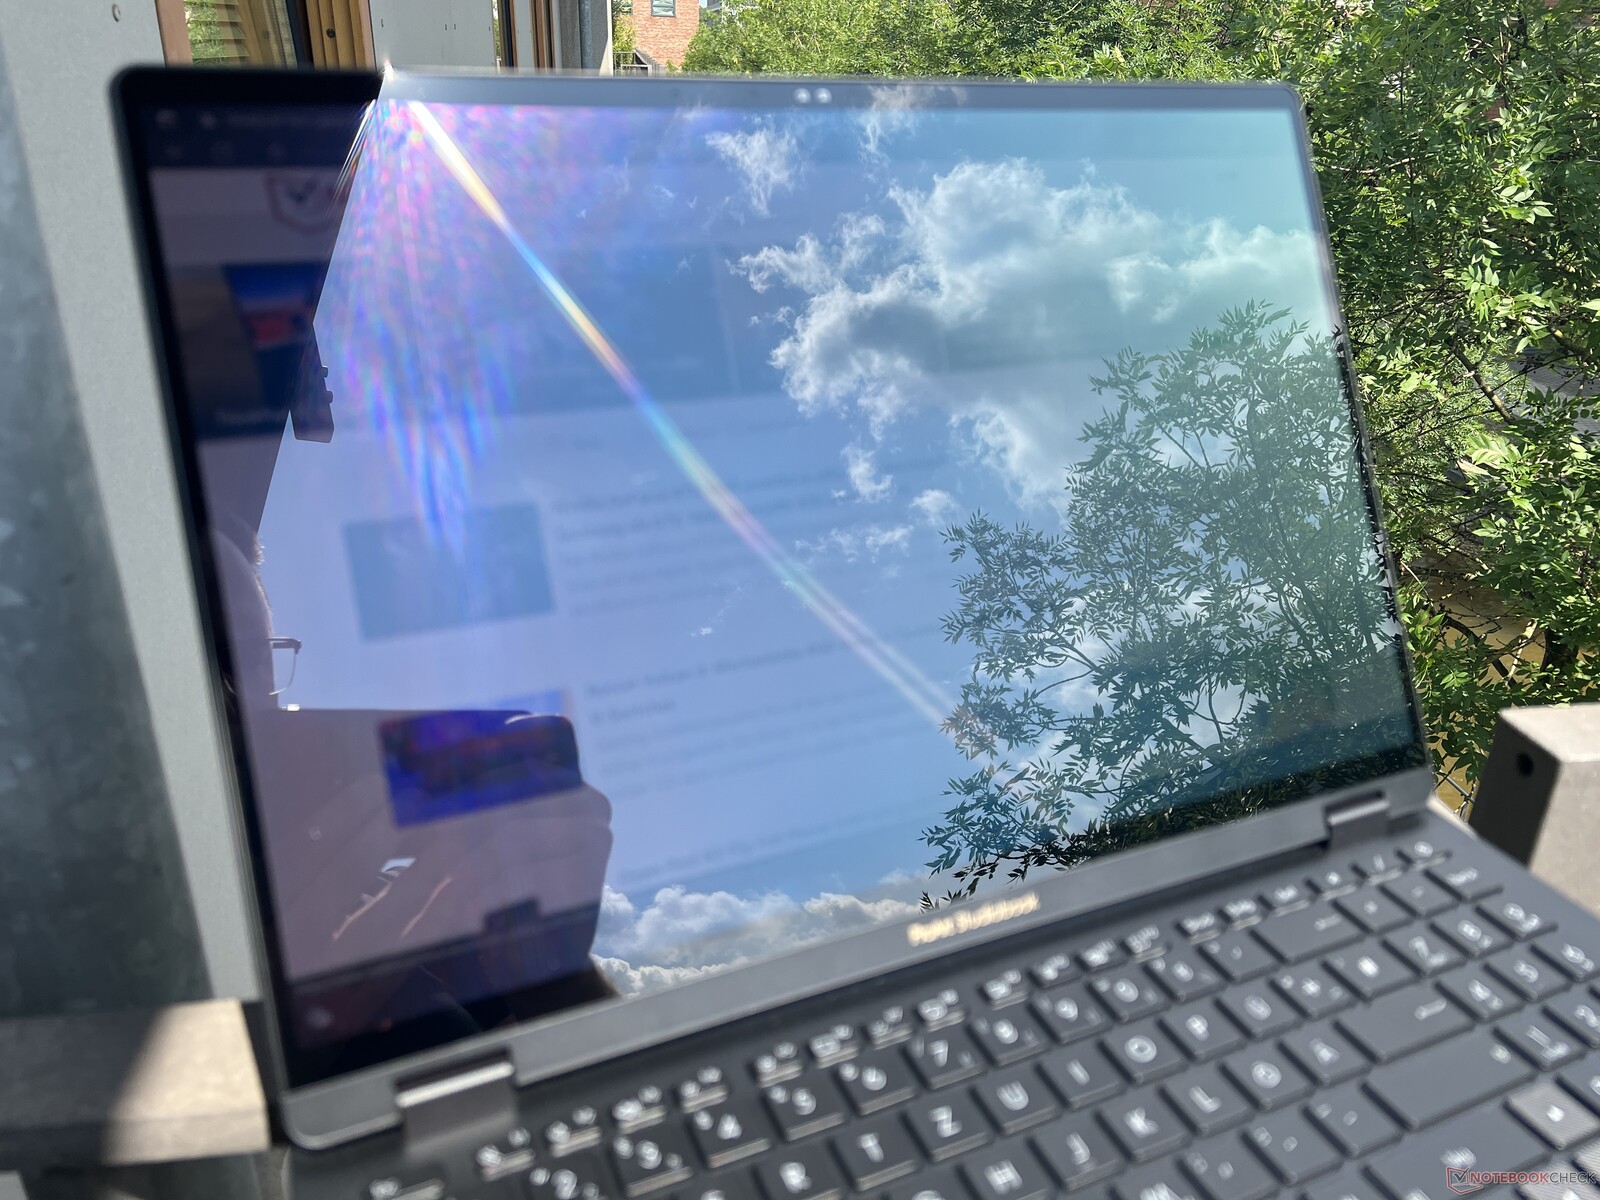
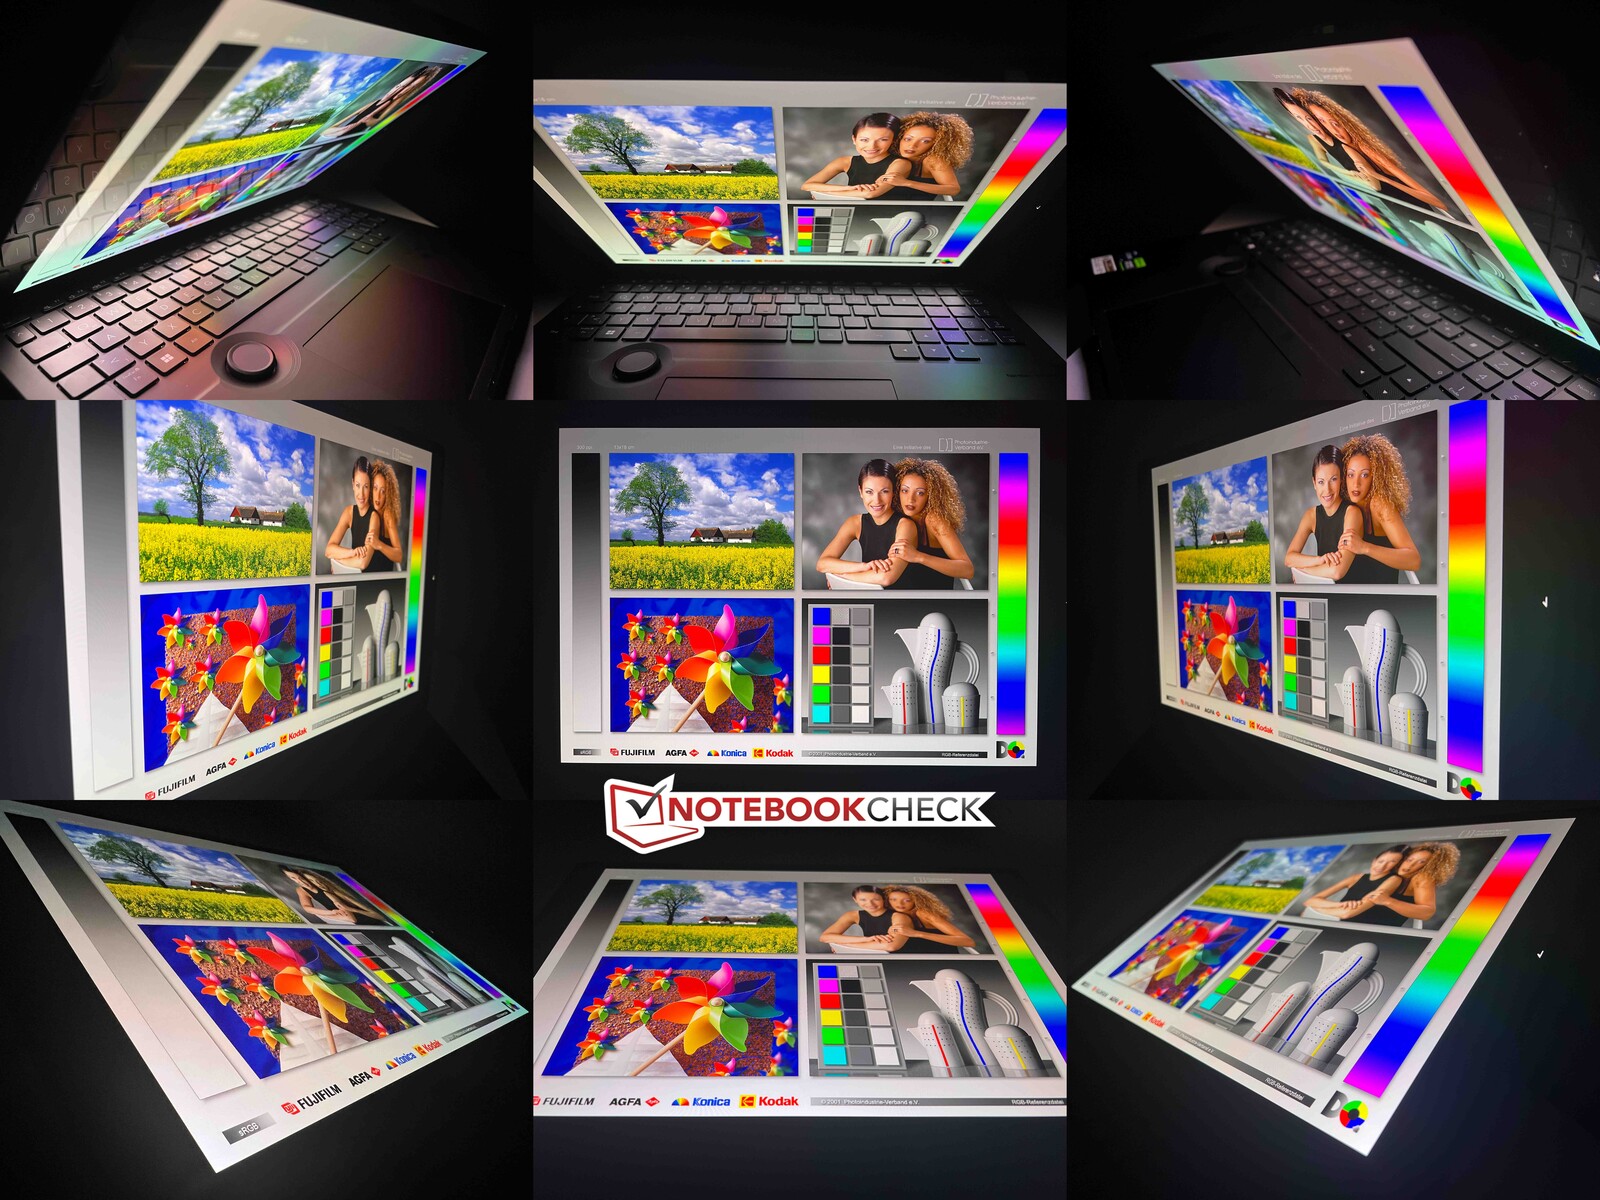
Ekran dotykowy jest bardzo odblaskowy na zewnątrz, więc należy unikać odbić od okien lub źródeł światła zarówno w pomieszczeniach, jak i na zewnątrz. Nie jest to łatwe, zwłaszcza gdy świeci słońce. Stabilność kąta widzenia jest ogólnie bardzo dobra. Tylko przy bardzo ekstremalnych kątach pojawia się typowy niebieski odcień OLED.
Wydajność - Raptor Lake-HX & Ada Lovelace
Warunki testowania
W preinstalowanym oprogramowaniu ProArt Creator Hub dostępne są różne profile energetyczne, które wymieniliśmy w poniższej tabeli. Przeprowadziliśmy pomiary i testy porównawcze głównie w trybie wydajności , ale w niektórych sekcjach przyjrzeliśmy się również efektom pozostałych dwóch trybów.
| Profil energetyczny | Obciążenie CPU | Obciążenie GPU | Test obciążeniowy | Maks. głośność wentylatora |
|---|---|---|---|---|
| Standard | 157/80 watów | 90 watów | CPU: 30 watów GPU: 80 W |
47,6 dB(A) |
| Wydajność | 170/130 watów | 130 watów | CPU: 55 W GPU: 105 W |
56,7 dB(A) |
| Pełna prędkość | 170/130 watów | 130 watów | CPU: 64 W 95 W |
58,9 dB(A) |
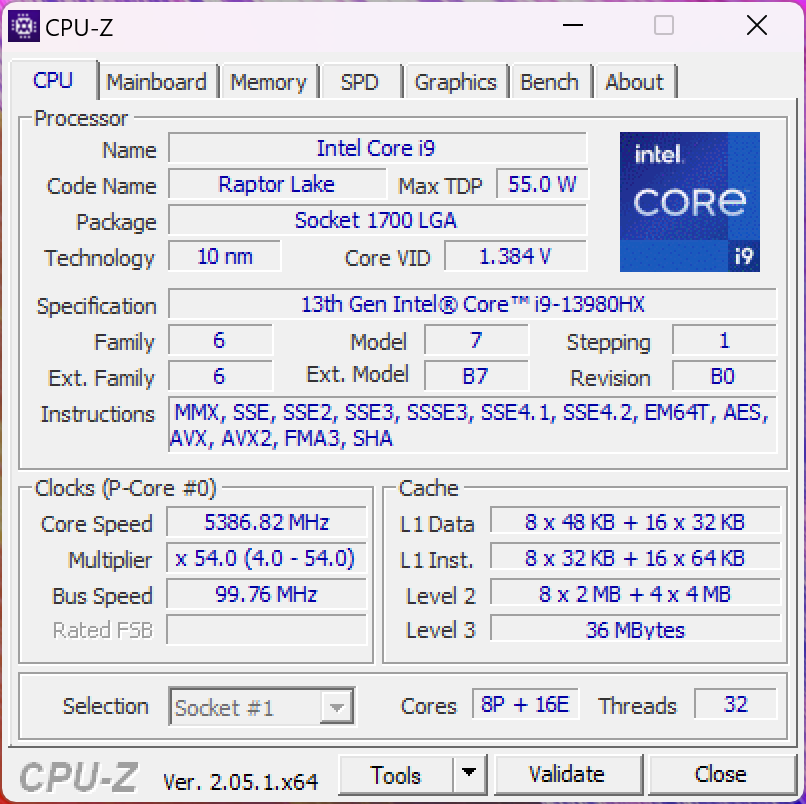
Procesor - Core i9-13980HX
Jako procesor wykorzystano obecny high-endowy model Intela z serii Raptor Lake dla notebooków, Core i9-13980HX. Oferuje on 8 szybkich rdzeni wydajnościowych i 16 rdzeni wydajnościowych, dzięki czemu układ jest w stanie przetwarzać łącznie 32 wątki jednocześnie. W Studiobooku procesor zużywa do ~170 watów i osiąga poziom 130 watów po kilku minutach długotrwałego obciążenia. W dużych notebookach do gier procesor działa nieco szybciej, ale w porównaniu do grupy porównawczej ze zwykłymi procesorami Intela lub Apple M2 Max, Studiobook ma dużą przewagę. Pod względem wydajności jednordzeniowej Core i9 również wyprzedza nowego AMD Ryzen 9 7945HX, ale ten drugi oferuje jeszcze większą wydajność w testach wielordzeniowych, jednocześnie pracując wydajniej
.
Z dala od gniazda, niewiele pozostaje do zobaczenia na temat możliwości wydajnościowych laptopa, ponieważ procesor może tutaj zużywać tylko 34/26 watów. W teście wielozadaniowym CB R23 uzyskał tylko 11 576 punktów, co odpowiada deficytowi na poziomie 63%. StudioBook jest więc wolniejszy na zasilaniu bateryjnym niżMacBook Pro 16 z jego M2 Maxgdzie nie ma spadku wydajności na zasilaniu bateryjnym. Więcej testów porównawczych procesora jest dostępnych w naszej sekcji technicznej.
Cinebench R15 Multi Sustained Load
Cinebench R23: Multi Core | Single Core
Cinebench R20: CPU (Multi Core) | CPU (Single Core)
Cinebench R15: CPU Multi 64Bit | CPU Single 64Bit
Blender: v2.79 BMW27 CPU
7-Zip 18.03: 7z b 4 | 7z b 4 -mmt1
Geekbench 5.5: Multi-Core | Single-Core
HWBOT x265 Benchmark v2.2: 4k Preset
LibreOffice : 20 Documents To PDF
R Benchmark 2.5: Overall mean
| CPU Performance rating | |
| Asus Zephyrus Duo 16 GX650PY-NM006W | |
| Asus ProArt Studiobook 16 OLED H7604 | |
| Przeciętny Intel Core i9-13980HX | |
| Apple MacBook Pro 16 2023 M2 Max -6! | |
| MSI Stealth 17 Studio A13VH-014 | |
| Gigabyte AERO 16 OLED BSF | |
| Średnia w klasie Multimedia | |
| Samsung Galaxy Book3 Ultra 16 | |
| Cinebench R23 / Multi Core | |
| Asus Zephyrus Duo 16 GX650PY-NM006W | |
| Asus ProArt Studiobook 16 OLED H7604 | |
| Przeciętny Intel Core i9-13980HX (28301 - 33052, n=11) | |
| MSI Stealth 17 Studio A13VH-014 | |
| Gigabyte AERO 16 OLED BSF | |
| Średnia w klasie Multimedia (4861 - 33362, n=79, ostatnie 2 lata) | |
| Samsung Galaxy Book3 Ultra 16 | |
| Apple MacBook Pro 16 2023 M2 Max | |
| Cinebench R23 / Single Core | |
| Asus ProArt Studiobook 16 OLED H7604 | |
| Przeciętny Intel Core i9-13980HX (1825 - 2169, n=9) | |
| Asus Zephyrus Duo 16 GX650PY-NM006W | |
| Średnia w klasie Multimedia (1128 - 2459, n=71, ostatnie 2 lata) | |
| Gigabyte AERO 16 OLED BSF | |
| MSI Stealth 17 Studio A13VH-014 | |
| Samsung Galaxy Book3 Ultra 16 | |
| Apple MacBook Pro 16 2023 M2 Max | |
| Cinebench R20 / CPU (Multi Core) | |
| Asus Zephyrus Duo 16 GX650PY-NM006W | |
| Asus ProArt Studiobook 16 OLED H7604 | |
| Przeciętny Intel Core i9-13980HX (10353 - 12437, n=10) | |
| MSI Stealth 17 Studio A13VH-014 | |
| Gigabyte AERO 16 OLED BSF | |
| Średnia w klasie Multimedia (1887 - 12912, n=62, ostatnie 2 lata) | |
| Samsung Galaxy Book3 Ultra 16 | |
| Apple MacBook Pro 16 2023 M2 Max | |
| Cinebench R20 / CPU (Single Core) | |
| Asus ProArt Studiobook 16 OLED H7604 | |
| Przeciętny Intel Core i9-13980HX (717 - 825, n=10) | |
| Asus Zephyrus Duo 16 GX650PY-NM006W | |
| Średnia w klasie Multimedia (425 - 853, n=62, ostatnie 2 lata) | |
| MSI Stealth 17 Studio A13VH-014 | |
| Samsung Galaxy Book3 Ultra 16 | |
| Gigabyte AERO 16 OLED BSF | |
| Apple MacBook Pro 16 2023 M2 Max | |
| Cinebench R15 / CPU Multi 64Bit | |
| Asus Zephyrus Duo 16 GX650PY-NM006W | |
| Przeciętny Intel Core i9-13980HX (4358 - 5172, n=11) | |
| Asus ProArt Studiobook 16 OLED H7604 | |
| MSI Stealth 17 Studio A13VH-014 | |
| Gigabyte AERO 16 OLED BSF | |
| Średnia w klasie Multimedia (856 - 5224, n=66, ostatnie 2 lata) | |
| Samsung Galaxy Book3 Ultra 16 | |
| Apple MacBook Pro 16 2023 M2 Max | |
| Cinebench R15 / CPU Single 64Bit | |
| Asus ProArt Studiobook 16 OLED H7604 | |
| Asus Zephyrus Duo 16 GX650PY-NM006W | |
| Przeciętny Intel Core i9-13980HX (289 - 312, n=11) | |
| MSI Stealth 17 Studio A13VH-014 | |
| Średnia w klasie Multimedia (184.8 - 326, n=64, ostatnie 2 lata) | |
| Samsung Galaxy Book3 Ultra 16 | |
| Gigabyte AERO 16 OLED BSF | |
| Apple MacBook Pro 16 2023 M2 Max | |
| Blender / v2.79 BMW27 CPU | |
| Średnia w klasie Multimedia (100 - 557, n=63, ostatnie 2 lata) | |
| Samsung Galaxy Book3 Ultra 16 | |
| Gigabyte AERO 16 OLED BSF | |
| MSI Stealth 17 Studio A13VH-014 | |
| Przeciętny Intel Core i9-13980HX (97 - 136, n=10) | |
| Asus ProArt Studiobook 16 OLED H7604 | |
| Asus Zephyrus Duo 16 GX650PY-NM006W | |
| 7-Zip 18.03 / 7z b 4 | |
| Asus Zephyrus Duo 16 GX650PY-NM006W | |
| Asus ProArt Studiobook 16 OLED H7604 | |
| Przeciętny Intel Core i9-13980HX (104616 - 129804, n=10) | |
| MSI Stealth 17 Studio A13VH-014 | |
| Gigabyte AERO 16 OLED BSF | |
| Samsung Galaxy Book3 Ultra 16 | |
| Średnia w klasie Multimedia (26062 - 130368, n=60, ostatnie 2 lata) | |
| 7-Zip 18.03 / 7z b 4 -mmt1 | |
| Asus Zephyrus Duo 16 GX650PY-NM006W | |
| Asus ProArt Studiobook 16 OLED H7604 | |
| Przeciętny Intel Core i9-13980HX (6230 - 7163, n=10) | |
| MSI Stealth 17 Studio A13VH-014 | |
| Średnia w klasie Multimedia (3666 - 7545, n=61, ostatnie 2 lata) | |
| Gigabyte AERO 16 OLED BSF | |
| Samsung Galaxy Book3 Ultra 16 | |
| Geekbench 5.5 / Multi-Core | |
| Przeciętny Intel Core i9-13980HX (18475 - 22200, n=10) | |
| Asus ProArt Studiobook 16 OLED H7604 | |
| Asus Zephyrus Duo 16 GX650PY-NM006W | |
| Apple MacBook Pro 16 2023 M2 Max | |
| Gigabyte AERO 16 OLED BSF | |
| MSI Stealth 17 Studio A13VH-014 | |
| Średnia w klasie Multimedia (4652 - 20422, n=60, ostatnie 2 lata) | |
| Samsung Galaxy Book3 Ultra 16 | |
| Geekbench 5.5 / Single-Core | |
| Asus ProArt Studiobook 16 OLED H7604 | |
| Asus Zephyrus Duo 16 GX650PY-NM006W | |
| Przeciętny Intel Core i9-13980HX (1796 - 2139, n=10) | |
| MSI Stealth 17 Studio A13VH-014 | |
| Apple MacBook Pro 16 2023 M2 Max | |
| Średnia w klasie Multimedia (805 - 2974, n=60, ostatnie 2 lata) | |
| Gigabyte AERO 16 OLED BSF | |
| Samsung Galaxy Book3 Ultra 16 | |
| HWBOT x265 Benchmark v2.2 / 4k Preset | |
| Asus Zephyrus Duo 16 GX650PY-NM006W | |
| Przeciętny Intel Core i9-13980HX (27 - 33.4, n=9) | |
| Asus ProArt Studiobook 16 OLED H7604 | |
| MSI Stealth 17 Studio A13VH-014 | |
| Gigabyte AERO 16 OLED BSF | |
| Średnia w klasie Multimedia (5.26 - 36.1, n=61, ostatnie 2 lata) | |
| Samsung Galaxy Book3 Ultra 16 | |
| LibreOffice / 20 Documents To PDF | |
| Asus Zephyrus Duo 16 GX650PY-NM006W | |
| Gigabyte AERO 16 OLED BSF | |
| MSI Stealth 17 Studio A13VH-014 | |
| Średnia w klasie Multimedia (23.9 - 146.7, n=62, ostatnie 2 lata) | |
| Samsung Galaxy Book3 Ultra 16 | |
| Asus ProArt Studiobook 16 OLED H7604 | |
| Przeciętny Intel Core i9-13980HX (35 - 51.4, n=10) | |
| R Benchmark 2.5 / Overall mean | |
| Gigabyte AERO 16 OLED BSF | |
| Samsung Galaxy Book3 Ultra 16 | |
| Średnia w klasie Multimedia (0.3604 - 0.947, n=61, ostatnie 2 lata) | |
| MSI Stealth 17 Studio A13VH-014 | |
| Asus Zephyrus Duo 16 GX650PY-NM006W | |
| Przeciętny Intel Core i9-13980HX (0.3793 - 0.4462, n=10) | |
| Asus ProArt Studiobook 16 OLED H7604 | |
* ... im mniej tym lepiej
AIDA64: FP32 Ray-Trace | FPU Julia | CPU SHA3 | CPU Queen | FPU SinJulia | FPU Mandel | CPU AES | CPU ZLib | FP64 Ray-Trace | CPU PhotoWorxx
| Performance rating | |
| Asus ProArt Studiobook 16 OLED H7604 | |
| Przeciętny Intel Core i9-13980HX | |
| Gigabyte AERO 16 OLED BSF | |
| MSI Stealth 17 Studio A13VH-014 | |
| Średnia w klasie Multimedia | |
| Samsung Galaxy Book3 Ultra 16 | |
| AIDA64 / FP32 Ray-Trace | |
| Asus ProArt Studiobook 16 OLED H7604 | |
| Przeciętny Intel Core i9-13980HX (21332 - 29553, n=9) | |
| MSI Stealth 17 Studio A13VH-014 | |
| Gigabyte AERO 16 OLED BSF | |
| Średnia w klasie Multimedia (2214 - 50388, n=58, ostatnie 2 lata) | |
| Samsung Galaxy Book3 Ultra 16 | |
| AIDA64 / FPU Julia | |
| Asus ProArt Studiobook 16 OLED H7604 | |
| Przeciętny Intel Core i9-13980HX (108001 - 148168, n=9) | |
| MSI Stealth 17 Studio A13VH-014 | |
| Gigabyte AERO 16 OLED BSF | |
| Średnia w klasie Multimedia (12867 - 201874, n=59, ostatnie 2 lata) | |
| Samsung Galaxy Book3 Ultra 16 | |
| AIDA64 / CPU SHA3 | |
| Asus ProArt Studiobook 16 OLED H7604 | |
| Przeciętny Intel Core i9-13980HX (5264 - 7142, n=9) | |
| MSI Stealth 17 Studio A13VH-014 | |
| Gigabyte AERO 16 OLED BSF | |
| Średnia w klasie Multimedia (626 - 8623, n=59, ostatnie 2 lata) | |
| Samsung Galaxy Book3 Ultra 16 | |
| AIDA64 / CPU Queen | |
| Przeciętny Intel Core i9-13980HX (126758 - 143409, n=9) | |
| Asus ProArt Studiobook 16 OLED H7604 | |
| Samsung Galaxy Book3 Ultra 16 | |
| MSI Stealth 17 Studio A13VH-014 | |
| Gigabyte AERO 16 OLED BSF | |
| Średnia w klasie Multimedia (13483 - 181505, n=46, ostatnie 2 lata) | |
| AIDA64 / FPU SinJulia | |
| Przeciętny Intel Core i9-13980HX (13785 - 17117, n=9) | |
| Asus ProArt Studiobook 16 OLED H7604 | |
| MSI Stealth 17 Studio A13VH-014 | |
| Gigabyte AERO 16 OLED BSF | |
| Samsung Galaxy Book3 Ultra 16 | |
| Średnia w klasie Multimedia (886 - 28794, n=59, ostatnie 2 lata) | |
| AIDA64 / FPU Mandel | |
| Asus ProArt Studiobook 16 OLED H7604 | |
| Przeciętny Intel Core i9-13980HX (53398 - 73758, n=9) | |
| MSI Stealth 17 Studio A13VH-014 | |
| Gigabyte AERO 16 OLED BSF | |
| Średnia w klasie Multimedia (6395 - 105740, n=58, ostatnie 2 lata) | |
| Samsung Galaxy Book3 Ultra 16 | |
| AIDA64 / CPU AES | |
| Gigabyte AERO 16 OLED BSF | |
| Asus ProArt Studiobook 16 OLED H7604 | |
| Przeciętny Intel Core i9-13980HX (105169 - 136520, n=9) | |
| MSI Stealth 17 Studio A13VH-014 | |
| Samsung Galaxy Book3 Ultra 16 | |
| Średnia w klasie Multimedia (8171 - 126790, n=59, ostatnie 2 lata) | |
| AIDA64 / CPU ZLib | |
| Asus ProArt Studiobook 16 OLED H7604 | |
| Przeciętny Intel Core i9-13980HX (1513 - 2039, n=9) | |
| MSI Stealth 17 Studio A13VH-014 | |
| Gigabyte AERO 16 OLED BSF | |
| Samsung Galaxy Book3 Ultra 16 | |
| Średnia w klasie Multimedia (143.8 - 2022, n=59, ostatnie 2 lata) | |
| AIDA64 / FP64 Ray-Trace | |
| Przeciętny Intel Core i9-13980HX (11431 - 16325, n=9) | |
| Asus ProArt Studiobook 16 OLED H7604 | |
| MSI Stealth 17 Studio A13VH-014 | |
| Gigabyte AERO 16 OLED BSF | |
| Średnia w klasie Multimedia (1014 - 26875, n=59, ostatnie 2 lata) | |
| Samsung Galaxy Book3 Ultra 16 | |
| AIDA64 / CPU PhotoWorxx | |
| MSI Stealth 17 Studio A13VH-014 | |
| Średnia w klasie Multimedia (8187 - 88154, n=59, ostatnie 2 lata) | |
| Asus ProArt Studiobook 16 OLED H7604 | |
| Samsung Galaxy Book3 Ultra 16 | |
| Przeciętny Intel Core i9-13980HX (37069 - 52949, n=9) | |
| Gigabyte AERO 16 OLED BSF | |
Wydajność systemu
Wydajność systemu jest doskonała, zarówno w syntetycznych testach porównawczych, jak i w praktyce. Podczas testów nie napotkano również żadnych problemów.
CrossMark: Overall | Productivity | Creativity | Responsiveness
| PCMark 10 / Score | |
| Asus Zephyrus Duo 16 GX650PY-NM006W | |
| Gigabyte AERO 16 OLED BSF | |
| Średnia w klasie Multimedia (4325 - 10386, n=56, ostatnie 2 lata) | |
| Asus ProArt Studiobook 16 OLED H7604 | |
| Przeciętny Intel Core i9-13980HX, NVIDIA GeForce RTX 4070 Laptop GPU (n=1) | |
| MSI Stealth 17 Studio A13VH-014 | |
| Samsung Galaxy Book3 Ultra 16 | |
| PCMark 10 / Essentials | |
| Asus Zephyrus Duo 16 GX650PY-NM006W | |
| Gigabyte AERO 16 OLED BSF | |
| Asus ProArt Studiobook 16 OLED H7604 | |
| Przeciętny Intel Core i9-13980HX, NVIDIA GeForce RTX 4070 Laptop GPU (n=1) | |
| Samsung Galaxy Book3 Ultra 16 | |
| Średnia w klasie Multimedia (8025 - 11664, n=55, ostatnie 2 lata) | |
| MSI Stealth 17 Studio A13VH-014 | |
| PCMark 10 / Productivity | |
| Asus Zephyrus Duo 16 GX650PY-NM006W | |
| Średnia w klasie Multimedia (7323 - 18233, n=55, ostatnie 2 lata) | |
| MSI Stealth 17 Studio A13VH-014 | |
| Asus ProArt Studiobook 16 OLED H7604 | |
| Przeciętny Intel Core i9-13980HX, NVIDIA GeForce RTX 4070 Laptop GPU (n=1) | |
| Gigabyte AERO 16 OLED BSF | |
| Samsung Galaxy Book3 Ultra 16 | |
| PCMark 10 / Digital Content Creation | |
| Asus Zephyrus Duo 16 GX650PY-NM006W | |
| Gigabyte AERO 16 OLED BSF | |
| MSI Stealth 17 Studio A13VH-014 | |
| Asus ProArt Studiobook 16 OLED H7604 | |
| Przeciętny Intel Core i9-13980HX, NVIDIA GeForce RTX 4070 Laptop GPU (n=1) | |
| Średnia w klasie Multimedia (3651 - 16240, n=55, ostatnie 2 lata) | |
| Samsung Galaxy Book3 Ultra 16 | |
| CrossMark / Overall | |
| Asus ProArt Studiobook 16 OLED H7604 | |
| Przeciętny Intel Core i9-13980HX, NVIDIA GeForce RTX 4070 Laptop GPU (n=1) | |
| Asus Zephyrus Duo 16 GX650PY-NM006W | |
| Apple MacBook Pro 16 2023 M2 Max | |
| Gigabyte AERO 16 OLED BSF | |
| Średnia w klasie Multimedia (866 - 2728, n=65, ostatnie 2 lata) | |
| MSI Stealth 17 Studio A13VH-014 | |
| Samsung Galaxy Book3 Ultra 16 | |
| CrossMark / Productivity | |
| Asus ProArt Studiobook 16 OLED H7604 | |
| Przeciętny Intel Core i9-13980HX, NVIDIA GeForce RTX 4070 Laptop GPU (n=1) | |
| Asus Zephyrus Duo 16 GX650PY-NM006W | |
| Gigabyte AERO 16 OLED BSF | |
| Średnia w klasie Multimedia (931 - 2489, n=65, ostatnie 2 lata) | |
| MSI Stealth 17 Studio A13VH-014 | |
| Apple MacBook Pro 16 2023 M2 Max | |
| Samsung Galaxy Book3 Ultra 16 | |
| CrossMark / Creativity | |
| Apple MacBook Pro 16 2023 M2 Max | |
| Asus ProArt Studiobook 16 OLED H7604 | |
| Przeciętny Intel Core i9-13980HX, NVIDIA GeForce RTX 4070 Laptop GPU (n=1) | |
| Asus Zephyrus Duo 16 GX650PY-NM006W | |
| Średnia w klasie Multimedia (907 - 3465, n=65, ostatnie 2 lata) | |
| Gigabyte AERO 16 OLED BSF | |
| MSI Stealth 17 Studio A13VH-014 | |
| Samsung Galaxy Book3 Ultra 16 | |
| CrossMark / Responsiveness | |
| Gigabyte AERO 16 OLED BSF | |
| Asus ProArt Studiobook 16 OLED H7604 | |
| Przeciętny Intel Core i9-13980HX, NVIDIA GeForce RTX 4070 Laptop GPU (n=1) | |
| Asus Zephyrus Duo 16 GX650PY-NM006W | |
| MSI Stealth 17 Studio A13VH-014 | |
| Średnia w klasie Multimedia (605 - 2024, n=65, ostatnie 2 lata) | |
| Samsung Galaxy Book3 Ultra 16 | |
| Apple MacBook Pro 16 2023 M2 Max | |
| PCMark 10 Score | 7491 pkt. | |
Pomoc | ||
| AIDA64 / Memory Copy | |
| Średnia w klasie Multimedia (11299 - 132135, n=59, ostatnie 2 lata) | |
| Asus ProArt Studiobook 16 OLED H7604 | |
| MSI Stealth 17 Studio A13VH-014 | |
| Samsung Galaxy Book3 Ultra 16 | |
| Przeciętny Intel Core i9-13980HX (62189 - 80776, n=9) | |
| Gigabyte AERO 16 OLED BSF | |
| AIDA64 / Memory Read | |
| Średnia w klasie Multimedia (11624 - 174586, n=59, ostatnie 2 lata) | |
| Asus ProArt Studiobook 16 OLED H7604 | |
| Przeciętny Intel Core i9-13980HX (62624 - 89096, n=9) | |
| MSI Stealth 17 Studio A13VH-014 | |
| Samsung Galaxy Book3 Ultra 16 | |
| Gigabyte AERO 16 OLED BSF | |
| AIDA64 / Memory Write | |
| Samsung Galaxy Book3 Ultra 16 | |
| Średnia w klasie Multimedia (11755 - 134998, n=59, ostatnie 2 lata) | |
| MSI Stealth 17 Studio A13VH-014 | |
| Asus ProArt Studiobook 16 OLED H7604 | |
| Przeciętny Intel Core i9-13980HX (59912 - 79917, n=9) | |
| Gigabyte AERO 16 OLED BSF | |
| AIDA64 / Memory Latency | |
| Średnia w klasie Multimedia (7 - 535, n=58, ostatnie 2 lata) | |
| Samsung Galaxy Book3 Ultra 16 | |
| Gigabyte AERO 16 OLED BSF | |
| MSI Stealth 17 Studio A13VH-014 | |
| Przeciętny Intel Core i9-13980HX (79.4 - 93.2, n=9) | |
| Asus ProArt Studiobook 16 OLED H7604 | |
* ... im mniej tym lepiej
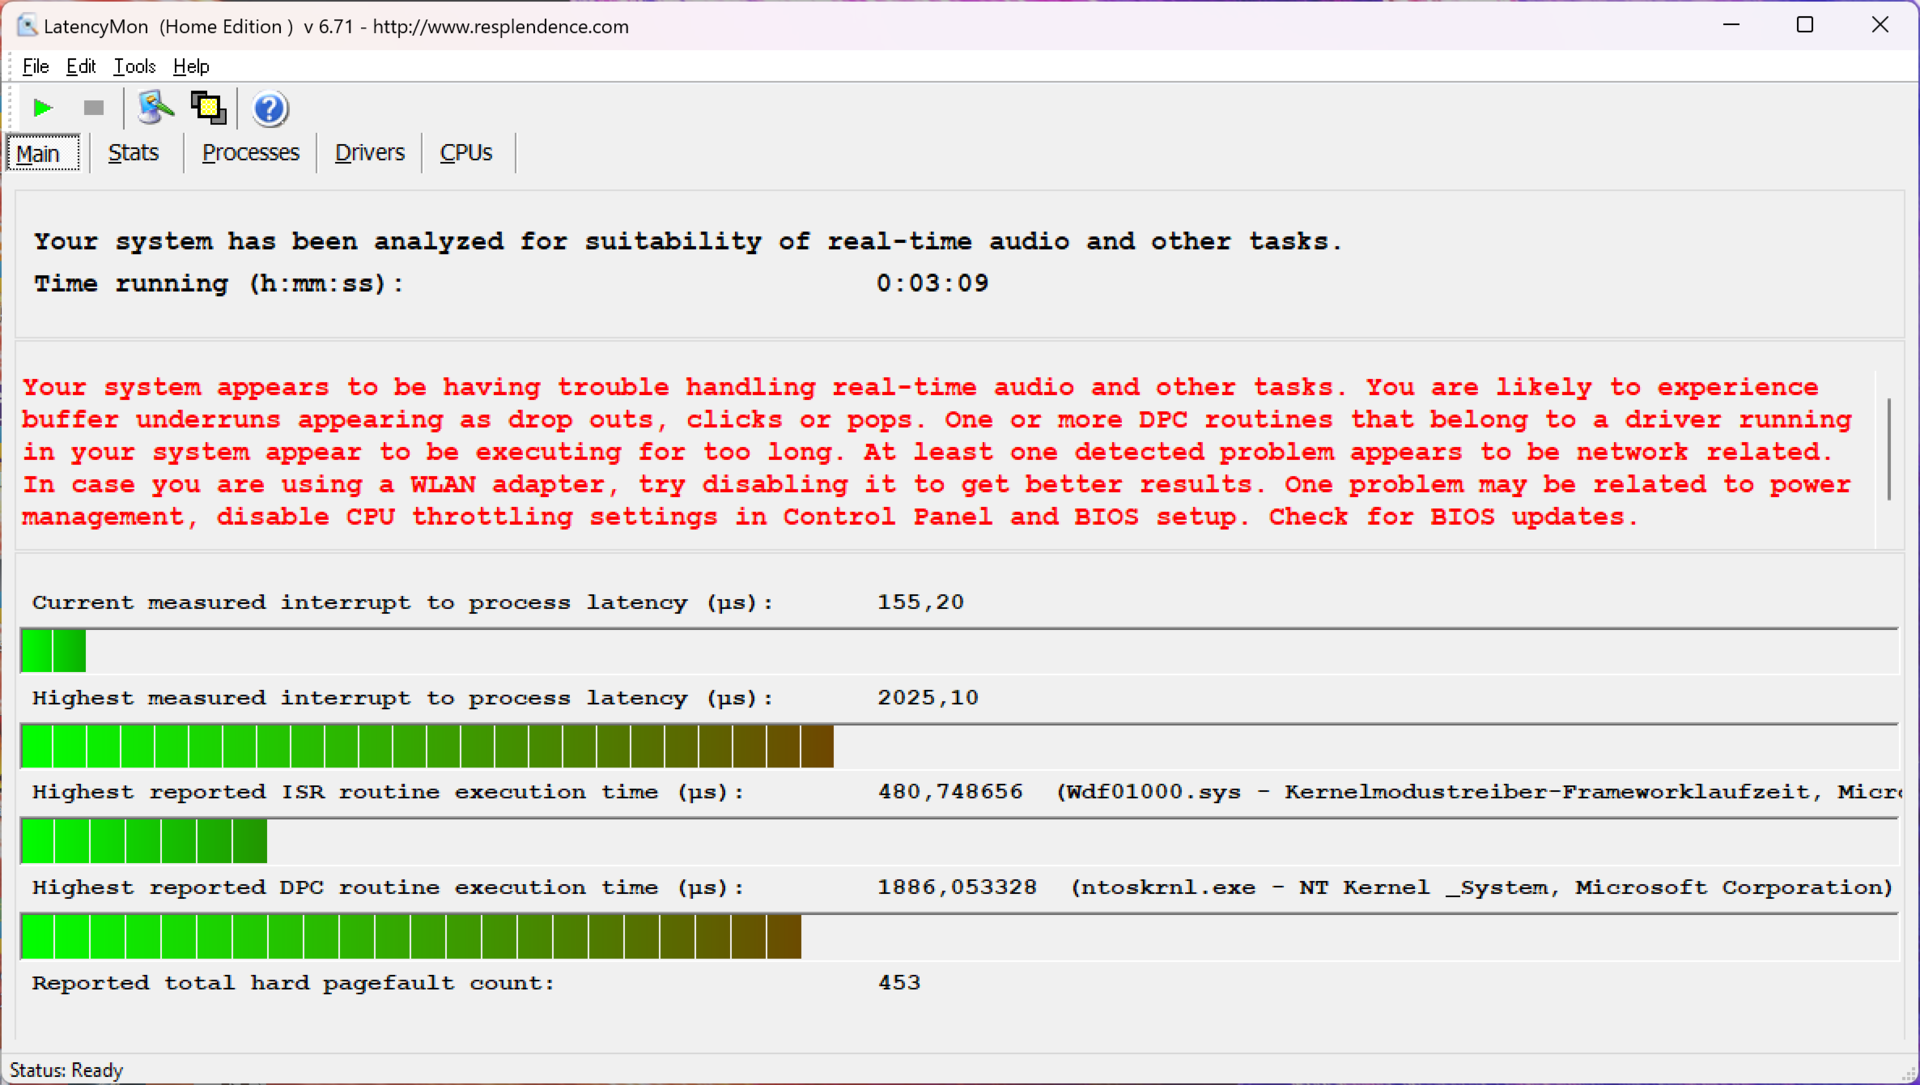
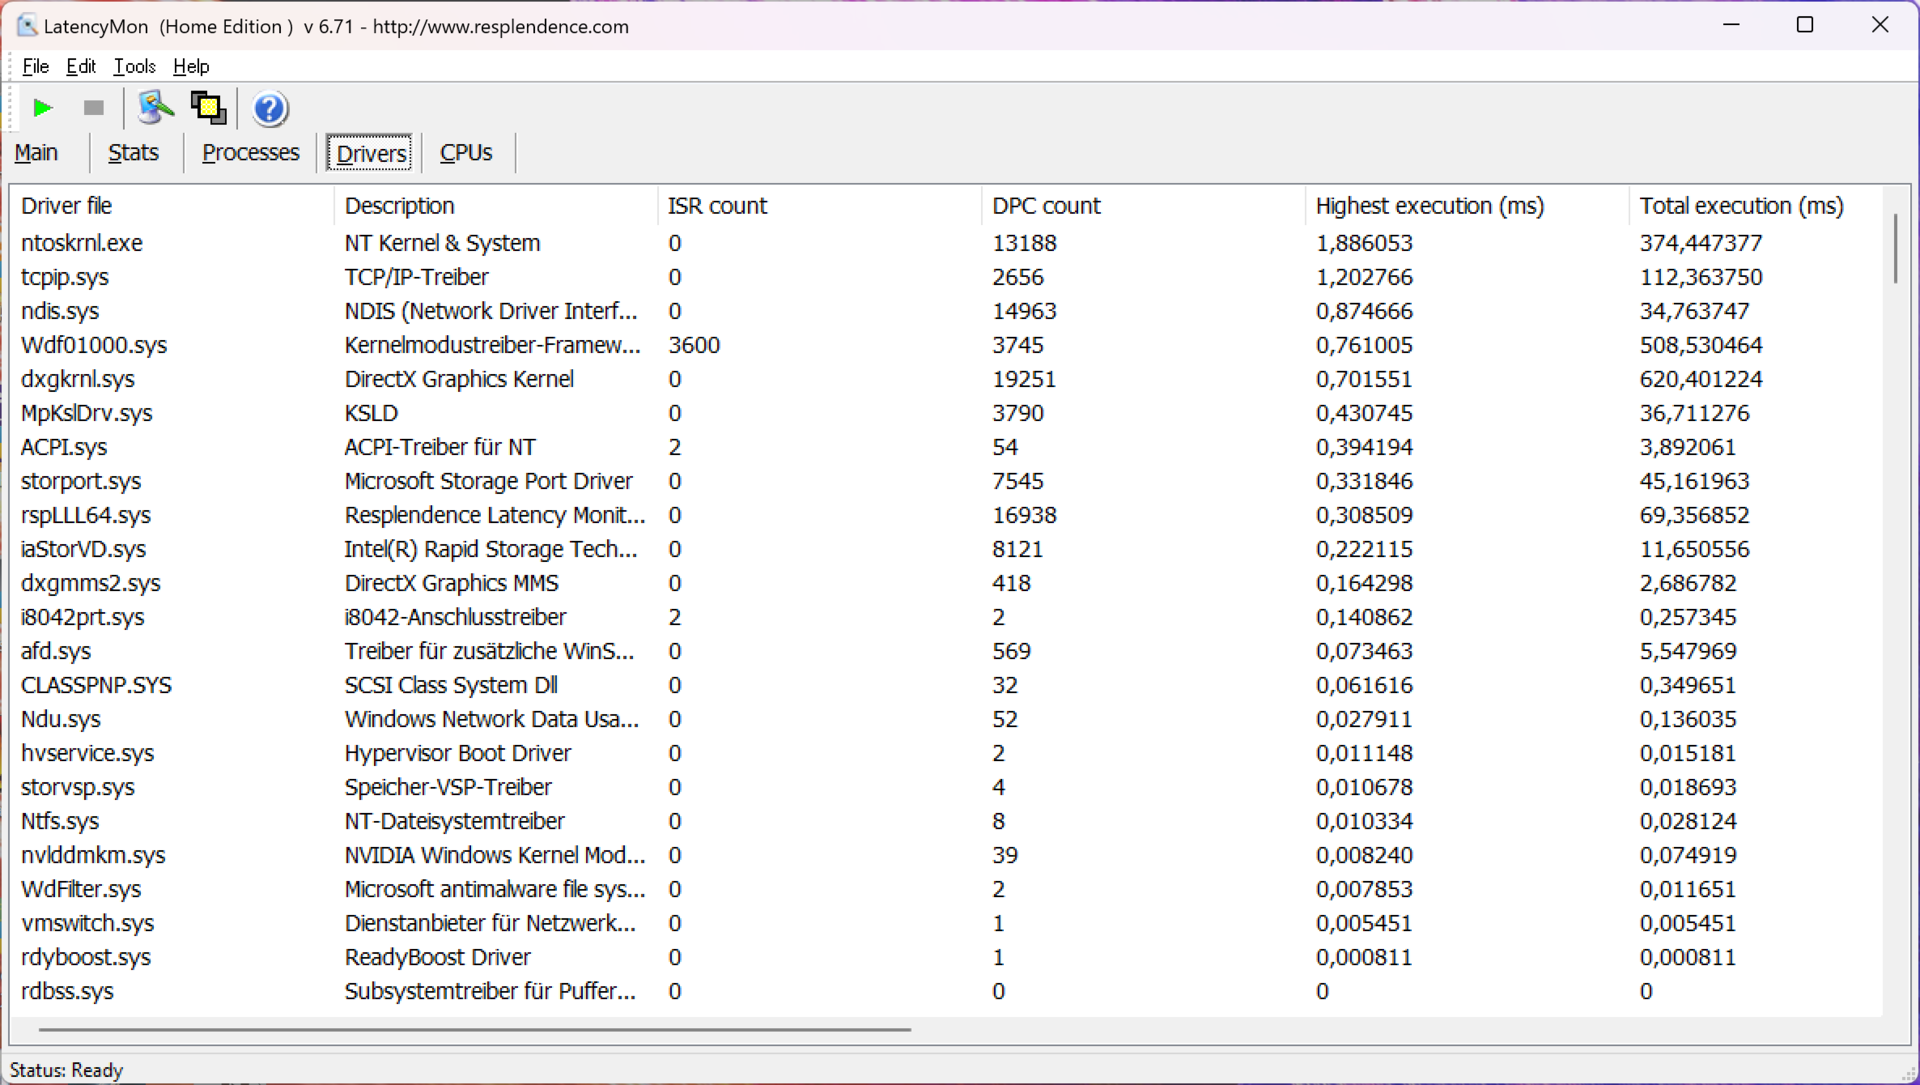
Opóźnienie DPC
Studiobook nie nadaje się szczególnie do zastosowań audio w czasie rzeczywistym. Wysokie opóźnienia występowały pod obecną wersją BIOS-u w naszym standardowym teście opóźnień.
| DPC Latencies / LatencyMon - interrupt to process latency (max), Web, Youtube, Prime95 | |
| Asus Zephyrus Duo 16 GX650PY-NM006W | |
| Samsung Galaxy Book3 Ultra 16 | |
| MSI Stealth 17 Studio A13VH-014 | |
| Asus ProArt Studiobook 16 OLED H7604 | |
| Gigabyte AERO 16 OLED BSF | |
* ... im mniej tym lepiej
Urządzenia pamięci masowej
W naszym urządzeniu testowym zastosowano szybki dysk SSD PCIe 4.0 firmy Phison, który oferuje ogromną pojemność 4 TB. Z tego 3,63 TB jest nadal dostępne po pierwszym uruchomieniu. Dysk jest bardzo szybki z szybkością transferu przekraczającą 7 GB/s, a przede wszystkim wydajność może być utrzymywana stale, nawet przy stałym obciążeniu. Nie jest to bynajmniej standard. Dodatkowo Studiobook 16 oferuje jeszcze jeden slot M.2 2280, który również podłączany jest za pomocą szybkiego interfejsu PCIe 4.0. Więcej testów porównawczych dysków SSD można znaleźćtutaj.

* ... im mniej tym lepiej
Sustained Read Performance: DiskSpd Read Loop, Queue Depth 8
Grafika
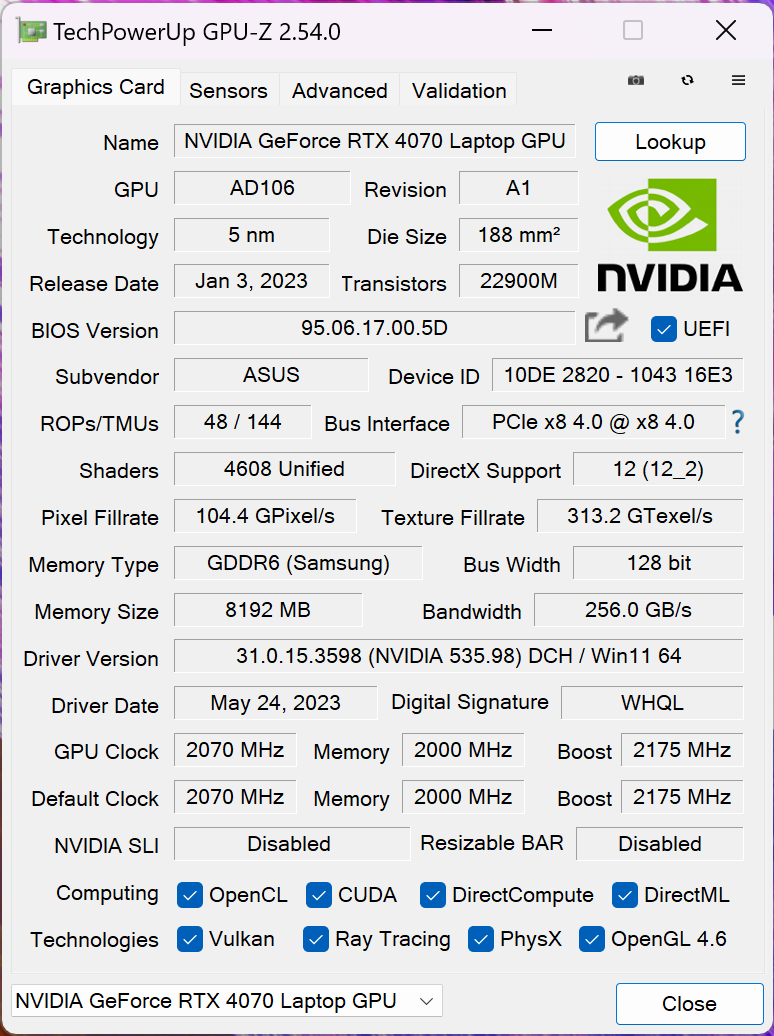
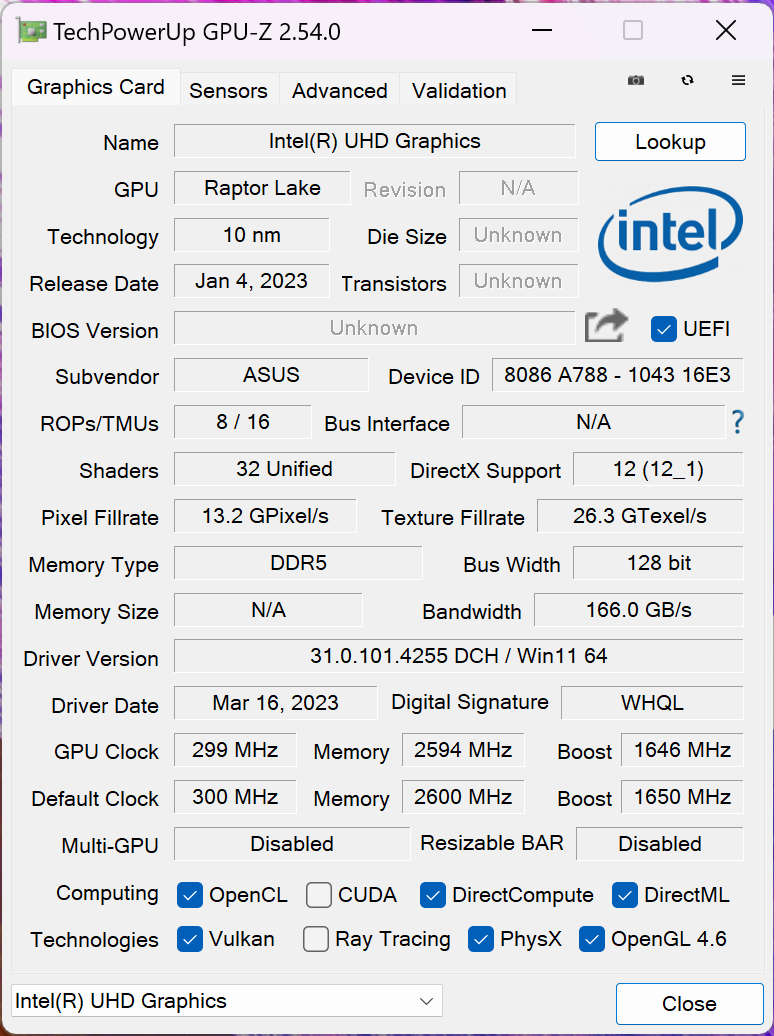
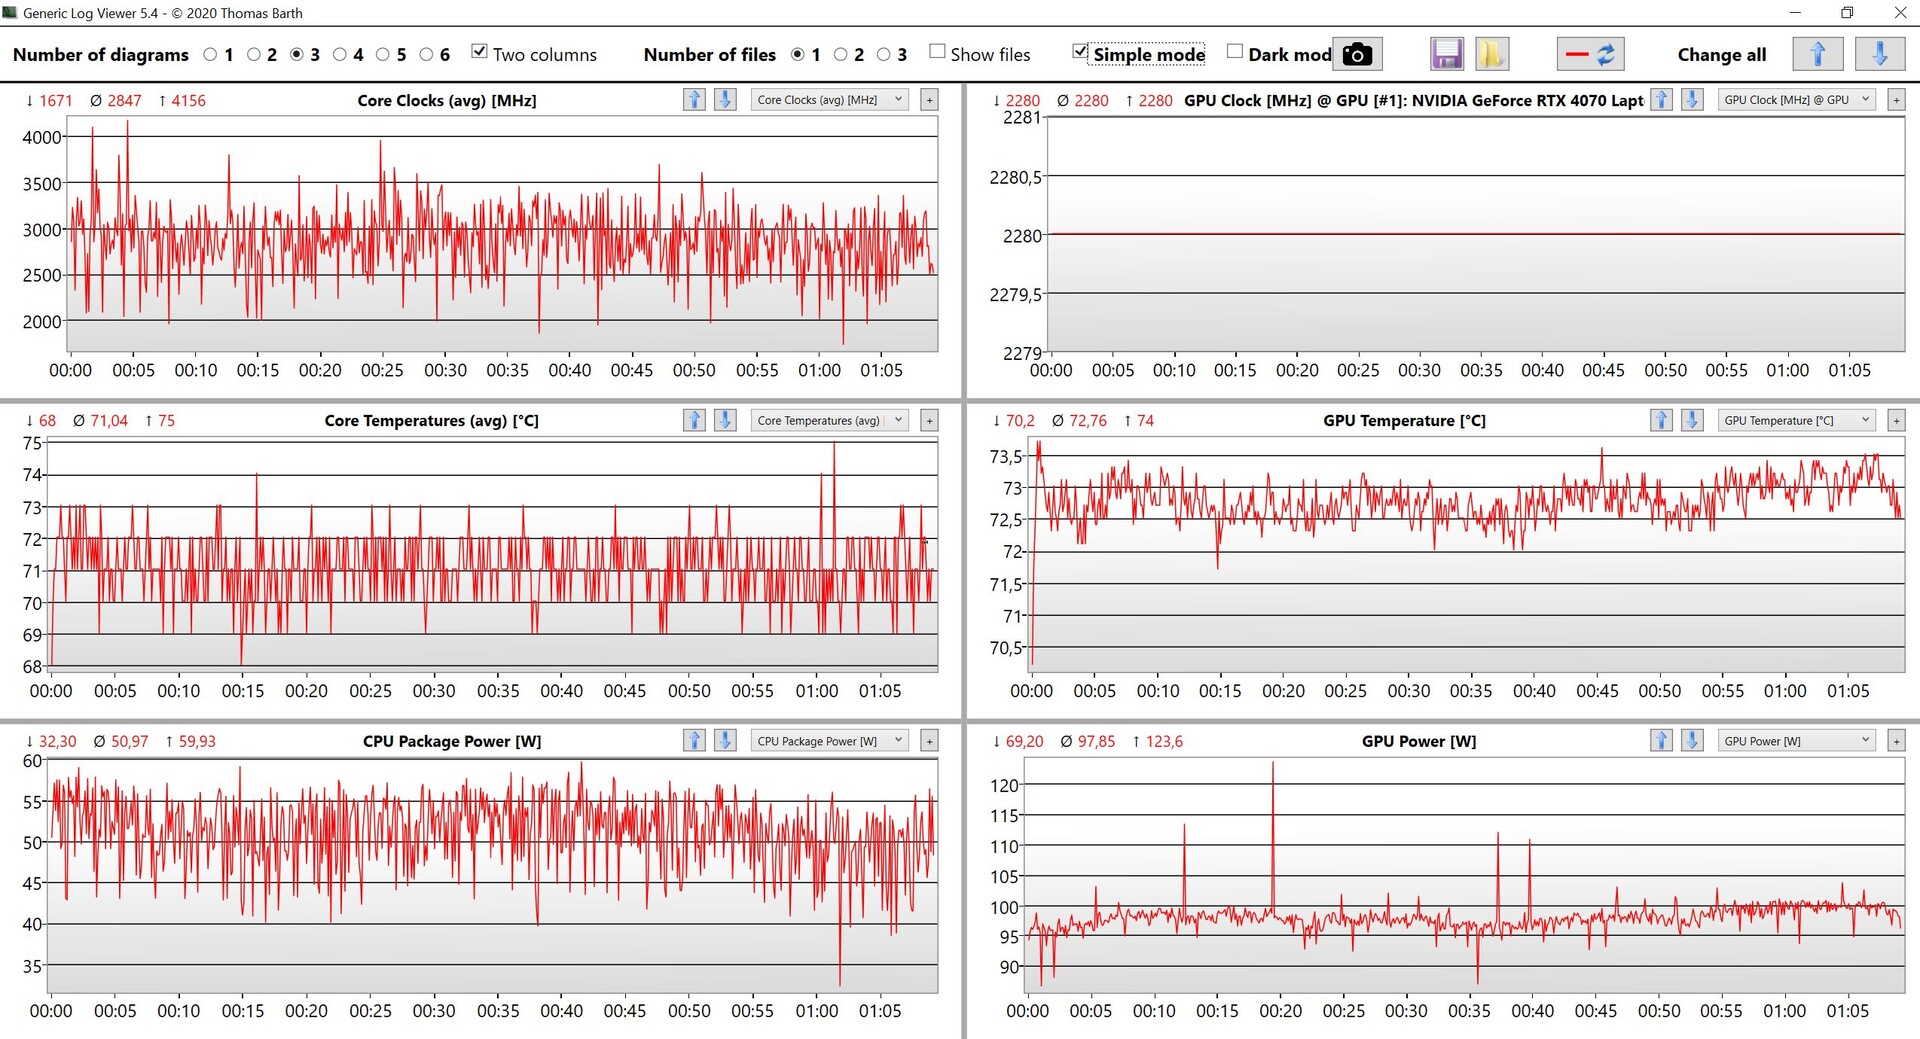
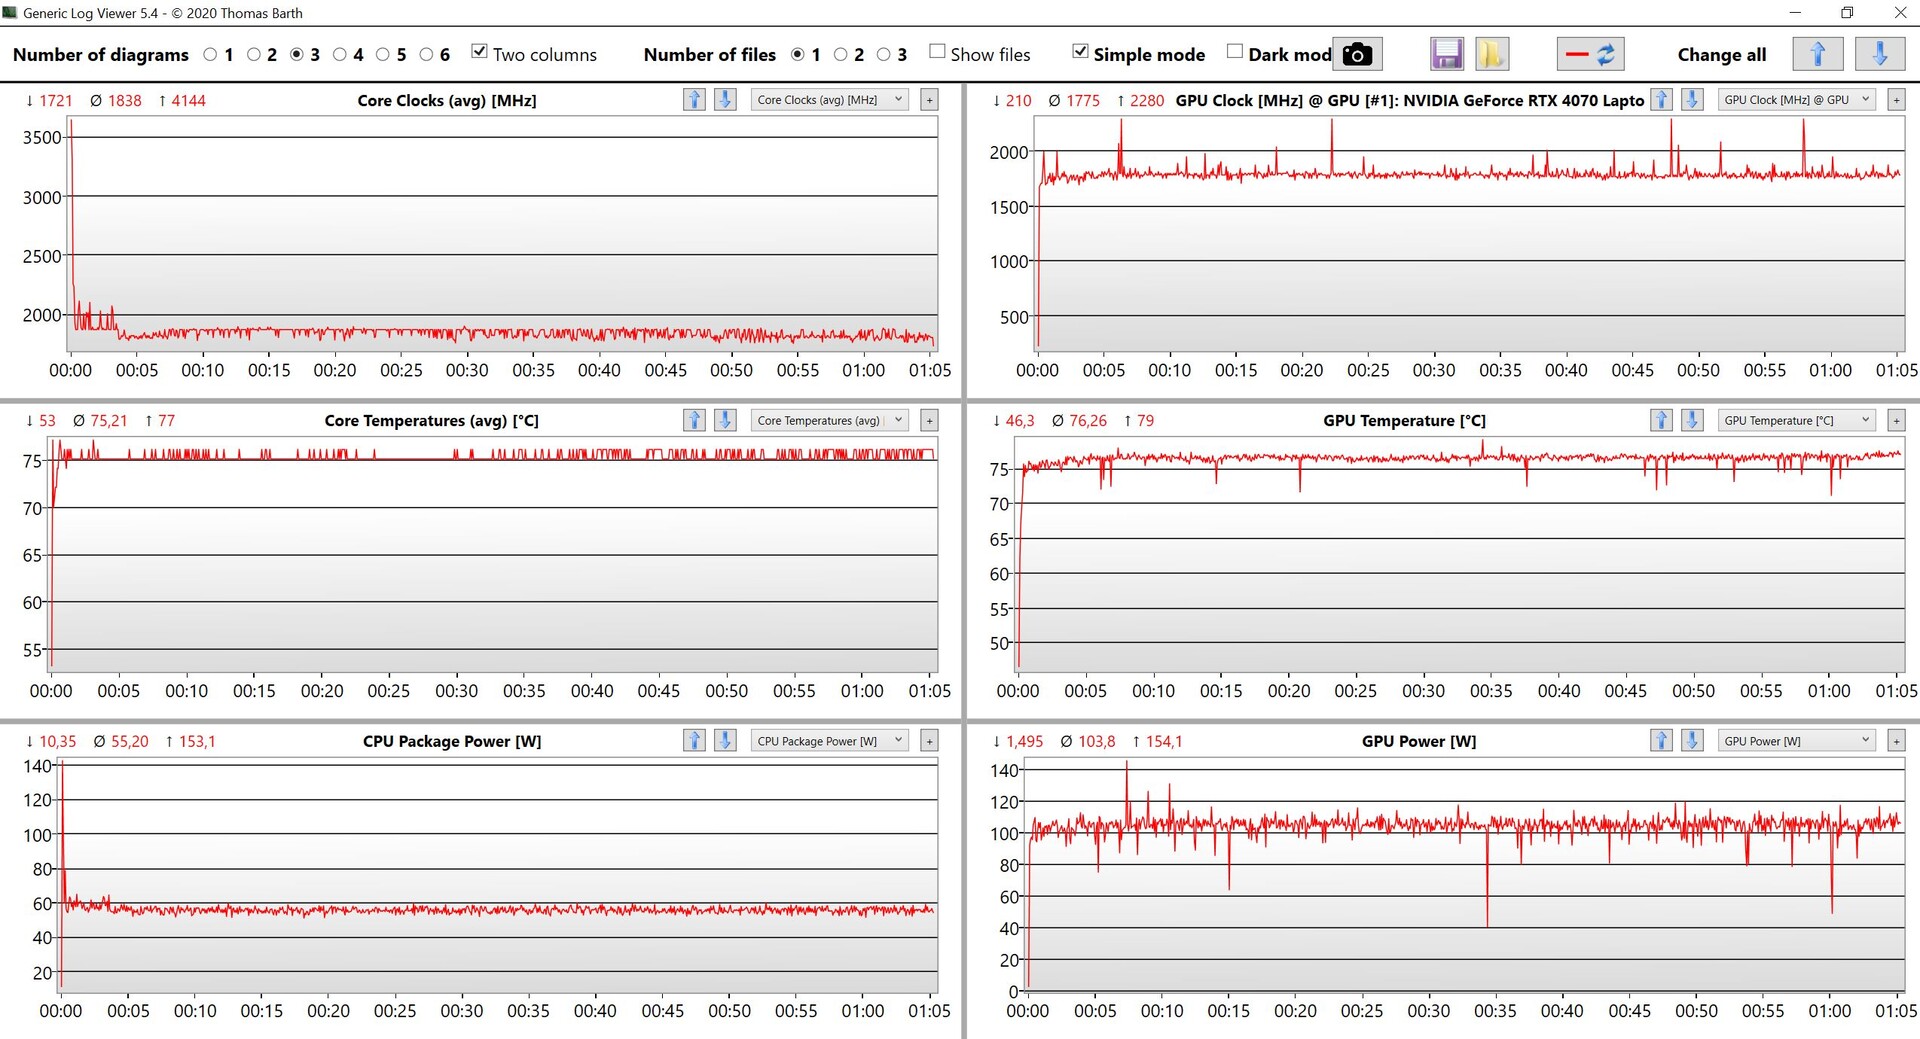
Oprócz zintegrowanej karty graficznej procesora (UHD Graphics), zainstalowano również szybką kartę Nvidia GeForce RTX 4070 Laptop. Przełączanie grafiki odbywa się za pomocą Optimusa, ale nie ma zaawansowanego Optimusa ani przełącznika MUX. Przy maksymalnym TGP wynoszącym 130 watów jest to jeden z najszybszych modeli laptopów 4070, ale liczba ta jest nieco myląca. Jak widzieliśmy w naszej pierwszej recenzji nowych mobilnych GPU, wartość ta może zostać osiągnięta w testach syntetycznych, takich jak FurMark, ale w grach jest ograniczona do około 105-110 watów, ponieważ GPU osiąga tutaj swoje maksymalne taktowanie
W benchmarkach RTX 4070 plasuje się na oczekiwanym poziomie zaRTX 4080 Laptop i 4090 Laptopw porównaniu do starego Studiobook 16 z RTX 3070 Ti,przewaga na poziomie 7-15% nie jest tak duża, więc aktualizacja nie jest tutaj naprawdę opłacalna. Wydajność GPU pozostaje stabilna pod stałym obciążeniem, ale wydajność jest o około 40% niższa w trybie bateryjnym (maks. TGP 40 watów). Więcej testów porównawczych GPU jest dostępnych na stronie tutaj.
| 3DMark 11 Performance | 35000 pkt. | |
| 3DMark Fire Strike Score | 25949 pkt. | |
| 3DMark Time Spy Score | 12384 pkt. | |
Pomoc | ||
| Blender / v3.3 Classroom OPTIX/RTX | |
| Średnia w klasie Multimedia (12 - 105, n=24, ostatnie 2 lata) | |
| Samsung Galaxy Book3 Ultra 16 | |
| Asus ProArt StudioBook 16 H7600ZW | |
| Schenker XMG Pro 15 (E23) | |
| Asus ProArt Studiobook 16 OLED H7604 | |
| Przeciętny NVIDIA GeForce RTX 4070 Laptop GPU (18 - 30, n=68) | |
| Gigabyte AERO 16 OLED BSF | |
| MSI Stealth 17 Studio A13VH-014 | |
| Asus Zephyrus Duo 16 GX650PY-NM006W | |
| Blender / v3.3 Classroom CUDA | |
| Samsung Galaxy Book3 Ultra 16 | |
| Średnia w klasie Multimedia (20 - 186, n=24, ostatnie 2 lata) | |
| Asus ProArt StudioBook 16 H7600ZW | |
| Schenker XMG Pro 15 (E23) | |
| Asus ProArt Studiobook 16 OLED H7604 | |
| Przeciętny NVIDIA GeForce RTX 4070 Laptop GPU (32 - 50, n=67) | |
| Gigabyte AERO 16 OLED BSF | |
| MSI Stealth 17 Studio A13VH-014 | |
| Asus Zephyrus Duo 16 GX650PY-NM006W | |
| Blender / v3.3 Classroom METAL | |
| Apple MacBook Pro 16 2023 M2 Max | |
| Średnia w klasie Multimedia (17.8 - 68, n=5, ostatnie 2 lata) | |
| Blender / v3.3 Classroom CPU | |
| Średnia w klasie Multimedia (134.5 - 1042, n=65, ostatnie 2 lata) | |
| Samsung Galaxy Book3 Ultra 16 | |
| Apple MacBook Pro 16 2023 M2 Max | |
| Gigabyte AERO 16 OLED BSF | |
| Przeciętny NVIDIA GeForce RTX 4070 Laptop GPU (158 - 440, n=67) | |
| Asus ProArt StudioBook 16 H7600ZW | |
| MSI Stealth 17 Studio A13VH-014 | |
| Schenker XMG Pro 15 (E23) | |
| Asus ProArt Studiobook 16 OLED H7604 | |
| Asus Zephyrus Duo 16 GX650PY-NM006W | |
* ... im mniej tym lepiej
Wydajność w grach
Wydajność Studiobooka 16 w grach jest bardzo dobra i nawet w nowoczesne tytuły można bez problemu grać w rozdzielczości QHD. Jedynie ray tracing zwykle wymaga skalowania w górę, aby grać płynnie. Dobrym przykładem jest tutaj Cyberpunk 2077, gdzie przy ustawieniu Ray Tracing Ultra możliwe jest tylko 26 FPS, ale z DLSS (w tym Frame Generation) jest to już 84 FPS. Oczywiście wzrost prędkości może się różnić w zależności od tytułu, a Cyberpunk jest flagowym tytułem dla DLSS. Wydajność w grach pozostaje stabilna podczas dłuższych sesji, ale ogólna przewaga nad starą kartą studyjną z jej RTX 3070 Ti jest minimalna.
| Performance rating - Percent | |
| Asus Zephyrus Duo 16 GX650PY-NM006W | |
| MSI Stealth 17 Studio A13VH-014 | |
| Schenker XMG Pro 15 (E23) -1! | |
| Asus ProArt Studiobook 16 OLED H7604 | |
| Gigabyte AERO 16 OLED BSF | |
| Asus ProArt StudioBook 16 H7600ZW | |
| Asus ProArt StudioBook 16 W7600H5A-2BL2 | |
| Samsung Galaxy Book3 Ultra 16 | |
| Średnia w klasie Multimedia | |
| The Witcher 3 - 1920x1080 Ultra Graphics & Postprocessing (HBAO+) | |
| Asus Zephyrus Duo 16 GX650PY-NM006W | |
| Schenker XMG Pro 15 (E23) | |
| MSI Stealth 17 Studio A13VH-014 | |
| Gigabyte AERO 16 OLED BSF | |
| Asus ProArt Studiobook 16 OLED H7604 | |
| Asus ProArt StudioBook 16 H7600ZW | |
| Asus ProArt StudioBook 16 W7600H5A-2BL2 | |
| Samsung Galaxy Book3 Ultra 16 | |
| Średnia w klasie Multimedia (11 - 121, n=11, ostatnie 2 lata) | |
| GTA V - 1920x1080 Highest AA:4xMSAA + FX AF:16x | |
| Asus Zephyrus Duo 16 GX650PY-NM006W | |
| Gigabyte AERO 16 OLED BSF | |
| Asus ProArt Studiobook 16 OLED H7604 | |
| MSI Stealth 17 Studio A13VH-014 | |
| Asus ProArt StudioBook 16 H7600ZW | |
| Schenker XMG Pro 15 (E23) | |
| Asus ProArt StudioBook 16 W7600H5A-2BL2 | |
| Samsung Galaxy Book3 Ultra 16 | |
| Średnia w klasie Multimedia (7.92 - 141.6, n=61, ostatnie 2 lata) | |
| Final Fantasy XV Benchmark - 1920x1080 High Quality | |
| Asus Zephyrus Duo 16 GX650PY-NM006W | |
| MSI Stealth 17 Studio A13VH-014 | |
| Gigabyte AERO 16 OLED BSF | |
| Asus ProArt Studiobook 16 OLED H7604 | |
| Asus ProArt StudioBook 16 H7600ZW | |
| Asus ProArt StudioBook 16 W7600H5A-2BL2 | |
| Samsung Galaxy Book3 Ultra 16 | |
| Średnia w klasie Multimedia (7.61 - 144.4, n=63, ostatnie 2 lata) | |
| Strange Brigade - 1920x1080 ultra AA:ultra AF:16 | |
| Asus Zephyrus Duo 16 GX650PY-NM006W | |
| MSI Stealth 17 Studio A13VH-014 | |
| Gigabyte AERO 16 OLED BSF | |
| Asus ProArt StudioBook 16 H7600ZW | |
| Schenker XMG Pro 15 (E23) | |
| Asus ProArt StudioBook 16 W7600H5A-2BL2 | |
| Asus ProArt Studiobook 16 OLED H7604 | |
| Samsung Galaxy Book3 Ultra 16 | |
| Średnia w klasie Multimedia (13.3 - 303, n=63, ostatnie 2 lata) | |
| Dota 2 Reborn - 1920x1080 ultra (3/3) best looking | |
| Asus Zephyrus Duo 16 GX650PY-NM006W | |
| Asus ProArt Studiobook 16 OLED H7604 | |
| Asus ProArt StudioBook 16 H7600ZW | |
| Schenker XMG Pro 15 (E23) | |
| Gigabyte AERO 16 OLED BSF | |
| MSI Stealth 17 Studio A13VH-014 | |
| Asus ProArt StudioBook 16 W7600H5A-2BL2 | |
| Średnia w klasie Multimedia (29 - 179.9, n=65, ostatnie 2 lata) | |
| Samsung Galaxy Book3 Ultra 16 | |
| X-Plane 11.11 - 1920x1080 high (fps_test=3) | |
| Asus ProArt Studiobook 16 OLED H7604 | |
| Asus Zephyrus Duo 16 GX650PY-NM006W | |
| Gigabyte AERO 16 OLED BSF | |
| Schenker XMG Pro 15 (E23) | |
| Asus ProArt StudioBook 16 H7600ZW | |
| MSI Stealth 17 Studio A13VH-014 | |
| Asus ProArt StudioBook 16 W7600H5A-2BL2 | |
| Samsung Galaxy Book3 Ultra 16 | |
| Średnia w klasie Multimedia (16.9 - 141.1, n=59, ostatnie 2 lata) | |
| The Witcher 3 - 1920x1080 Ultra Graphics & Postprocessing (HBAO+) | |
| Asus Zephyrus Duo 16 GX650PY-NM006W | |
| Schenker XMG Pro 15 (E23) | |
| MSI Stealth 17 Studio A13VH-014 | |
| Gigabyte AERO 16 OLED BSF | |
| Przeciętny NVIDIA GeForce RTX 4070 Laptop GPU (69.8 - 133.7, n=57) | |
| Asus ProArt Studiobook 16 OLED H7604 | |
| Asus ProArt StudioBook 16 H7600ZW | |
| Asus ProArt StudioBook 16 W7600H5A-2BL2 | |
| Apple MacBook Pro 16 2023 M2 Max | |
| Samsung Galaxy Book3 Ultra 16 | |
| Średnia w klasie Multimedia (11 - 121, n=11, ostatnie 2 lata) | |
| Far Cry 5 | |
| 1920x1080 Ultra Preset AA:T | |
| Gigabyte AERO 16 OLED BSF | |
| Asus ProArt Studiobook 16 OLED H7604 | |
| Asus ProArt StudioBook 16 H7600ZW | |
| MSI Stealth 17 Studio A13VH-014 | |
| Przeciętny NVIDIA GeForce RTX 4070 Laptop GPU (92 - 158, n=37) | |
| Samsung Galaxy Book3 Ultra 16 | |
| Średnia w klasie Multimedia (17 - 145, n=21, ostatnie 2 lata) | |
| Asus ProArt StudioBook 16 W7600H5A-2BL2 | |
| 2560x1440 Ultra Preset AA:T | |
| Asus ProArt Studiobook 16 OLED H7604 | |
| MSI Stealth 17 Studio A13VH-014 | |
| Gigabyte AERO 16 OLED BSF | |
| Przeciętny NVIDIA GeForce RTX 4070 Laptop GPU (79 - 128, n=33) | |
| Asus ProArt StudioBook 16 H7600ZW | |
| Średnia w klasie Multimedia (45 - 106, n=4, ostatnie 2 lata) | |
| Asus ProArt StudioBook 16 W7600H5A-2BL2 | |
| Samsung Galaxy Book3 Ultra 16 | |
Witcher 3 FPS Chart
| low | med. | high | ultra | QHD | |
|---|---|---|---|---|---|
| GTA V (2015) | 183.4 | 179 | 123 | 94.5 | |
| The Witcher 3 (2015) | 249 | 107.1 | |||
| Dota 2 Reborn (2015) | 215 | 192.8 | 184.4 | 171.6 | |
| Final Fantasy XV Benchmark (2018) | 162.4 | 114.7 | 85.2 | ||
| X-Plane 11.11 (2018) | 181.6 | 164.3 | 131.1 | ||
| Far Cry 5 (2018) | 187 | 162 | 154 | 145 | 117 |
| Strange Brigade (2018) | 315 | 162.1 | 150.6 | 142.7 | 95.3 |
| Shadow of the Tomb Raider (2018) | 153 | 103 | |||
| F1 2021 (2021) | 441 | 336 | 264 | 149.8 | 110.9 |
| Cyberpunk 2077 1.6 (2022) | 129 | 113 | 96 | 87 | 54 |
| F1 22 (2022) | 138.5 | 133.8 | 111.2 | 59.4 | 42.4 |
| Call of Duty Modern Warfare 2 2022 (2022) | 102 | 72 |
Emisje - głośniej, głośniej, Studiobook
Hałas
Oba wentylatory zwykle pozostają ciche podczas codziennych zadań, ale szybko stają się głośne, gdy tylko procesor lub karta graficzna znajdą się pod obciążeniem. Podaliśmy wartości w poniższej tabeli, ale generalnie zalecamy słuchawki lub zestawy słuchawkowe podczas grania. Można pominąć tryb Full Speed , ponieważ staje się on tylko głośniejszy i nie ma żadnej przewagi w zakresie wydajności. Nie wykryto żadnych innych odgłosów elektronicznych, takich jak wycie cewki
| Profil energetyczny | 3DMark 06 | Witcher 3 | Cyberpoint 2077 | Test obciążeniowy |
|---|---|---|---|---|
| Domyślny | 43.6dB(A) | 43.6dB(A) | 47.6dB(A) | 47.6dB(A) |
| Wydajność | 43.6dB(A) | 43.6dB(A) | 47.6dB(A) | 47.6dB(A) |
| Pełna prędkość | 58.9dB(A) | 58.9dB(A) | 58.9dB(A) | 58.9dB(A) |
Hałas
| luz |
| 24.5 / 24.5 / 24.5 dB |
| obciążenie |
| 47.6 / 56.7 dB |
 | ||
30 dB cichy 40 dB(A) słyszalny 50 dB(A) irytujący |
||
min: | ||
| Asus ProArt Studiobook 16 OLED H7604 GeForce RTX 4070 Laptop GPU, i9-13980HX, Phison EM2804TBMTCB47 | Gigabyte AERO 16 OLED BSF GeForce RTX 4070 Laptop GPU, i9-13900H, Gigabyte AG470S1TB-SI B10 | Samsung Galaxy Book3 Ultra 16 GeForce RTX 4050 Laptop GPU, i7-13700H, Samsung PM9A1 MZVL2512HCJQ | MSI Stealth 17 Studio A13VH-014 GeForce RTX 4080 Laptop GPU, i9-13900H, Samsung PM9A1 MZVL22T0HBLB | Apple MacBook Pro 16 2023 M2 Max M2 Max 38-Core GPU, M2 Max, Apple SSD AP2048Z | Asus Zephyrus Duo 16 GX650PY-NM006W GeForce RTX 4090 Laptop GPU, R9 7945HX, SK hynix PC801 HFS002TEJ9X101N | |
|---|---|---|---|---|---|---|
| Noise | -3% | 6% | 9% | 13% | -9% | |
| wyłączone / środowisko * (dB) | 24.5 | 23 6% | 25 -2% | 24 2% | 23.9 2% | 23.9 2% |
| Idle Minimum * (dB) | 24.5 | 23 6% | 26 -6% | 24 2% | 23.9 2% | 23.9 2% |
| Idle Average * (dB) | 24.5 | 23 6% | 27 -10% | 24 2% | 23.9 2% | 32.9 -34% |
| Idle Maximum * (dB) | 24.5 | 33.64 -37% | 28 -14% | 24 2% | 23.9 2% | 36.5 -49% |
| Load Average * (dB) | 47.6 | 51.49 -8% | 40 16% | 34.49 28% | 36.6 23% | 42.9 10% |
| Witcher 3 ultra * (dB) | 55.9 | 55.27 1% | 39 30% | 48.29 14% | 35.1 37% | 51.2 8% |
| Load Maximum * (dB) | 56.7 | 55.24 3% | 41 28% | 49.66 12% | 43.2 24% | 56 1% |
* ... im mniej tym lepiej
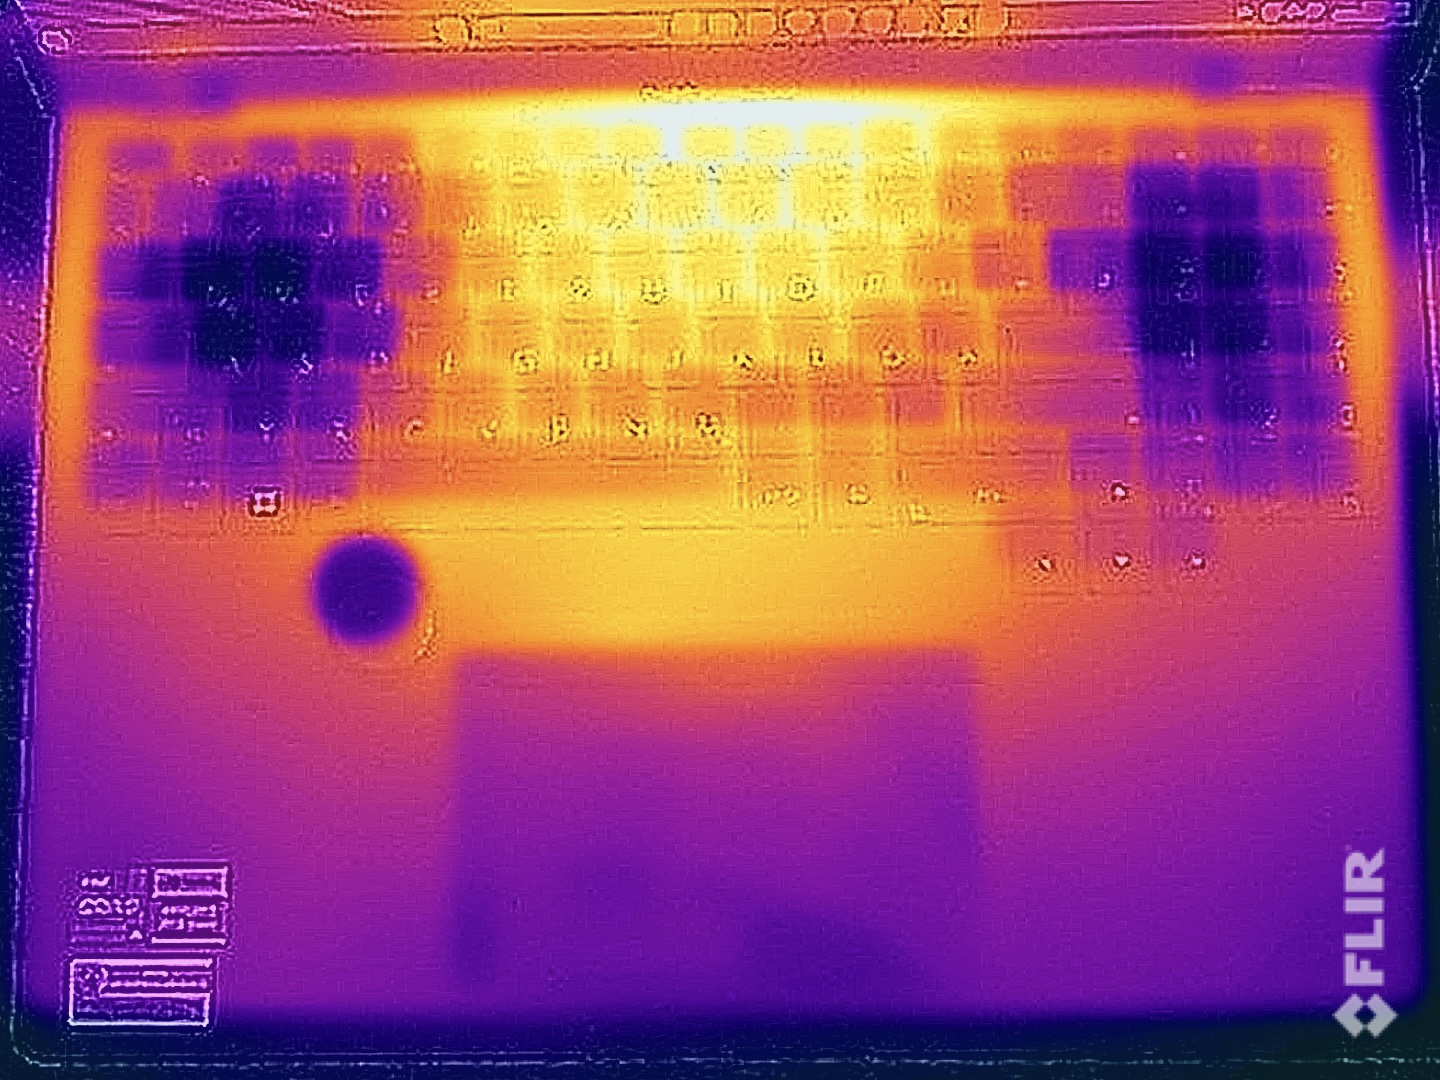
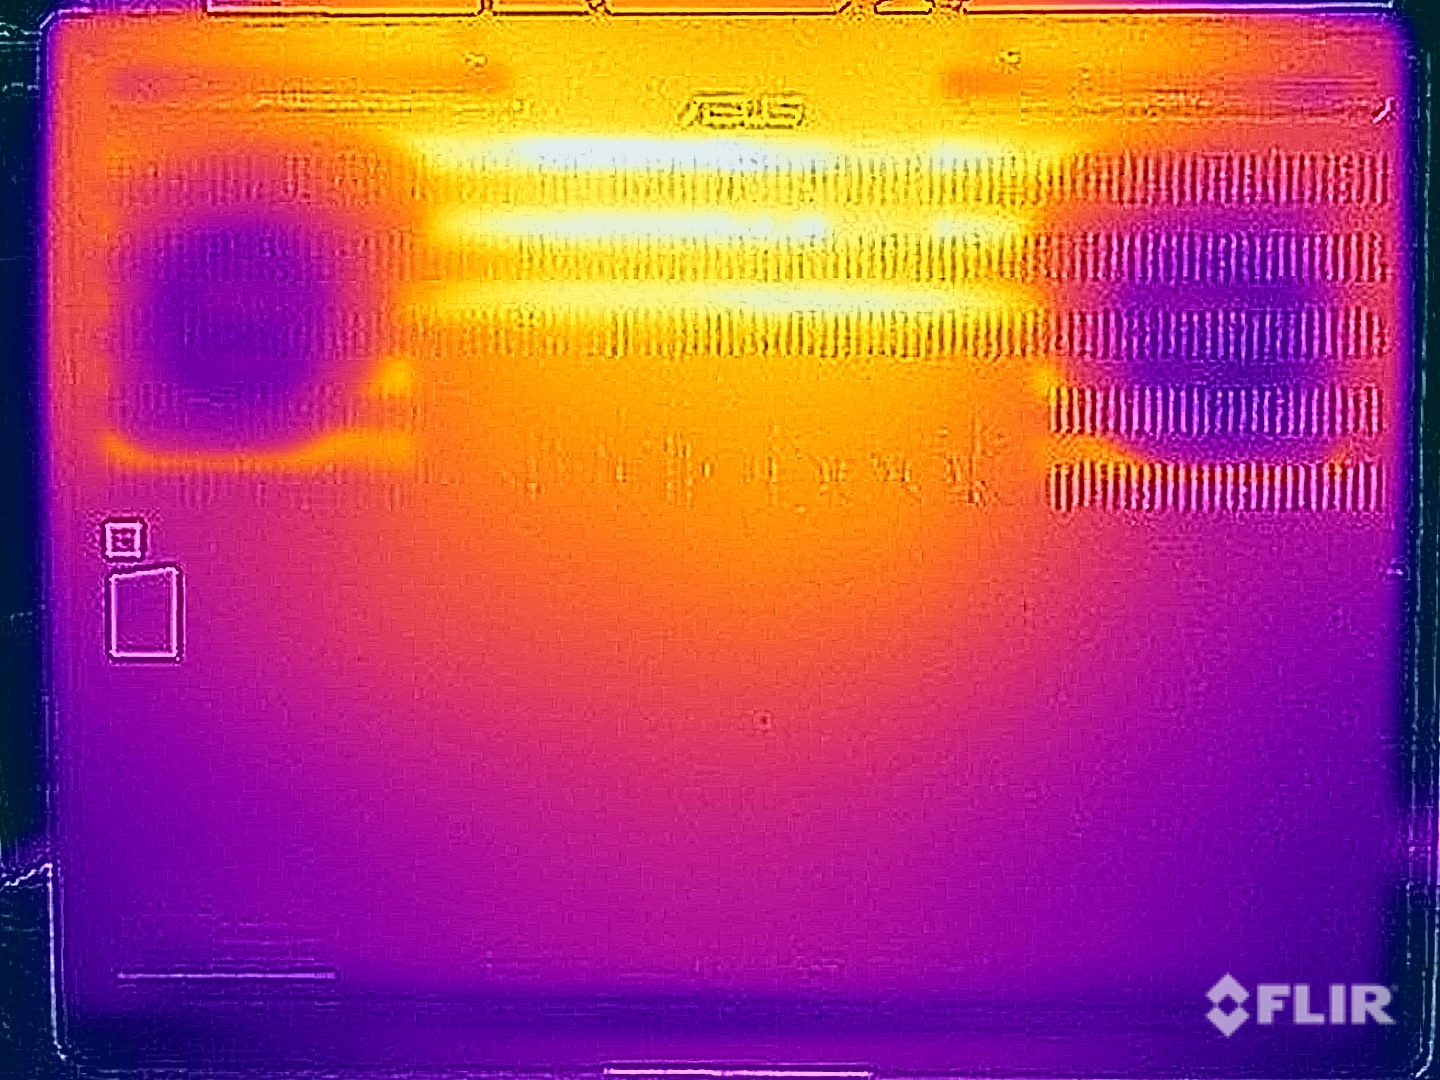
Temperatura
Temperatury powierzchniowe są ogólnie bezproblemowe, ale mocne komponenty laptopa szybko dają o sobie znać, nawet w stanie bezczynności. Ponieważ wentylatory tutaj nie pracują, zmierzyliśmy ponad 30 °C. Pod obciążeniem górna strona jednostki bazowej pozostaje całkiem komfortowa przy maksymalnie 45 °C i nie ma żadnych ograniczeń podczas pisania. Dolna strona osiąga maksymalnie nieco poniżej 48 °C na środku, dlatego teoretycznie można umieścić urządzenie na kolanach (ale jest to mało prawdopodobne, biorąc pod uwagę rozmiar).
Oba komponenty bardzo szybko wyrównują się w teście warunków skrajnych, w którym karta graficzna jest preferowana przez system i działa z około 105 watów, podczas gdy procesor nadal ma ~ 55 watów. Bezpośrednio po teście obciążeniowym nie odnotowano spadku wydajności.
(±) Maksymalna temperatura w górnej części wynosi 44.1 °C / 111 F, w porównaniu do średniej 36.8 °C / 98 F , począwszy od 21 do 71 °C dla klasy Multimedia.
(-) Dno nagrzewa się maksymalnie do 48 °C / 118 F, w porównaniu do średniej 39.1 °C / 102 F
(+) W stanie bezczynności średnia temperatura górnej części wynosi 31 °C / 88 F, w porównaniu ze średnią temperaturą urządzenia wynoszącą 31.3 °C / ### class_avg_f### F.
(±) Podczas gry w Wiedźmina 3 średnia temperatura górnej części wynosi 34.9 °C / 95 F, w porównaniu do średniej temperatury urządzenia wynoszącej 31.3 °C / ## #class_avg_f### F.
(+) Podparcia dłoni i touchpad osiągają maksymalną temperaturę skóry (32.3 °C / 90.1 F) i dlatego nie są gorące.
(-) Średnia temperatura obszaru podparcia dłoni w podobnych urządzeniach wynosiła 28.7 °C / 83.7 F (-3.6 °C / -6.4 F).
| Asus ProArt Studiobook 16 OLED H7604 Intel Core i9-13980HX, NVIDIA GeForce RTX 4070 Laptop GPU | Gigabyte AERO 16 OLED BSF Intel Core i9-13900H, NVIDIA GeForce RTX 4070 Laptop GPU | Samsung Galaxy Book3 Ultra 16 Intel Core i7-13700H, NVIDIA GeForce RTX 4050 Laptop GPU | MSI Stealth 17 Studio A13VH-014 Intel Core i9-13900H, NVIDIA GeForce RTX 4080 Laptop GPU | Apple MacBook Pro 16 2023 M2 Max Apple M2 Max, Apple M2 Max 38-Core GPU | Asus Zephyrus Duo 16 GX650PY-NM006W AMD Ryzen 9 7945HX, NVIDIA GeForce RTX 4090 Laptop GPU | |
|---|---|---|---|---|---|---|
| Heat | 18% | 18% | -1% | 20% | 7% | |
| Maximum Upper Side * (°C) | 44.1 | 41 7% | 41 7% | 47 -7% | 44.2 -0% | 44.2 -0% |
| Maximum Bottom * (°C) | 48 | 47 2% | 44 8% | 54 -13% | 42.9 11% | 46.8 2% |
| Idle Upper Side * (°C) | 32.7 | 23 30% | 23 30% | 30 8% | 22.4 31% | 29.2 11% |
| Idle Bottom * (°C) | 34.9 | 23 34% | 26 26% | 32 8% | 22.3 36% | 30.2 13% |
* ... im mniej tym lepiej
Głośniki
System dźwiękowy składa się z czterech głośników, które oferują dobrą jakość dźwięku. Chociaż nie na tyle, aby konkurować z MacBookiem Pro 16ponieważ wciąż brakuje mu trochę ciśnienia, to jednak ogólnie jest zadowalający. Wydajność jest wystarczająca do filmów i muzyki w tle, a podczas grania i tak nie słychać zbyt wiele z głośników ze względu na głośne wentylatory.
Asus ProArt Studiobook 16 OLED H7604 analiza dźwięku
(+) | głośniki mogą odtwarzać stosunkowo głośno (84 dB)
Bas 100 - 315 Hz
(±) | zredukowany bas - średnio 14.1% niższy od mediany
(±) | liniowość basu jest średnia (9.5% delta do poprzedniej częstotliwości)
Średnie 400 - 2000 Hz
(+) | zbalansowane środki średnie - tylko 1.9% od mediany
(+) | średnie są liniowe (3.8% delta do poprzedniej częstotliwości)
Wysokie 2–16 kHz
(+) | zrównoważone maksima - tylko 4.2% od mediany
(+) | wzloty są liniowe (3.9% delta do poprzedniej częstotliwości)
Ogólnie 100 - 16.000 Hz
(+) | ogólny dźwięk jest liniowy (11.2% różnicy w stosunku do mediany)
W porównaniu do tej samej klasy
» 17% wszystkich testowanych urządzeń w tej klasie było lepszych, 4% podobnych, 80% gorszych
» Najlepszy miał deltę 5%, średnia wynosiła ###średnia###%, najgorsza wynosiła 45%
W porównaniu do wszystkich testowanych urządzeń
» 7% wszystkich testowanych urządzeń było lepszych, 2% podobnych, 91% gorszych
» Najlepszy miał deltę 4%, średnia wynosiła ###średnia###%, najgorsza wynosiła 134%
Apple MacBook Pro 16 2023 M2 Max analiza dźwięku
(+) | głośniki mogą odtwarzać stosunkowo głośno (86.1 dB)
Bas 100 - 315 Hz
(+) | dobry bas - tylko 3.9% od mediany
(+) | bas jest liniowy (5.7% delta do poprzedniej częstotliwości)
Średnie 400 - 2000 Hz
(+) | zbalansowane środki średnie - tylko 1.2% od mediany
(+) | średnie są liniowe (1.5% delta do poprzedniej częstotliwości)
Wysokie 2–16 kHz
(+) | zrównoważone maksima - tylko 2.5% od mediany
(+) | wzloty są liniowe (1.7% delta do poprzedniej częstotliwości)
Ogólnie 100 - 16.000 Hz
(+) | ogólny dźwięk jest liniowy (4.9% różnicy w stosunku do mediany)
W porównaniu do tej samej klasy
» 0% wszystkich testowanych urządzeń w tej klasie było lepszych, 0% podobnych, 99% gorszych
» Najlepszy miał deltę 5%, średnia wynosiła ###średnia###%, najgorsza wynosiła 45%
W porównaniu do wszystkich testowanych urządzeń
» 0% wszystkich testowanych urządzeń było lepszych, 0% podobnych, 100% gorszych
» Najlepszy miał deltę 4%, średnia wynosiła ###średnia###%, najgorsza wynosiła 134%
Zarządzanie energią - StudioBook z krótką żywotnością baterii
Zużycie energii
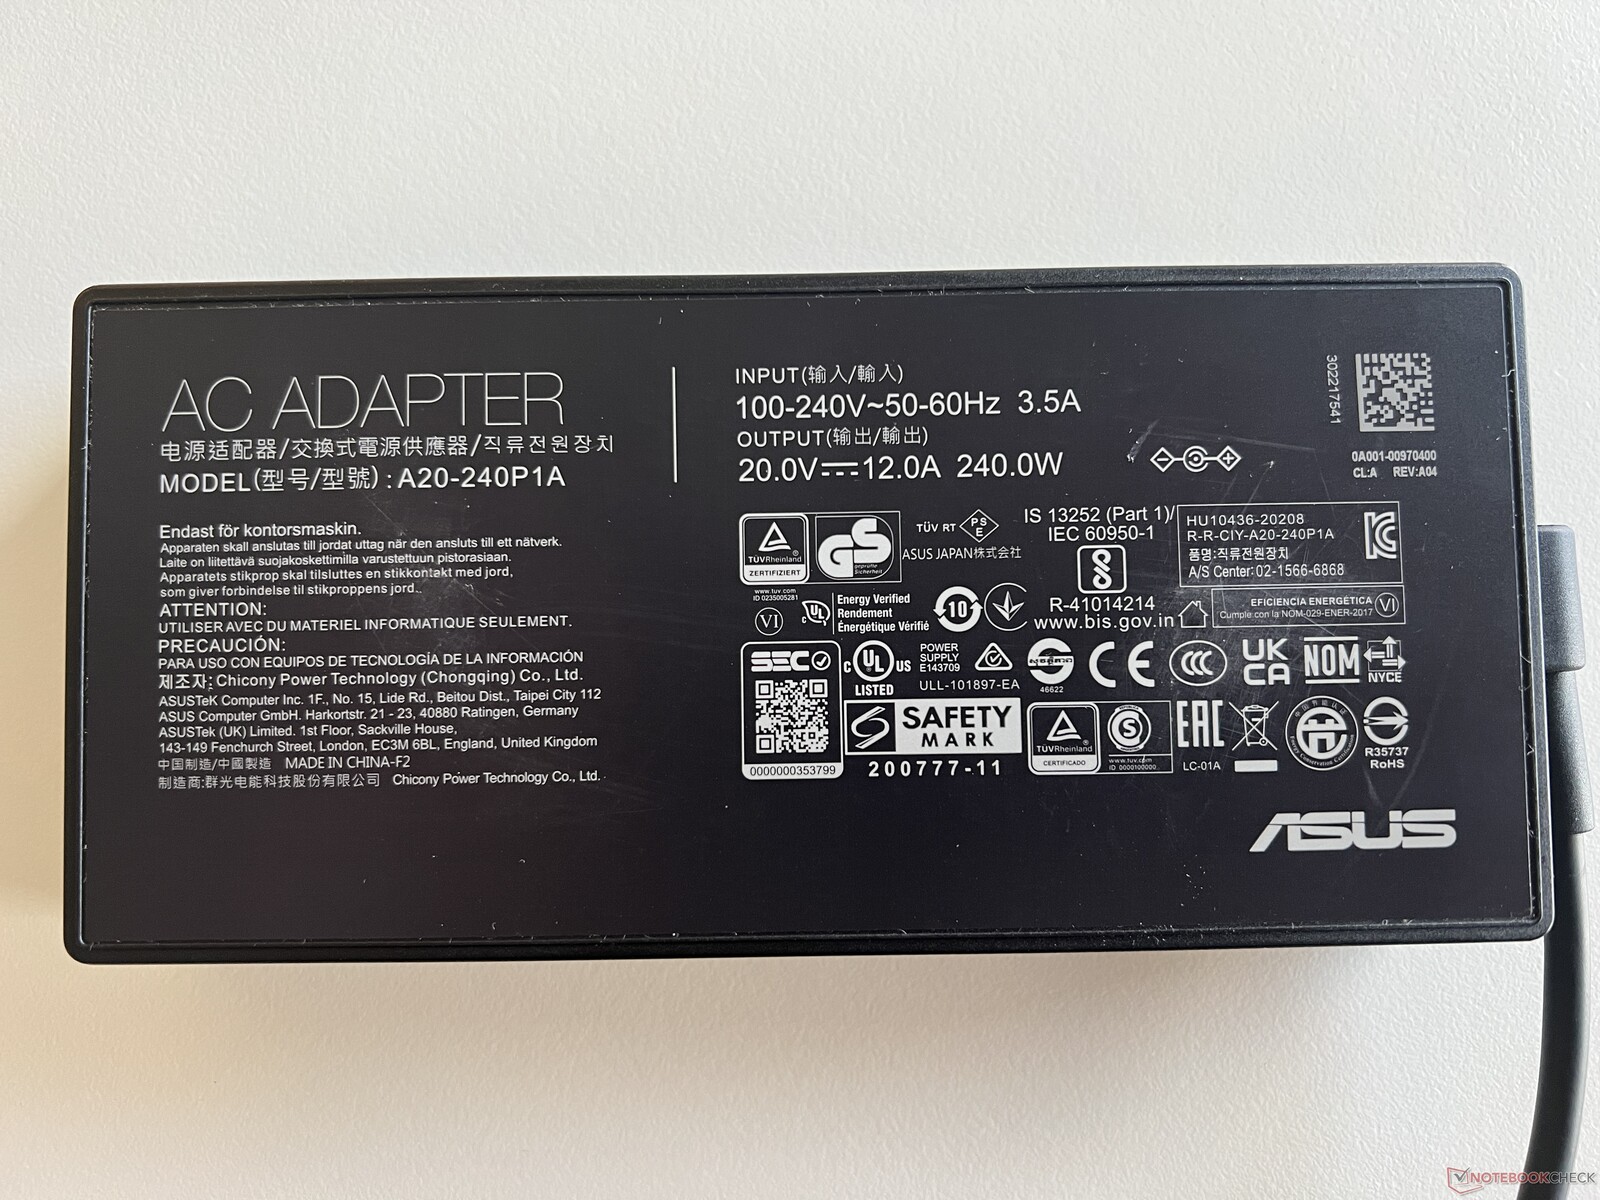
Ze względu na duży panel OLED i sam procesor HX, wydajność Studiobook 16 nie jest szczególnie dobra. Zmierzyliśmy między 12-21 watów w stanie bezczynności, w zależności od jasności, chociaż czasami osiąga nawet 36 watów w trybie HDR. Pod obciążeniem nie ma niespodzianek: wzrasta do około 200 watów podczas grania i osiąga poziom około 210 watów po początkowych ~ 247 watów w teście warunków skrajnych. Dołączony 240-watowy zasilacz jest więc wystarczająco duży.
| wyłączony / stan wstrzymania | |
| luz | |
| obciążenie |
|
Legenda:
min: | |
| Asus ProArt Studiobook 16 OLED H7604 i9-13980HX, GeForce RTX 4070 Laptop GPU, Phison EM2804TBMTCB47, OLED, 3200x2000, 16" | Gigabyte AERO 16 OLED BSF i9-13900H, GeForce RTX 4070 Laptop GPU, Gigabyte AG470S1TB-SI B10, OLED, 3840x2400, 16" | Samsung Galaxy Book3 Ultra 16 i7-13700H, GeForce RTX 4050 Laptop GPU, Samsung PM9A1 MZVL2512HCJQ, AMOLED, 2880x1800, 16" | MSI Stealth 17 Studio A13VH-014 i9-13900H, GeForce RTX 4080 Laptop GPU, Samsung PM9A1 MZVL22T0HBLB, Mini LED, 3840x2160, 17.3" | Apple MacBook Pro 16 2023 M2 Max M2 Max, M2 Max 38-Core GPU, Apple SSD AP2048Z, Mini-LED, 3456x2234, 16.2" | Asus Zephyrus Duo 16 GX650PY-NM006W R9 7945HX, GeForce RTX 4090 Laptop GPU, SK hynix PC801 HFS002TEJ9X101N, MiniLED, 2560x1600, 16" | Przeciętny NVIDIA GeForce RTX 4070 Laptop GPU | Średnia w klasie Multimedia | |
|---|---|---|---|---|---|---|---|---|
| Power Consumption | 18% | 61% | 10% | 34% | -35% | 4% | 50% | |
| Idle Minimum * (Watt) | 12.8 | 11.8 8% | 3 77% | 13.9 -9% | 5.2 59% | 19.2 -50% | 13.2 ? -3% | 5.65 ? 56% |
| Idle Average * (Watt) | 19.9 | 16.1 19% | 5 75% | 20 -1% | 16.5 17% | 29.7 -49% | 18.2 ? 9% | 10 ? 50% |
| Idle Maximum * (Watt) | 20.3 | 17 16% | 11 46% | 20.6 -1% | 16.8 17% | 30.8 -52% | 24.6 ? -21% | 12.3 ? 39% |
| Load Average * (Watt) | 131.4 | 100.6 23% | 72 45% | 77 41% | 113 14% | 126 4% | 97 ? 26% | 65.1 ? 50% |
| Witcher 3 ultra * (Watt) | 196.5 | 158 20% | 69.7 65% | 162 18% | 92 53% | 258 -31% | ||
| Load Maximum * (Watt) | 246.8 | 192 22% | 108 56% | 216 12% | 145 41% | 330 -34% | 221 ? 10% | 112.5 ? 54% |
* ... im mniej tym lepiej
Power consumption Witcher 3 / Stress test
Power consumption with an external monitor
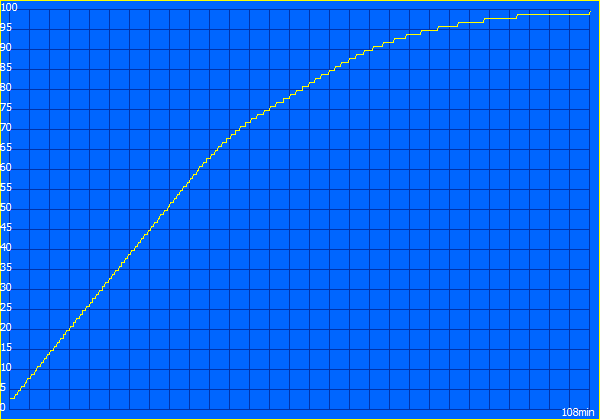
Żywotność baterii
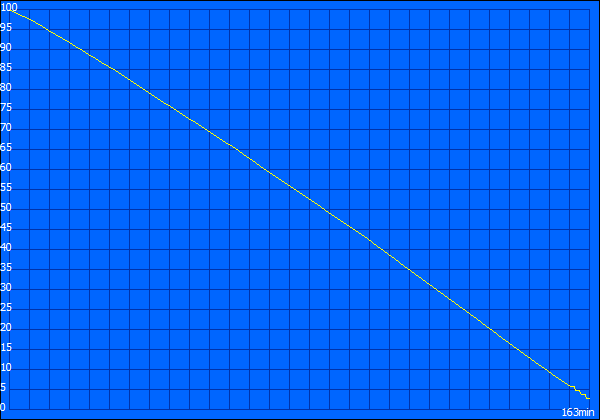
Biorąc pod uwagę wskaźniki zużycia, trudno się dziwić, że żywotność baterii nie jest szczególnie dobra pomimo baterii 90 Wh. Domyślnie laptop przełącza się w tryb 60 Hz zaraz po odłączeniu go od zasilania. Niezależnie od tego, w teście WLAN odnotowaliśmy zaledwie 5,5 godziny przy 150 cd/m² (120 Hz: 5 godzin) i około 4,5 godziny przy pełnej jasności (120 Hz: ~3,5 godziny). Test wideo trwa nieco poniżej 6 godzin. Wideo HDR przy pełnej jasności rozładowuje baterię po ~2:40 godzinach i około godzinie pod obciążeniem, pomimo zmniejszonej wydajności.
| Asus ProArt Studiobook 16 OLED H7604 i9-13980HX, GeForce RTX 4070 Laptop GPU, 90 Wh | Gigabyte AERO 16 OLED BSF i9-13900H, GeForce RTX 4070 Laptop GPU, 88 Wh | Samsung Galaxy Book3 Ultra 16 i7-13700H, GeForce RTX 4050 Laptop GPU, 76 Wh | MSI Stealth 17 Studio A13VH-014 i9-13900H, GeForce RTX 4080 Laptop GPU, 99 Wh | Apple MacBook Pro 16 2023 M2 Max M2 Max, M2 Max 38-Core GPU, 99.6 Wh | Asus Zephyrus Duo 16 GX650PY-NM006W R9 7945HX, GeForce RTX 4090 Laptop GPU, 90 Wh | Średnia w klasie Multimedia | |
|---|---|---|---|---|---|---|---|
| Czasy pracy | 49% | 86% | 13% | 125% | -25% | 112% | |
| H.264 (h) | 6 | 7.4 23% | 13.4 123% | 5.6 -7% | 18.7 212% | 3.8 -37% | 16.2 ? 170% |
| WiFi v1.3 (h) | 5.6 | 7.5 34% | 9.6 71% | 5.6 0% | 14.8 164% | 4 -29% | 12 ? 114% |
| Load (h) | 1.1 | 2.1 91% | 1.8 64% | 1.6 45% | 1.1 0% | 1 -9% | 1.669 ? 52% |
| Witcher 3 ultra (h) | 2.6 |
Za
Przeciw
Werdykt - Studiobook 16 z niedociągnięciami w szczegółach
Nowy 2023 ProArt Studiobook 16 OLED oferuje dużą wydajność i ogólnie jest dobrym laptopem dla kreatywnych użytkowników, choć w szczegółach ma kilka słabych punktów. Po pierwsze, procesor Core i9-13980HXjako najszybszy mobilny procesor Intela, oferuje dużą moc obliczeniową, ale nadal pozostaje w tyle za AMD Ryzen 9 7945HX pod względem wydajności wielordzeniowej i efektywności. W porównaniu do Core i9-12900H ze starego modelu, z drugiej strony oferuje znacznie wyższą wydajność. Nie dotyczy to jednak karty graficznej, ponieważ RTX 4070 Laptop jest tylko nieznacznie szybszy niż RTX 3070 Tiwięc aktualizacja nie jest tutaj naprawdę tego warta. Inne punkty krytyki obejmują konwencjonalne chłodzenie, a w szczególności hałas wentylatora, ponieważ urządzenie szybko staje się bardzo głośne. Przynajmniej temperatury pozostają w granicach.
Wyświetlacz OLED zmienił się z panelu 4K z 60 Hz na ekran dotykowy 120 Hz o nieco niższej rozdzielczości. Jakość obrazu jest zasadniczo bardzo dobra, ale podobnie jak w przypadku innych ekranów dotykowych OLED firmy Asus, jasne obszary wydają się nieco ziarniste. Istnieją również niewielkie odchylenia kolorów, których nie byliśmy w stanie skorygować za pomocą własnej kalibracji. Ekran OLED ma również negatywny wpływ na żywotność baterii. Funkcja oprogramowania zapobiegająca migotaniu PWM jest dobra, ale korekty muszą być dokonywane za każdym razem za pośrednictwem oprogramowania, co jest uciążliwe.
Dużo mocy, ale też głośne wentylatory: ProArt Studiobook 16 jest niewątpliwie szybkim urządzeniem, a DialPad może stanowić wartość dodaną dla kreatywnych użytkowników. Jednak 120 Hz OLED nie jest całkowicie przekonujący.
Oprócz ekranu dotykowego, Studiobook 16 ponownie oferuje dodatkowy DialPad, który działa szczególnie dobrze z aplikacjami Adobe i może również stanowić wartość dodaną. Możliwości HDR są nadal ograniczone, ale wynika to z systemu Windows. HDR musi być aktywowany ręcznie, a profile kolorów nie są już wtedy dostępne. Ponadto panele mini LED mają przewagę, jeśli chodzi o maksymalną jasność. Chociaż MacBook Pro 16 oferuje znacznie mniejszą wydajność procesora (przynajmniej w trybie zasilania sieciowego), nadal jest bardzo dobrym wyborem dla kreatywnych użytkowników i oferuje znacznie dłuższy czas pracy na baterii w codziennym użytkowaniu. Jeszcze większą wydajność oferuje ROG Zephyrus Duo 16który jest wymieniony jako gracz, ale jest również interesujący dla twórców treści dzięki drugiemu wyświetlaczowi.
Cena i dostępność
Wariant Asus ProArt Studiobook 16 OLED (procesor Intel Core i9-13980HX, karta graficzna Nvidia Geforce RTX 4070, 32 GB pamięci RAM DDR5 SO-DIMM, 1 TB SSD) jest dostępny za pośrednictwem Amazon USA za 2499,99 USD.
Ceny są aktualne na dzień 29.06.23 i mogą ulec zmianie.
Asus ProArt Studiobook 16 OLED H7604
- 27/06/2023 v7 (old)
Andreas Osthoff
Przezroczystość
Wyboru urządzeń do recenzji dokonuje nasza redakcja. Próbka testowa została udostępniona autorowi jako pożyczka od producenta lub sprzedawcy detalicznego na potrzeby tej recenzji. Pożyczkodawca nie miał wpływu na tę recenzję, producent nie otrzymał też kopii tej recenzji przed publikacją. Nie było obowiązku publikowania tej recenzji. Jako niezależna firma medialna, Notebookcheck nie podlega władzy producentów, sprzedawców detalicznych ani wydawców.
Tak testuje Notebookcheck
Każdego roku Notebookcheck niezależnie sprawdza setki laptopów i smartfonów, stosując standardowe procedury, aby zapewnić porównywalność wszystkich wyników. Od około 20 lat stale rozwijamy nasze metody badawcze, ustanawiając przy tym standardy branżowe. W naszych laboratoriach testowych doświadczeni technicy i redaktorzy korzystają z wysokiej jakości sprzętu pomiarowego. Testy te obejmują wieloetapowy proces walidacji. Nasz kompleksowy system ocen opiera się na setkach uzasadnionych pomiarów i benchmarków, co pozwala zachować obiektywizm.Price comparison

