Recenzja Aorus 15 BSF: Laptop do gier QHD z RTX 4070 i świetnymi czasami pracy
Gigabyte Aorus 15 BSF to średniej klasy 15,6-calowy laptop do gier, który opiera się na nowoczesnym sprzęcie: Raptor Lake, Ada Lovelace, DDR5, PCIe 4. Cały pakiet jest dostępny za około 1700 USD. Konkurenci to między innymiHP Omen Transcend 16, MSI Pulse 17 B13VGK, Lenovo Legion Slim 7i 16 Gen 8, Acer Nitro 16 AN16-41orazAsus TUF Gaming A16 FA617XS.
Potencjalni konkurenci w porównaniu
Ocena | Data | Model | Waga | Wysokość | Rozmiar | Rezolucja | Cena |
|---|---|---|---|---|---|---|---|
| 85.7 % v7 (old) | 08/2023 | Aorus 15 BSF i7-13700H, GeForce RTX 4070 Laptop GPU | 2.4 kg | 20.9 mm | 15.60" | 2560x1440 | |
| 87.9 % v7 (old) | 08/2023 | HP Omen Transcend 16 i9-13900HX, GeForce RTX 4070 Laptop GPU | 2.3 kg | 19.8 mm | 16.00" | 2560x1600 | |
| 86.3 % v7 (old) | 07/2023 | MSI Pulse 17 B13VGK i7-13700H, GeForce RTX 4070 Laptop GPU | 2.7 kg | 27.2 mm | 17.30" | 1920x1080 | |
| 90 % v7 (old) | 07/2023 | Lenovo Legion Slim 7i 16 Gen 8 i9-13900H, GeForce RTX 4070 Laptop GPU | 2.1 kg | 19.9 mm | 16.00" | 2560x1600 | |
| 88.1 % v7 (old) | 06/2023 | Acer Nitro 16 AN16-41 R7 7735HS, GeForce RTX 4070 Laptop GPU | 2.7 kg | 27.9 mm | 16.00" | 2560x1600 | |
| 86.9 % v7 (old) | 06/2023 | Asus TUF Gaming A16 FA617XS R9 7940HS, Radeon RX 7600S | 2.2 kg | 22.1 mm | 16.00" | 1920x1200 |
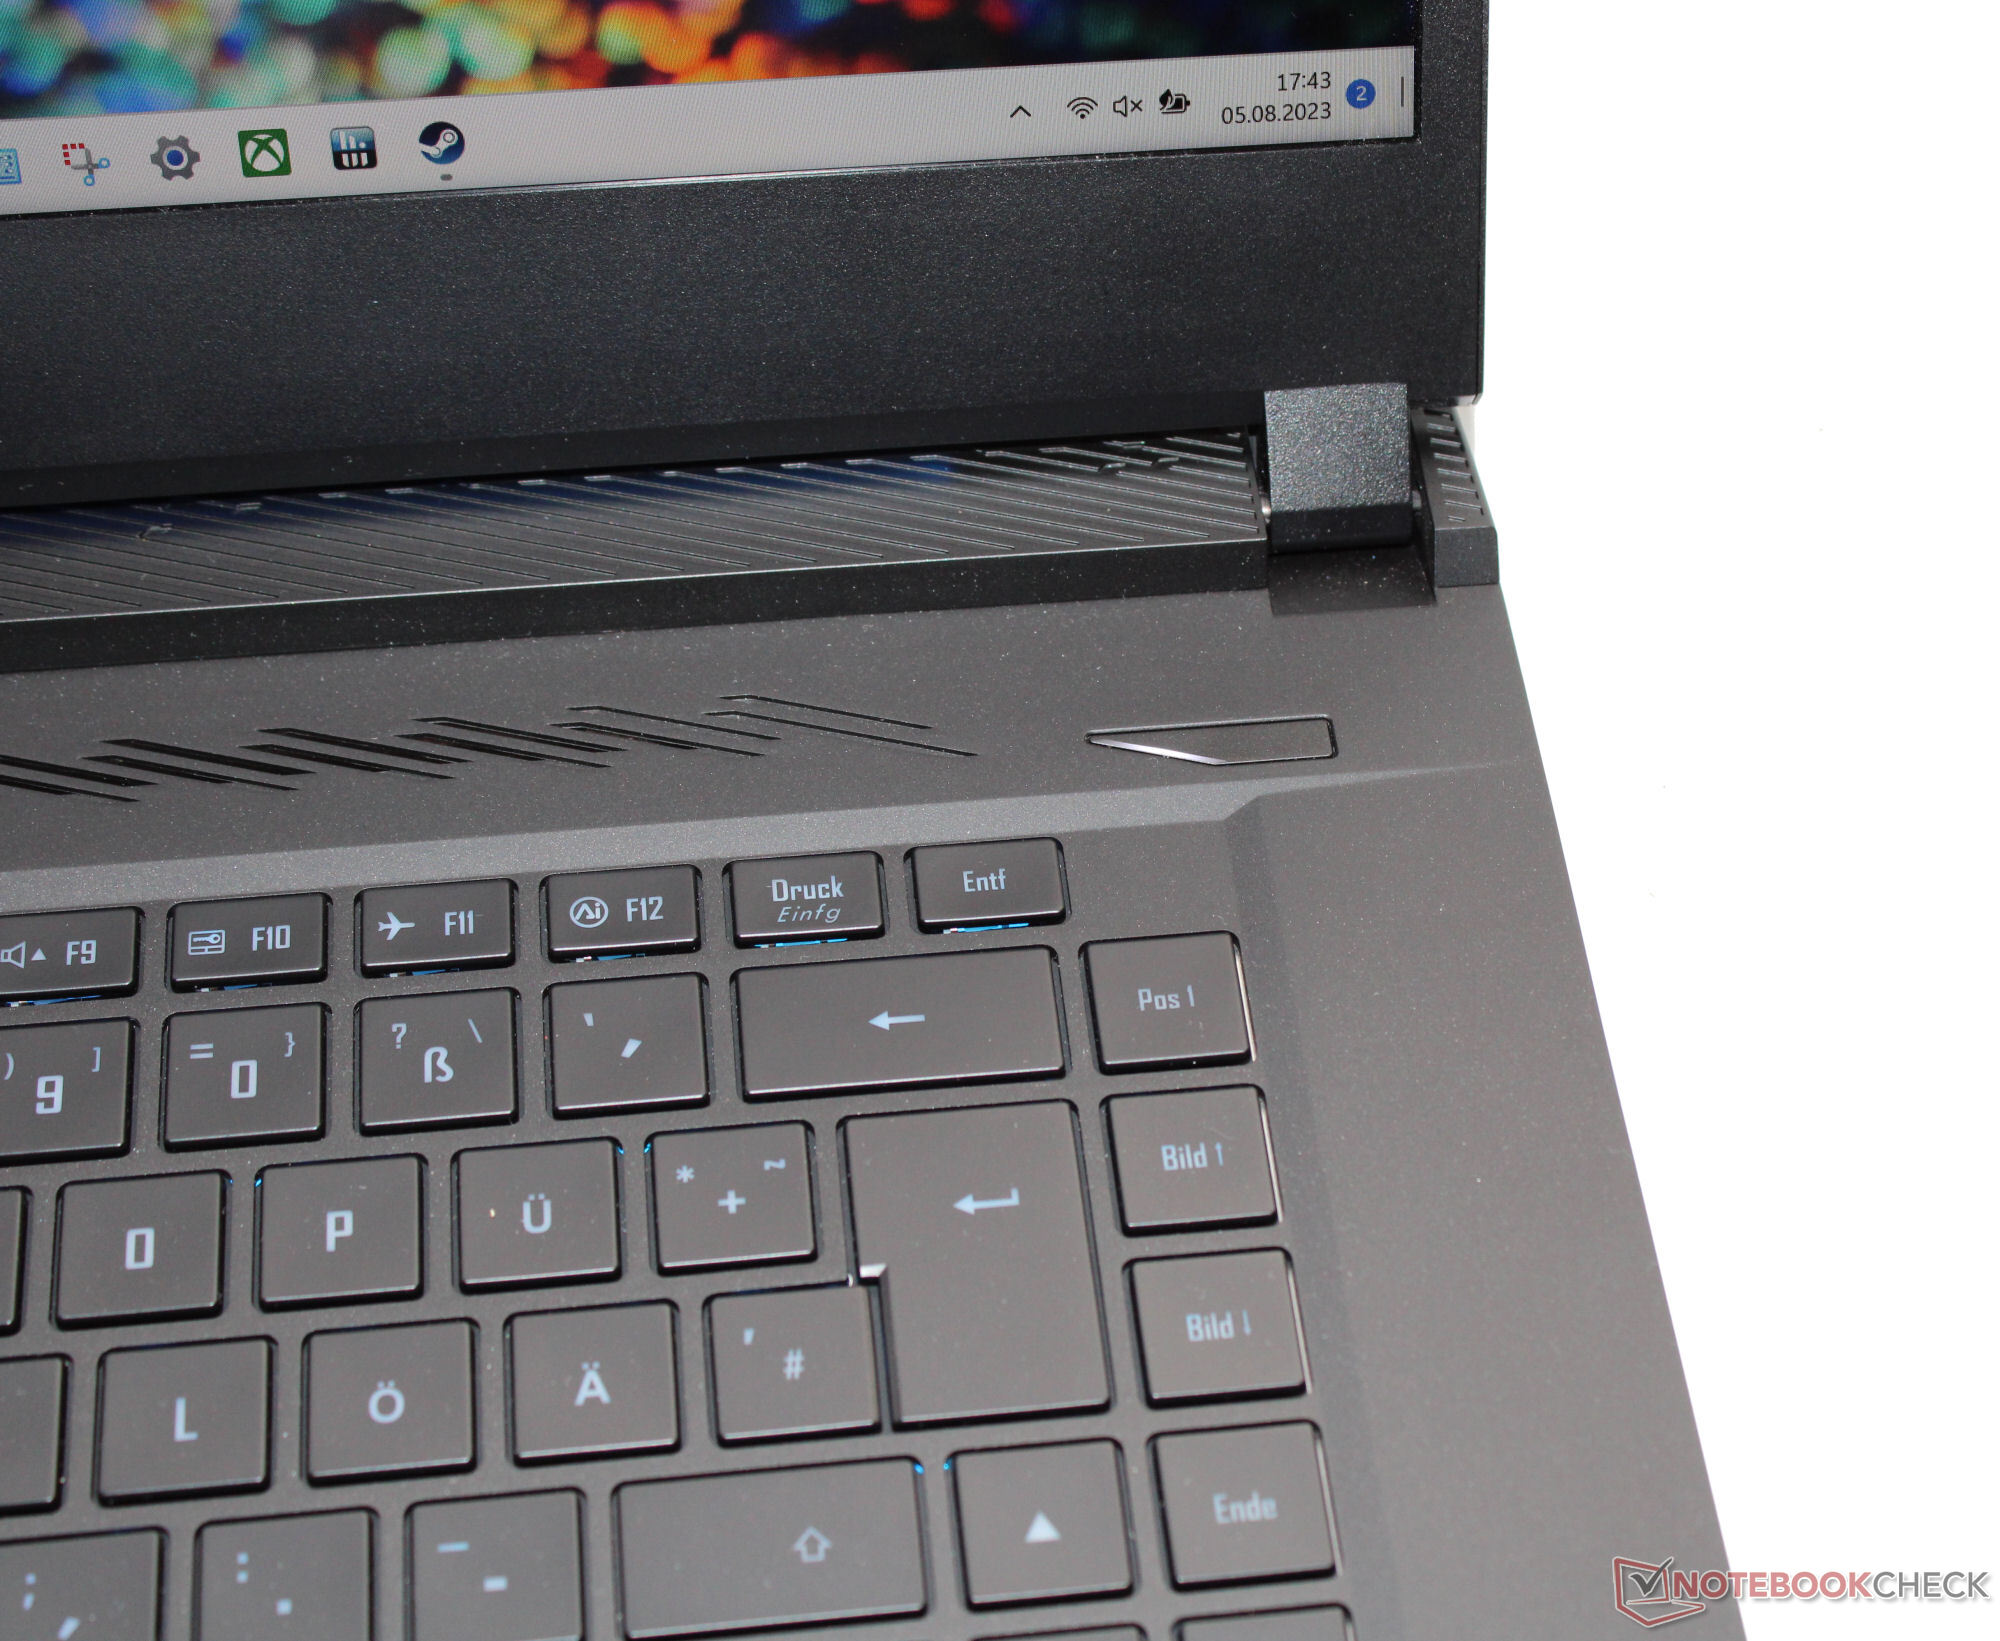
Obudowa - Gigabyte umieścił technologię w metalowej obudowie
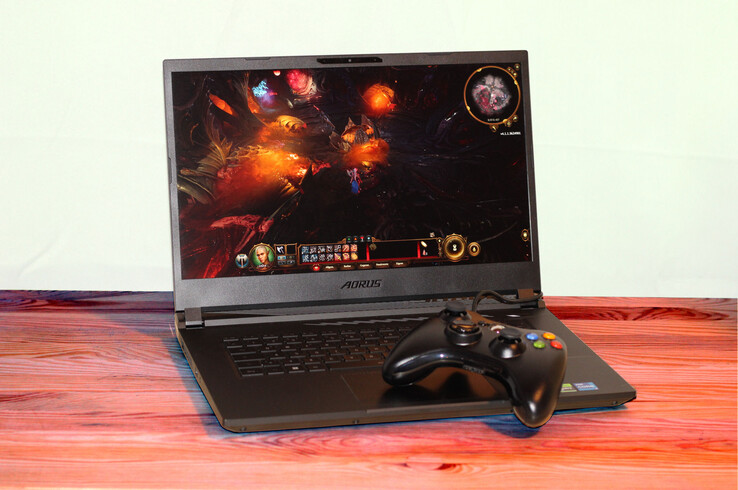
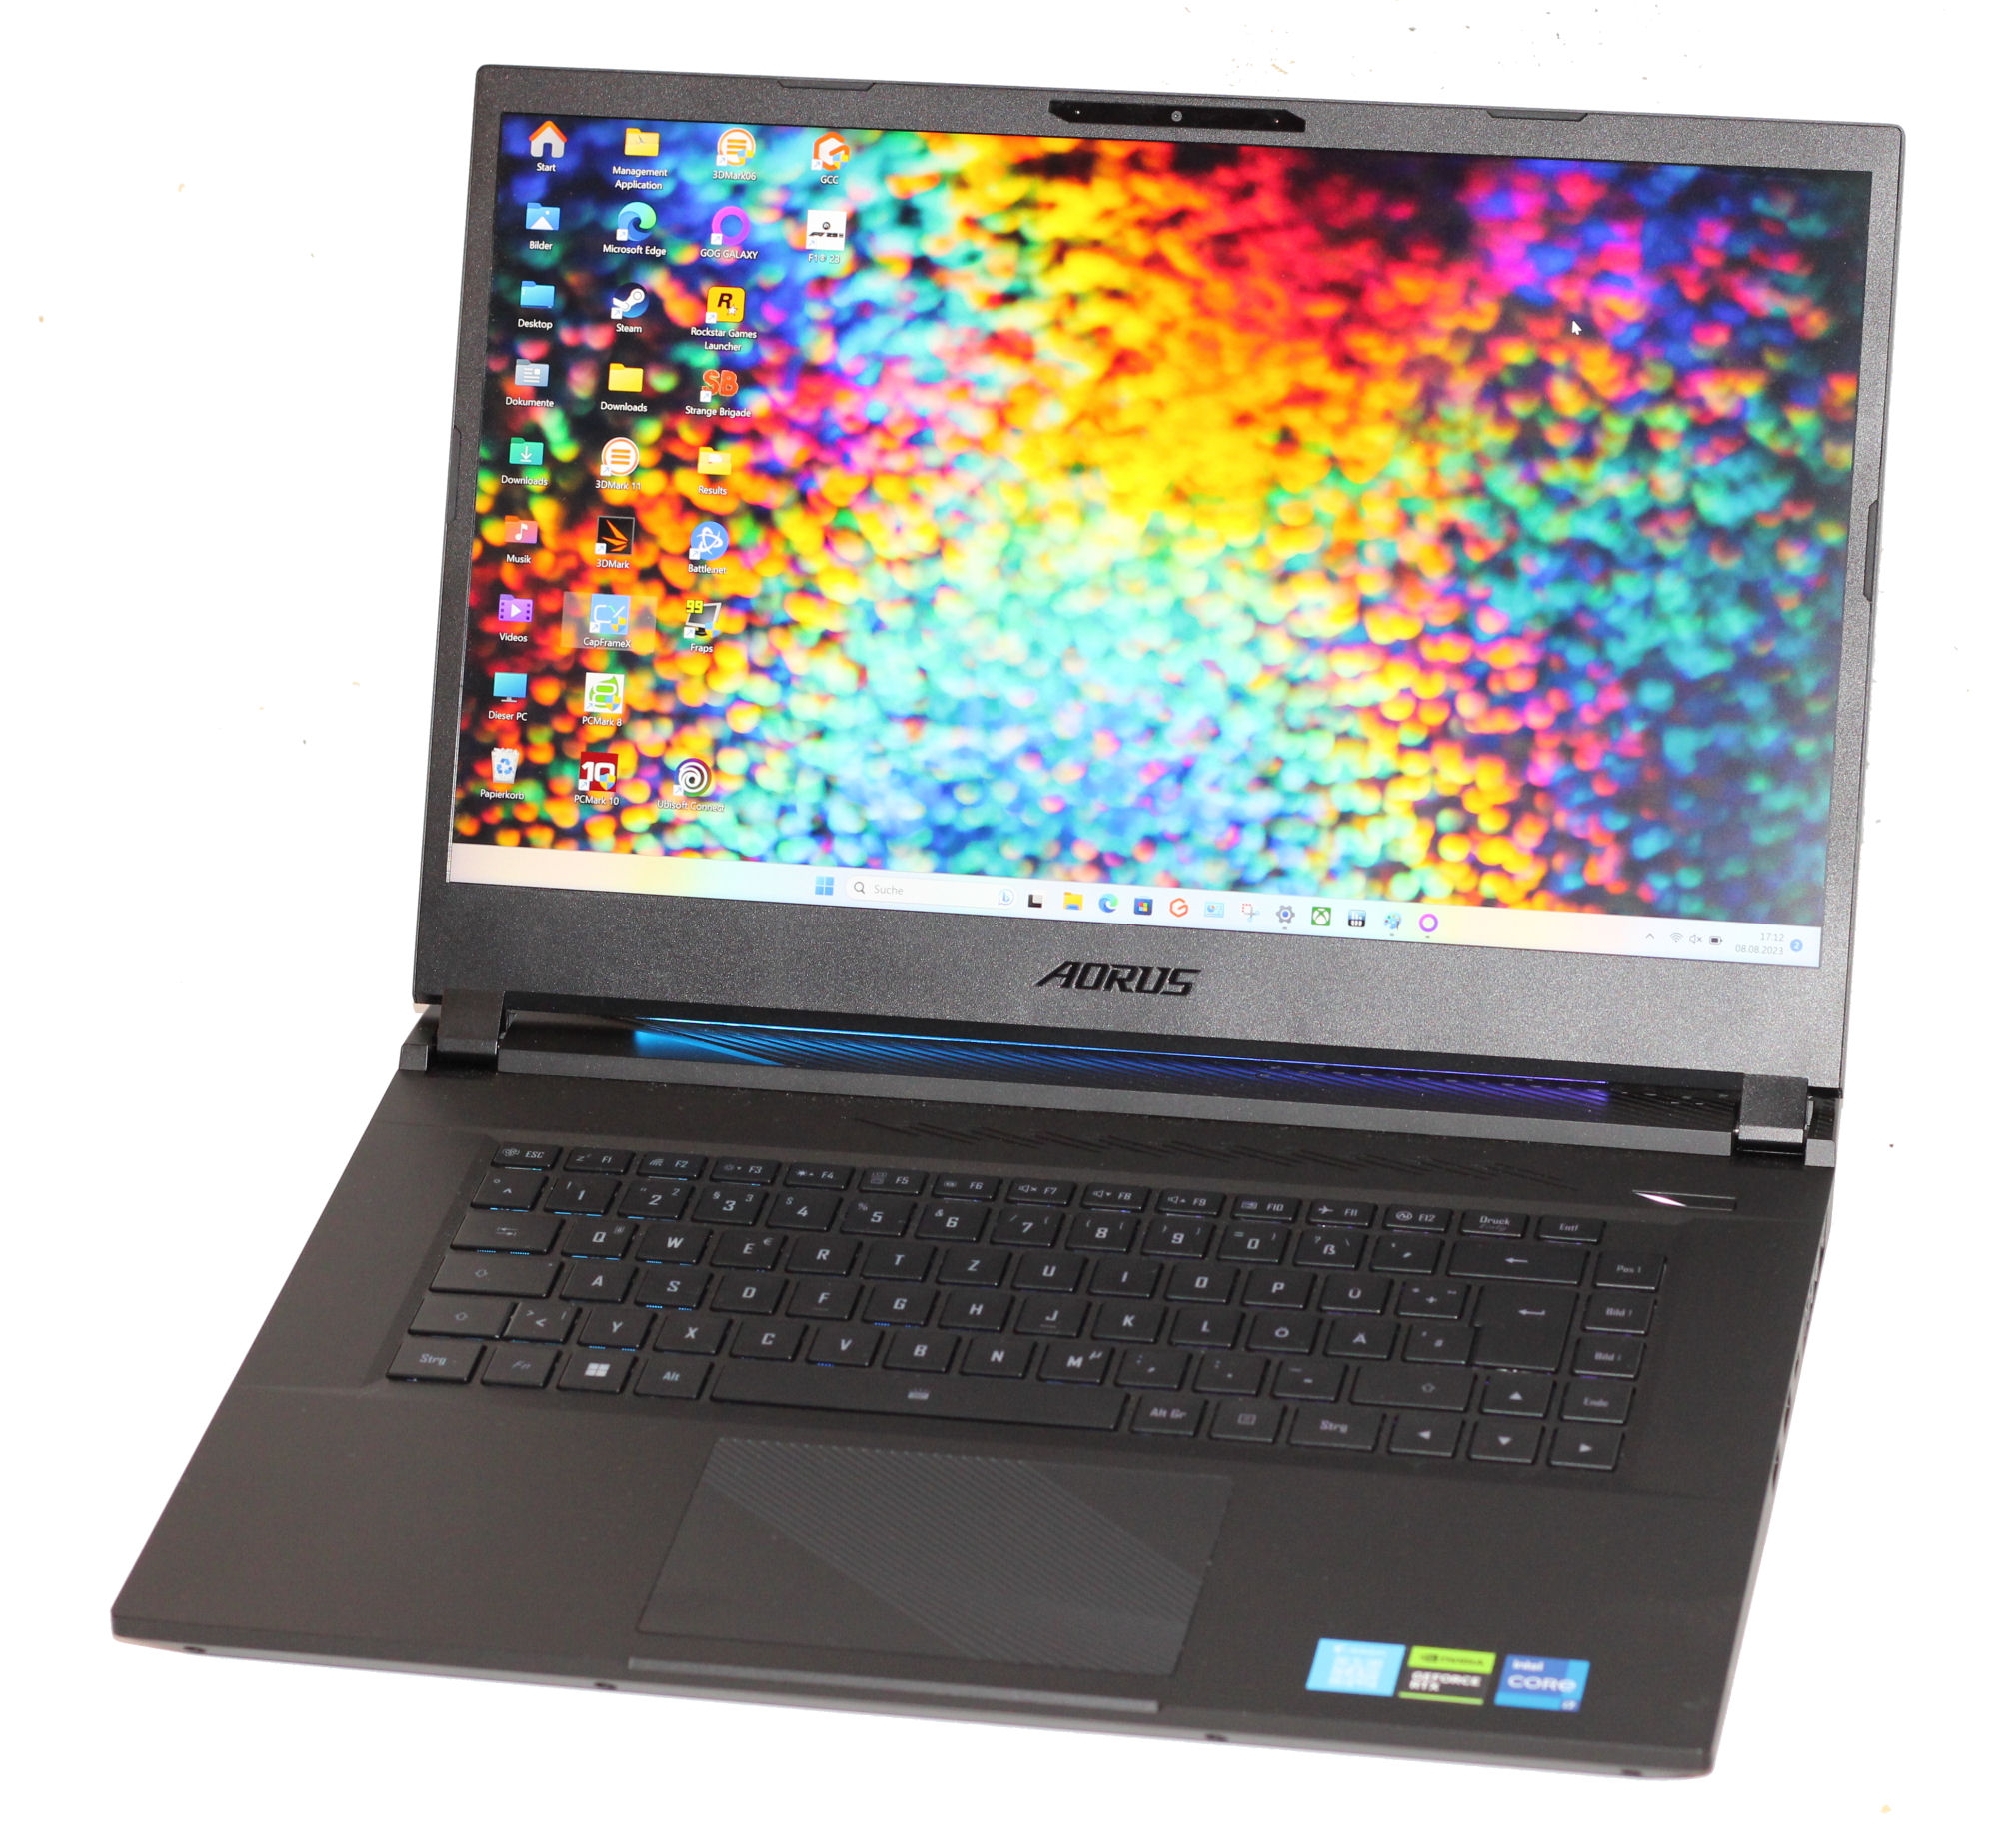
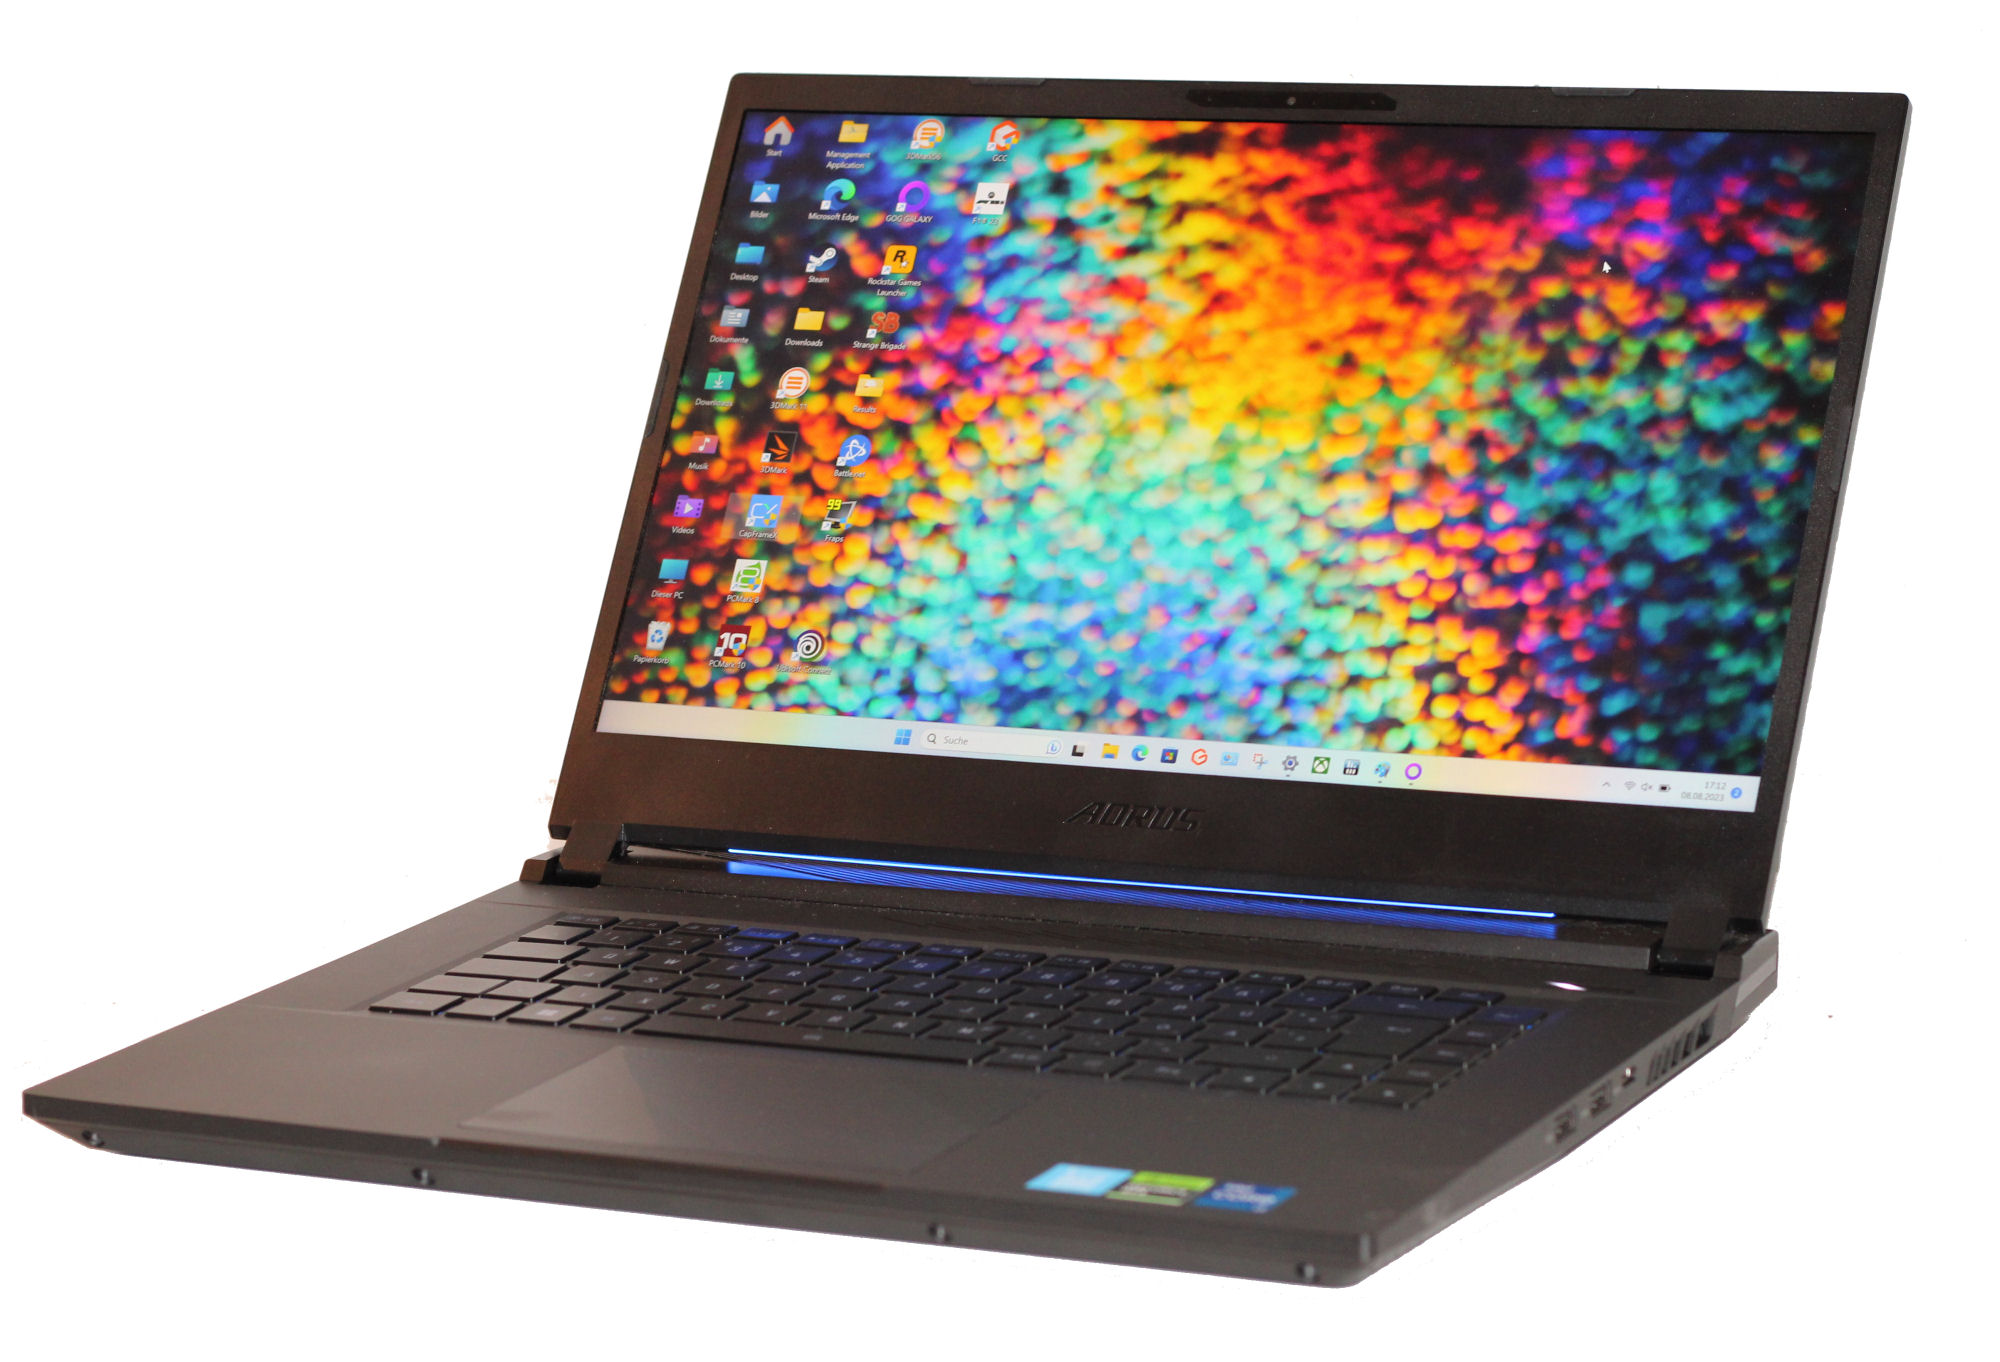
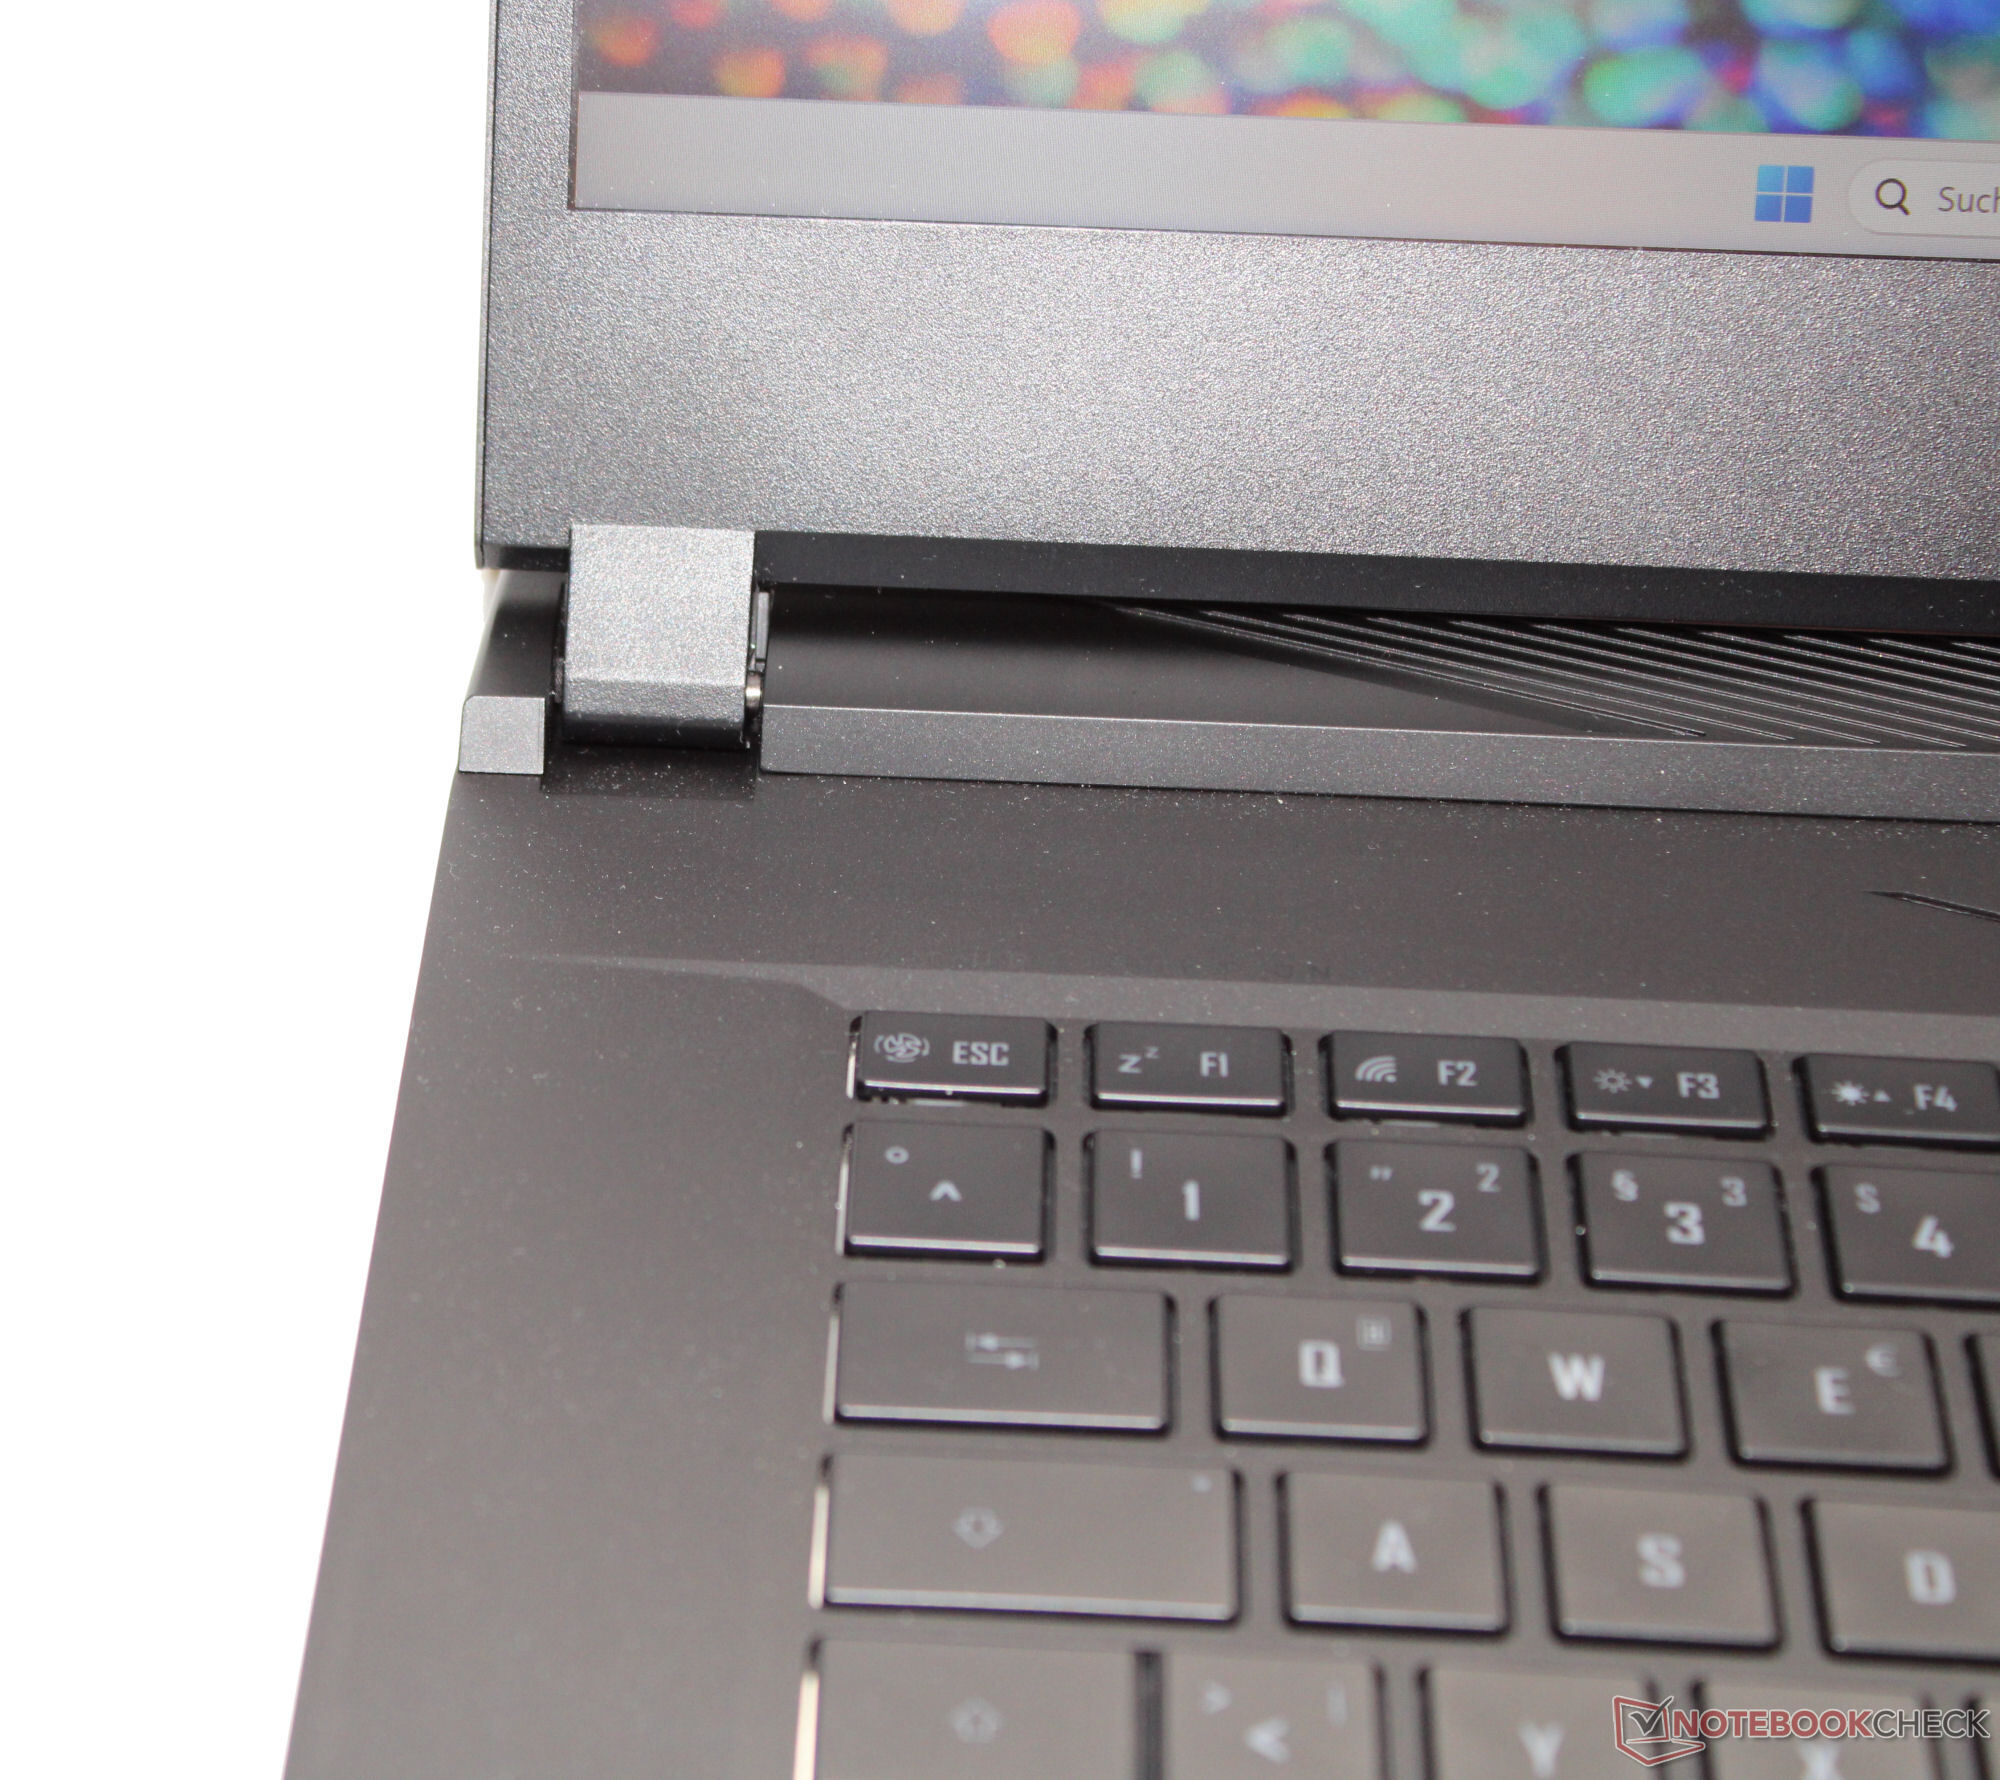
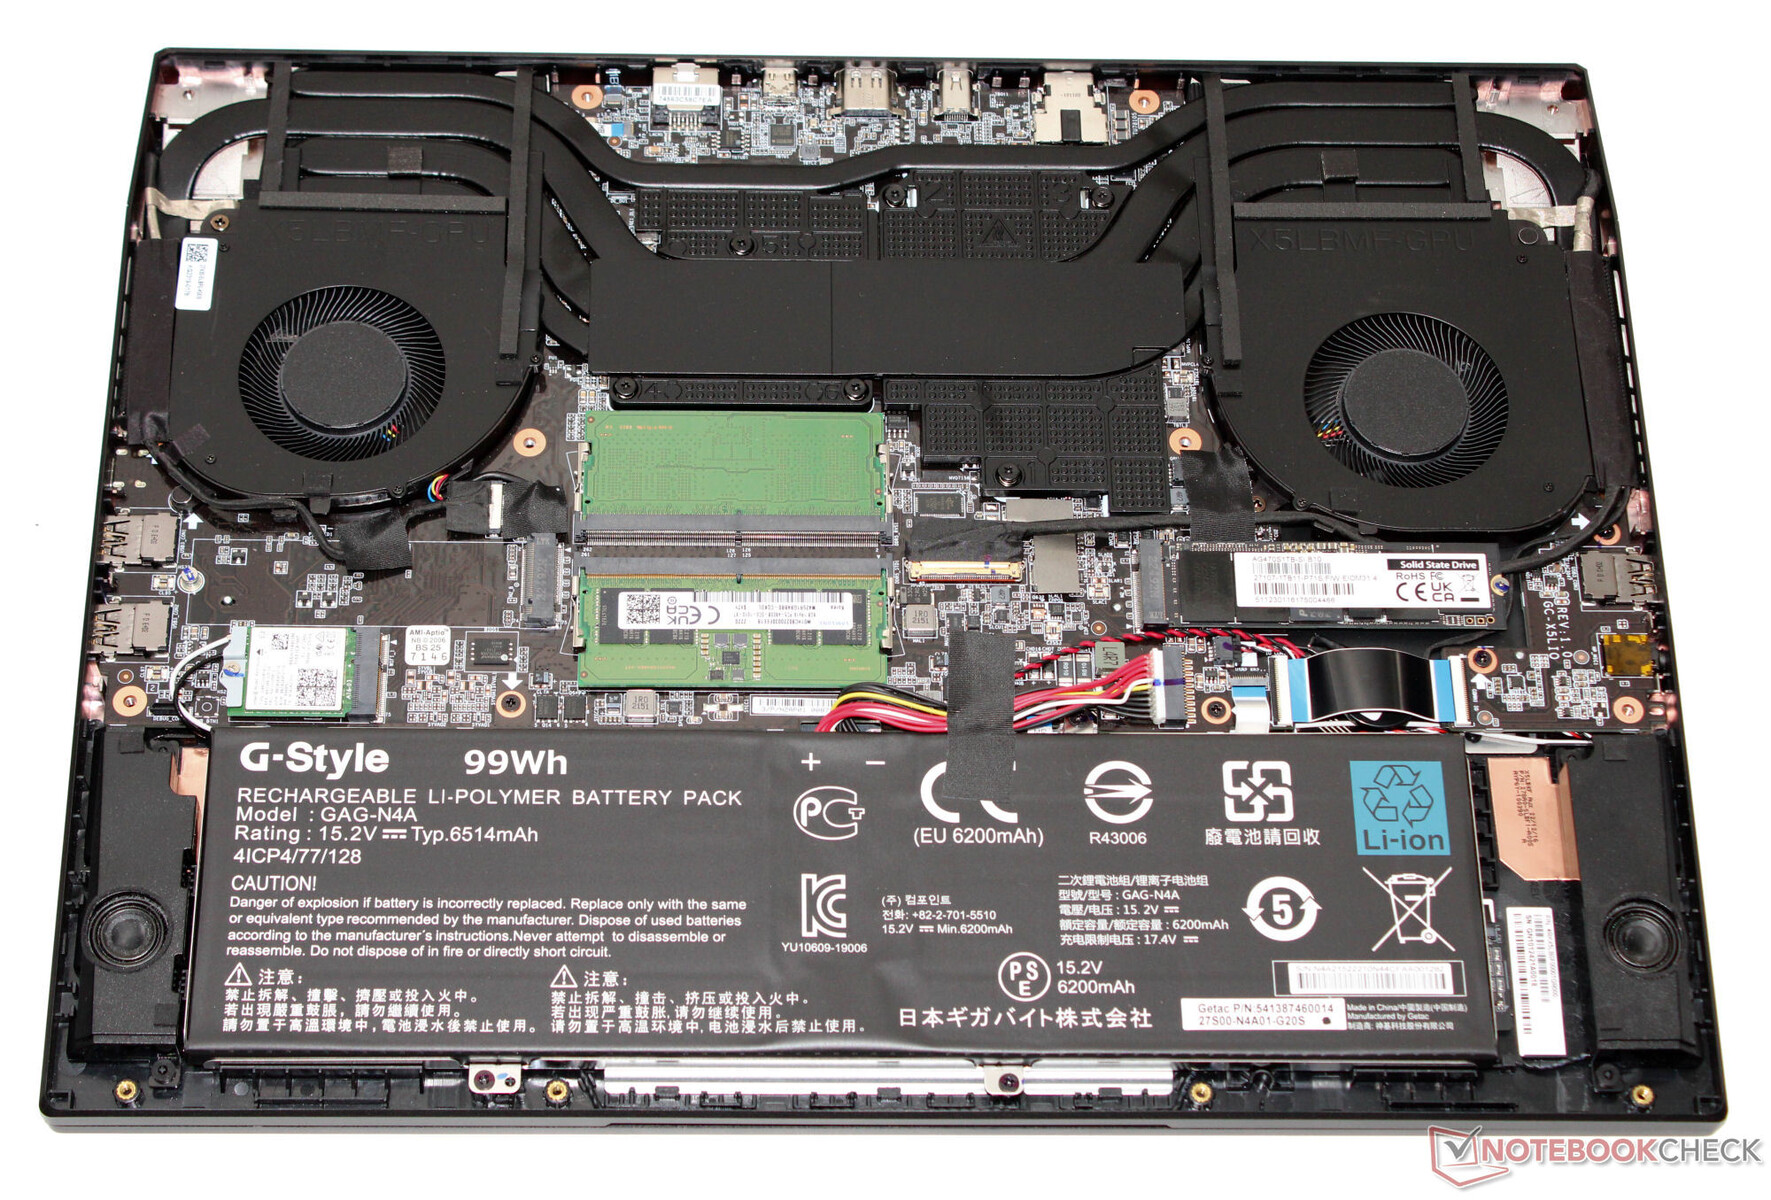
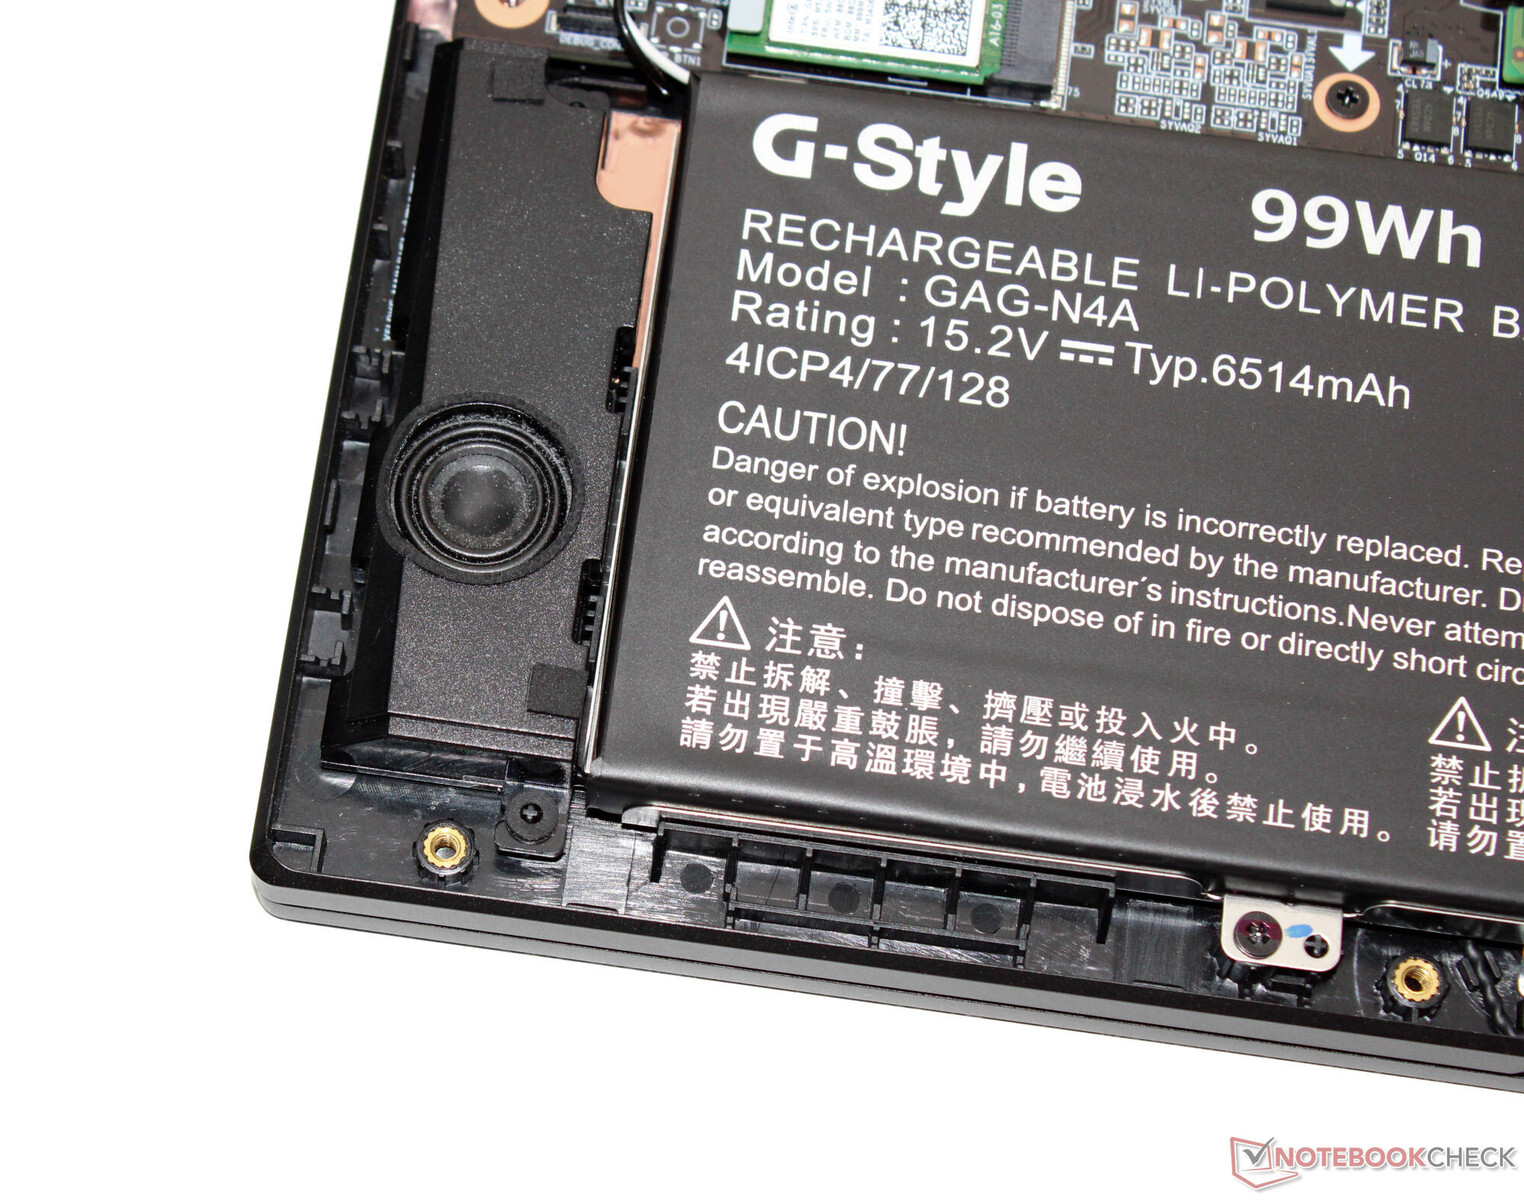
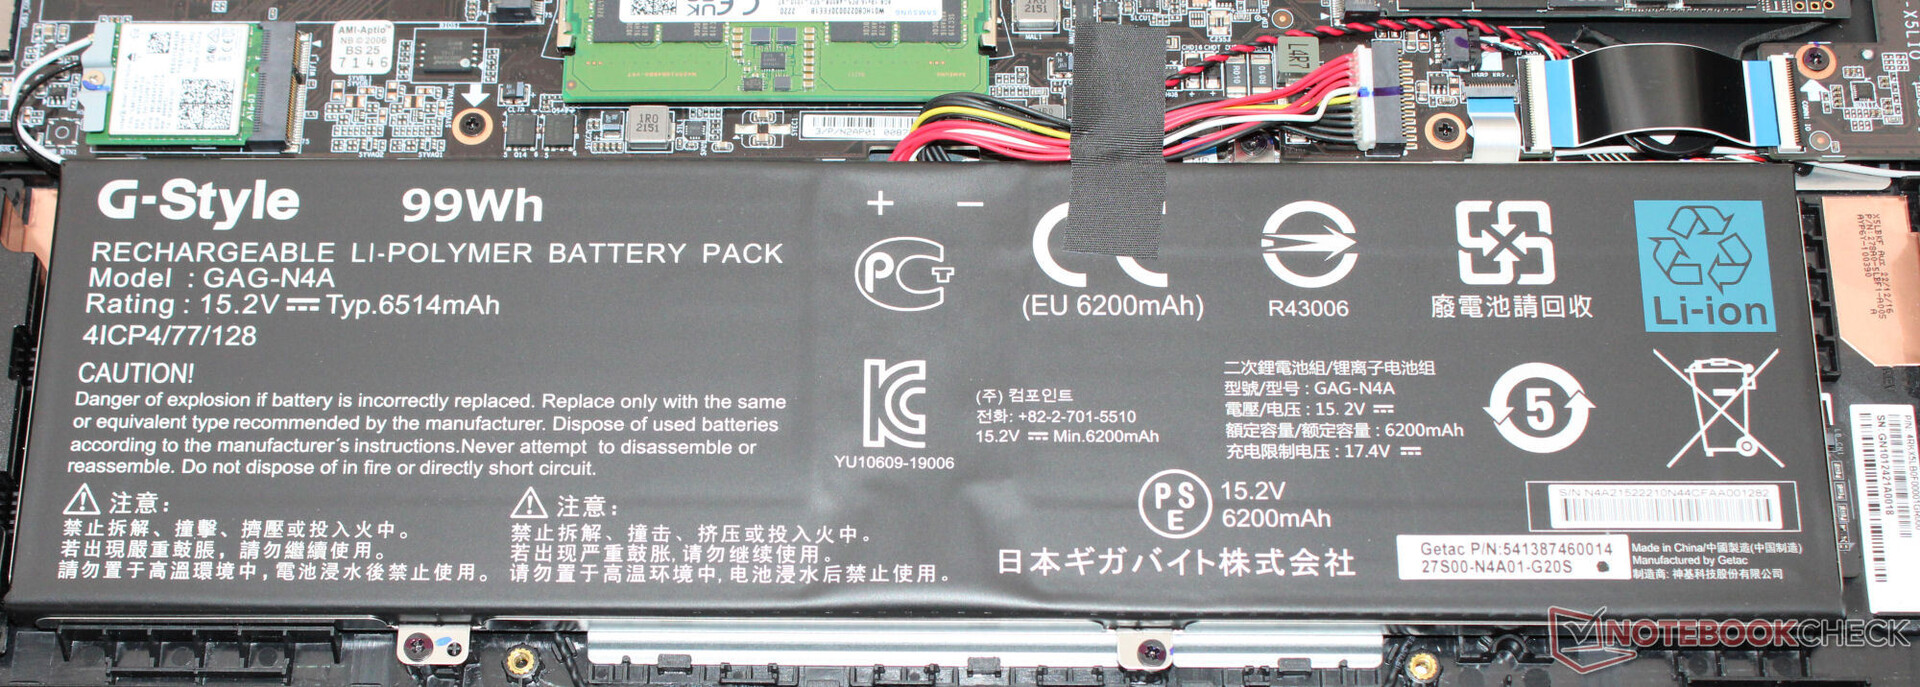
Gigabyte postawił na czarną, metalową obudowę o gładkich, matowych powierzchniach. Laptop nie posiada żadnych ekstrawertycznych cech konstrukcyjnych. Pasek LED przymocowany do dolnej przedniej części pokrywy (gdy laptop jest otwarty) nadaje urządzeniu trochę koloru - wraz z podświetlaną klawiaturą. Dostęp do baterii (przykręconej, a nie przyklejonej), a także reszty wnętrza laptopa można uzyskać po zdjęciu dolnej części obudowy.
Laptop nie wydaje się mieć żadnych wad konstrukcyjnych. Wszystkie szczeliny się zgadzają i nie widać nadmiaru materiału. Jednostka zasadnicza może być tylko lekko skręcona - pokrywa bardziej. Chociaż: Naciśnięcie tyłu nie prowadzi do żadnych zmian w obrazie. Zawiasy pewnie trzymają pokrywę, a jej maksymalny kąt otwarcia wynosi około 130 stopni. Urządzenie można otworzyć jedną ręką.
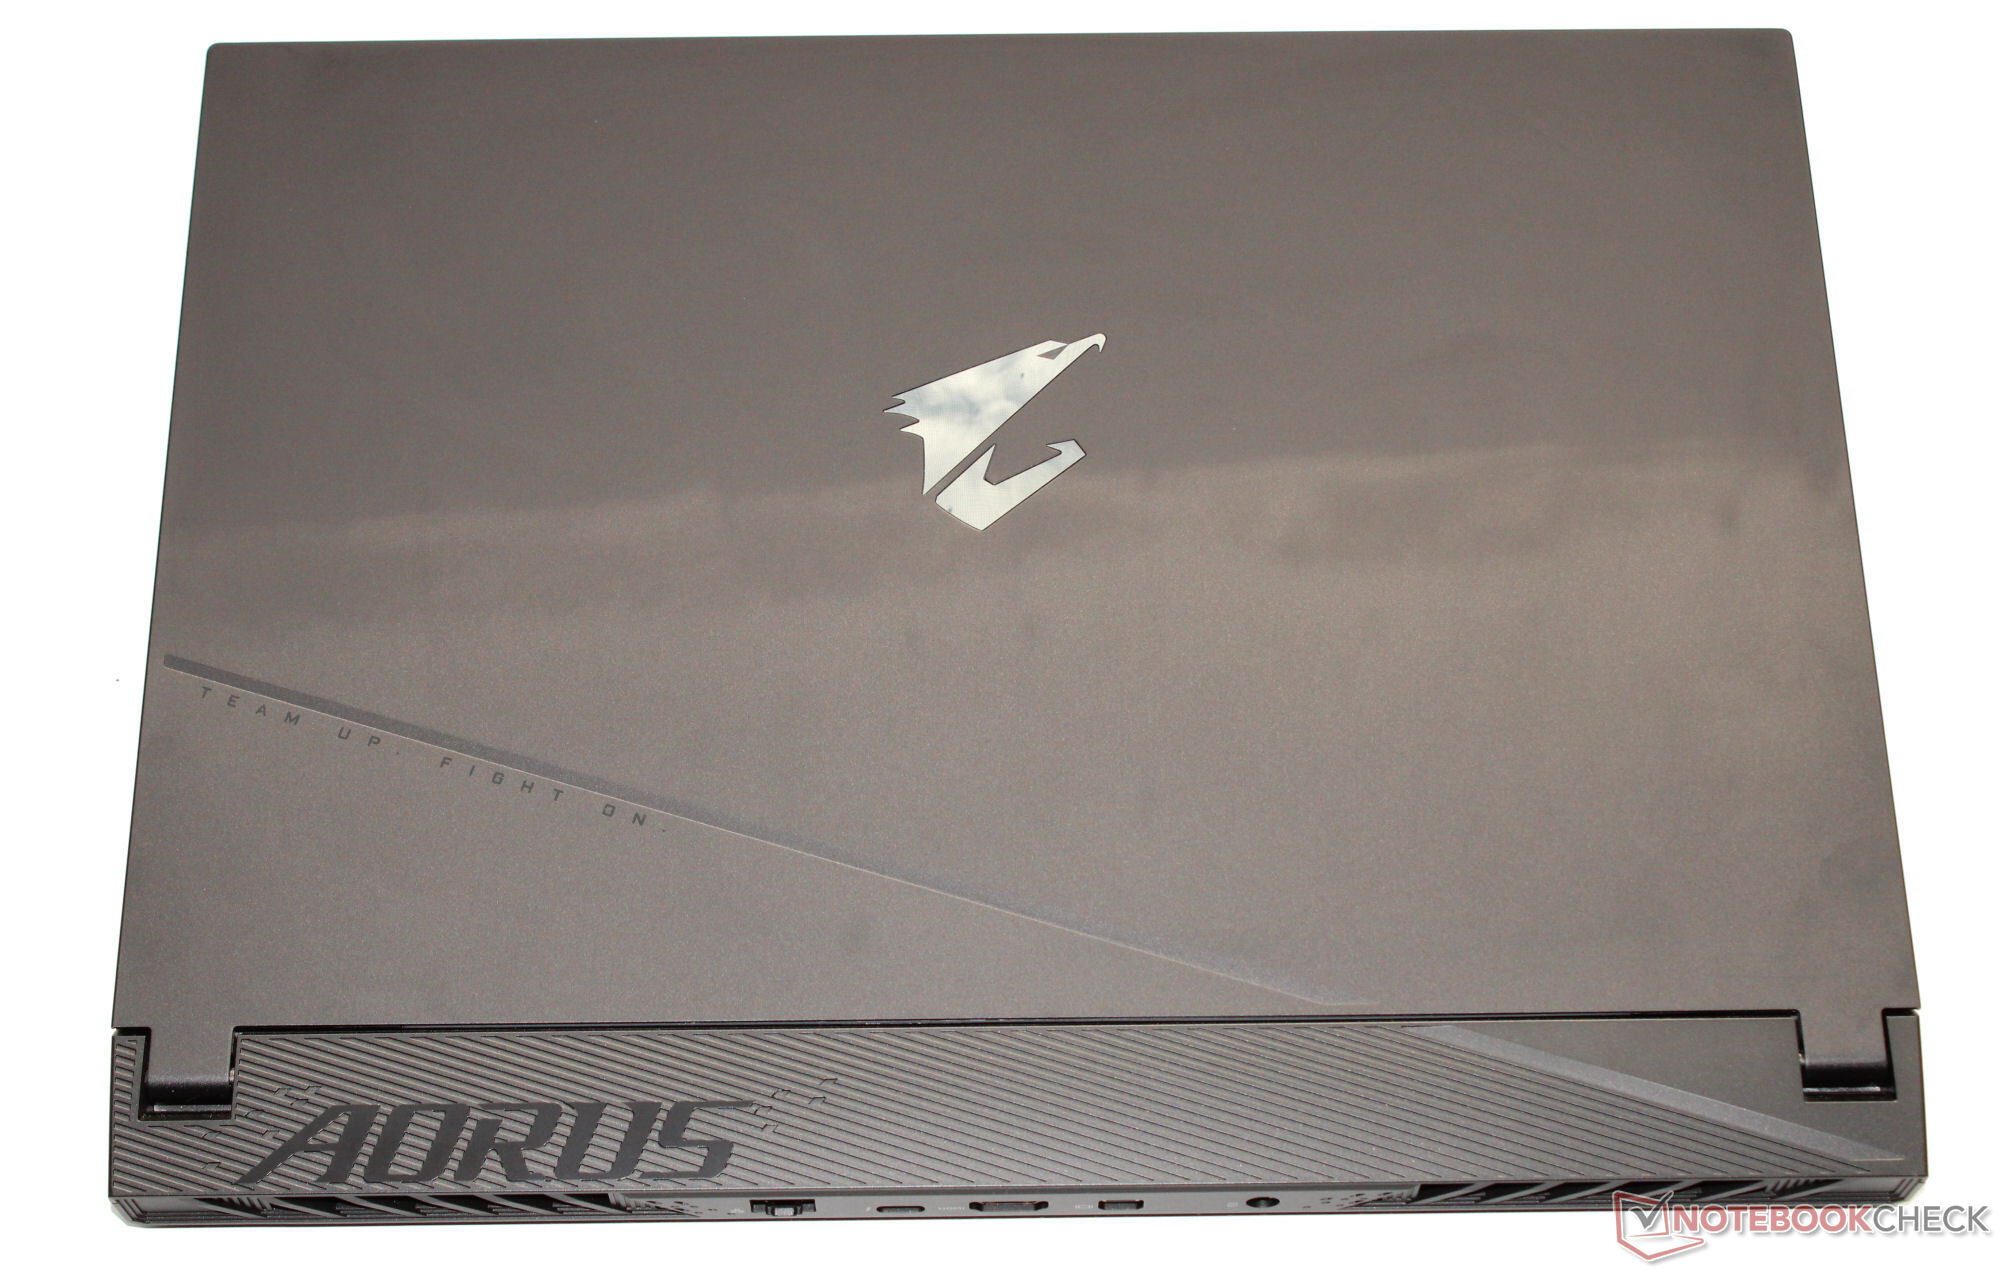
W polu porównawczym Aorus 15 zalicza się do największych laptopów pod względem zajmowanej powierzchni. Jego waga jest przeciętna.
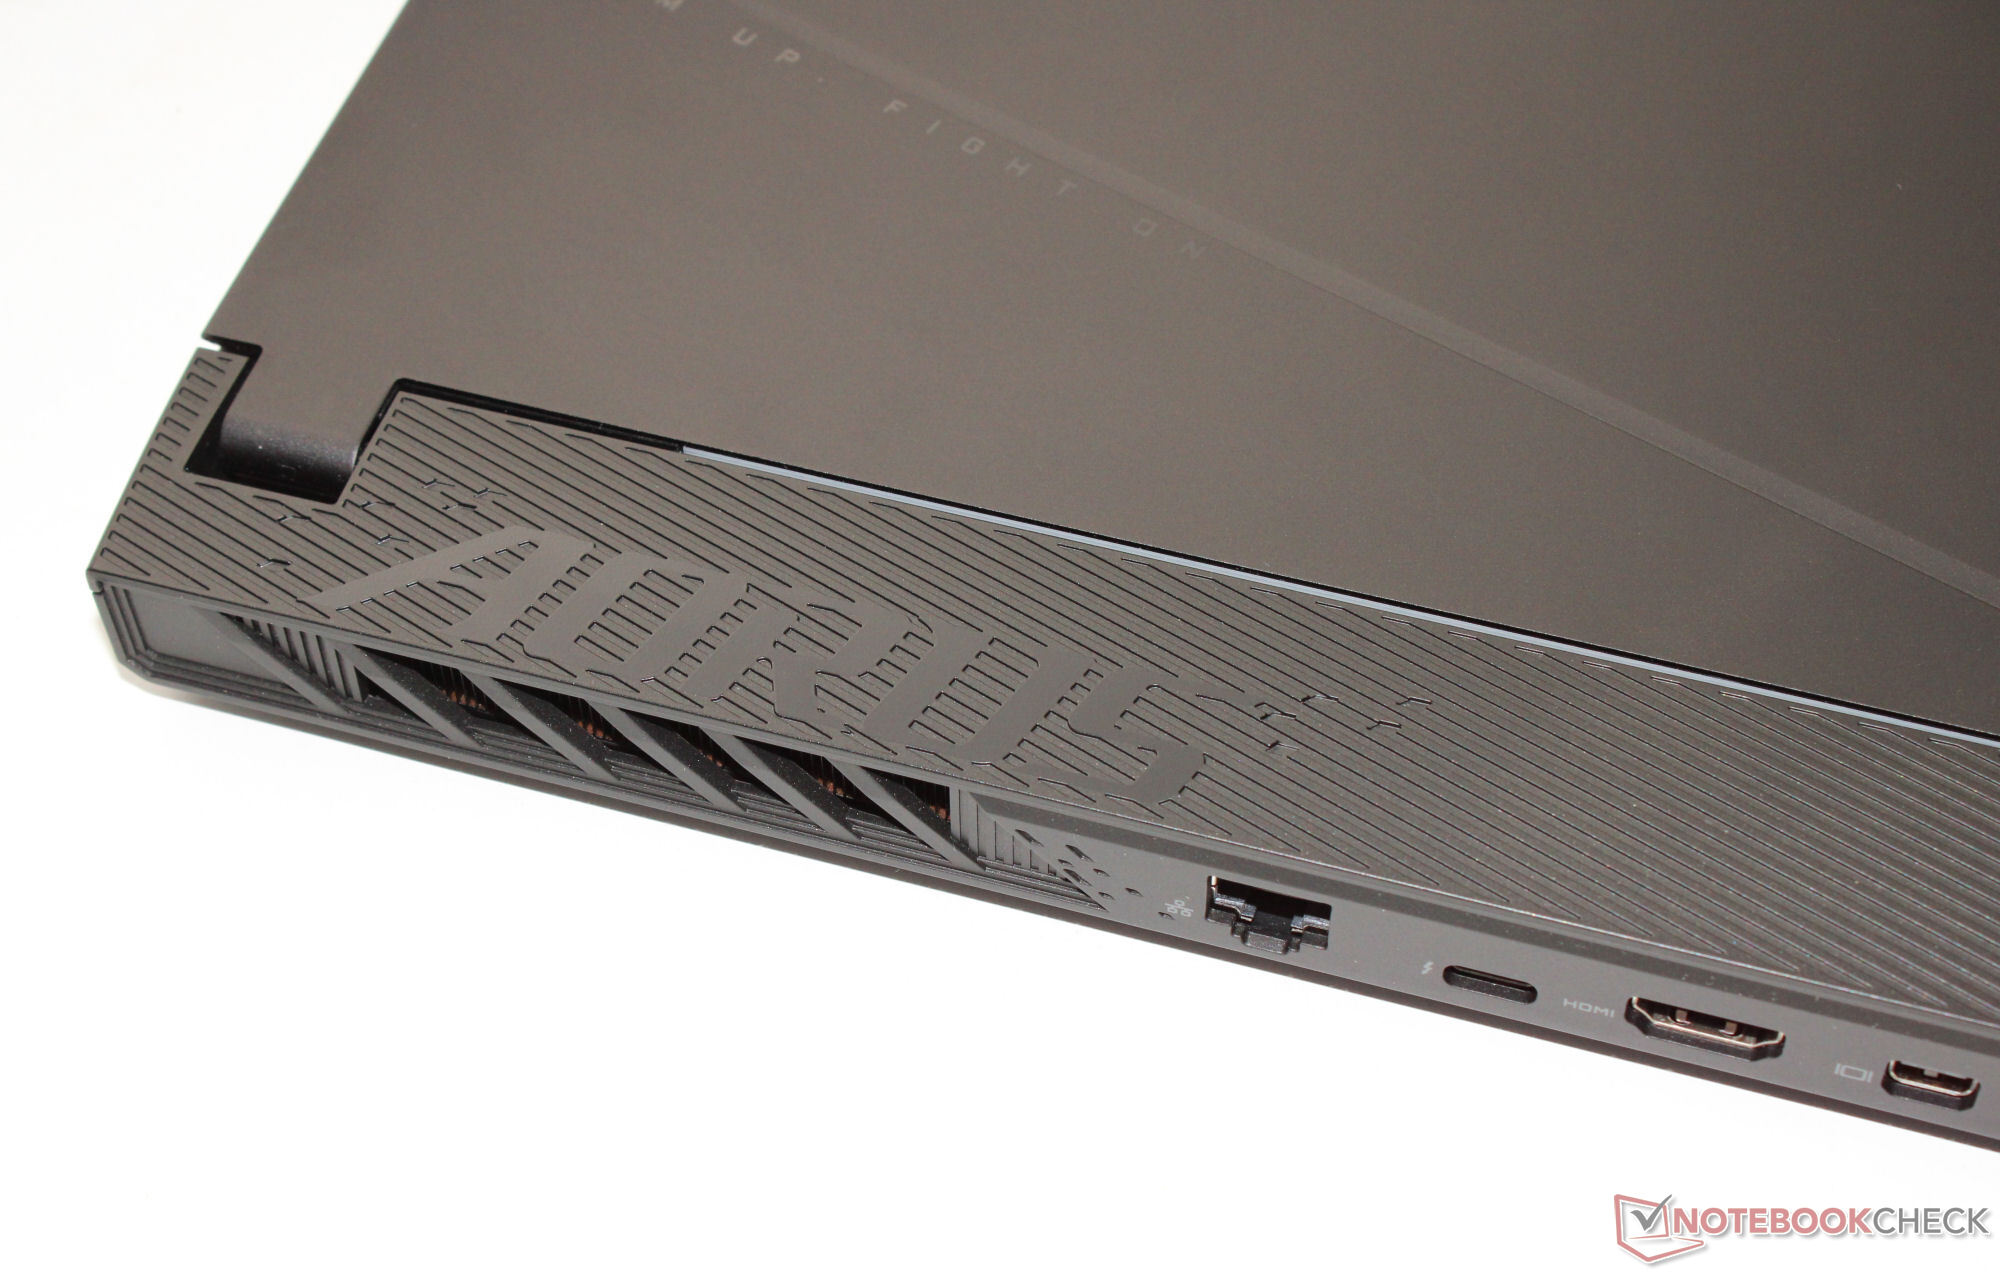
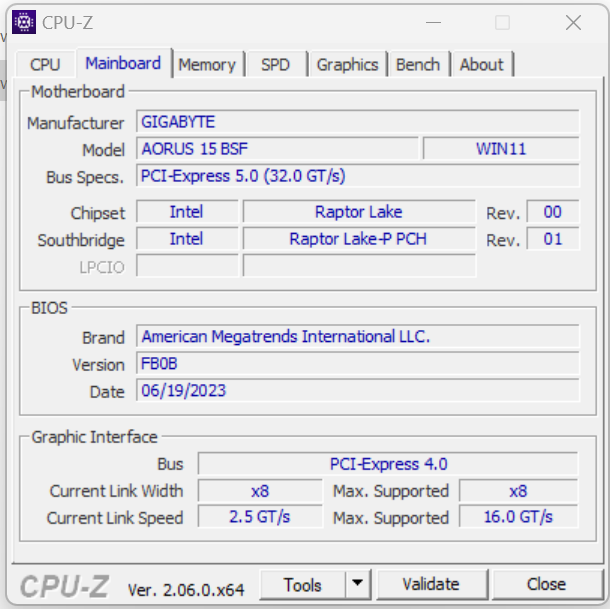
Łączność - Thunderbolt 4 w zestawie
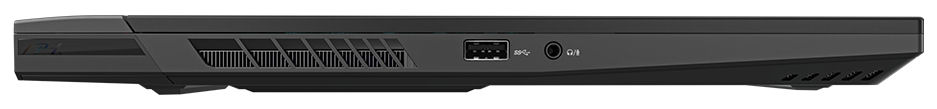
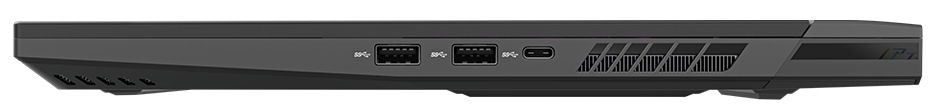
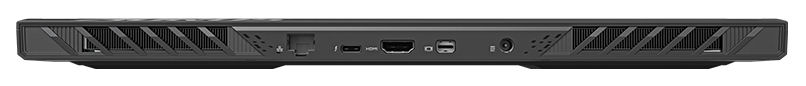
Aorus posiada trzy porty USB-A (2x USB 3.2 Gen 2, 1x USB 3.2 Gen 1) i dwa złącza USB-C (1x Thunderbolt 4, 1x USB 3.2 Gen 2). Port TB4 obsługuje funkcję Power Delivery, ale nie może wysyłać sygnału DisplayPort. Oznacza to, że ma w sumie dwa wyjścia wideo, a mianowicie jeden port HDMI (2.1) i jeden dedykowany Mini DisplayPort (1.4). Laptop nie posiada czytnika kart SD.
Wyjścia wideo, złącze zasilania i port Gigabit Ethernet znajdują się z tyłu urządzenia, co oznacza, że wszystkie kable wychodzą z tyłu i prawdopodobnie nie będą przeszkadzać.
Komunikacja
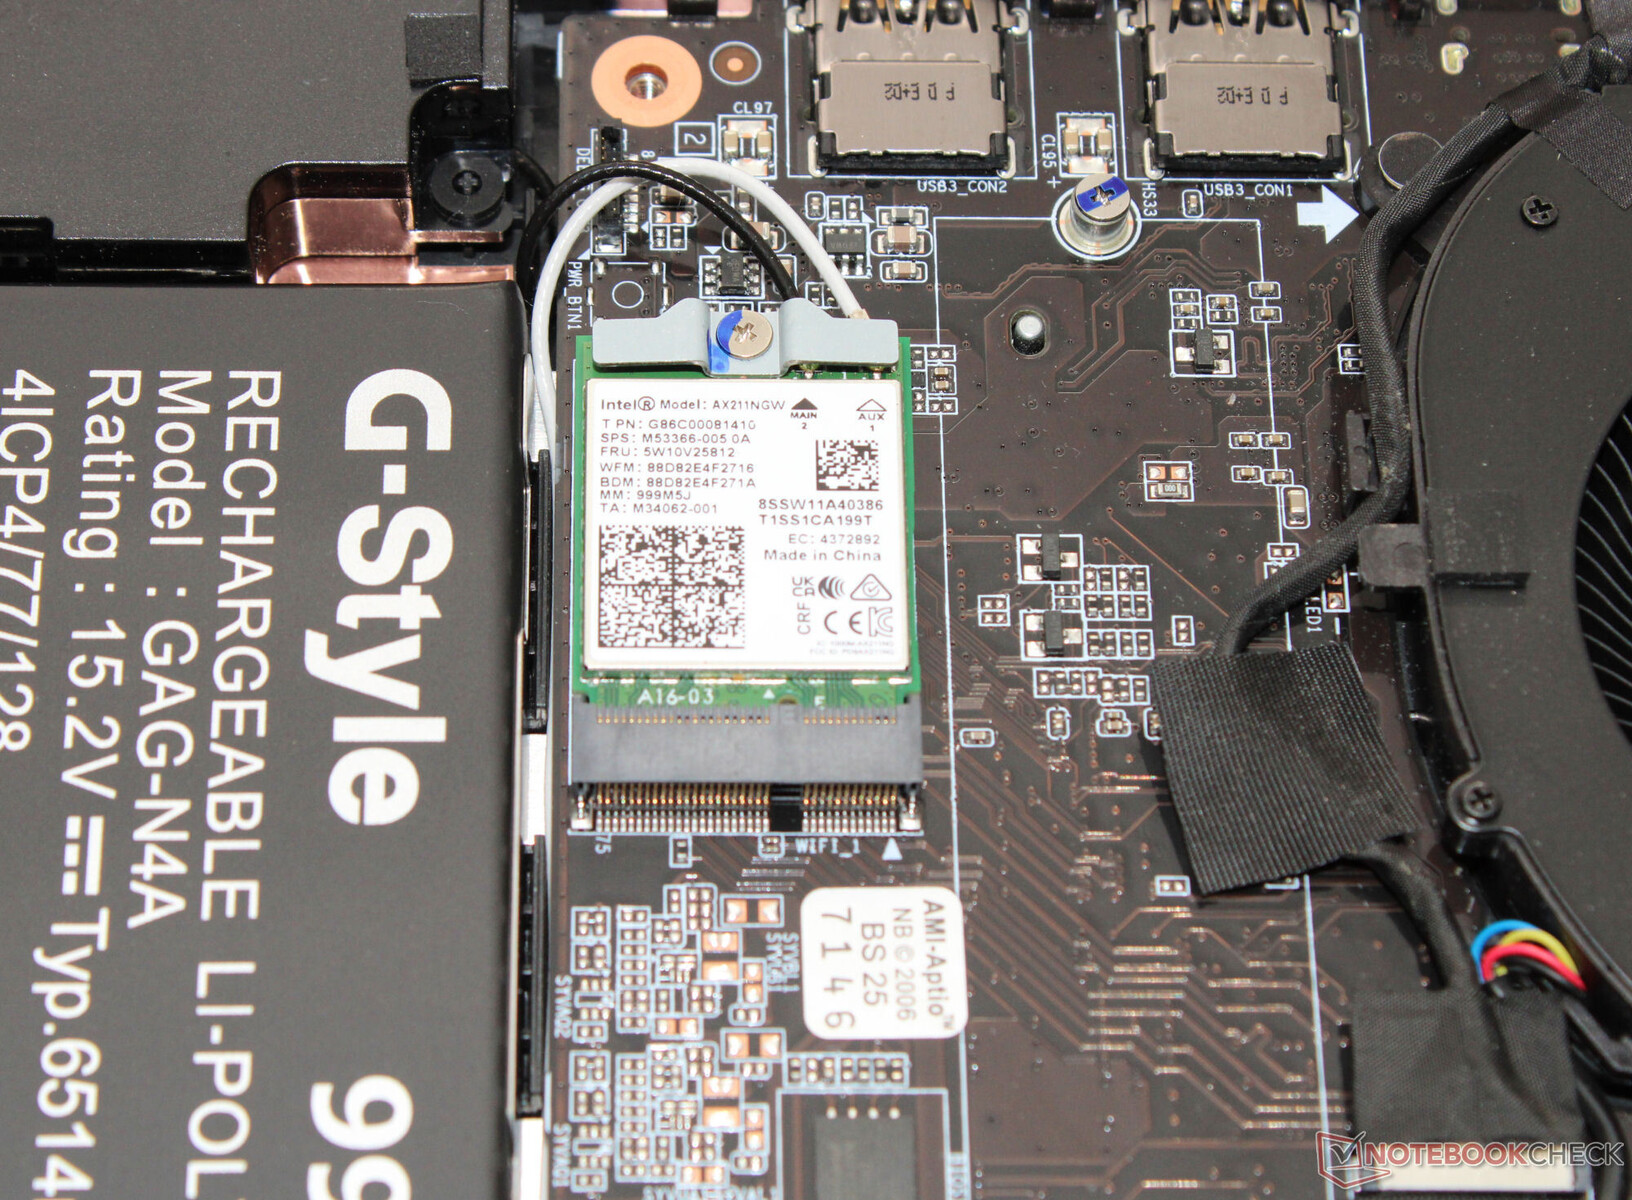
W idealnych warunkach (brak urządzeń WLAN w pobliżu, niewielka odległość między laptopem a serwerem PC), laptop osiąga doskonałe prędkości transmisji danych WiFi. Urządzenie wykorzystuje układ WiFi 6E (Intel AX211). Za połączenia przewodowe odpowiada kontroler (RTL8125; 2,5 GBit) firmy Realtek.
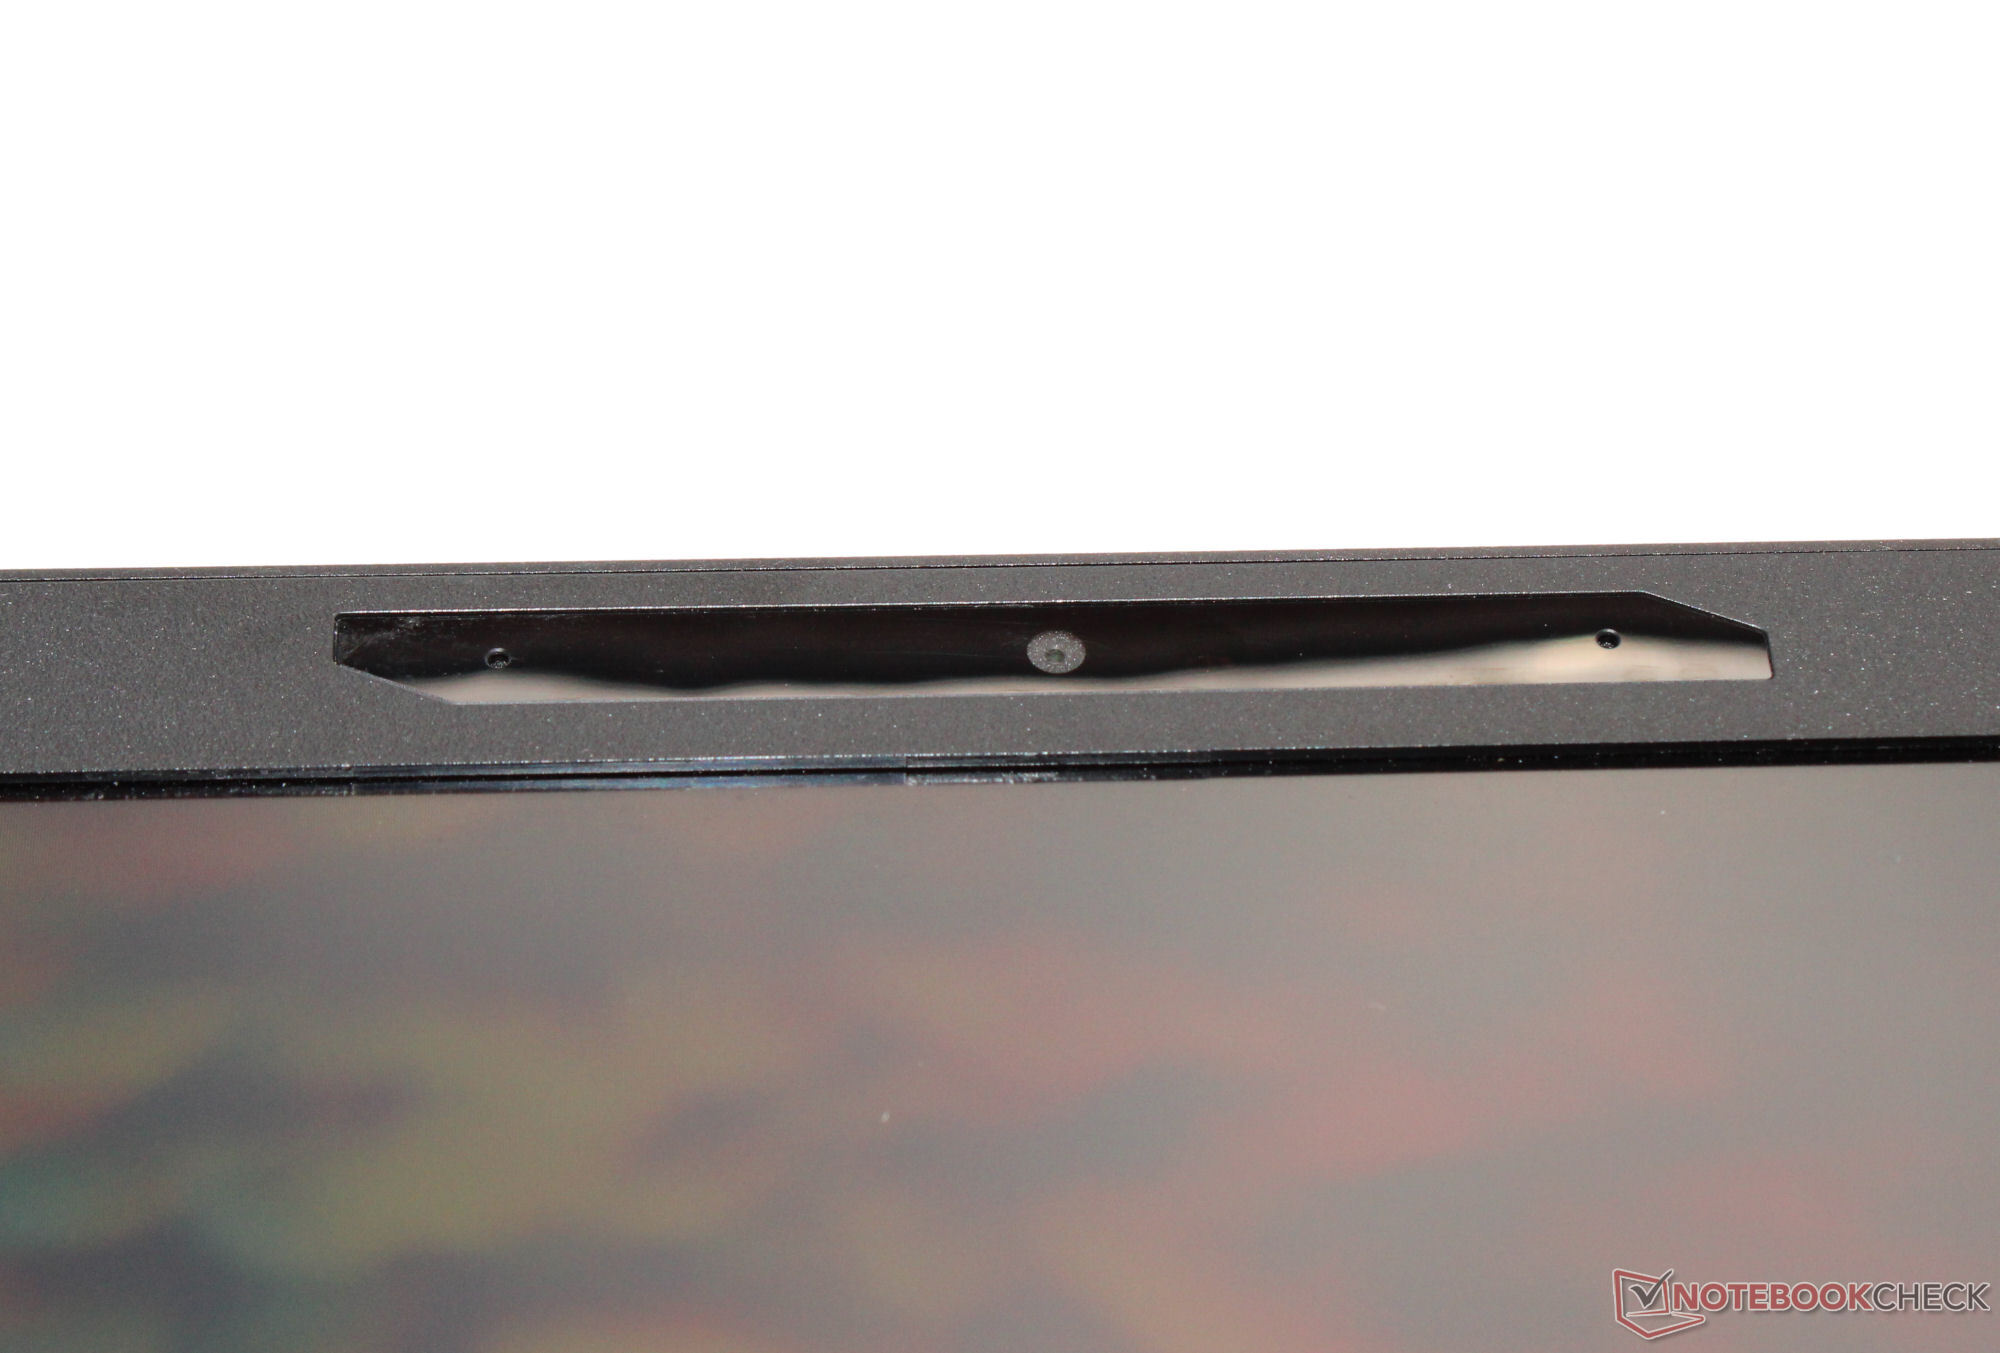
Kamera internetowa
Jakość kamery internetowej (2,1 MP, maks. 1920 x 1080 pikseli) nie odbiega od konkurencji. Nie posiada mechanicznej osłony.


Akcesoria
Poza zwykłymi dokumentami (skrócona instrukcja obsługi i informacje o gwarancji), laptop nie jest dostarczany z żadnymi dodatkowymi akcesoriami.
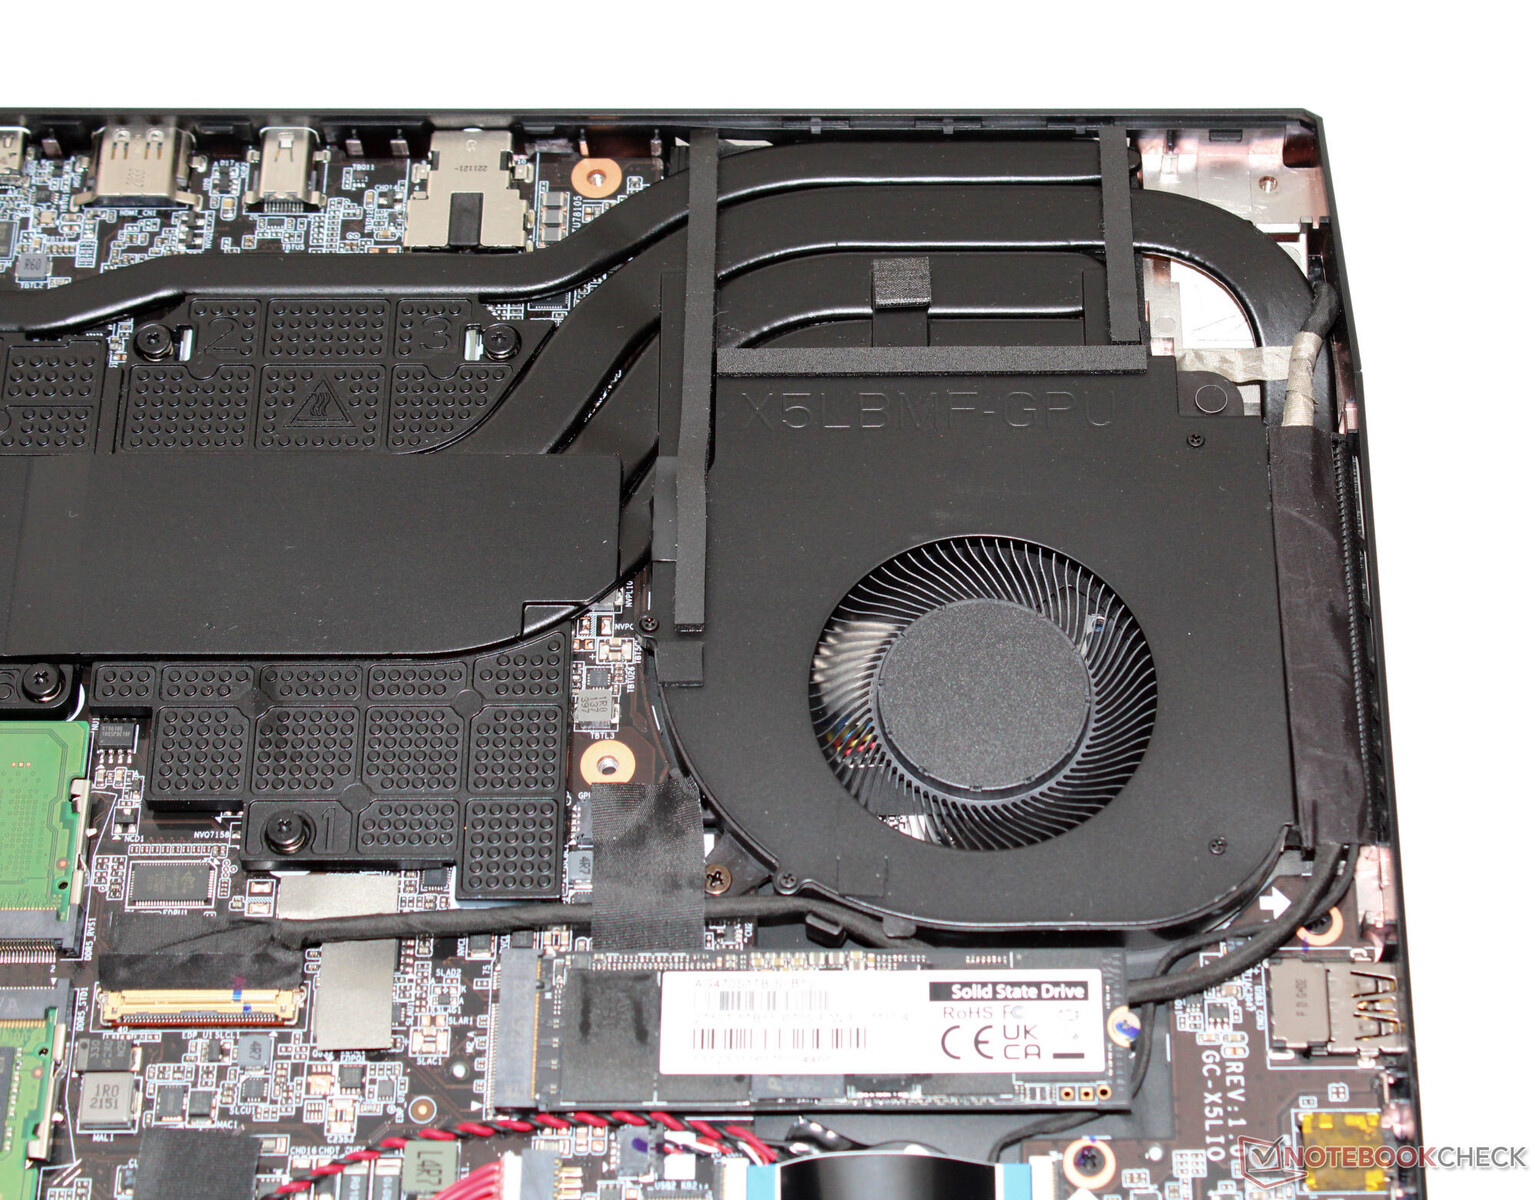
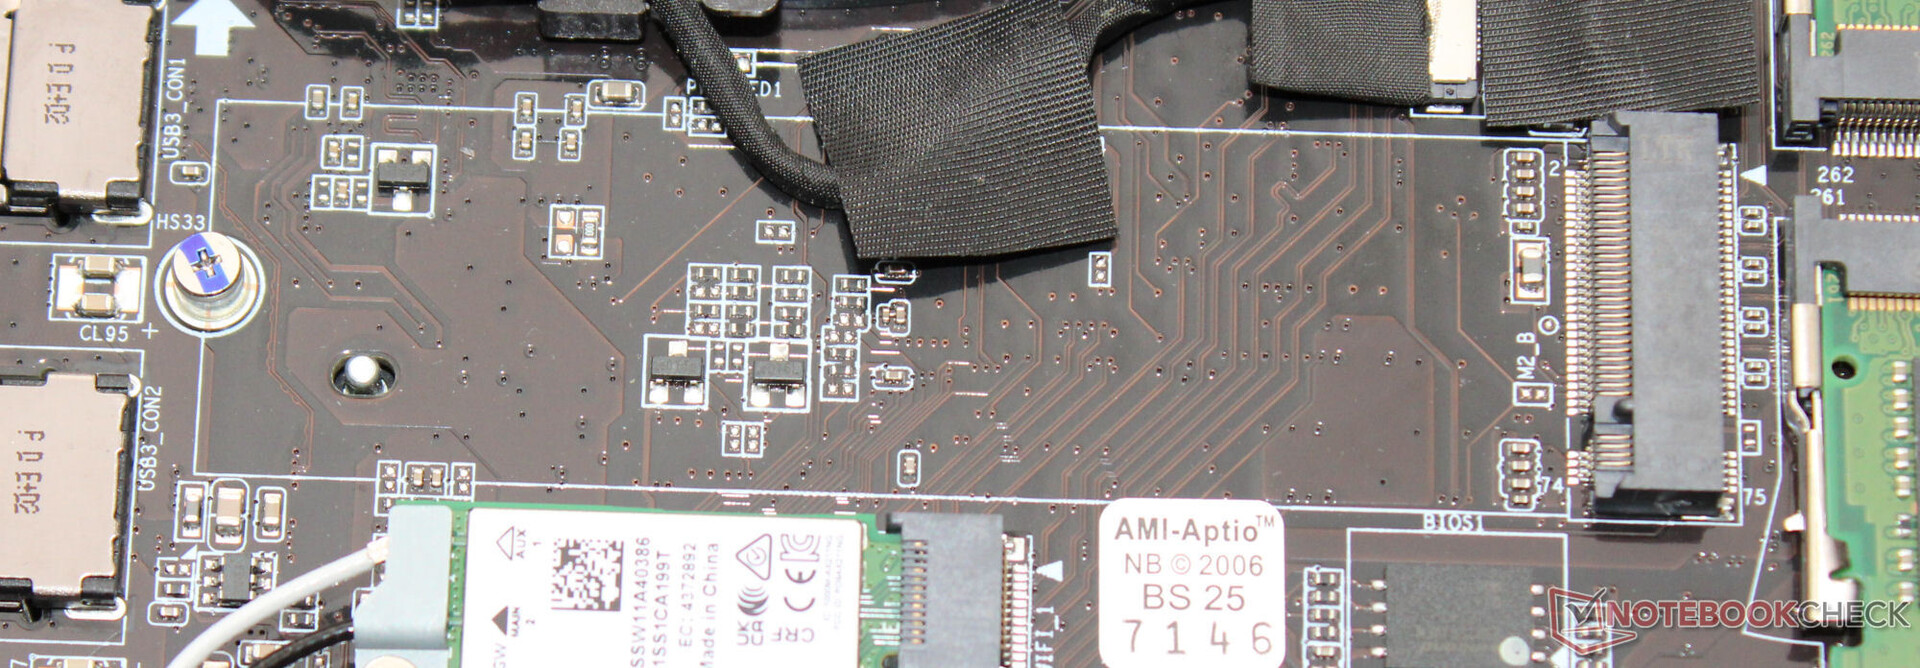
Konserwacja
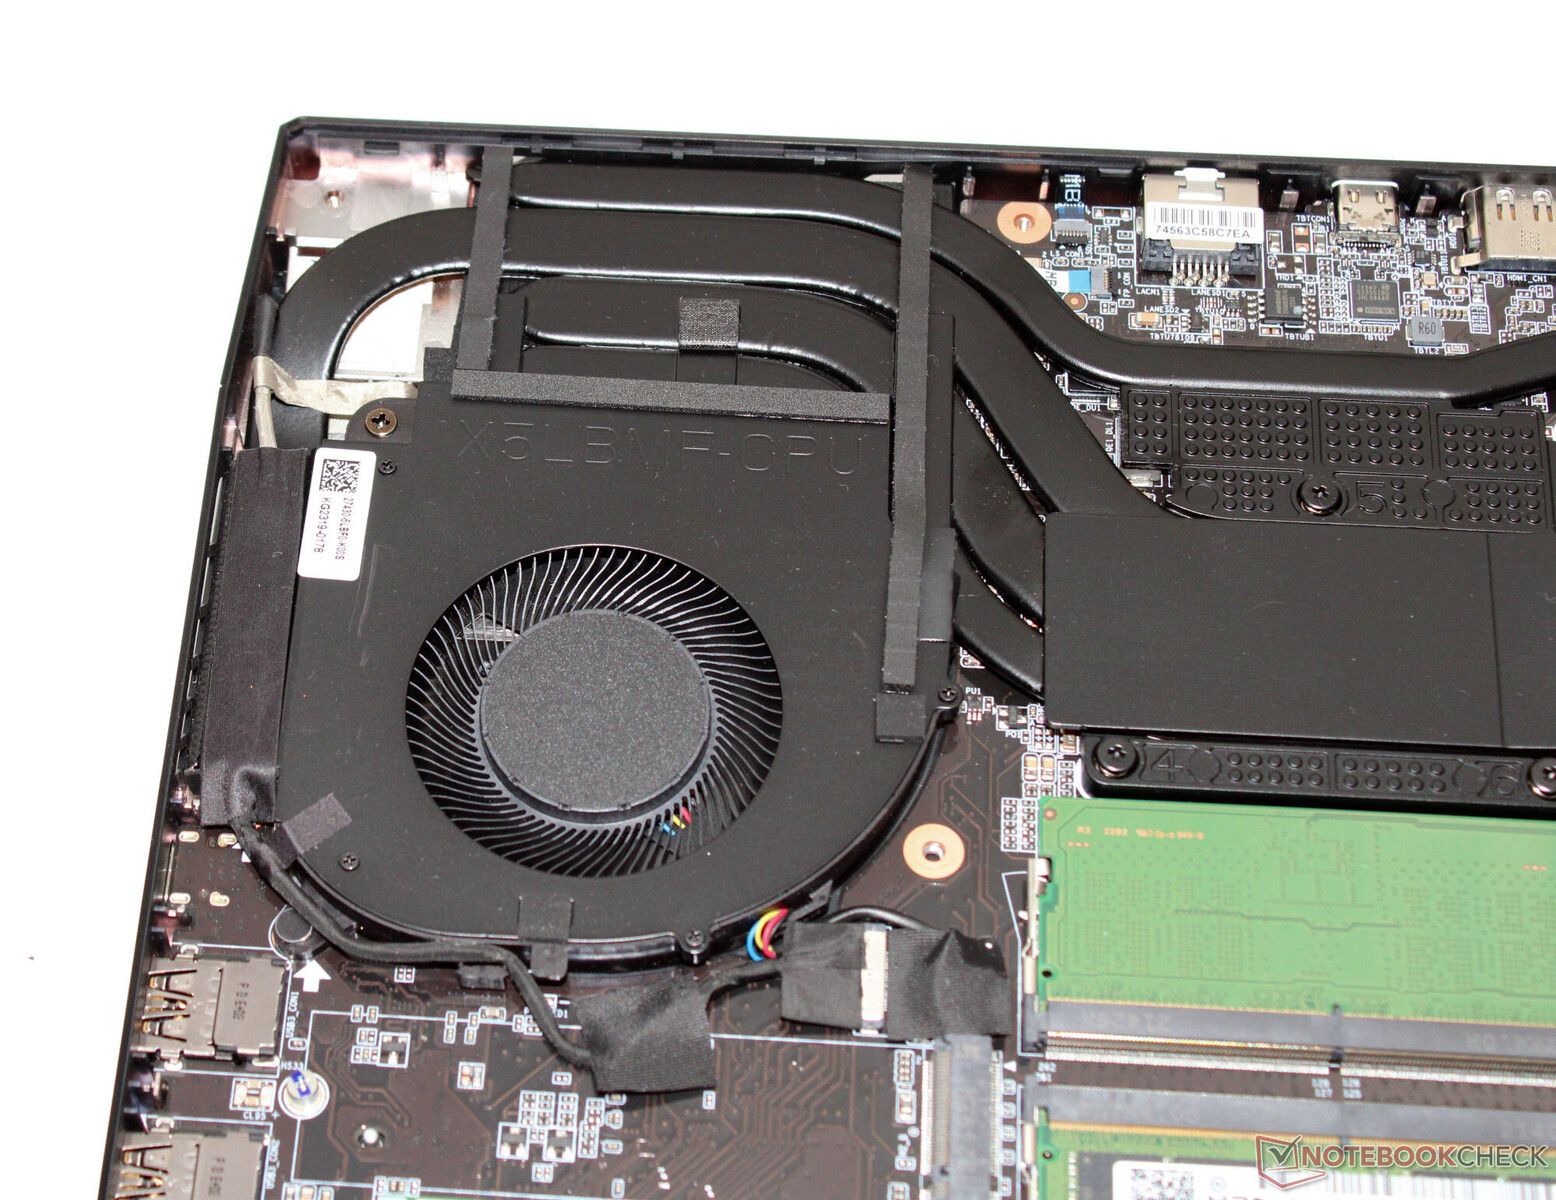
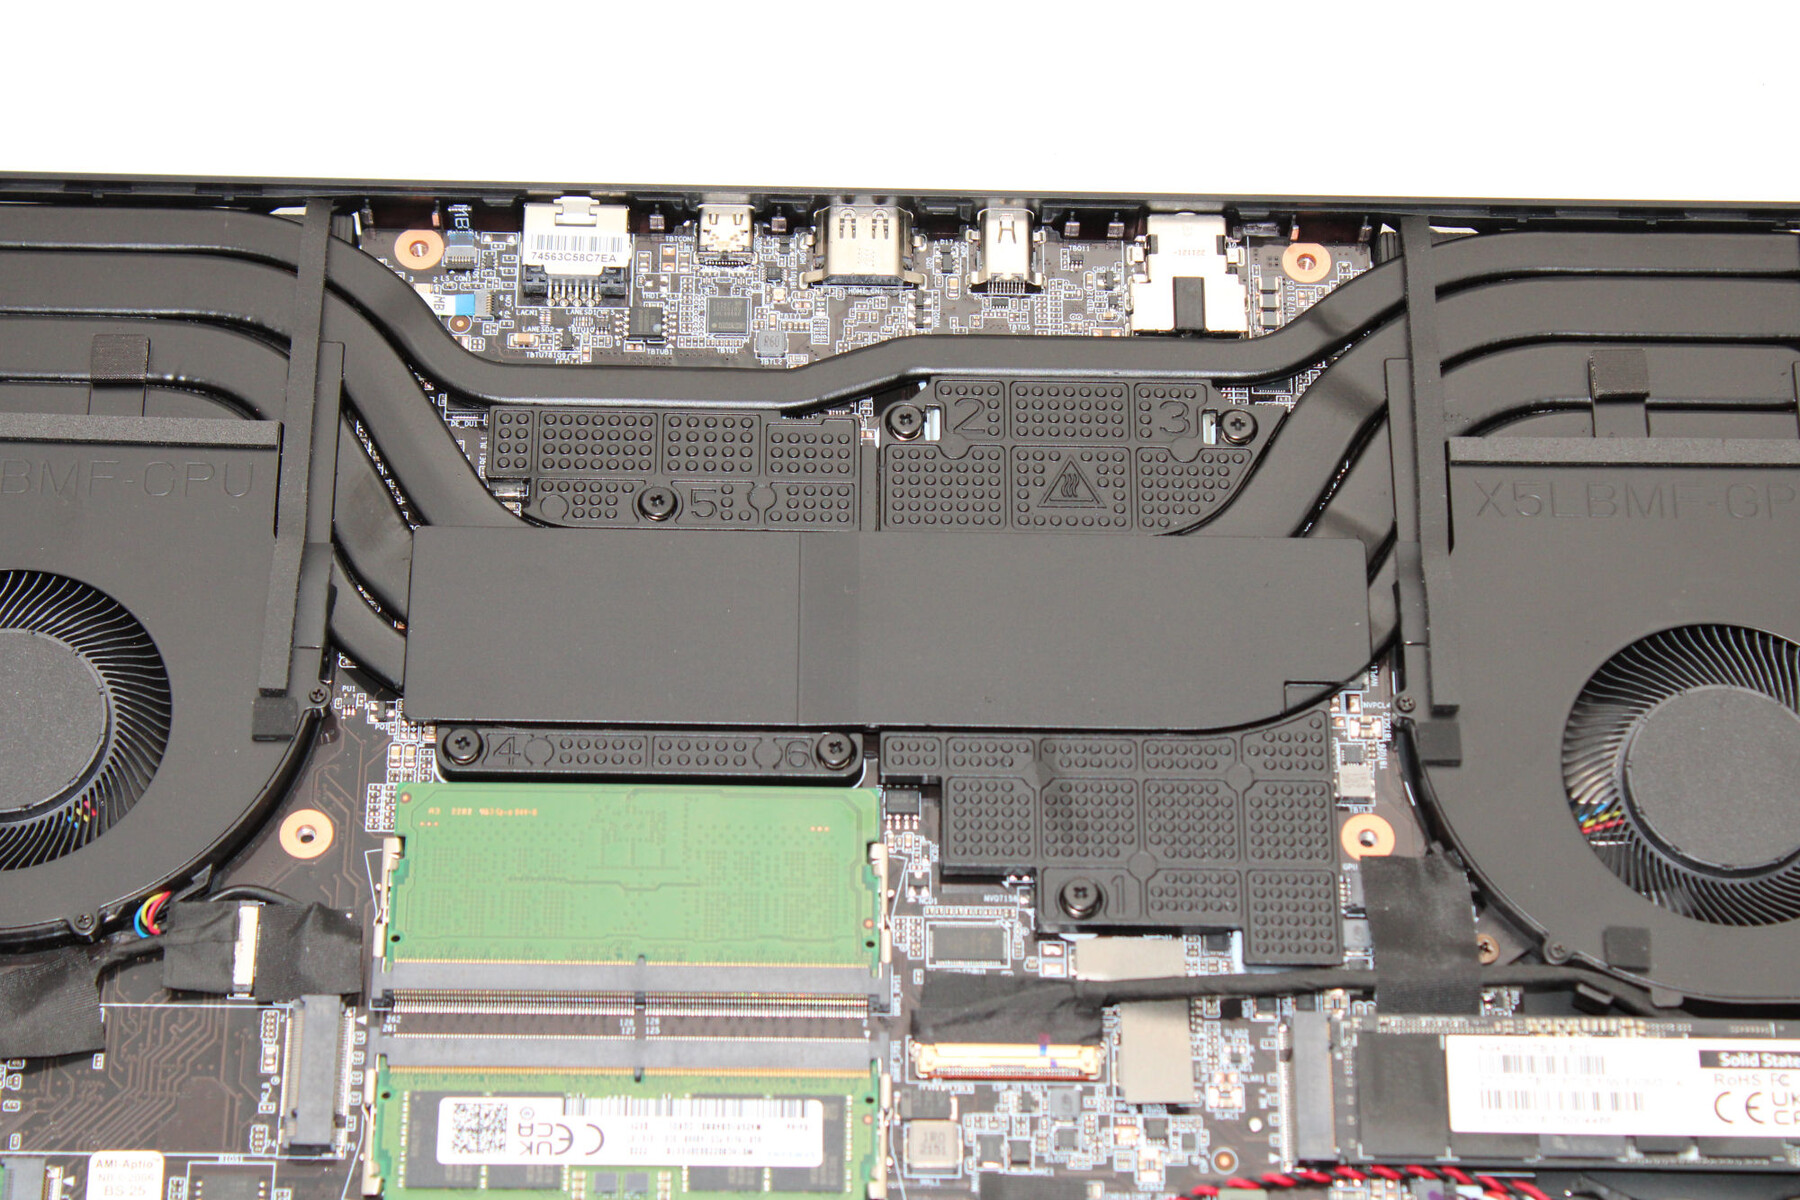
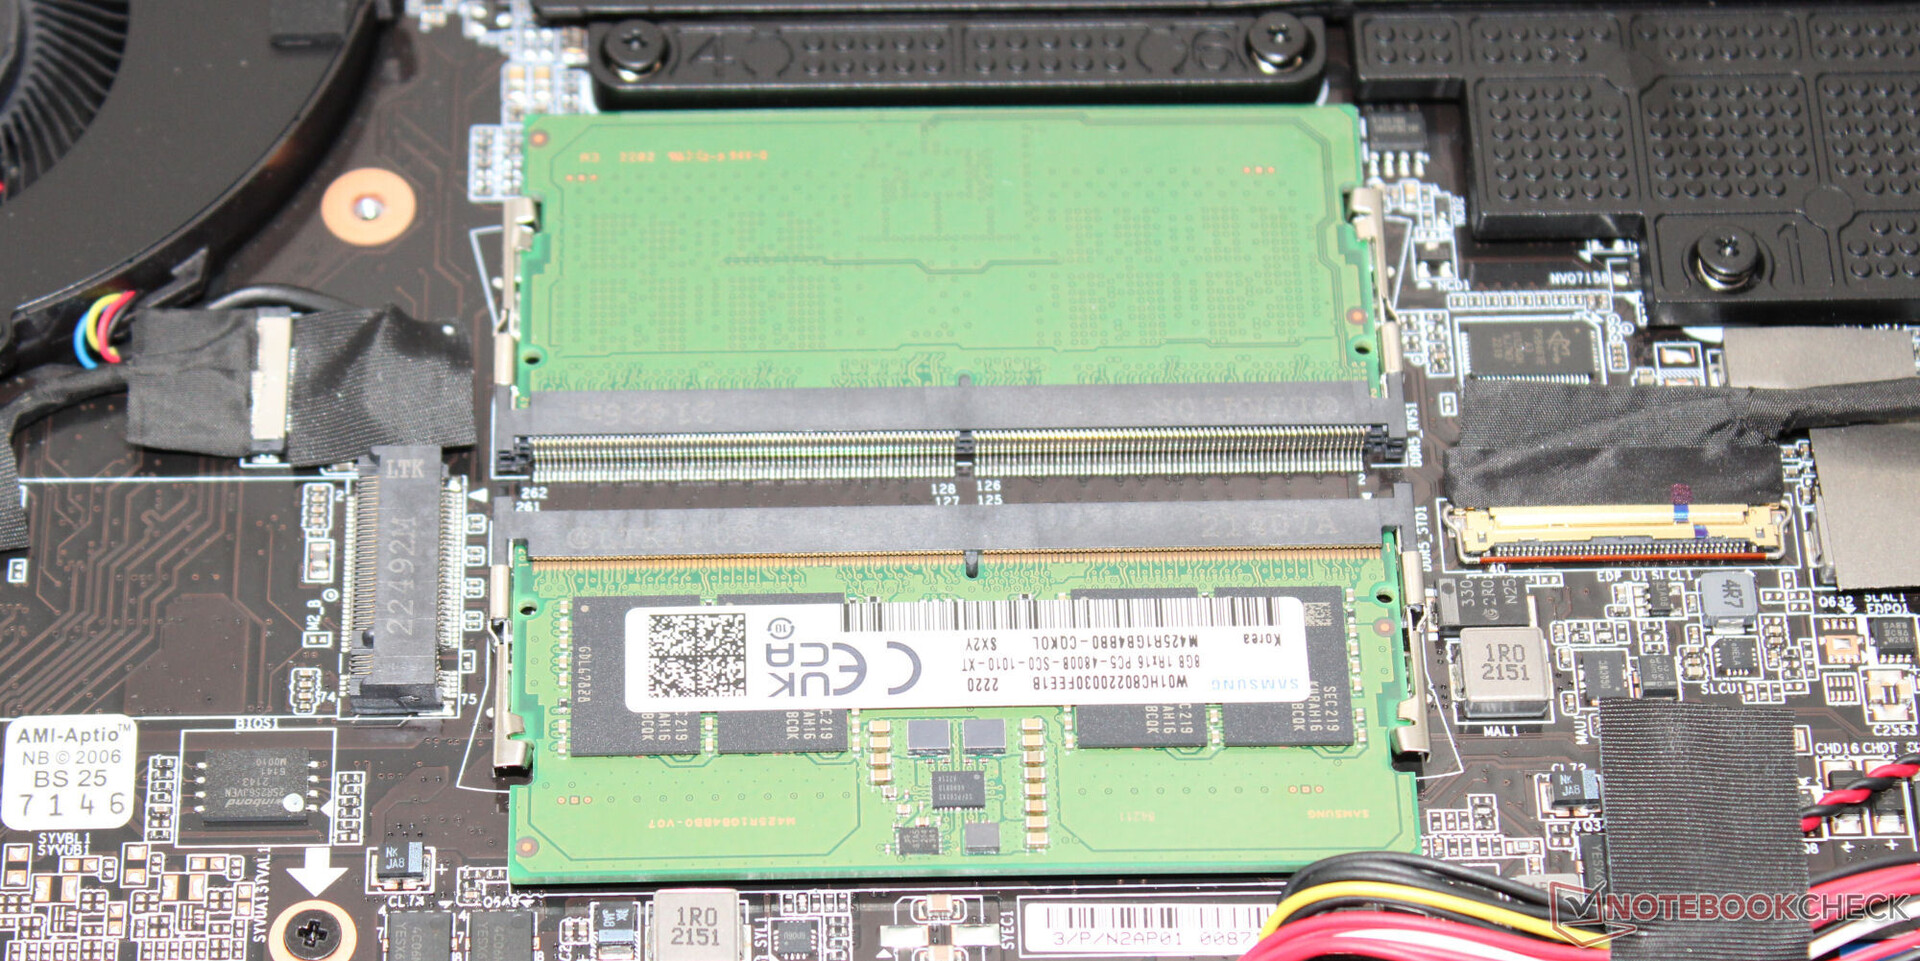
Po odkręceniu wszystkich śrubek na spodzie urządzenia, dolną część obudowy można zdjąć za pomocą szpatułki lub plectrum. Następnie można uzyskać dostęp do gniazd pamięci RAM (oba zajęte), dysku SSD (PCIe 4, M.2 2280), drugiego gniazda M.2 2280 (PCIe 4, M.2 2280), baterii BIOS, modułu WLAN, wentylatorów, głośników i baterii.
Gwarancja
15,6-calowy laptop Gigabyte objęty jest roczną gwarancją. Nie ma możliwości jej przedłużenia.
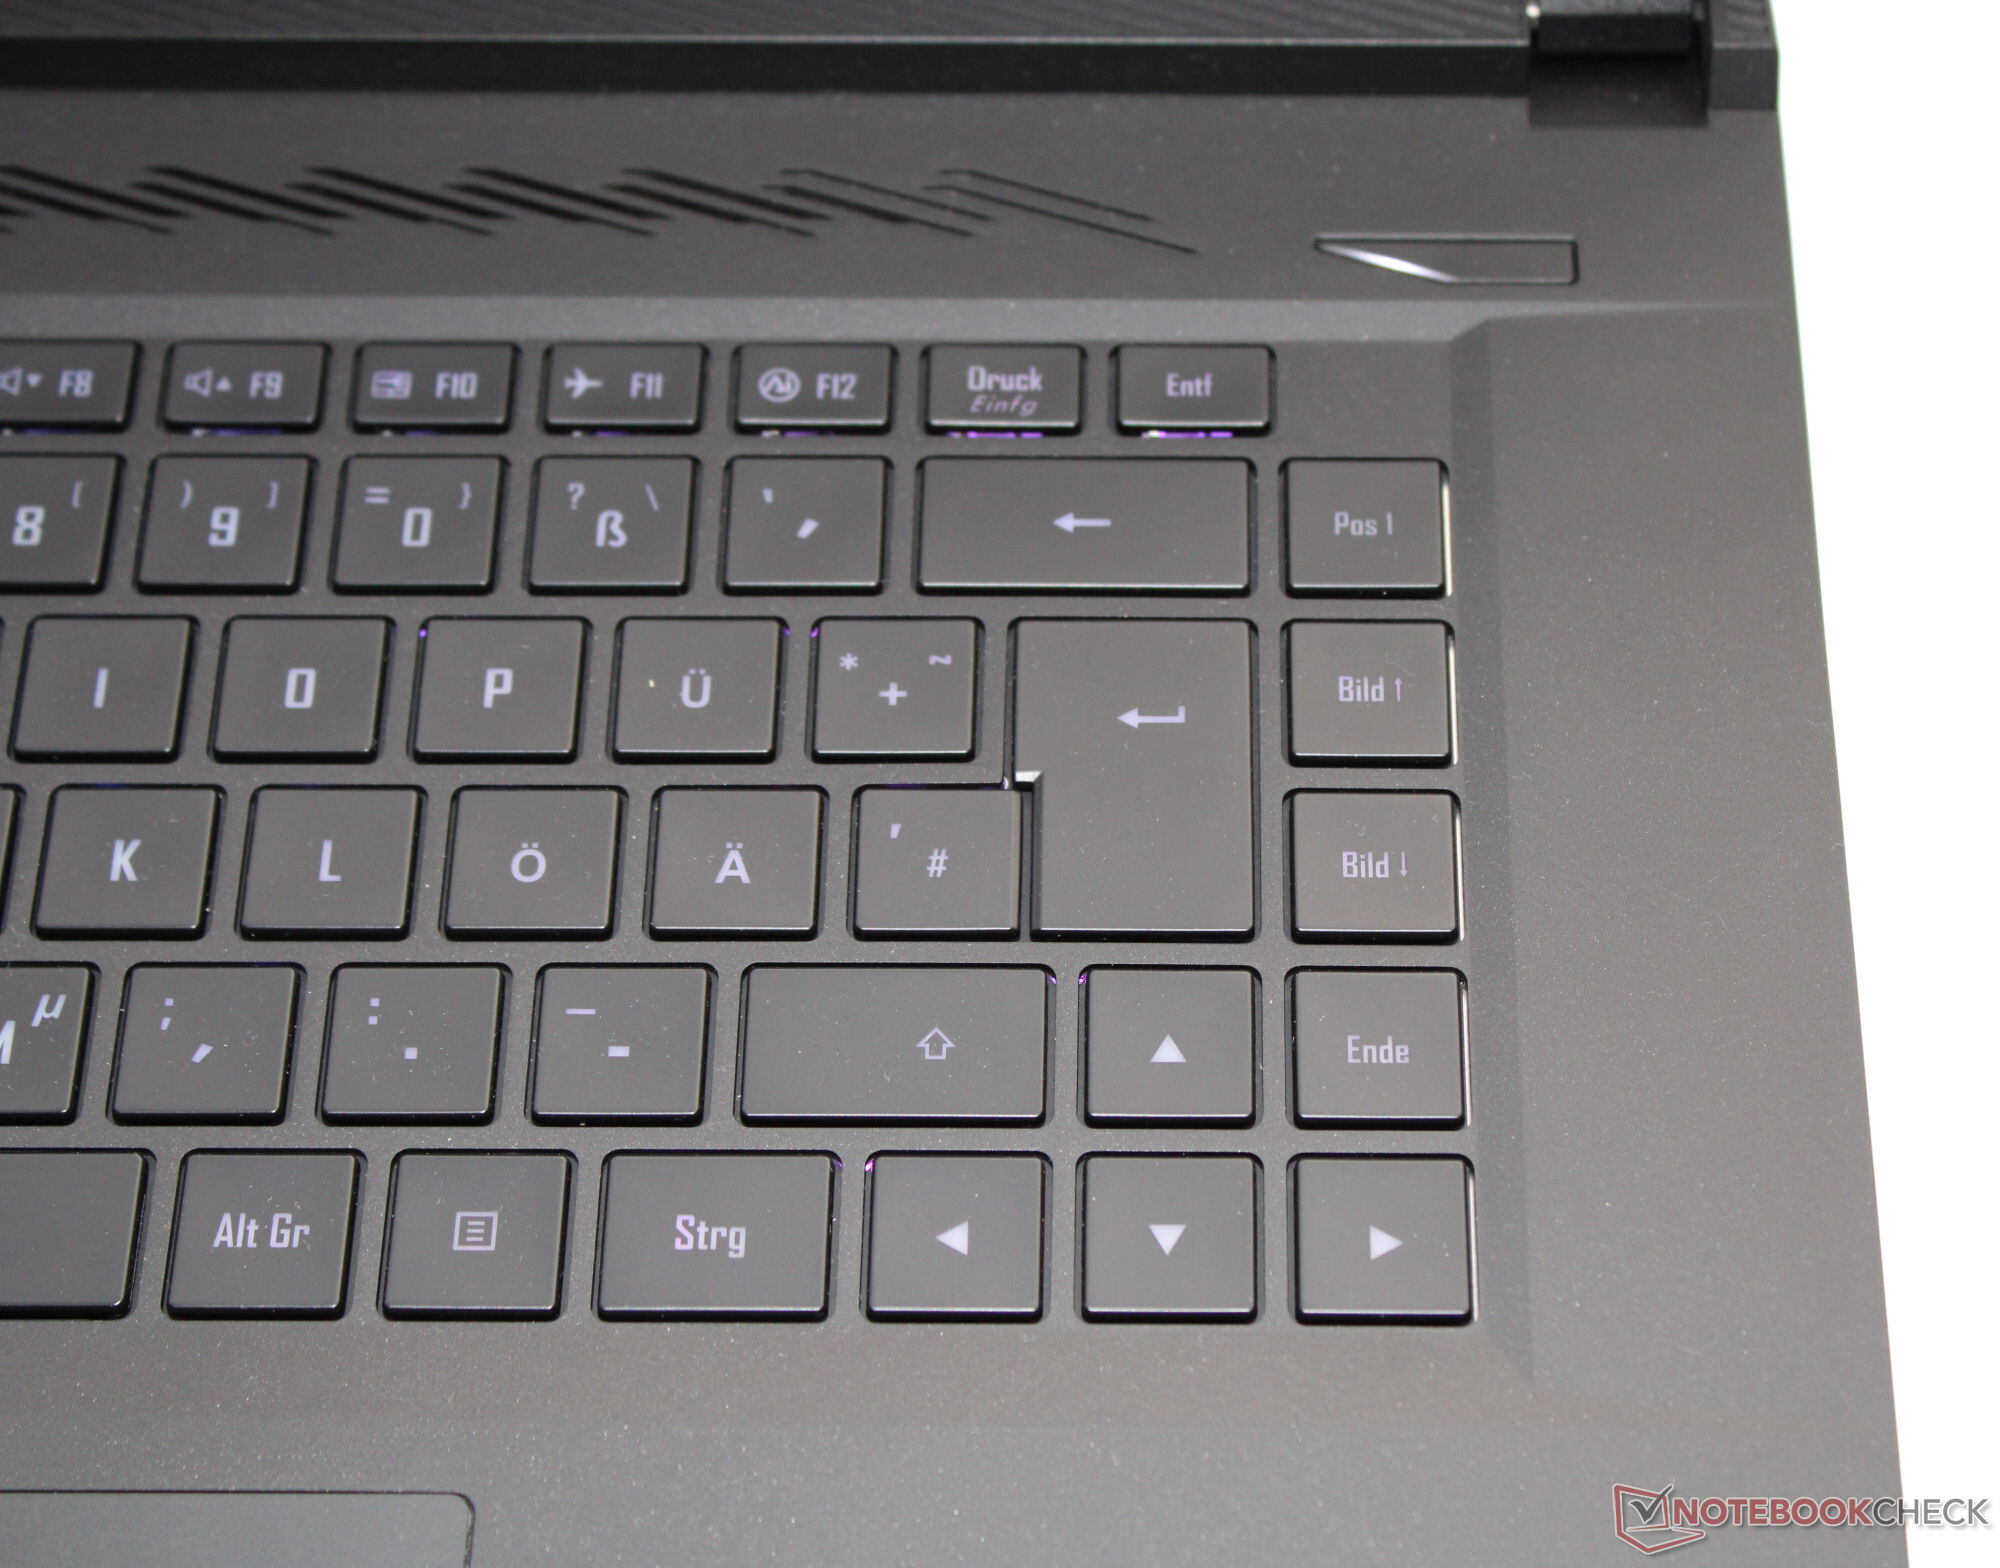
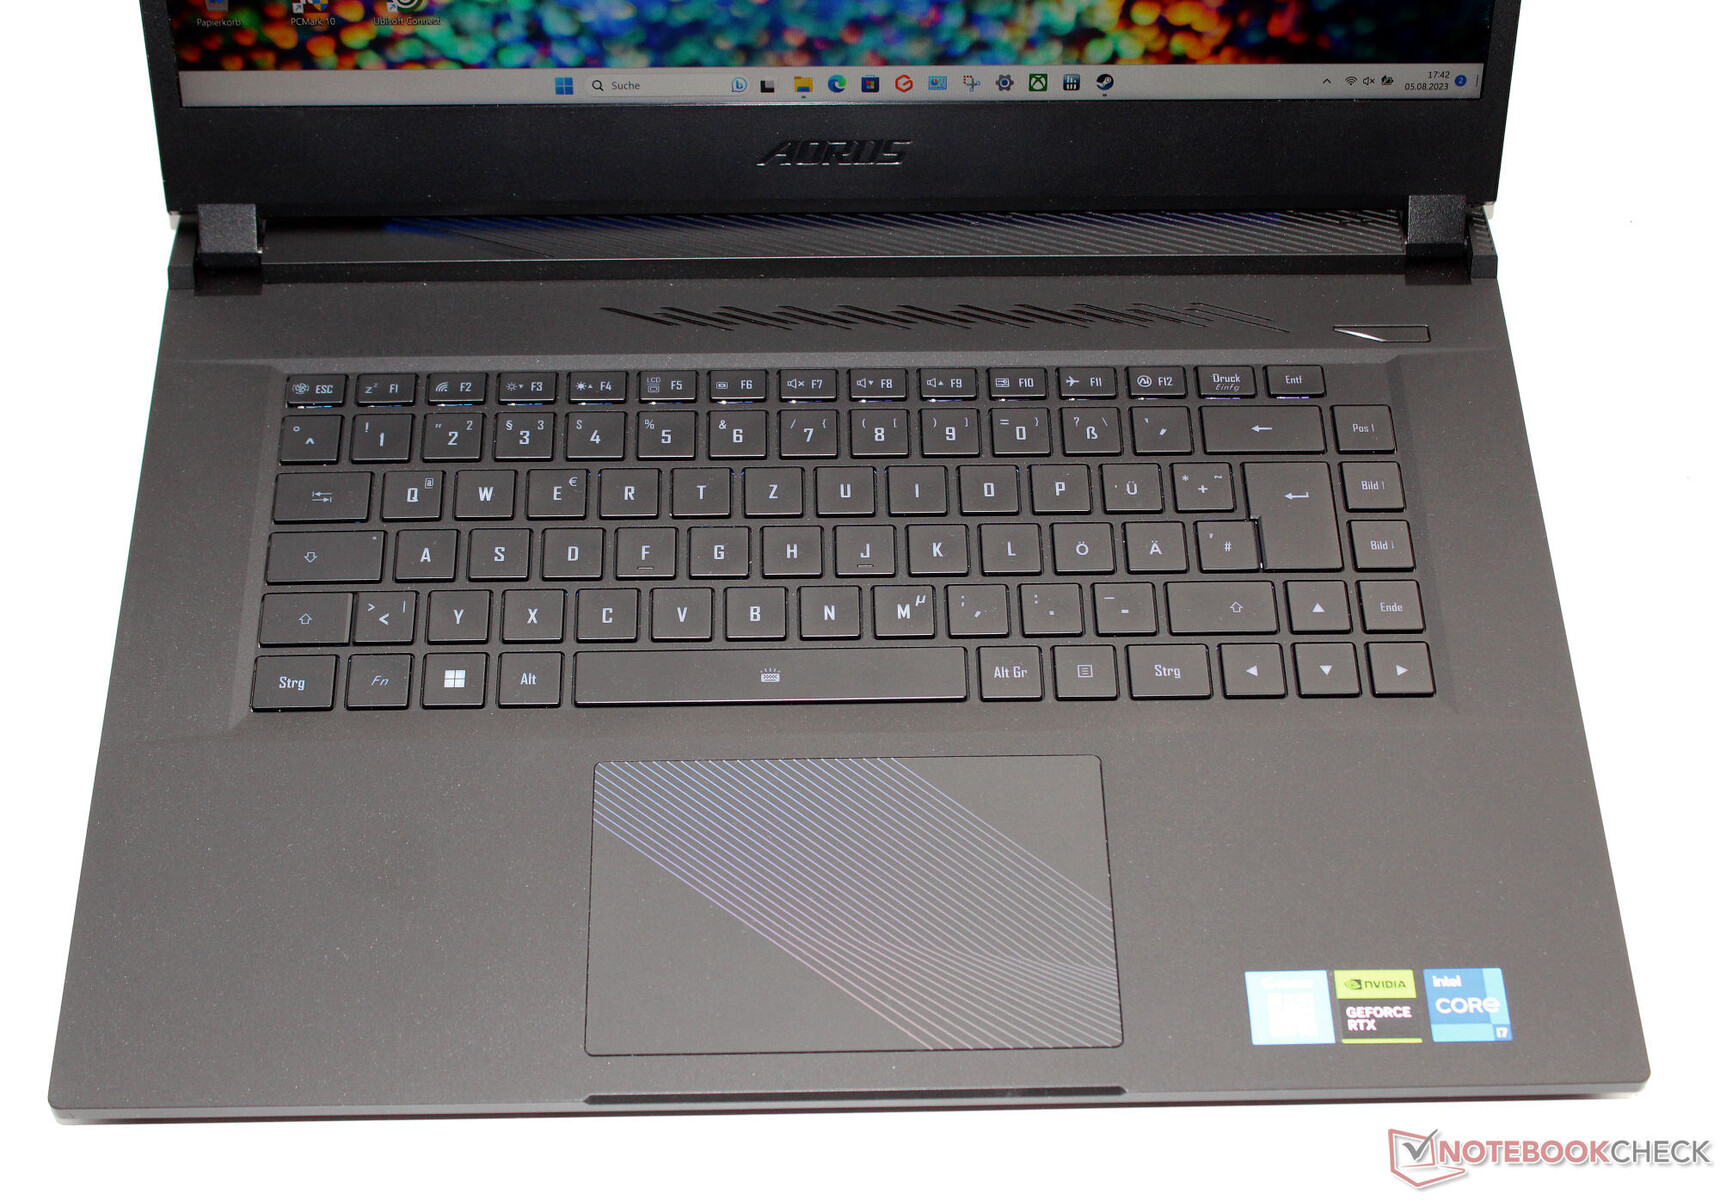
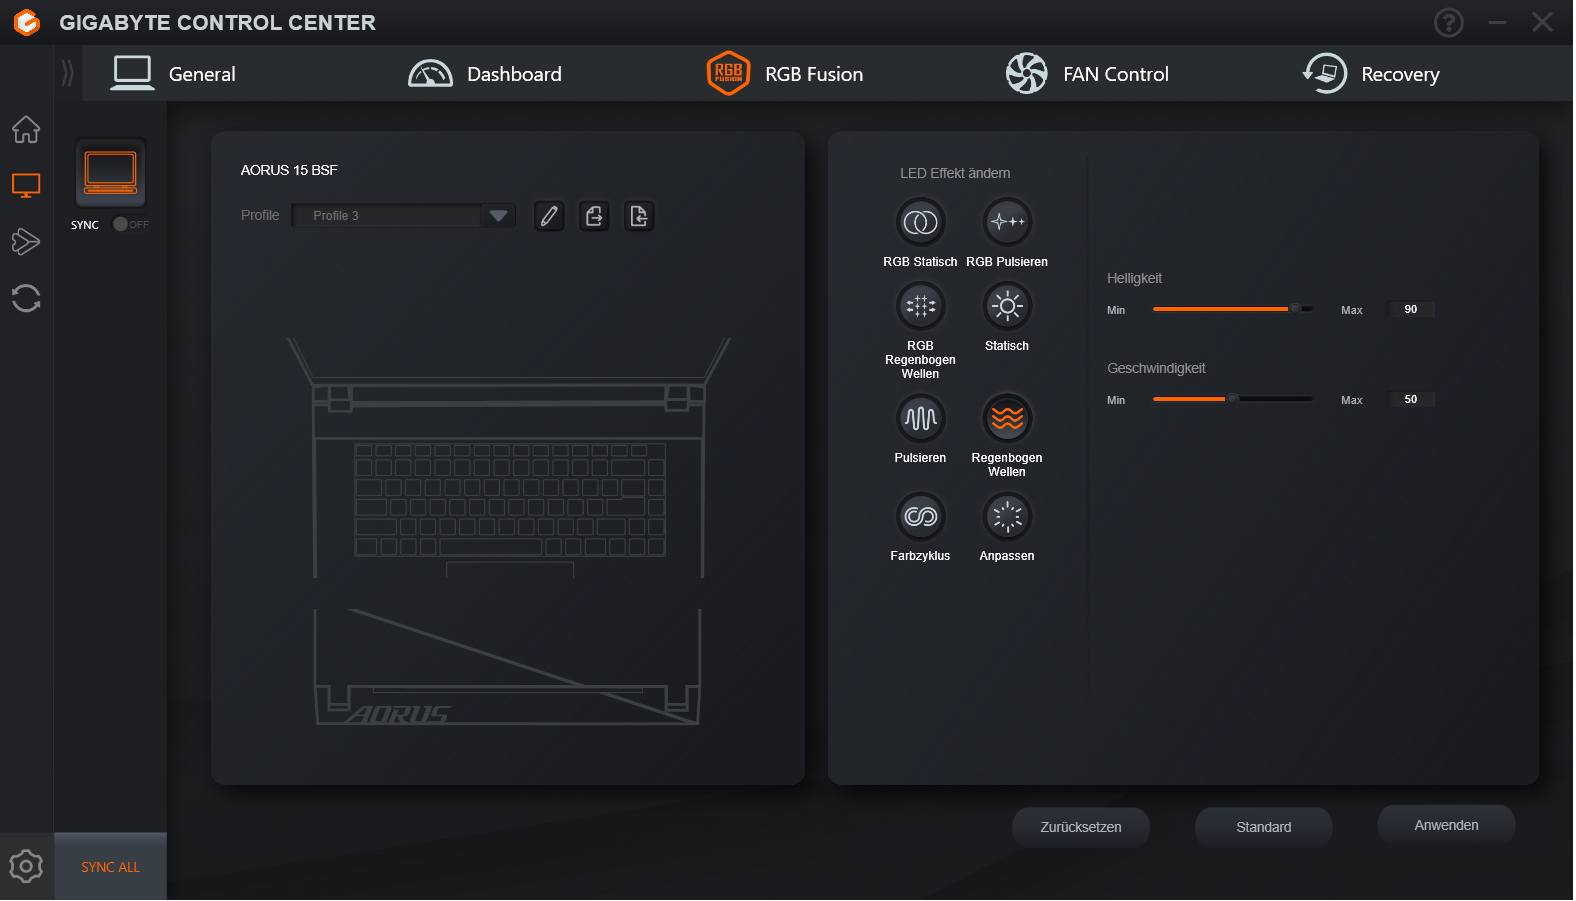
Urządzenia wejściowe - Laptop do gier z podświetleniem RGB
Klawiatura
Gładkie klawisze podświetlanej klawiatury typu chiclet mają średni skok i wyraźny punkt nacisku. Opór klawiszy jest w porządku - podczas pisania mają one niewielki luz, ale nie powinno to być zbyt irytujące. Pozytywne: Wszystkie cztery klawisze strzałek mają regularny rozmiar. Podsumowując, jest to dobra klawiatura do codziennego użytku.
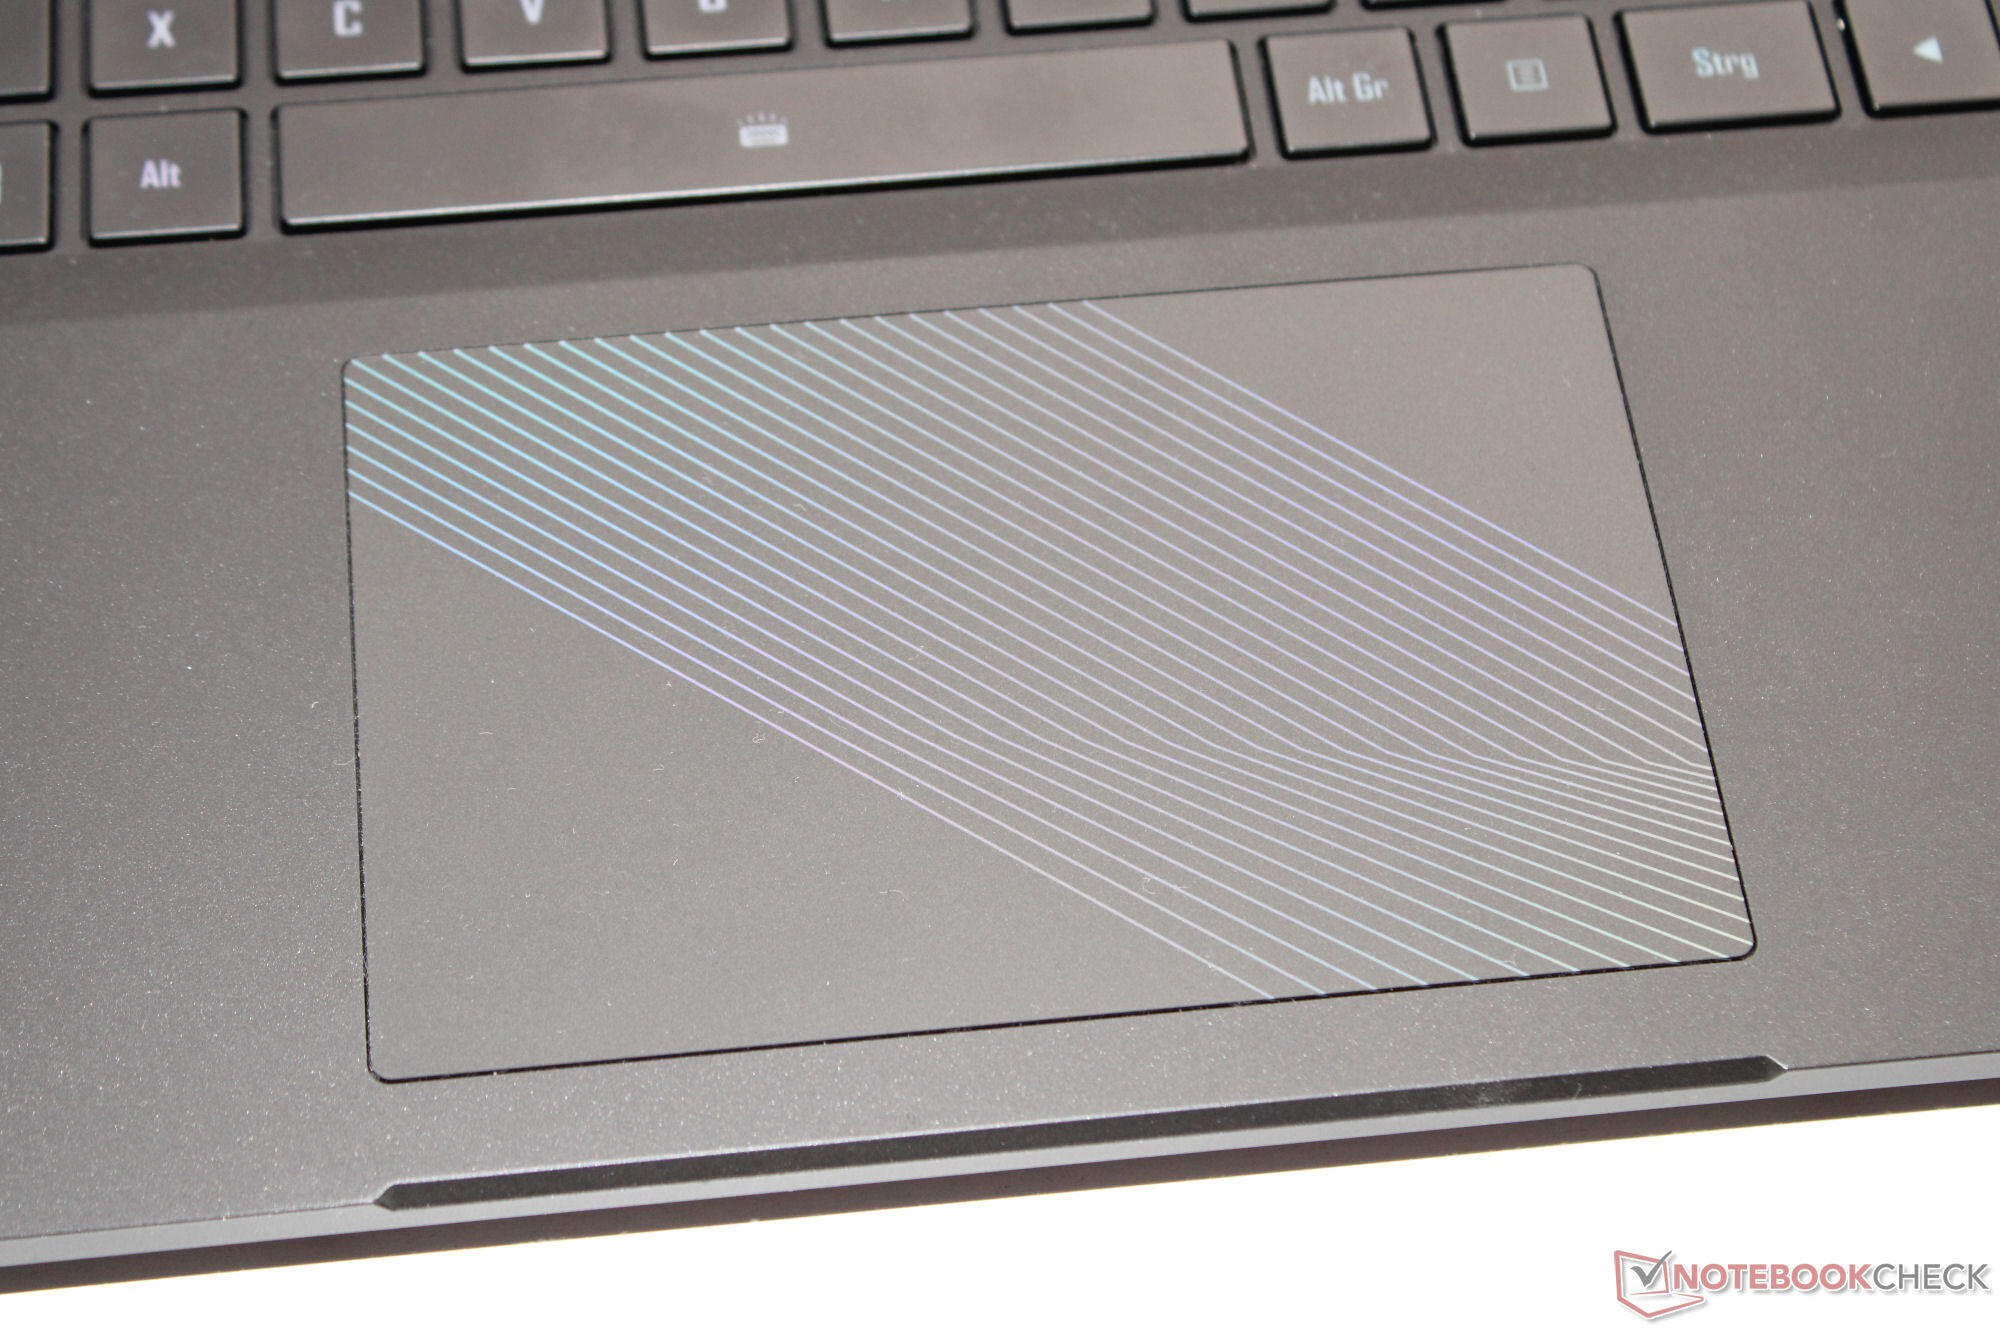
Touchpad
Podkładka pod kliknięcia (12,1 x 7,6 cm) działa jak zamiennik myszy, a palce przyjemnie przesuwają się po jej gładkiej powierzchni. Ma krótki skok i wyraźny punkt nacisku.
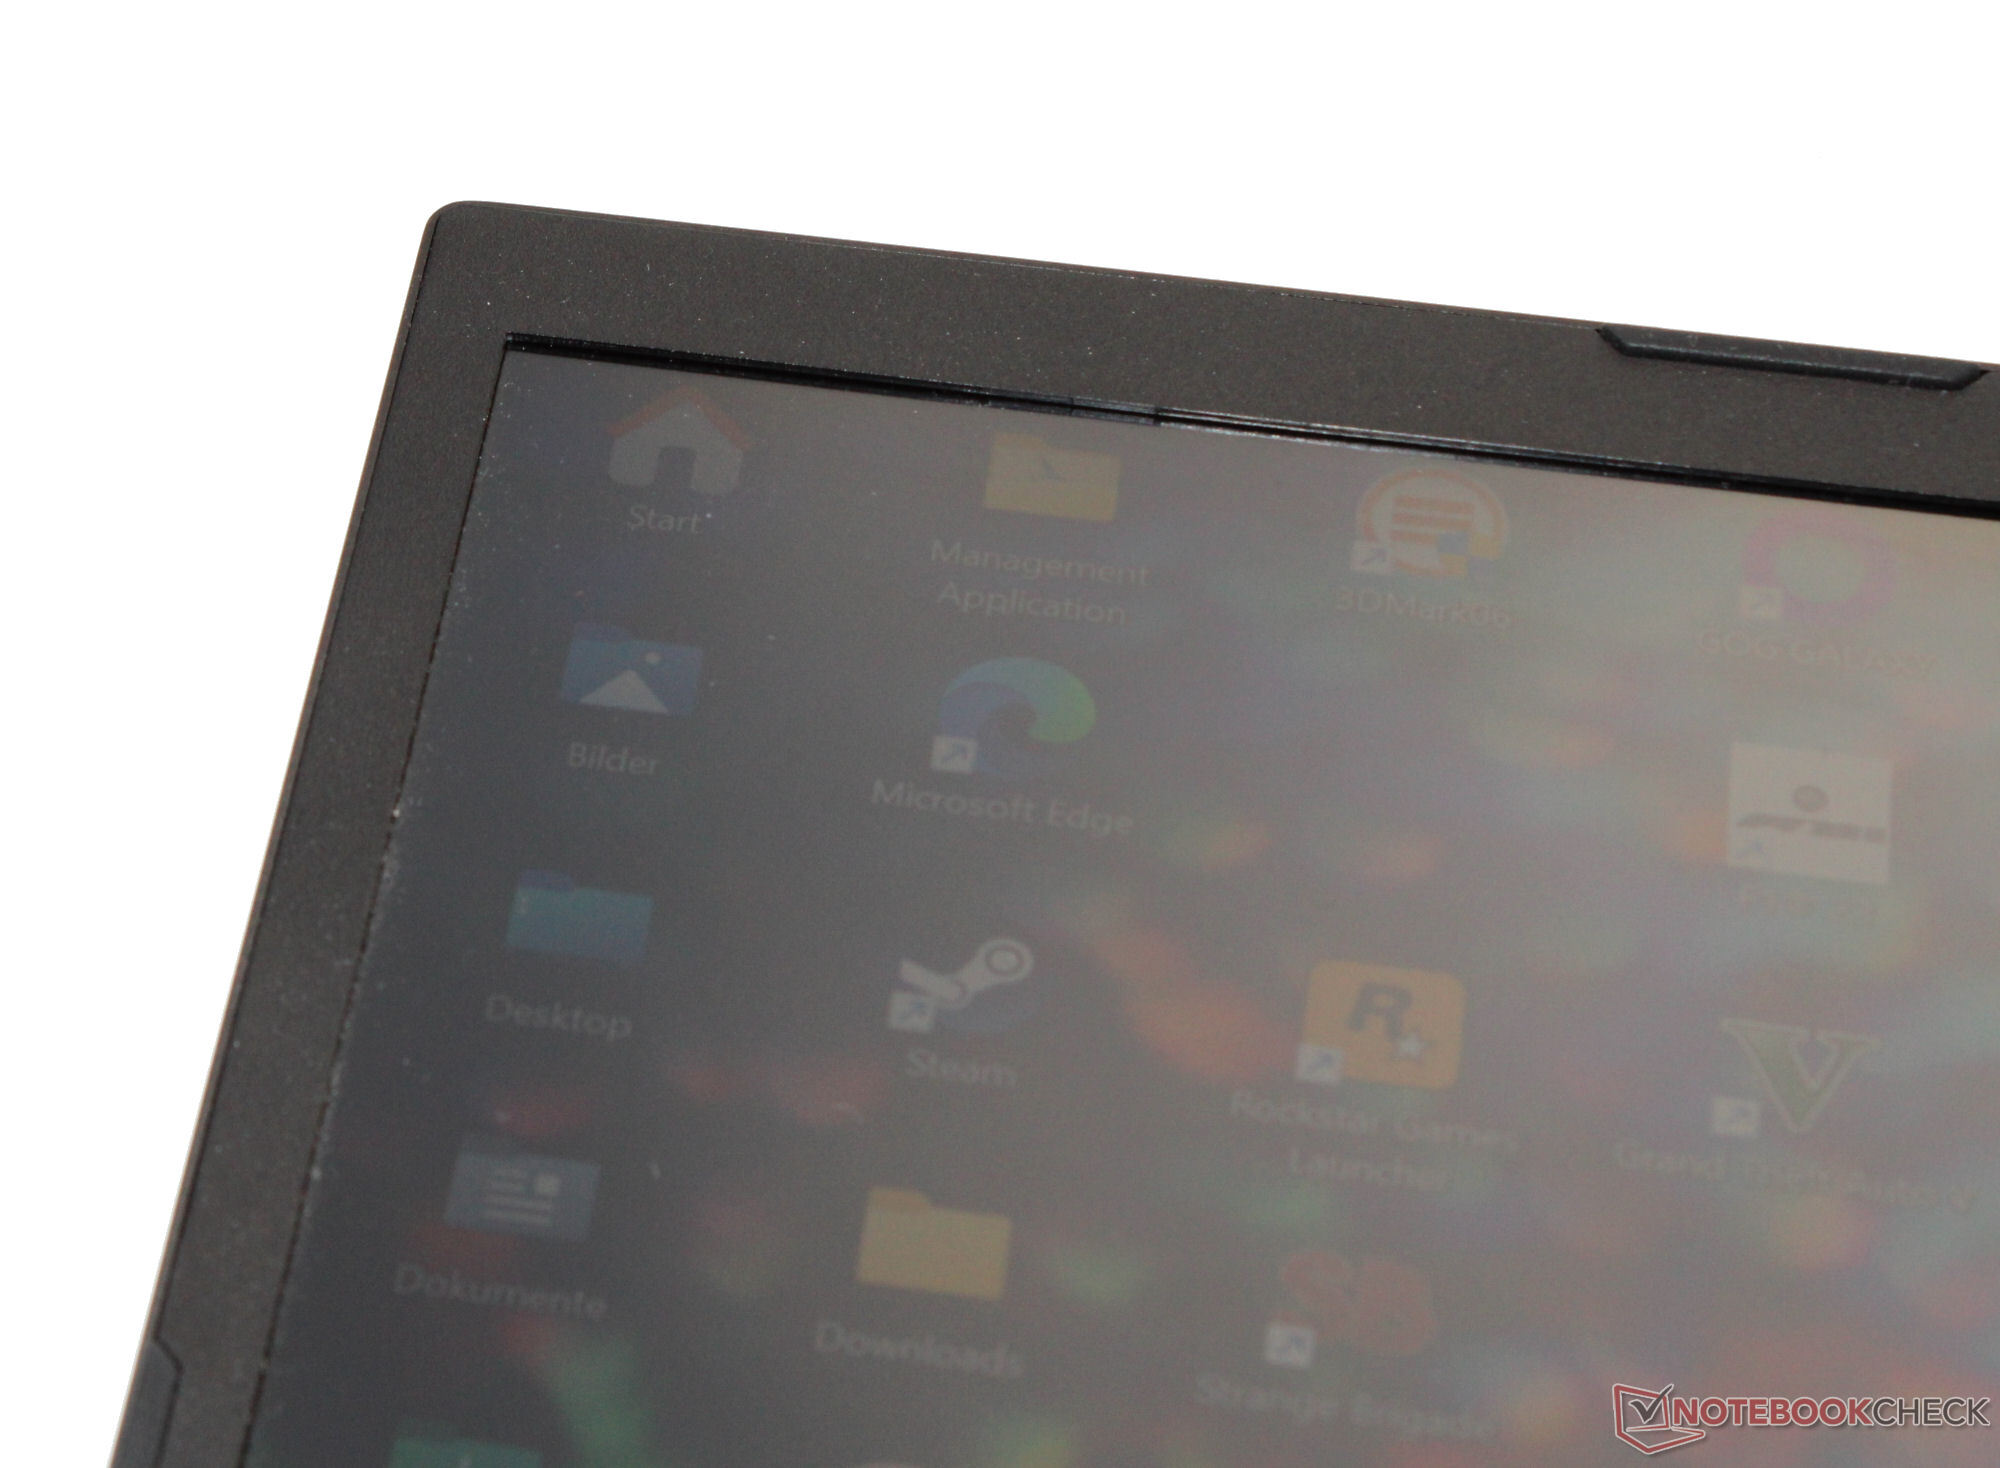
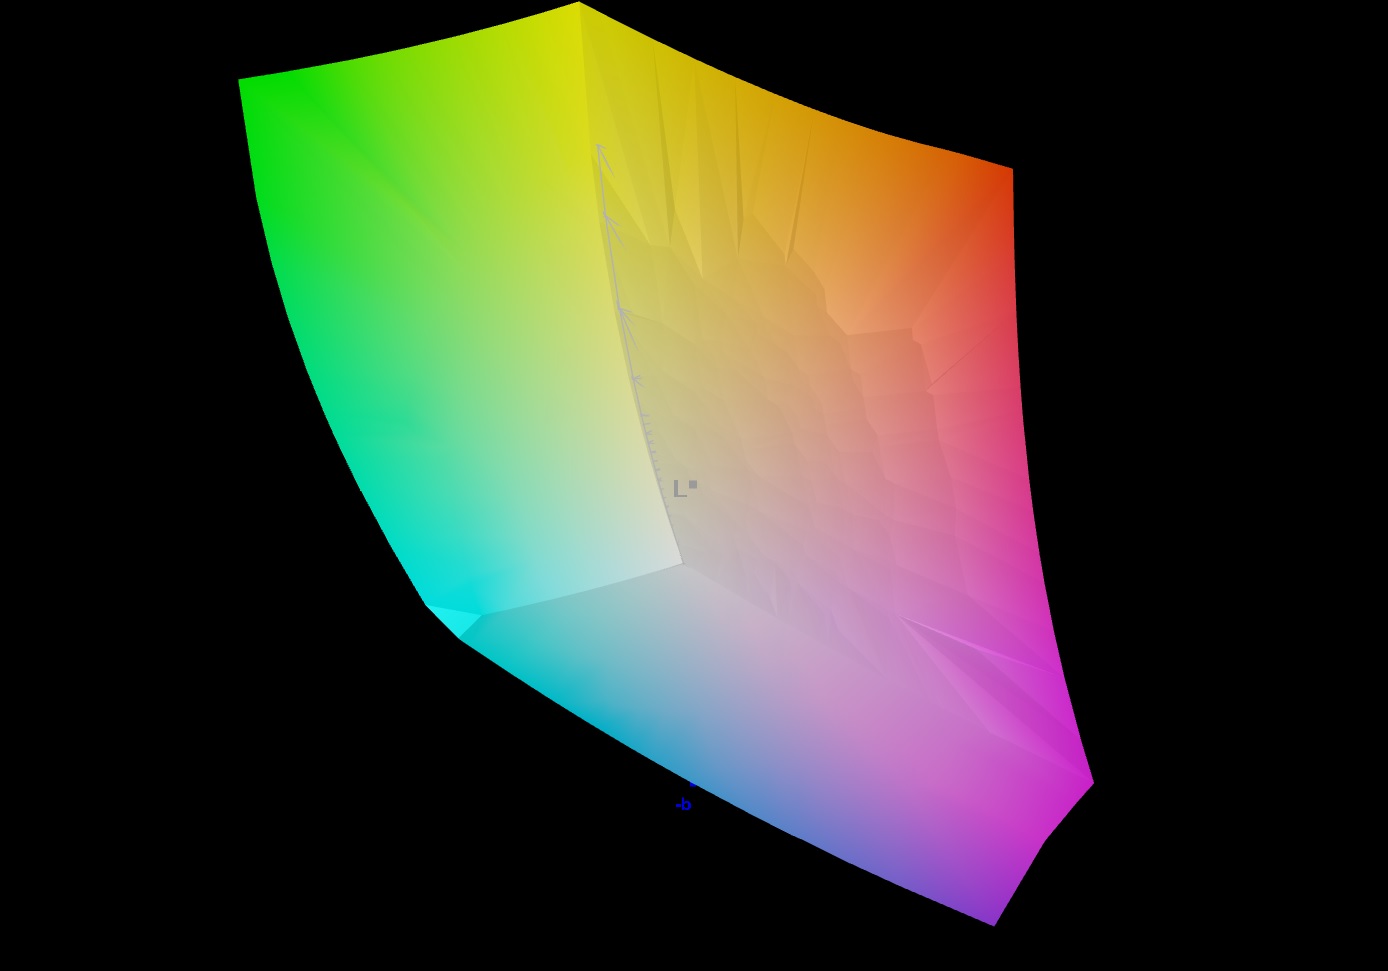
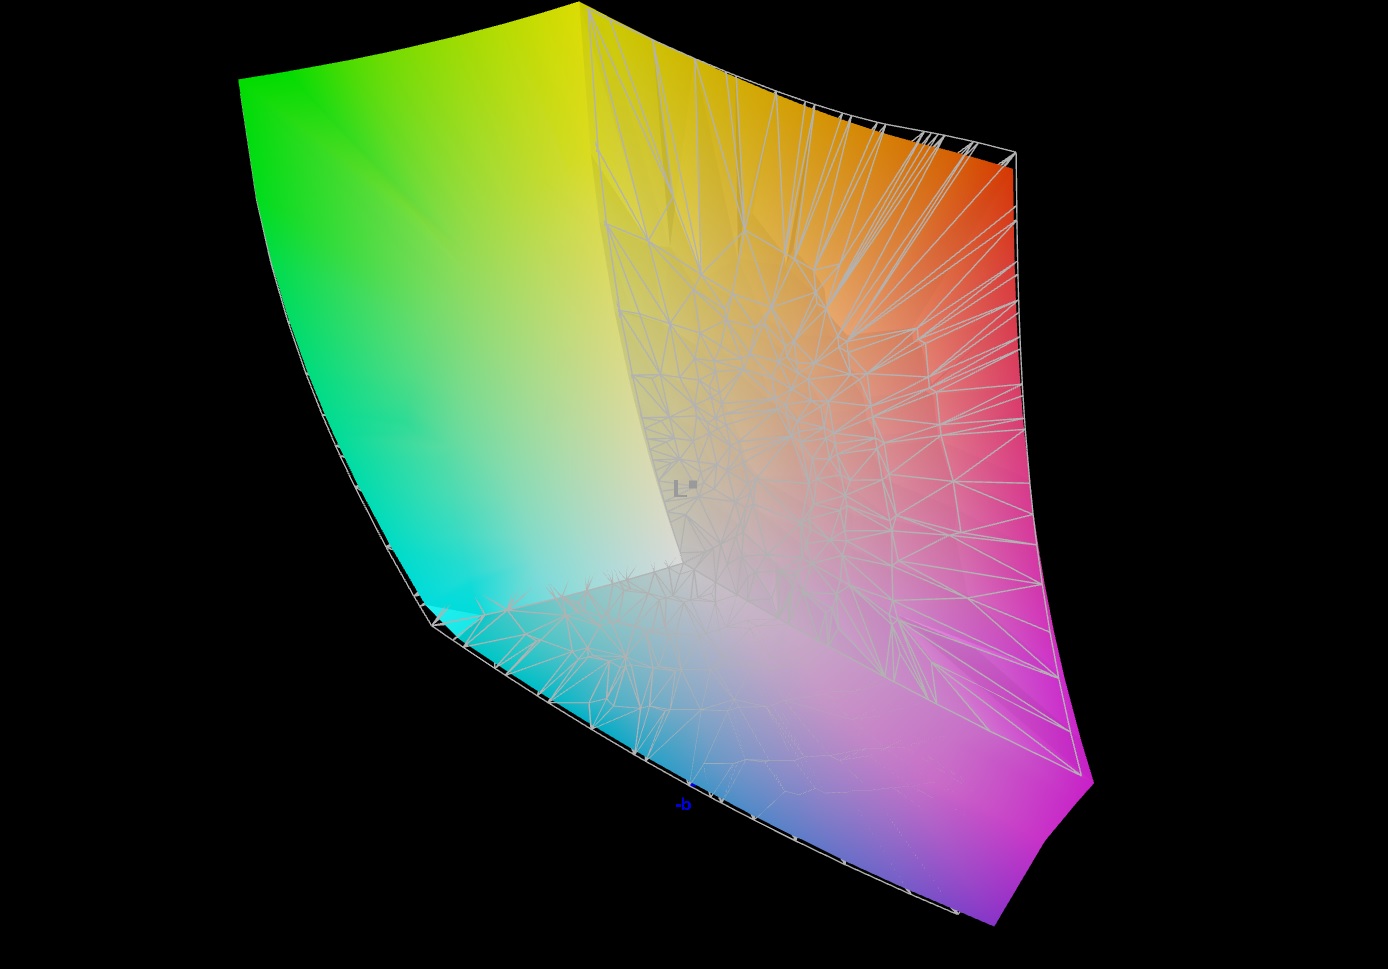
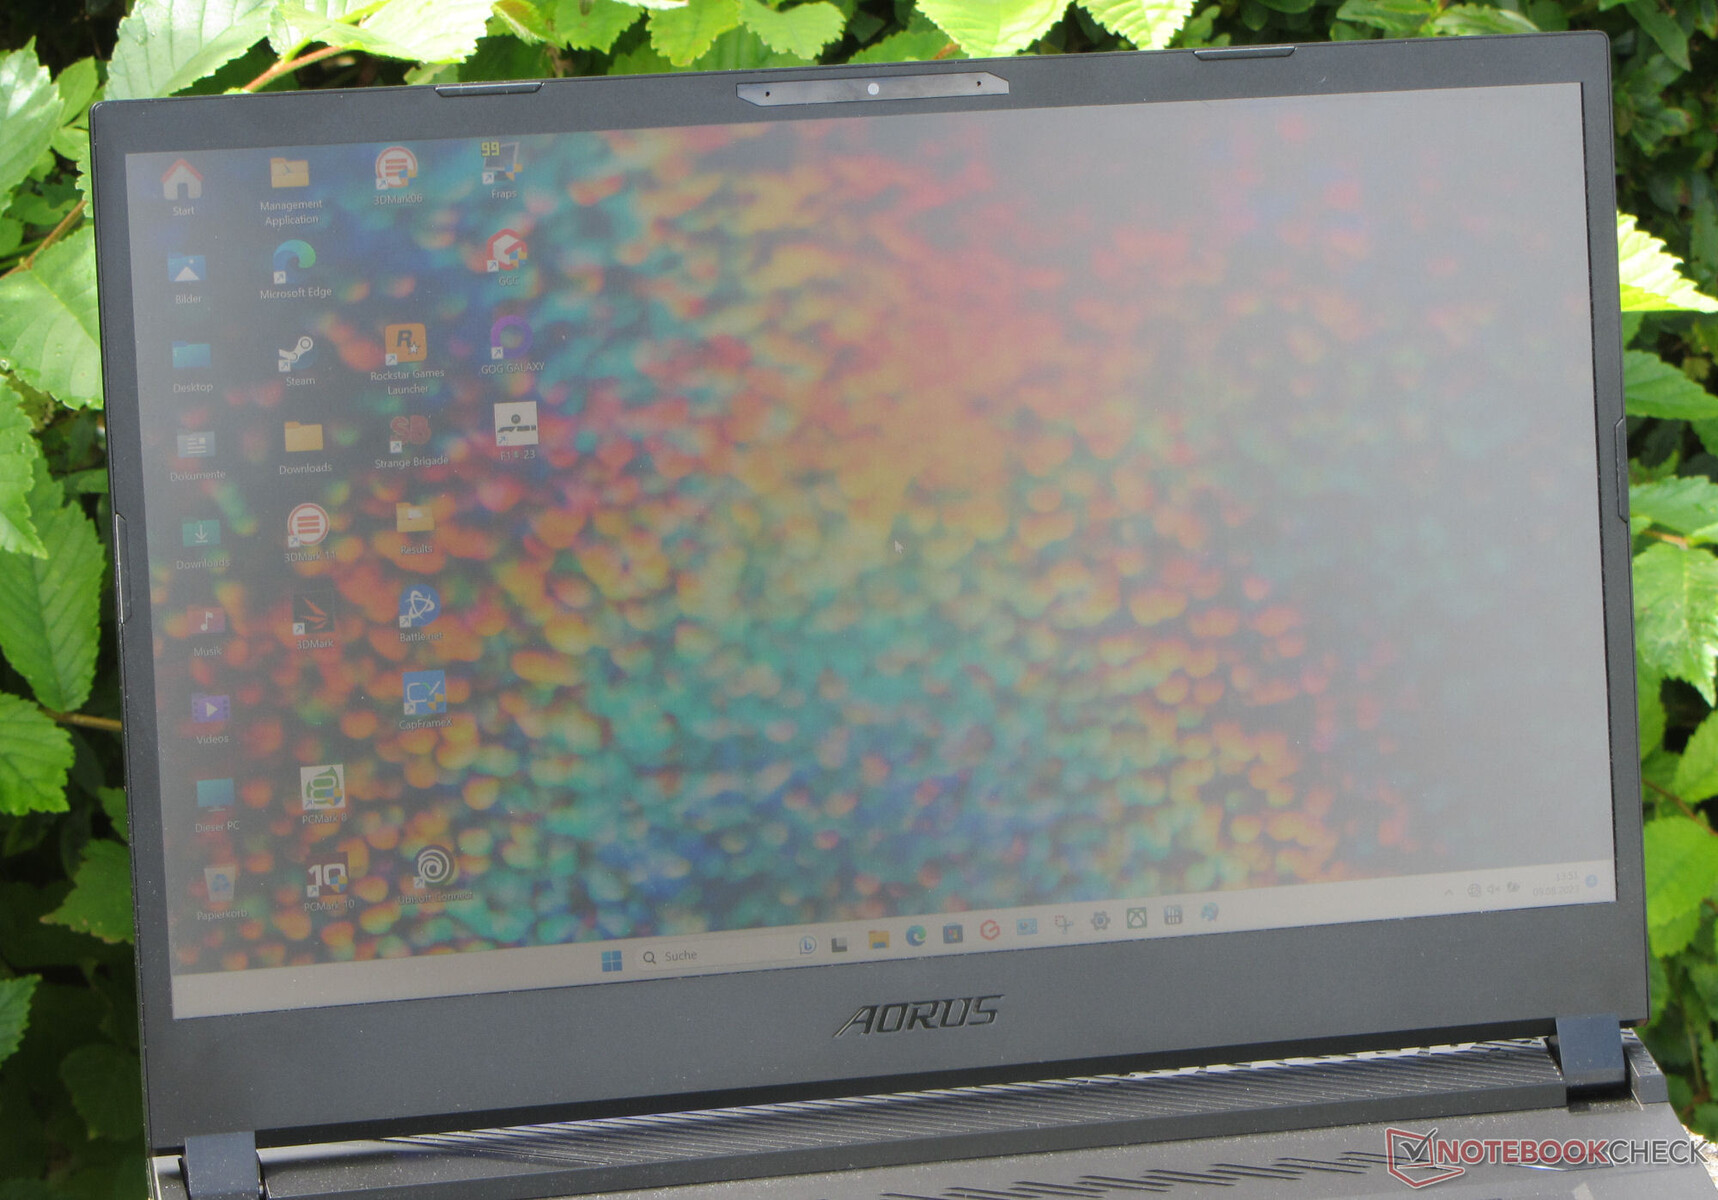
Wyświetlacz - panel QHD z pokryciem DCI-P3
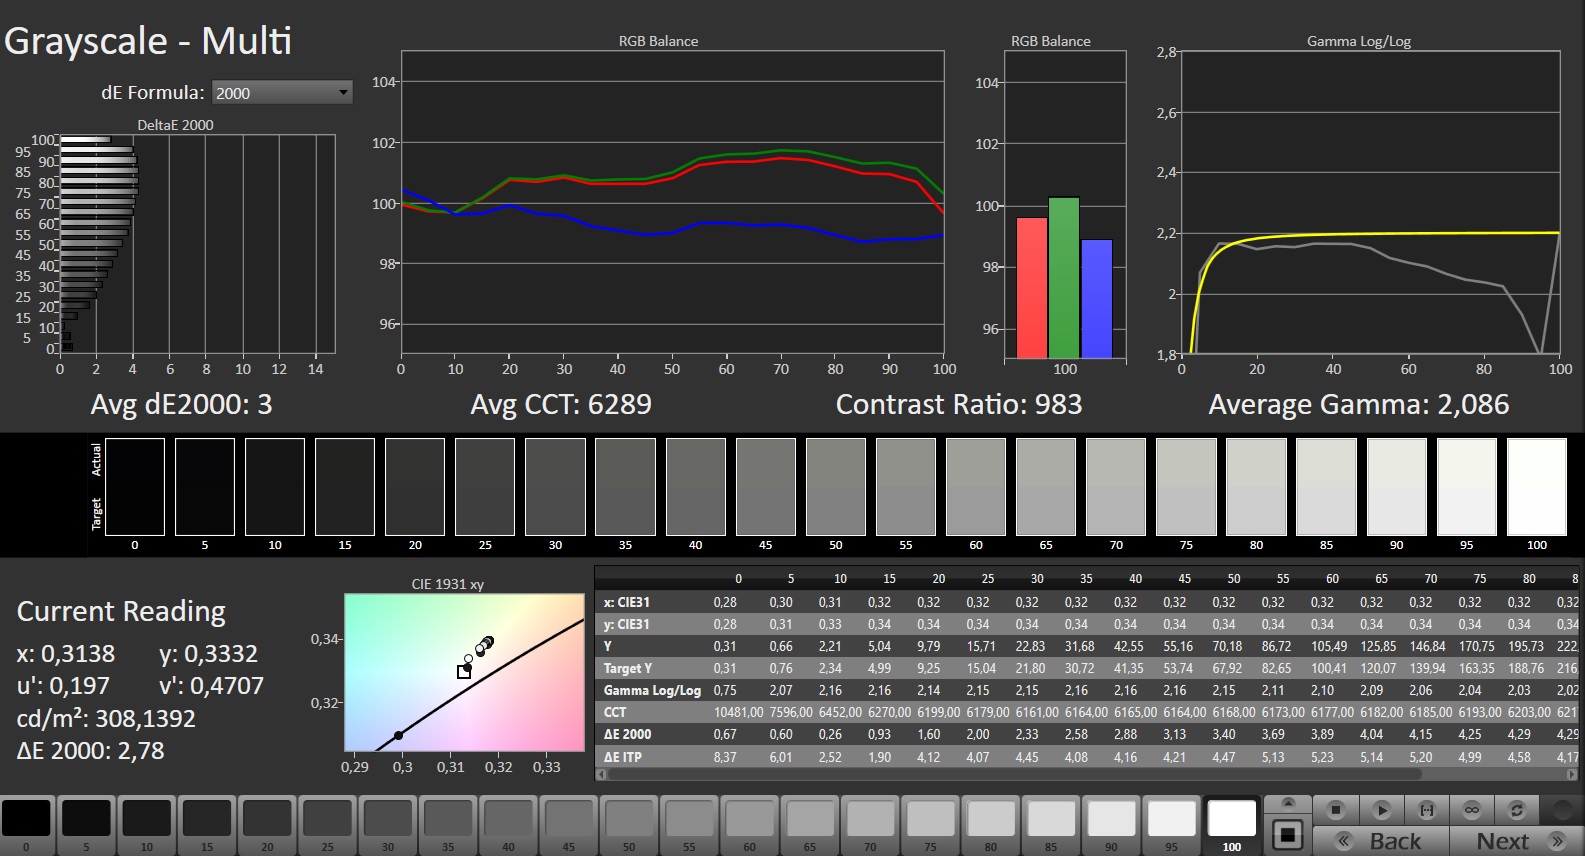
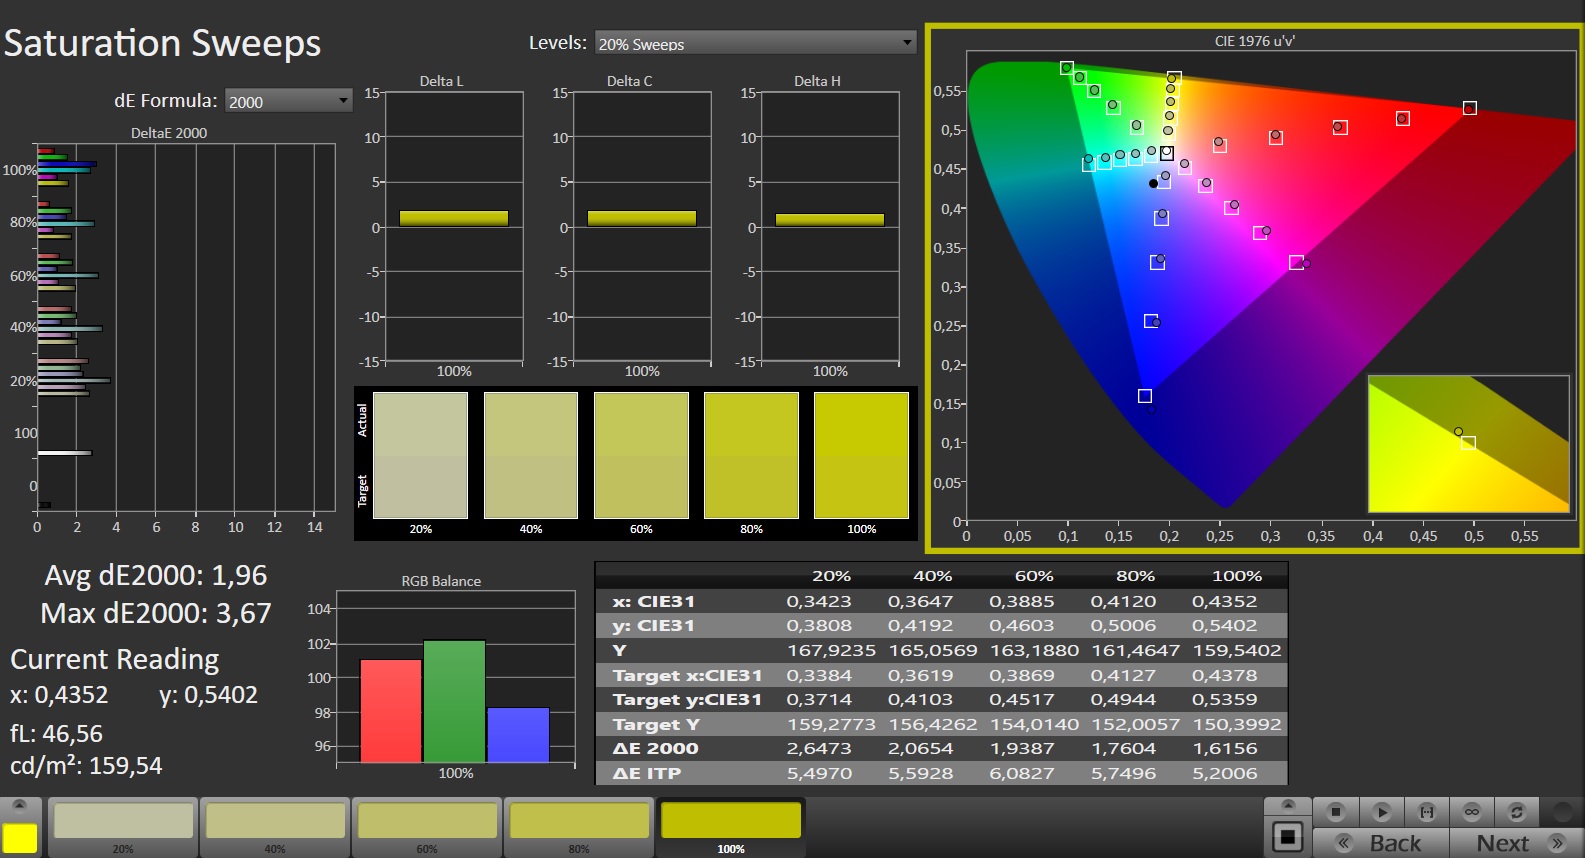
Szybko reagujący ekran 165-Hz zdobywa punkty dzięki matowej powierzchni i braku migotania PWM. 15,6-calowy wyświetlacz (2560 x 1440 pikseli, IPS), który ma proporcje 16:9, osiągnął poziomy jasności i kontrastu, które nie spełniły ich odpowiednich celów (> 300 cd/m² i 1.000:1).
| |||||||||||||||||||||||||
rozświetlenie: 82 %
na akumulatorze: 299 cd/m²
kontrast: 965:1 (czerń: 0.31 cd/m²)
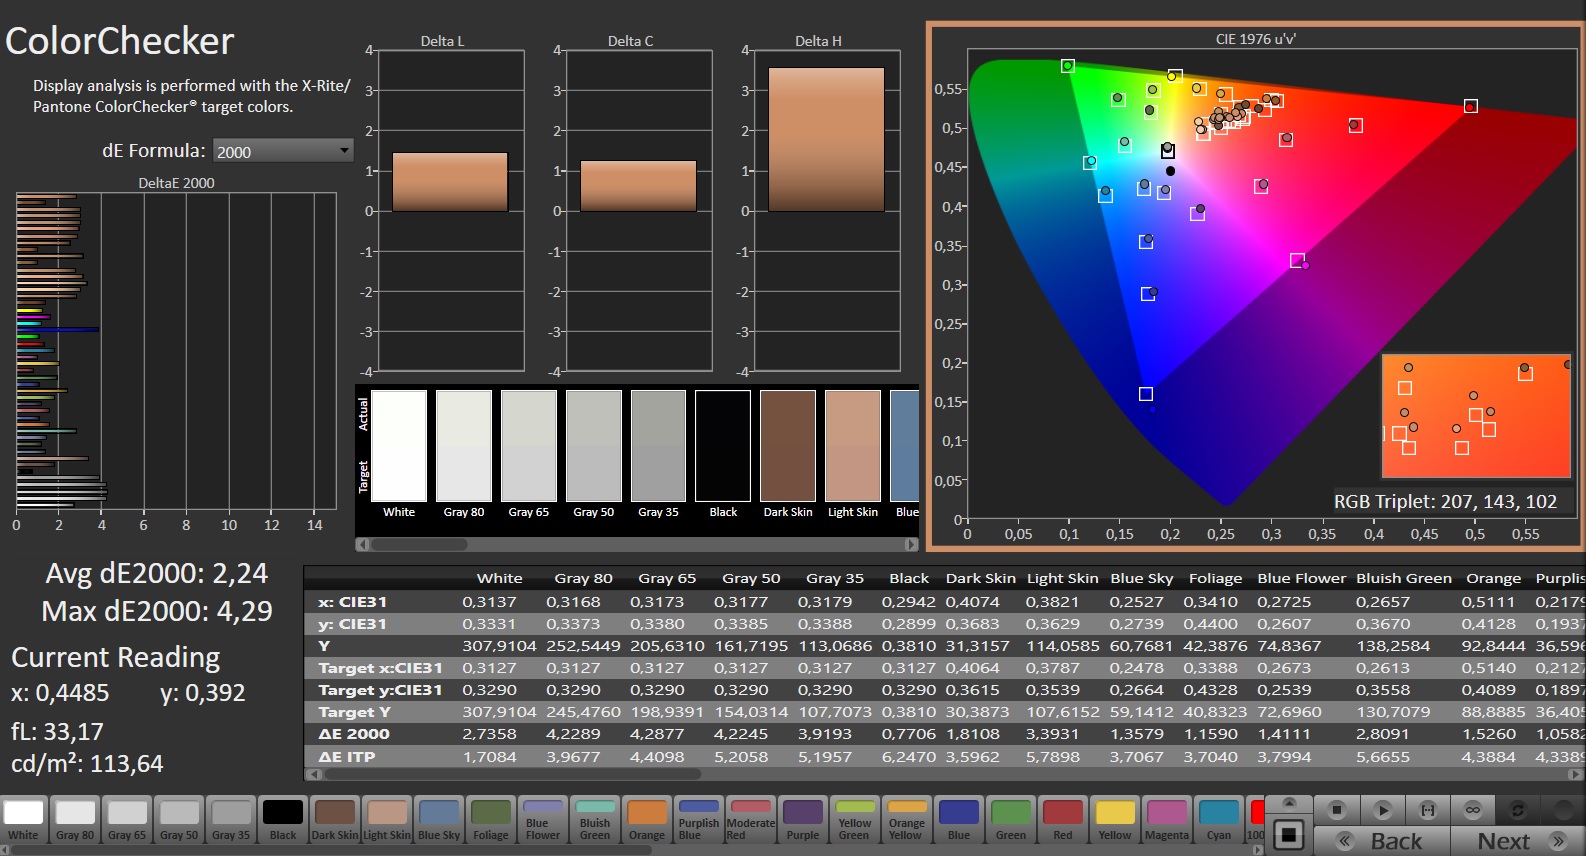
ΔE ColorChecker Calman: 2.24 | ∀{0.5-29.43 Ø4.72}
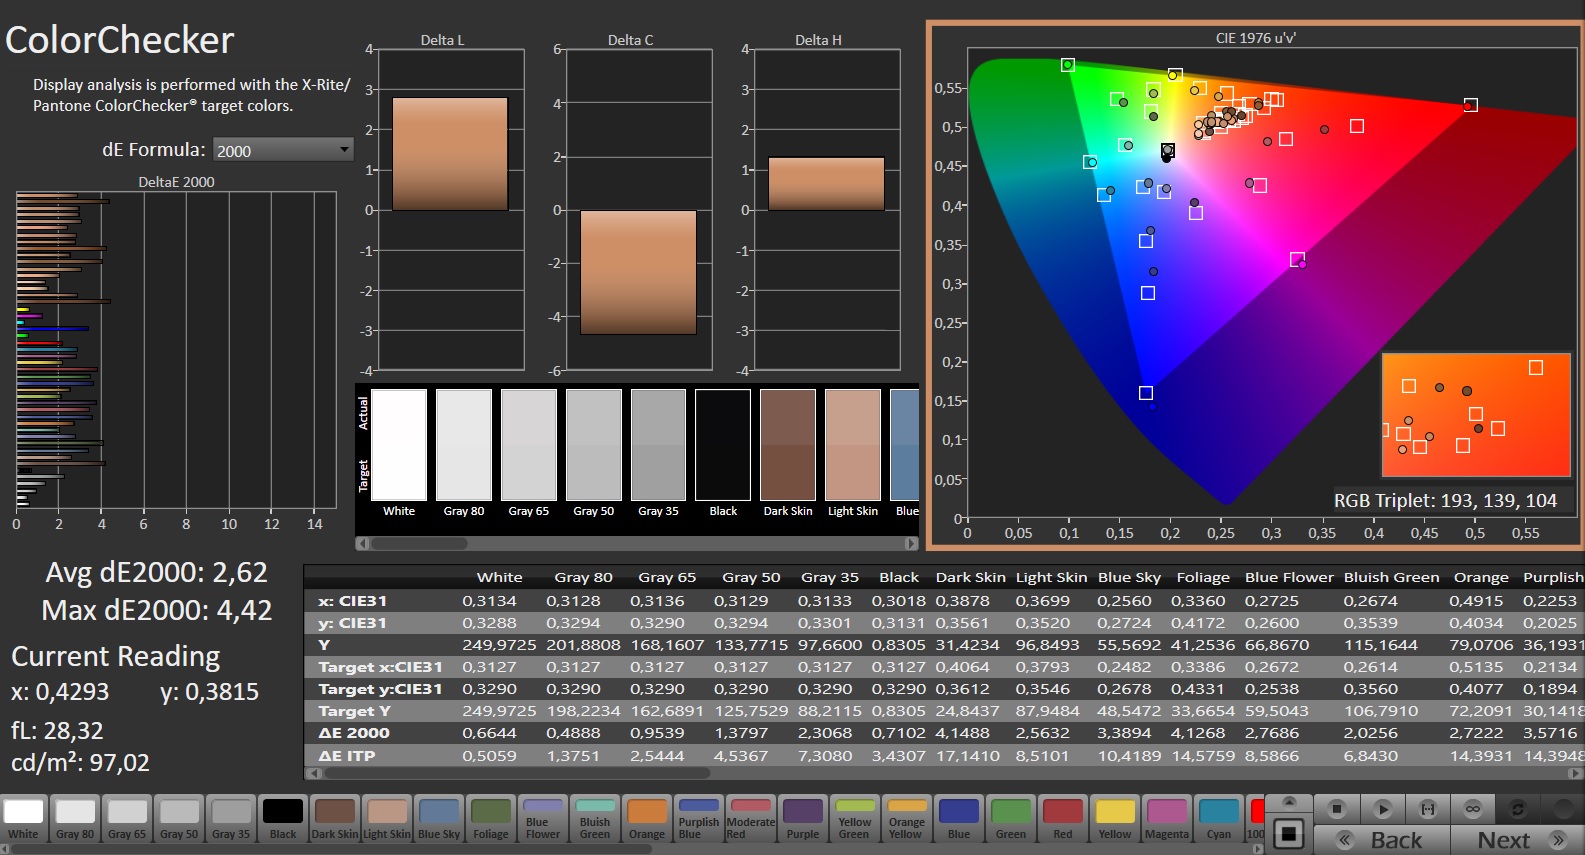
calibrated: 2.62
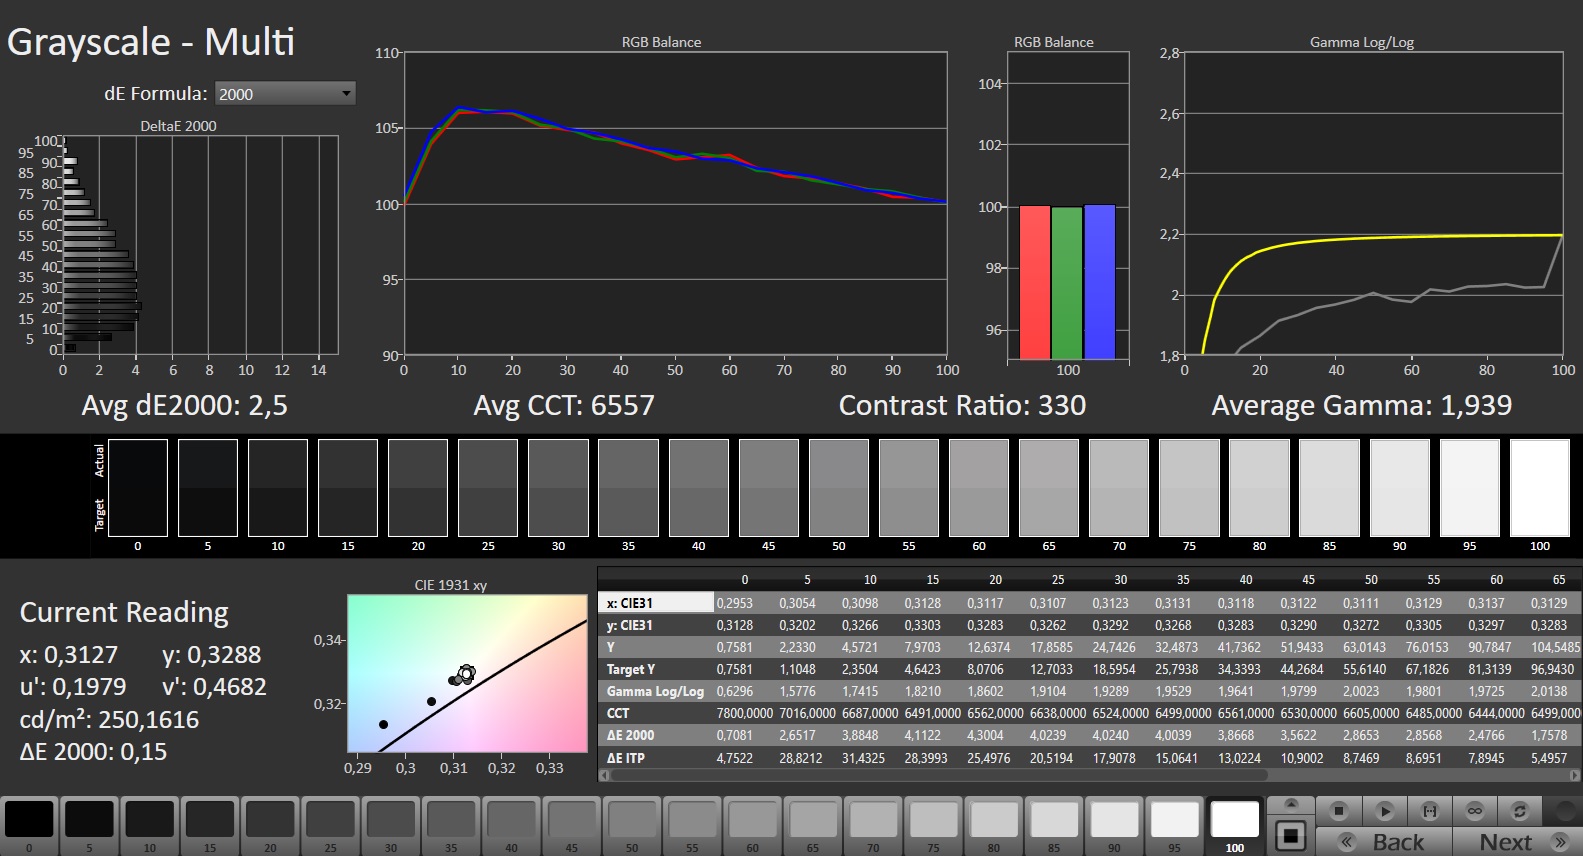
ΔE Greyscale Calman: 3 | ∀{0.09-98 Ø4.97}
85.7% AdobeRGB 1998 (Argyll 3D)
99.9% sRGB (Argyll 3D)
98.2% Display P3 (Argyll 3D)
Gamma: 2.086
CCT: 6289 K
| Aorus 15 BSF Sharp LQ156T1JW05, IPS, 2560x1440, 15.6" | HP Omen Transcend 16 AUOA3A6, Mini-LED, 2560x1600, 16" | MSI Pulse 17 B13VGK AU Optronics B173HAN04.9, IPS, 1920x1080, 17.3" | Lenovo Legion Slim 7i 16 Gen 8 CSOT T3 MNG007DA2-3, IPS, 2560x1600, 16" | Acer Nitro 16 AN16-41 BOE CQ NE16QDM-NY1, IPS, 2560x1600, 16" | Asus TUF Gaming A16 FA617XS BOE NE160WUM-NX2, IPS, 1920x1200, 16" | |
|---|---|---|---|---|---|---|
| Display | 1% | -52% | -15% | -17% | -17% | |
| Display P3 Coverage (%) | 98.2 | 99.2 1% | 38.4 -61% | 70.4 -28% | 67.9 -31% | 69.3 -29% |
| sRGB Coverage (%) | 99.9 | 100 0% | 57.5 -42% | 99.4 -1% | 99.1 -1% | 97.3 -3% |
| AdobeRGB 1998 Coverage (%) | 85.7 | 87.6 2% | 39.7 -54% | 72.5 -15% | 69.9 -18% | 70.7 -18% |
| Response Times | -219% | -207% | -17% | 16% | -41% | |
| Response Time Grey 50% / Grey 80% * (ms) | 11.3 ? | 26.4 ? -134% | 31.2 ? -176% | 12 ? -6% | 11 ? 3% | 15.6 ? -38% |
| Response Time Black / White * (ms) | 7 ? | 28.2 ? -303% | 23.6 ? -237% | 8.9 ? -27% | 5 ? 29% | 10 ? -43% |
| PWM Frequency (Hz) | 3506 ? | |||||
| Screen | 234% | -42% | 22% | 25% | 23% | |
| Brightness middle (cd/m²) | 299 | 791.1 165% | 254 -15% | 474.6 59% | 520 74% | 301 1% |
| Brightness (cd/m²) | 282 | 800 184% | 250 -11% | 445 58% | 494 75% | 294 4% |
| Brightness Distribution (%) | 82 | 95 16% | 91 11% | 86 5% | 91 11% | 94 15% |
| Black Level * (cd/m²) | 0.31 | 0.04 87% | 0.14 55% | 0.39 -26% | 0.39 -26% | 0.21 32% |
| Contrast (:1) | 965 | 19778 1950% | 1814 88% | 1217 26% | 1333 38% | 1433 48% |
| Colorchecker dE 2000 * | 2.24 | 4.37 -95% | 4.52 -102% | 2.12 5% | 1.94 13% | 1.79 20% |
| Colorchecker dE 2000 max. * | 4.29 | 10.39 -142% | 21.22 -395% | 4.73 -10% | 5.62 -31% | 3.48 19% |
| Colorchecker dE 2000 calibrated * | 2.62 | 1.04 60% | 4.52 -73% | 0.57 78% | 0.74 72% | 1.2 54% |
| Greyscale dE 2000 * | 3 | 6.5 -117% | 1 67% | 2.8 7% | 2.94 2% | 2.5 17% |
| Gamma | 2.086 105% | 2.28 96% | 2.44 90% | 2.22 99% | 2.37 93% | 2.265 97% |
| CCT | 6289 103% | 6000 108% | 6502 100% | 6542 99% | 6443 101% | 6157 106% |
| Całkowita średnia (program / ustawienia) | 5% /
120% | -100% /
-68% | -3% /
9% | 8% /
15% | -12% /
6% |
* ... im mniej tym lepiej
Wyświetlacz już w stanie fabrycznym wykazywał dobre odwzorowanie kolorów: Z odchyleniem 2,24, jego cel został osiągnięty (DeltaE < 3). Kalibracja nie doprowadziła do żadnej zauważalnej różnicy. Dokładność kolorów jest obecna: Panel jest w stanie w pełni odwzorować przestrzenie barw sRGB i DCI-P3 oraz 86 procent przestrzeni Adobe RGB.


Wyświetl czasy reakcji
| ↔ Czas reakcji od czerni do bieli | ||
|---|---|---|
| 7 ms ... wzrost ↗ i spadek ↘ łącznie | ↗ 3.4 ms wzrost | 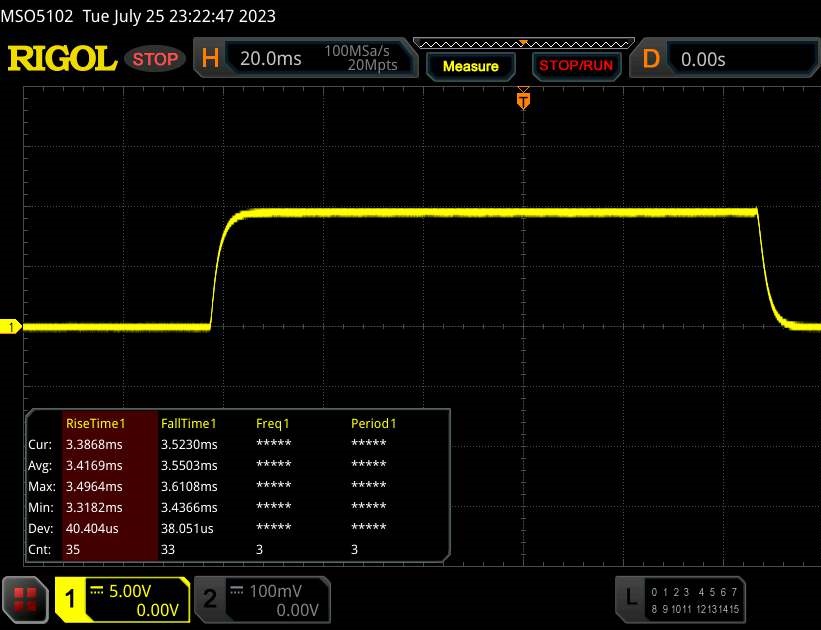 |
| ↘ 3.6 ms upadek | ||
| W naszych testach ekran wykazuje bardzo szybką reakcję i powinien bardzo dobrze nadawać się do szybkich gier. Dla porównania, wszystkie testowane urządzenia wahają się od 0.1 (minimum) do 240 (maksimum) ms. » 21 % wszystkich urządzeń jest lepszych. Oznacza to, że zmierzony czas reakcji jest lepszy od średniej wszystkich testowanych urządzeń (19.8 ms). | ||
| ↔ Czas reakcji 50% szarości do 80% szarości | ||
| 11.3 ms ... wzrost ↗ i spadek ↘ łącznie | ↗ 5.2 ms wzrost | 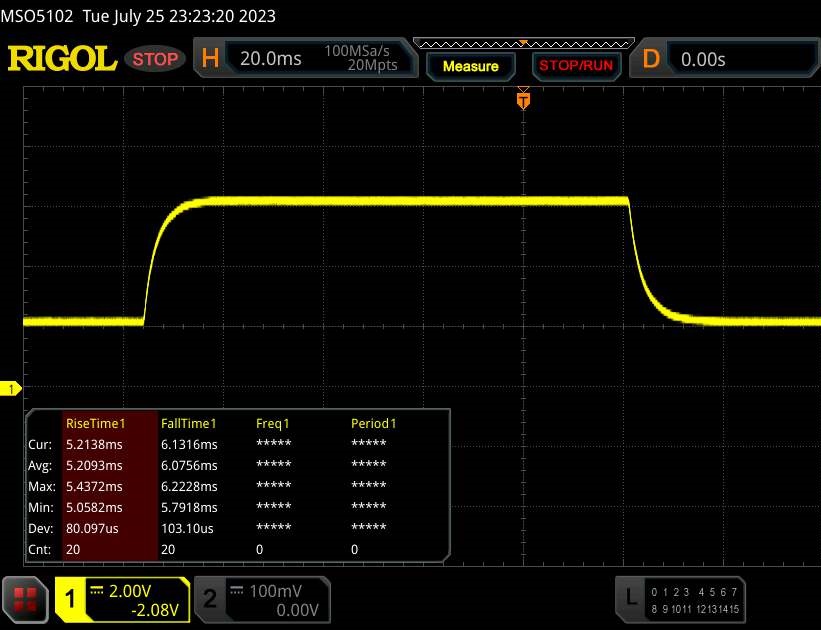 |
| ↘ 6.1 ms upadek | ||
| W naszych testach ekran wykazuje dobry współczynnik reakcji, ale może być zbyt wolny dla graczy rywalizujących ze sobą. Dla porównania, wszystkie testowane urządzenia wahają się od 0.165 (minimum) do 636 (maksimum) ms. » 25 % wszystkich urządzeń jest lepszych. Oznacza to, że zmierzony czas reakcji jest lepszy od średniej wszystkich testowanych urządzeń (31 ms). | ||
Migotanie ekranu / PWM (modulacja szerokości impulsu)
| Migotanie ekranu/nie wykryto PWM | 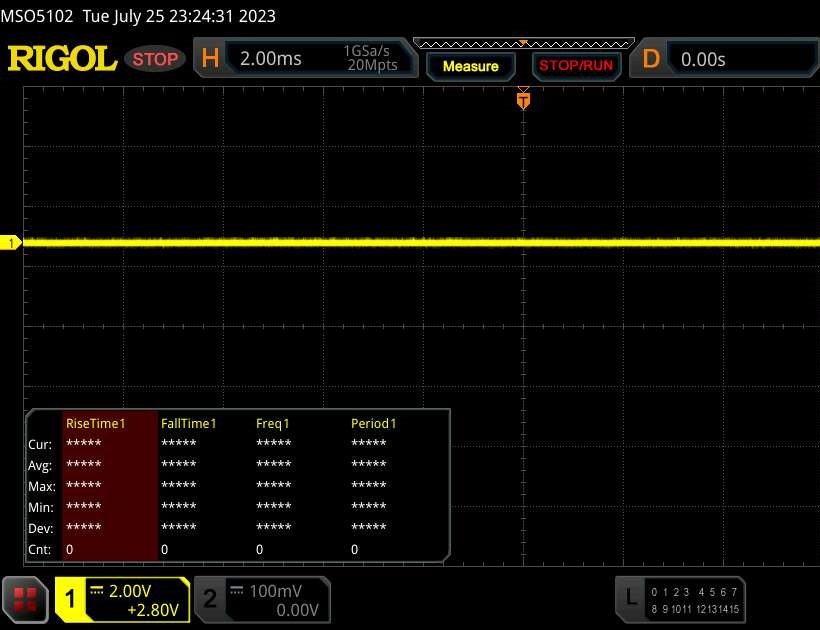 | ||
Dla porównania: 52 % wszystkich testowanych urządzeń nie używa PWM do przyciemniania wyświetlacza. Jeśli wykryto PWM, zmierzono średnio 7753 (minimum: 5 - maksimum: 343500) Hz. | |||
Panel IPS o stabilnym kącie widzenia może być odczytywany z dowolnej pozycji. Na zewnątrz można czytać z ekranu, jeśli słońce nie świeci zbyt mocno.

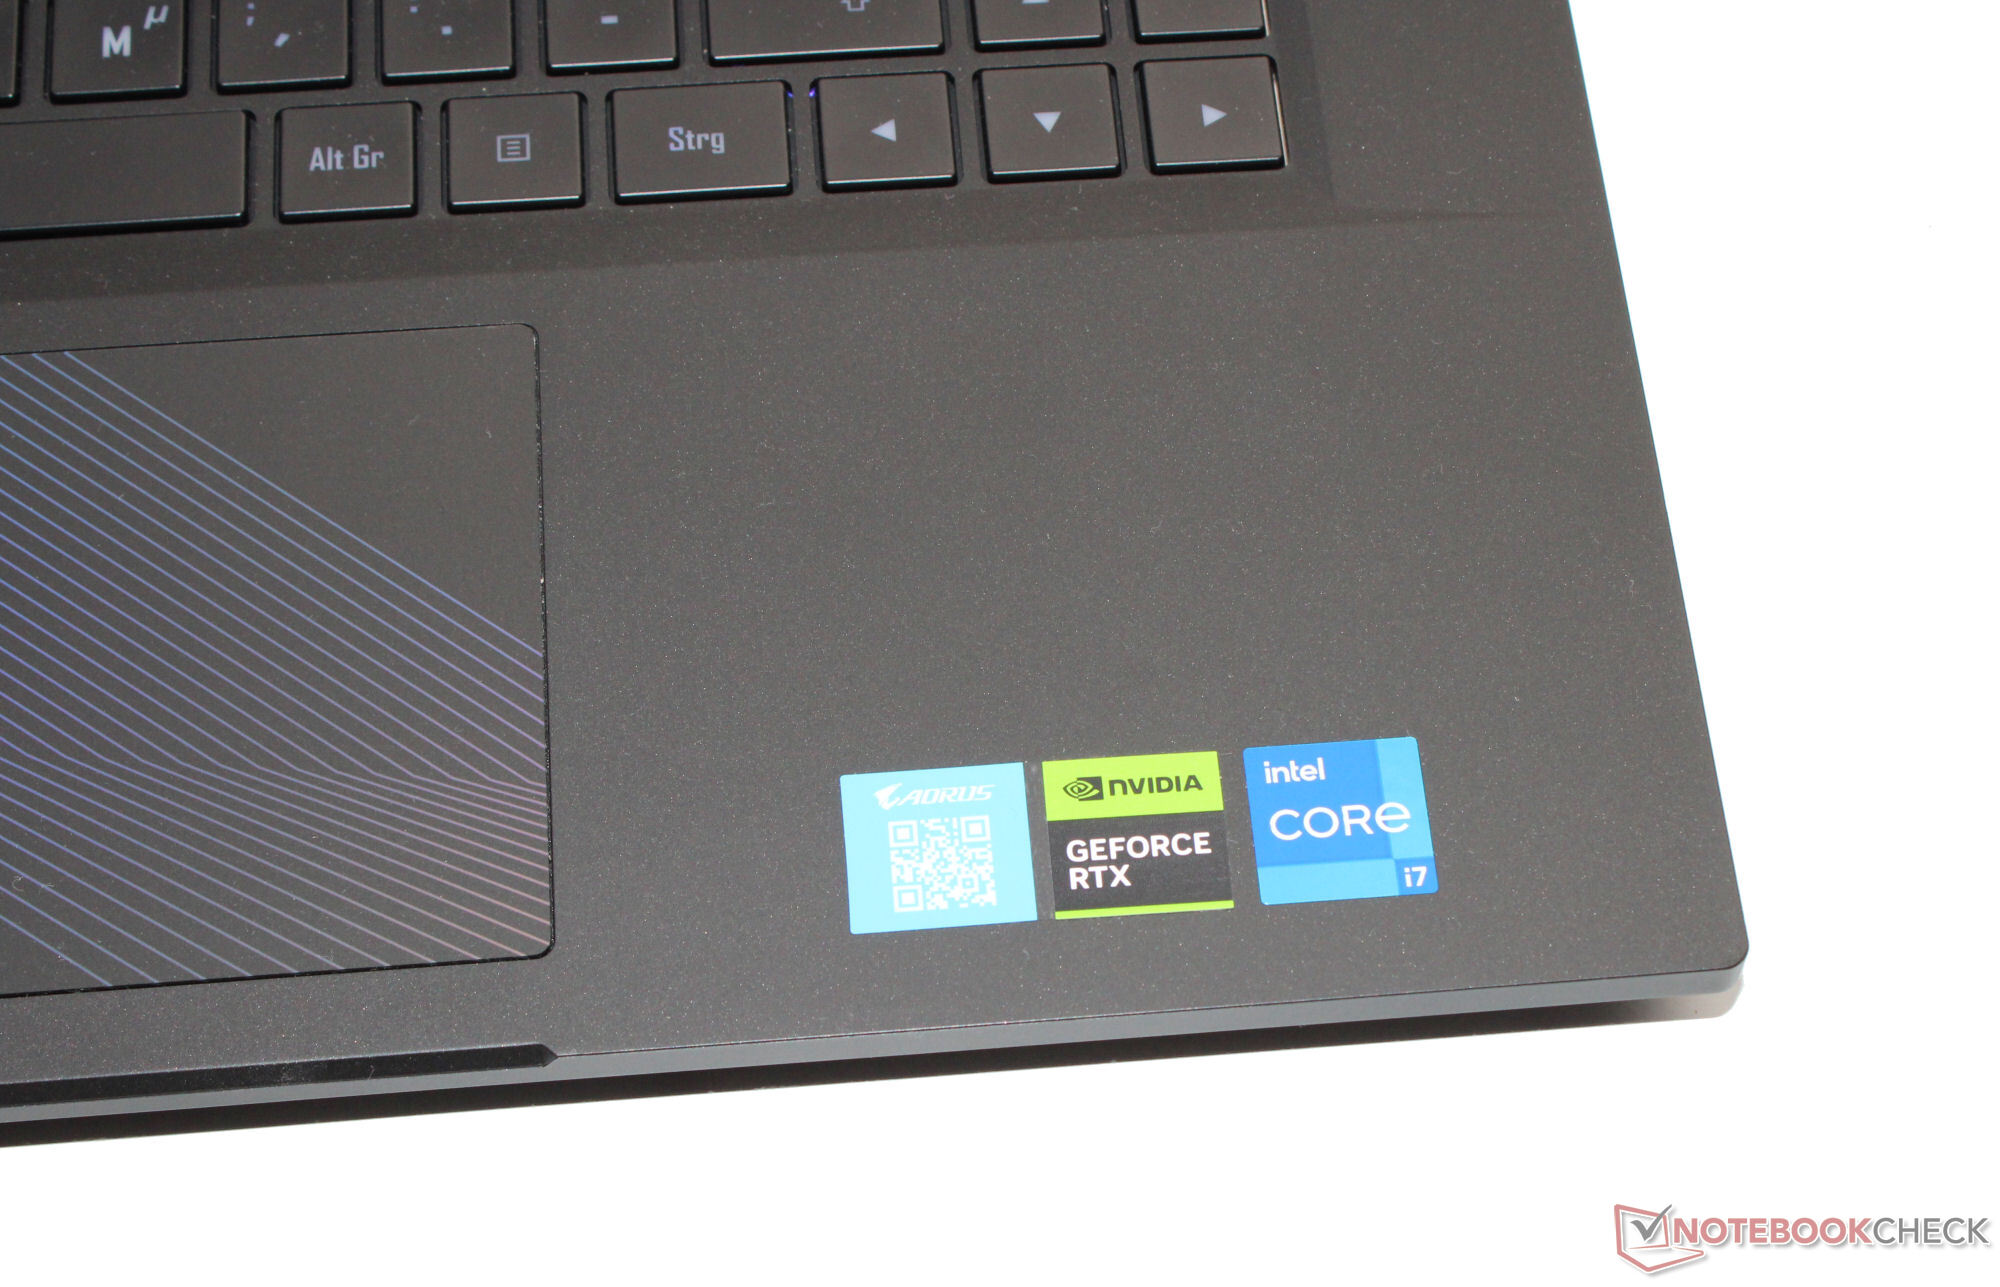
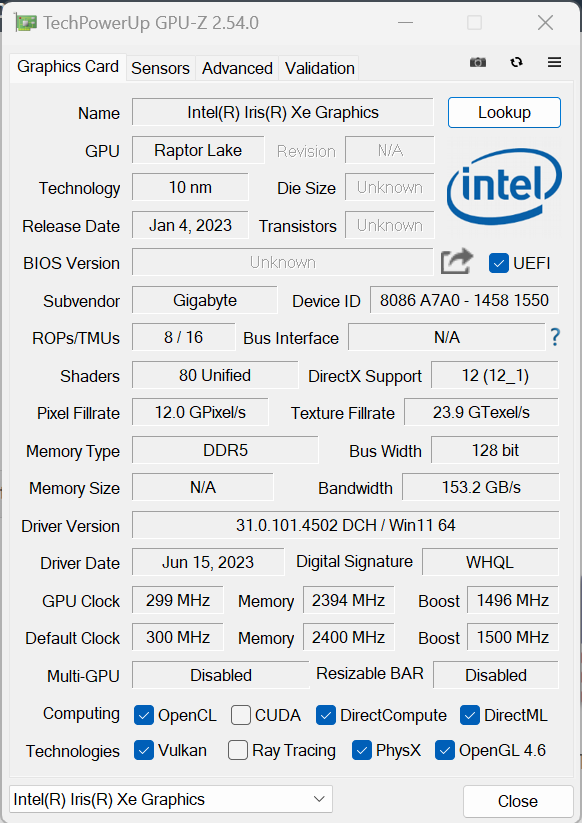
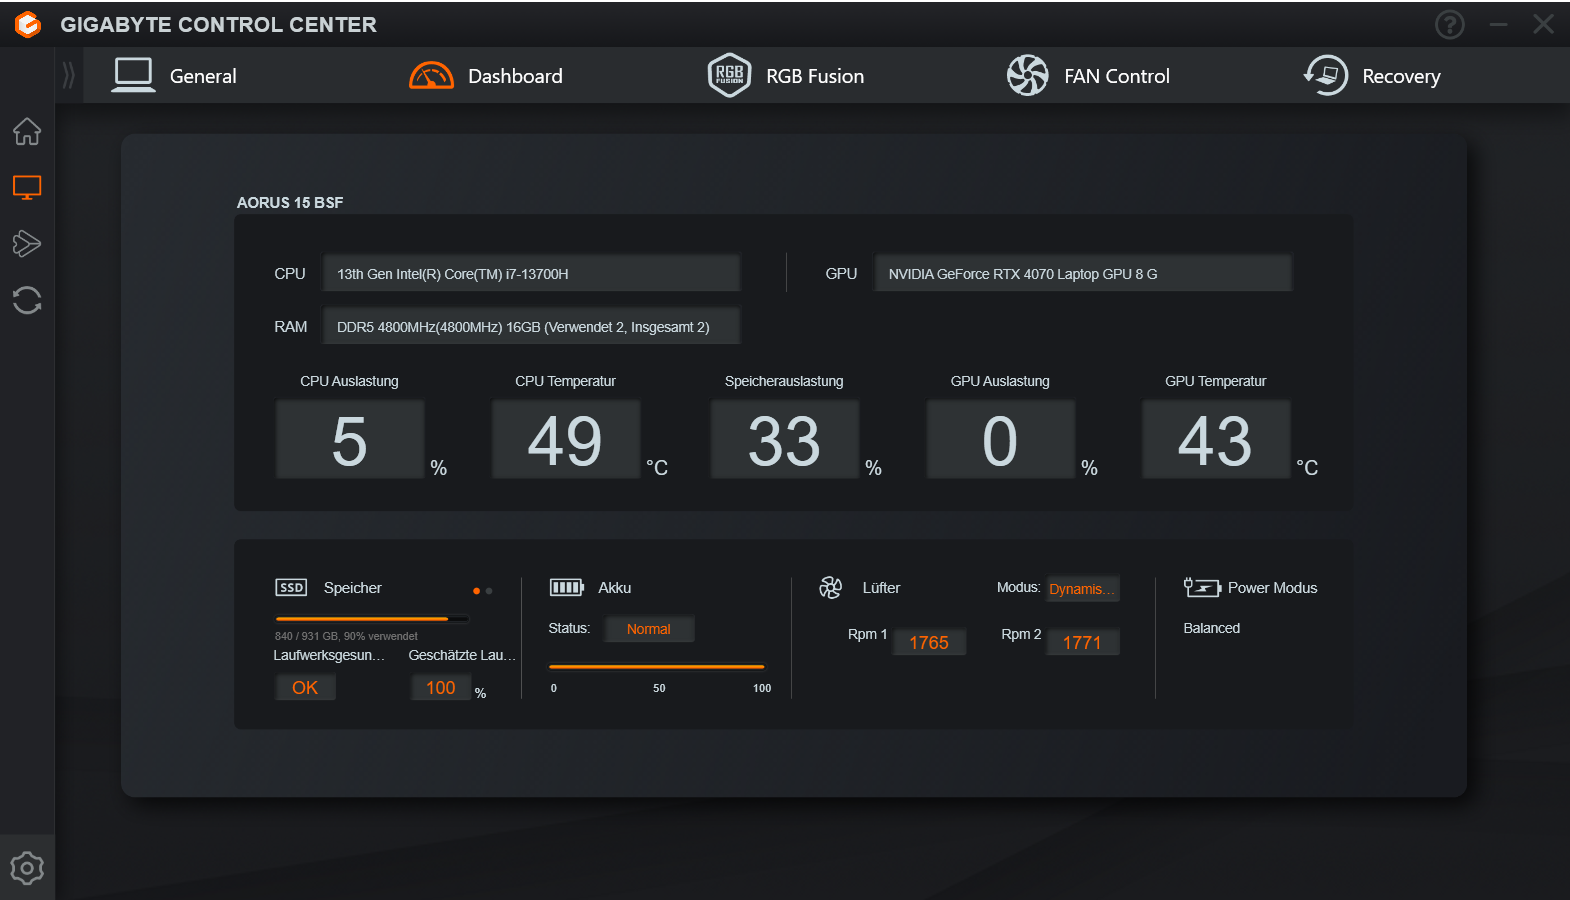
Wydajność - Raptor Lake i Ada Lovelace napędzają komputer Gigabyte
Aorus 15 BSF zalicza się do mocniejszych laptopów gamingowych ze średniej półki i może być również wykorzystywany w różnych dziedzinach. Niezbędną wydajność zapewniają procesory Raptor Lake i Ada Lovelace. Prezentowane urządzenie można znaleźć za około 1700 USD.
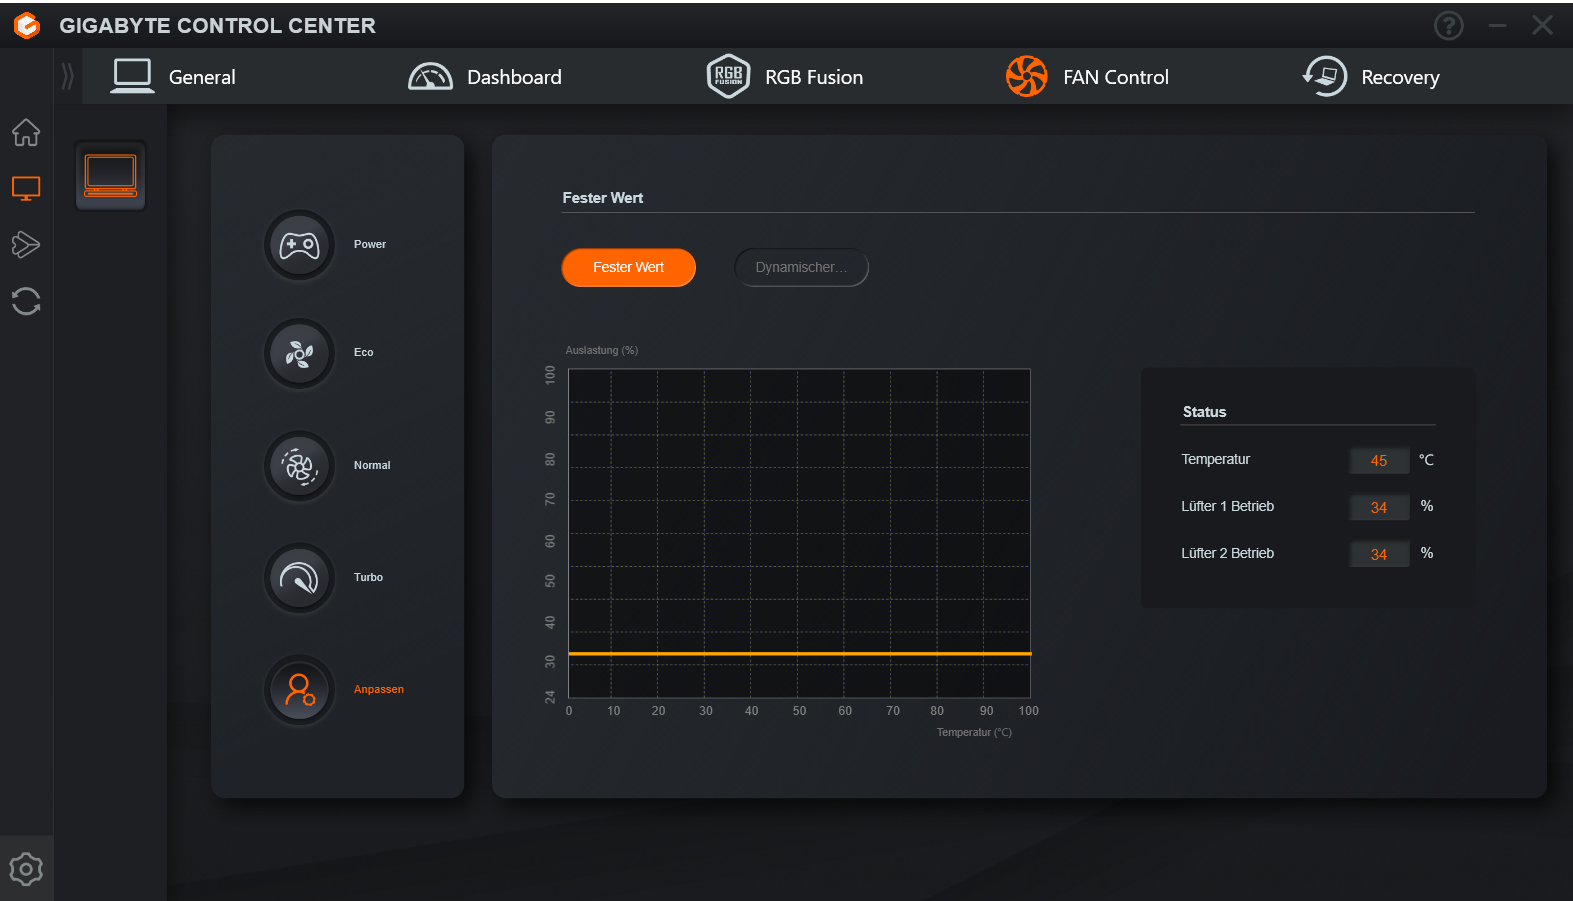
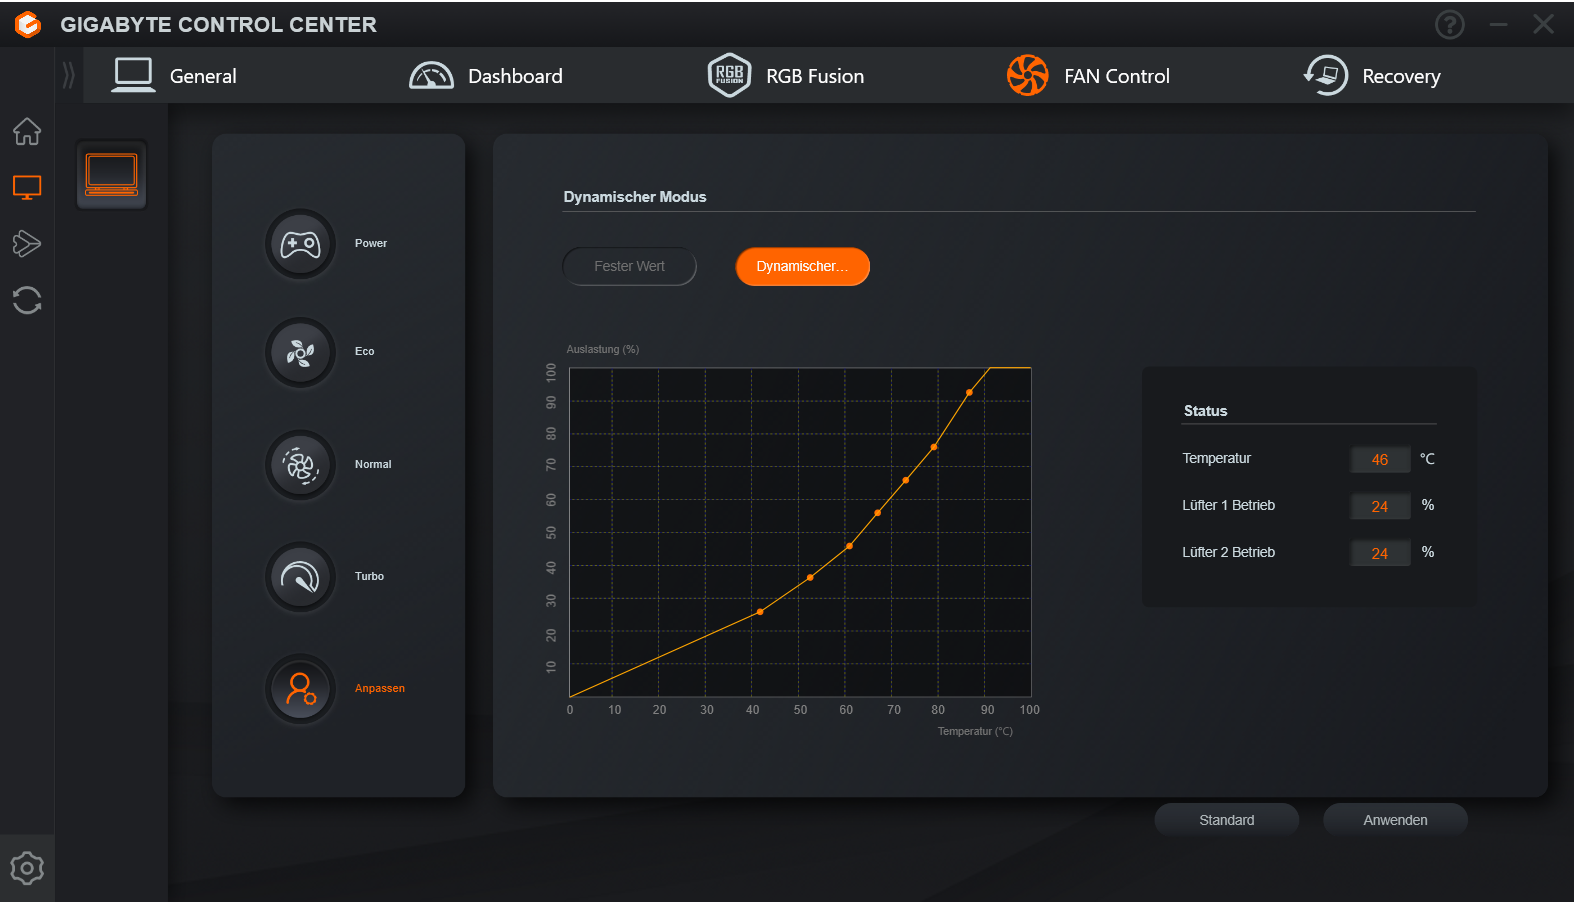
Warunki testowania
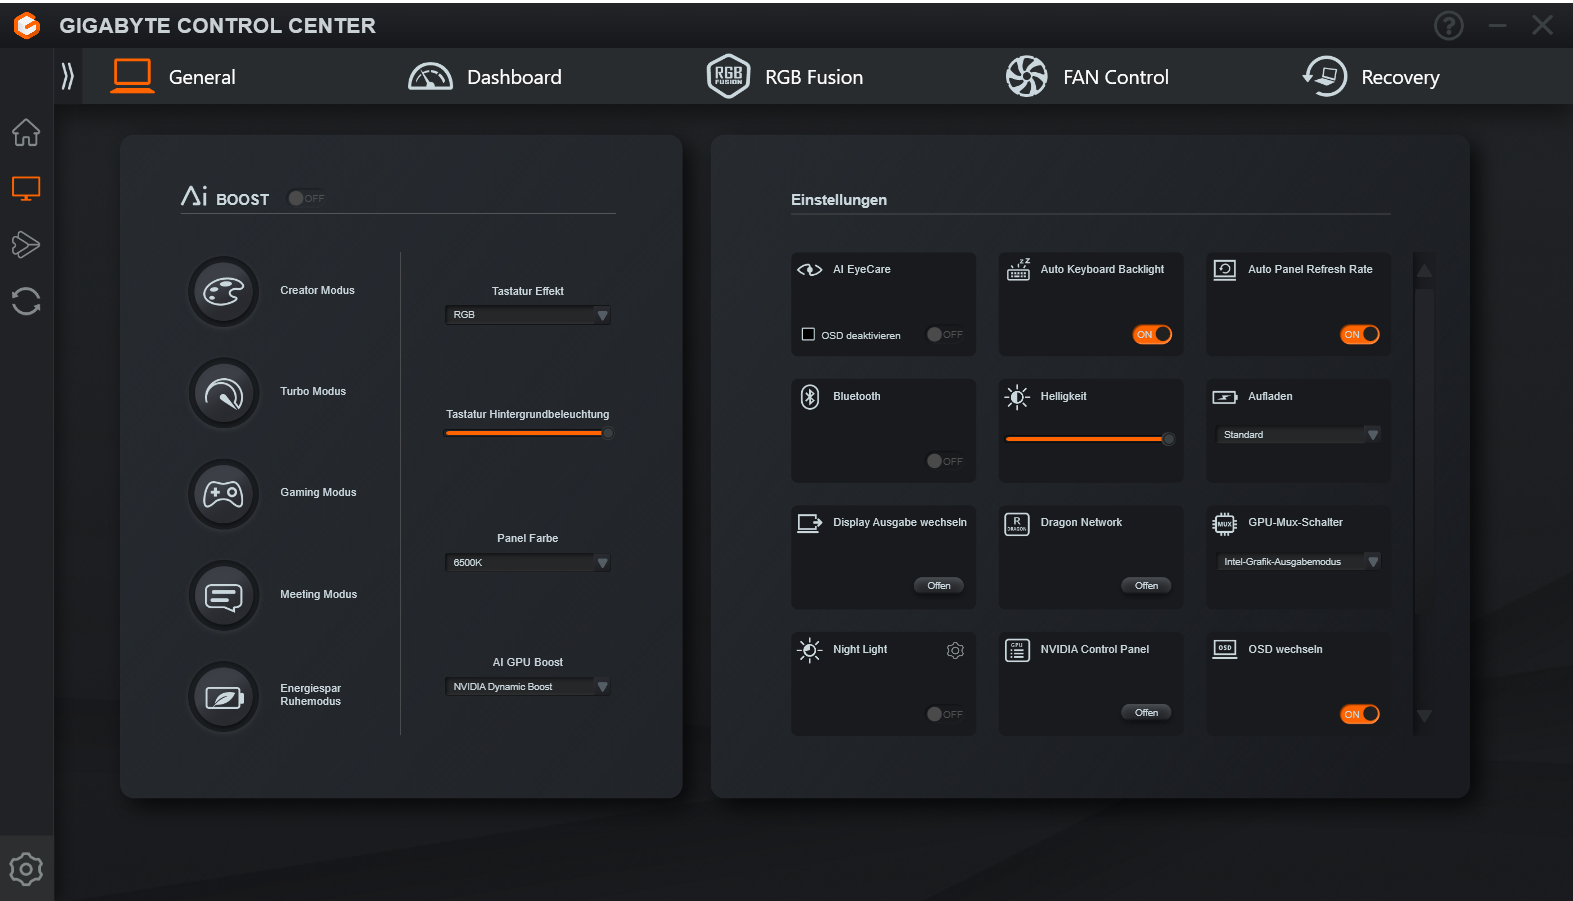
Centrum sterowania komputera (Gigabyte Control Center) zapewnia funkcję wyższego poziomu AI Boost, której użyliśmy oprócz typowych trybów wydajności (patrz tabela). Następnie Control Center wybrało odpowiedni profil - "Gaming Mode" i "Creator Mode" dla benchmarków, "Energy Saving Sleep Mode" dla testów baterii.
| AI Boost | Creator | Turbo | Gaming | Meeting | Energooszczędny tryb uśpienia | |
|---|---|---|---|---|---|---|
| Limit mocy 1 (HWInfo) | 55-70 watów | 70 watów | 70 watów | 55 watów | 27 watów | 27 watów |
| Limit mocy 2 (HWInfo) | 115 watów | 115 watów | 115 watów | 115 watów | 45 watów | 45 watów |
| Hałas (Witcher 3) | 53 dB(A) | 52 dB(A) | 55 dB(A) | 53 dB(A) | 46 dB(A) | 46 dB(A) |
| Wydajność (Witcher 3) | 118 fps | 118 fps | 118 fps | 118 fps | 118 fps | 118 fps |
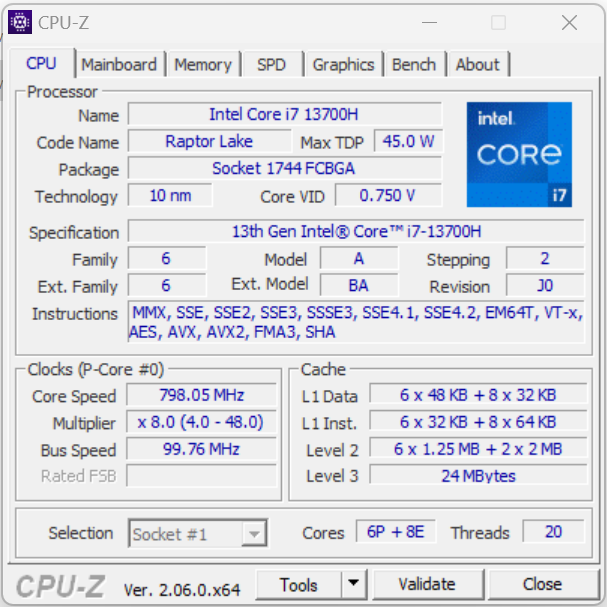
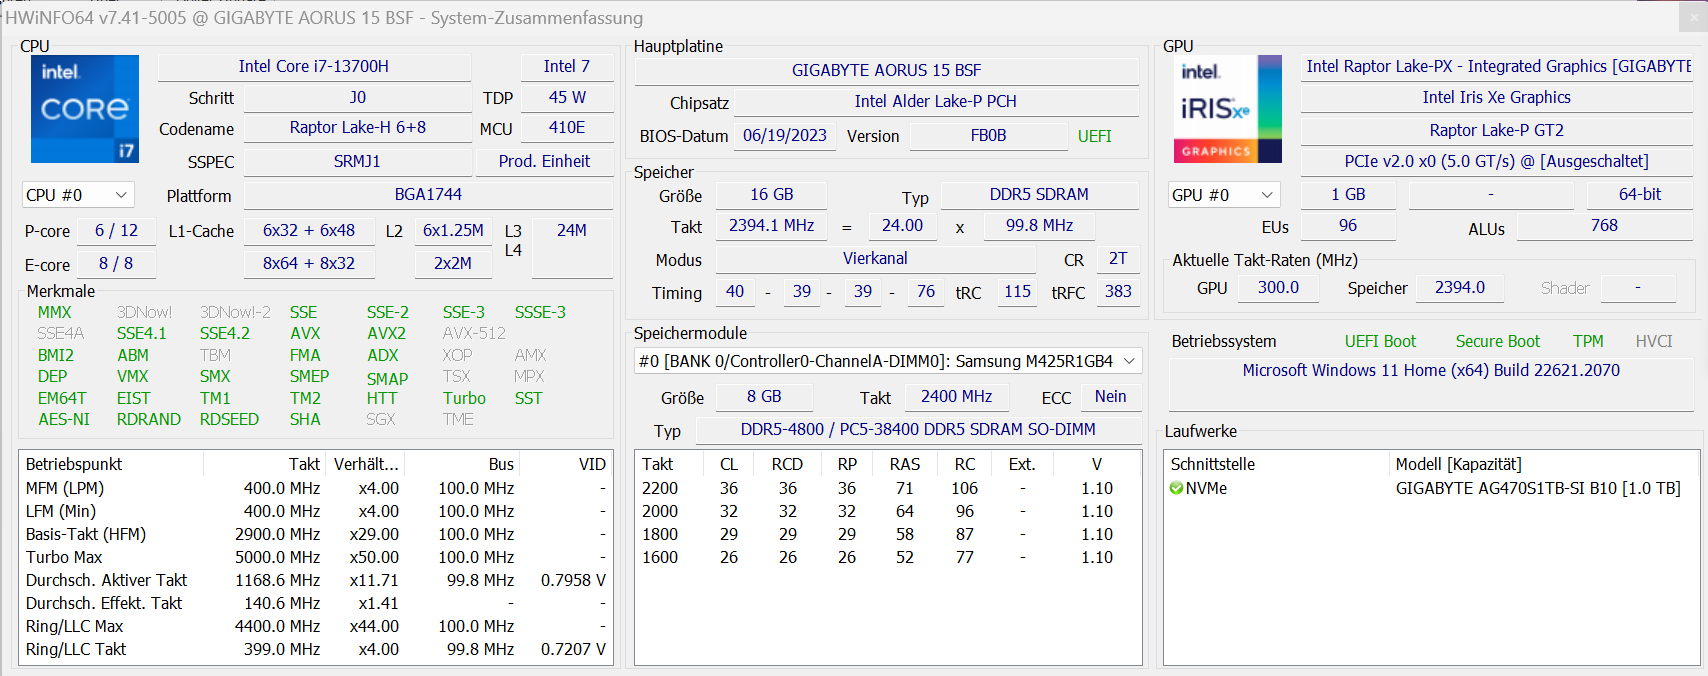
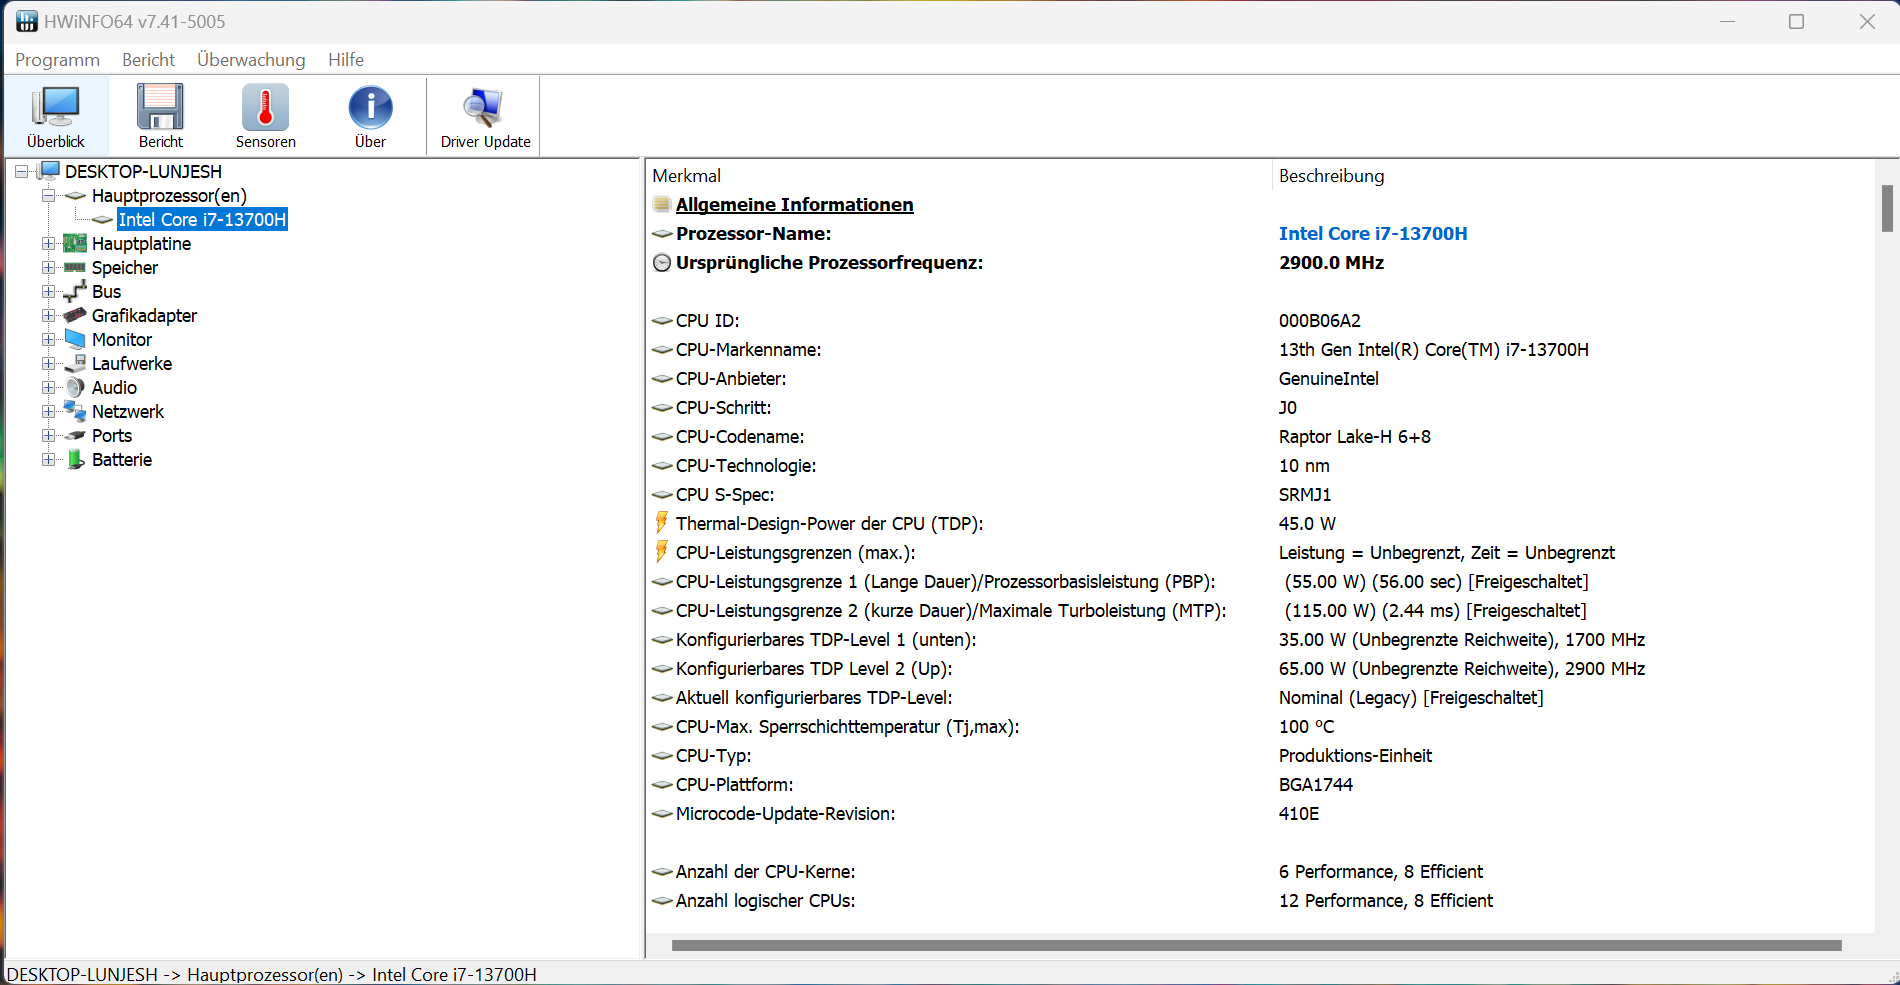
Procesor
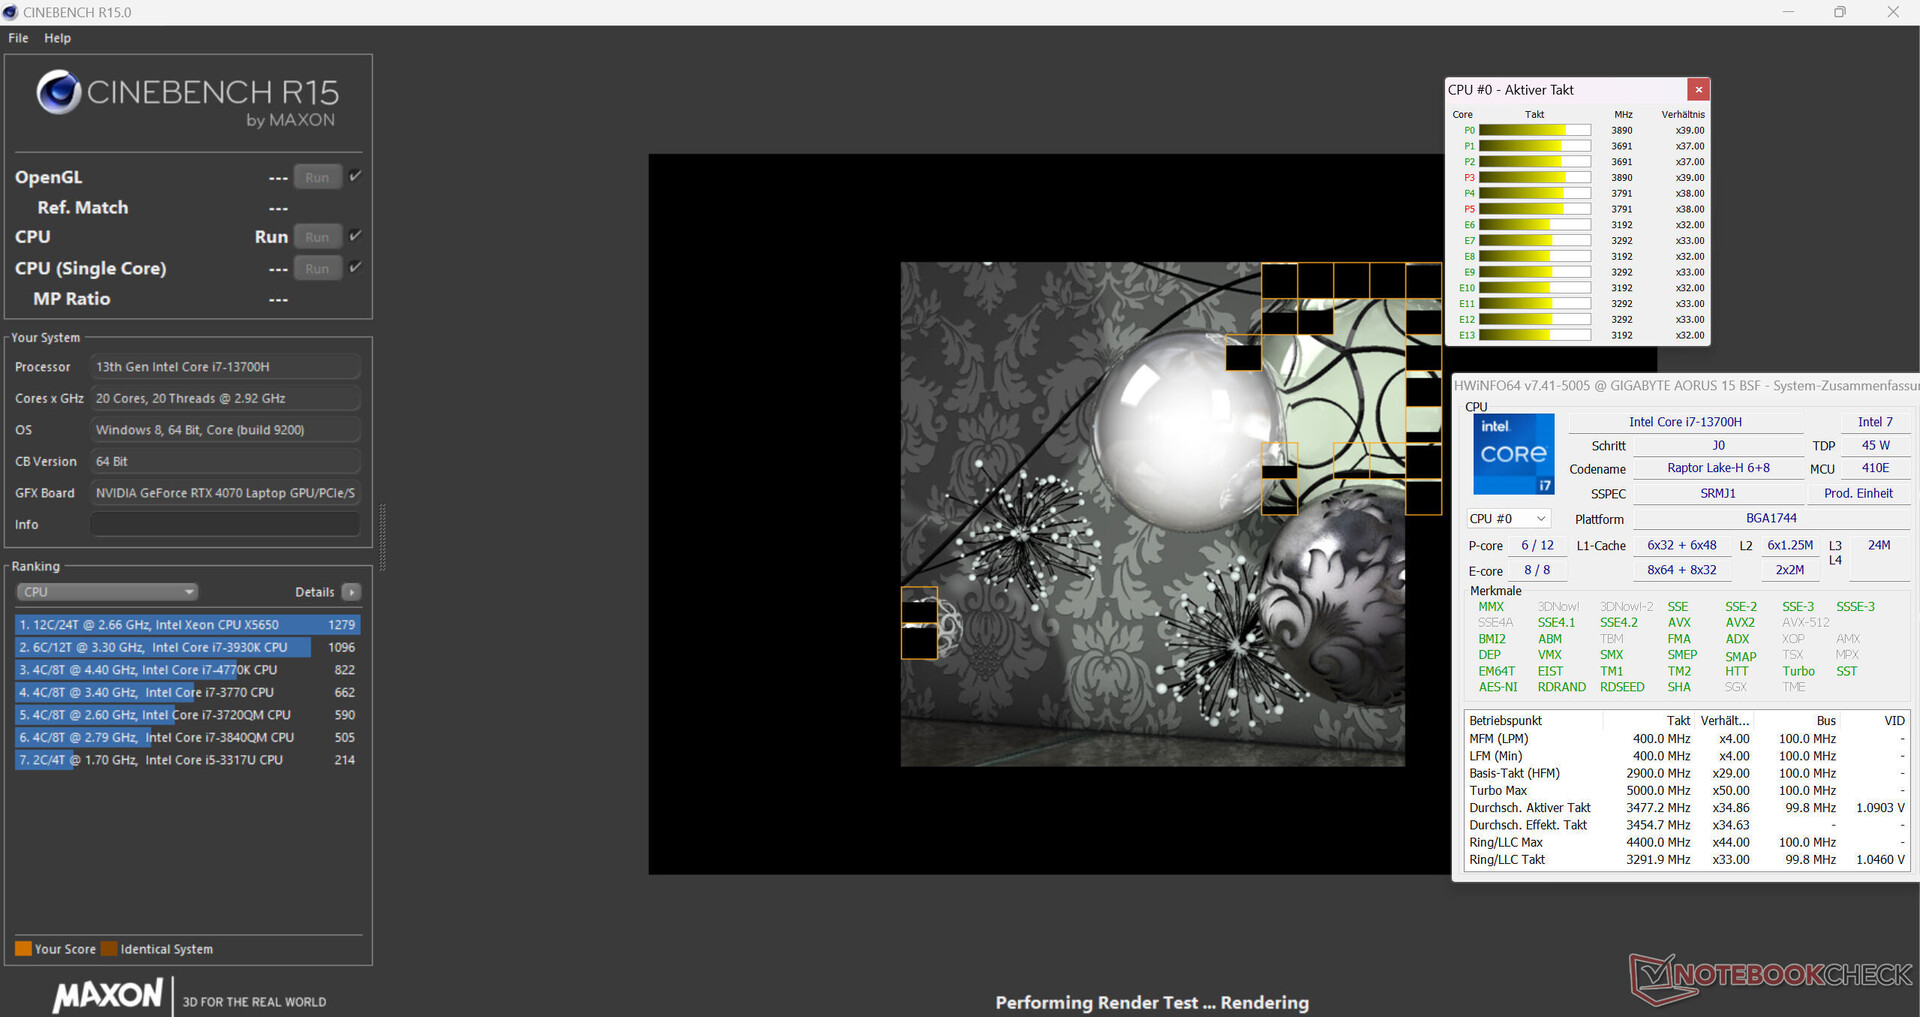
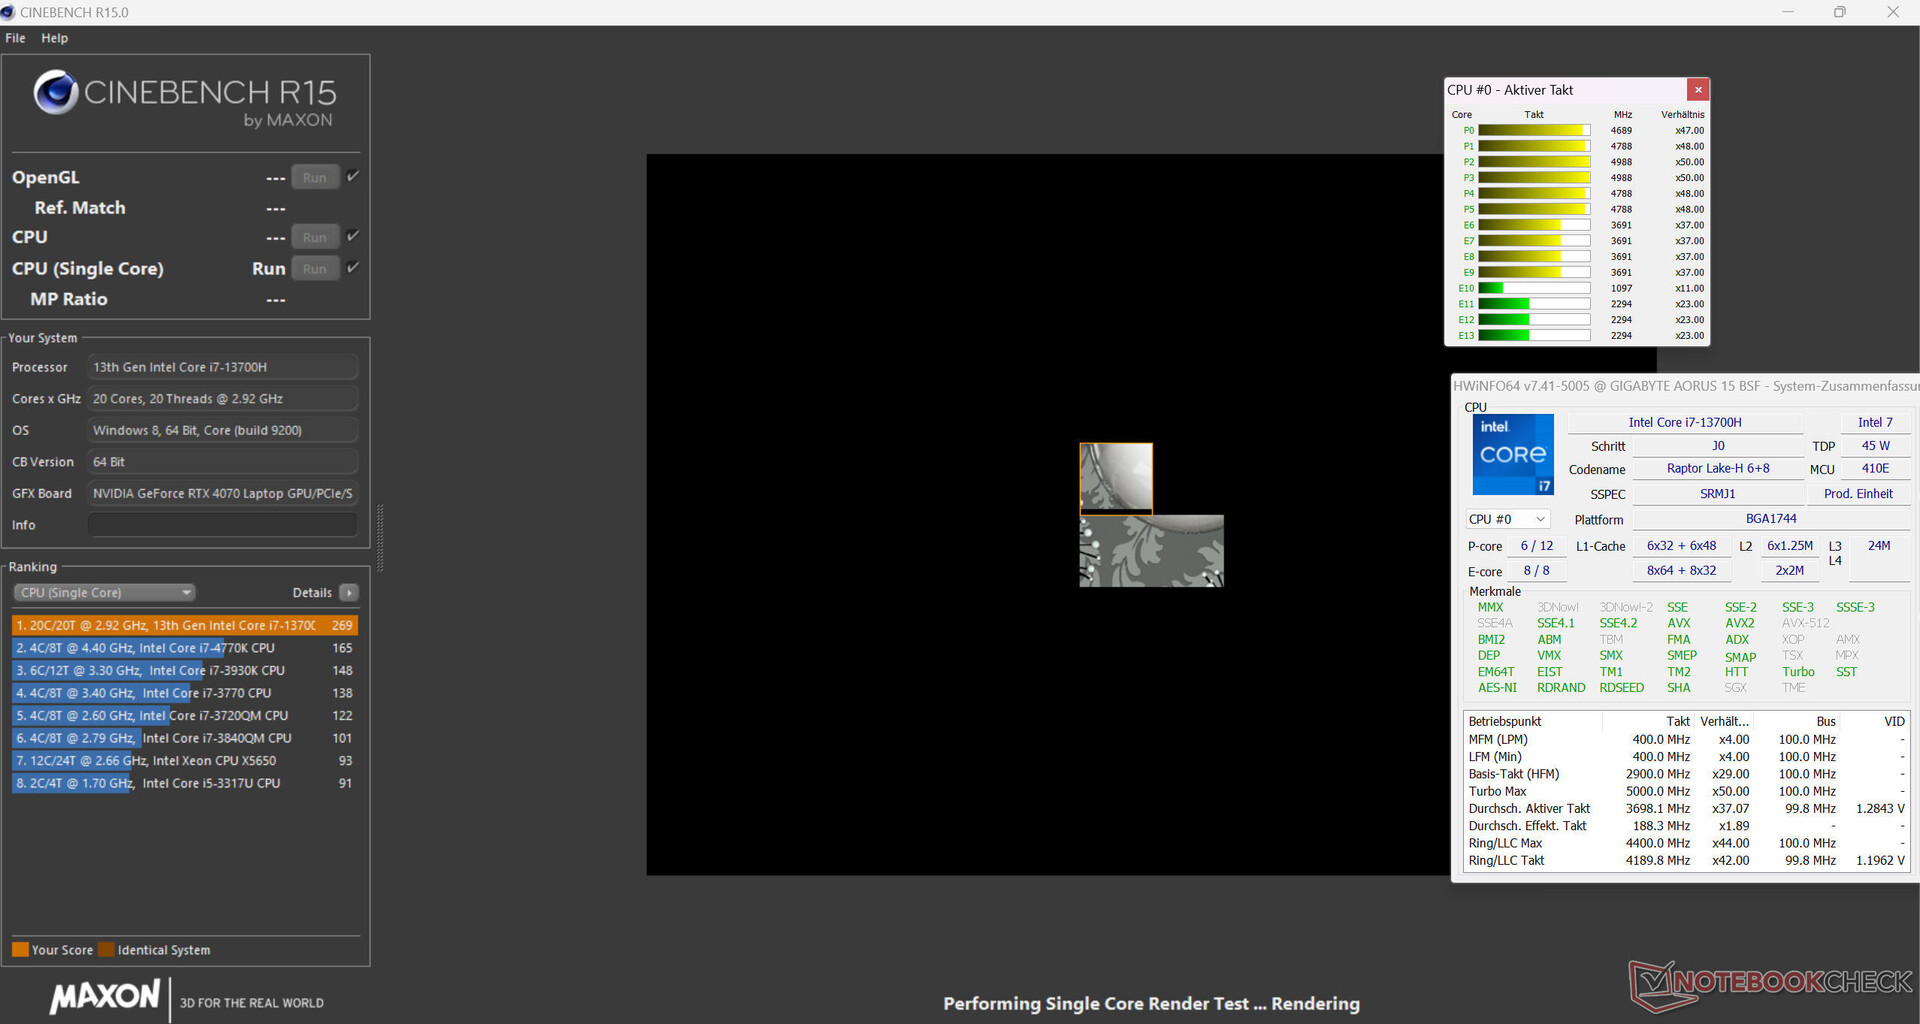
ProcesorCore-i7-13700H(Raptor Lake) składa się z ośmiu rdzeni wydajnościowych (bez hiperwątkowości, 1,8 - 3,7 GHz) i sześciu rdzeni wydajnościowych (hiperwątkowość, 2,4 - 5 GHz). Łącznie daje to 20 logicznych rdzeni CPU.
Wyniki testów porównawczych laptopa po podłączeniu do zasilania były powyżej średniej CPU. Podczas korzystania z baterii, jego bardziej istotna wydajność jednowątkowa (163 punkty) spadła o podobną wartość do wydajności wielowątkowej (1614 punktów).
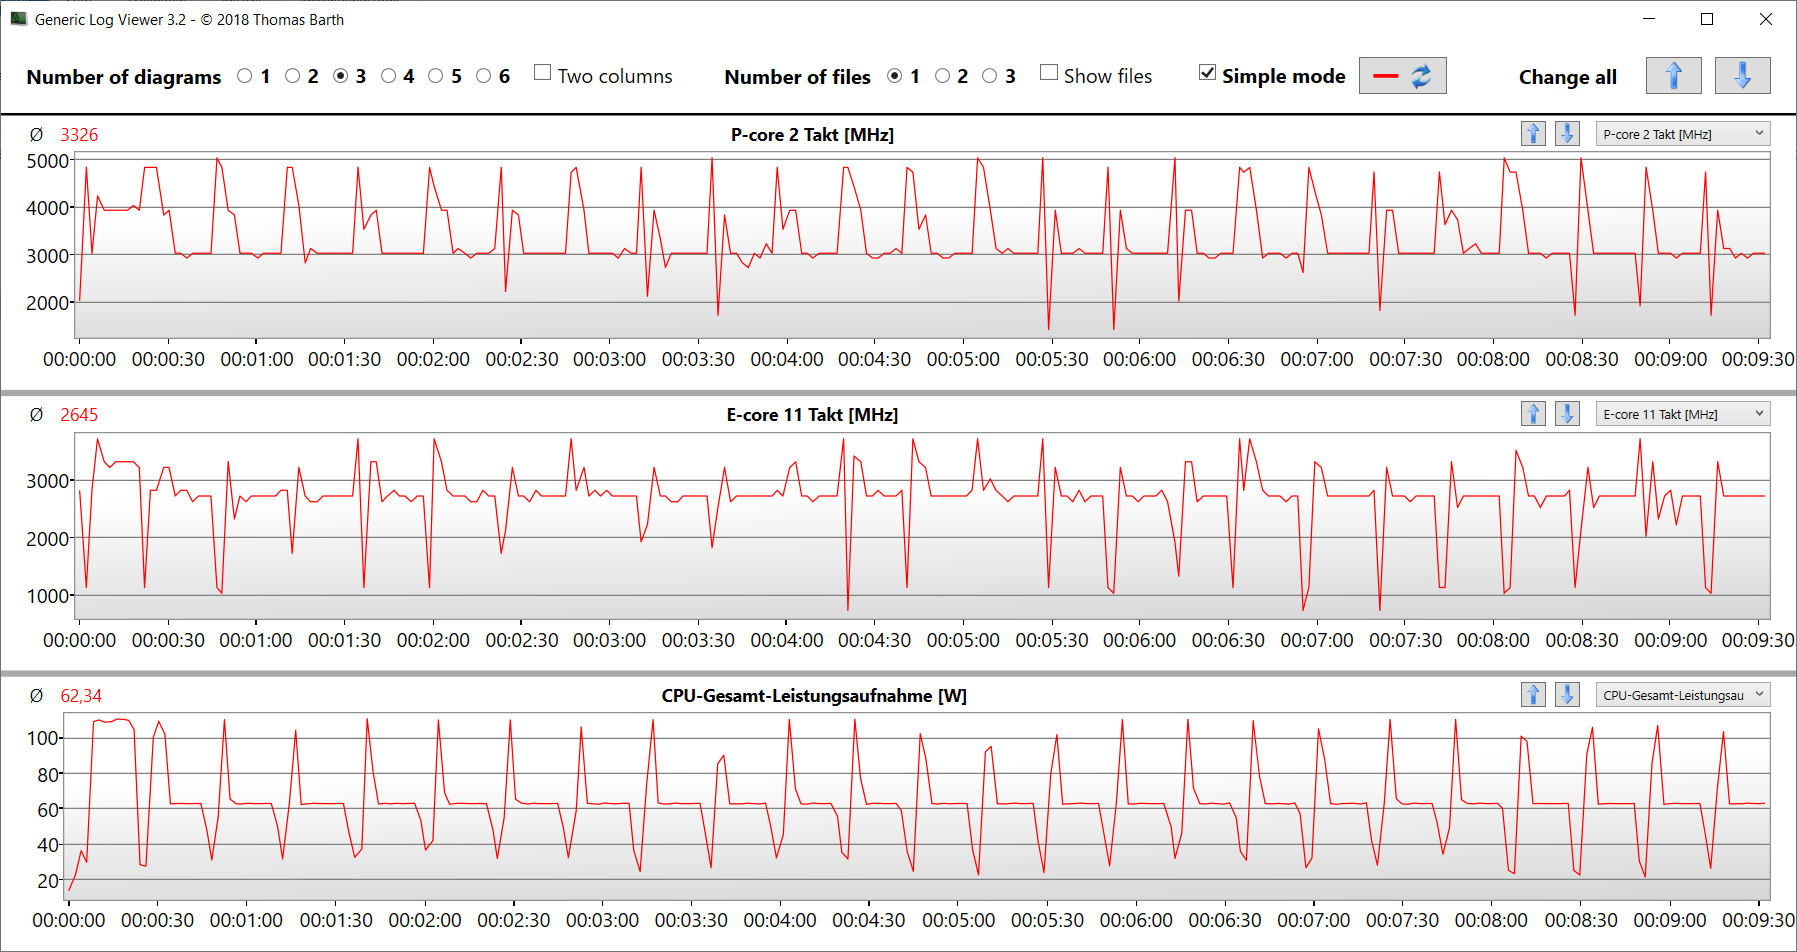
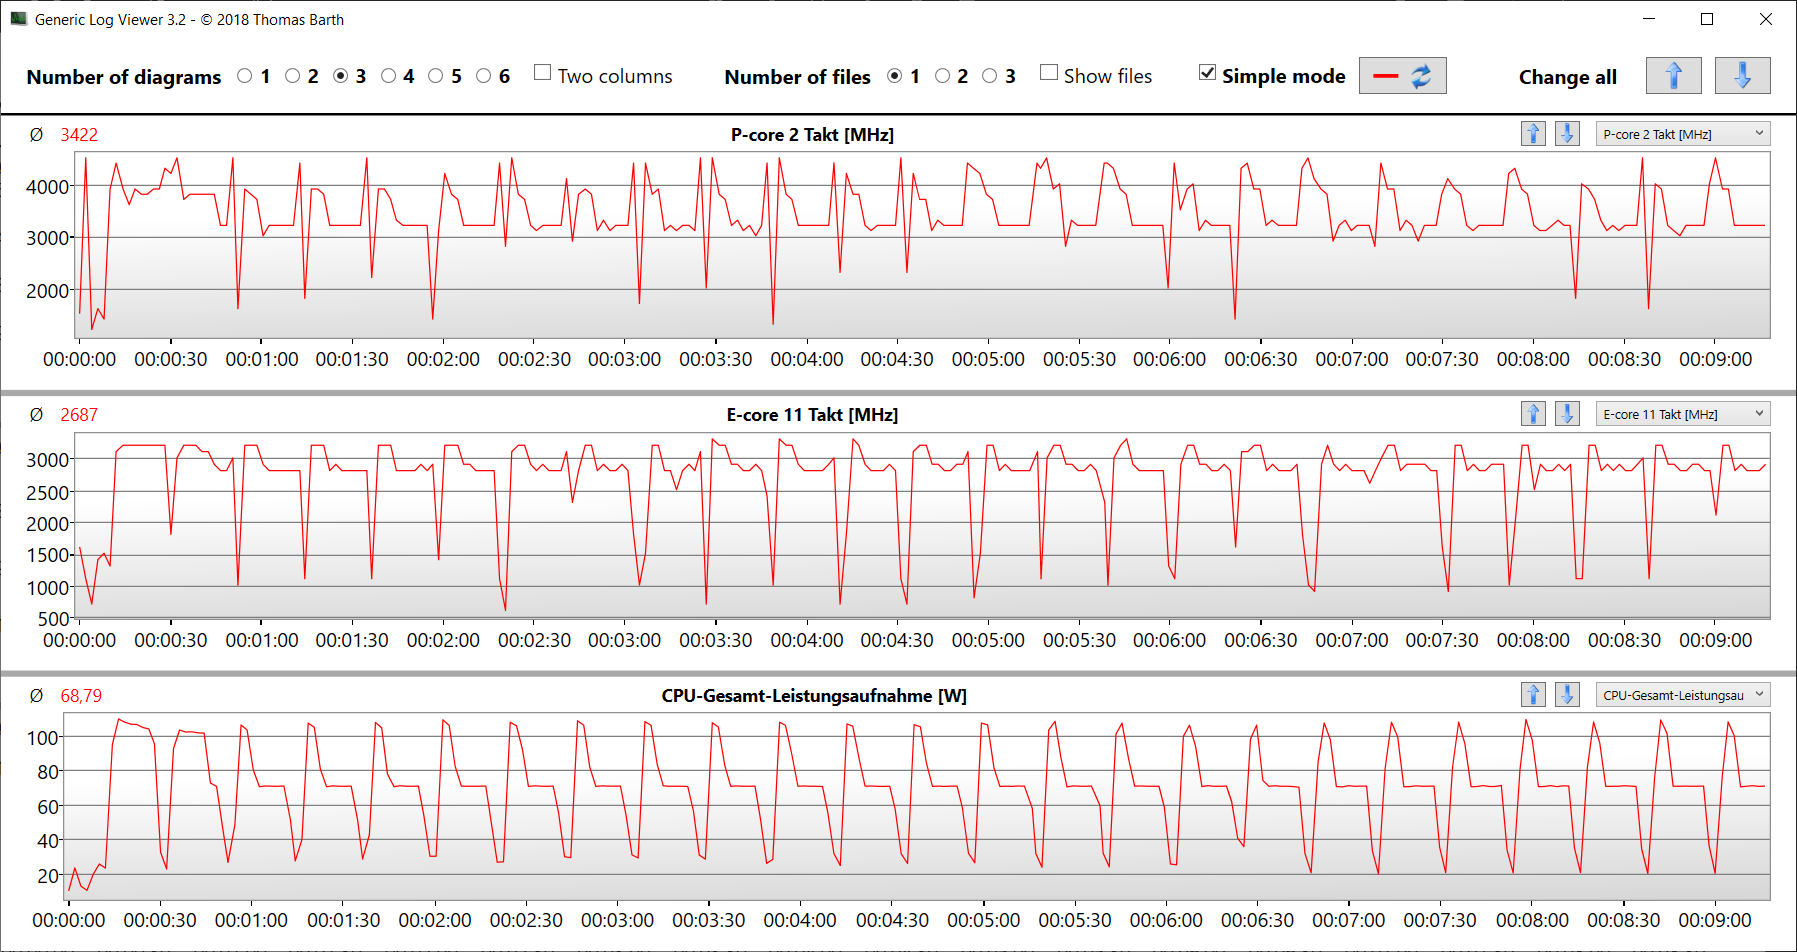
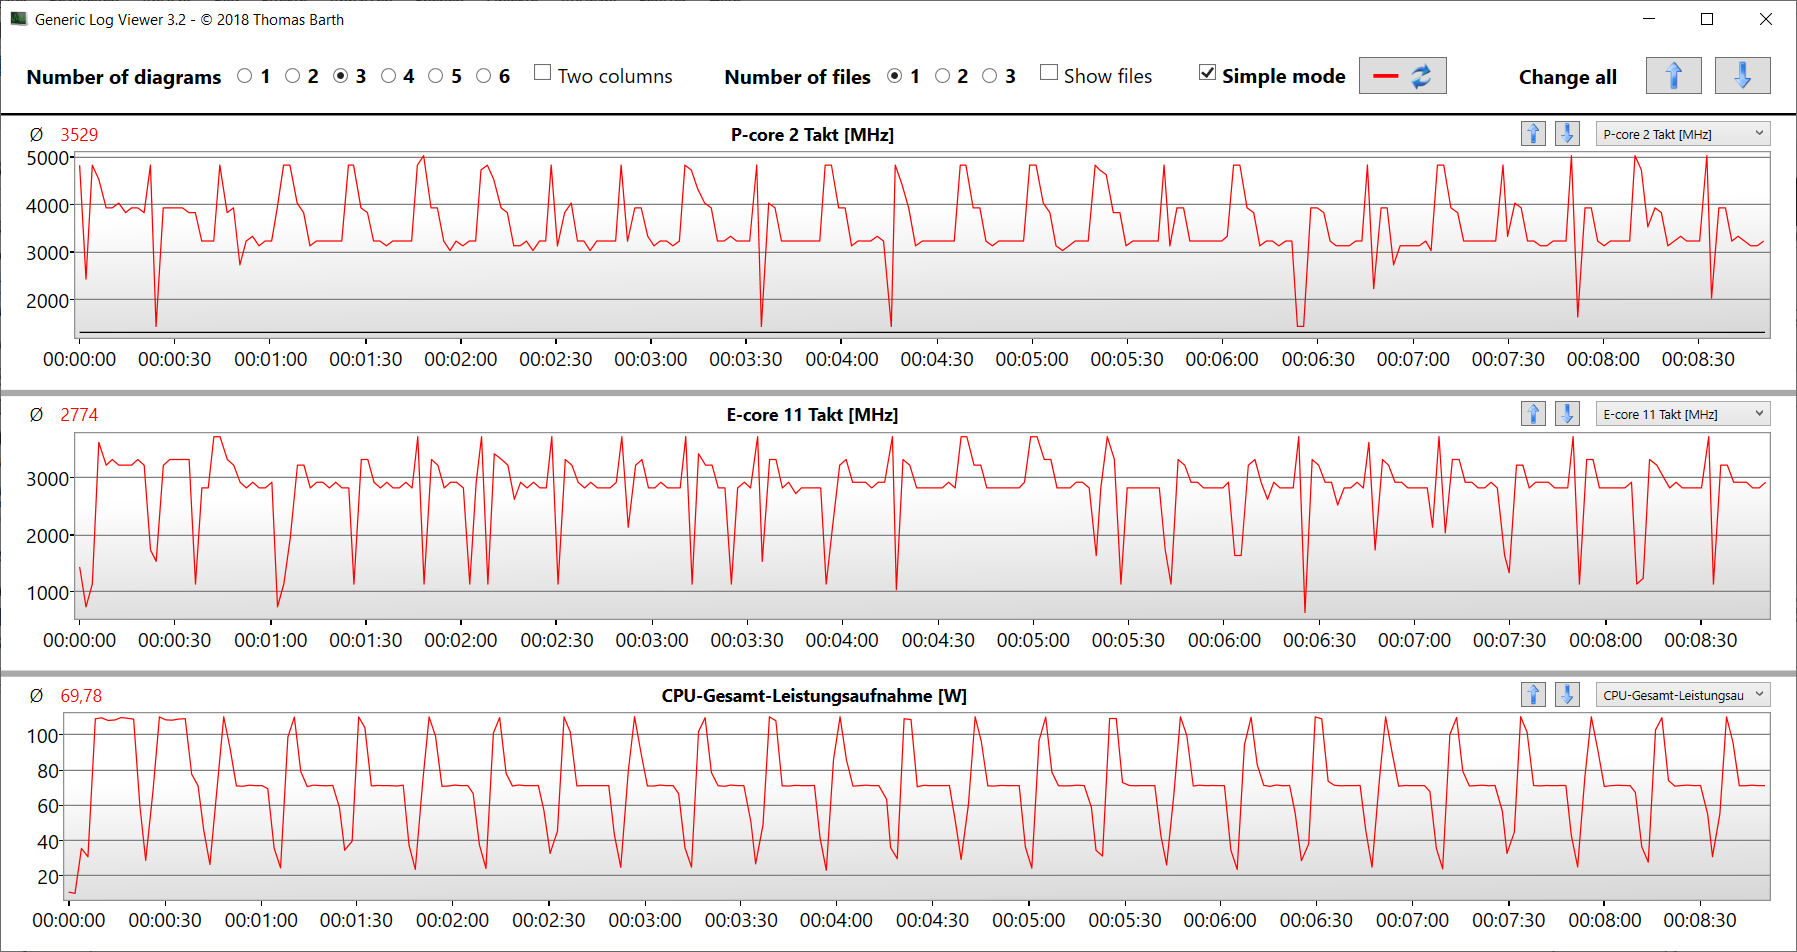
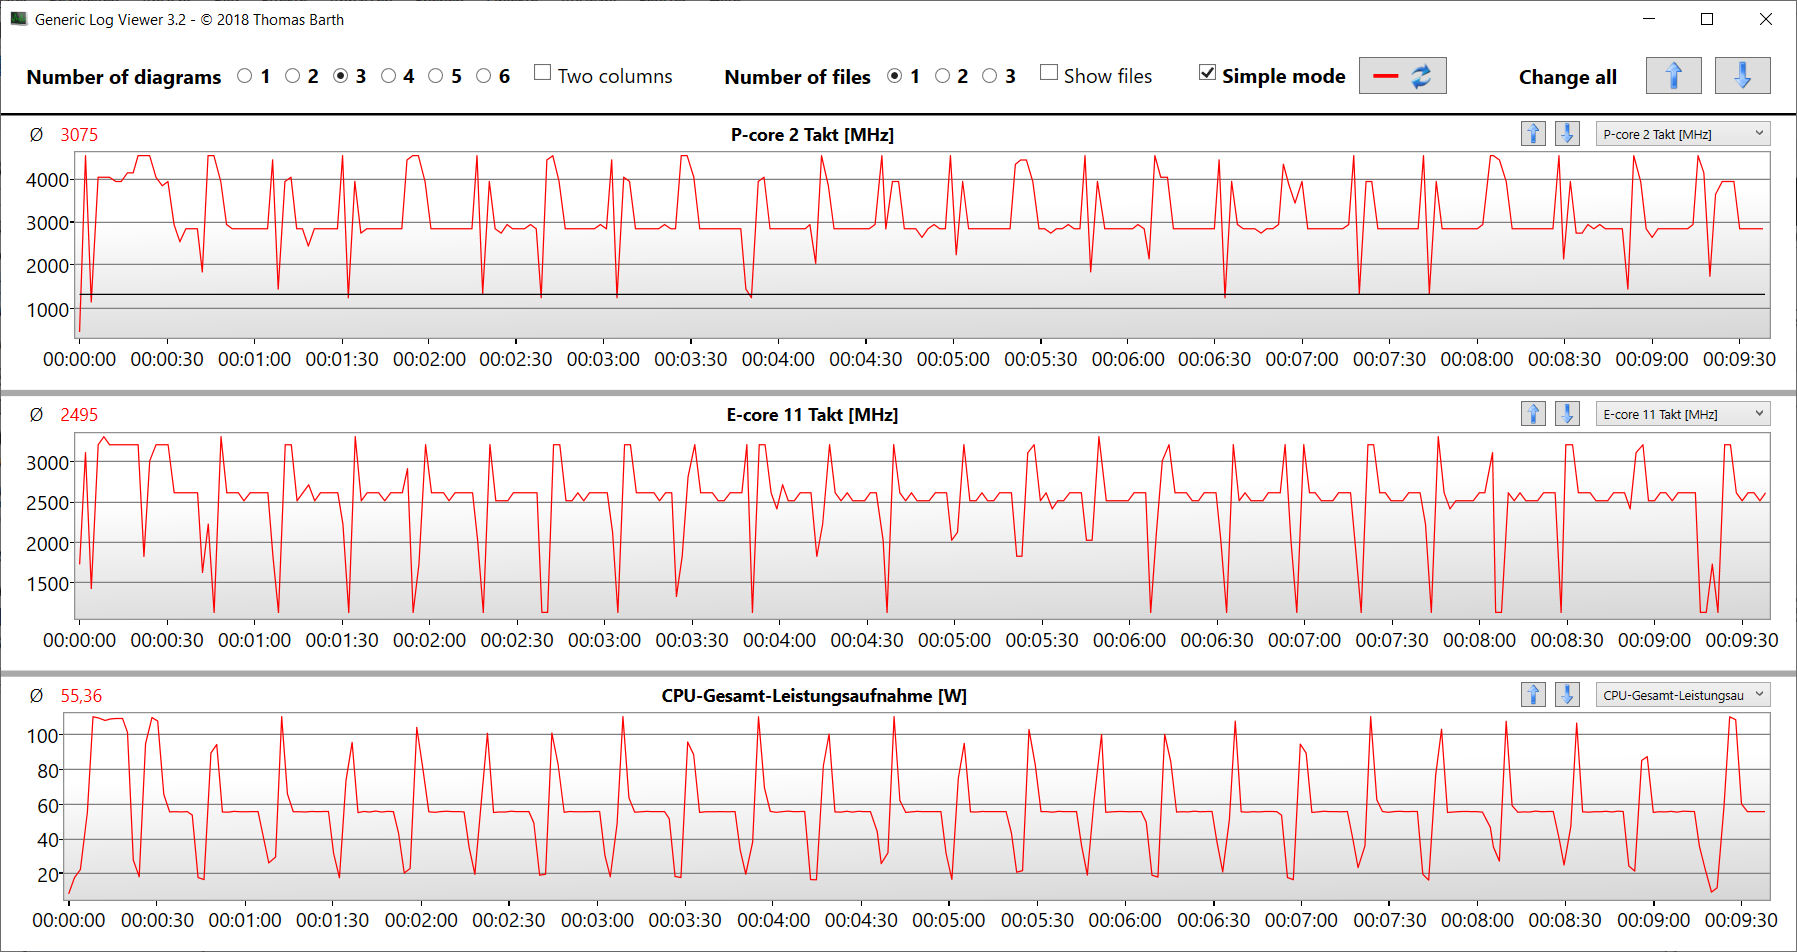
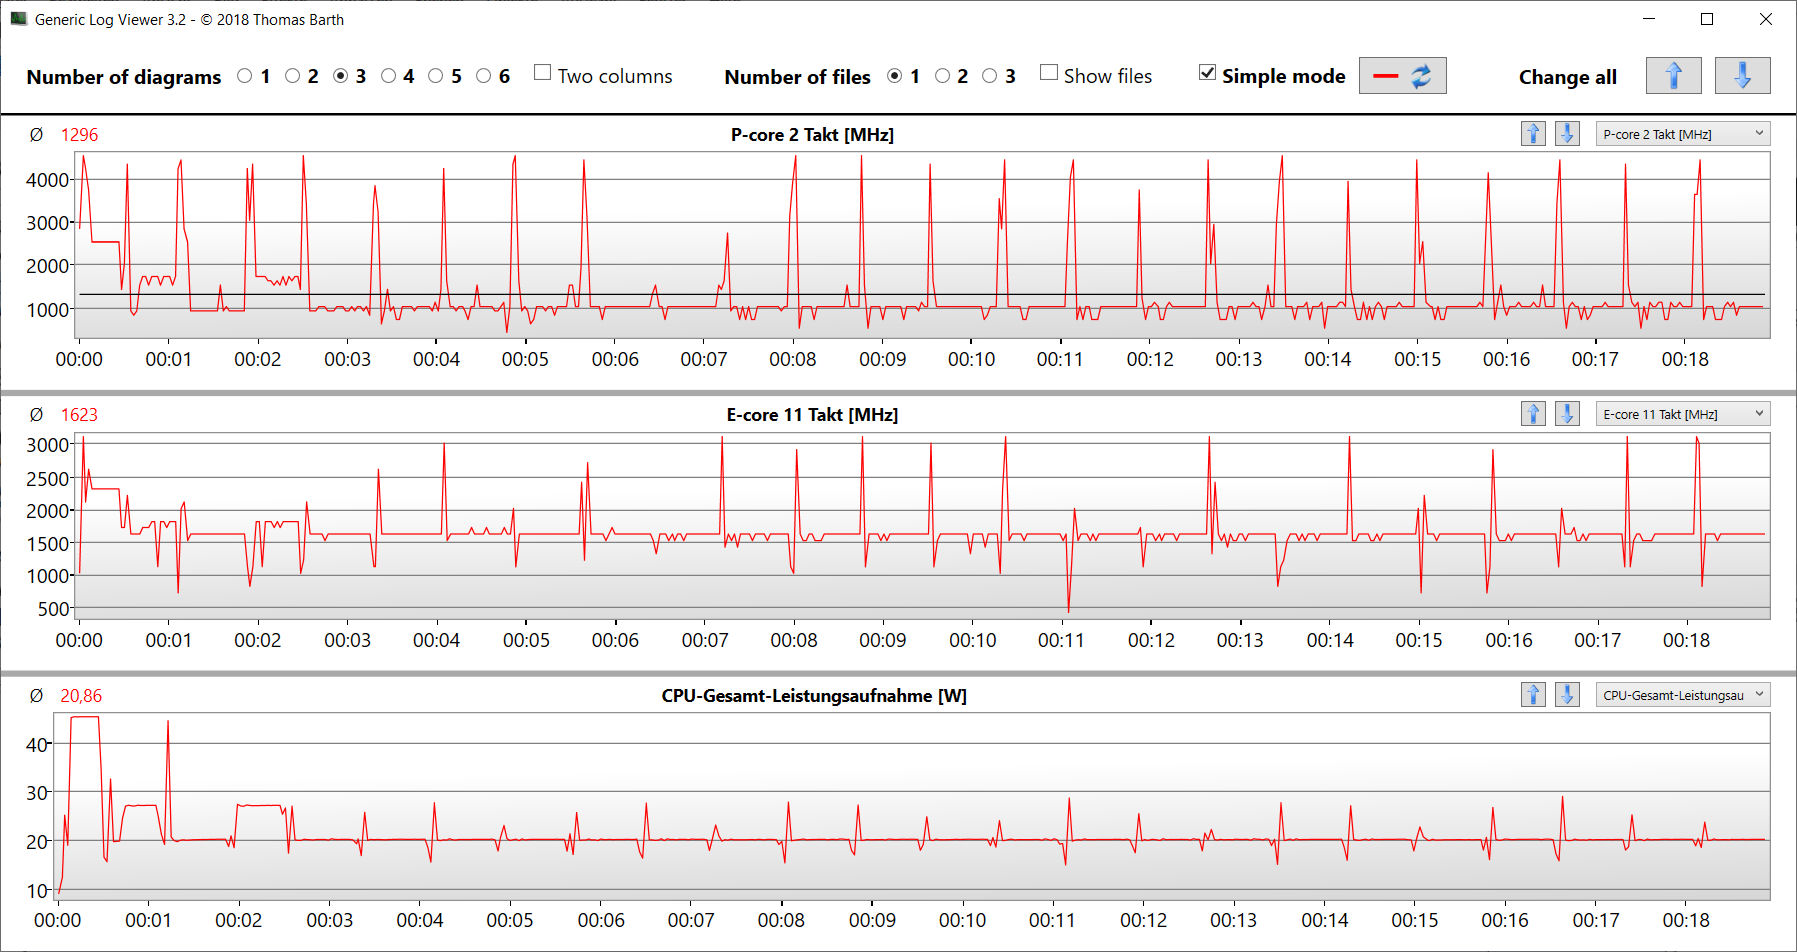
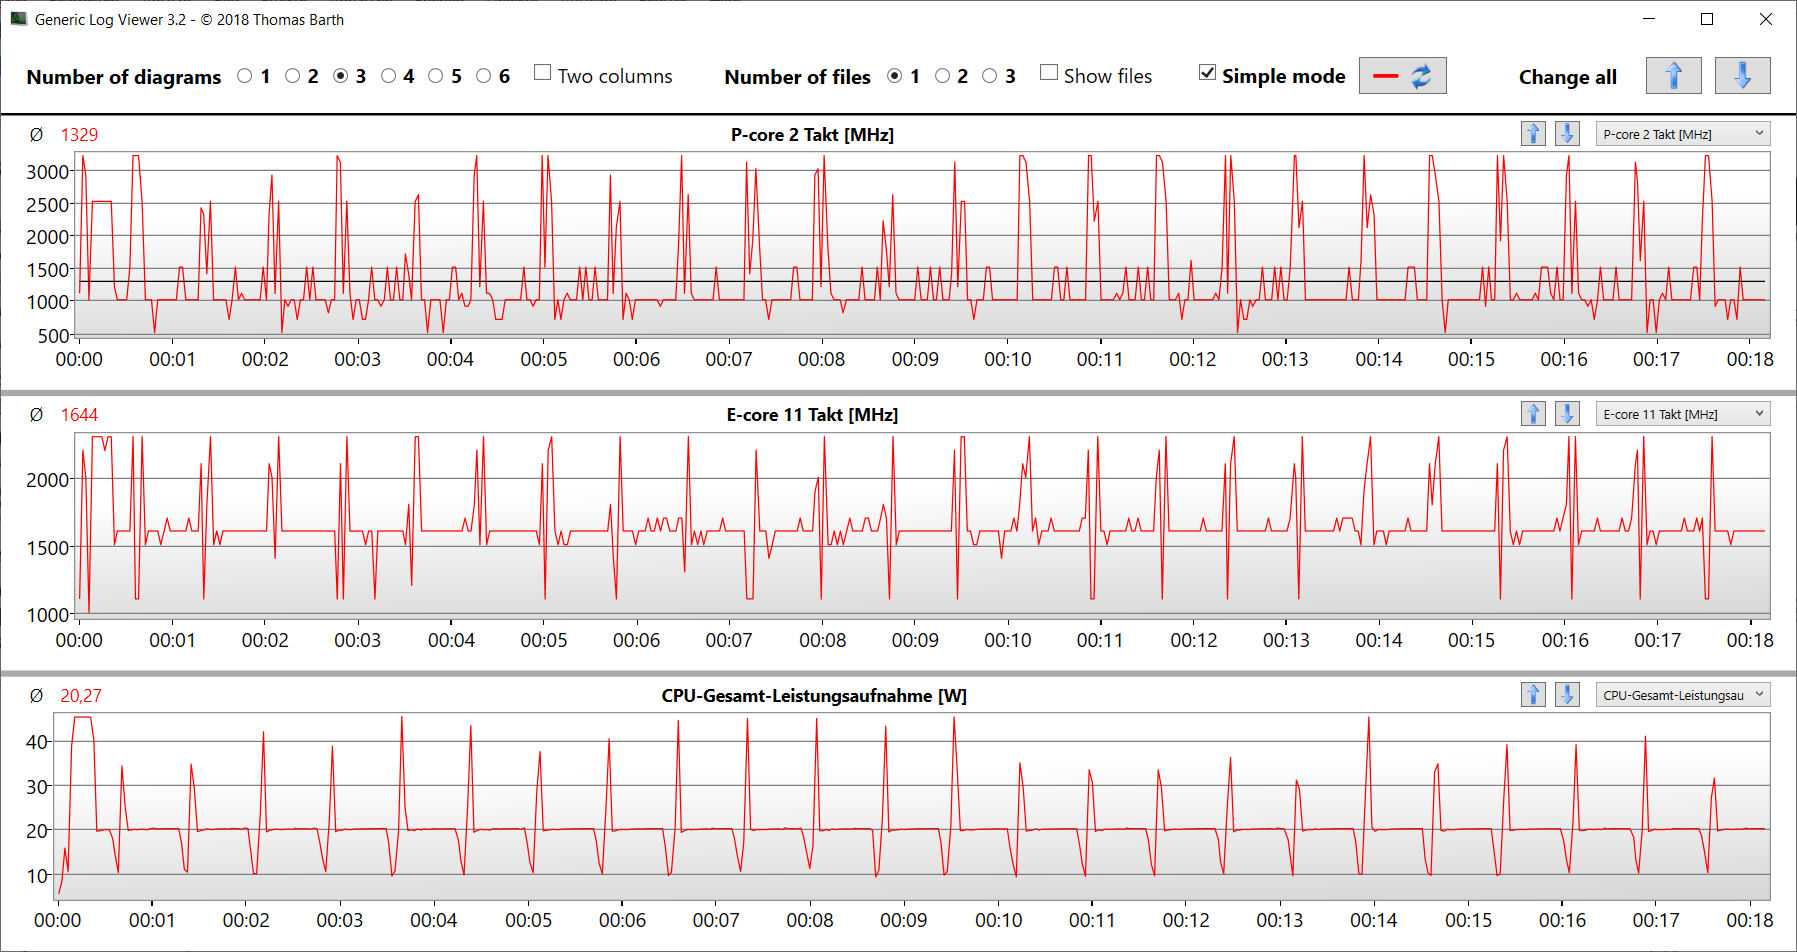
Test pętli CB15 potwierdził, że turbo procesora jest stale używane. Chociaż częstotliwość taktowania nieco spadła po pierwszym uruchomieniu, niezależnie od używanego profilu. "Turbo" wpłynęło na ogólnie wyższy poziom wydajności.
Cinebench R15 Multi continuous test
* ... im mniej tym lepiej
AIDA64: FP32 Ray-Trace | FPU Julia | CPU SHA3 | CPU Queen | FPU SinJulia | FPU Mandel | CPU AES | CPU ZLib | FP64 Ray-Trace | CPU PhotoWorxx
| Performance rating | |
| Średnia w klasie Gaming | |
| HP Omen Transcend 16 | |
| Asus TUF Gaming A16 FA617XS | |
| MSI Pulse 17 B13VGK | |
| Lenovo Legion Slim 7i 16 Gen 8 | |
| Acer Nitro 16 AN16-41 | |
| Aorus 15 BSF | |
| Przeciętny Intel Core i7-13700H | |
| AIDA64 / FP32 Ray-Trace | |
| Średnia w klasie Gaming (10227 - 85542, n=103, ostatnie 2 lata) | |
| Asus TUF Gaming A16 FA617XS | |
| HP Omen Transcend 16 | |
| MSI Pulse 17 B13VGK | |
| Lenovo Legion Slim 7i 16 Gen 8 | |
| Acer Nitro 16 AN16-41 | |
| Przeciętny Intel Core i7-13700H (4986 - 18908, n=29) | |
| Aorus 15 BSF | |
| AIDA64 / FPU Julia | |
| Średnia w klasie Gaming (51376 - 238426, n=103, ostatnie 2 lata) | |
| Asus TUF Gaming A16 FA617XS | |
| HP Omen Transcend 16 | |
| Acer Nitro 16 AN16-41 | |
| MSI Pulse 17 B13VGK | |
| Lenovo Legion Slim 7i 16 Gen 8 | |
| Przeciętny Intel Core i7-13700H (25360 - 92359, n=29) | |
| Aorus 15 BSF | |
| AIDA64 / CPU SHA3 | |
| Średnia w klasie Gaming (2180 - 9817, n=103, ostatnie 2 lata) | |
| HP Omen Transcend 16 | |
| Asus TUF Gaming A16 FA617XS | |
| MSI Pulse 17 B13VGK | |
| Lenovo Legion Slim 7i 16 Gen 8 | |
| Acer Nitro 16 AN16-41 | |
| Aorus 15 BSF | |
| Przeciętny Intel Core i7-13700H (1339 - 4224, n=29) | |
| AIDA64 / CPU Queen | |
| HP Omen Transcend 16 | |
| Asus TUF Gaming A16 FA617XS | |
| Lenovo Legion Slim 7i 16 Gen 8 | |
| Średnia w klasie Gaming (49785 - 173351, n=90, ostatnie 2 lata) | |
| Acer Nitro 16 AN16-41 | |
| Aorus 15 BSF | |
| MSI Pulse 17 B13VGK | |
| Przeciętny Intel Core i7-13700H (59324 - 107159, n=29) | |
| AIDA64 / FPU SinJulia | |
| Asus TUF Gaming A16 FA617XS | |
| Średnia w klasie Gaming (4424 - 33636, n=103, ostatnie 2 lata) | |
| HP Omen Transcend 16 | |
| Acer Nitro 16 AN16-41 | |
| Lenovo Legion Slim 7i 16 Gen 8 | |
| MSI Pulse 17 B13VGK | |
| Aorus 15 BSF | |
| Przeciętny Intel Core i7-13700H (4800 - 11050, n=29) | |
| AIDA64 / FPU Mandel | |
| Średnia w klasie Gaming (25115 - 128721, n=103, ostatnie 2 lata) | |
| Asus TUF Gaming A16 FA617XS | |
| HP Omen Transcend 16 | |
| Acer Nitro 16 AN16-41 | |
| MSI Pulse 17 B13VGK | |
| Lenovo Legion Slim 7i 16 Gen 8 | |
| Przeciętny Intel Core i7-13700H (12321 - 45118, n=29) | |
| Aorus 15 BSF | |
| AIDA64 / CPU AES | |
| Aorus 15 BSF | |
| HP Omen Transcend 16 | |
| Średnia w klasie Gaming (39258 - 247074, n=103, ostatnie 2 lata) | |
| Asus TUF Gaming A16 FA617XS | |
| MSI Pulse 17 B13VGK | |
| Lenovo Legion Slim 7i 16 Gen 8 | |
| Przeciętny Intel Core i7-13700H (28769 - 151254, n=29) | |
| Acer Nitro 16 AN16-41 | |
| AIDA64 / CPU ZLib | |
| HP Omen Transcend 16 | |
| Średnia w klasie Gaming (574 - 2531, n=103, ostatnie 2 lata) | |
| Lenovo Legion Slim 7i 16 Gen 8 | |
| MSI Pulse 17 B13VGK | |
| Asus TUF Gaming A16 FA617XS | |
| Przeciętny Intel Core i7-13700H (389 - 1215, n=29) | |
| Aorus 15 BSF | |
| Acer Nitro 16 AN16-41 | |
| AIDA64 / FP64 Ray-Trace | |
| Średnia w klasie Gaming (5509 - 45446, n=103, ostatnie 2 lata) | |
| Asus TUF Gaming A16 FA617XS | |
| HP Omen Transcend 16 | |
| MSI Pulse 17 B13VGK | |
| Lenovo Legion Slim 7i 16 Gen 8 | |
| Acer Nitro 16 AN16-41 | |
| Przeciętny Intel Core i7-13700H (2540 - 10135, n=29) | |
| Aorus 15 BSF | |
| AIDA64 / CPU PhotoWorxx | |
| HP Omen Transcend 16 | |
| Średnia w klasie Gaming (12271 - 89891, n=103, ostatnie 2 lata) | |
| Przeciętny Intel Core i7-13700H (12872 - 52727, n=29) | |
| MSI Pulse 17 B13VGK | |
| Aorus 15 BSF | |
| Asus TUF Gaming A16 FA617XS | |
| Acer Nitro 16 AN16-41 | |
| Lenovo Legion Slim 7i 16 Gen 8 | |
Wydajność systemu
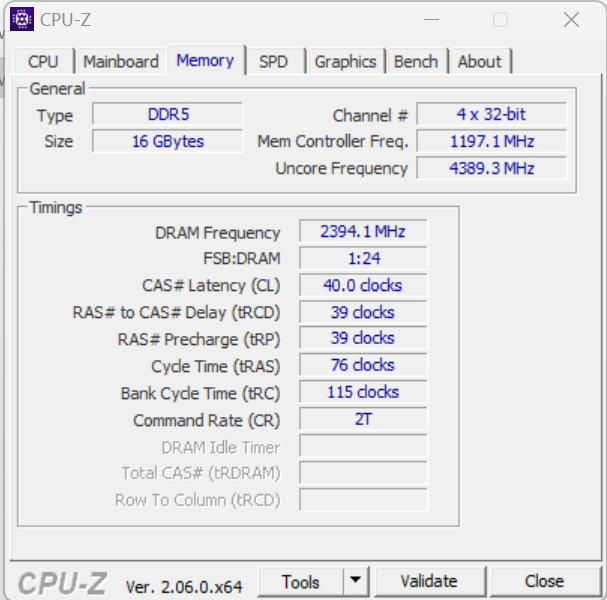
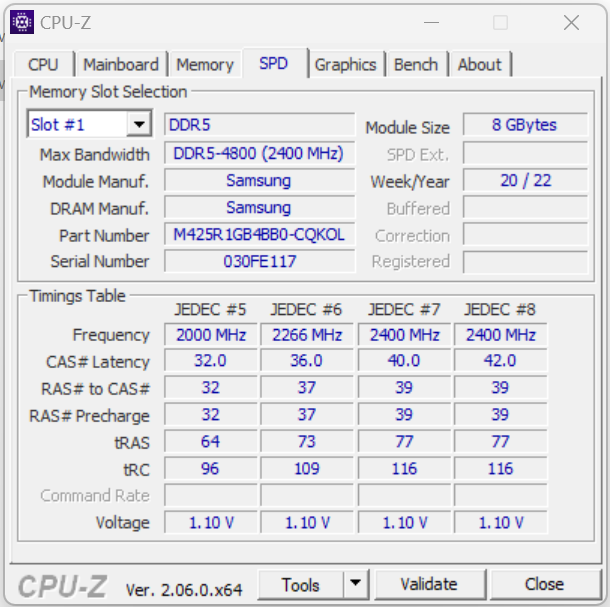
Płynnie działającemu systemowi nie brakuje żadnej wydajności obliczeniowej. Rendering i gry nie stanowią dla laptopa żadnego problemu. Szybkość transferu pamięci RAM była mniej więcej na średnim poziomie dla pamięci DDR5 4800 RAM.
CrossMark: Overall | Productivity | Creativity | Responsiveness
| PCMark 10 / Score | |
| Lenovo Legion Slim 7i 16 Gen 8 | |
| Średnia w klasie Gaming (5828 - 11574, n=92, ostatnie 2 lata) | |
| HP Omen Transcend 16 | |
| Asus TUF Gaming A16 FA617XS | |
| MSI Pulse 17 B13VGK | |
| Przeciętny Intel Core i7-13700H, NVIDIA GeForce RTX 4070 Laptop GPU (7158 - 7956, n=8) | |
| Aorus 15 BSF | |
| Acer Nitro 16 AN16-41 | |
| PCMark 10 / Essentials | |
| Lenovo Legion Slim 7i 16 Gen 8 | |
| HP Omen Transcend 16 | |
| Asus TUF Gaming A16 FA617XS | |
| Aorus 15 BSF | |
| Przeciętny Intel Core i7-13700H, NVIDIA GeForce RTX 4070 Laptop GPU (10252 - 11449, n=8) | |
| Średnia w klasie Gaming (8810 - 11935, n=96, ostatnie 2 lata) | |
| Acer Nitro 16 AN16-41 | |
| MSI Pulse 17 B13VGK | |
| PCMark 10 / Productivity | |
| Lenovo Legion Slim 7i 16 Gen 8 | |
| Średnia w klasie Gaming (6845 - 21327, n=94, ostatnie 2 lata) | |
| MSI Pulse 17 B13VGK | |
| Asus TUF Gaming A16 FA617XS | |
| HP Omen Transcend 16 | |
| Przeciętny Intel Core i7-13700H, NVIDIA GeForce RTX 4070 Laptop GPU (8501 - 10769, n=8) | |
| Acer Nitro 16 AN16-41 | |
| Aorus 15 BSF | |
| PCMark 10 / Digital Content Creation | |
| Średnia w klasie Gaming (7602 - 19657, n=94, ostatnie 2 lata) | |
| Lenovo Legion Slim 7i 16 Gen 8 | |
| HP Omen Transcend 16 | |
| Asus TUF Gaming A16 FA617XS | |
| MSI Pulse 17 B13VGK | |
| Przeciętny Intel Core i7-13700H, NVIDIA GeForce RTX 4070 Laptop GPU (10358 - 12908, n=8) | |
| Aorus 15 BSF | |
| Acer Nitro 16 AN16-41 | |
| CrossMark / Overall | |
| Aorus 15 BSF | |
| Średnia w klasie Gaming (1366 - 2409, n=93, ostatnie 2 lata) | |
| Lenovo Legion Slim 7i 16 Gen 8 | |
| HP Omen Transcend 16 | |
| MSI Pulse 17 B13VGK | |
| Przeciętny Intel Core i7-13700H, NVIDIA GeForce RTX 4070 Laptop GPU (1768 - 2073, n=6) | |
| Asus TUF Gaming A16 FA617XS | |
| Acer Nitro 16 AN16-41 | |
| CrossMark / Productivity | |
| Aorus 15 BSF | |
| Lenovo Legion Slim 7i 16 Gen 8 | |
| Średnia w klasie Gaming (1386 - 2254, n=93, ostatnie 2 lata) | |
| HP Omen Transcend 16 | |
| MSI Pulse 17 B13VGK | |
| Przeciętny Intel Core i7-13700H, NVIDIA GeForce RTX 4070 Laptop GPU (1645 - 2006, n=6) | |
| Asus TUF Gaming A16 FA617XS | |
| Acer Nitro 16 AN16-41 | |
| CrossMark / Creativity | |
| HP Omen Transcend 16 | |
| Średnia w klasie Gaming (1343 - 2729, n=93, ostatnie 2 lata) | |
| Aorus 15 BSF | |
| Lenovo Legion Slim 7i 16 Gen 8 | |
| MSI Pulse 17 B13VGK | |
| Przeciętny Intel Core i7-13700H, NVIDIA GeForce RTX 4070 Laptop GPU (1936 - 2137, n=6) | |
| Asus TUF Gaming A16 FA617XS | |
| Acer Nitro 16 AN16-41 | |
| CrossMark / Responsiveness | |
| Aorus 15 BSF | |
| Lenovo Legion Slim 7i 16 Gen 8 | |
| MSI Pulse 17 B13VGK | |
| Przeciętny Intel Core i7-13700H, NVIDIA GeForce RTX 4070 Laptop GPU (1451 - 2202, n=6) | |
| Średnia w klasie Gaming (1226 - 2334, n=93, ostatnie 2 lata) | |
| HP Omen Transcend 16 | |
| Asus TUF Gaming A16 FA617XS | |
| Acer Nitro 16 AN16-41 | |
| PCMark 10 Score | 7309 pkt. | |
Pomoc | ||
| AIDA64 / Memory Copy | |
| HP Omen Transcend 16 | |
| Średnia w klasie Gaming (21750 - 129946, n=103, ostatnie 2 lata) | |
| Przeciętny Intel Core i7-13700H (24334 - 78081, n=29) | |
| MSI Pulse 17 B13VGK | |
| Aorus 15 BSF | |
| Asus TUF Gaming A16 FA617XS | |
| Acer Nitro 16 AN16-41 | |
| Lenovo Legion Slim 7i 16 Gen 8 | |
| AIDA64 / Memory Read | |
| HP Omen Transcend 16 | |
| Średnia w klasie Gaming (22956 - 118858, n=103, ostatnie 2 lata) | |
| MSI Pulse 17 B13VGK | |
| Aorus 15 BSF | |
| Przeciętny Intel Core i7-13700H (23681 - 79656, n=29) | |
| Asus TUF Gaming A16 FA617XS | |
| Acer Nitro 16 AN16-41 | |
| Lenovo Legion Slim 7i 16 Gen 8 | |
| AIDA64 / Memory Write | |
| Aorus 15 BSF | |
| HP Omen Transcend 16 | |
| Średnia w klasie Gaming (22297 - 135096, n=103, ostatnie 2 lata) | |
| Asus TUF Gaming A16 FA617XS | |
| Przeciętny Intel Core i7-13700H (22986 - 99898, n=29) | |
| MSI Pulse 17 B13VGK | |
| Acer Nitro 16 AN16-41 | |
| Lenovo Legion Slim 7i 16 Gen 8 | |
| AIDA64 / Memory Latency | |
| Średnia w klasie Gaming (75.3 - 259, n=103, ostatnie 2 lata) | |
| MSI Pulse 17 B13VGK | |
| Przeciętny Intel Core i7-13700H (82.4 - 136.8, n=29) | |
| Acer Nitro 16 AN16-41 | |
| Aorus 15 BSF | |
| Asus TUF Gaming A16 FA617XS | |
| HP Omen Transcend 16 | |
| Lenovo Legion Slim 7i 16 Gen 8 | |
* ... im mniej tym lepiej
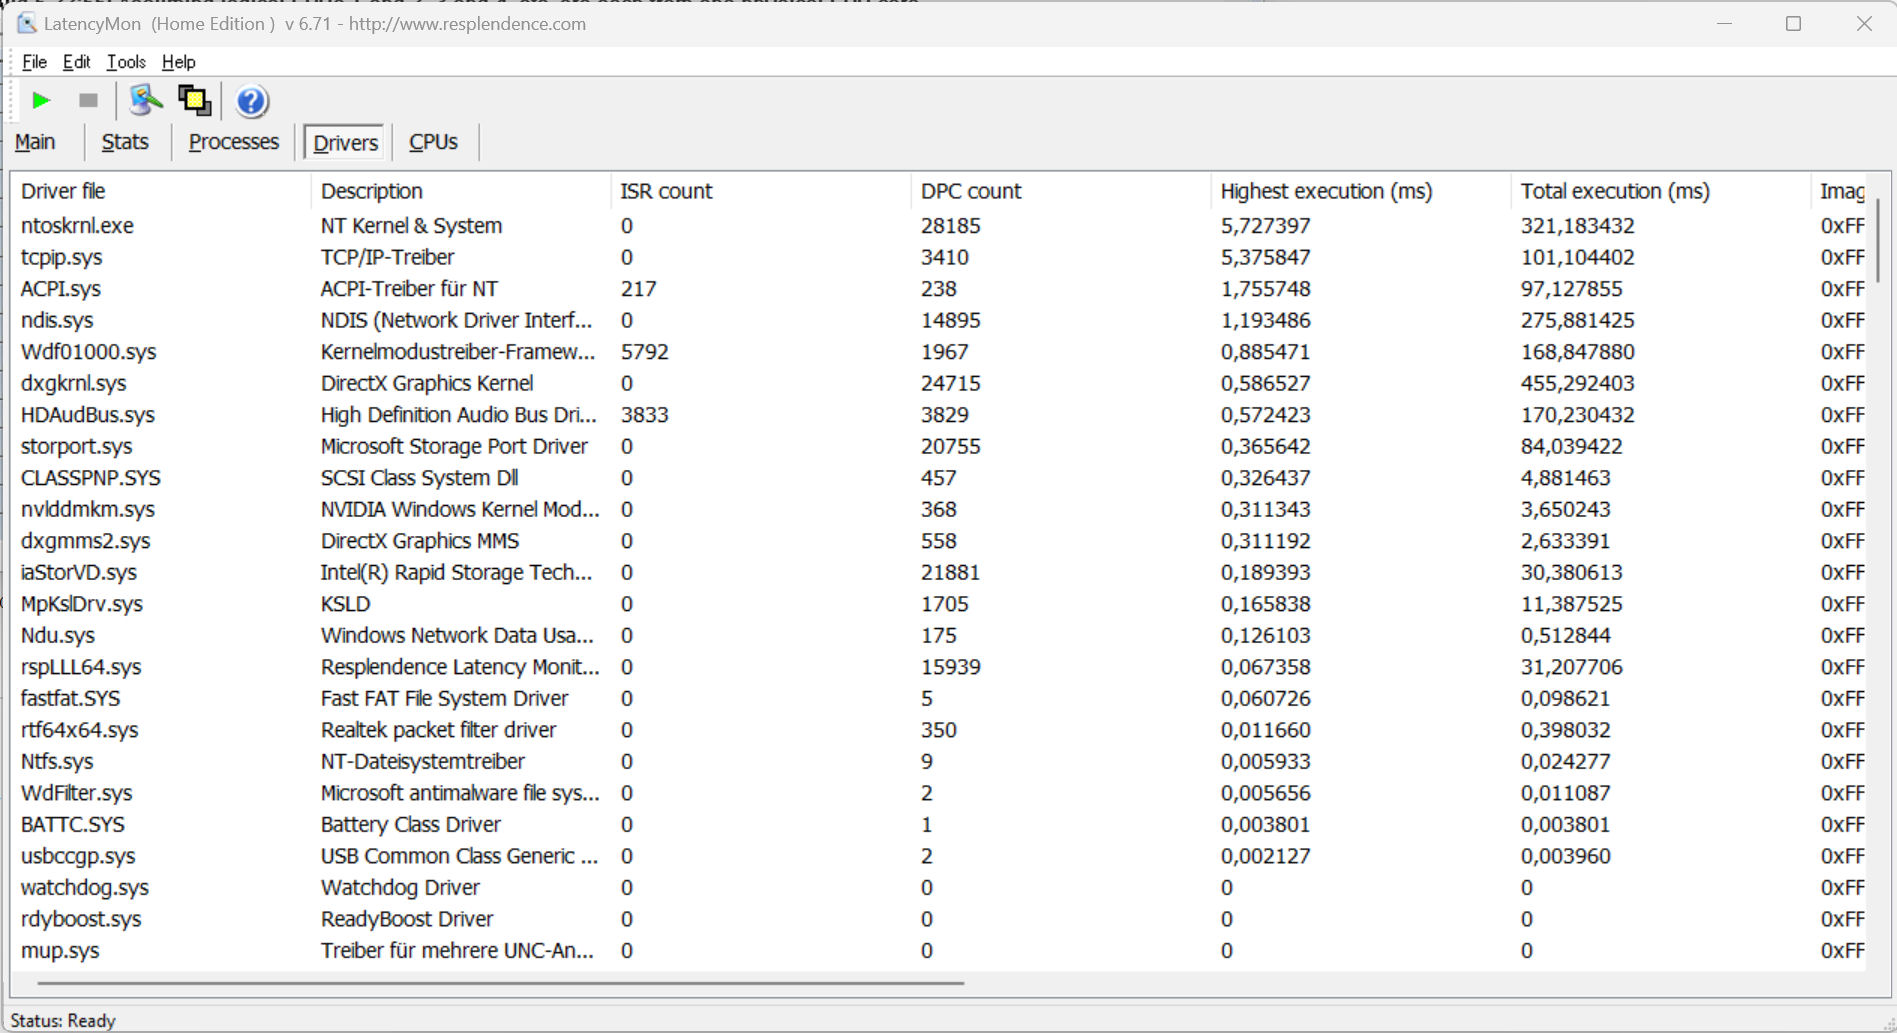
Opóźnienie DPC
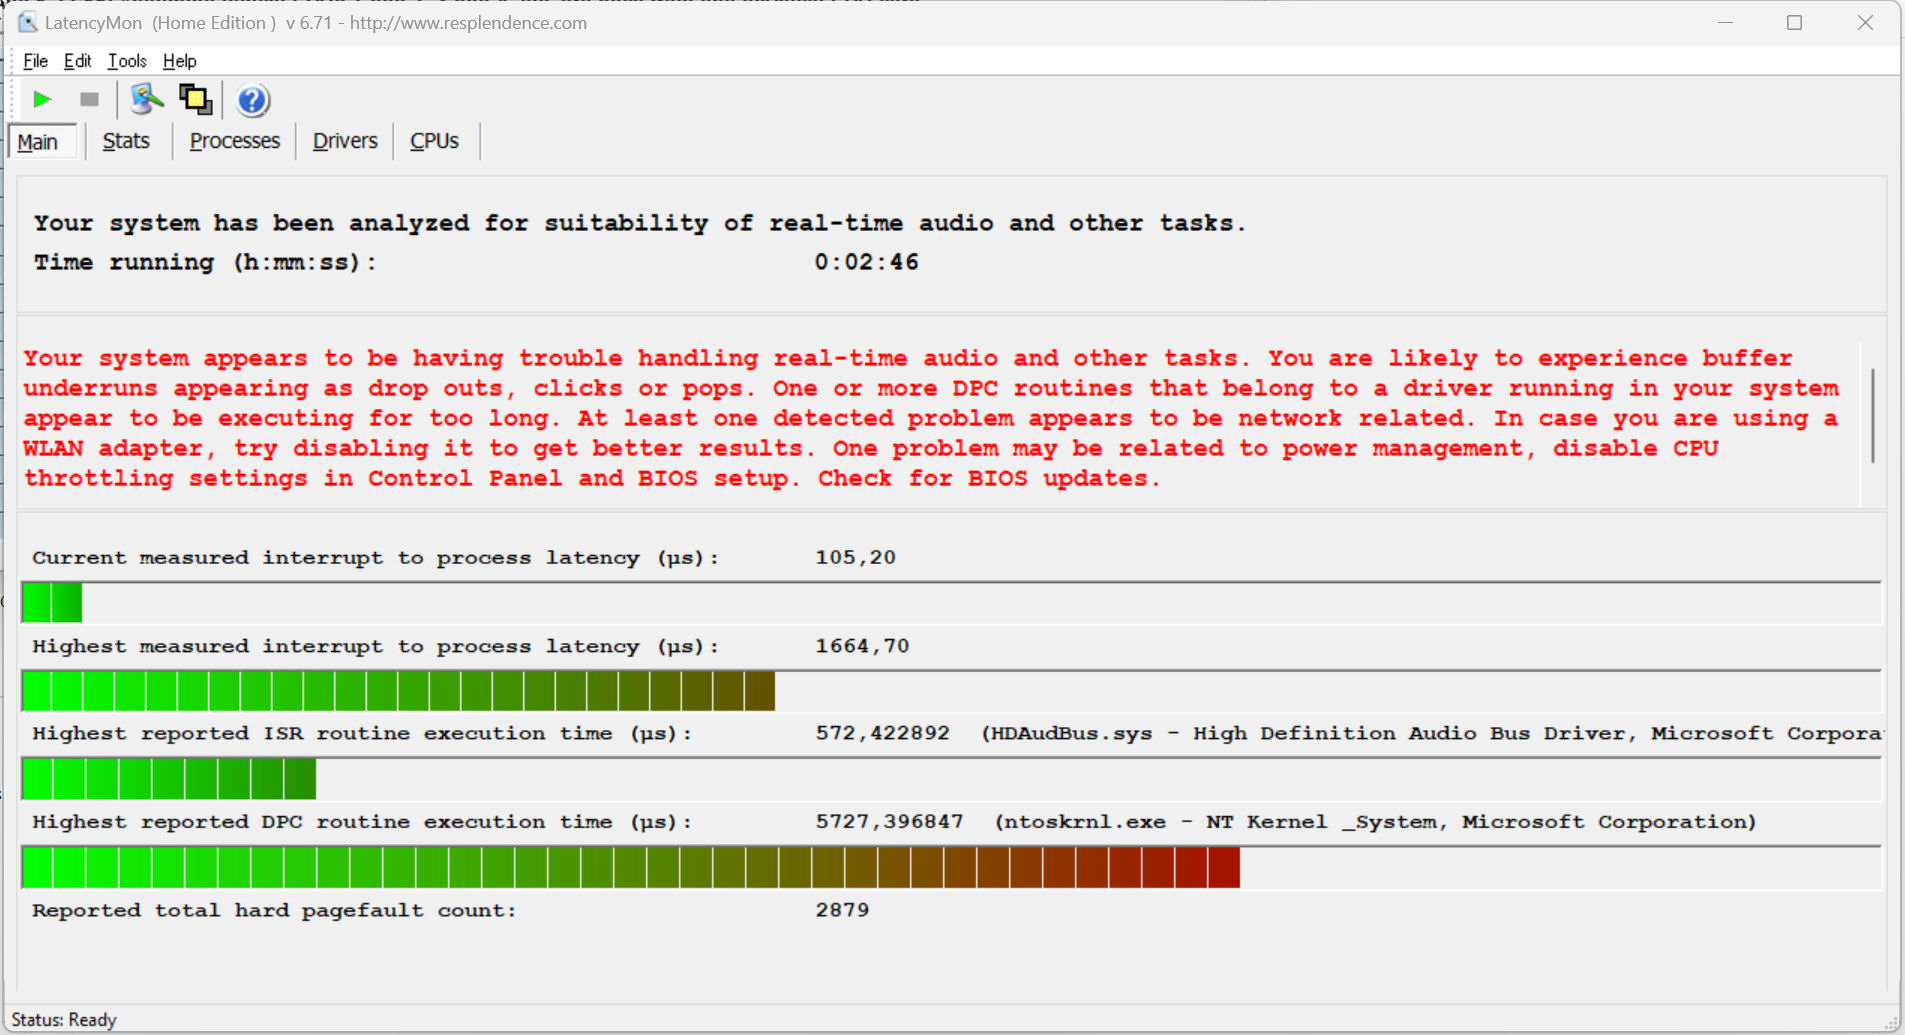
Standardowy test monitora opóźnień (surfowanie po sieci, odtwarzanie wideo 4k, wysokie obciążenie Prime95) ujawnił pewne anomalie. System nie wydaje się być odpowiedni do edycji wideo i audio w czasie rzeczywistym. Przyszłe aktualizacje oprogramowania mogą doprowadzić do poprawy lub nawet pogorszenia wydajności.
| DPC Latencies / LatencyMon - interrupt to process latency (max), Web, Youtube, Prime95 | |
| Lenovo Legion Slim 7i 16 Gen 8 | |
| Aorus 15 BSF | |
| HP Omen Transcend 16 | |
| Acer Nitro 16 AN16-41 | |
| Asus TUF Gaming A16 FA617XS | |
| MSI Pulse 17 B13VGK | |
* ... im mniej tym lepiej
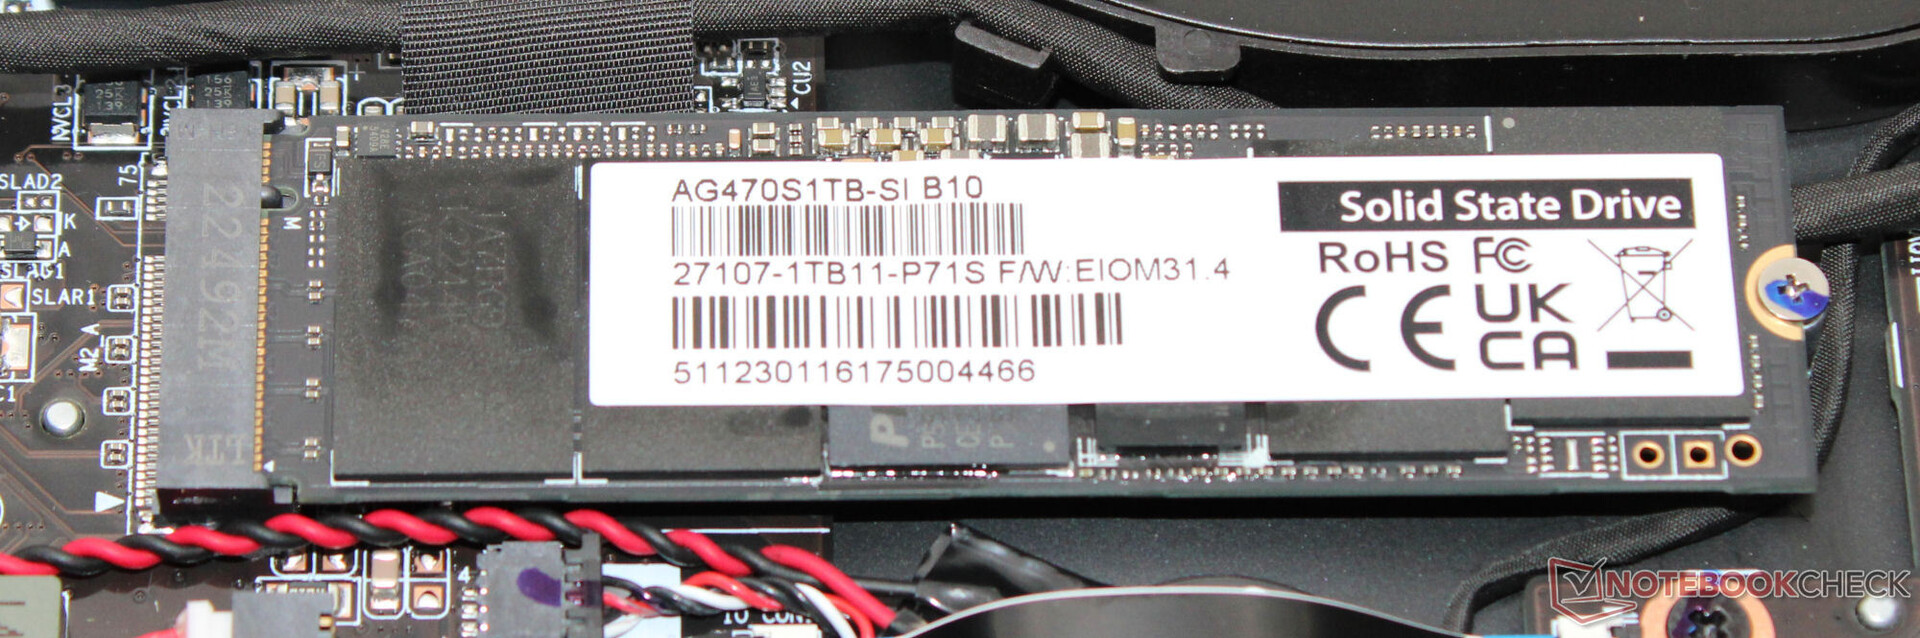
Urządzenia pamięci masowej
Laptop jest wyposażony w dysk SSD o pojemności 1 TB (PCIe 4, M.2 2280) firmy Gigabyte, który wykazał się bardzo dobrymi prędkościami przesyłu danych. Pozytywne: Nie odnotowaliśmy żadnego throttlingu związanego z temperaturą. Urządzenie ma miejsce na kolejny dysk SSD.

* ... im mniej tym lepiej
Reading continuous performance: DiskSpd Read Loop, Queue Depth 8
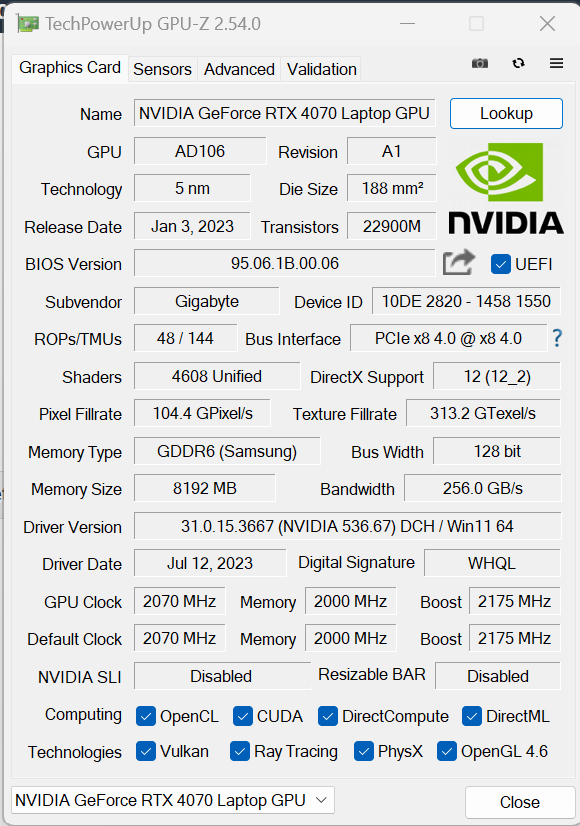
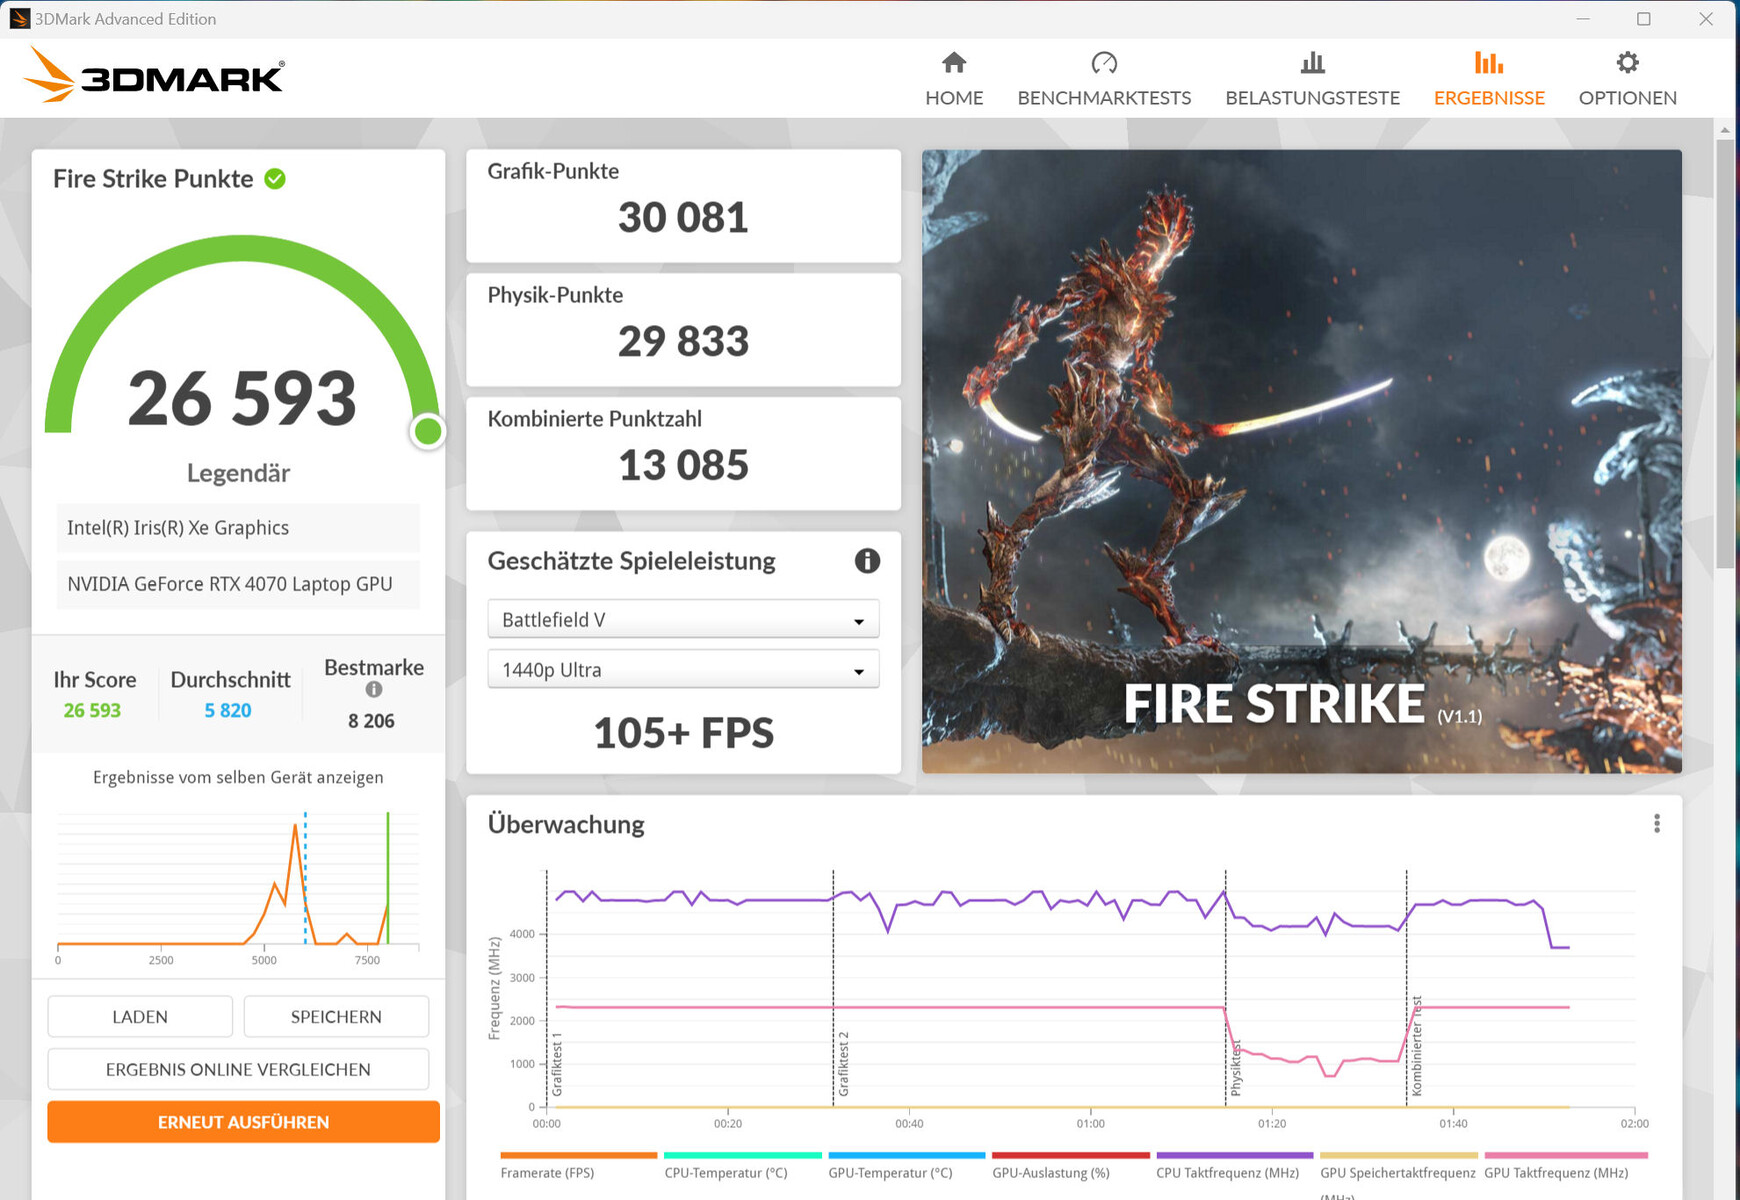
Karta graficzna
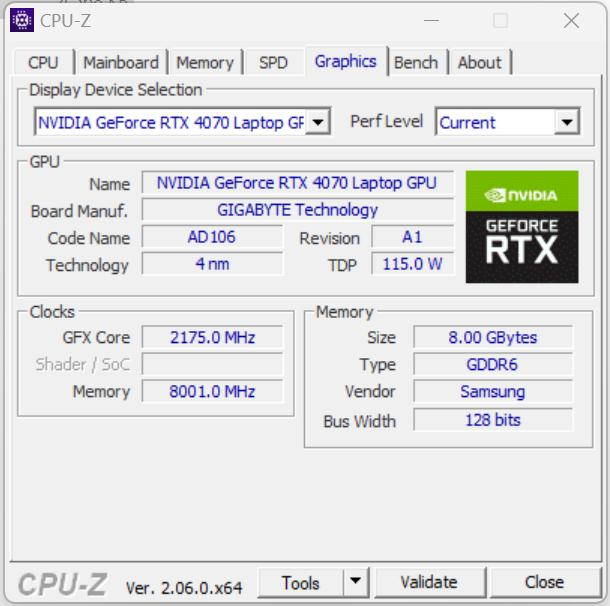
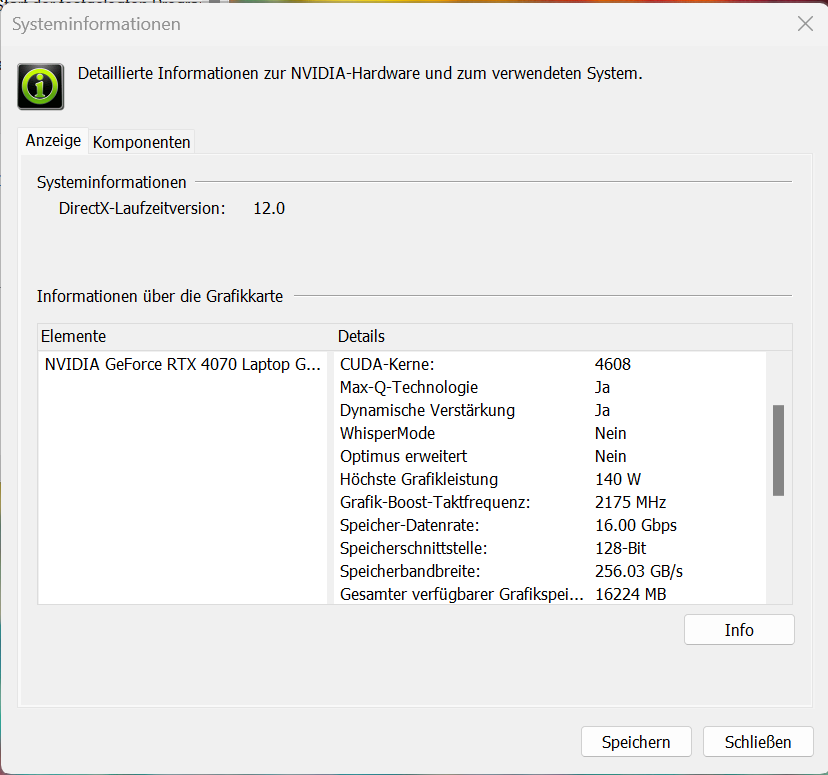
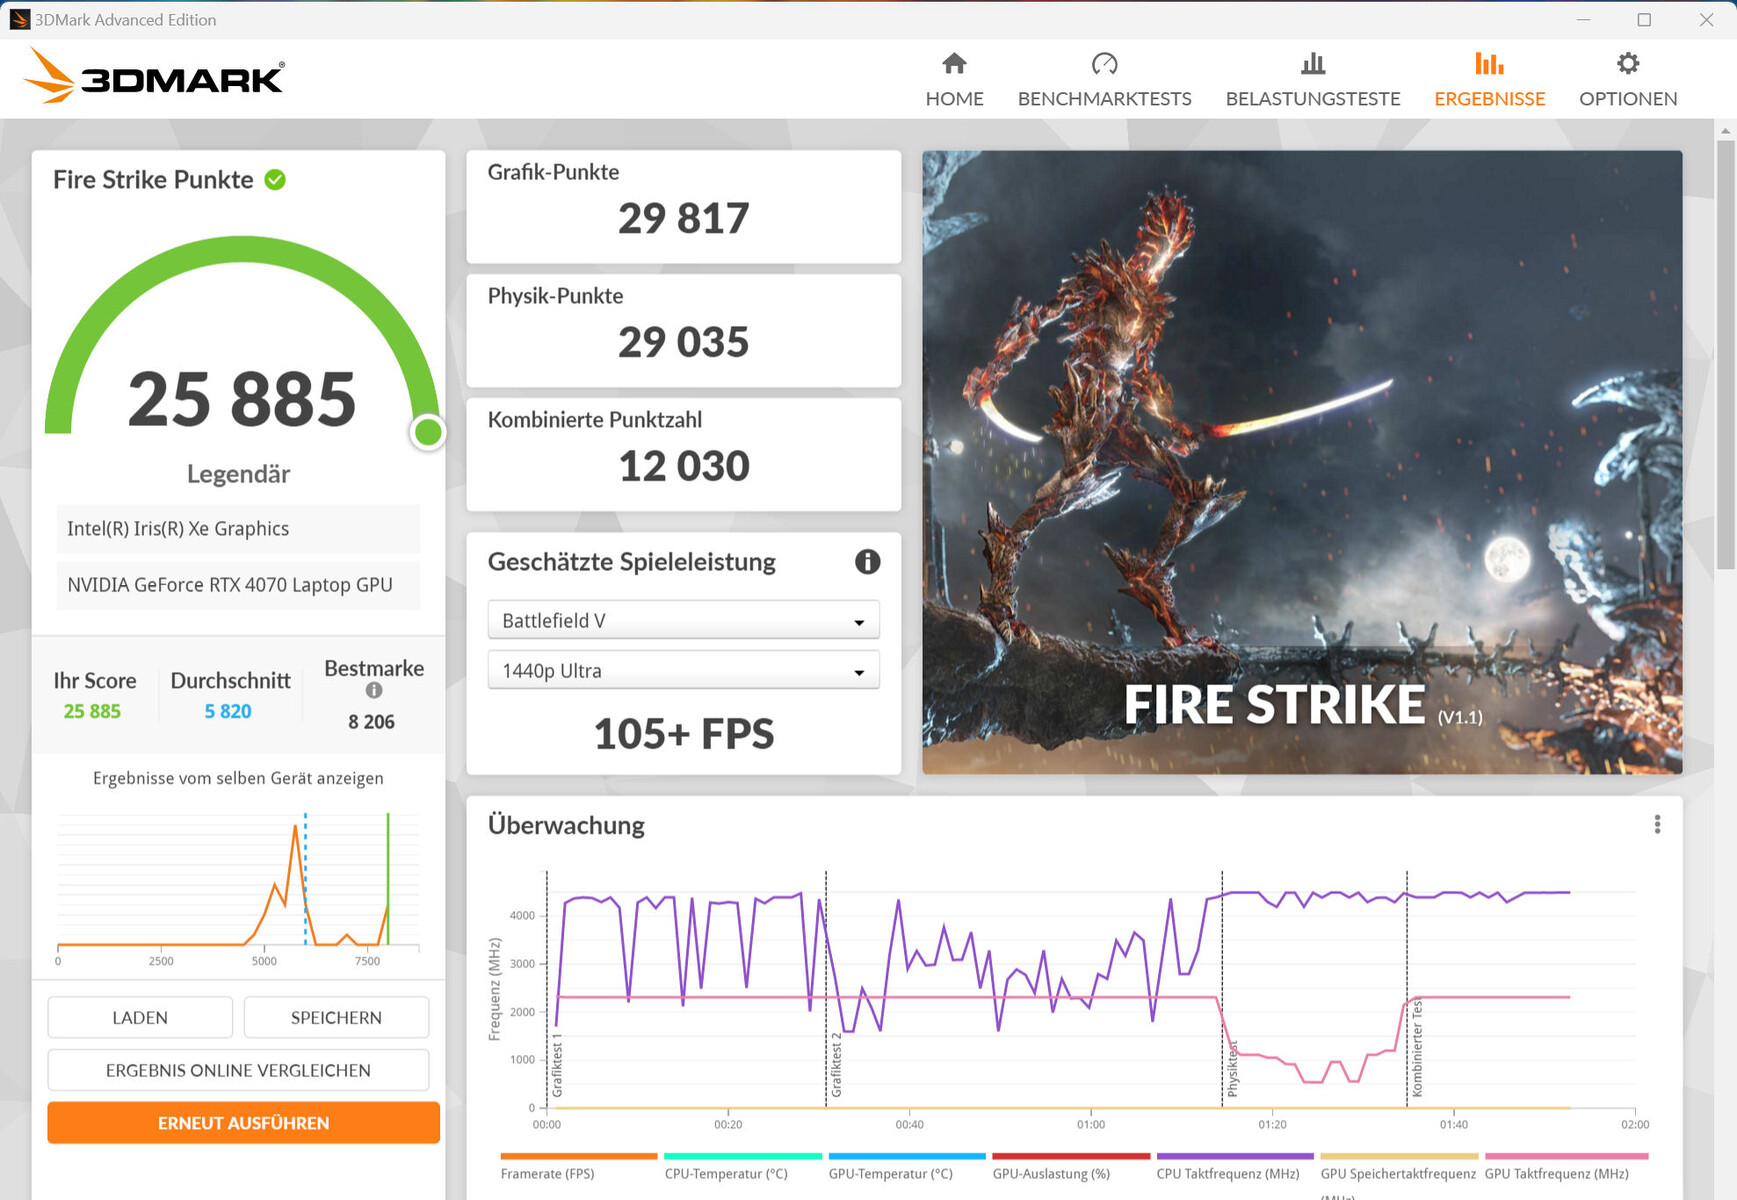
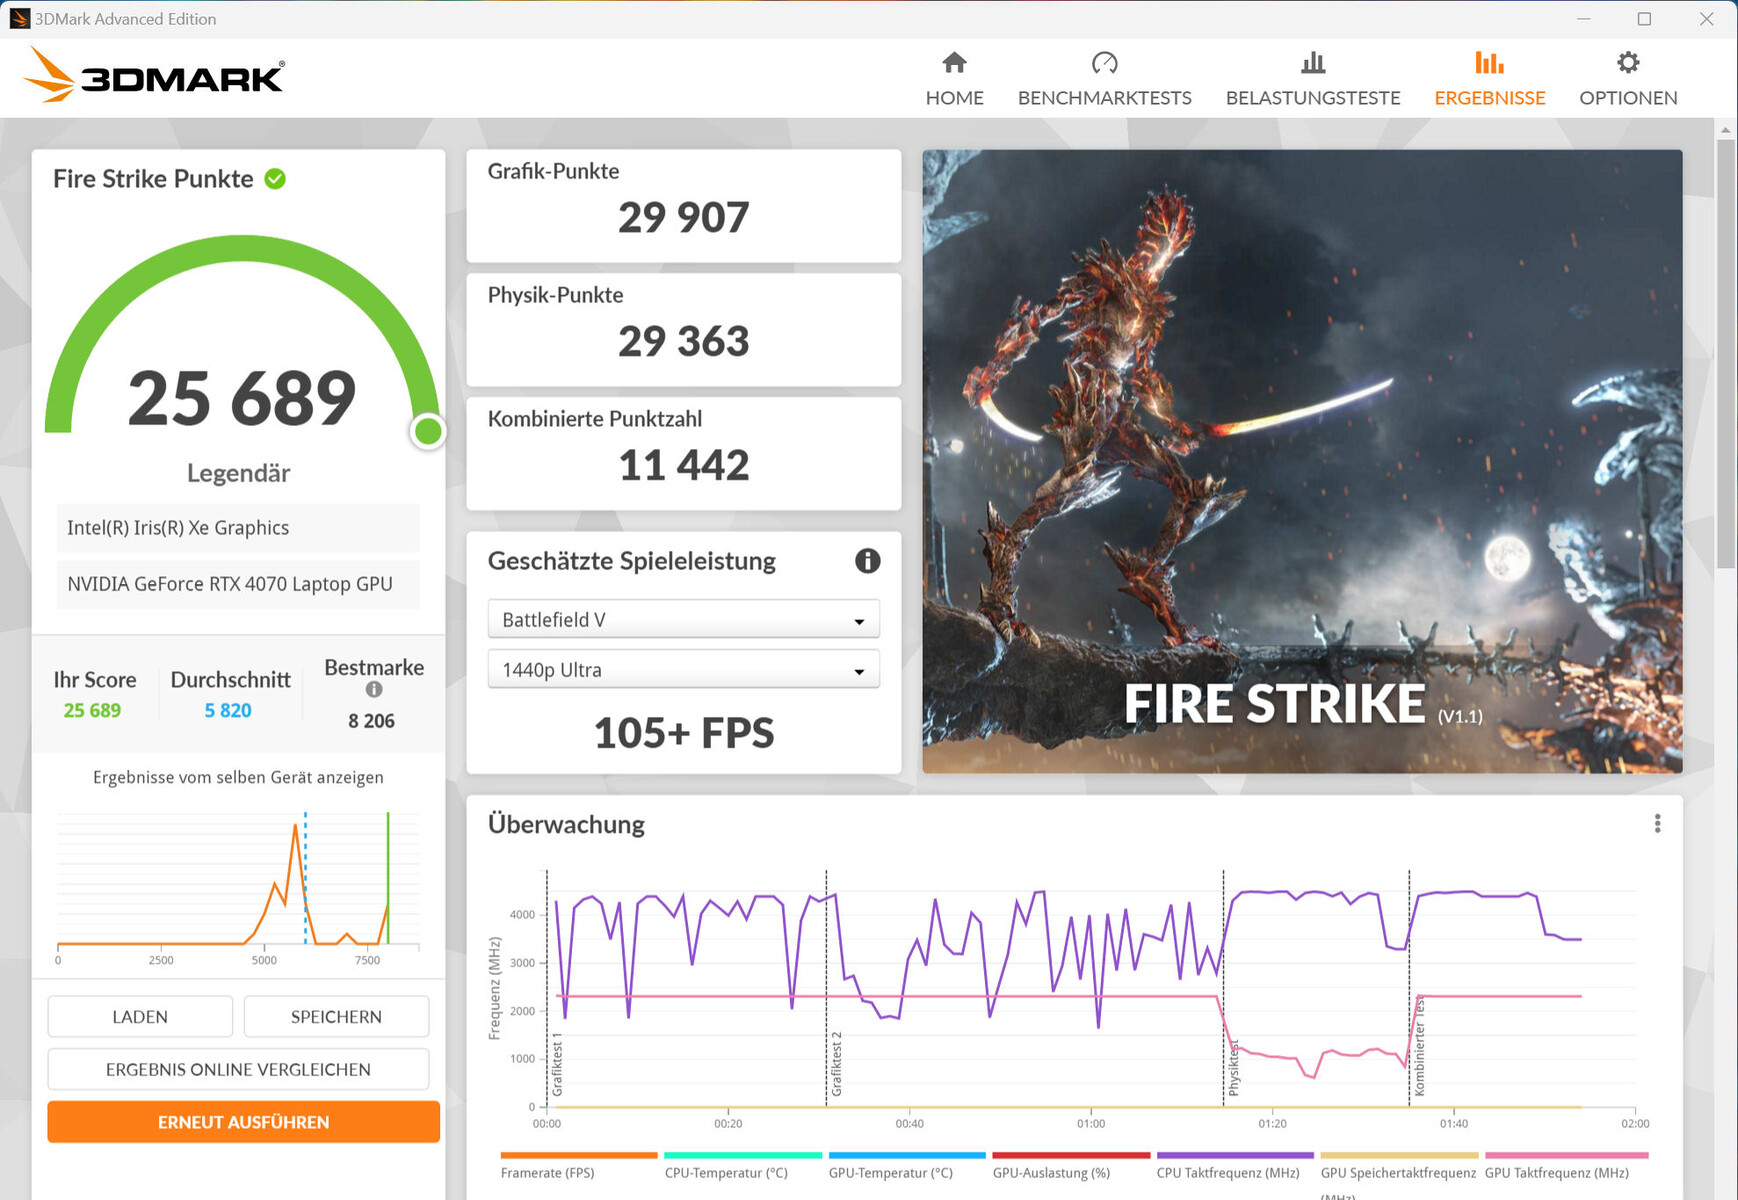
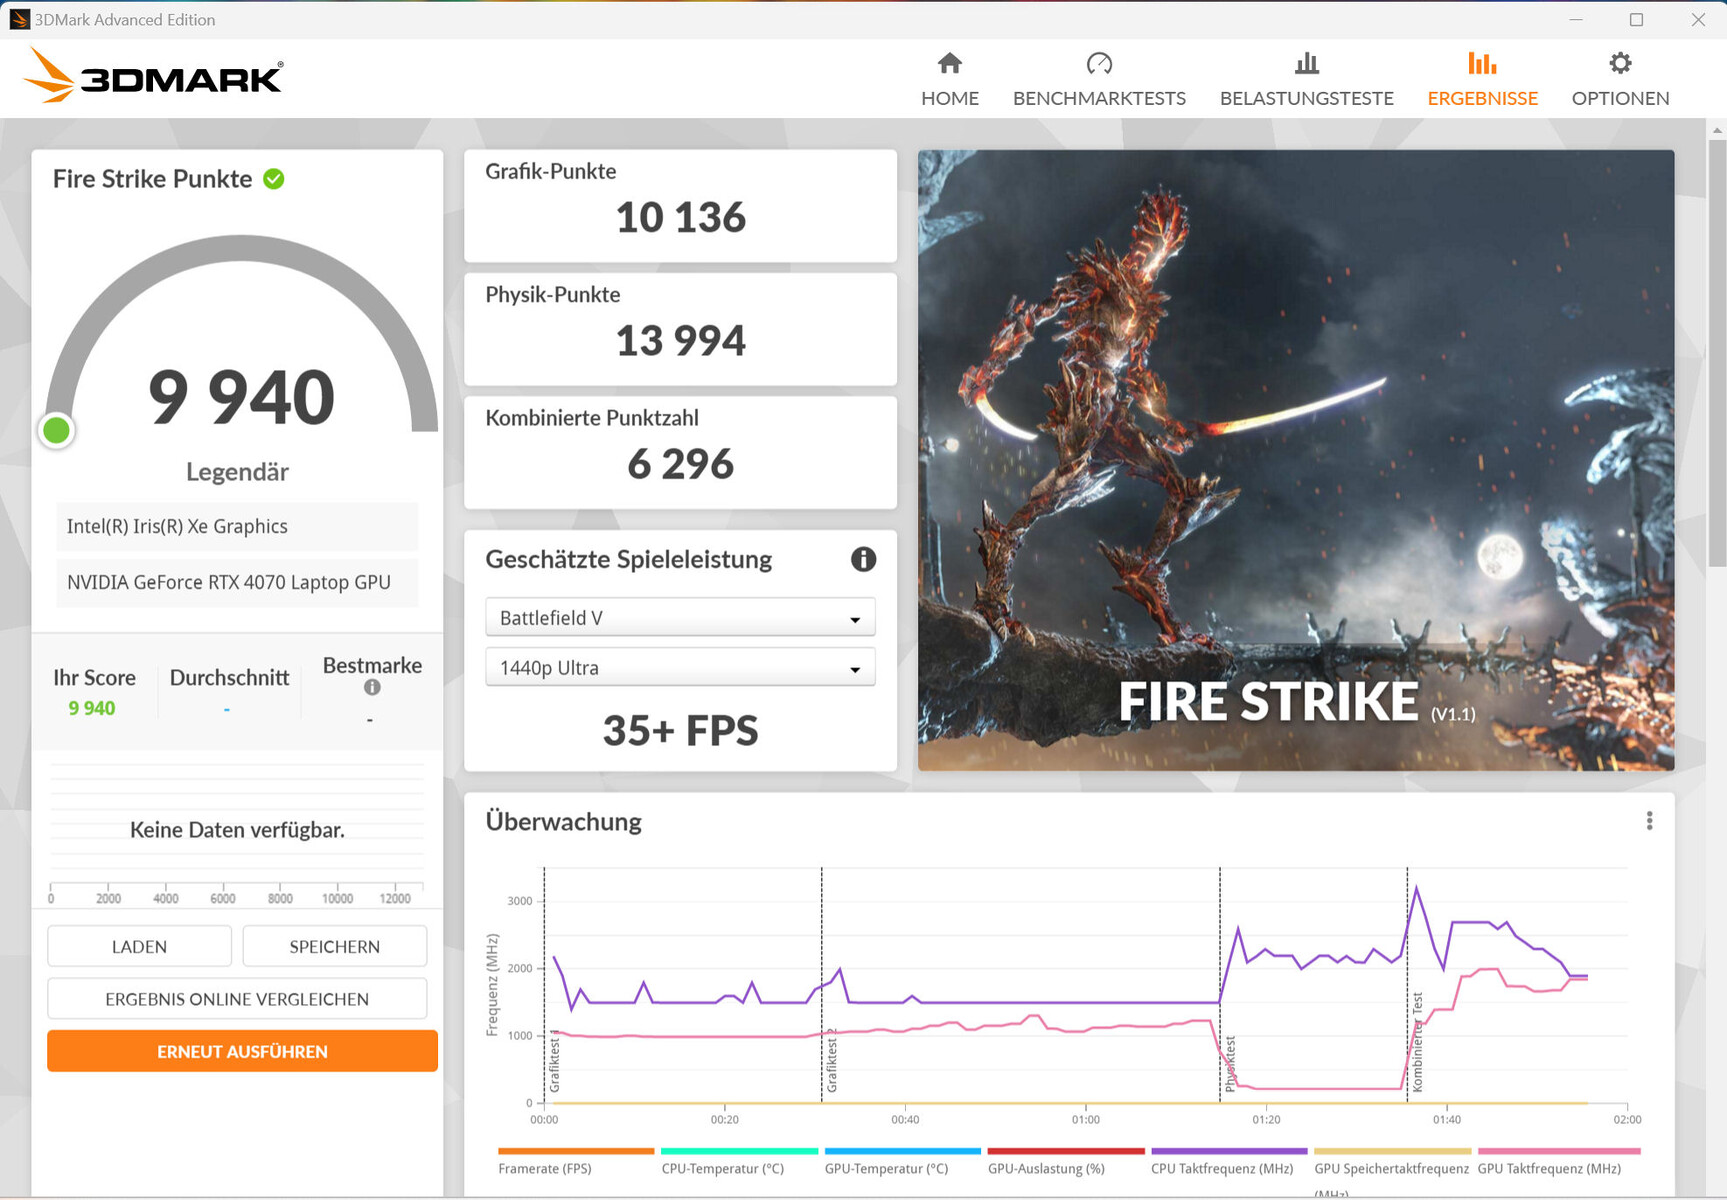
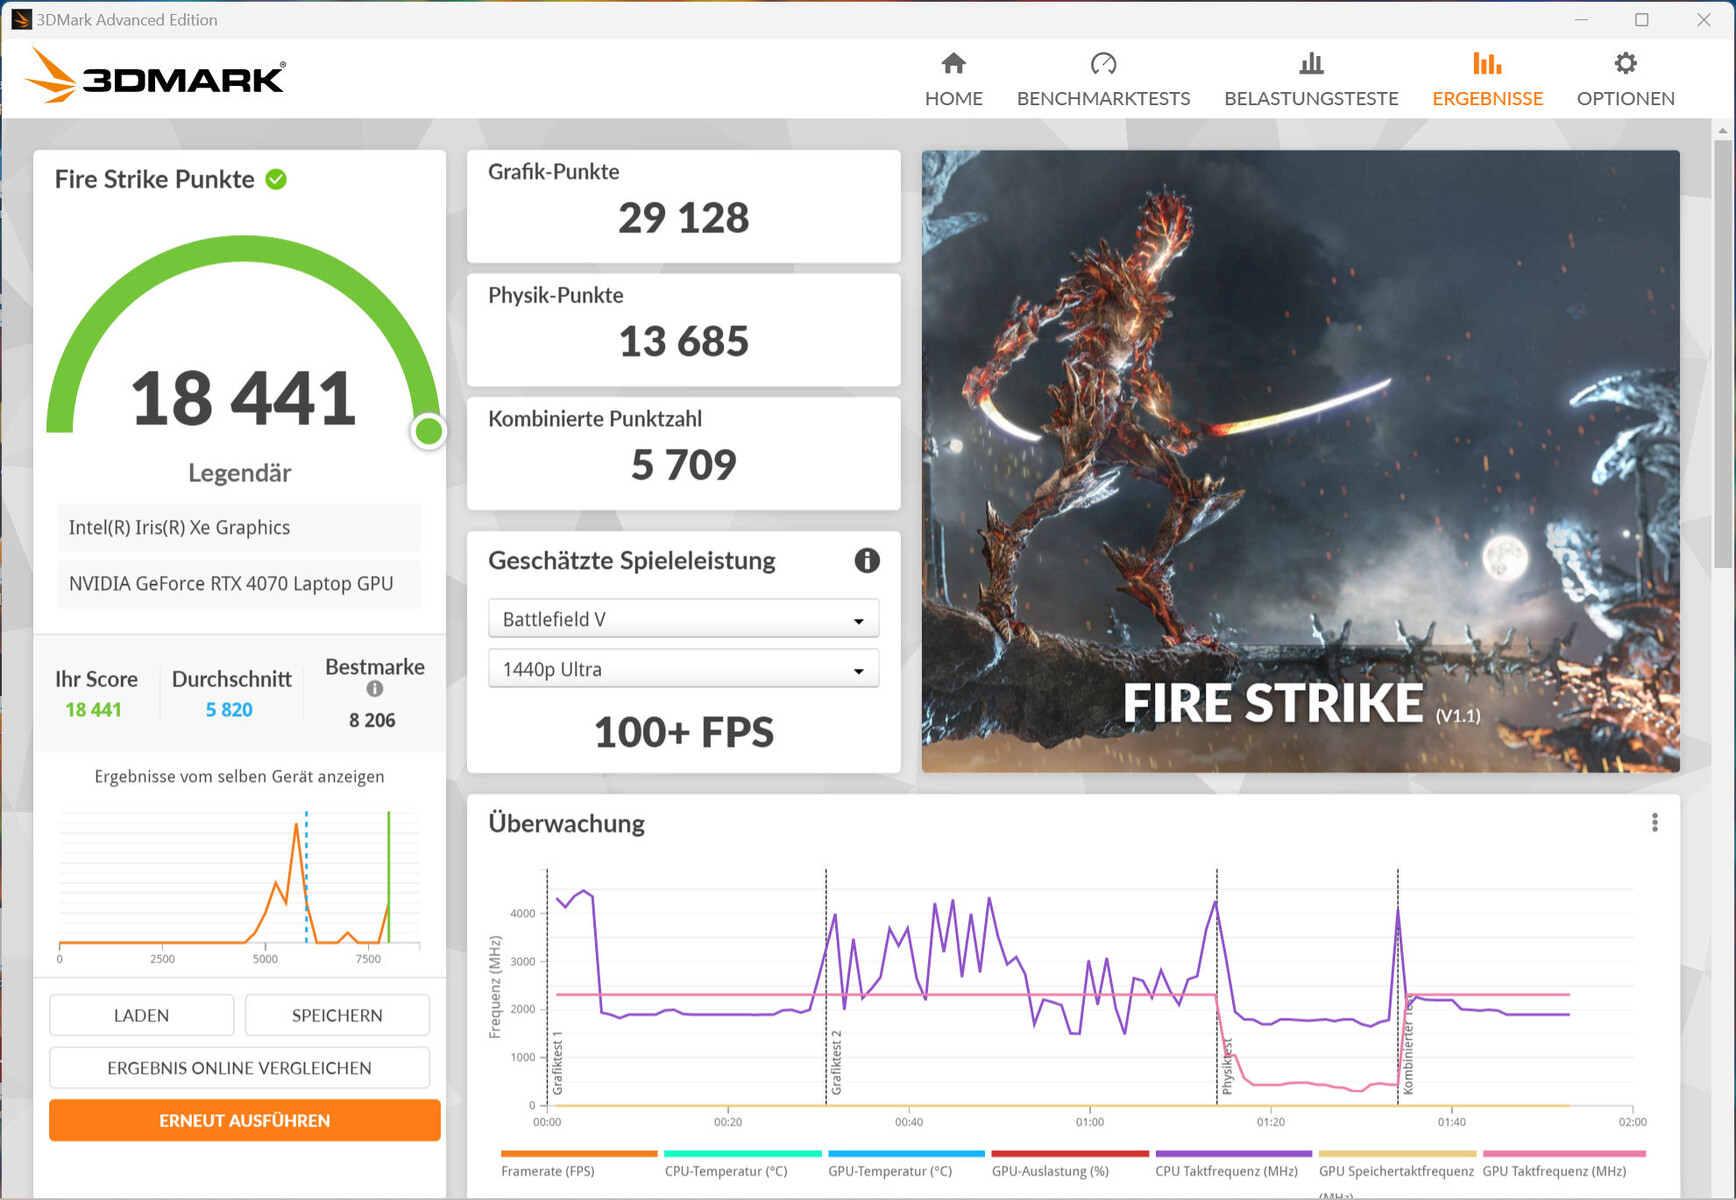
Karta graficznaGeForce RTX 4070oferuje 4 608 jednostek cieniujących, szybką pamięć GDDR6 (choć tylko 8 192 MB) i magistralę o szerokości 128 bitów. Gigabyte podał maksymalne TGP na poziomie 140 watów (115 watów + 25 watów) - więcej nie jest możliwe. Według Witcher 3 testu, pełne TGP nie jest wykorzystywane.
Wyniki benchmarków były powyżej poprzedniej średniej RTX 4070. Korzystanie z trybu dGPU nie przyniosło żadnej poprawy. Przełączanie między trybem Optimus ("tryb wyjścia grafiki Intel") a trybem dGPU ("tryb wyjścia grafiki Nvidia") można wykonać za pomocą Centrum sterowania (ogólne -> przełącznik GPU MUX). Zawsze konieczne jest ponowne uruchomienie laptopa. Gigabyte polega na przełączniku MUX - Advanced Optimus nie jest obsługiwany.

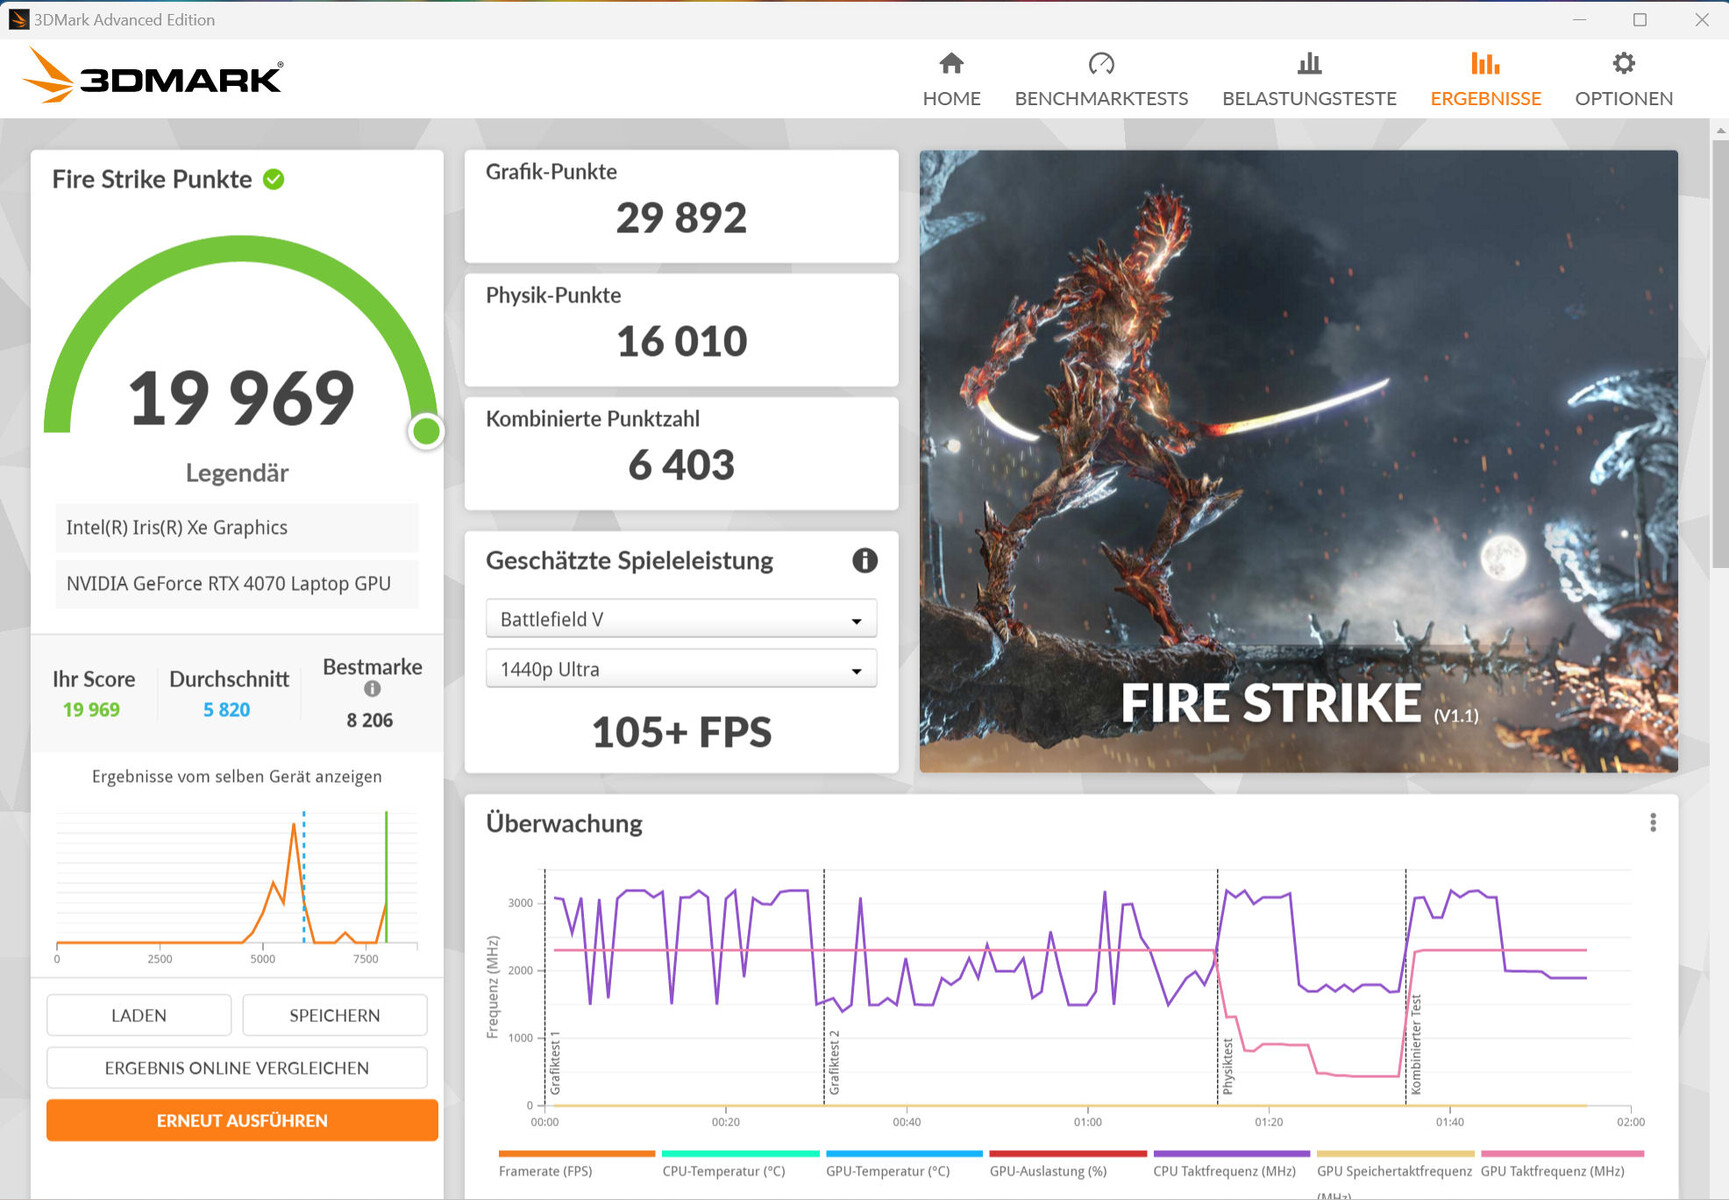
| 3DMark 06 Standard Score | 55084 pkt. | |
| 3DMark 11 Performance | 33789 pkt. | |
| 3DMark Cloud Gate Standard Score | 57822 pkt. | |
| 3DMark Fire Strike Score | 26593 pkt. | |
| 3DMark Time Spy Score | 12234 pkt. | |
Pomoc | ||
| Geekbench 6.7 - GPU OpenCL | |
| Średnia w klasie Gaming (67235 - 253130, n=102, ostatnie 2 lata) | |
| Aorus 15 BSF | |
| MSI Pulse 17 B13VGK | |
| Przeciętny NVIDIA GeForce RTX 4070 Laptop GPU (85488 - 129836, n=45) | |
* ... im mniej tym lepiej
Wydajność w grach
Laptop jest przeznaczony do grania w rozdzielczości QHD przy wysokich lub maksymalnych ustawieniach. Wyższe rozdzielczości działałyby w połączeniu z odpowiednim monitorem - czasami przy obniżonych ustawieniach. Liczba klatek na sekundę w testowanych przez nas grach wahała się powyżej ustalonej średniej RTX 4070. Korzystanie z trybu dGPU nie prowadziło do wyższej wydajności.
Korzystanie z trybu Spotkania pozwala na rozgrywkę z niższą emisją hałasu: Podczas gdy wydajność GPU pozostaje na tym samym poziomie, wydajność CPU spada ze względu na obniżony limit mocy. W takim przypadku może być konieczne zmniejszenie ustawień.
| The Witcher 3 - 1920x1080 Ultra Graphics & Postprocessing (HBAO+) | |
| Średnia w klasie Gaming (104.7 - 240, n=6, ostatnie 2 lata) | |
| Lenovo Legion Slim 7i 16 Gen 8 | |
| Aorus 15 BSF | |
| Acer Nitro 16 AN16-41 | |
| Przeciętny NVIDIA GeForce RTX 4070 Laptop GPU (69.8 - 133.7, n=57) | |
| HP Omen Transcend 16 | |
| MSI Pulse 17 B13VGK | |
| Asus TUF Gaming A16 FA617XS | |
| Final Fantasy XV Benchmark - 1920x1080 High Quality | |
| Średnia w klasie Gaming (41 - 215, n=94, ostatnie 2 lata) | |
| Lenovo Legion Slim 7i 16 Gen 8 | |
| Aorus 15 BSF | |
| MSI Pulse 17 B13VGK | |
| Przeciętny NVIDIA GeForce RTX 4070 Laptop GPU (41 - 131.9, n=65) | |
| Acer Nitro 16 AN16-41 | |
| Asus TUF Gaming A16 FA617XS | |
| Cyberpunk 2077 1.6 | |
| 1920x1080 Ultra Preset | |
| Lenovo Legion Slim 7i 16 Gen 8 | |
| Aorus 15 BSF | |
| HP Omen Transcend 16 | |
| Acer Nitro 16 AN16-41 | |
| Przeciętny NVIDIA GeForce RTX 4070 Laptop GPU (48 - 110, n=24) | |
| 2560x1440 Ultra Preset | |
| HP Omen Transcend 16 | |
| Lenovo Legion Slim 7i 16 Gen 8 | |
| Acer Nitro 16 AN16-41 | |
| Aorus 15 BSF | |
| Przeciętny NVIDIA GeForce RTX 4070 Laptop GPU (30 - 63.9, n=24) | |
| 1920x1080 Ray Tracing Ultra Preset (DLSS off) | |
| Przeciętny NVIDIA GeForce RTX 4070 Laptop GPU (36.2 - 65, n=5) | |
| Aorus 15 BSF | |
| The Callisto Protocol | |
| 1920x1080 Ultra Preset (without FSR Upscaling) | |
| Aorus 15 BSF | |
| Acer Nitro 16 AN16-41 | |
| Przeciętny NVIDIA GeForce RTX 4070 Laptop GPU (78.9 - 88, n=4) | |
| 2560x1440 Ultra Preset (without FSR Upscaling) | |
| Aorus 15 BSF | |
| Acer Nitro 16 AN16-41 | |
| Przeciętny NVIDIA GeForce RTX 4070 Laptop GPU (58.4 - 68.3, n=4) | |
| 1920x1080 Ultra Preset (without FSR Upscaling) + Full Ray-Tracing | |
| Aorus 15 BSF | |
| Przeciętny NVIDIA GeForce RTX 4070 Laptop GPU (50.8 - 70, n=4) | |
| Acer Nitro 16 AN16-41 | |
| Returnal | |
| 1920x1080 Epic Preset | |
| Aorus 15 BSF | |
| HP Omen Transcend 16 | |
| Przeciętny NVIDIA GeForce RTX 4070 Laptop GPU (54 - 90, n=12) | |
| Asus TUF Gaming A16 FA617XS | |
| Lenovo Legion Slim 7i 16 Gen 8 | |
| 2560x1440 Epic Preset | |
| Aorus 15 BSF | |
| HP Omen Transcend 16 | |
| Przeciętny NVIDIA GeForce RTX 4070 Laptop GPU (39 - 66, n=12) | |
| Lenovo Legion Slim 7i 16 Gen 8 | |
| 1920x1080 Epic Preset + Epic Ray-Tracing | |
| Aorus 15 BSF | |
| Przeciętny NVIDIA GeForce RTX 4070 Laptop GPU (71 - 75, n=5) | |
| Asus TUF Gaming A16 FA617XS | |
| Baldur's Gate 3 | |
| 1920x1080 Ultra Preset AA:T | |
| Średnia w klasie Gaming (59.4 - 246, n=101, ostatnie 2 lata) | |
| Przeciętny NVIDIA GeForce RTX 4070 Laptop GPU (66.7 - 128.5, n=30) | |
| Aorus 15 BSF | |
| 2560x1440 Ultra Preset AA:T | |
| Średnia w klasie Gaming (60 - 175.5, n=81, ostatnie 2 lata) | |
| Przeciętny NVIDIA GeForce RTX 4070 Laptop GPU (54.4 - 89.6, n=25) | |
| Aorus 15 BSF | |
| Ratchet & Clank Rift Apart | |
| 1920x1080 Very High Preset AA:T | |
| Aorus 15 BSF | |
| Przeciętny NVIDIA GeForce RTX 4070 Laptop GPU (52.3 - 58.1, n=4) | |
| 2560x1440 Very High Preset AA:T | |
| Przeciętny NVIDIA GeForce RTX 4070 Laptop GPU (48.7 - 49.1, n=3) | |
| Aorus 15 BSF | |
| 1920x1080 Very High Preset + Very High Raytracing AA:T | |
| Przeciętny NVIDIA GeForce RTX 4070 Laptop GPU (43.4 - 44.8, n=2) | |
| Aorus 15 BSF | |
Aby sprawdzić, czy liczba klatek na sekundę pozostaje stabilna przez dłuższy czas, pozwoliliśmy grze The Witcher 3 działać przez około 60 minut w rozdzielczości Full HD i przy maksymalnych ustawieniach jakości. Nie poruszaliśmy postacią. Nie odnotowaliśmy żadnych spadków liczby klatek na sekundę.
Witcher 3 FPS diagram
| low | med. | high | ultra | QHD | |
|---|---|---|---|---|---|
| The Witcher 3 (2015) | 432.4 | 371.8 | 230.9 | 117 | |
| Dota 2 Reborn (2015) | 186.9 | 167.6 | 162.4 | 149.9 | |
| Final Fantasy XV Benchmark (2018) | 213 | 163.9 | 115.4 | 84.4 | |
| X-Plane 11.11 (2018) | 160 | 142.1 | 113.4 | ||
| Far Cry 5 (2018) | 178 | 156 | 149 | 140 | 117 |
| Strange Brigade (2018) | 485 | 295 | 231 | 202 | 133.6 |
| Cyberpunk 2077 1.6 (2022) | 135.4 | 113.8 | 96.7 | 90 | 53.4 |
| The Callisto Protocol (2022) | 162.8 | 142.2 | 136 | 88 | 68.3 |
| Returnal (2023) | 117 | 114 | 104 | 87 | 64 |
| F1 23 (2023) | 248 | 255 | 209 | 71.7 | 46.3 |
| Ratchet & Clank Rift Apart (2023) | 90.4 | 78.8 | 62.3 | 57.1 | 48.8 |
| Baldur's Gate 3 (2023) | 137.1 | 114.2 | 91.4 | 88.5 | 60.2 |
Emisje - laptop Aorus może być dość głośny
Emisja hałasu
Podczas grania emisja hałasu wzrasta do 55 dB(A) ("Turbo"). Kiedy korzystaliśmy z trybu "AI Boost", zmierzyliśmy 53 dB(A). Tryb spotkań oferuje bardziej zrównoważone połączenie wydajności, emisji i zużycia energii.
W trybie bezczynności i w codziennym użytkowaniu (biuro, Internet), dwa wentylatory generalnie nie generują zbyt dużego hałasu - czasami w ogóle się nie obracają. Nie oznacza to jednak, że pozostają ciche przez cały czas - zmierzyliśmy do 37 dB(A).
Hałas
| luz |
| 25 / 31 / 37 dB |
| obciążenie |
| 51 / 57 dB |
 | ||
30 dB cichy 40 dB(A) słyszalny 50 dB(A) irytujący |
||
min: | ||
| Aorus 15 BSF i7-13700H, GeForce RTX 4070 Laptop GPU | HP Omen Transcend 16 i9-13900HX, GeForce RTX 4070 Laptop GPU | MSI Pulse 17 B13VGK i7-13700H, GeForce RTX 4070 Laptop GPU | Lenovo Legion Slim 7i 16 Gen 8 i9-13900H, GeForce RTX 4070 Laptop GPU | Acer Nitro 16 AN16-41 R7 7735HS, GeForce RTX 4070 Laptop GPU | Asus TUF Gaming A16 FA617XS R9 7940HS, Radeon RX 7600S | |
|---|---|---|---|---|---|---|
| Noise | 5% | 19% | 20% | 10% | 10% | |
| wyłączone / środowisko * (dB) | 24 | 22.9 5% | 24 -0% | 22.8 5% | 25.7 -7% | 25 -4% |
| Idle Minimum * (dB) | 25 | 29.1 -16% | 24 4% | 23.6 6% | 25.7 -3% | 25 -0% |
| Idle Average * (dB) | 31 | 29.1 6% | 24 23% | 23.6 24% | 25.7 17% | 26 16% |
| Idle Maximum * (dB) | 37 | 29.1 21% | 24 35% | 25.7 31% | 26.3 29% | 28 24% |
| Load Average * (dB) | 51 | 45.7 10% | 32.49 36% | 27.6 46% | 33.9 34% | 43 16% |
| Load Maximum * (dB) | 57 | 54.3 5% | 46.51 18% | 54.4 5% | 62 -9% | 53 7% |
| Witcher 3 ultra * (dB) | 54.3 | 46.51 | 54.4 | 51 |
* ... im mniej tym lepiej
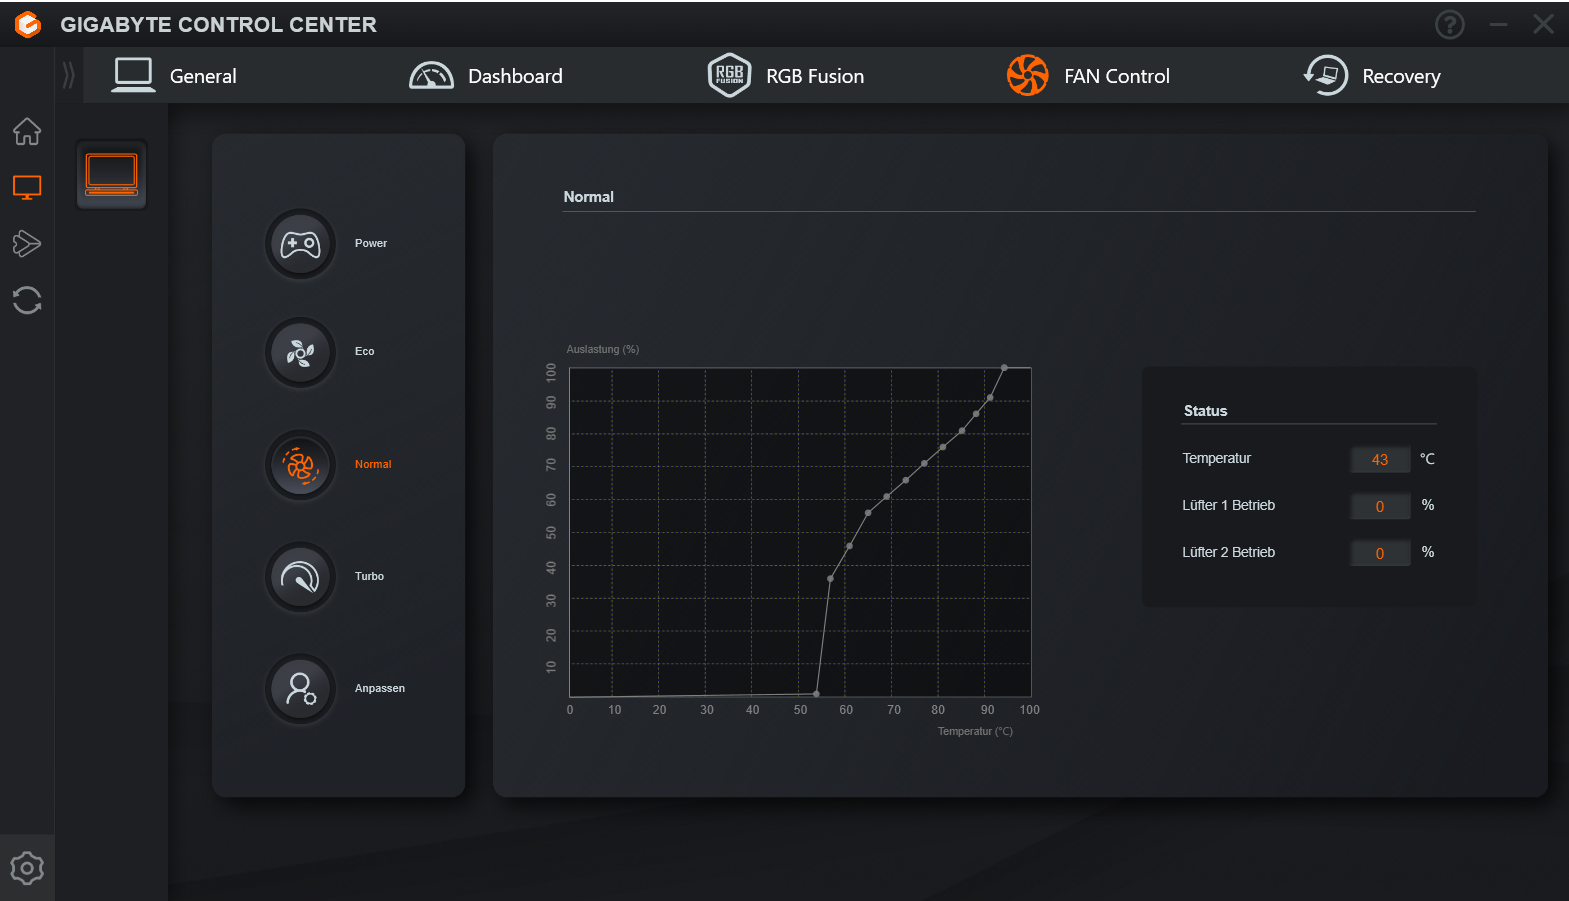
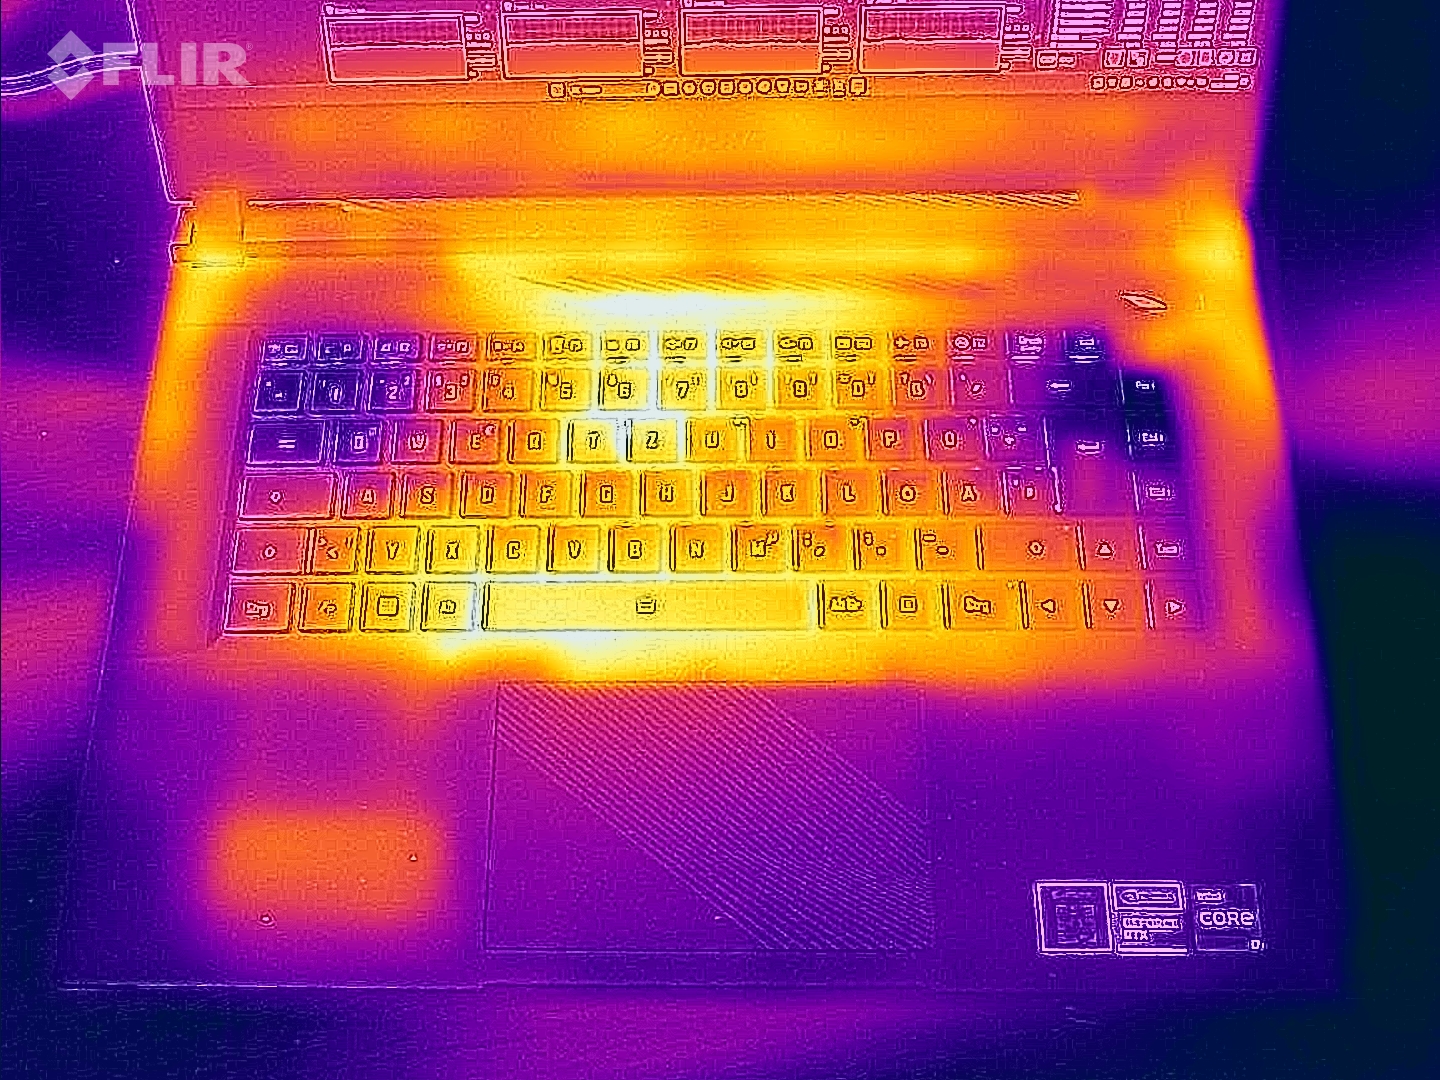
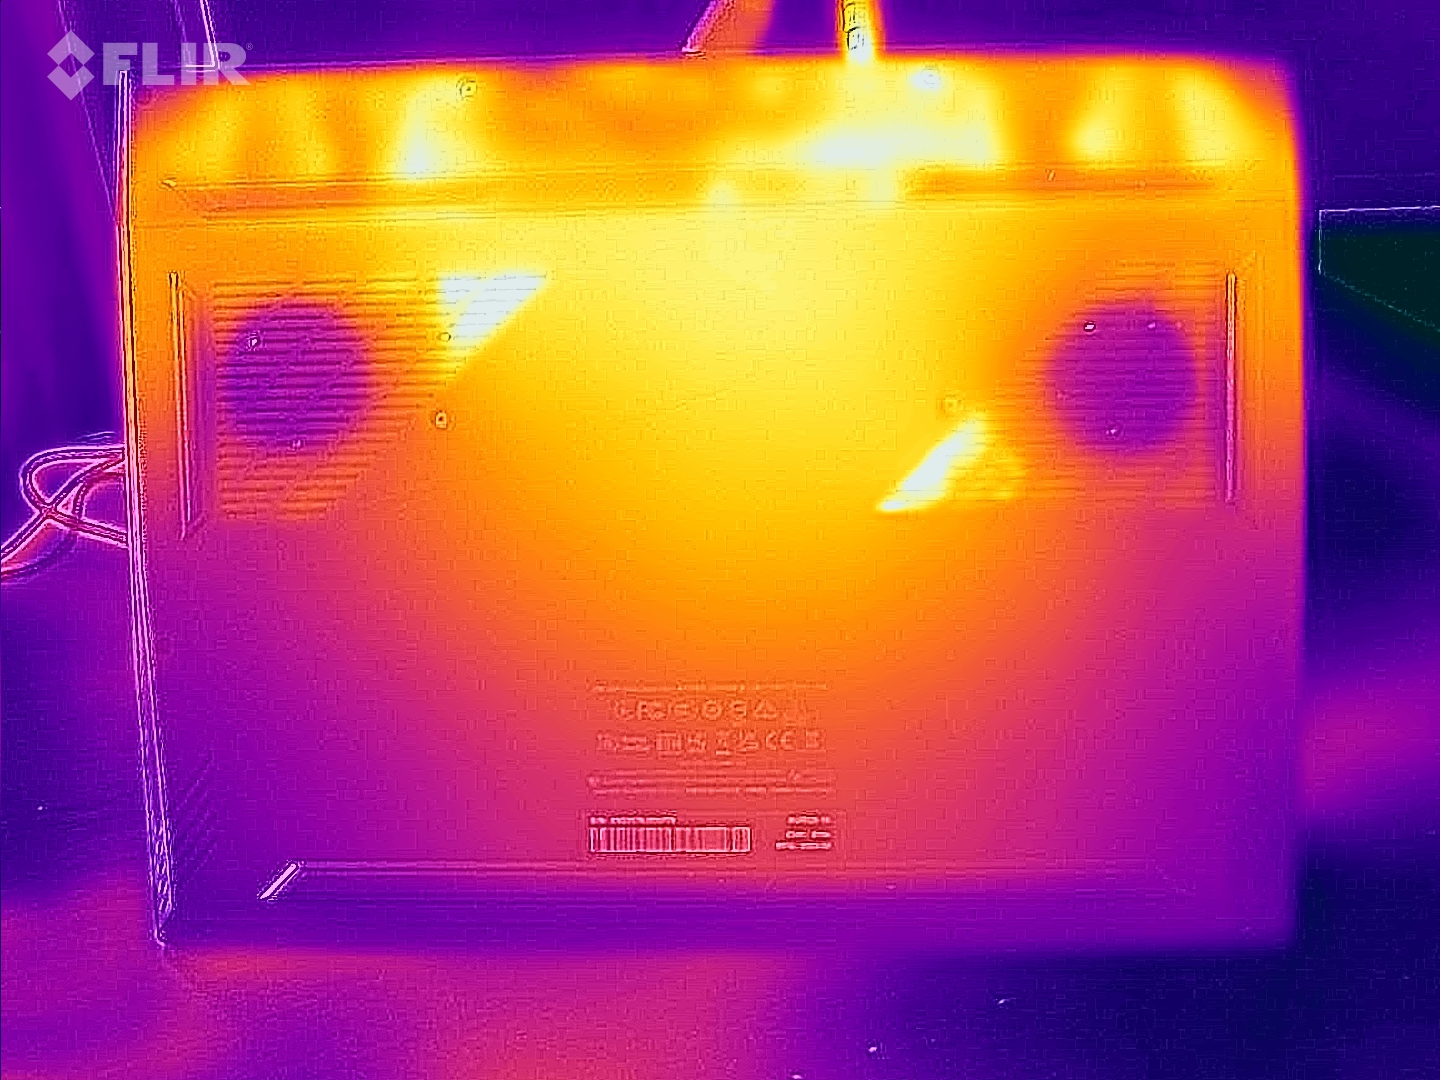
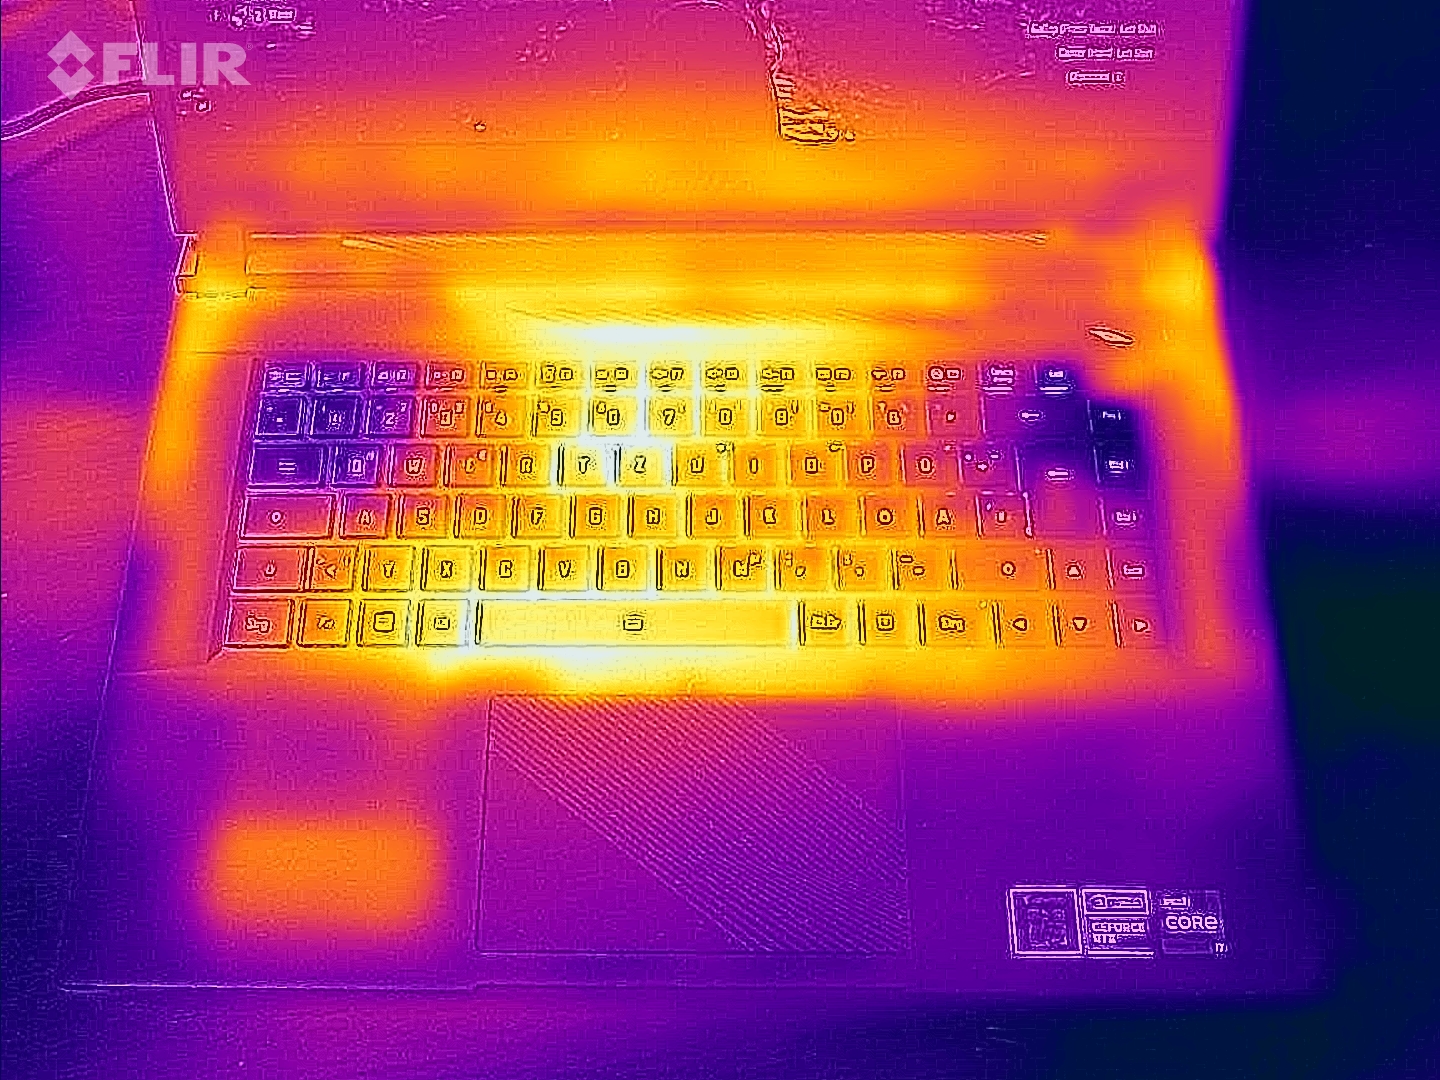
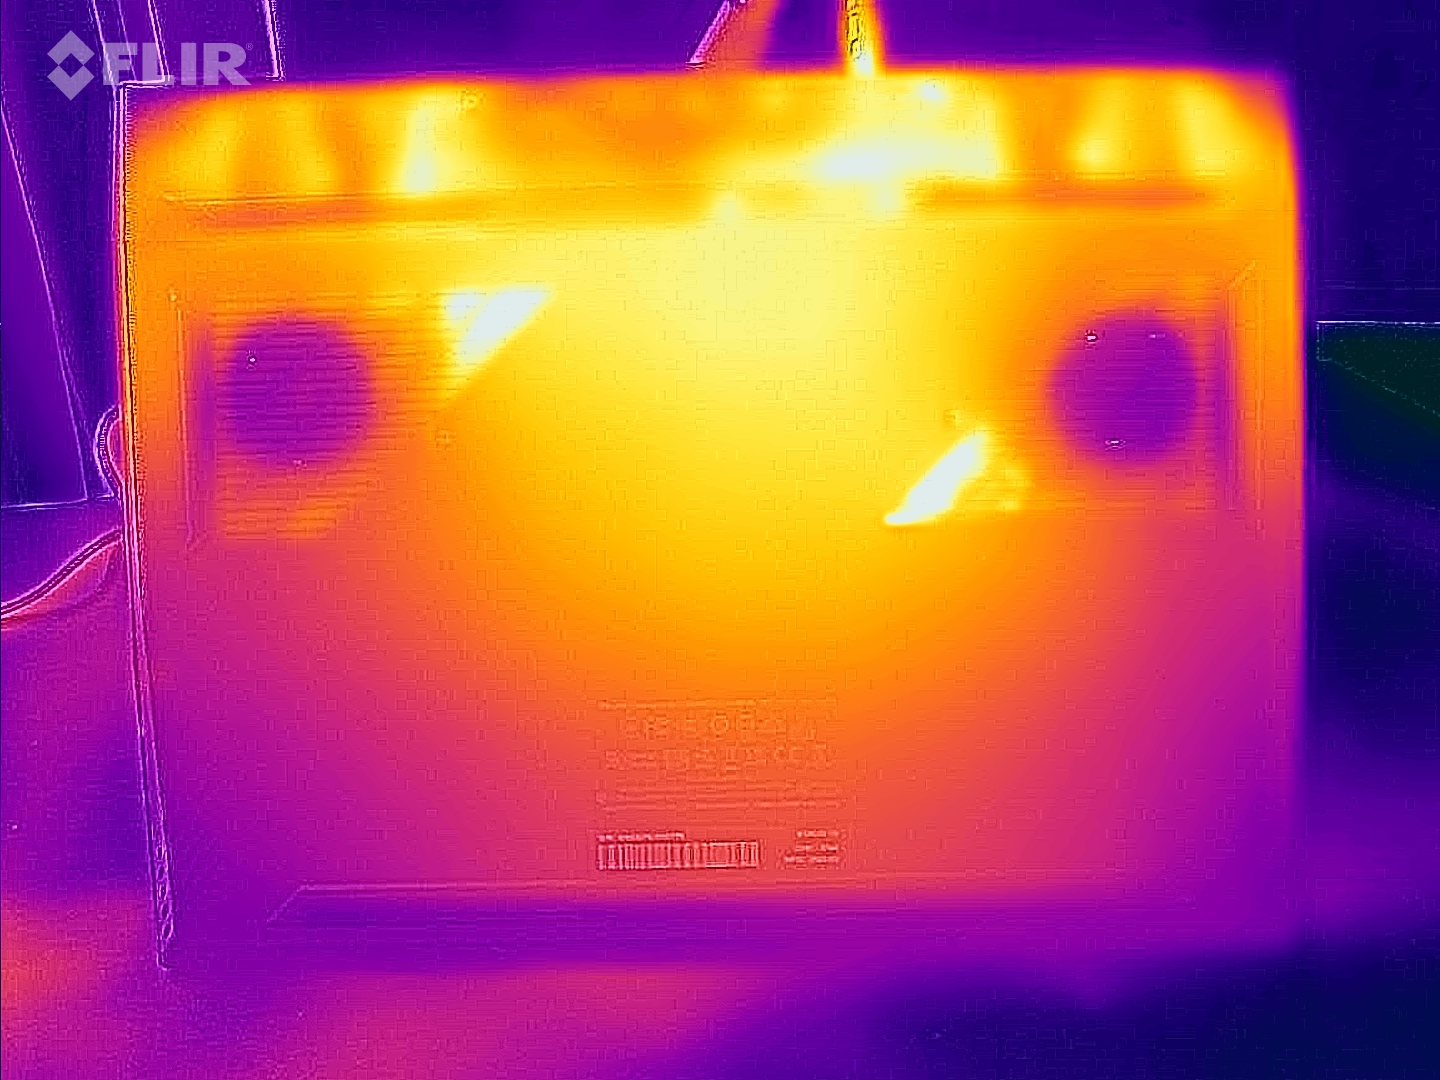
Temperatura
Nasz test obciążeniowy i test Witcher 3 spowodowały, że laptop nagrzał się zauważalnie, ale nie ekstremalnie. W codziennym użytkowaniu (biuro, Internet) temperatury obudowy generalnie utrzymują się w zielonym obszarze - w porównaniu do podobnych laptopów są nieco wyższe.
(-) Maksymalna temperatura w górnej części wynosi 48 °C / 118 F, w porównaniu do średniej 40.4 °C / 105 F , począwszy od 21.2 do 68.8 °C dla klasy Gaming.
(-) Dno nagrzewa się maksymalnie do 47 °C / 117 F, w porównaniu do średniej 43.2 °C / 110 F
(±) W stanie bezczynności średnia temperatura górnej części wynosi 35.6 °C / 96 F, w porównaniu ze średnią temperaturą urządzenia wynoszącą 33.9 °C / ### class_avg_f### F.
(-) Podczas gry w Wiedźmina 3 średnia temperatura górnej części wynosi 41.9 °C / 107 F, w porównaniu do średniej temperatury urządzenia wynoszącej 33.9 °C / ## #class_avg_f### F.
(-) Podpórki pod nadgarstki i touchpad mogą się bardzo nagrzać w dotyku, maksymalnie do 42 °C / 107.6 F.
(-) Średnia temperatura obszaru podparcia dłoni w podobnych urządzeniach wynosiła 28.8 °C / 83.8 F (-13.2 °C / -23.8 F).
| Aorus 15 BSF Intel Core i7-13700H, NVIDIA GeForce RTX 4070 Laptop GPU | HP Omen Transcend 16 Intel Core i9-13900HX, NVIDIA GeForce RTX 4070 Laptop GPU | MSI Pulse 17 B13VGK Intel Core i7-13700H, NVIDIA GeForce RTX 4070 Laptop GPU | Lenovo Legion Slim 7i 16 Gen 8 Intel Core i9-13900H, NVIDIA GeForce RTX 4070 Laptop GPU | Acer Nitro 16 AN16-41 AMD Ryzen 7 7735HS, NVIDIA GeForce RTX 4070 Laptop GPU | Asus TUF Gaming A16 FA617XS AMD Ryzen 9 7940HS, AMD Radeon RX 7600S | |
|---|---|---|---|---|---|---|
| Heat | 7% | 6% | 8% | 6% | 6% | |
| Maximum Upper Side * (°C) | 48 | 47.4 1% | 48 -0% | 49.8 -4% | 41.5 14% | 53 -10% |
| Maximum Bottom * (°C) | 47 | 54.4 -16% | 50 -6% | 48.8 -4% | 51.8 -10% | 48 -2% |
| Idle Upper Side * (°C) | 39 | 28.4 27% | 30 23% | 29.4 25% | 31.6 19% | 30 23% |
| Idle Bottom * (°C) | 35 | 29.2 17% | 33 6% | 30 14% | 34.5 1% | 30 14% |
* ... im mniej tym lepiej
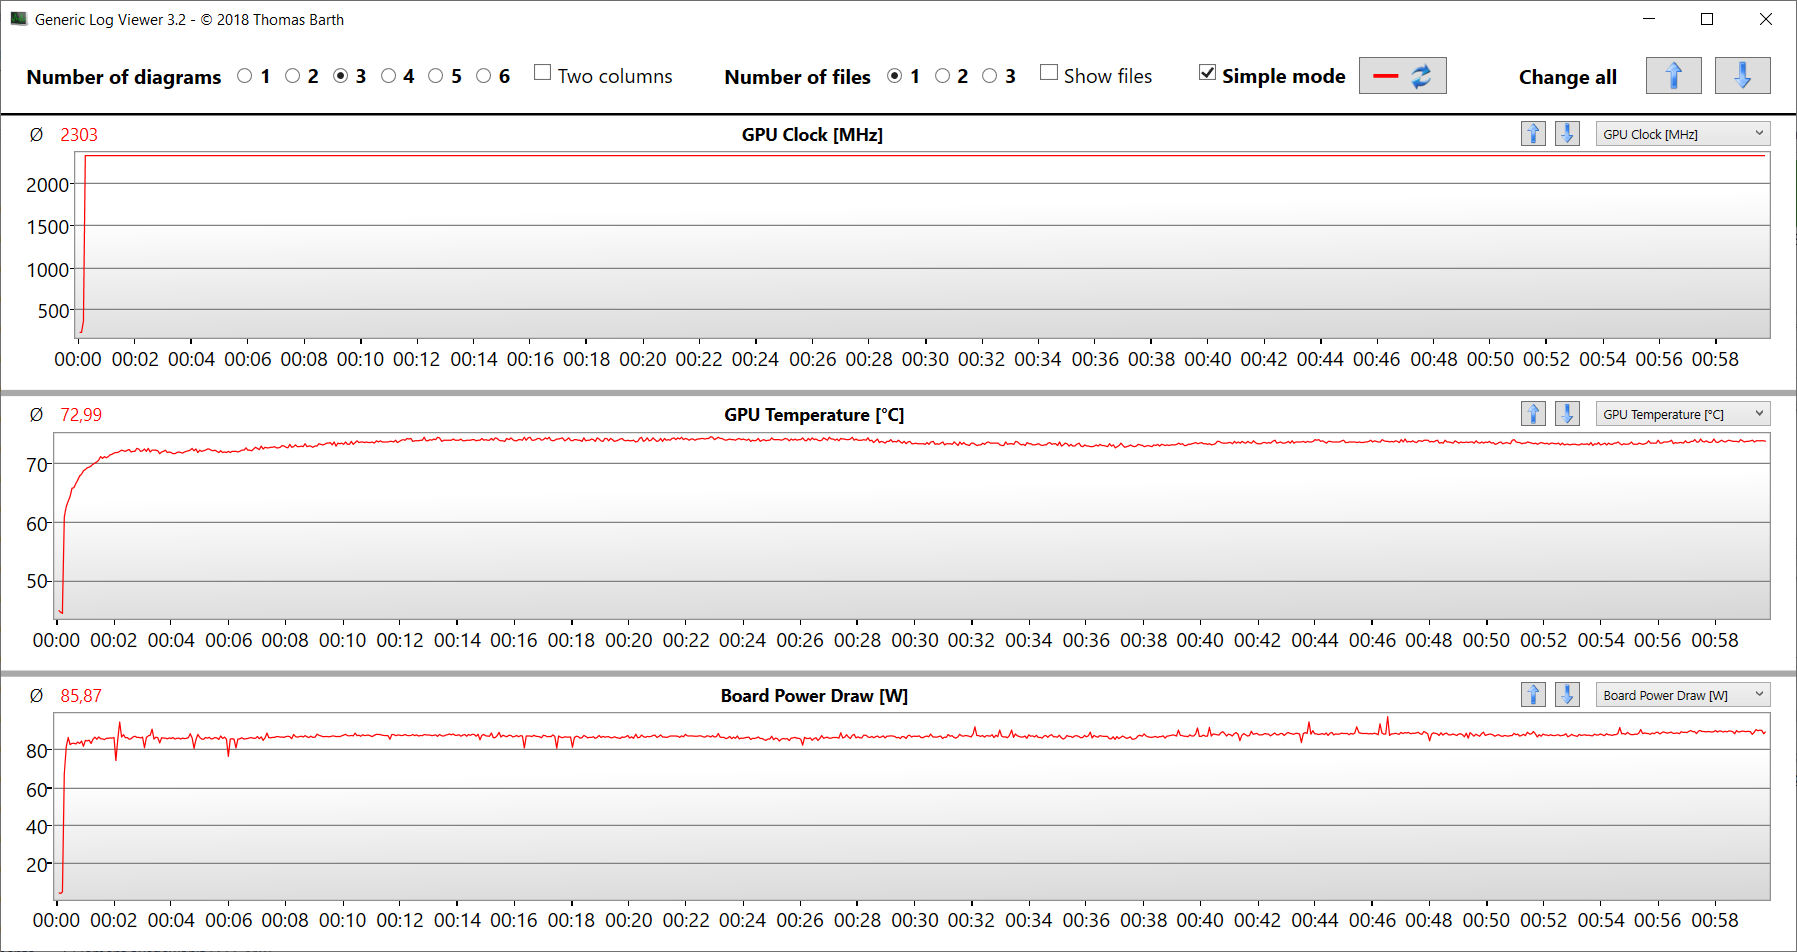
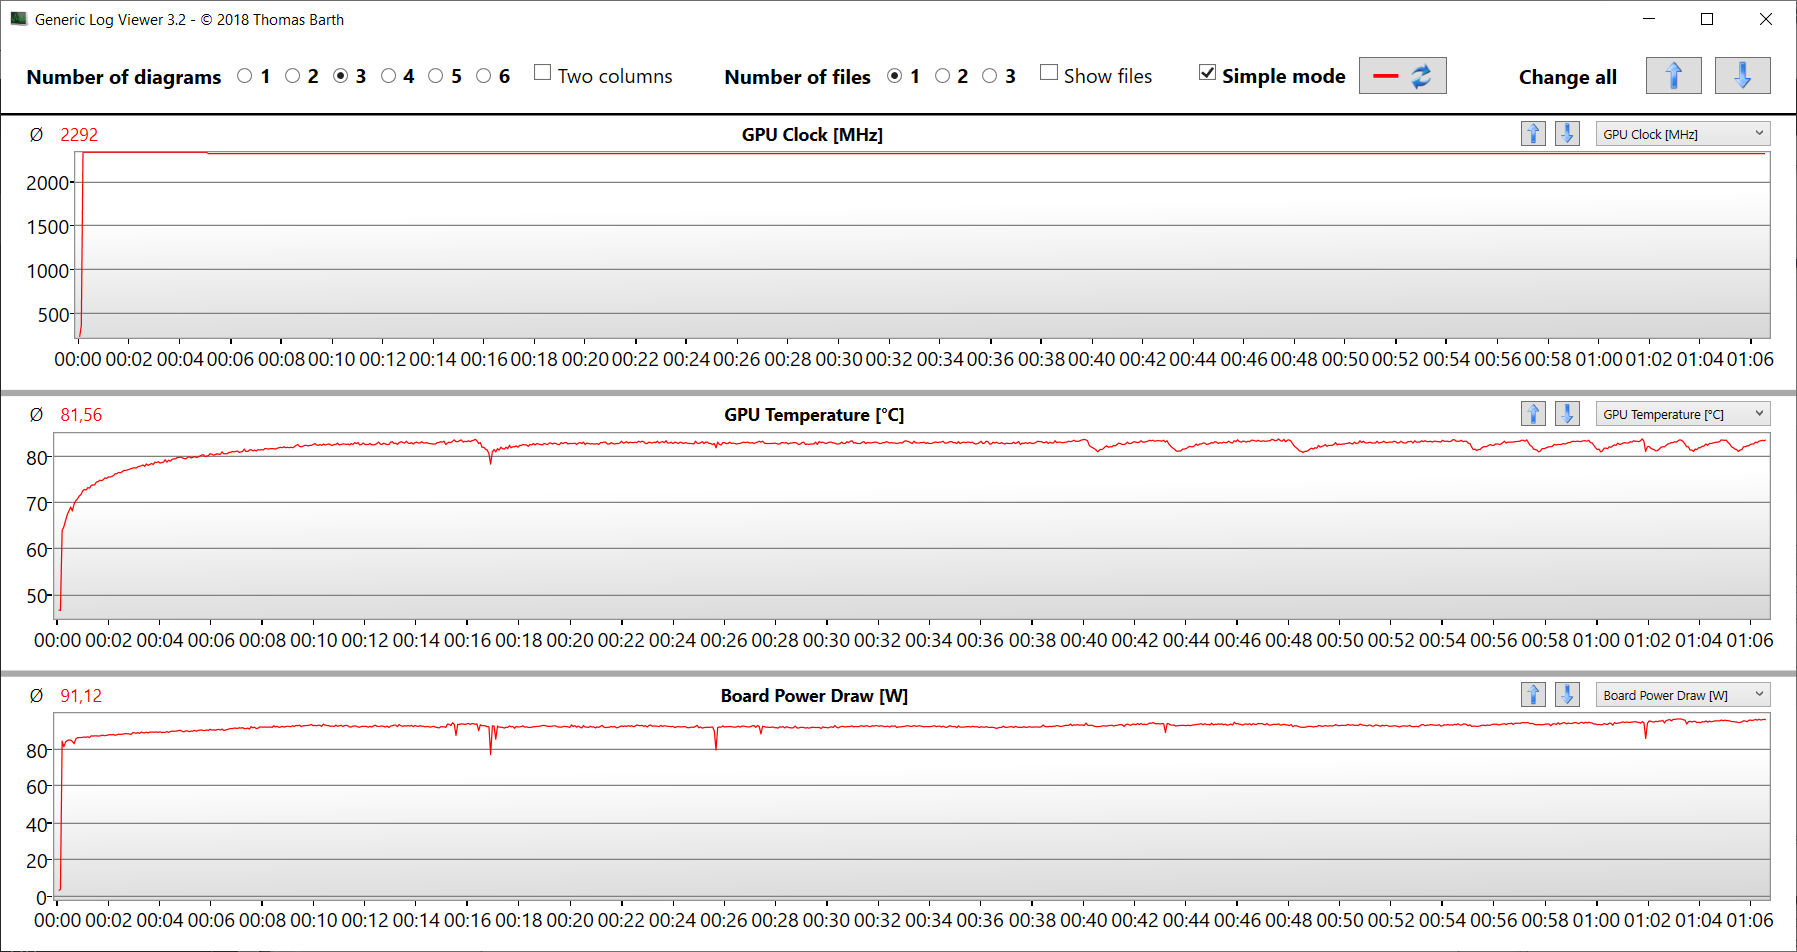
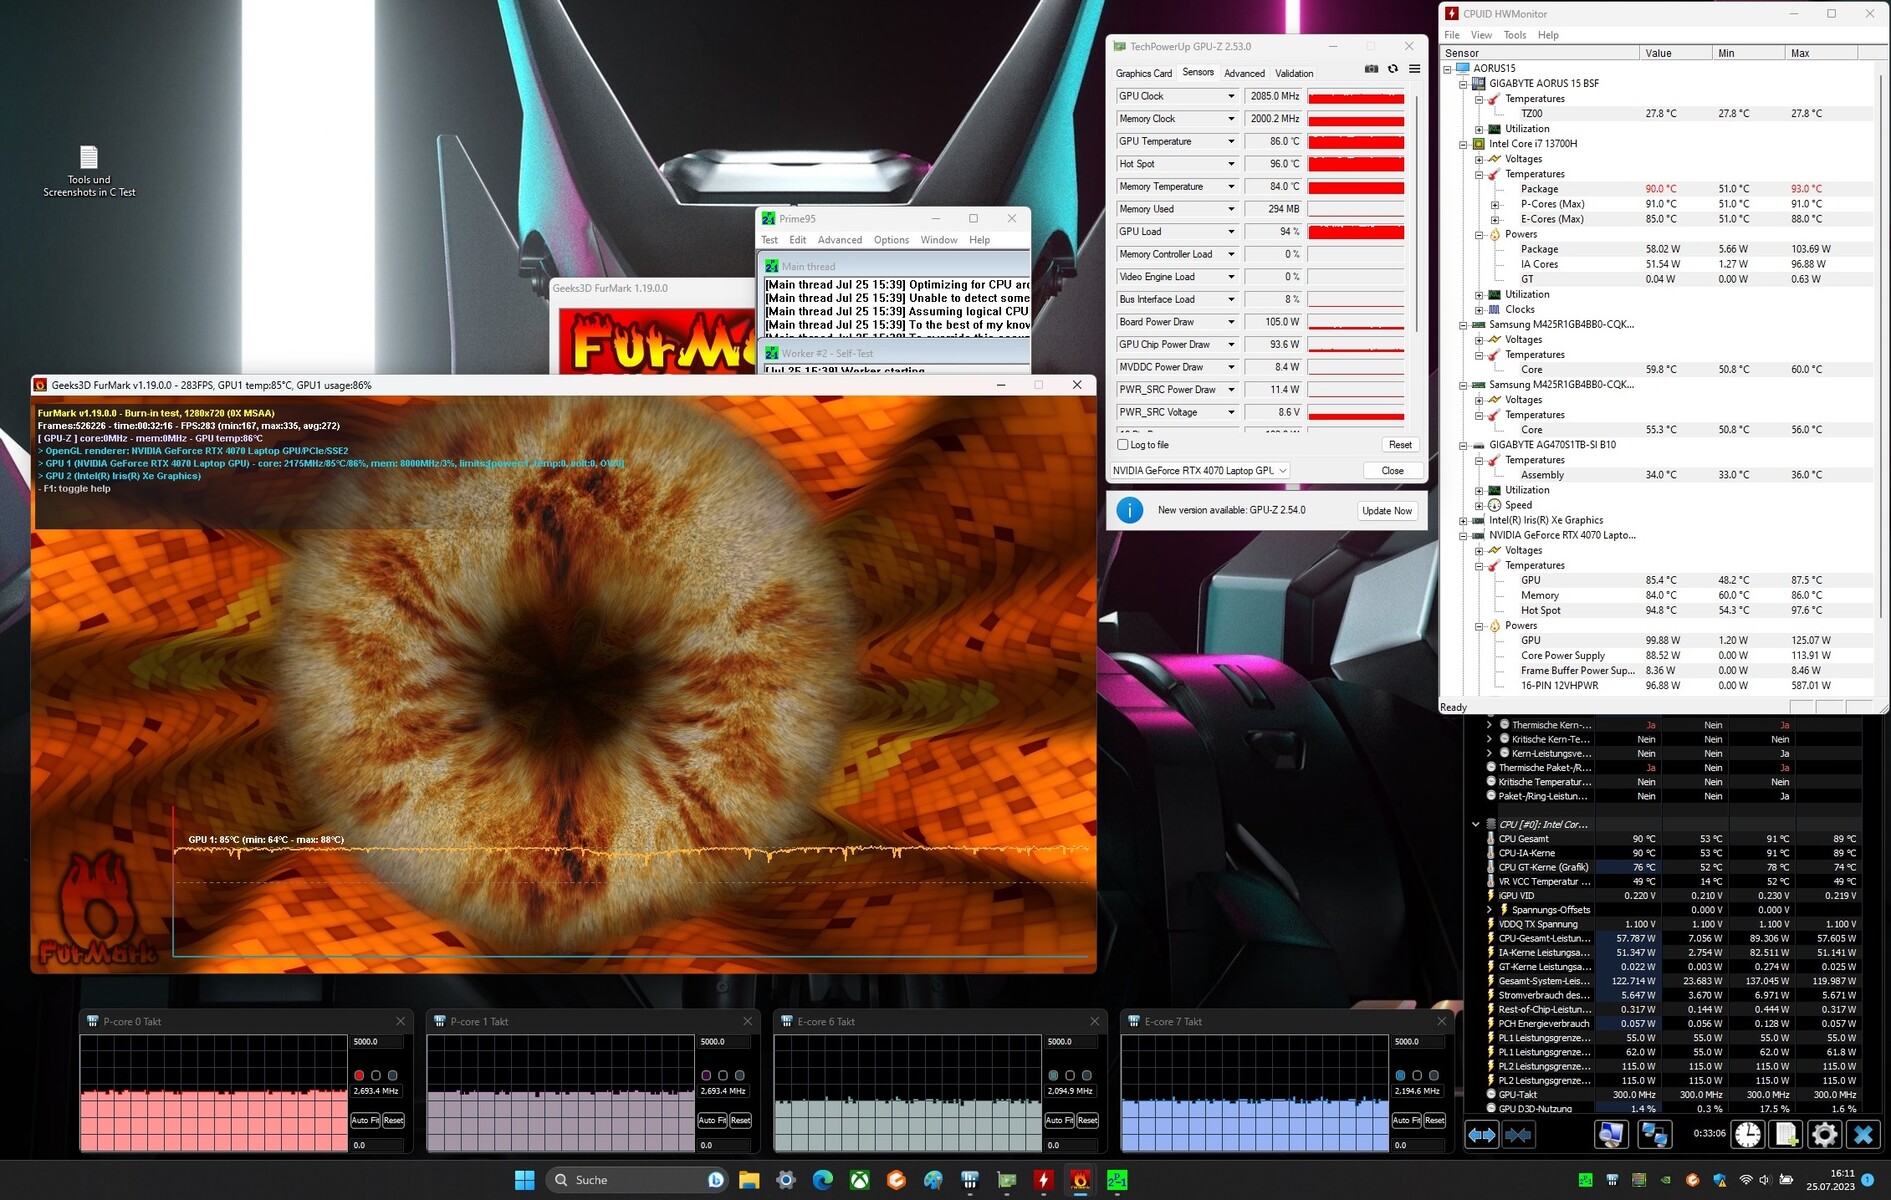
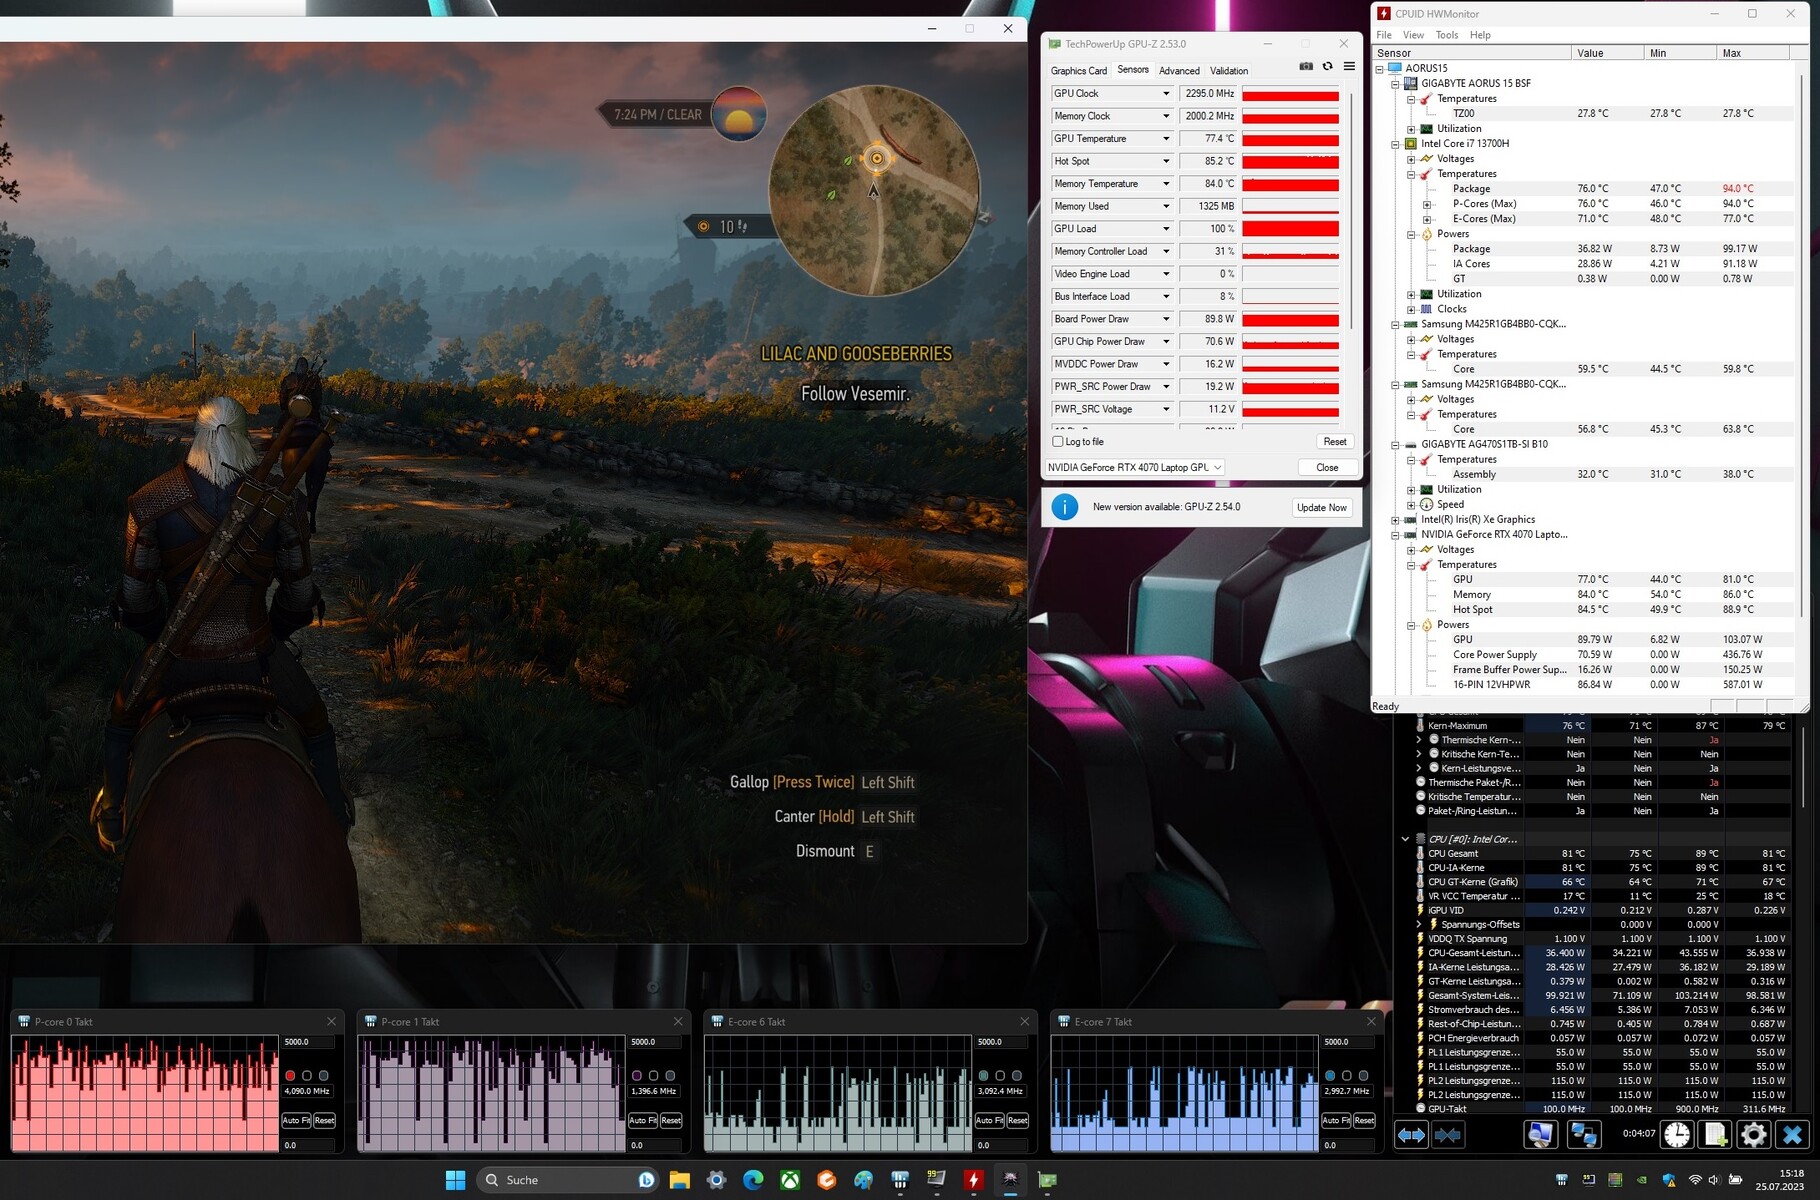
Test warunków skrajnych
Test obciążeniowy (Prime95 i Furmark w trybie ciągłym) tworzy ekstremalny scenariusz w celu sprawdzenia stabilności systemu pod pełnym obciążeniem. Procesor (P: 2,7 - 2,8 GHz, E: 2,5 GHz) rozpoczął test ze średnim taktowaniem. Po krótkiej chwili taktowanie spadło do około 2,6 - 2,7 GHz (rdzenie P) i 2,1 - 2,2 GHz (rdzenie E). Zegar GPU spadł z 2,3 GHz do 2,1 GHz.
Głośniki
Głośniki stereo generują przyzwoity dźwięk, ale nie ma prawie żadnych basów. Aby uzyskać lepsze wrażenia dźwiękowe, zaleca się stosowanie słuchawek lub głośników zewnętrznych.
Aorus 15 BSF analiza dźwięku
(+) | głośniki mogą odtwarzać stosunkowo głośno (83 dB)
Bas 100 - 315 Hz
(-) | prawie brak basu - średnio 27.1% niższa od mediany
(-) | bas nie jest liniowy (16% delta do poprzedniej częstotliwości)
Średnie 400 - 2000 Hz
(+) | zbalansowane środki średnie - tylko 4.2% od mediany
(+) | średnie są liniowe (3.6% delta do poprzedniej częstotliwości)
Wysokie 2–16 kHz
(+) | zrównoważone maksima - tylko 2.8% od mediany
(+) | wzloty są liniowe (6.8% delta do poprzedniej częstotliwości)
Ogólnie 100 - 16.000 Hz
(±) | liniowość ogólnego dźwięku jest średnia (17.3% różnicy w stosunku do mediany)
W porównaniu do tej samej klasy
» 47% wszystkich testowanych urządzeń w tej klasie było lepszych, 12% podobnych, 41% gorszych
» Najlepszy miał deltę 6%, średnia wynosiła ###średnia###%, najgorsza wynosiła 132%
W porównaniu do wszystkich testowanych urządzeń
» 32% wszystkich testowanych urządzeń było lepszych, 8% podobnych, 59% gorszych
» Najlepszy miał deltę 4%, średnia wynosiła ###średnia###%, najgorsza wynosiła 134%
Acer Nitro 16 AN16-41 analiza dźwięku
(+) | głośniki mogą odtwarzać stosunkowo głośno (83.9 dB)
Bas 100 - 315 Hz
(-) | prawie brak basu - średnio 33.5% niższa od mediany
(±) | liniowość basu jest średnia (13.2% delta do poprzedniej częstotliwości)
Średnie 400 - 2000 Hz
(+) | zbalansowane środki średnie - tylko 2.4% od mediany
(+) | średnie są liniowe (4.9% delta do poprzedniej częstotliwości)
Wysokie 2–16 kHz
(+) | zrównoważone maksima - tylko 3.6% od mediany
(+) | wzloty są liniowe (4.2% delta do poprzedniej częstotliwości)
Ogólnie 100 - 16.000 Hz
(±) | liniowość ogólnego dźwięku jest średnia (19.6% różnicy w stosunku do mediany)
W porównaniu do tej samej klasy
» 68% wszystkich testowanych urządzeń w tej klasie było lepszych, 6% podobnych, 25% gorszych
» Najlepszy miał deltę 6%, średnia wynosiła ###średnia###%, najgorsza wynosiła 132%
W porównaniu do wszystkich testowanych urządzeń
» 49% wszystkich testowanych urządzeń było lepszych, 7% podobnych, 44% gorszych
» Najlepszy miał deltę 4%, średnia wynosiła ###średnia###%, najgorsza wynosiła 134%
Zarządzanie energią - komputerowi Gigabyte nie brakuje wytrzymałości
Zużycie energii
Laptop Gigabyte nie zgłosił żadnych problemów pod względem zużycia energii. Wskaźniki są na normalnym poziomie dla zainstalowanego sprzętu. Test Witcher 3 test i test warunków skrajnych zostały uruchomione przy względnie stałym zużyciu energii. Zasilacz (240 W) jest wystarczającej wielkości.
| wyłączony / stan wstrzymania | |
| luz | |
| obciążenie |
|
Legenda:
min: | |
| Aorus 15 BSF i7-13700H, GeForce RTX 4070 Laptop GPU | HP Omen Transcend 16 i9-13900HX, GeForce RTX 4070 Laptop GPU | MSI Pulse 17 B13VGK i7-13700H, GeForce RTX 4070 Laptop GPU | Lenovo Legion Slim 7i 16 Gen 8 i9-13900H, GeForce RTX 4070 Laptop GPU | Acer Nitro 16 AN16-41 R7 7735HS, GeForce RTX 4070 Laptop GPU | Asus TUF Gaming A16 FA617XS R9 7940HS, Radeon RX 7600S | Średnia w klasie Gaming | |
|---|---|---|---|---|---|---|---|
| Power Consumption | -85% | 15% | -74% | -19% | 15% | -36% | |
| Idle Minimum * (Watt) | 7 | 19.2 -174% | 9 -29% | 22 -214% | 11.6 -66% | 7 -0% | 13 ? -86% |
| Idle Average * (Watt) | 12 | 22.7 -89% | 10.2 15% | 29 -142% | 15.6 -30% | 10 17% | 18.6 ? -55% |
| Idle Maximum * (Watt) | 20 | 55.4 -177% | 10.8 46% | 39.5 -98% | 16.5 17% | 15 25% | 24.2 ? -21% |
| Load Average * (Watt) | 94 | 128.4 -37% | 72 23% | 98.7 -5% | 155 -65% | 86 9% | 109.2 ? -16% |
| Witcher 3 ultra * (Watt) | 175.8 | 206 -17% | 130 26% | 171.8 2% | 154.8 12% | 160.6 9% | |
| Load Maximum * (Watt) | 247 | 292 -18% | 221 11% | 213.2 14% | 205 17% | 172 30% | 256 ? -4% |
* ... im mniej tym lepiej
Power consumption Witcher 3 / stress test
Power consumption with external monitor
Żywotność baterii
15,6-calowe urządzenie osiągnęło czasy pracy wynoszące odpowiednio 10:19 h i 9:01 h w teście WLAN (wywoływanie stron internetowych za pomocą skryptu) i teście wideo (krótki film Big Buck Bunny (kodowanie H.264, FHD) w pętli). Podczas obu testów funkcje oszczędzania energii laptopa były wyłączone, a jasność wyświetlacza ustawiona na około 150 cd/m². Moduły bezprzewodowe były również wyłączone na czas testu wideo.
Urządzenie osiągnęło bardzo dobre czasy pracy. Wielu konkurentów znalazło się daleko w tyle za Aorusem 15, pomimo podobnej pojemności baterii. Laptop Aorus nadal nie był w stanie zbliżyć się doAsus TUF Gaming A16osiągając niesamowite wyniki. Komputer Asus korzysta z bardziej oszczędnego procesora AMD APU.
| Aorus 15 BSF i7-13700H, GeForce RTX 4070 Laptop GPU, 99 Wh | HP Omen Transcend 16 i9-13900HX, GeForce RTX 4070 Laptop GPU, 97 Wh | MSI Pulse 17 B13VGK i7-13700H, GeForce RTX 4070 Laptop GPU, 90 Wh | Lenovo Legion Slim 7i 16 Gen 8 i9-13900H, GeForce RTX 4070 Laptop GPU, 99.9 Wh | Acer Nitro 16 AN16-41 R7 7735HS, GeForce RTX 4070 Laptop GPU, 90 Wh | Asus TUF Gaming A16 FA617XS R9 7940HS, Radeon RX 7600S, 90 Wh | Średnia w klasie Gaming | |
|---|---|---|---|---|---|---|---|
| Czasy pracy | -49% | -7% | -56% | -2% | 21% | -22% | |
| Reader / Idle (h) | 10.9 | 6.3 -42% | 5.1 -53% | 12.2 12% | 20.3 86% | 8.71 ? -20% | |
| H.264 (h) | 9 | 10.2 13% | 12.4 38% | 8.64 ? -4% | |||
| WiFi v1.3 (h) | 10.3 | 4.2 -59% | 9 -13% | 4.4 -57% | 9 -13% | 12.4 20% | 7.11 ? -31% |
| Load (h) | 2.2 | 1.2 -45% | 2.2 0% | 0.9 -59% | 1.8 -18% | 0.9 -59% | 1.502 ? -32% |
Za
Przeciw
Werdykt - laptop do gier QHD jest wart swojej ceny
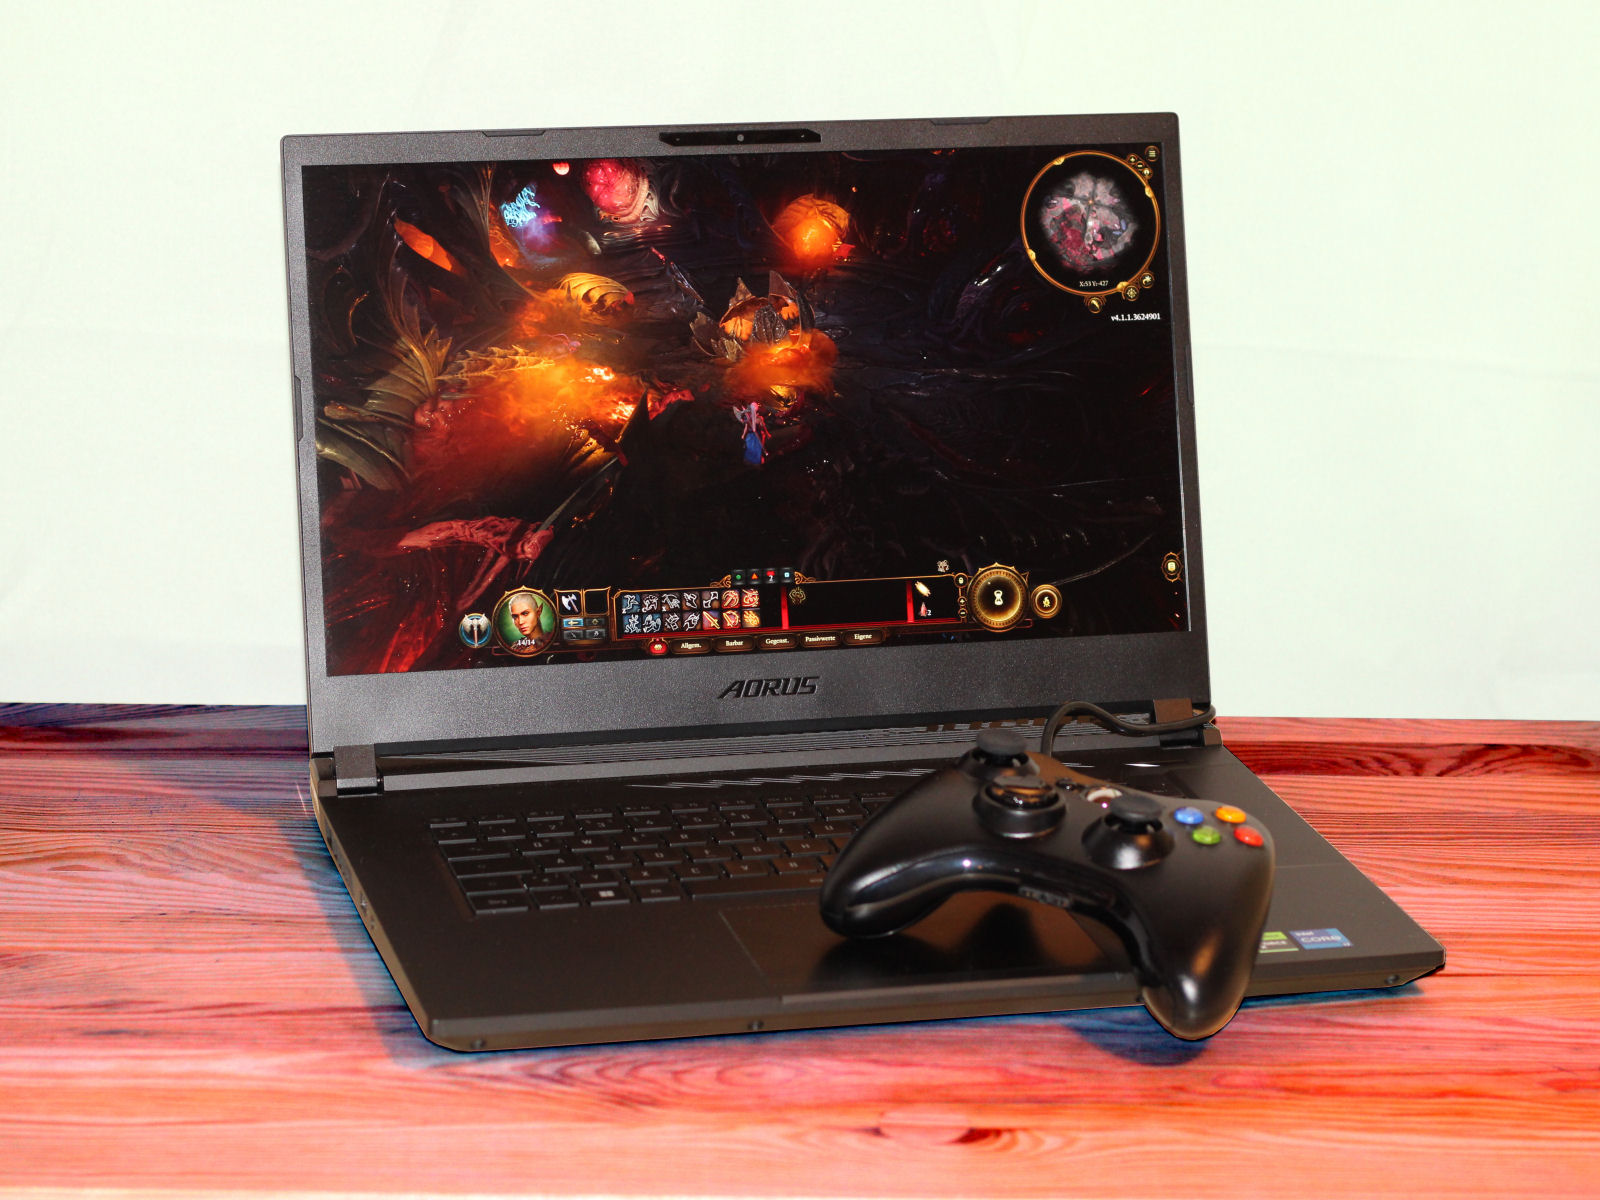
Aorus 15 jest stworzony do gier w rozdzielczości QHD (ustawienia wysokie do maksymalnych), ale świetnie radzi sobie także w innych zastosowaniach (edycja wideo, renderowanie). JegoCore i7-13700HiGeForce RTX 4070zapewniają niezbędną wydajność. Oba układy pracują z niezmiennie wysokim taktowaniem. Szybki dysk SSD PCIe 4 (1 TB) zapewnia wymaganą pamięć masową i zapewnia krótki czas ładowania.
Gigabyte Aorus 15 BSF to świetny i wszechstronny laptop do gier średniej klasy.
Emisja hałasu i ciepła jest na oczekiwanym poziomie dla tego przedziału cenowego. Niższy poziom hałasu można osiągnąć kosztem wydajności laptopa. Matowa matryca IPS (15,6 cala, 2560 x 1440 pikseli, 165 Hz, DCI P3) ogólnie robi dobre wrażenie. Choć jego jasność i kontrast mogłyby być nieco lepsze.
Pełne naładowanie baterii (99 Wh) prowadzi do praktycznych czasów pracy wynoszących około 9 do 10 godzin - to bardzo dobry wynik. Pozytywne: Akumulator można ładować za pomocą kabla USB-C (min. 65 W, 20 V) - jego port USB-C (Thunderbolt 4) obsługuje Power Delivery. Oznacza to, że nieporęczne, własne złącze zasilania (240 W) nie zawsze musi być transportowane z urządzeniem.
Alternatywą dla tego laptopa może byćAsus TUF Gaming A16 FA617XSktóry oferuje lepszą wydajność procesora, wyświetlacz 16:10 i jeszcze dłuższy czas pracy. Pod względem wydajności graficznej wypada nieco gorzej niż Aorus 15.
Cena i dostępność
Testowaną przez nas wersję Aorus 15 BSF można znaleźć na Amazonie w cenie 1699 USD.
Aorus 15 BSF
- 12/08/2023 v7 (old)
Sascha Mölck
Przezroczystość
Wyboru urządzeń do recenzji dokonuje nasza redakcja. Próbka testowa została udostępniona autorowi jako pożyczka od producenta lub sprzedawcy detalicznego na potrzeby tej recenzji. Pożyczkodawca nie miał wpływu na tę recenzję, producent nie otrzymał też kopii tej recenzji przed publikacją. Nie było obowiązku publikowania tej recenzji. Jako niezależna firma medialna, Notebookcheck nie podlega władzy producentów, sprzedawców detalicznych ani wydawców.
Tak testuje Notebookcheck
Każdego roku Notebookcheck niezależnie sprawdza setki laptopów i smartfonów, stosując standardowe procedury, aby zapewnić porównywalność wszystkich wyników. Od około 20 lat stale rozwijamy nasze metody badawcze, ustanawiając przy tym standardy branżowe. W naszych laboratoriach testowych doświadczeni technicy i redaktorzy korzystają z wysokiej jakości sprzętu pomiarowego. Testy te obejmują wieloetapowy proces walidacji. Nasz kompleksowy system ocen opiera się na setkach uzasadnionych pomiarów i benchmarków, co pozwala zachować obiektywizm.Price comparison

