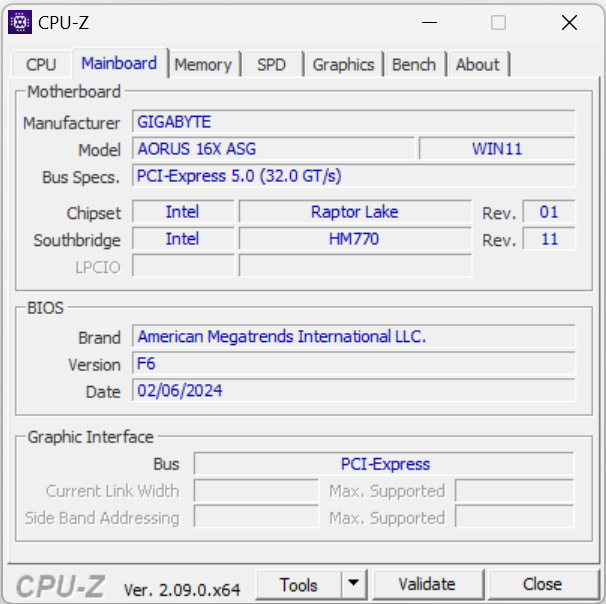
Recenzja Aorus 16X (2024): Core i9 i RTX 4070 za 2000 USD
Gry, rendering i tworzenie treści są reklamowane jako główne zalety Aorus 16X ASG. Raptor Lake i Ada Lovelace zapewniają wymaganą wydajność. Wśród konkurentów znajdują się takie urządzenia jak Alienware m16 R2, HP Omen Transcend 16, XMG Pro 16 Studio (Mid 23), Asus TUF Gaming A17 FA707XI i Lenovo Legion Pro 5 16IRX9.
Potencjalni konkurenci w porównaniu
Ocena | Data | Model | Waga | Wysokość | Rozmiar | Rezolucja | Cena |
|---|---|---|---|---|---|---|---|
| 87.4 % v7 (old) | 04/2024 | Aorus 16X 2024 i9-14900HX, GeForce RTX 4070 Laptop GPU | 2.3 kg | 20 mm | 16.00" | 2560x1600 | |
| 90.2 % v7 (old) | 03/2024 | Alienware m16 R2 Ultra 7 155H, GeForce RTX 4070 Laptop GPU | 2.5 kg | 23.5 mm | 16.00" | 2560x1600 | |
| 88.4 % v7 (old) | 02/2024 | HP Omen Transcend 16-u1095ng i9-14900HX, GeForce RTX 4070 Laptop GPU | 2.3 kg | 20 mm | 16.00" | 2560x1600 | |
| 85.6 % v7 (old) | 01/2024 | Asus TUF Gaming A17 FA707XI-NS94 R9 7940HS, GeForce RTX 4070 Laptop GPU | 2.5 kg | 25.4 mm | 17.30" | 1920x1080 | |
| 87.9 % v7 (old) | 10/2023 | Schenker XMG Pro 16 Studio (Mid 23) i9-13900H, GeForce RTX 4070 Laptop GPU | 2.6 kg | 19.9 mm | 16.00" | 2560x1600 | |
| 89.3 % v7 (old) | 04/2024 | Lenovo Legion Pro 5 16IRX9 i9-14900HX, GeForce RTX 4070 Laptop GPU | 2.5 kg | 26.95 mm | 16.00" | 2560x1600 |
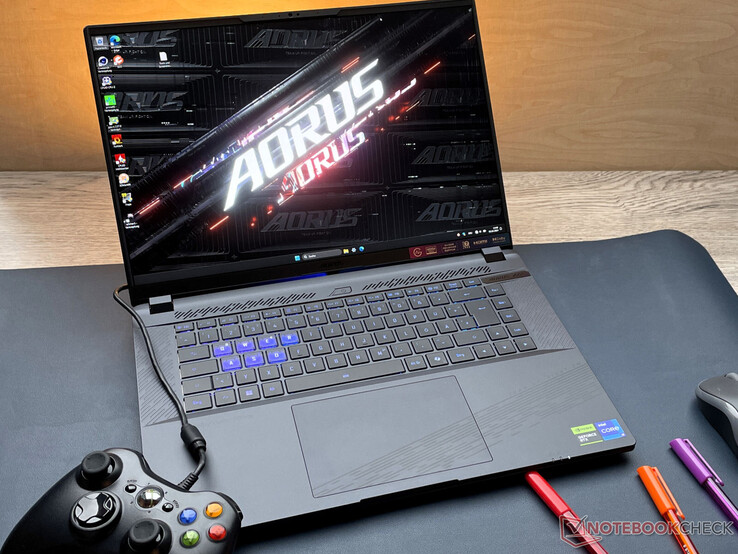
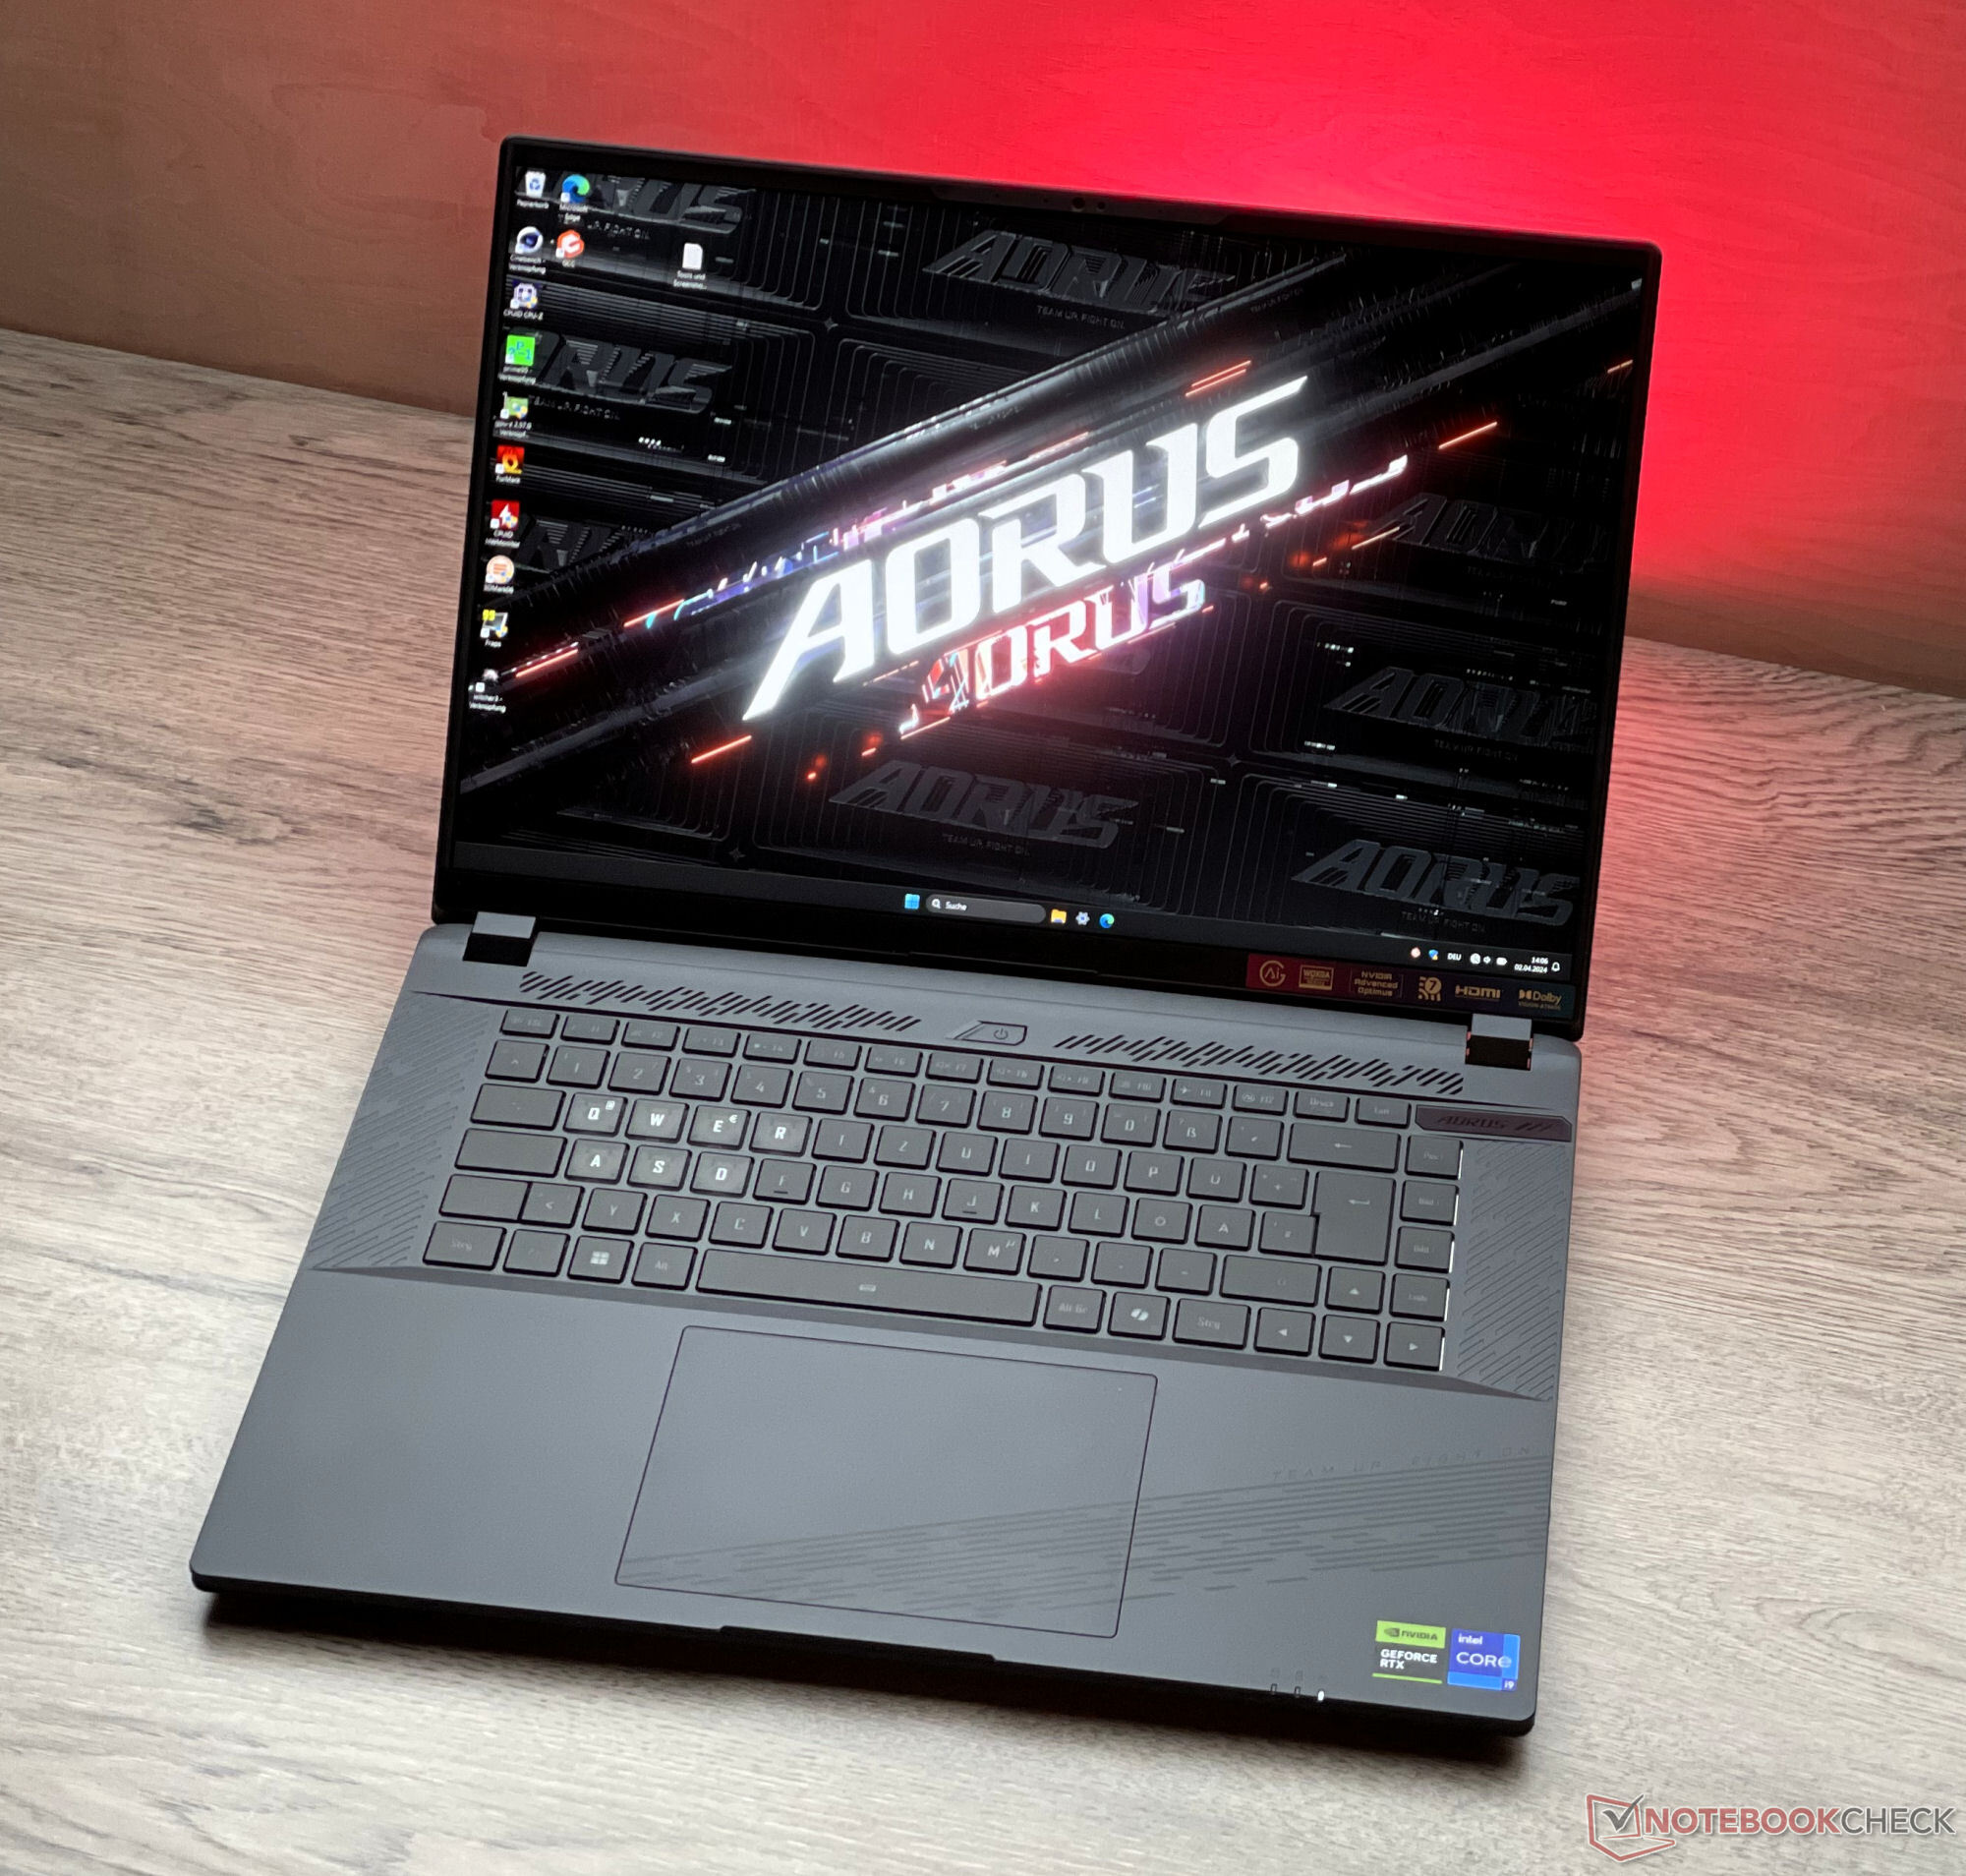
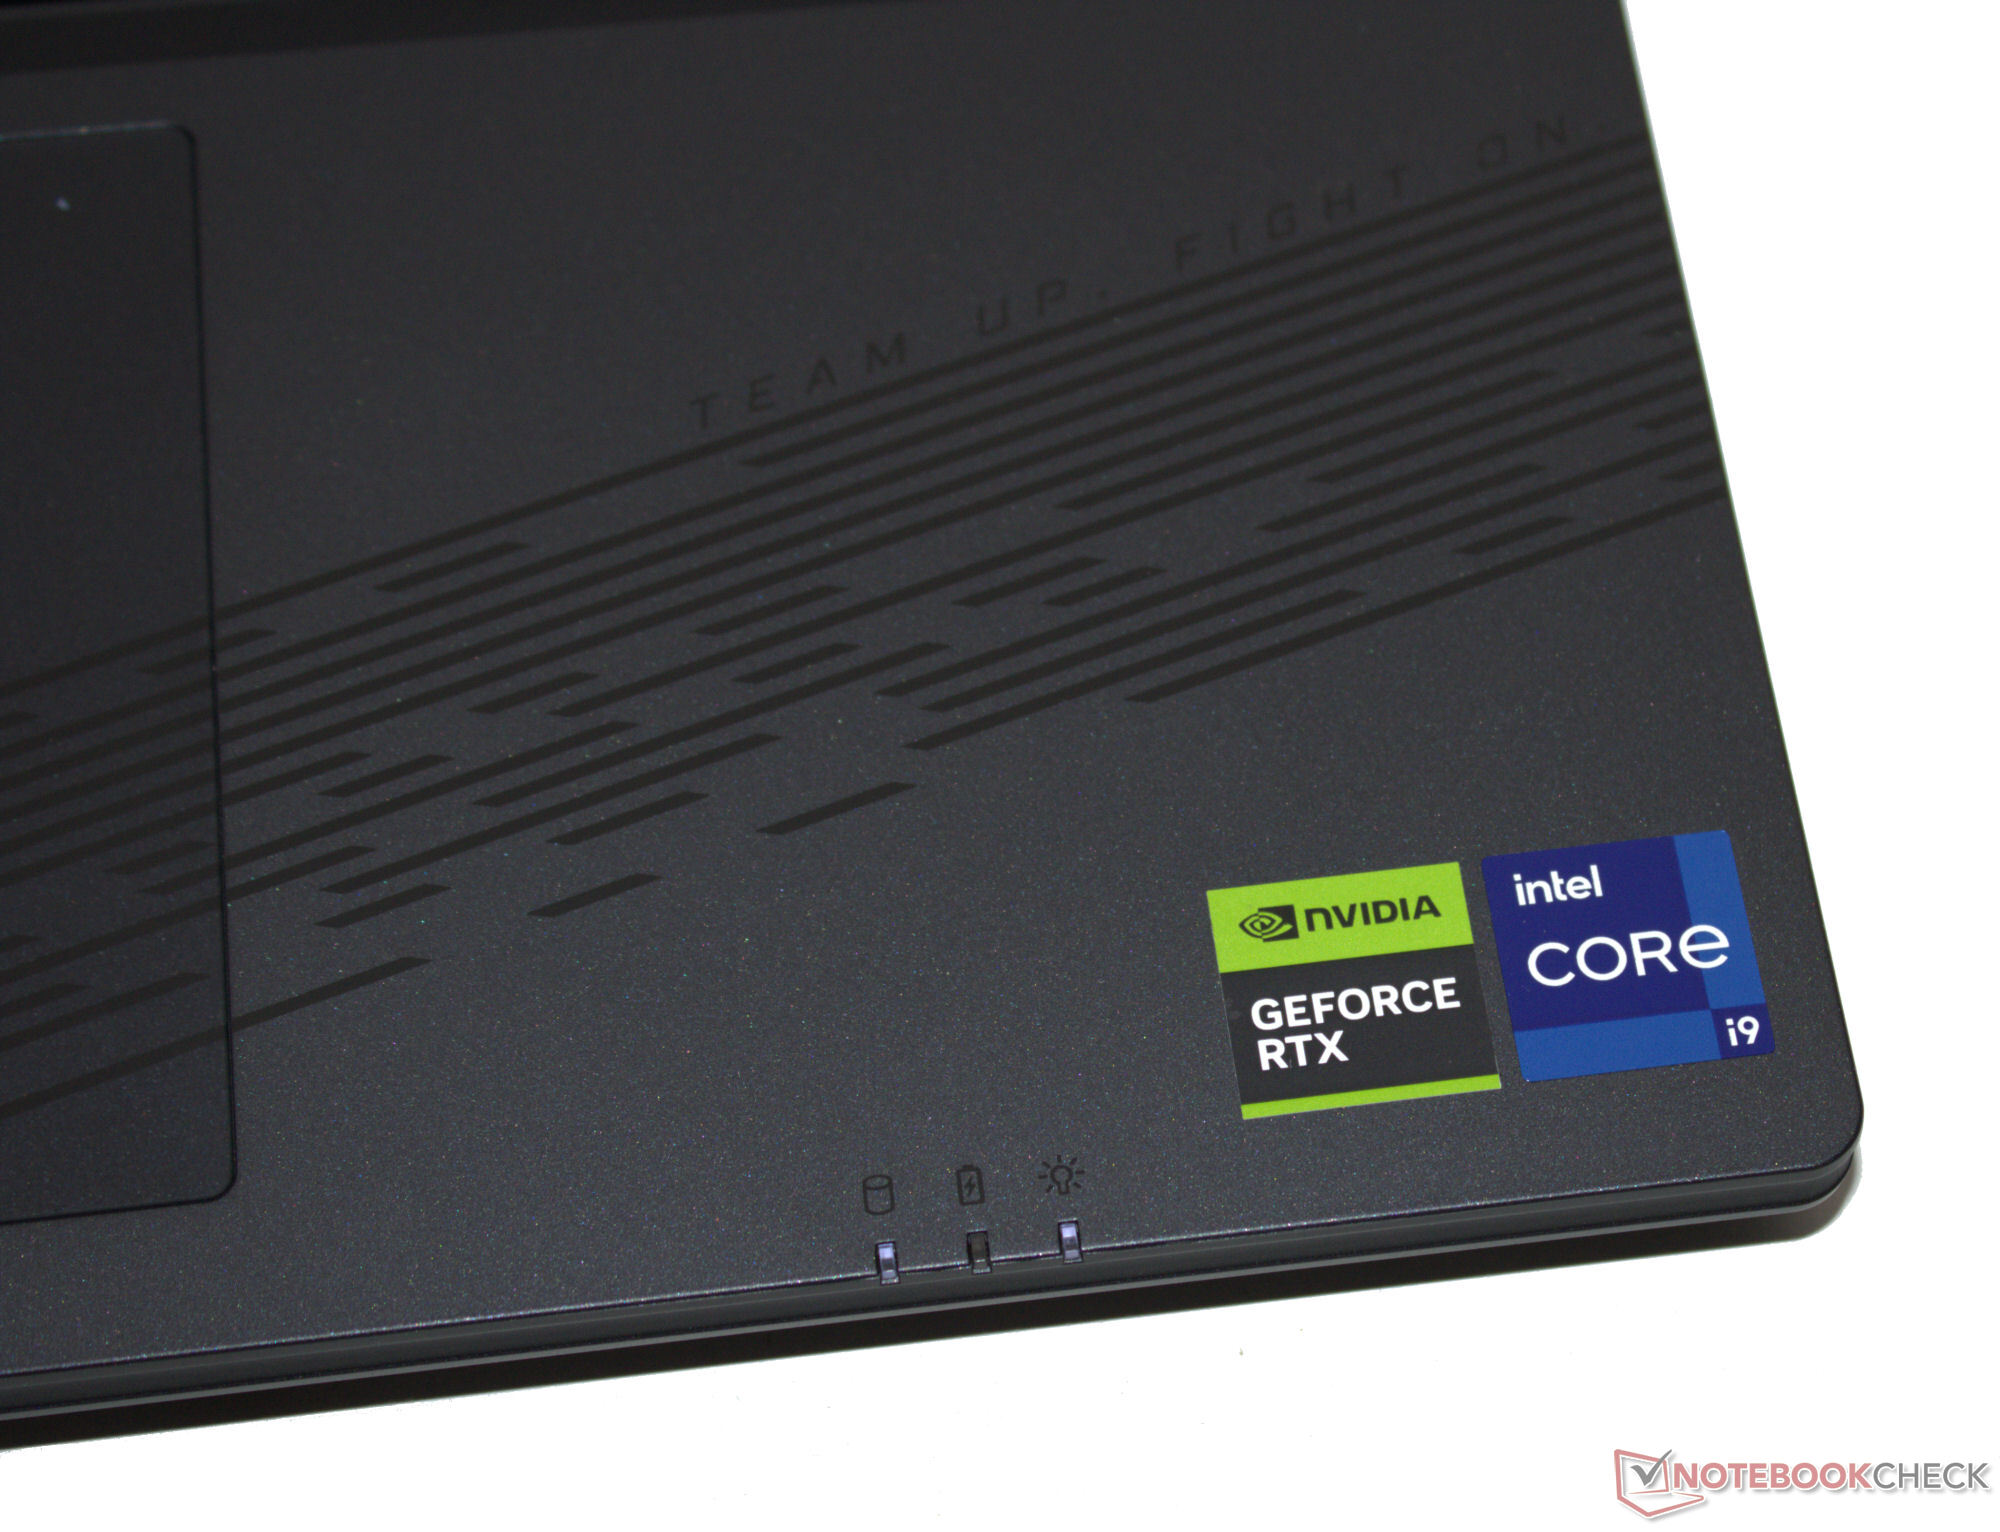
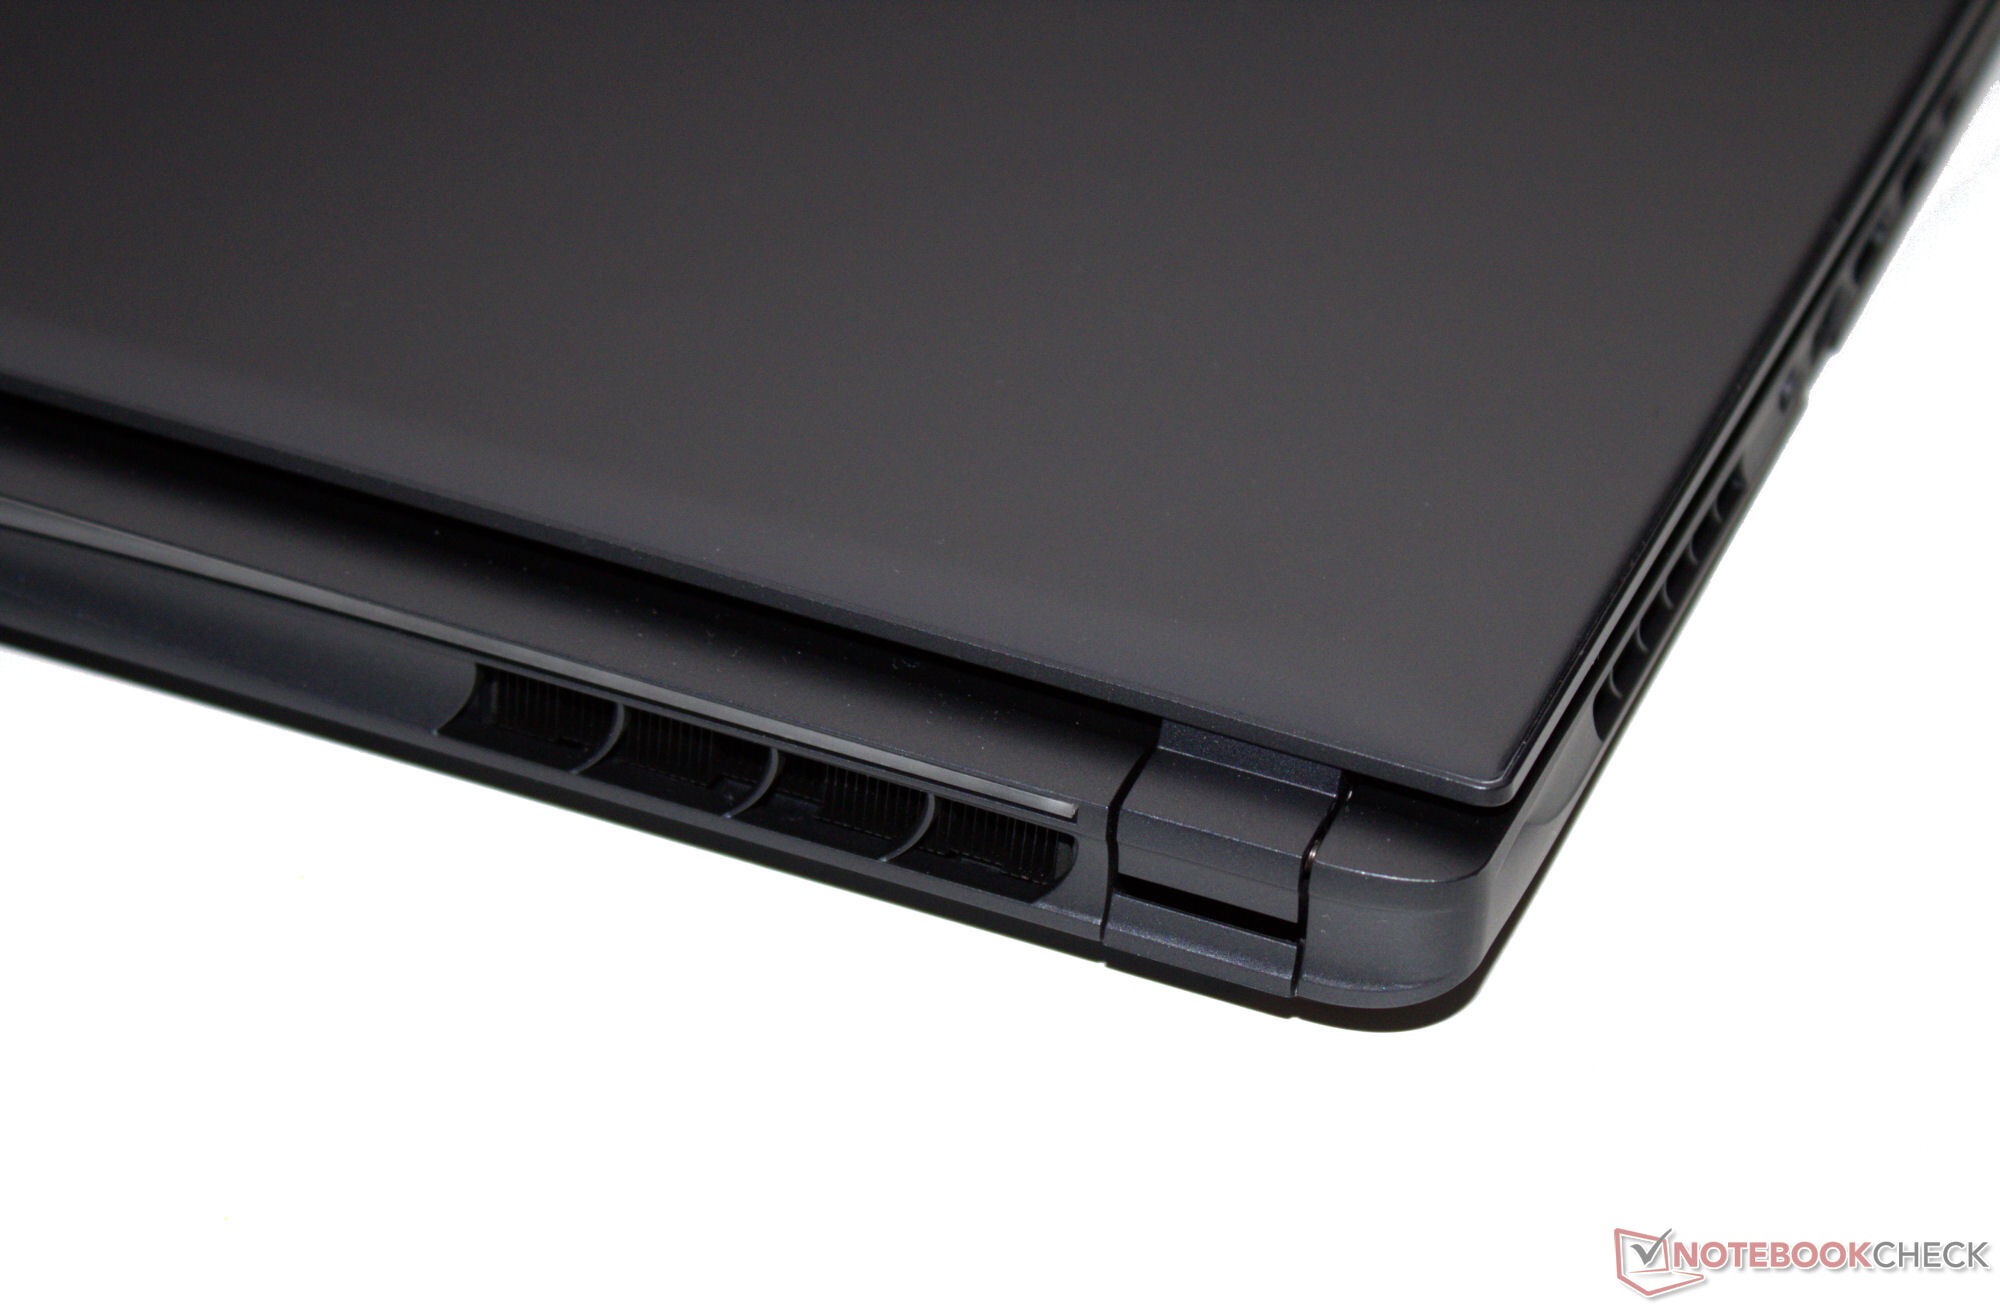
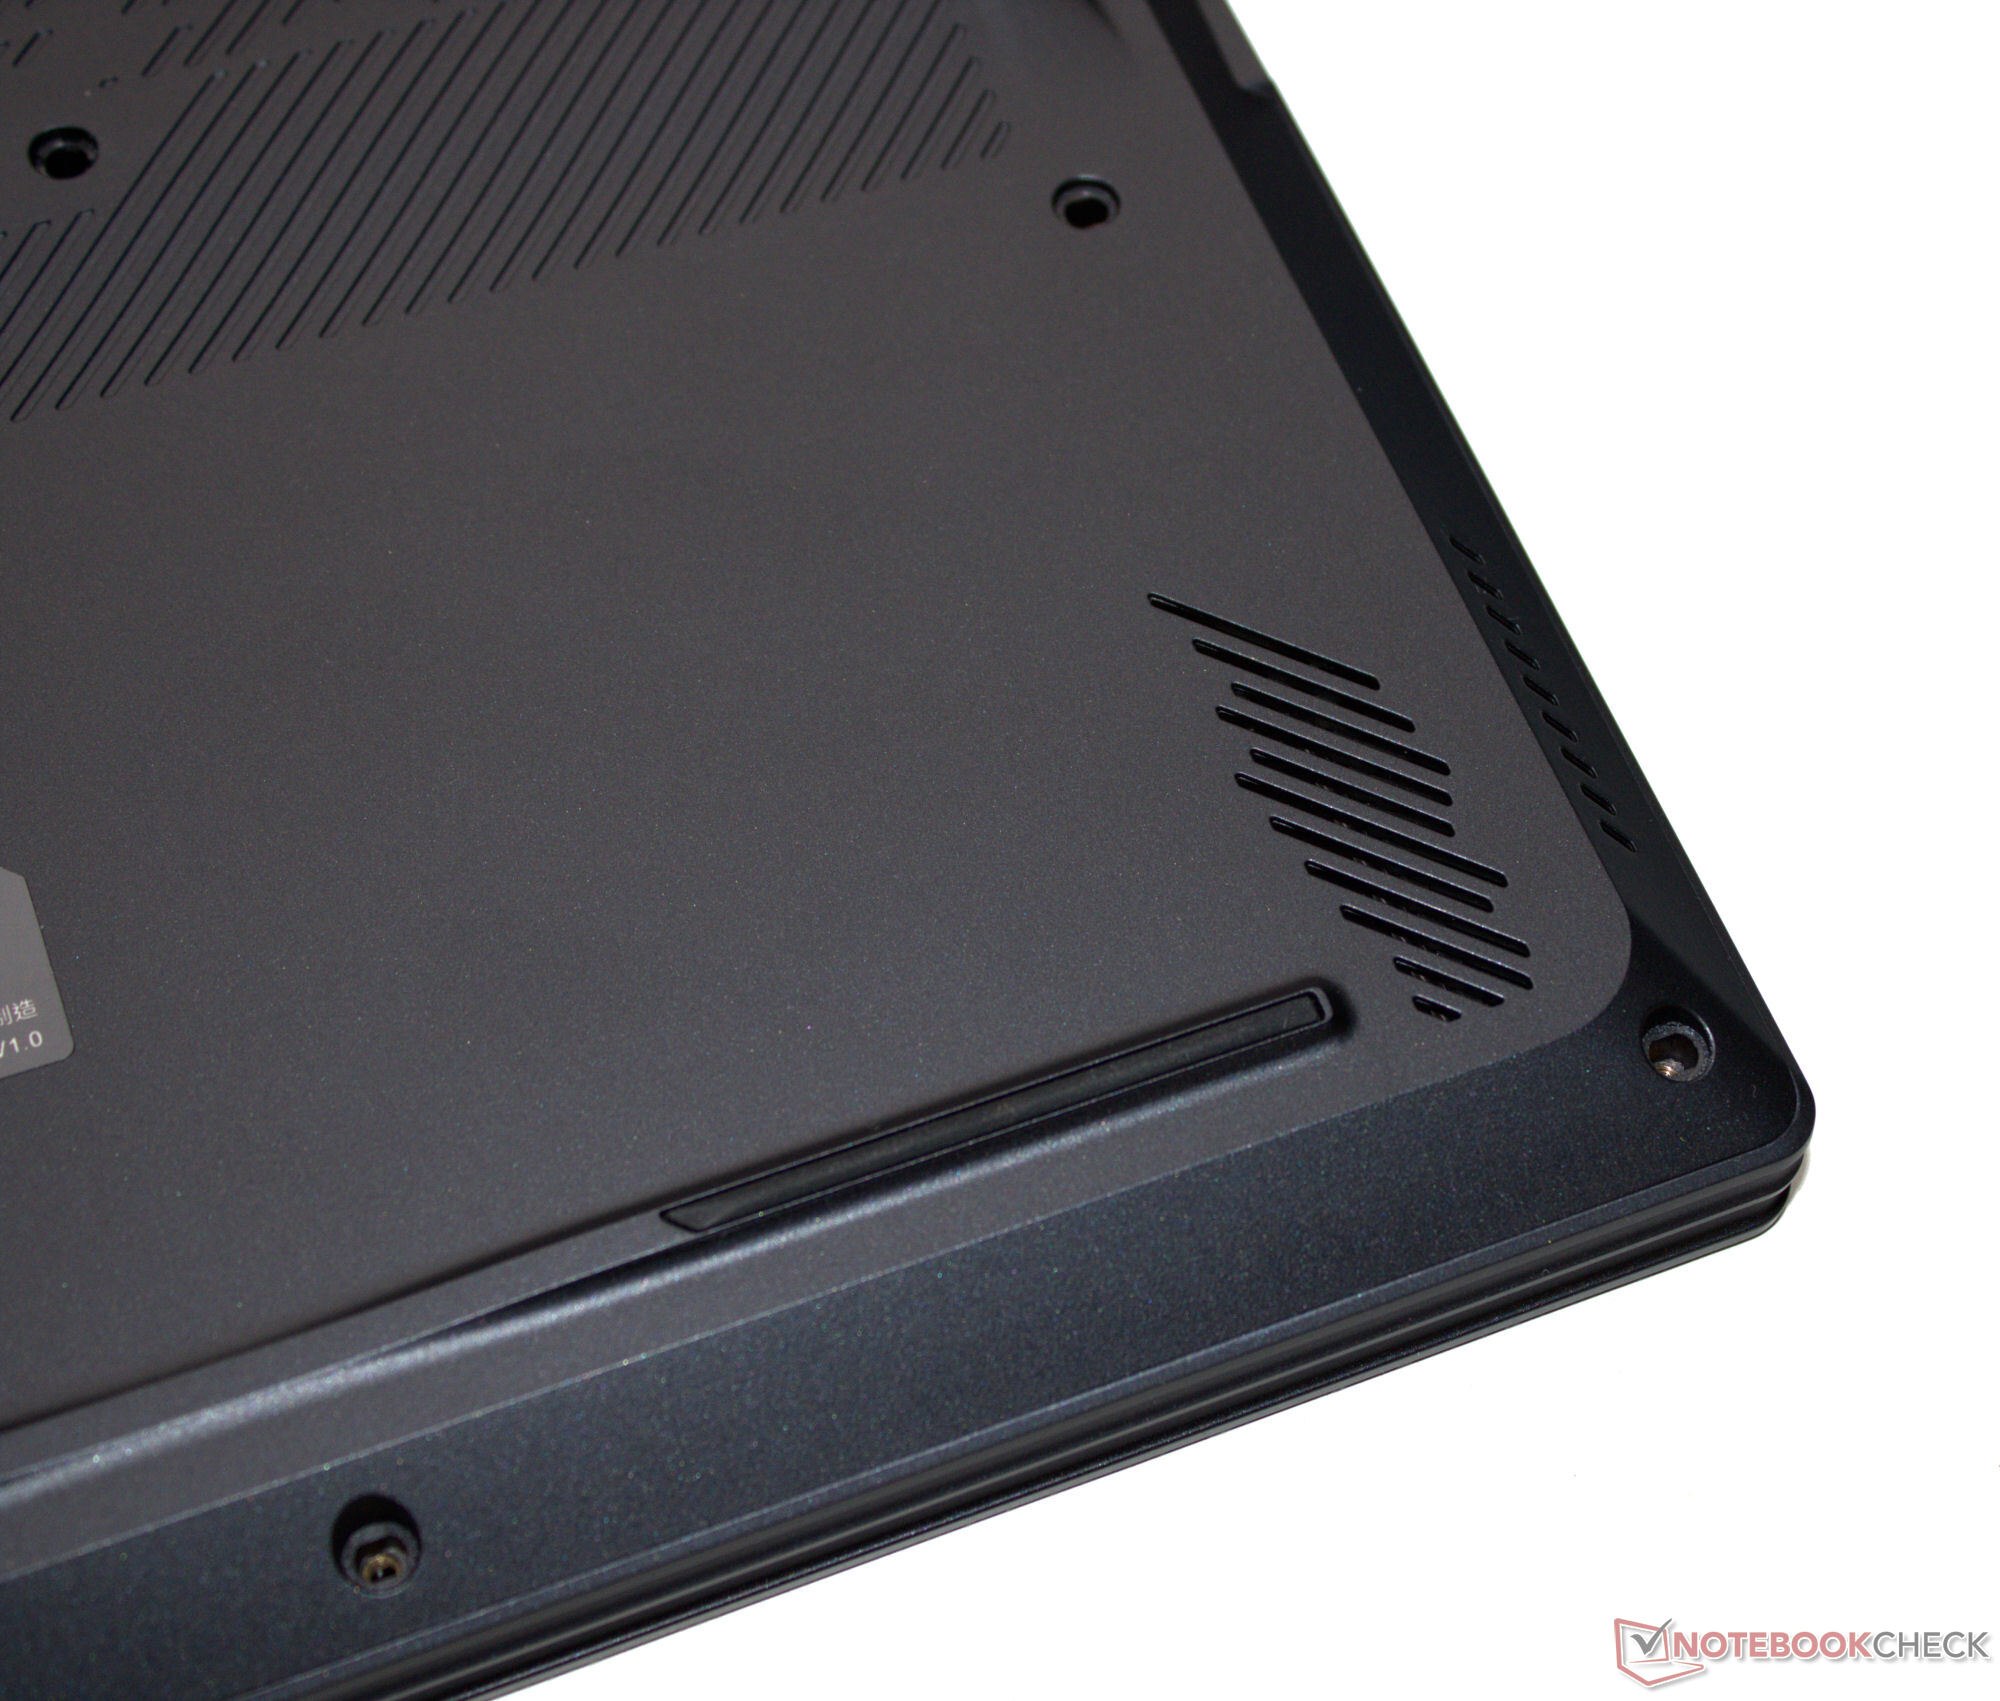
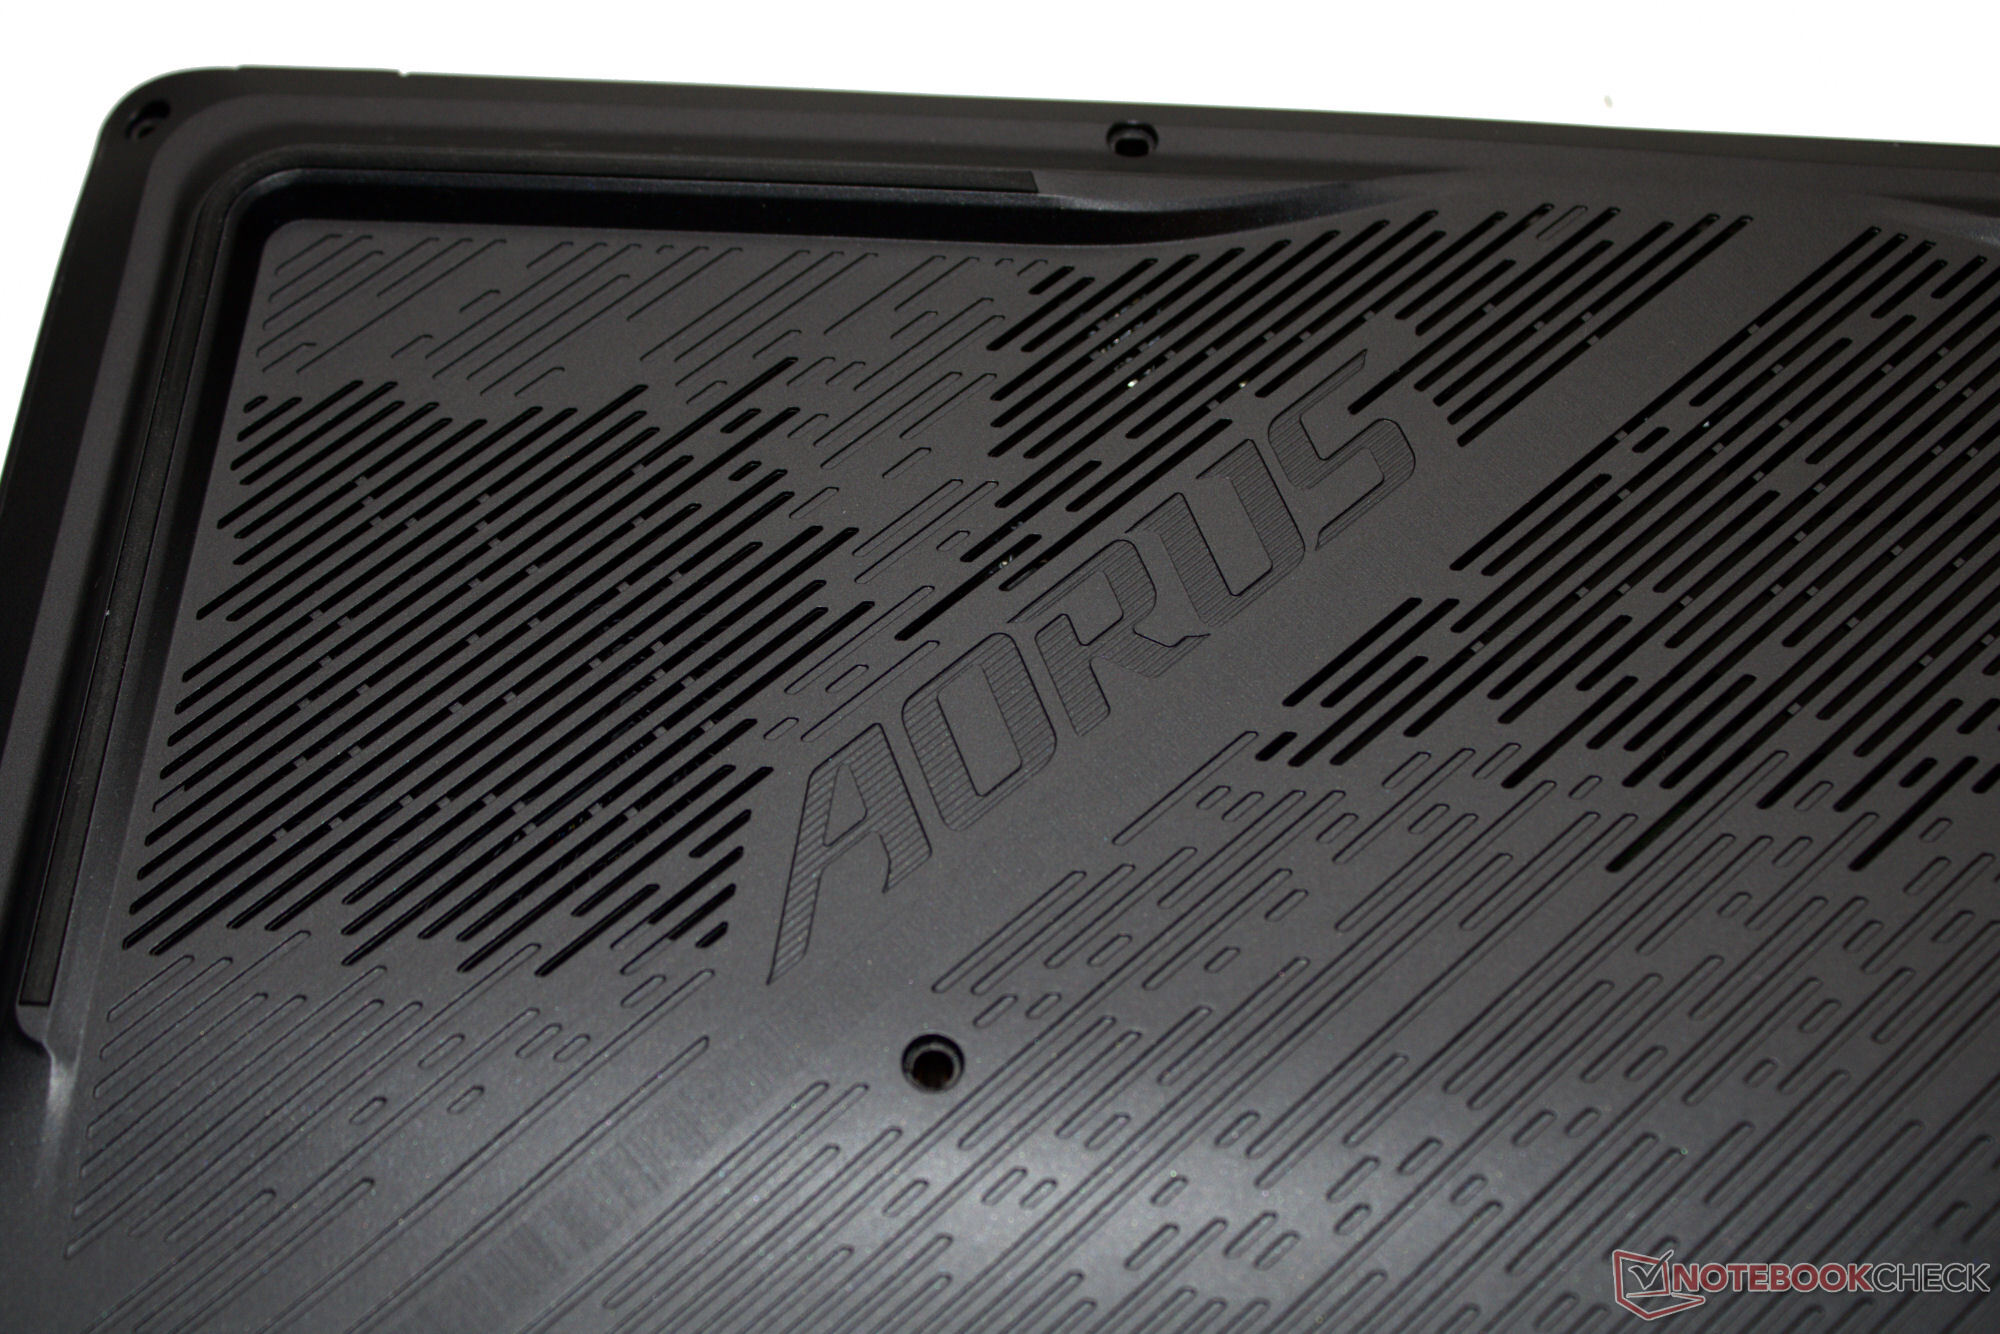
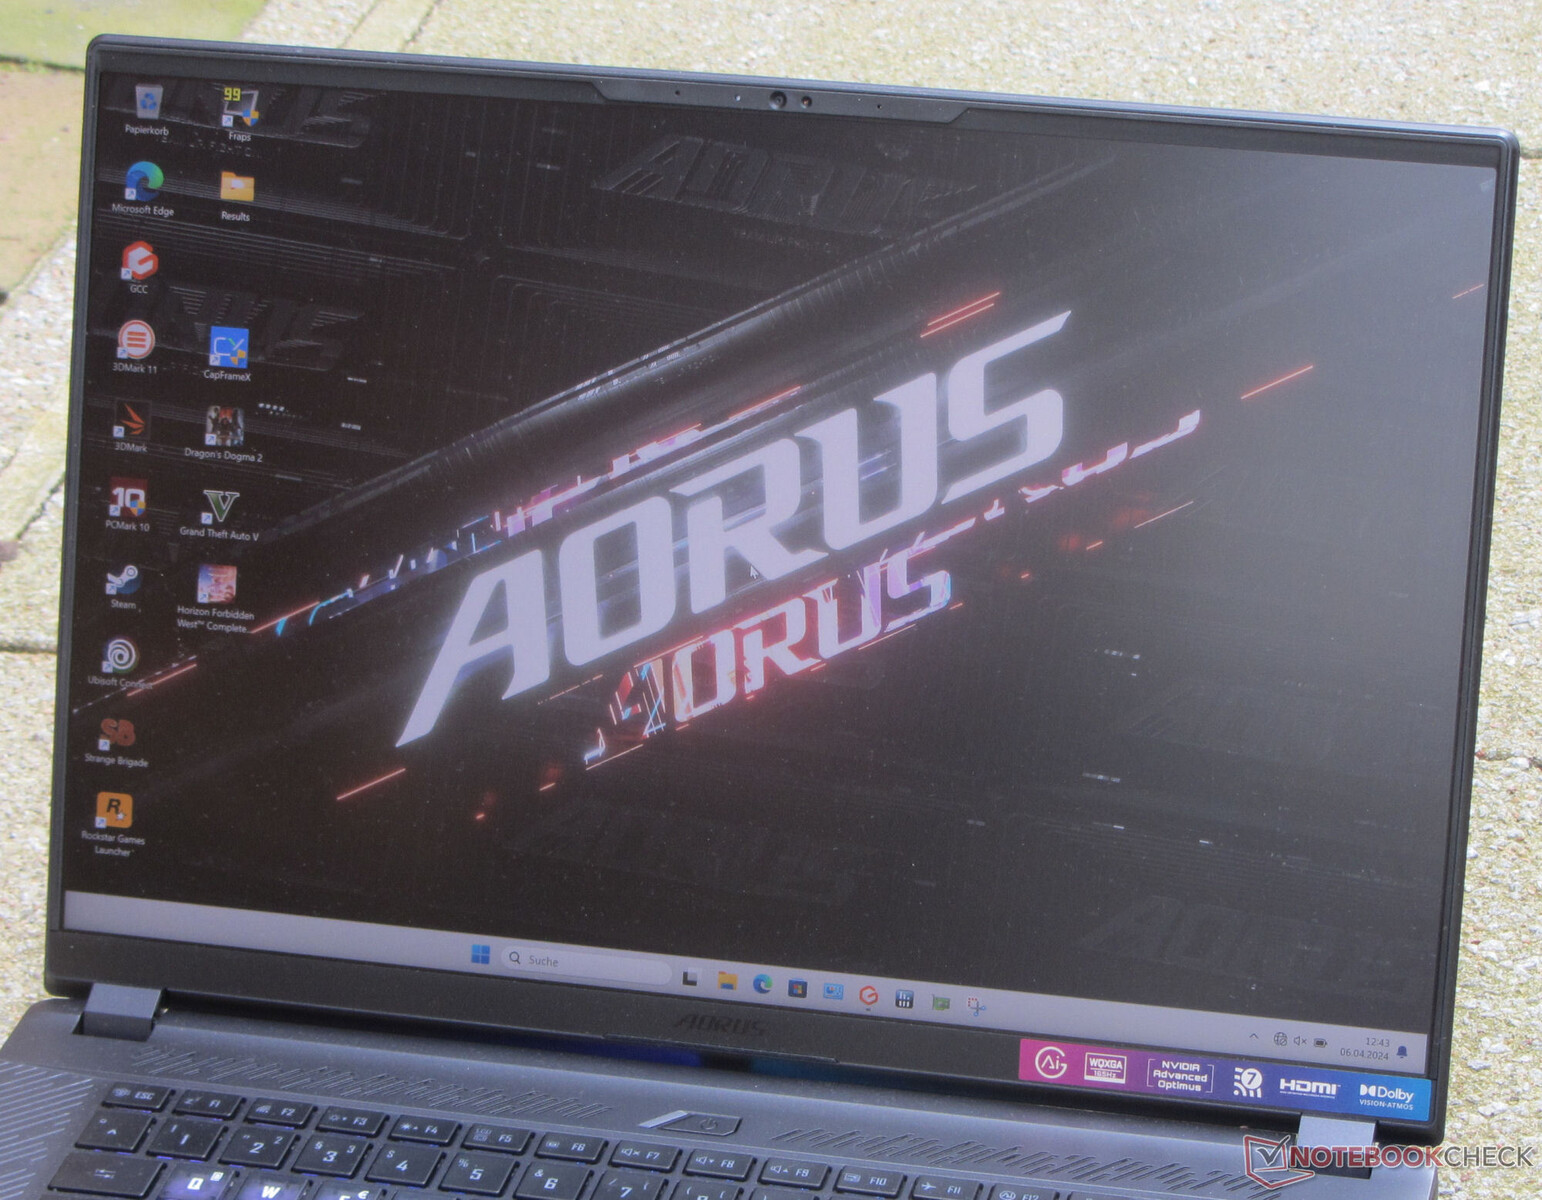
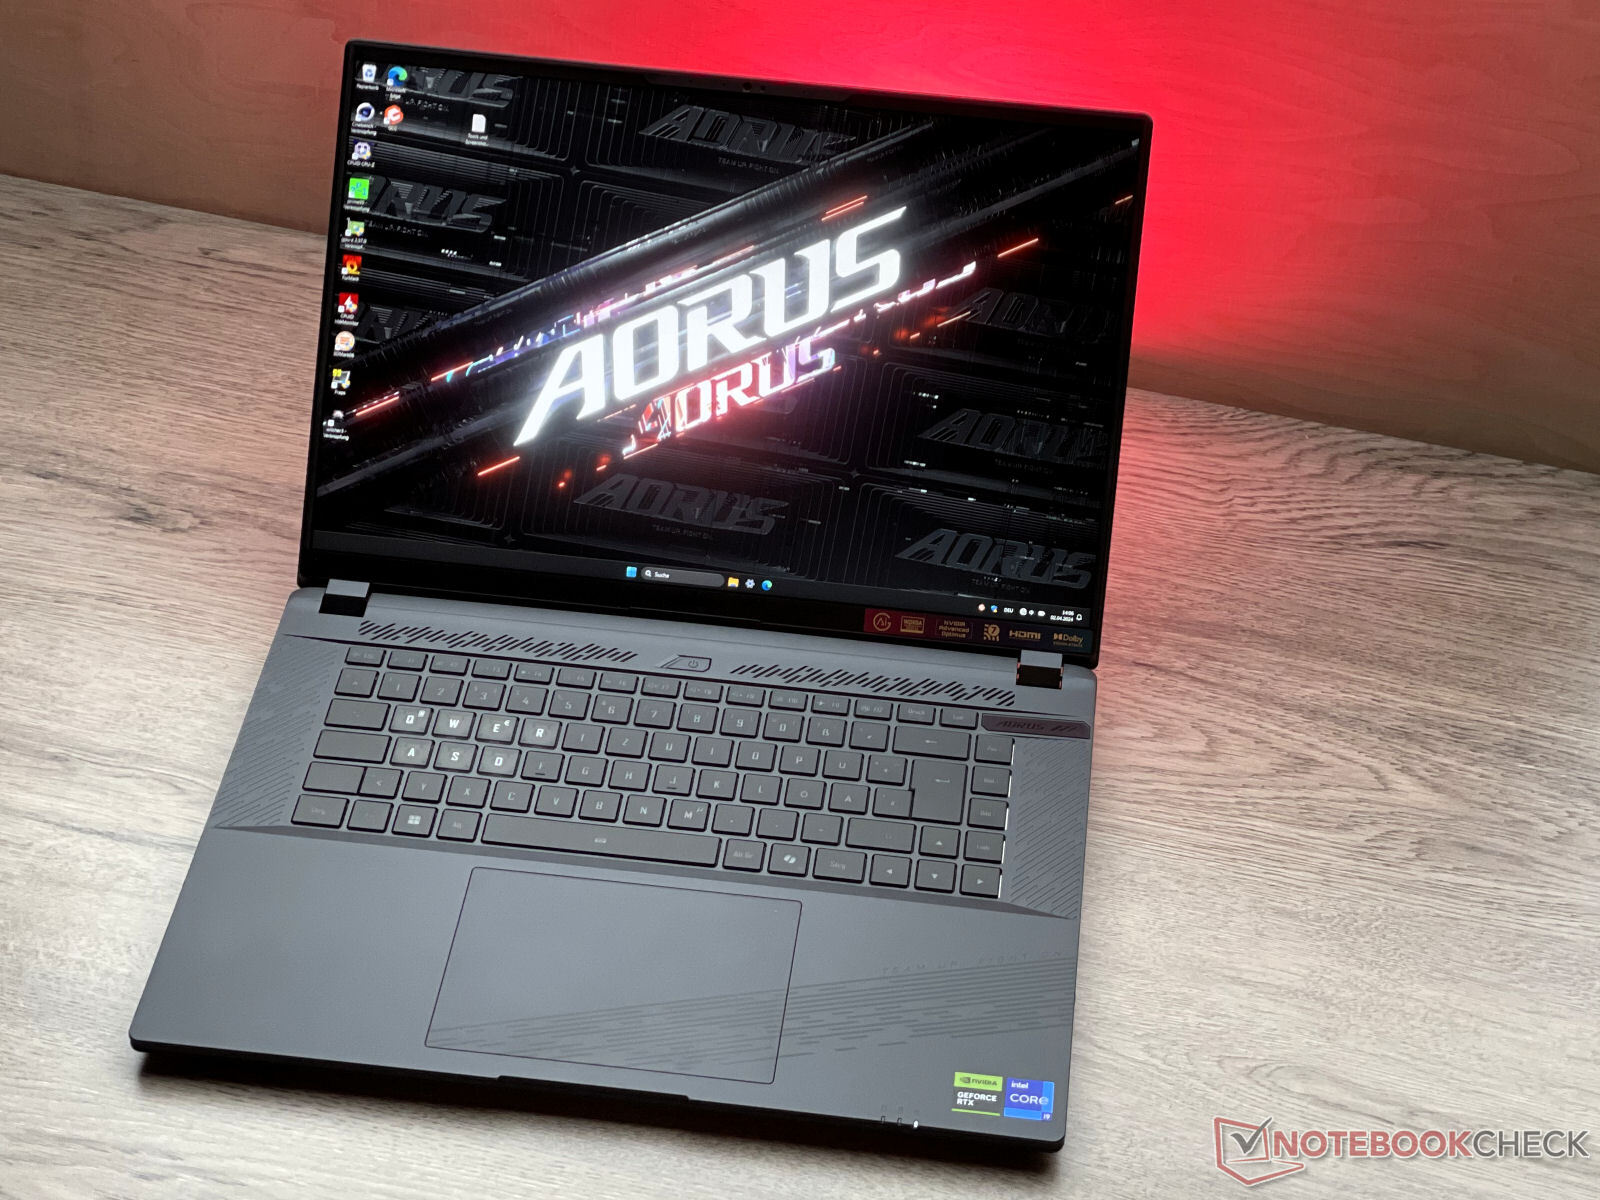
Obudowa - paski LED dodają odrobinę zabawy
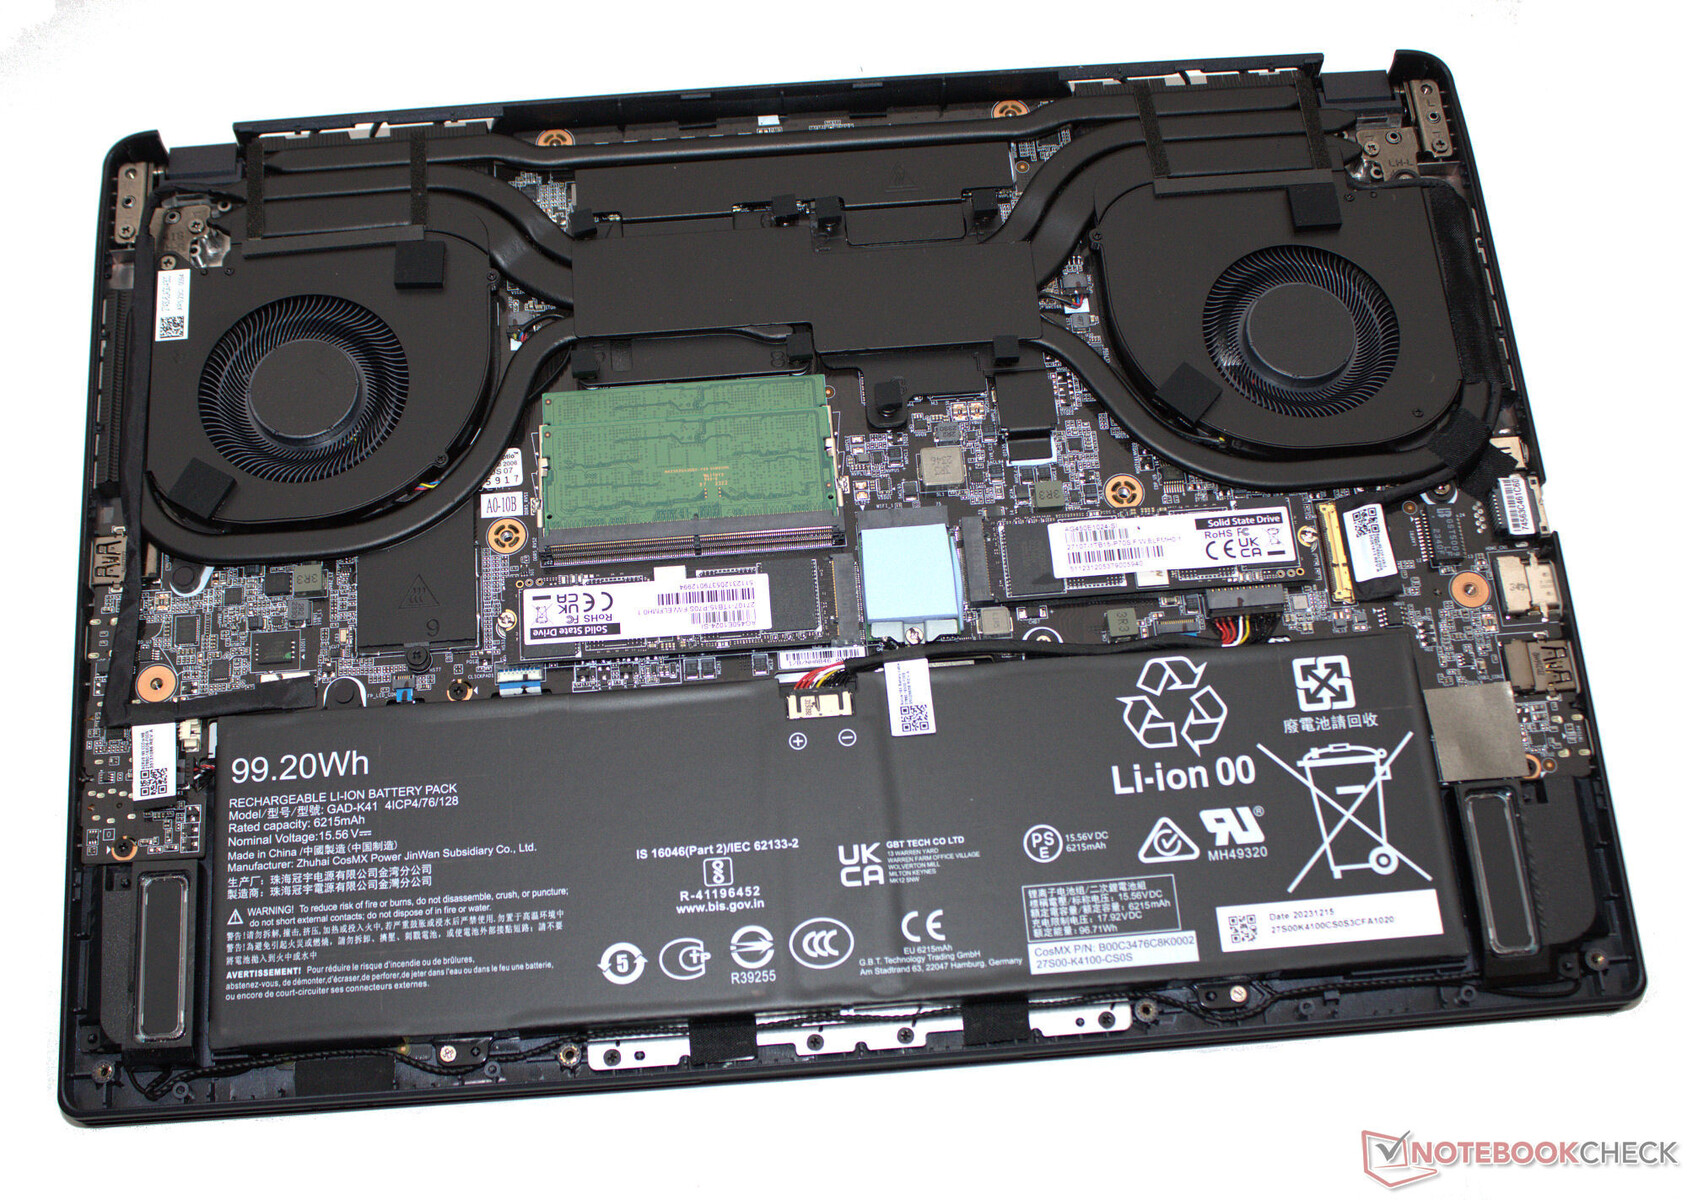
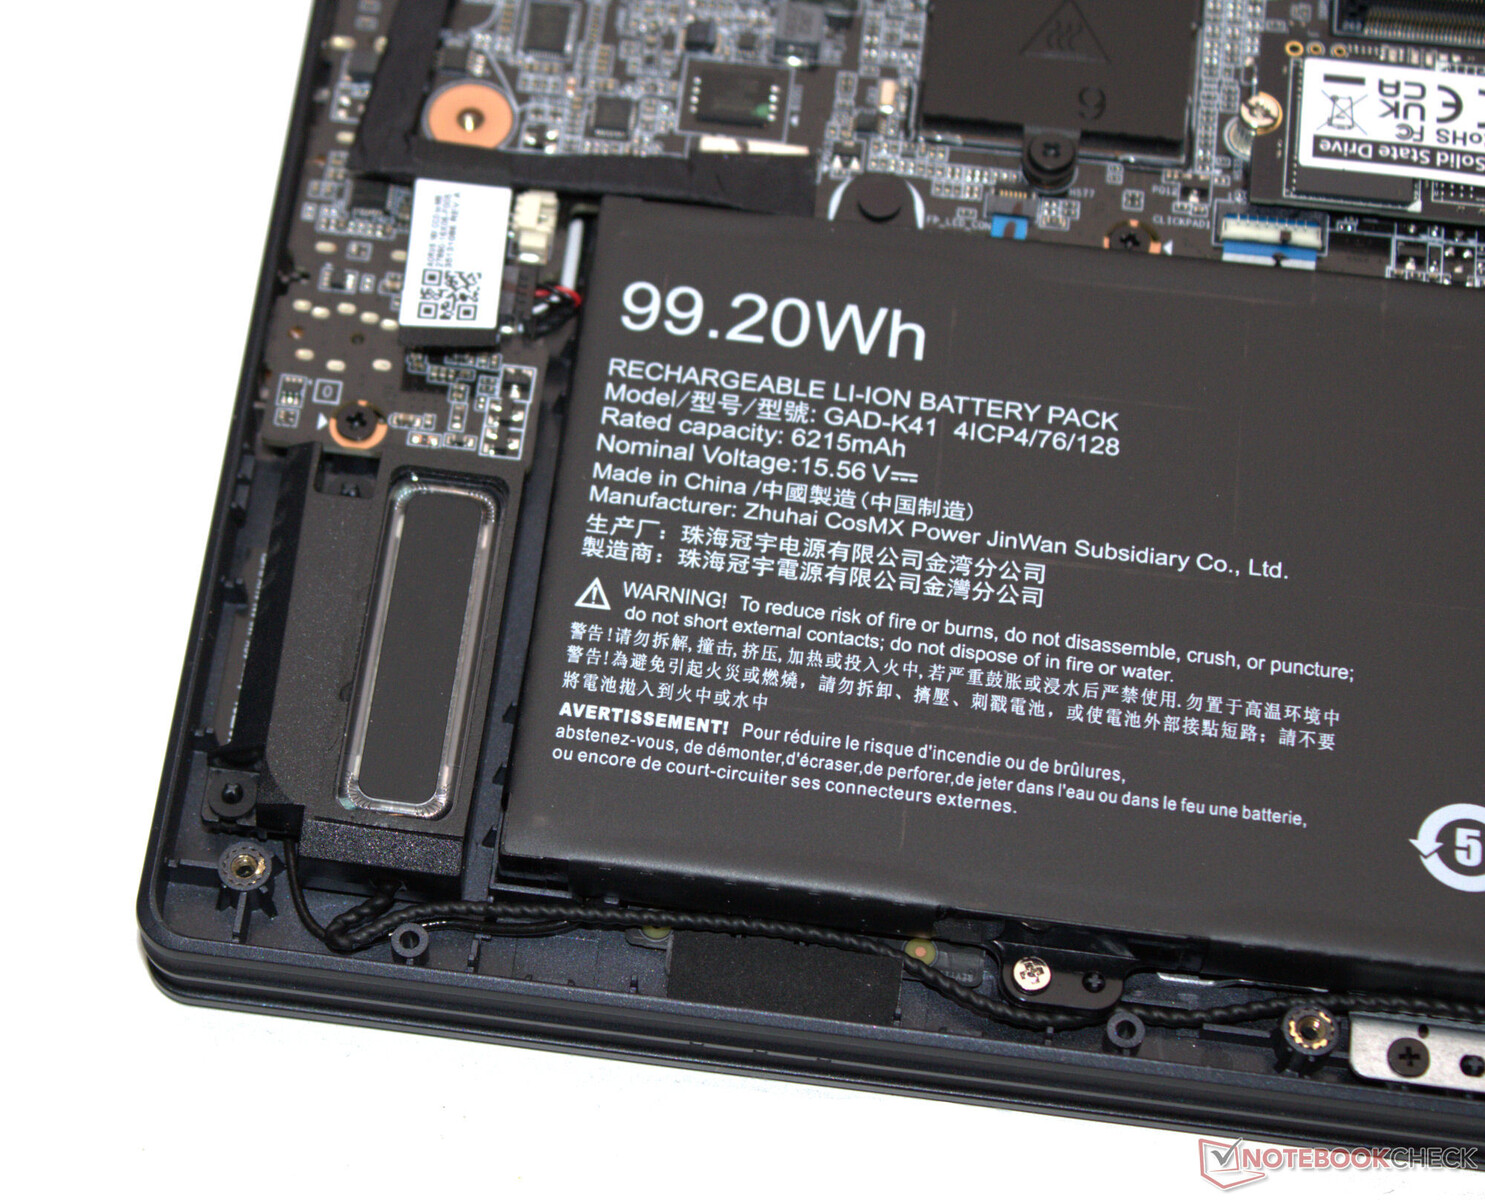
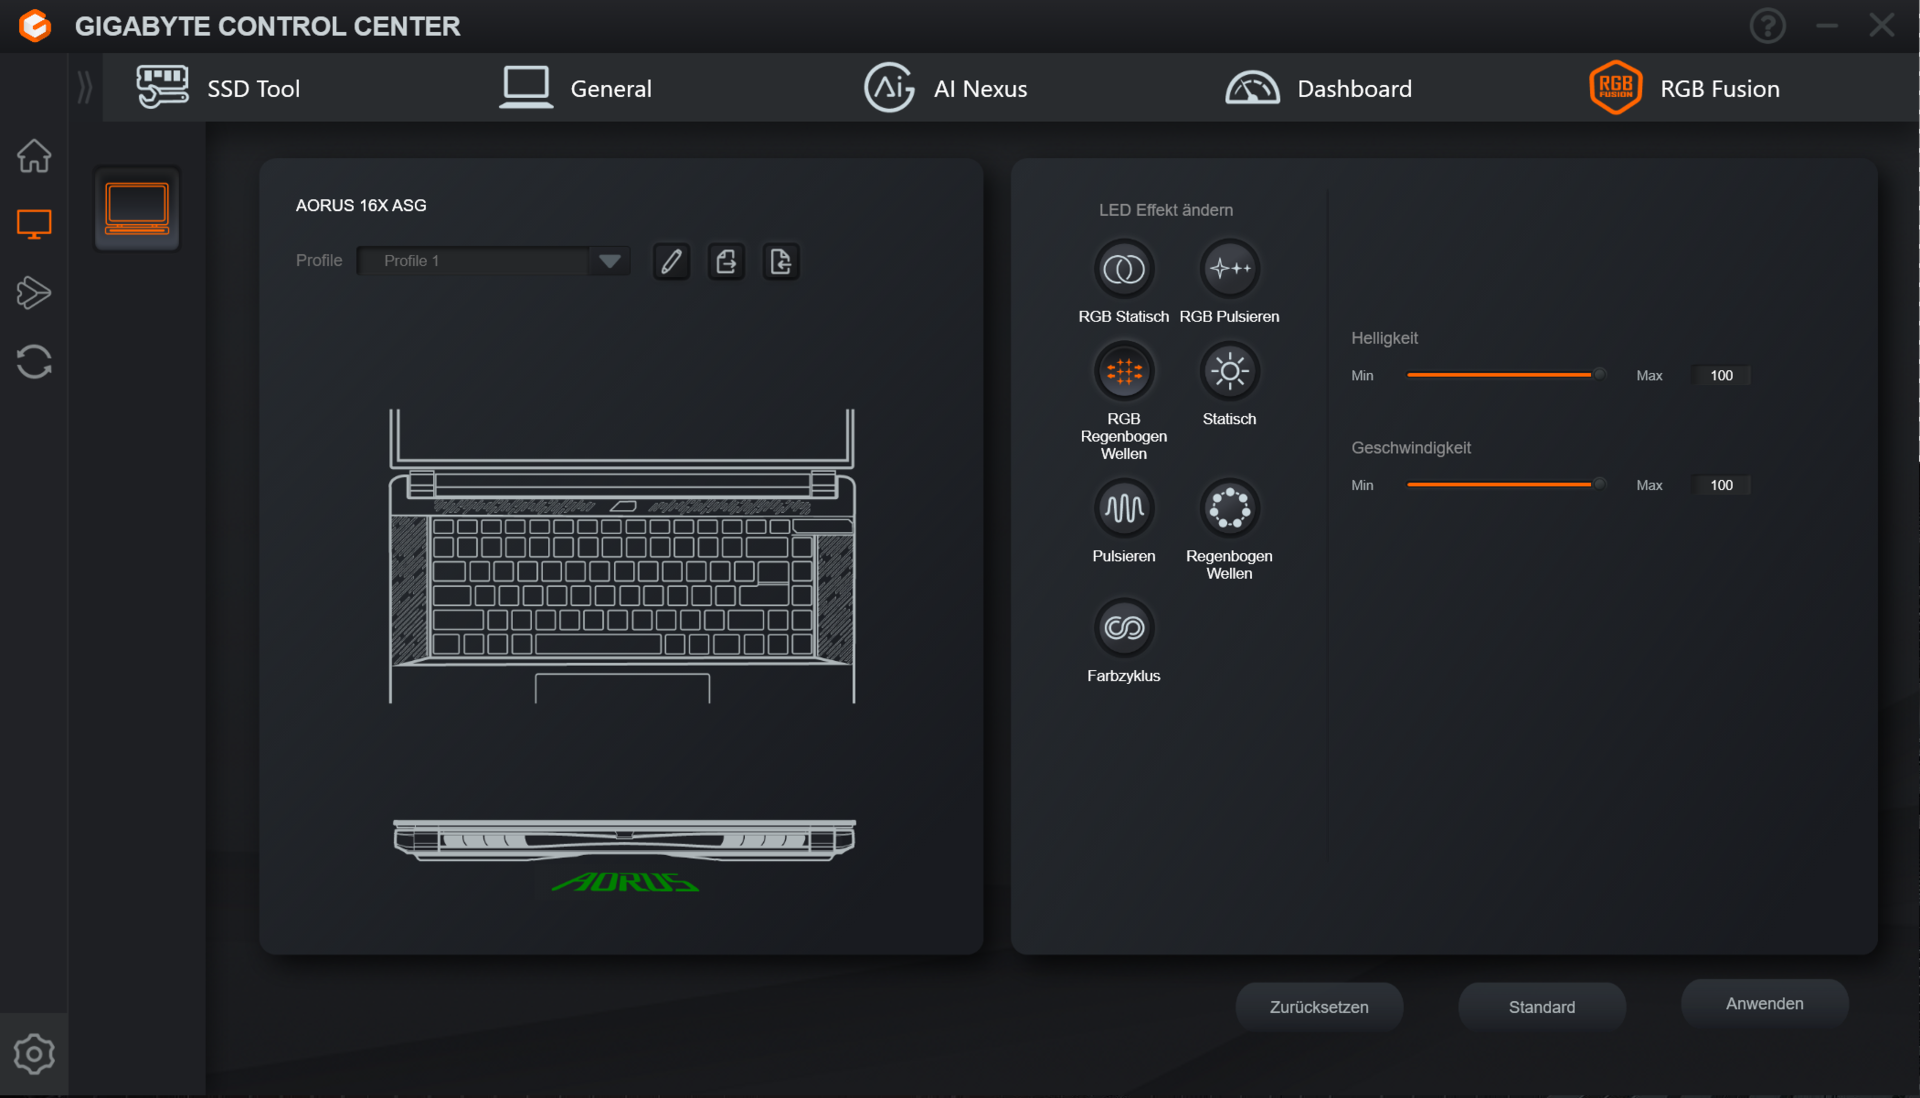
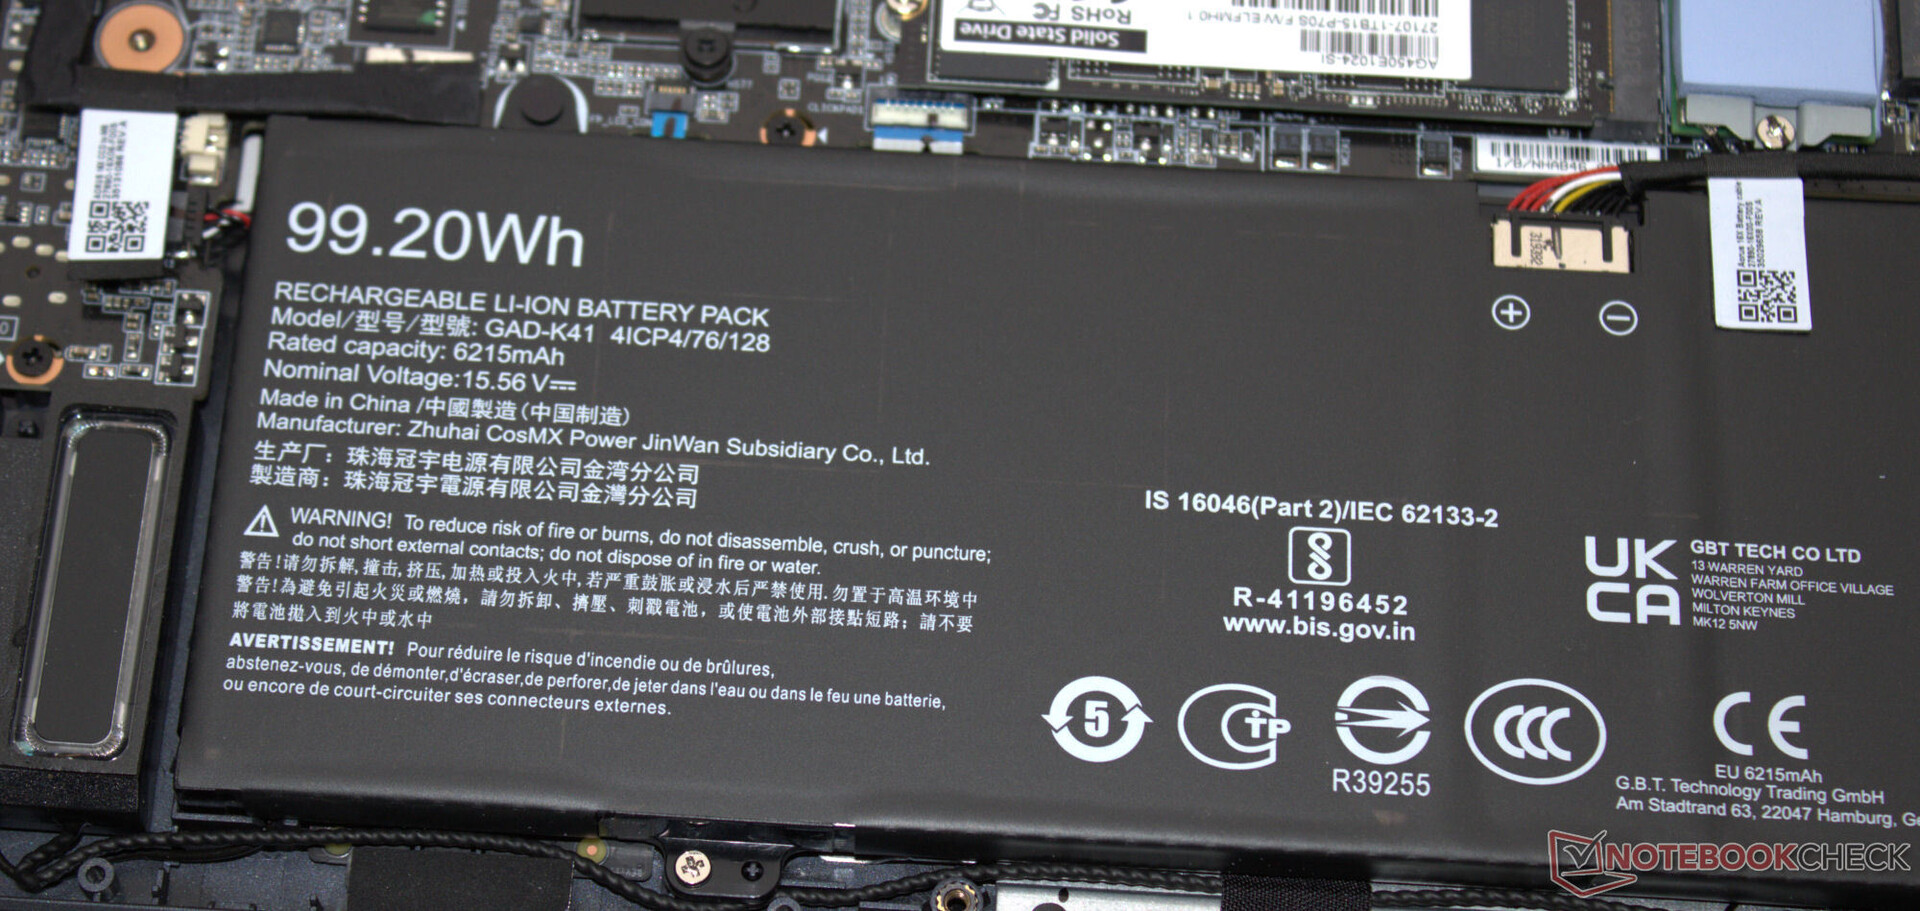
Technologia laptopa znajduje się w ciemnoszarej obudowie o matowych powierzchniach. Ogólnie rzecz biorąc, Gigabyte postawił na bardziej stonowany wygląd. Oprócz podświetlenia klawiatury, dwa paski LED z tyłu urządzenia dodają odrobinę kolorowej zabawy do jego wyglądu. Podczas gdy jednostka bazowa wykonana jest z tworzywa sztucznego, pokrywa opiera się na aluminium. Dostęp do baterii (przykręcanej, a nie przyklejanej), a także reszty wnętrza laptopa można uzyskać po zdjęciu dolnej części obudowy.
Nie odnotowaliśmy żadnych błędów konstrukcyjnych, a wszystkie szczeliny dobrze do siebie pasują. Pokrywę i podstawę można lekko przekręcić, ale nie jest to nic nadzwyczajnego. Zawiasy utrzymują pokrywę bezpiecznie na miejscu, ale pokrywa odbija się nieco, gdy reguluje się jej kąt. Maksymalny kąt otwarcia wynosi około 130 stopni. Można ją otworzyć jedną ręką.
Aorus 16X jest jednym z najbardziej kompaktowych i lekkich urządzeń w porównaniu.
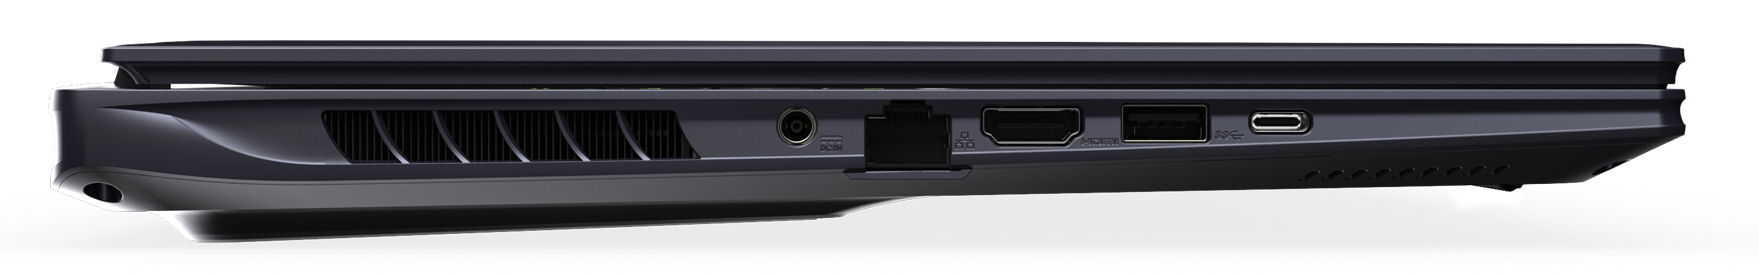
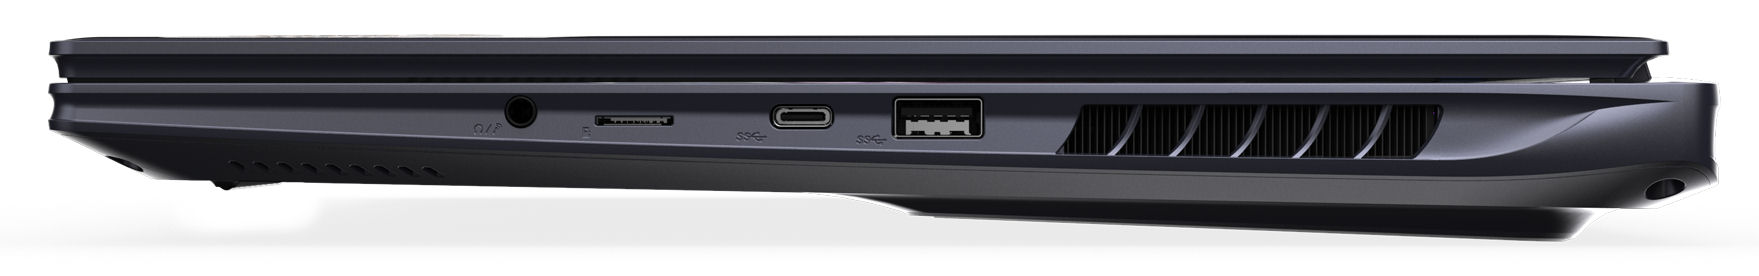
Łączność - laptop Gigabyte jest wyposażony w port Thunderbolt 4
16X posiada dwa porty USB-A (USB 3.2 Gen 2) i dwa porty USB-C (1x USB 3.2 Gen 2, 1x Thunderbolt 4). Port TB4 obsługuje funkcję Power Delivery, a oba złącza USB-C mogą wysyłać sygnał DisplayPort. W sumie laptop jest wyposażony w trzy wyjścia wideo (1x HDMI, 2x DP). Pakiet uzupełniają gniazdo audio i port Gigabit Ethernet.
Gigabyte umieścił wszystkie złącza wzdłuż środka prawej i lewej strony urządzenia. Obszary obok oparcia na plecy generalnie pozostają wolne od kabli.
Czytnik kart SD
Czytnik kart MicroSD w urządzeniu (karta referencyjna: AV PRO microSD 128 GB V60) to jeden z szybszych modeli, osiągający maksymalne transfery na poziomie 186 MB/s (przesyłanie 250 obrazów jpg, każdy o rozmiarze około 5 MB) i 188 MB/s (kopiowanie większych bloków danych).
| SD Card Reader | |
| average JPG Copy Test (av. of 3 runs) | |
| Aorus 16X 2024 (AV PRO microSD 128 GB V60) | |
| Średnia w klasie Gaming (20.9 - 210, n=54, ostatnie 2 lata) | |
| Schenker XMG Pro 16 Studio (Mid 23) (AV PRO microSD 128 GB V60) | |
| Alienware m16 R2 (AV PRO microSD 128 GB V60) | |
| maximum AS SSD Seq Read Test (1GB) | |
| Alienware m16 R2 (AV PRO microSD 128 GB V60) | |
| Aorus 16X 2024 (AV PRO microSD 128 GB V60) | |
| Średnia w klasie Gaming (25.5 - 261, n=51, ostatnie 2 lata) | |
| Schenker XMG Pro 16 Studio (Mid 23) (AV PRO microSD 128 GB V60) | |
Komunikacja
W optymalnych warunkach (brak urządzeń WLAN w bliskim sąsiedztwie, niewielka odległość między laptopem a serwerem PC) odnotowaliśmy bardzo dobre prędkości transmisji danych WiFi. Słabe wartości 16X podczas wysyłania danych są prawdopodobnie spowodowane problemami ze sterownikami. Laptop Gigabyte wykorzystuje układ WiFi 7 (Intel BE200). Za połączenia przewodowe odpowiada kontroler (RTL8168/8111; 1 GBit/s) firmy Realtek.
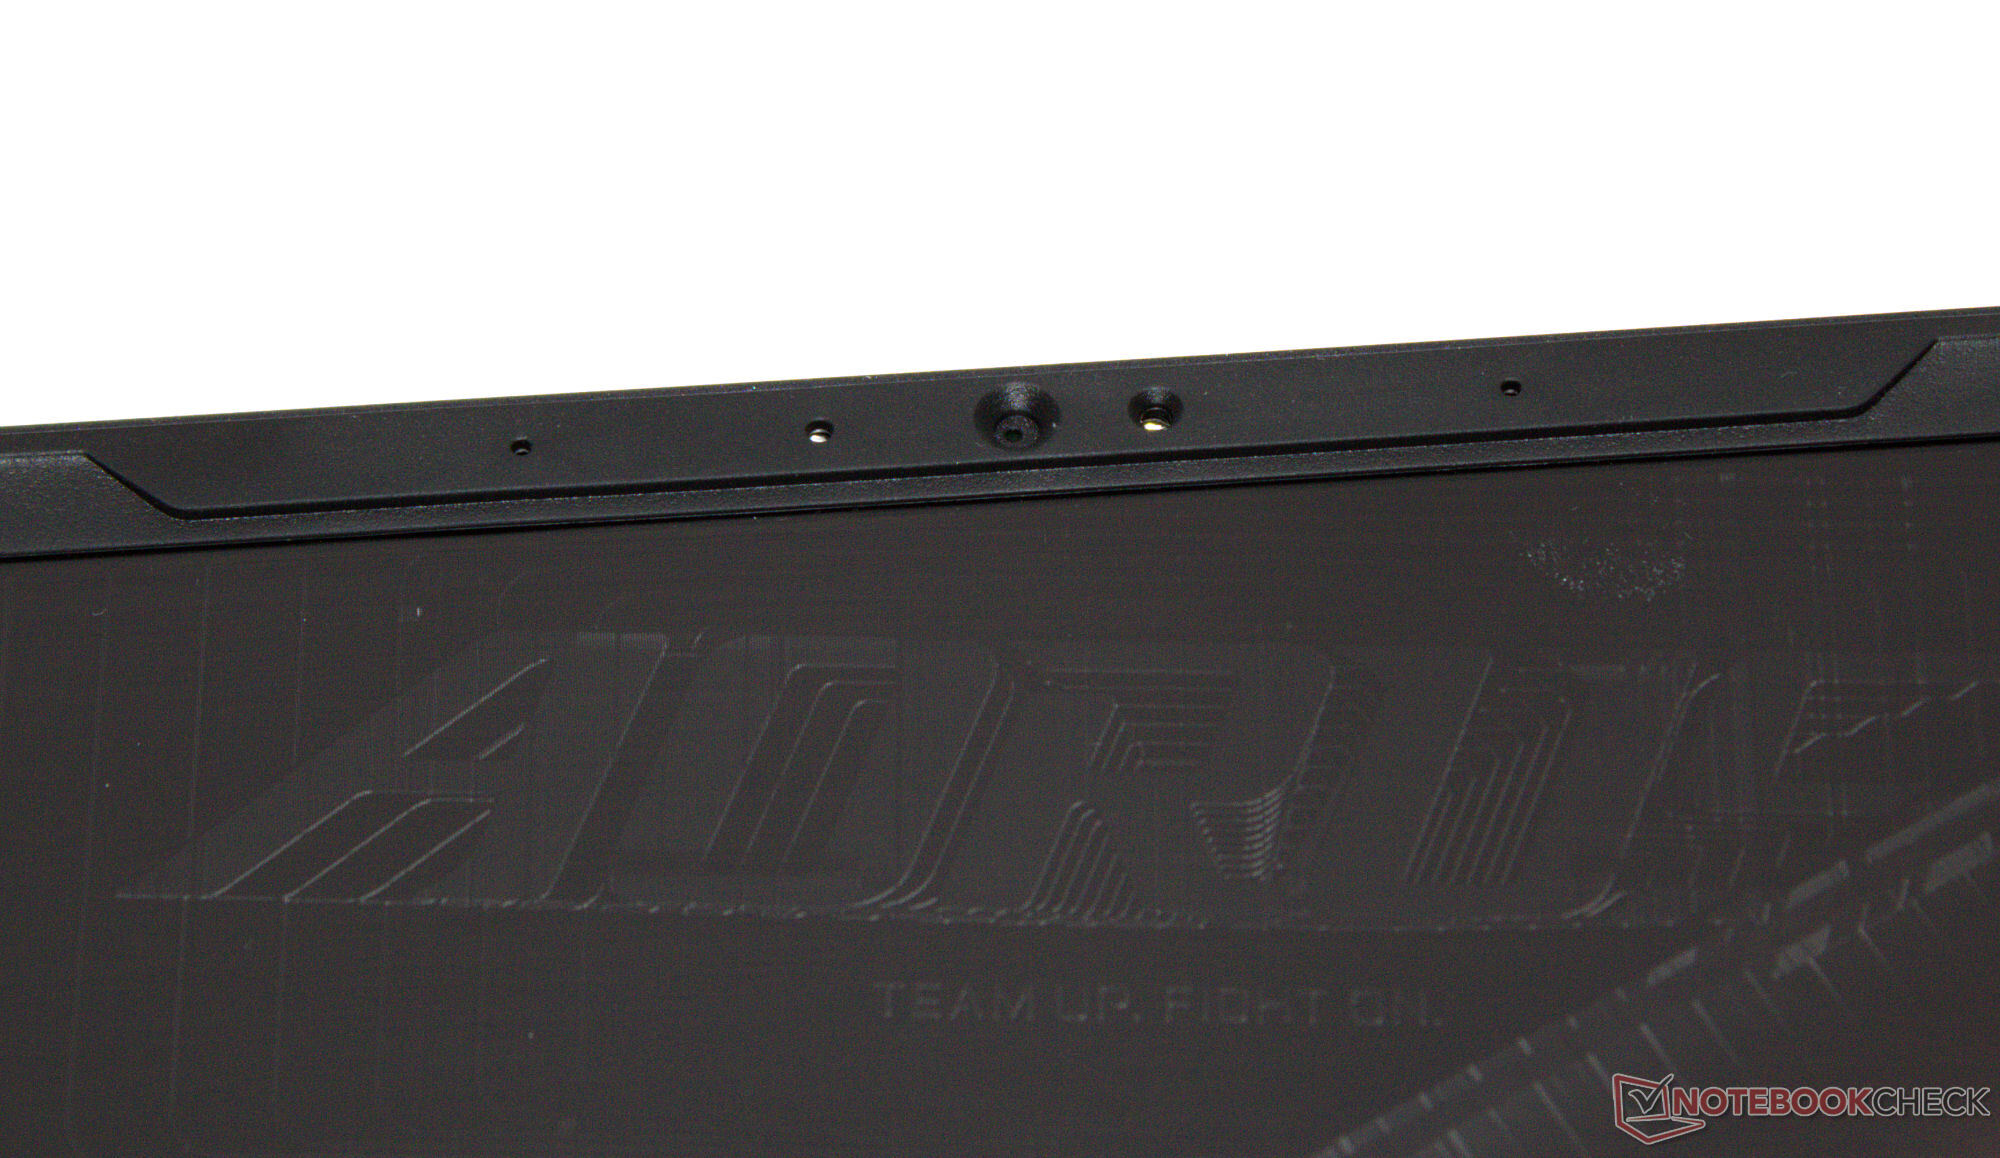
Kamera internetowa
Kamera internetowa (2,1 MP, maks. 1,920 x 1,080 pikseli, IR) zapewnia jedynie obraz średniej jakości. Dokładność odwzorowania kolorów zawodzi: Z odchyleniem około 10, wartość docelowa (DeltaE niższa niż 3) została pominięta. Obsługuje jednak funkcję Windows Hello. Z kolei nie posiada mechanicznej pokrywy.


Akcesoria
Poza zwykłymi dokumentami (skrócona instrukcja obsługi i informacje o gwarancji), do laptopa nie dołączono żadnych dodatkowych akcesoriów.
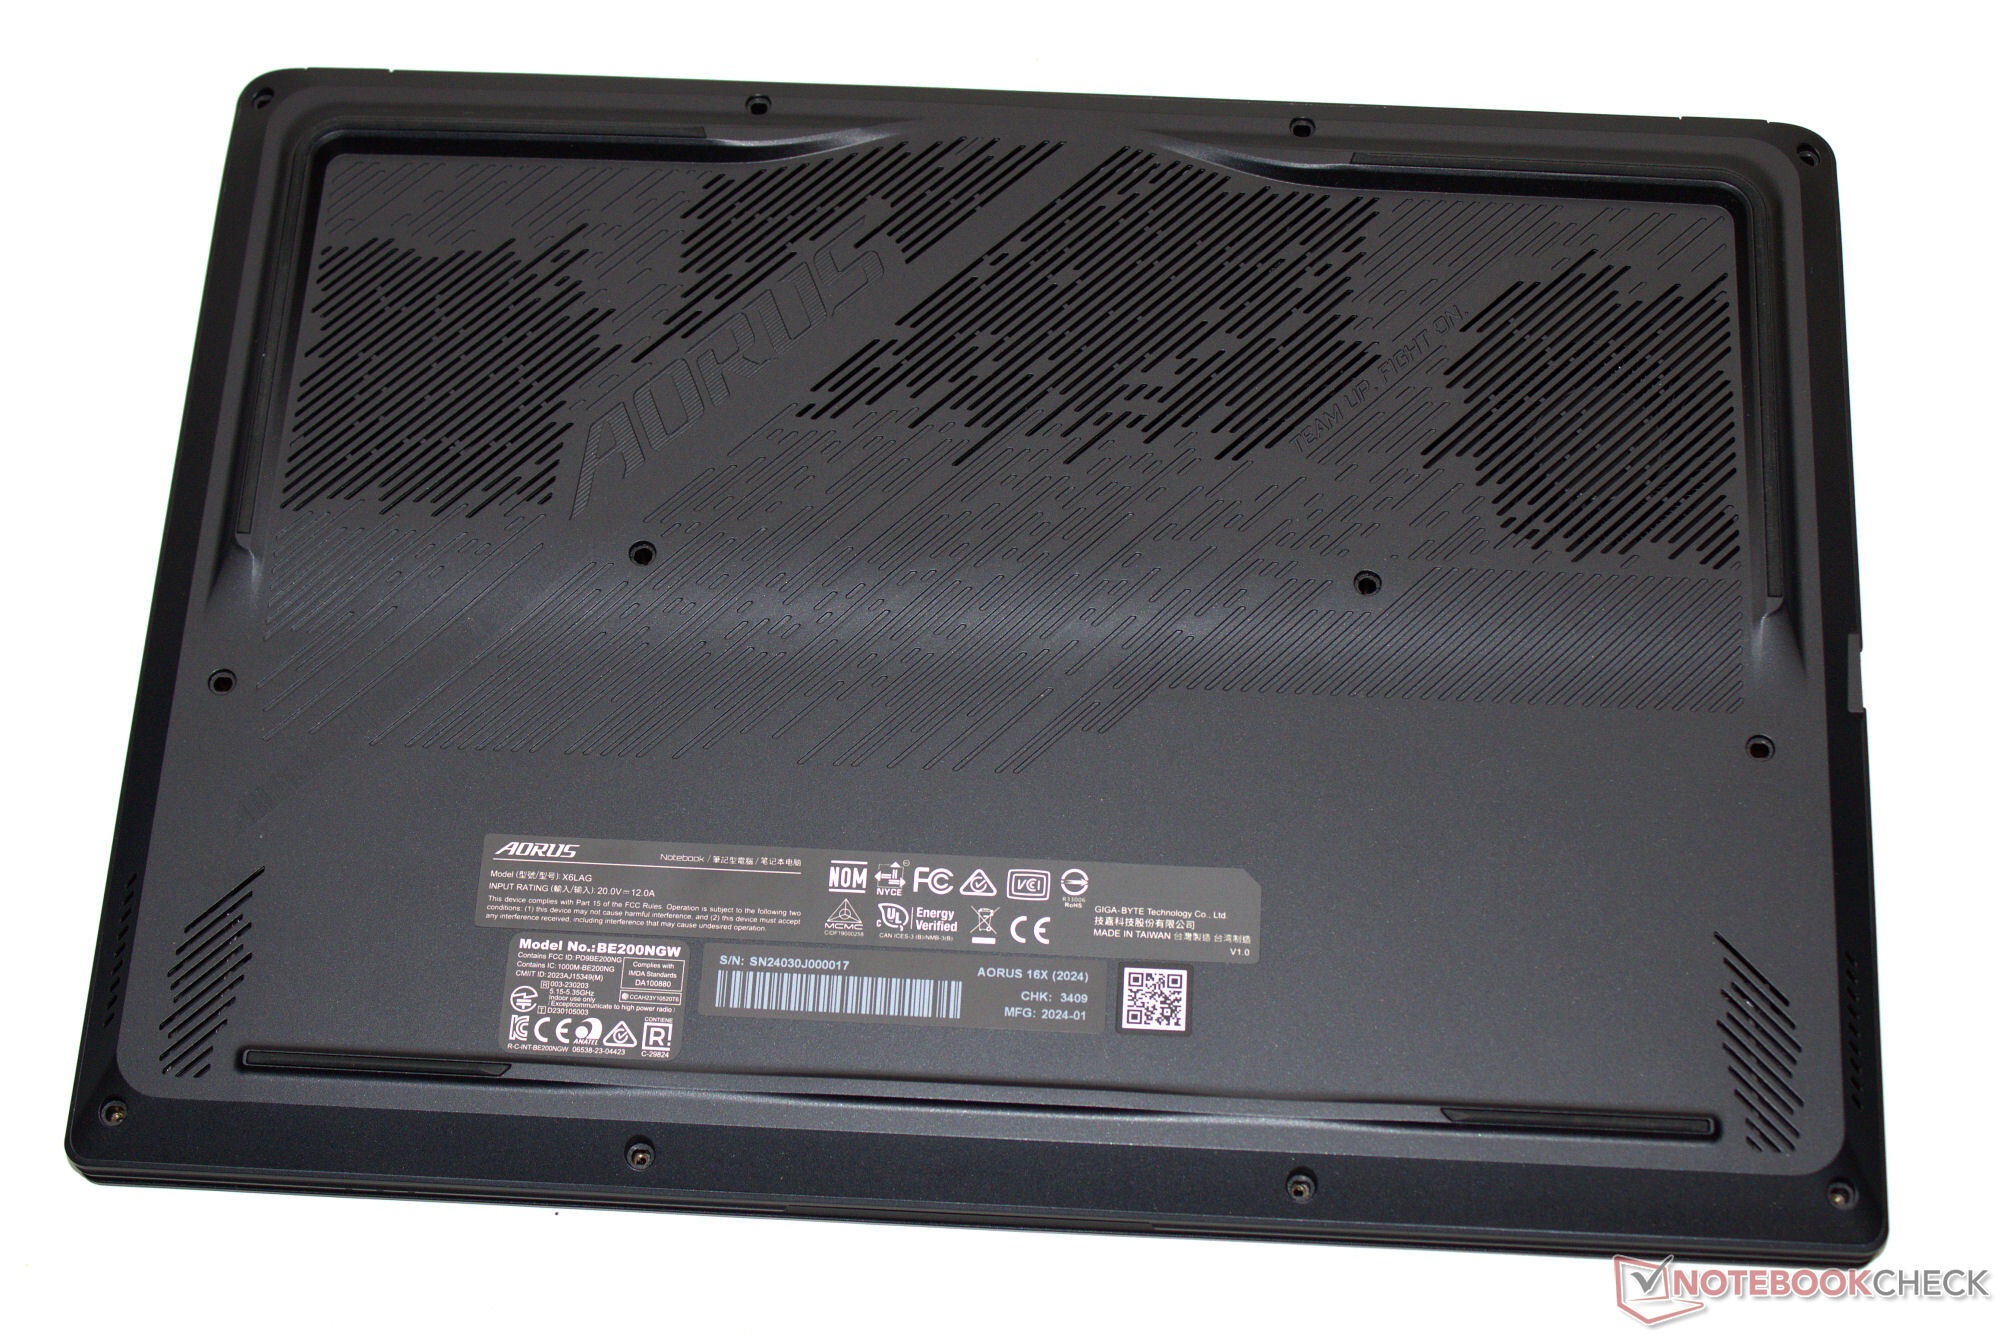
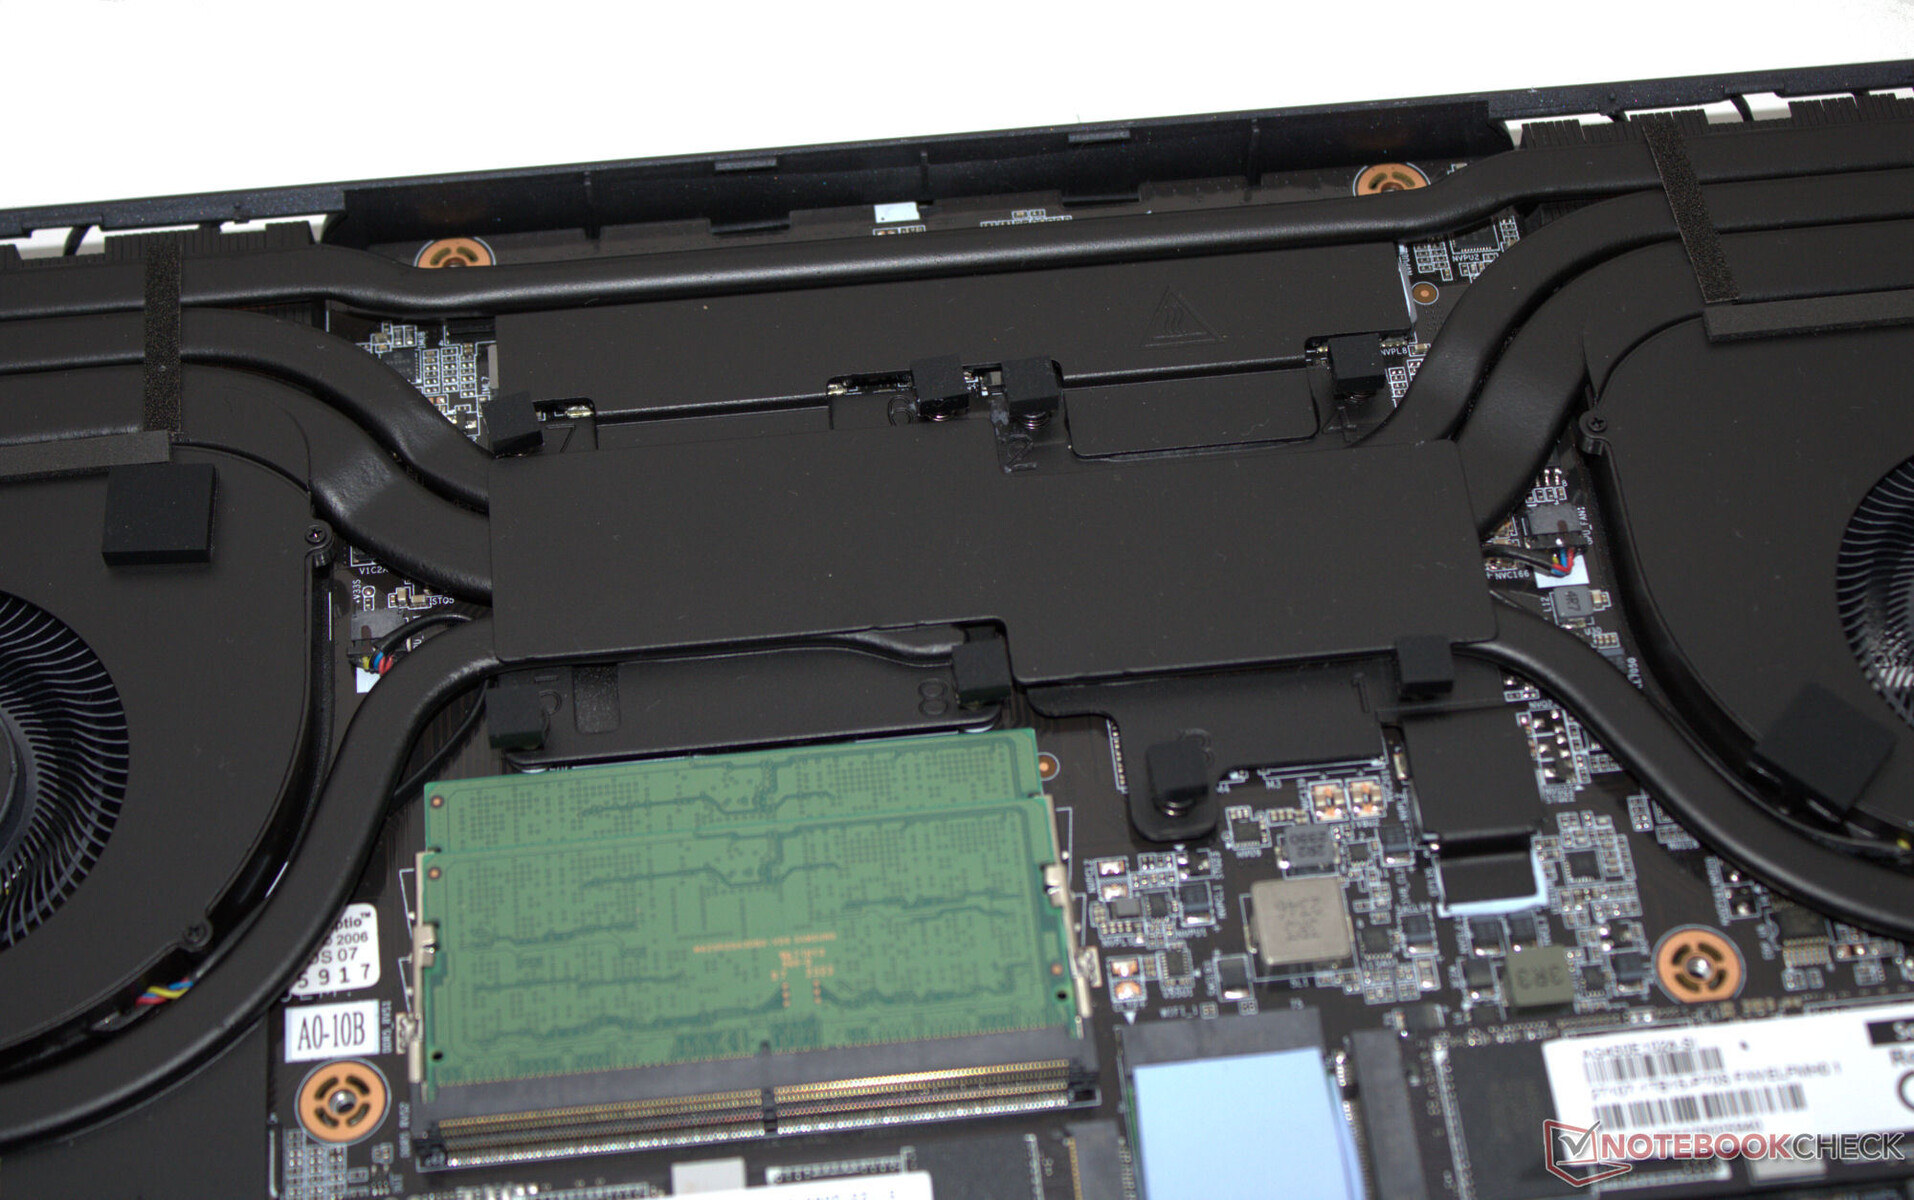
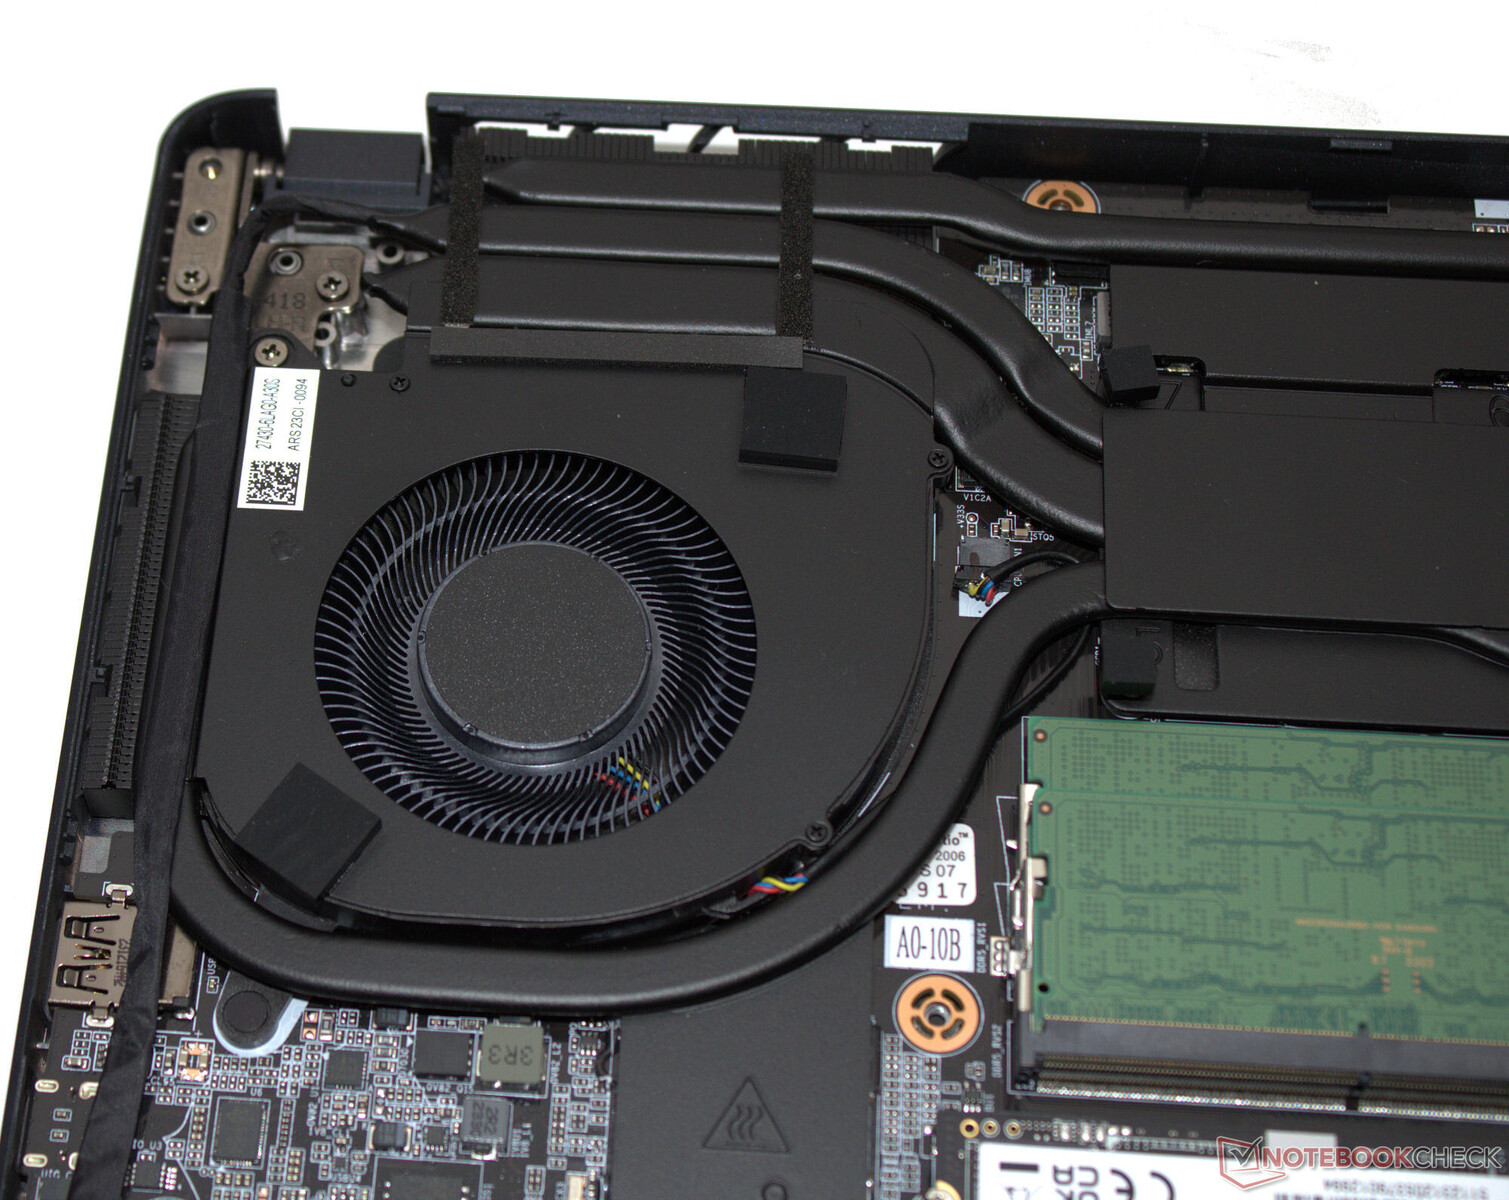
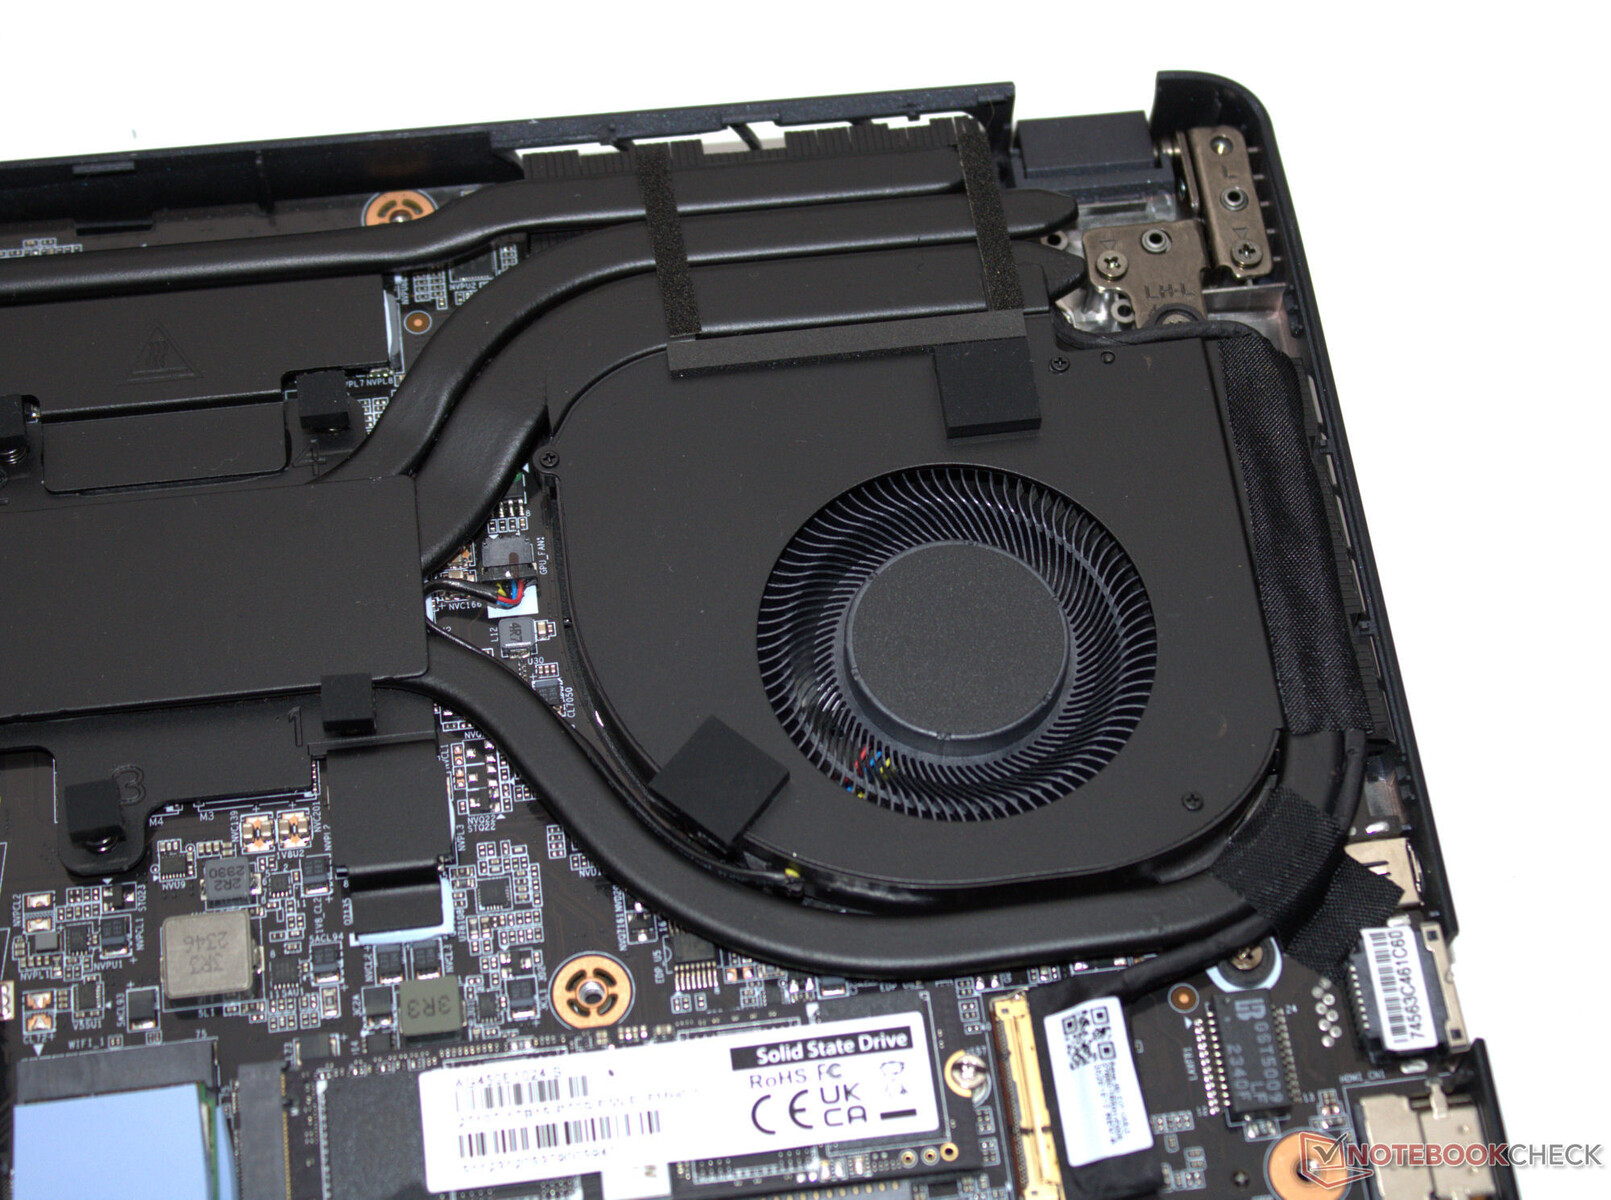
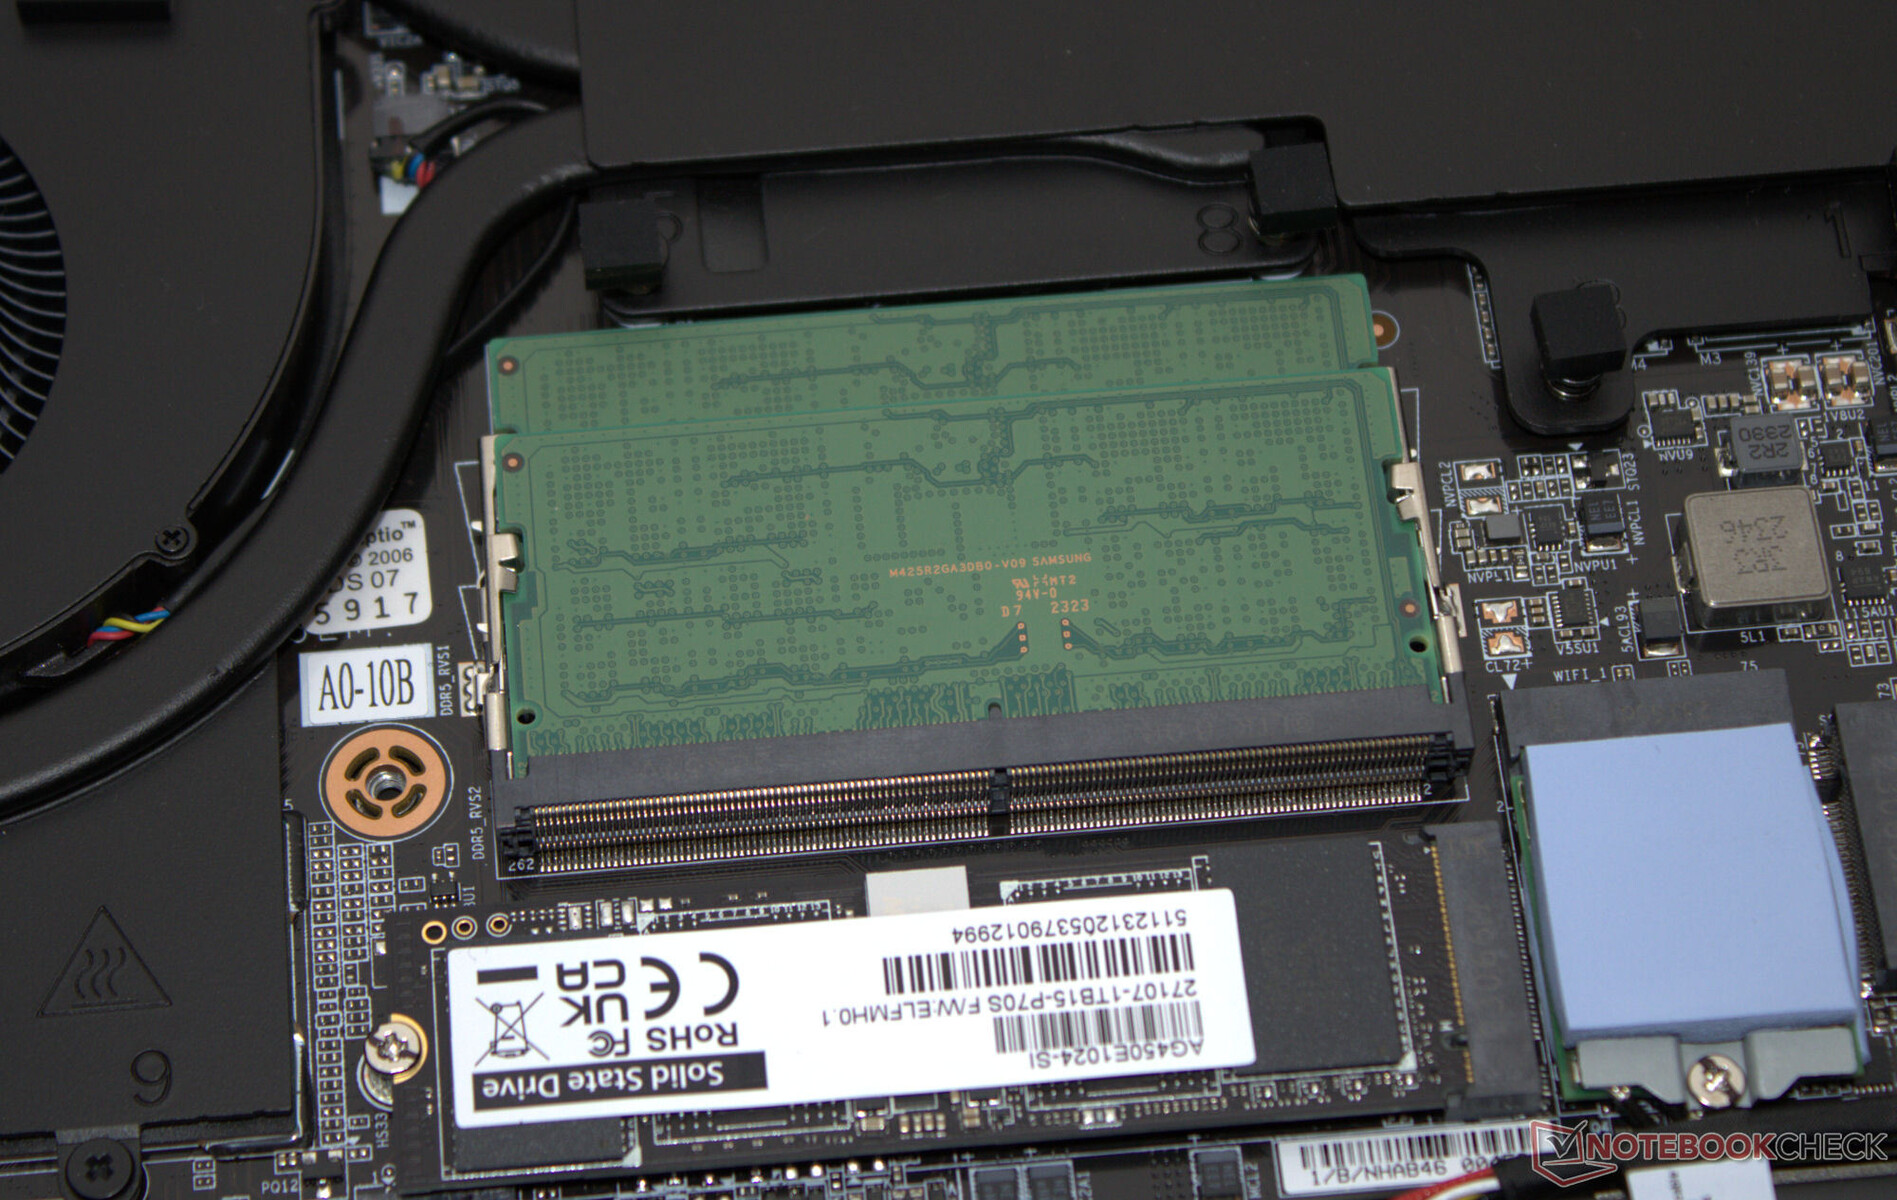
Konserwacja
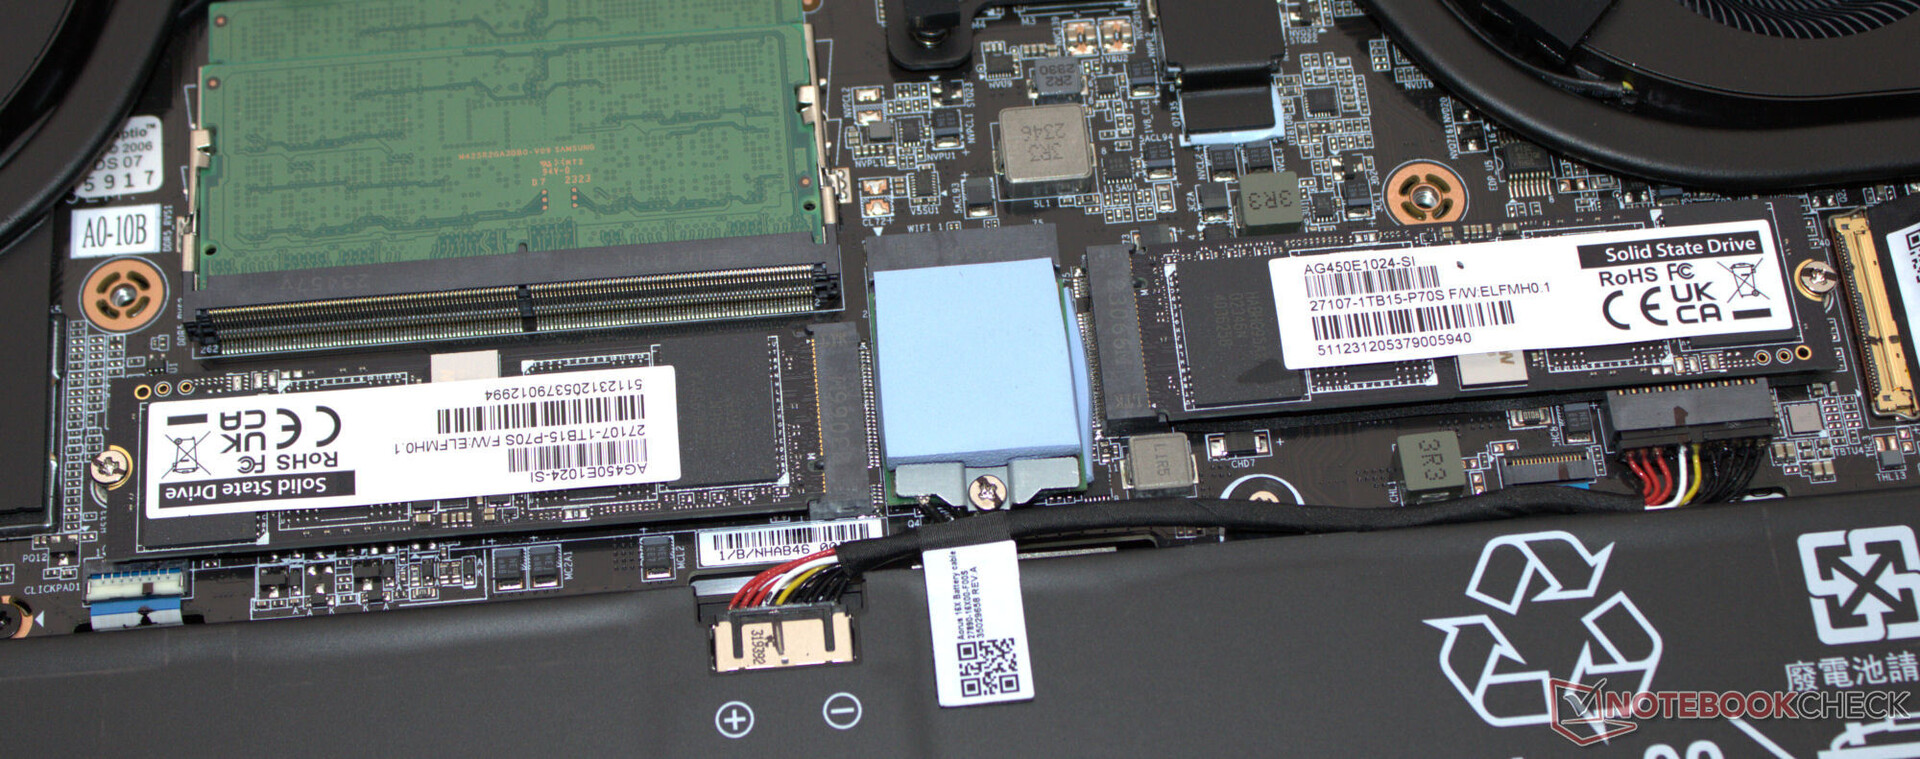
Po odkręceniu wszystkich śrubek na spodzie urządzenia, można użyć płaskiej szpatułki lub plektronu, aby zdjąć dolną część obudowy. Następnie można uzyskać dostęp do banków pamięci (oba zajęte), obu dysków SSD (PCIe 4, M.2-2280), modułu WLAN, wentylatorów, baterii BIOS, a także zwykłej baterii.
Gwarancja
16-calowe urządzenie objęte jest standardową 12-miesięczną gwarancją. Opcje jej przedłużenia nie są dostępne.
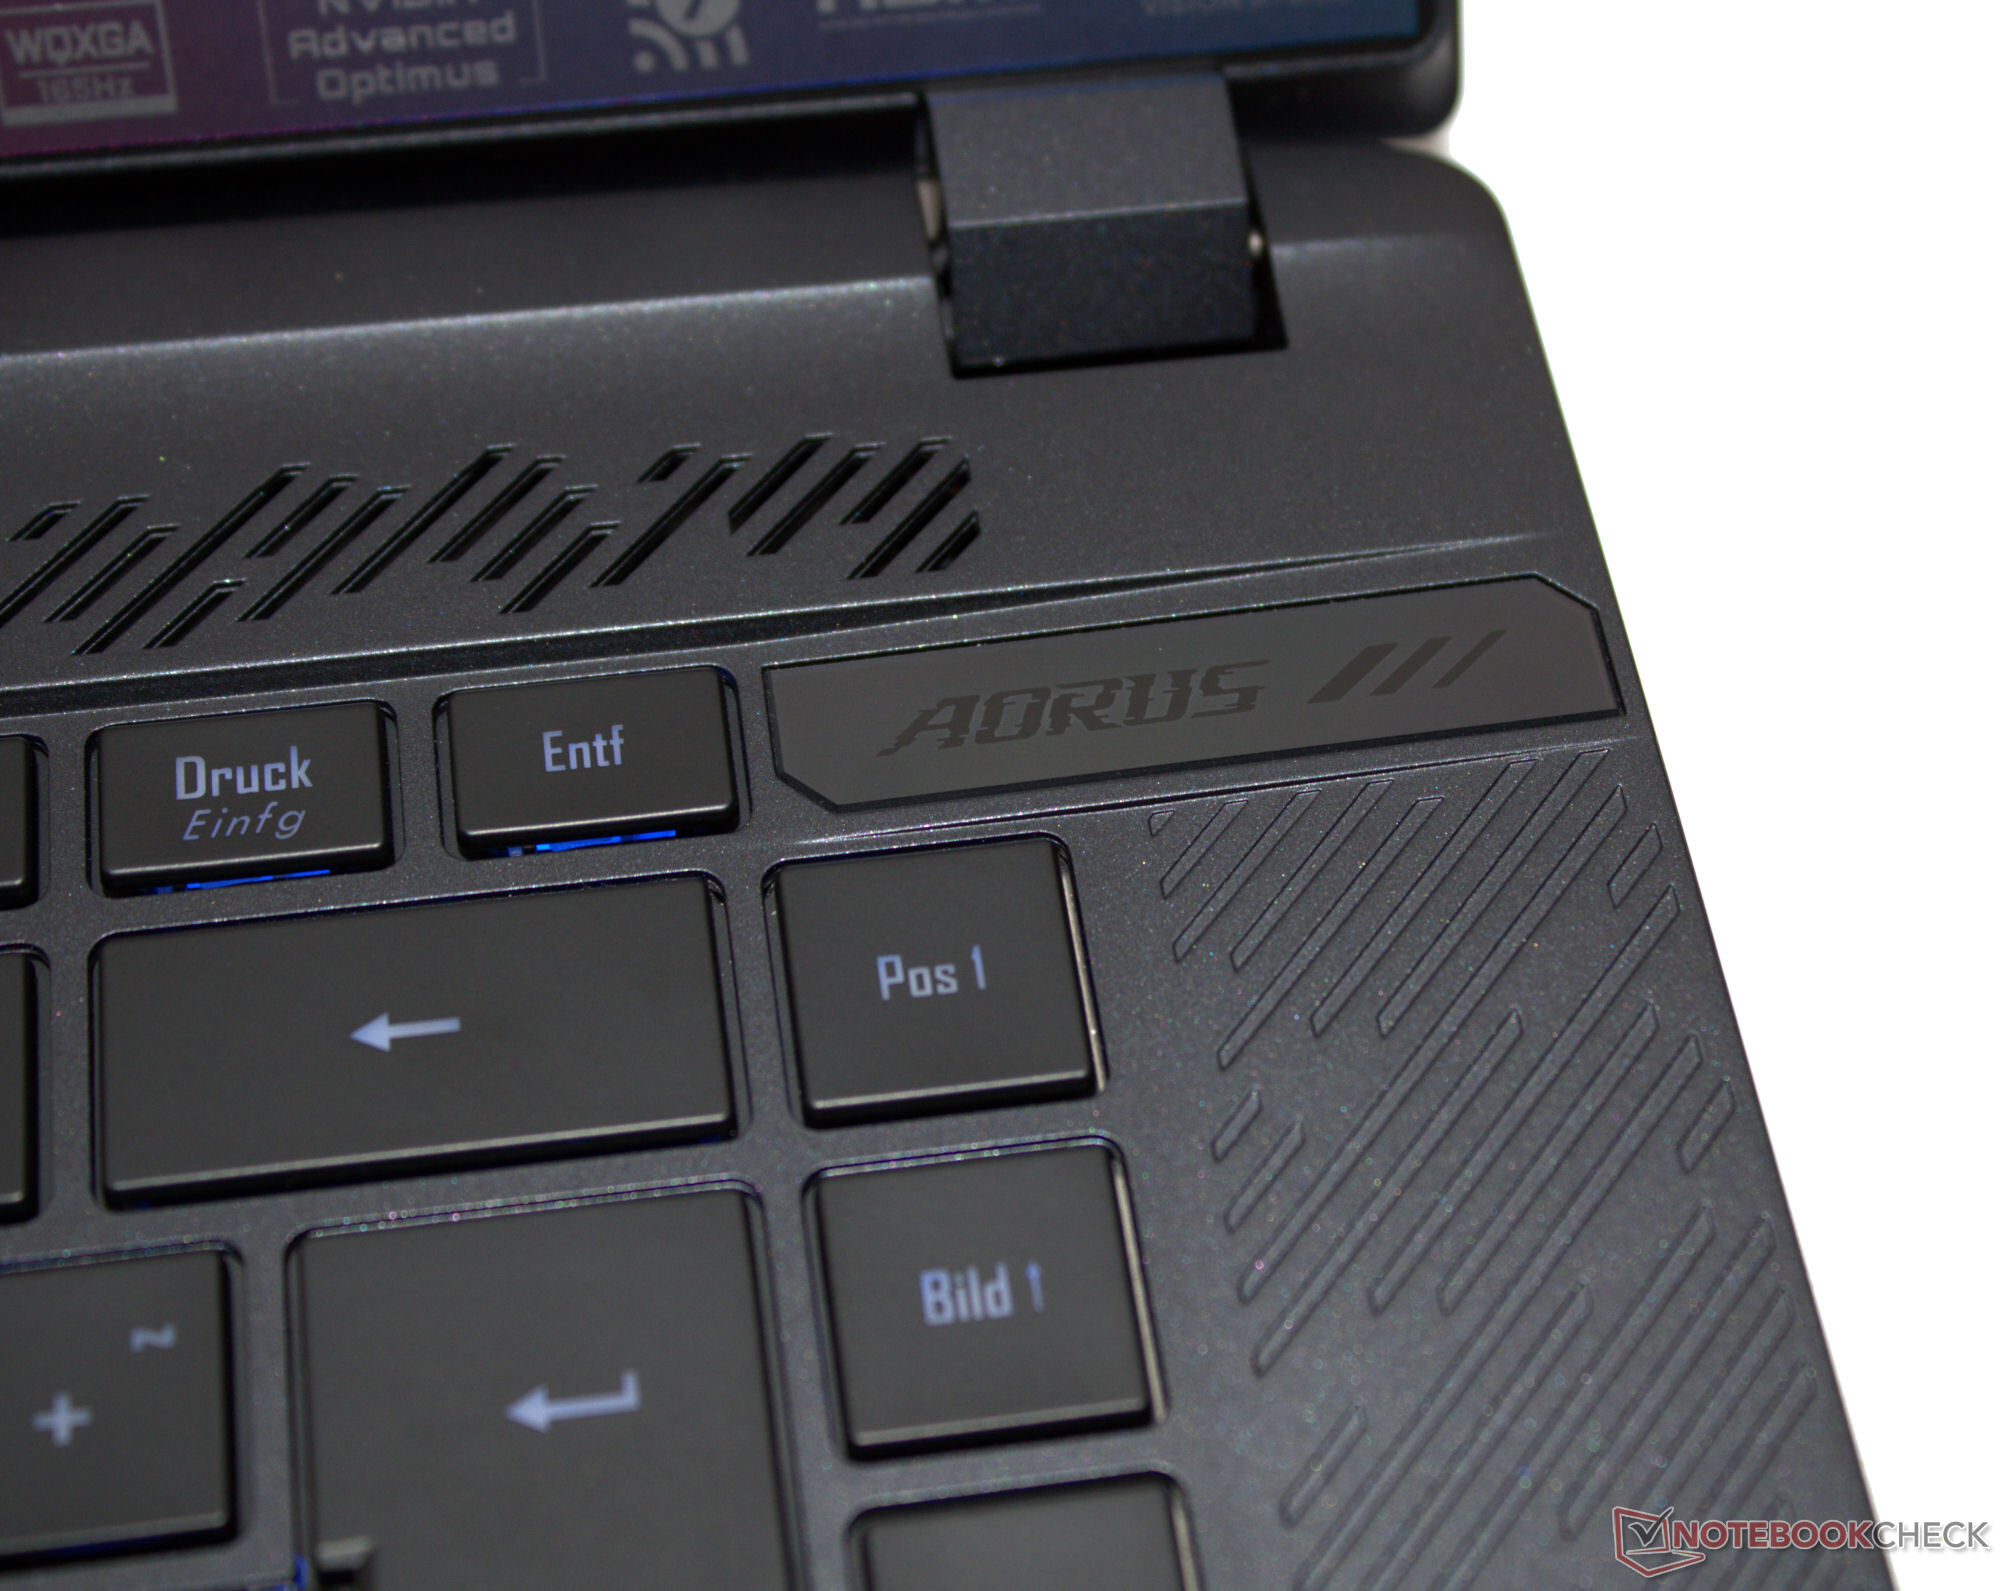
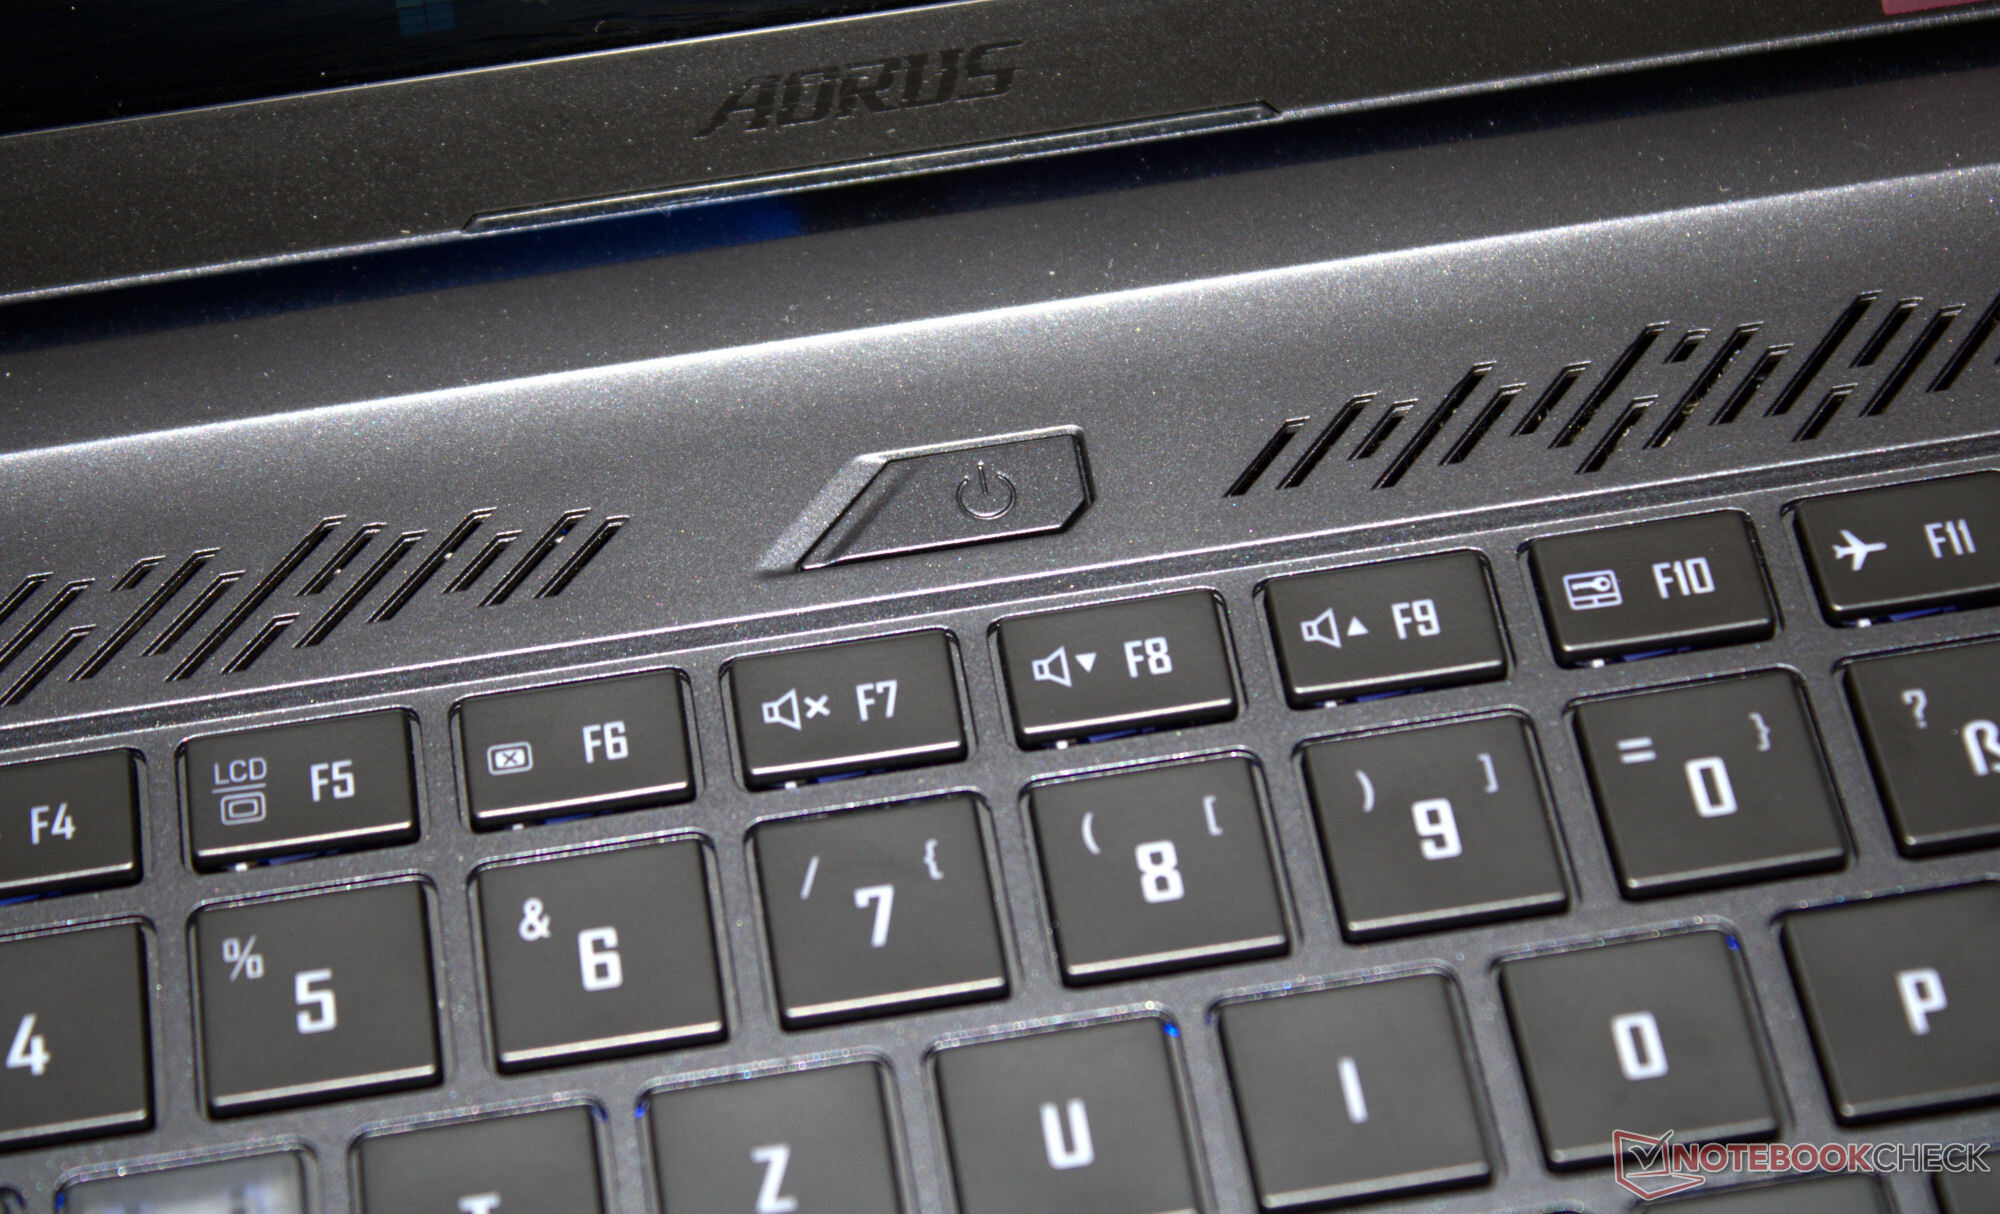
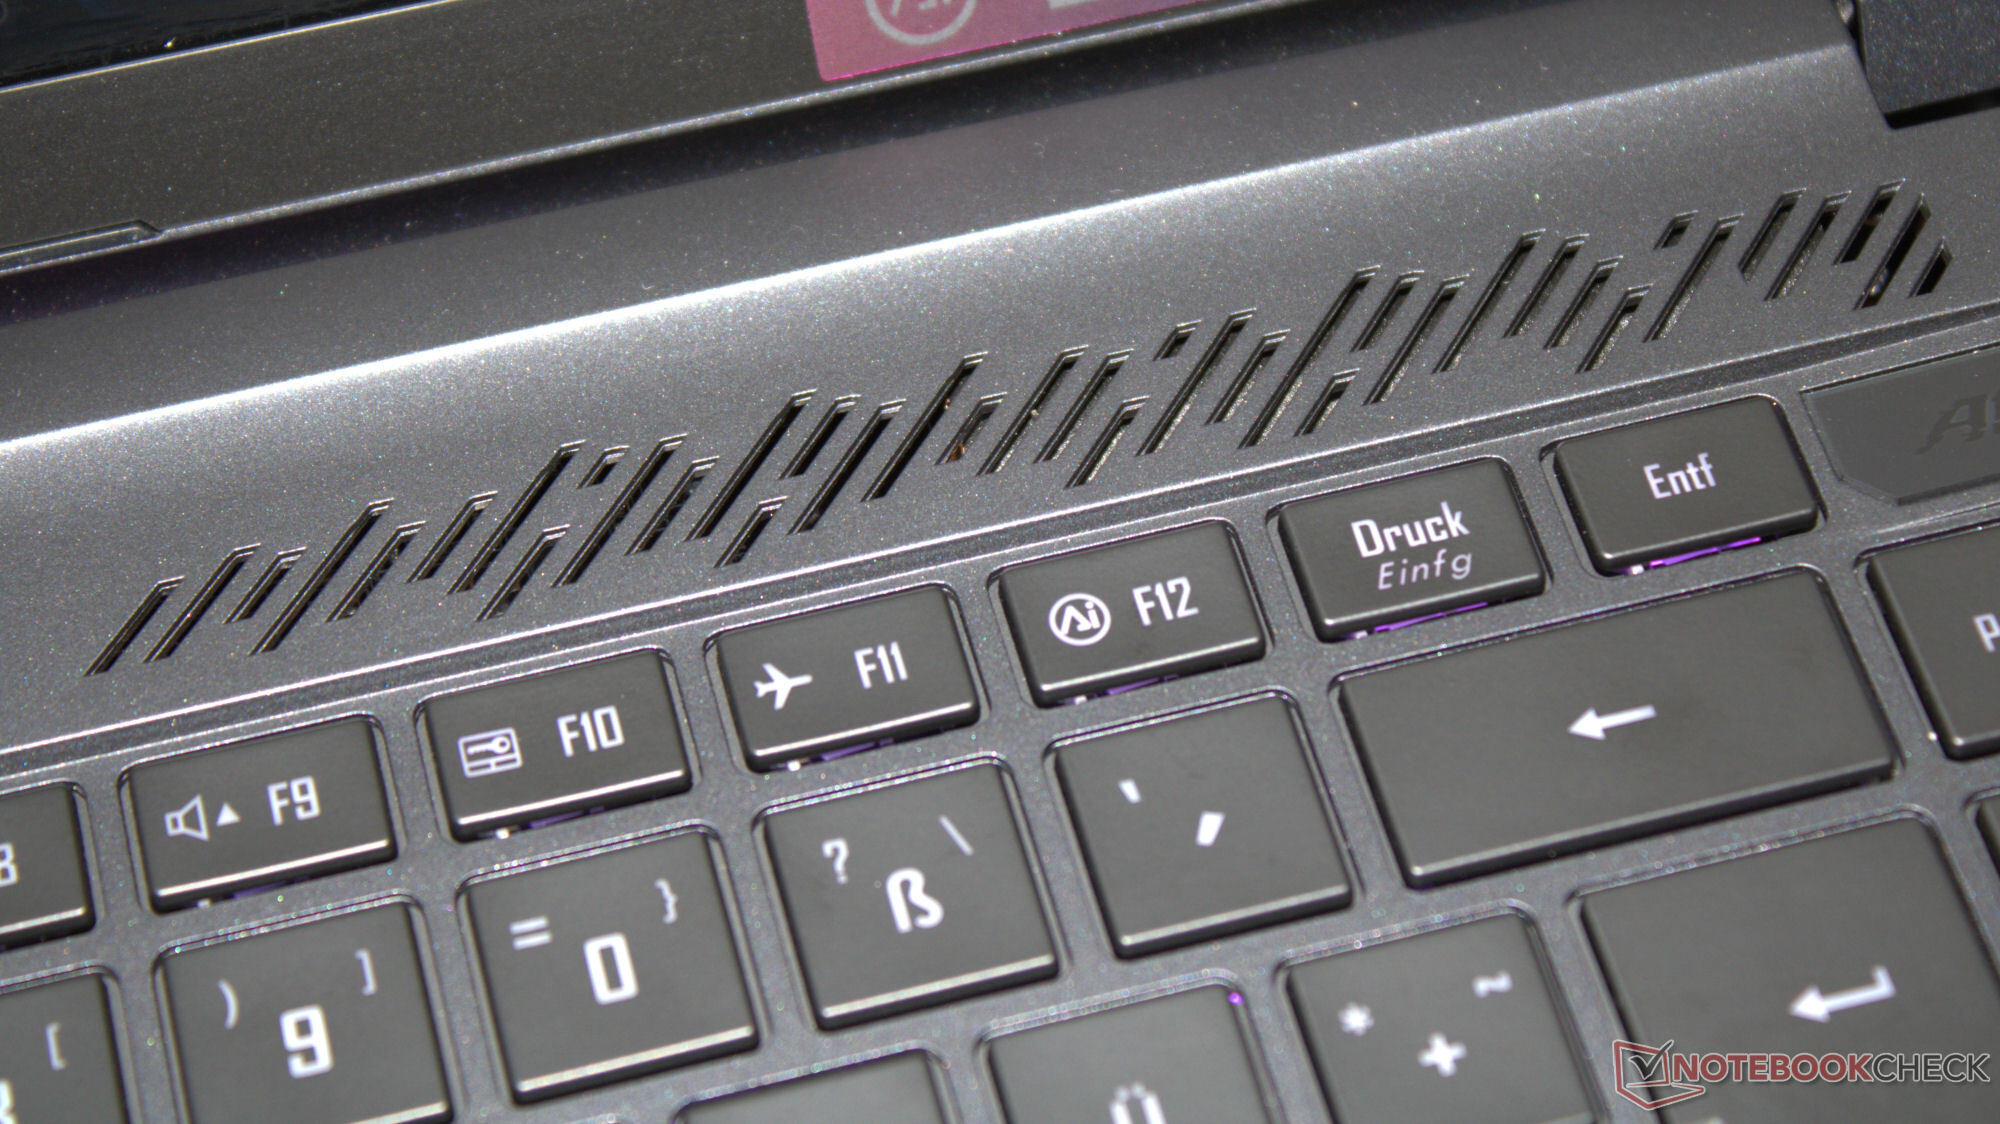
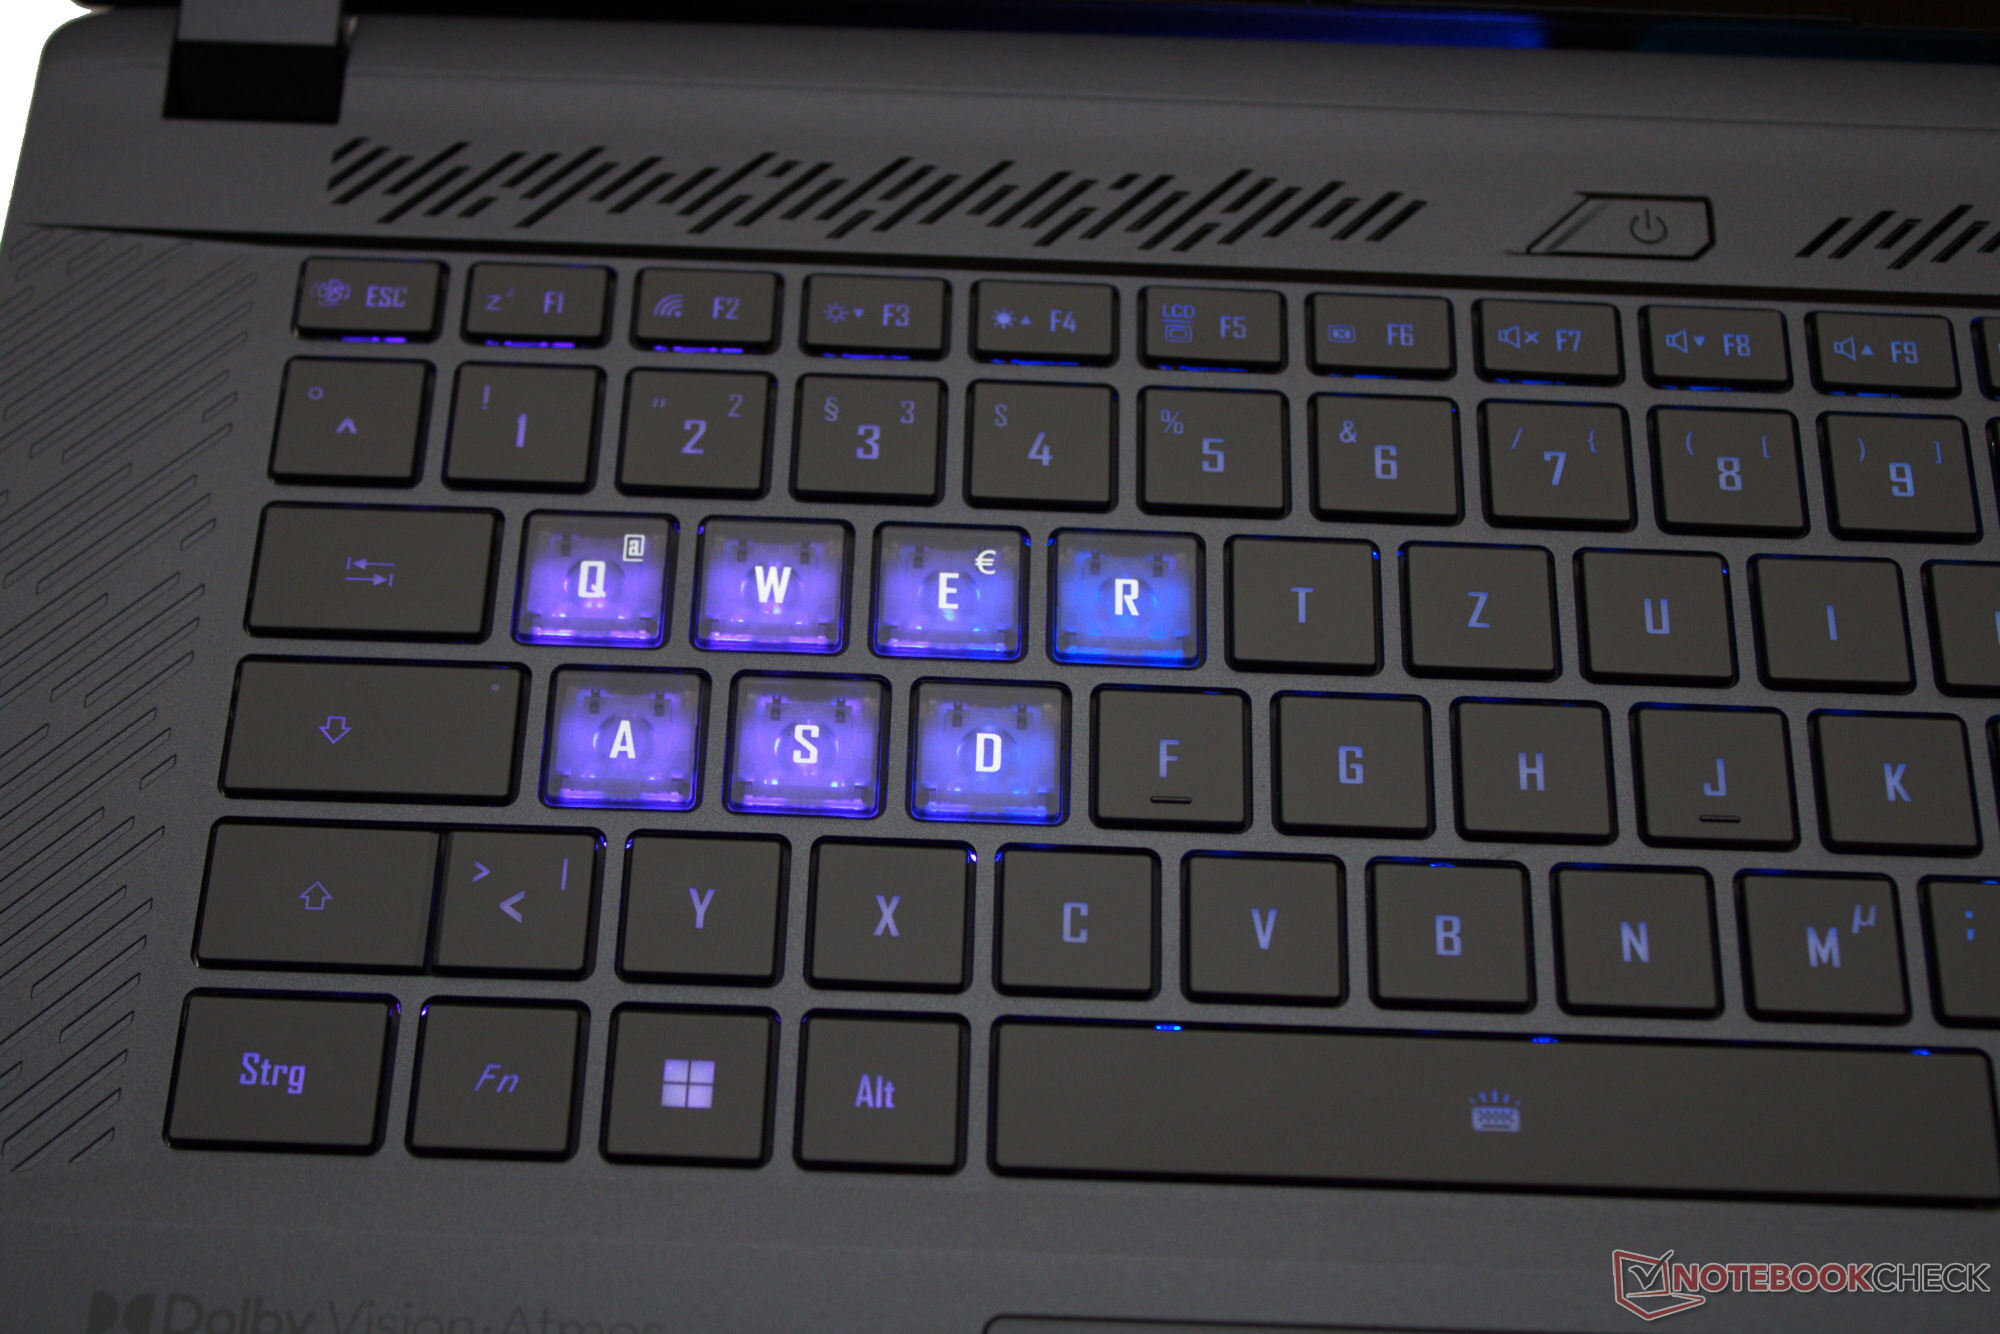
Urządzenia wejściowe - laptop Aorus posiada podświetlaną klawiaturę
Klawiatura
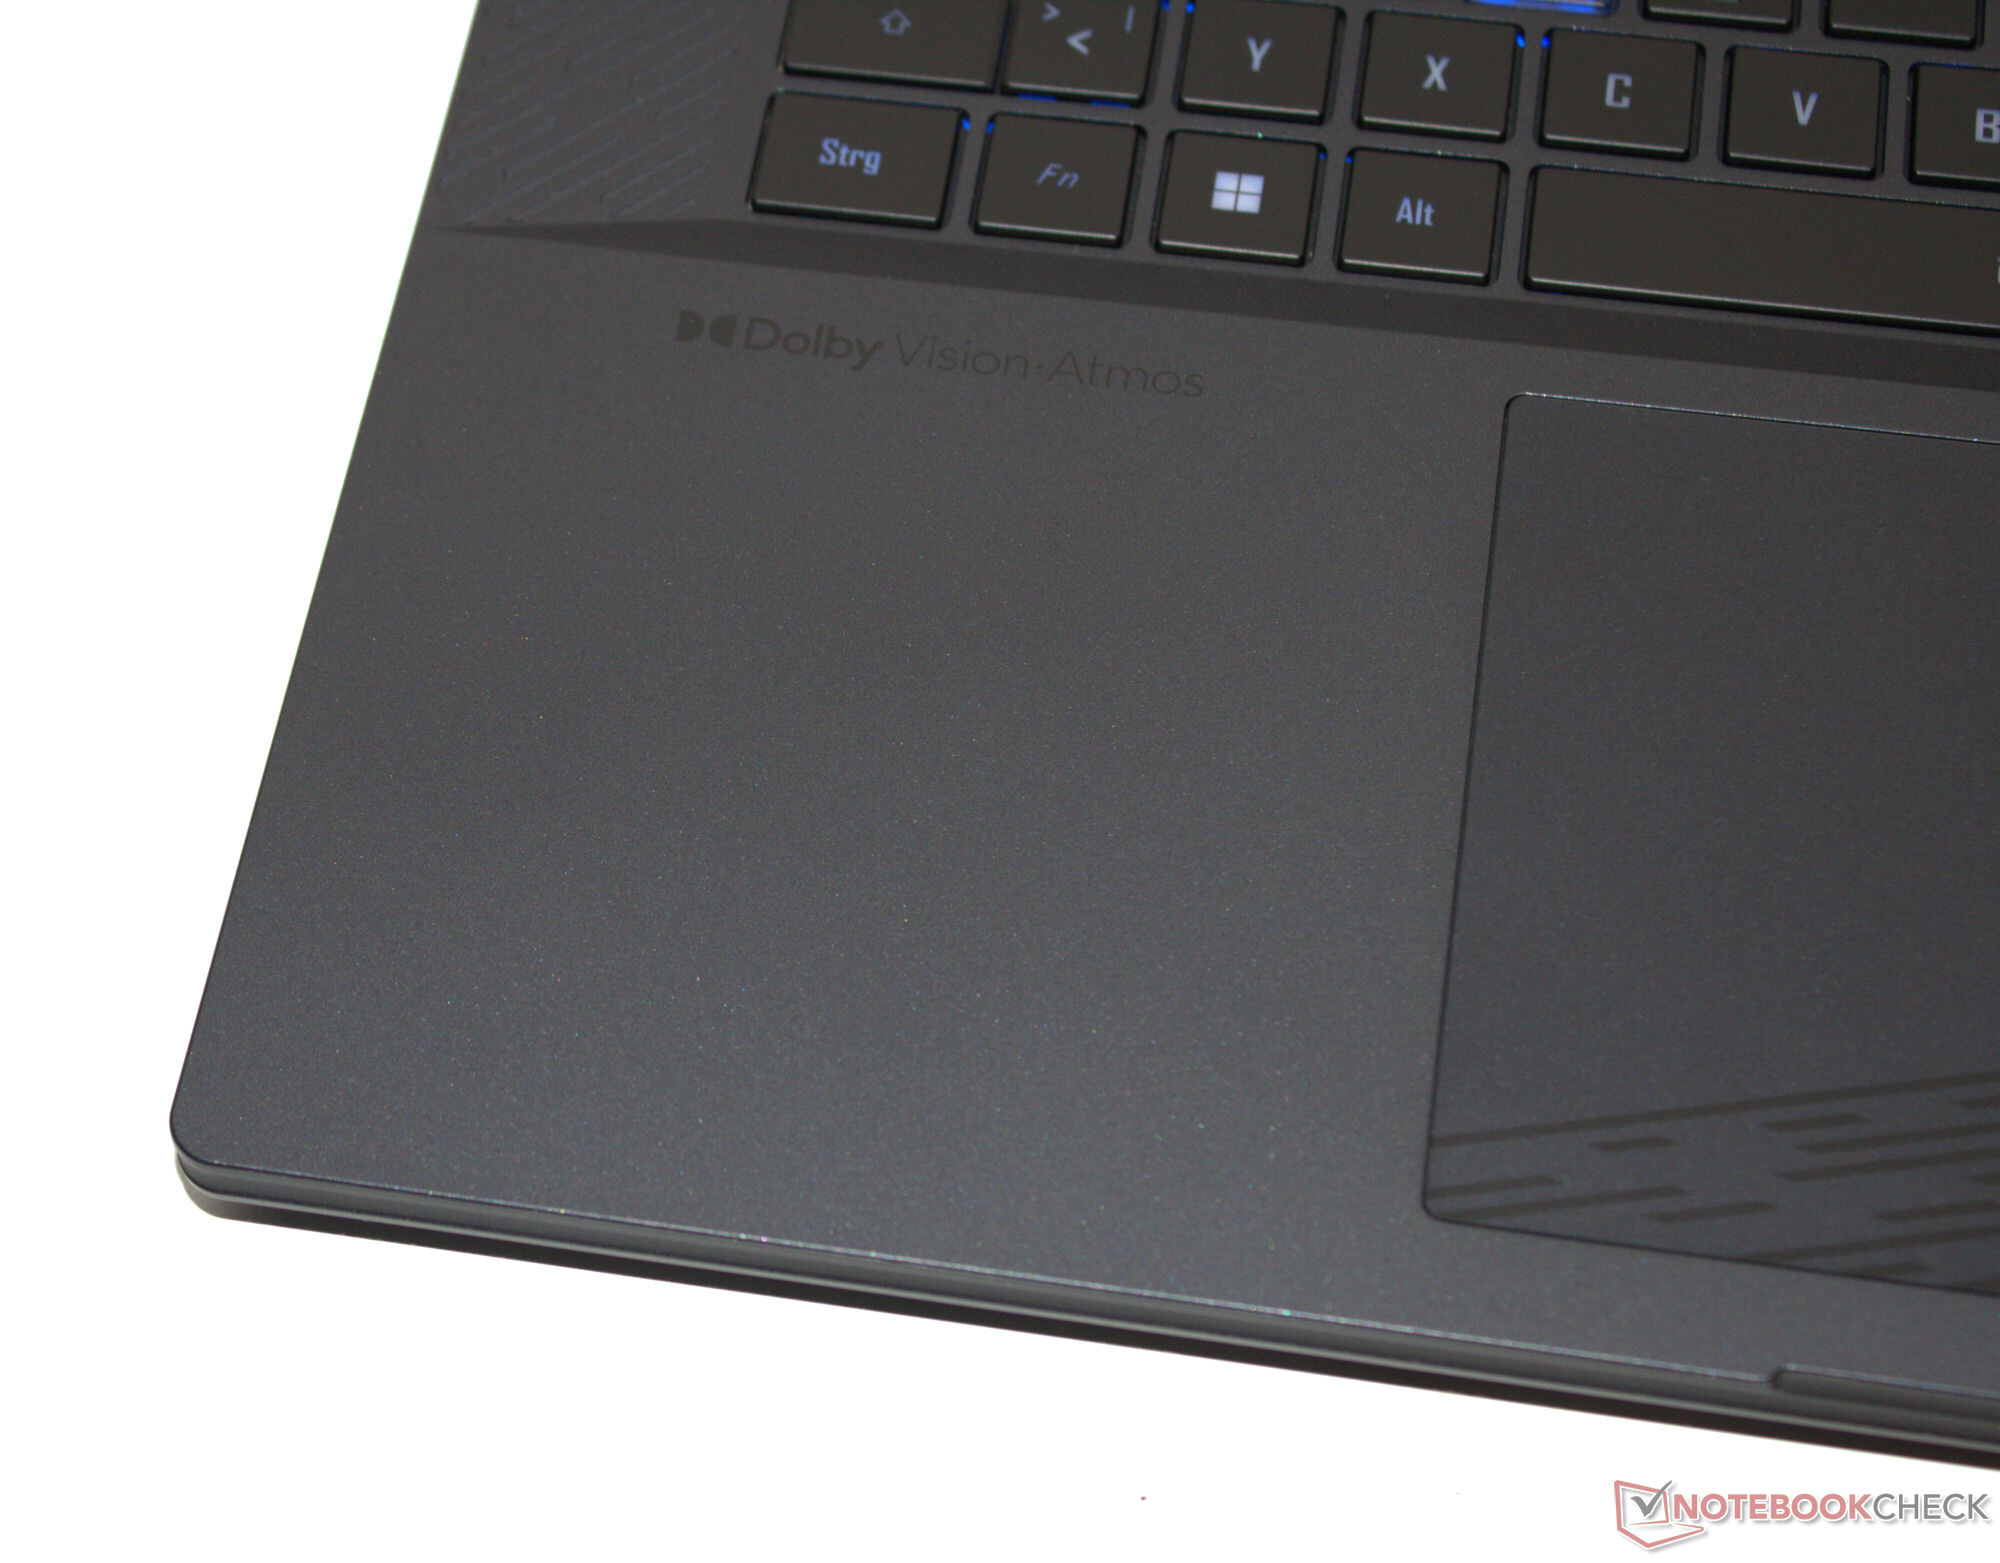
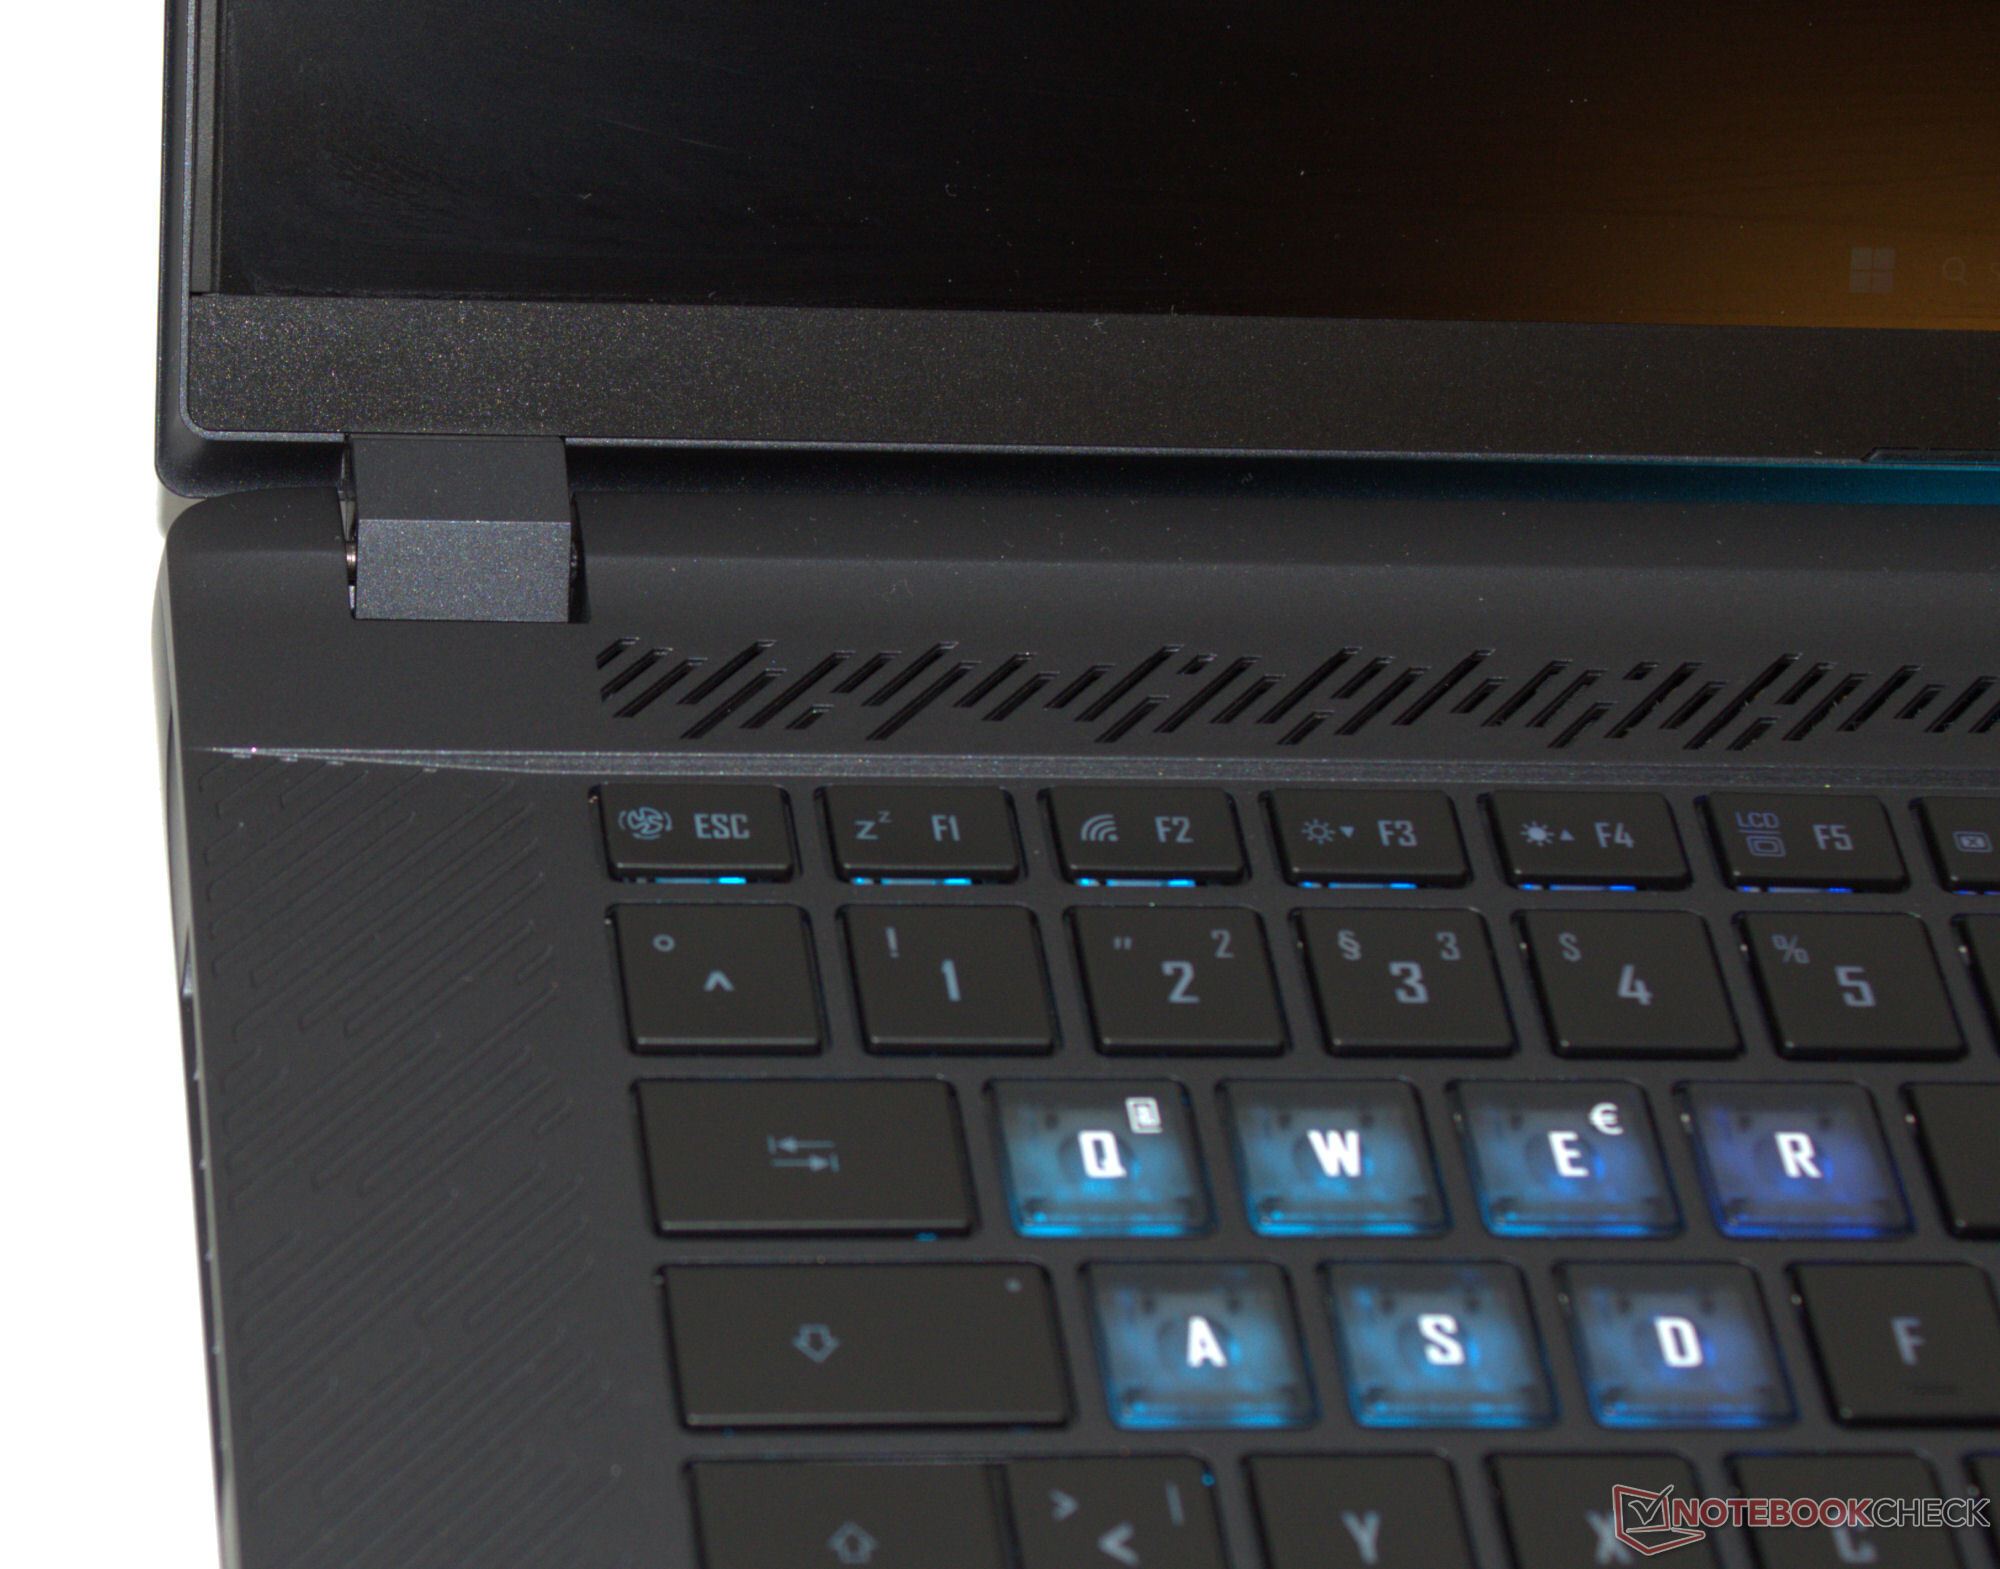
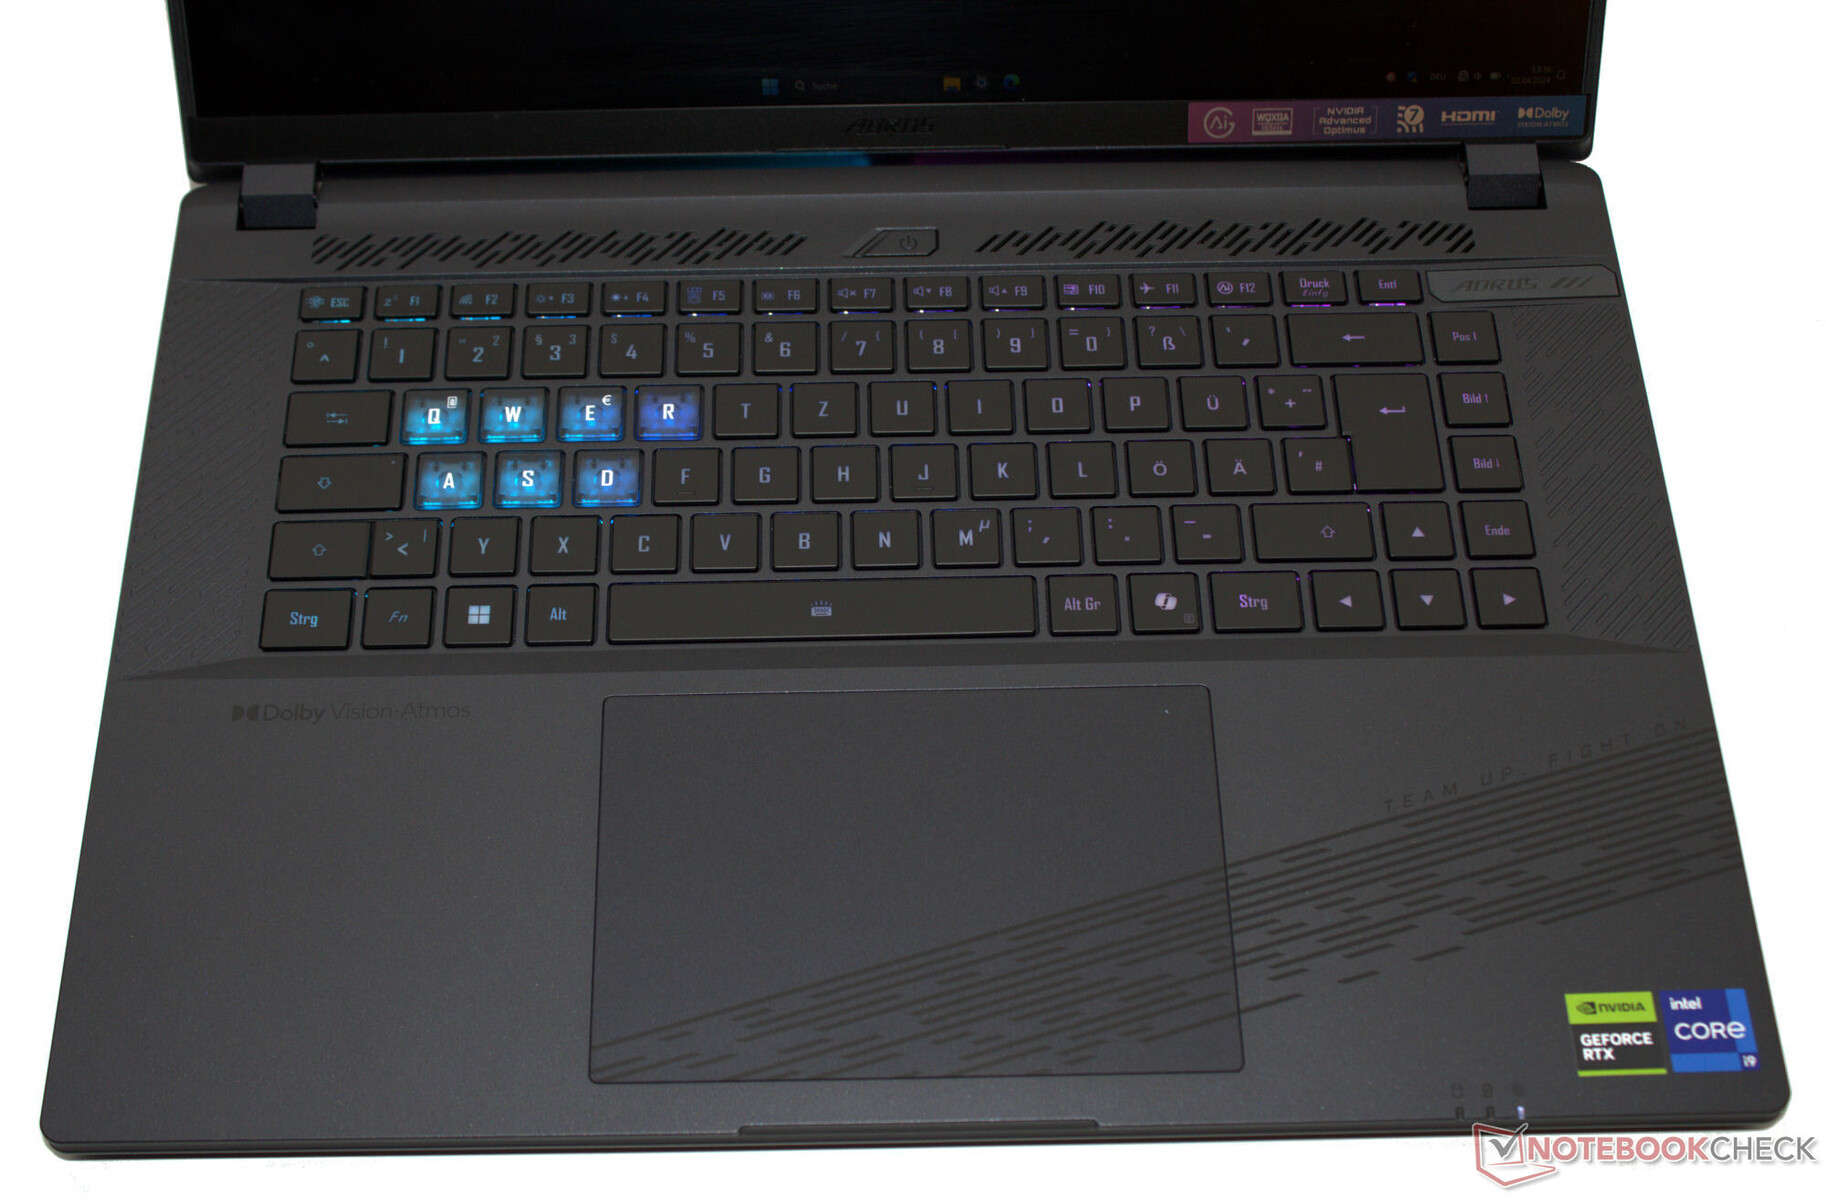
Klawisze na klawiaturze typu chiclet (trzystopniowe podświetlenie RGB) charakteryzują się średnim skokiem i wyraźnym punktem nacisku. Ich opór jest w porządku. Klawiatura lekko ugina się podczas pisania, ale nie okazało się to jeszcze irytujące. Dobrze: Cztery klawisze strzałek są pełnowymiarowe. Gigabyte zrezygnował z instalacji klawiatury numerycznej. Podsumowując, producent dostarczył klawiaturę nadającą się do codziennego użytku.
Panel dotykowy
Wielodotykowy clickpad (ok. 13,3 x 9 cm) służy jako zamiennik myszy, a jego gładka powierzchnia ułatwia przesuwanie palców. Charakteryzuje się krótkim skokiem i wyraźnym punktem nacisku.
Wyświetlacz - jasny, 16:10, sRGB
Gigabyte zainstalował panel 165-Hz z obsługą G-Sync. Ta ostatnia dynamicznie dostosowuje częstotliwość odświeżania wyświetlacza i procesora graficznego, aby uzyskać możliwie najbardziej płynny obraz - zwłaszcza podczas grania.
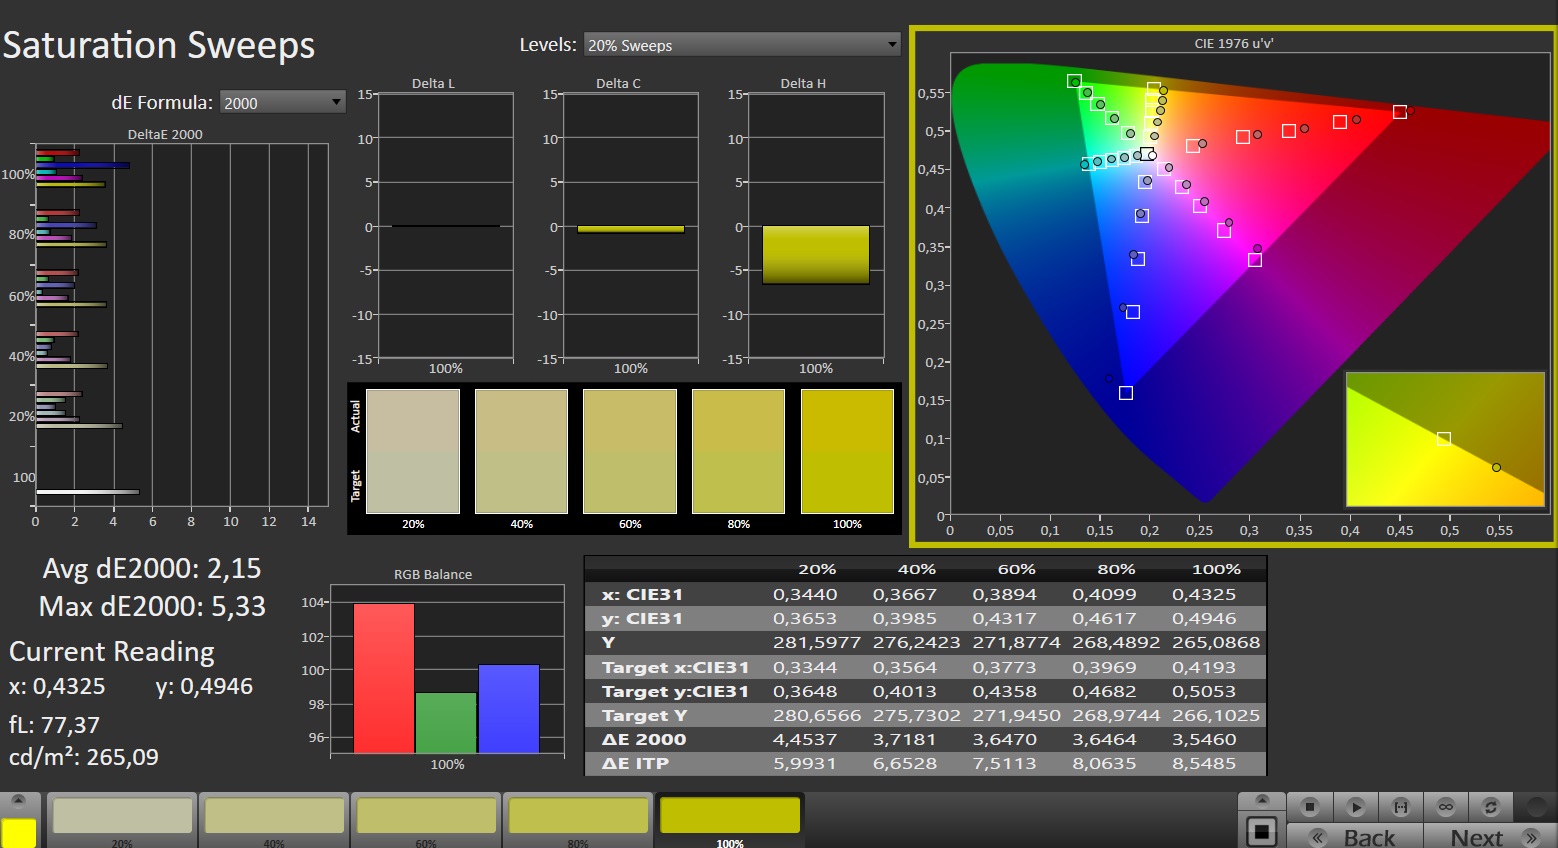
Nie zauważyliśmy żadnych oznak migotania PWM przy żadnym ustawieniu jasności. Jasność i kontrast 16-calowego matowego panelu 16:10 (2560 x 1600 pikseli) spełniają swoje cele (> 300 cd/m² lub 1000:1). Na szczególną uwagę zasługuje jego wysoka jasność.
| |||||||||||||||||||||||||
rozświetlenie: 86 %
na akumulatorze: 542 cd/m²
kontrast: 1204:1 (czerń: 0.45 cd/m²)
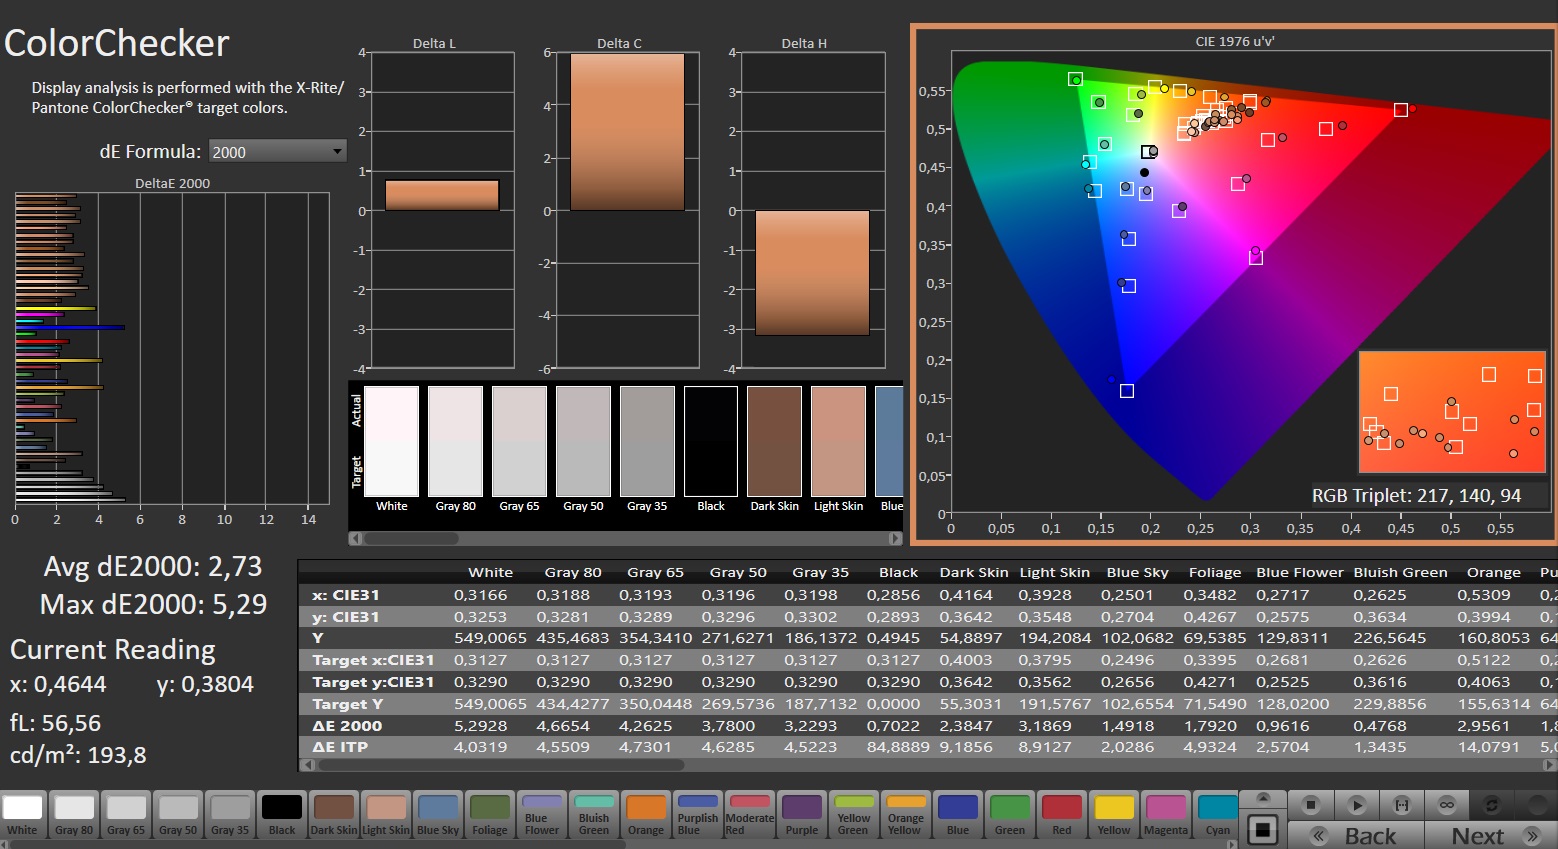
ΔE ColorChecker Calman: 2.73 | ∀{0.5-29.43 Ø4.73}
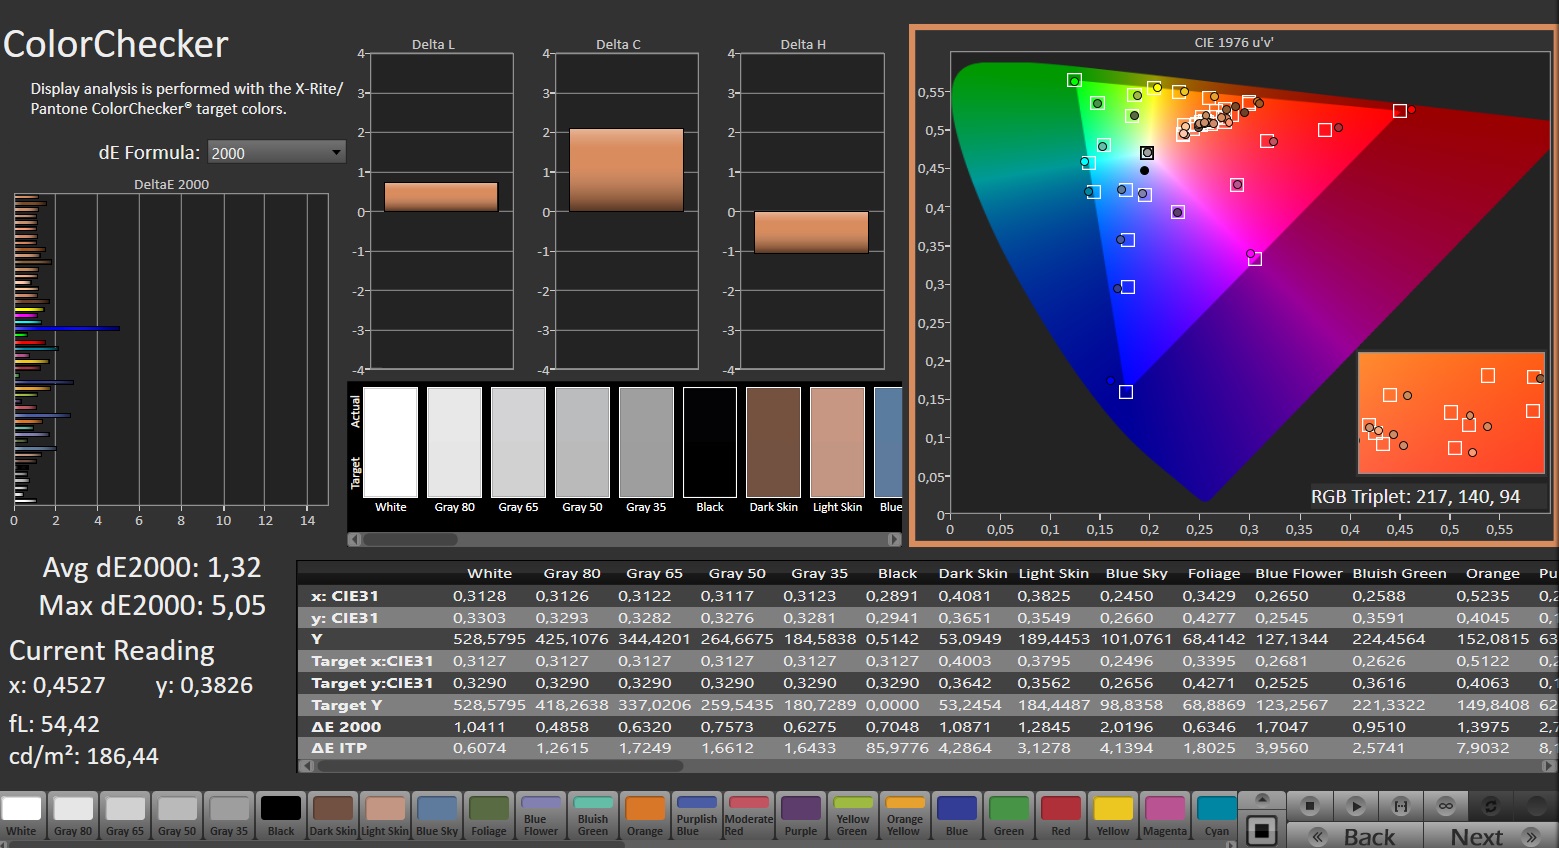
calibrated: 1.32
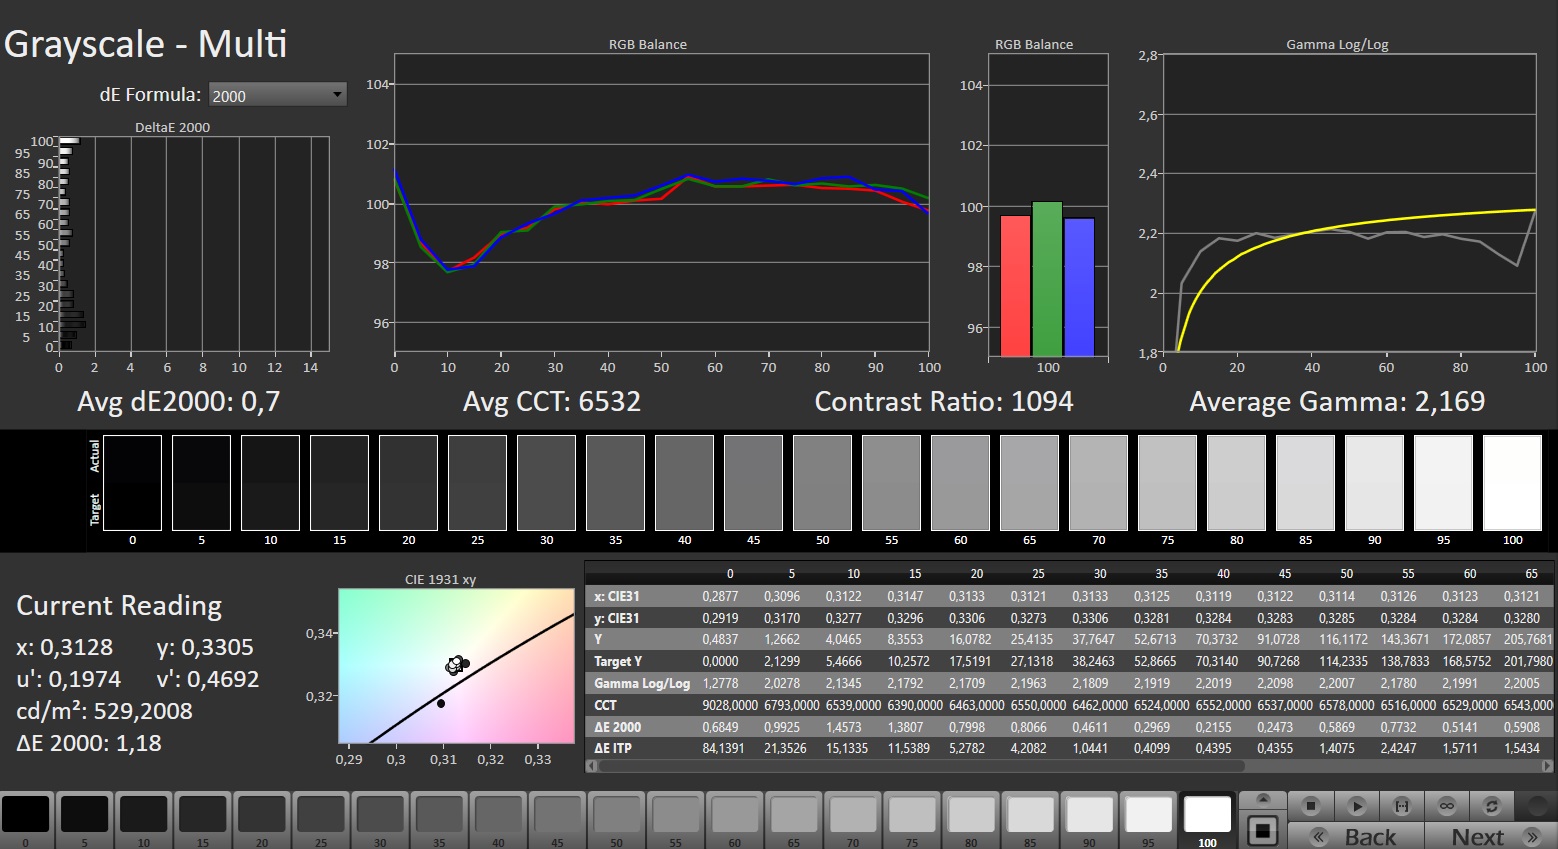
ΔE Greyscale Calman: 2.9 | ∀{0.09-98 Ø4.97}
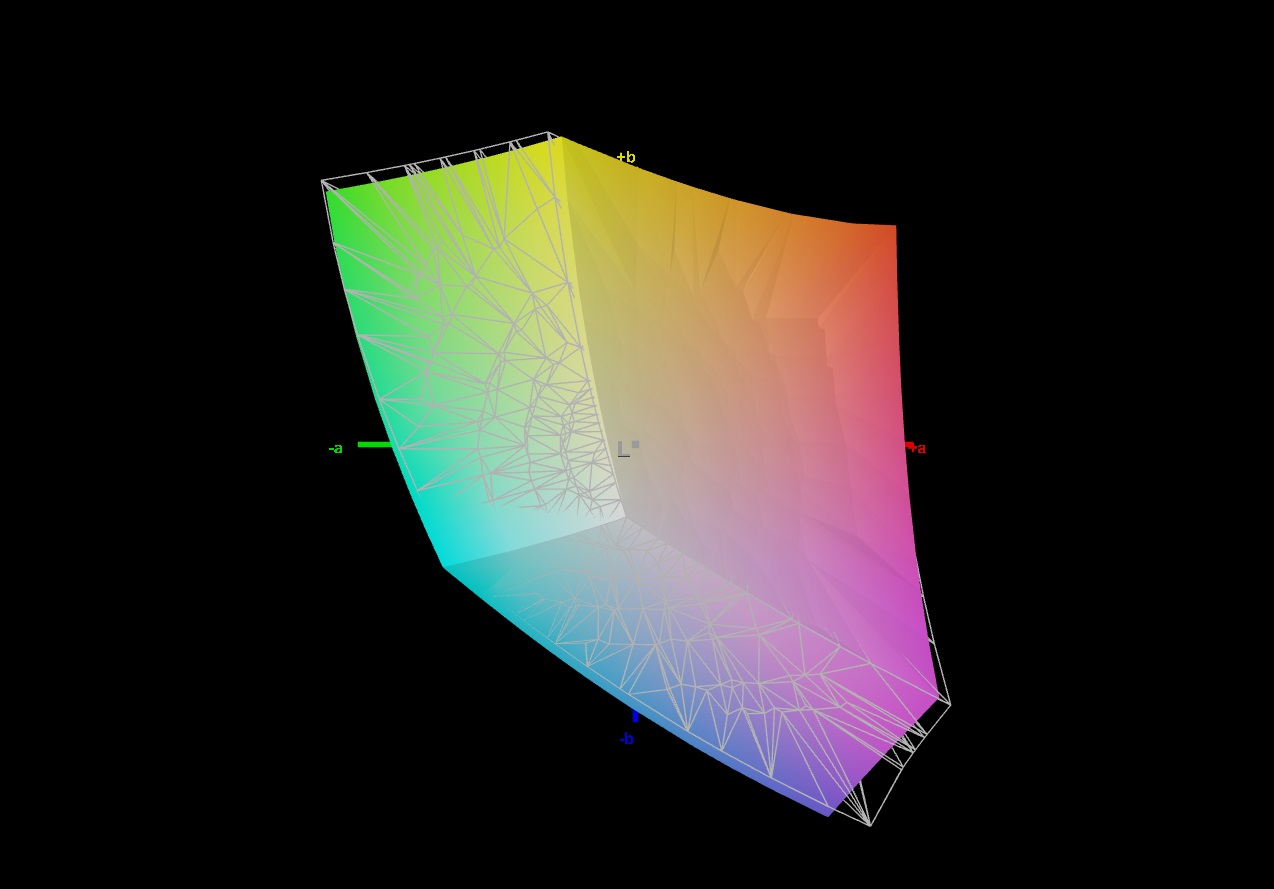
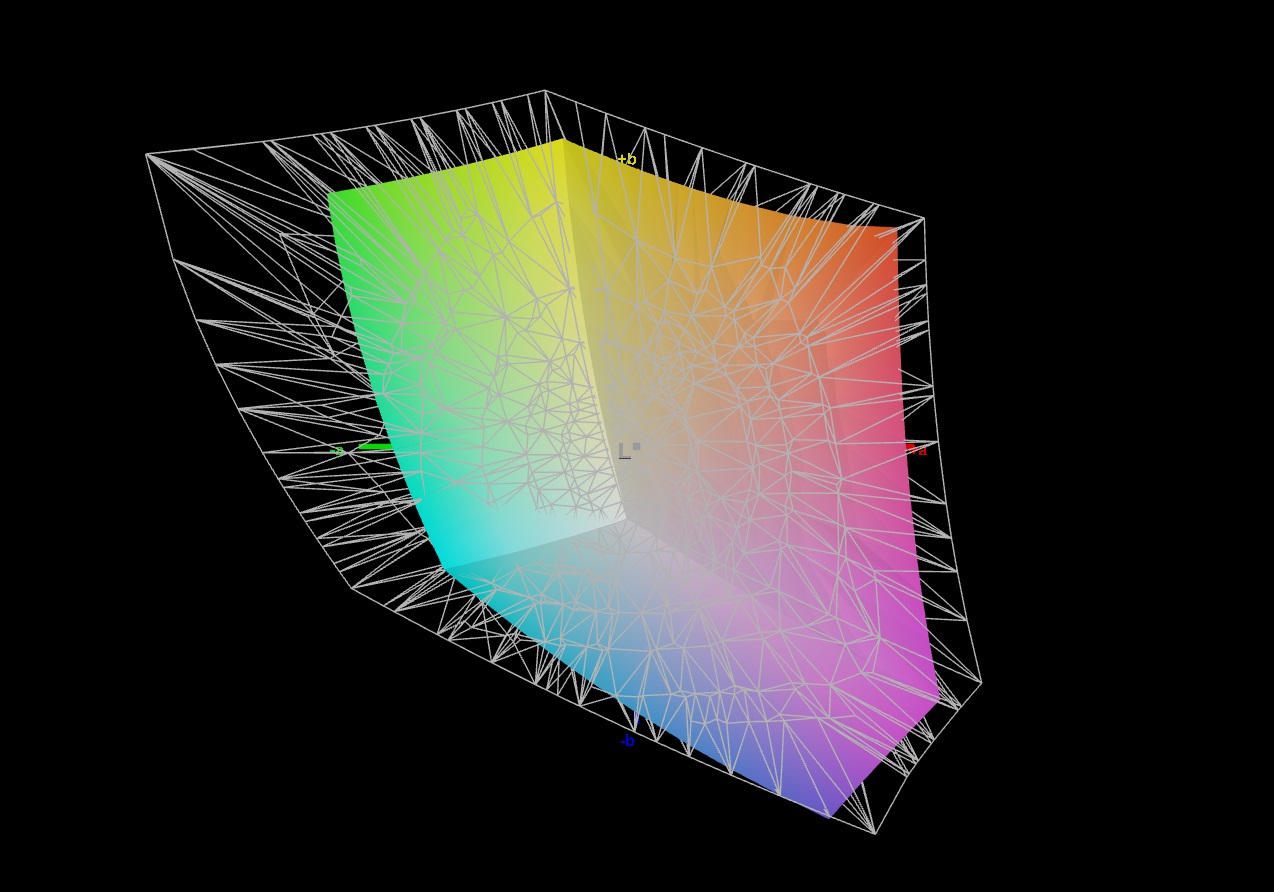
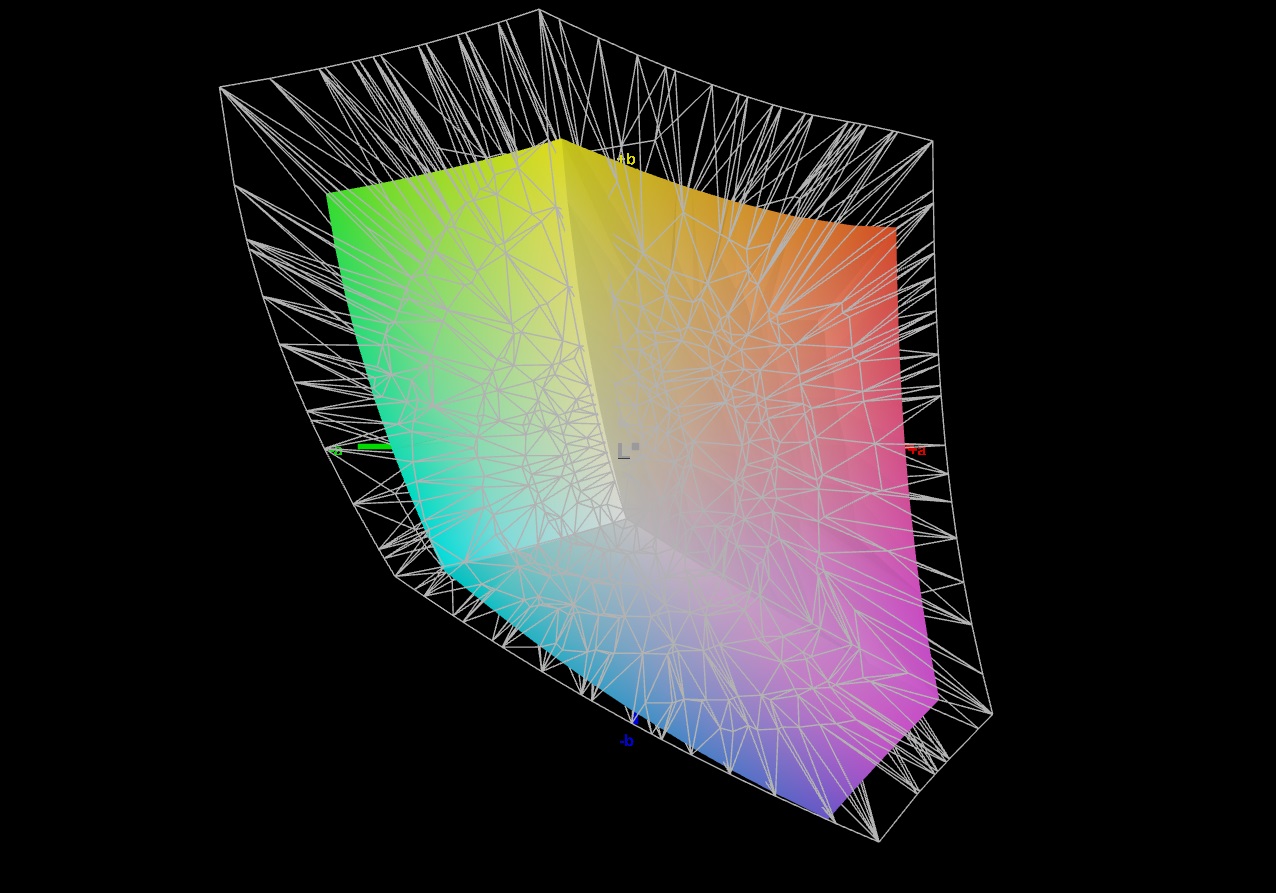
69.3% AdobeRGB 1998 (Argyll 3D)
96.7% sRGB (Argyll 3D)
67.2% Display P3 (Argyll 3D)
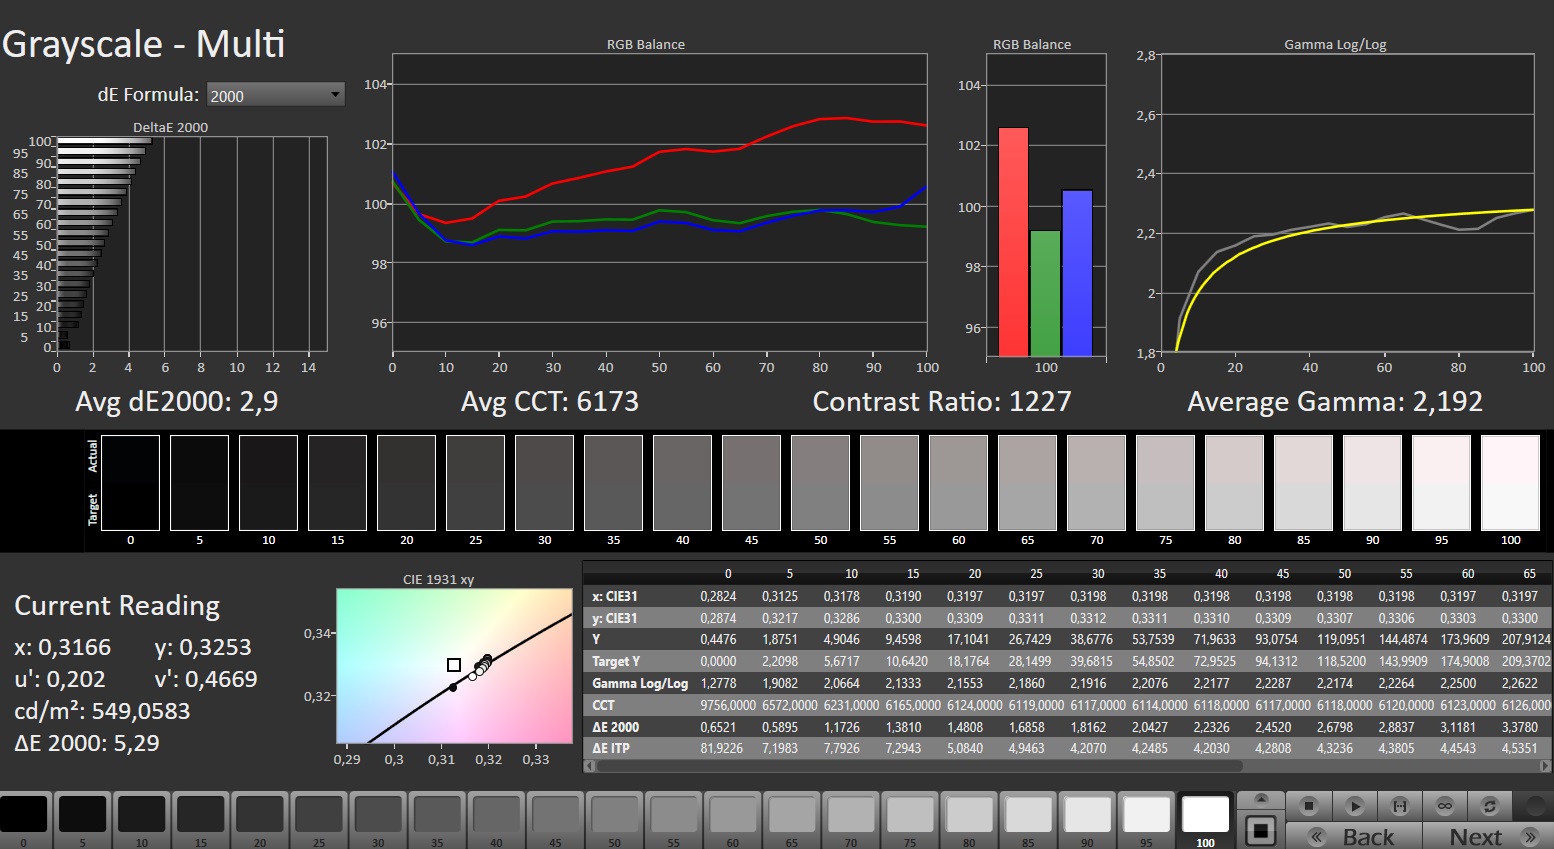
Gamma: 2.192
CCT: 6173 K
| Aorus 16X 2024 BOE CQ NE160QDM-NY1, IPS, 2560x1600, 16" | Alienware m16 R2 BOE NE16NYH, IPS, 2560x1600, 16" | HP Omen Transcend 16-u1095ng ATNA60DL02-0 (SDC41A4), OLED, 2560x1600, 16" | Asus TUF Gaming A17 FA707XI-NS94 AU Optronics B173HAN04.9, IPS, 1920x1080, 17.3" | Schenker XMG Pro 16 Studio (Mid 23) BOE CQ NE160QDM-NZ1, IPS, 2560x1600, 16" | Lenovo Legion Pro 5 16IRX9 BOE NE160QDM-NYC, IPS, 2560x1600, 16" | |
|---|---|---|---|---|---|---|
| Display | 4% | 31% | -40% | 2% | 2% | |
| Display P3 Coverage (%) | 67.2 | 71 6% | 99.8 49% | 39.7 -41% | 69.4 3% | 69.3 3% |
| sRGB Coverage (%) | 96.7 | 100 3% | 100 3% | 59.1 -39% | 98.2 2% | 99.4 3% |
| AdobeRGB 1998 Coverage (%) | 69.3 | 71.4 3% | 97 40% | 41 -41% | 70.1 1% | 70.1 1% |
| Response Times | -19% | 97% | -409% | -53% | -62% | |
| Response Time Grey 50% / Grey 80% * (ms) | 7.5 ? | 5.7 ? 24% | 0.2 ? 97% | 39 ? -420% | 12.2 ? -63% | 11.9 ? -59% |
| Response Time Black / White * (ms) | 5.4 ? | 8.7 ? -61% | 0.2 ? 96% | 26.9 ? -398% | 7.7 ? -43% | 8.9 ? -65% |
| PWM Frequency (Hz) | 120 ? | |||||
| Screen | 11% | 162% | -50% | -9% | 17% | |
| Brightness middle (cd/m²) | 542 | 345.8 -36% | 390 -28% | 255.9 -53% | 349 -36% | 384 -29% |
| Brightness (cd/m²) | 504 | 337 -33% | 392 -22% | 248 -51% | 348 -31% | 366 -27% |
| Brightness Distribution (%) | 86 | 87 1% | 98 14% | 91 6% | 93 8% | 91 6% |
| Black Level * (cd/m²) | 0.45 | 0.3 33% | 0.02 96% | 0.21 53% | 0.32 29% | 0.35 22% |
| Contrast (:1) | 1204 | 1153 -4% | 19500 1520% | 1219 1% | 1091 -9% | 1097 -9% |
| Colorchecker dE 2000 * | 2.73 | 1.99 27% | 1.94 29% | 4.51 -65% | 1.98 27% | 0.97 64% |
| Colorchecker dE 2000 max. * | 5.29 | 3.52 33% | 4.26 19% | 20.77 -293% | 7.56 -43% | 3.57 33% |
| Colorchecker dE 2000 calibrated * | 1.32 | 0.62 53% | 4.21 -219% | 1.82 -38% | 1.45 -10% | 0.77 42% |
| Greyscale dE 2000 * | 2.9 | 2.1 28% | 1.5 48% | 3.2 -10% | 3.3 -14% | 1.5 48% |
| Gamma | 2.192 100% | 2.32 95% | 2.221 99% | 2.08 106% | 2.137 103% | 2.24 98% |
| CCT | 6173 105% | 6369 102% | 6395 102% | 6054 107% | 6672 97% | 6709 97% |
| Całkowita średnia (program / ustawienia) | -1% /
6% | 97% /
124% | -166% /
-99% | -20% /
-13% | -14% /
2% |
* ... im mniej tym lepiej
Ekran już po wyjęciu z pudełka pokazywał dobre odwzorowanie kolorów: Przy odchyleniu około 2,7, cel (DeltaE < 3) został osiągnięty. Kalibracja zmniejsza odchylenie do 1,3 i zapewnia bardziej zrównoważone odcienie szarości. Panel jest w stanie w pełni odwzorować przestrzeń kolorów sRGB, ale nie AdobeRGB i DCI P3. Nie inaczej jest w przypadku monitorów większości konkurentów.

Wyświetl czasy reakcji
| ↔ Czas reakcji od czerni do bieli | ||
|---|---|---|
| 5.4 ms ... wzrost ↗ i spadek ↘ łącznie | ↗ 1.5 ms wzrost | 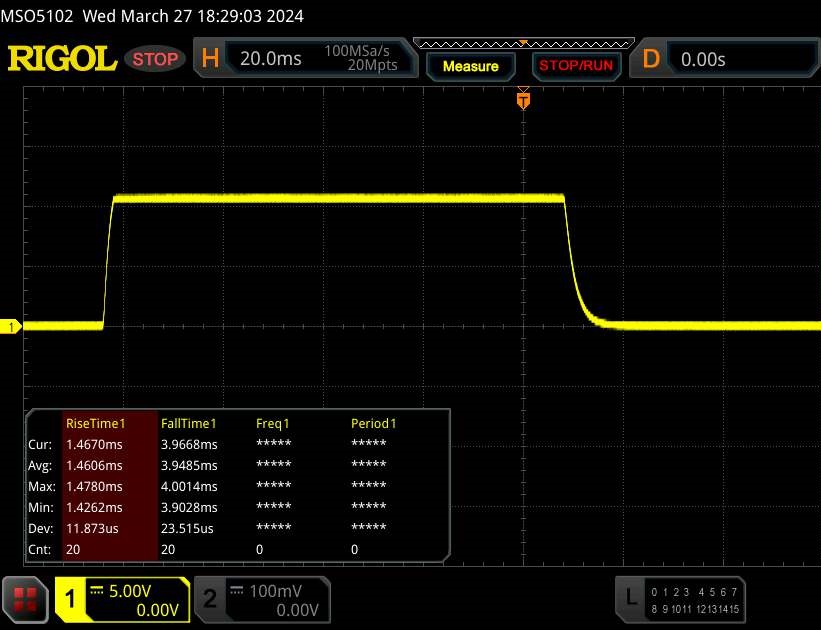 |
| ↘ 3.9 ms upadek | ||
| W naszych testach ekran wykazuje bardzo szybką reakcję i powinien bardzo dobrze nadawać się do szybkich gier. Dla porównania, wszystkie testowane urządzenia wahają się od 0.1 (minimum) do 240 (maksimum) ms. » 18 % wszystkich urządzeń jest lepszych. Oznacza to, że zmierzony czas reakcji jest lepszy od średniej wszystkich testowanych urządzeń (19.9 ms). | ||
| ↔ Czas reakcji 50% szarości do 80% szarości | ||
| 7.5 ms ... wzrost ↗ i spadek ↘ łącznie | ↗ 3.3 ms wzrost | 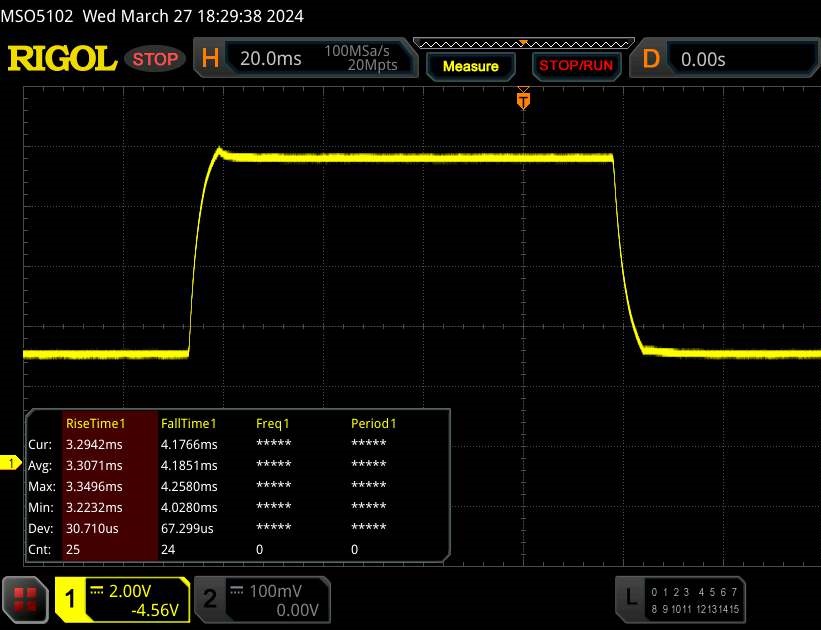 |
| ↘ 4.2 ms upadek | ||
| W naszych testach ekran wykazuje bardzo szybką reakcję i powinien bardzo dobrze nadawać się do szybkich gier. Dla porównania, wszystkie testowane urządzenia wahają się od 0.165 (minimum) do 636 (maksimum) ms. » 20 % wszystkich urządzeń jest lepszych. Oznacza to, że zmierzony czas reakcji jest lepszy od średniej wszystkich testowanych urządzeń (31.1 ms). | ||
Migotanie ekranu / PWM (modulacja szerokości impulsu)
| Migotanie ekranu/nie wykryto PWM | 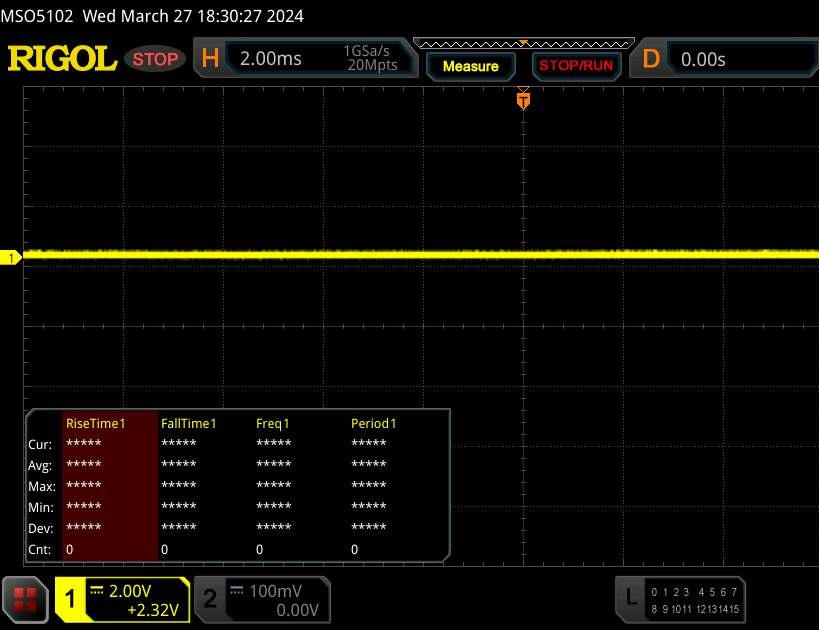 | ||
Dla porównania: 52 % wszystkich testowanych urządzeń nie używa PWM do przyciemniania wyświetlacza. Jeśli wykryto PWM, zmierzono średnio 7784 (minimum: 5 - maksimum: 343500) Hz. | |||
Panel IPS o stabilnym kącie widzenia pozostaje czytelny pod każdym kątem. Na zewnątrz można czytać z panelu, o ile słońce nie świeci zbyt mocno.

Wydajność - Raptor Lake i Ada Lovelace zasilają urządzenie
Gigabyte Aorus 16X to laptop dla graczy i twórców. Niezbędną moc obliczeniową zapewniają układy Raptor Lake i Ada Lovelace. Prezentowany model można obecnie nabyć za około 2000 USD. Dostępne są również tańsze warianty.
Warunki testowania
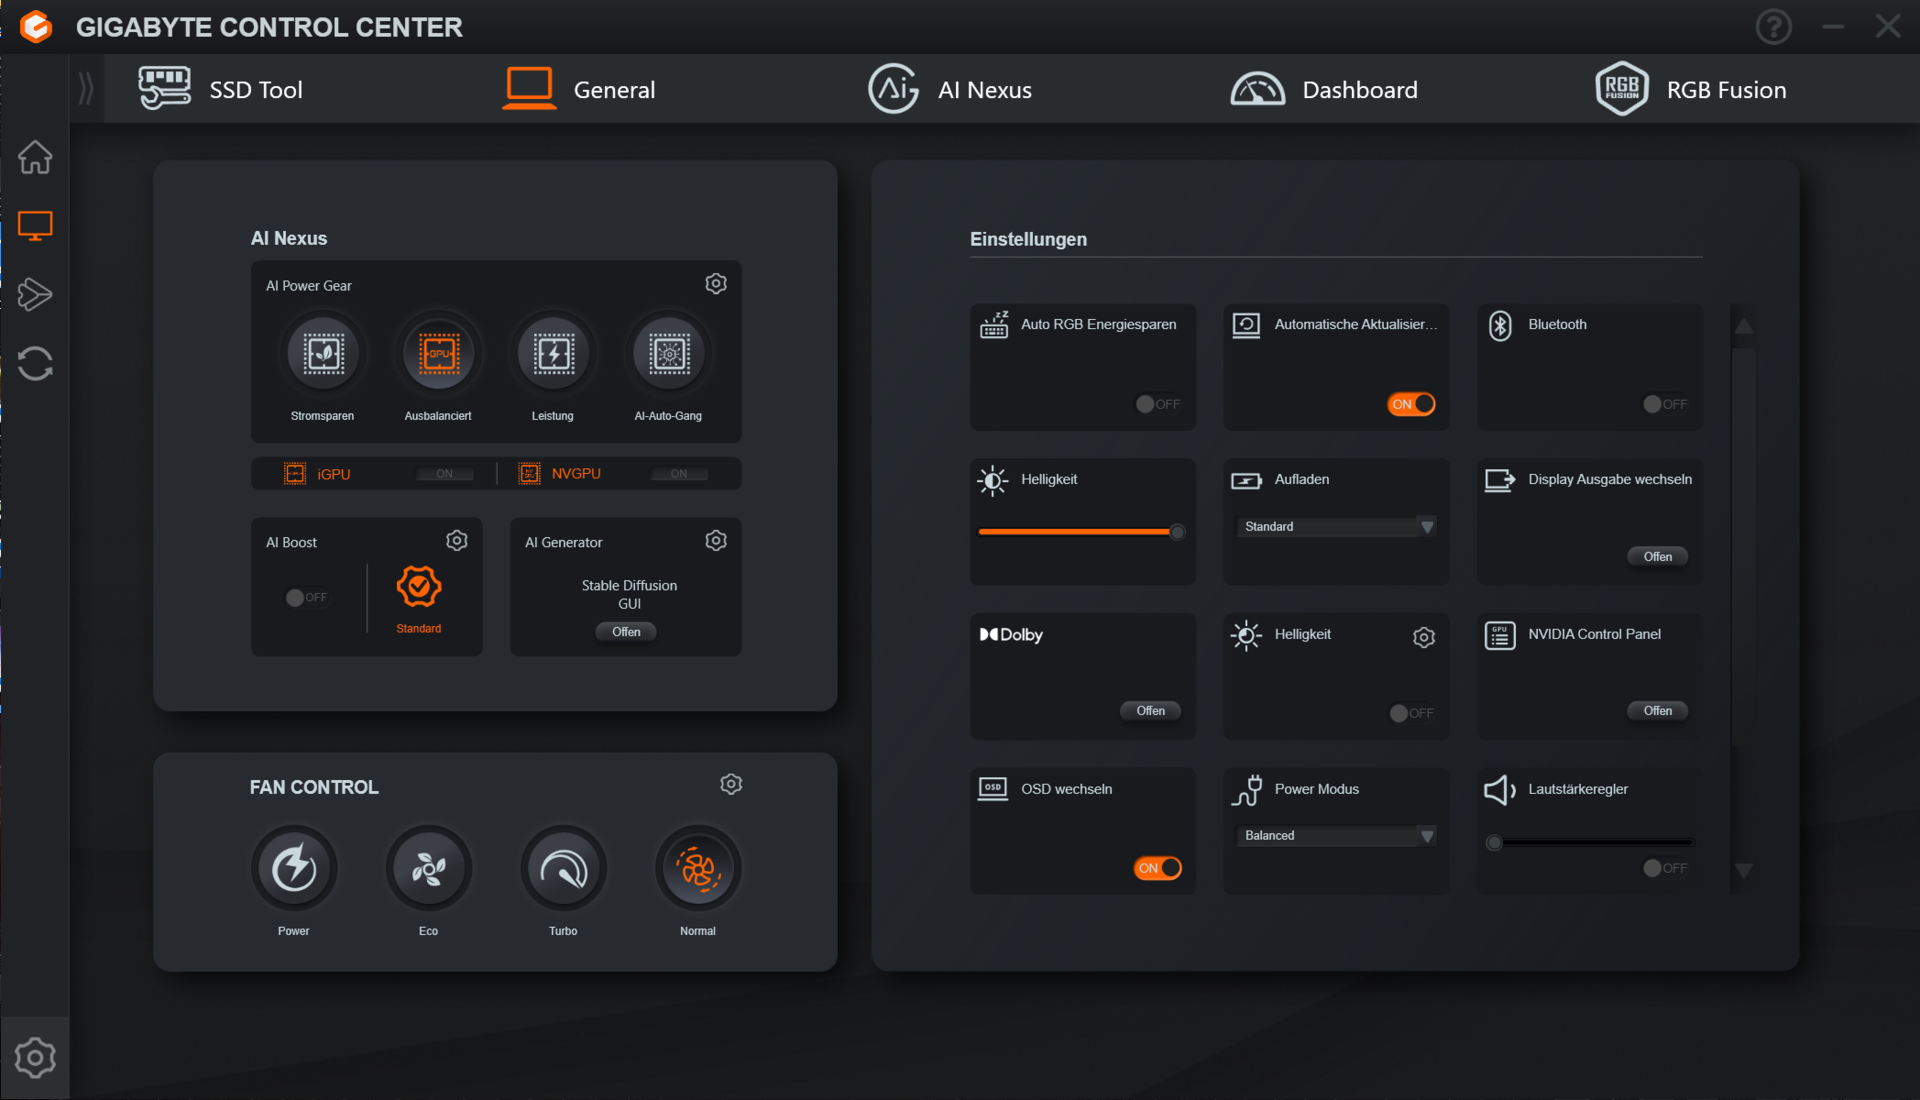
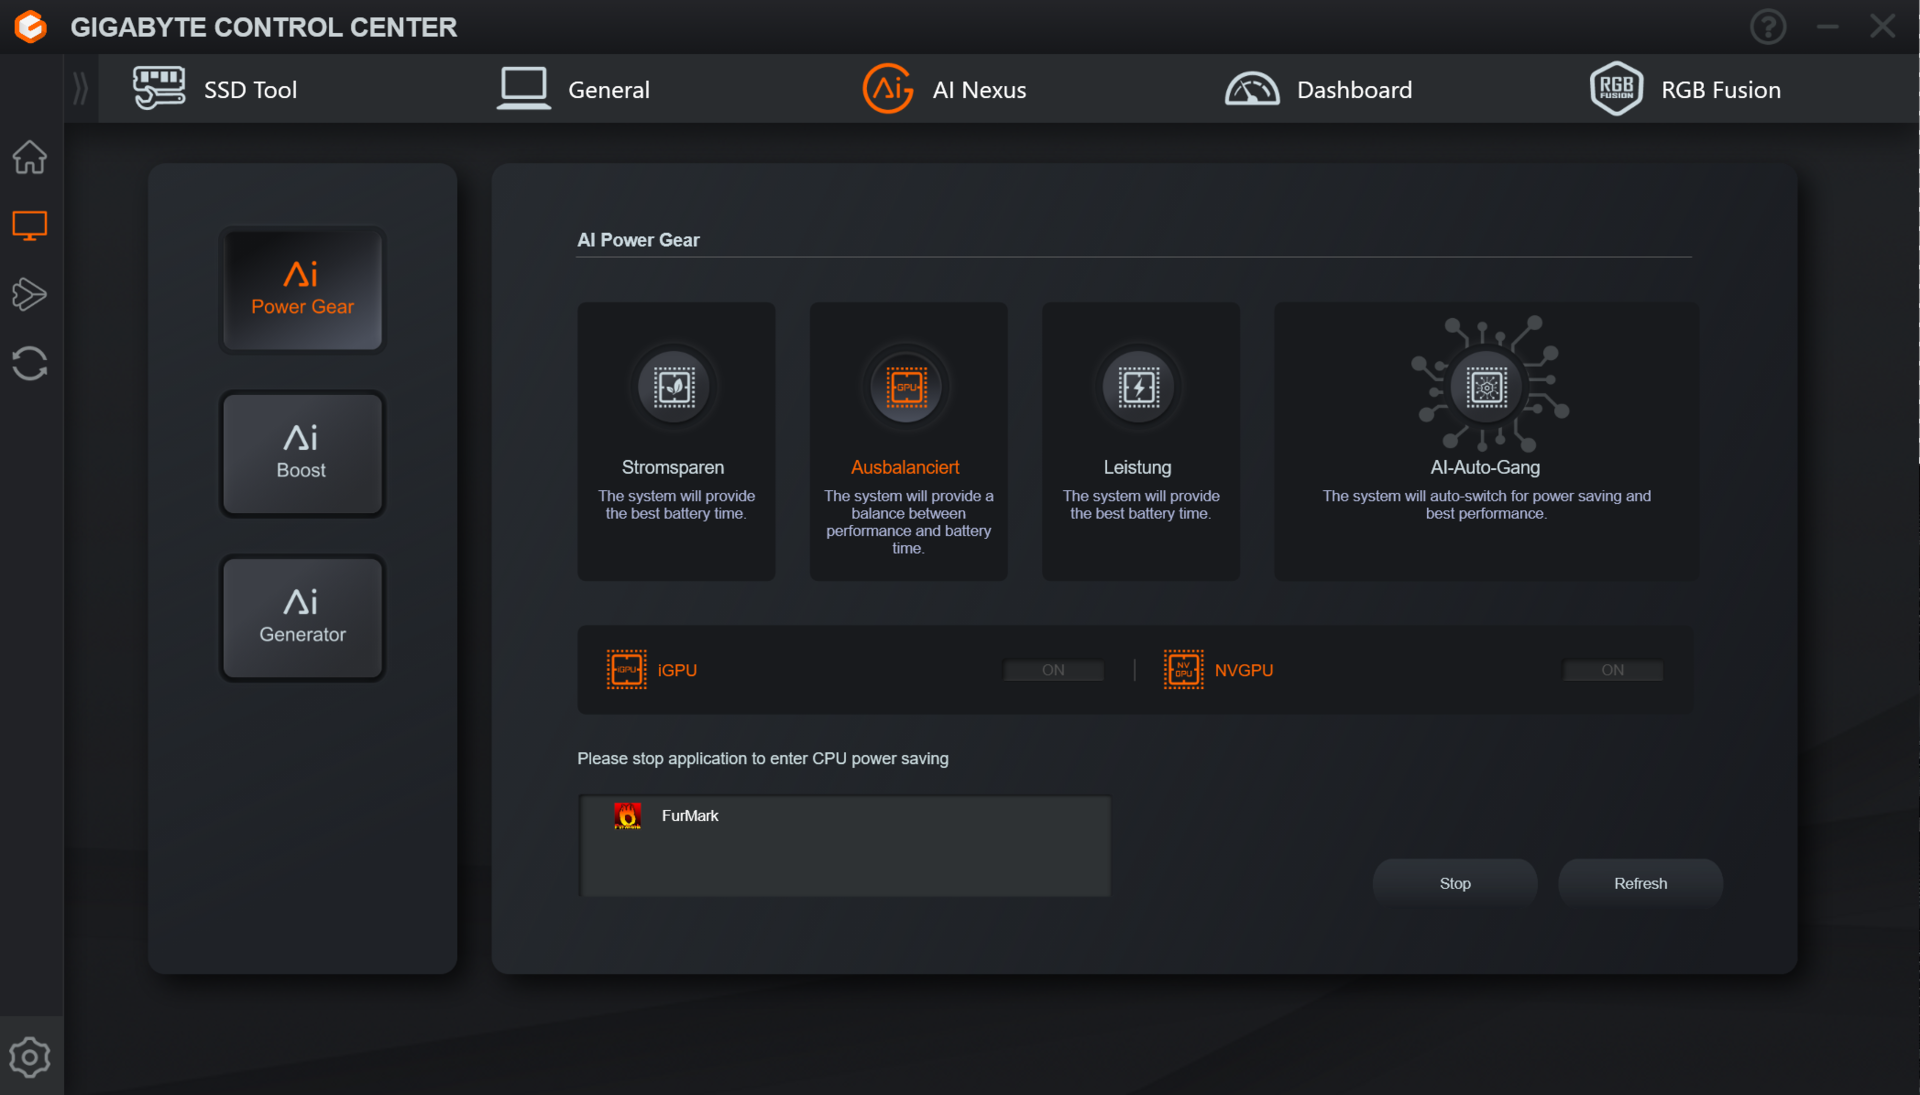
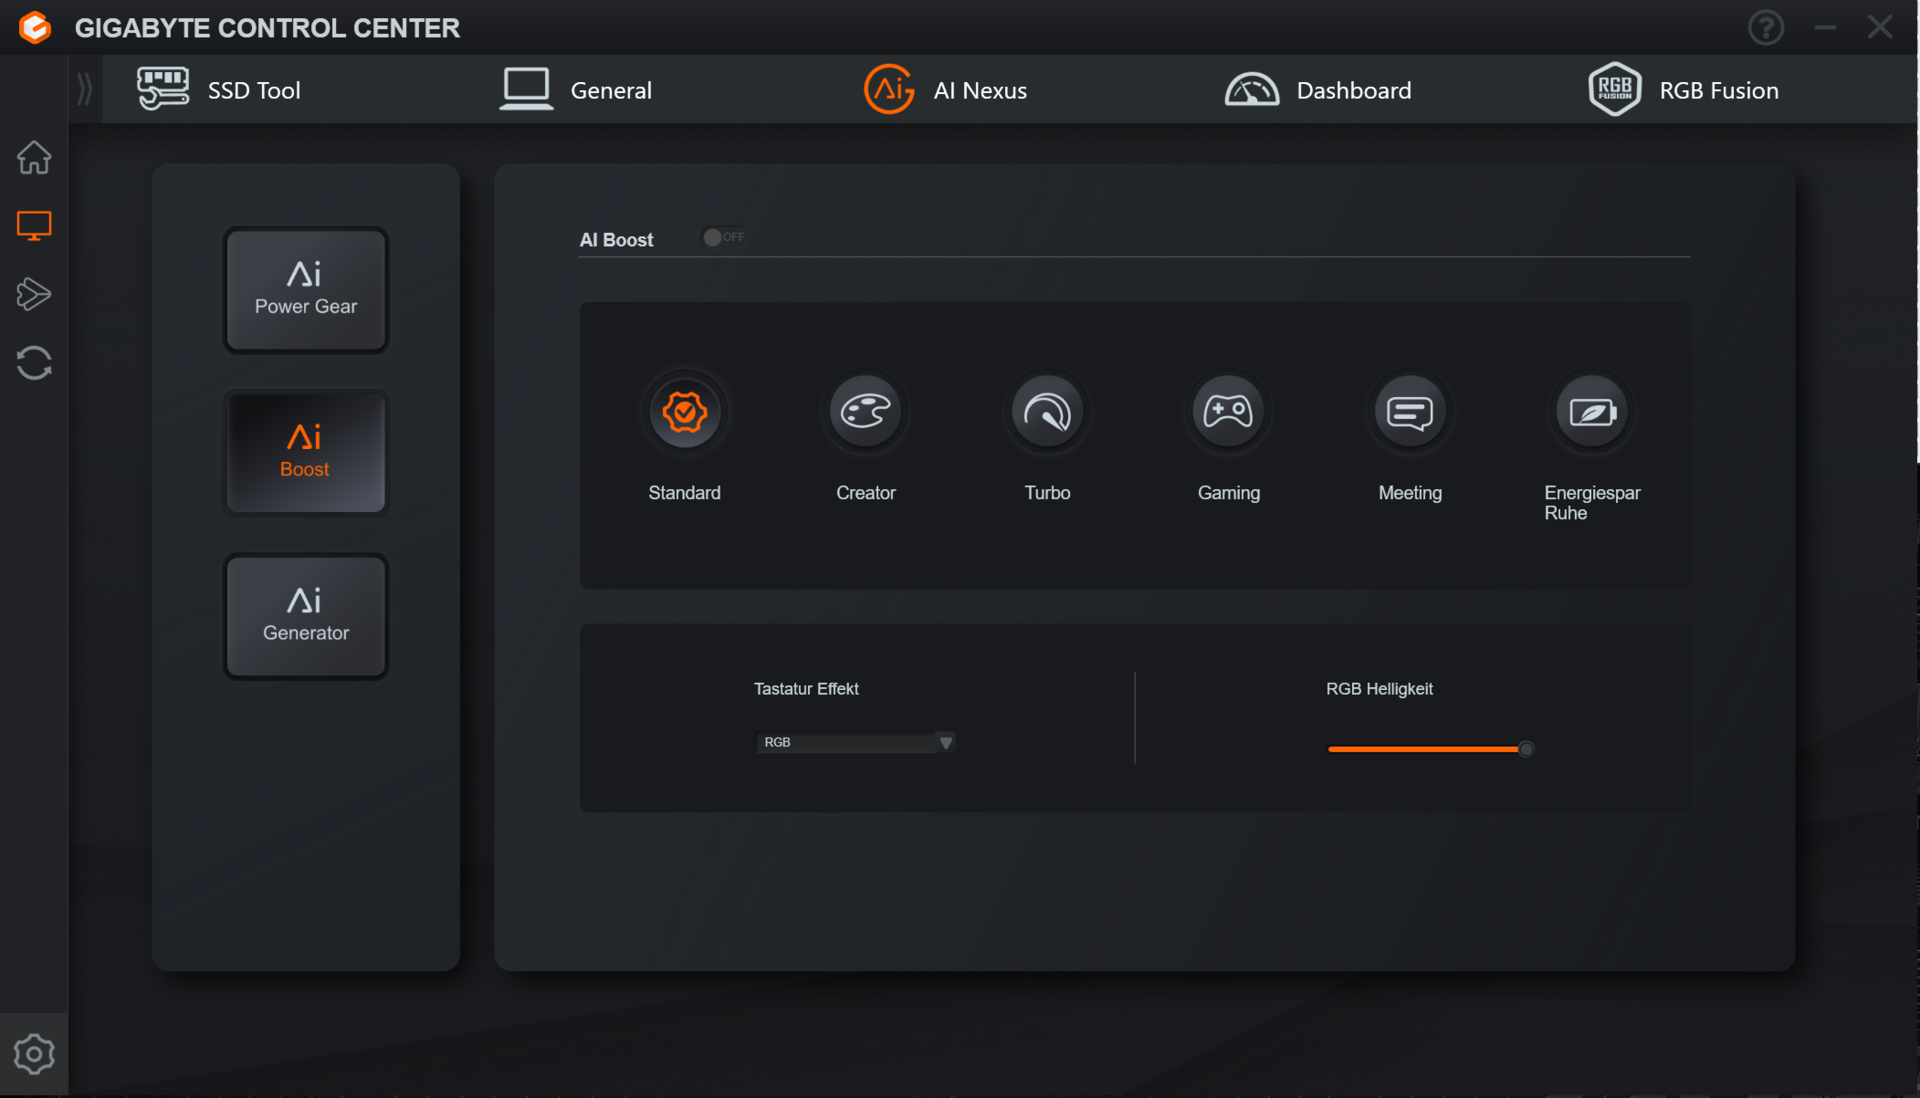
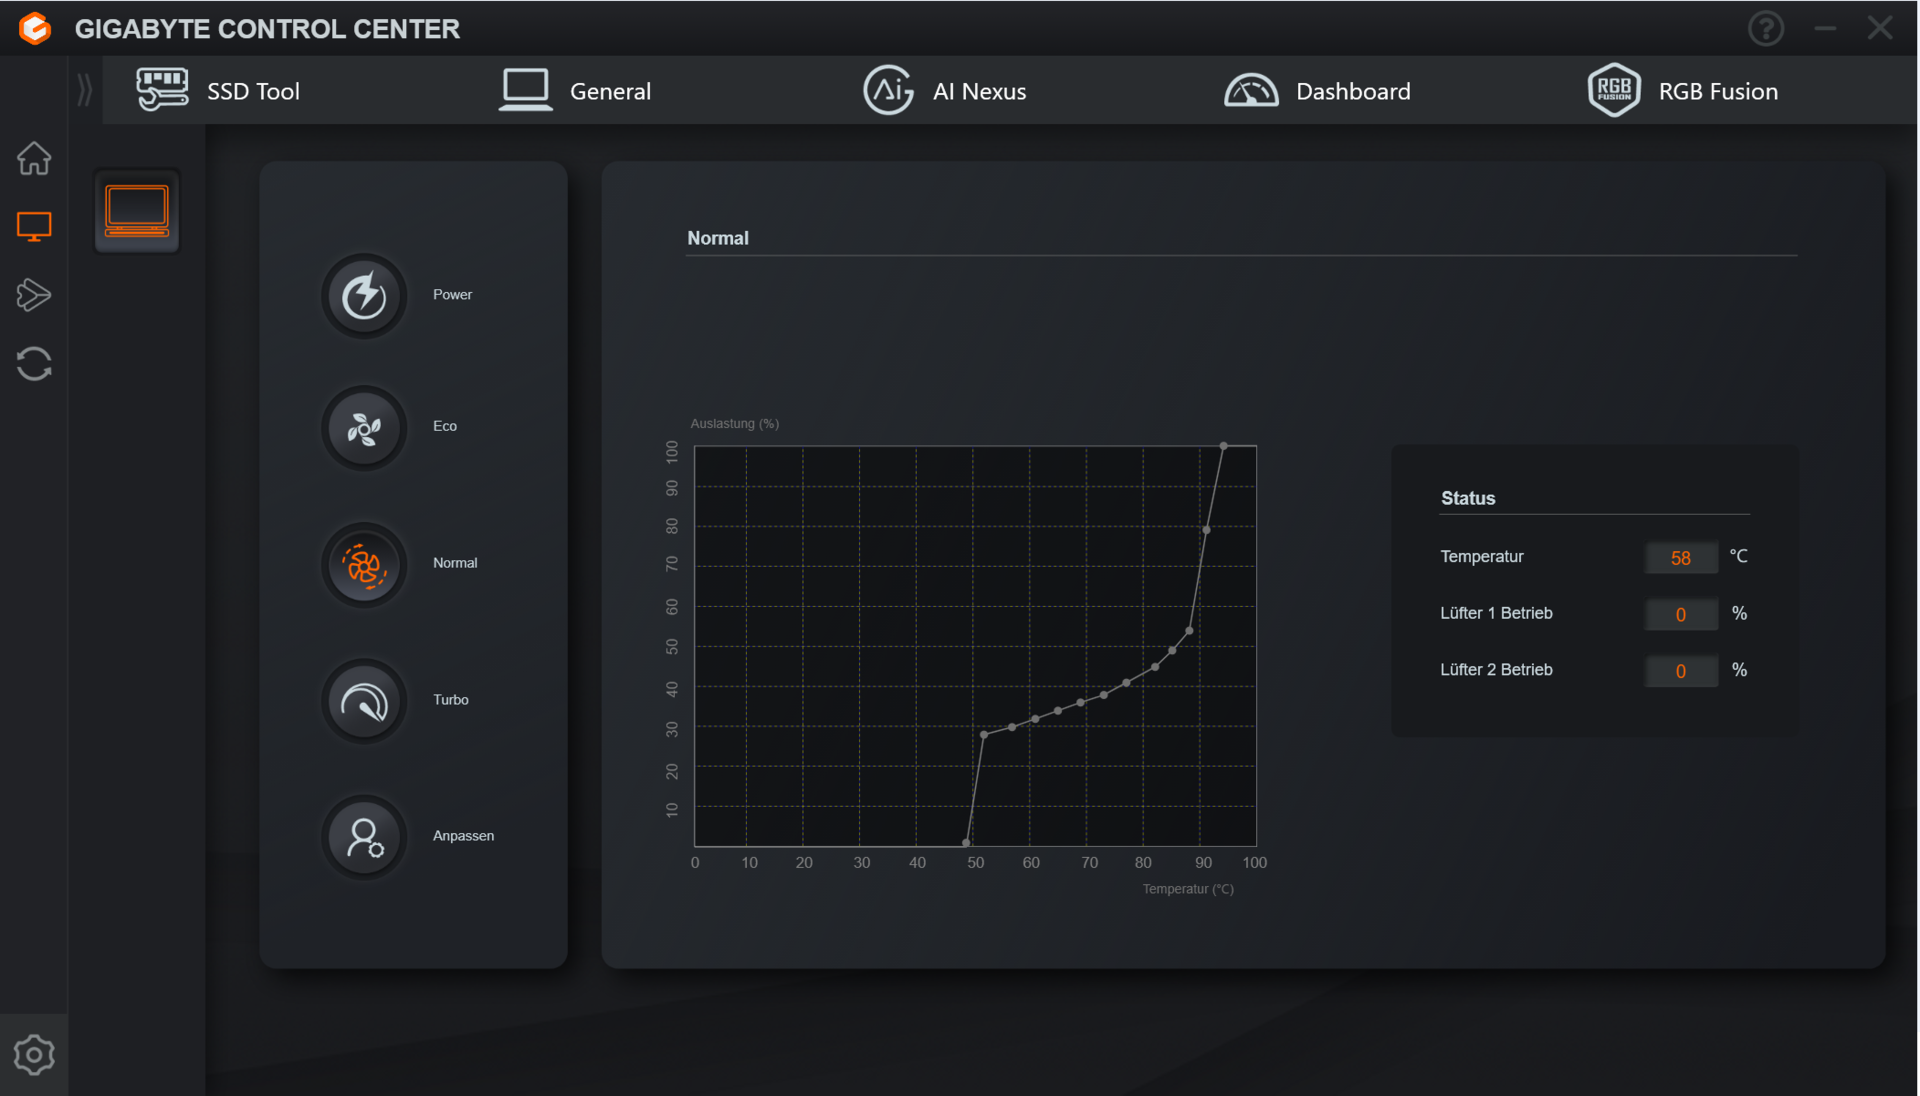
16X oferuje sześć trybów wydajności specyficznych dla producenta (patrz tabela), między którymi można przełączać się za pośrednictwem Gigabyte Control Center (centrum sterowania laptopa). My korzystaliśmy z trybów Standard (benchmarki) i Energy-Saving Quiet (testy baterii). Tryby Turbo, Gaming i Creator mogą być używane tylko wtedy, gdy laptop jest podłączony do zasilania.
Uwaga: Dostępne ustawienia wydajności nie są zbyt jasno przedstawione w Gigabyte Control Center.Profile wydajności dla całego systemu można znaleźć w sekcji "AI Boost". Sekcja "AI Power Gear" odnosi się tylko do stanu pracy dGPU (tylko dGPU lub wyłączone, przełączanie grafiki).
| Standardowa | Creator | Turbo | Gaming | Meeting | Energooszczędna Cicha | |
|---|---|---|---|---|---|---|
| Limit mocy 1 (HWInfo) | 90 watów | 110 watów | 125 watów | 110 watów | 65 watów | 65 watów |
| Limit mocy 2 (HWInfo) | 120 watów | 135 watów | 150 watów | 135 watów | 100 watów | 100 watów |
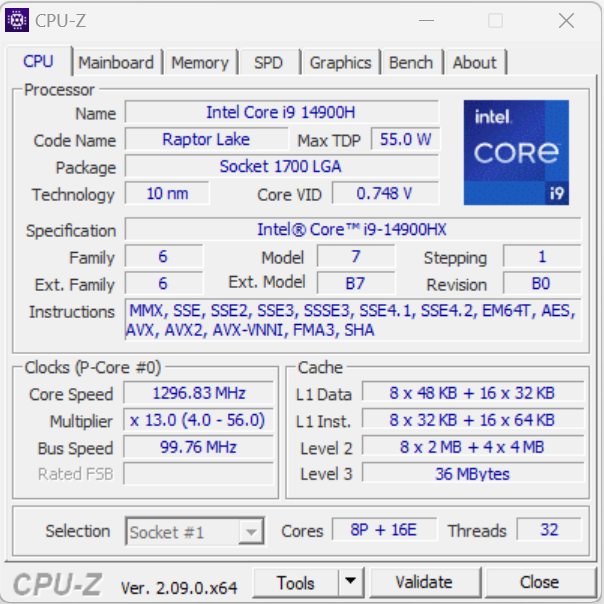
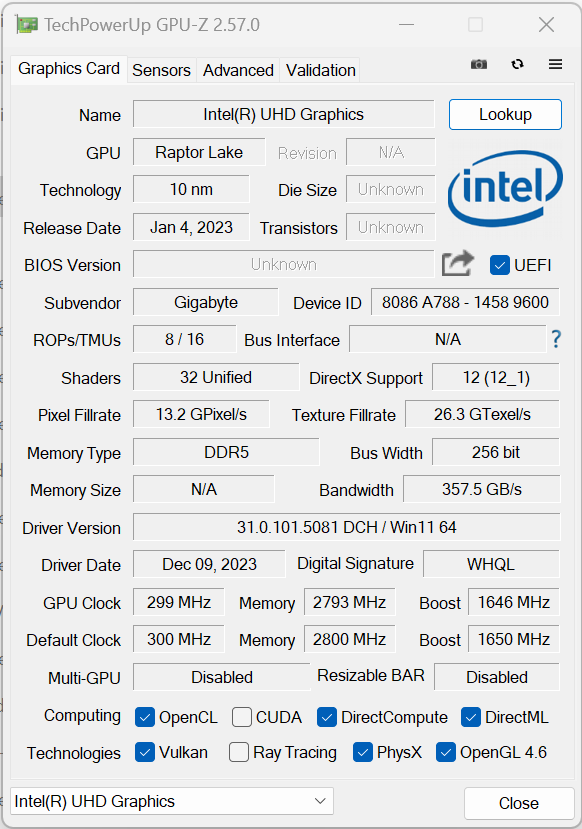
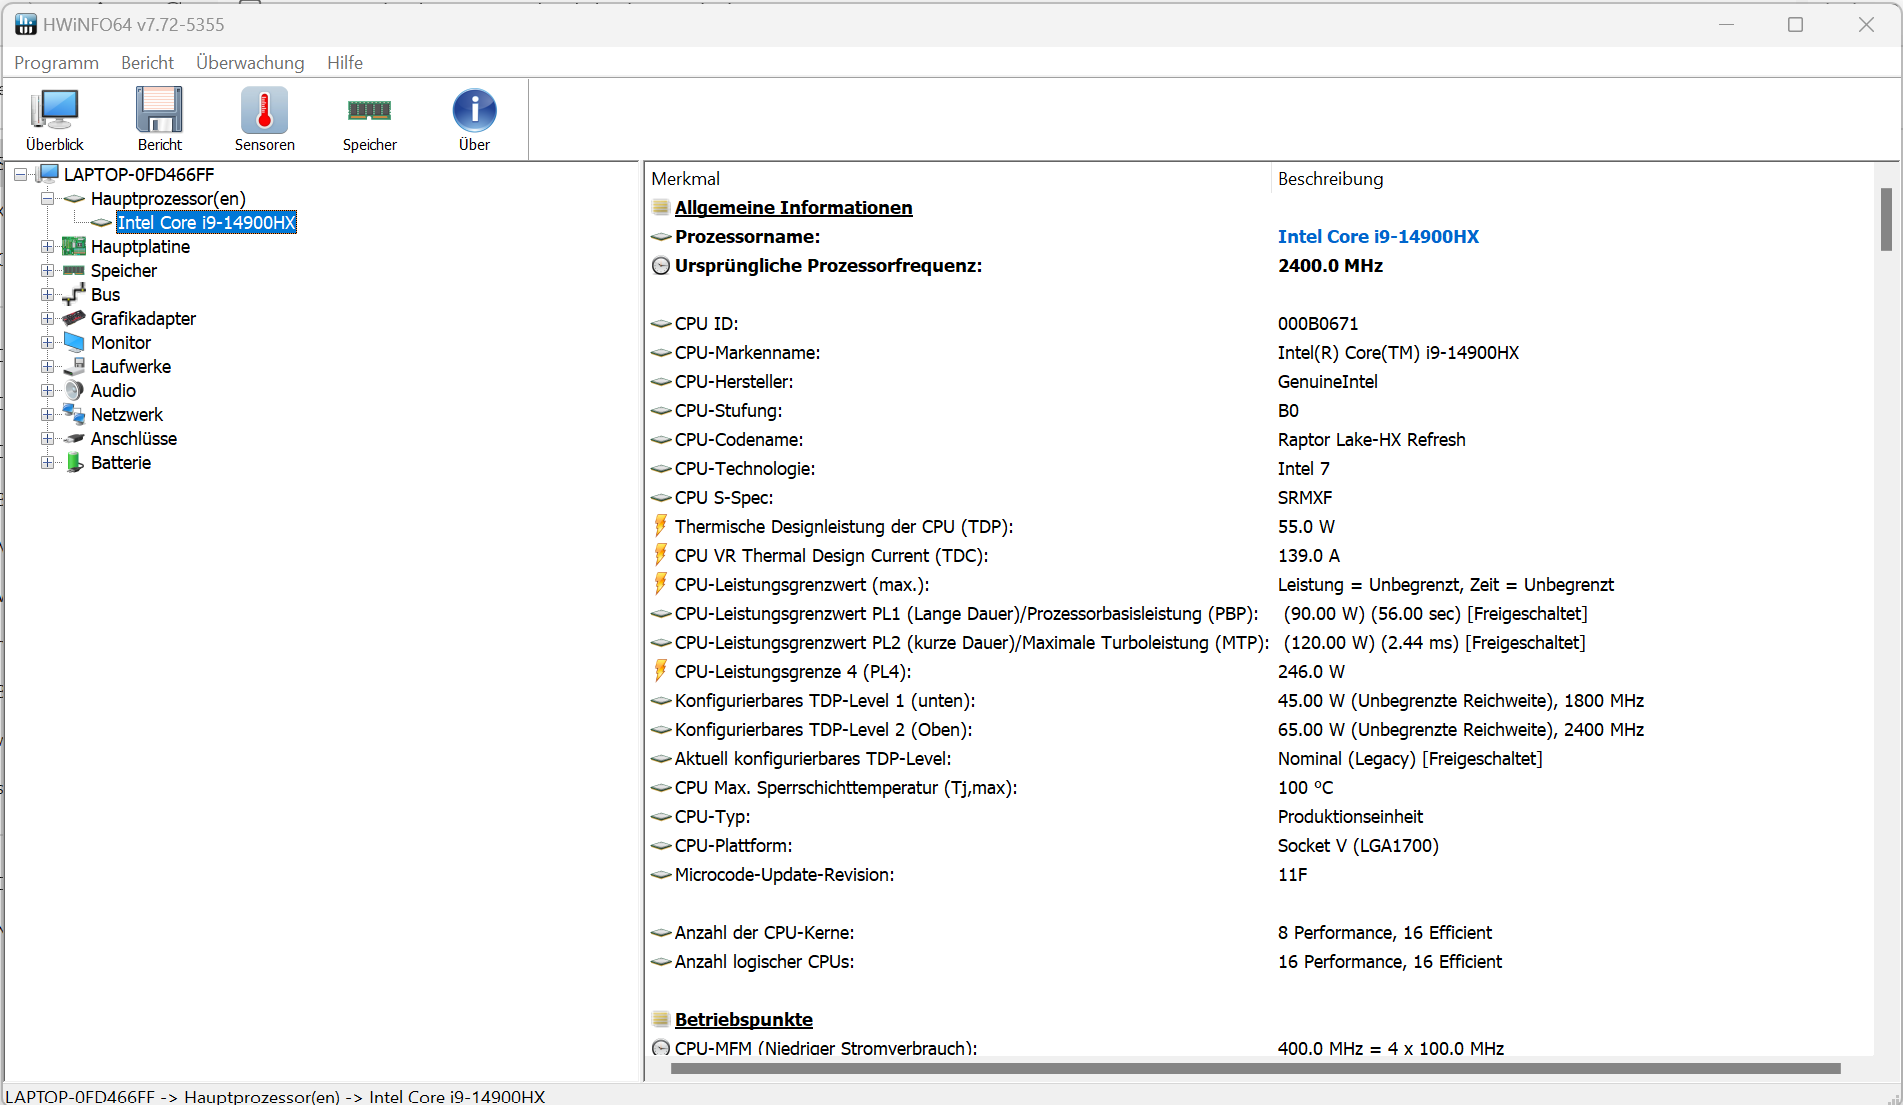
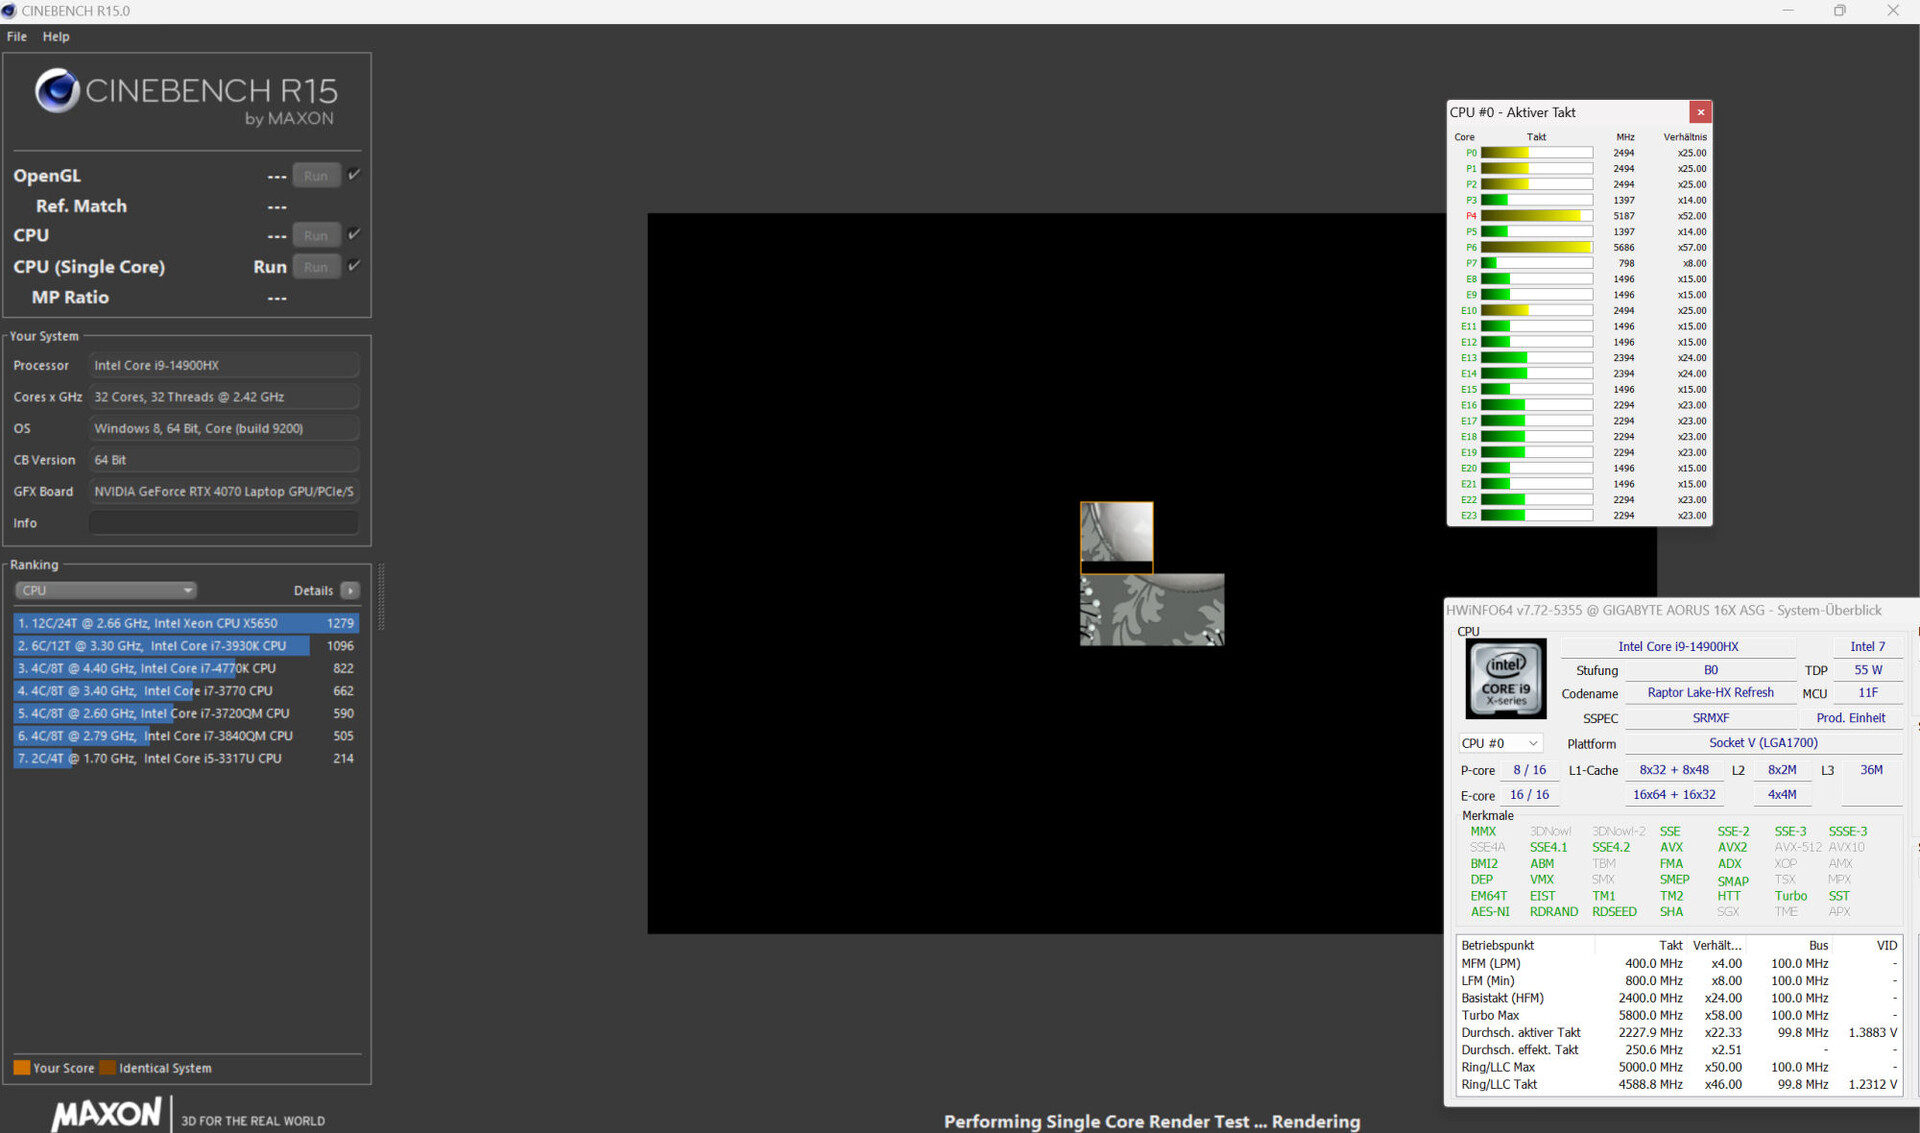
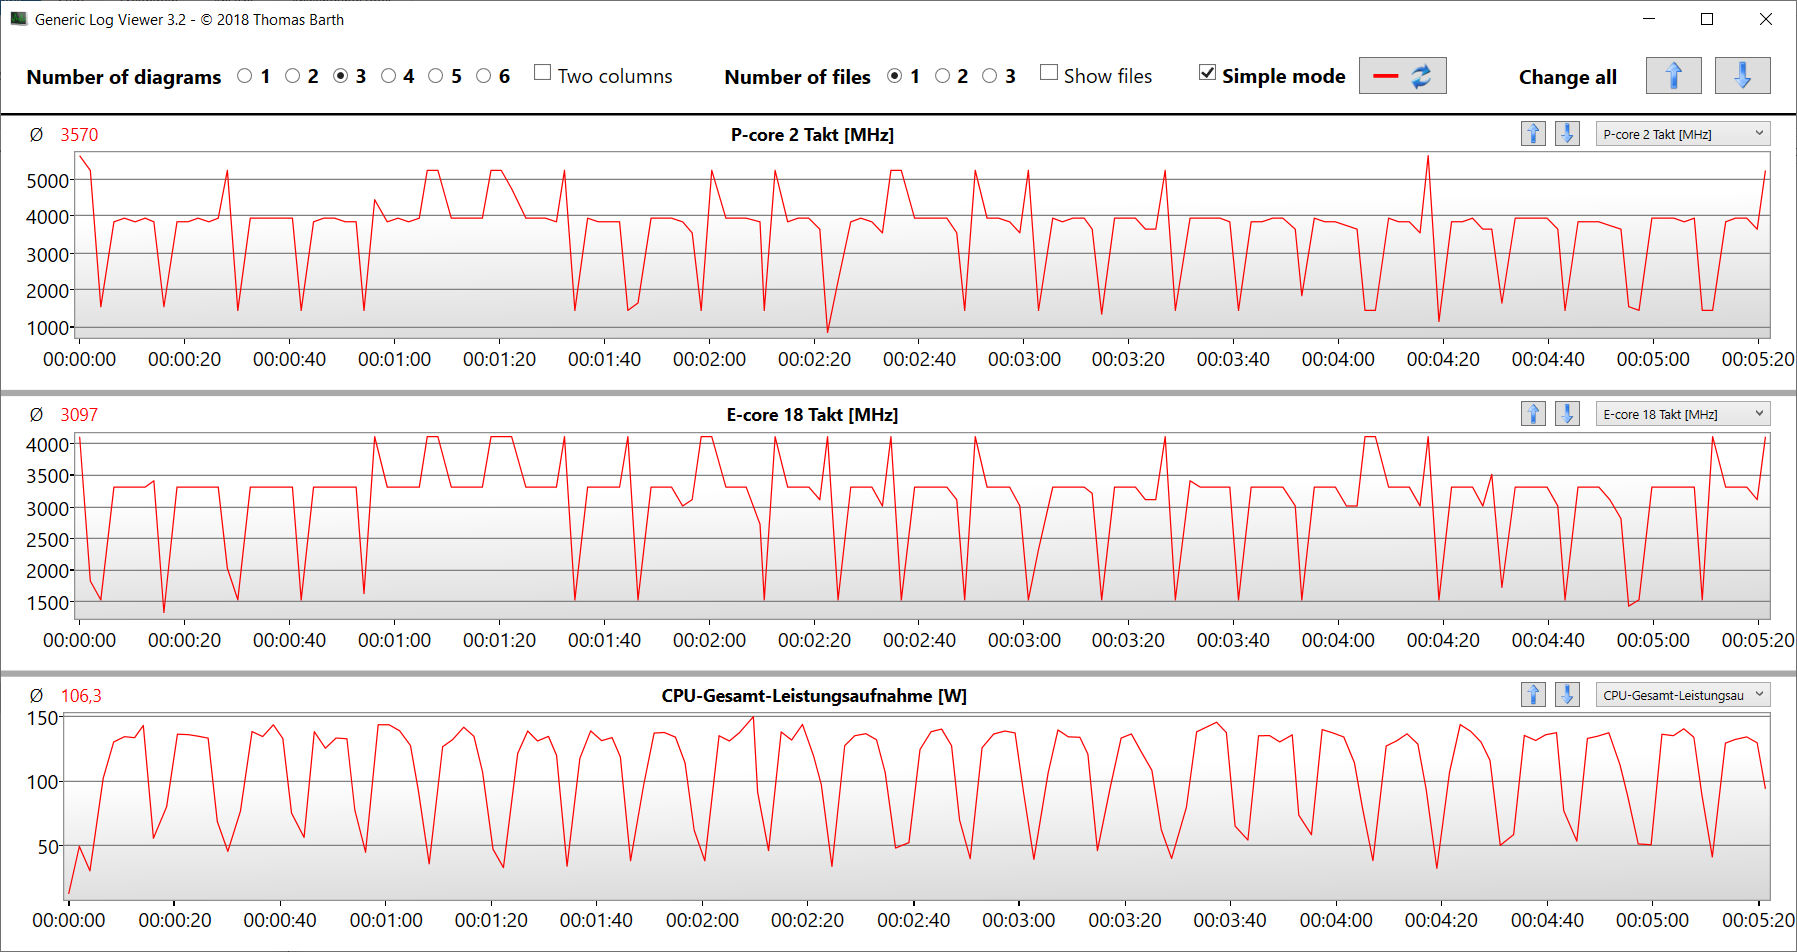
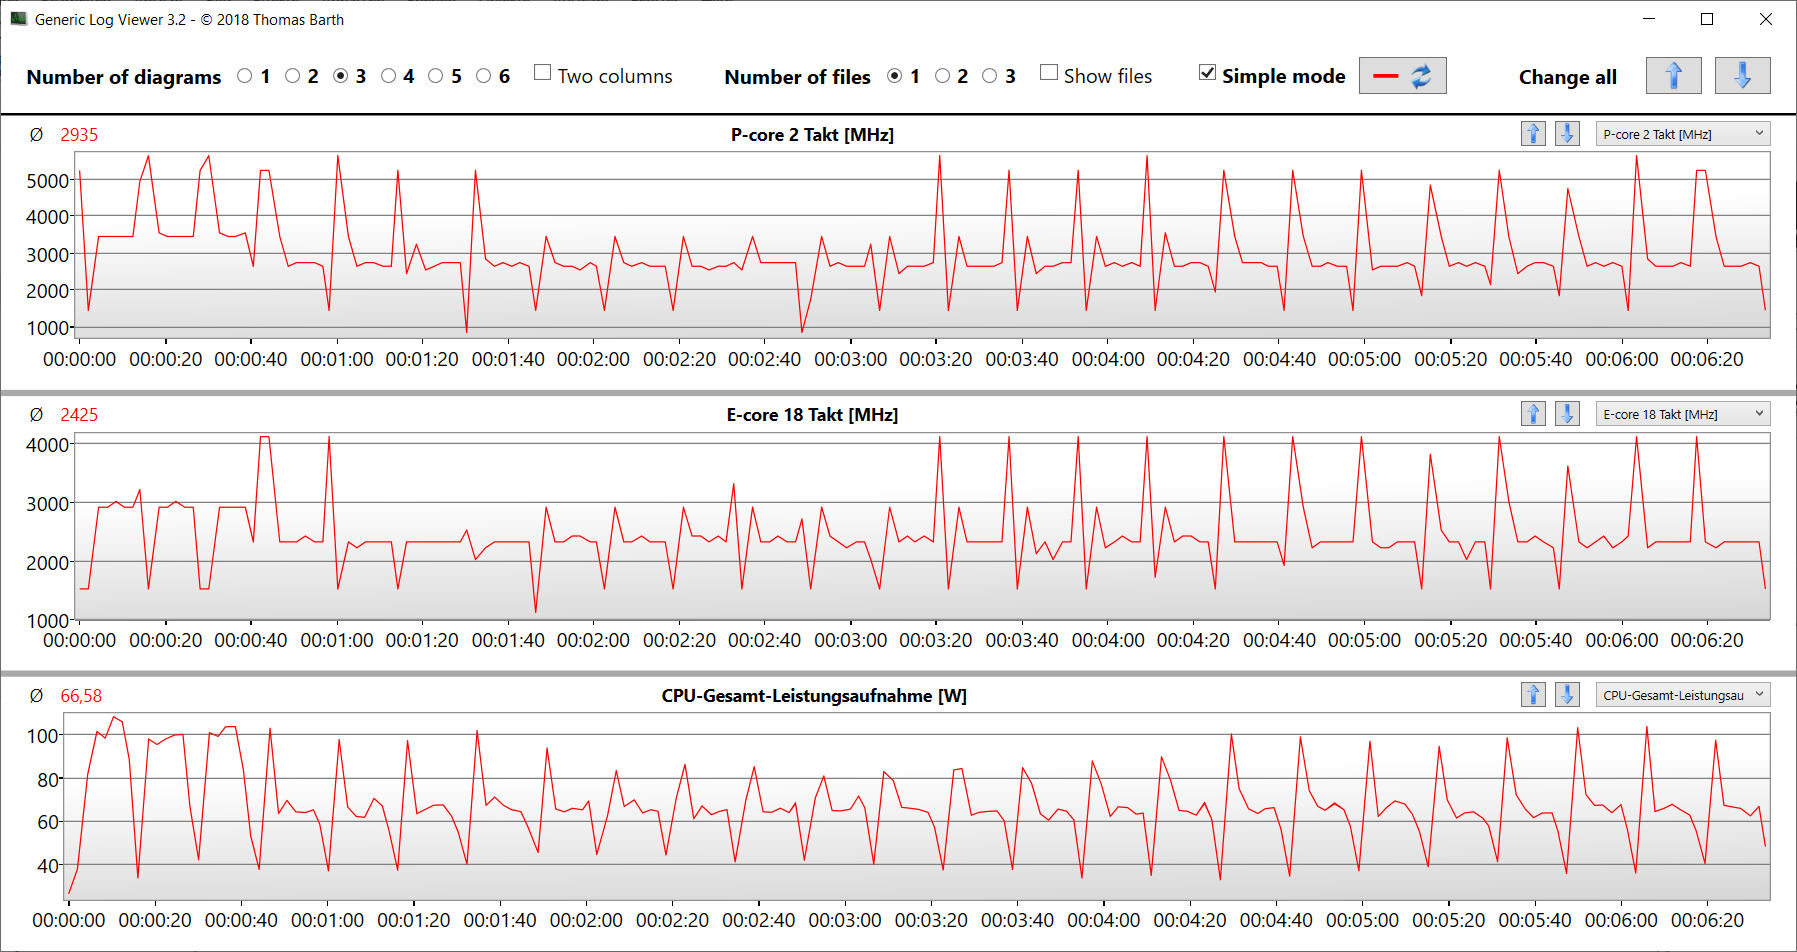
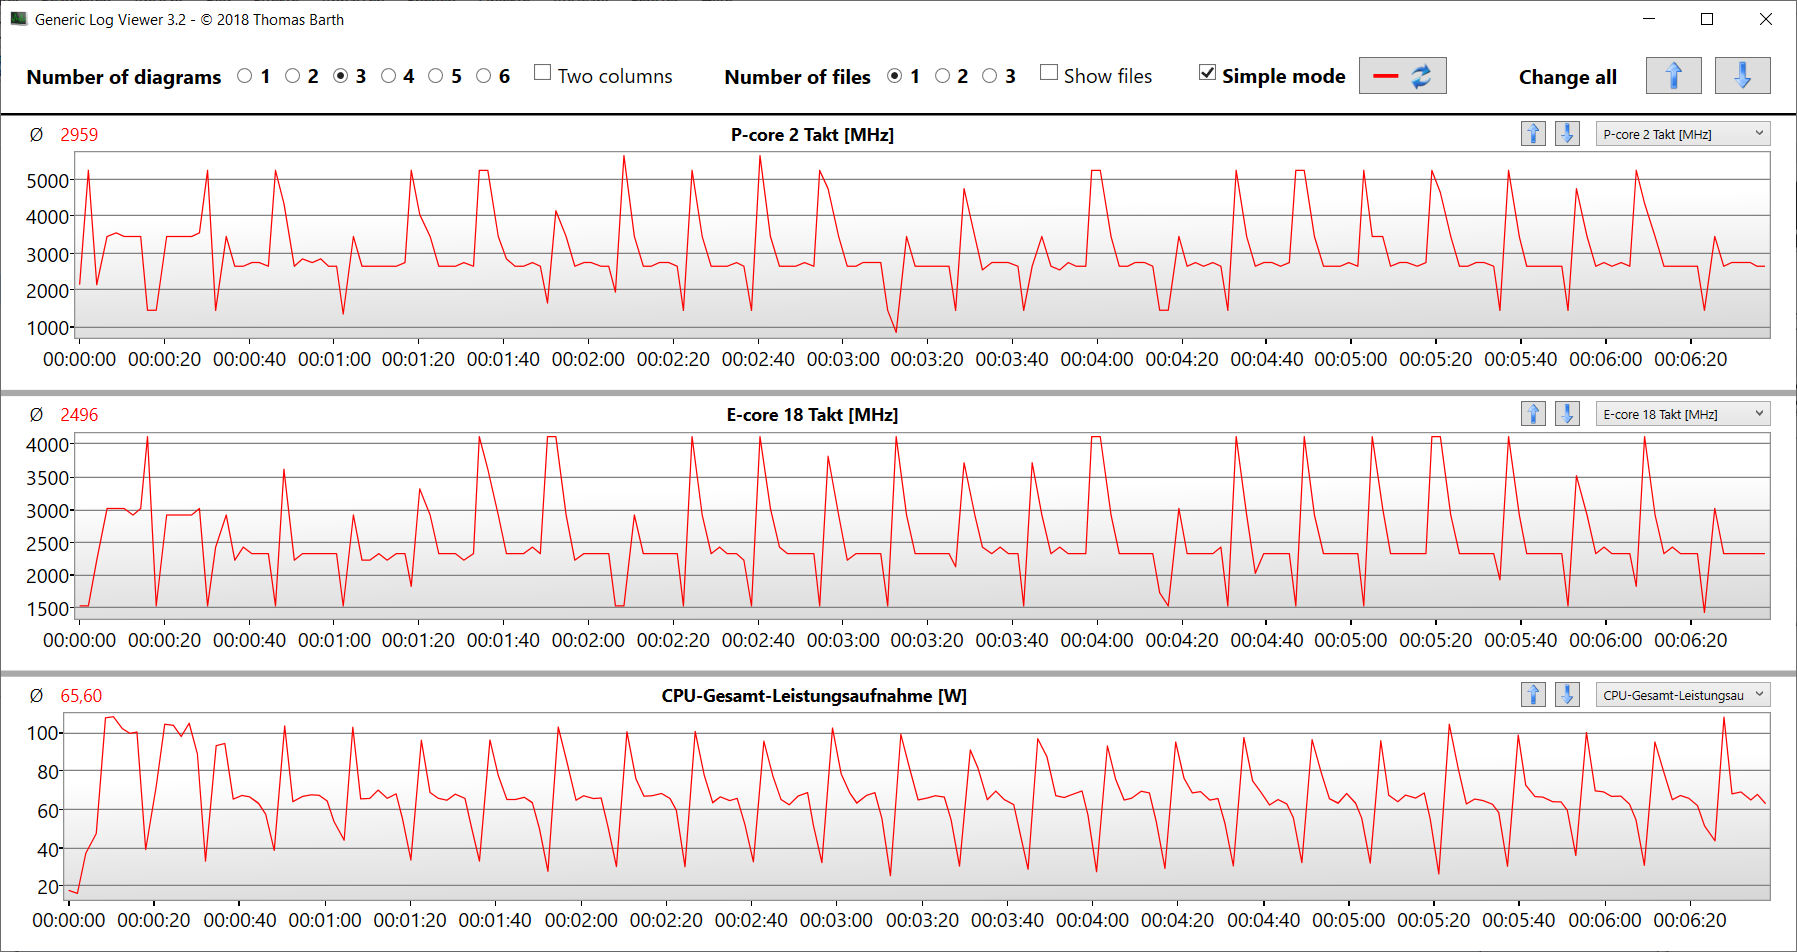
Procesor
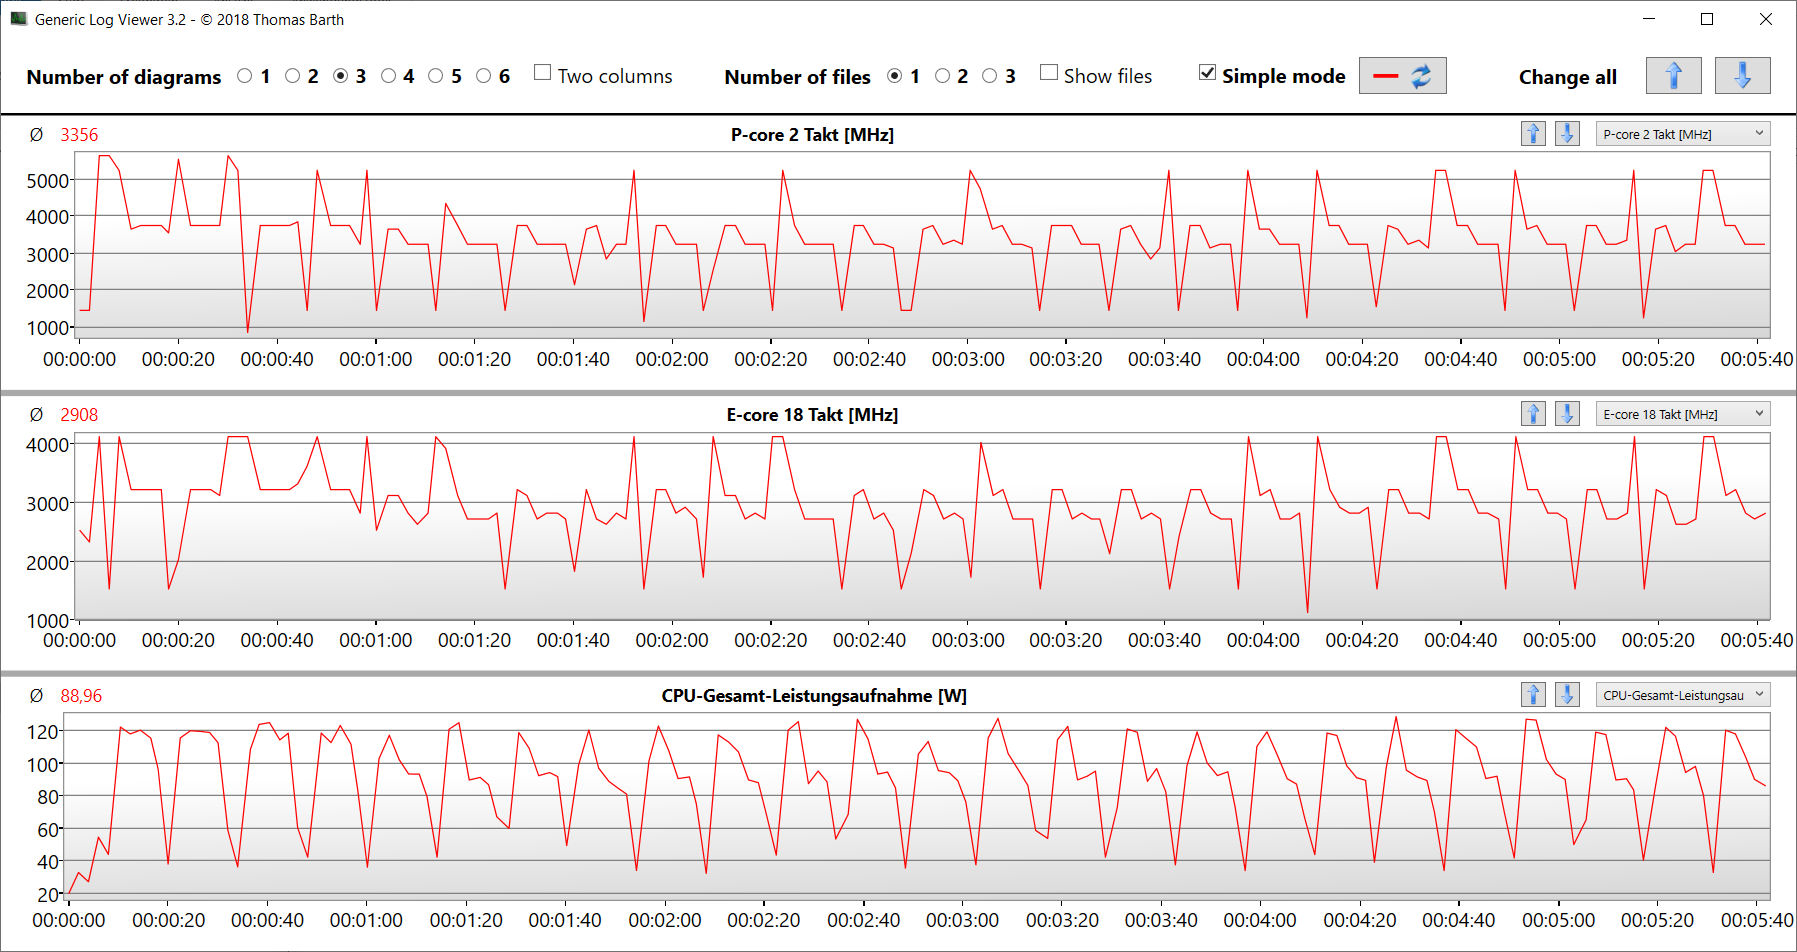
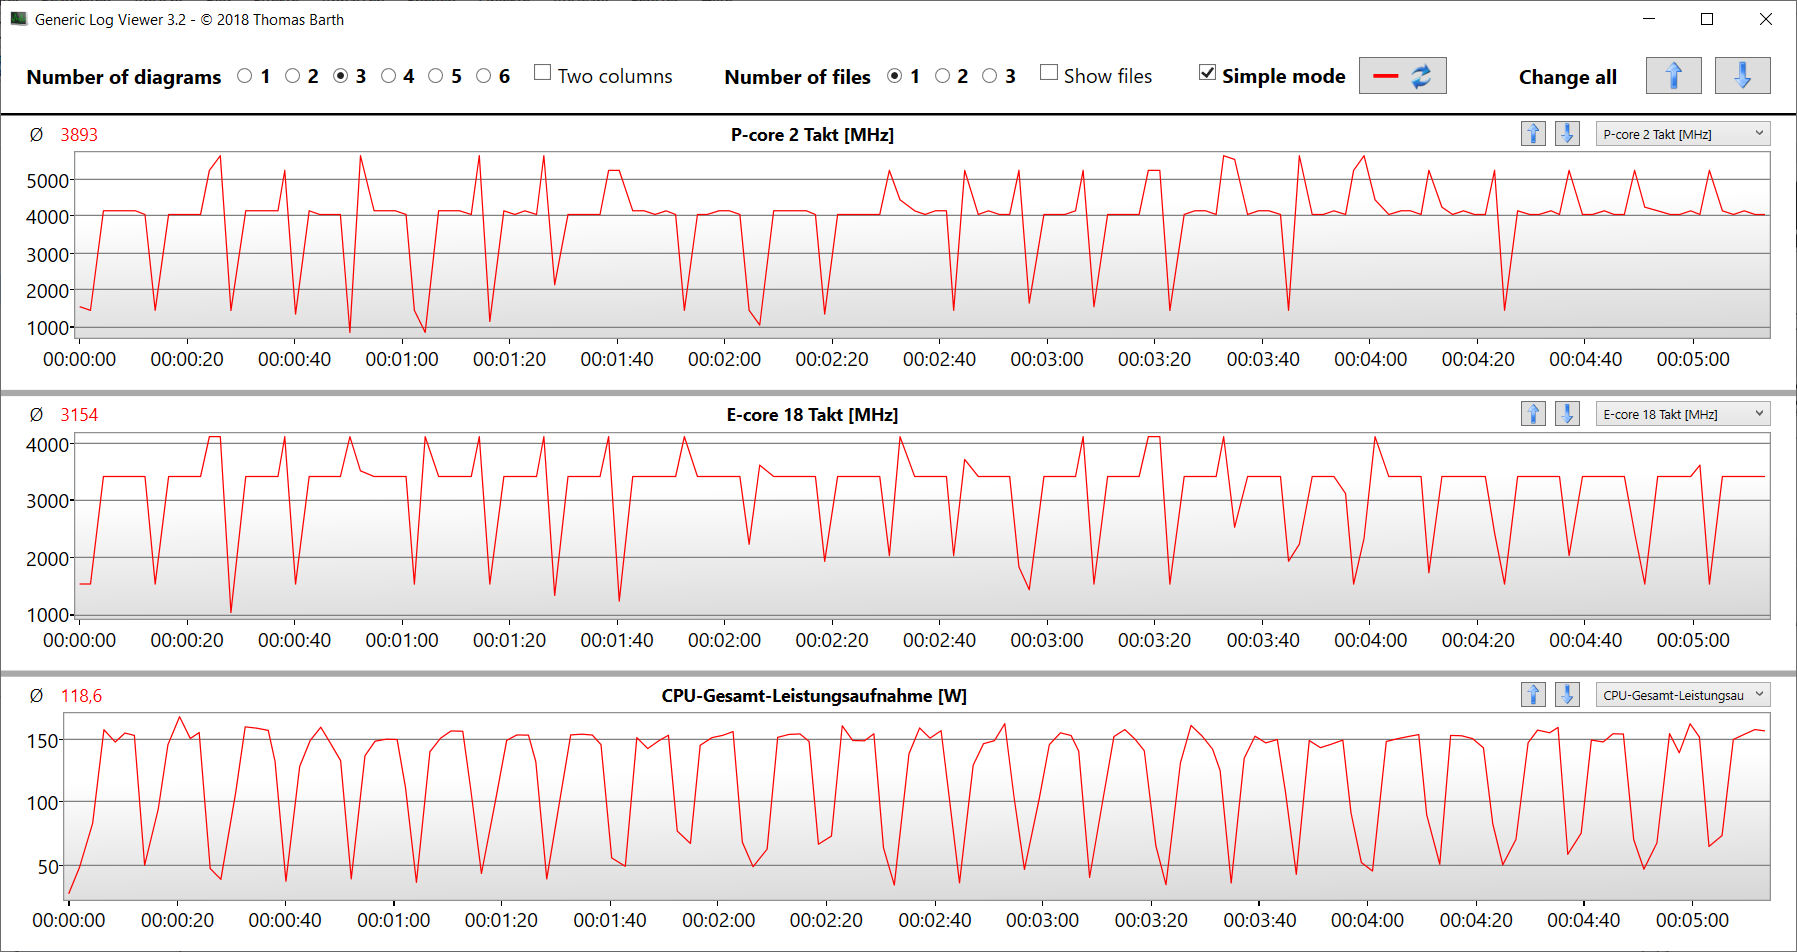
Procesor Core i9-14900HX(Raptor Lake) z 24 rdzeniami CPU (8P + 16E = 32 wątki) osiąga maksymalne częstotliwości taktowania na poziomie 5,8 GHz (P) i 4,1 GHz (E). Ciągłe obciążenie wielowątkowe (CB15 Loop) spowodowało spadek taktowania od czwartego do piątego uruchomienia. Później utrzymywała się na dość stabilnym poziomie. Profile Turbo, Gaming i Creator doprowadziły do konsekwentnie wyższego poziomu wydajności.
Wyniki benchmarków są na równi ze średnią CPU. W trybie bateryjnym jego bardziej istotna wydajność jednowątkowa (187 punktów; CB15) spadła w mniejszym stopniu niż jego wydajność wielowątkowa (1533 punkty; CB15).
Więcej informacji na temat Core i9 znajdą Państwo w naszym artykule analitycznym.
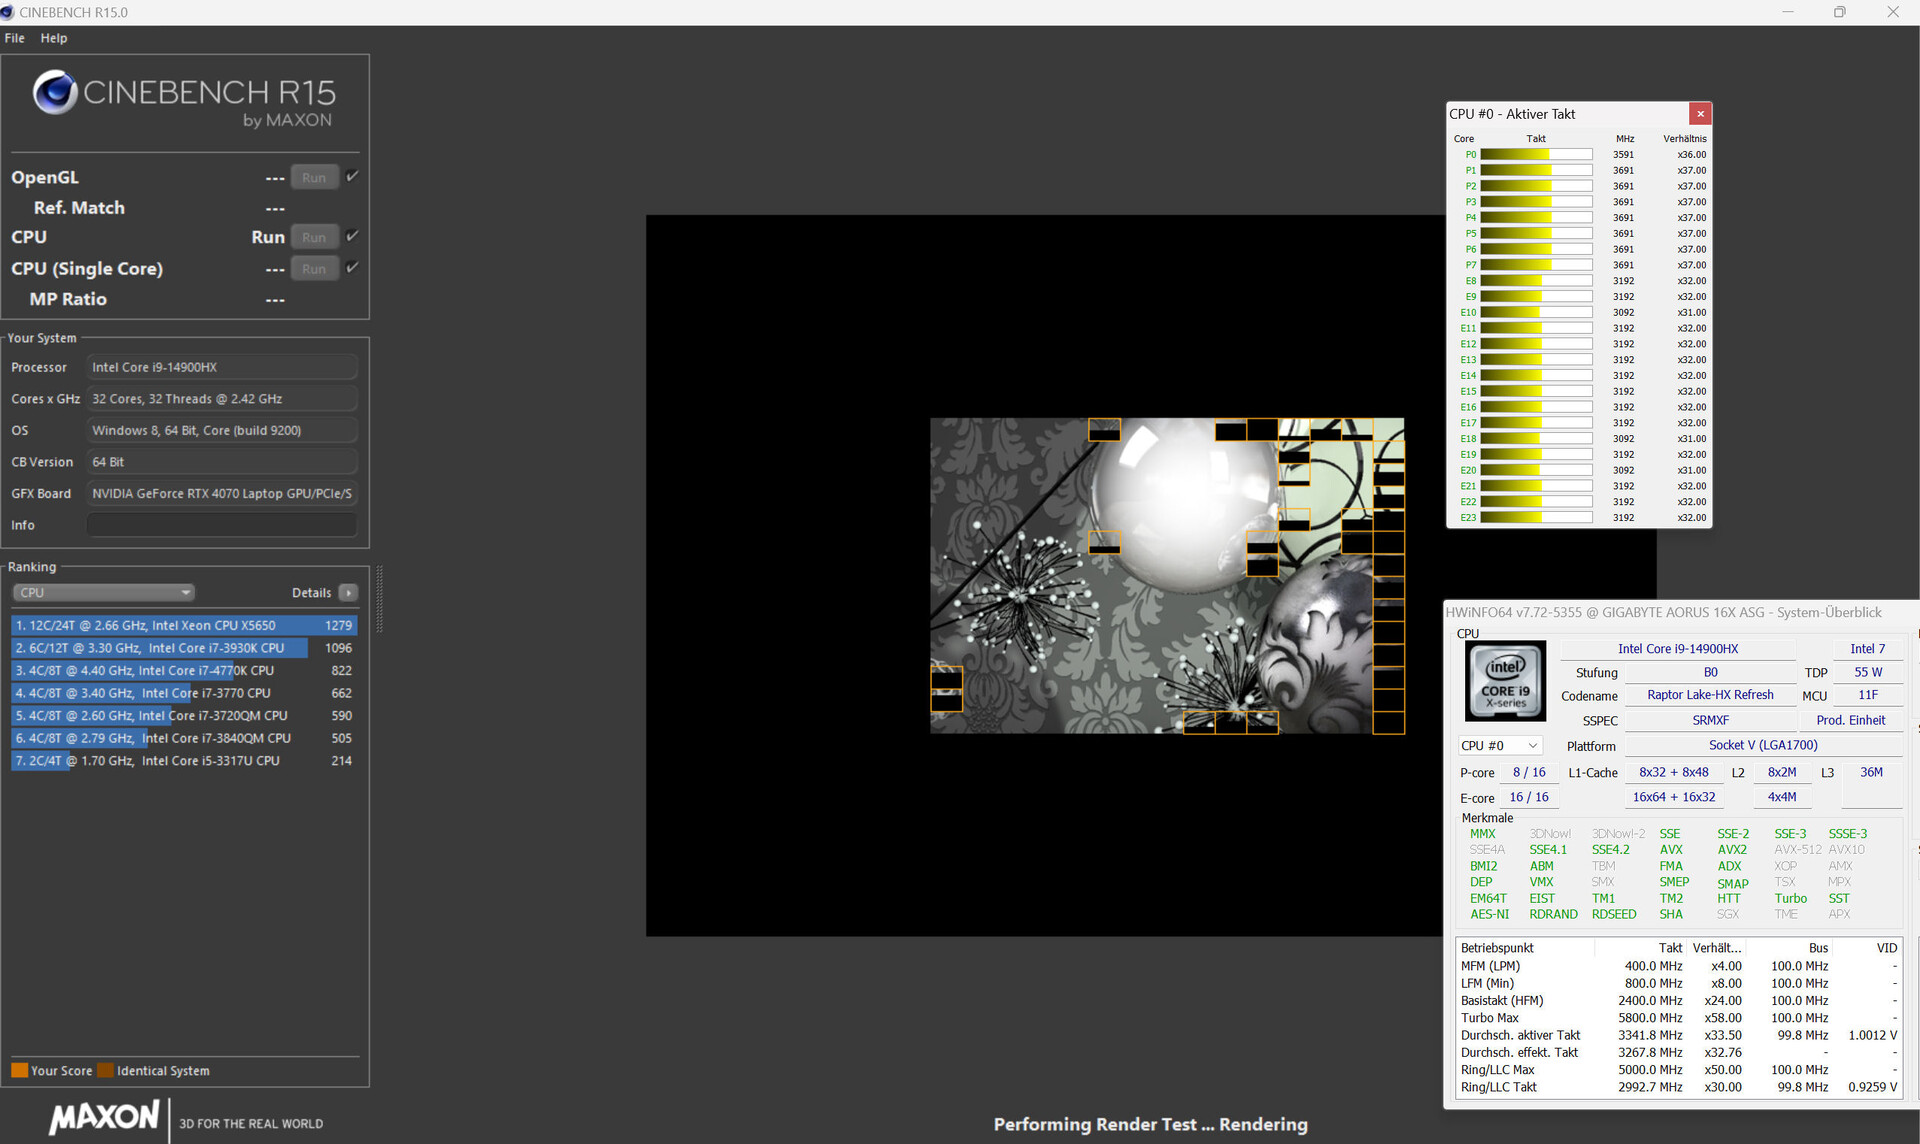
Cinebench R15 Multi continuous test
| Geekbench 6.7 | |
| Multi-Core | |
| Lenovo Legion Pro 5 16IRX9 (6.2.1) | |
| Aorus 16X 2024 (6.2.1, Turbo) | |
| Aorus 16X 2024 (6.2.1) | |
| Przeciętny Intel Core i9-14900HX (13158 - 19665, n=37) | |
| HP Omen Transcend 16-u1095ng (6.2.1) | |
| Średnia w klasie Gaming (6625 - 22104, n=109, ostatnie 2 lata) | |
| Schenker XMG Pro 16 Studio (Mid 23) | |
| Alienware m16 R2 (6.2.1) | |
| Asus TUF Gaming A17 FA707XI-NS94 (6.2.1) | |
| Single-Core | |
| Aorus 16X 2024 (6.2.1, Turbo) | |
| Aorus 16X 2024 (6.2.1) | |
| Przeciętny Intel Core i9-14900HX (2419 - 3129, n=37) | |
| Lenovo Legion Pro 5 16IRX9 (6.2.1) | |
| Średnia w klasie Gaming (1490 - 3259, n=109, ostatnie 2 lata) | |
| HP Omen Transcend 16-u1095ng (6.2.1) | |
| Asus TUF Gaming A17 FA707XI-NS94 (6.2.1) | |
| Schenker XMG Pro 16 Studio (Mid 23) | |
| Alienware m16 R2 (6.2.1) | |
| HWBOT x265 Benchmark v2.2 - 4k Preset | |
| Aorus 16X 2024 (Turbo) | |
| Lenovo Legion Pro 5 16IRX9 | |
| Przeciętny Intel Core i9-14900HX (16.8 - 38.9, n=37) | |
| Średnia w klasie Gaming (11.5 - 44.3, n=108, ostatnie 2 lata) | |
| Aorus 16X 2024 | |
| HP Omen Transcend 16-u1095ng | |
| Asus TUF Gaming A17 FA707XI-NS94 | |
| Alienware m16 R2 | |
| Schenker XMG Pro 16 Studio (Mid 23) | |
| LibreOffice - 20 Documents To PDF | |
| HP Omen Transcend 16-u1095ng (6.3.4.2) | |
| Alienware m16 R2 (6.3.4.2) | |
| Asus TUF Gaming A17 FA707XI-NS94 (6.3.4.2) | |
| Średnia w klasie Gaming (19 - 88.8, n=108, ostatnie 2 lata) | |
| Schenker XMG Pro 16 Studio (Mid 23) | |
| Przeciętny Intel Core i9-14900HX (19 - 85.1, n=37) | |
| Lenovo Legion Pro 5 16IRX9 (6.3.4.2) | |
| Aorus 16X 2024 (6.3.4.2) | |
| Aorus 16X 2024 (6.3.4.2, Turbo) | |
* ... im mniej tym lepiej
AIDA64: FP32 Ray-Trace | FPU Julia | CPU SHA3 | CPU Queen | FPU SinJulia | FPU Mandel | CPU AES | CPU ZLib | FP64 Ray-Trace | CPU PhotoWorxx
| Performance rating | |
| Aorus 16X 2024 | |
| Lenovo Legion Pro 5 16IRX9 | |
| Średnia w klasie Gaming | |
| Przeciętny Intel Core i9-14900HX | |
| Aorus 16X 2024 | |
| Asus TUF Gaming A17 FA707XI-NS94 | |
| HP Omen Transcend 16-u1095ng | |
| Schenker XMG Pro 16 Studio (Mid 23) | |
| Alienware m16 R2 | |
| AIDA64 / FP32 Ray-Trace | |
| Średnia w klasie Gaming (10227 - 85542, n=107, ostatnie 2 lata) | |
| Asus TUF Gaming A17 FA707XI-NS94 (v6.92.6600) | |
| Aorus 16X 2024 (v6.92.6600, Turbo) | |
| Lenovo Legion Pro 5 16IRX9 (v6.92.6600) | |
| Przeciętny Intel Core i9-14900HX (13098 - 33474, n=36) | |
| Aorus 16X 2024 (v6.92.6600) | |
| Alienware m16 R2 (v6.92.6600) | |
| HP Omen Transcend 16-u1095ng (v6.92.6600) | |
| Schenker XMG Pro 16 Studio (Mid 23) (v6.75.6100) | |
| AIDA64 / FPU Julia | |
| Średnia w klasie Gaming (51376 - 238426, n=107, ostatnie 2 lata) | |
| Aorus 16X 2024 (v6.92.6600, Turbo) | |
| Lenovo Legion Pro 5 16IRX9 (v6.92.6600) | |
| Przeciętny Intel Core i9-14900HX (67573 - 166040, n=36) | |
| Asus TUF Gaming A17 FA707XI-NS94 (v6.92.6600) | |
| Aorus 16X 2024 (v6.92.6600) | |
| Alienware m16 R2 (v6.92.6600) | |
| HP Omen Transcend 16-u1095ng (v6.92.6600) | |
| Schenker XMG Pro 16 Studio (Mid 23) (v6.75.6100) | |
| AIDA64 / CPU SHA3 | |
| Aorus 16X 2024 (v6.92.6600, Turbo) | |
| Lenovo Legion Pro 5 16IRX9 (v6.92.6600) | |
| Średnia w klasie Gaming (2180 - 9817, n=107, ostatnie 2 lata) | |
| Przeciętny Intel Core i9-14900HX (3589 - 7979, n=36) | |
| Aorus 16X 2024 (v6.92.6600) | |
| Asus TUF Gaming A17 FA707XI-NS94 (v6.92.6600) | |
| HP Omen Transcend 16-u1095ng (v6.92.6600) | |
| Alienware m16 R2 (v6.92.6600) | |
| Schenker XMG Pro 16 Studio (Mid 23) (v6.75.6100) | |
| AIDA64 / CPU Queen | |
| Lenovo Legion Pro 5 16IRX9 (v6.92.6600) | |
| Aorus 16X 2024 (v6.92.6600, Turbo) | |
| Aorus 16X 2024 (v6.92.6600) | |
| Przeciętny Intel Core i9-14900HX (118405 - 148966, n=36) | |
| Asus TUF Gaming A17 FA707XI-NS94 (v6.92.6600) | |
| HP Omen Transcend 16-u1095ng (v6.92.6600) | |
| Średnia w klasie Gaming (49785 - 173351, n=98, ostatnie 2 lata) | |
| Schenker XMG Pro 16 Studio (Mid 23) (v6.75.6100) | |
| Alienware m16 R2 (v6.92.6600) | |
| AIDA64 / FPU SinJulia | |
| Aorus 16X 2024 (v6.92.6600, Turbo) | |
| Asus TUF Gaming A17 FA707XI-NS94 (v6.92.6600) | |
| Lenovo Legion Pro 5 16IRX9 (v6.92.6600) | |
| Przeciętny Intel Core i9-14900HX (10475 - 18517, n=36) | |
| Aorus 16X 2024 (v6.92.6600) | |
| Średnia w klasie Gaming (4424 - 33636, n=107, ostatnie 2 lata) | |
| HP Omen Transcend 16-u1095ng (v6.92.6600) | |
| Alienware m16 R2 (v6.92.6600) | |
| Schenker XMG Pro 16 Studio (Mid 23) (v6.75.6100) | |
| AIDA64 / FPU Mandel | |
| Średnia w klasie Gaming (25115 - 128721, n=107, ostatnie 2 lata) | |
| Aorus 16X 2024 (v6.92.6600, Turbo) | |
| Asus TUF Gaming A17 FA707XI-NS94 (v6.92.6600) | |
| Lenovo Legion Pro 5 16IRX9 (v6.92.6600) | |
| Przeciętny Intel Core i9-14900HX (32543 - 83662, n=36) | |
| Aorus 16X 2024 (v6.92.6600) | |
| Alienware m16 R2 (v6.92.6600) | |
| HP Omen Transcend 16-u1095ng (v6.92.6600) | |
| Schenker XMG Pro 16 Studio (Mid 23) (v6.75.6100) | |
| AIDA64 / CPU AES | |
| Schenker XMG Pro 16 Studio (Mid 23) (v6.75.6100) | |
| Przeciętny Intel Core i9-14900HX (86964 - 241777, n=36) | |
| Aorus 16X 2024 (v6.92.6600, Turbo) | |
| Lenovo Legion Pro 5 16IRX9 (v6.92.6600) | |
| Aorus 16X 2024 (v6.92.6600) | |
| Średnia w klasie Gaming (39258 - 247074, n=107, ostatnie 2 lata) | |
| Asus TUF Gaming A17 FA707XI-NS94 (v6.92.6600) | |
| HP Omen Transcend 16-u1095ng (v6.92.6600) | |
| Alienware m16 R2 (v6.92.6600) | |
| AIDA64 / CPU ZLib | |
| Aorus 16X 2024 (v6.92.6600, Turbo) | |
| Lenovo Legion Pro 5 16IRX9 (v6.92.6600) | |
| Przeciętny Intel Core i9-14900HX (1054 - 2292, n=36) | |
| Aorus 16X 2024 (v6.92.6600) | |
| Średnia w klasie Gaming (574 - 2531, n=107, ostatnie 2 lata) | |
| HP Omen Transcend 16-u1095ng (v6.92.6600) | |
| Alienware m16 R2 (v6.92.6600) | |
| Asus TUF Gaming A17 FA707XI-NS94 (v6.92.6600) | |
| Schenker XMG Pro 16 Studio (Mid 23) (v6.75.6100) | |
| AIDA64 / FP64 Ray-Trace | |
| Średnia w klasie Gaming (5509 - 45446, n=107, ostatnie 2 lata) | |
| Asus TUF Gaming A17 FA707XI-NS94 (v6.92.6600) | |
| Aorus 16X 2024 (v6.92.6600, Turbo) | |
| Lenovo Legion Pro 5 16IRX9 (v6.92.6600) | |
| Przeciętny Intel Core i9-14900HX (6809 - 18349, n=36) | |
| Aorus 16X 2024 (v6.92.6600) | |
| Alienware m16 R2 (v6.92.6600) | |
| HP Omen Transcend 16-u1095ng (v6.92.6600) | |
| Schenker XMG Pro 16 Studio (Mid 23) (v6.75.6100) | |
| AIDA64 / CPU PhotoWorxx | |
| Lenovo Legion Pro 5 16IRX9 (v6.92.6600) | |
| HP Omen Transcend 16-u1095ng (v6.92.6600) | |
| Aorus 16X 2024 (v6.92.6600, Turbo) | |
| Aorus 16X 2024 (v6.92.6600) | |
| Schenker XMG Pro 16 Studio (Mid 23) (v6.75.6100) | |
| Przeciętny Intel Core i9-14900HX (23903 - 54702, n=36) | |
| Średnia w klasie Gaming (12271 - 89891, n=107, ostatnie 2 lata) | |
| Alienware m16 R2 (v6.92.6600) | |
| Asus TUF Gaming A17 FA707XI-NS94 (v6.92.6600) | |
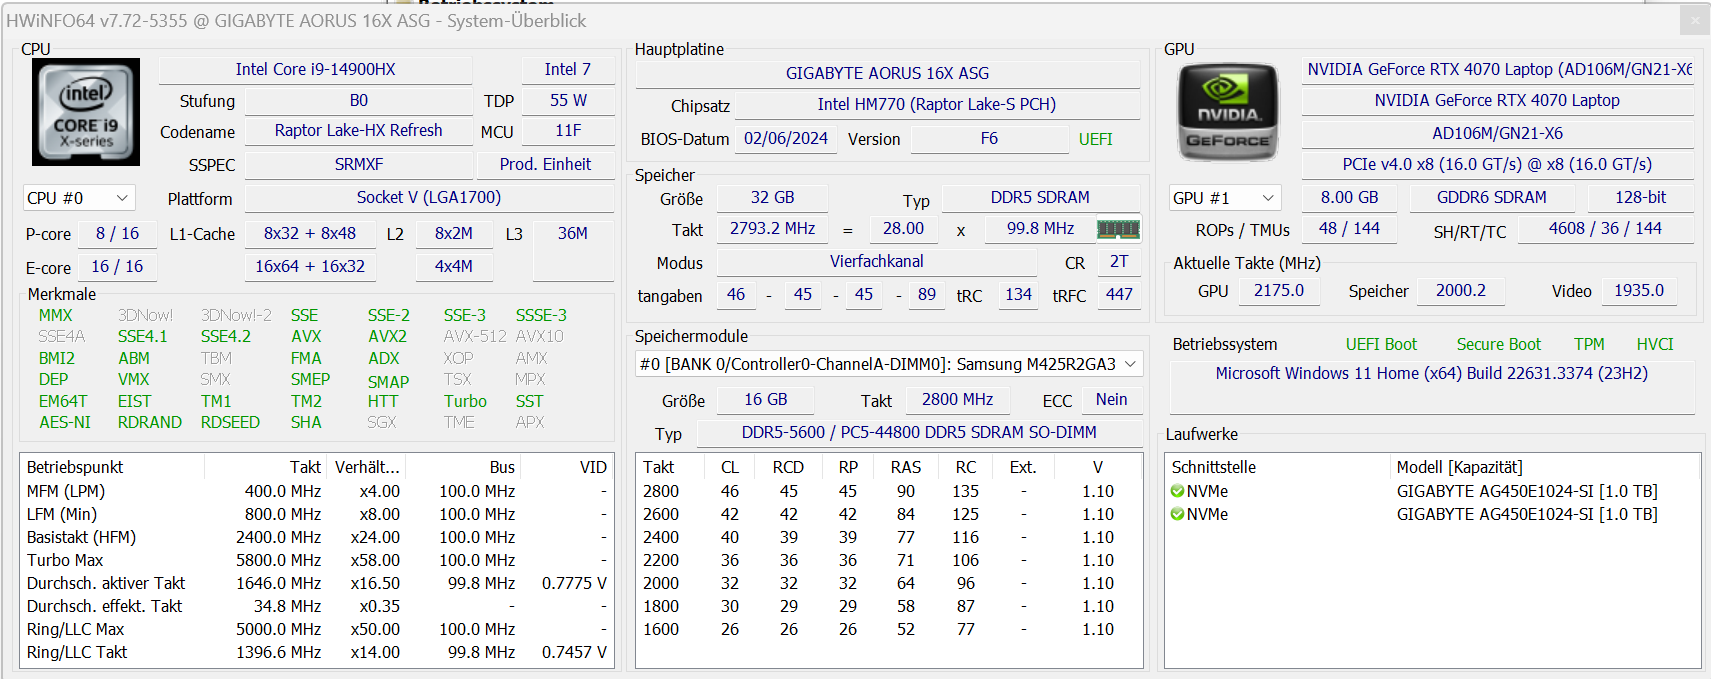
Wydajność systemu
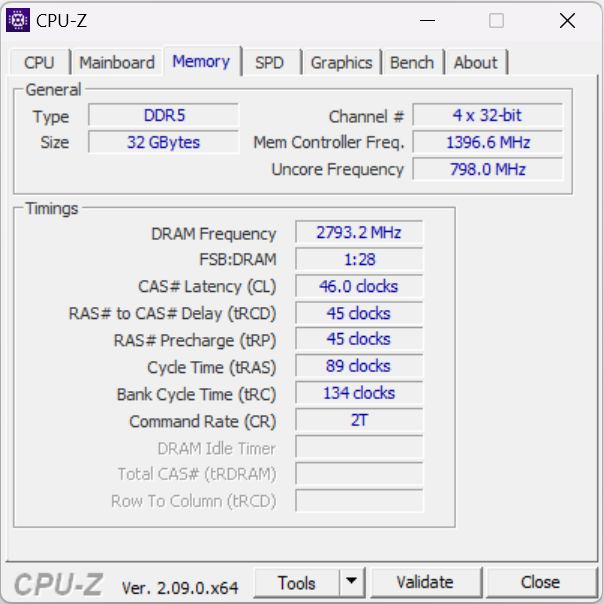
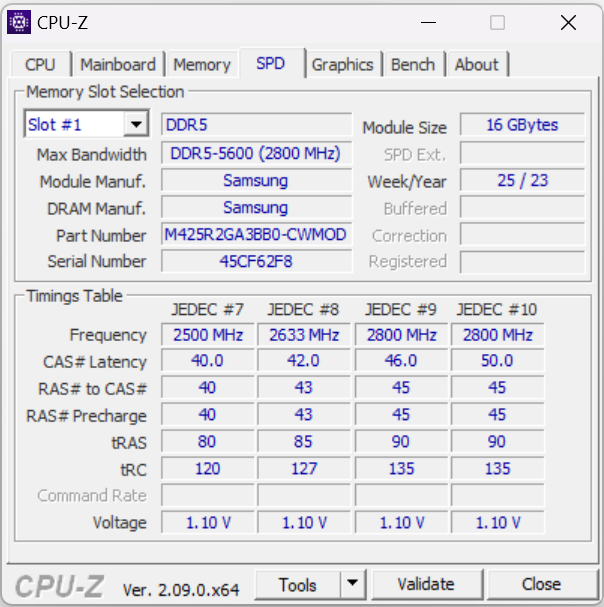
Płynnie działającemu systemowi nie brakuje mocy obliczeniowej. Gry, streaming i rendering nie stanowią dla laptopa większego wyzwania. Prędkości transferu pamięci RAM są na normalnym poziomie dla pamięci DDR5-5600 RAM.
CrossMark: Overall | Productivity | Creativity | Responsiveness
WebXPRT 3: Overall
WebXPRT 4: Overall
Mozilla Kraken 1.1: Total
| PCMark 10 / Score | |
| Lenovo Legion Pro 5 16IRX9 | |
| Aorus 16X 2024 | |
| Średnia w klasie Gaming (5828 - 11574, n=94, ostatnie 2 lata) | |
| Przeciętny Intel Core i9-14900HX, NVIDIA GeForce RTX 4070 Laptop GPU (7768 - 8550, n=8) | |
| Asus TUF Gaming A17 FA707XI-NS94 | |
| Schenker XMG Pro 16 Studio (Mid 23) | |
| HP Omen Transcend 16-u1095ng | |
| Alienware m16 R2 | |
| PCMark 10 / Essentials | |
| Schenker XMG Pro 16 Studio (Mid 23) | |
| Lenovo Legion Pro 5 16IRX9 | |
| Aorus 16X 2024 | |
| Asus TUF Gaming A17 FA707XI-NS94 | |
| Przeciętny Intel Core i9-14900HX, NVIDIA GeForce RTX 4070 Laptop GPU (10104 - 11815, n=8) | |
| Średnia w klasie Gaming (8810 - 12600, n=98, ostatnie 2 lata) | |
| HP Omen Transcend 16-u1095ng | |
| Alienware m16 R2 | |
| PCMark 10 / Productivity | |
| Aorus 16X 2024 | |
| Średnia w klasie Gaming (6845 - 18766, n=96, ostatnie 2 lata) | |
| Przeciętny Intel Core i9-14900HX, NVIDIA GeForce RTX 4070 Laptop GPU (9577 - 11103, n=8) | |
| Schenker XMG Pro 16 Studio (Mid 23) | |
| HP Omen Transcend 16-u1095ng | |
| Lenovo Legion Pro 5 16IRX9 | |
| Asus TUF Gaming A17 FA707XI-NS94 | |
| Alienware m16 R2 | |
| PCMark 10 / Digital Content Creation | |
| Lenovo Legion Pro 5 16IRX9 | |
| Średnia w klasie Gaming (7602 - 19657, n=96, ostatnie 2 lata) | |
| Asus TUF Gaming A17 FA707XI-NS94 | |
| Przeciętny Intel Core i9-14900HX, NVIDIA GeForce RTX 4070 Laptop GPU (12114 - 14827, n=8) | |
| Aorus 16X 2024 | |
| Alienware m16 R2 | |
| HP Omen Transcend 16-u1095ng | |
| Schenker XMG Pro 16 Studio (Mid 23) | |
| CrossMark / Overall | |
| Aorus 16X 2024 | |
| Przeciętny Intel Core i9-14900HX, NVIDIA GeForce RTX 4070 Laptop GPU (2002 - 2312, n=7) | |
| Lenovo Legion Pro 5 16IRX9 | |
| Średnia w klasie Gaming (1366 - 2409, n=96, ostatnie 2 lata) | |
| Schenker XMG Pro 16 Studio (Mid 23) | |
| Asus TUF Gaming A17 FA707XI-NS94 | |
| Alienware m16 R2 | |
| CrossMark / Productivity | |
| Aorus 16X 2024 | |
| Przeciętny Intel Core i9-14900HX, NVIDIA GeForce RTX 4070 Laptop GPU (1827 - 2191, n=7) | |
| Schenker XMG Pro 16 Studio (Mid 23) | |
| Średnia w klasie Gaming (1386 - 2254, n=96, ostatnie 2 lata) | |
| Lenovo Legion Pro 5 16IRX9 | |
| Asus TUF Gaming A17 FA707XI-NS94 | |
| Alienware m16 R2 | |
| CrossMark / Creativity | |
| Aorus 16X 2024 | |
| Przeciętny Intel Core i9-14900HX, NVIDIA GeForce RTX 4070 Laptop GPU (2258 - 2458, n=7) | |
| Lenovo Legion Pro 5 16IRX9 | |
| Średnia w klasie Gaming (1343 - 2729, n=96, ostatnie 2 lata) | |
| Schenker XMG Pro 16 Studio (Mid 23) | |
| Asus TUF Gaming A17 FA707XI-NS94 | |
| Alienware m16 R2 | |
| CrossMark / Responsiveness | |
| Aorus 16X 2024 | |
| Przeciętny Intel Core i9-14900HX, NVIDIA GeForce RTX 4070 Laptop GPU (1734 - 2330, n=7) | |
| Schenker XMG Pro 16 Studio (Mid 23) | |
| Lenovo Legion Pro 5 16IRX9 | |
| Średnia w klasie Gaming (1226 - 2334, n=96, ostatnie 2 lata) | |
| Alienware m16 R2 | |
| Asus TUF Gaming A17 FA707XI-NS94 | |
| WebXPRT 3 / Overall | |
| HP Omen Transcend 16-u1095ng | |
| Aorus 16X 2024 | |
| Lenovo Legion Pro 5 16IRX9 | |
| Przeciętny Intel Core i9-14900HX, NVIDIA GeForce RTX 4070 Laptop GPU (269 - 342, n=8) | |
| Schenker XMG Pro 16 Studio (Mid 23) | |
| Asus TUF Gaming A17 FA707XI-NS94 | |
| Średnia w klasie Gaming (242 - 532, n=99, ostatnie 2 lata) | |
| Alienware m16 R2 | |
| WebXPRT 4 / Overall | |
| Przeciętny Intel Core i9-14900HX, NVIDIA GeForce RTX 4070 Laptop GPU (291 - 304, n=6) | |
| Lenovo Legion Pro 5 16IRX9 | |
| Średnia w klasie Gaming (176.4 - 354, n=99, ostatnie 2 lata) | |
| Asus TUF Gaming A17 FA707XI-NS94 | |
| Alienware m16 R2 | |
| Mozilla Kraken 1.1 / Total | |
| Alienware m16 R2 | |
| Schenker XMG Pro 16 Studio (Mid 23) | |
| Asus TUF Gaming A17 FA707XI-NS94 | |
| Średnia w klasie Gaming (391 - 590, n=104, ostatnie 2 lata) | |
| Lenovo Legion Pro 5 16IRX9 | |
| Przeciętny Intel Core i9-14900HX, NVIDIA GeForce RTX 4070 Laptop GPU (431 - 469, n=8) | |
| HP Omen Transcend 16-u1095ng | |
| Aorus 16X 2024 | |
* ... im mniej tym lepiej
| PCMark 10 Score | 8389 pkt. | |
Pomoc | ||
| AIDA64 / Memory Copy | |
| Lenovo Legion Pro 5 16IRX9 | |
| Aorus 16X 2024 | |
| HP Omen Transcend 16-u1095ng | |
| Przeciętny Intel Core i9-14900HX (38028 - 83392, n=36) | |
| Średnia w klasie Gaming (21750 - 129946, n=107, ostatnie 2 lata) | |
| Schenker XMG Pro 16 Studio (Mid 23) | |
| Alienware m16 R2 | |
| Asus TUF Gaming A17 FA707XI-NS94 | |
| AIDA64 / Memory Read | |
| Aorus 16X 2024 | |
| Lenovo Legion Pro 5 16IRX9 | |
| HP Omen Transcend 16-u1095ng | |
| Przeciętny Intel Core i9-14900HX (43306 - 87568, n=36) | |
| Alienware m16 R2 | |
| Schenker XMG Pro 16 Studio (Mid 23) | |
| Średnia w klasie Gaming (22956 - 118858, n=107, ostatnie 2 lata) | |
| Asus TUF Gaming A17 FA707XI-NS94 | |
| AIDA64 / Memory Write | |
| HP Omen Transcend 16-u1095ng | |
| Aorus 16X 2024 | |
| Lenovo Legion Pro 5 16IRX9 | |
| Średnia w klasie Gaming (22297 - 135096, n=107, ostatnie 2 lata) | |
| Asus TUF Gaming A17 FA707XI-NS94 | |
| Przeciętny Intel Core i9-14900HX (37146 - 80589, n=36) | |
| Schenker XMG Pro 16 Studio (Mid 23) | |
| Alienware m16 R2 | |
| AIDA64 / Memory Latency | |
| Alienware m16 R2 | |
| Średnia w klasie Gaming (75.3 - 259, n=107, ostatnie 2 lata) | |
| Asus TUF Gaming A17 FA707XI-NS94 | |
| Schenker XMG Pro 16 Studio (Mid 23) | |
| HP Omen Transcend 16-u1095ng | |
| Przeciętny Intel Core i9-14900HX (76.1 - 105, n=36) | |
| Lenovo Legion Pro 5 16IRX9 | |
| Aorus 16X 2024 | |
* ... im mniej tym lepiej
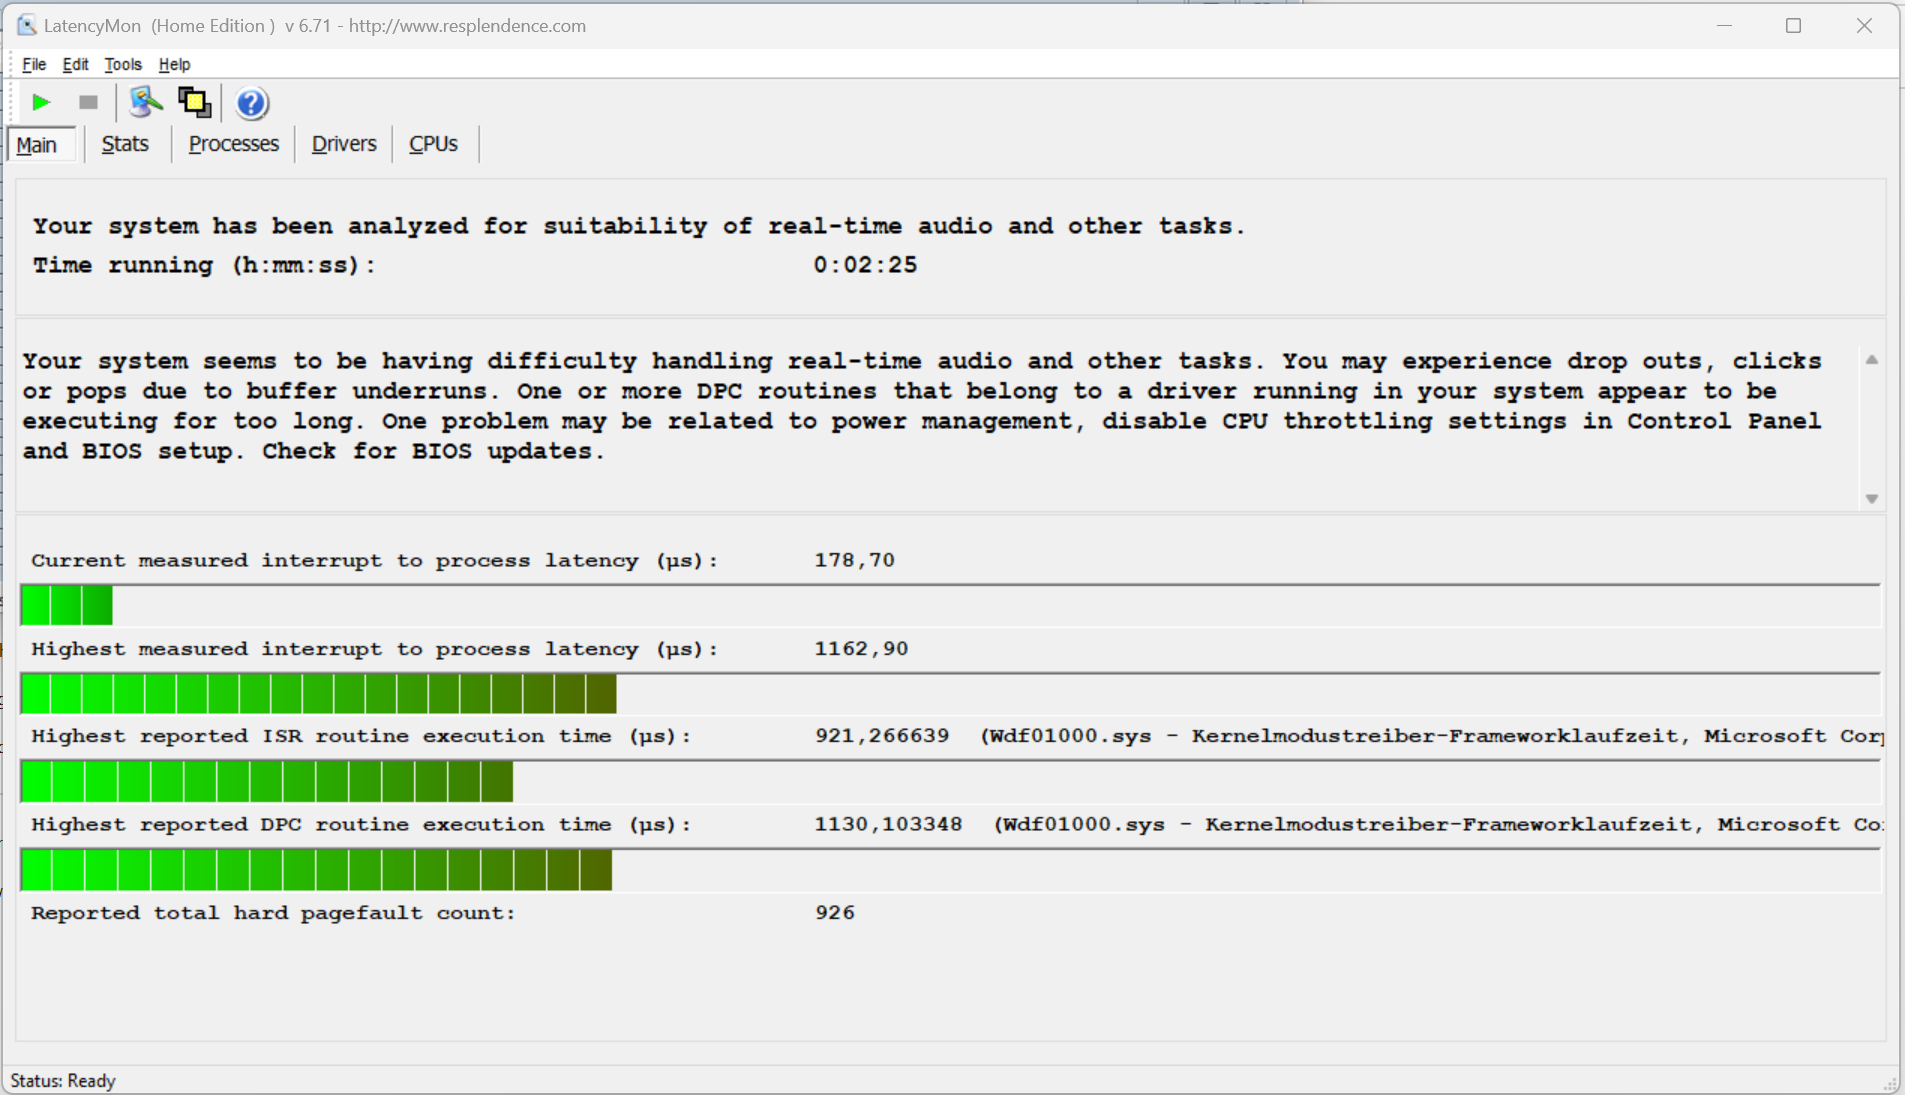
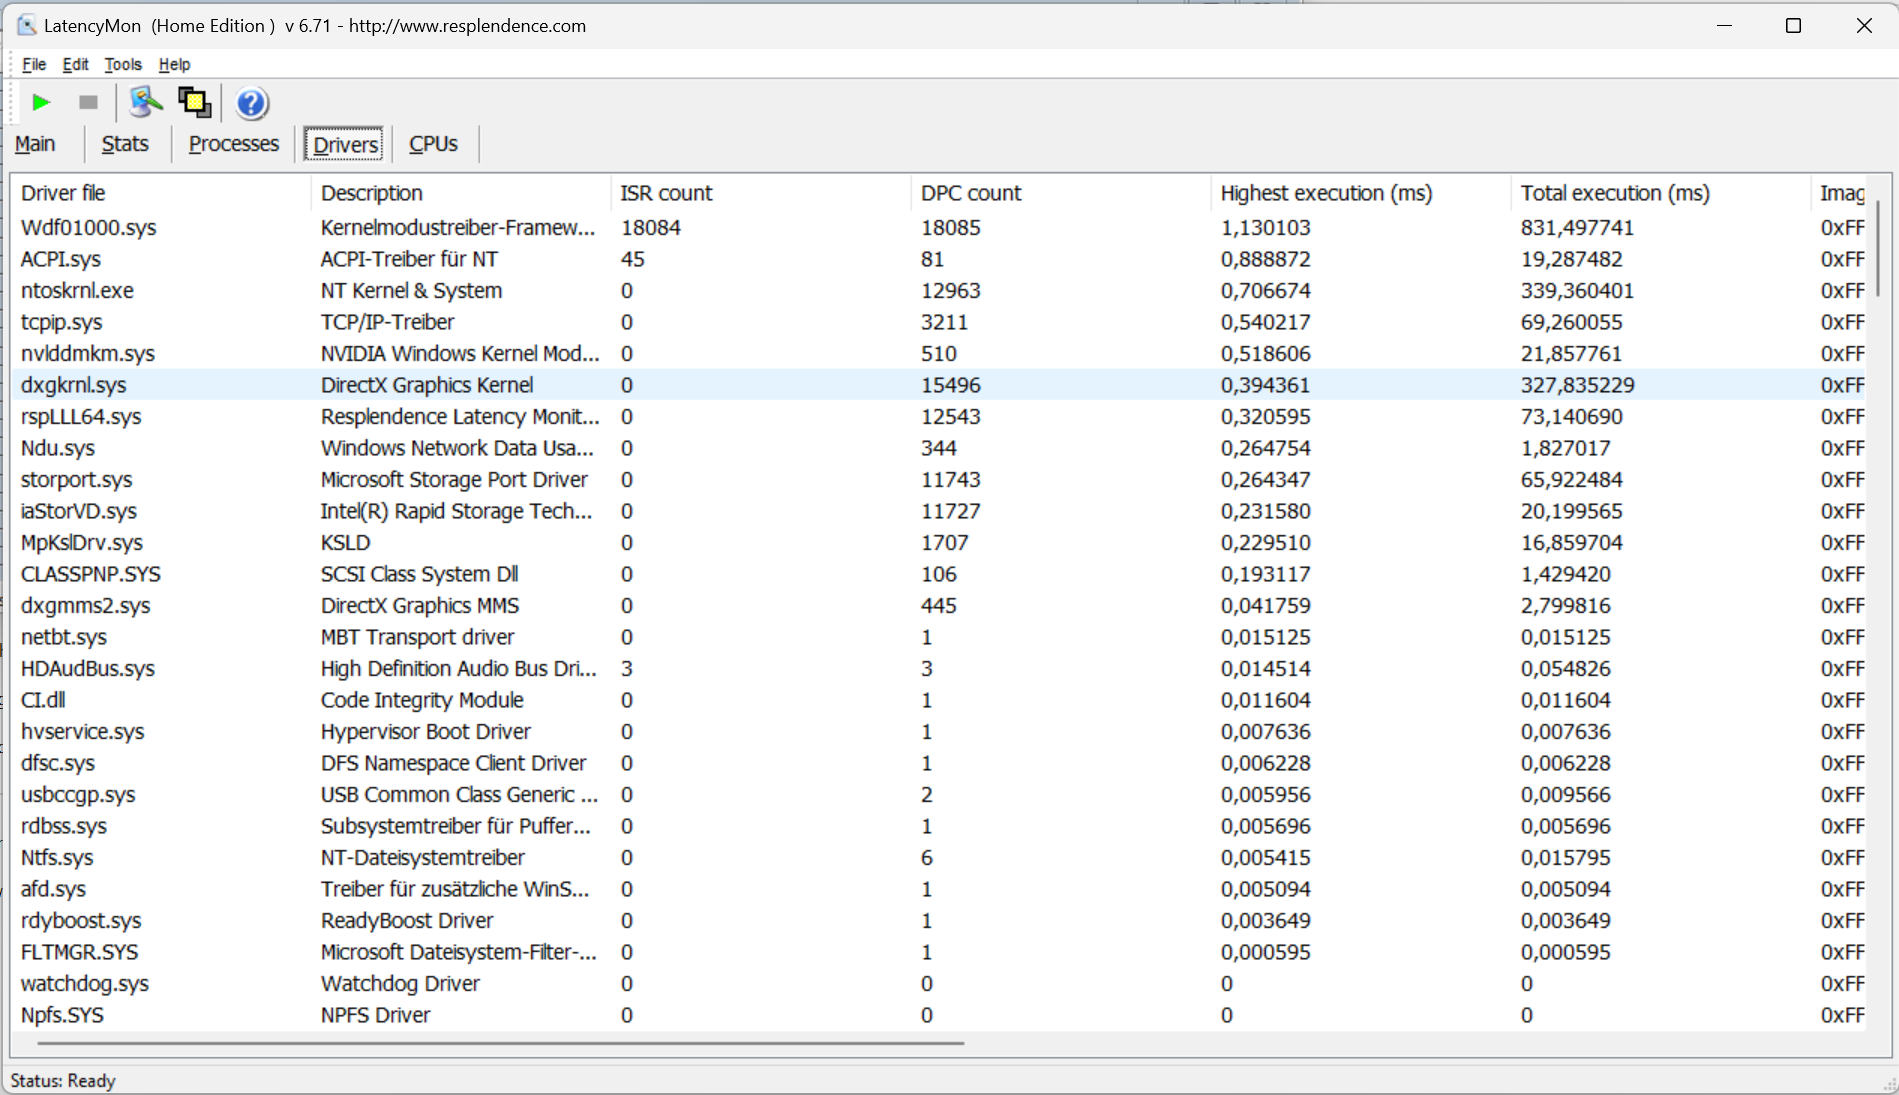
Opóźnienia DPC
Standardowy test Latency Monitor (surfowanie po sieci, odtwarzanie wideo 4k, wysokie obciążenie Prime95) ujawnił pewne anomalie. System nie wydaje się być odpowiedni do edycji wideo i audio w czasie rzeczywistym. Przyszłe aktualizacje oprogramowania mogą doprowadzić do poprawy lub nawet pogorszenia wydajności.
| DPC Latencies / LatencyMon - interrupt to process latency (max), Web, Youtube, Prime95 | |
| Alienware m16 R2 | |
| Schenker XMG Pro 16 Studio (Mid 23) | |
| Asus TUF Gaming A17 FA707XI-NS94 | |
| HP Omen Transcend 16-u1095ng | |
| Aorus 16X 2024 | |
| Lenovo Legion Pro 5 16IRX9 | |
* ... im mniej tym lepiej
Urządzenia pamięci masowej
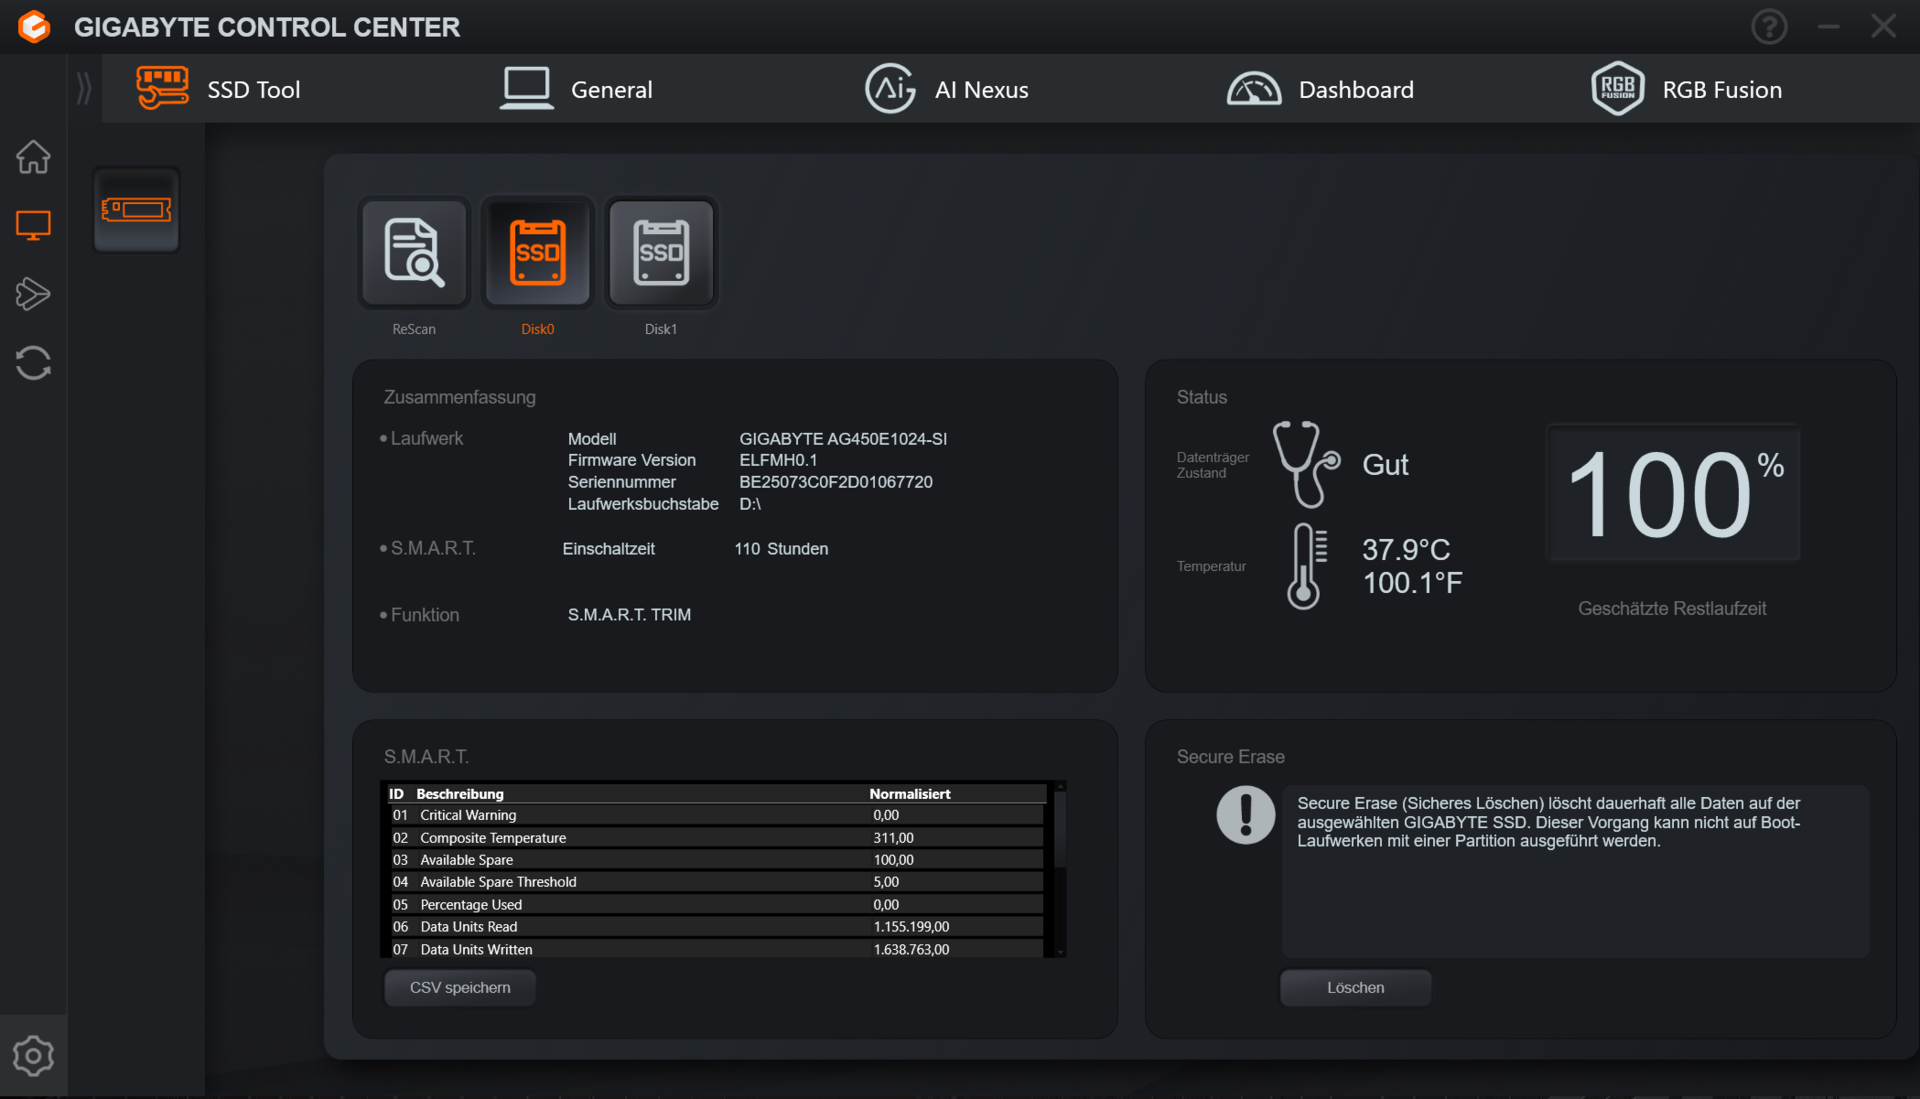
Model 16X wyposażono w dwa dyski SSD PCIe 4 o pojemności 1 TB każdy (M.2-2280) - nie tworzą one macierzy RAID. Jeden dysk SSD służy jako dysk systemowy, a drugi jako magazyn danych - oba osiągają bardzo dobre prędkości przesyłu danych. Nie odnotowaliśmy żadnych spadków spowodowanych dławieniem termicznym.
Dysk 16X generalnie obsługuje macierz RAID. Jednak najpierw trzeba aktywować odpowiednią opcję w BIOS-ie, a następnie ponownie zainstalować system Windows. Procedura ta nie jest zalecana dla osób niedoświadczonych.

* ... im mniej tym lepiej
Reading continuous performance: DiskSpd Read Loop, Queue Depth 8
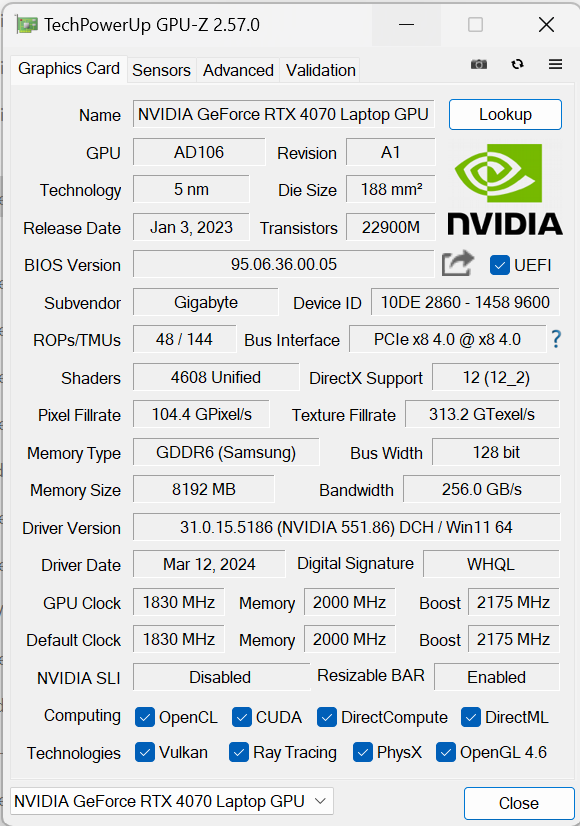
Karta graficzna
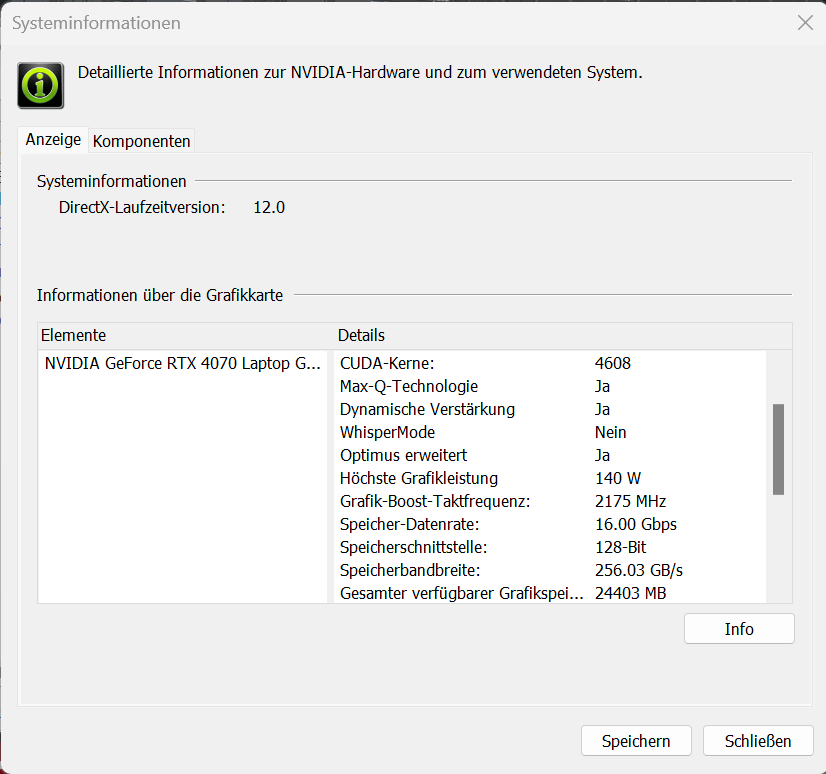
Gigabyte ustawił zainstalowane GeForce RTX 4070na 140 W (115 W + 25 W Dynamic Boost) - więcej nie zostało określone przez Nvidię. GPU ma do dyspozycji 8 GB pamięci VRAM (GDDR6) - trochę za mało jak na dzisiejsze wymagania. Jego wyniki w testach porównawczych były nieco powyżej średniej RTX-4070(Standard), a mocniejsze profile zapewniają co najwyżej niewielki wzrost. Przełączanie pomiędzy dGPU i Optimus nie wymaga restartu systemu. Zaawansowany Optimus jest obsługiwany.

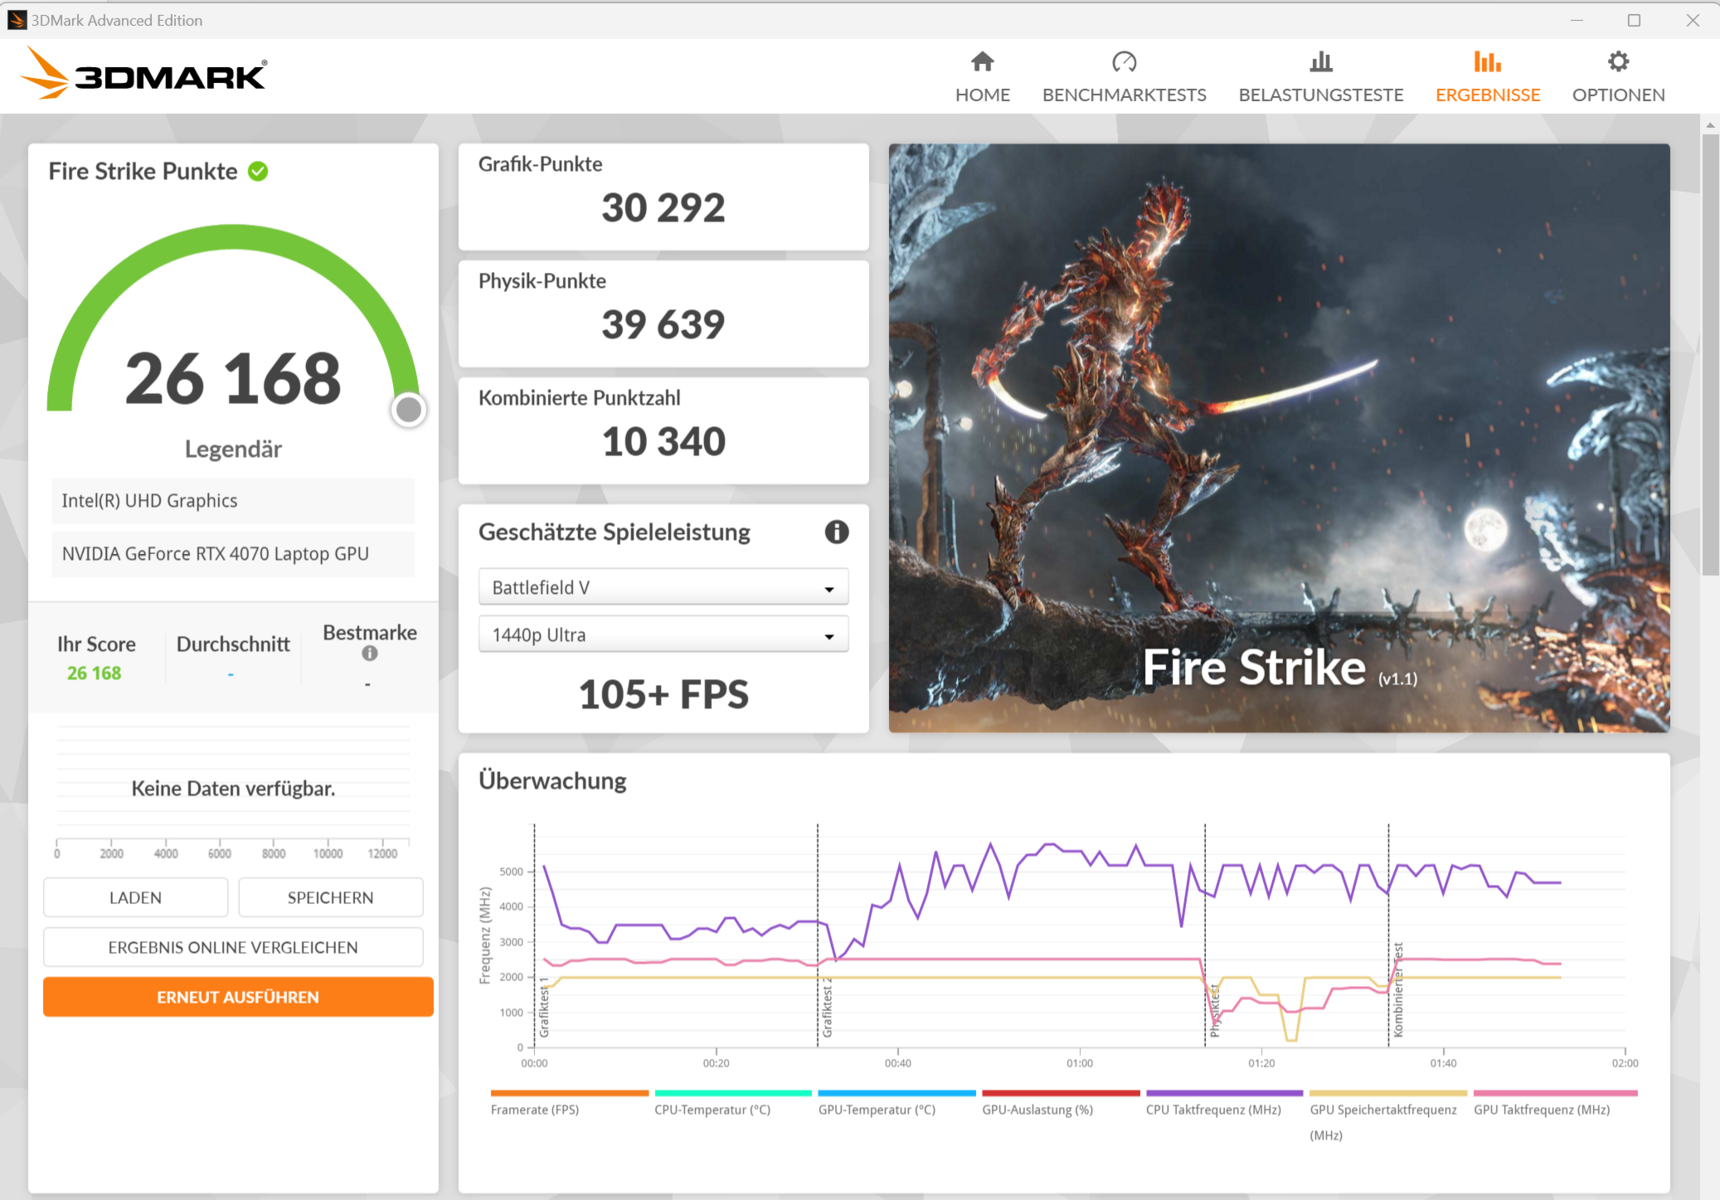

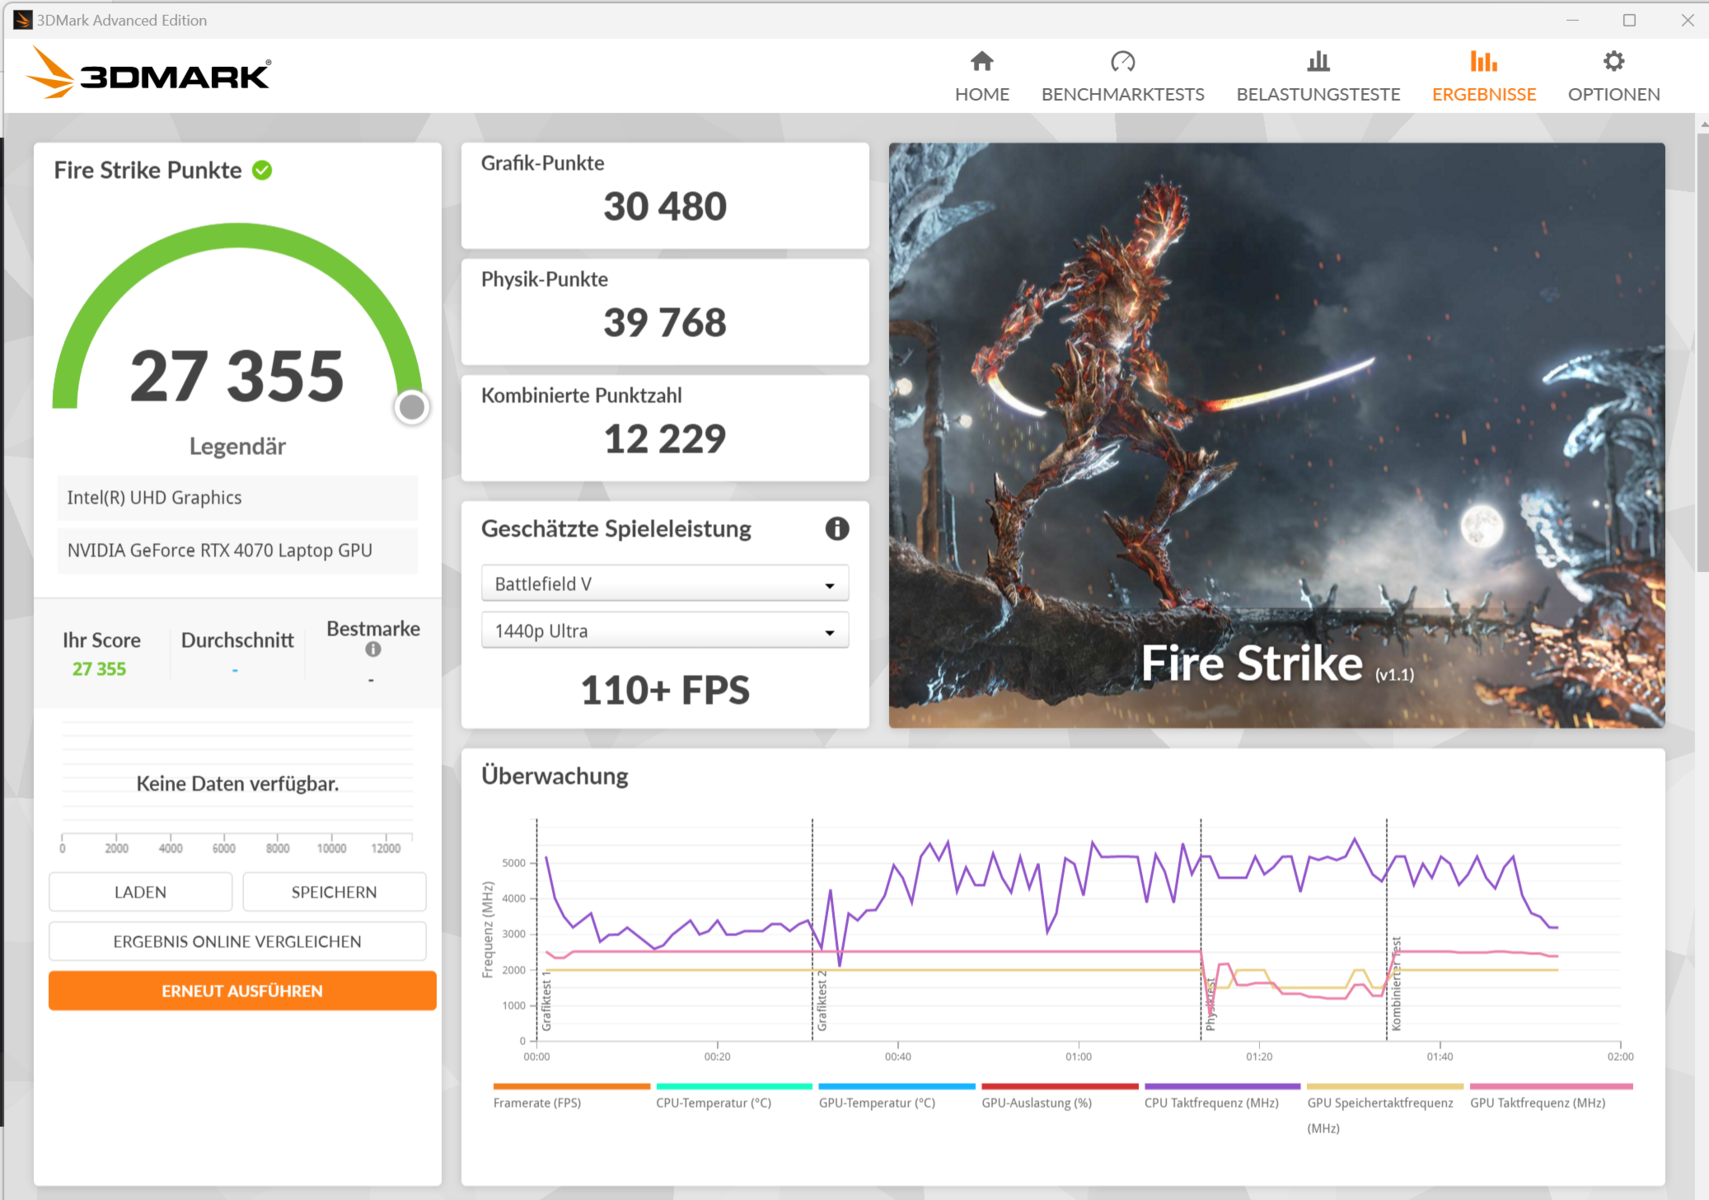

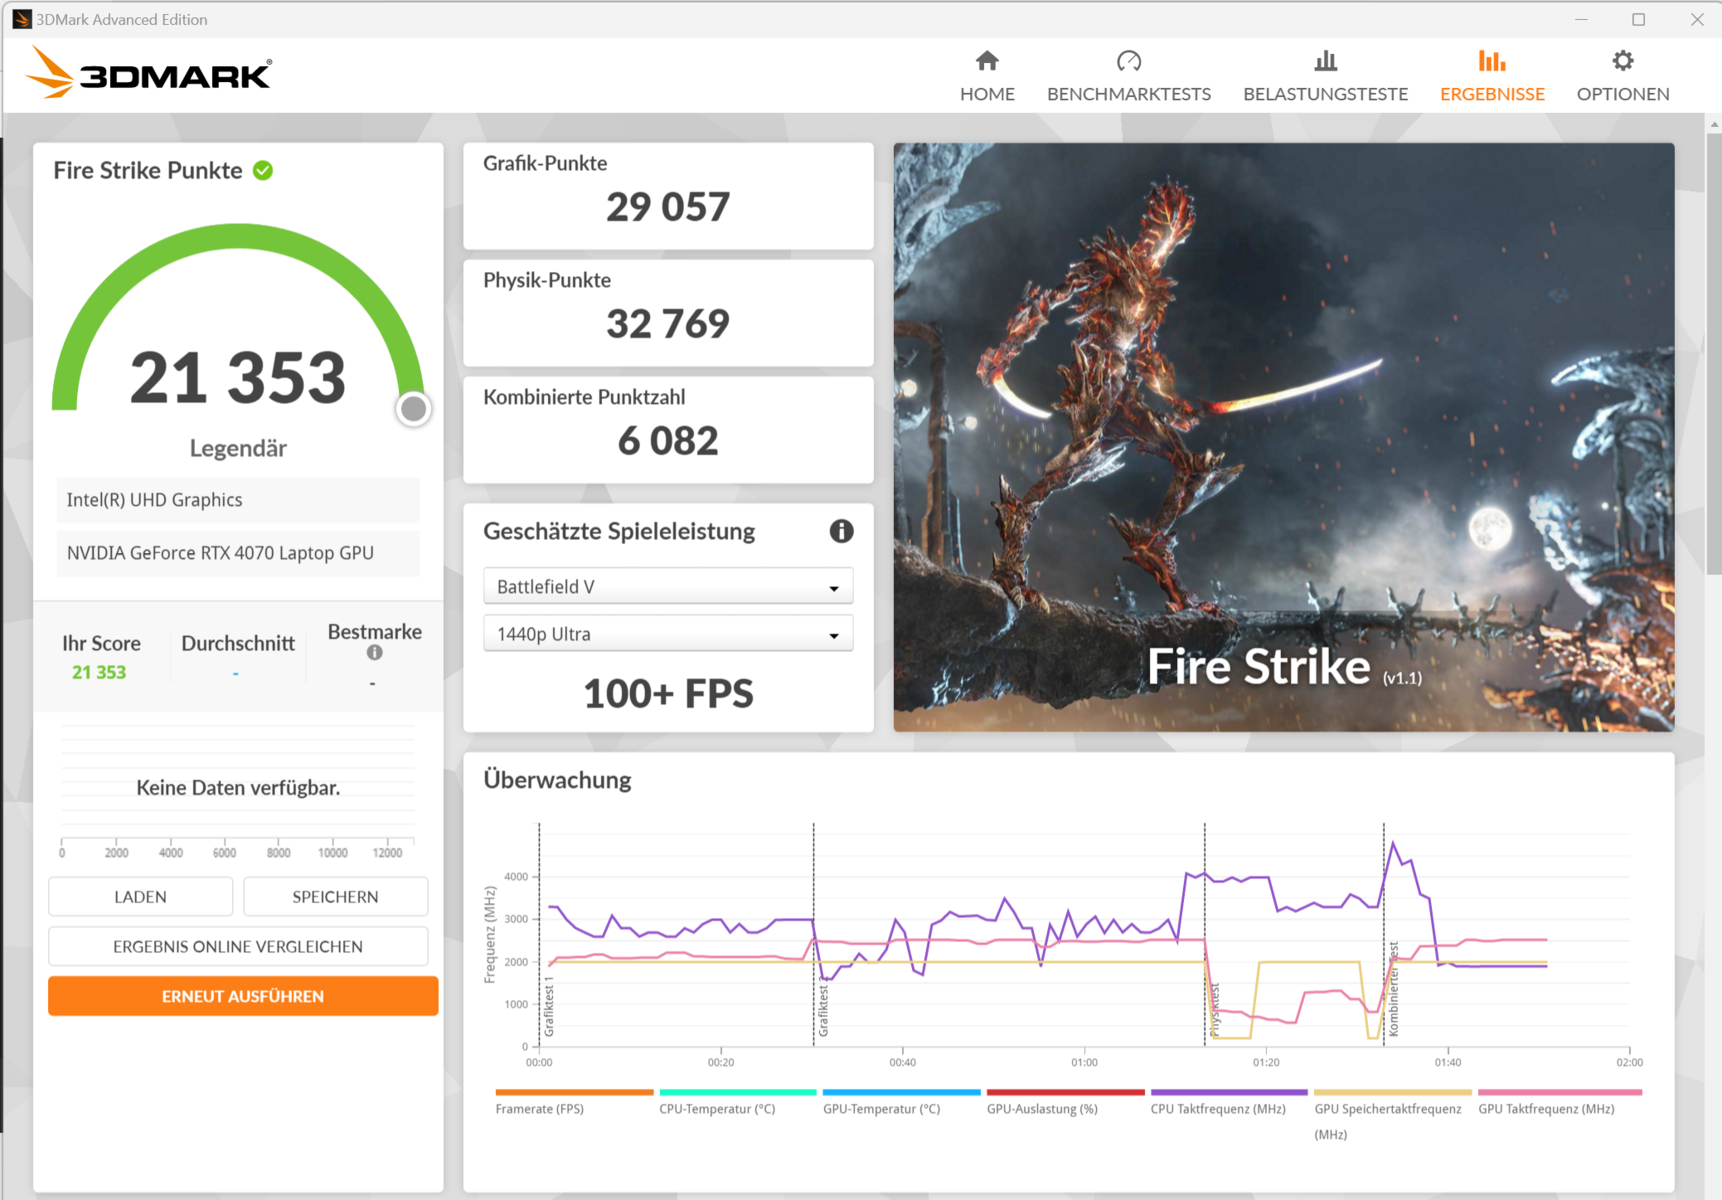
| 3DMark 11 Performance | 35473 pkt. | |
| 3DMark Fire Strike Score | 23487 pkt. | |
| 3DMark Time Spy Score | 12612 pkt. | |
Pomoc | ||
* ... im mniej tym lepiej
Wydajność w grach
Rdzeń graficzny pozwala na rozgrywkę w rozdzielczości QHD przy ustawieniach od wysokich do maksymalnych. Skutkuje to liczbą klatek na sekundę powyżej poprzedniej średniej RTX 4070(Standard); bardziej wydajne profile mogą w najlepszym przypadku skutkować niewielkim wzrostem. Korzystając z DLSS 3 i Frame Generation, maksymalne ustawienia, w tym ray tracing, mogą być również możliwe w wyższych rozdzielczościach - ale tylko w grach, które je obsługują.
| The Witcher 3 - 1920x1080 Ultra Graphics & Postprocessing (HBAO+) | |
| Średnia w klasie Gaming (95 - 240, n=8, ostatnie 2 lata) | |
| Lenovo Legion Pro 5 16IRX9 | |
| Aorus 16X 2024 | |
| Alienware m16 R2 | |
| Asus TUF Gaming A17 FA707XI-NS94 | |
| Schenker XMG Pro 16 Studio (Mid 23) | |
| HP Omen Transcend 16-u1095ng | |
| Przeciętny NVIDIA GeForce RTX 4070 Laptop GPU (69.8 - 133.7, n=57) | |
| Horizon Forbidden West | |
| 1920x1080 Very High Preset AA:T | |
| Średnia w klasie Gaming (14.7 - 140.3, n=13, ostatnie 2 lata) | |
| Aorus 16X 2024 | |
| XMG Pro 15 E23 | |
| Przeciętny NVIDIA GeForce RTX 4070 Laptop GPU (53.2 - 76.7, n=10) | |
| 2560x1440 Very High Preset AA:T | |
| Średnia w klasie Gaming (39.6 - 100.9, n=10, ostatnie 2 lata) | |
| Aorus 16X 2024 | |
| XMG Pro 15 E23 | |
| Przeciętny NVIDIA GeForce RTX 4070 Laptop GPU (40.3 - 59.1, n=9) | |
| Alone in the Dark | |
| 1920x1080 High Preset | |
| XMG Pro 15 E23 | |
| Przeciętny NVIDIA GeForce RTX 4070 Laptop GPU (125.8 - 196.5, n=5) | |
| Aorus 16X 2024 | |
| Średnia w klasie Gaming (n=1ostatnie 2 lata) | |
| 2560x1440 Cinematic Preset | |
| XMG Pro 15 E23 | |
| Przeciętny NVIDIA GeForce RTX 4070 Laptop GPU (37.4 - 76.6, n=5) | |
| Aorus 16X 2024 | |
| Skull & Bones | |
| 1920x1080 Ultra High Preset AA:T | |
| Aorus 16X 2024 | |
| Przeciętny NVIDIA GeForce RTX 4070 Laptop GPU (75 - 81, n=3) | |
| XMG Pro 15 E23 | |
| 2560x1440 Ultra High Preset AA:T | |
| Aorus 16X 2024 | |
| Przeciętny NVIDIA GeForce RTX 4070 Laptop GPU (56 - 63, n=3) | |
| XMG Pro 15 E23 | |
| Last Epoch | |
| 1920x1080 Ultra Preset AA:T | |
| XMG Pro 15 E23 | |
| Przeciętny NVIDIA GeForce RTX 4070 Laptop GPU (133.8 - 140, n=2) | |
| Aorus 16X 2024 | |
| Średnia w klasie Gaming (n=1ostatnie 2 lata) | |
| 2560x1440 Ultra Preset AA:T | |
| XMG Pro 15 E23 | |
| Przeciętny NVIDIA GeForce RTX 4070 Laptop GPU (80.4 - 81.1, n=2) | |
| Aorus 16X 2024 | |
| Średnia w klasie Gaming (n=1ostatnie 2 lata) | |
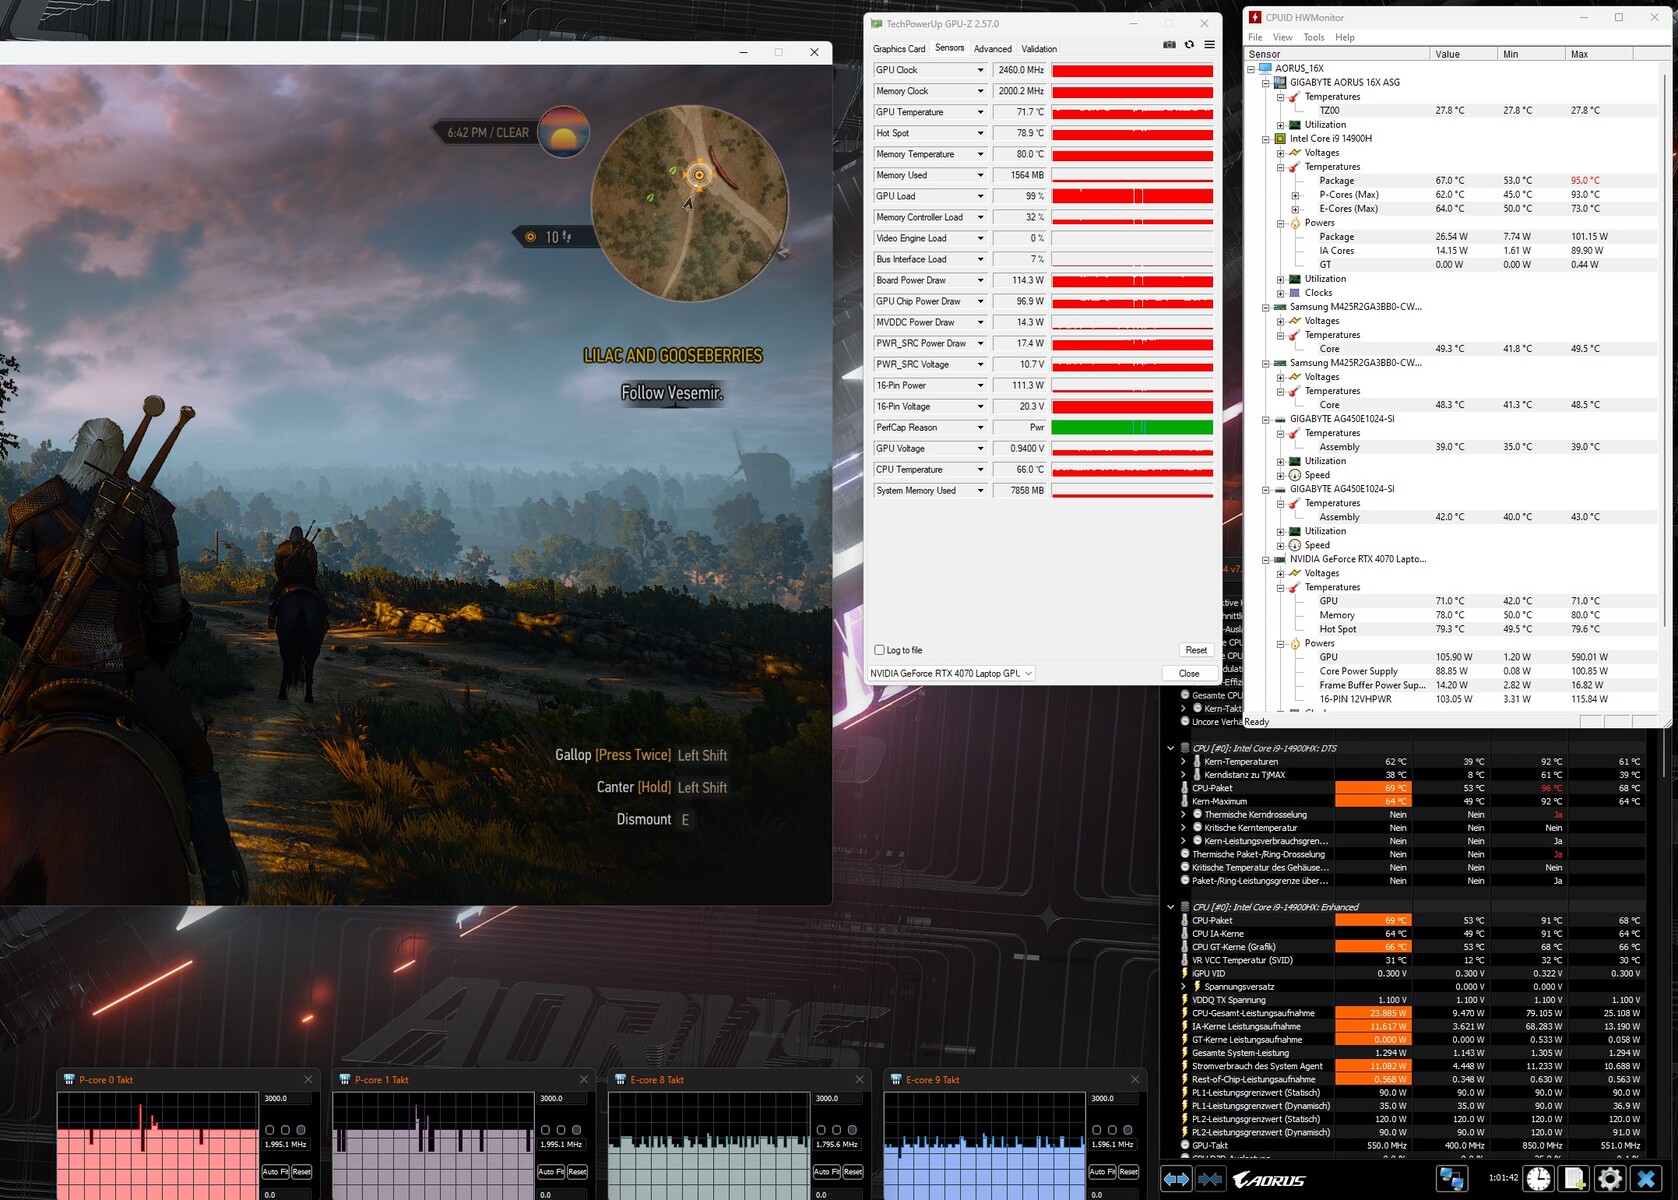
Aby sprawdzić, czy liczba klatek na sekundę urządzenia pozostaje w dużej mierze stała przez dłuższy czas, uruchomiliśmy grę The Witcher 3 na około 60 minut w rozdzielczości Full HD i przy maksymalnych ustawieniach jakości. Postać w grze nie była poruszana. Nie odnotowaliśmy zauważalnego spadku liczby klatek na sekundę.
Witcher 3 FPS diagram
| low | med. | high | ultra | QHD | |
|---|---|---|---|---|---|
| GTA V (2015) | 187.5 | 187 | 176.5 | 107.2 | 90.5 |
| The Witcher 3 (2015) | 435 | 338 | 223 | 122 | 88.5 |
| Dota 2 Reborn (2015) | 233 | 208 | 199.1 | 180.9 | |
| Final Fantasy XV Benchmark (2018) | 176.6 | 139.1 | 111.5 | 85.8 | |
| X-Plane 11.11 (2018) | 194.4 | 163 | 126.4 | ||
| Far Cry 5 (2018) | 184 | 124 | 114 | 109 | 98 |
| Strange Brigade (2018) | 455 | 277 | 233 | 204 | 136.2 |
| Cyberpunk 2077 (2023) | 90.2 | 81.6 | 76.9 | 75.8 | 49.4 |
| Skull & Bones (2024) | 107 | 101 | 94 | 81 | 63 |
| Last Epoch (2024) | 169.7 | 156 | 155.9 | 133.8 | 80.4 |
| Alone in the Dark (2024) | 185.9 | 157.3 | 151.1 | 124.7 | 64.7 |
| Horizon Forbidden West (2024) | 92.3 | 77.3 | 73.4 | 71.1 | 54.5 |
Emisja - laptop Aorus nie nagrzewa się zbytnio
Emisja hałasu
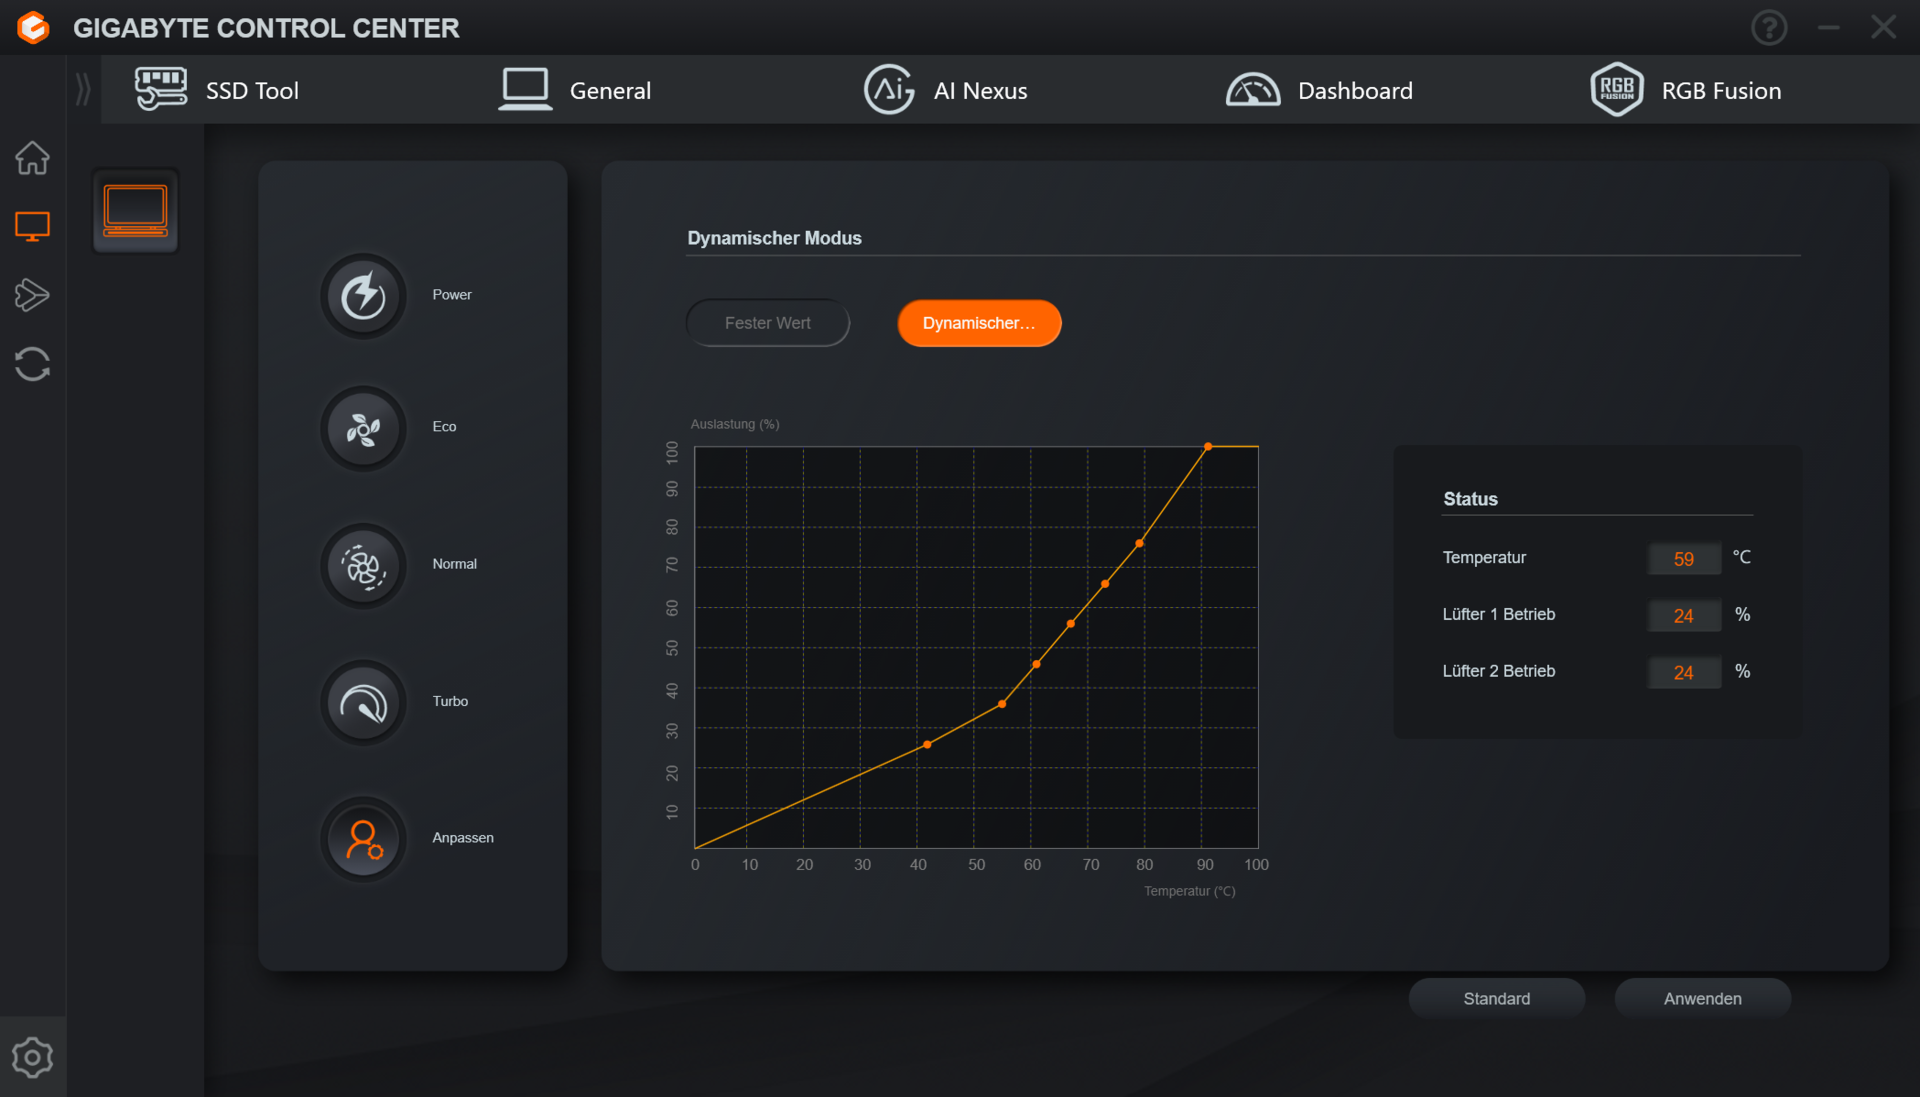
Przy pełnym obciążeniu laptop emituje hałas o natężeniu do 55 dB(A). Profile energetyczne Meeting i Energy-Saving Quiet zapewniają ogólnie cichszą pracę - kosztem pewnej wydajności. Aktywność wentylatorów można również kontrolować za pomocą czterech profili wentylatorów (w Gigabyte Control Center). W razie potrzeby można również utworzyć niestandardową krzywą wentylatora. W stanie spoczynku i podczas codziennego użytkowania (biuro, Internet), laptop generalnie działa cicho - czasami nawet bezgłośnie. Czasami jednak wentylatory zaczynają obracać się dość szybko.
Hałas
| luz |
| 26 / 32 / 38 dB |
| obciążenie |
| 54 / 55 dB |
 | ||
30 dB cichy 40 dB(A) słyszalny 50 dB(A) irytujący |
||
min: | ||
| Aorus 16X 2024 i9-14900HX, GeForce RTX 4070 Laptop GPU | Alienware m16 R2 Ultra 7 155H, GeForce RTX 4070 Laptop GPU | HP Omen Transcend 16-u1095ng i9-14900HX, GeForce RTX 4070 Laptop GPU | Asus TUF Gaming A17 FA707XI-NS94 R9 7940HS, GeForce RTX 4070 Laptop GPU | Schenker XMG Pro 16 Studio (Mid 23) i9-13900H, GeForce RTX 4070 Laptop GPU | Lenovo Legion Pro 5 16IRX9 i9-14900HX, GeForce RTX 4070 Laptop GPU | |
|---|---|---|---|---|---|---|
| Noise | 12% | 9% | 4% | 9% | 10% | |
| wyłączone / środowisko * (dB) | 26 | 24.7 5% | 24 8% | 27.9 -7% | 25 4% | 23.9 8% |
| Idle Minimum * (dB) | 26 | 25.3 3% | 29 -12% | 28.5 -10% | 26 -0% | 24.3 7% |
| Idle Average * (dB) | 32 | 25.3 21% | 30 6% | 29.8 7% | 29 9% | 24.3 24% |
| Idle Maximum * (dB) | 38 | 25.3 33% | 31 18% | 29.8 22% | 34 11% | 28.9 24% |
| Load Average * (dB) | 54 | 31.7 41% | 45 17% | 34.8 36% | 43 20% | 45.8 15% |
| Witcher 3 ultra * (dB) | 50 | 53.8 -8% | 44 12% | 57.1 -14% | 48 4% | 51 -2% |
| Load Maximum * (dB) | 55 | 62 -13% | 47 15% | 57.3 -4% | 48 13% | 56.6 -3% |
* ... im mniej tym lepiej
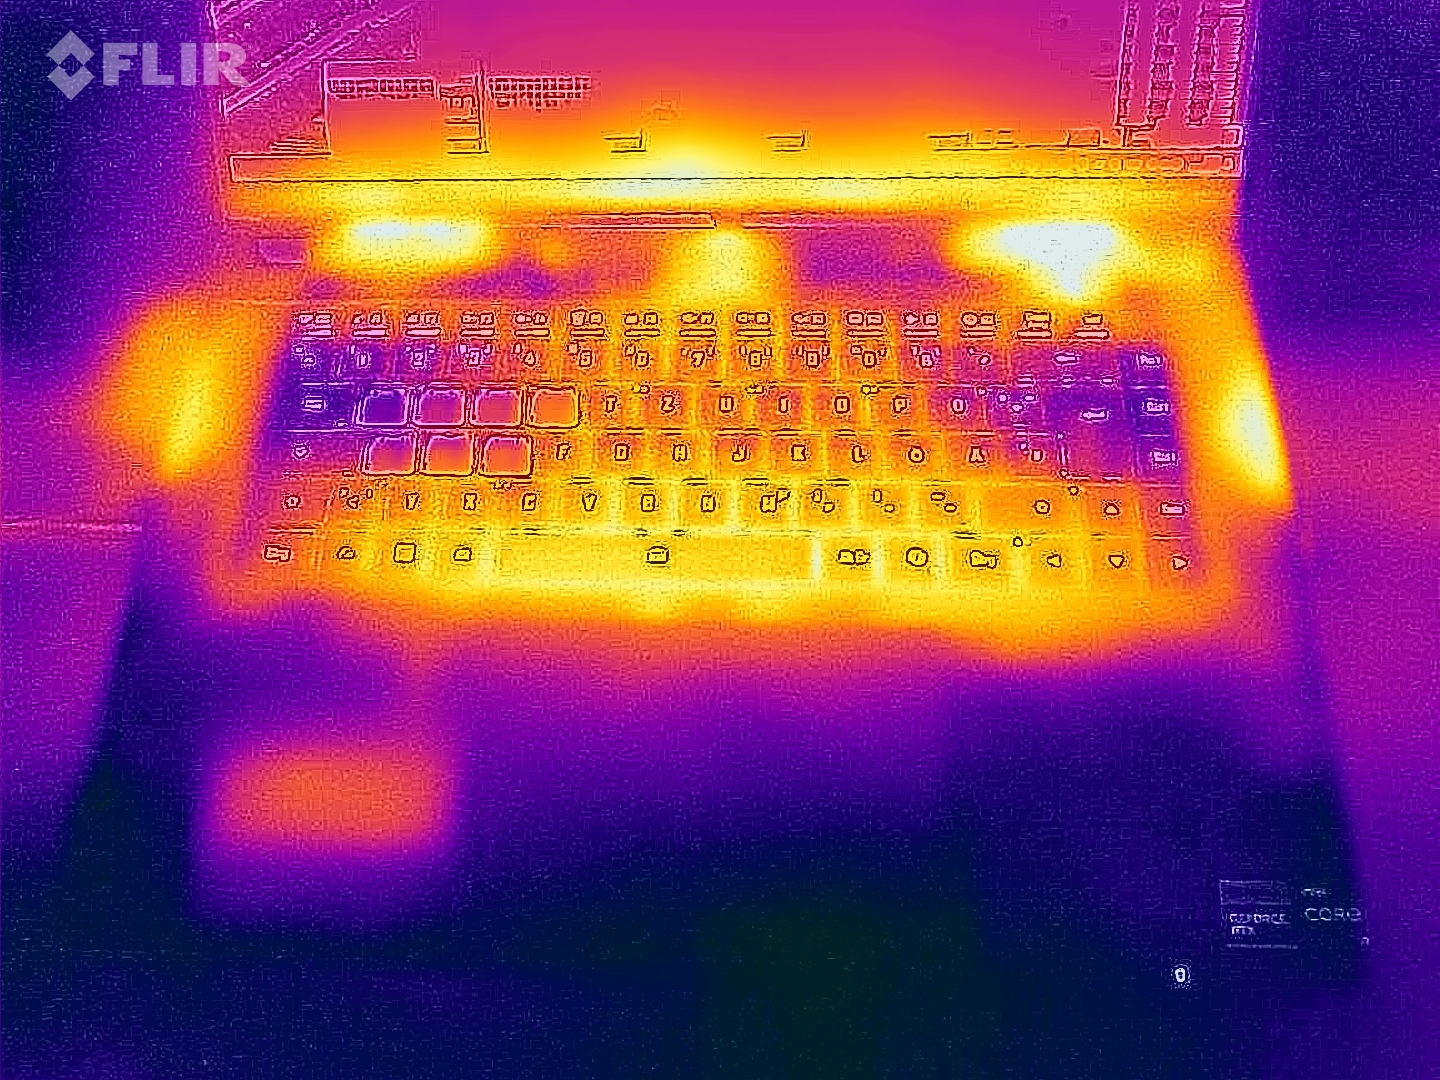
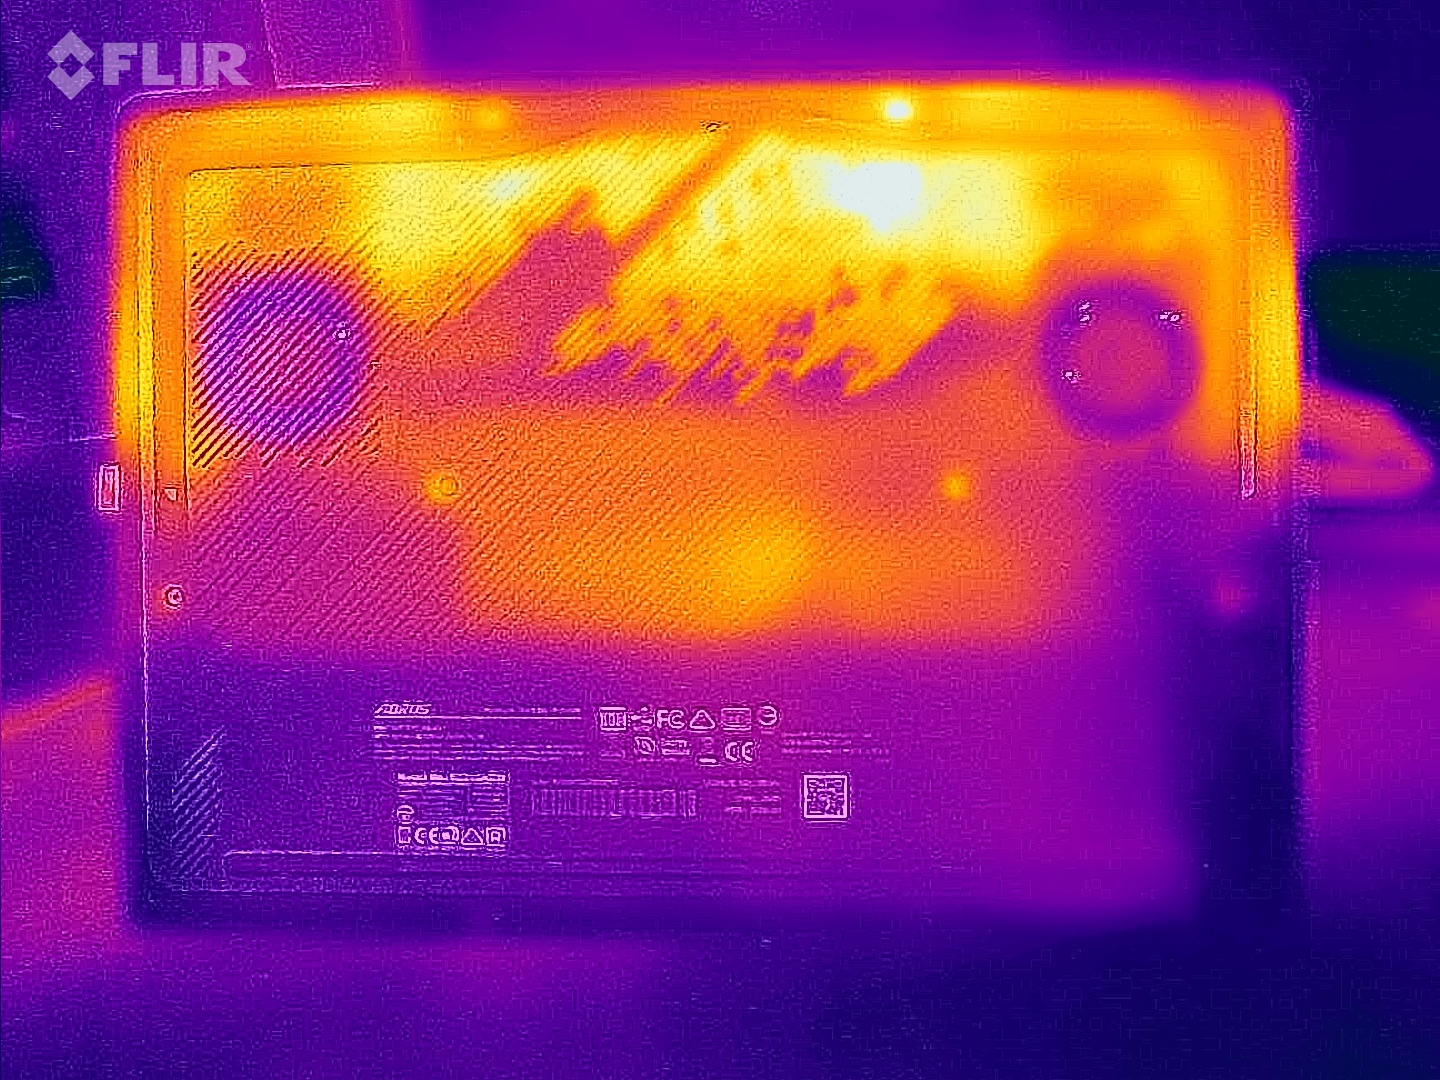
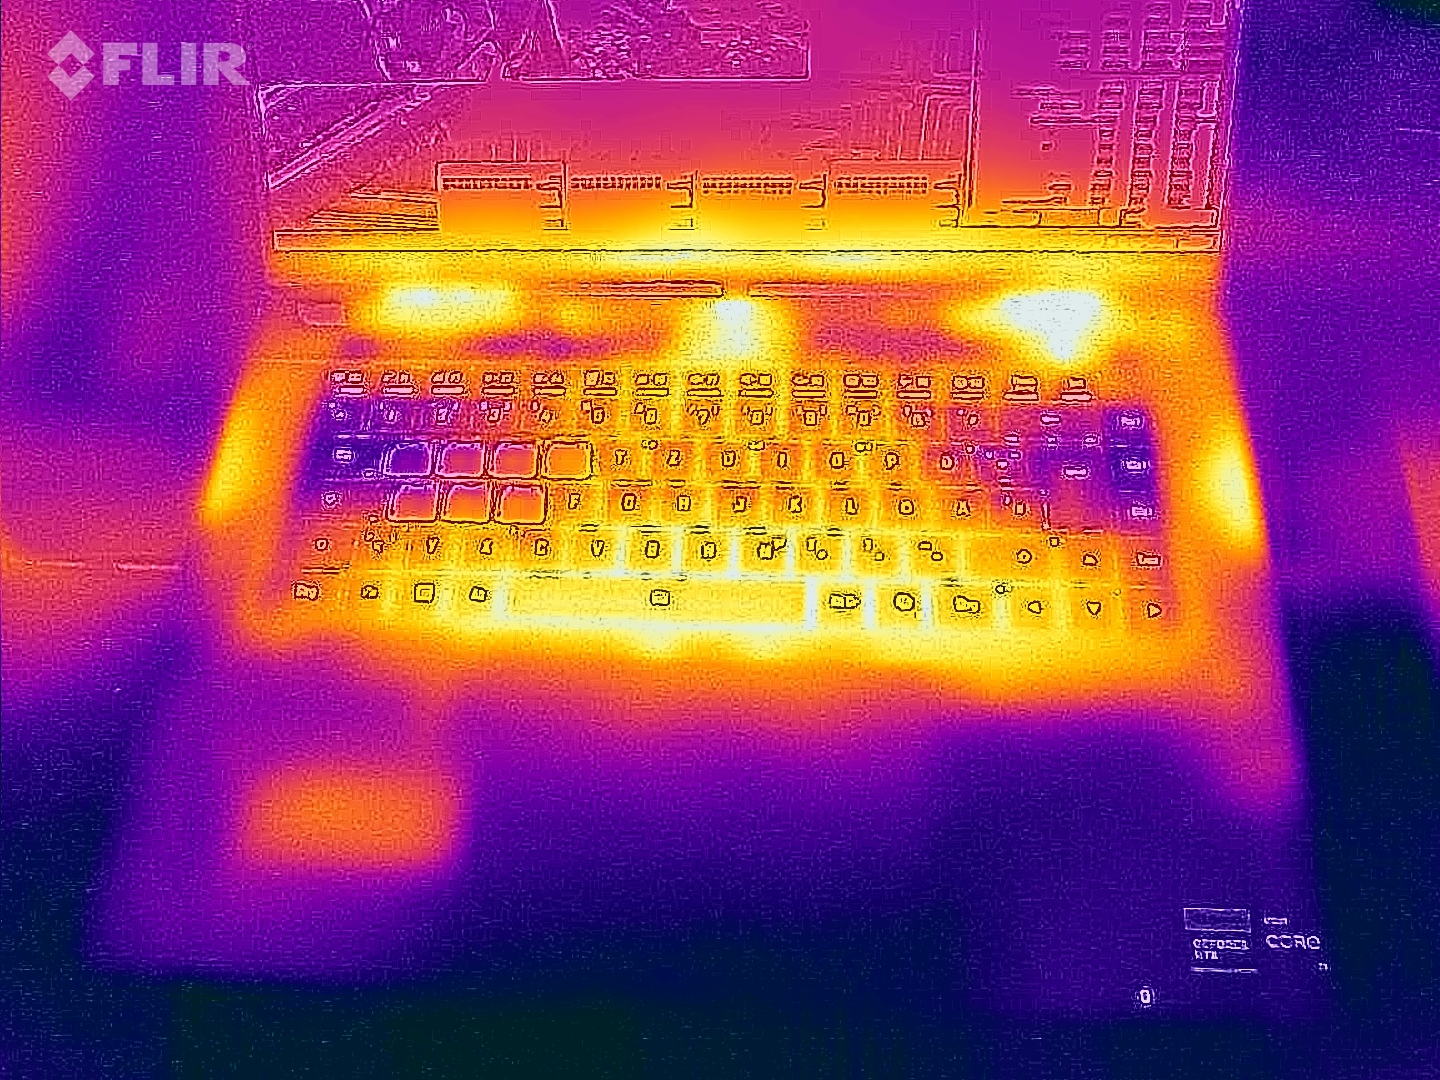
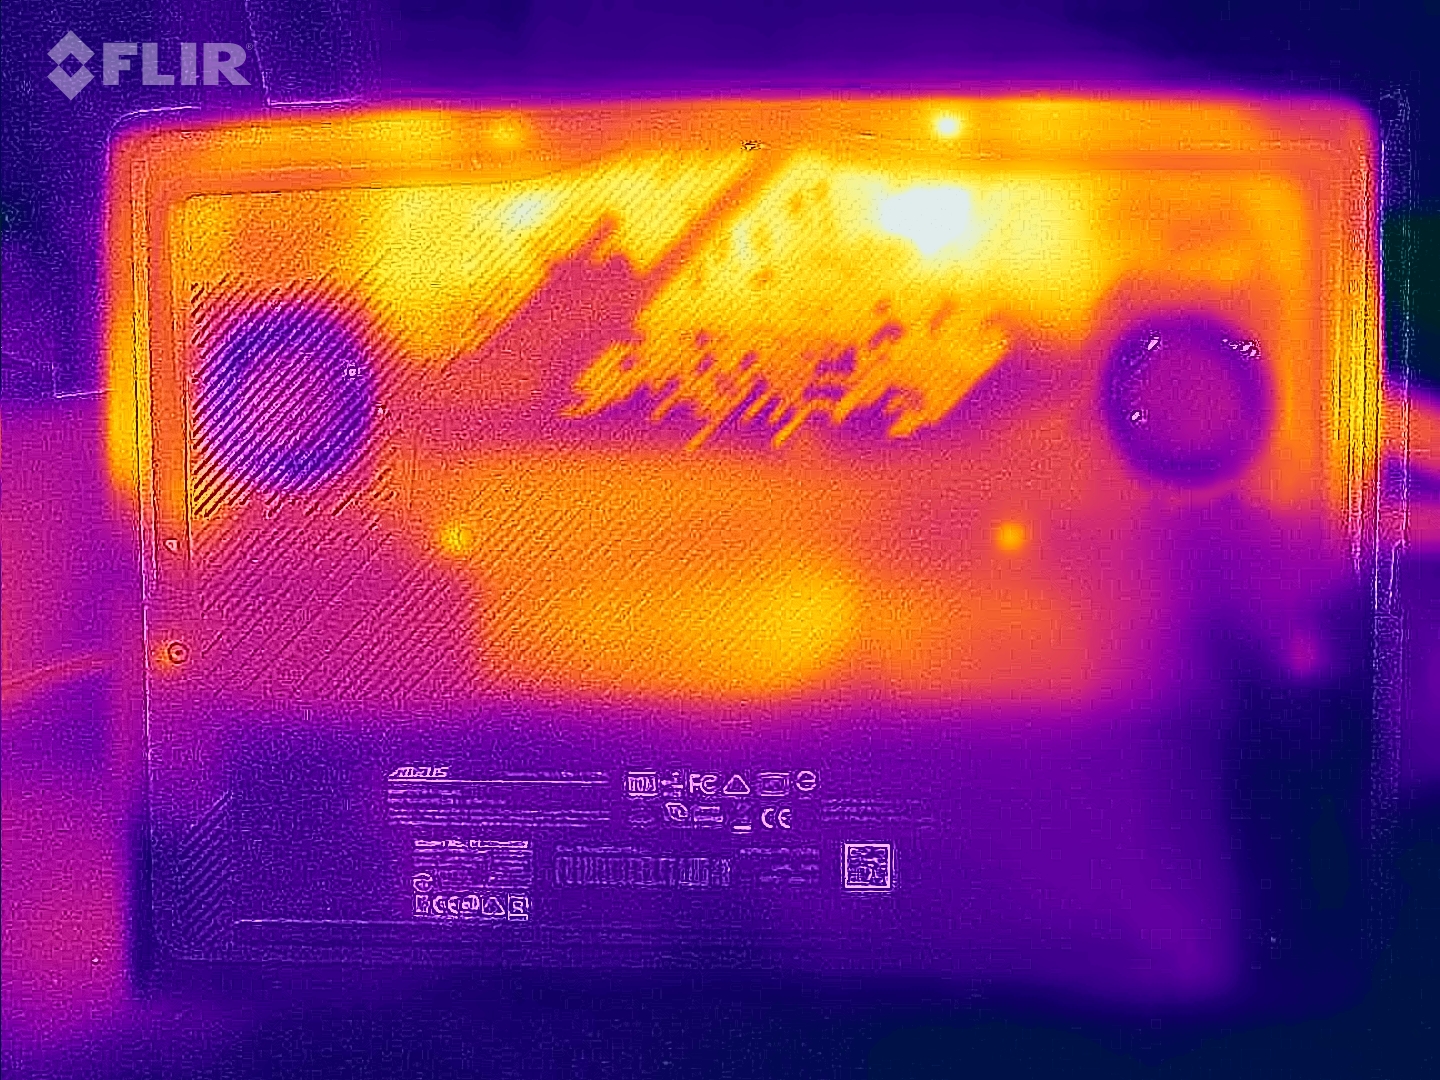
Temperatura
Test warunków skrajnych i Witcher 3 spowodowały jedynie niewielkie nagrzewanie się laptopa. W niektórych przypadkach zmierzyliśmy wartości w zakresie od niższych do średnich 40 stopni Celsjusza. W codziennym użytkowaniu (biuro, internet) wartości w dużej mierze pozostaną w zielonej strefie, jednak są powyżej średniej.
(±) Maksymalna temperatura w górnej części wynosi 41 °C / 106 F, w porównaniu do średniej 40.4 °C / 105 F , począwszy od 21.2 do 68.8 °C dla klasy Gaming.
(±) Dno nagrzewa się maksymalnie do 41 °C / 106 F, w porównaniu do średniej 43.2 °C / 110 F
(±) W stanie bezczynności średnia temperatura górnej części wynosi 33.2 °C / 92 F, w porównaniu ze średnią temperaturą urządzenia wynoszącą 33.9 °C / ### class_avg_f### F.
(±) Podczas gry w Wiedźmina 3 średnia temperatura górnej części wynosi 35.7 °C / 96 F, w porównaniu do średniej temperatury urządzenia wynoszącej 33.9 °C / ## #class_avg_f### F.
(+) Podpórki pod nadgarstki i touchpad są chłodniejsze niż temperatura skóry i maksymalnie 30 °C / 86 F i dlatego są chłodne w dotyku.
(±) Średnia temperatura obszaru podparcia dłoni w podobnych urządzeniach wynosiła 28.8 °C / 83.8 F (-1.2 °C / -2.2 F).
| Aorus 16X 2024 i9-14900HX, GeForce RTX 4070 Laptop GPU | Alienware m16 R2 Ultra 7 155H, GeForce RTX 4070 Laptop GPU | HP Omen Transcend 16-u1095ng i9-14900HX, GeForce RTX 4070 Laptop GPU | Asus TUF Gaming A17 FA707XI-NS94 R9 7940HS, GeForce RTX 4070 Laptop GPU | Schenker XMG Pro 16 Studio (Mid 23) i9-13900H, GeForce RTX 4070 Laptop GPU | Lenovo Legion Pro 5 16IRX9 i9-14900HX, GeForce RTX 4070 Laptop GPU | |
|---|---|---|---|---|---|---|
| Heat | -10% | -8% | 21% | -19% | -7% | |
| Maximum Upper Side * (°C) | 41 | 44.8 -9% | 49 -20% | 40 2% | 55 -34% | 43.8 -7% |
| Maximum Bottom * (°C) | 41 | 48 -17% | 63 -54% | 33.6 18% | 66 -61% | 55.4 -35% |
| Idle Upper Side * (°C) | 37 | 37.2 -1% | 30 19% | 26.6 28% | 33 11% | 32.8 11% |
| Idle Bottom * (°C) | 38 | 42 -11% | 29 24% | 24.4 36% | 35 8% | 36 5% |
* ... im mniej tym lepiej
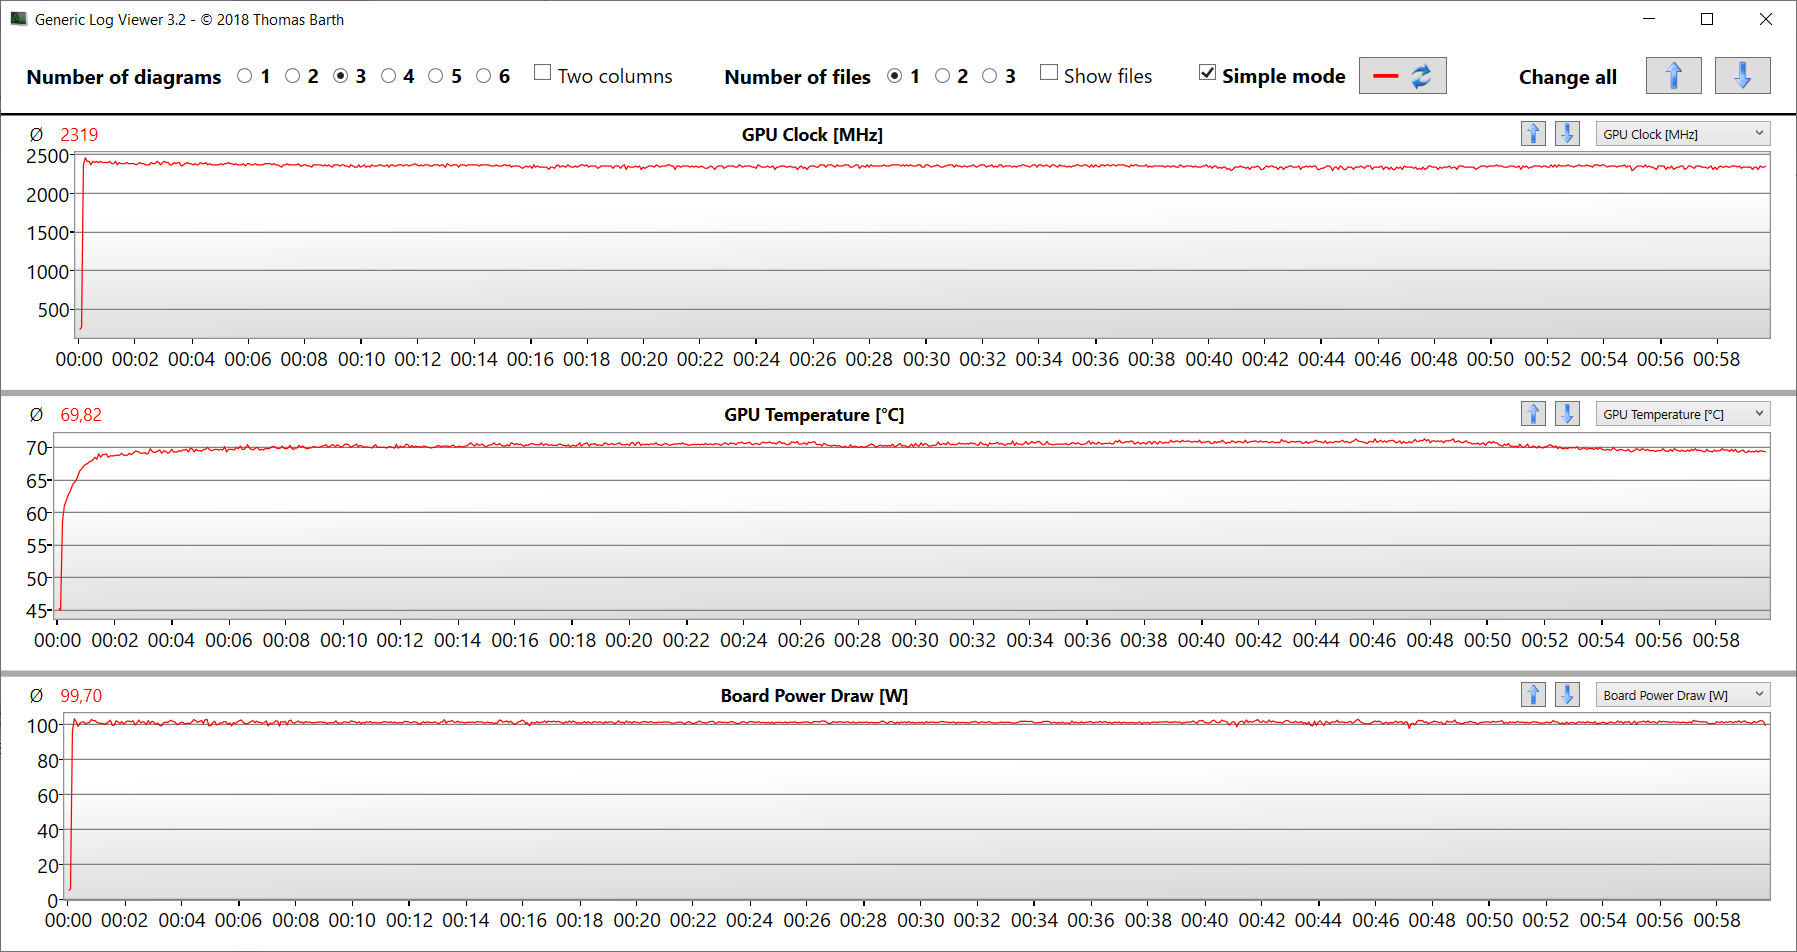
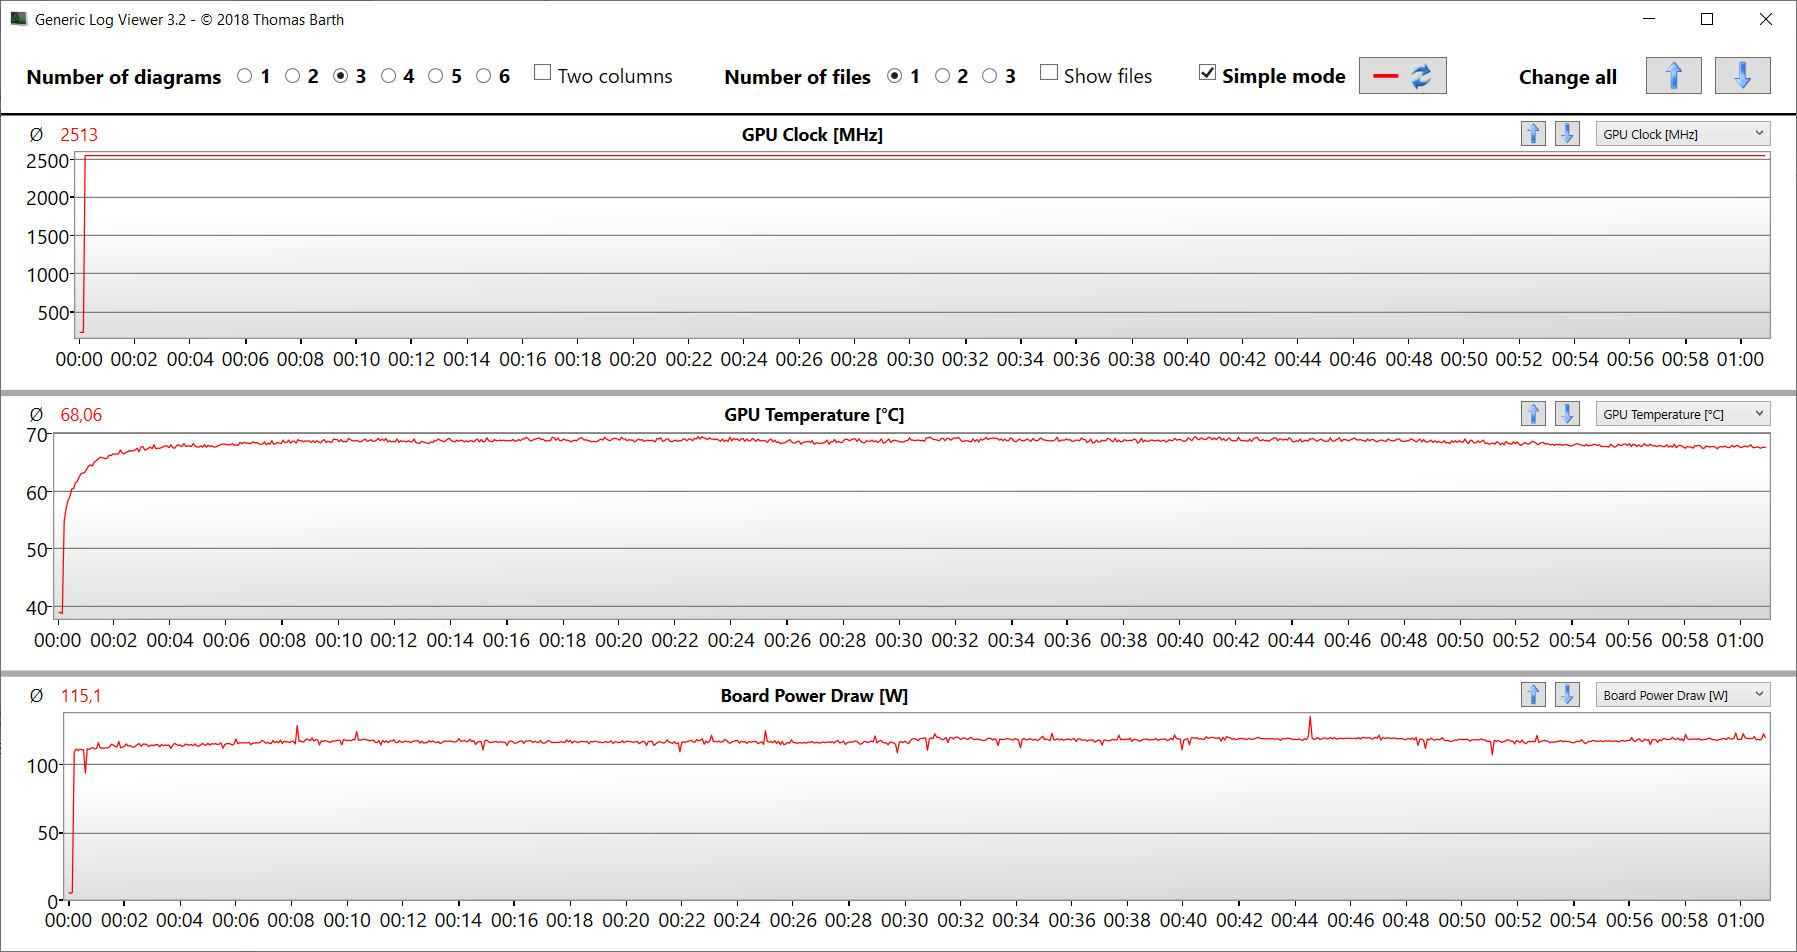
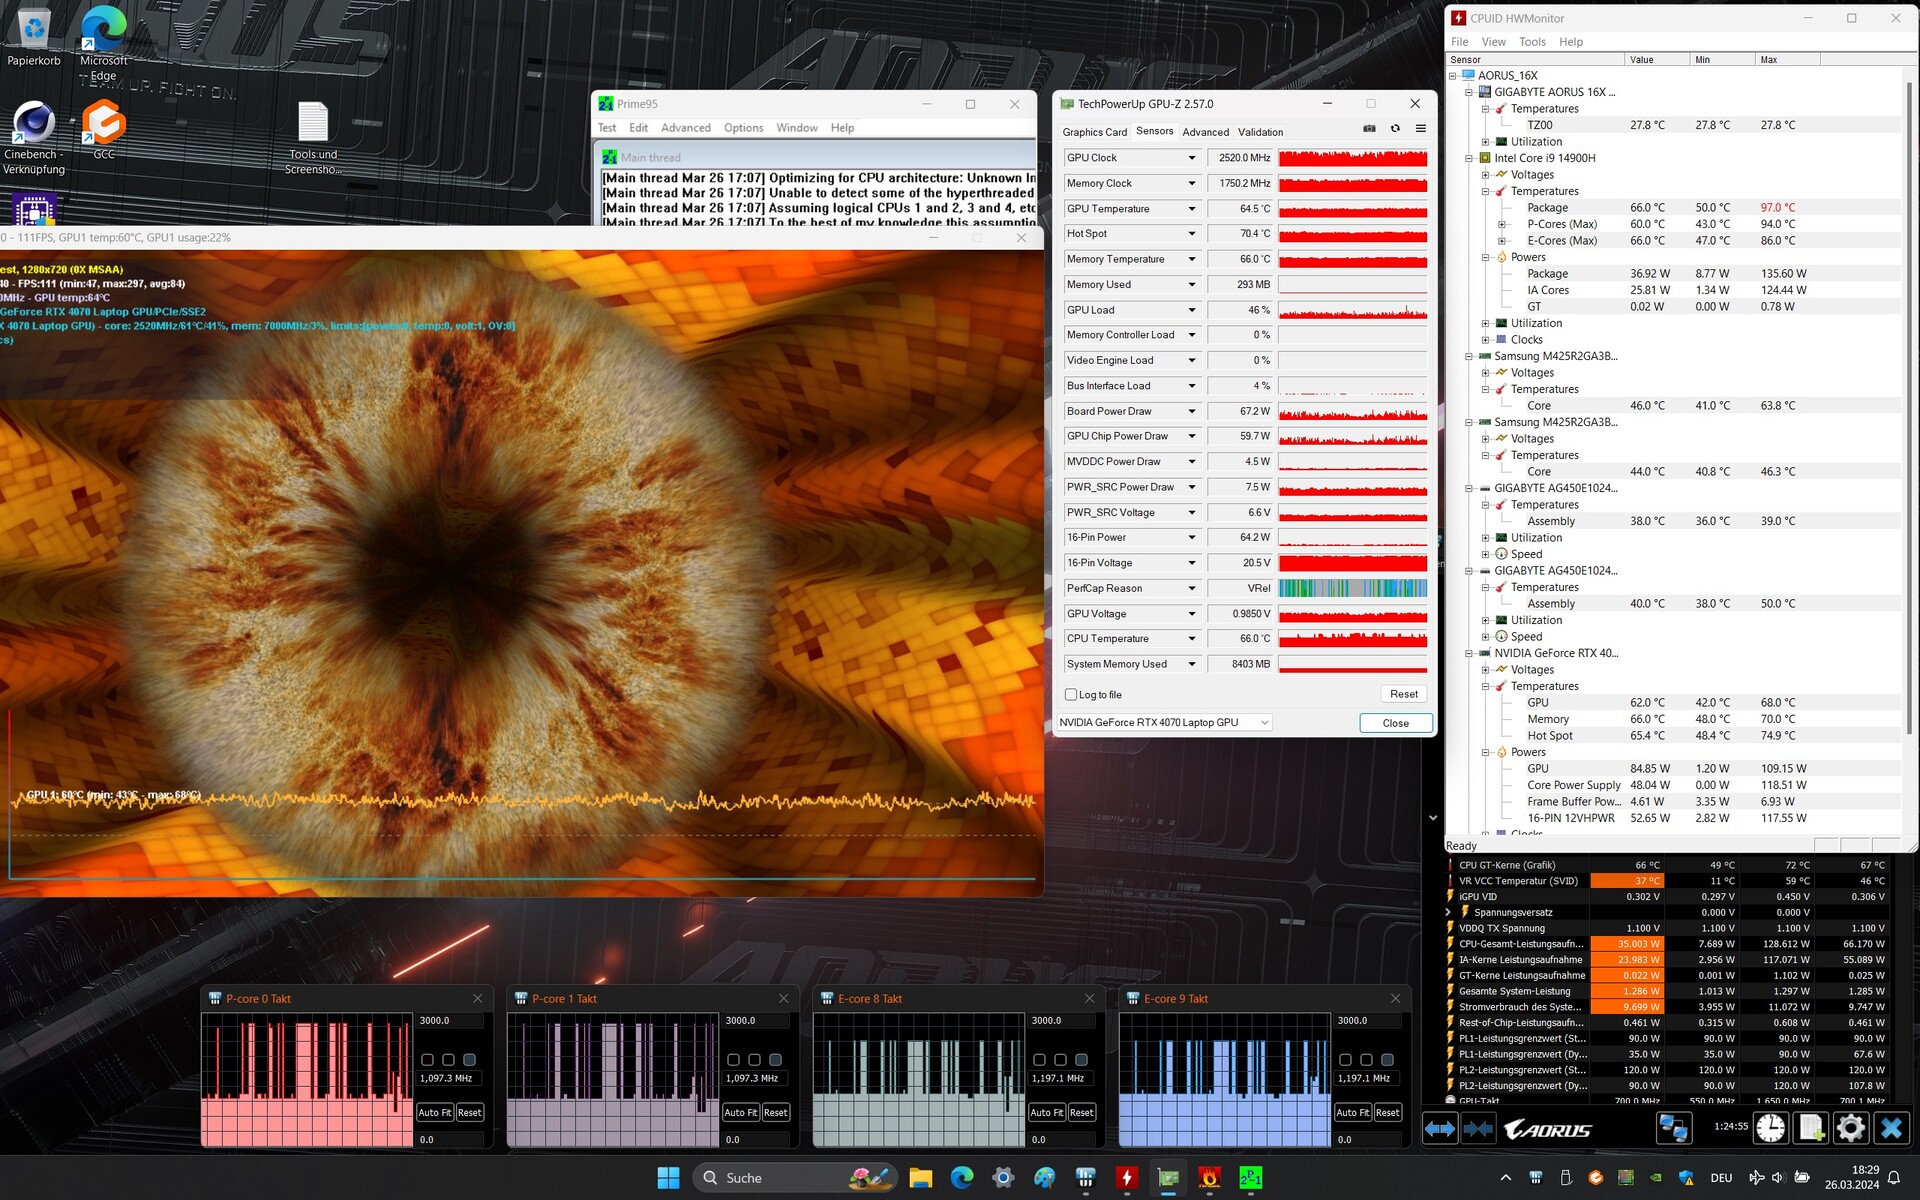
Test warunków skrajnych
Ekstremalny scenariusz testu obciążeniowego (Prime95 i Furmark w trybie ciągłym) sprawdza stabilność systemu pod pełnym obciążeniem. Zegar procesora wahał się między 1 a 3 GHz przez dość długi czas, ale po chwili ustabilizował się na niskim poziomie. Rdzeń graficzny działał z dużą prędkością.
Głośniki
Głośniki stereo laptopa generują ogólnie dobry dźwięk. Jeszcze lepsze wrażenia dźwiękowe można uzyskać, korzystając ze słuchawek lub głośników zewnętrznych.
Aorus 16X 2024 analiza dźwięku
(+) | głośniki mogą odtwarzać stosunkowo głośno (85 dB)
Bas 100 - 315 Hz
(±) | zredukowany bas - średnio 8.5% niższy od mediany
(±) | liniowość basu jest średnia (8.3% delta do poprzedniej częstotliwości)
Średnie 400 - 2000 Hz
(+) | zbalansowane środki średnie - tylko 3.1% od mediany
(+) | średnie są liniowe (5.8% delta do poprzedniej częstotliwości)
Wysokie 2–16 kHz
(+) | zrównoważone maksima - tylko 2.5% od mediany
(±) | liniowość wysokich wartości jest średnia (7% delta do poprzedniej częstotliwości)
Ogólnie 100 - 16.000 Hz
(+) | ogólny dźwięk jest liniowy (8.4% różnicy w stosunku do mediany)
W porównaniu do tej samej klasy
» 2% wszystkich testowanych urządzeń w tej klasie było lepszych, 1% podobnych, 97% gorszych
» Najlepszy miał deltę 6%, średnia wynosiła ###średnia###%, najgorsza wynosiła 132%
W porównaniu do wszystkich testowanych urządzeń
» 2% wszystkich testowanych urządzeń było lepszych, 1% podobnych, 97% gorszych
» Najlepszy miał deltę 4%, średnia wynosiła ###średnia###%, najgorsza wynosiła 134%
Alienware m16 R2 analiza dźwięku
(+) | głośniki mogą odtwarzać stosunkowo głośno (82.4 dB)
Bas 100 - 315 Hz
(-) | prawie brak basu - średnio 20.1% niższa od mediany
(±) | liniowość basu jest średnia (11.1% delta do poprzedniej częstotliwości)
Średnie 400 - 2000 Hz
(+) | zbalansowane środki średnie - tylko 2.2% od mediany
(+) | średnie są liniowe (3.1% delta do poprzedniej częstotliwości)
Wysokie 2–16 kHz
(+) | zrównoważone maksima - tylko 2.2% od mediany
(+) | wzloty są liniowe (3.5% delta do poprzedniej częstotliwości)
Ogólnie 100 - 16.000 Hz
(+) | ogólny dźwięk jest liniowy (12.9% różnicy w stosunku do mediany)
W porównaniu do tej samej klasy
» 17% wszystkich testowanych urządzeń w tej klasie było lepszych, 4% podobnych, 79% gorszych
» Najlepszy miał deltę 6%, średnia wynosiła ###średnia###%, najgorsza wynosiła 132%
W porównaniu do wszystkich testowanych urządzeń
» 12% wszystkich testowanych urządzeń było lepszych, 3% podobnych, 85% gorszych
» Najlepszy miał deltę 4%, średnia wynosiła ###średnia###%, najgorsza wynosiła 134%
Zarządzanie energią - laptop do gier o przyzwoitej wytrzymałości
Zużycie energii
Zużycie energii przez urządzenie jest na normalnym poziomie dla zainstalowanego sprzętu. Podczas gdy test Witcher 3 test przebiegał ze stałym poborem mocy, zapotrzebowanie laptopa wahało się znacznie w ciągu pierwszych kilku minut testu warunków skrajnych. Zasilacz (240 W) jest wystarczającej wielkości.
| wyłączony / stan wstrzymania | |
| luz | |
| obciążenie |
|
Legenda:
min: | |
| Aorus 16X 2024 i9-14900HX, GeForce RTX 4070 Laptop GPU | Alienware m16 R2 Ultra 7 155H, GeForce RTX 4070 Laptop GPU | HP Omen Transcend 16-u1095ng i9-14900HX, GeForce RTX 4070 Laptop GPU | Asus TUF Gaming A17 FA707XI-NS94 R9 7940HS, GeForce RTX 4070 Laptop GPU | Schenker XMG Pro 16 Studio (Mid 23) i9-13900H, GeForce RTX 4070 Laptop GPU | Średnia w klasie Gaming | |
|---|---|---|---|---|---|---|
| Power Consumption | 12% | 7% | 17% | 23% | 6% | |
| Idle Minimum * (Watt) | 13 | 8.1 38% | 10 23% | 6.2 52% | 8 38% | 13.2 ? -2% |
| Idle Average * (Watt) | 18 | 13 28% | 18 -0% | 21.8 -21% | 12 33% | 18.9 ? -5% |
| Idle Maximum * (Watt) | 35 | 40.3 -15% | 32 9% | 22 37% | 23 34% | 24.3 ? 31% |
| Load Average * (Watt) | 138 | 79 43% | 128 7% | 59.2 57% | 94 32% | 108.3 ? 22% |
| Witcher 3 ultra * (Watt) | 172.6 | 188.1 -9% | 148.4 14% | 189.7 -10% | 181.5 -5% | |
| Load Maximum * (Watt) | 222 | 254.9 -15% | 242 -9% | 247.8 -12% | 215 3% | 254 ? -14% |
* ... im mniej tym lepiej
Power consumption Witcher 3 / stress test
Power consumption with external monitor
Czas trwania
16-calowe urządzenie osiągnęło czasy pracy 8:01 h i 9:01 h podczas testu WLAN (dostęp do stron internetowych za pomocą skryptu) i testu wideo (krótki film Big Buck Bunny (kodowanie H.264, FHD) w pętli). Podsumowując, Aorus 16X osiągnął bardzo dobre wyniki. Żaden z porównywanych komputerów nie zbliżył się jednak do wytrzymałości Asusa A17.
| Aorus 16X 2024 i9-14900HX, GeForce RTX 4070 Laptop GPU, 99 Wh | Alienware m16 R2 Ultra 7 155H, GeForce RTX 4070 Laptop GPU, 90 Wh | HP Omen Transcend 16-u1095ng i9-14900HX, GeForce RTX 4070 Laptop GPU, 97 Wh | Asus TUF Gaming A17 FA707XI-NS94 R9 7940HS, GeForce RTX 4070 Laptop GPU, 90 Wh | Schenker XMG Pro 16 Studio (Mid 23) i9-13900H, GeForce RTX 4070 Laptop GPU, 73 Wh | Lenovo Legion Pro 5 16IRX9 i9-14900HX, GeForce RTX 4070 Laptop GPU, 80 Wh | Średnia w klasie Gaming | |
|---|---|---|---|---|---|---|---|
| Czasy pracy | -13% | -39% | 23% | -15% | -41% | -16% | |
| Reader / Idle (h) | 12.6 | 12.6 0% | 19.7 56% | 6.7 -47% | 8.71 ? -31% | ||
| H.264 (h) | 9 | 8.26 ? -8% | |||||
| WiFi v1.3 (h) | 8 | 8.1 1% | 4.9 -39% | 9.1 14% | 6.8 -15% | 4.8 -40% | 7.04 ? -12% |
| Load (h) | 1.7 | 1 -41% | 1.7 0% | 1.1 -35% | 1.47 ? -14% |
Za
Przeciw
Werdykt - Dobrze zaokrąglony laptop do gier wyższej klasy średniej
Aorus 16X został zoptymalizowany pod kątem gier, streamingu i renderowania w rozdzielczości QHD+. Procesor Core i9-14900HX i GeForce RTX 4070 zapewniają niezbędną wydajność. Procesor i rdzeń graficzny pracują z niezmiennie wysokim taktowaniem. Dwa szybkie dyski SSD PCIe-4 (1 TB każdy) zapewniają krótki czas ładowania.
Gigabyte Aorus 16X (2024) to potężny, dobrze wyposażony laptop dla graczy i twórców, który nie wydaje się mieć większych wad.
Laptop nie nagrzewa się szczególnie pod obciążeniem, ale może generować sporo hałasu. Cichsza praca odbywa się kosztem pewnej wydajności obliczeniowej. Zainstalowany ekran IPS (16 cali, 2560 x 1600 pikseli, 165 Hz) ma przyjazne dla pracy proporcje 16:10 i wywarł na nas ogólnie dobre wrażenie. W szczególności może pochwalić się wyjątkowo dobrą jasnością.
Dwa porty USB-C (1x Thunderbolt 4, 1x USB 3.2 Gen 2) ułatwiają integrację laptopa z istniejącymi konfiguracjami w miejscu pracy i otwierają dalsze opcje rozbudowy (zewnętrzne GPU, dokowanie). Oba porty mogą wysyłać sygnał DisplayPort, a dodatkowo jeden z nich obsługuje Power Delivery. Czasy pracy urządzenia są imponujące.
Jedną z alternatyw dla Aorus 16X może być potencjalnie Lenovo Legion Pro 5 16IRX9. Oferuje on nieco lepszą wydajność graficzną przy użyciu tej samej konfiguracji CPU/GPU, ale posiada tylko jeden dysk SSD i nadal wykorzystuje moduł WiFi 6E (Aorus: WiFi 7).
Cena i dostępność
Obecnie Aorus 16X ASG można kupić za 1 949,99 USD na Amazon.
Aorus 16X 2024
- 09/04/2024 v7 (old)
Sascha Mölck
Przezroczystość
Wyboru urządzeń do recenzji dokonuje nasza redakcja. Próbka testowa została udostępniona autorowi jako pożyczka od producenta lub sprzedawcy detalicznego na potrzeby tej recenzji. Pożyczkodawca nie miał wpływu na tę recenzję, producent nie otrzymał też kopii tej recenzji przed publikacją. Nie było obowiązku publikowania tej recenzji. Jako niezależna firma medialna, Notebookcheck nie podlega władzy producentów, sprzedawców detalicznych ani wydawców.
Tak testuje Notebookcheck
Każdego roku Notebookcheck niezależnie sprawdza setki laptopów i smartfonów, stosując standardowe procedury, aby zapewnić porównywalność wszystkich wyników. Od około 20 lat stale rozwijamy nasze metody badawcze, ustanawiając przy tym standardy branżowe. W naszych laboratoriach testowych doświadczeni technicy i redaktorzy korzystają z wysokiej jakości sprzętu pomiarowego. Testy te obejmują wieloetapowy proces walidacji. Nasz kompleksowy system ocen opiera się na setkach uzasadnionych pomiarów i benchmarków, co pozwala zachować obiektywizm.Price comparison

