Recenzja gamingowego laptopa MSI Pulse 17 B13V: Z cichymi skrzydłami
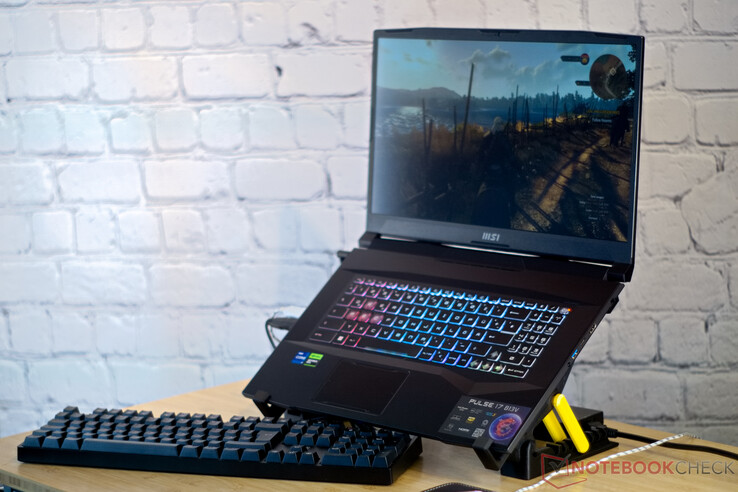
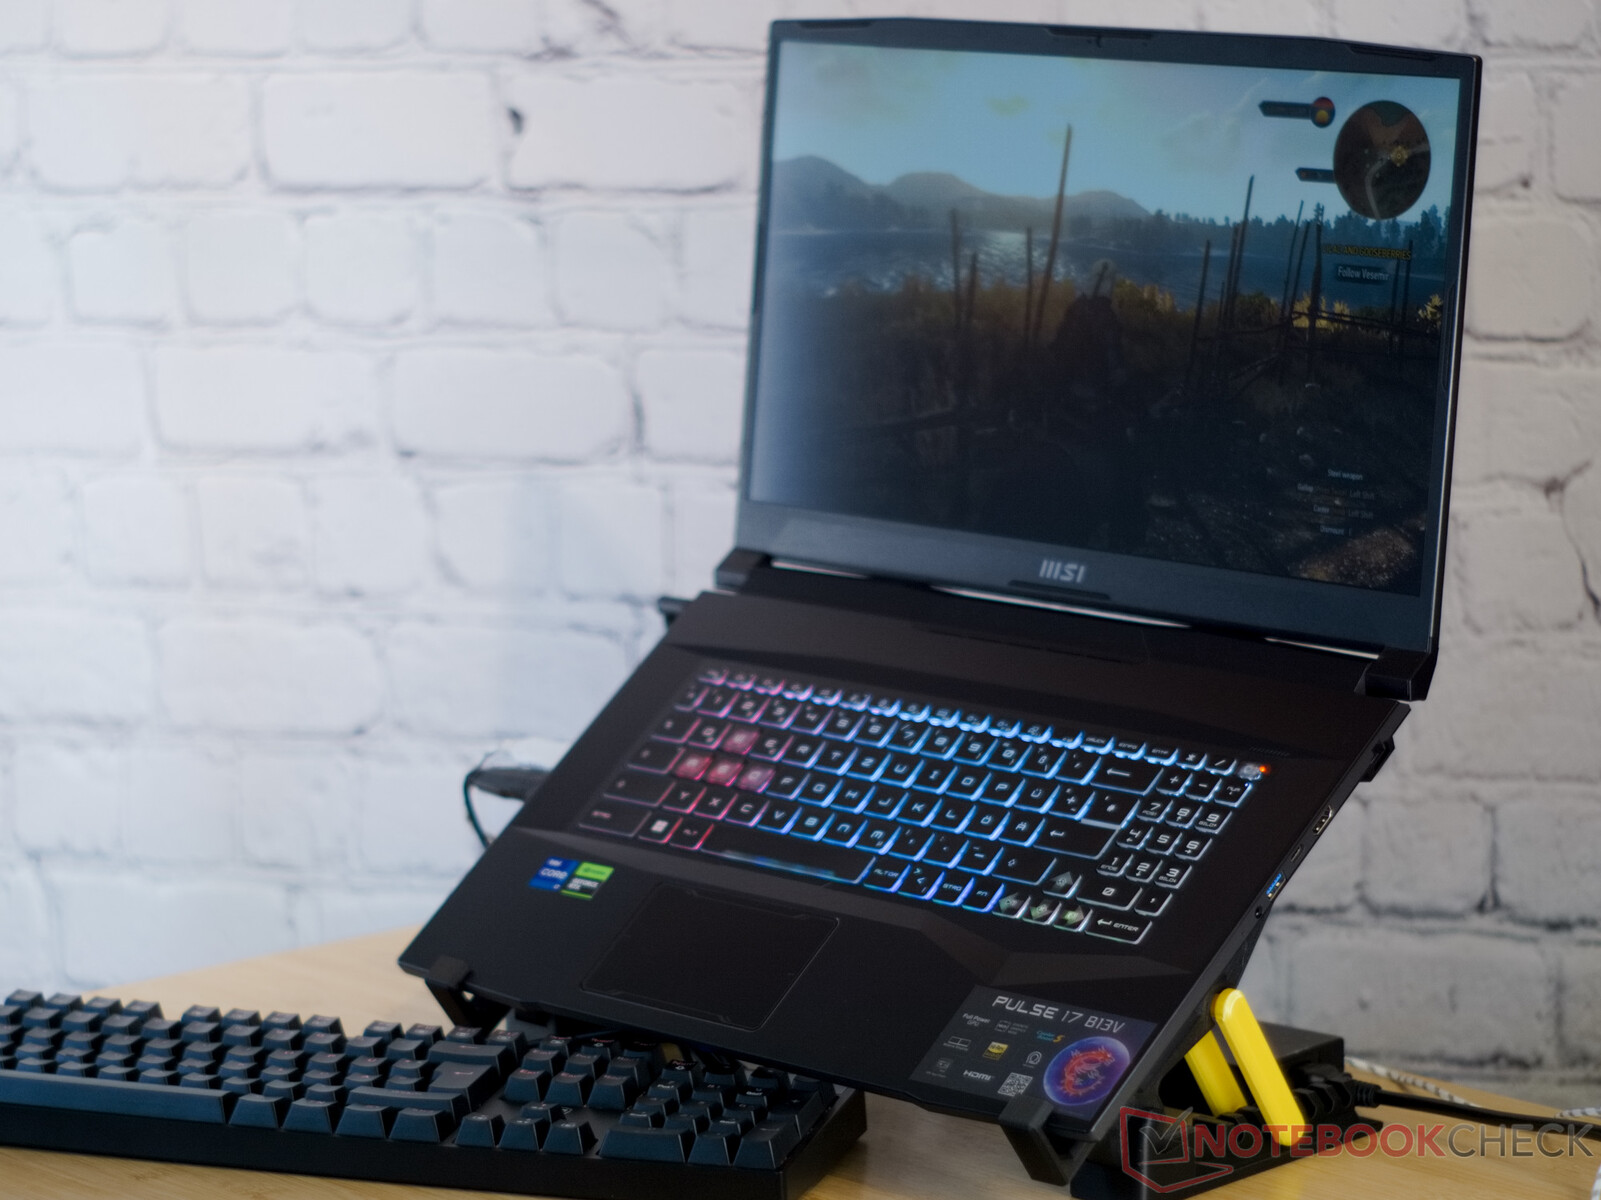
Wraz z MSI Pulse 17, Czerwony Smok przynosi gamingowego laptopa, którego wygląd zewnętrzny przypomina nieco science fiction. Wrażenie to wynika z pokrywy wyświetlacza wykonanej z anodyzowanego aluminium, wielu krawędzi i narożników, a nawet siatki o strukturze plastra miodu na spodzie 17-calowego laptopa. Ale wewnątrz laptopa działają aktualne komponenty, a nasz testowy egzemplarz jest wyposażony w Intel Core i7-13700Hi Nvidia GeForce RTX 4070. Kiedy my testowaliśmy poprzednika na początku rokuwydajność laptopa była przekonująca. Zauważyliśmy jednak również, że Pulse GL76 brakowało obsługi G-Sync, MUX, Advanced Optimus i Thunderbolt. Poziom hałasu wentylatorów w laptopie do gier również dawał pewne powody do narzekań.
Teraz MSI znacznie przerobiło laptopa, wprowadzając wiele ulepszeń, oprócz nowego projektu, generacji chipów i kryptycznej nazwy. Dzięki temu to potężne urządzenie znacznie awansowało w naszych rankingach. Porównujemy laptopa z Asus ROG Strix G17 G713PIiMSI Katana 17 B13VFKi Schenker XMG Focus 17 (E23).
Potencjalni konkurenci w porównaniu
Ocena | Data | Model | Waga | Wysokość | Rozmiar | Rezolucja | Cena |
|---|---|---|---|---|---|---|---|
| 86.3 % v7 (old) | 07/2023 | MSI Pulse 17 B13VGK i7-13700H, GeForce RTX 4070 Laptop GPU | 2.7 kg | 27.2 mm | 17.30" | 1920x1080 | |
| 83.2 % v7 (old) | 01/2023 | MSI Pulse GL76 12UGK i7-12700H, GeForce RTX 3070 Laptop GPU | 2.6 kg | 24.2 mm | 17.30" | 1920x1080 | |
| 82.1 % v7 (old) | 02/2023 | MSI Katana 17 B13VFK i7-13620H, GeForce RTX 4060 Laptop GPU | 2.8 kg | 25.2 mm | 17.30" | 1920x1080 | |
| 87.2 % v7 (old) | 07/2023 | Acer Nitro 17 AN17-51-71ER i7-13700H, GeForce RTX 4060 Laptop GPU | 3 kg | 30.3 mm | 17.30" | 2560x1440 | |
| 85.9 % v7 (old) | 06/2023 | Schenker XMG Focus 17 (E23) i9-13900HX, GeForce RTX 4070 Laptop GPU | 2.9 kg | 29.3 mm | 17.30" | 2560x1440 | |
| 88.4 % v7 (old) | 04/2023 | Asus ROG Strix G17 G713PI R9 7945HX, GeForce RTX 4070 Laptop GPU | 2.8 kg | 30.7 mm | 17.30" | 2560x1440 |
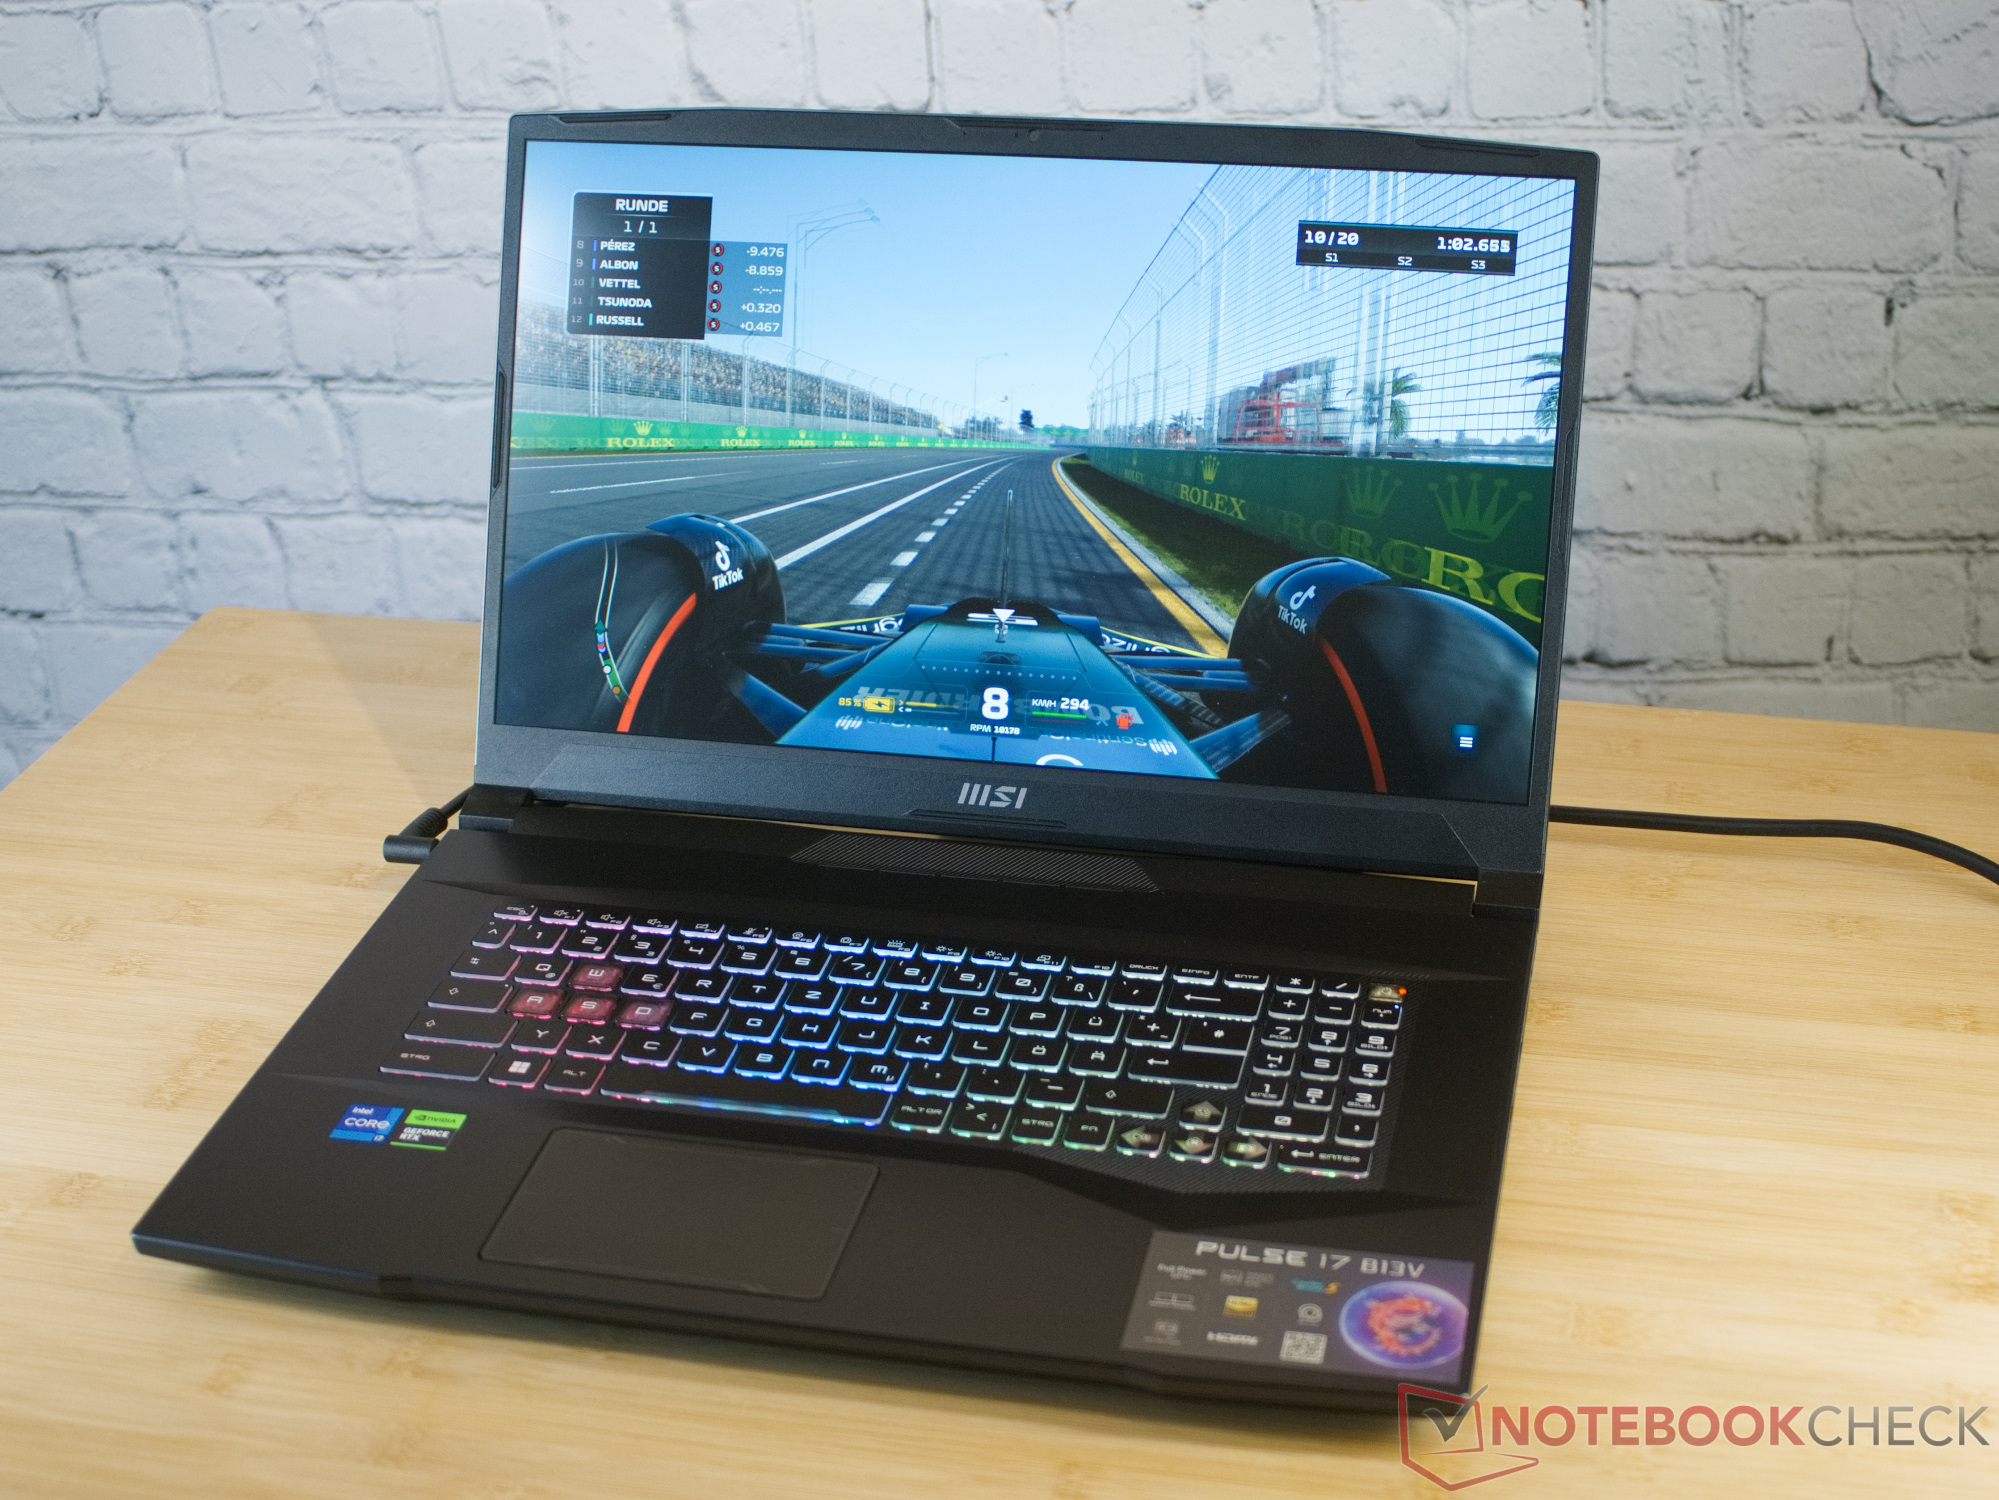
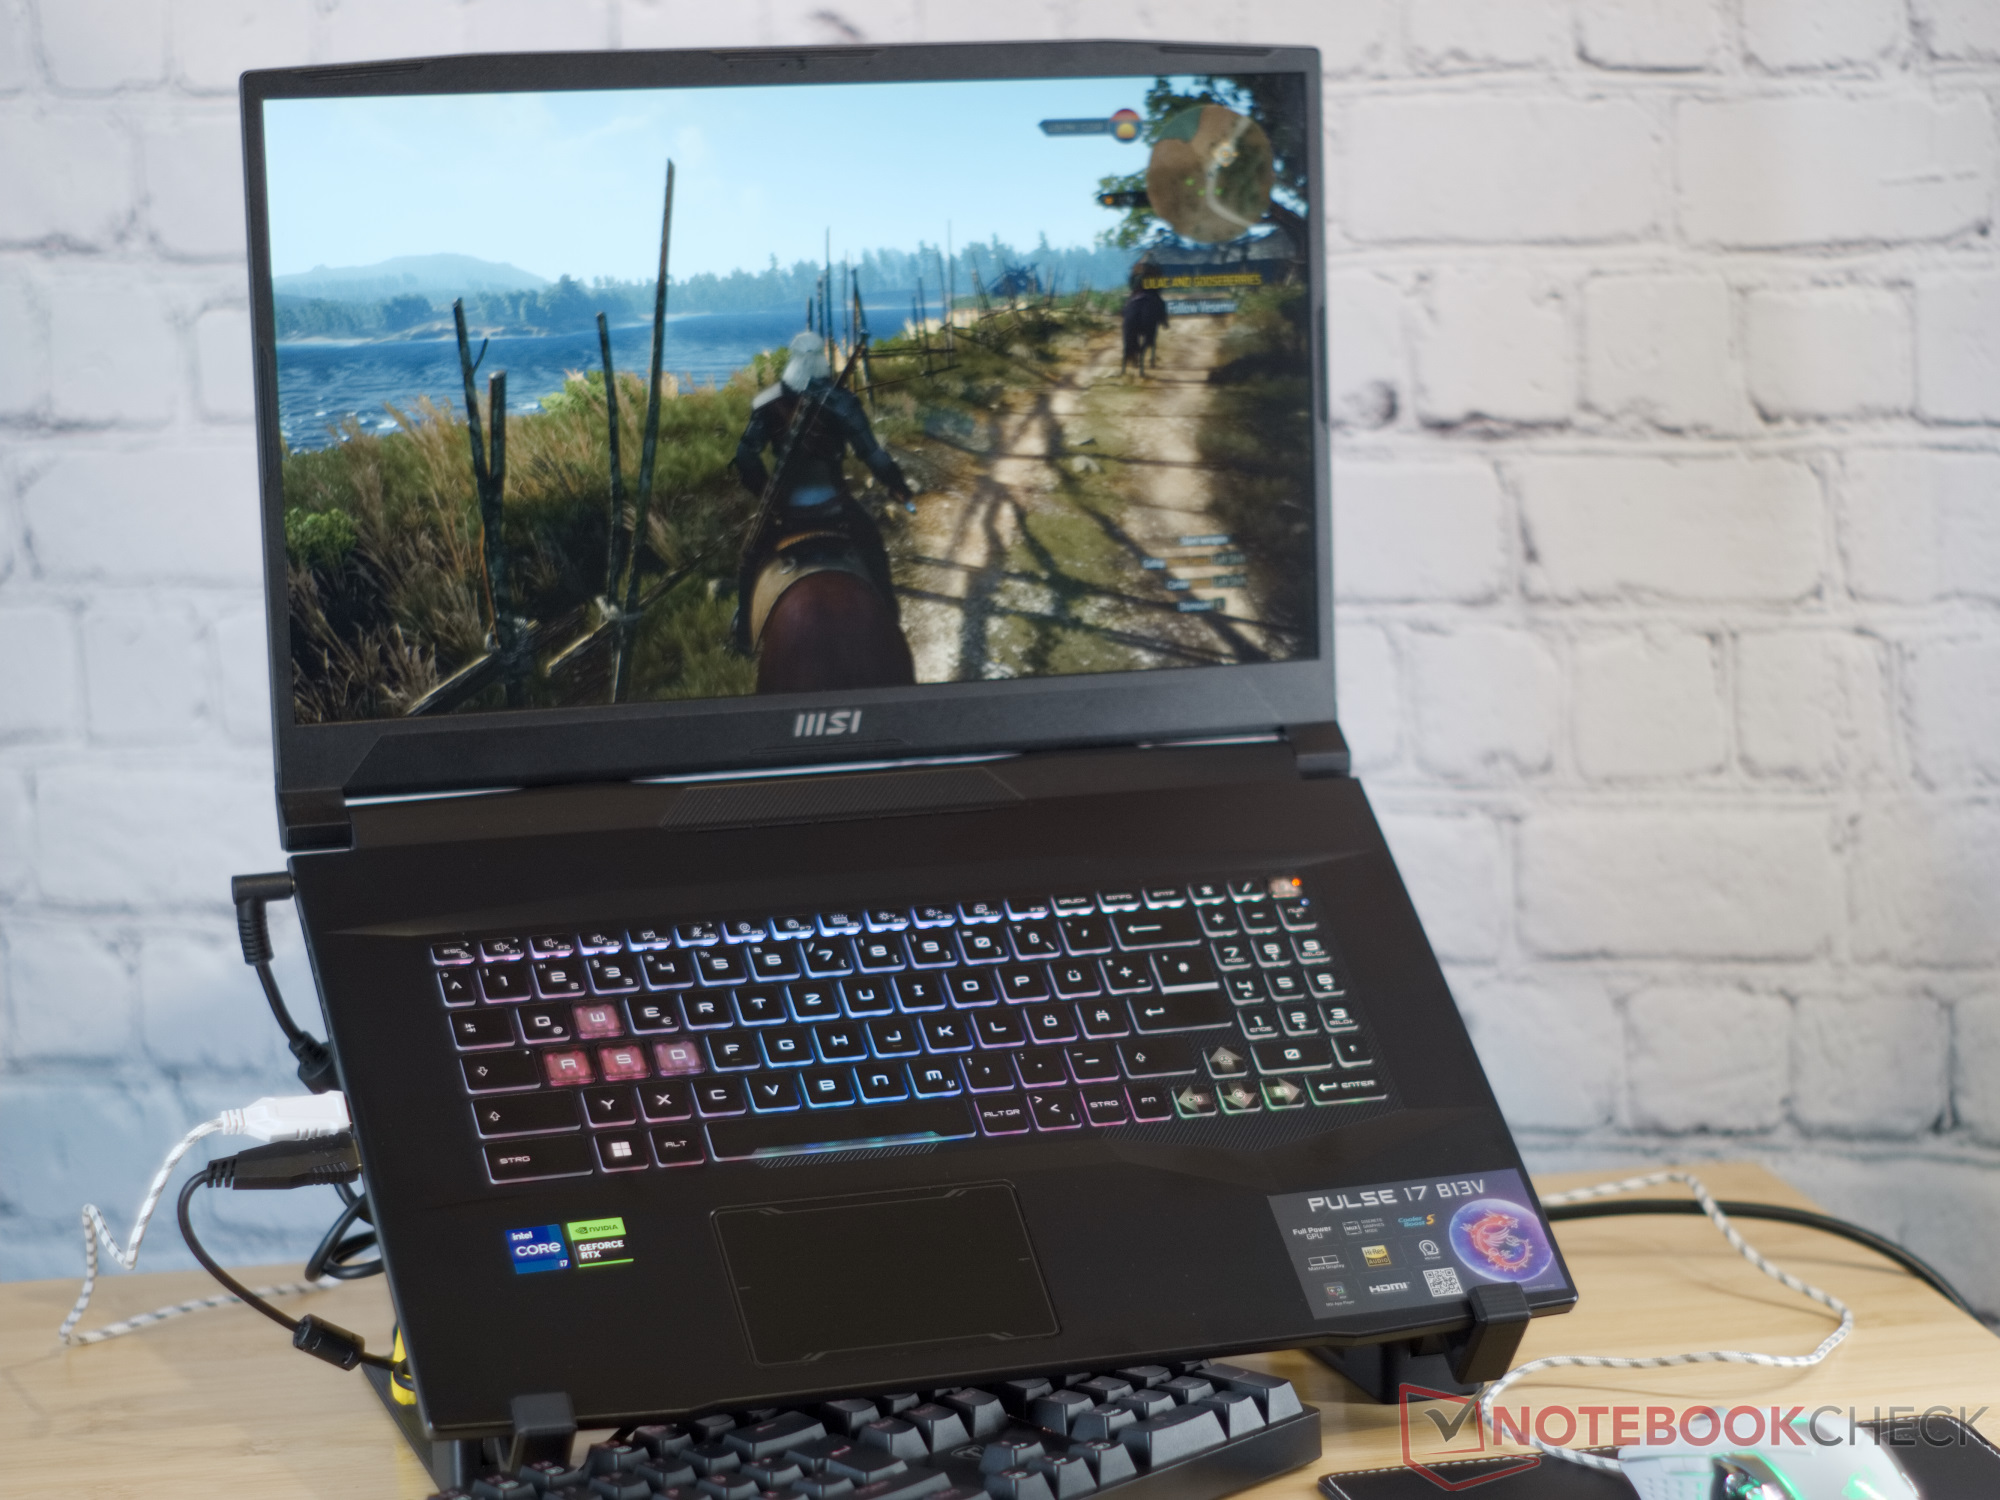
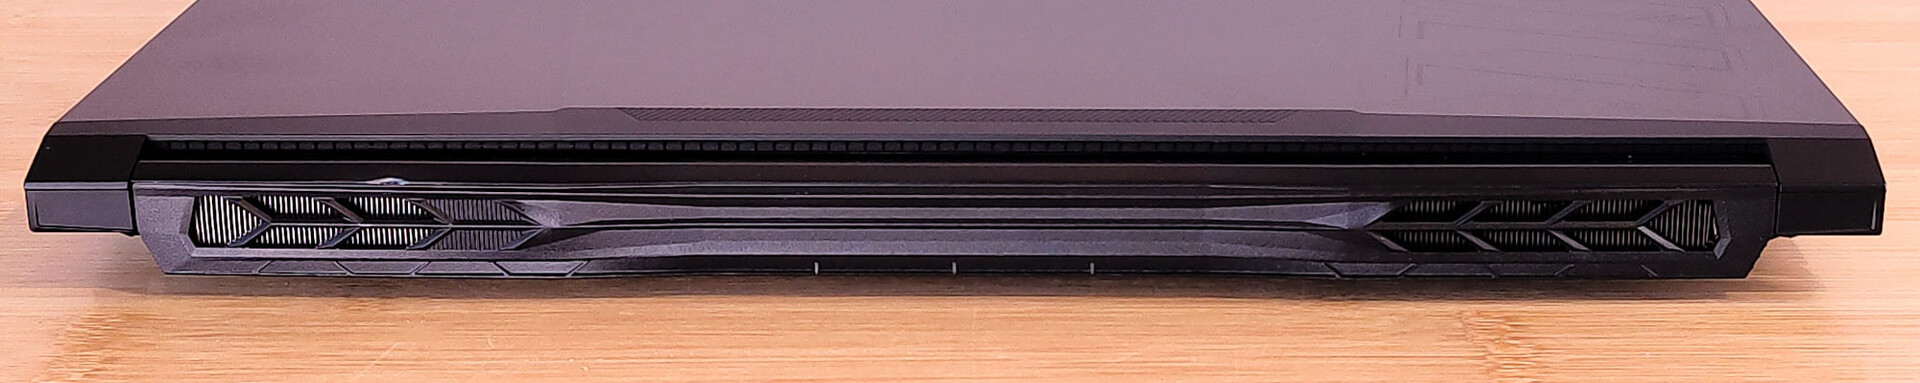
Obudowa - Aluminiowa pokrywa wyświetlacza o wyglądzie science-fiction
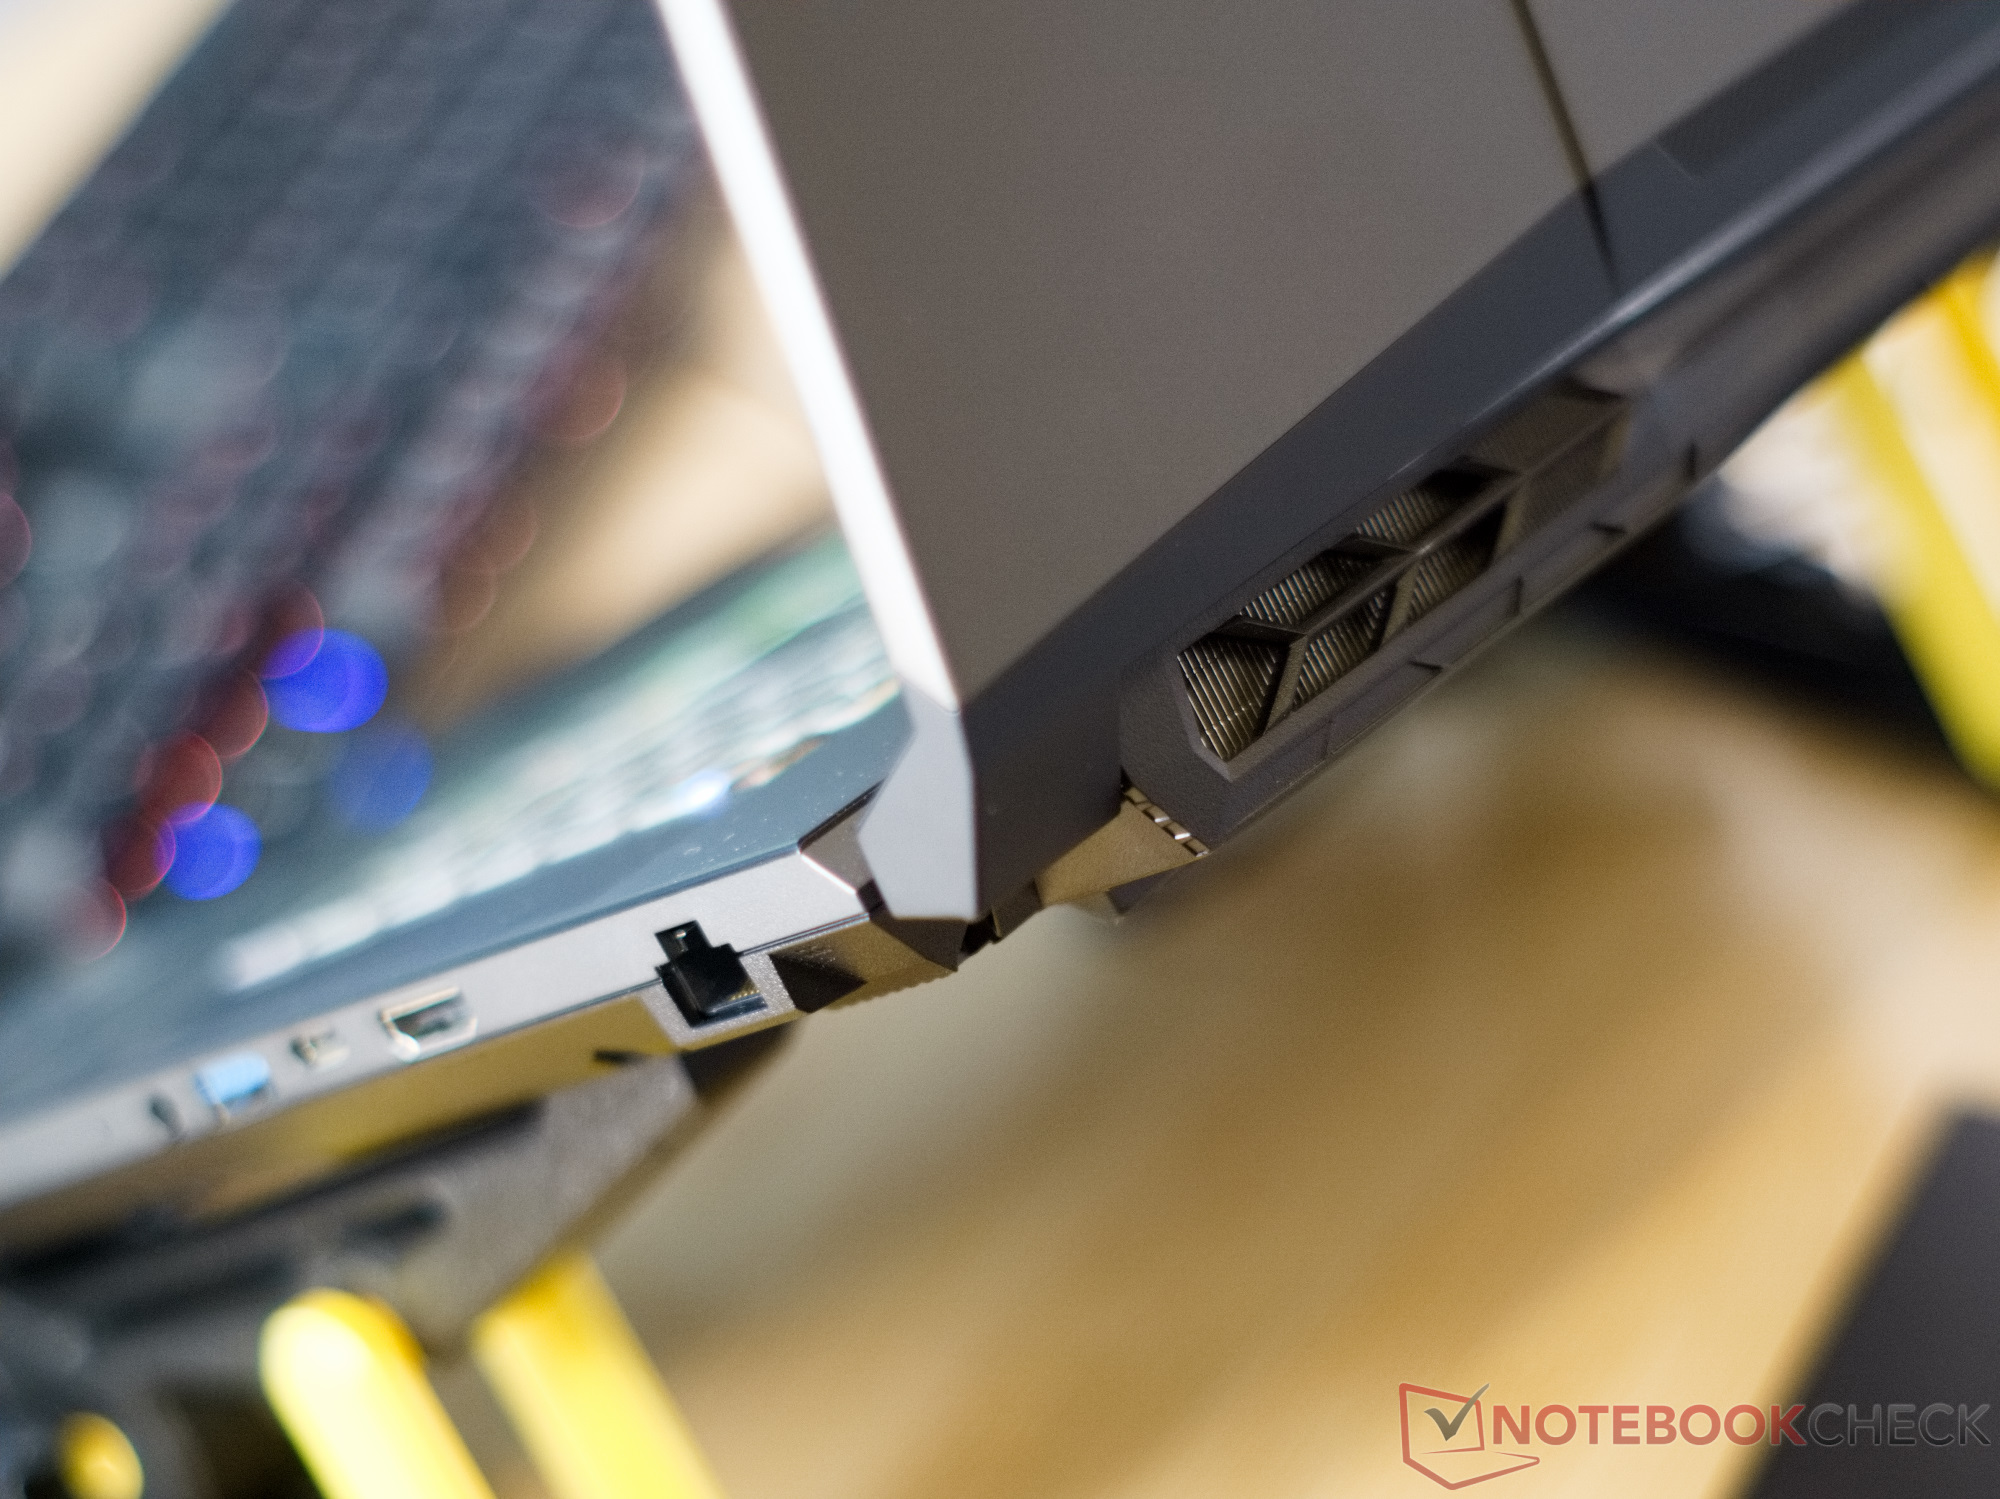
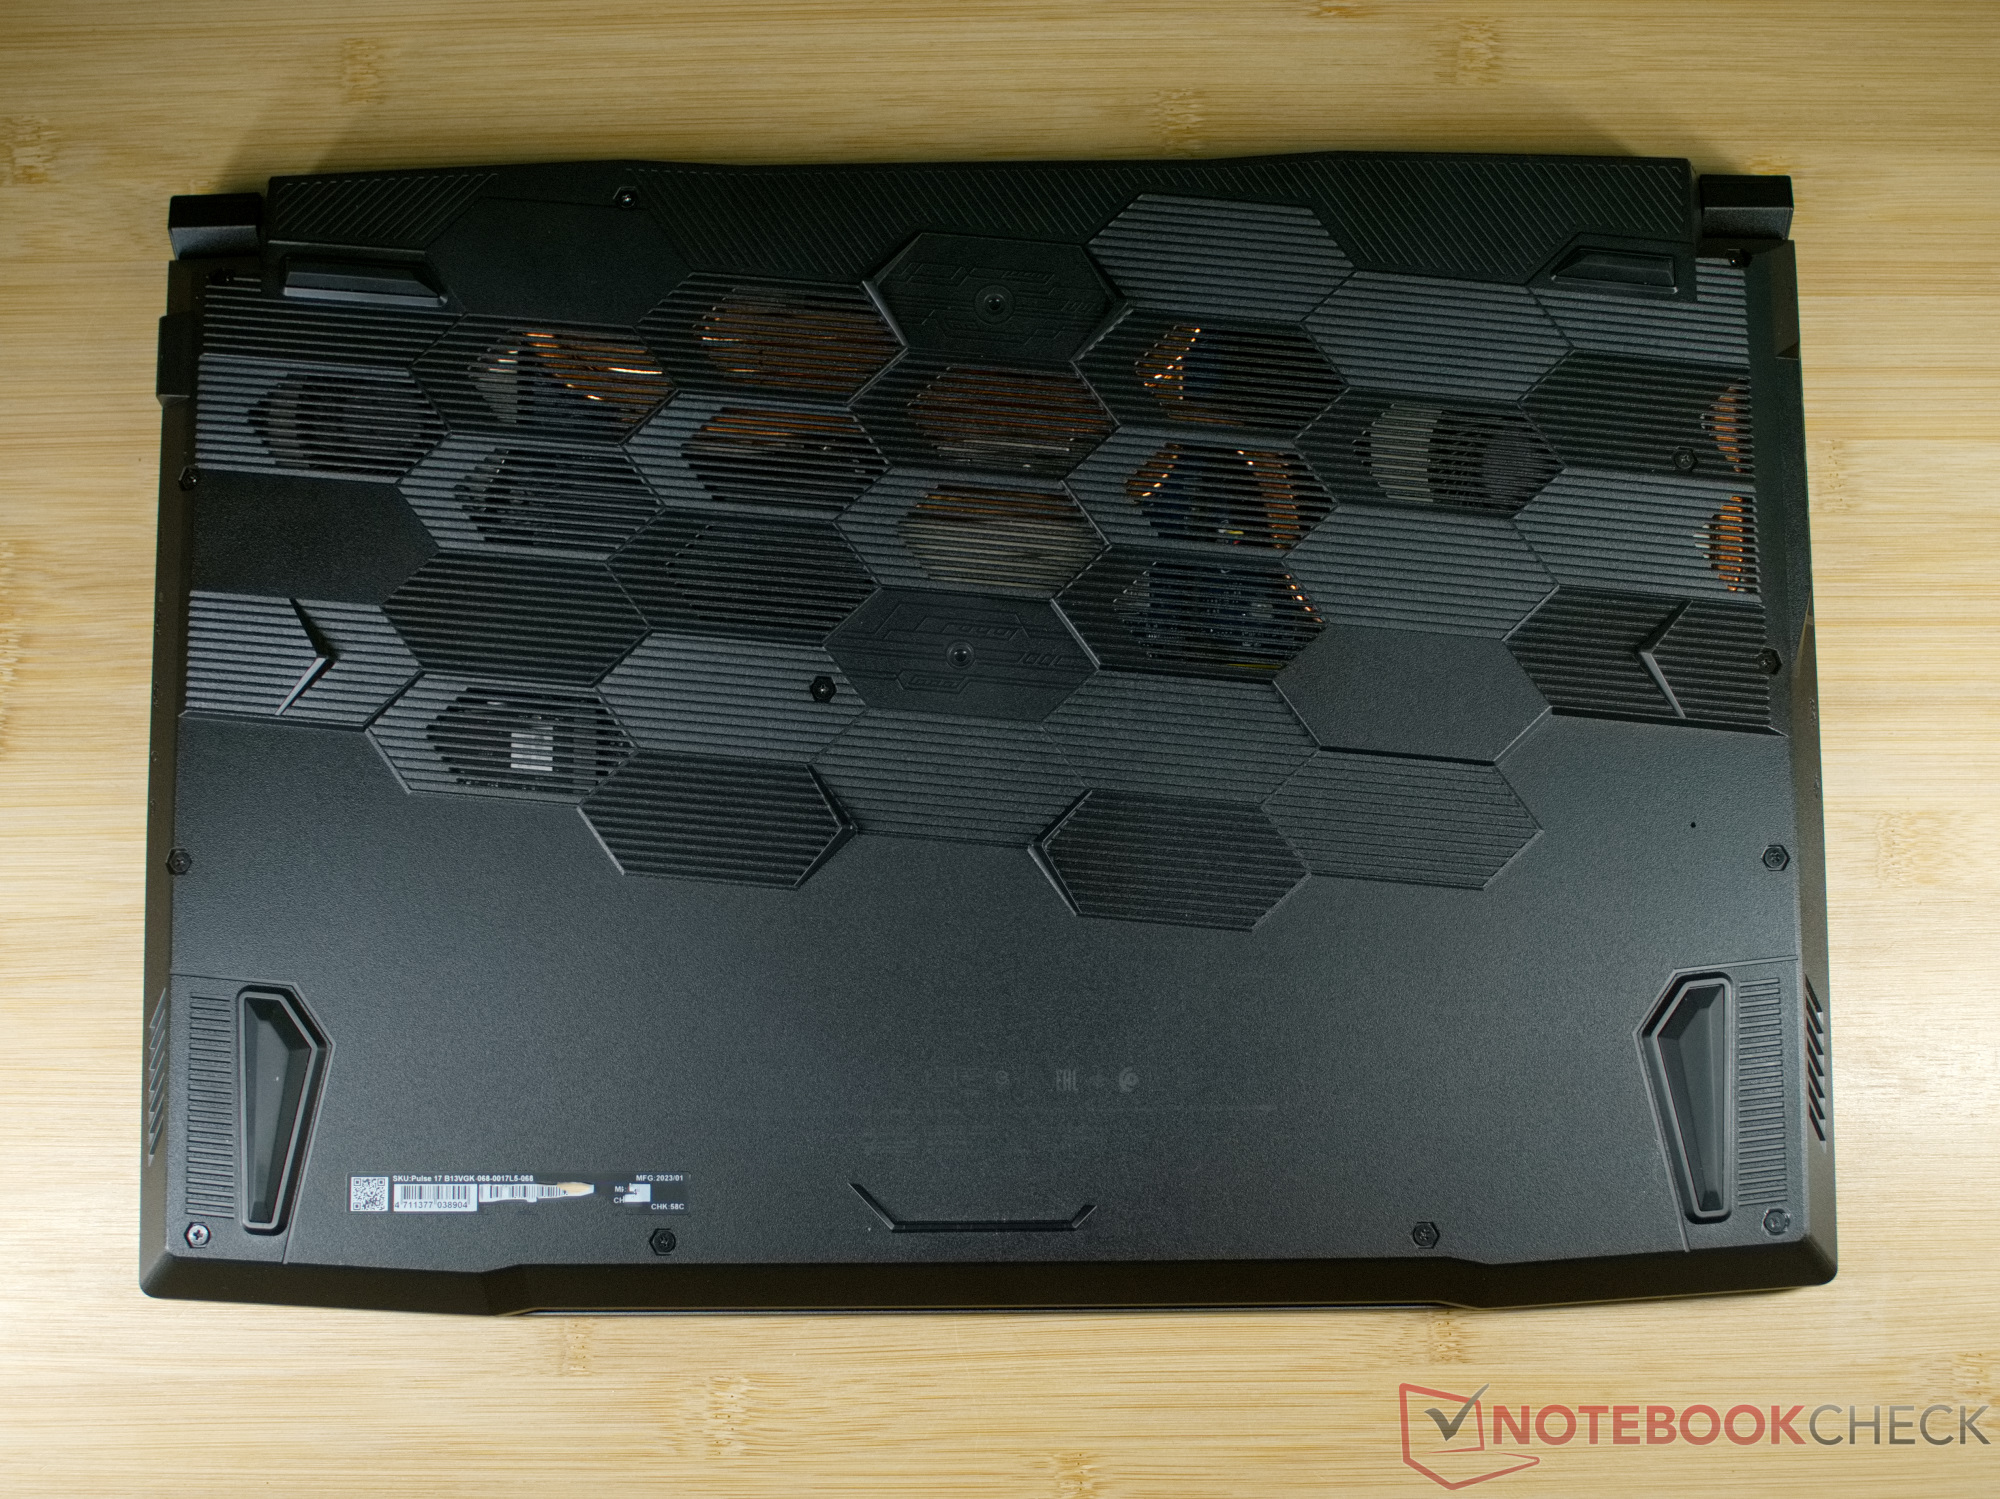
Prawie wszystkie obecne laptopy gamingowe od MSI są zaprojektowane według podobnej koncepcji. Raz po raz MSI wykorzystuje agresywne linie na pokrywie wyświetlacza, a także ostre zawiasy i wzór plastra miodu na spodzie obudowy. W Pulse 17, aluminiowa pokrywa wyświetlacza jest ozdobiona krawędziami, które nadają laptopowi dodatkowy klimat science-fiction. Pod pokrywą, futurystyczny motyw jest kontynuowany, a MSI również dodaje tutaj wiele elementów projektowych.
Jednocześnie obudowa MSI Pulse 17 jest dość solidna, ale duży rozmiar laptopa oznacza również, że nadal możliwe jest lekkie wypaczenie lub wciśnięcie plastikowych elementów. Niemniej jednak, Pulse 17 prezentuje się ogólnie jako solidne urządzenie. Duży wyświetlacz można otworzyć o 180° i jest on w stanie do pewnego stopnia utrzymać swoją pozycję. Zawiasy są prawie zbyt łatwe do poruszenia, a lekkie wibracje lub stukanie w wyświetlacz już go nieco poruszą.
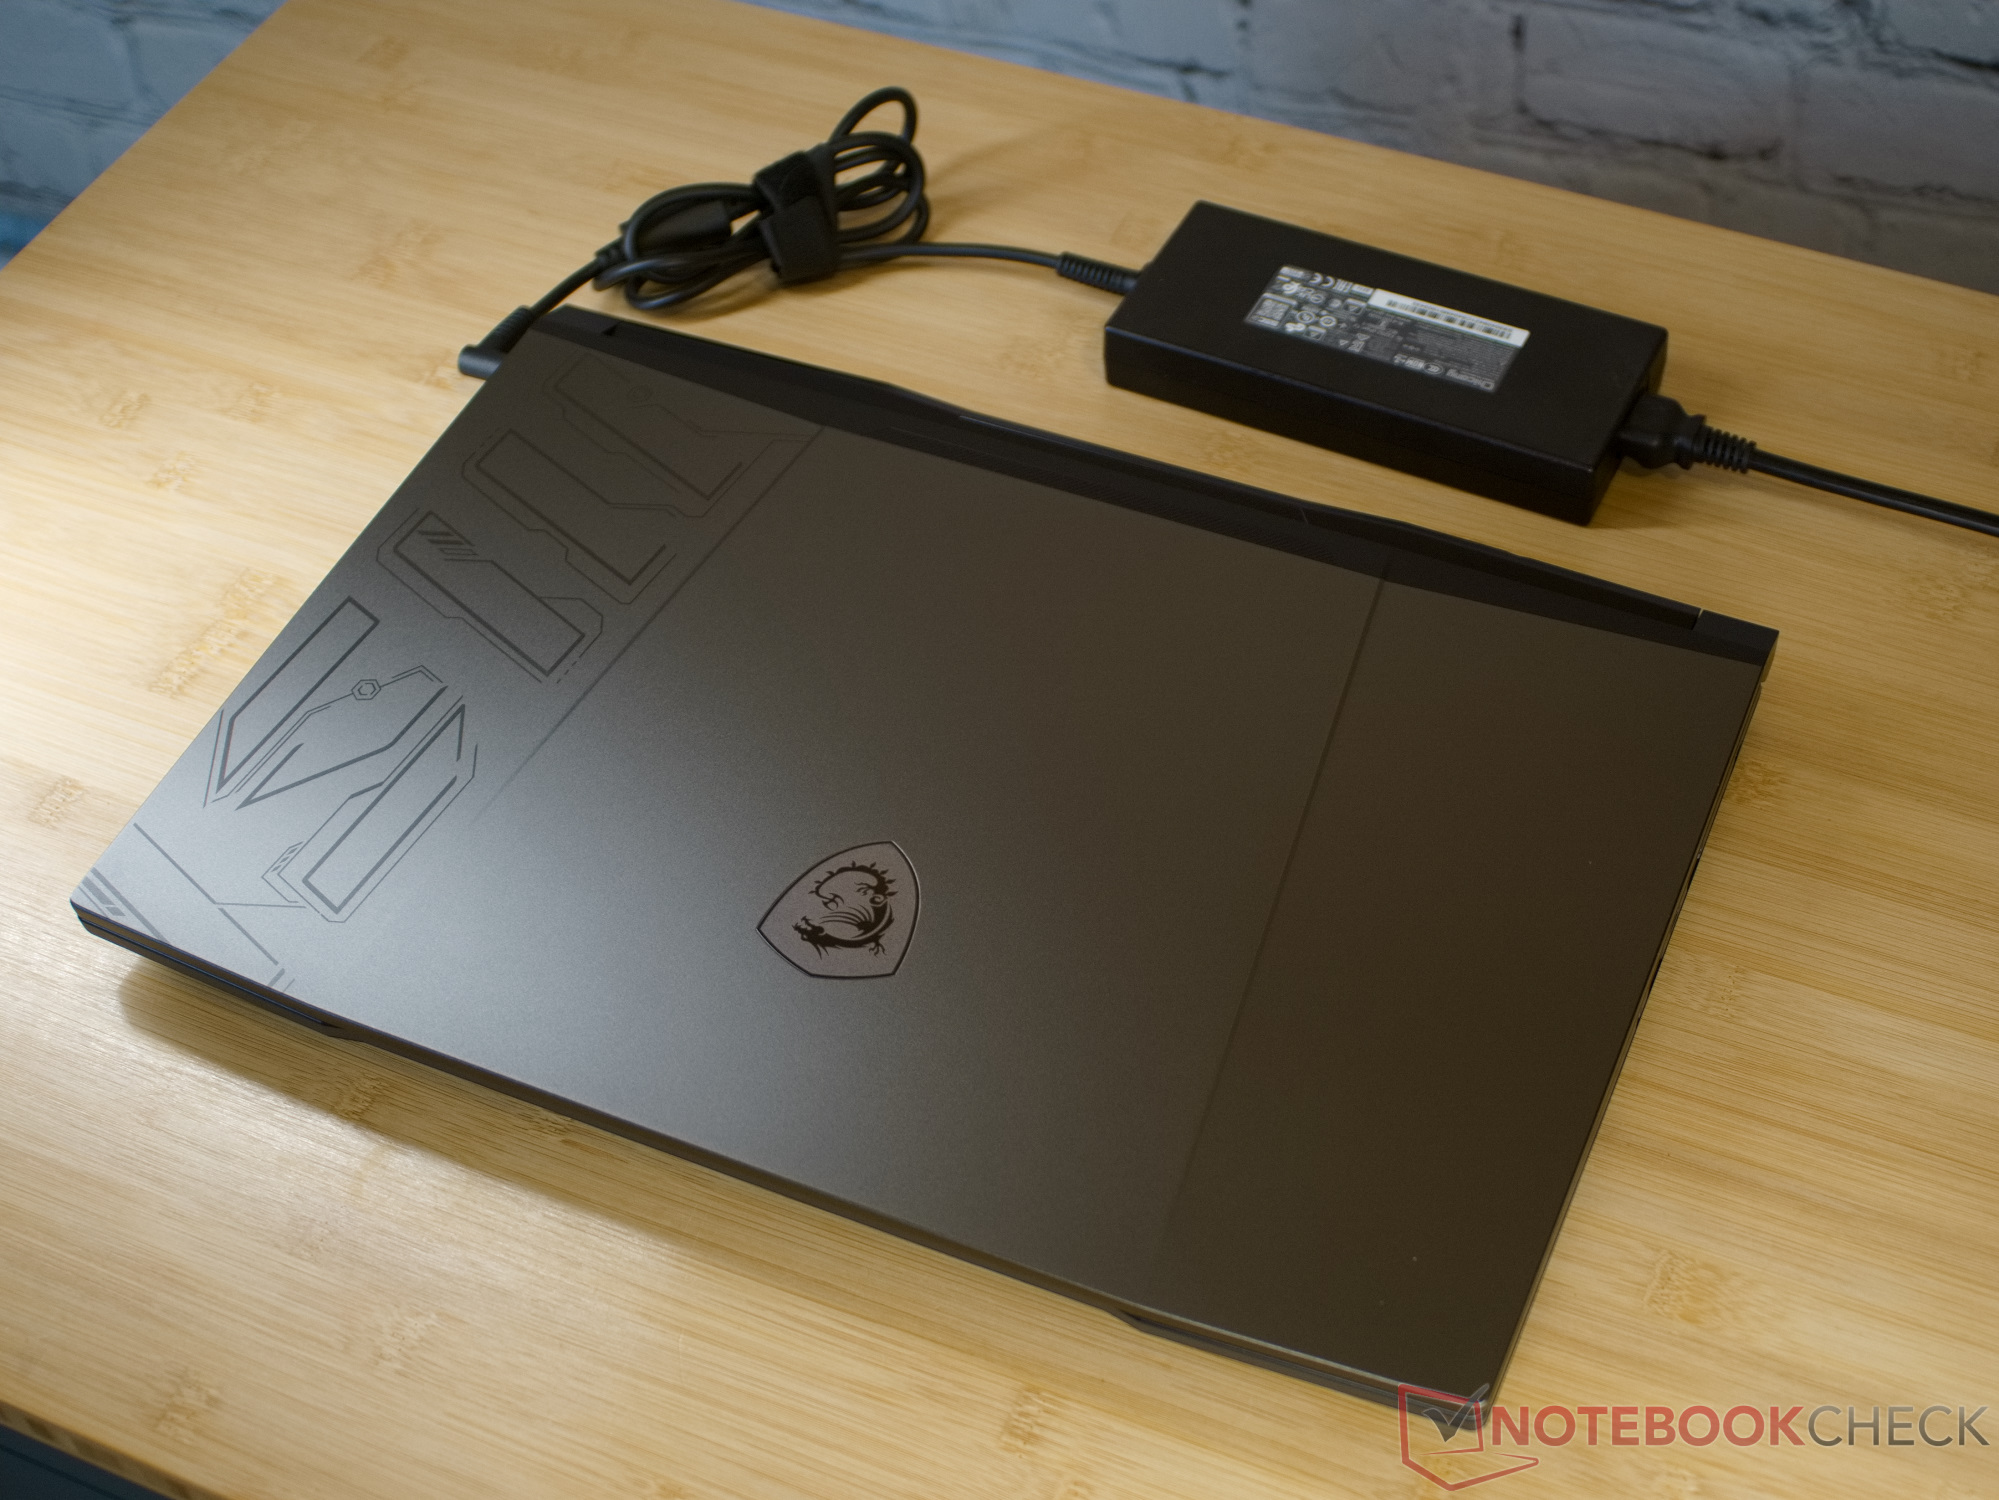
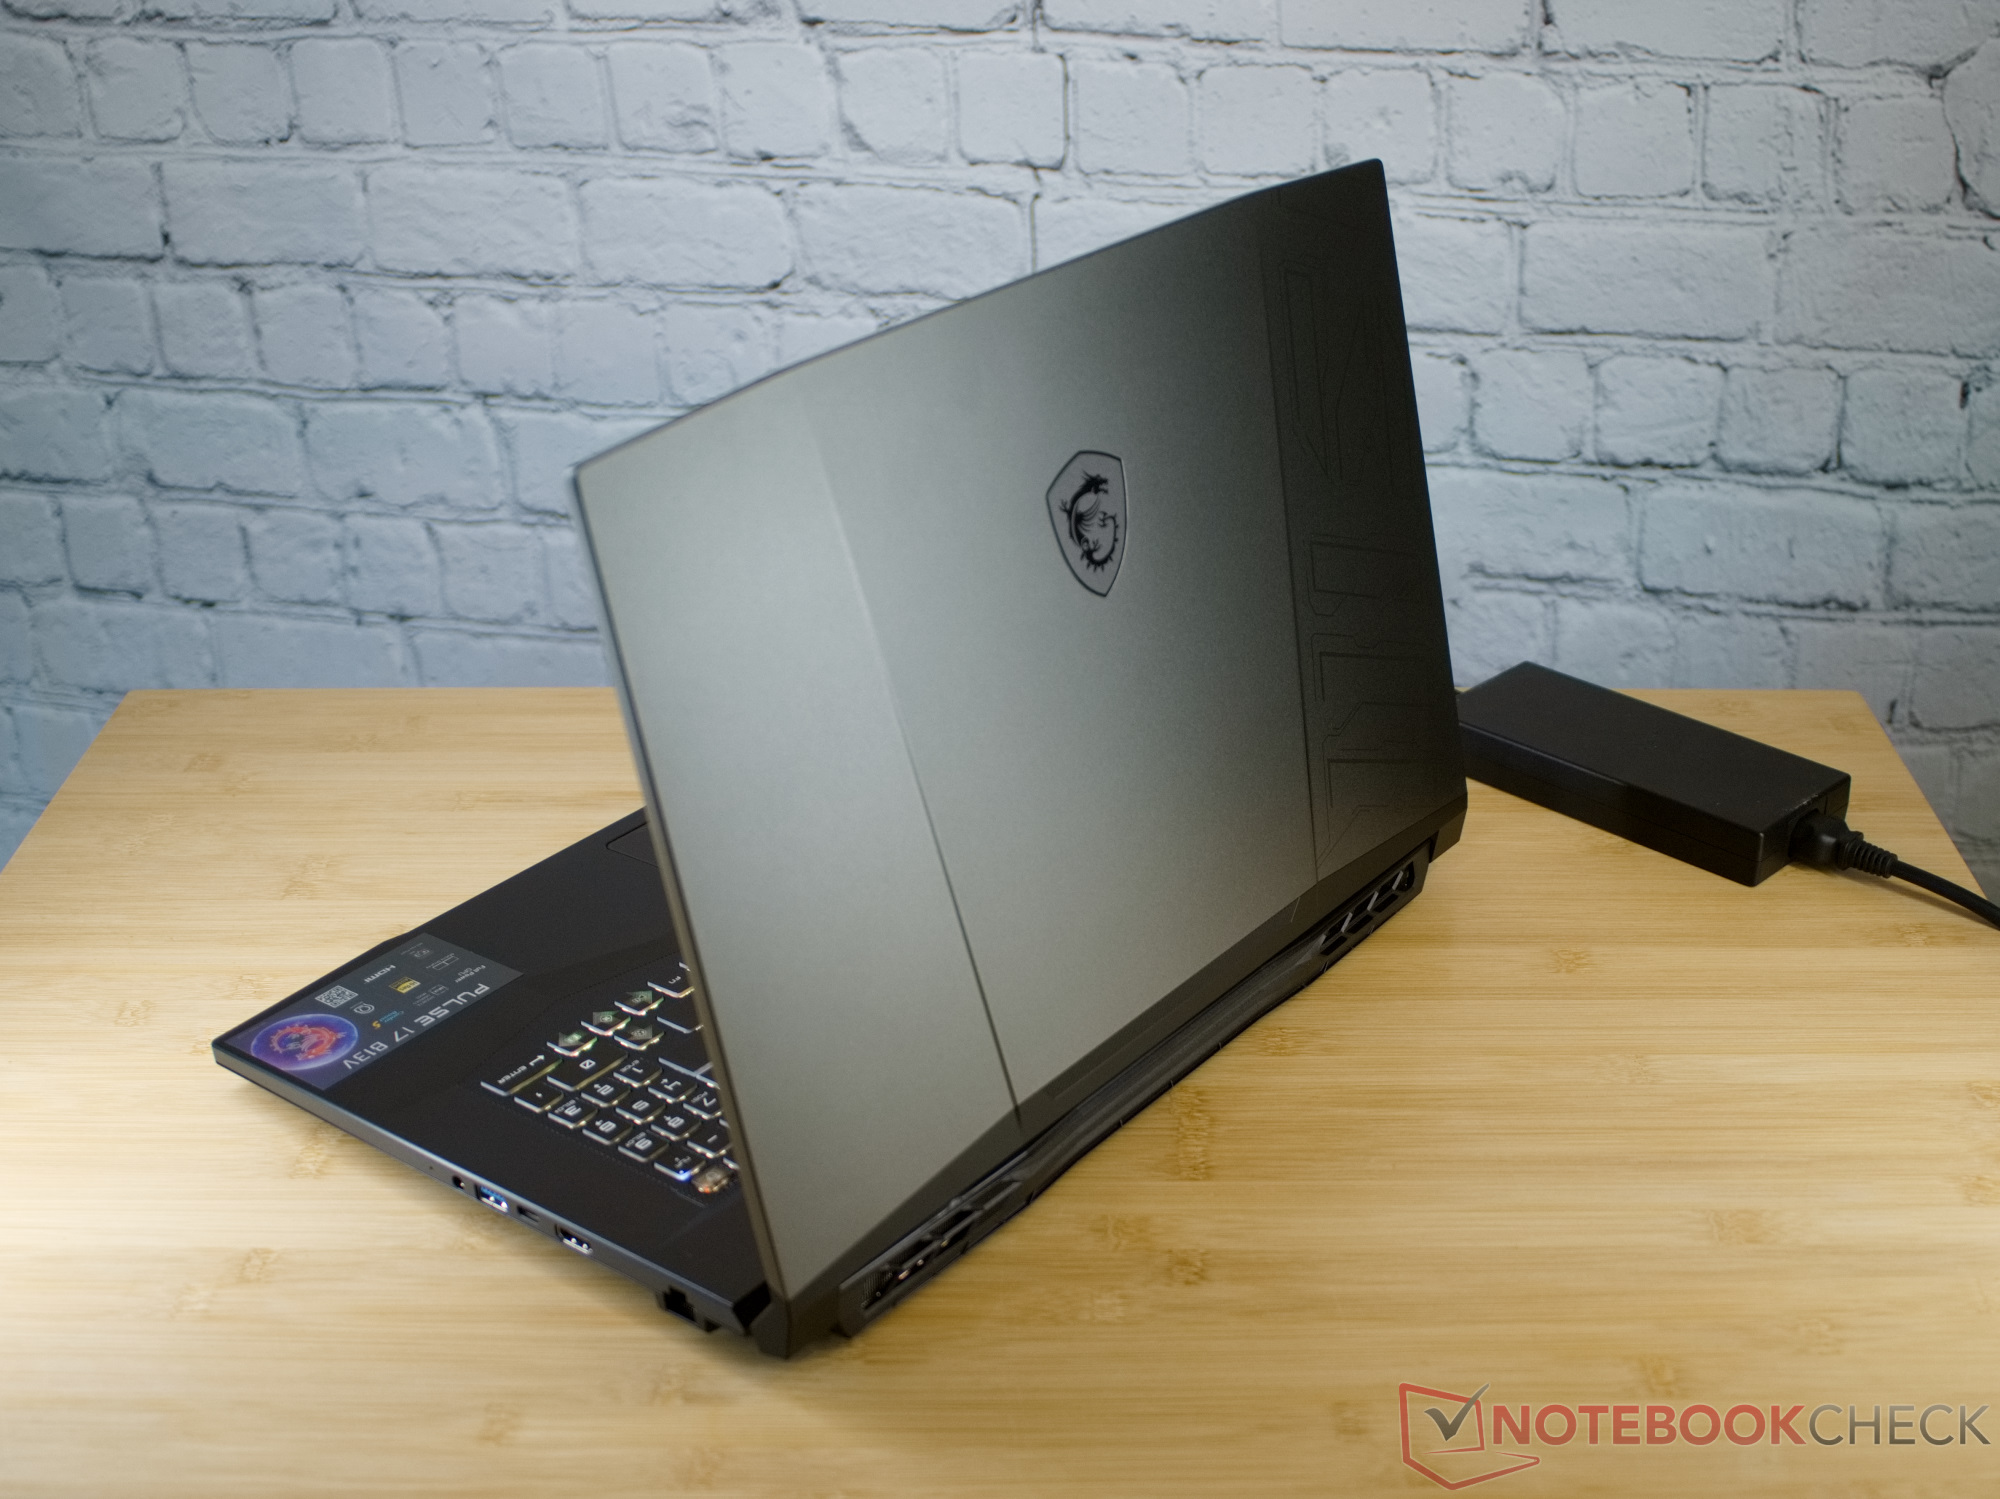
Z wagą 2,7 kg (~6 funtów), MSI Pulse 17 jest najlżejszy wśród swoich konkurentów o podobnych rozmiarach. Tylko poprzedni model waży mniej. Poza tym obecne laptopy do gier w naszym porównaniu różnią się dość nieznacznie pod względem wypełnienia torby.
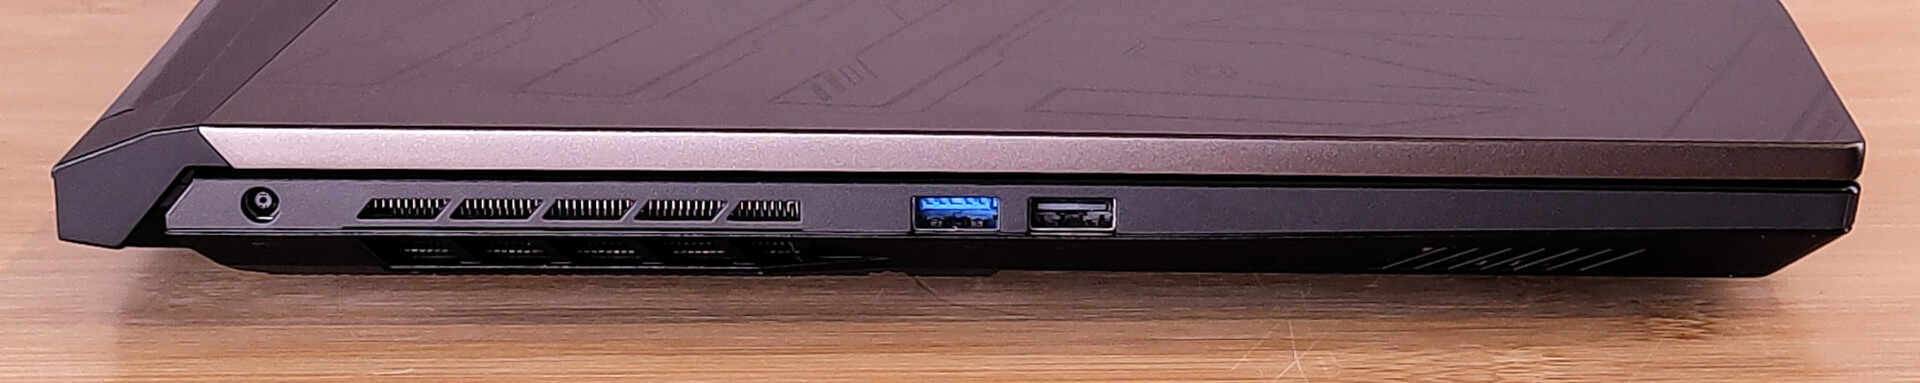
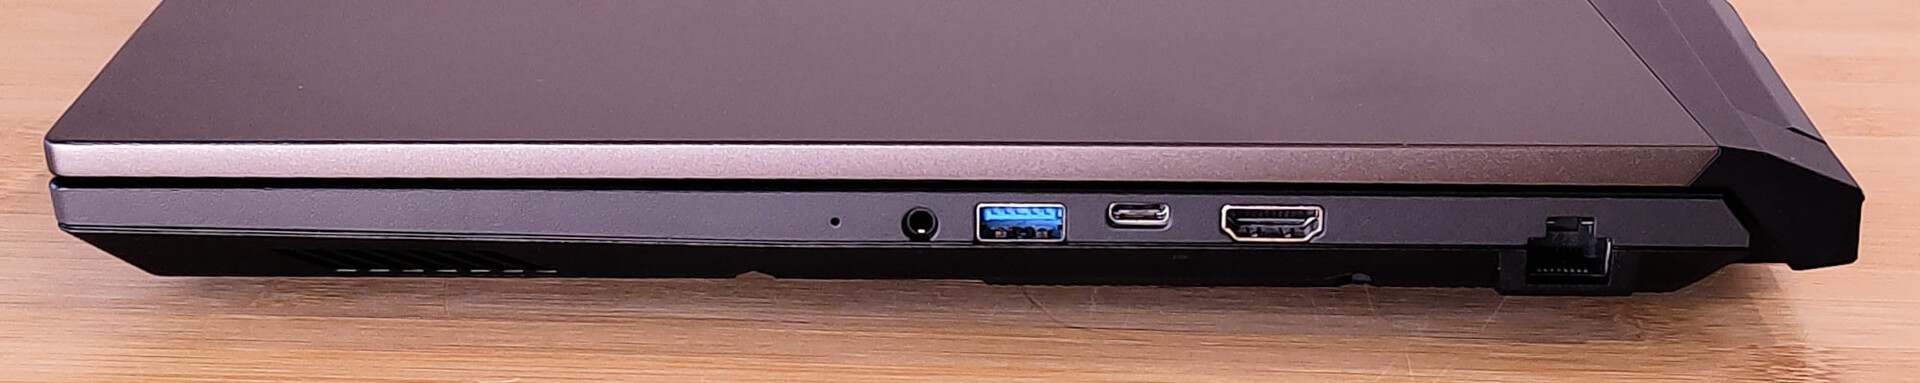
Wyposażenie - brak Thunderbolt i tylko USB 3.2 Gen 1
Fakt, że Pulse oferuje dwa złącza USB po każdej stronie, jest sprytnym rozwiązaniem, pozwalającym zarówno lewo-, jak i praworęcznym użytkownikom trzymać kable z dala od siebie. Jeden z portów USB po prawej stronie to złącze USB-C, ale niestety obsługuje ono tylko transfer danych i DisplayPort.
Komunikacja
Dzięki Gigabit LAN i WiFi 6 z modułu Intel AX201, Pulse 17 nie jest tak naprawdę na bieżąco pod względem technologii sieciowej. Z drugiej strony, nasza jednostka testowa pokazuje, że wysokie i stabilne prędkości transferu są również możliwe w sieci 5 GHz.
Kamera internetowa
Kamera internetowa MSI Pulse 17 również nie jest nowoczesna. Oferuje rozdzielczość HD i generuje raczej rozmyty obraz z silnymi odchyleniami chromatycznymi na kontrastowych krawędziach.


Akcesoria
Oprócz zwykłej dokumentacji, naklejki z czerwonym smokiem i ładowarki do laptopa, w pudełku nie znajdziemy żadnych dodatkowych akcesoriów.
Konserwacja
Jedna z 13 śrub Phillips PH0, które przytrzymują spód obudowy, jest chroniona naklejką w naszym testowym egzemplarzu. Chociaż MSI wielokrotnie podkreśla, że nie ma to znaczenia dla gwarancji, niektórzy sprzedawcy mogą protestować, jeśli plomba zostanie zerwana w przypadku gwarancji.
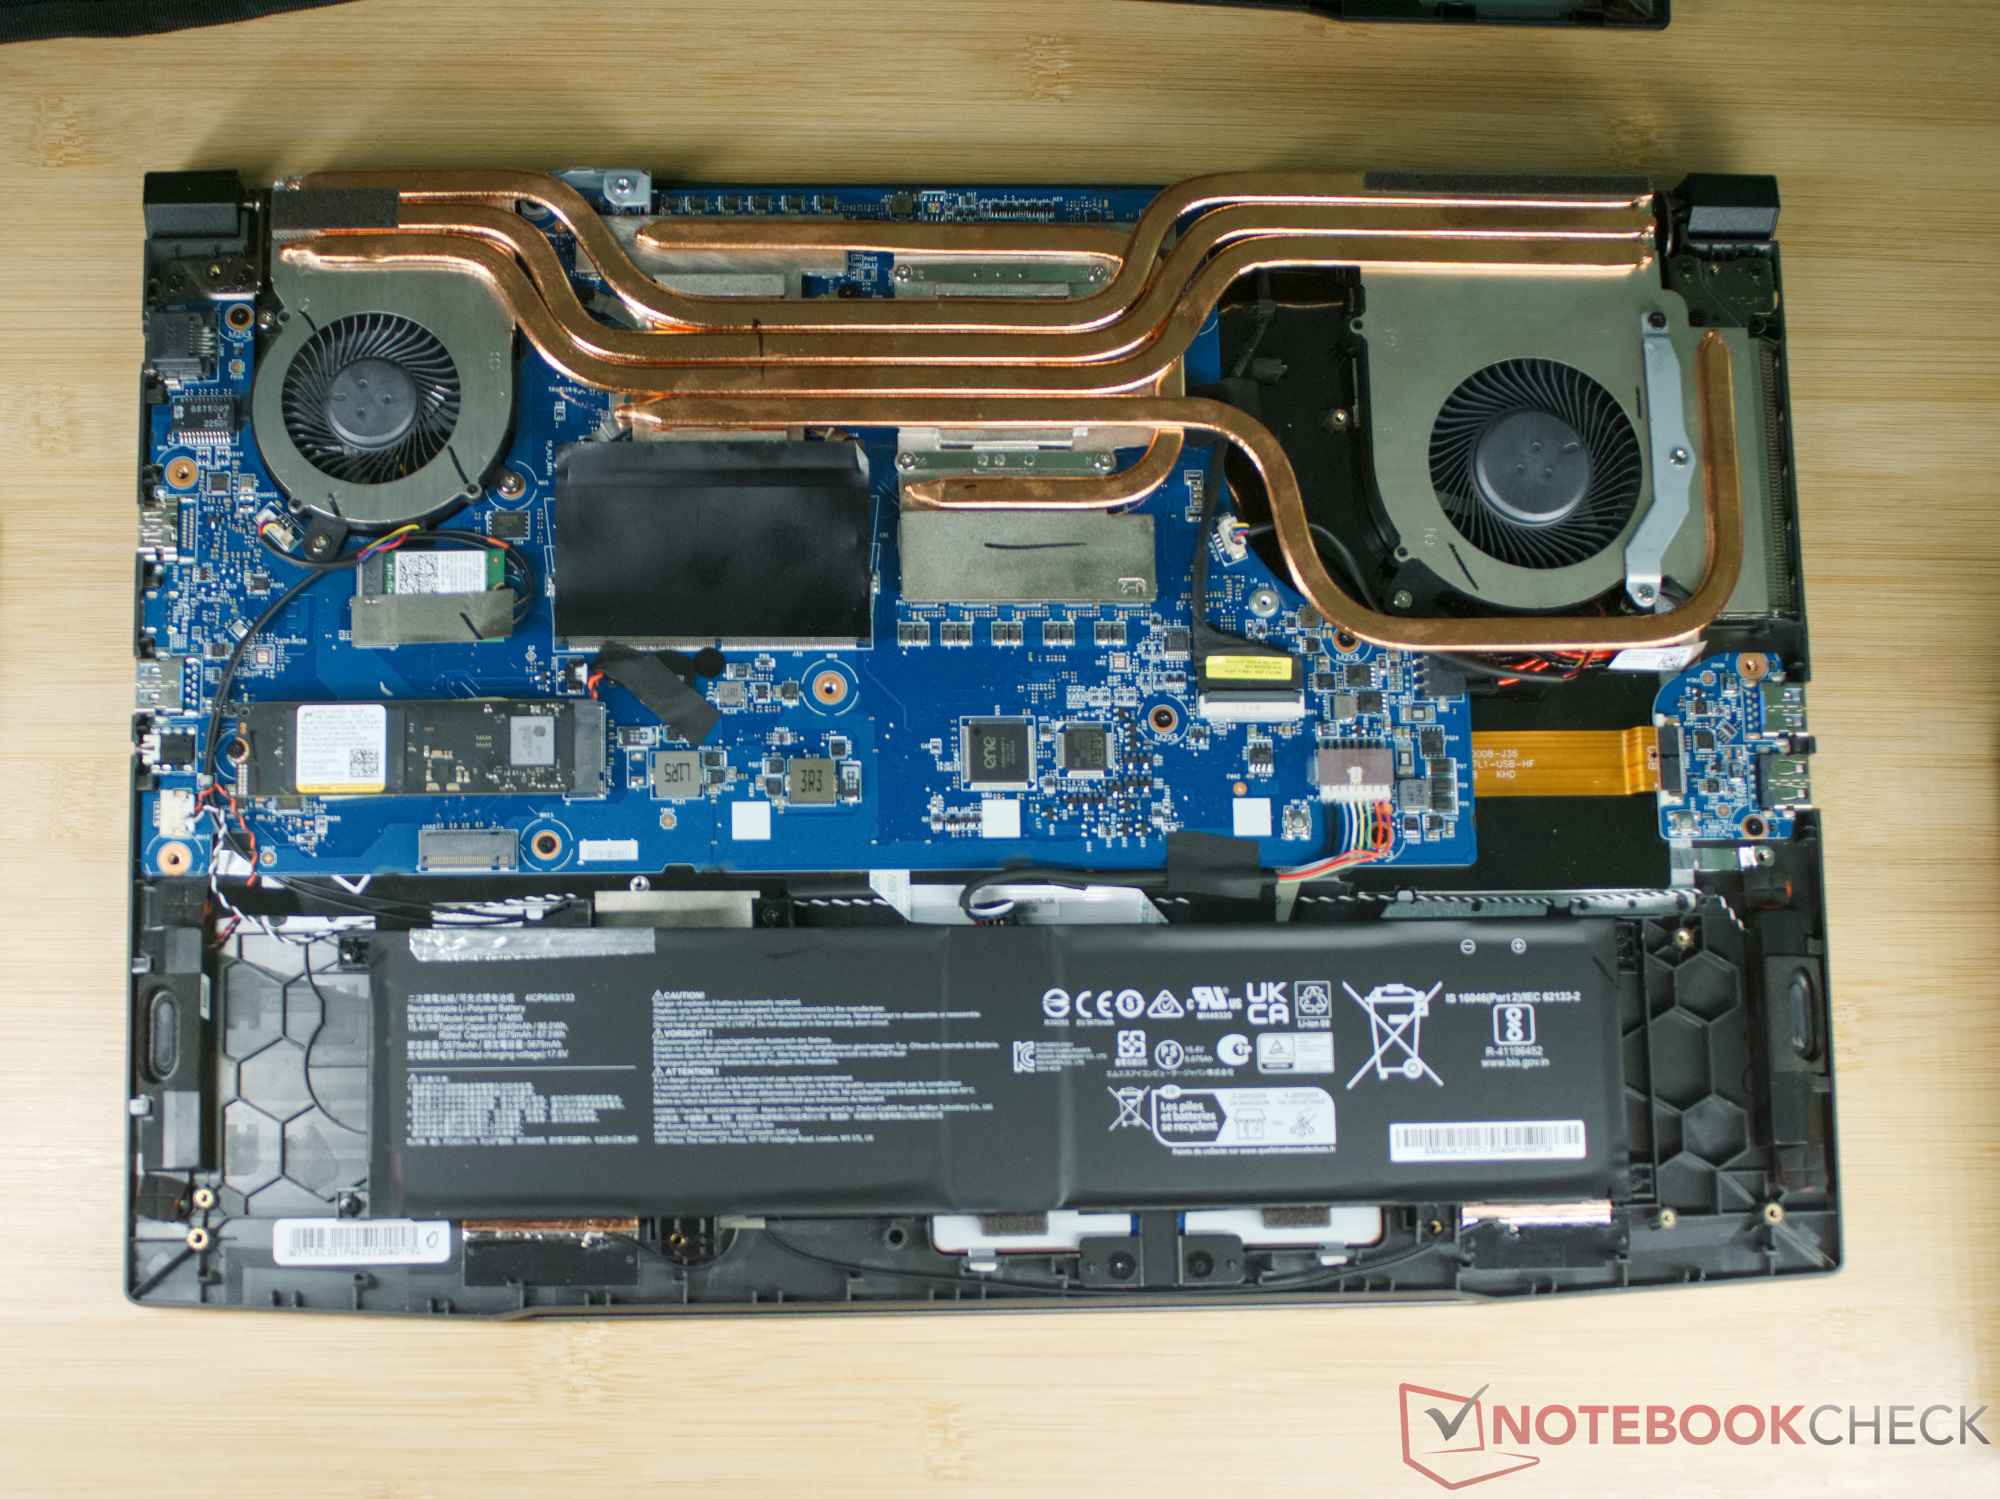
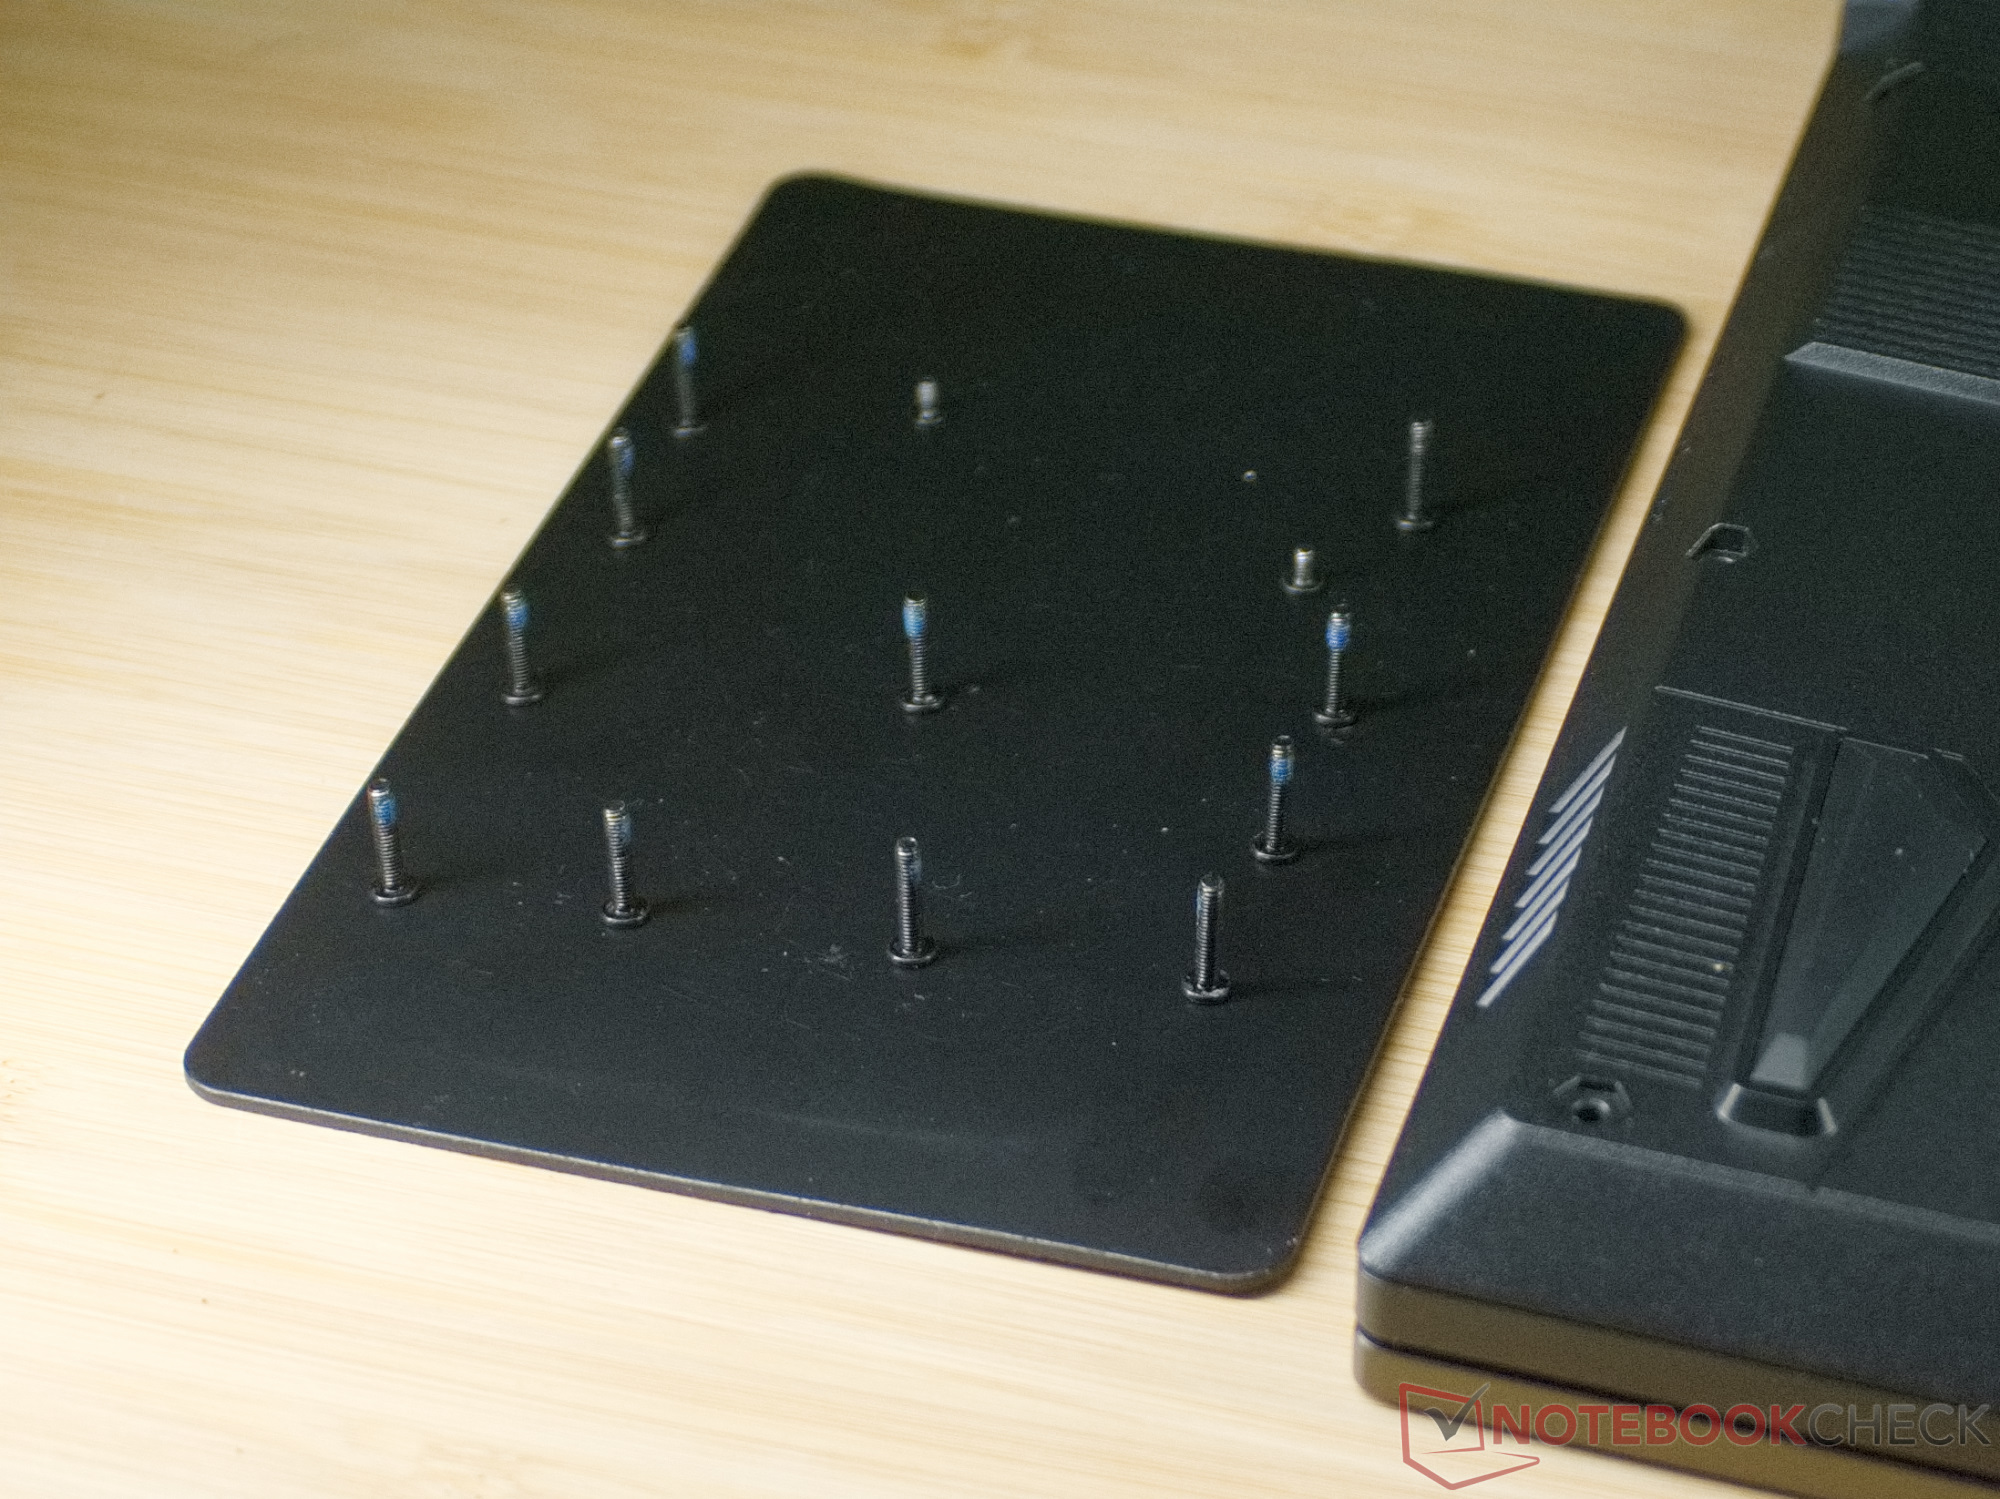
Podczas odkręcania 13 śrubek należy również zaznaczyć ich położenie, gdyż dwie z nich są znacznie krótsze. Dolna pokrywa jest również zabezpieczona kilkoma klipsami, ale można je łatwo otworzyć za pomocą plastikowego narzędzia do podważania, umożliwiając następnie podniesienie dolnej pokrywy.
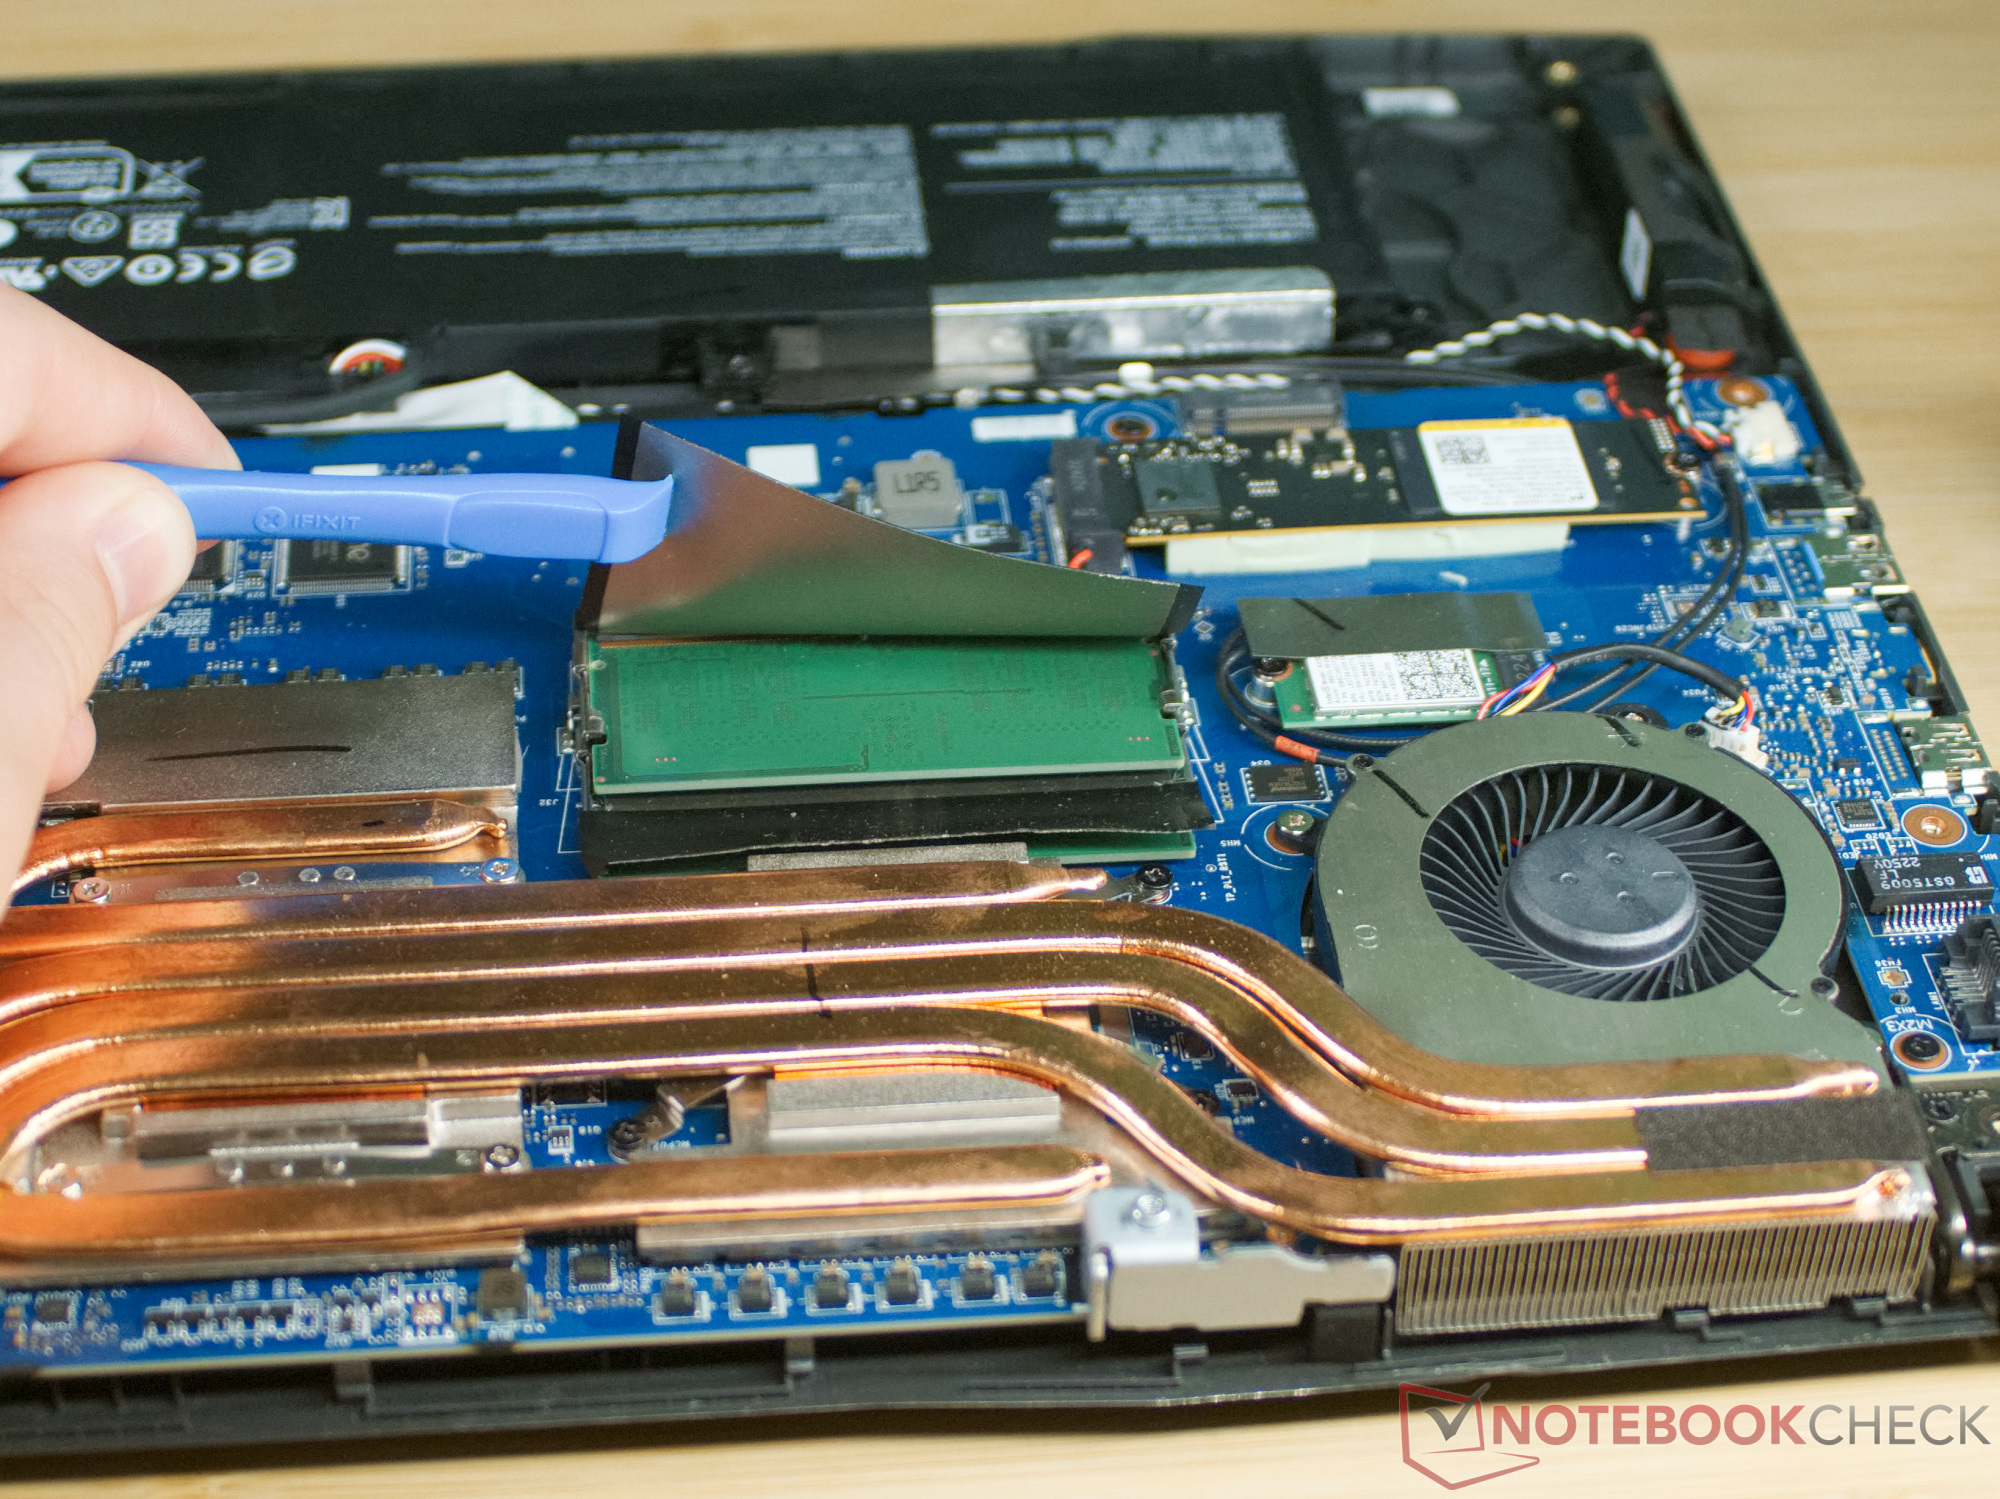
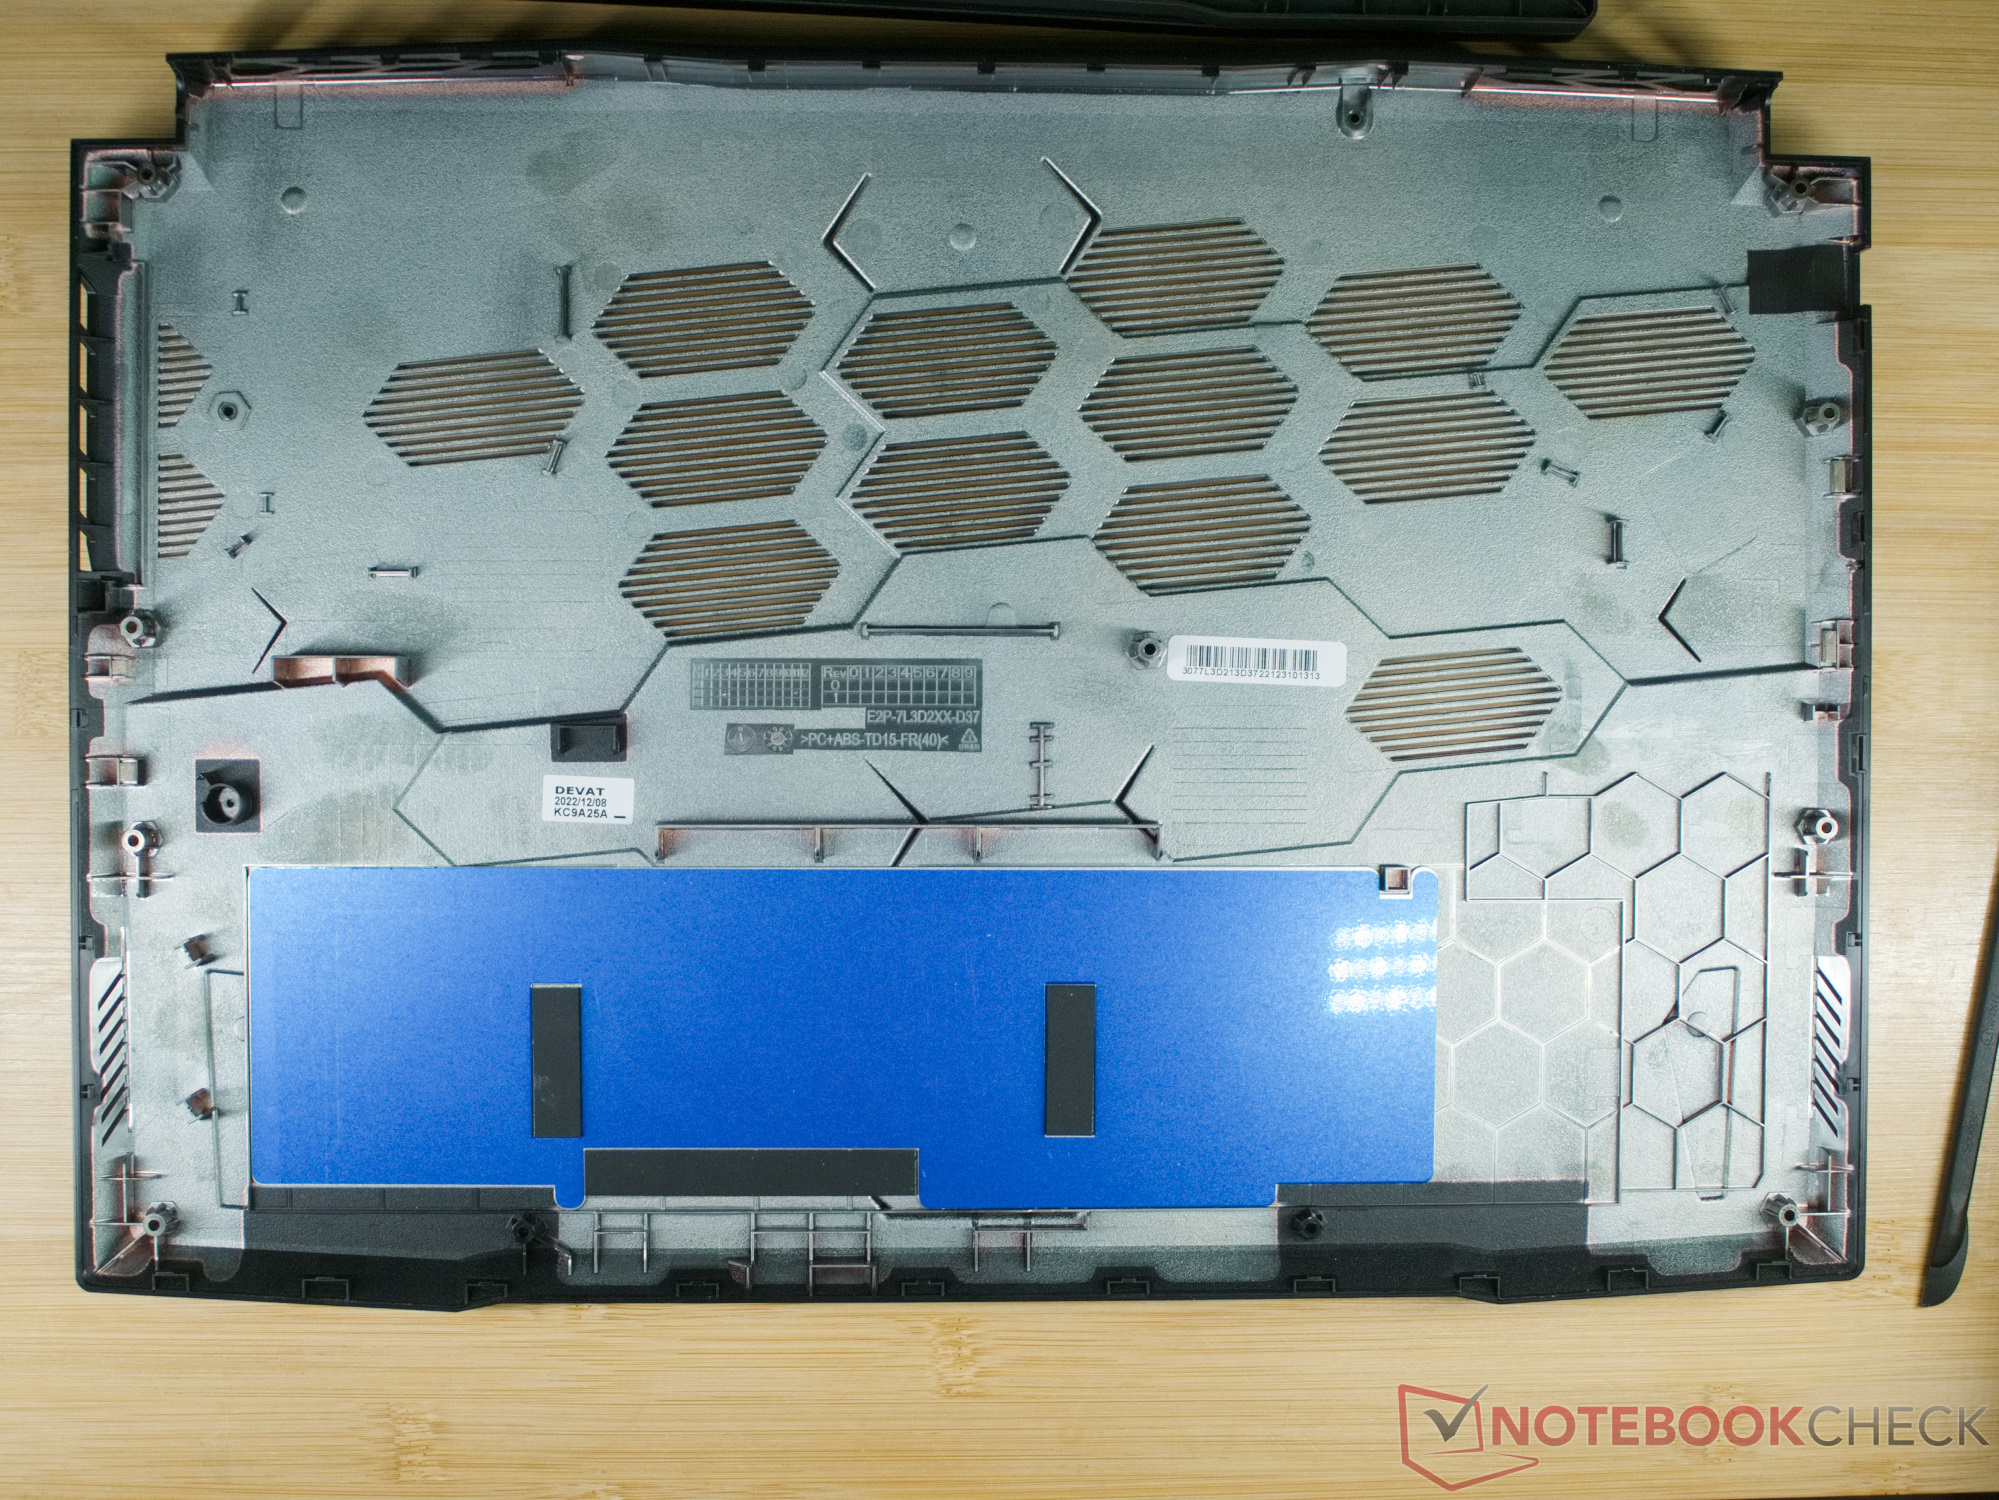
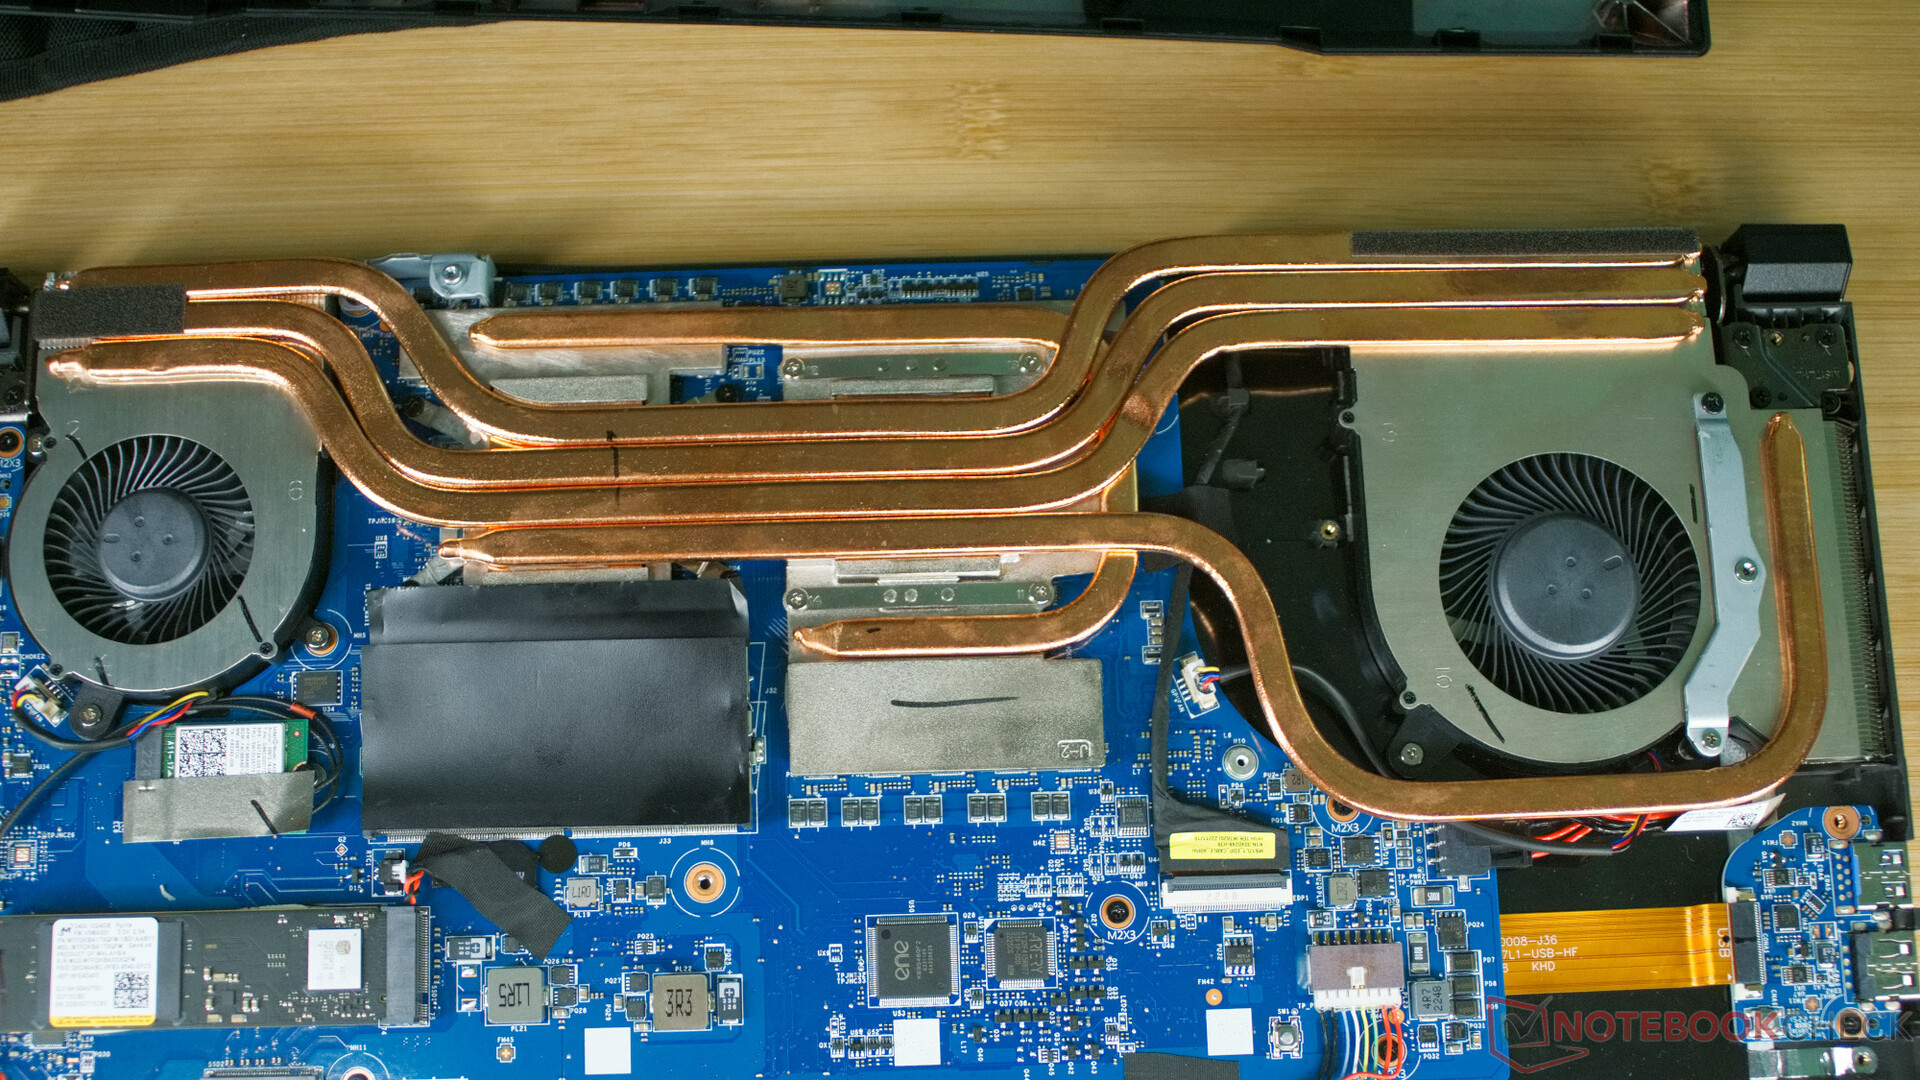
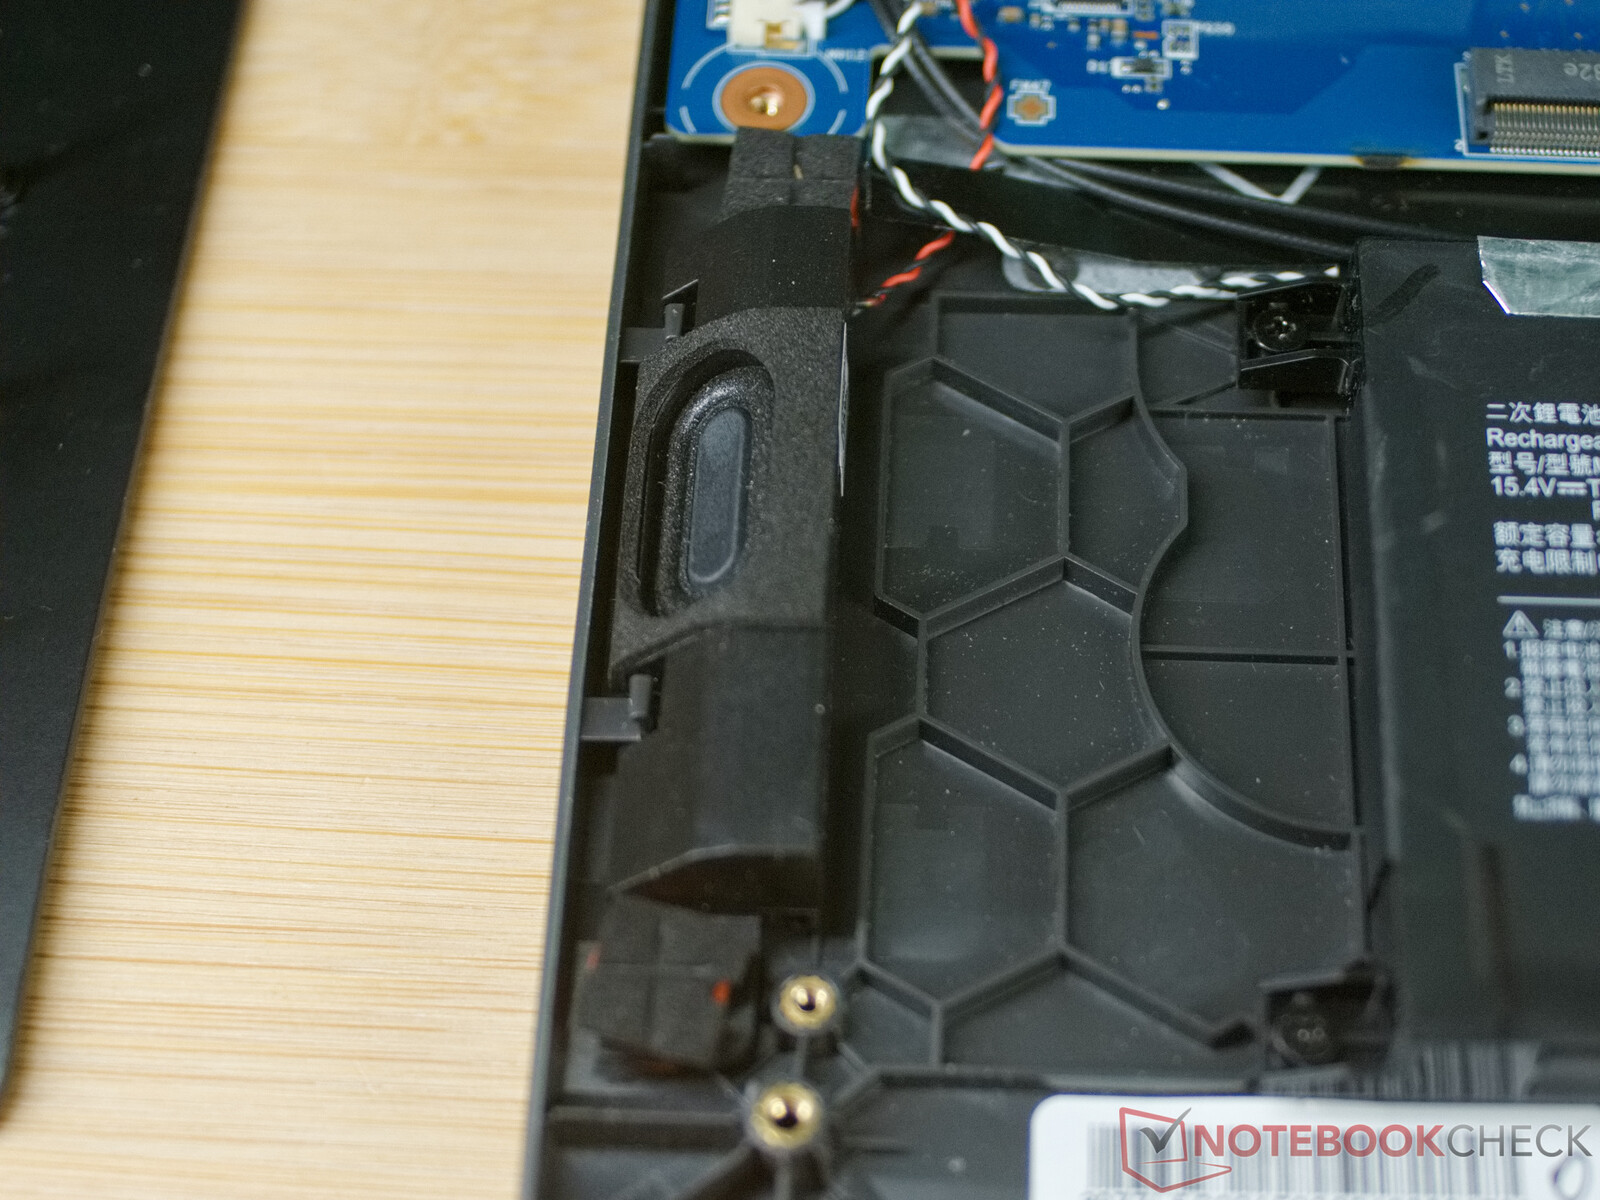
Wewnątrz laptopa znajdziemy dość modułową konstrukcję, dzięki czemu pamięć RAM, dysk SSD NVMe i WLAN/Modul można szybko wymienić. Baterię, głośniki i płytkę z dwoma złączami USB również można łatwo wymienić. Jednak ci, którzy regularnie lubią usuwać kurz spomiędzy wentylatorów i żeberek chłodzących, muszą zdemontować cały układ chłodzenia, aby móc to zrobić.
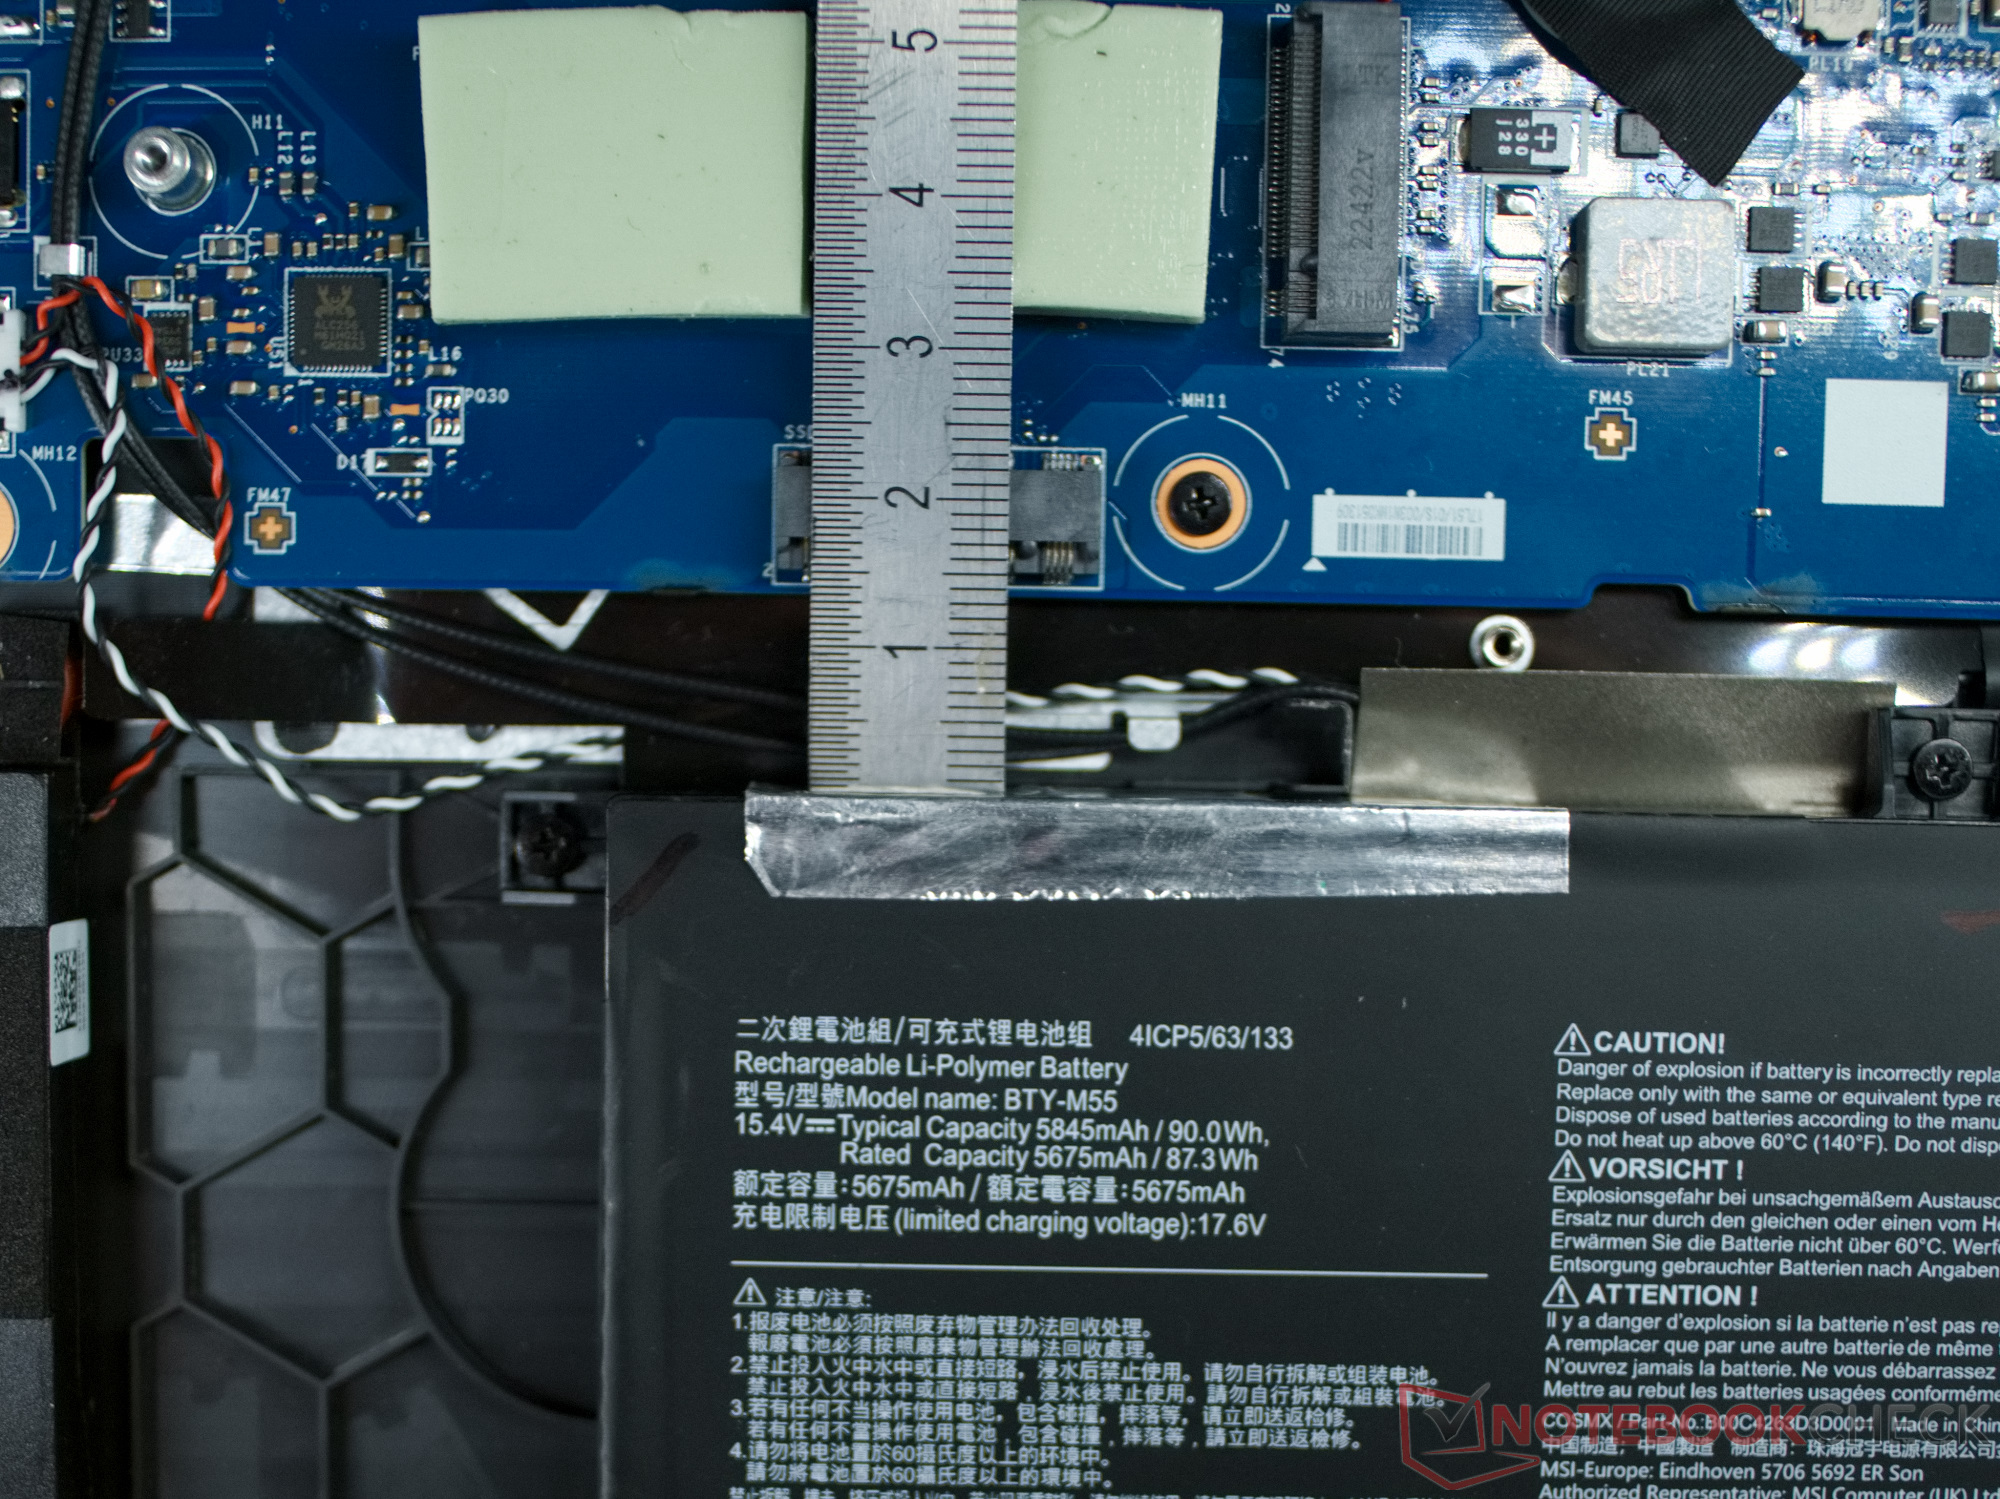
Laptop oferuje również drugi slot M.2 PCIe, ale niestety jest on zablokowany przez baterię. Można więc prawdopodobnie zainstalować drugi dysk SSD tylko za pomocą rozwiązania wykorzystującego adaptery i kable.
Gwarancja
MSI oferuje 24-miesięczną gwarancję dla nabywców w Europie.
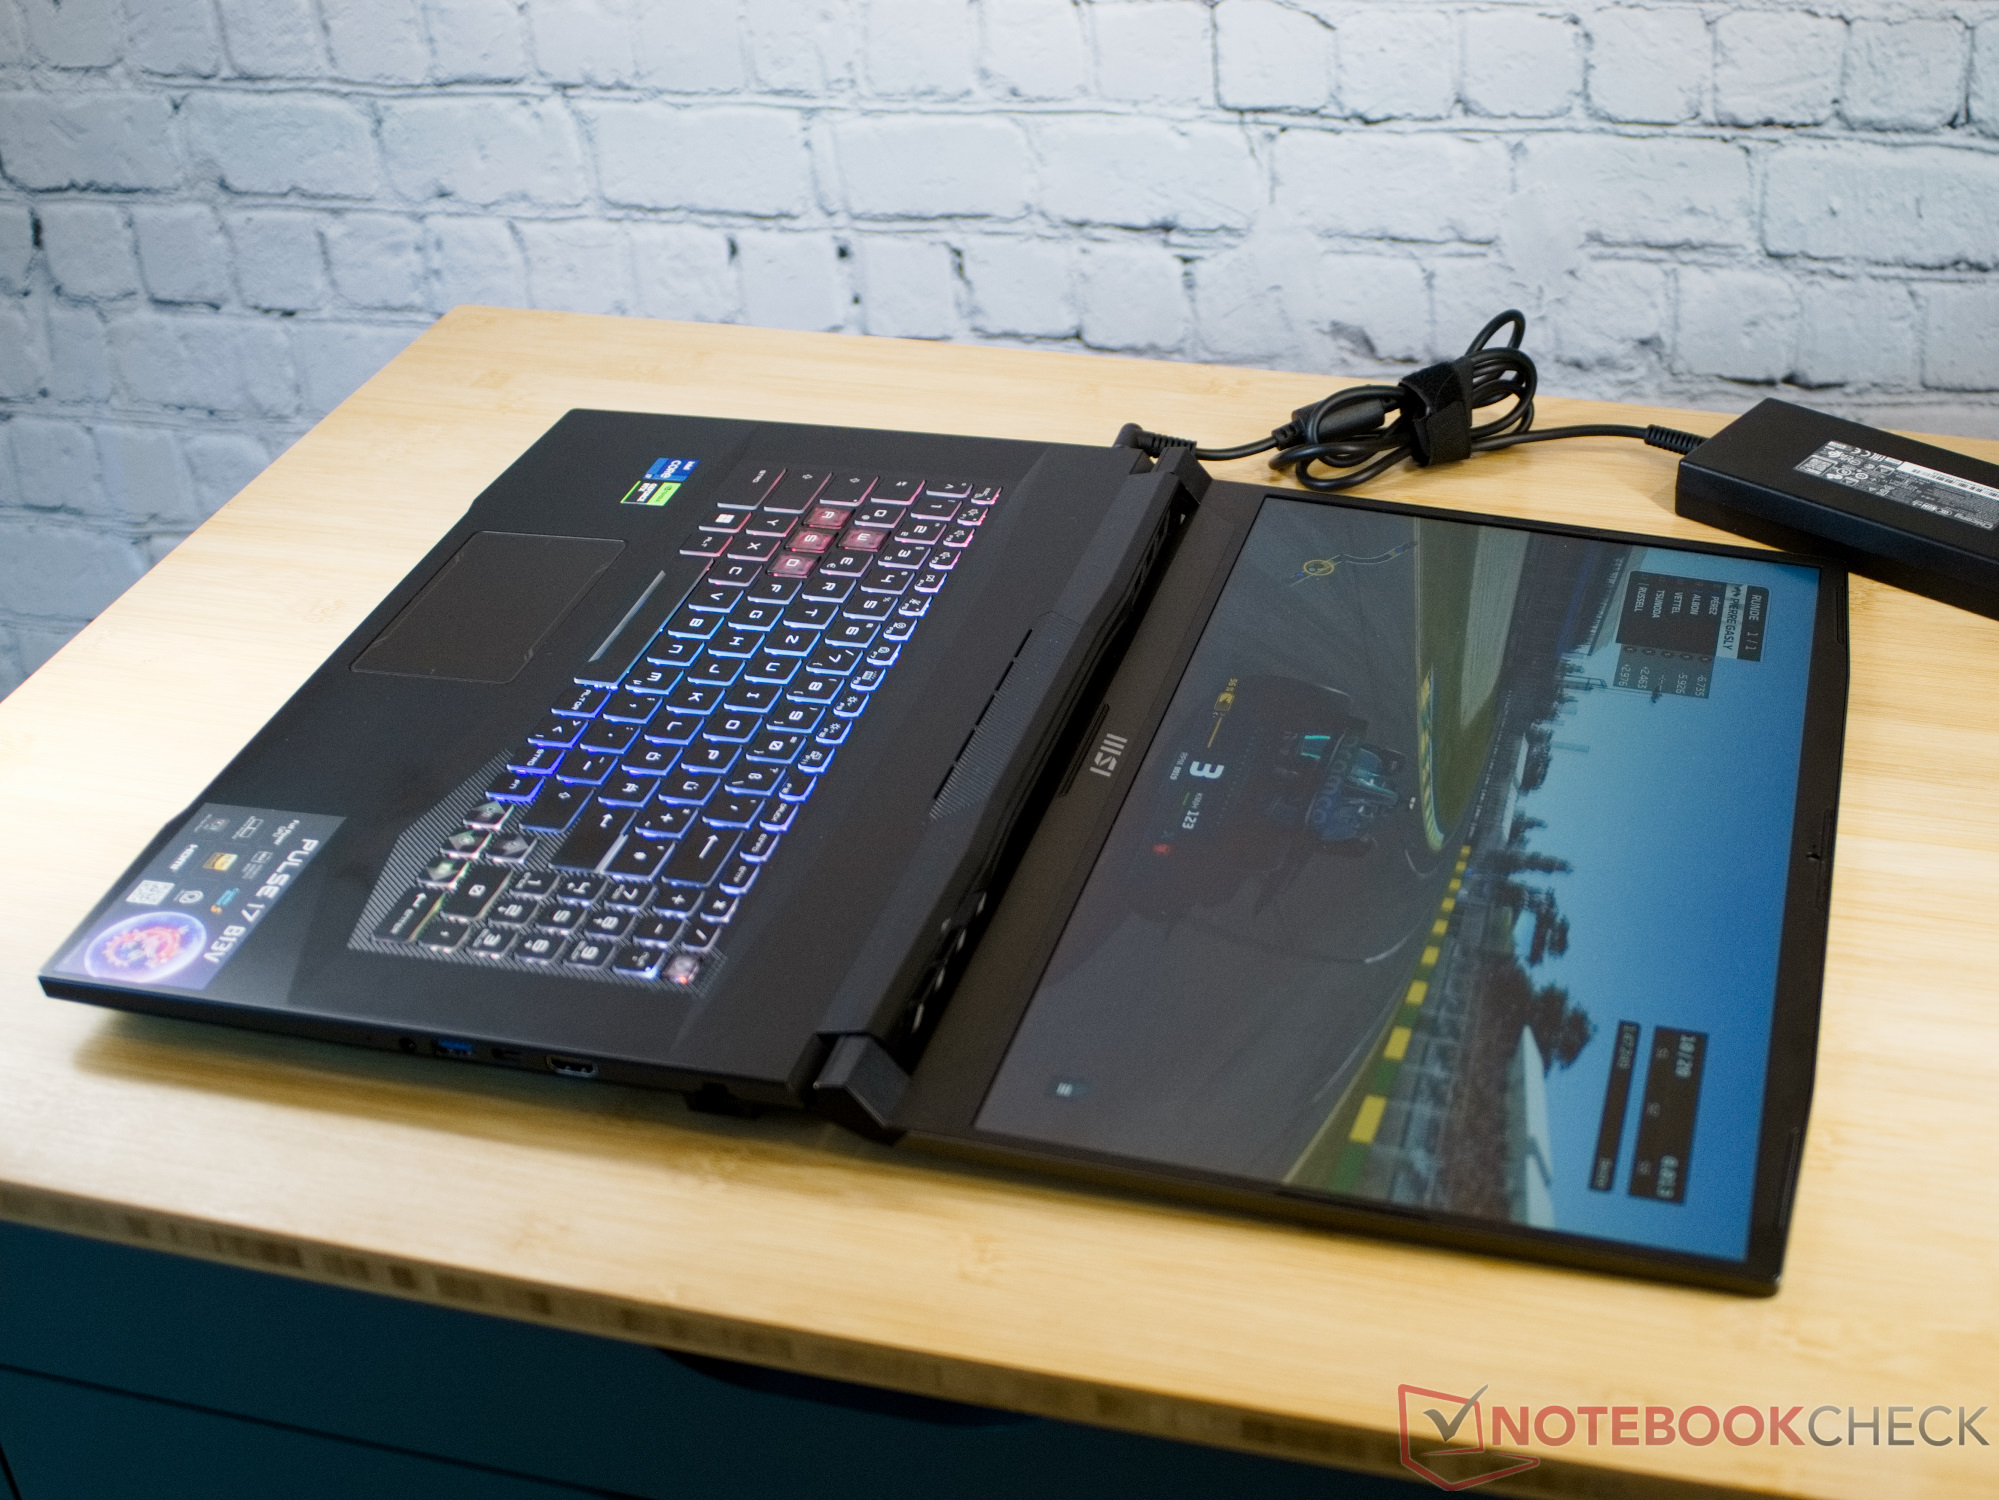
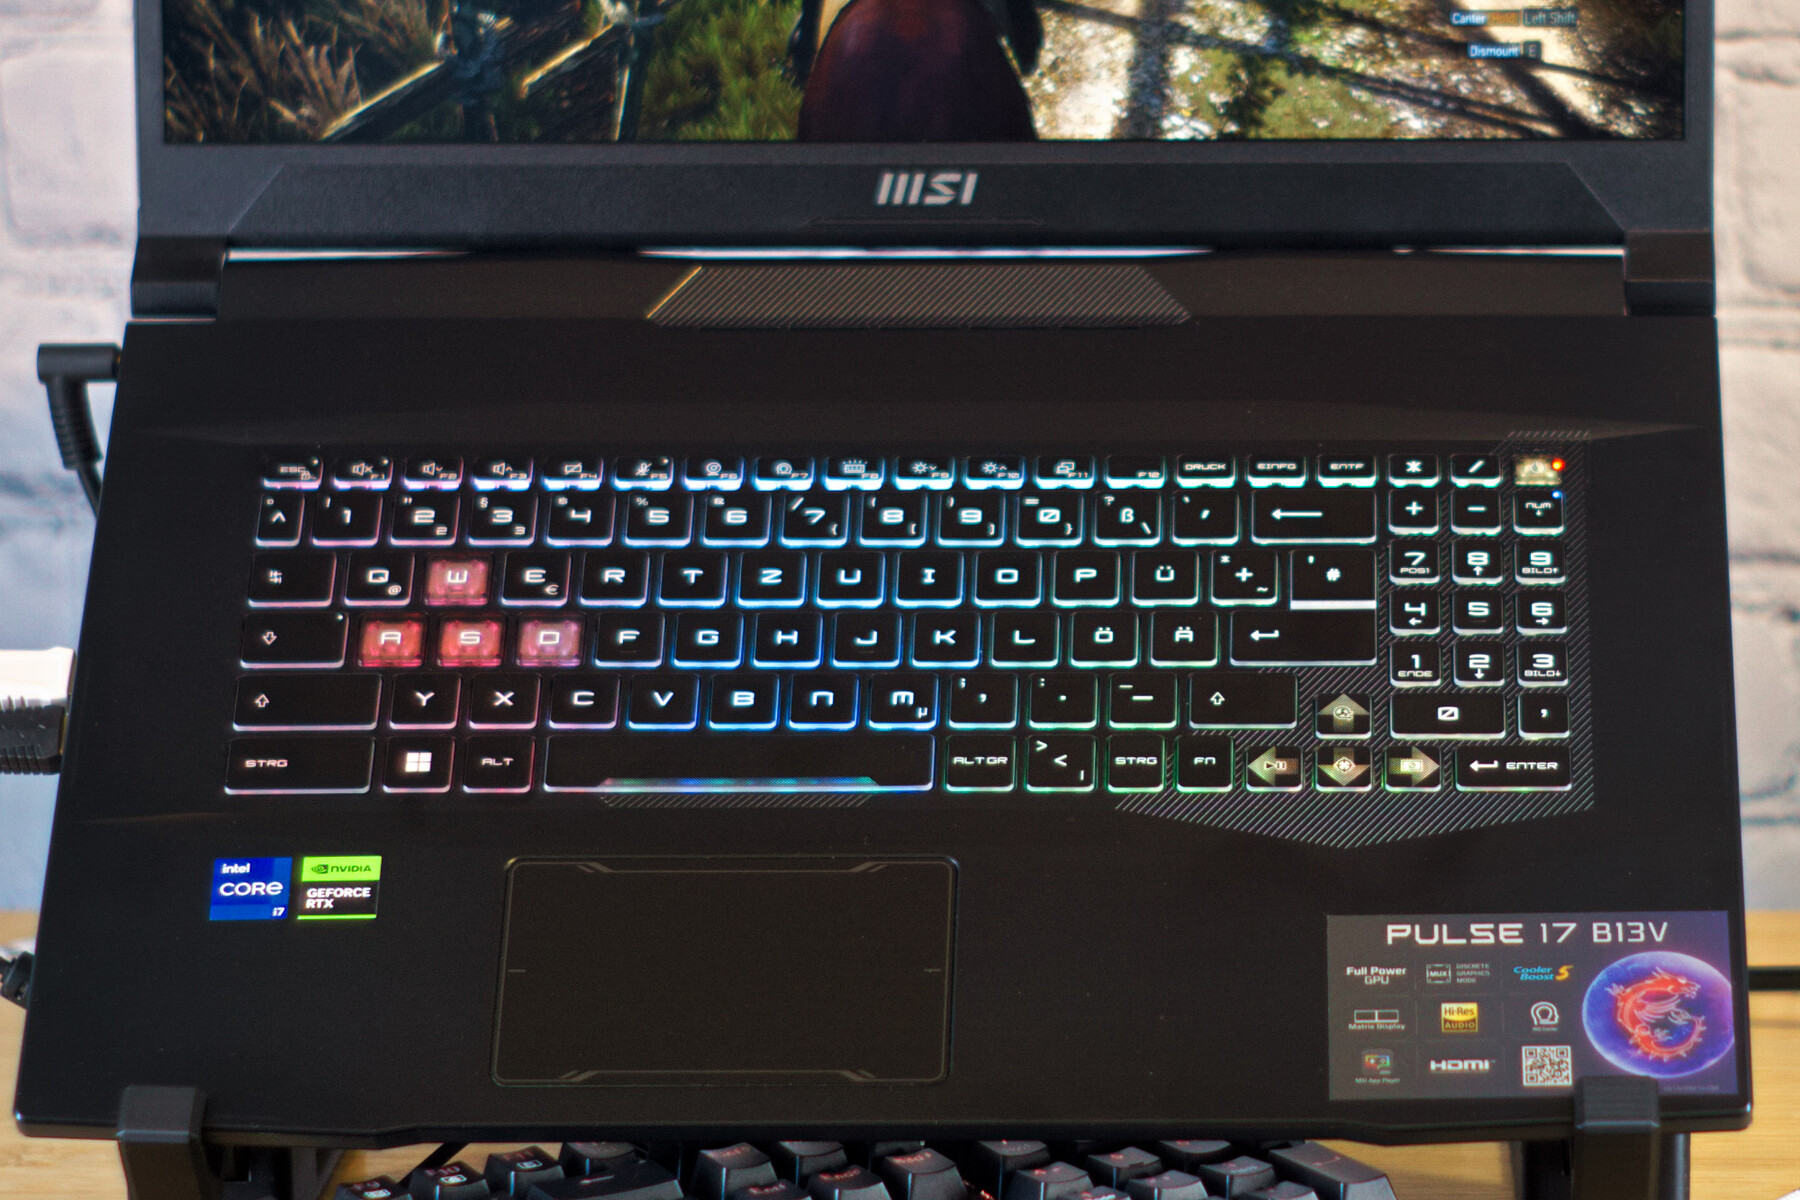
Input Devices - Four RGB zones and a small touchpad in the MSI Pulse
Klawiatura
MSI Control Center umożliwia sterowanie podświetleniem RGB klawiatury MSI Pluse 17. Producent umożliwia również korzystanie z oprogramowania firm trzecich do zmiany kolorów i efektów w czterech strefach podświetlenia klawiatury. Szczególnie podkreślone są tutaj przezroczyste klawisze W, A, S i D. Klawiatura oferuje dobre haptyczne sprzężenie zwrotne i skok klawiszy wynoszący około 1,2 mm (~0,05 cala).
Touchpad
Touchpad w Pulse 17 jest stosunkowo mały, ale oznacza to również, że nie przeszkadza dłoniom podczas grania. Dzięki gładkiej powierzchni, wyraźnym klawiszom i wysokiej precyzji, ogólnie działa dobrze.
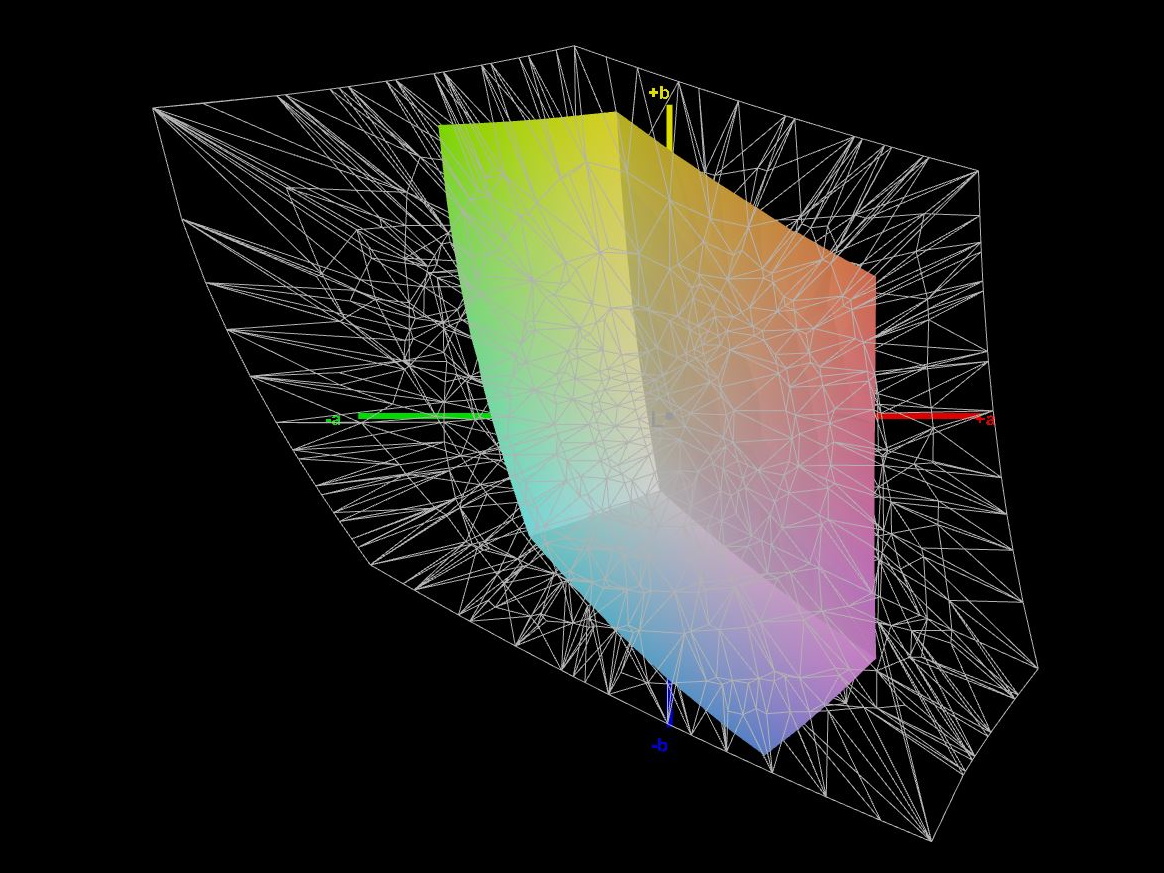
Wyświetlacz - Mniej niż 60% pokrycia palety sRGB
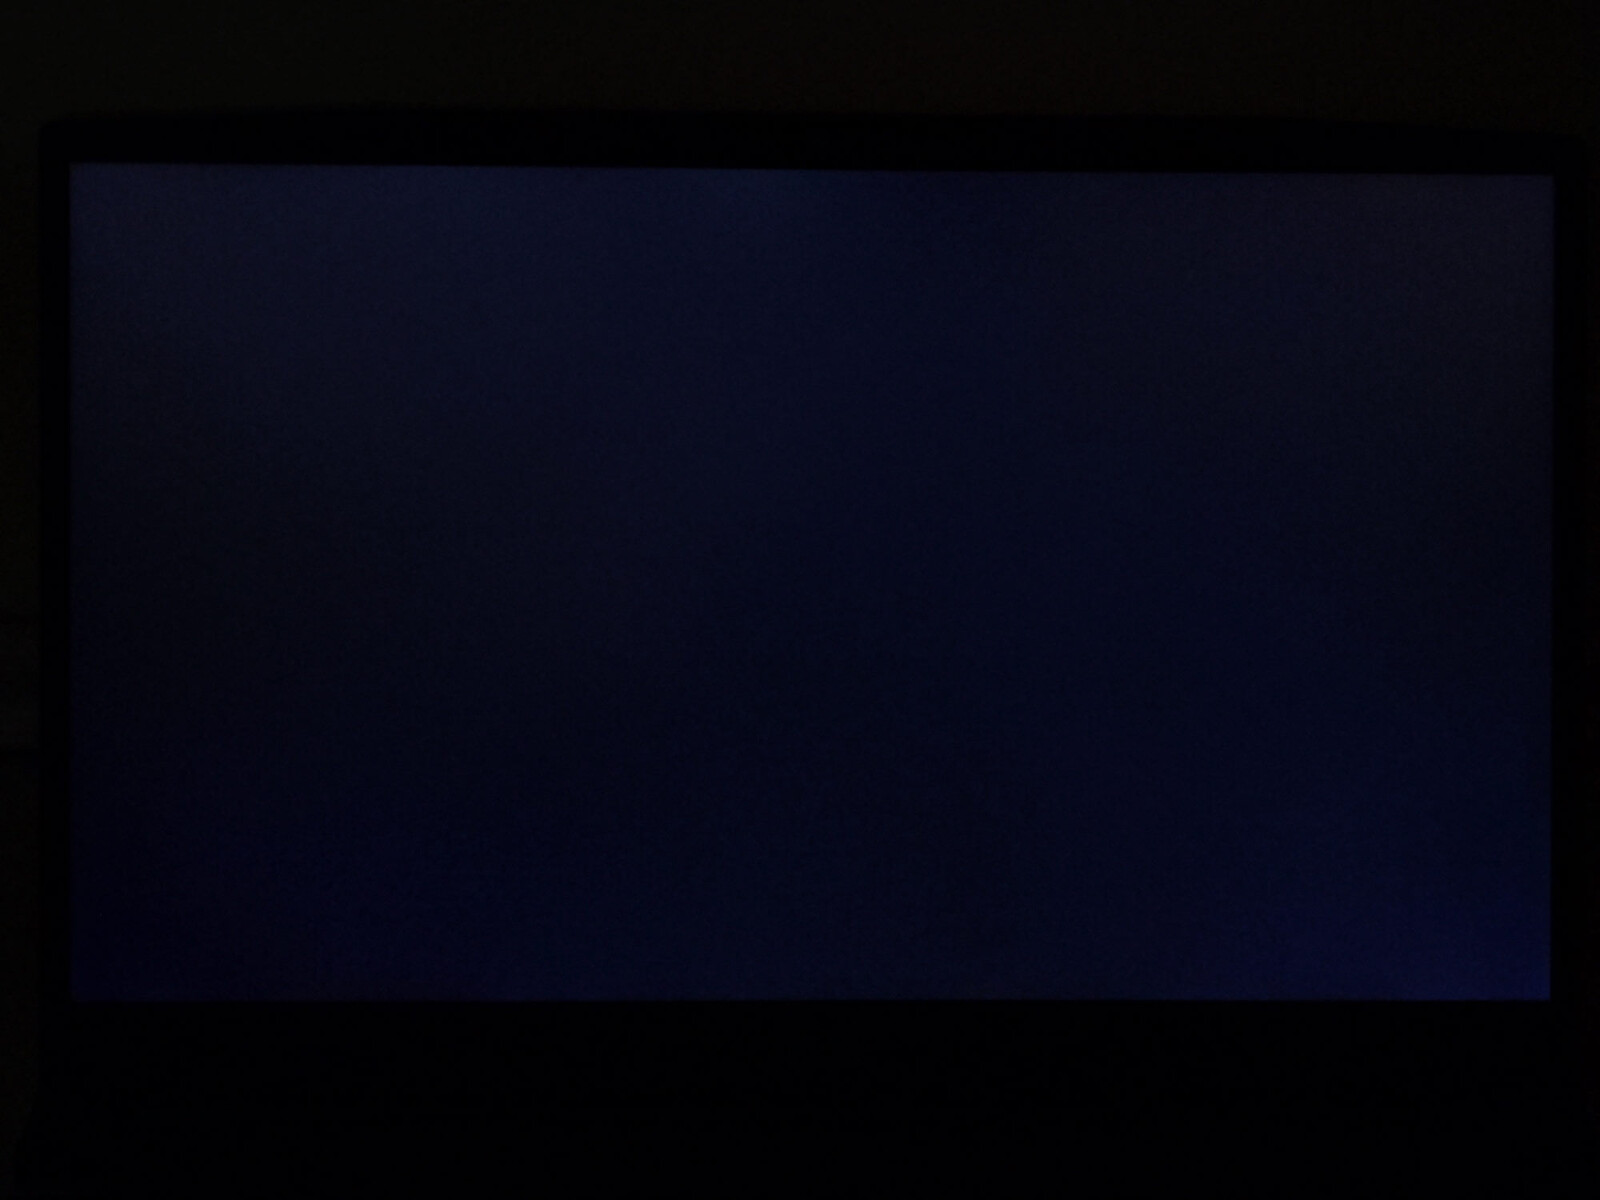
W laptopie do gier wyświetlacz powinien być bardzo responsywny, w pełni pokrywać przestrzeń kolorów sRGB i oferować wysoki kontrast. W przypadku MSI Pulse tylko wysoki współczynnik kontrastu przemawia na korzyść wyświetlacza. Mimo że matowy wyświetlacz nie jest szczególnie jasny przy średniej jasności 250 cd/m², niska wartość czerni zapewnia wysoki współczynnik kontrastu. Rozkład jasności nie jest szczególnie równomierny, ale przynajmniej nie zauważamy żadnych widocznych aureoli świetlnych.
Oznacza to, że wyświetlacz Pulse 17 jest znacznie gorszy w porównaniu do wyświetlacza Pulse GL76. Czasy reakcji wzrosły prawie dwukrotnie, stając się czasami prawie 6 razy wolniejsze, a liczba wyświetlanych kolorów została zmniejszona prawie o połowę. MSI dokonało więc znacznego obniżenia jakości wyświetlacza.
| |||||||||||||||||||||||||
rozświetlenie: 91 %
na akumulatorze: 253 cd/m²
kontrast: 1814:1 (czerń: 0.14 cd/m²)
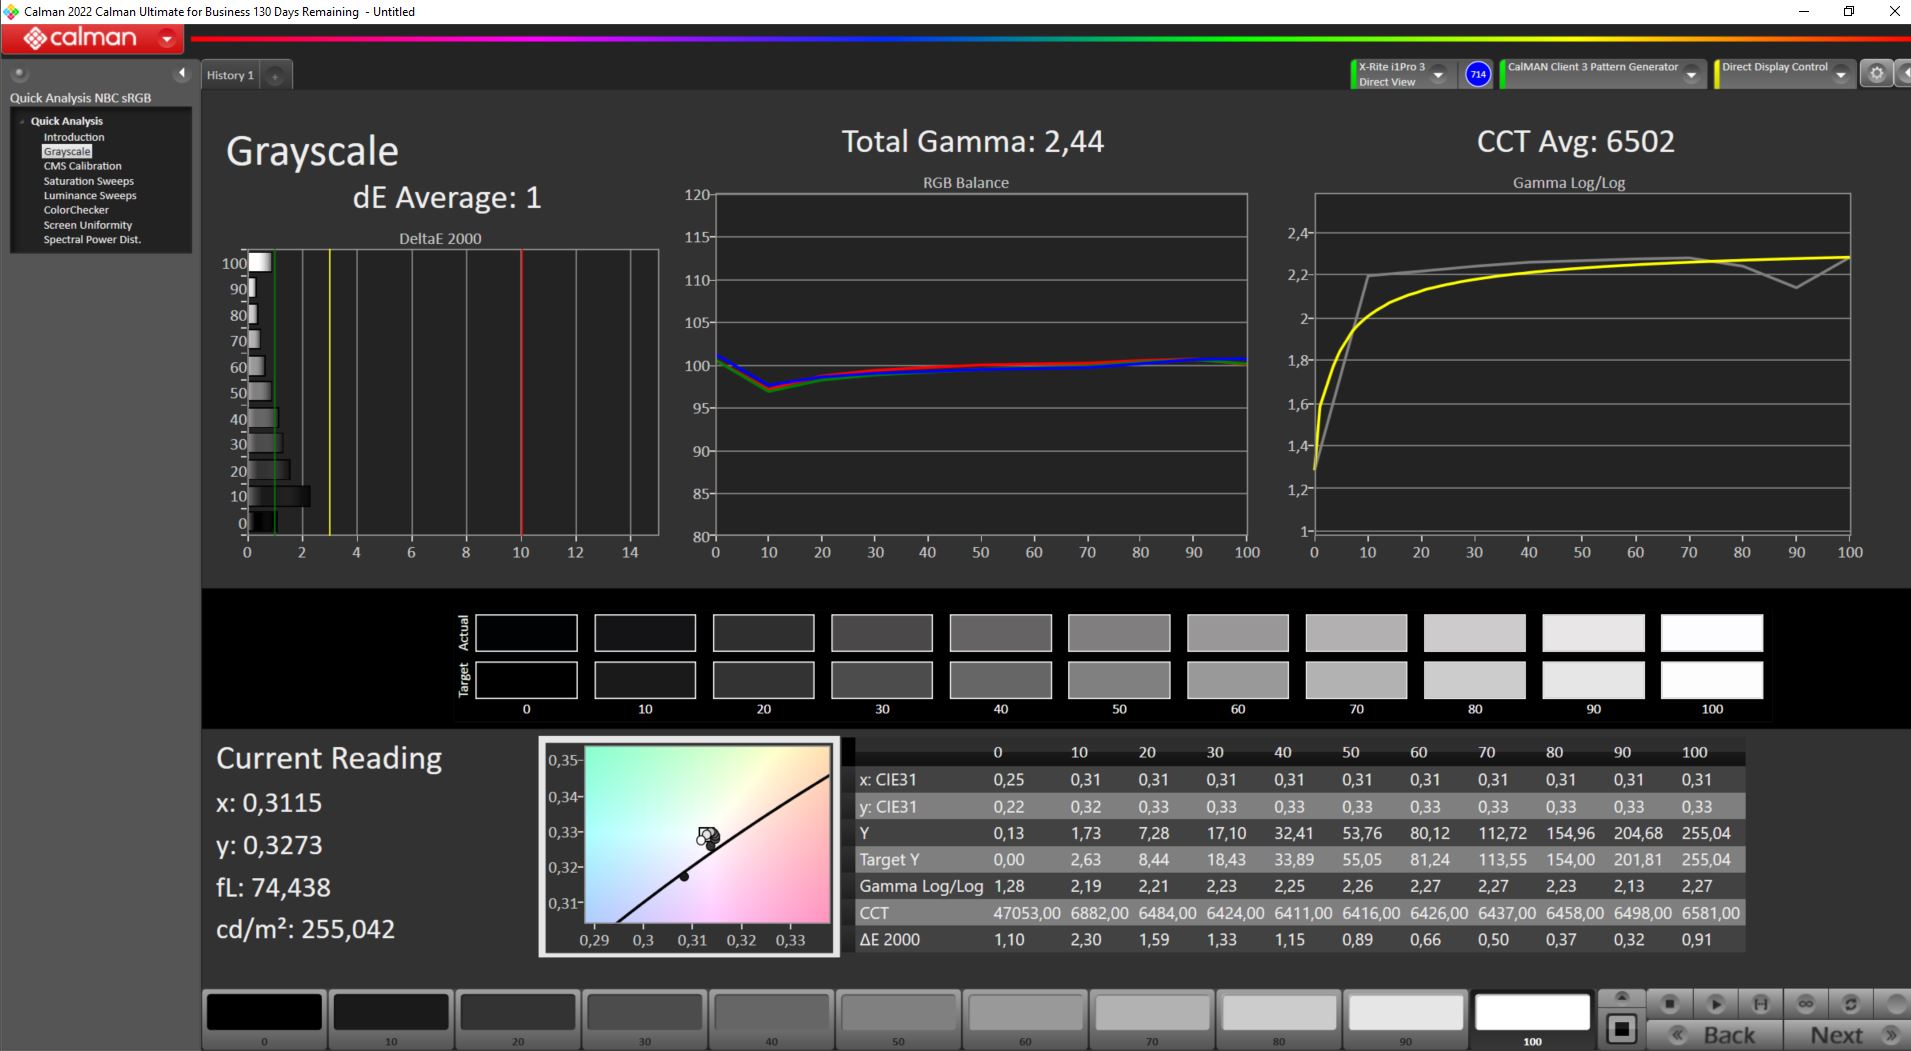
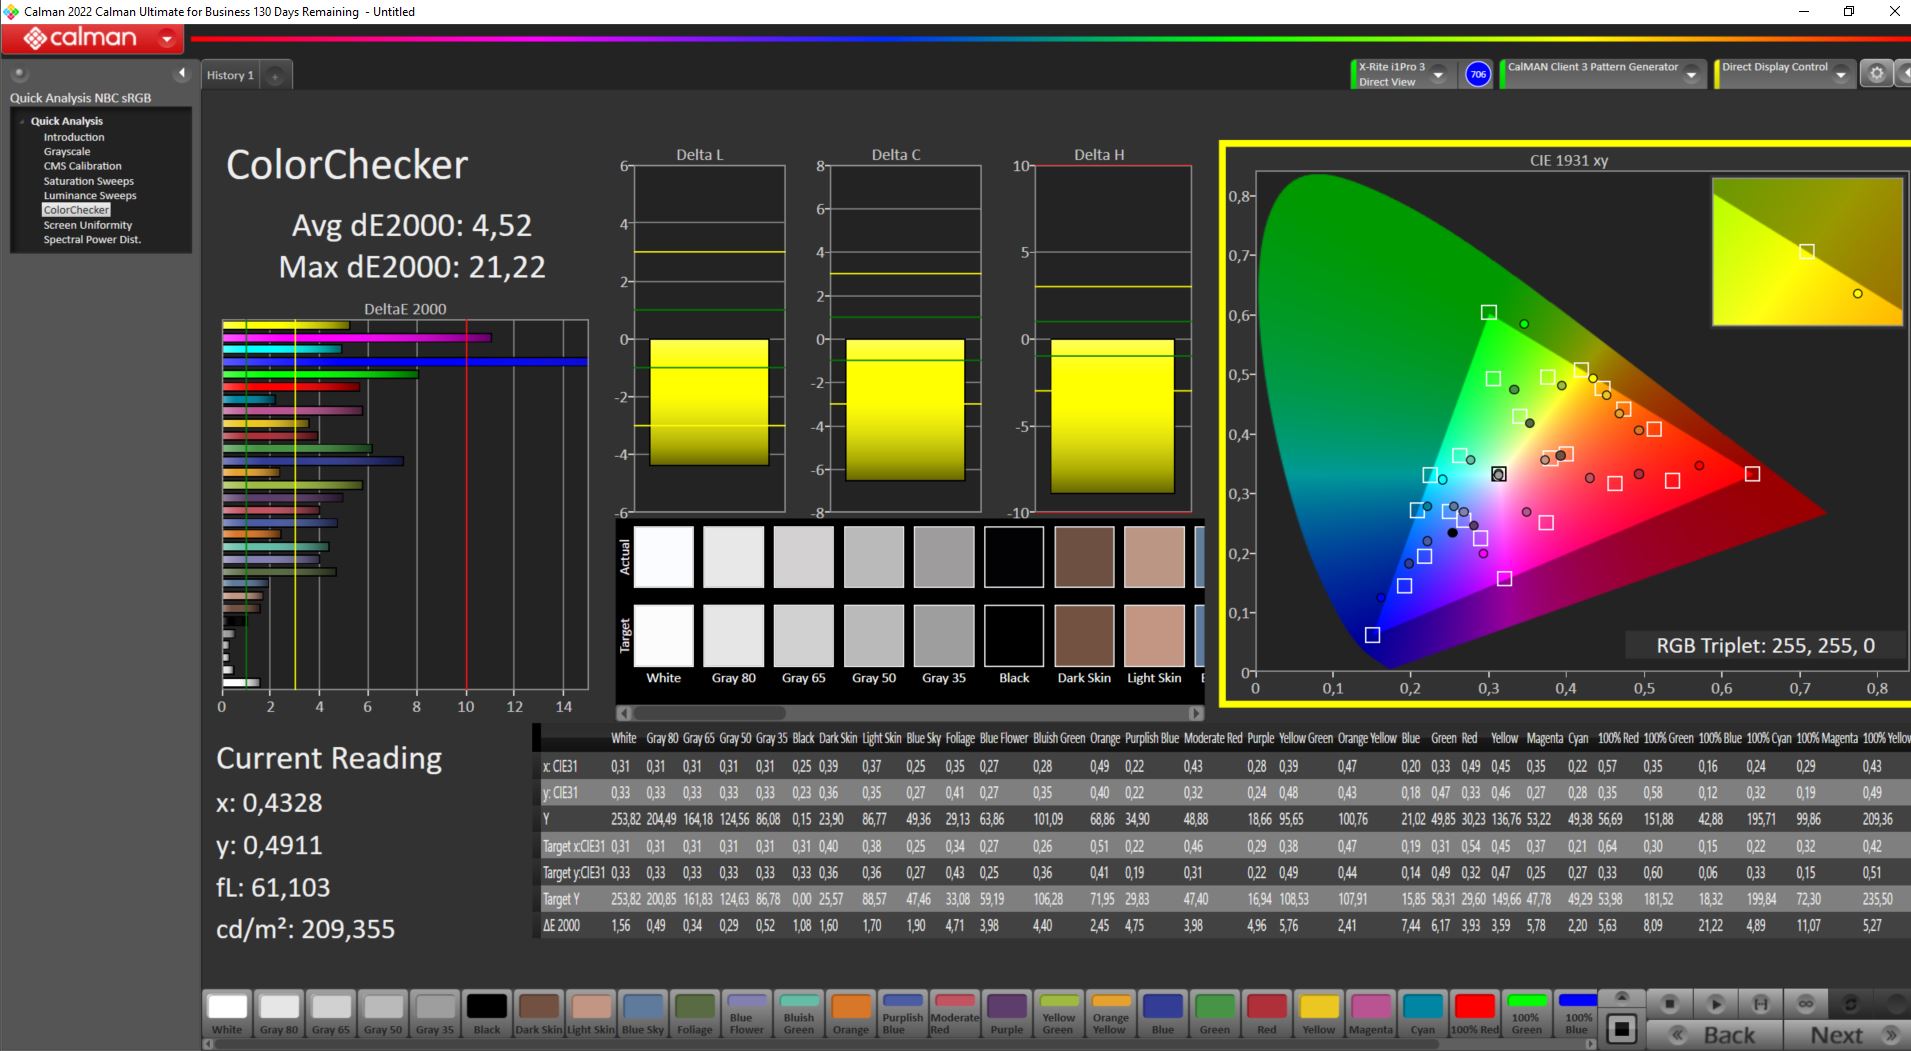
ΔE ColorChecker Calman: 4.52 | ∀{0.5-29.43 Ø4.71}
calibrated: 4.52
ΔE Greyscale Calman: 1 | ∀{0.09-98 Ø4.96}
39.7% AdobeRGB 1998 (Argyll 3D)
57.5% sRGB (Argyll 3D)
38.4% Display P3 (Argyll 3D)
Gamma: 2.44
CCT: 6502 K
| MSI Pulse 17 B13VGK AU Optronics B173HAN04.9, IPS, 1920x1080, 17.3" | MSI Pulse GL76 12UGK Sharp LQ173M1JW08, IPS, 1920x1080, 17.3" | MSI Katana 17 B13VFK B173HAN04.9, IPS LED, 1920x1080, 17.3" | Acer Nitro 17 AN17-51-71ER BOE0B7C NE173QHM-NY6, , 2560x1440, 17.3" | Schenker XMG Focus 17 (E23) BOE09F9 NE173QHM-NZ1, IPS, 2560x1440, 17.3" | Asus ROG Strix G17 G713PI BOE0B69, IPS, 2560x1440, 17.3" | |
|---|---|---|---|---|---|---|
| Display | 82% | 6% | 115% | 113% | 115% | |
| Display P3 Coverage (%) | 38.4 | 71.9 87% | 40.8 6% | 98.3 156% | 96.6 152% | 98.3 156% |
| sRGB Coverage (%) | 57.5 | 99.9 74% | 61 6% | 100 74% | 99.9 74% | 100 74% |
| AdobeRGB 1998 Coverage (%) | 39.7 | 73.7 86% | 42.2 6% | 85.7 116% | 84.5 113% | 85.9 116% |
| Response Times | 69% | -8% | 60% | 51% | 74% | |
| Response Time Grey 50% / Grey 80% * (ms) | 31.2 ? | 4.6 ? 85% | 33 ? -6% | 14.8 ? 53% | 16.4 ? 47% | 5.3 ? 83% |
| Response Time Black / White * (ms) | 23.6 ? | 11.2 ? 53% | 26 ? -10% | 8 ? 66% | 10.8 ? 54% | 8.6 ? 64% |
| PWM Frequency (Hz) | ||||||
| Screen | -55% | -13% | -50% | -10% | 2% | |
| Brightness middle (cd/m²) | 254 | 337.7 33% | 267 5% | 361 42% | 349 37% | 327 29% |
| Brightness (cd/m²) | 250 | 331 32% | 256 2% | 326 30% | 318 27% | 320 28% |
| Brightness Distribution (%) | 91 | 82 -10% | 93 2% | 87 -4% | 82 -10% | 89 -2% |
| Black Level * (cd/m²) | 0.14 | 0.31 -121% | 0.21 -50% | 0.6 -329% | 0.56 -300% | 0.38 -171% |
| Contrast (:1) | 1814 | 1089 -40% | 1271 -30% | 602 -67% | 623 -66% | 861 -53% |
| Colorchecker dE 2000 * | 4.52 | 4.12 9% | 4.7 -4% | 3.83 15% | 1.08 76% | 1.01 78% |
| Colorchecker dE 2000 max. * | 21.22 | 8.89 58% | 20.4 4% | 5.71 73% | 3.05 86% | 4.01 81% |
| Colorchecker dE 2000 calibrated * | 4.52 | 0.98 78% | 4.5 -0% | 3.48 23% | 1.08 76% | 0.41 91% |
| Greyscale dE 2000 * | 1 | 6.3 -530% | 1.5 -50% | 3.29 -229% | 1.14 -14% | 1.6 -60% |
| Gamma | 2.44 90% | 2.48 89% | 2.12 104% | 2.29 96% | 2.41 91% | 2.168 101% |
| CCT | 6502 100% | 6542 99% | 6552 99% | 6679 97% | 6687 97% | 6659 98% |
| Całkowita średnia (program / ustawienia) | 32% /
-8% | -5% /
-9% | 42% /
1% | 51% /
25% | 64% /
37% |
* ... im mniej tym lepiej
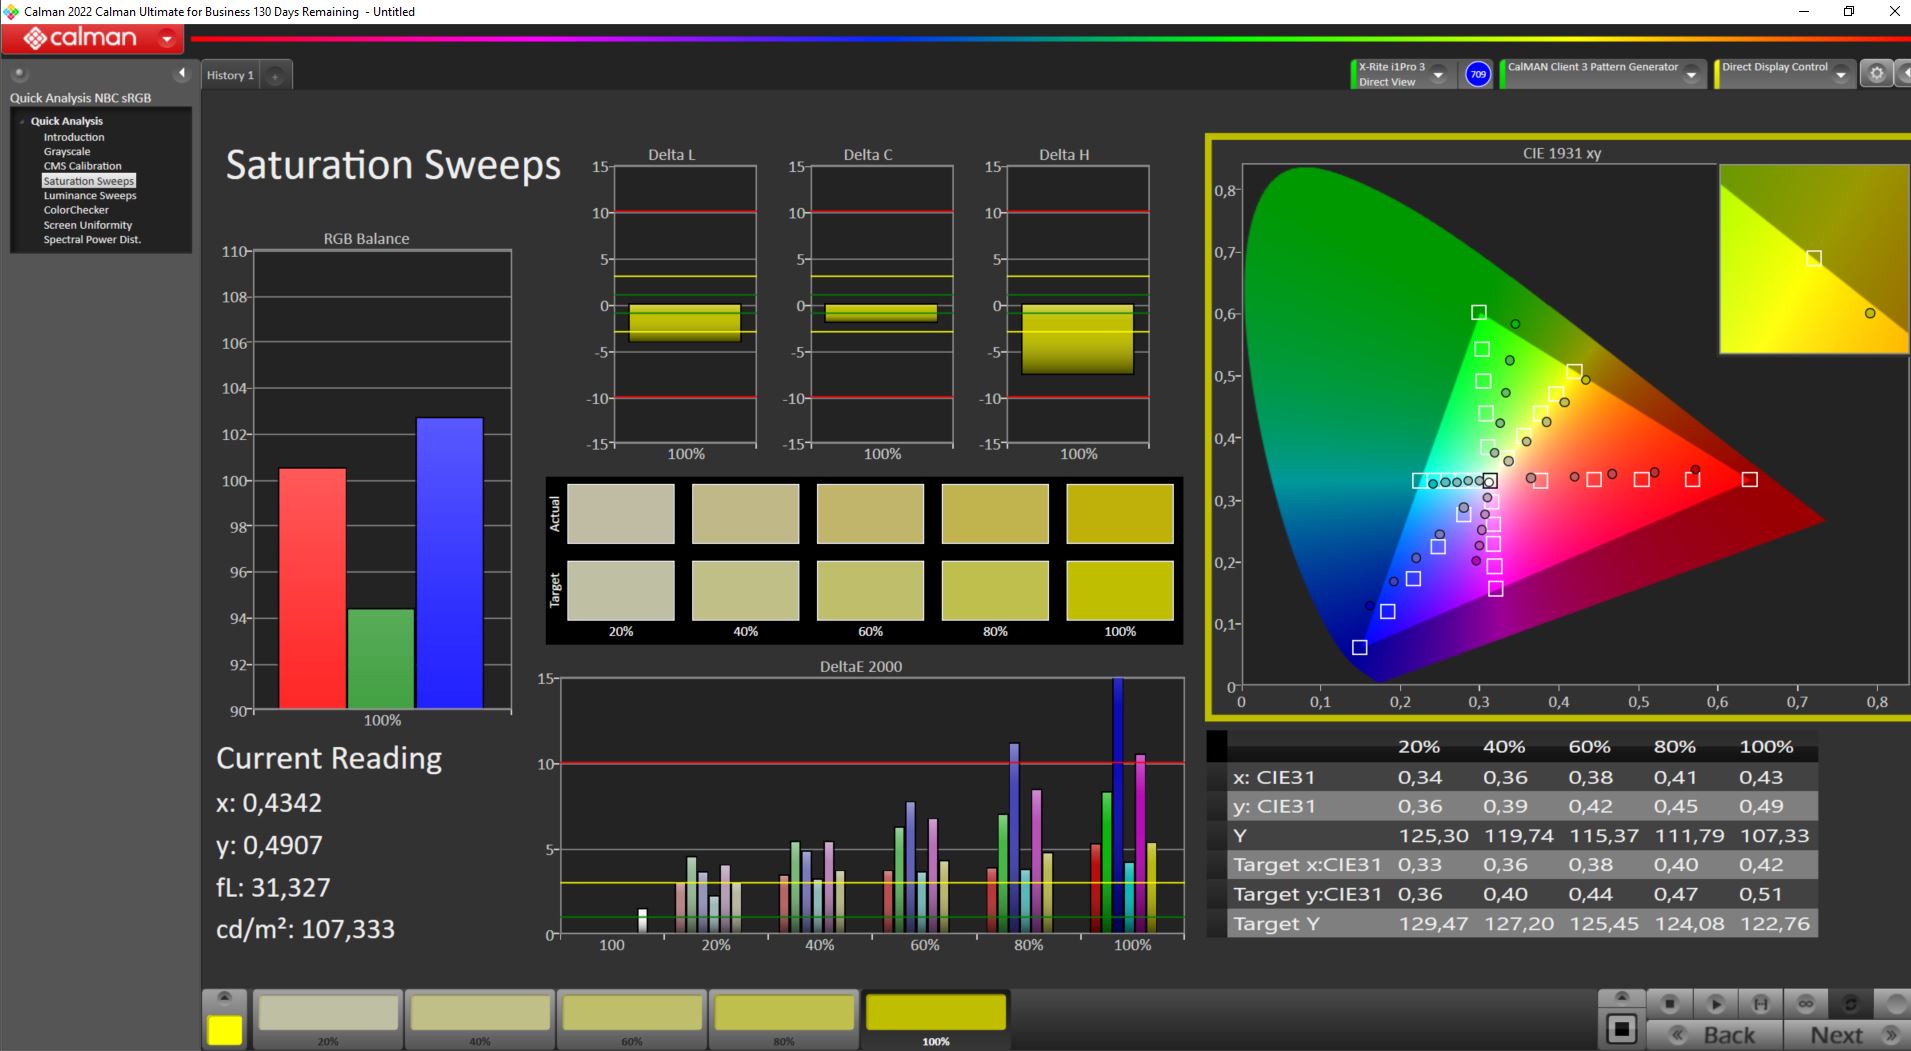
Przestrzenie barw AdobeRGB i DisplayP3 są pokrywane tylko w mniej niż 40%, a nawet sRGB nie jest pokrywane w 60% przez Pulse 17.
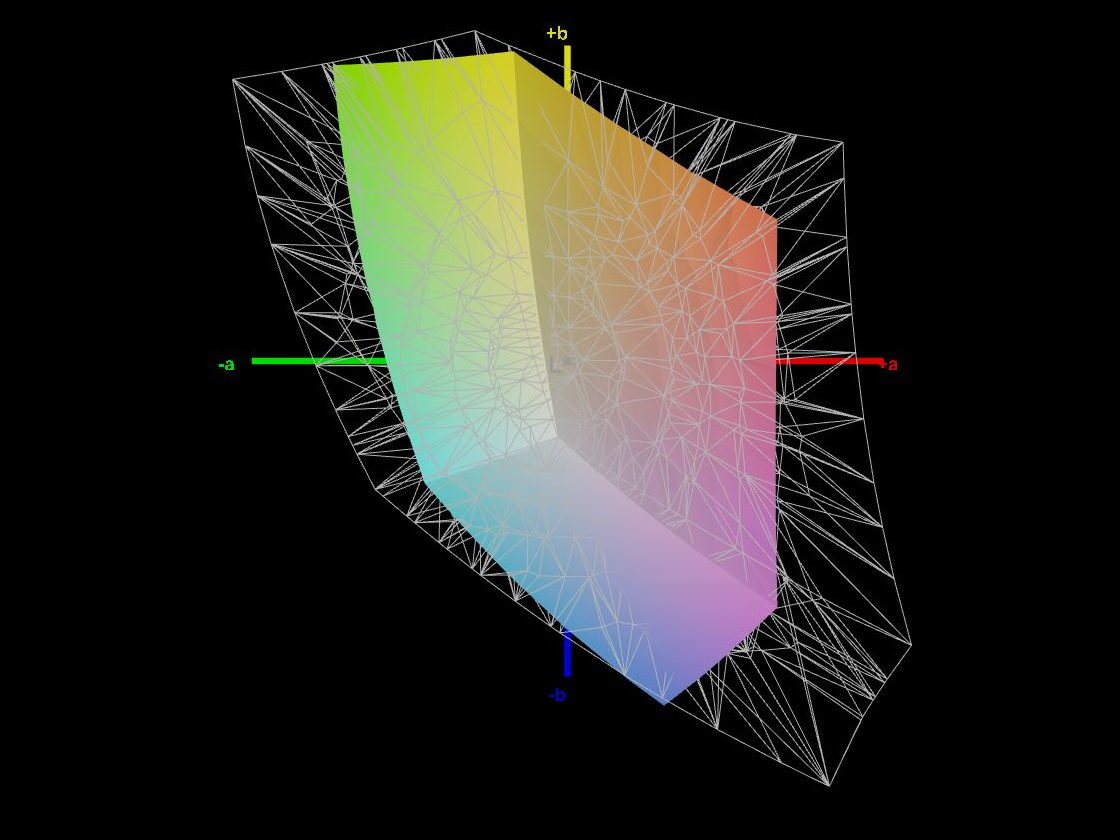
Przynajmniej test Calmana pokazuje dobry wynik w wyświetlaniu skali szarości. Jednak ocena dokładności odwzorowania kolorów za pomocą Calman ColorChecker wyraźnie ujawnia ograniczenia wyświetlacza. Przy zaledwie 60% przestrzeni kolorów sRGB, wyświetlaczowi wyraźnie brakuje dużej części kolorów, kończąc odpowiednio daleko od skali kolorów w kolorach czerwonym, zielonym i niebieskim. Skutkuje to maksymalnym odchyleniem kolorów wynoszącym ΔΕ 21,22. Jest to bardzo wysokie maksymalne odchylenie, którego nie osiąga żaden z naszych pozostałych laptopów porównawczych. Wyświetlacz wypada jednak nieco lepiej pod względem średniego odchylenia kolorów. Jednak dodatkowa kalibracja nie zmienia wyniku, więc nawet MSI Katanauzyskuje niższe odchylenia kolorów przy użyciu naszego profilu ICC.
Wyświetl czasy reakcji
| ↔ Czas reakcji od czerni do bieli | ||
|---|---|---|
| 23.6 ms ... wzrost ↗ i spadek ↘ łącznie | ↗ 12.2 ms wzrost | 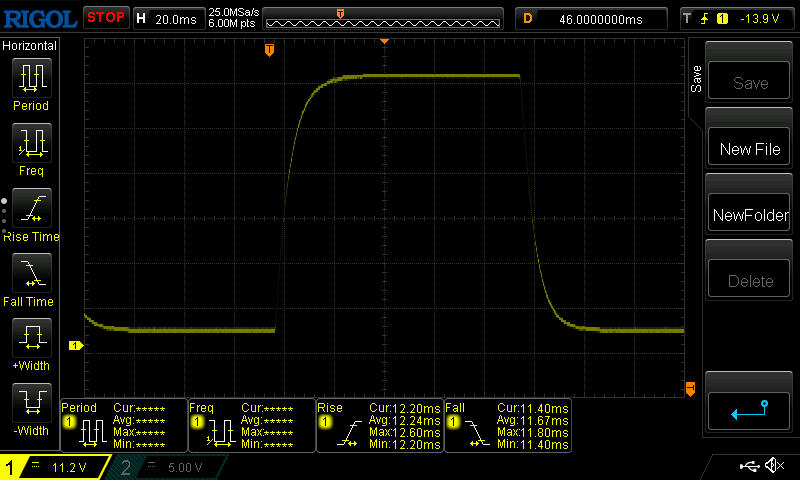 |
| ↘ 11.4 ms upadek | ||
| W naszych testach ekran wykazuje dobry współczynnik reakcji, ale może być zbyt wolny dla graczy rywalizujących ze sobą. Dla porównania, wszystkie testowane urządzenia wahają się od 0.1 (minimum) do 240 (maksimum) ms. » 54 % wszystkich urządzeń jest lepszych. Oznacza to, że zmierzony czas reakcji jest gorszy od średniej wszystkich testowanych urządzeń (19.8 ms). | ||
| ↔ Czas reakcji 50% szarości do 80% szarości | ||
| 31.2 ms ... wzrost ↗ i spadek ↘ łącznie | ↗ 14.2 ms wzrost | 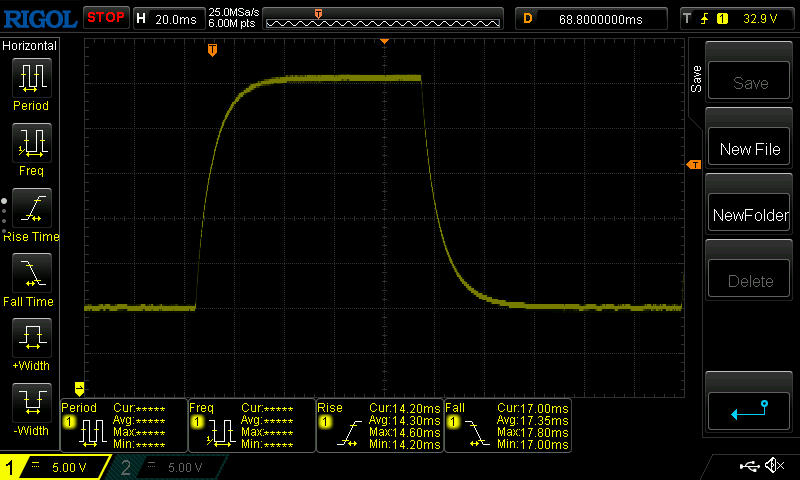 |
| ↘ 17 ms upadek | ||
| W naszych testach ekran wykazuje powolne tempo reakcji, co będzie niezadowalające dla graczy. Dla porównania, wszystkie testowane urządzenia wahają się od 0.165 (minimum) do 636 (maksimum) ms. » 42 % wszystkich urządzeń jest lepszych. Oznacza to, że zmierzony czas reakcji jest zbliżony do średniej wszystkich testowanych urządzeń (31 ms). | ||
Migotanie ekranu / PWM (modulacja szerokości impulsu)
| Migotanie ekranu/nie wykryto PWM | 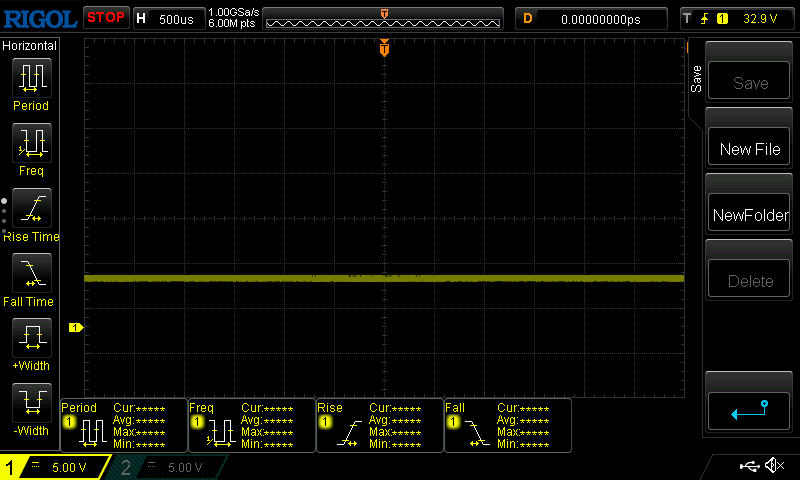 | ||
Dla porównania: 52 % wszystkich testowanych urządzeń nie używa PWM do przyciemniania wyświetlacza. Jeśli wykryto PWM, zmierzono średnio 7757 (minimum: 5 - maksimum: 343500) Hz. | |||
Kąty widzenia panelu IPS Pulse 17 są dość stabilne pod względem odwzorowania kolorów, ale znacznie tracą na jasności wraz ze wzrostem kąta. Podczas korzystania z laptopa na zewnątrz jest on przekonujący tylko w ograniczonym stopniu, ponieważ wyświetlacz nie jest wystarczająco jasny, aby być widocznym w jasnym świetle słonecznym. Nawet w naszym oświetleniu studyjnym szybko staje się jasne, że wyświetlacz jest raczej ciemny, a matowa powierzchnia nadal wykazuje stosunkowo dużą ilość odbić.

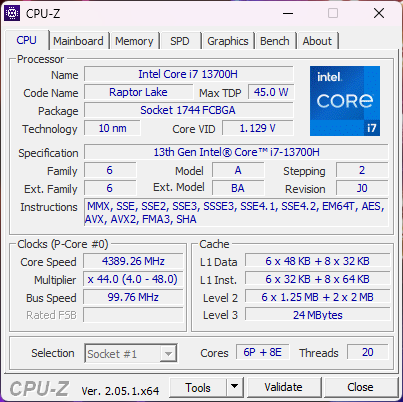
Wydajność - Bardzo wydajny procesor Intel Core i7-13700H
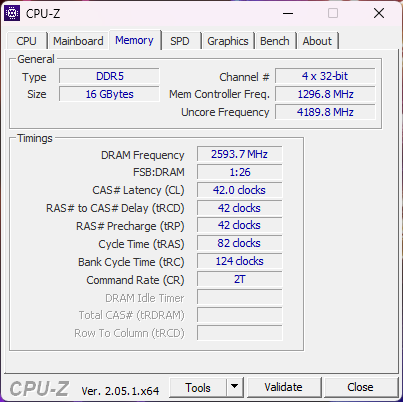
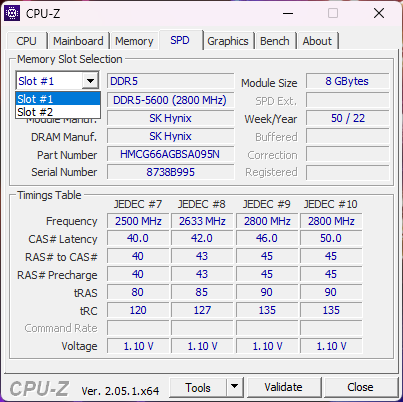
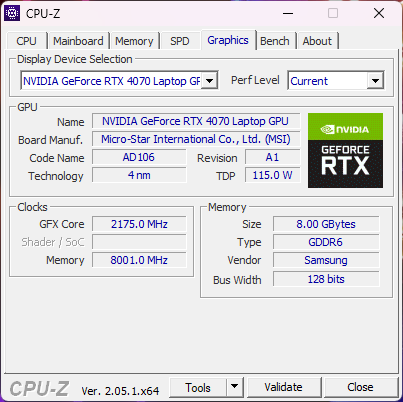
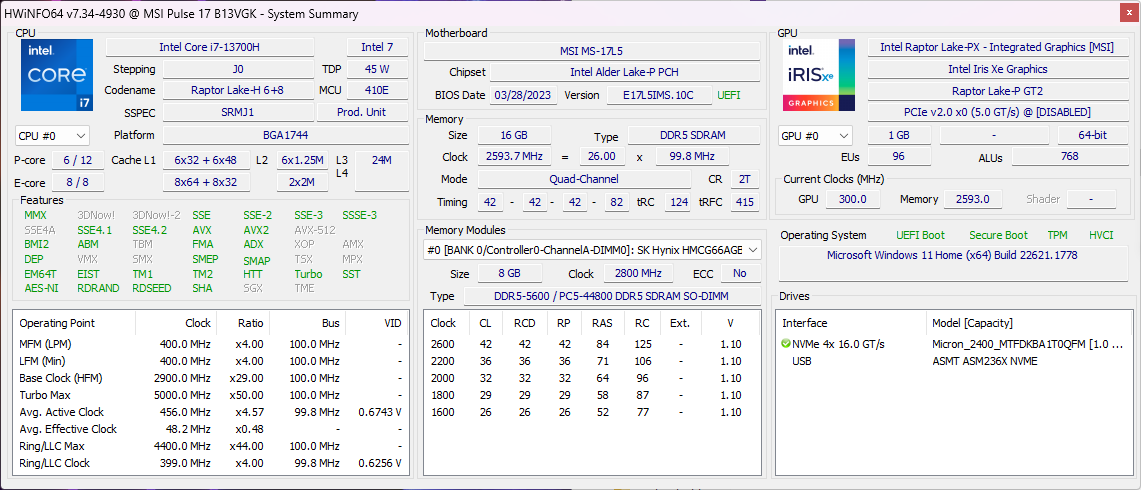
MSI Pulse 17 B13V jest dostępny w dwóch konfiguracjach sprzętowych, które różnią się jedynie procesorem graficznym. Podczas gdy nasza jednostka testowa wykorzystujeNvidia GeForce RTX 4070druga konfiguracja jest wyposażona w kartę RTX 4060. Jako procesor zastosowano Intel Core i7-13700Hjest używany. Towarzyszy mu 16 GB pamięci RAM DDR5-5200 i dysk SSD o pojemności 1 TB. Dzięki tak wydajnej konfiguracji sprzętowej nasza jednostka testowa nadaje się do gier w rozdzielczościach powyżej Full HD.
Kontrola zasilania i warunki testowe
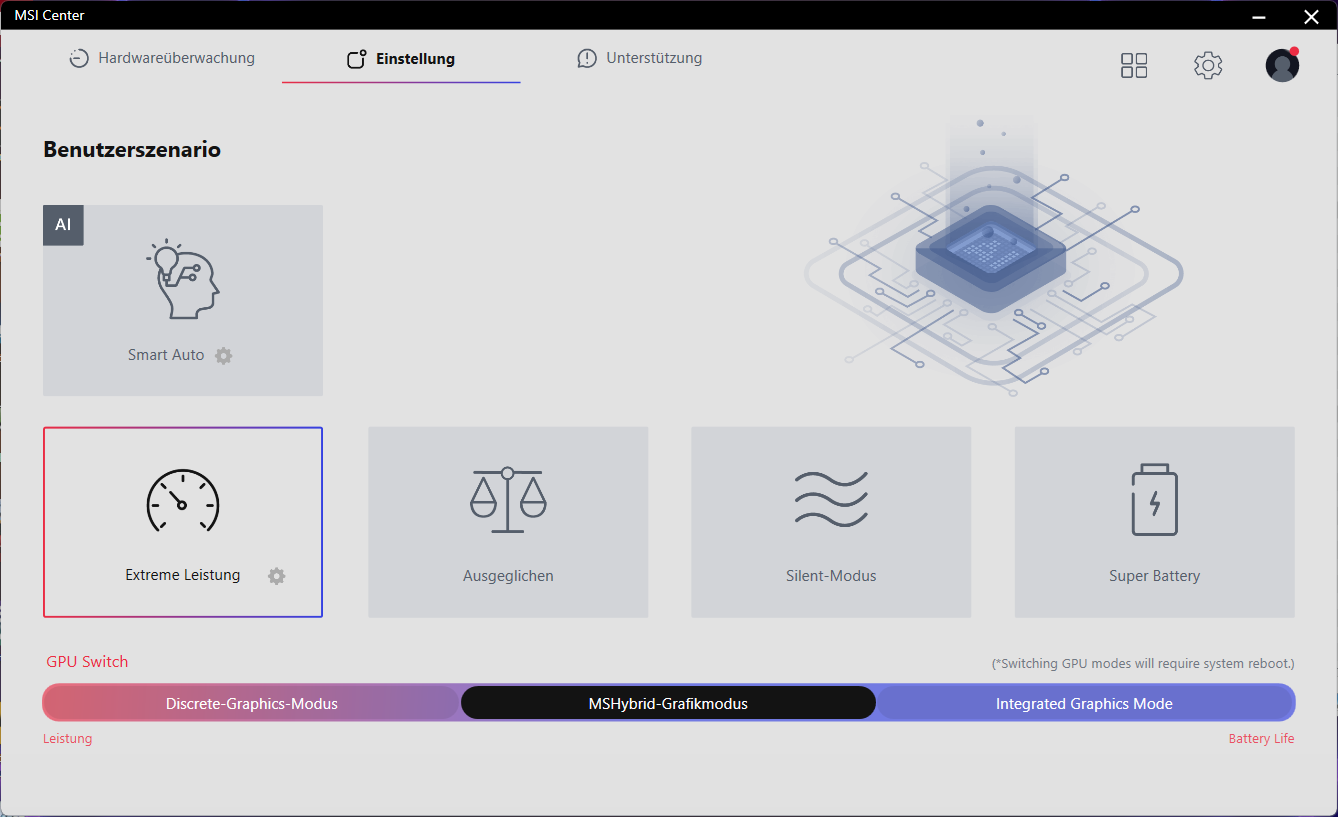
MSI oferuje trzy profile wydajności i tryb oszczędzania baterii w Pulse 17. Ponadto można również skorzystać z trybu AI firmy MSI. Gdy procesor działa samodzielnie, jest w stanie wykorzystać PL1 o mocy 90 watów w trybie Extreme Performance, z potężnym zwiększeniem wydajności (PL2) o mocy 140 watów. W trybie zrównoważonym, PL1 i PL2 wynoszą odpowiednio 70 i 120 watów. Tryb cichej pracy, w którym wentylatory nie są słyszalne, działa z mocą 30 W bez doładowania.
Ale to, co jest bardziej interesujące dla laptopa do gier, to wydajność podczas grania. We wszystkich trzech trybach wydajności nie różni się ona prawie wcale w ciągu pierwszych 10 minut naszego testu. Jedynie temperatury osiągają różne wartości. Tryby Performance i Balanced zapewniają stałą temperaturę CPU i GPU. W trybie cichej pracy temperatury rosną tak wysoko, że wydajność jest dławiona, spadając znacząco po około 10 minutach.
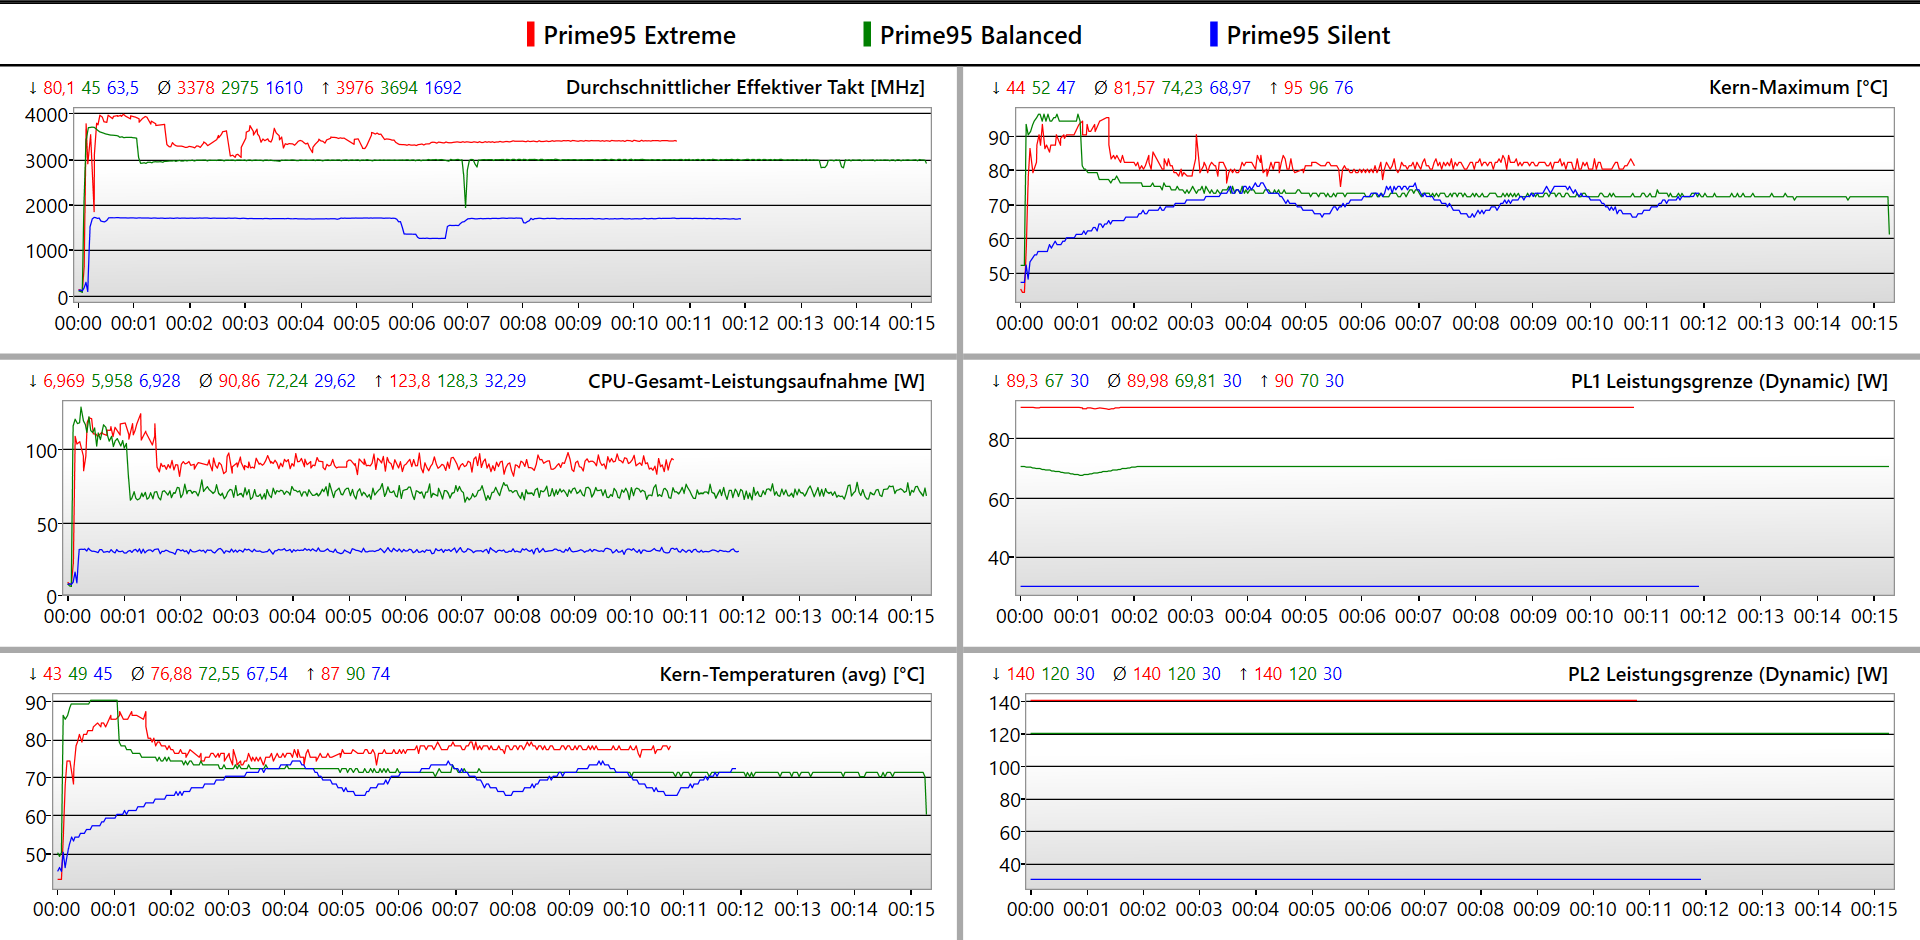
Dlatego też zdecydowaliśmy się uruchomić wszystkie ogólne testy porównawcze w trybie wydajności, a testy porównawcze gier w trybie zrównoważonym. We wszystkich testowanych przez nas grach przeprowadziliśmy również dodatkowy test porównawczy z najwyższymi ustawieniami jakości w trybie Wydajność. Osiągnięta liczba klatek na sekundę różniła się o mniej niż jeden punkt procentowy. Oznacza to, że tryb Wydajności praktycznie nie zapewnia przewagi w liczbie klatek na sekundę podczas grania.
Procesor
Dzięki sześciu rdzeniom P i ośmiu rdzeniom E Intel Core i7-13700H w Pulse 17 jest w stanie obsłużyć 20 wątków. Procesor ten dysponuje stosunkowo dużą mocą i w ten sposób jest w stanie nieznacznie wyprzedzić inne porównywane urządzenia z Core i7. JednakXMG Focus 17z procesoremCore i9oraz Asus ROG Strix G17z procesoremRyzen 9 znacznie przewyższają procesory i7.
Cinebench R15 Multi Constant Load Test
Cinebench R23: Multi Core | Single Core
Cinebench R20: CPU (Multi Core) | CPU (Single Core)
Cinebench R15: CPU Multi 64Bit | CPU Single 64Bit
Blender: v2.79 BMW27 CPU
7-Zip 18.03: 7z b 4 | 7z b 4 -mmt1
Geekbench 5.5: Multi-Core | Single-Core
HWBOT x265 Benchmark v2.2: 4k Preset
LibreOffice : 20 Documents To PDF
R Benchmark 2.5: Overall mean
| CPU Performance rating | |
| Asus ROG Strix G17 G713PI | |
| Schenker XMG Focus 17 (E23) | |
| Średnia w klasie Gaming | |
| MSI Pulse 17 B13VGK | |
| MSI Pulse GL76 12UGK | |
| Przeciętny Intel Core i7-13700H | |
| MSI Katana 17 B13VFK | |
| Acer Nitro 17 AN17-51-71ER | |
| Cinebench R23 / Multi Core | |
| Asus ROG Strix G17 G713PI | |
| Schenker XMG Focus 17 (E23) | |
| Średnia w klasie Gaming (10488 - 42661, n=107, ostatnie 2 lata) | |
| Acer Nitro 17 AN17-51-71ER | |
| MSI Pulse 17 B13VGK | |
| MSI Pulse GL76 12UGK | |
| MSI Katana 17 B13VFK | |
| Przeciętny Intel Core i7-13700H (5890 - 20034, n=29) | |
| Cinebench R23 / Single Core | |
| Średnia w klasie Gaming (1166 - 2415, n=107, ostatnie 2 lata) | |
| Schenker XMG Focus 17 (E23) | |
| Asus ROG Strix G17 G713PI | |
| MSI Katana 17 B13VFK | |
| Przeciętny Intel Core i7-13700H (1323 - 1914, n=29) | |
| MSI Pulse GL76 12UGK | |
| MSI Pulse 17 B13VGK | |
| Acer Nitro 17 AN17-51-71ER | |
| Cinebench R20 / CPU (Multi Core) | |
| Średnia w klasie Gaming (4029 - 16433, n=106, ostatnie 2 lata) | |
| Schenker XMG Focus 17 (E23) | |
| Asus ROG Strix G17 G713PI | |
| MSI Pulse 17 B13VGK | |
| Acer Nitro 17 AN17-51-71ER | |
| MSI Pulse GL76 12UGK | |
| MSI Katana 17 B13VFK | |
| Przeciętny Intel Core i7-13700H (2322 - 7674, n=29) | |
| Cinebench R20 / CPU (Single Core) | |
| Średnia w klasie Gaming (442 - 913, n=106, ostatnie 2 lata) | |
| Schenker XMG Focus 17 (E23) | |
| Asus ROG Strix G17 G713PI | |
| Przeciętny Intel Core i7-13700H (508 - 741, n=29) | |
| MSI Katana 17 B13VFK | |
| MSI Pulse GL76 12UGK | |
| MSI Pulse 17 B13VGK | |
| Acer Nitro 17 AN17-51-71ER | |
| Cinebench R15 / CPU Multi 64Bit | |
| Asus ROG Strix G17 G713PI | |
| Schenker XMG Focus 17 (E23) | |
| Średnia w klasie Gaming (1578 - 6330, n=105, ostatnie 2 lata) | |
| Acer Nitro 17 AN17-51-71ER | |
| MSI Pulse 17 B13VGK | |
| MSI Pulse GL76 12UGK | |
| Przeciętny Intel Core i7-13700H (905 - 2982, n=29) | |
| MSI Katana 17 B13VFK | |
| Cinebench R15 / CPU Single 64Bit | |
| Średnia w klasie Gaming (188.8 - 350, n=106, ostatnie 2 lata) | |
| Asus ROG Strix G17 G713PI | |
| Schenker XMG Focus 17 (E23) | |
| Przeciętny Intel Core i7-13700H (213 - 278, n=29) | |
| MSI Katana 17 B13VFK | |
| MSI Pulse GL76 12UGK | |
| MSI Pulse 17 B13VGK | |
| Acer Nitro 17 AN17-51-71ER | |
| Blender / v2.79 BMW27 CPU | |
| Przeciętny Intel Core i7-13700H (169 - 555, n=29) | |
| MSI Katana 17 B13VFK | |
| MSI Pulse GL76 12UGK | |
| Acer Nitro 17 AN17-51-71ER | |
| MSI Pulse 17 B13VGK | |
| Średnia w klasie Gaming (79 - 330, n=104, ostatnie 2 lata) | |
| Schenker XMG Focus 17 (E23) | |
| Asus ROG Strix G17 G713PI | |
| 7-Zip 18.03 / 7z b 4 | |
| Asus ROG Strix G17 G713PI | |
| Schenker XMG Focus 17 (E23) | |
| Średnia w klasie Gaming (33491 - 148086, n=105, ostatnie 2 lata) | |
| MSI Pulse 17 B13VGK | |
| Acer Nitro 17 AN17-51-71ER | |
| MSI Pulse GL76 12UGK | |
| MSI Katana 17 B13VFK | |
| Przeciętny Intel Core i7-13700H (27322 - 76344, n=29) | |
| 7-Zip 18.03 / 7z b 4 -mmt1 | |
| Asus ROG Strix G17 G713PI | |
| Schenker XMG Focus 17 (E23) | |
| Średnia w klasie Gaming (4199 - 7436, n=105, ostatnie 2 lata) | |
| Przeciętny Intel Core i7-13700H (4825 - 6238, n=29) | |
| MSI Katana 17 B13VFK | |
| MSI Pulse GL76 12UGK | |
| MSI Pulse 17 B13VGK | |
| Acer Nitro 17 AN17-51-71ER | |
| Geekbench 5.5 / Multi-Core | |
| Asus ROG Strix G17 G713PI | |
| Schenker XMG Focus 17 (E23) | |
| Średnia w klasie Gaming (6460 - 28263, n=105, ostatnie 2 lata) | |
| MSI Pulse 17 B13VGK | |
| Acer Nitro 17 AN17-51-71ER | |
| MSI Pulse GL76 12UGK | |
| Przeciętny Intel Core i7-13700H (6165 - 14215, n=29) | |
| MSI Katana 17 B13VFK | |
| Geekbench 5.5 / Single-Core | |
| Średnia w klasie Gaming (986 - 2474, n=105, ostatnie 2 lata) | |
| Asus ROG Strix G17 G713PI | |
| Schenker XMG Focus 17 (E23) | |
| Przeciętny Intel Core i7-13700H (1362 - 1919, n=29) | |
| MSI Katana 17 B13VFK | |
| MSI Pulse 17 B13VGK | |
| MSI Pulse GL76 12UGK | |
| Acer Nitro 17 AN17-51-71ER | |
| HWBOT x265 Benchmark v2.2 / 4k Preset | |
| Asus ROG Strix G17 G713PI | |
| Średnia w klasie Gaming (11.5 - 44.4, n=105, ostatnie 2 lata) | |
| Schenker XMG Focus 17 (E23) | |
| MSI Pulse 17 B13VGK | |
| Acer Nitro 17 AN17-51-71ER | |
| MSI Pulse GL76 12UGK | |
| MSI Katana 17 B13VFK | |
| Przeciętny Intel Core i7-13700H (6.72 - 21.2, n=29) | |
| LibreOffice / 20 Documents To PDF | |
| MSI Pulse 17 B13VGK | |
| MSI Katana 17 B13VFK | |
| Acer Nitro 17 AN17-51-71ER | |
| Schenker XMG Focus 17 (E23) | |
| Średnia w klasie Gaming (33.2 - 88.8, n=105, ostatnie 2 lata) | |
| Przeciętny Intel Core i7-13700H (31.3 - 62.4, n=29) | |
| MSI Pulse GL76 12UGK | |
| Asus ROG Strix G17 G713PI | |
| R Benchmark 2.5 / Overall mean | |
| Acer Nitro 17 AN17-51-71ER | |
| MSI Pulse 17 B13VGK | |
| MSI Pulse GL76 12UGK | |
| Przeciętny Intel Core i7-13700H (0.4308 - 0.607, n=29) | |
| MSI Katana 17 B13VFK | |
| Średnia w klasie Gaming (0.3439 - 0.759, n=106, ostatnie 2 lata) | |
| Schenker XMG Focus 17 (E23) | |
| Asus ROG Strix G17 G713PI | |
* ... im mniej tym lepiej
AIDA64: FP32 Ray-Trace | FPU Julia | CPU SHA3 | CPU Queen | FPU SinJulia | FPU Mandel | CPU AES | CPU ZLib | FP64 Ray-Trace | CPU PhotoWorxx
| Performance rating | |
| Asus ROG Strix G17 G713PI | |
| Średnia w klasie Gaming | |
| Schenker XMG Focus 17 (E23) | |
| Acer Nitro 17 AN17-51-71ER | |
| MSI Pulse 17 B13VGK | |
| MSI Pulse GL76 12UGK | |
| Przeciętny Intel Core i7-13700H | |
| MSI Katana 17 B13VFK | |
| AIDA64 / FP32 Ray-Trace | |
| Asus ROG Strix G17 G713PI | |
| Średnia w klasie Gaming (10227 - 85542, n=105, ostatnie 2 lata) | |
| Schenker XMG Focus 17 (E23) | |
| MSI Pulse 17 B13VGK | |
| Acer Nitro 17 AN17-51-71ER | |
| MSI Pulse GL76 12UGK | |
| Przeciętny Intel Core i7-13700H (4986 - 18908, n=29) | |
| MSI Katana 17 B13VFK | |
| AIDA64 / FPU Julia | |
| Asus ROG Strix G17 G713PI | |
| Średnia w klasie Gaming (51376 - 238426, n=105, ostatnie 2 lata) | |
| Schenker XMG Focus 17 (E23) | |
| MSI Pulse 17 B13VGK | |
| Acer Nitro 17 AN17-51-71ER | |
| MSI Pulse GL76 12UGK | |
| Przeciętny Intel Core i7-13700H (25360 - 92359, n=29) | |
| MSI Katana 17 B13VFK | |
| AIDA64 / CPU SHA3 | |
| Asus ROG Strix G17 G713PI | |
| Średnia w klasie Gaming (2180 - 10115, n=105, ostatnie 2 lata) | |
| Schenker XMG Focus 17 (E23) | |
| Acer Nitro 17 AN17-51-71ER | |
| MSI Pulse 17 B13VGK | |
| MSI Pulse GL76 12UGK | |
| Przeciętny Intel Core i7-13700H (1339 - 4224, n=29) | |
| MSI Katana 17 B13VFK | |
| AIDA64 / CPU Queen | |
| Asus ROG Strix G17 G713PI | |
| Schenker XMG Focus 17 (E23) | |
| Średnia w klasie Gaming (49785 - 173351, n=90, ostatnie 2 lata) | |
| MSI Pulse GL76 12UGK | |
| Acer Nitro 17 AN17-51-71ER | |
| MSI Pulse 17 B13VGK | |
| Przeciętny Intel Core i7-13700H (59324 - 107159, n=29) | |
| MSI Katana 17 B13VFK | |
| AIDA64 / FPU SinJulia | |
| Asus ROG Strix G17 G713PI | |
| Średnia w klasie Gaming (4424 - 33636, n=105, ostatnie 2 lata) | |
| Schenker XMG Focus 17 (E23) | |
| MSI Pulse 17 B13VGK | |
| Acer Nitro 17 AN17-51-71ER | |
| MSI Pulse GL76 12UGK | |
| Przeciętny Intel Core i7-13700H (4800 - 11050, n=29) | |
| MSI Katana 17 B13VFK | |
| AIDA64 / FPU Mandel | |
| Asus ROG Strix G17 G713PI | |
| Średnia w klasie Gaming (25115 - 128721, n=105, ostatnie 2 lata) | |
| Schenker XMG Focus 17 (E23) | |
| MSI Pulse 17 B13VGK | |
| Acer Nitro 17 AN17-51-71ER | |
| MSI Pulse GL76 12UGK | |
| Przeciętny Intel Core i7-13700H (12321 - 45118, n=29) | |
| MSI Katana 17 B13VFK | |
| AIDA64 / CPU AES | |
| Asus ROG Strix G17 G713PI | |
| Acer Nitro 17 AN17-51-71ER | |
| MSI Pulse GL76 12UGK | |
| Średnia w klasie Gaming (39258 - 247074, n=105, ostatnie 2 lata) | |
| Schenker XMG Focus 17 (E23) | |
| MSI Pulse 17 B13VGK | |
| Przeciętny Intel Core i7-13700H (28769 - 151254, n=29) | |
| MSI Katana 17 B13VFK | |
| AIDA64 / CPU ZLib | |
| Asus ROG Strix G17 G713PI | |
| Schenker XMG Focus 17 (E23) | |
| Średnia w klasie Gaming (574 - 2531, n=105, ostatnie 2 lata) | |
| Acer Nitro 17 AN17-51-71ER | |
| MSI Pulse 17 B13VGK | |
| MSI Pulse GL76 12UGK | |
| Przeciętny Intel Core i7-13700H (389 - 1215, n=29) | |
| MSI Katana 17 B13VFK | |
| AIDA64 / FP64 Ray-Trace | |
| Asus ROG Strix G17 G713PI | |
| Średnia w klasie Gaming (5509 - 45446, n=105, ostatnie 2 lata) | |
| Schenker XMG Focus 17 (E23) | |
| MSI Pulse 17 B13VGK | |
| Acer Nitro 17 AN17-51-71ER | |
| MSI Pulse GL76 12UGK | |
| Przeciętny Intel Core i7-13700H (2540 - 10135, n=29) | |
| MSI Katana 17 B13VFK | |
| AIDA64 / CPU PhotoWorxx | |
| Schenker XMG Focus 17 (E23) | |
| Średnia w klasie Gaming (12271 - 89891, n=105, ostatnie 2 lata) | |
| Przeciętny Intel Core i7-13700H (12872 - 52727, n=29) | |
| MSI Pulse 17 B13VGK | |
| Acer Nitro 17 AN17-51-71ER | |
| MSI Katana 17 B13VFK | |
| Asus ROG Strix G17 G713PI | |
| MSI Pulse GL76 12UGK | |
Wydajność systemu
Przeprowadziliśmy benchmark wydajności systemu PCMark 10 dwukrotnie, ponieważ w pierwszym uruchomieniu MSI Pulse pozostawał daleko w tyle za potężnymi wynikami, które procesor był w stanie pokazać w swoich benchmarkach wcześniej. Z zaledwie 6844 punktami osiągnąłby tylko ostatnie miejsce wśród naszych urządzeń porównawczych. Jednak kilka aktualizacji później za pomocą Windows Update, obraz zmienia się drastycznie.
Laptop do gier plasuje się teraz ledwo przed urządzeniami porównawczymi. Jedyny wyraźny punkt odstający występuje w sekcji Essentials testu porównawczego. Podejrzewamy, że wina leży po stronie stosunkowo wolnego dysku SSD w naszej jednostce testowej, ponieważ sekcja Essentials kładzie szczególny nacisk na czasy dostępu do danych i programów.
Obciążający procesor CrossMark maluje podobny obraz z urządzeniami porównawczymi z Core i9i Ryzen 9są w stanie znacznie wyprzedzić.
CrossMark: Overall | Productivity | Creativity | Responsiveness
| PCMark 10 / Score | |
| Średnia w klasie Gaming (5828 - 12414, n=93, ostatnie 2 lata) | |
| MSI Pulse 17 B13VGK | |
| MSI Pulse GL76 12UGK | |
| Asus ROG Strix G17 G713PI | |
| Przeciętny Intel Core i7-13700H, NVIDIA GeForce RTX 4070 Laptop GPU (7158 - 7956, n=8) | |
| MSI Katana 17 B13VFK | |
| Acer Nitro 17 AN17-51-71ER | |
| Schenker XMG Focus 17 (E23) | |
| PCMark 10 / Essentials | |
| Asus ROG Strix G17 G713PI | |
| MSI Pulse GL76 12UGK | |
| MSI Katana 17 B13VFK | |
| Przeciętny Intel Core i7-13700H, NVIDIA GeForce RTX 4070 Laptop GPU (10252 - 11449, n=8) | |
| Średnia w klasie Gaming (8810 - 11935, n=97, ostatnie 2 lata) | |
| MSI Pulse 17 B13VGK | |
| Acer Nitro 17 AN17-51-71ER | |
| Schenker XMG Focus 17 (E23) | |
| PCMark 10 / Productivity | |
| Średnia w klasie Gaming (6845 - 25323, n=95, ostatnie 2 lata) | |
| Asus ROG Strix G17 G713PI | |
| MSI Pulse 17 B13VGK | |
| MSI Pulse GL76 12UGK | |
| Schenker XMG Focus 17 (E23) | |
| Przeciętny Intel Core i7-13700H, NVIDIA GeForce RTX 4070 Laptop GPU (8501 - 10769, n=8) | |
| MSI Katana 17 B13VFK | |
| Acer Nitro 17 AN17-51-71ER | |
| PCMark 10 / Digital Content Creation | |
| Średnia w klasie Gaming (7602 - 19954, n=95, ostatnie 2 lata) | |
| Acer Nitro 17 AN17-51-71ER | |
| MSI Pulse 17 B13VGK | |
| MSI Pulse GL76 12UGK | |
| Przeciętny Intel Core i7-13700H, NVIDIA GeForce RTX 4070 Laptop GPU (10358 - 12908, n=8) | |
| MSI Katana 17 B13VFK | |
| Schenker XMG Focus 17 (E23) | |
| Asus ROG Strix G17 G713PI | |
| CrossMark / Overall | |
| Asus ROG Strix G17 G713PI | |
| Schenker XMG Focus 17 (E23) | |
| Średnia w klasie Gaming (1366 - 2409, n=94, ostatnie 2 lata) | |
| MSI Pulse 17 B13VGK | |
| Przeciętny Intel Core i7-13700H, NVIDIA GeForce RTX 4070 Laptop GPU (1768 - 2073, n=6) | |
| MSI Katana 17 B13VFK | |
| MSI Pulse GL76 12UGK | |
| Acer Nitro 17 AN17-51-71ER | |
| CrossMark / Productivity | |
| Asus ROG Strix G17 G713PI | |
| Schenker XMG Focus 17 (E23) | |
| Średnia w klasie Gaming (1386 - 2254, n=94, ostatnie 2 lata) | |
| MSI Pulse 17 B13VGK | |
| Przeciętny Intel Core i7-13700H, NVIDIA GeForce RTX 4070 Laptop GPU (1645 - 2006, n=6) | |
| MSI Pulse GL76 12UGK | |
| MSI Katana 17 B13VFK | |
| Acer Nitro 17 AN17-51-71ER | |
| CrossMark / Creativity | |
| Asus ROG Strix G17 G713PI | |
| Schenker XMG Focus 17 (E23) | |
| Średnia w klasie Gaming (1343 - 2786, n=94, ostatnie 2 lata) | |
| MSI Pulse 17 B13VGK | |
| Przeciętny Intel Core i7-13700H, NVIDIA GeForce RTX 4070 Laptop GPU (1936 - 2137, n=6) | |
| MSI Katana 17 B13VFK | |
| MSI Pulse GL76 12UGK | |
| Acer Nitro 17 AN17-51-71ER | |
| CrossMark / Responsiveness | |
| MSI Pulse GL76 12UGK | |
| MSI Pulse 17 B13VGK | |
| Schenker XMG Focus 17 (E23) | |
| Przeciętny Intel Core i7-13700H, NVIDIA GeForce RTX 4070 Laptop GPU (1451 - 2202, n=6) | |
| MSI Katana 17 B13VFK | |
| Średnia w klasie Gaming (1226 - 2334, n=94, ostatnie 2 lata) | |
| Asus ROG Strix G17 G713PI | |
| Acer Nitro 17 AN17-51-71ER | |
| PCMark 10 Score | 7796 pkt. | |
Pomoc | ||
| AIDA64 / Memory Copy | |
| Schenker XMG Focus 17 (E23) | |
| Średnia w klasie Gaming (21750 - 129946, n=105, ostatnie 2 lata) | |
| Przeciętny Intel Core i7-13700H (24334 - 78081, n=29) | |
| MSI Pulse 17 B13VGK | |
| Acer Nitro 17 AN17-51-71ER | |
| MSI Katana 17 B13VFK | |
| Asus ROG Strix G17 G713PI | |
| MSI Pulse GL76 12UGK | |
| AIDA64 / Memory Read | |
| Schenker XMG Focus 17 (E23) | |
| Średnia w klasie Gaming (22956 - 118858, n=105, ostatnie 2 lata) | |
| MSI Pulse 17 B13VGK | |
| Acer Nitro 17 AN17-51-71ER | |
| Przeciętny Intel Core i7-13700H (23681 - 79656, n=29) | |
| MSI Katana 17 B13VFK | |
| Asus ROG Strix G17 G713PI | |
| MSI Pulse GL76 12UGK | |
| AIDA64 / Memory Write | |
| Średnia w klasie Gaming (22297 - 135096, n=105, ostatnie 2 lata) | |
| Schenker XMG Focus 17 (E23) | |
| Przeciętny Intel Core i7-13700H (22986 - 99898, n=29) | |
| Acer Nitro 17 AN17-51-71ER | |
| MSI Pulse 17 B13VGK | |
| Asus ROG Strix G17 G713PI | |
| MSI Katana 17 B13VFK | |
| MSI Pulse GL76 12UGK | |
| AIDA64 / Memory Latency | |
| Acer Nitro 17 AN17-51-71ER | |
| Średnia w klasie Gaming (75.3 - 259, n=105, ostatnie 2 lata) | |
| MSI Katana 17 B13VFK | |
| MSI Pulse 17 B13VGK | |
| Przeciętny Intel Core i7-13700H (82.4 - 136.8, n=29) | |
| MSI Pulse GL76 12UGK | |
| Schenker XMG Focus 17 (E23) | |
| Asus ROG Strix G17 G713PI | |
* ... im mniej tym lepiej
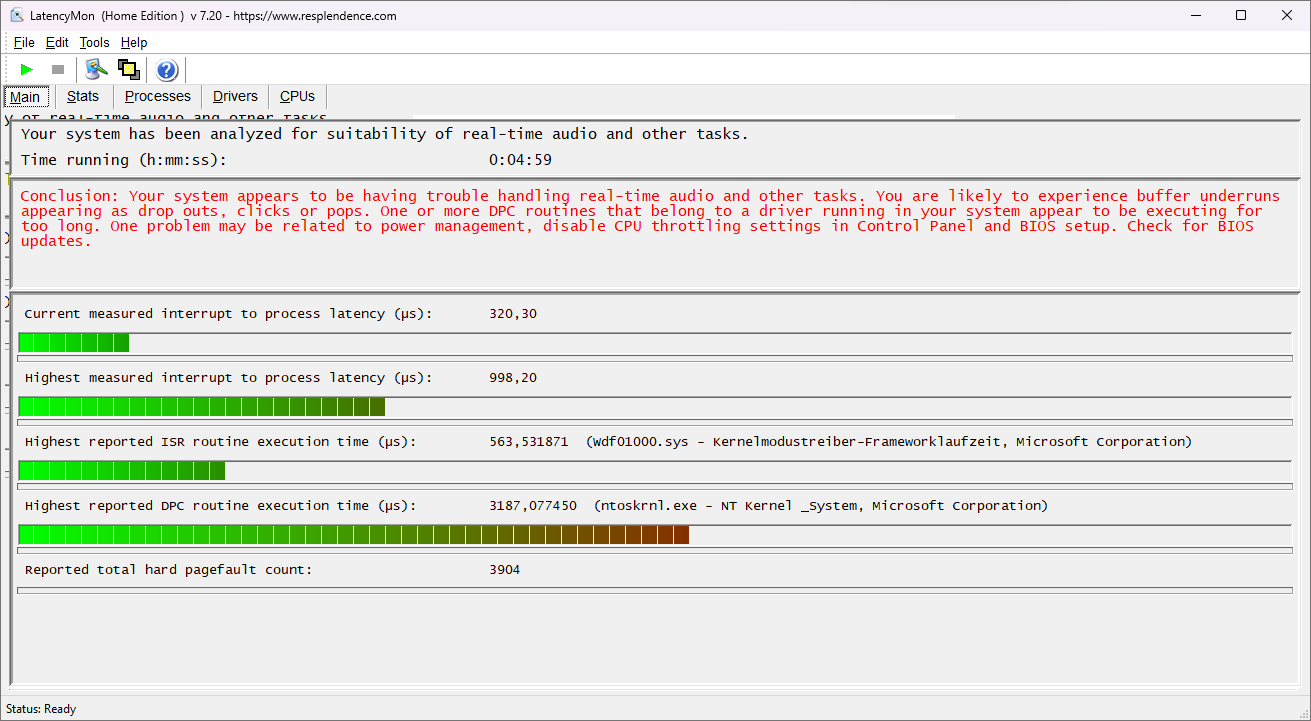
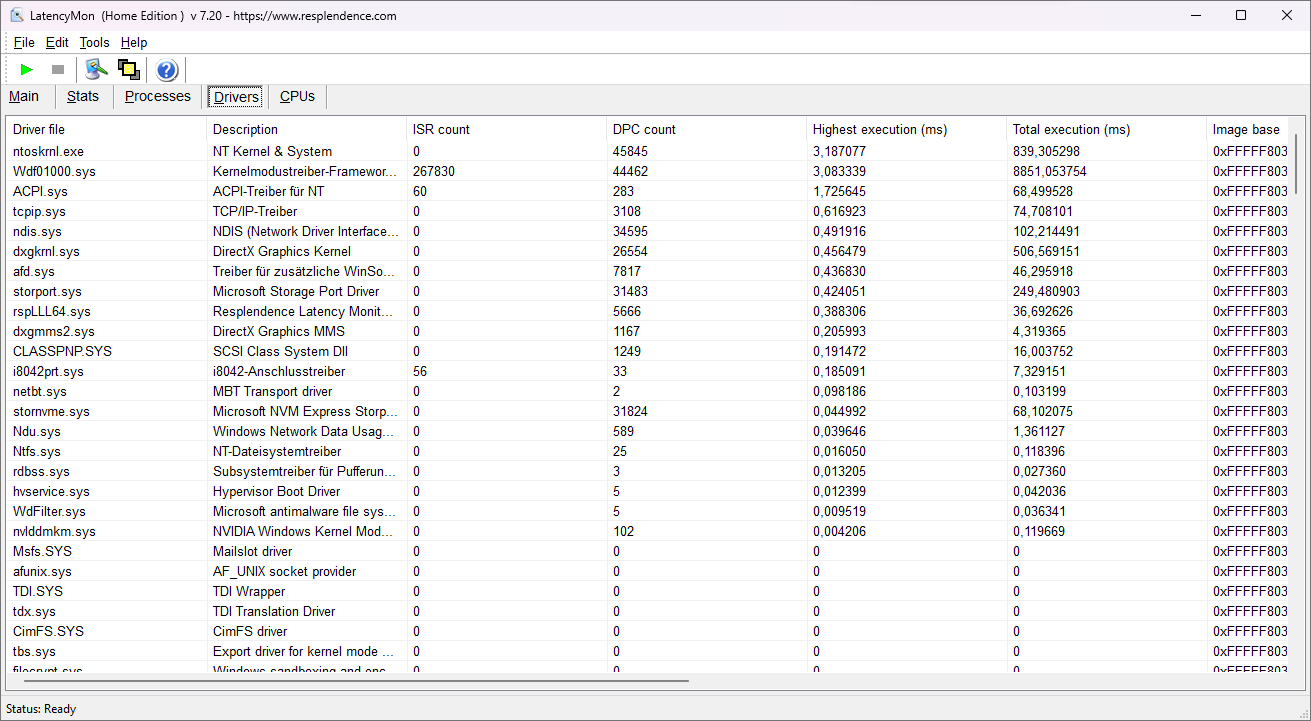
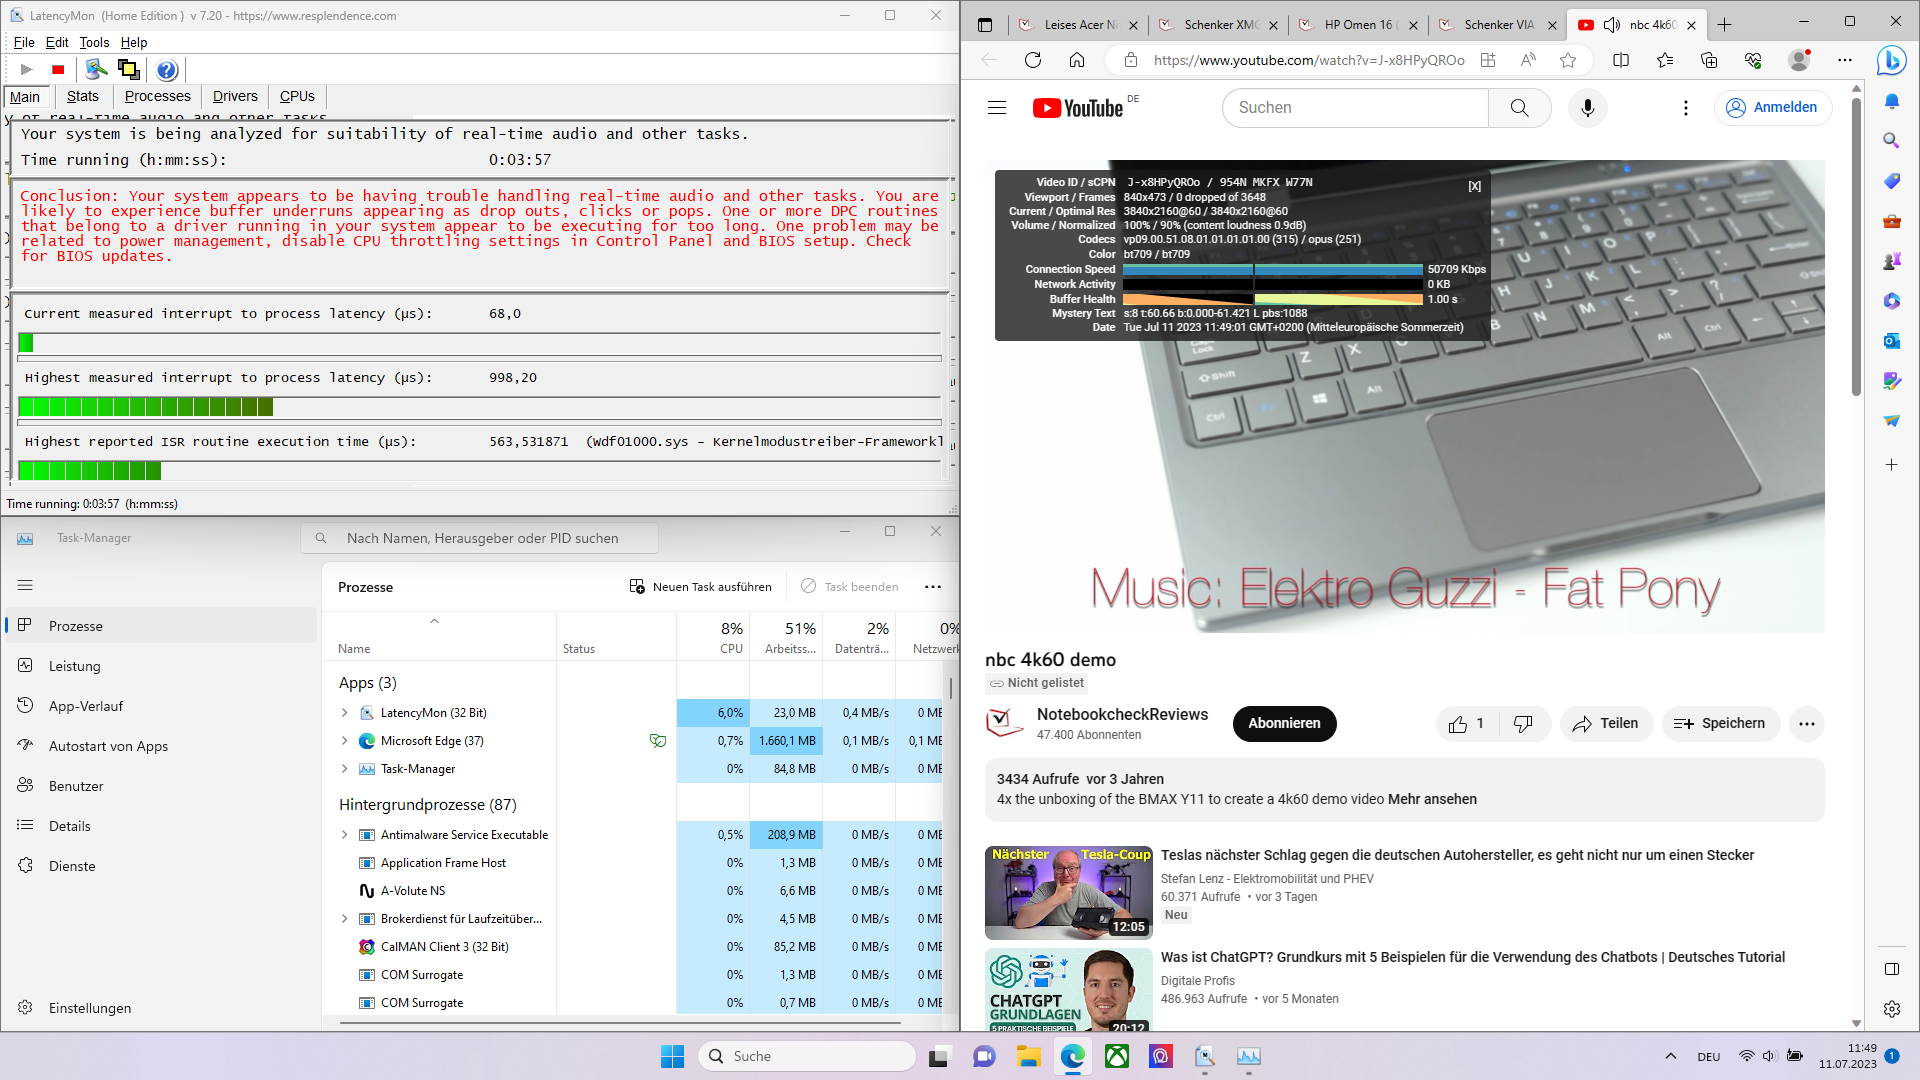
Opóźnienia DPC
W opóźnieniach DPC LatencyMon określa, że laptop do gier z dostępnymi aktualizacjami w czasie testu nie nadaje się do przetwarzania dźwięku w czasie rzeczywistym. Problem najwyraźniej leży w jądrze systemu Windows.
| DPC Latencies / LatencyMon - interrupt to process latency (max), Web, Youtube, Prime95 | |
| MSI Katana 17 B13VFK | |
| Asus ROG Strix G17 G713PI | |
| Acer Nitro 17 AN17-51-71ER | |
| MSI Pulse 17 B13VGK | |
| Schenker XMG Focus 17 (E23) | |
| MSI Pulse GL76 12UGK | |
* ... im mniej tym lepiej
Rozwiązanie pamięci masowej
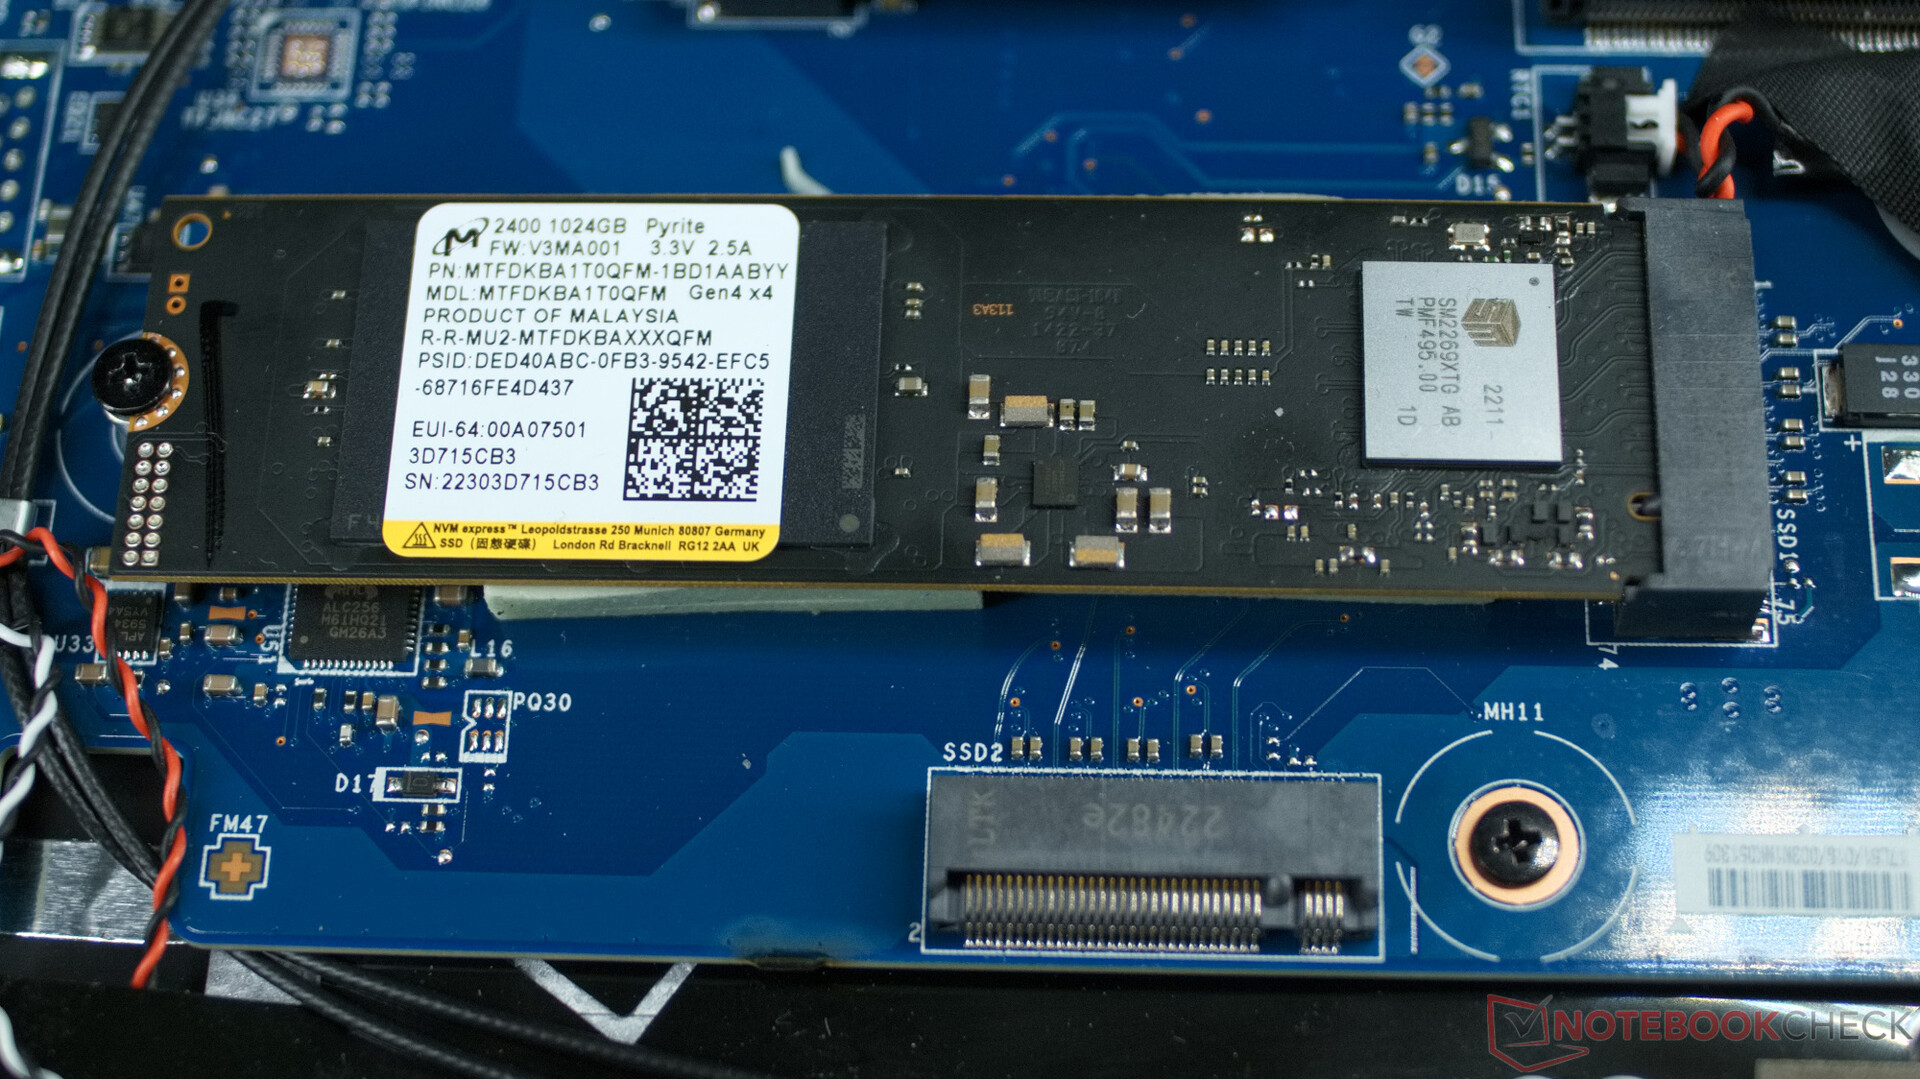
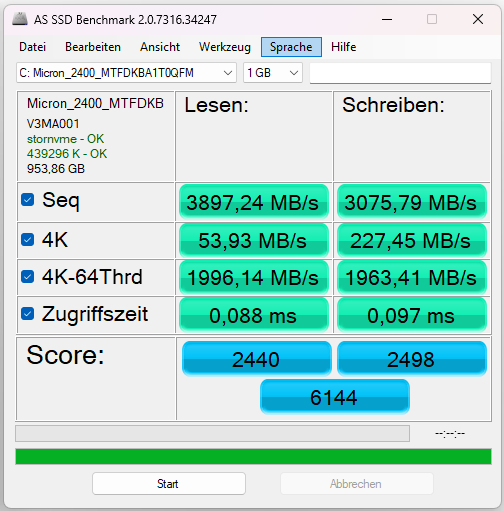
DyskMicron 2400 NVMe SSD w naszej jednostce testowej oferuje pojemność 1 terabajta. Jego prędkość jest przeciętna wśród laptopów do gier i może być również stale utrzymywana w MSI Pulse 17 przez dłuższy czas bez żadnych problemów.

* ... im mniej tym lepiej
Constant Read Performance: DiskSpd Read Loop, Queue Depth 8
Karta graficzna
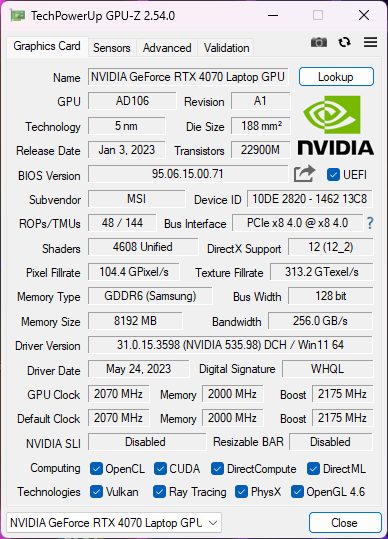
Karta graficznaNvidia RTX 4070jest w stanie stale pracować z mocą od 100 do 140 watów w MSI Pulse 17 bez nadmiernego nagrzewania się układu. Dzięki temu układ graficzny zapewnia stosunkowo wysoką wydajność w benchmarkach 3DMark. Oznacza to, że granie w rozdzielczości Full HD i lekkie raytracing nie powinny stanowić żadnego problemu dla karty graficznej, a układ szybko radzi sobie również z praktycznymi zastosowaniami, takimi jak renderowanie grafiki 3D w programach takich jak Blender.
| 3DMark 11 Performance | 34584 pkt. | |
| 3DMark Cloud Gate Standard Score | 70329 pkt. | |
| 3DMark Fire Strike Score | 27138 pkt. | |
| 3DMark Time Spy Score | 12235 pkt. | |
Pomoc | ||
| Geekbench 6.7 - GPU OpenCL | |
| Średnia w klasie Gaming (67235 - 253130, n=103, ostatnie 2 lata) | |
| MSI Pulse 17 B13VGK | |
| Przeciętny NVIDIA GeForce RTX 4070 Laptop GPU (85488 - 129836, n=45) | |
* ... im mniej tym lepiej
Wydajność w grach
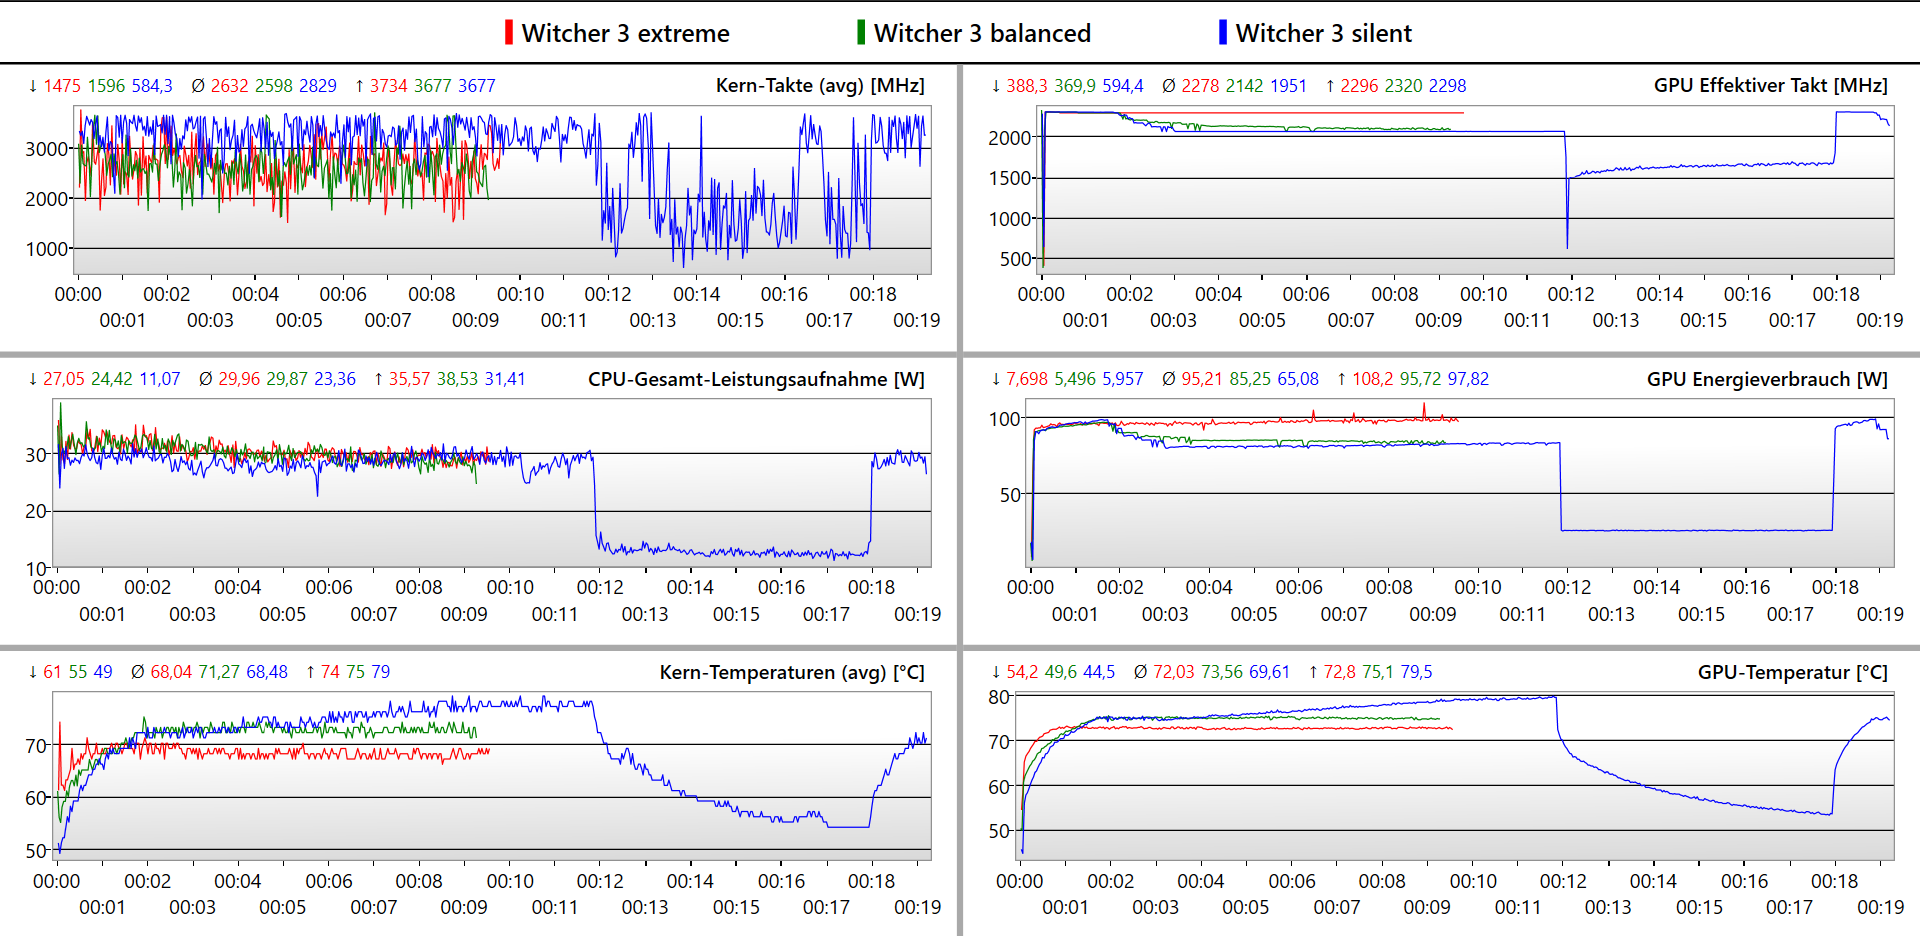
ModelSchenker XMG Focus 17i Asus ROG Strix G17mają tutaj niewielką przewagę nad MSI Pulse 17. Oba laptopy oferują po prostu szybszy procesor, co jest wyraźnie odzwierciedlone w liczbie klatek na sekundę w grach obciążających procesor, takich jak Dota 2 Reborn. Jednak Pulse 17 pokazuje również, że granie w rozdzielczości Full HD i więcej przy wysokich ustawieniach jakości, a nawet raytracingu, jest możliwe bez schodzenia poniżej 60 klatek na sekundę. Jednocześnie laptop pozostaje znacznie cichszy niż inni konkurenci i można tu grać w gry bez spadku wydajności w trybie zrównoważonym przy poziomie hałasu wynoszącym zaledwie 42 dB(A) (mierzone z odległości 15 cm, ~ 6 cali).
| Performance rating - Percent | |
| Średnia w klasie Gaming | |
| Asus ROG Strix G17 G713PI | |
| Schenker XMG Focus 17 (E23) | |
| MSI Katana 17 B13VFK | |
| MSI Pulse 17 B13VGK | |
| Acer Nitro 17 AN17-51-71ER | |
| MSI Pulse GL76 12UGK | |
| The Witcher 3 - 1920x1080 Ultra Graphics & Postprocessing (HBAO+) | |
| Średnia w klasie Gaming (104.7 - 240, n=7, ostatnie 2 lata) | |
| Asus ROG Strix G17 G713PI | |
| Schenker XMG Focus 17 (E23) | |
| MSI Pulse 17 B13VGK | |
| Acer Nitro 17 AN17-51-71ER | |
| MSI Katana 17 B13VFK | |
| MSI Pulse GL76 12UGK | |
| GTA V - 1920x1080 Highest AA:4xMSAA + FX AF:16x | |
| Średnia w klasie Gaming (48.3 - 186.9, n=94, ostatnie 2 lata) | |
| Schenker XMG Focus 17 (E23) | |
| MSI Pulse 17 B13VGK | |
| Acer Nitro 17 AN17-51-71ER | |
| Asus ROG Strix G17 G713PI | |
| MSI Katana 17 B13VFK | |
| MSI Pulse GL76 12UGK | |
| Final Fantasy XV Benchmark - 1920x1080 High Quality | |
| Średnia w klasie Gaming (41 - 215, n=95, ostatnie 2 lata) | |
| Schenker XMG Focus 17 (E23) | |
| Asus ROG Strix G17 G713PI | |
| MSI Pulse 17 B13VGK | |
| Acer Nitro 17 AN17-51-71ER | |
| MSI Katana 17 B13VFK | |
| MSI Pulse GL76 12UGK | |
| Strange Brigade - 1920x1080 ultra AA:ultra AF:16 | |
| Średnia w klasie Gaming (76.3 - 458, n=87, ostatnie 2 lata) | |
| Schenker XMG Focus 17 (E23) | |
| Asus ROG Strix G17 G713PI | |
| MSI Pulse 17 B13VGK | |
| Acer Nitro 17 AN17-51-71ER | |
| MSI Katana 17 B13VFK | |
| MSI Pulse GL76 12UGK | |
| Dota 2 Reborn - 1920x1080 ultra (3/3) best looking | |
| Schenker XMG Focus 17 (E23) | |
| Asus ROG Strix G17 G713PI | |
| MSI Katana 17 B13VFK | |
| Średnia w klasie Gaming (84.8 - 248, n=107, ostatnie 2 lata) | |
| MSI Pulse 17 B13VGK | |
| Acer Nitro 17 AN17-51-71ER | |
| MSI Pulse GL76 12UGK | |
W godzinnym teście z The Witcher 3 pokazano typowy zakres FPS w dziennym i nocnym rytmie gry. Nie widzimy tu żadnych znaczących wartości odstających.
The Witcher 3 FPS Chart
| low | med. | high | ultra | QHD | 4K | |
|---|---|---|---|---|---|---|
| GTA V (2015) | 184.8 | 182.2 | 176.9 | 116.4 | ||
| The Witcher 3 (2015) | 106.9 | |||||
| Dota 2 Reborn (2015) | 174 | 158 | 146.3 | 138.5 | 132.4 | |
| Final Fantasy XV Benchmark (2018) | 150.5 | 111.9 | 86.2 | 47.5 | ||
| X-Plane 11.11 (2018) | 147.6 | 130.8 | 102 | 102.2 | ||
| Far Cry 5 (2018) | 163 | 154 | 145 | |||
| Strange Brigade (2018) | 468 | 295 | 233 | 202 | ||
| F1 22 (2022) | 239 | 228 | 186.7 | 71 | ||
| F1 23 (2023) | 248 | 251 | 199.2 | 100 |
Emisje - ciche wentylatory
Emisja hałasu
MSI Pulse 17 jest wyjątkowo cichy jak na laptop do gier. Zmierzyliśmy maksymalny poziom hałasu wynoszący zaledwie 46,5 dB(A) pod obciążeniem w trybie Performance, a w trybie Balanced jest on nawet o 4 dB(A) niższy. Wentylatory są również słyszalne z opóźnieniem pod obciążeniem. Przykładowo, w naszym pomiarze pod średnim obciążeniem w PCMark 06 uaktywniają się one dopiero na krótko przed końcem benchmarka.
Hałas
| luz |
| 24 / 24 / 24 dB |
| obciążenie |
| 32.49 / 46.51 dB |
 | ||
30 dB cichy 40 dB(A) słyszalny 50 dB(A) irytujący |
||
min: | ||
| MSI Pulse 17 B13VGK GeForce RTX 4070 Laptop GPU, i7-13700H, Micron 2400 MTFDKBA1T0QFM | MSI Pulse GL76 12UGK GeForce RTX 3070 Laptop GPU, i7-12700H, Micron 3400 1TB MTFDKBA1T0TFH | MSI Katana 17 B13VFK GeForce RTX 4060 Laptop GPU, i7-13620H, Micron 2400 MTFDKBA1T0QFM | Acer Nitro 17 AN17-51-71ER GeForce RTX 4060 Laptop GPU, i7-13700H, Samsung PM9A1 MZVL21T0HCLR | Schenker XMG Focus 17 (E23) GeForce RTX 4070 Laptop GPU, i9-13900HX, Crucial P5 Plus 1TB CT1000P5PSSD8 | Asus ROG Strix G17 G713PI GeForce RTX 4070 Laptop GPU, R9 7945HX, WD PC SN560 SDDPNQE-1T00 | |
|---|---|---|---|---|---|---|
| Noise | -13% | -24% | -11% | -19% | -14% | |
| wyłączone / środowisko * (dB) | 24 | 24.1 -0% | 24.5 -2% | 24 -0% | 24 -0% | 25 -4% |
| Idle Minimum * (dB) | 24 | 26.9 -12% | 24.5 -2% | 24 -0% | 24 -0% | 26 -8% |
| Idle Average * (dB) | 24 | 26.9 -12% | 24.5 -2% | 24 -0% | 24 -0% | 29 -21% |
| Idle Maximum * (dB) | 24 | 27 -13% | 40 -67% | 32.32 -35% | 26.47 -10% | 30 -25% |
| Load Average * (dB) | 32.49 | 43.8 -35% | 48.3 -49% | 35.18 -8% | 55.72 -71% | 46 -42% |
| Witcher 3 ultra * (dB) | 46.51 | 44.7 4% | 56 -20% | 54.78 -18% | 57.94 -25% | 46 1% |
| Load Maximum * (dB) | 46.51 | 58.3 -25% | 59.1 -27% | 54.78 -18% | 57.94 -25% | 47 -1% |
* ... im mniej tym lepiej
Temperatury
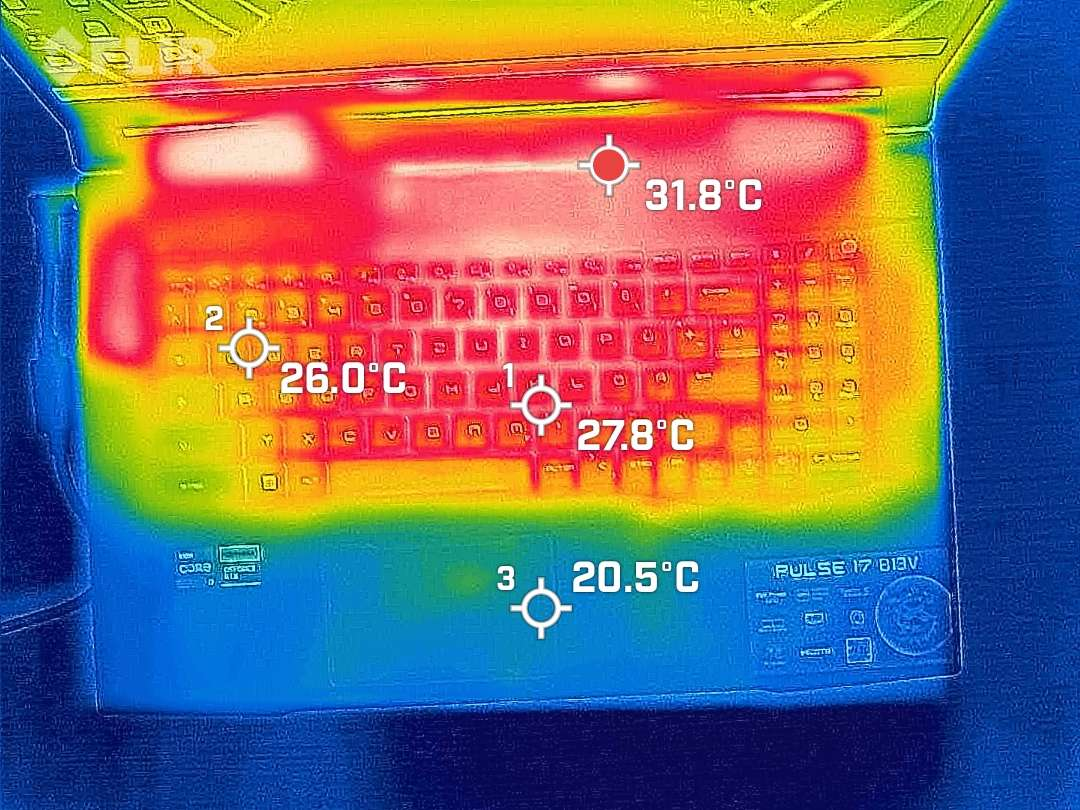
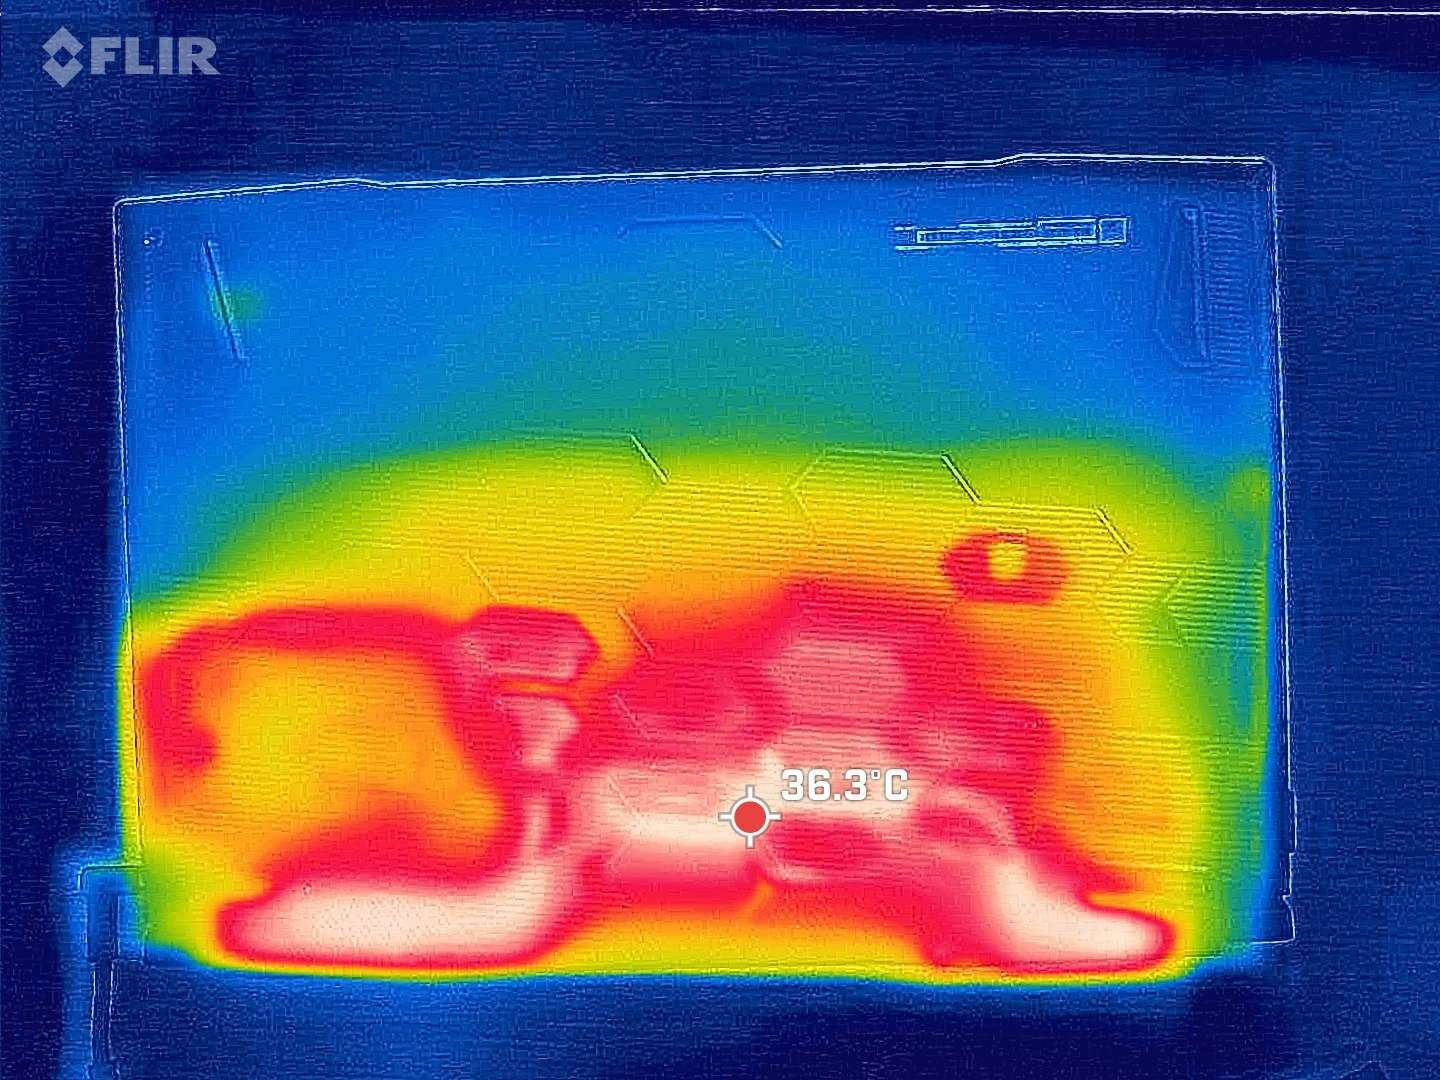
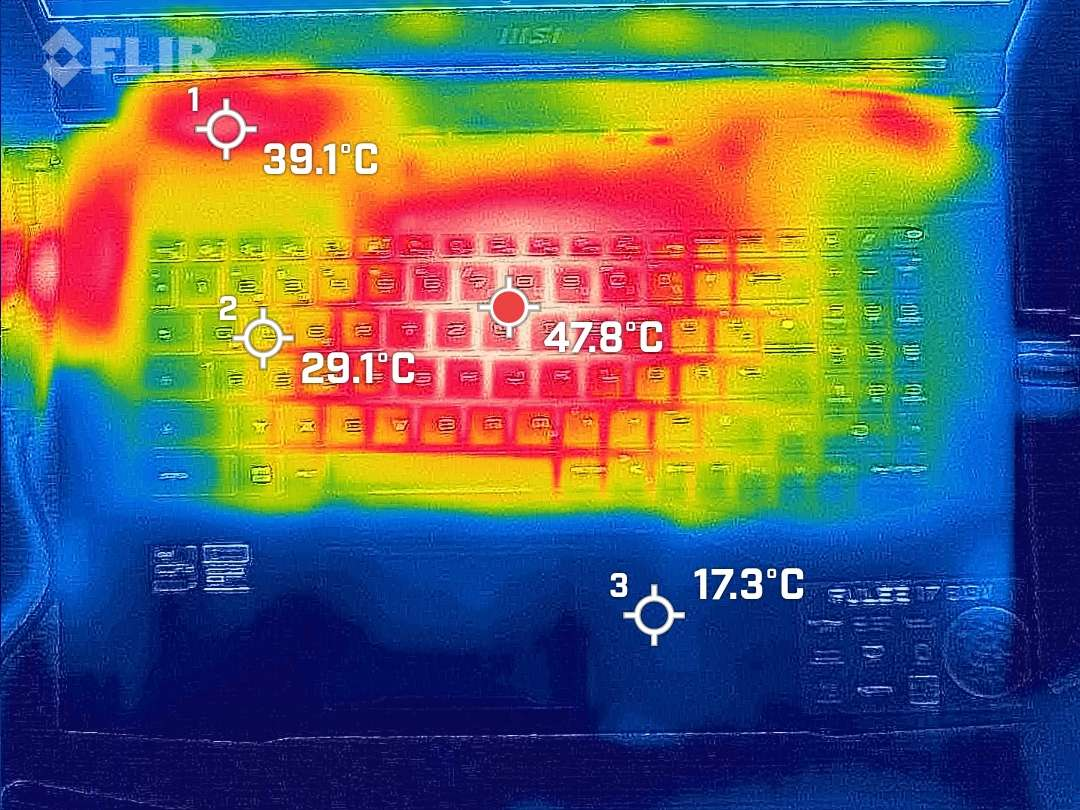
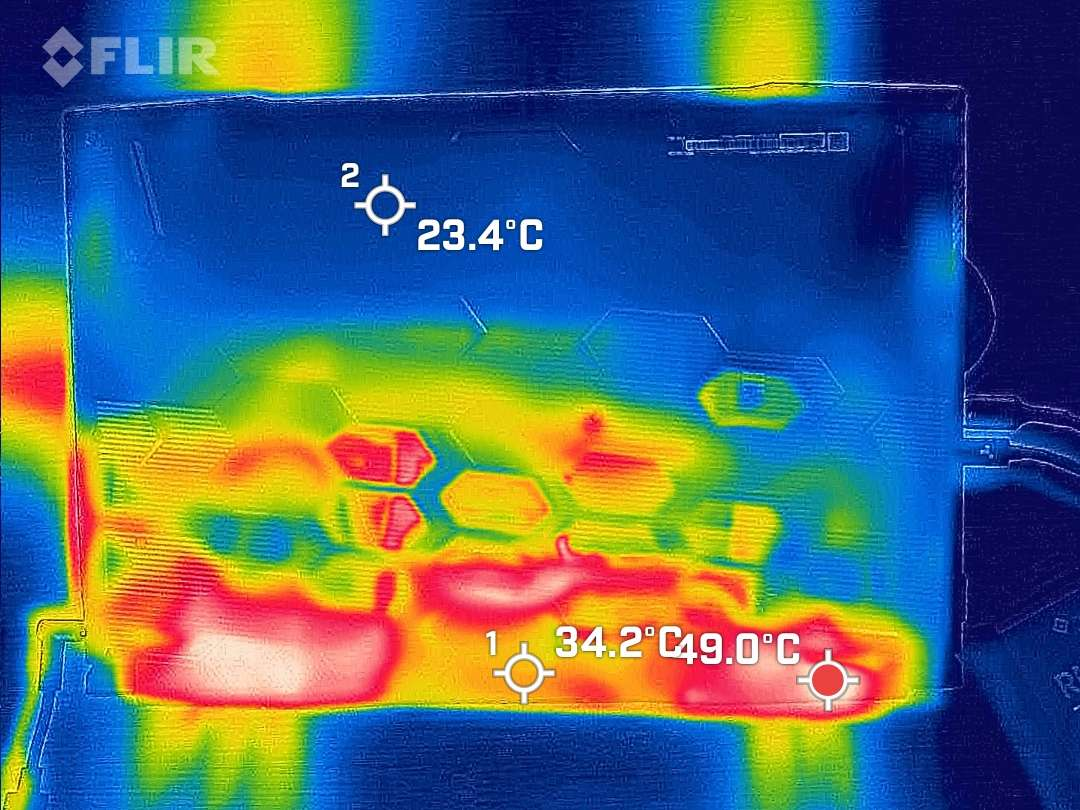
W naszej jednostce testowej temperatury powierzchni podpórek pod dłonie pozostawały niezmiennie chłodne i tylko nieznacznie wyższe od temperatury pokojowej. Maksymalna temperatura urządzenia wynosi 48 °C (118 °F) i jest rozłożona na dużych obszarach na tylnej krawędzi powyżej i poniżej systemu chłodzenia, a także na środku klawiatury. Jednak temperatury pozostają w tolerowanych zakresach w obszarach ważnych dla gier, a także na spodzie tego wysokowydajnego laptopa do gier.
(-) Maksymalna temperatura w górnej części wynosi 48 °C / 118 F, w porównaniu do średniej 40.4 °C / 105 F , począwszy od 21.2 do 68.8 °C dla klasy Gaming.
(-) Dno nagrzewa się maksymalnie do 50 °C / 122 F, w porównaniu do średniej 43.2 °C / 110 F
(+) W stanie bezczynności średnia temperatura górnej części wynosi 27.8 °C / 82 F, w porównaniu ze średnią temperaturą urządzenia wynoszącą 33.9 °C / ### class_avg_f### F.
(±) Podczas gry w Wiedźmina 3 średnia temperatura górnej części wynosi 37 °C / 99 F, w porównaniu do średniej temperatury urządzenia wynoszącej 33.9 °C / ## #class_avg_f### F.
(+) Podpórki pod nadgarstki i touchpad są chłodniejsze niż temperatura skóry i maksymalnie 24 °C / 75.2 F i dlatego są chłodne w dotyku.
(+) Średnia temperatura obszaru podparcia dłoni w podobnych urządzeniach wynosiła 28.8 °C / 83.8 F (+4.8 °C / 8.6 F).
| MSI Pulse 17 B13VGK Intel Core i7-13700H, NVIDIA GeForce RTX 4070 Laptop GPU | |
|---|---|
| Heat | |
| Maximum Upper Side * (°C) | 48 |
| Maximum Bottom * (°C) | 50 |
| Idle Upper Side * (°C) | 30 |
| Idle Bottom * (°C) | 33 |
* ... im mniej tym lepiej
Test warunków skrajnych
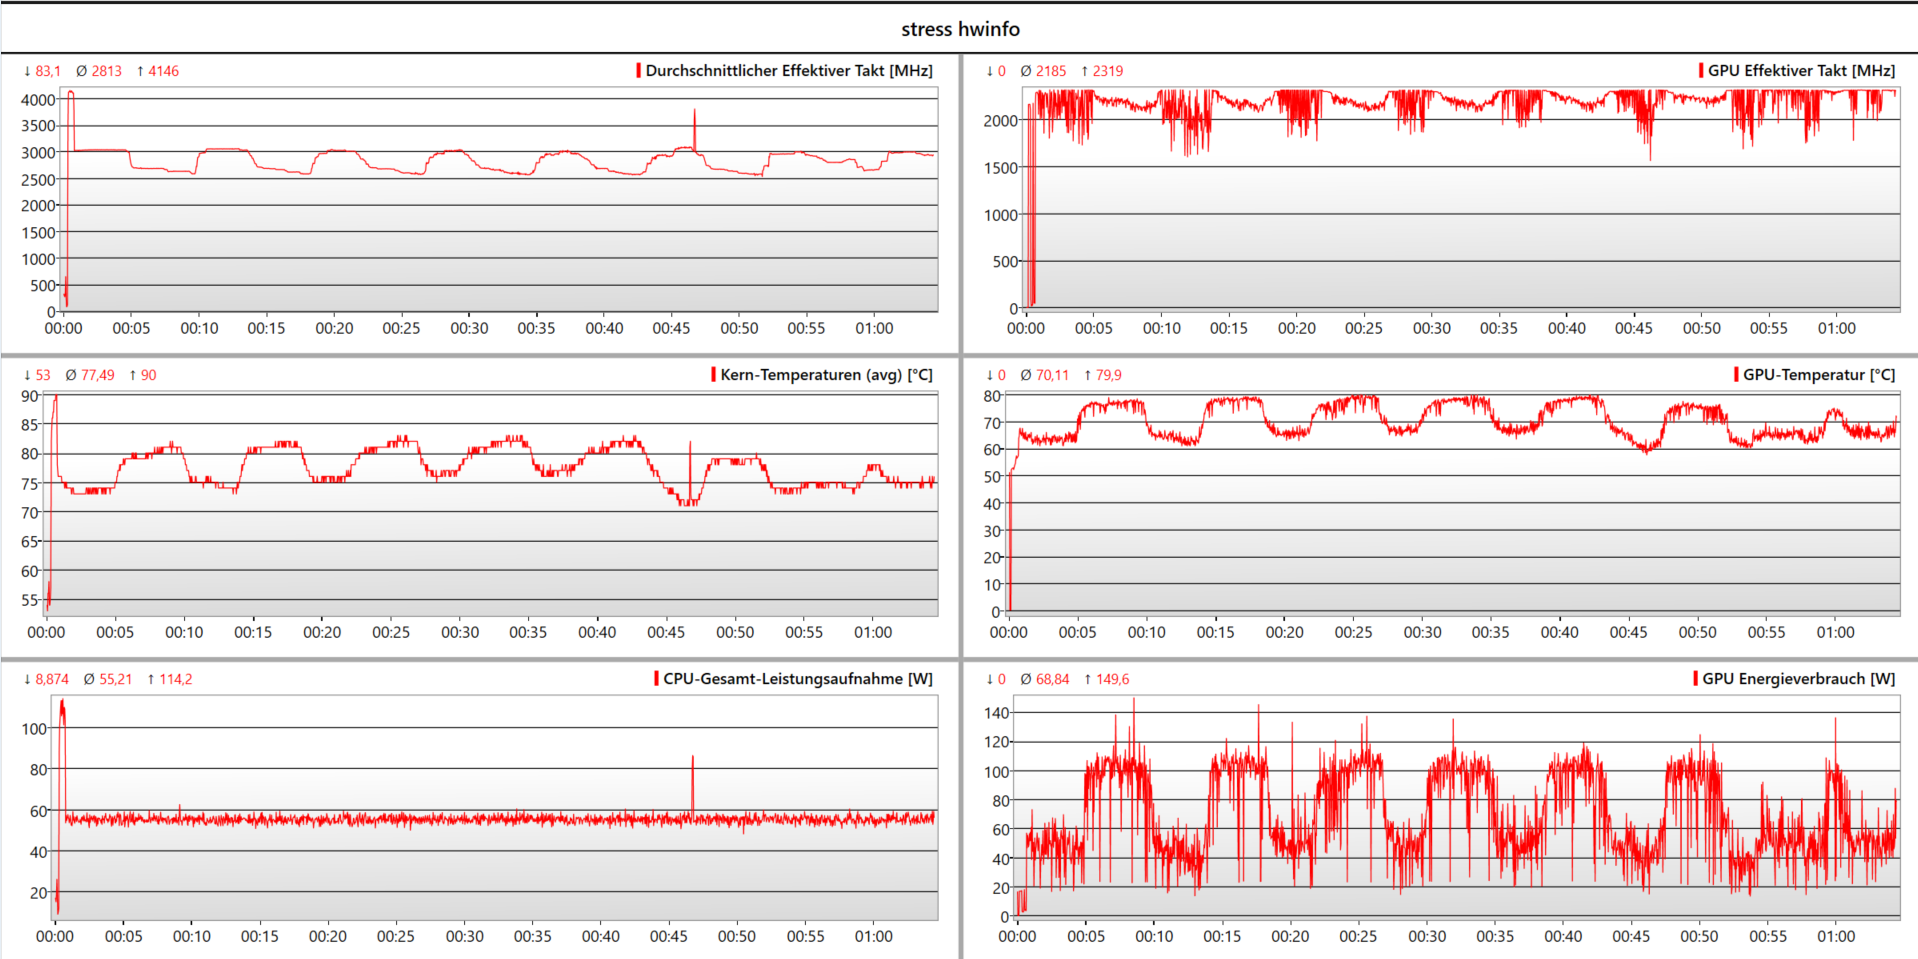
Przeprowadziliśmy test obciążeniowy na prawie nowym MSI Pulse 17. Najwyraźniej docelowa temperatura GPU wynosi około 80 °C (176 °F). Gdy tylko ta wartość zostanie osiągnięta, wydajność jest dławiona, dopóki GPU nieco się nie ochłodzi. Powoduje to pewne fale w naszym dzienniku testu obciążeniowego z Prime95 i Furmark. Po krótkiej fazie podkręcania, Core i7 pracuje stale z mocą około 55 watów. RTX 4070 wielokrotnie musi dławić moc z 110 watów do 50 watów. W późniejszych częściach naszego testu MSI Pulse 17 kontrola mocy laptopa znacznie się ustabilizowała, więc możemy założyć, że jest to efekt uczenia się.
Głośniki
Podkreślone średnie tony sprawiają, że MSI Pulse 17 brzmi nieco blado. Jednak przy głośności do 85 dB(A), małe głośniki są stosunkowo głośne i z łatwością są w stanie zagłuszyć ciche wentylatory w tym laptopie do gier. Ci, którzy nie lubią głośników, mogą podłączyć urządzenia zewnętrzne za pomocą Bluetooth lub portu audio 3,5 mm.
MSI Pulse 17 B13VGK analiza dźwięku
(+) | głośniki mogą odtwarzać stosunkowo głośno (85.01 dB)
Bas 100 - 315 Hz
(±) | zredukowany bas - średnio 13.2% niższy od mediany
(±) | liniowość basu jest średnia (12.3% delta do poprzedniej częstotliwości)
Średnie 400 - 2000 Hz
(±) | wyższe średnie - średnio 9.4% wyższe niż mediana
(+) | średnie są liniowe (5.7% delta do poprzedniej częstotliwości)
Wysokie 2–16 kHz
(+) | zrównoważone maksima - tylko 2.9% od mediany
(+) | wzloty są liniowe (6.7% delta do poprzedniej częstotliwości)
Ogólnie 100 - 16.000 Hz
(±) | liniowość ogólnego dźwięku jest średnia (15.8% różnicy w stosunku do mediany)
W porównaniu do tej samej klasy
» 37% wszystkich testowanych urządzeń w tej klasie było lepszych, 7% podobnych, 56% gorszych
» Najlepszy miał deltę 6%, średnia wynosiła ###średnia###%, najgorsza wynosiła 132%
W porównaniu do wszystkich testowanych urządzeń
» 24% wszystkich testowanych urządzeń było lepszych, 5% podobnych, 70% gorszych
» Najlepszy miał deltę 4%, średnia wynosiła ###średnia###%, najgorsza wynosiła 134%
Apple MacBook Pro 16 2021 M1 Pro analiza dźwięku
(+) | głośniki mogą odtwarzać stosunkowo głośno (84.7 dB)
Bas 100 - 315 Hz
(+) | dobry bas - tylko 3.8% od mediany
(+) | bas jest liniowy (5.2% delta do poprzedniej częstotliwości)
Średnie 400 - 2000 Hz
(+) | zbalansowane środki średnie - tylko 1.3% od mediany
(+) | średnie są liniowe (2.1% delta do poprzedniej częstotliwości)
Wysokie 2–16 kHz
(+) | zrównoważone maksima - tylko 1.9% od mediany
(+) | wzloty są liniowe (2.7% delta do poprzedniej częstotliwości)
Ogólnie 100 - 16.000 Hz
(+) | ogólny dźwięk jest liniowy (4.6% różnicy w stosunku do mediany)
W porównaniu do tej samej klasy
» 0% wszystkich testowanych urządzeń w tej klasie było lepszych, 0% podobnych, 100% gorszych
» Najlepszy miał deltę 5%, średnia wynosiła ###średnia###%, najgorsza wynosiła 45%
W porównaniu do wszystkich testowanych urządzeń
» 0% wszystkich testowanych urządzeń było lepszych, 0% podobnych, 100% gorszych
» Najlepszy miał deltę 4%, średnia wynosiła ###średnia###%, najgorsza wynosiła 134%
Zarządzanie energią - bateria 90 Wh zapewnia długą żywotność baterii
Zużycie energii
Podczas gdy maksymalny pobór mocy Pulse 17 pod obciążeniem jest dość typowy dla tej klasy laptopów, w trybie bezczynności, a nawet przy umiarkowanym obciążeniu, nasza jednostka testowa jest niezwykle wydajna jak na laptop do gier.
| wyłączony / stan wstrzymania | |
| luz | |
| obciążenie |
|
Legenda:
min: | |
| MSI Pulse 17 B13VGK i7-13700H, GeForce RTX 4070 Laptop GPU, Micron 2400 MTFDKBA1T0QFM, IPS, 1920x1080, 17.3" | MSI Pulse GL76 12UGK i7-12700H, GeForce RTX 3070 Laptop GPU, Micron 3400 1TB MTFDKBA1T0TFH, IPS, 1920x1080, 17.3" | MSI Katana 17 B13VFK i7-13620H, GeForce RTX 4060 Laptop GPU, Micron 2400 MTFDKBA1T0QFM, IPS LED, 1920x1080, 17.3" | Acer Nitro 17 AN17-51-71ER i7-13700H, GeForce RTX 4060 Laptop GPU, Samsung PM9A1 MZVL21T0HCLR, , 2560x1440, 17.3" | Schenker XMG Focus 17 (E23) i9-13900HX, GeForce RTX 4070 Laptop GPU, Crucial P5 Plus 1TB CT1000P5PSSD8, IPS, 2560x1440, 17.3" | Asus ROG Strix G17 G713PI R9 7945HX, GeForce RTX 4070 Laptop GPU, WD PC SN560 SDDPNQE-1T00, IPS, 2560x1440, 17.3" | Przeciętny NVIDIA GeForce RTX 4070 Laptop GPU | Średnia w klasie Gaming | |
|---|---|---|---|---|---|---|---|---|
| Power Consumption | -45% | -26% | -18% | -97% | -75% | -58% | -66% | |
| Idle Minimum * (Watt) | 9 | 12.4 -38% | 12.2 -36% | 8.3 8% | 17 -89% | 15 -67% | 13.2 ? -47% | 13 ? -44% |
| Idle Average * (Watt) | 10.2 | 13.1 -28% | 14.9 -46% | 13.5 -32% | 18 -76% | 20 -96% | 18.2 ? -78% | 19 ? -86% |
| Idle Maximum * (Watt) | 10.8 | 25.3 -134% | 15.8 -46% | 14.8 -37% | 25.8 -139% | 29 -169% | 24.6 ? -128% | 24.6 ? -128% |
| Load Average * (Watt) | 72 | 105.4 -46% | 85.22 -18% | 77 -7% | 178 -147% | 121 -68% | 97 ? -35% | 110.7 ? -54% |
| Witcher 3 ultra * (Watt) | 130 | 150 -15% | 151.1 -16% | 154 -18% | 265 -104% | 179.8 -38% | ||
| Load Maximum * (Watt) | 221 | 240.5 -9% | 212.8 4% | 263 -19% | 275 -24% | 246 -11% | 221 ? -0% | 259 ? -17% |
* ... im mniej tym lepiej
Power Consumption The Witcher 3 / Stress Test
Power Consumption With External Monitor
Żywotność baterii
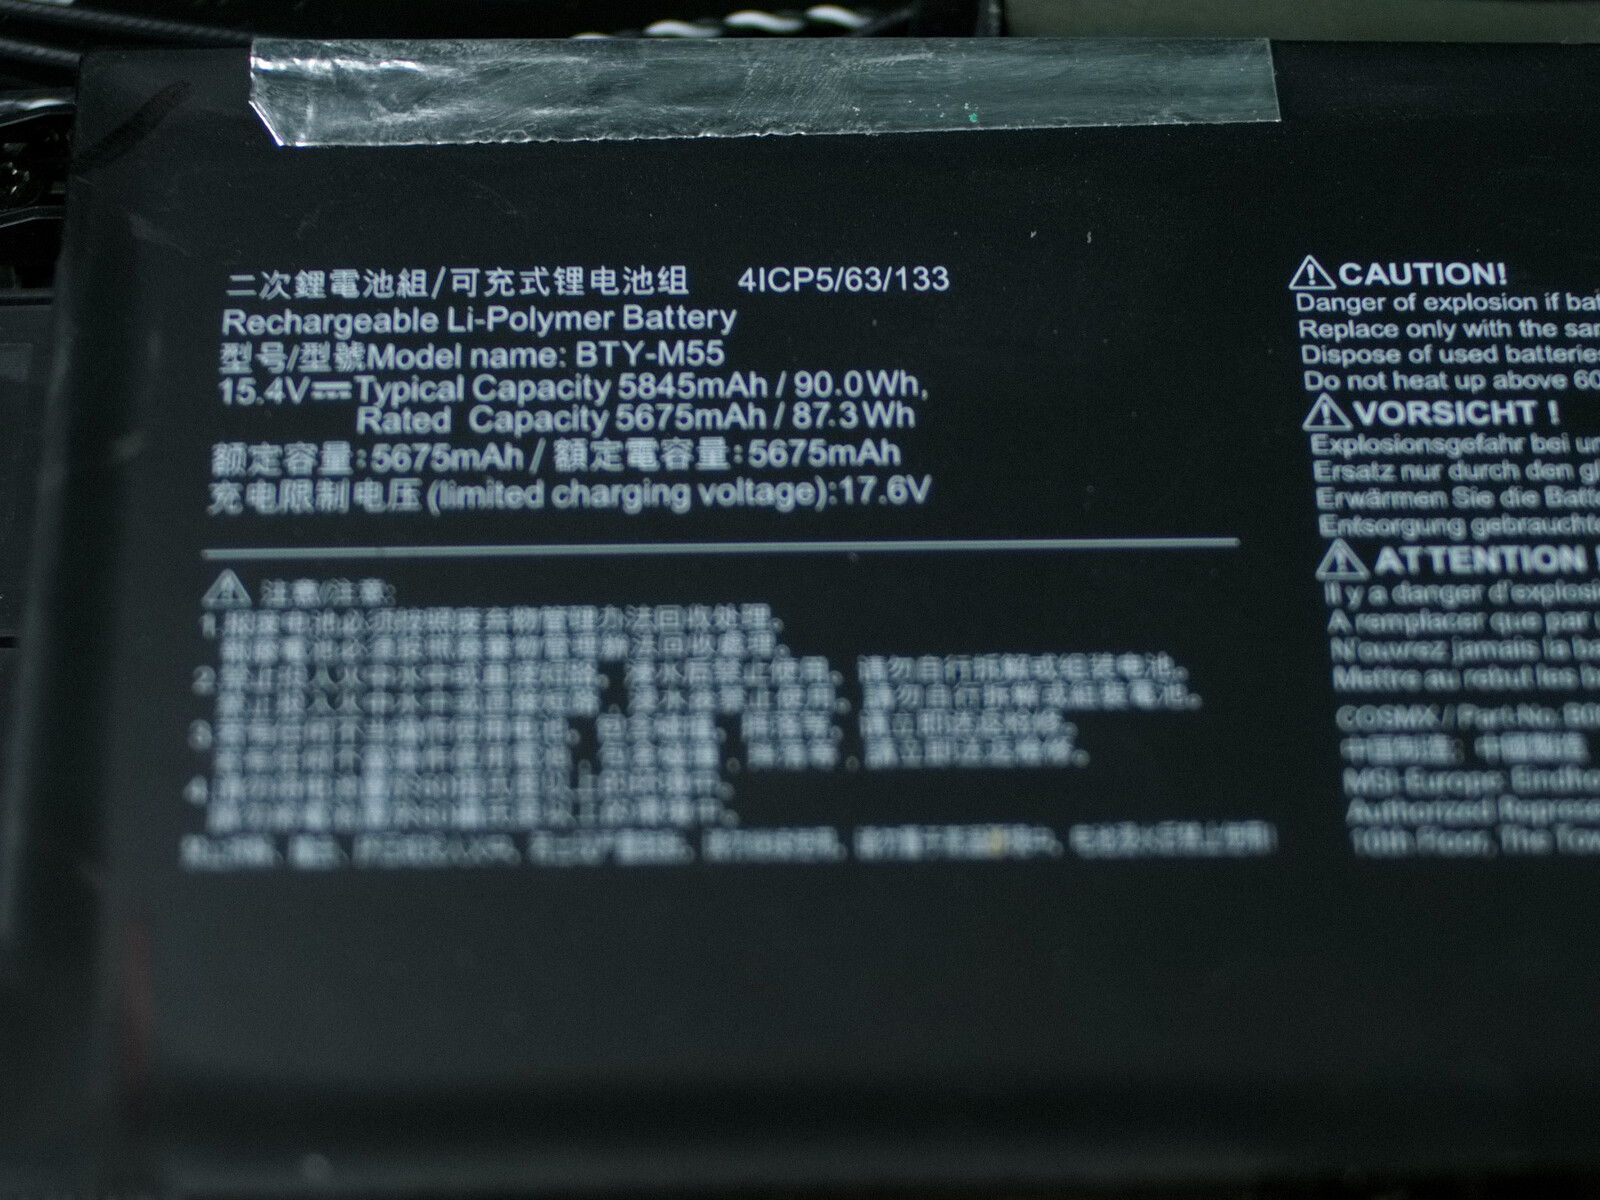
Zgodnie z naszymi pomiarami zużycia energii, nie jest również zaskakujące, że laptop do gier wytrzymuje długo z baterią 90 Wh w naszym teście surfowania po Internecie przez WiFi, osiągając tutaj prawie 9 godzin. Nawet pod obciążeniem bateria wystarcza na dobre 2 godziny.
| MSI Pulse 17 B13VGK i7-13700H, GeForce RTX 4070 Laptop GPU, 90 Wh | MSI Pulse GL76 12UGK i7-12700H, GeForce RTX 3070 Laptop GPU, 90 Wh | MSI Katana 17 B13VFK i7-13620H, GeForce RTX 4060 Laptop GPU, 53.5 Wh | Acer Nitro 17 AN17-51-71ER i7-13700H, GeForce RTX 4060 Laptop GPU, 90 Wh | Schenker XMG Focus 17 (E23) i9-13900HX, GeForce RTX 4070 Laptop GPU, 73 Wh | Asus ROG Strix G17 G713PI R9 7945HX, GeForce RTX 4070 Laptop GPU, 90 Wh | Średnia w klasie Gaming | |
|---|---|---|---|---|---|---|---|
| Czasy pracy | -20% | -62% | -9% | -57% | -54% | -27% | |
| WiFi v1.3 (h) | 9 | 5.9 -34% | 2.9 -68% | 8.2 -9% | 3.9 -57% | 4.3 -52% | 7.11 ? -21% |
| Load (h) | 2.2 | 2.1 -5% | 1 -55% | 1 -55% | 1.502 ? -32% | ||
| Reader / Idle (h) | 7.3 | 8.27 ? | |||||
| H.264 (h) | 6.9 | 3.1 | 2.8 | 8.32 ? | |||
| Witcher 3 ultra (h) | 2.5 | 1 | 1.1 |
Za
Przeciw
Werdykt - Bardziej steam punk niż sci-fi
Po pozytywnej stronie MSI Pulse 17 jest kilka mocnych punktów, które przemawiają za laptopem, z optymalną wydajnością Core i7i Nvidia GeForce RTX 4070 przede wszystkim. Aby to osiągnąć, Pulse nie potrzebuje nawet pulsujących wentylatorów, a laptop jest wyjątkowo cichy jak na swoją klasę wydajności. Inne pozytywne punkty laptopa do gier obejmują przyzwoitą klawiaturę i dobre rozmieszczenie złączy zewnętrznych. Żywotność baterii jest również doskonała dla laptopa do gier.
Pulse 17 to laptop do gier, który jest w stanie zaoferować potężną wydajność przy niskim poziomie hałasu. Z drugiej strony, urządzenie nie dotarło do roku 2023 w wielu innych aspektach.
Niestety, laptop ma również kilka poważnych wad. Poza MSI Katana 17, żaden inny laptop do gier w naszym porównaniu nie ma tak kiepskiego wyświetlacza. Sprzęt połączeniowy z wolnymi portami USB 2.0 i USB 3.2 Gen 1 oraz 1 GBit / s LAN, a także brak Wi-Fi 6 GHz również nie prezentują laptopa do gier jako urządzenia z wyższej półki. Co jednak naprawdę irytuje, to zablokowany port M.2 NVMe, ponieważ producent mógł tego uniknąć na dwa sposoby. Po pierwsze, płyta główna i obudowa pozostawiłyby wystarczająco dużo miejsca, aby przesunąć moduł nieco w lewo, aby zapewnić trochę miejsca na baterię. Po drugie, niepotrzebnie zmarnowane linie PCIe można było również zainwestować w port Thunderbolt.
Chociaż w porównaniu do poprzednika, obecny model oferuje teraz obsługę G-Sync, MUX i Advanced Optimus, nadal brakuje mu Thunderbolt. Ponadto wyświetlacz poprzednika był znacznie lepszy według naszych pomiarów.
Przy cenach ulicznych zaczynających się od 2150 euro (~2415 USD) w momencie naszego testu, istnieje wiele (w części również znacznie tańszych) laptopów jako alternatywy dla naszej jednostki testowej. Cena, jaką płacisz producentowi za Asus ROG Stix G17 jest na tym samym poziomie, co urządzenie MSI od wielu dostawców. Chociaż w przypadku laptopa Asusa trzeba pójść na poważne kompromisy w zakresie żywotności baterii, poza tym Pulse 17 i ROG Strix G17 są dość podobne we wszystkich obszarach wydajności. Z drugiej strony wyświetlacz i sprzęt połączeniowy ROG Strix są znacznie lepsze.
Cena i dostępność
MSI Pulse 17 B13VGK jest dostępny tylko u kilku sprzedawców w Stanach Zjednoczonych, takich jak Newegg za ~ 1963 USDwięcej sprzedawców oferuje ją na UK, Australialub Kanadana przykład.
MSI Pulse 17 B13VGK
- 16/07/2023 v7 (old)
Marc Herter
Przezroczystość
Wyboru urządzeń do recenzji dokonuje nasza redakcja. Próbka testowa została udostępniona autorowi jako pożyczka od producenta lub sprzedawcy detalicznego na potrzeby tej recenzji. Pożyczkodawca nie miał wpływu na tę recenzję, producent nie otrzymał też kopii tej recenzji przed publikacją. Nie było obowiązku publikowania tej recenzji. Jako niezależna firma medialna, Notebookcheck nie podlega władzy producentów, sprzedawców detalicznych ani wydawców.
Tak testuje Notebookcheck
Każdego roku Notebookcheck niezależnie sprawdza setki laptopów i smartfonów, stosując standardowe procedury, aby zapewnić porównywalność wszystkich wyników. Od około 20 lat stale rozwijamy nasze metody badawcze, ustanawiając przy tym standardy branżowe. W naszych laboratoriach testowych doświadczeni technicy i redaktorzy korzystają z wysokiej jakości sprzętu pomiarowego. Testy te obejmują wieloetapowy proces walidacji. Nasz kompleksowy system ocen opiera się na setkach uzasadnionych pomiarów i benchmarków, co pozwala zachować obiektywizm.Price comparison

