Testy dla Intel Core i7-13700H procesor
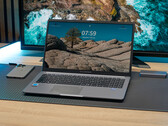
Recenzja Asus ExpertBook P1 - niedrogi laptop do użytku biurowego i pracy w domu wyposażony w liczne funkcje bezpieczeństwa
Asus ExpertBook P1 z procesorem Intel Core i7-13700H obiecuje potężną wydajność do wymagającej codziennej pracy. Jak jednak wypada w praktyce? Czy ExpertBook P1 to dobry wybór dla świadomych swojej ceny użytkowników biznesowych i studentów? W naszym teście przeanalizowaliśmy jego mocne i słabe strony, aby dowiedzieć się, czy Asusowi udało się dostarczyć dobry pakiet całościowy.
Intel Core i7-13700H, Iris Xe G7 96EUs, 15.6", 1.7 kgRecenzja laptopa Tulpar T7 V20.6 (Tongfang GM7PG0R): Obecnie jeden z najtańszych laptopów dla graczy z RTX 4060
Obecnie laptop Tulpar przyciąga uwagę swoją wyjątkowo niską ceną. Producent nie pochodzi z Chin - pochodzi z Turcji i ma siedzibę w sklepie na berlińskim Alexanderplatz, który zaprasza potencjalnych nabywców do wypróbowania go. Przyjrzeliśmy się, czy 17-calowy gracz RTX 4060, Tulpar T7, może dotrzymać kroku modelom głównych producentów i czy mają Państwo szansę na zdobycie prawdziwej gamingowej okazji.
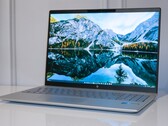
Intel Core i7-13700H, NVIDIA GeForce RTX 4060 Laptop GPU, 17.3", 2.6 kgRecenzja HP Pavilion Plus 16: Wysokiej klasy laptop multimedialny, który mógł skorzystać z RTX 4050
HP zamierza wejść na dynamicznie rozwijający się rynek laptopów dla początkujących z modelem Pavilion Plus 16. Pavilion Plus 16 jest jednym z niewielu laptopów wyposażonych w 6 GB GPU RTX 3050 wraz z procesorem Core i7-13700H, 16 GB pamięci RAM i wyświetlaczem IPS QHD + 120 Hz. Choć sam w sobie jest przyzwoity, porównanie z podobnymi laptopami pokazuje, że HP mogło zminimalizować niektóre kompromisy, aby uzyskać jeszcze bardziej atrakcyjną propozycję 1,24,999 ₹ (1350 USD).
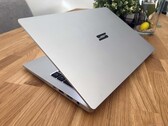
Intel Core i7-13700H, NVIDIA GeForce RTX 3050 6GB Laptop GPU, 16", 1.9 kgRecenzja Schenker Vision 14 M23 - magnezowy ultrabook teraz z kartą graficzną GeForce RTX 3050 6 GB
Schenker oferuje swojego Vision 14 z GeForce RTX 3050 Refresh, wyposażonym w więcej pamięci graficznej. Ogólnie rzecz biorąc, jego wydajność pozostała prawie taka sama i nie może zbliżyć się do laptopa GeForce RTX 4050. Dzięki wyświetlaczowi IPS o wysokiej rozdzielczości i dobrym opcjom konserwacji - umożliwiającym do 64 GB pamięci RAM - laptop nadal okazuje się interesującą opcją.
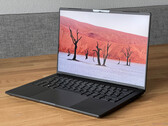
Intel Core i7-13700H, NVIDIA GeForce RTX 3050 6GB Laptop GPU, 14", 1.3 kgRecenzja Schenker Vision 14 2023: Ultrabook z magnezu o bardzo długim czasie pracy na baterii
Firma Schenker wzbogaciła swój kompaktowy ultrabook Vision 14 o procesor Intel Raptor Lake i opcjonalną kartę graficzną GeForce RTX 3050. Dzisiejsza recenzja dotyczy wariantu iGPU, który osiąga bardzo długi czas pracy dzięki baterii 99 Wh i bardzo dobrym opcjom konserwacji.
Intel Core i7-13700H, Iris Xe G7 96EUs, 14", 1.3 kgMicrosoft Surface Laptop Studio 2 RTX 4060: NVIDIA GeForce RTX 4060 Laptop GPU, 14.40", 2 kg
Recenzja » Recenzja Microsoft Surface Laptop Studio 2 - multimedialny laptop konwertowalny z szybszymi podzespołami
HP Victus 16-r0077ng: NVIDIA GeForce RTX 4070 Laptop GPU, 16.10", 2.4 kg
Recenzja » Recenzja laptopa HP Victus 16: Gracz Full HD z RTX 4070
Lenovo IdeaCentre Mini 01IRH8: Intel Iris Xe Graphics G7 96EUs, 1.8 kg
Recenzja » Recenzja Lenovo IdeaCentre Mini 01IRH8: Zbliża się rywal Intel NUC
Dell Inspiron 16 Plus 7630: NVIDIA GeForce RTX 4060 Laptop GPU, 16.00", 2.2 kg
Recenzja » Recenzja laptopa Dell Inspiron 16 Plus 7630: 60 W GeForce RTX 4060 nie jest taki zły
Aorus 15 BSF: NVIDIA GeForce RTX 4070 Laptop GPU, 15.60", 2.4 kg
Recenzja » Recenzja Aorus 15 BSF: Laptop do gier QHD z RTX 4070 i świetnymi czasami pracy
Schenker Vision 16 PH6PRX1: Intel Iris Xe Graphics G7 96EUs, 16.00", 1.5 kg
Recenzja » Recenzja Schenker Vision 16 2023: 16-calowy, lekki komputer z wieloma portami
Acer Predator Triton 14 PT14-51: NVIDIA GeForce RTX 4050 Laptop GPU, 14.00", 1.7 kg
Recenzja » Recenzja Acer Predator Triton 14: 14-calowy laptop do gier z jasnym wyświetlaczem i RTX 4050
Schenker VISION 16 Pro (M23): NVIDIA GeForce RTX 4070 Laptop GPU, 16.00", 1.6 kg
Recenzja » Recenzja Schenker Vision 16 Pro 2023: 1.6-kilogramowy, lekki i wydajny zestaw z laptopem RTX 4070
MSI Pulse 17 B13VGK: NVIDIA GeForce RTX 4070 Laptop GPU, 17.30", 2.7 kg
Recenzja » Recenzja gamingowego laptopa MSI Pulse 17 B13V: Z cichymi skrzydłami
MSI Stealth 14 Studio A13V: NVIDIA GeForce RTX 4050 Laptop GPU, 14.00", 1.7 kg
Recenzja » Recenzja MSI Stealth 14 Studio - drogi laptop do gier, który poszedł na zbyt wiele kompromisów
MSI Stealth 16 Studio A13VG: NVIDIA GeForce RTX 4070 Laptop GPU, 16.00", 2 kg
Recenzja » Recenzja laptopa MSI Stealth 16 Studio: Niezwykle lekkie, 16-calowe urządzenie z Core i7 i RTX 4070 dla graczy i twórców
Acer Swift X SFX14-71G: NVIDIA GeForce RTX 4050 Laptop GPU, 14.50", 1.5 kg
Recenzja » Recenzja Acer Swift X 14 2023 OLED - multimedialny laptop z RTX 4050 robi wrażenie tylko na papierze
Acer Nitro 17 AN17-51-71ER: NVIDIA GeForce RTX 4060 Laptop GPU, 17.30", 3 kg
Recenzja » Recenzja cichego laptopa Acer Nitro 17: RTX 4060 w doskonałej konfiguracji
Acer Swift Go SFG16-71: Intel Iris Xe Graphics G7 96EUs, 16.00", 1.6 kg
Recenzja » Recenzja Acer Swift Go 16: Multimedialny laptop z olśniewającym wyświetlaczem OLED
Dell XPS 17 9730 RTX 4070: NVIDIA GeForce RTX 4070 Laptop GPU, 17.00", 2.5 kg
Recenzja » Recenzja laptopa Dell XPS 17 9730: GeForce Multimedialny potwór RTX 4070
Medion Erazer Scout E20: NVIDIA GeForce RTX 4050 Laptop GPU, 17.30", 2.8 kg
Recenzja » Recenzja Medion Erazer Scout E20: Niedrogi laptop do gier FHD z RTX 4050
Lenovo Yoga Pro 7 14IRH G8: NVIDIA GeForce RTX 4050 Laptop GPU, 14.50", 1.5 kg
Recenzja » Recenzja notebooka Lenovo Yoga Pro 7 14 G8: GeForce Laptop z RTX 4050 zasila wyświetlacz 3K o częstotliwości 120 Hz
Gigabyte Aero 14 OLED BMF: NVIDIA GeForce RTX 4050 Laptop GPU, 14.00", 1.4 kg
Recenzja » Recenzja laptopa Gigabyte Aero 14 OLED BMF: Kompaktowy notebook studyjny z wyświetlaczem true color
Samsung Galaxy Book3 Ultra 16: NVIDIA GeForce RTX 4050 Laptop GPU, 16.00", 1.8 kg
Recenzja » Recenzja Samsunga Galaxy Book3 Ultra 16: Wytrzymały 16-calowy ultrabook z RTX 4050
Dell XPS 15 9530 RTX 4070: NVIDIA GeForce RTX 4070 Laptop GPU, 15.60", 1.9 kg
Recenzja » Recenzja laptopa Dell XPS 15 9530 RTX 4070: Zarówno imponujący, jak i niezadowalający
MSI Katana 15 B13VGK, i7-13700H: NVIDIA GeForce RTX 4070 Laptop GPU, 15.60", 2.3 kg
Zewnętrzna recenzja » MSI Katana 15 B13VGK, i7-13700H
Asus TUF Gaming F15 FX507VU: NVIDIA GeForce RTX 4050 Laptop GPU, 15.60", 2.2 kg
Zewnętrzna recenzja » Asus TUF Gaming F15 FX507VU
Dell Precision 3581: NVIDIA RTX A500 Laptop GPU, 15.60", 1.8 kg
Zewnętrzna recenzja » Dell Precision 3581
Asus ExpertBook P1 P1503CVA-S70188X: Intel Iris Xe Graphics G7 96EUs, 15.60", 1.7 kg
Zewnętrzna recenzja » Asus ExpertBook P1 P1503CVA-S70188X
Lenovo Yoga Pro 7 14IRH G8: NVIDIA GeForce RTX 4050 Laptop GPU, 14.50", 1.5 kg
Zewnętrzna recenzja » Lenovo Yoga Pro 7 14IRH G8
Acer Nitro 16 AN16-51: NVIDIA GeForce RTX 4050 Laptop GPU, 16.00", 2.7 kg
Zewnętrzna recenzja » Acer Nitro 16 AN16-51
HP ZBook Power 15 G10, i7-13700H RTX A1000: NVIDIA RTX A1000 Laptop GPU, 15.60", 2 kg
Zewnętrzna recenzja » HP ZBook Power 15 G10, i7-13700H RTX A1000
MSI Stealth 14 Studio A13VF: NVIDIA GeForce RTX 4060 Laptop GPU, 14.00", 1.7 kg
Zewnętrzna recenzja » MSI Stealth 14 Studio A13VF
MSI Stealth 16 Studio A13VG: NVIDIA GeForce RTX 4070 Laptop GPU, 16.00", 2 kg
Zewnętrzna recenzja » MSI Stealth 16 Studio A13VG
Lenovo ThinkPad P1 G6: NVIDIA GeForce RTX 4060 Laptop GPU, 16.00", 1.9 kg
Zewnętrzna recenzja » Lenovo ThinkPad P1 G6
Gigabyte Aero 14 OLED BMF: NVIDIA GeForce RTX 4050 Laptop GPU, 14.00", 1.4 kg
Zewnętrzna recenzja » Gigabyte Aero 14 OLED BMF
Gigabyte Aero 16 OLED BKF: NVIDIA GeForce RTX 4060 Laptop GPU, 16.00", 2.1 kg
Zewnętrzna recenzja » Gigabyte Aero 16 OLED BKF
HP Victus 16-r0000ng: NVIDIA GeForce RTX 4050 Laptop GPU, 16.10", 2.3 kg
Zewnętrzna recenzja » HP Victus 16-r0000ng
Acer Swift Go 14 SFG14-71-785V: Intel Iris Xe Graphics G7 96EUs, 14.00", 1.3 kg
Zewnętrzna recenzja » Acer Swift Go 14 SFG14-71-785V
Samsung Galaxy Book3 Ultra 16: NVIDIA GeForce RTX 4050 Laptop GPU, 16.00", 1.8 kg
Zewnętrzna recenzja » Samsung Galaxy Book3 Ultra 16
HP ZBook Studio 16 G10: NVIDIA RTX A2000 Laptop GPU, 16.00", 1.7 kg
Zewnętrzna recenzja » HP ZBook Studio 16 G10
Dell XPS 15 9530 RTX 4070: NVIDIA GeForce RTX 4070 Laptop GPU, 15.60", 1.9 kg
Zewnętrzna recenzja » Dell XPS 15 9530 RTX 4070
Microsoft Surface Laptop Studio 2 RTX 4060: NVIDIA GeForce RTX 4060 Laptop GPU, 14.40", 2 kg
Zewnętrzna recenzja » Microsoft Surface Laptop Studio 2 RTX 4060
Gigabyte Aorus 15 BSF: NVIDIA GeForce RTX 4070 Laptop GPU, 15.60", 2.3 kg
Zewnętrzna recenzja » Gigabyte Aorus 15 BSF
HP Pavilion Plus 16-ab0456tx: NVIDIA GeForce RTX 3050 6GB Laptop GPU, 16.00", 1.9 kg
Zewnętrzna recenzja » HP Pavilion Plus 16-ab0456tx
MSI Modern 15 H C13M: Intel Iris Xe Graphics G7 96EUs, 15.60", 1.9 kg
Zewnętrzna recenzja » MSI Modern 15 H C13M
HP Pavilion Plus 16-ab0000: NVIDIA GeForce RTX 3050 6GB Laptop GPU, 16.00", 1.9 kg
Zewnętrzna recenzja » HP Pavilion Plus 16-ab0000
Lenovo Yoga Pro 7 14IRH8: Intel Iris Xe Graphics G7 96EUs, 14.50", 1.5 kg
Zewnętrzna recenzja » Lenovo Yoga Pro 7 14IRH8
Microsoft Surface Laptop Studio 2 RTX 4060: NVIDIA GeForce RTX 4060 Laptop GPU, 14.40", 2 kg
» Nowe laptopy Surface Microsoftu są drogie, ale produkty nie są wystarczająco dobre
Acer Swift Go SFG16-71: Intel Iris Xe Graphics G7 96EUs, 16.00", 1.6 kg
» Marketing mija się z celem: Laptop na skraju przegrzania