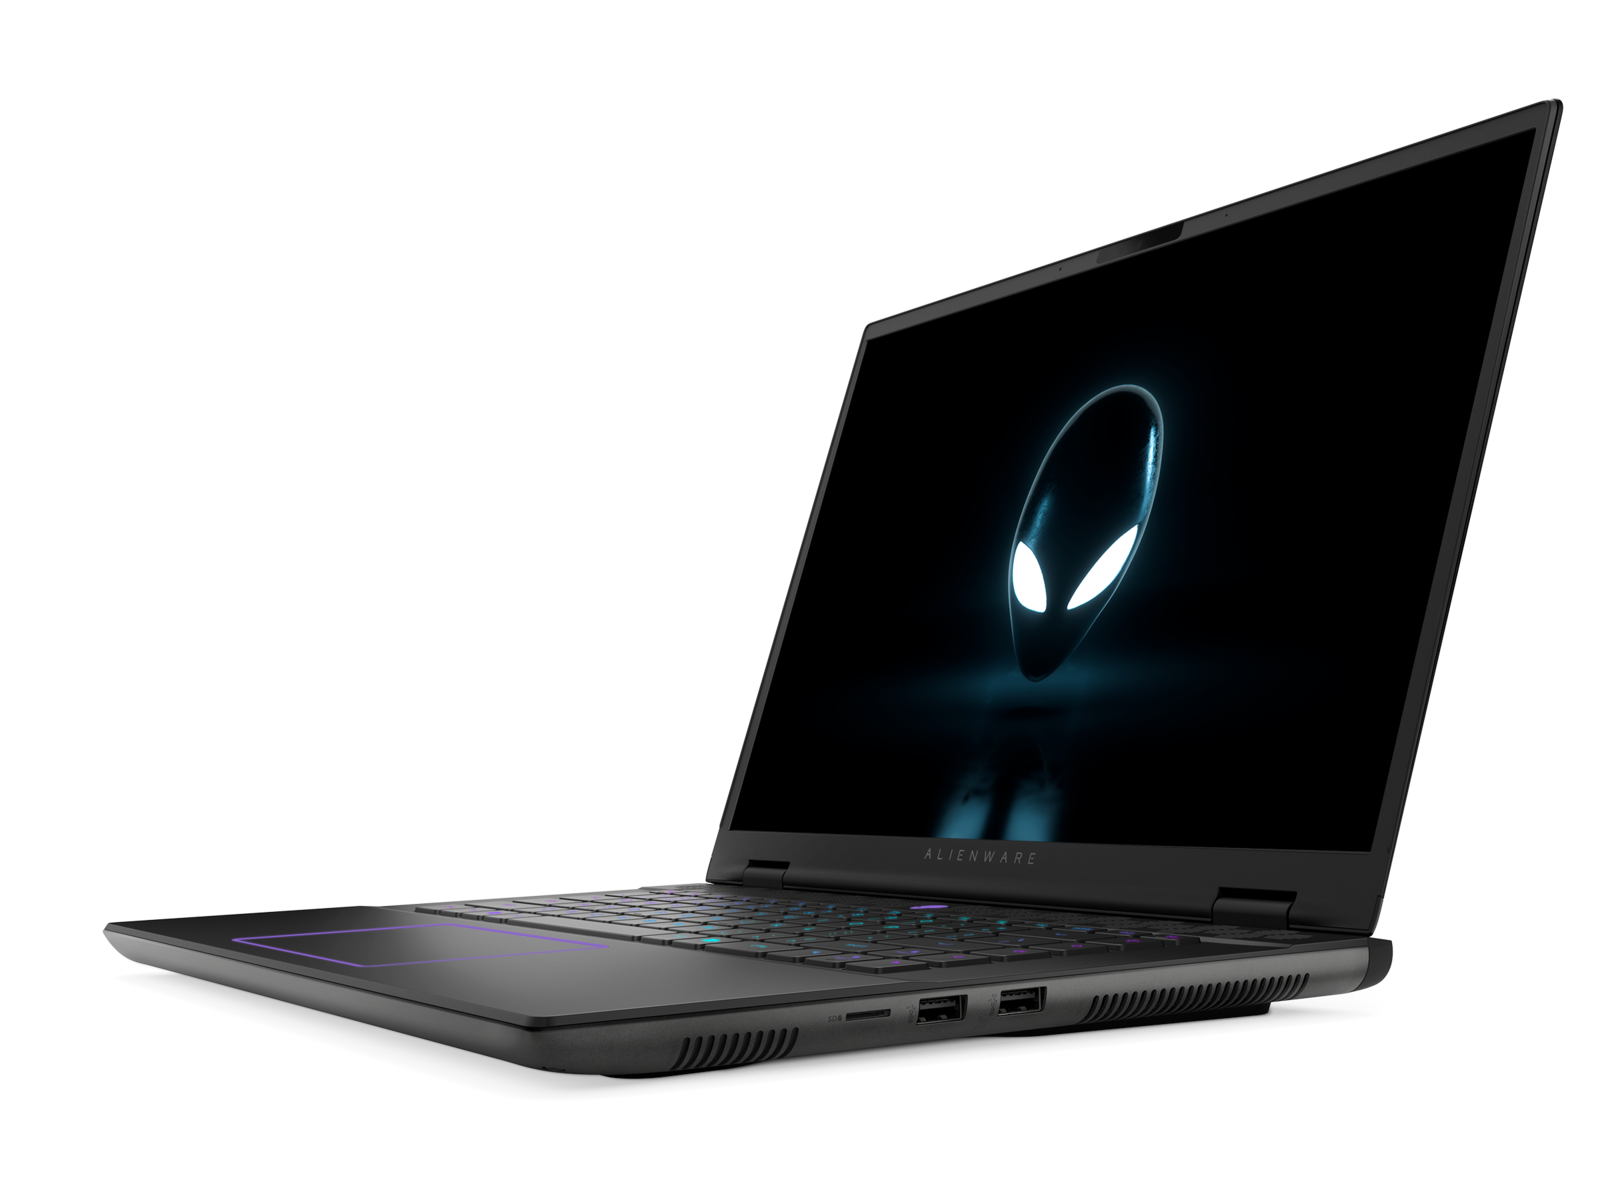
Recenzja laptopa Alienware m16 R2: Duże i ryzykowne zmiany

Alienware m16 R2 jest następcą m16 R1ale nie w sposób, jakiego można by się spodziewać. Nowy model to całkowite przeprojektowanie i przemyślenie serii m16 w celu przyciągnięcia zarówno graczy, jak i zwykłych użytkowników, podczas gdy inne produkty Alienware są przeznaczone dla zapalonych graczy. Już samo to sprawia, że m16 R2 jest jednym z najciekawszych laptopów Alienware od lat, ponieważ poświęca niektóre opcje procesora i karty graficznej wyższej klasy, które były dostępne w m16 R1, na rzecz mniejszej konstrukcji.
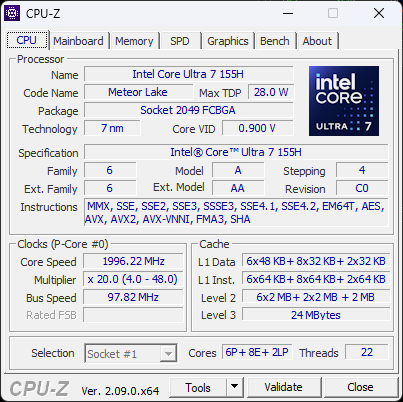
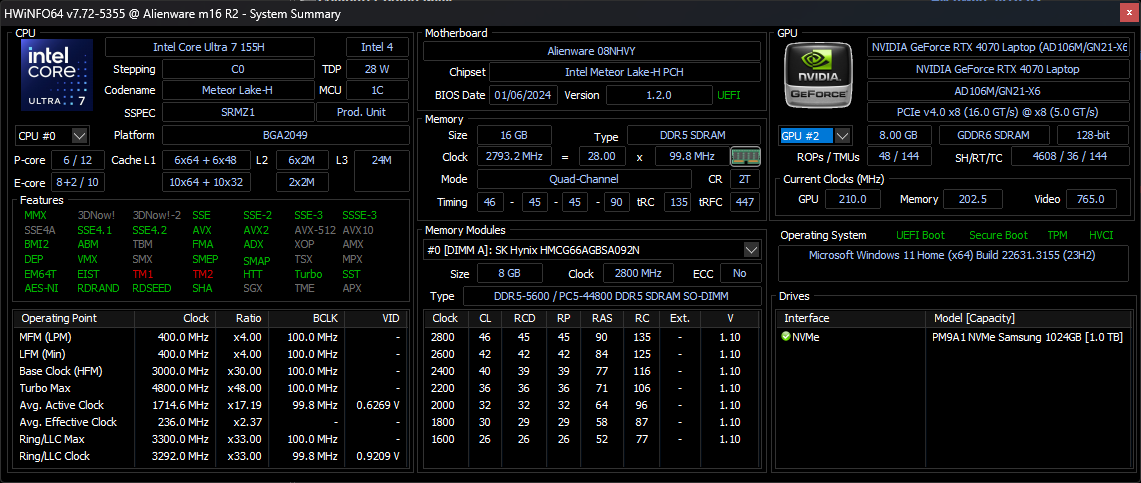
Nasza jednostka testowa to konfiguracja wyższej klasy z procesorem Meteor Lake-H Core Ultra 7 155H, procesorem graficznym GeForce RTX 4070 i wyświetlaczem IPS 1600p 240 Hz za około 1850 USD. Niższe jednostki SKU można skonfigurować z RTX 4050 lub 4060 zamiast tego, a wyższe jednostki SKU zawierają Core Ultra 9, ale wszystkie konfiguracje są poza tym ograniczone do tego samego wyświetlacza IPS 1600p240 i tylko do RTX 4070.
Alternatywy dla Alienware m16 R2 obejmują inne wysokowydajne 16-calowe laptopy, takie jak Razer Blade 16, HP Omen Transcend 16, Asus ROG Zephyrus G16lub Lenovo Legion Slim 7 16.
Więcej recenzji Alienware:
Potencjalni konkurenci w porównaniu
Ocena | Data | Model | Waga | Wysokość | Rozmiar | Rezolucja | Cena |
|---|---|---|---|---|---|---|---|
| 90.2 % v7 (old) | 03/2024 | Alienware m16 R2 Ultra 7 155H, GeForce RTX 4070 Laptop GPU | 2.5 kg | 23.5 mm | 16.00" | 2560x1600 | |
| 88.3 % v7 (old) | 09/2023 | Alienware m16 R1 Intel i7-13700HX, GeForce RTX 4060 Laptop GPU | 3 kg | 25.4 mm | 16.00" | 2560x1600 | |
| 88.4 % v7 (old) | 06/2023 | Alienware x16 R1 i9-13900HK, GeForce RTX 4080 Laptop GPU | 2.6 kg | 18.57 mm | 16.00" | 2560x1600 | |
| 88.4 % v7 (old) | 02/2024 | HP Omen Transcend 16-u1095ng i9-14900HX, GeForce RTX 4070 Laptop GPU | 2.3 kg | 20 mm | 16.00" | 2560x1600 | |
| 92.3 % v7 (old) | 02/2024 | Asus ROG Zephyrus G16 2024 GU605M Ultra 7 155H, GeForce RTX 4070 Laptop GPU | 1.8 kg | 16.4 mm | 16.00" | 2560x1600 | |
| 90.4 % v7 (old) | 11/2023 | Lenovo Legion Slim 7 16APH8 R7 7840HS, GeForce RTX 4060 Laptop GPU | 2.1 kg | 20 mm | 16.00" | 2560x1600 |
Przypadek - Legenda 3.0 na nowo zdefiniowana
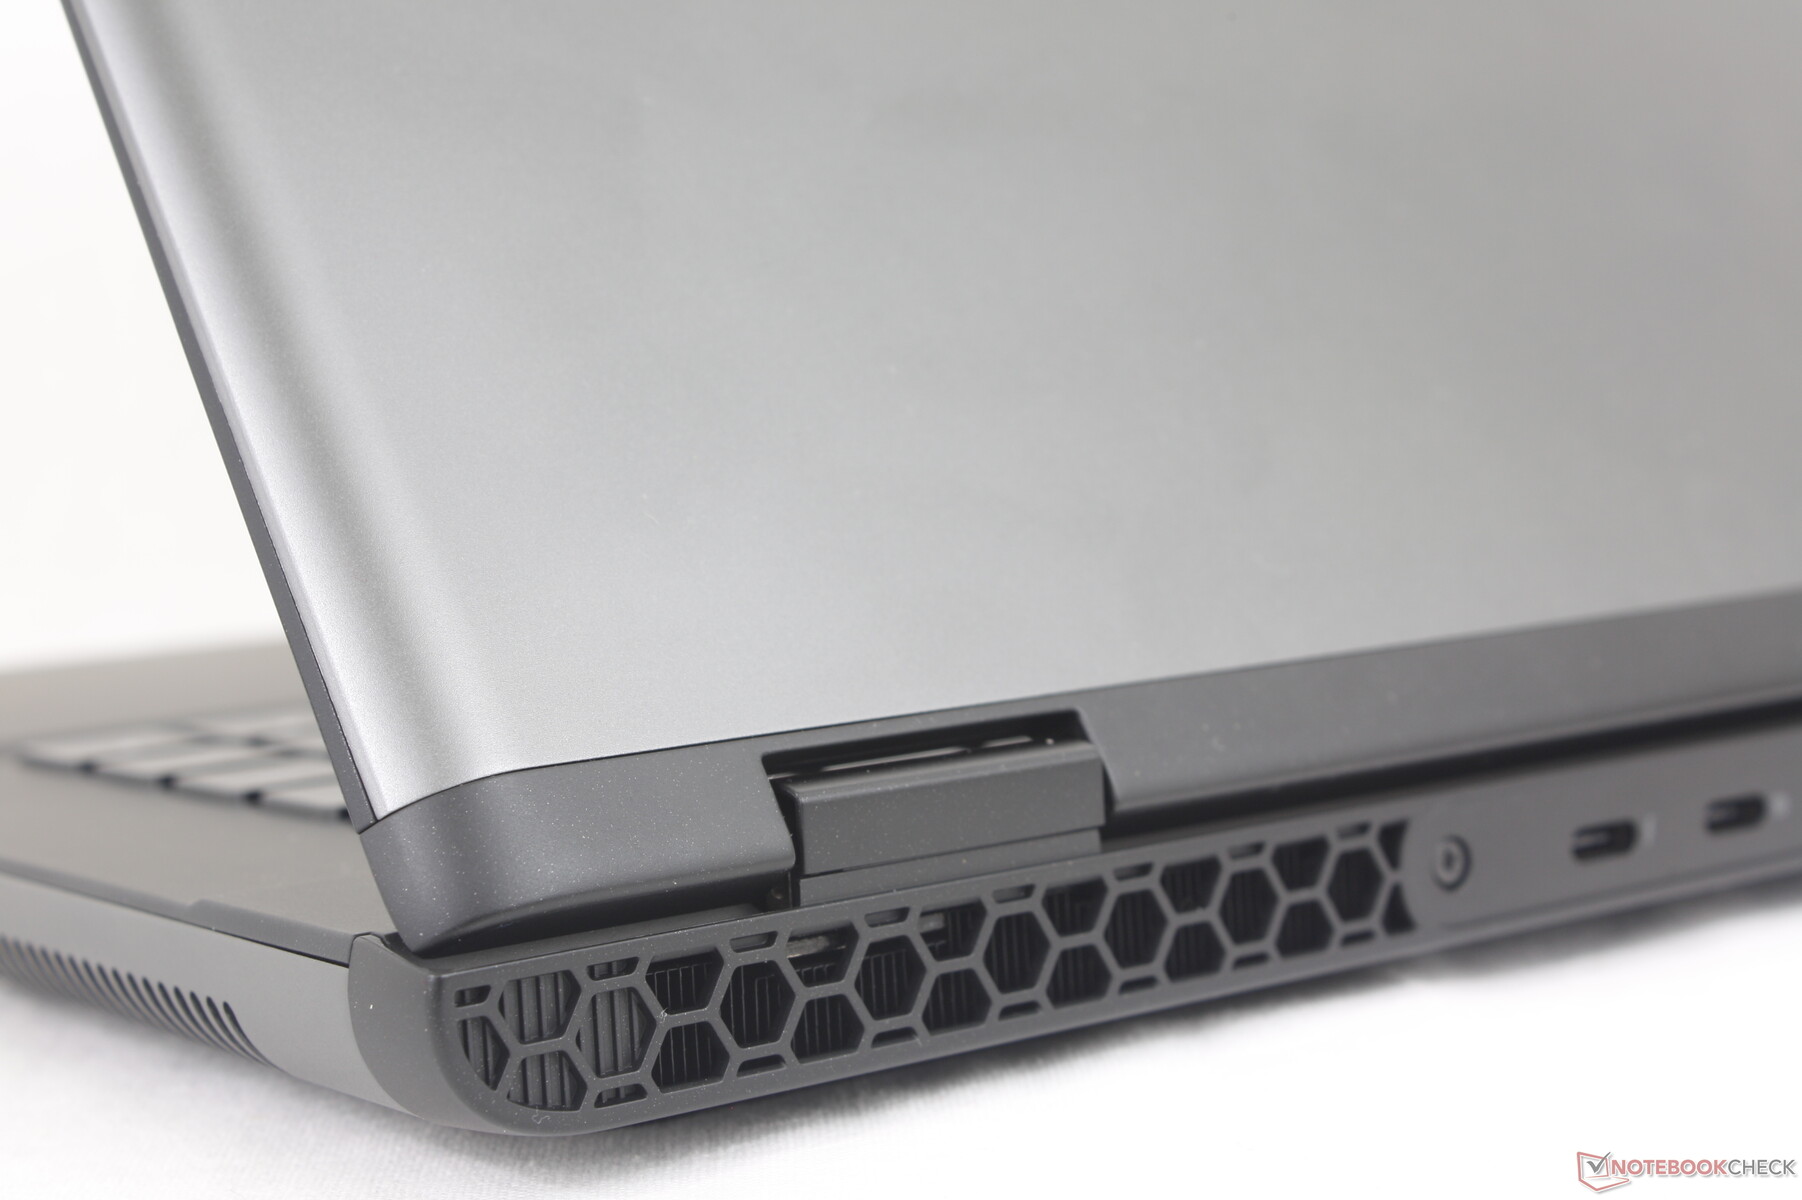
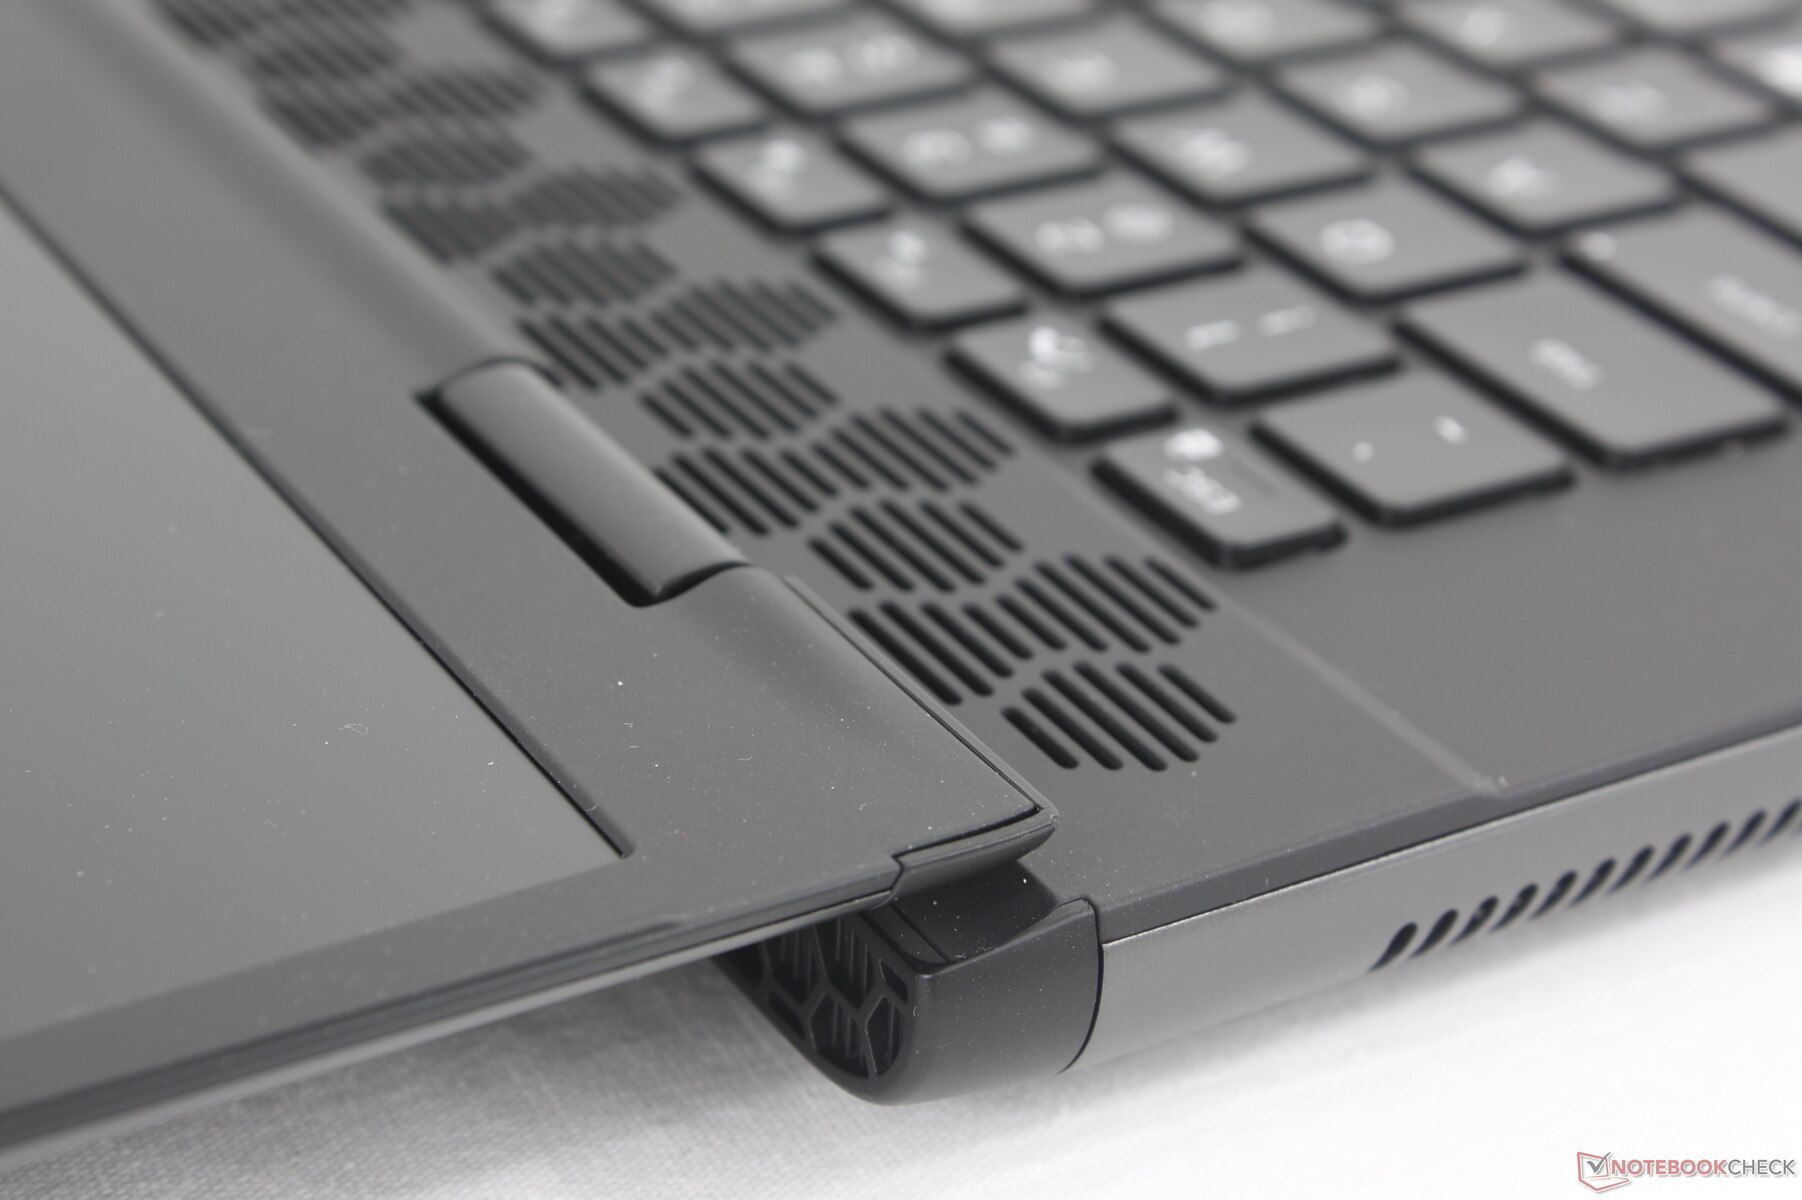
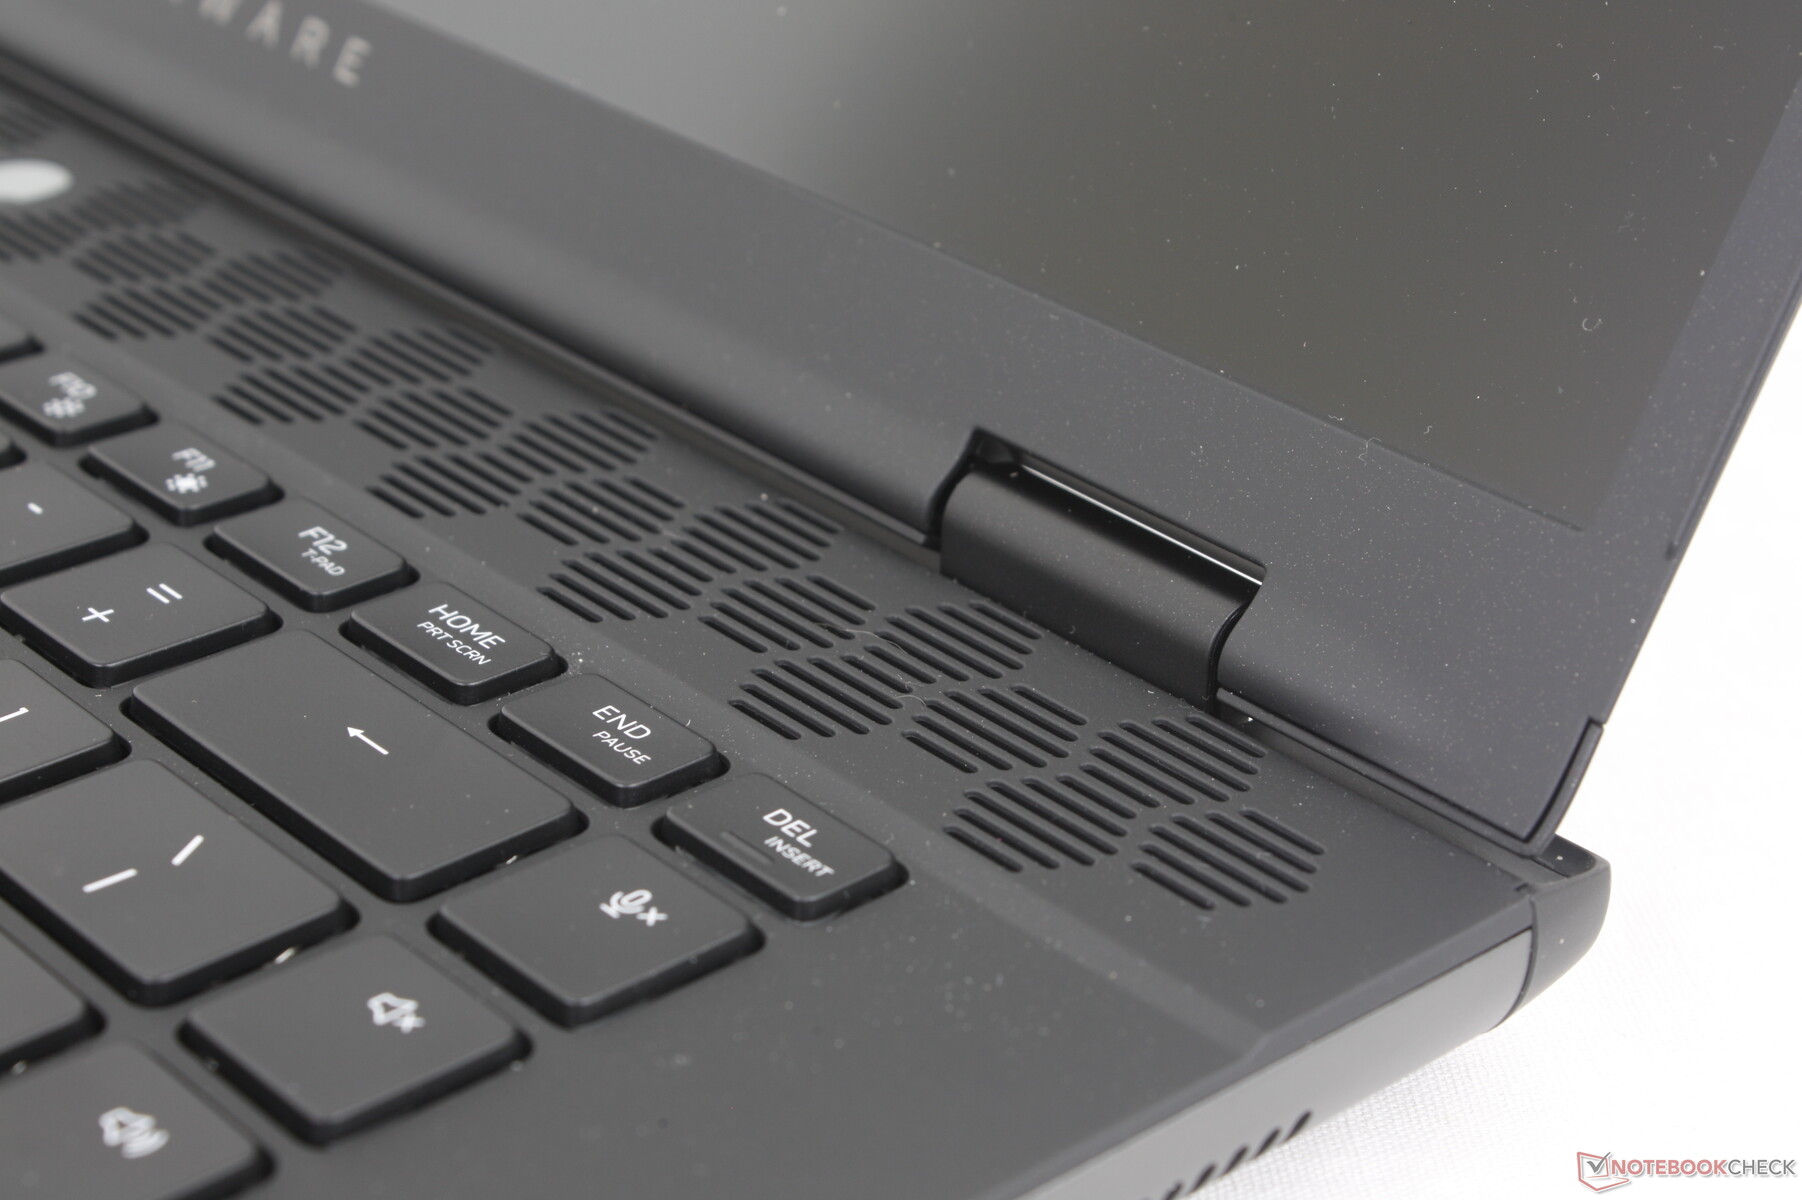
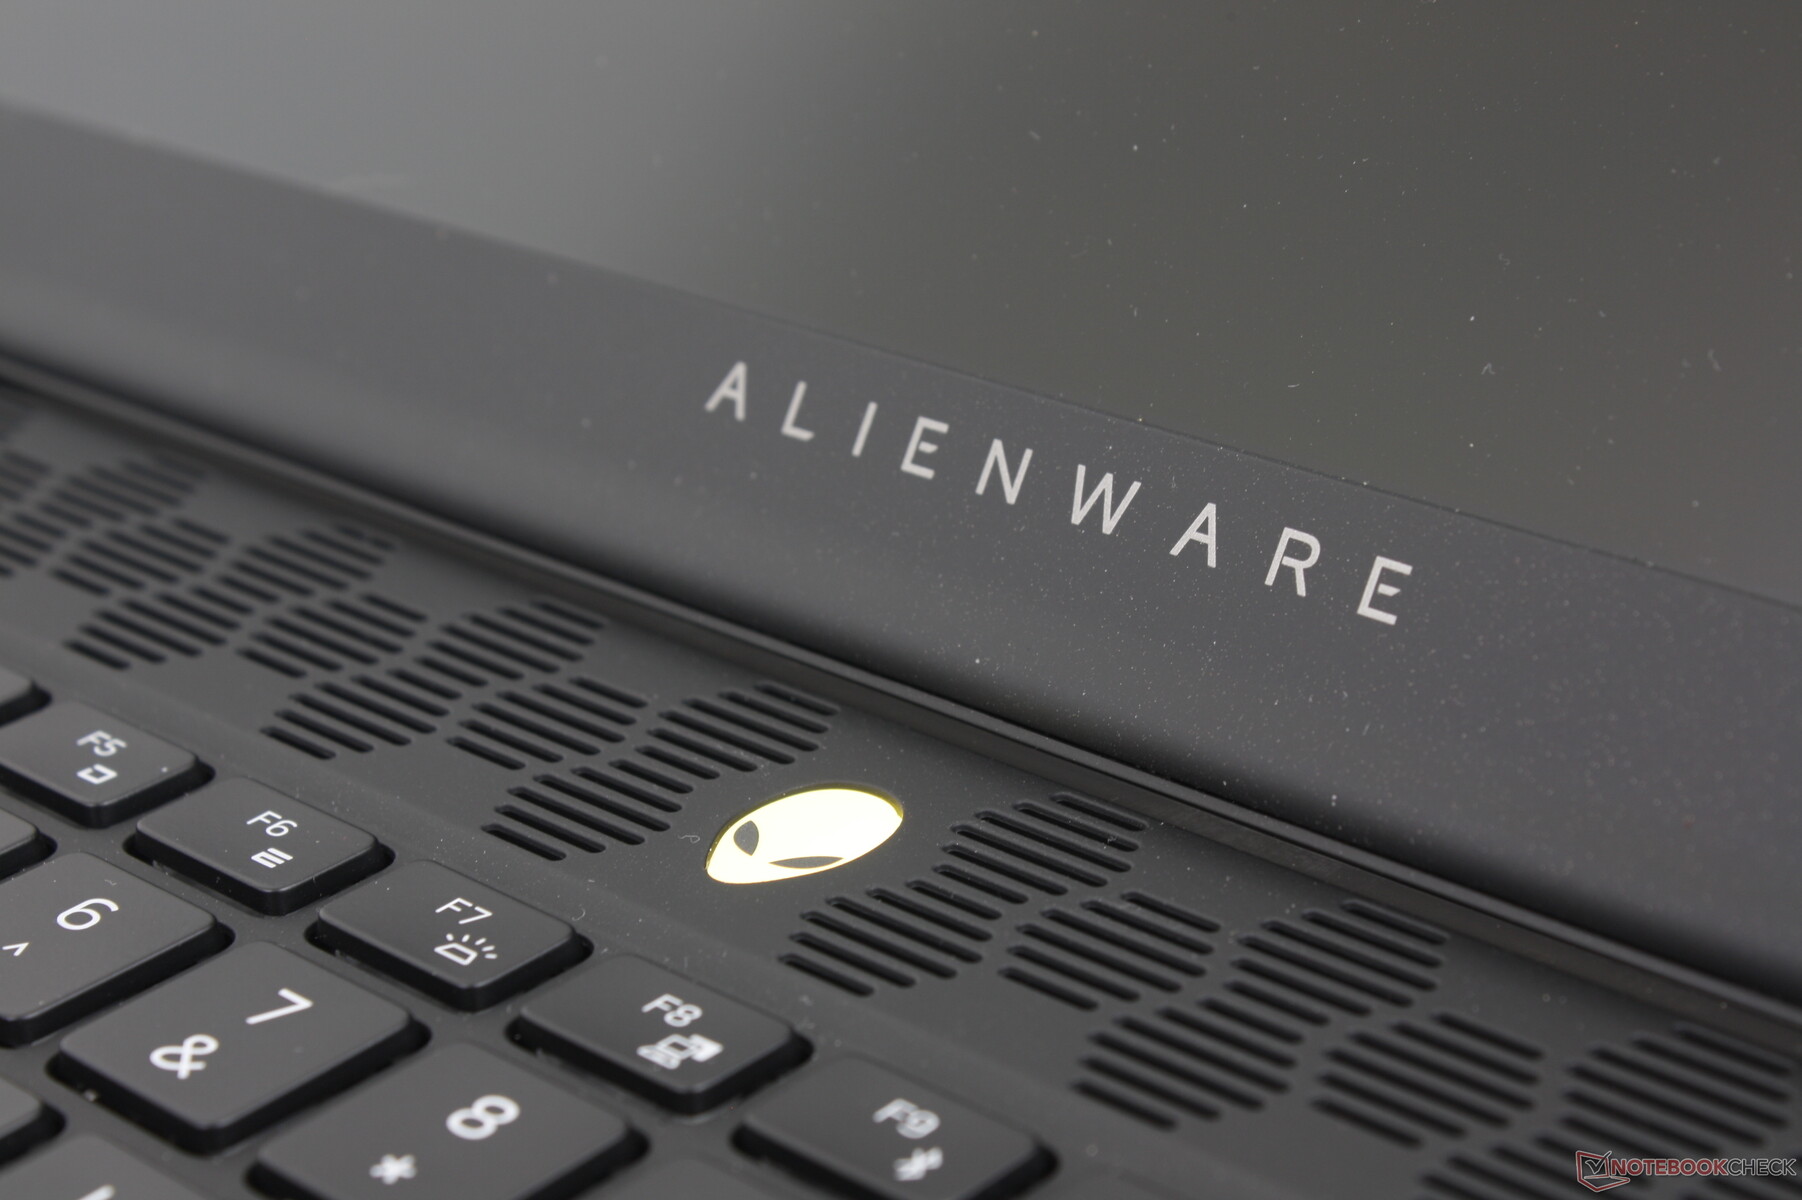
Alienware m16 R1 Alienware m16 R1 nie ma nawet roku, a Dell już wprowadza poprawioną konstrukcję obudowy z m16 R2. Najbardziej zauważalną zmianą jest usunięcie wystającej osłony termicznej z tyłu, dzięki czemu obudowa zajmuje znacznie mniej miejsca niż wcześniej. Pierścień LED RGB z tyłu zniknął, a klawiatura została przesunięta w górę, aby zrobić miejsce zarówno na większe podpórki pod nadgarstki, jak i większy clickpad.
Materiały, z których wykonano obudowę, pozostały takie same jak wcześniej, zapewniając podobne tekstury i wrażenia. Sztywność nie zmieniła się w żadnym znaczącym stopniu, więc urządzenie nadal wydaje się dość mocne od góry do dołu, bez większych skrzypień lub oczywistych słabych punktów.
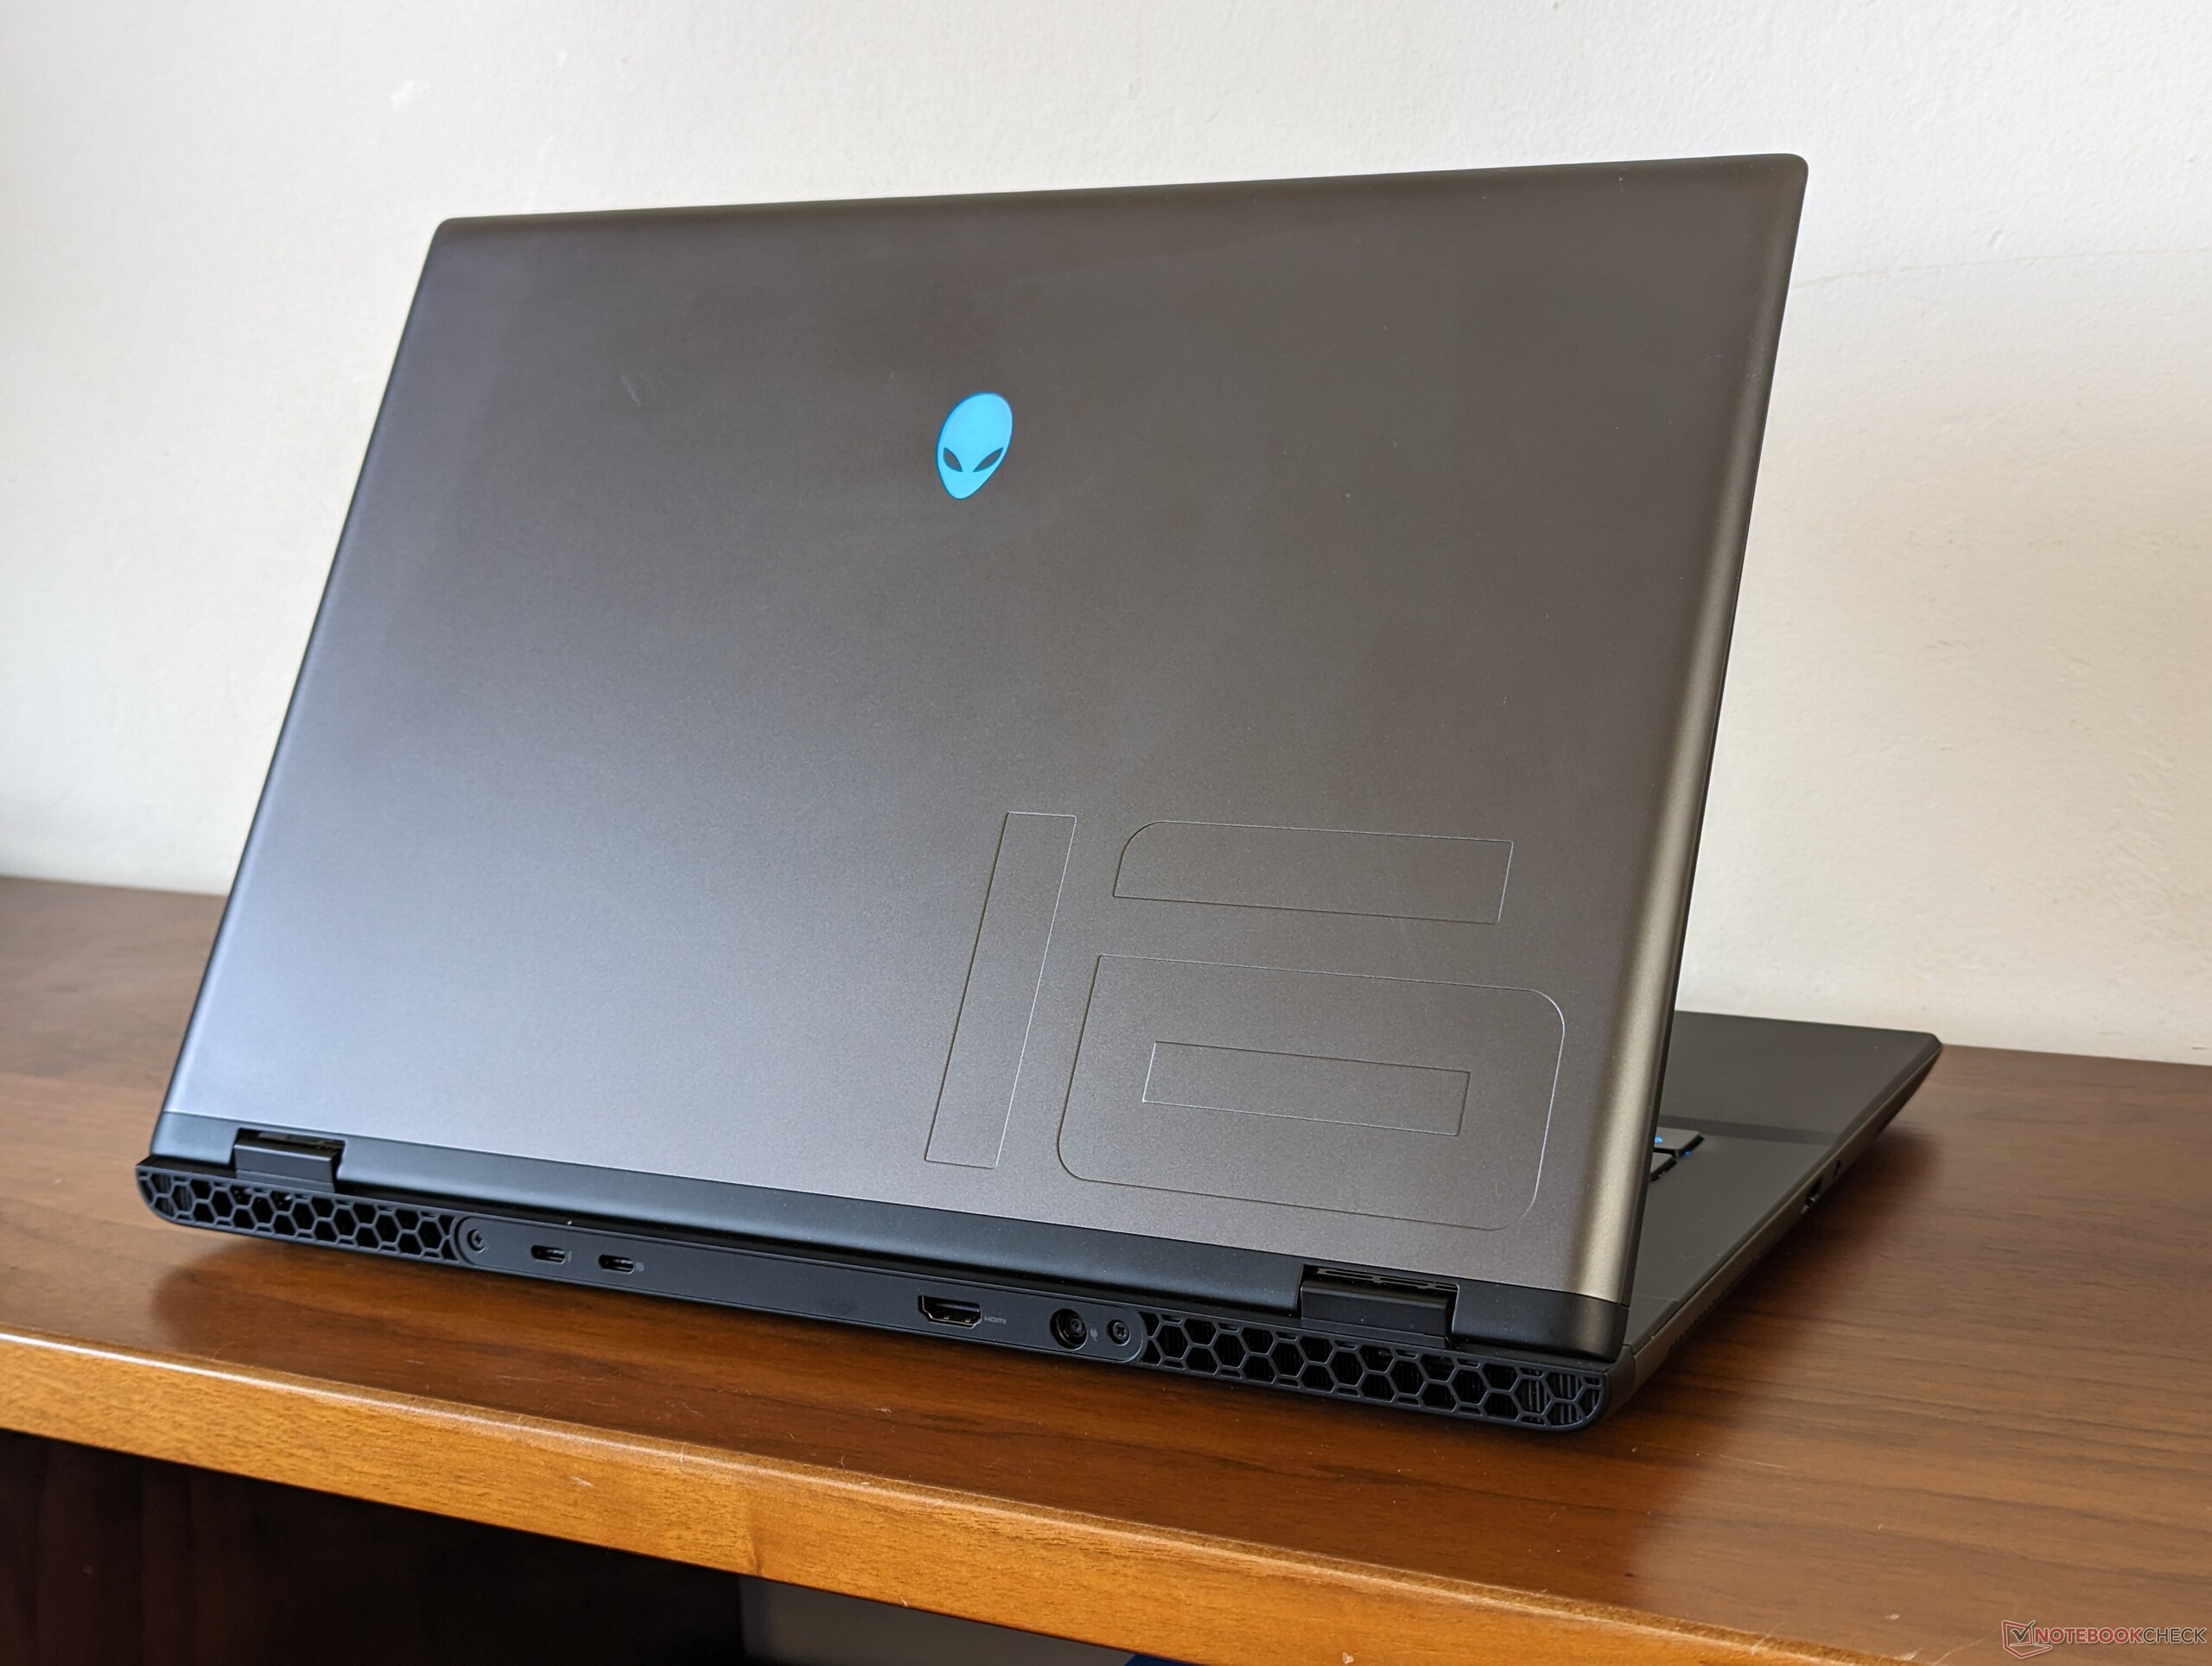
Znaczące zmiany w podwoziu zaowocowały znacznym zmniejszeniem zarówno wagi, jak i wymiarów. M16 R2 jest o około 17 procent lżejszy i o 22 procent mniejszy niż m16 R1, co zapewnia lepszą przenośność. Mniejsza powierzchnia podstawy pomaga również systemowi zmieścić się w mniejszych plecakach, ponieważ szersze wymiary oryginalnego m16 R1 wymagałyby większych toreb.
Zmniejszenie rozmiaru nie jest wystarczające, aby uczynić m16 R2 najmniejszym w swojej kategorii, ponieważ zarówno Razer Blade 16 i Asus Zephyrus G16 są nadal lżejsze i mniejsze.
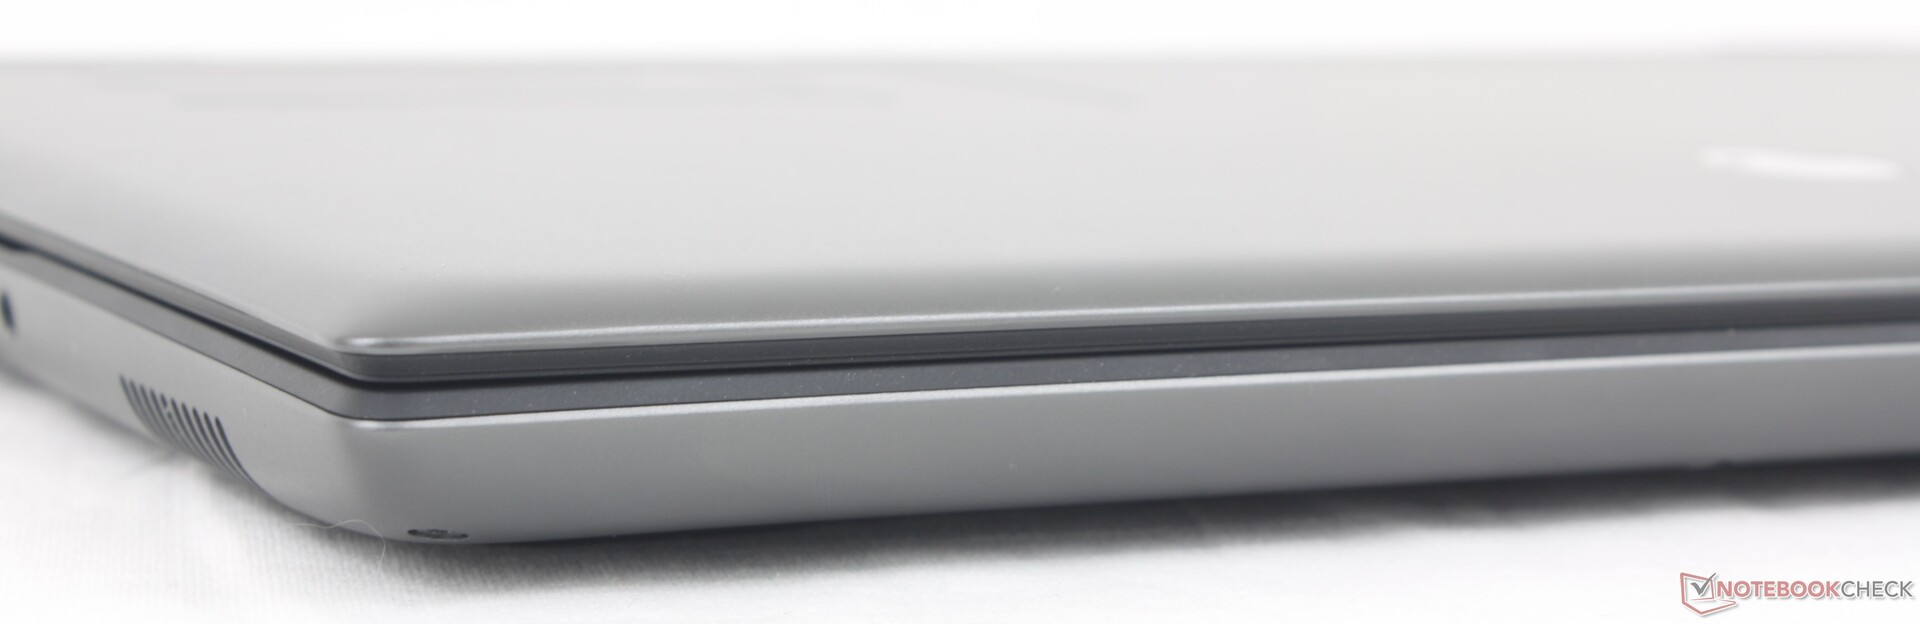
Łączność - wszystkie podstawy są tutaj
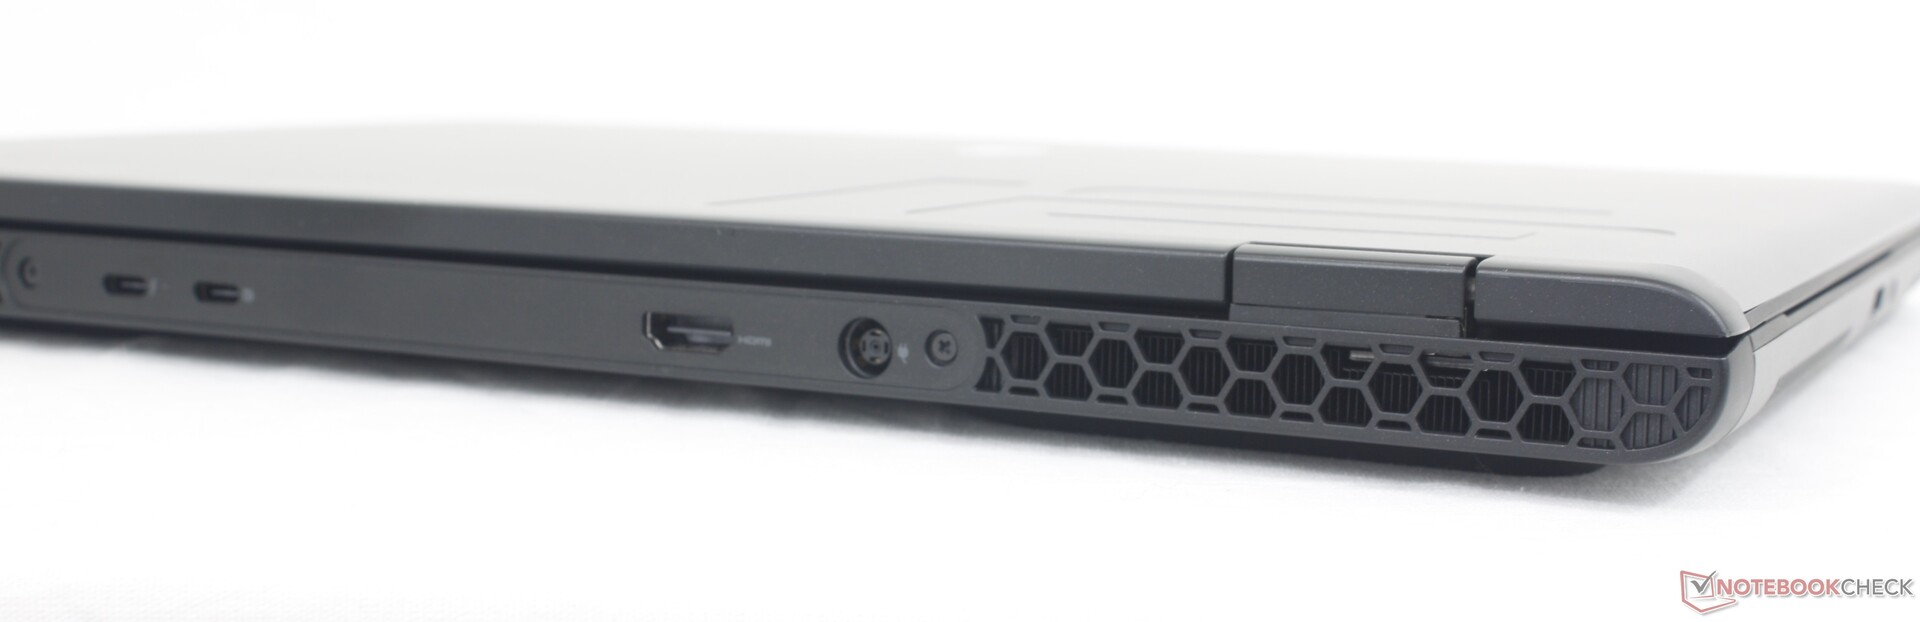
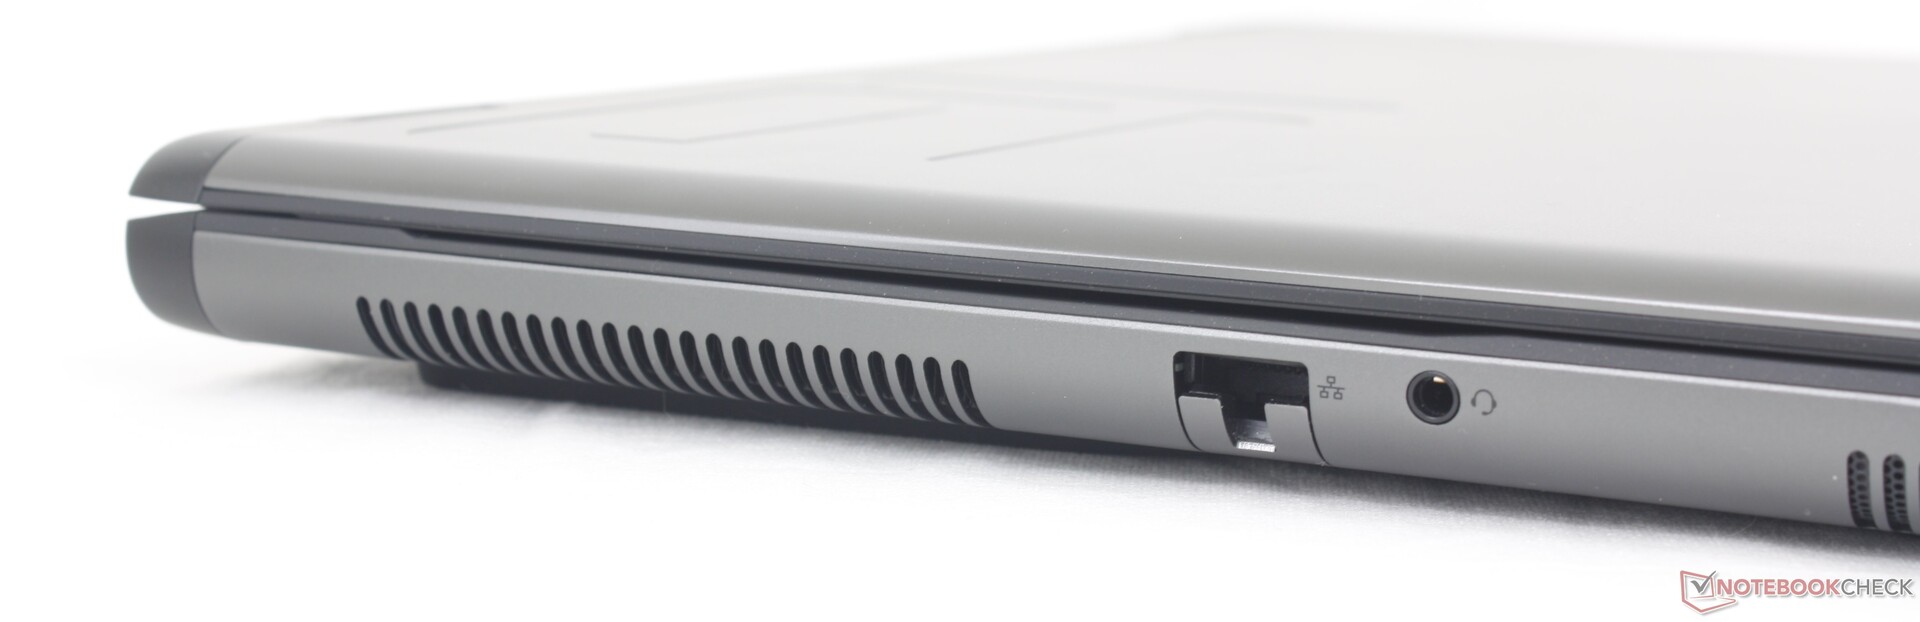
Wszystkie porty z zeszłorocznego m16 R1 powróciły, z wyjątkiem mini-DisplayPort. Rozmieszczenie portów uległo zmianie, a RJ-45 i gniazdo audio zostały przeniesione na lewą krawędź, podczas gdy większość portów w m16 R1 znajdowała się niewygodnie z tyłu.
Proszę pamiętać, że tylko jeden z dwóch portów USB-C obsługuje Power Delivery. Oba są kompatybilne z monitorami zewnętrznymi.
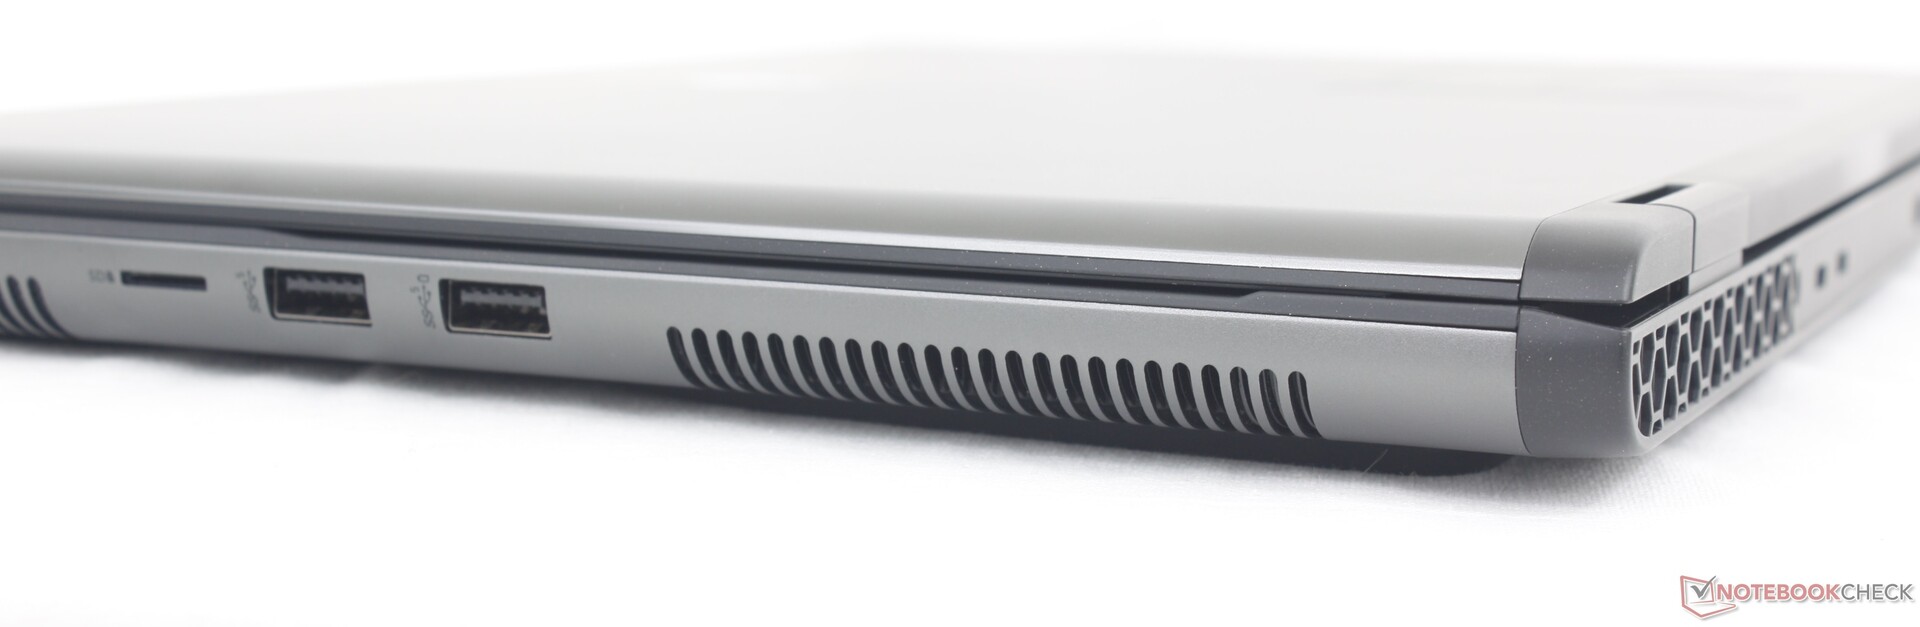
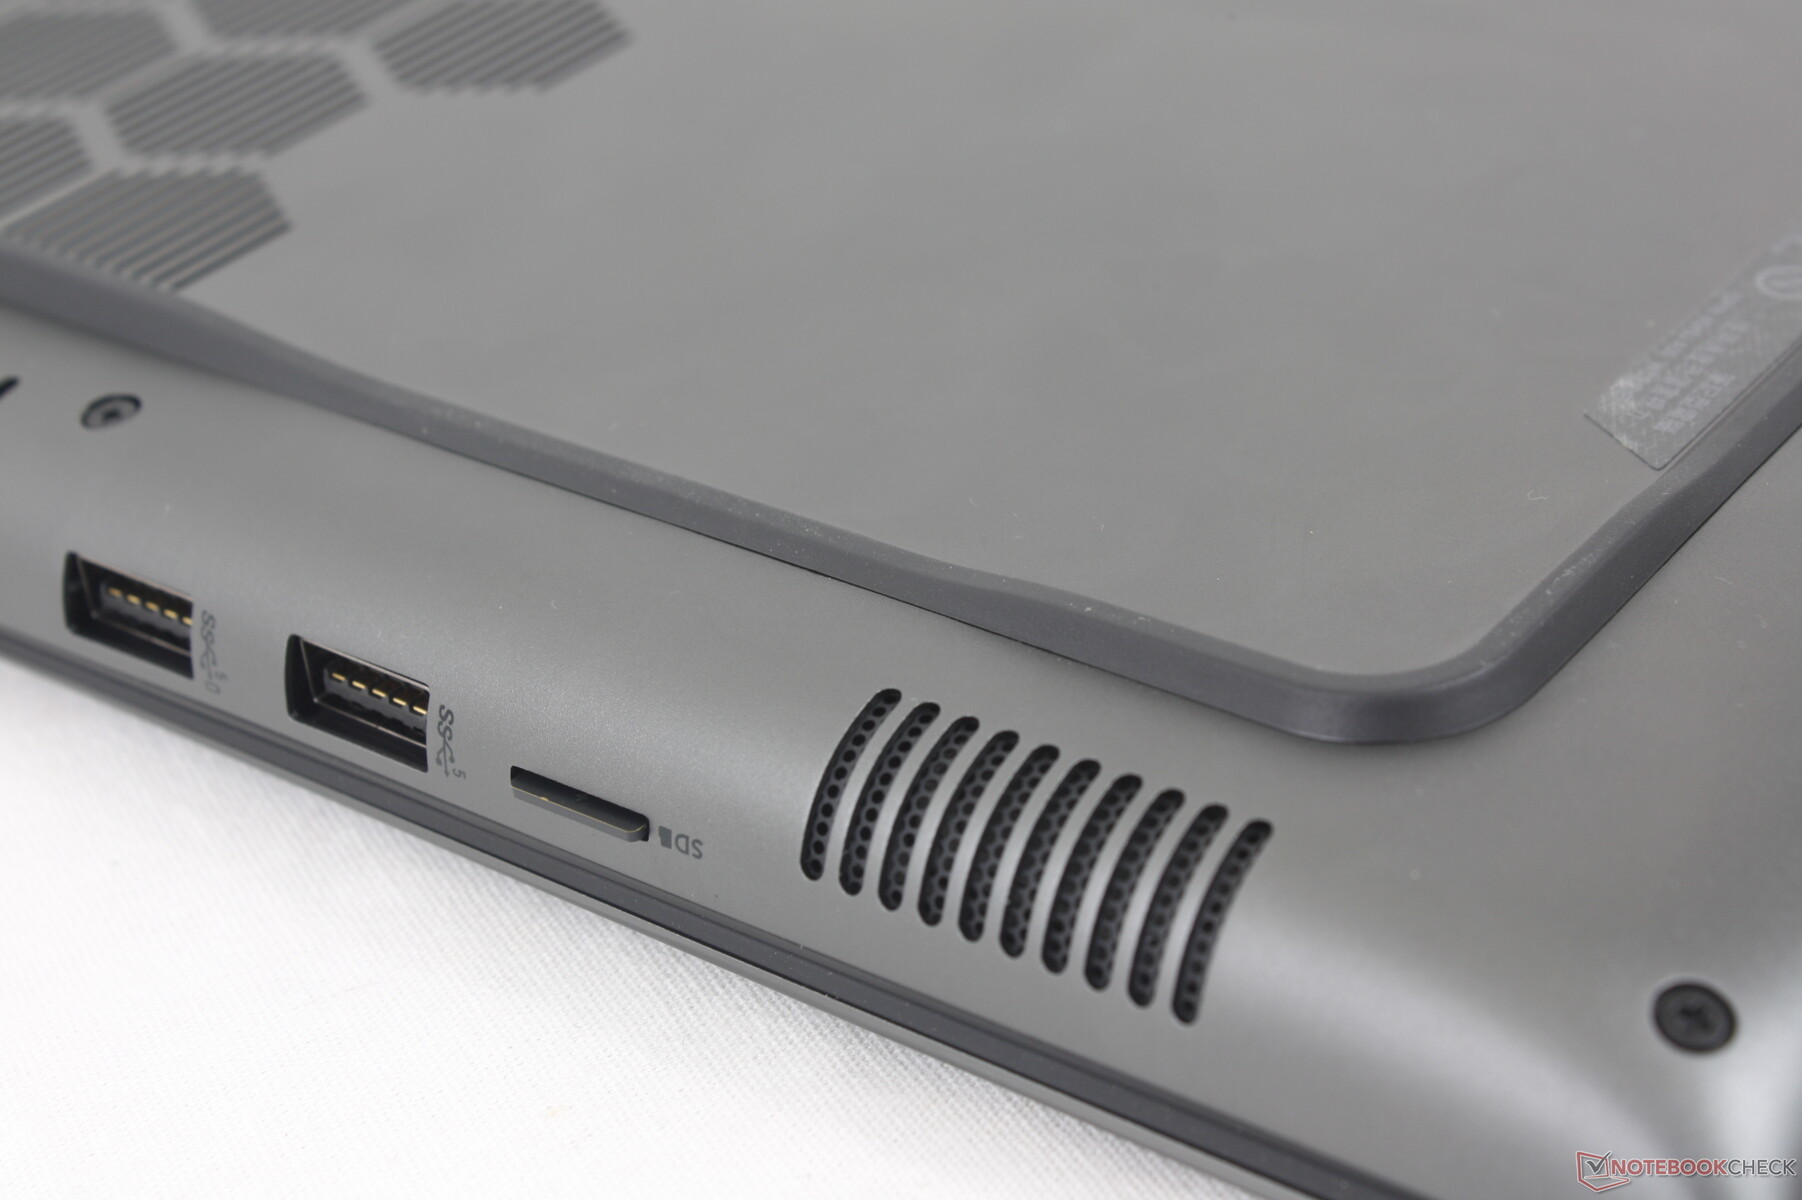
Czytnik kart SD
Podczas gdy m16 R1 miał pełnowymiarowy czytnik SD, m16 R2 niestety wycofał się do czytnika MicroSD, co może irytować niektórych twórców treści. Szybkość transferu jest jednak mniej więcej taka sama, jak w przypadku m16 R1, pomimo zamiany na MicroSD.
| SD Card Reader | |
| average JPG Copy Test (av. of 3 runs) | |
| Alienware m16 R1 Intel (AV PRO microSD 128 GB V60) | |
| Lenovo Legion Slim 7 16APH8 (AV PRO microSD 128 GB V60) | |
| Asus ROG Zephyrus G16 2024 GU605M | |
| Alienware m16 R2 (AV PRO microSD 128 GB V60) | |
| Alienware x16 R1 (AV PRO microSD 128 GB V60) | |
| maximum AS SSD Seq Read Test (1GB) | |
| Alienware x16 R1 (AV PRO microSD 128 GB V60) | |
| Alienware m16 R2 (AV PRO microSD 128 GB V60) | |
| Alienware m16 R1 Intel (AV PRO microSD 128 GB V60) | |
| Asus ROG Zephyrus G16 2024 GU605M | |
| Lenovo Legion Slim 7 16APH8 (AV PRO microSD 128 GB V60) | |
Komunikacja
Intel Killer AX1675 jest standardowo wyposażony w łączność Wi-Fi 6E z opcją aktualizacji do BE202 w celu zapewnienia kompatybilności z Wi-Fi 7. Nie doświadczyliśmy żadnych problemów po sparowaniu z naszym routerem testowym Asus AXE11000.
| Networking | |
| iperf3 transmit AXE11000 | |
| Asus ROG Zephyrus G16 2024 GU605M | |
| HP Omen Transcend 16-u1095ng | |
| Alienware m16 R1 Intel | |
| Alienware m16 R2 | |
| Alienware x16 R1 | |
| Lenovo Legion Slim 7 16APH8 | |
| iperf3 receive AXE11000 | |
| Lenovo Legion Slim 7 16APH8 | |
| HP Omen Transcend 16-u1095ng | |
| Alienware m16 R1 Intel | |
| Asus ROG Zephyrus G16 2024 GU605M | |
| Alienware x16 R1 | |
| Alienware m16 R2 | |
| iperf3 transmit AXE11000 6GHz | |
| Alienware m16 R2 | |
| Alienware x16 R1 | |
| iperf3 receive AXE11000 6GHz | |
| Alienware m16 R2 | |
| Alienware x16 R1 | |
Kamera internetowa
Kamera internetowa 2 MP jest standardowo wyposażona w podczerwień do obsługi Windows Hello. Nie ma zintegrowanej przesłony prywatności.


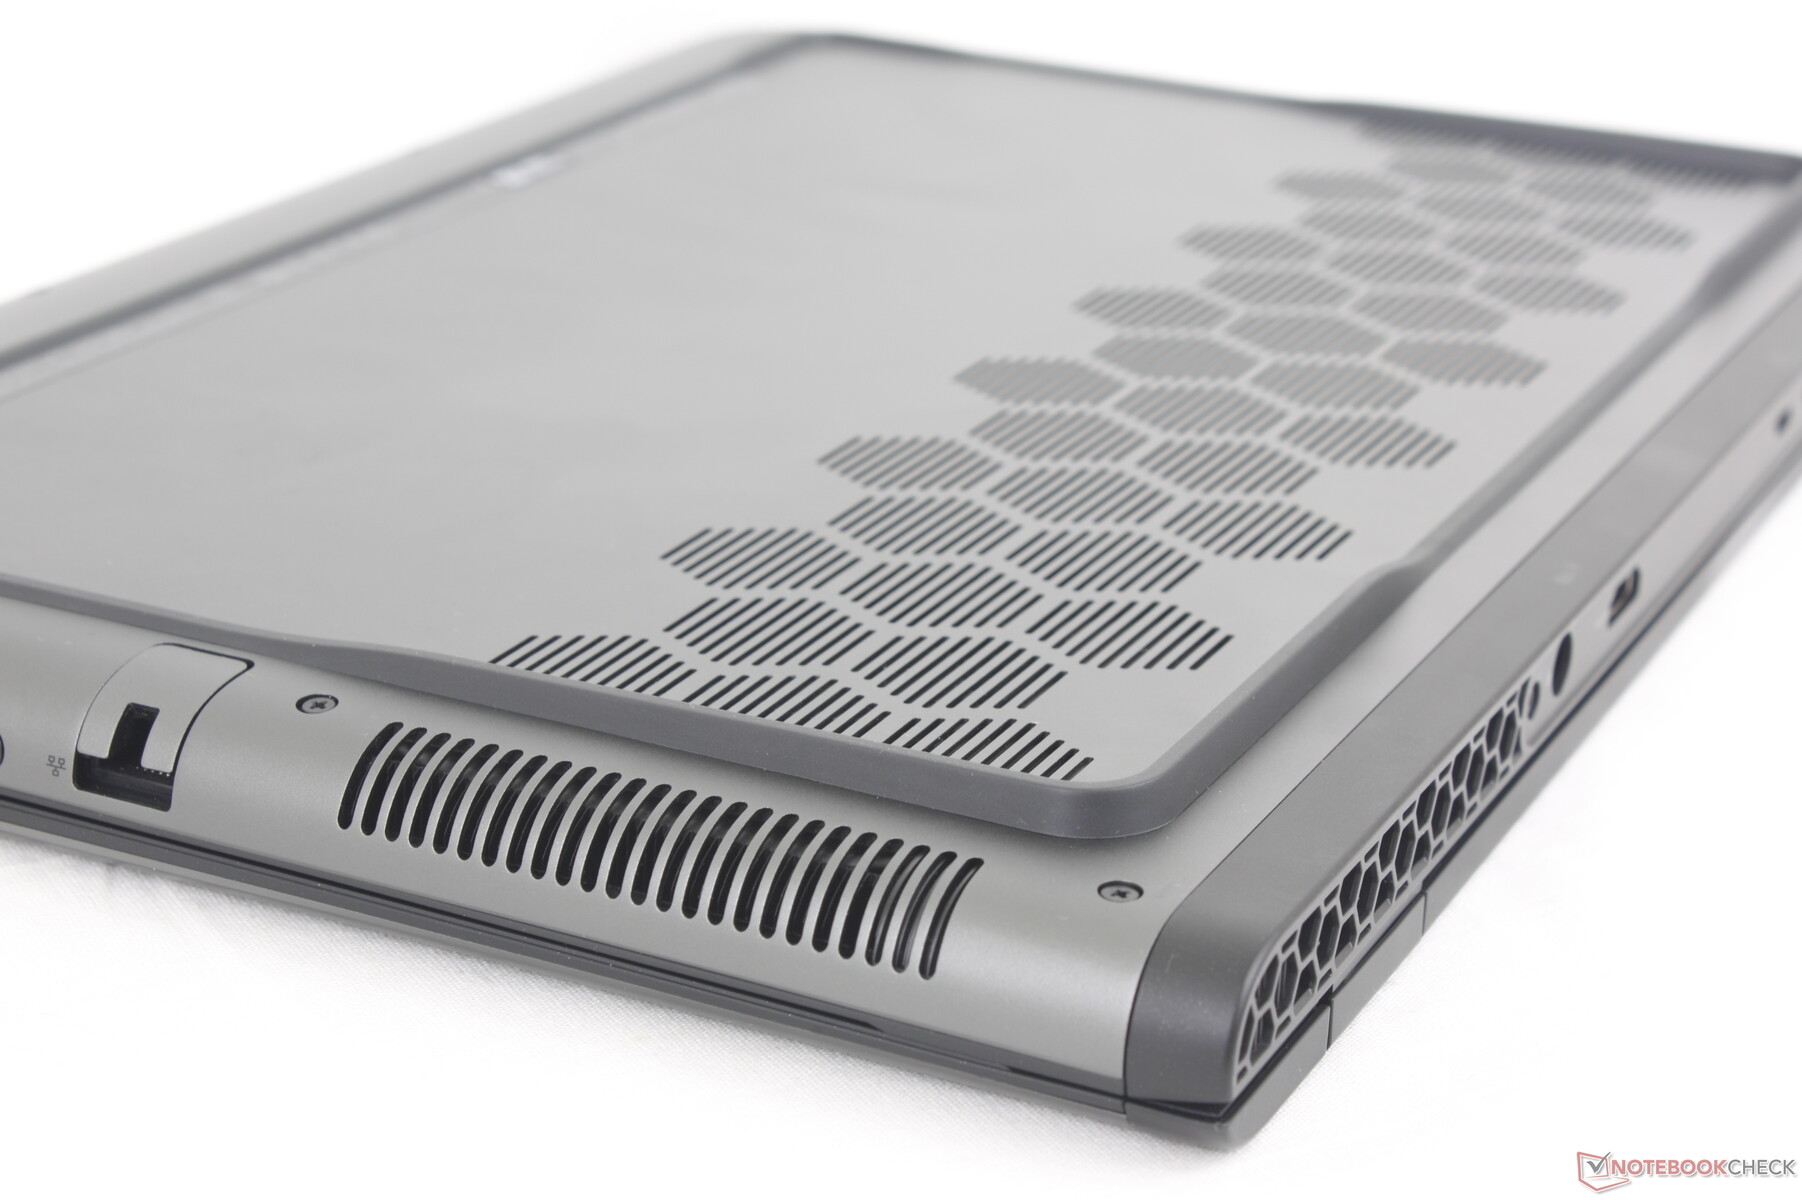
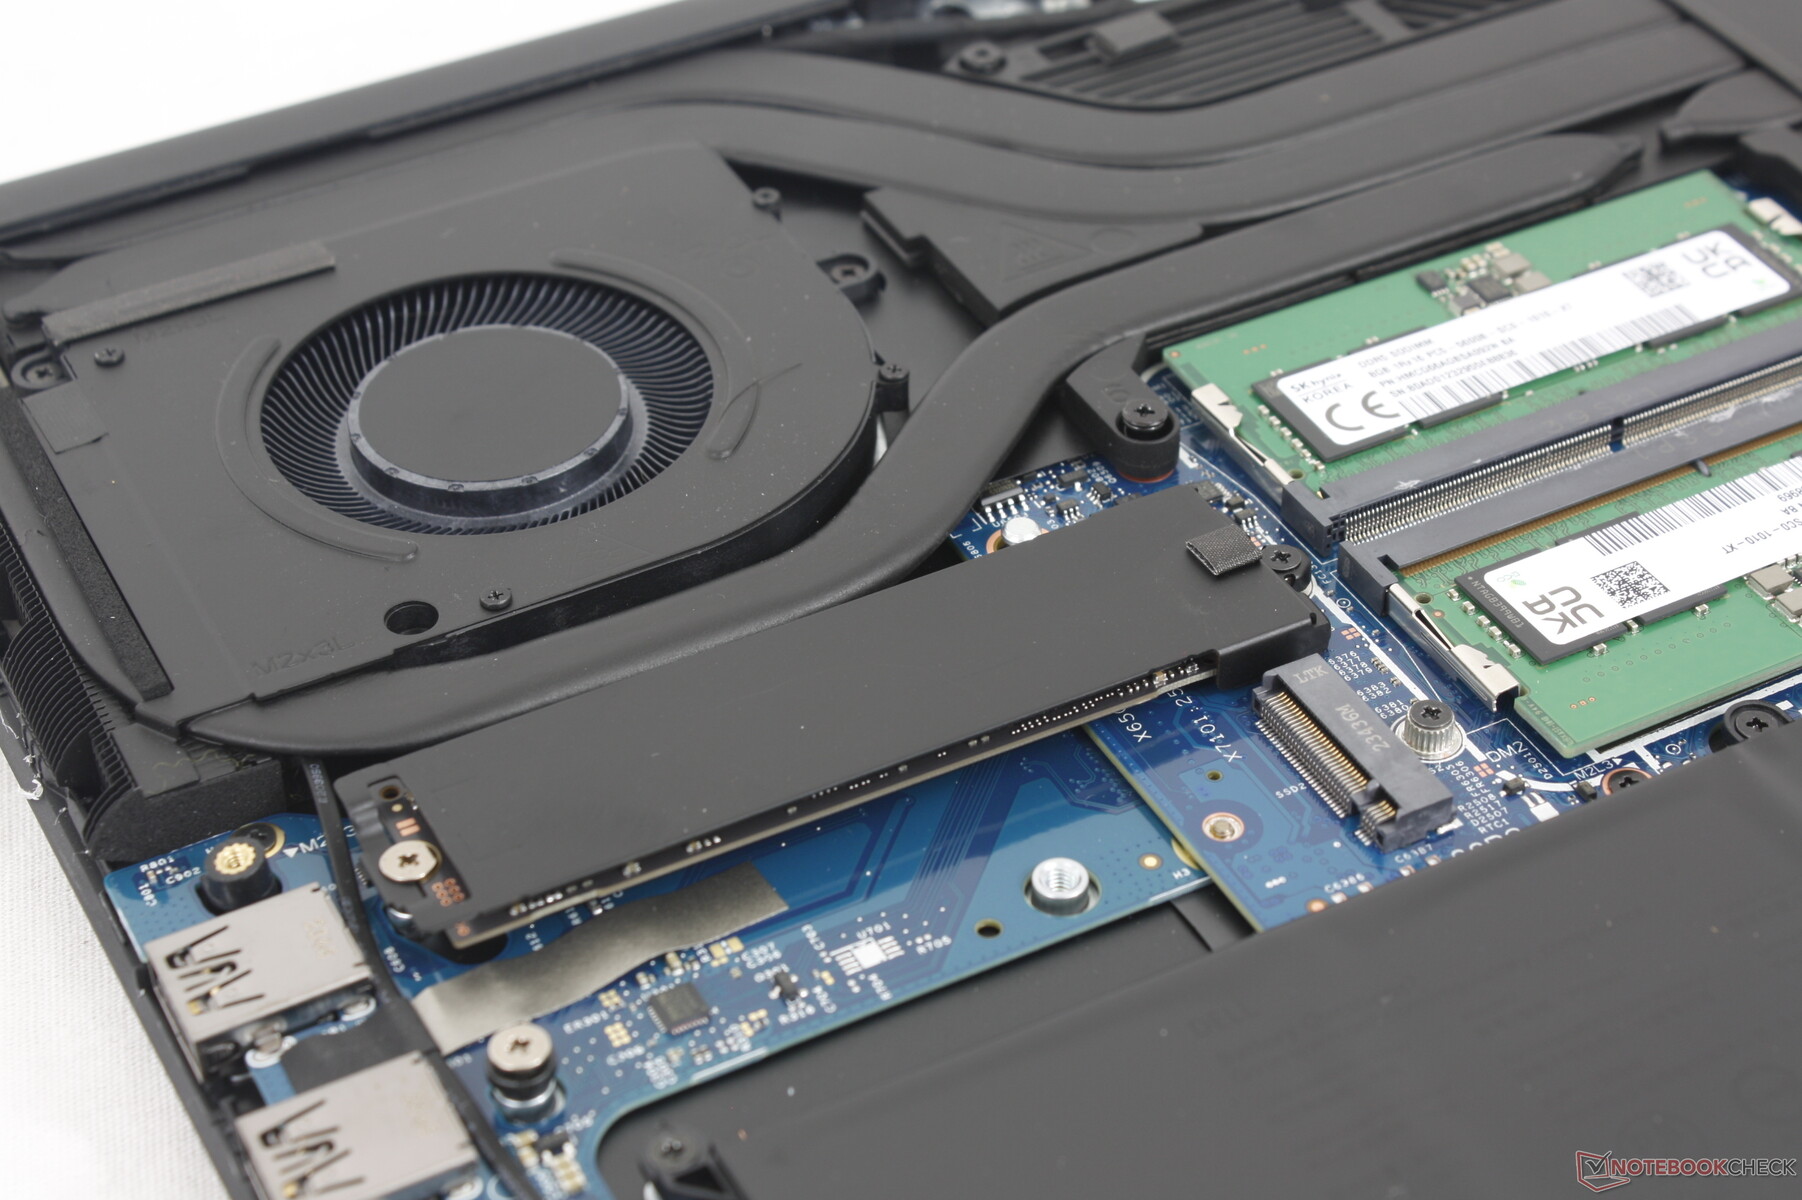
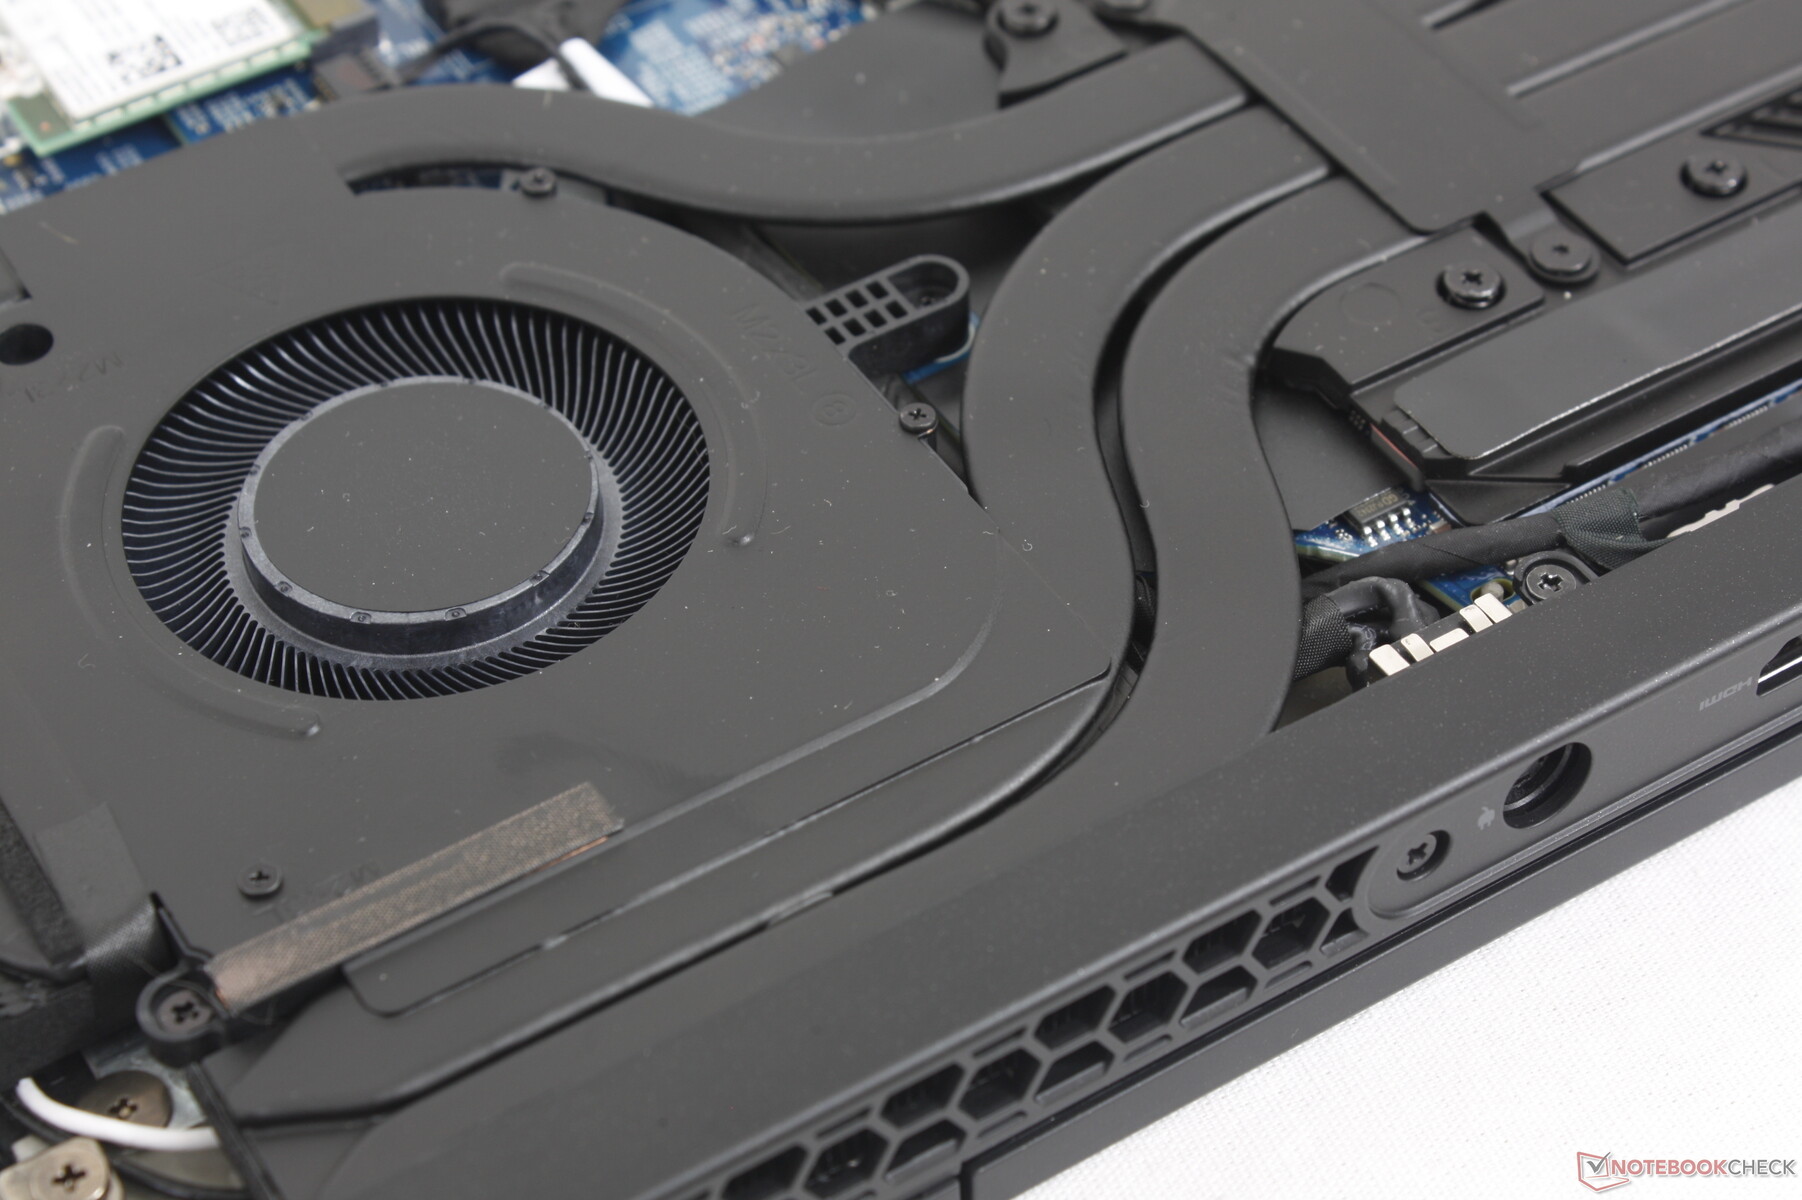
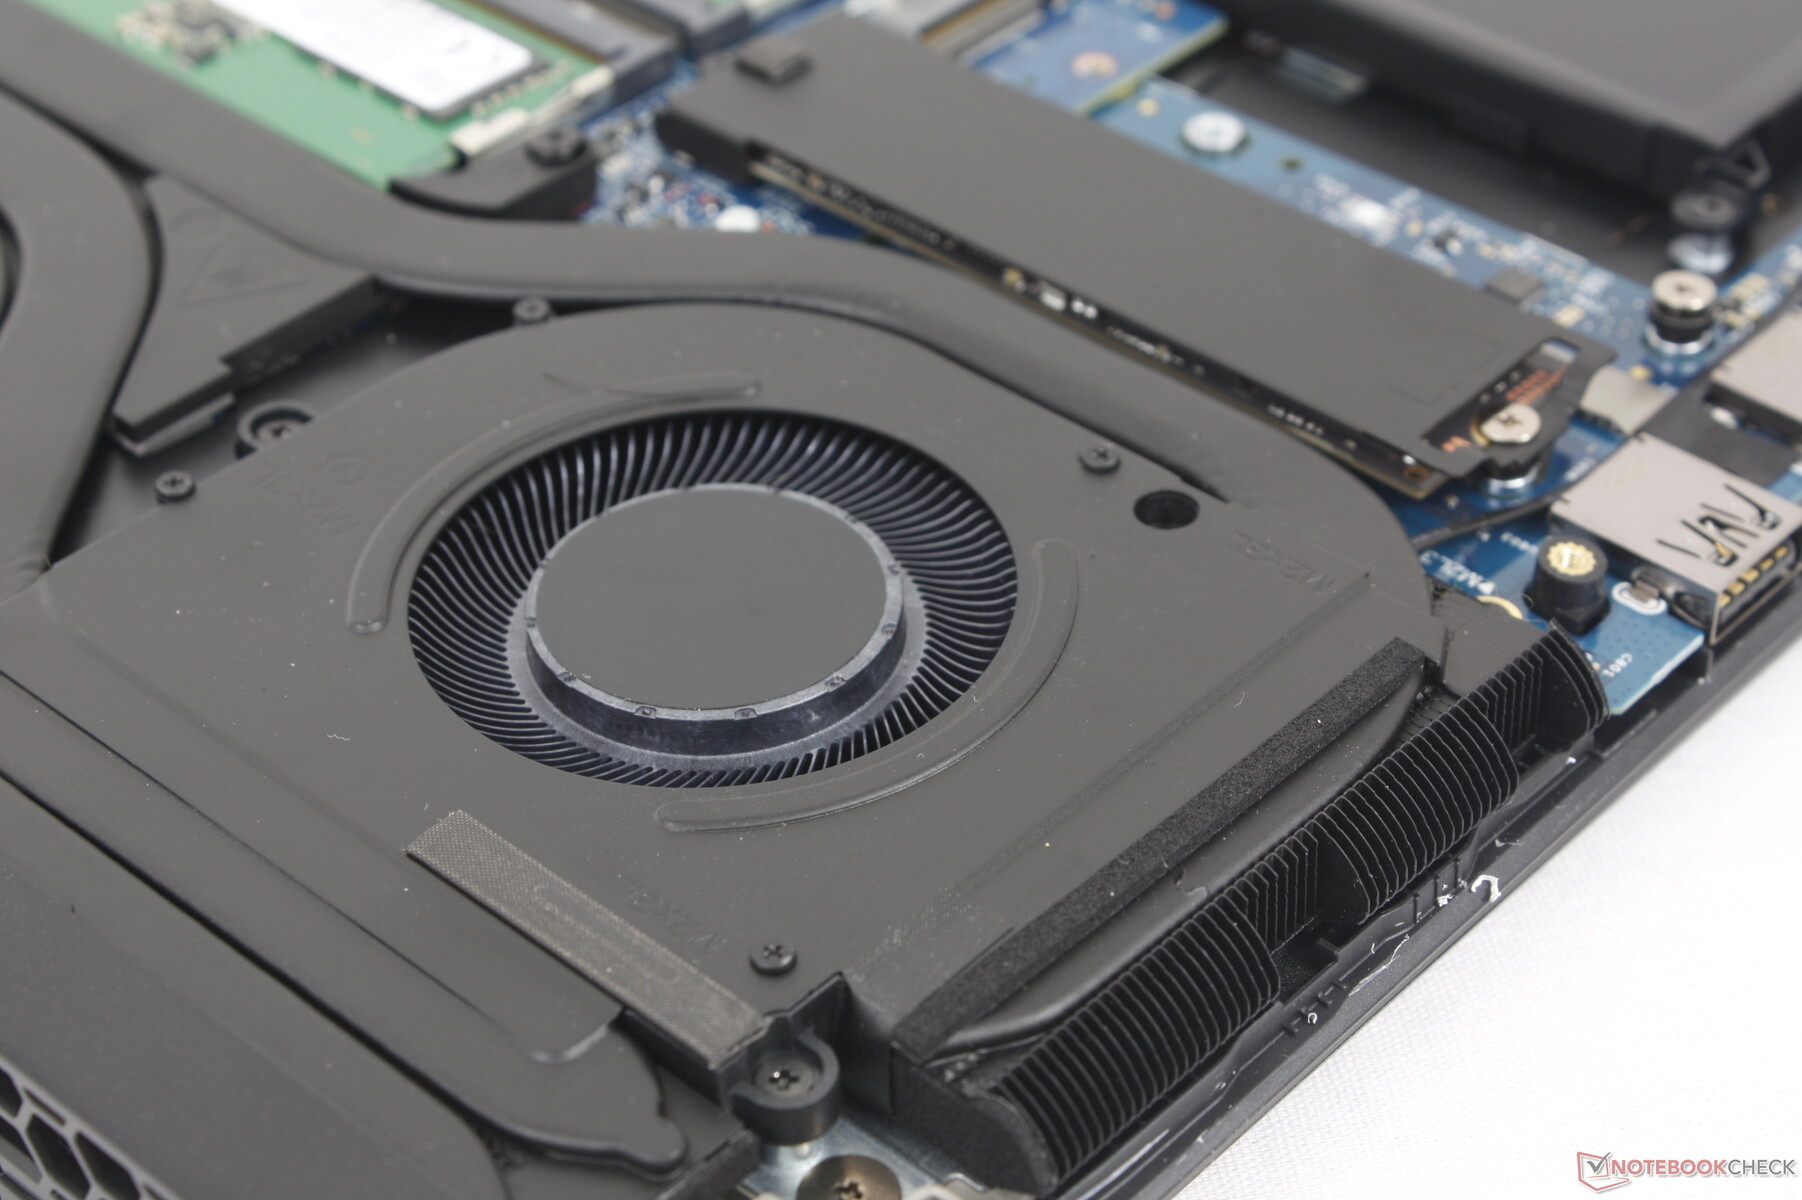
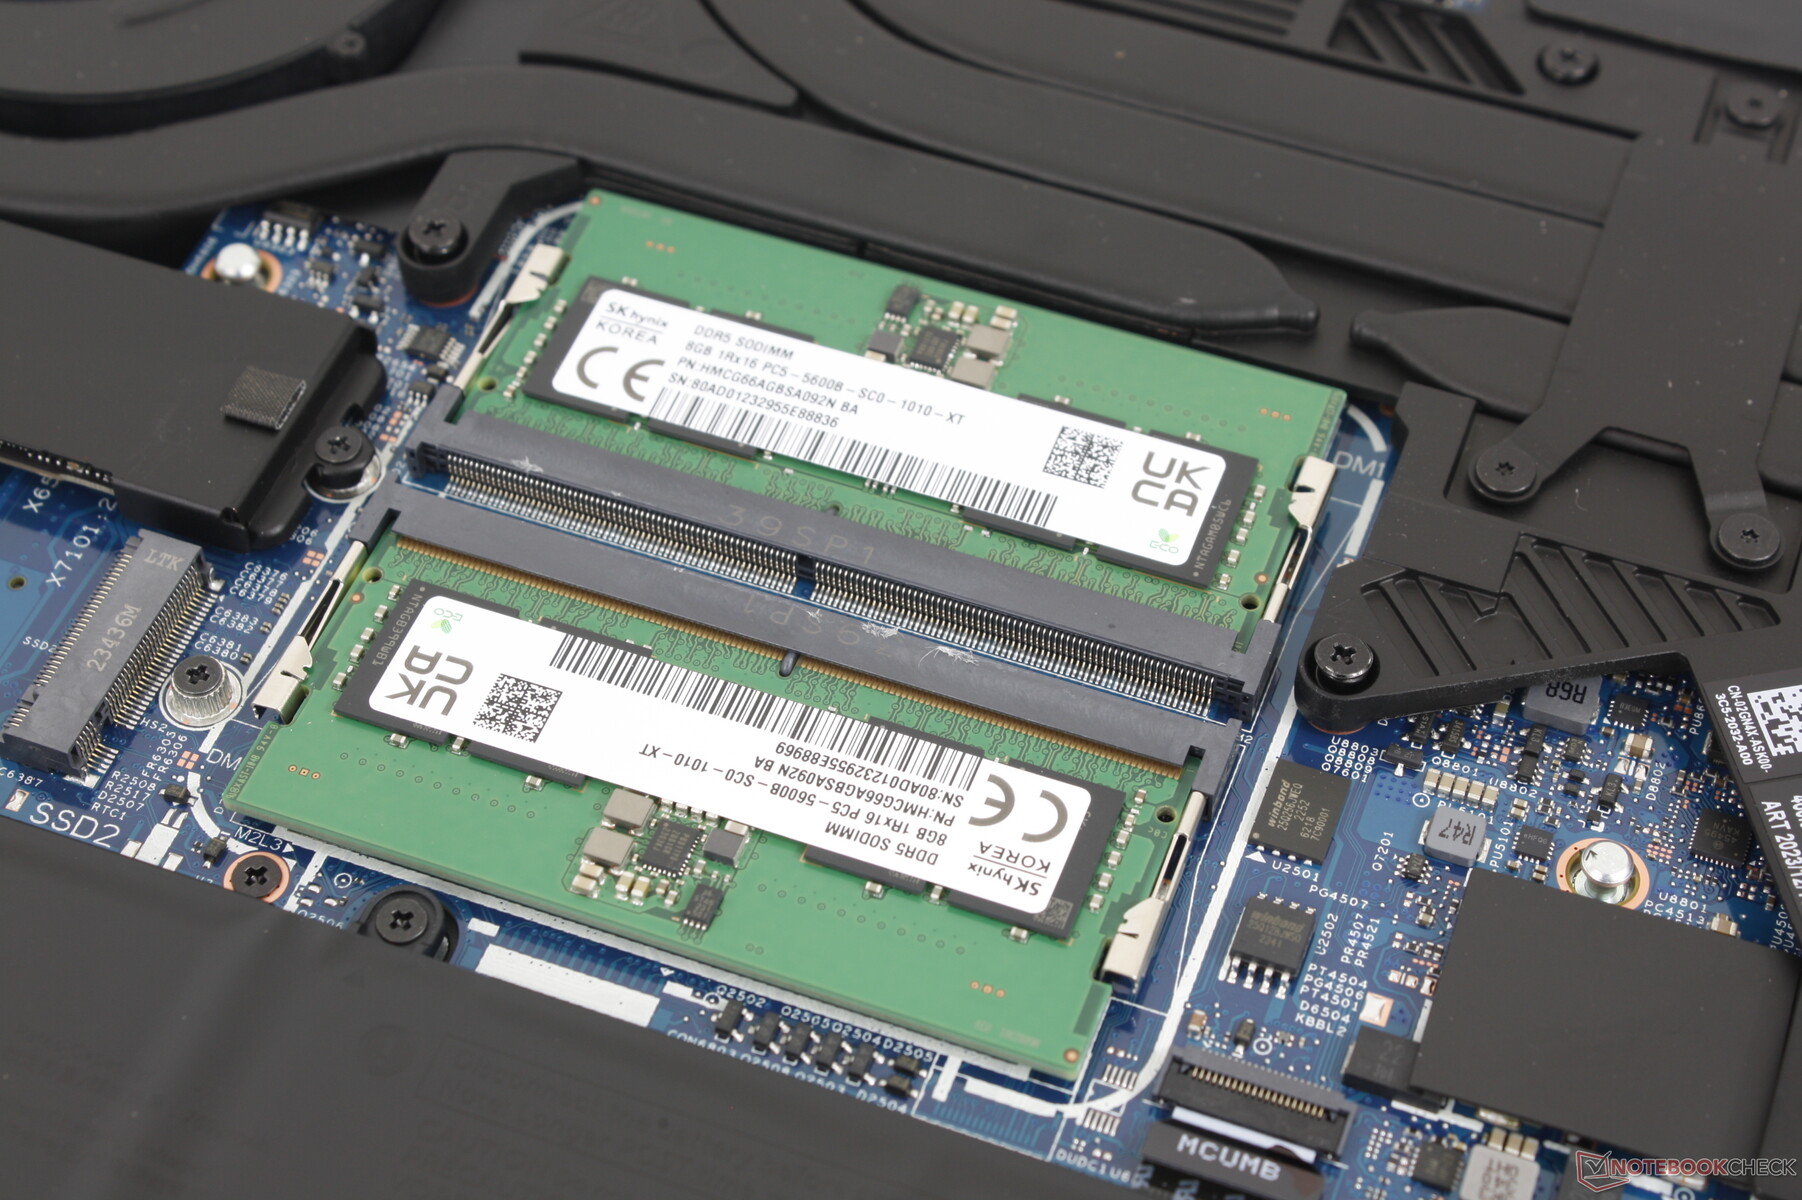
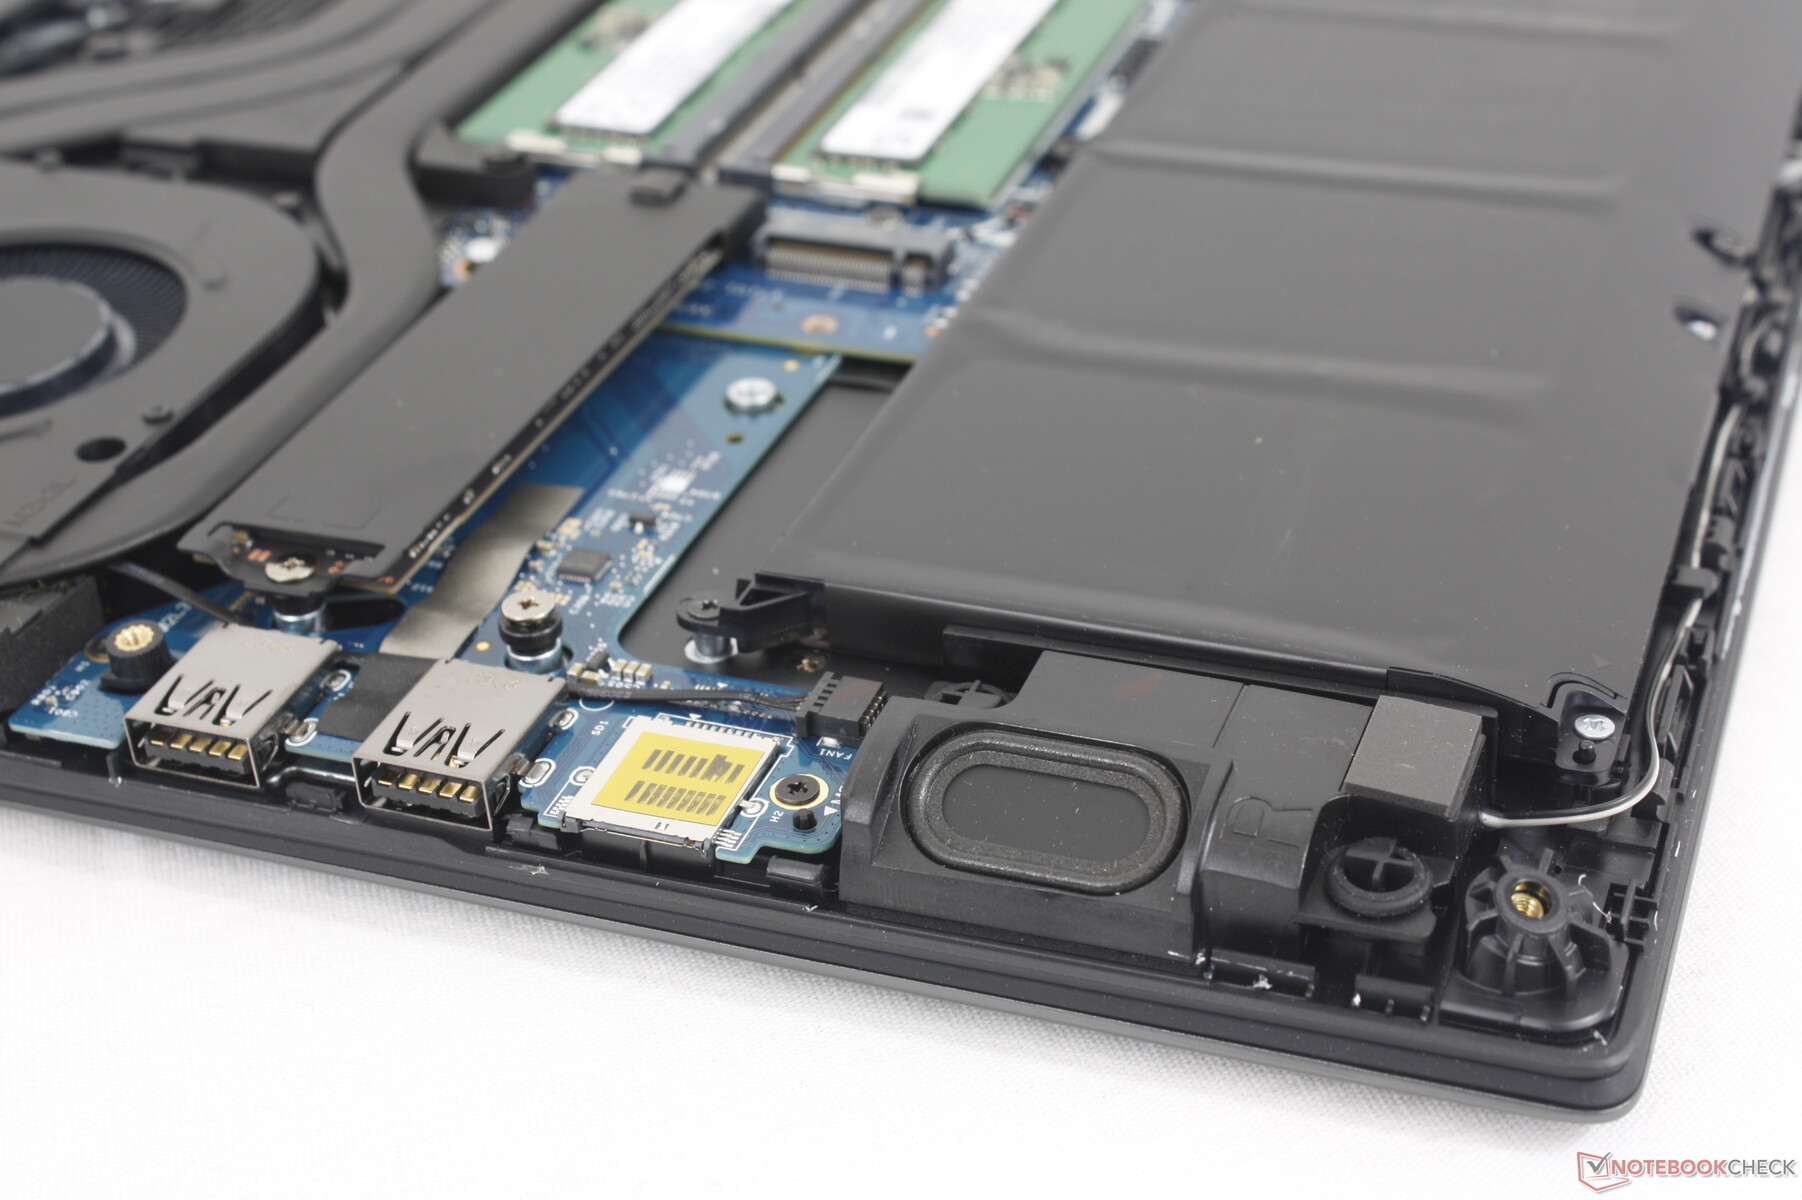
Konserwacja
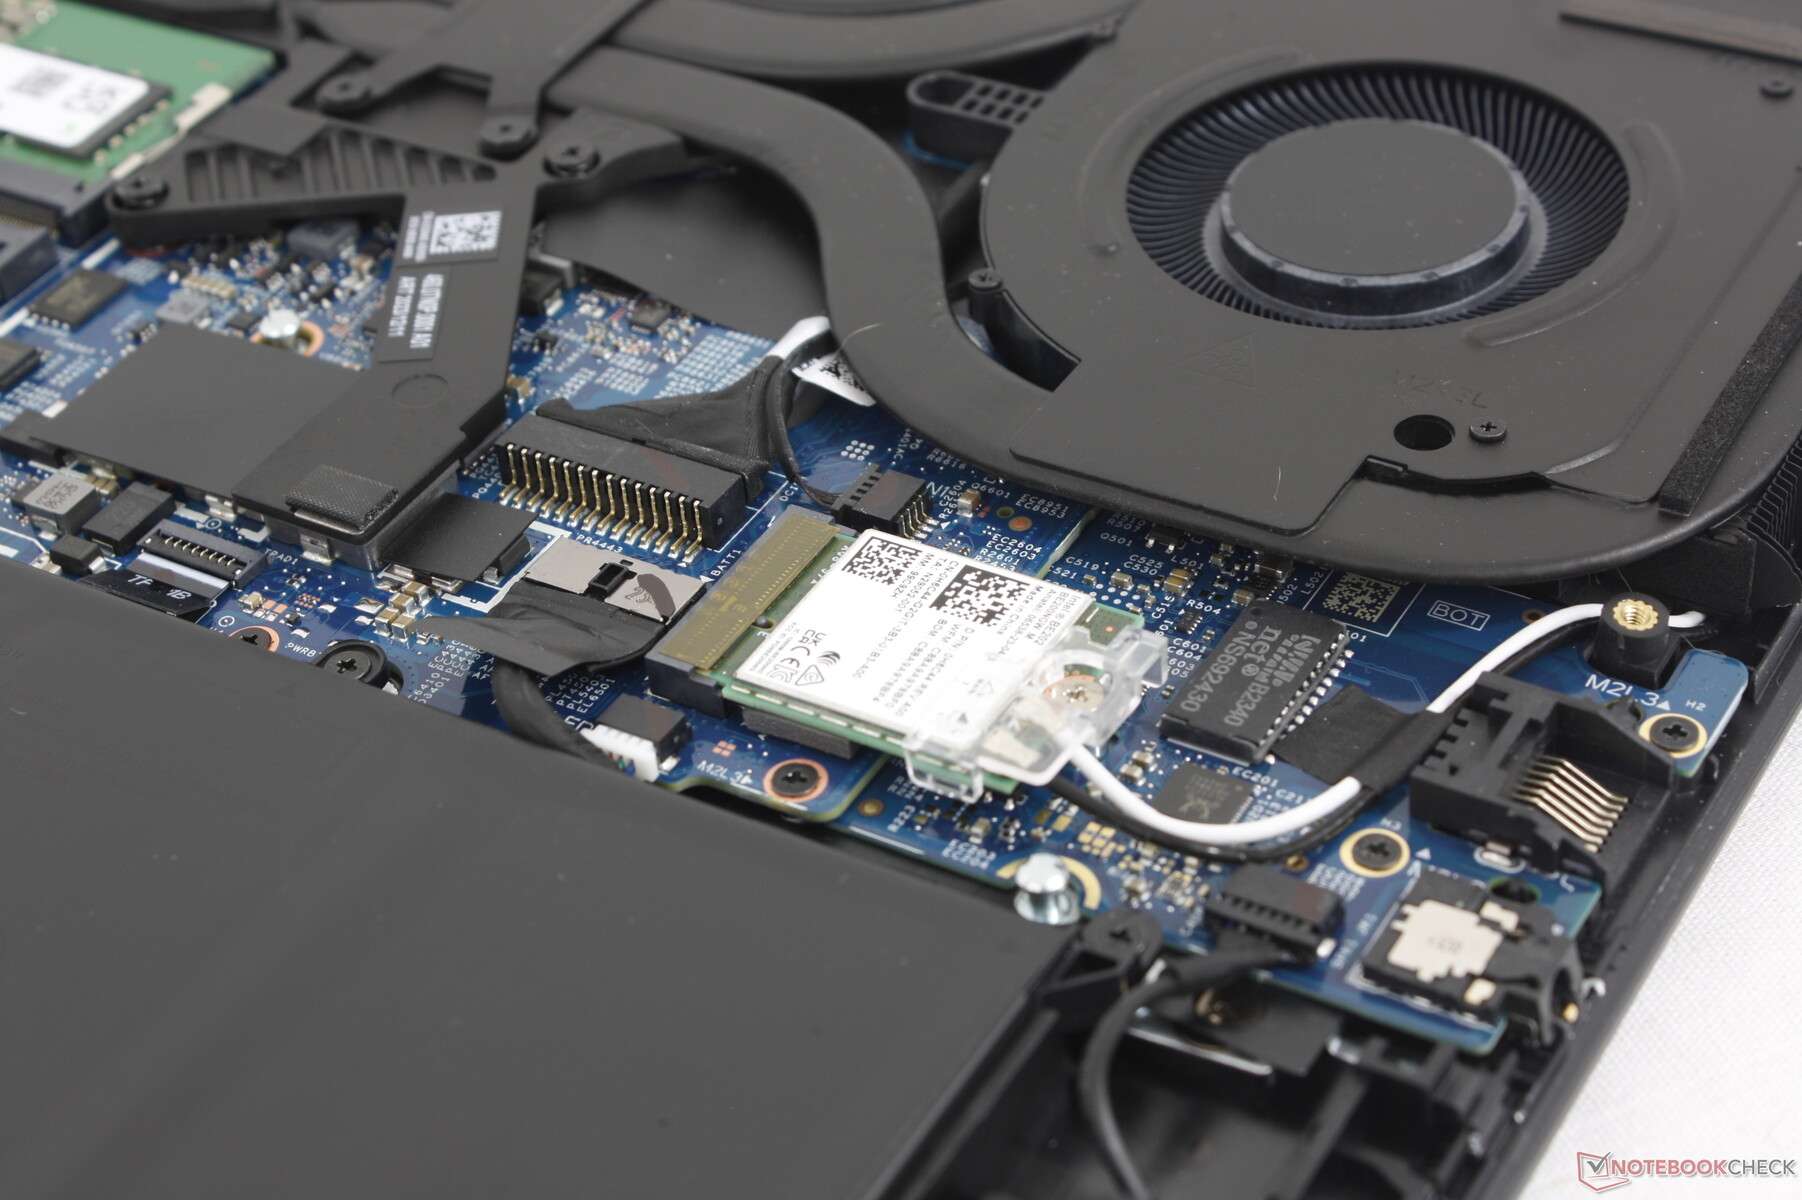
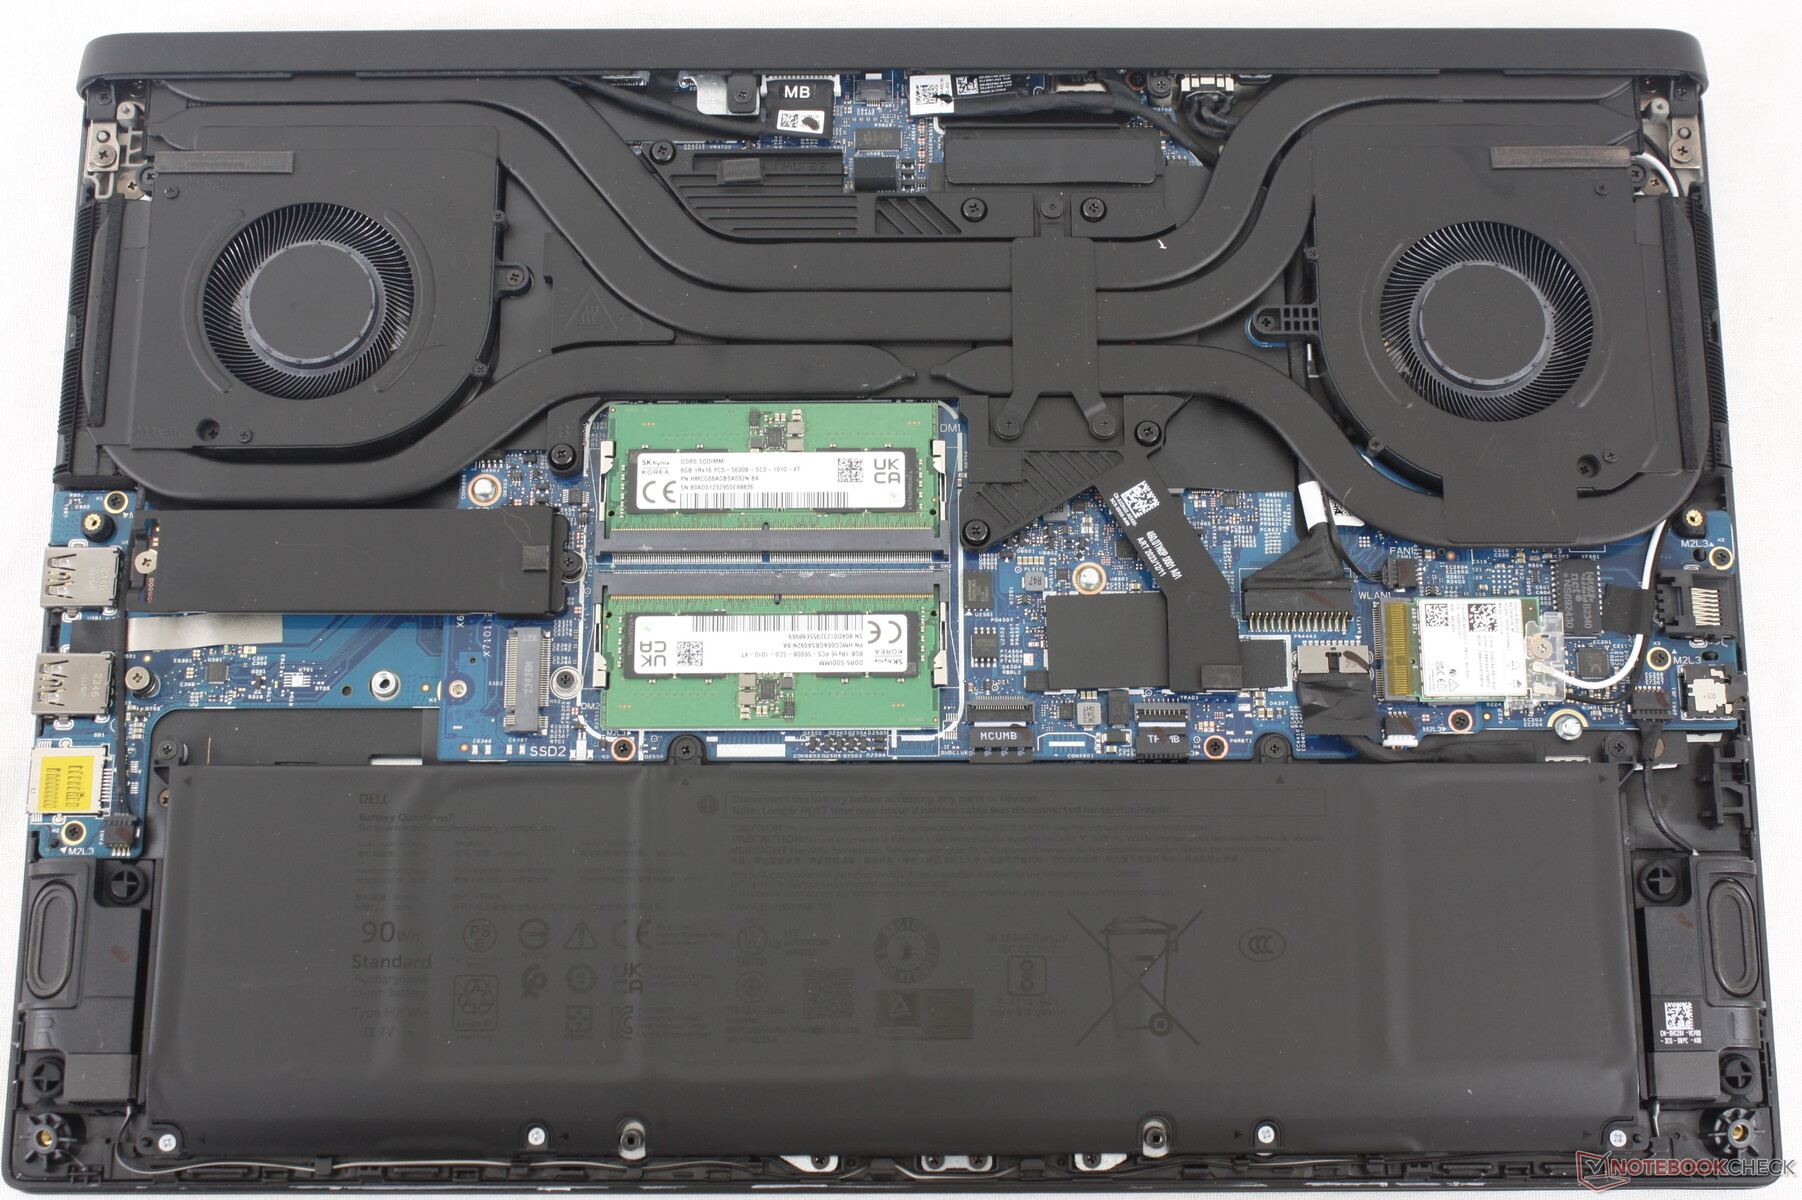
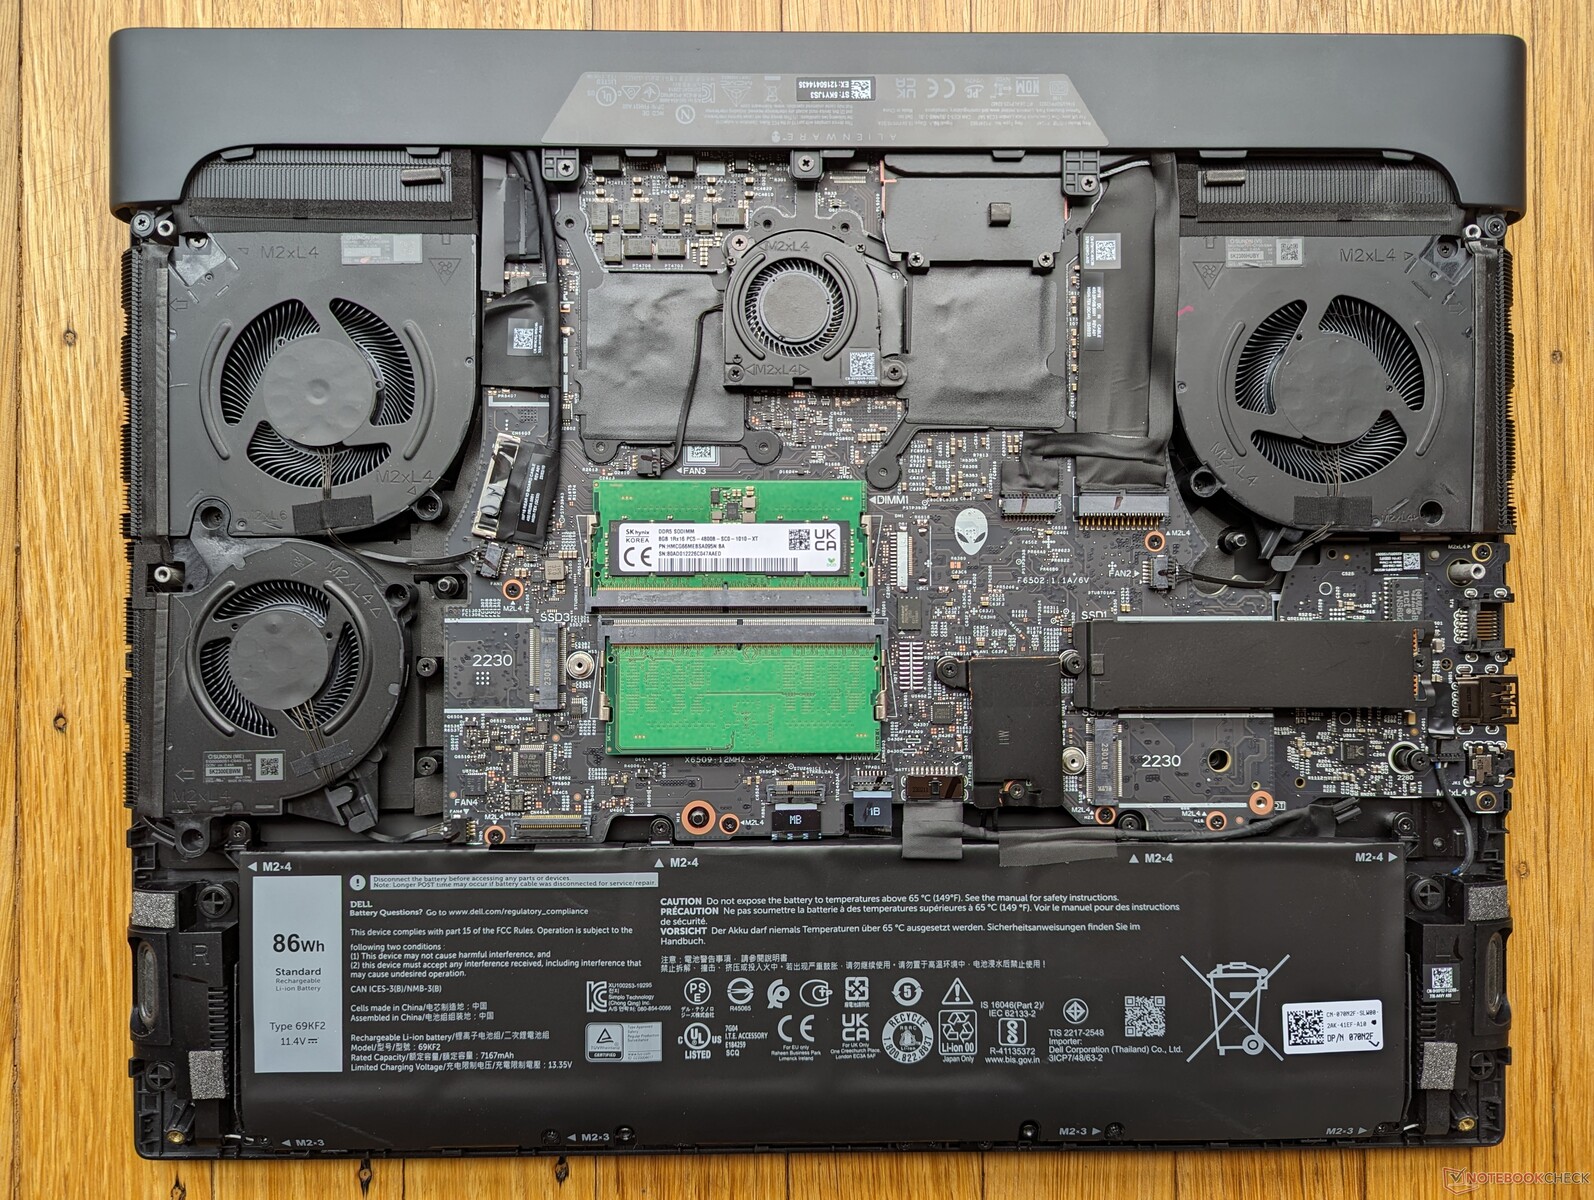
Dolny panel jest zabezpieczony 8 śrubami krzyżakowymi, co ułatwia serwisowanie. Pamięć RAM i WLAN są nadal wymienne, ale konfiguracja pamięci masowej uległa zmianie; system obsługuje teraz dwa dyski SSD M.2 2280 zamiast jednego M.2 2280 i dwóch M.2 2230 SSD w zeszłorocznym projekcie.
Akcesoria i gwarancja
Pudełko detaliczne zawiera kilka naklejek z logo Alienware wraz ze zwykłym zasilaczem sieciowym i dokumentacją. Standardowa roczna ograniczona gwarancja producenta jest standardem w przypadku zakupu w USA.
Urządzenia wejściowe - nie trzeba mechanicznych
Klawiatura
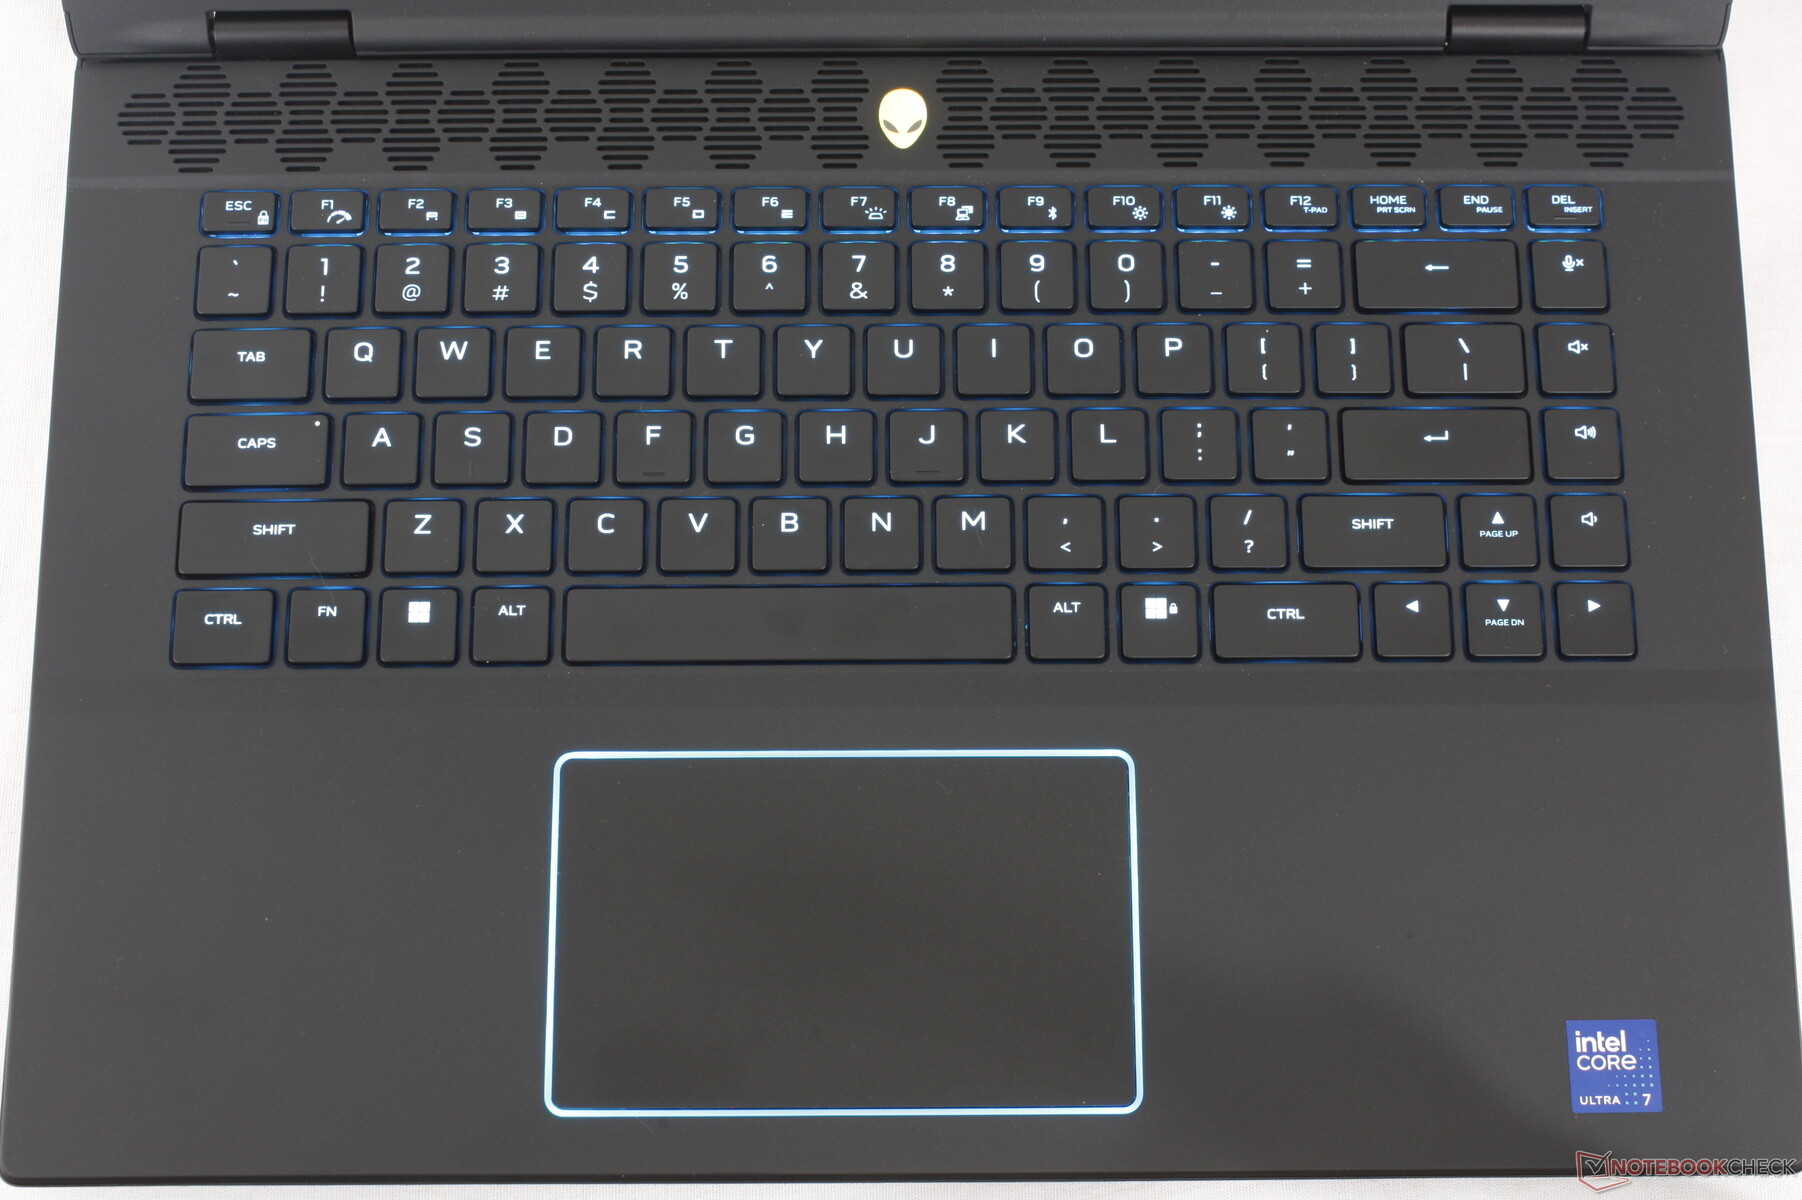
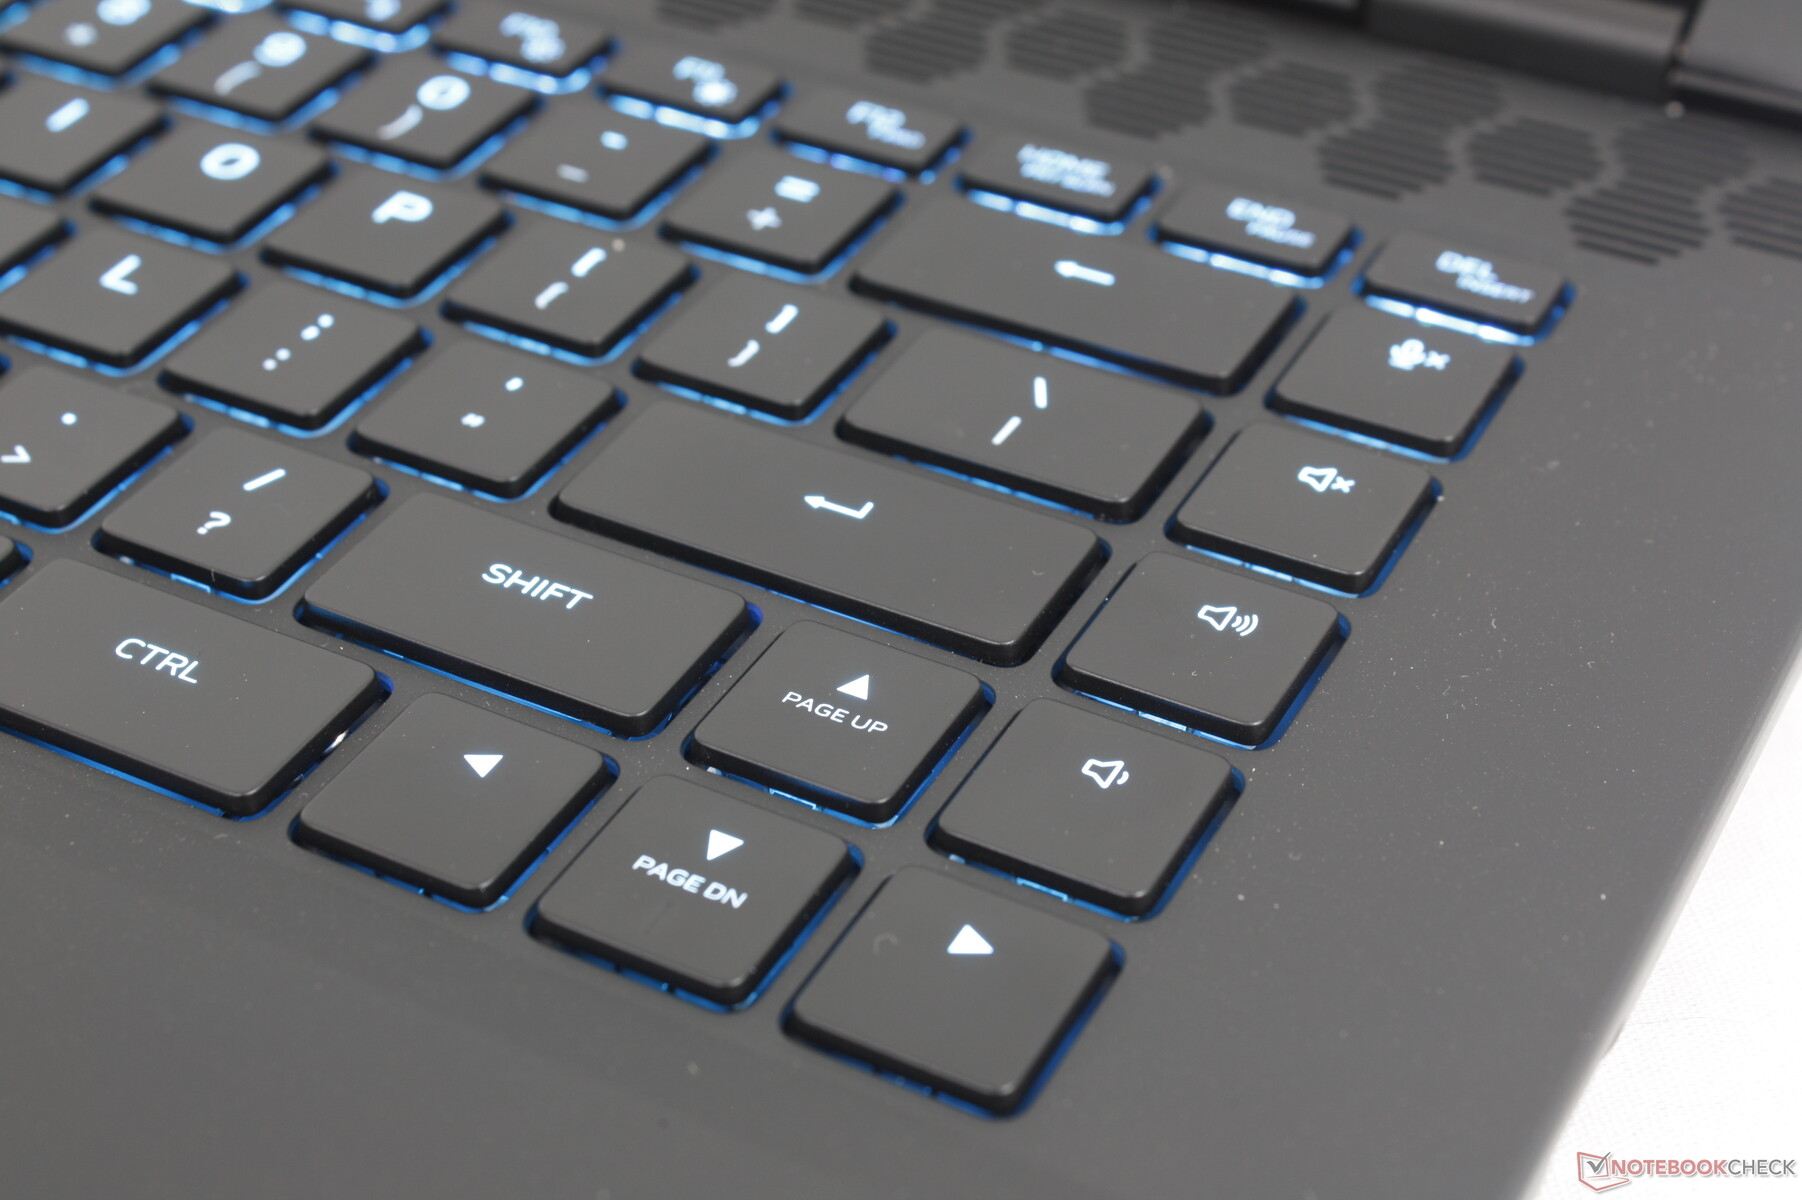
System wykorzystuje klawisze membranowe o skoku 1,8 mm i nie ma już opcji mechanicznej, aby utrzymać niską wagę i przyciągnąć szersze grono odbiorców poza graczami. Niemniej jednak są one wygodne i bardziej klikalne niż oczekiwano w porównaniu z klawiaturami w większości innych laptopów do gier, w tym MSI Raider GE68 lub HP Omen Transcend 16. W szczególności klawisze spacji i Enter są znacznie głośniejsze i ostrzejsze niż główne klawisze QWERTY po naciśnięciu.
Nowością w klawiaturze w tym roku jest przydatna funkcja "Stealth mode" powiązana z klawiszem F2, która przełącza system w tryb cichy bez konieczności wcześniejszego uruchamiania Alienware Command Center. W przeciwnym razie układ klawiatury pozostaje taki sam, jak w oryginalnym m16 R1.
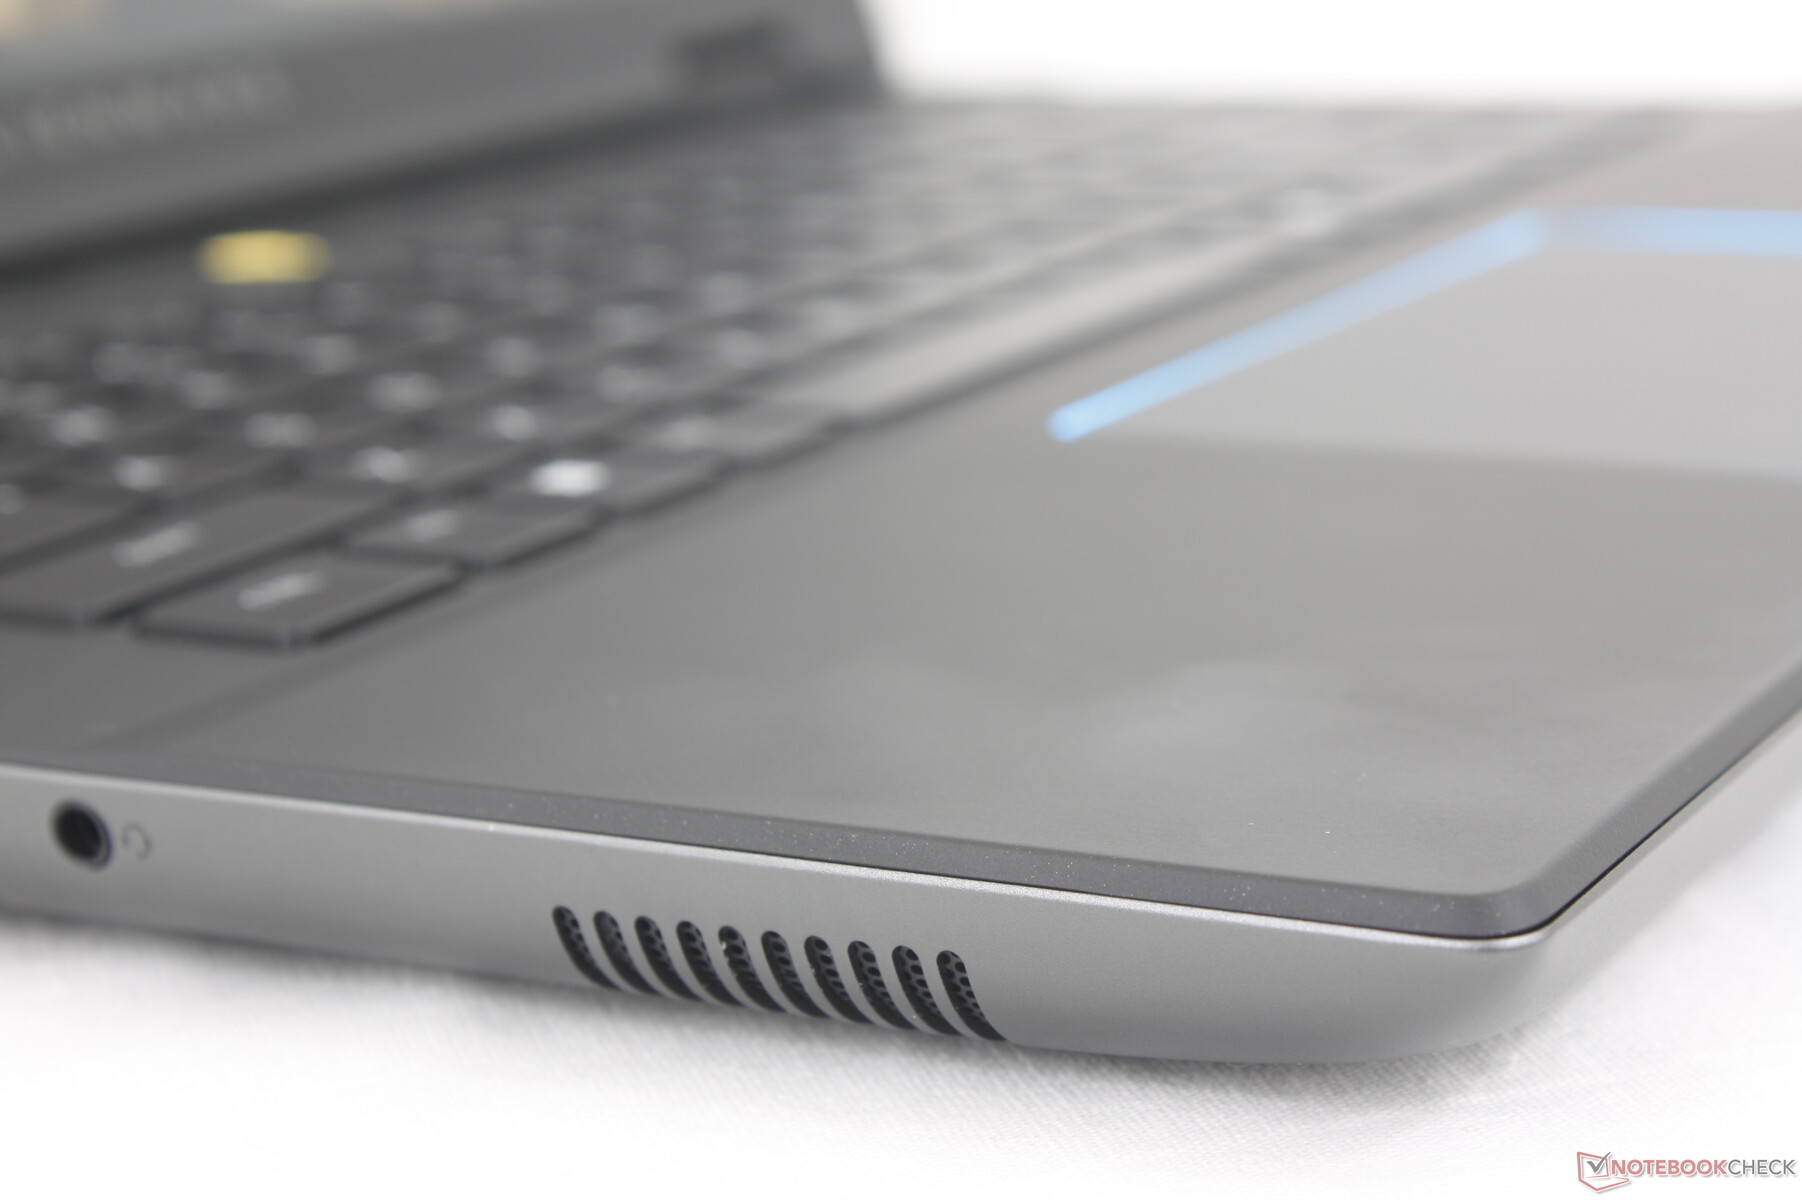
Panel dotykowy
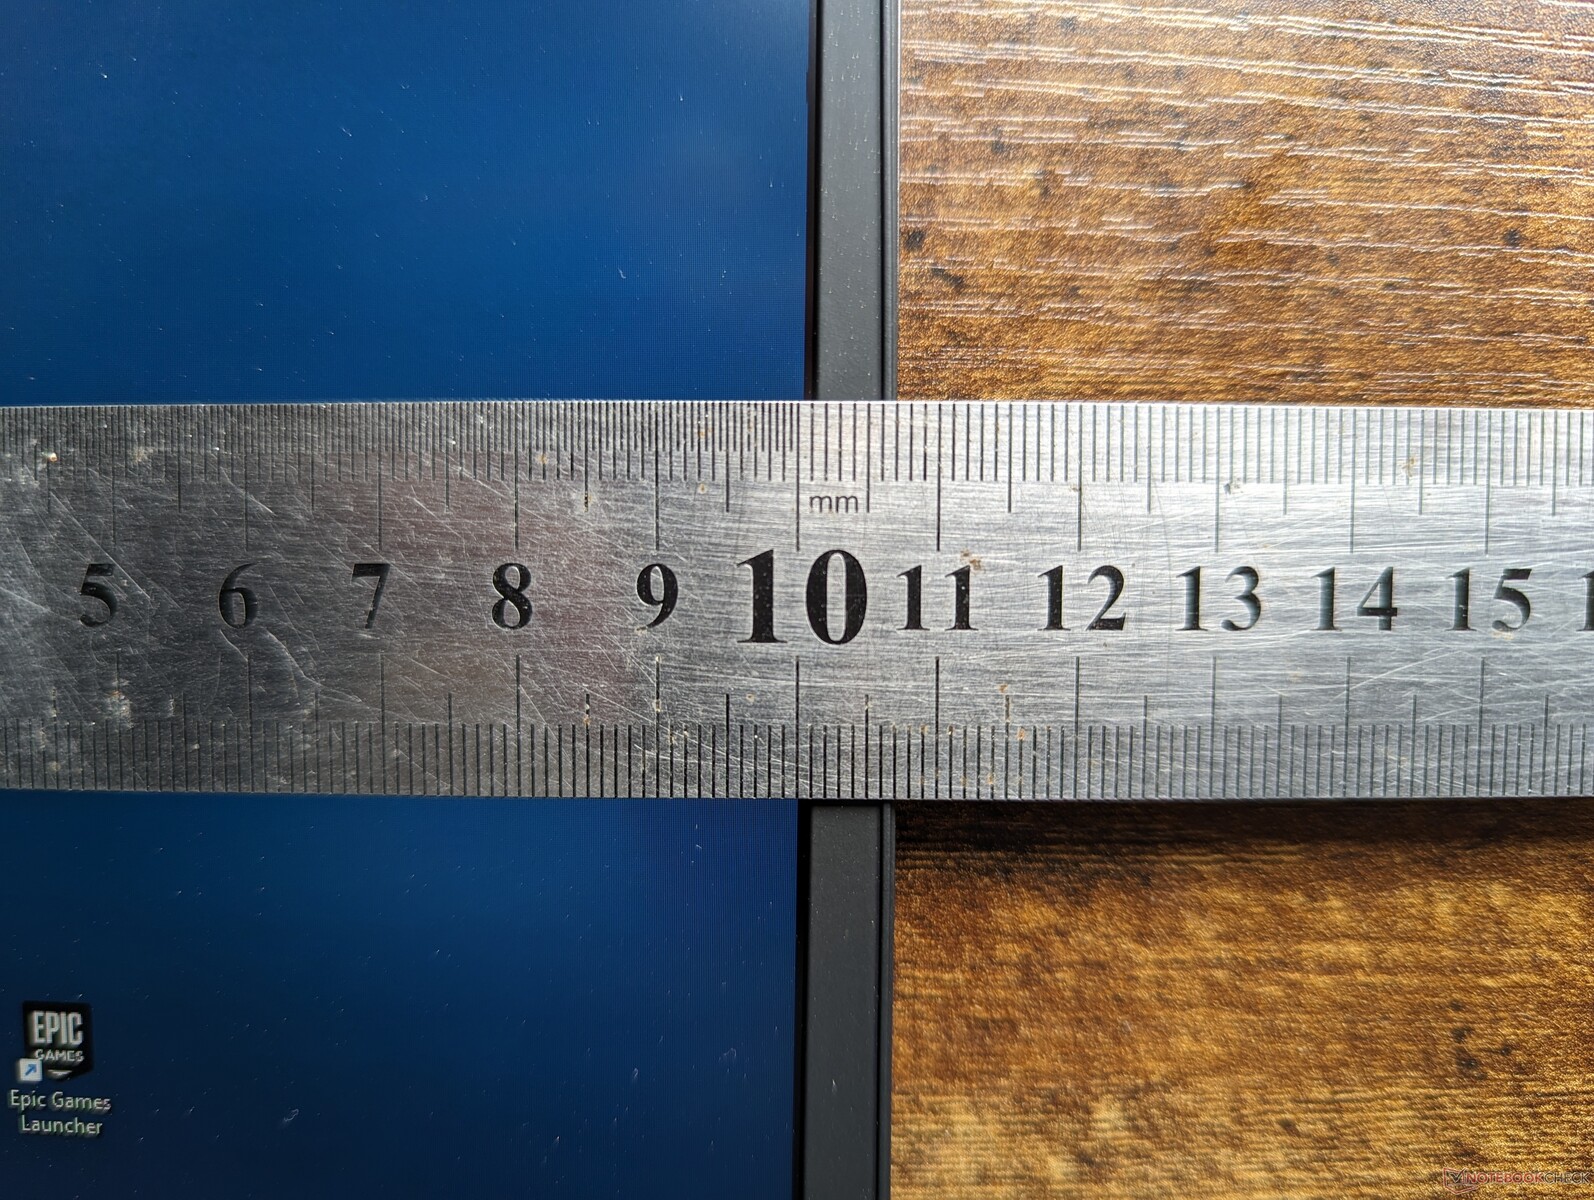
Klawiatura jest nieco większa niż w zeszłorocznym modelu (11,5 x 7 cm w porównaniu do 11,3 x 6,6 cm) i zawiera nowe oświetlenie RGB na całym obwodzie. Jednak sprzężenie zwrotne podczas klikania jest nadal gąbczaste i bardzo płytkie, co daje niezadowalające odczucia. Działa wystarczająco niezawodnie do podstawowego wskazywania i klikania, ale mysz jest nadal zalecana do bardziej wymagających czynności, takich jak przeciąganie i upuszczanie.
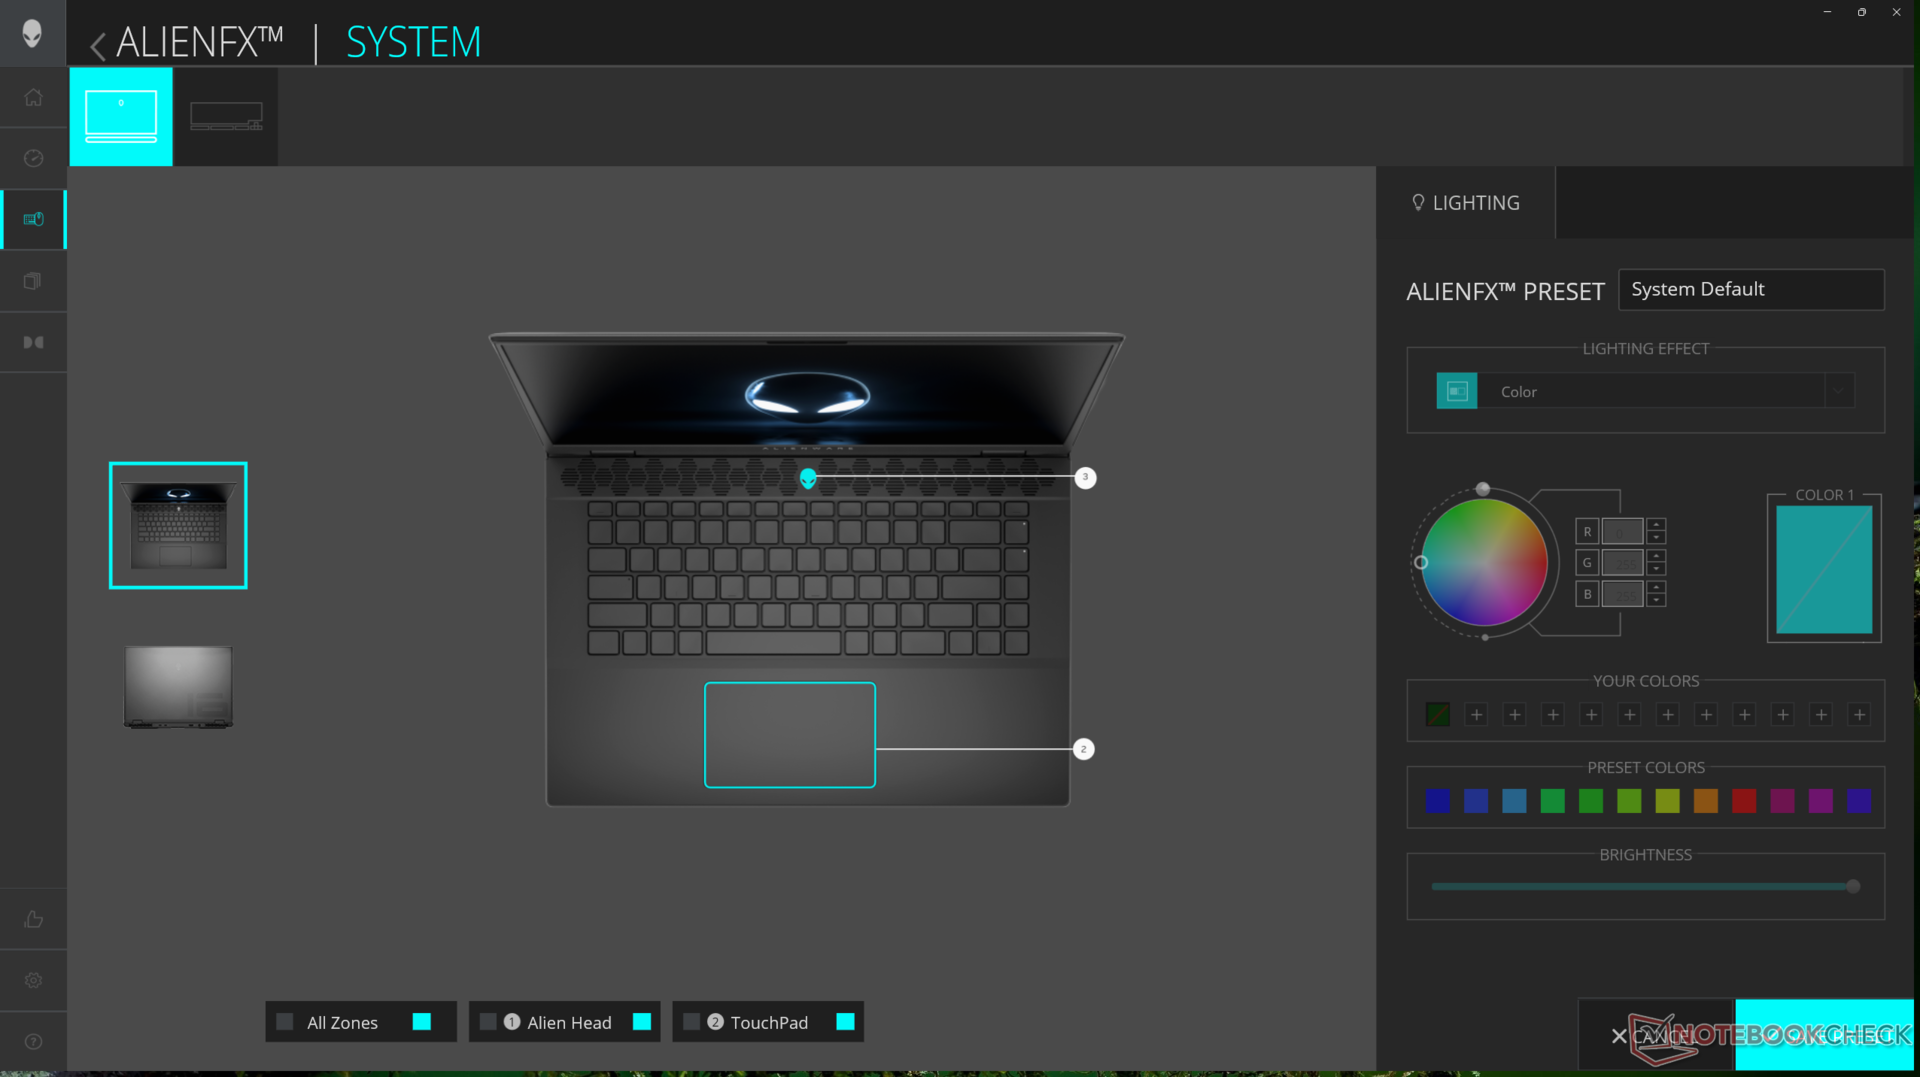
Irytujące jest to, że oświetlenie RGB można włączyć lub wyłączyć tylko za pośrednictwem Alienware Command Center, ponieważ nie ma klawisza skrótu do jego przełączania. Regulacja jasności klawiszy RGB nie ma wpływu na oświetlenie wokół klawiatury.


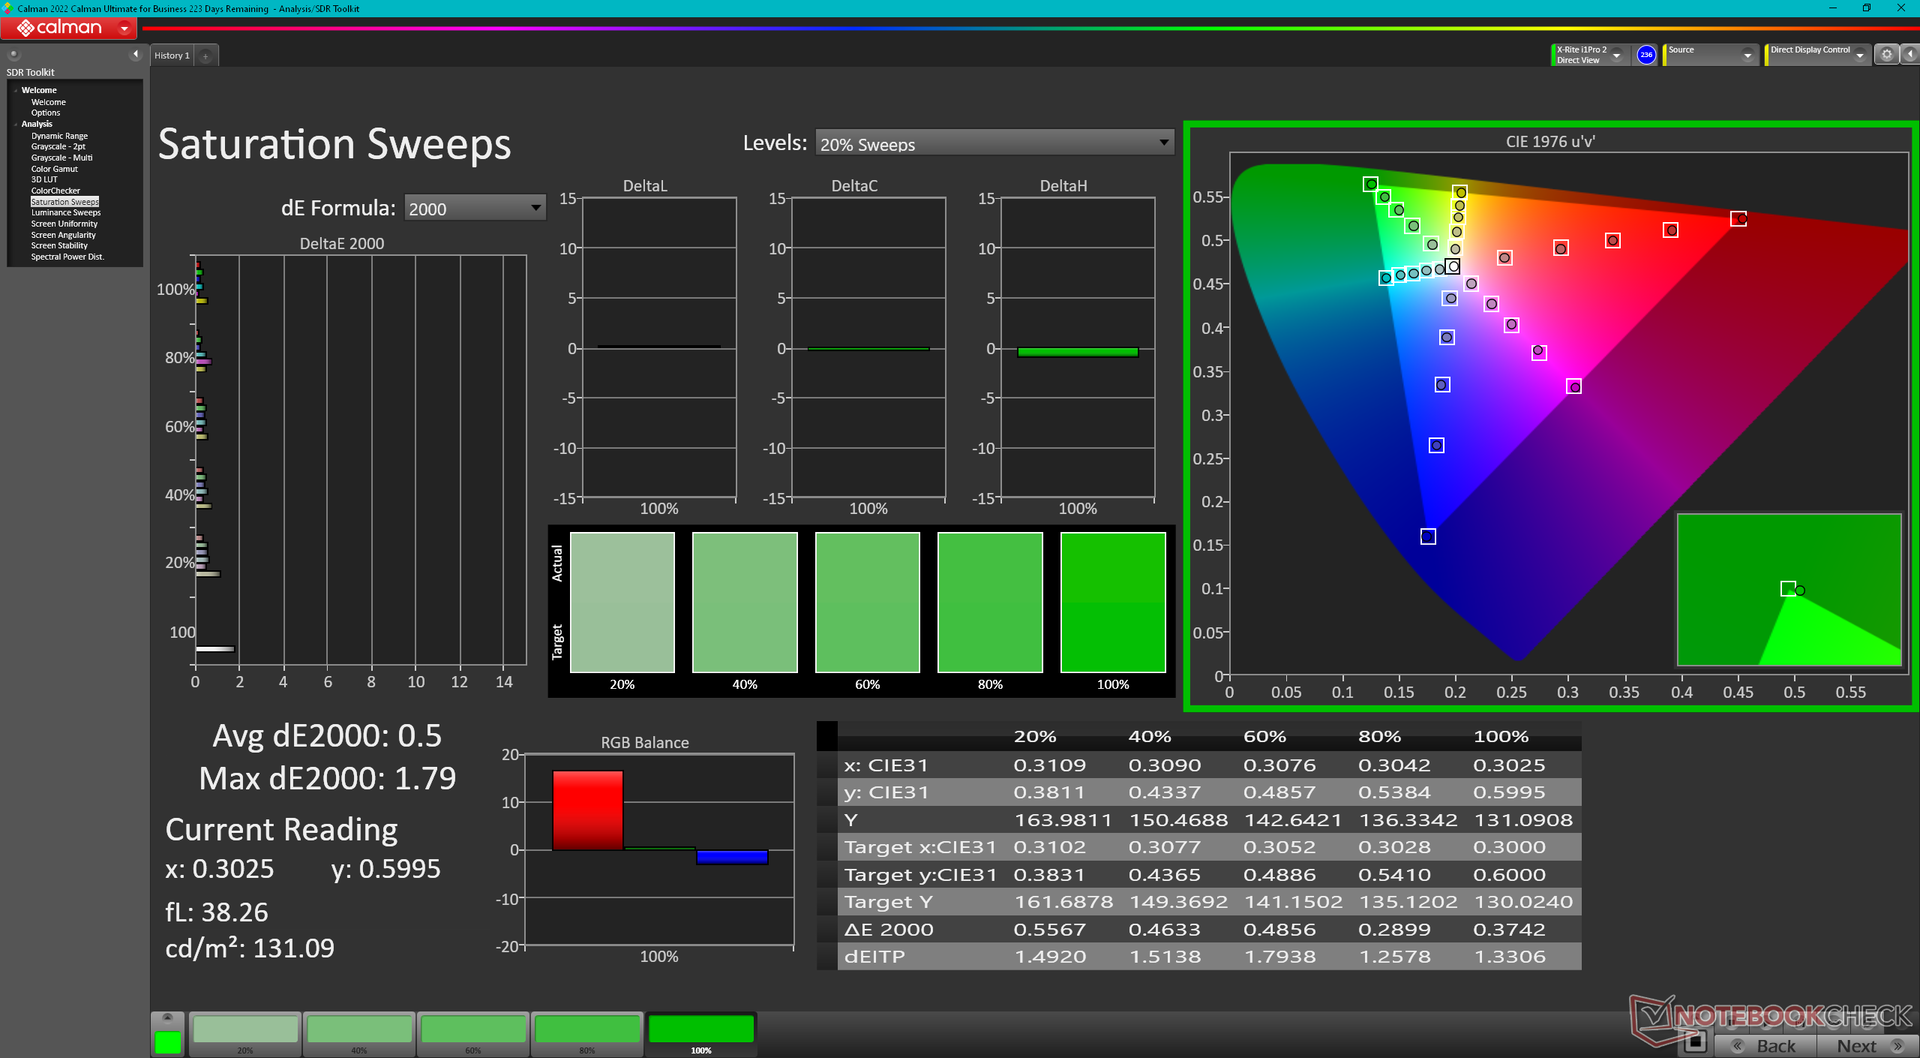
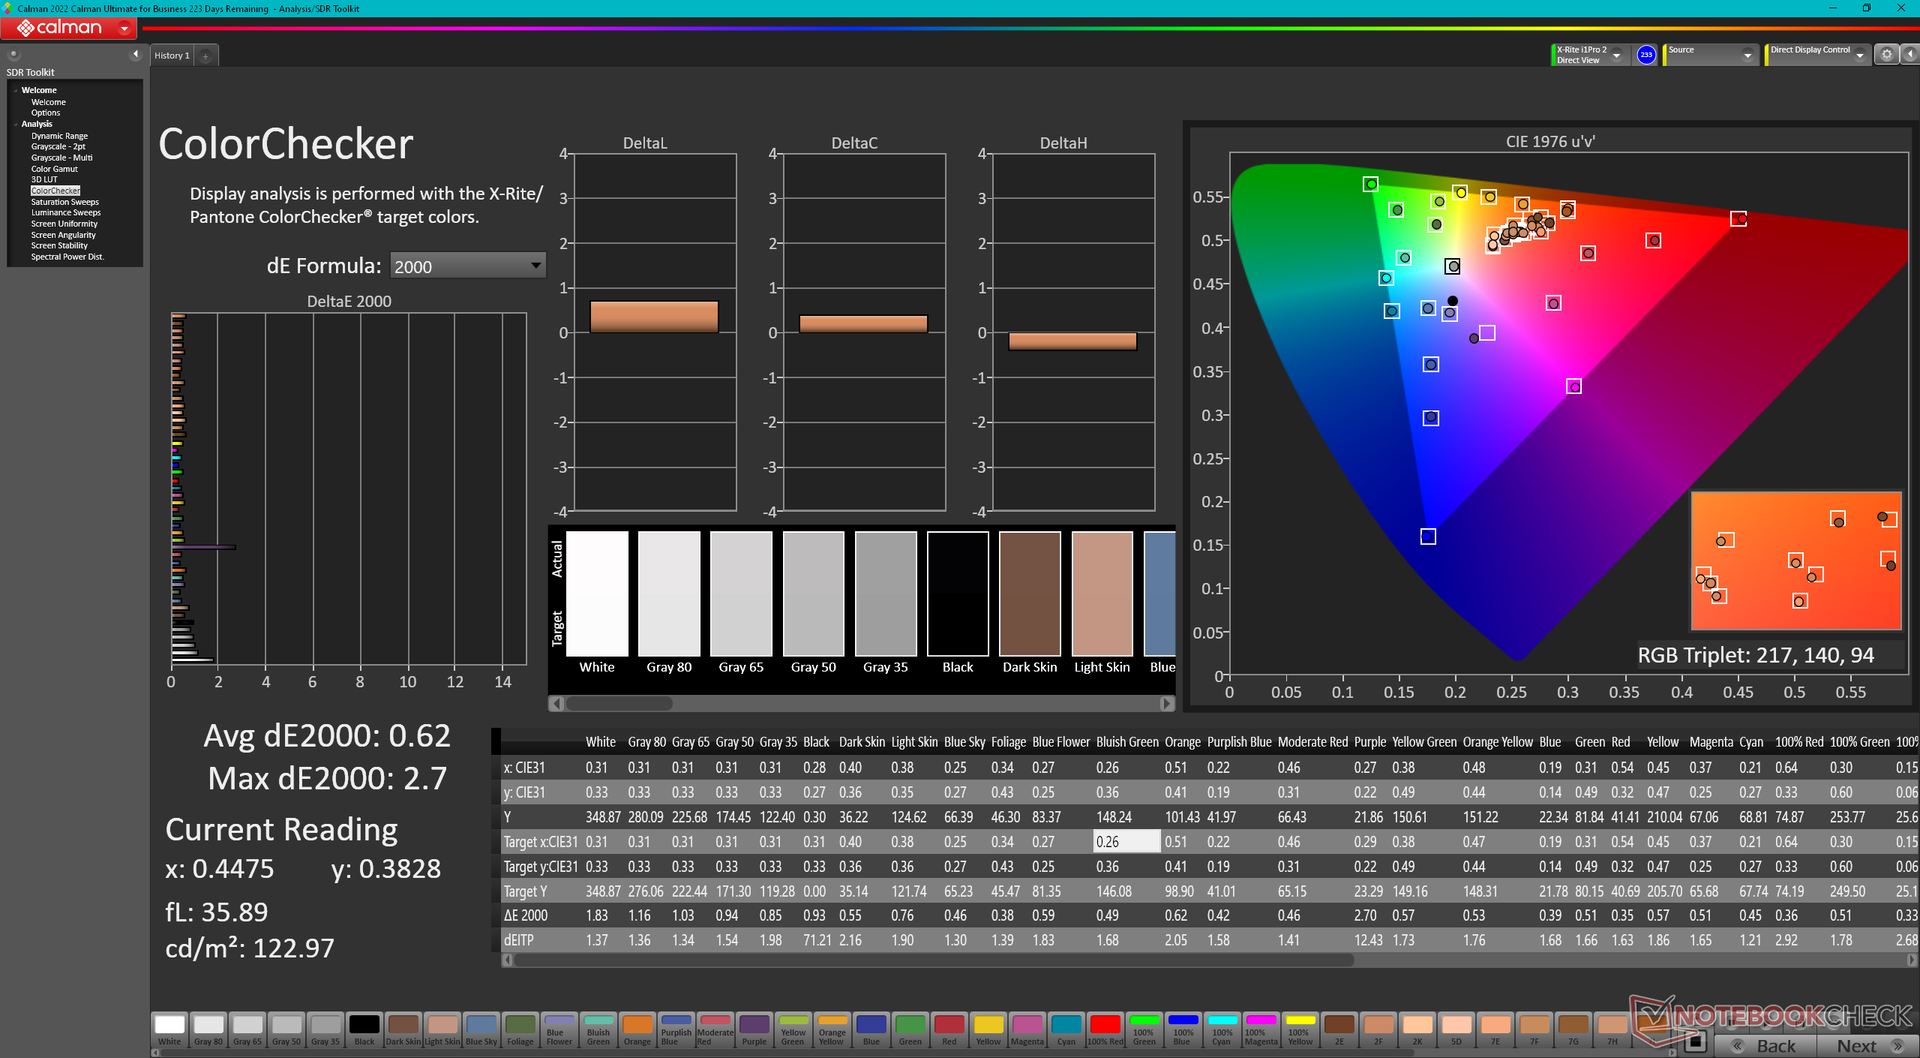
Wyświetlacz - 240 Hz i pełne sRGB teraz w standardzie
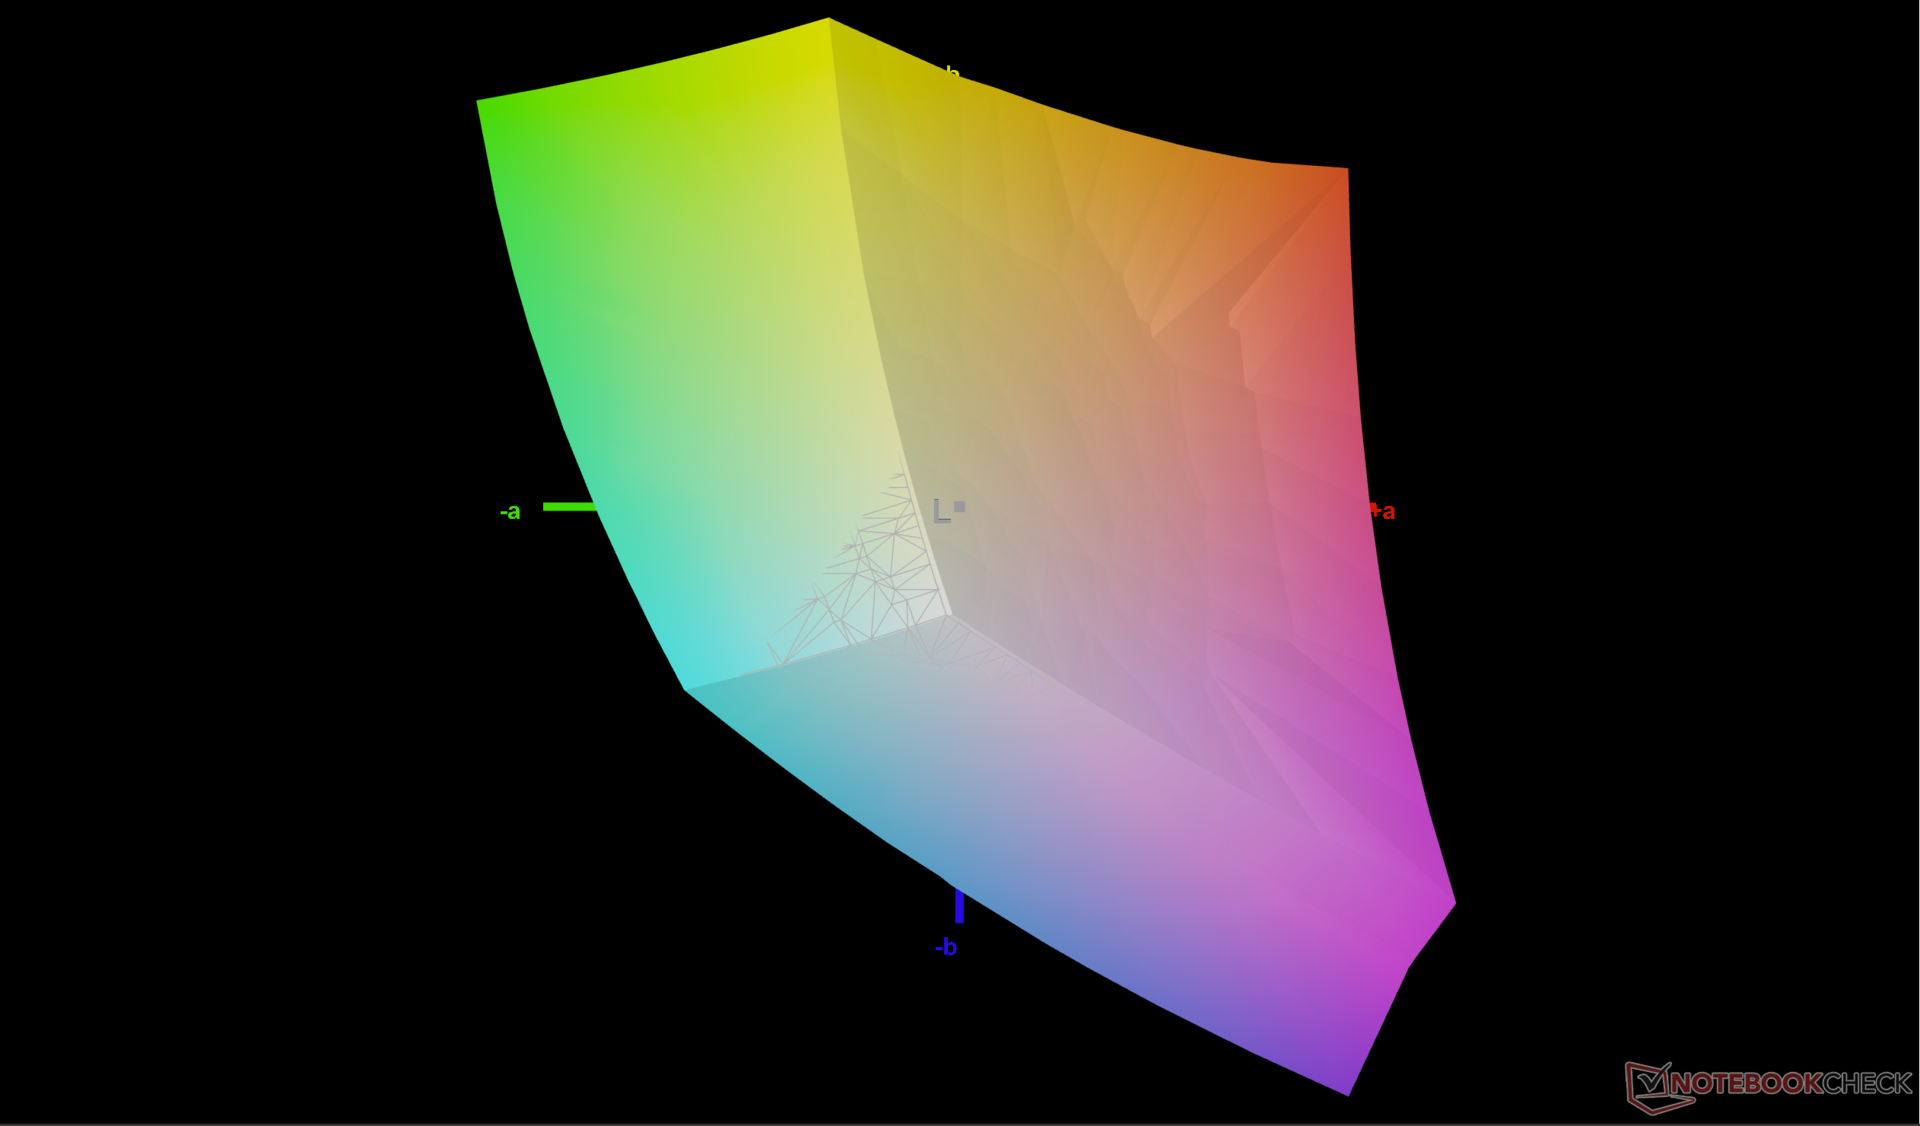
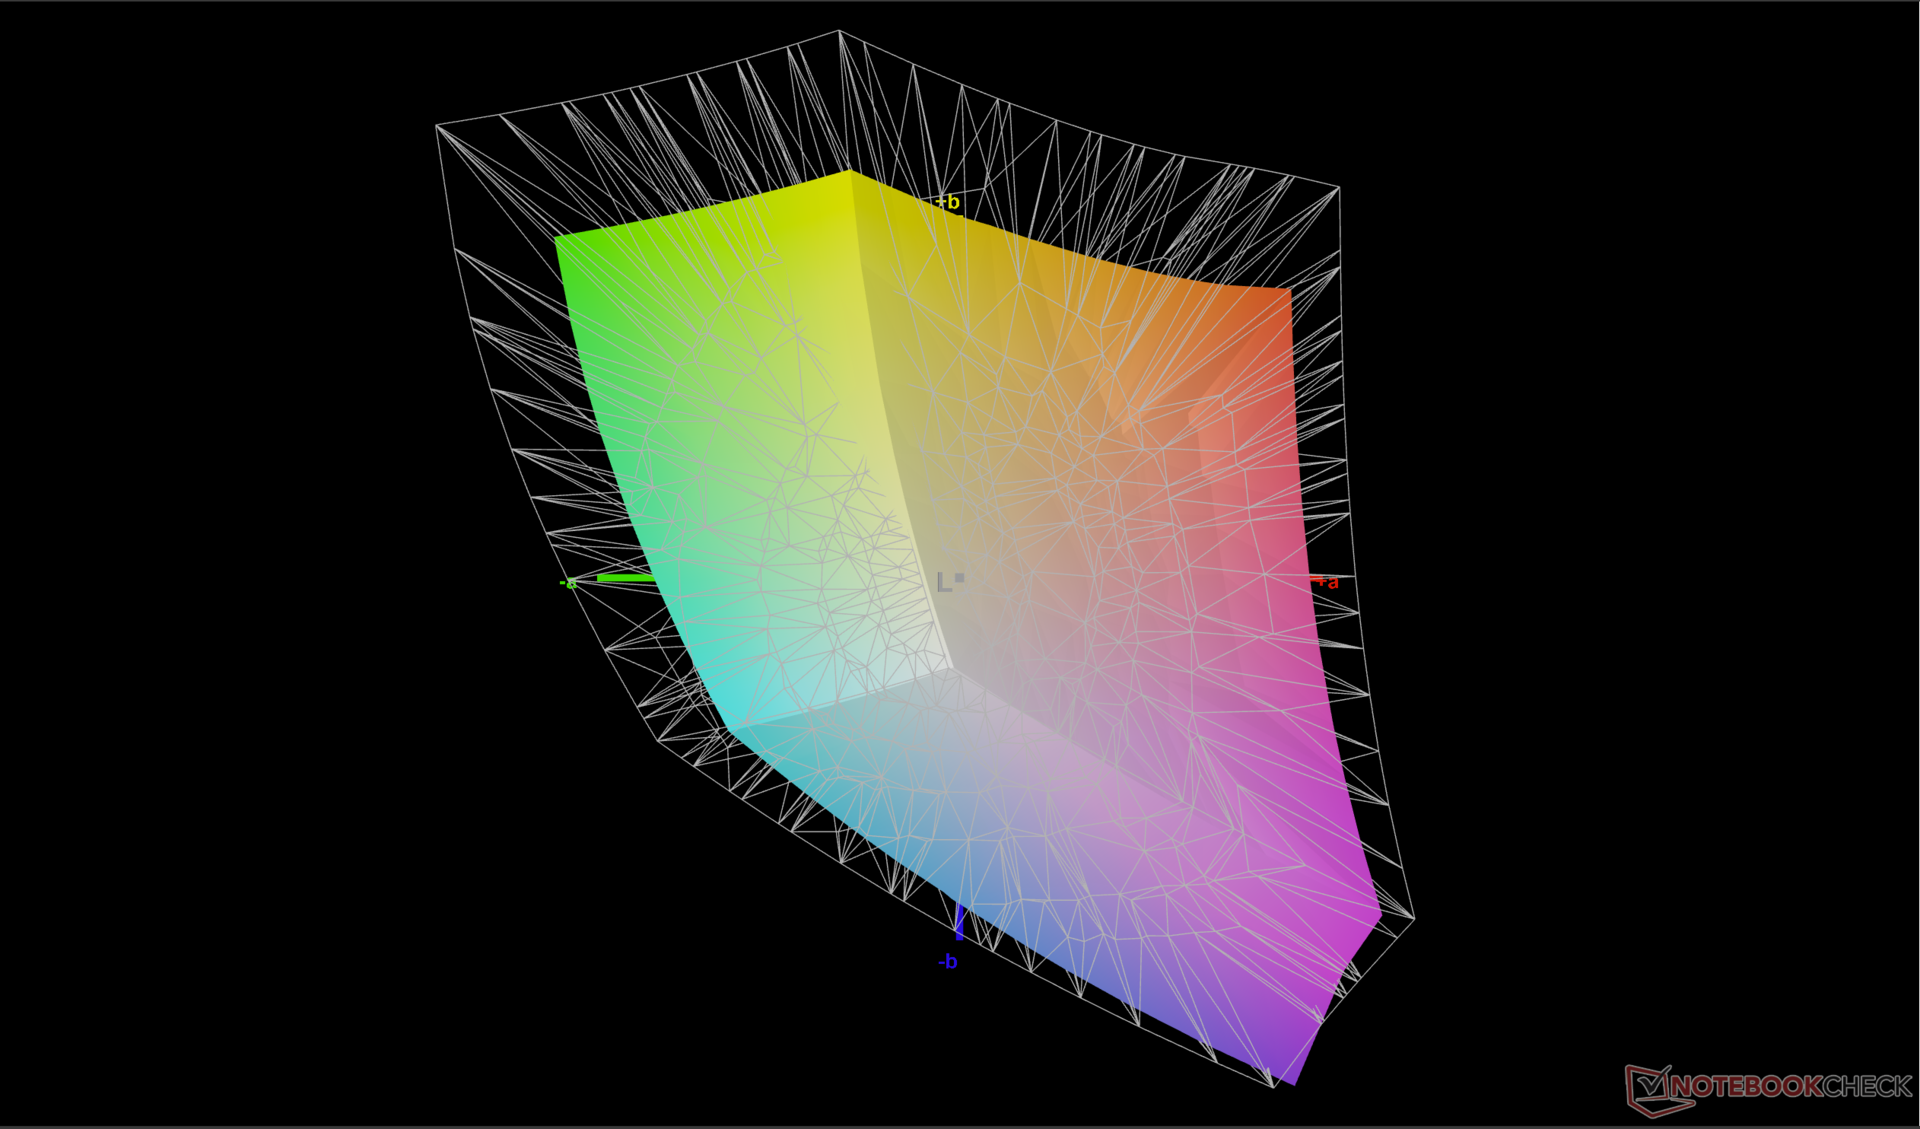
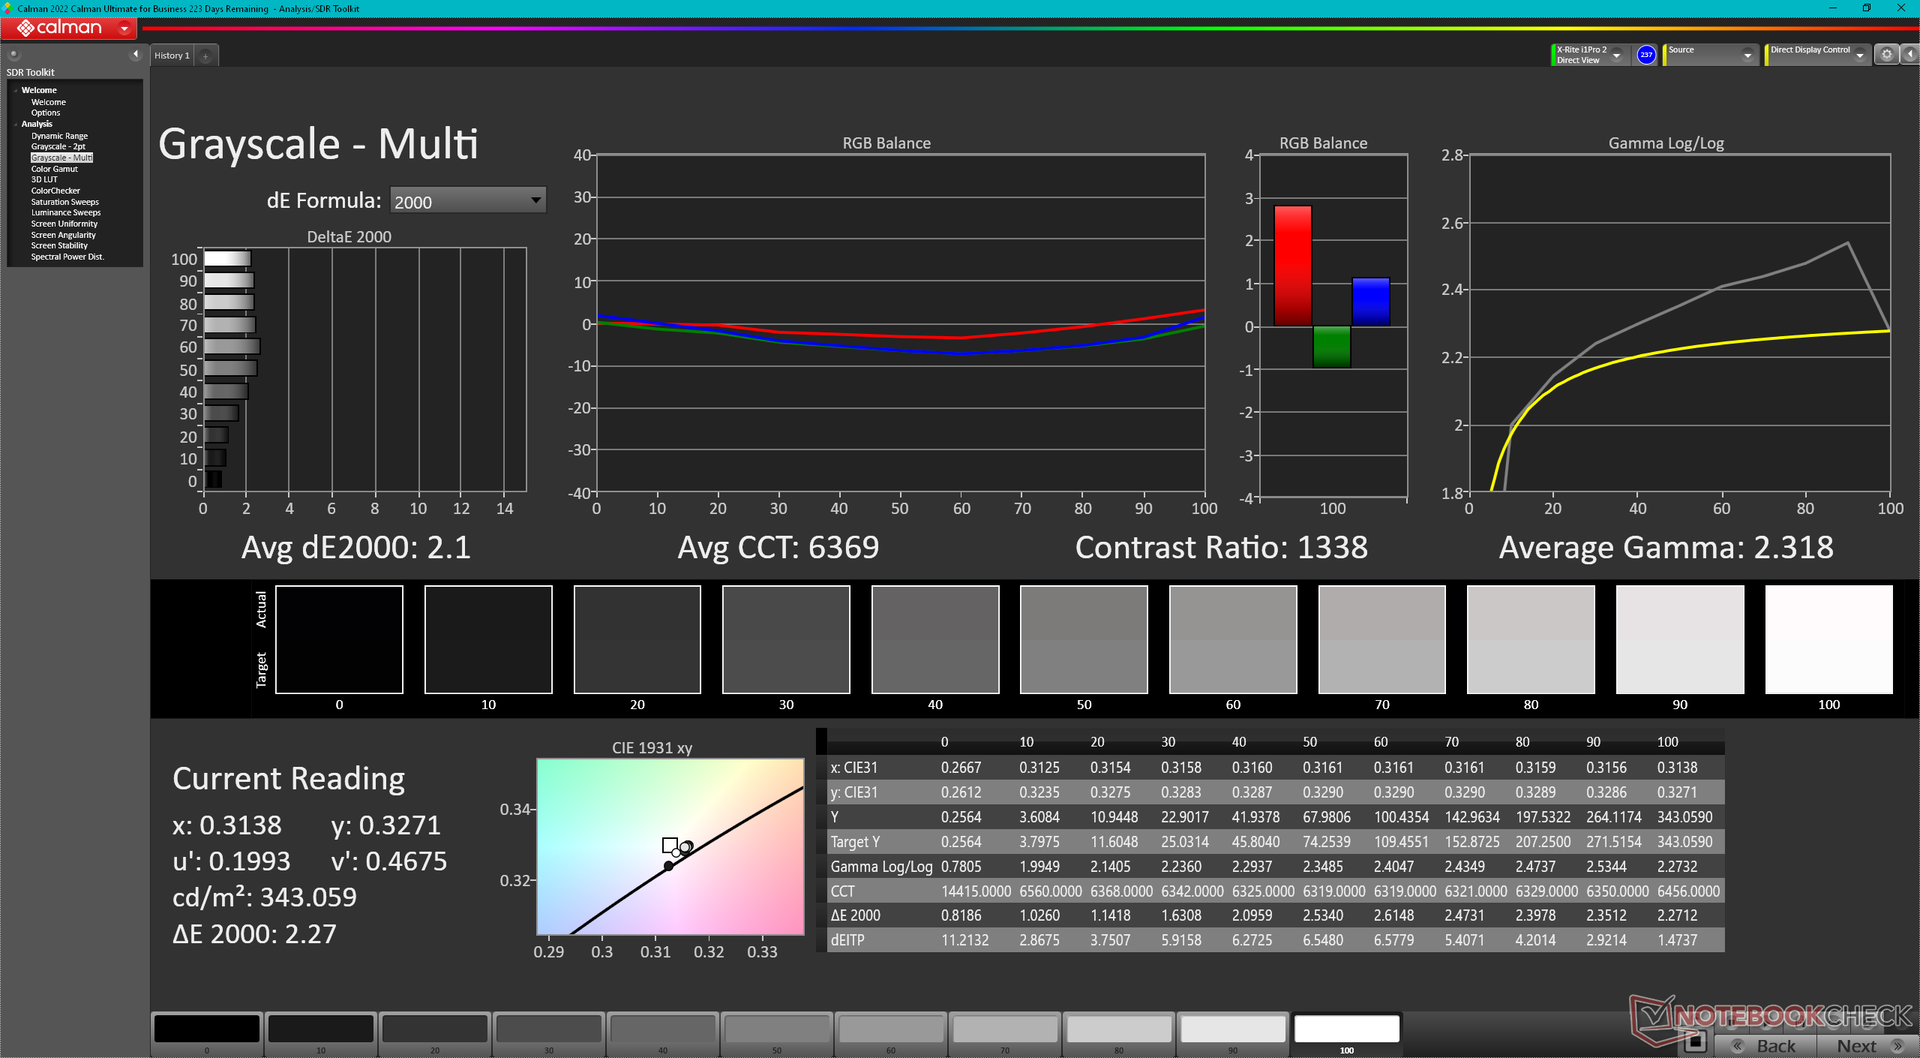
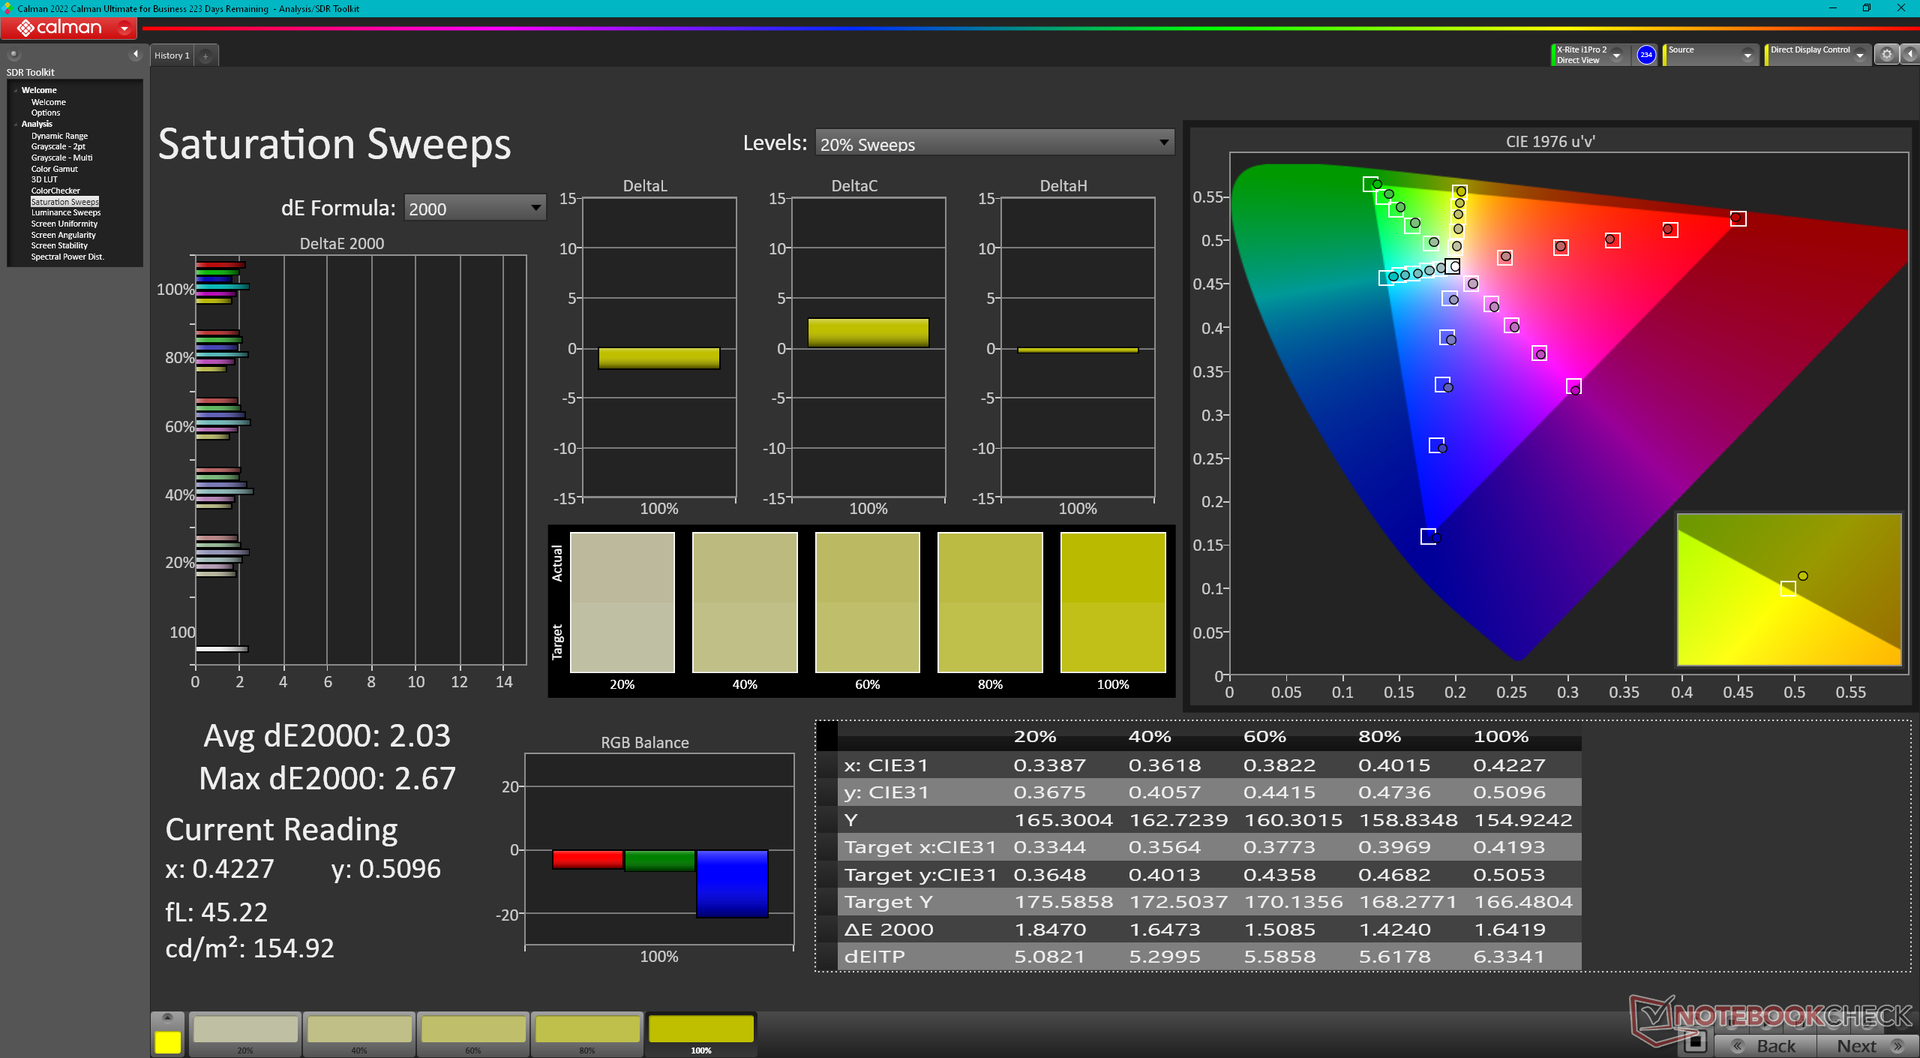
Model ten wykorzystuje panel BOE NE16NYH w przeciwieństwie do BOE NE16NYB w zeszłorocznym m16 R1. Nowszy panel ma szybszą natywną częstotliwość odświeżania (240 Hz w porównaniu do 165 Hz), podczas gdy wszystkie inne atrybuty pozostają zasadniczo takie same, w tym szybki czas reakcji czerni i bieli, współczynnik kontrastu ~1000:1, pełne pokrycie sRGB i maksymalna jasność od 300 do 350 nitów. Wyświetlacz nadaje się zarówno do gier, jak i amatorskiej edycji.
Choć nowy panel może być płynny, nadal brakuje mu kolorów DCI-P3 i zmiennej częstotliwości odświeżania systemu Windows. Pierwsza z nich spodobałaby się bardziej profesjonalnym edytorom grafiki, podczas gdy druga poprawiłaby żywotność baterii. Pełne kolory DCI-P3 są dostępne na x16 R1, HP Omen Transcend 16 i Asus ROG Zephyrus G16. HDR również nie jest obsługiwany, ponieważ wyświetlacz nie jest wystarczająco jasny, aby spełnić wymagania wstępne HDR400+.


| |||||||||||||||||||||||||
rozświetlenie: 87 %
na akumulatorze: 345.8 cd/m²
kontrast: 1153:1 (czerń: 0.3 cd/m²)
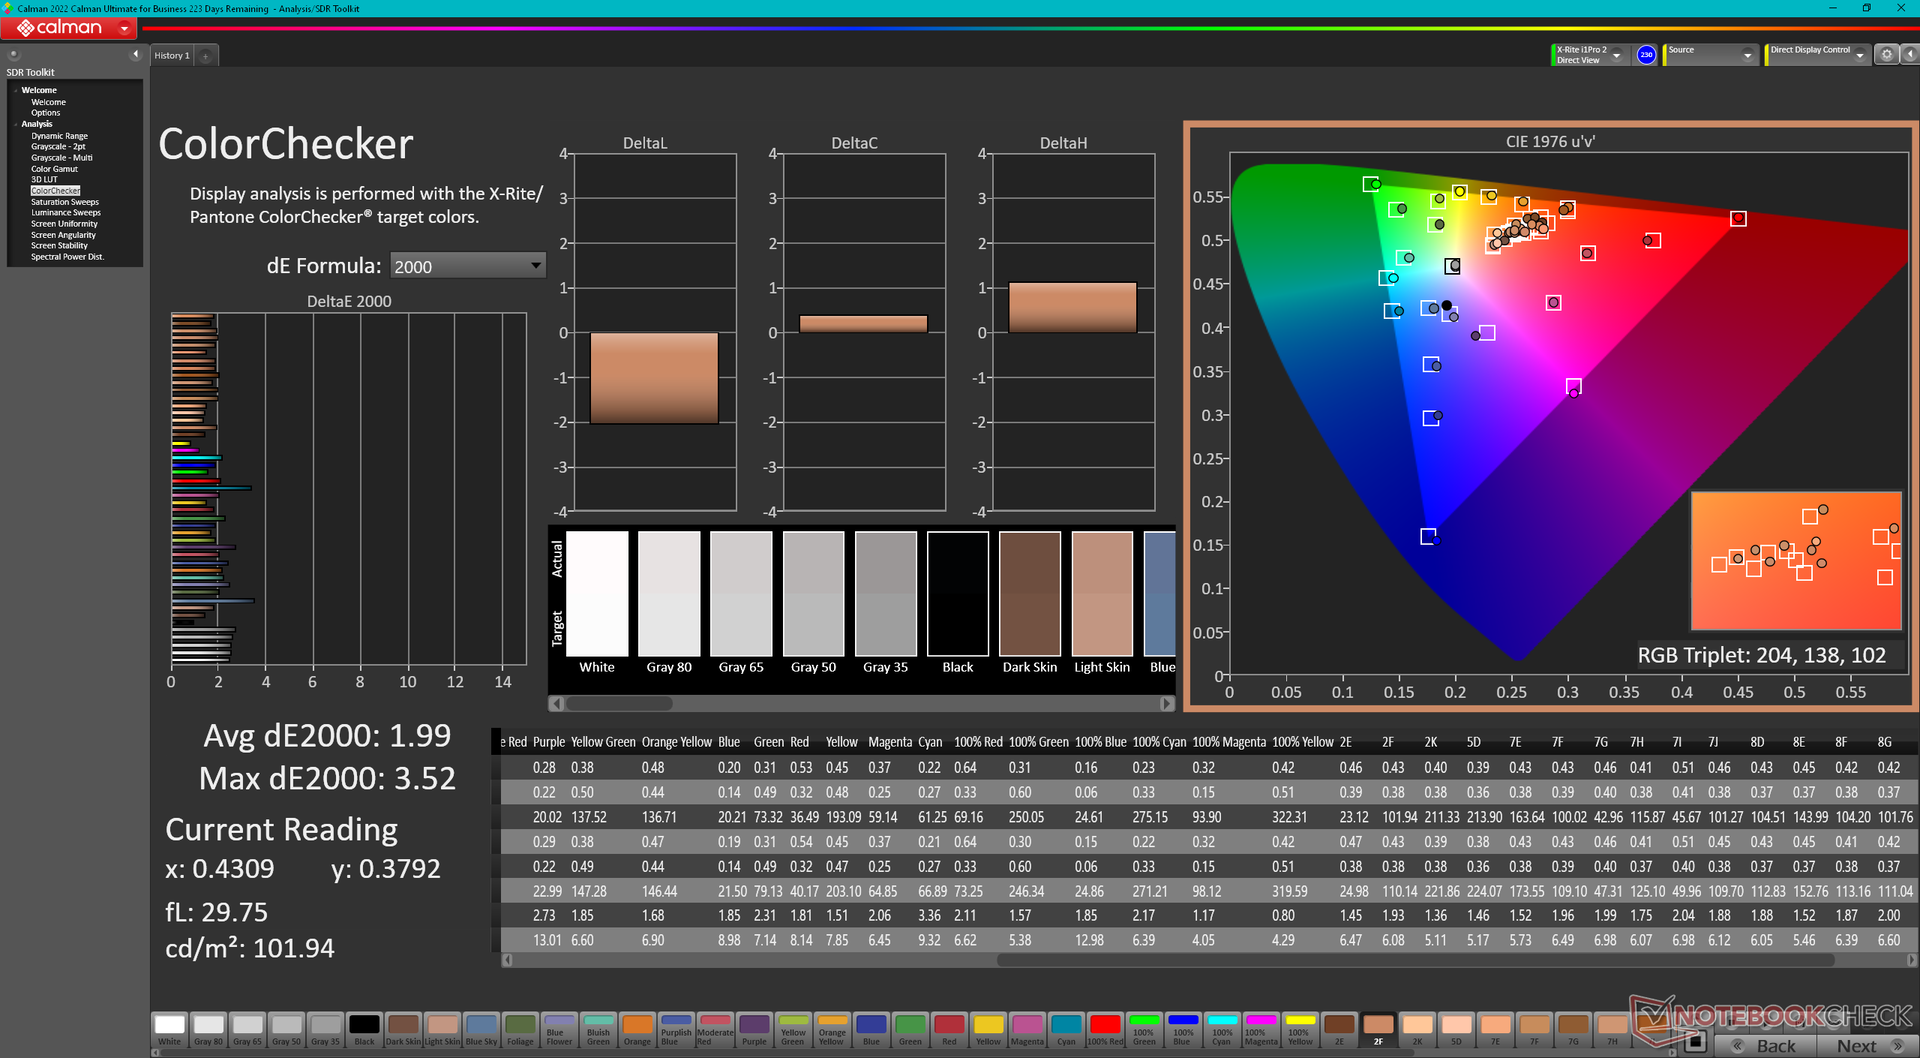
ΔE ColorChecker Calman: 1.99 | ∀{0.5-29.43 Ø4.72}
calibrated: 0.62
ΔE Greyscale Calman: 2.1 | ∀{0.09-98 Ø4.97}
71.4% AdobeRGB 1998 (Argyll 3D)
100% sRGB (Argyll 3D)
71% Display P3 (Argyll 3D)
Gamma: 2.32
CCT: 6369 K
| Alienware m16 R2 BOE NE16NYH, IPS, 2560x1600, 16" | Alienware m16 R1 Intel BOE NE16NYB, IPS, 2560x1600, 16" | Alienware x16 R1 BOE NE16NZ4, IPS, 2560x1600, 16" | HP Omen Transcend 16-u1095ng ATNA60DL02-0 (SDC41A4), OLED, 2560x1600, 16" | Asus ROG Zephyrus G16 2024 GU605M ATNA60DL01-0, OLED, 2560x1600, 16" | Lenovo Legion Slim 7 16APH8 BOE NE160QDM-NZ3, IPS, 2560x1600, 16" | |
|---|---|---|---|---|---|---|
| Display | -3% | 21% | 26% | 26% | 0% | |
| Display P3 Coverage (%) | 71 | 67.7 -5% | 99.2 40% | 99.8 41% | 99.9 41% | 70.3 -1% |
| sRGB Coverage (%) | 100 | 97.2 -3% | 100 0% | 100 0% | 100 0% | 99.6 0% |
| AdobeRGB 1998 Coverage (%) | 71.4 | 70 -2% | 88.6 24% | 97 36% | 96.9 36% | 72.4 1% |
| Response Times | 23% | -4% | 97% | 97% | -45% | |
| Response Time Grey 50% / Grey 80% * (ms) | 5.7 ? | 4 ? 30% | 5.1 ? 11% | 0.2 ? 96% | 0.22 ? 96% | 12.6 ? -121% |
| Response Time Black / White * (ms) | 8.7 ? | 7.3 ? 16% | 10.3 ? -18% | 0.2 ? 98% | 0.25 ? 97% | 5.9 ? 32% |
| PWM Frequency (Hz) | 120 ? | 960 ? | ||||
| Screen | -20% | -13% | 129% | 14% | 5% | |
| Brightness middle (cd/m²) | 345.8 | 306 -12% | 302.2 -13% | 390 13% | 416 20% | 545 58% |
| Brightness (cd/m²) | 337 | 302 -10% | 285 -15% | 392 16% | 418 24% | 502 49% |
| Brightness Distribution (%) | 87 | 89 2% | 89 2% | 98 13% | 96 10% | 82 -6% |
| Black Level * (cd/m²) | 0.3 | 0.3 -0% | 0.26 13% | 0.02 93% | 0.48 -60% | |
| Contrast (:1) | 1153 | 1020 -12% | 1162 1% | 19500 1591% | 1135 -2% | |
| Colorchecker dE 2000 * | 1.99 | 2.57 -29% | 1.63 18% | 1.94 3% | 1.6 20% | 1.36 32% |
| Colorchecker dE 2000 max. * | 3.52 | 4.26 -21% | 4.13 -17% | 4.26 -21% | 2.1 40% | 3.11 12% |
| Colorchecker dE 2000 calibrated * | 0.62 | 0.85 -37% | 1.17 -89% | 4.21 -579% | 1.04 -68% | |
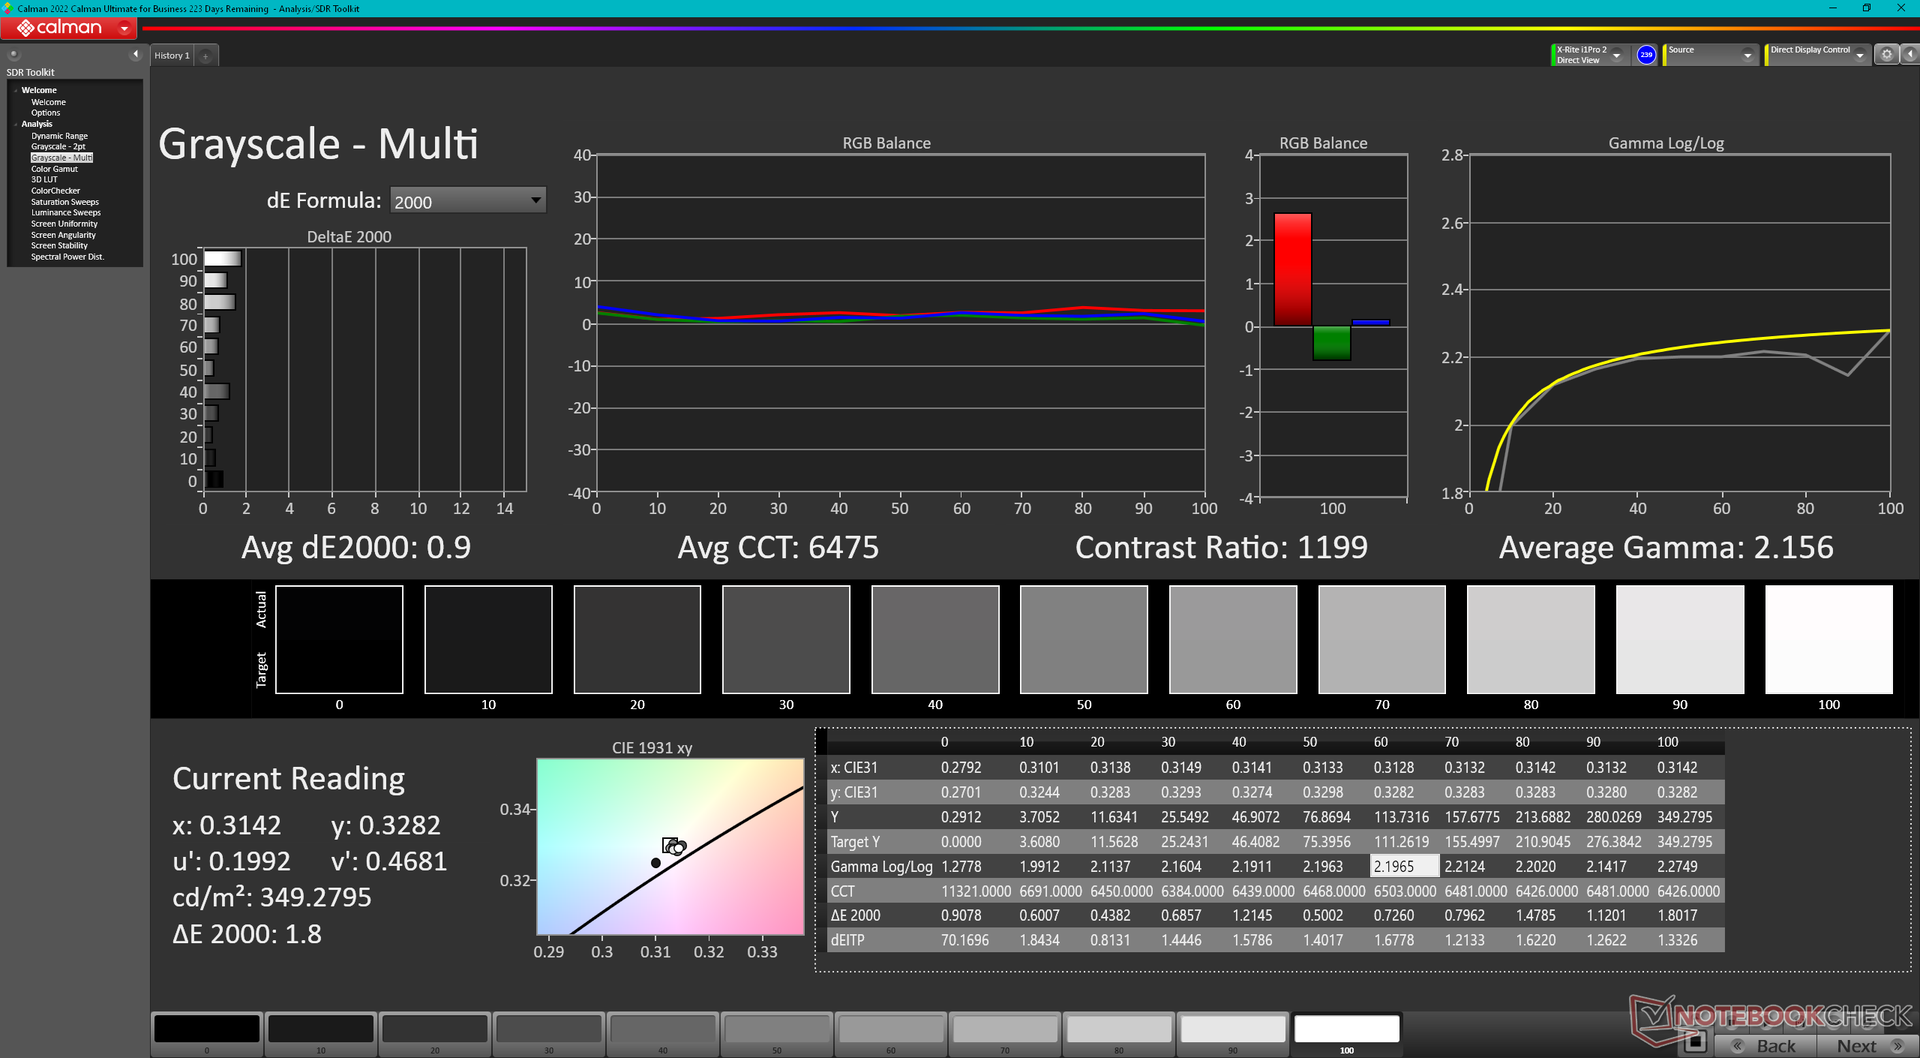
| Greyscale dE 2000 * | 2.1 | 3.3 -57% | 2.5 -19% | 1.5 29% | 2.7 -29% | 1.4 33% |
| Gamma | 2.32 95% | 1.997 110% | 2.23 99% | 2.221 99% | 2.16 102% | 2.253 98% |
| CCT | 6369 102% | 6895 94% | 6590 99% | 6395 102% | 6331 103% | 6631 98% |
| Całkowita średnia (program / ustawienia) | 0% /
-10% | 1% /
-4% | 84% /
102% | 46% /
32% | -13% /
-3% |
* ... im mniej tym lepiej
Wyświetlacz jest dobrze skalibrowany po wyjęciu z pudełka, a średnie wartości deltaE dla skali szarości i kolorów wynoszą odpowiednio 2,1 i 1,99. Wyniki poprawiłyby się jeszcze bardziej do <1 każdy po dalszej kalibracji za pomocą naszego kolorymetru X-Rite, ale nie powinno to być konieczne dla większości użytkowników. Nasz skalibrowany profil ICM można pobrać bezpłatnie powyżej.
Wyświetl czasy reakcji
| ↔ Czas reakcji od czerni do bieli | ||
|---|---|---|
| 8.7 ms ... wzrost ↗ i spadek ↘ łącznie | ↗ 4.6 ms wzrost | 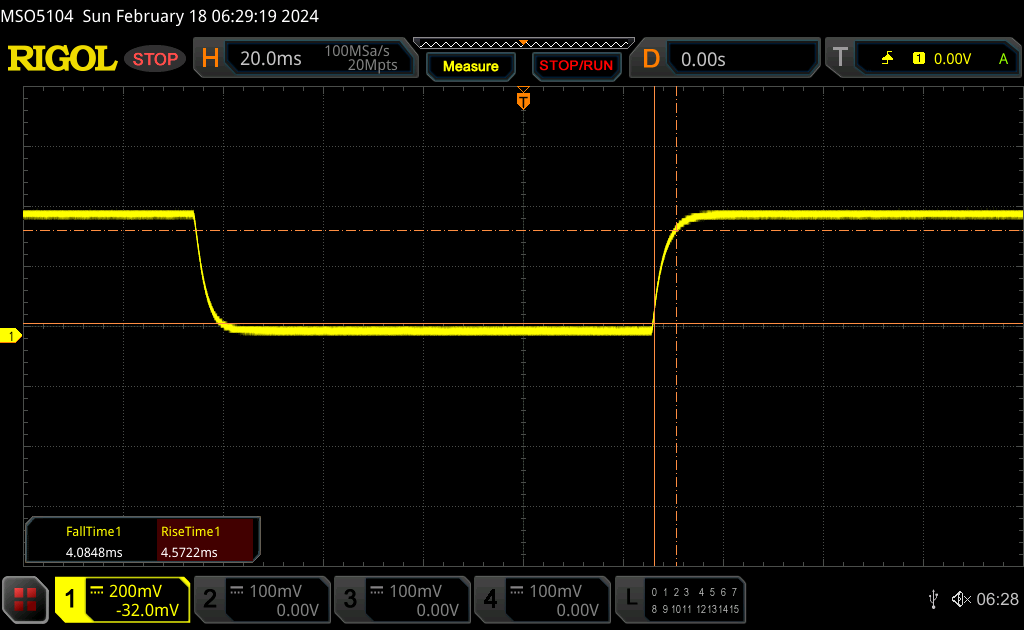 |
| ↘ 4.1 ms upadek | ||
| W naszych testach ekran wykazuje szybki czas reakcji i powinien nadawać się do gier. Dla porównania, wszystkie testowane urządzenia wahają się od 0.1 (minimum) do 240 (maksimum) ms. » 24 % wszystkich urządzeń jest lepszych. Oznacza to, że zmierzony czas reakcji jest lepszy od średniej wszystkich testowanych urządzeń (19.8 ms). | ||
| ↔ Czas reakcji 50% szarości do 80% szarości | ||
| 5.7 ms ... wzrost ↗ i spadek ↘ łącznie | ↗ 2.6 ms wzrost | 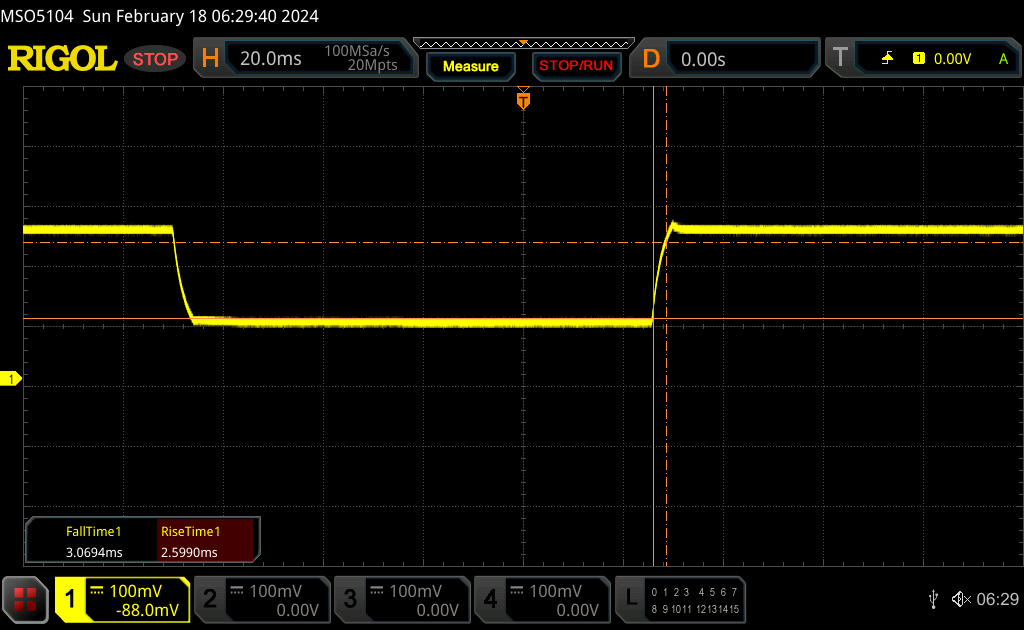 |
| ↘ 3.1 ms upadek | ||
| W naszych testach ekran wykazuje bardzo szybką reakcję i powinien bardzo dobrze nadawać się do szybkich gier. Dla porównania, wszystkie testowane urządzenia wahają się od 0.165 (minimum) do 636 (maksimum) ms. » 18 % wszystkich urządzeń jest lepszych. Oznacza to, że zmierzony czas reakcji jest lepszy od średniej wszystkich testowanych urządzeń (31 ms). | ||
Migotanie ekranu / PWM (modulacja szerokości impulsu)
| Migotanie ekranu/nie wykryto PWM |  | ||
Dla porównania: 52 % wszystkich testowanych urządzeń nie używa PWM do przyciemniania wyświetlacza. Jeśli wykryto PWM, zmierzono średnio 7747 (minimum: 5 - maksimum: 343500) Hz. | |||
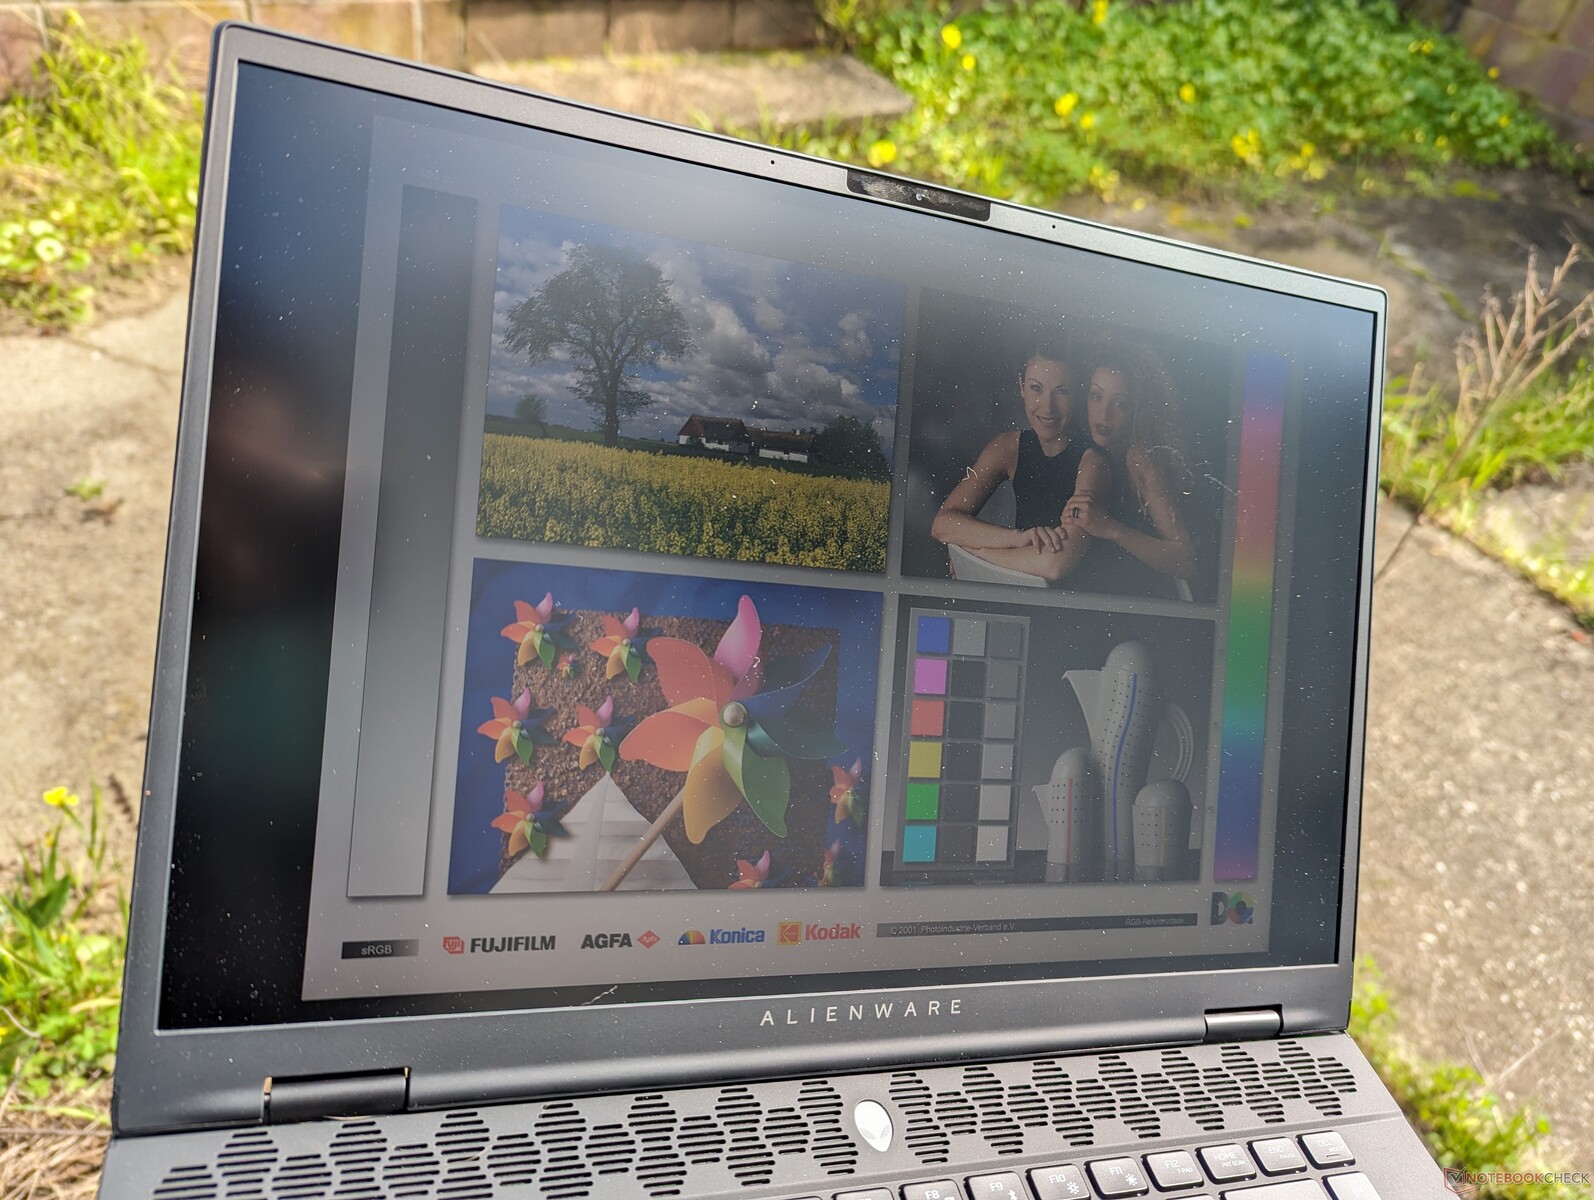
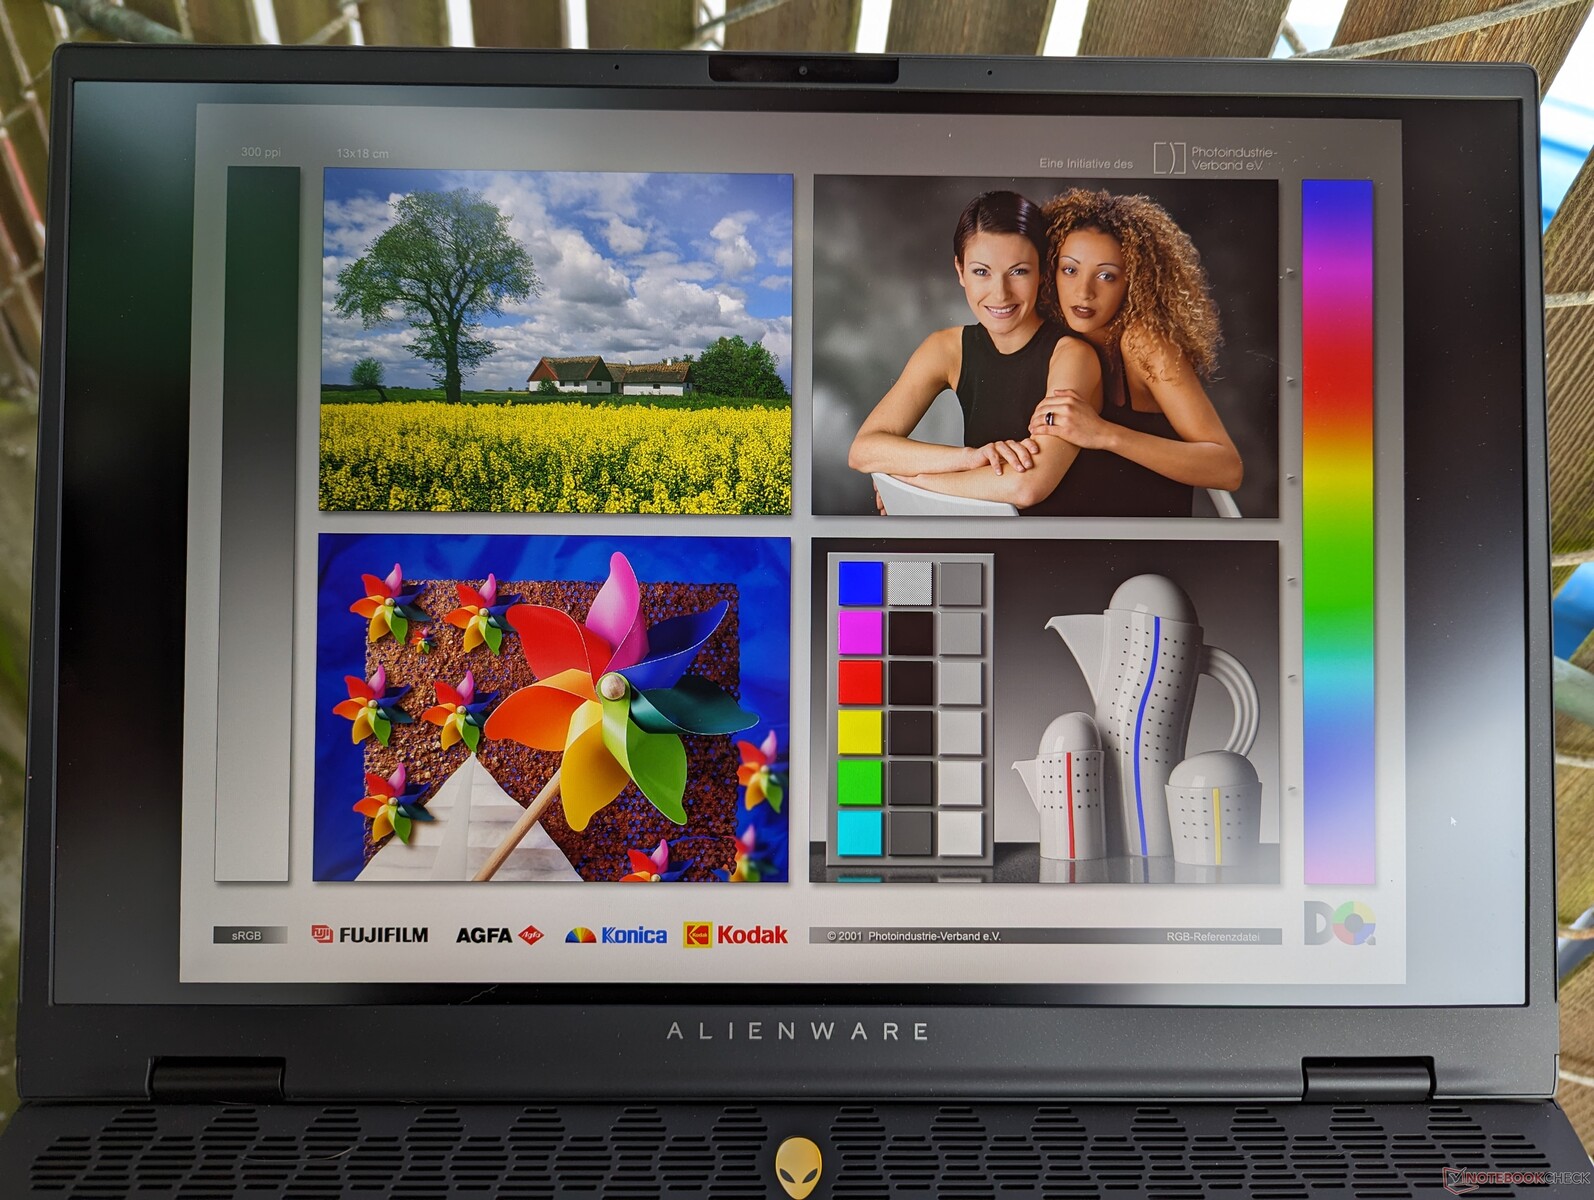
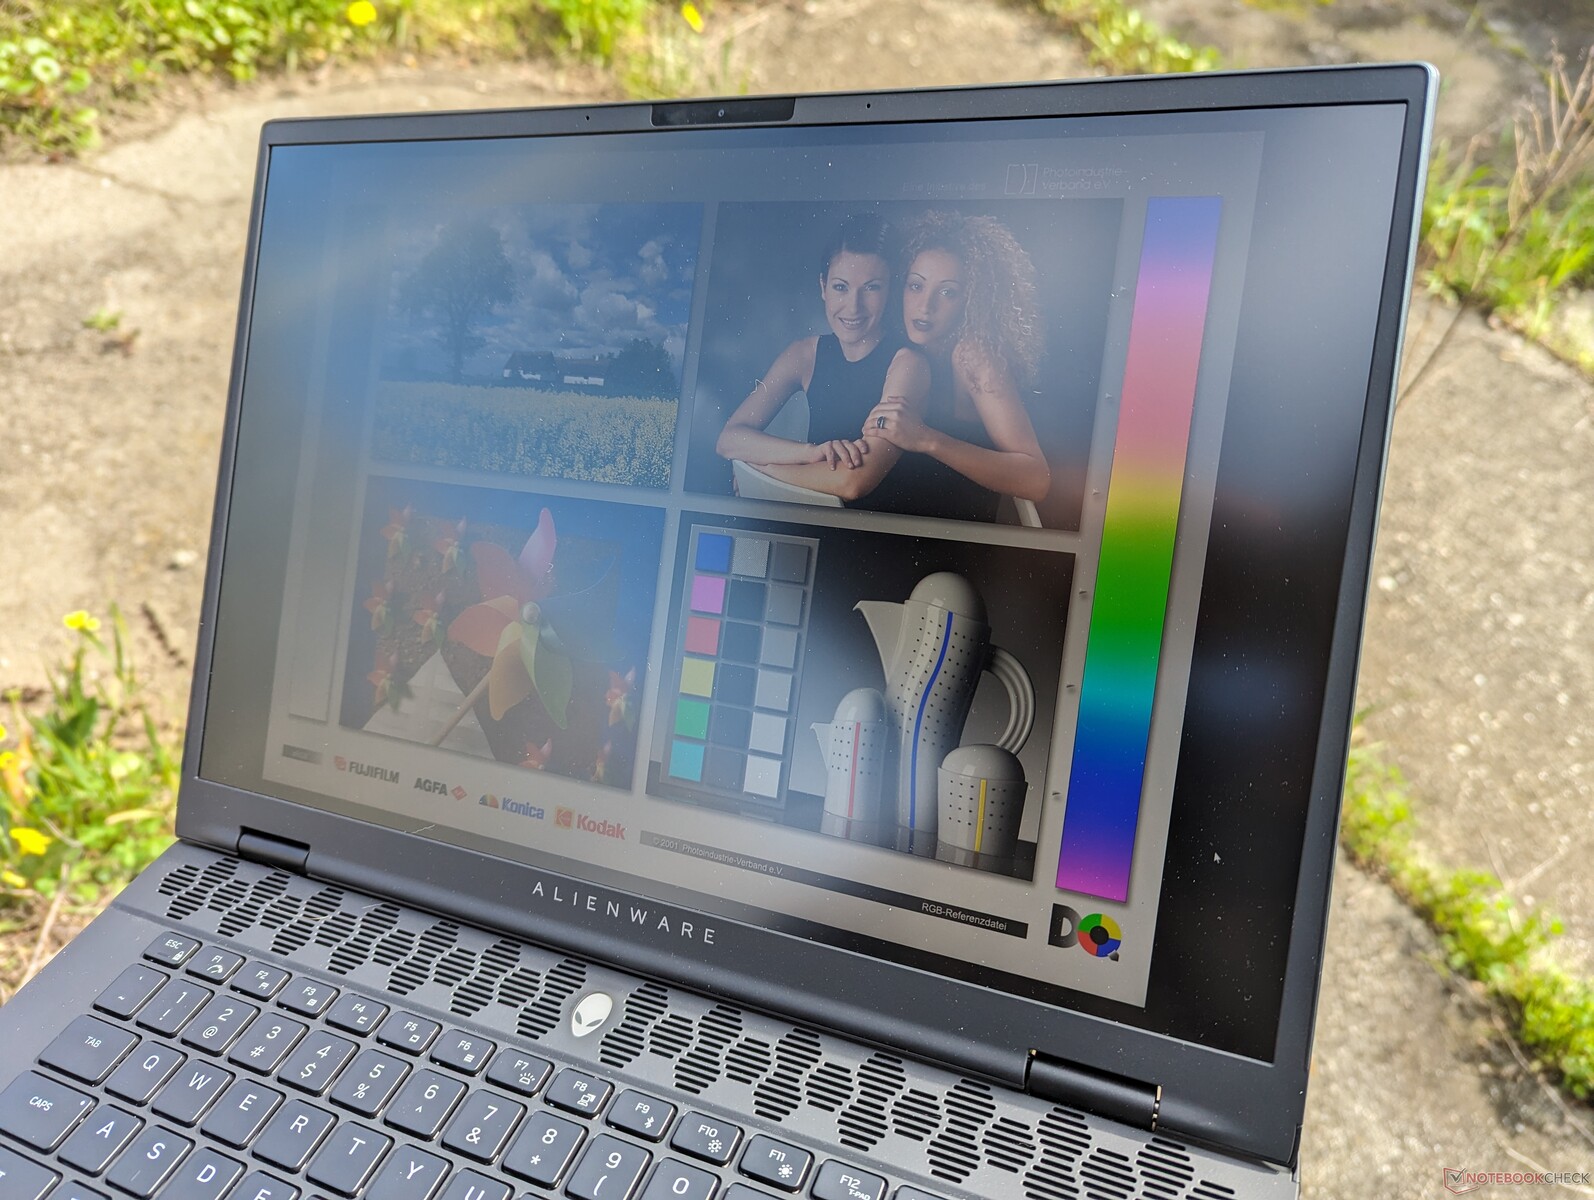
Widoczność na zewnątrz pozostaje mniej więcej taka sama jak wcześniej, dlatego zaleca się pozostawanie w cieniu, gdy tylko jest to możliwe, aby zmniejszyć odblaski i zachować kolory. Lżejsza waga i mniejszy rozmiar sprawiają jednak, że system jest łatwiejszy w obsłudze.

Wydajność - od Raptor Lake-HX do Meteor Lake-H

Warunki testowania
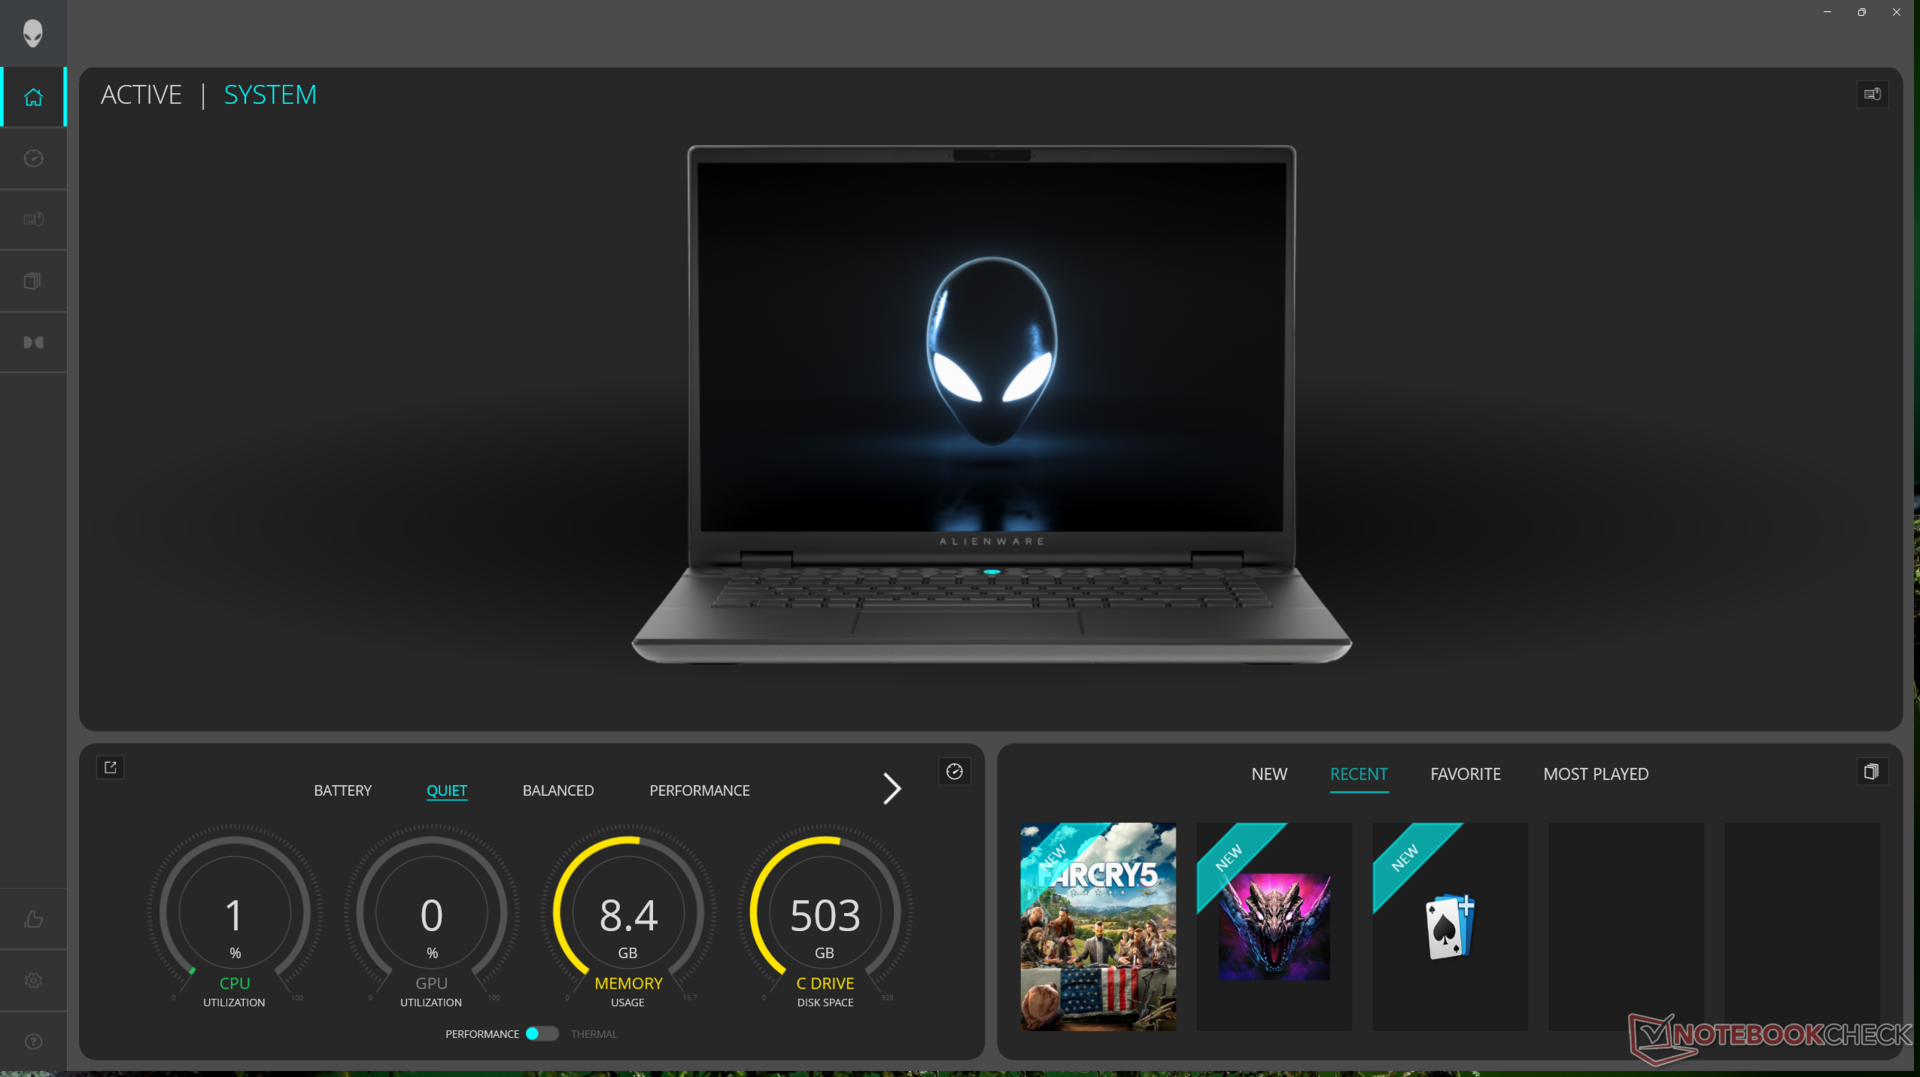
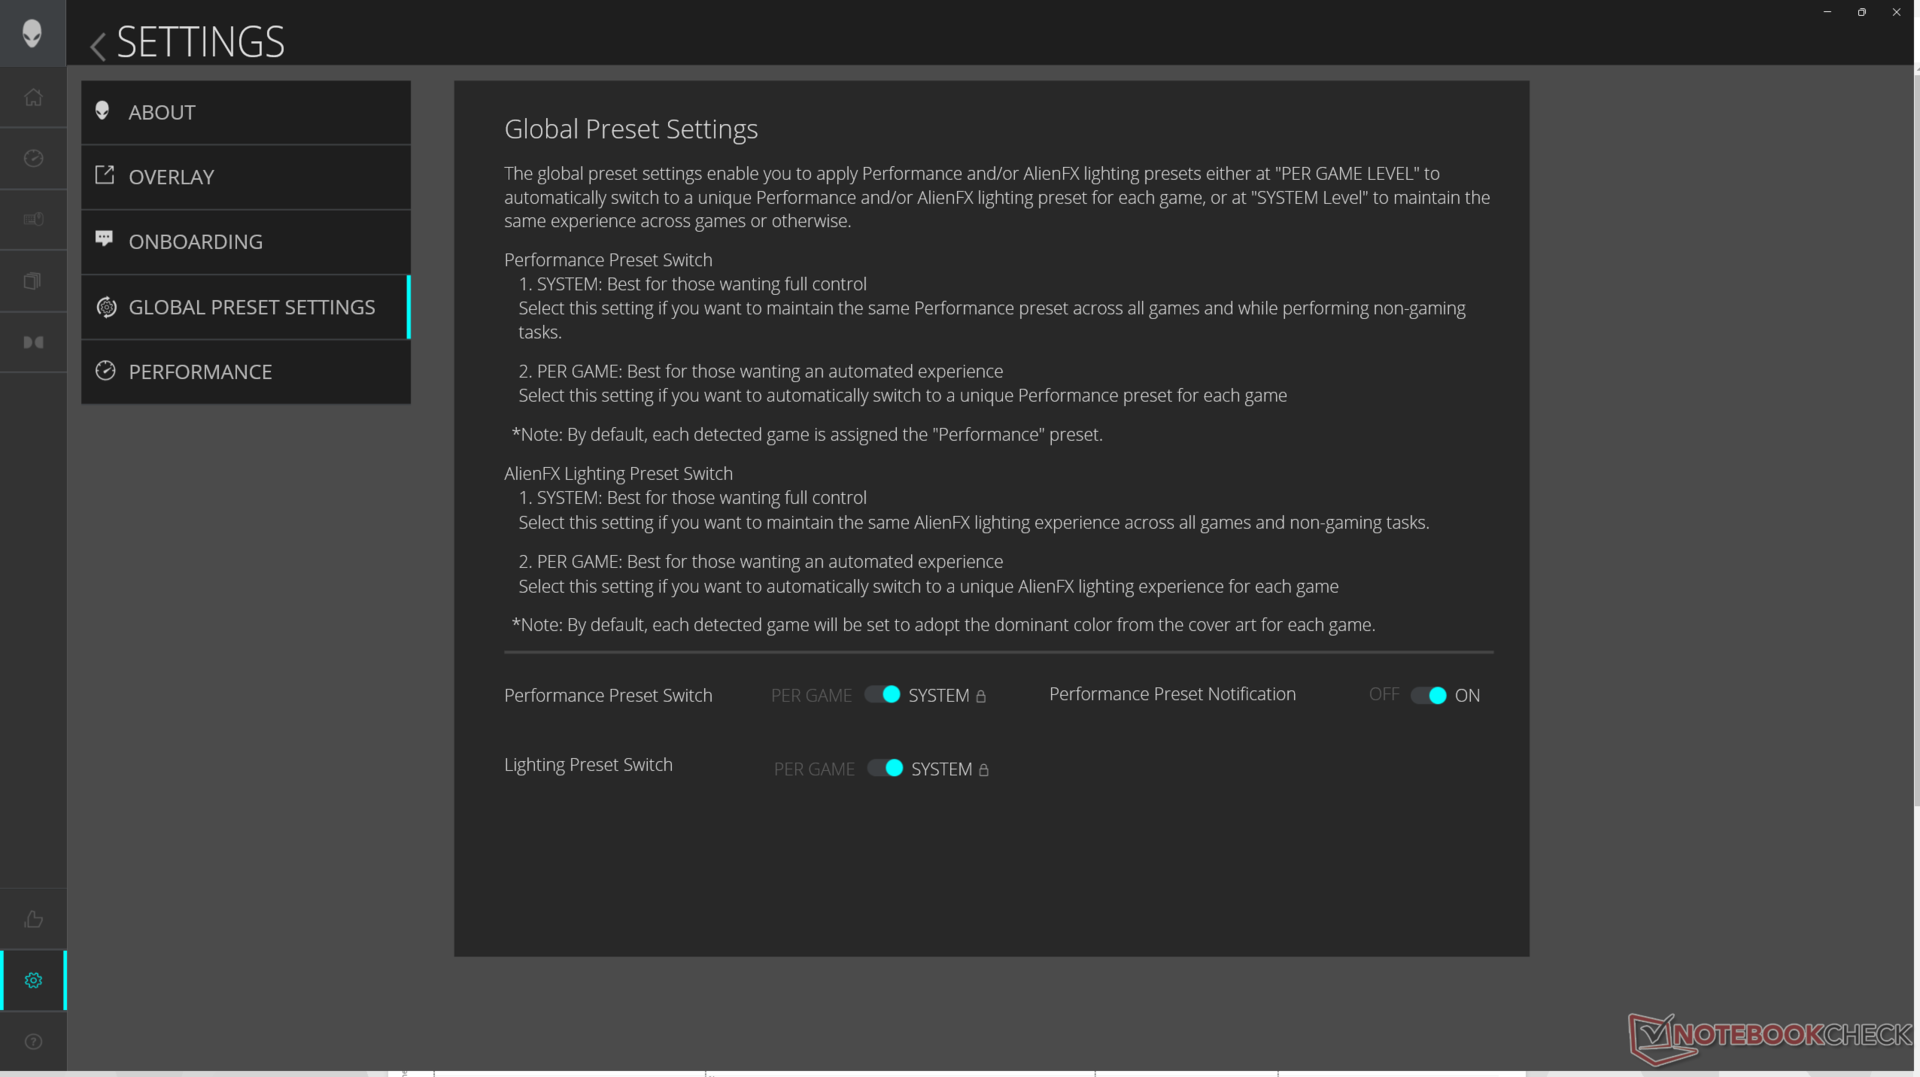
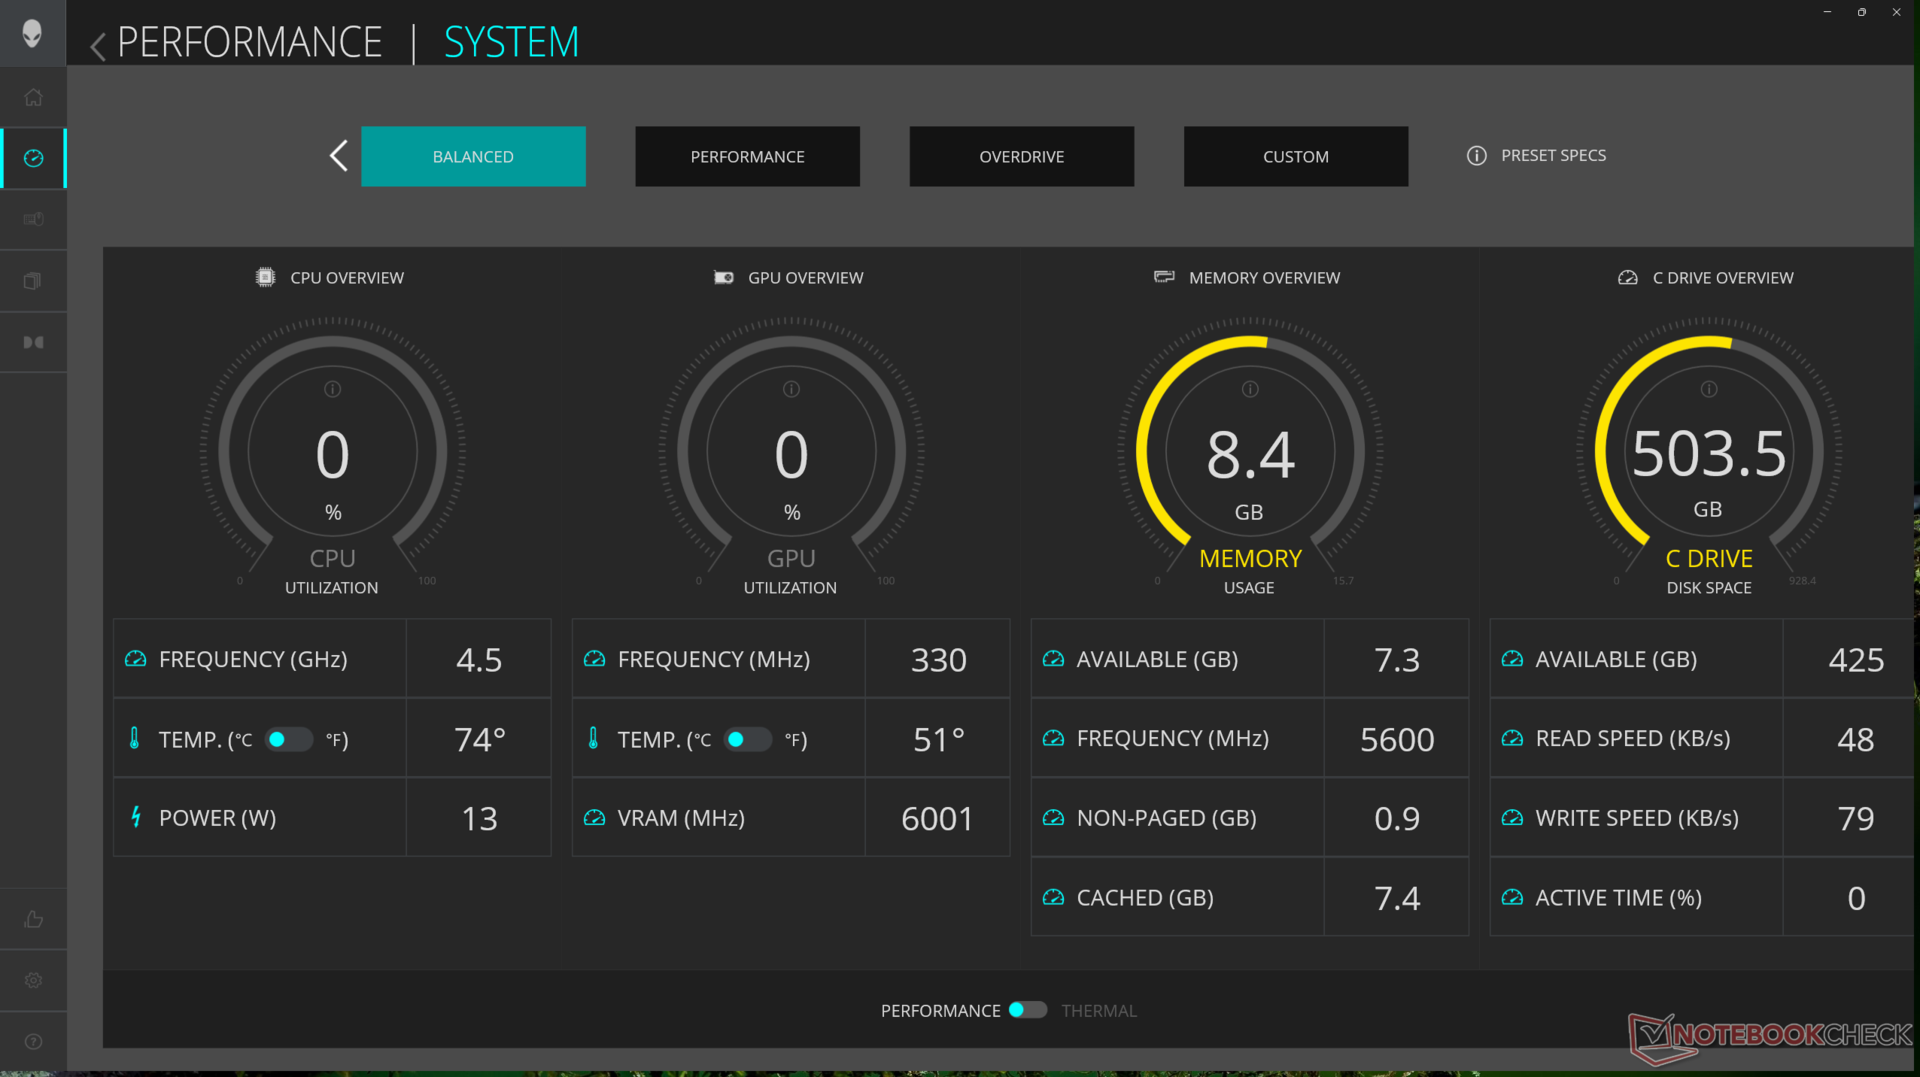
Ustawiliśmy Alienware Command Center (ACC) na tryb Overdrive i Nvidia Control Panel na tryb dGPU przed uruchomieniem poniższych testów porównawczych. ACC został zaktualizowany, aby działał znacznie płynniej i bez wielu problemów, których doświadczyliśmy na m16 R1. Na przykład, teraz uruchamia się niemal natychmiast po uruchomieniu, a tryby profilu wentylatora i oświetlenia AlienFX RGB nie zmieniają się już automatycznie bez uprzedniego powiadomienia użytkownika.
Niemniej jednak nadal doświadczaliśmy błędu, w którym system czasami nie przechodził poprawnie w tryb uśpienia po zamknięciu pokrywy, nawet po dwukrotnym sprawdzeniu ustawień zasilania systemu Windows. Prowadziło to do bardzo ciepłego laptopa i całkowicie rozładowanej baterii zaledwie kilka godzin później.
Zarówno Advanced Optimus, jak i G-Sync są obsługiwane, co oznacza, że użytkownicy mogą przełączać się między trybami iGPU i dGPU bez konieczności miękkiego restartu. Proszę zauważyć, że system musi być ustawiony na tryb dGPU, aby G-Sync działał.
Procesor
Nasz Core Ultra 7 155H jest około 10 do 15 procent wolniejszy niż Core i7-13700HX na zeszłorocznym m16 R1 zarówno w operacjach jedno-, jak i wielowątkowych. Jest on zasadniczo na równi z najnowszym Ryzen 9 8945HS. Podobnie jak w przypadku innych procesorów Meteor Lake, Core Ultra 7 155H integruje jednostkę NPU w celu przyspieszenia zadań AI, takich jak Microsoft Co-Pilot. Większość aplikacji AI jest jednak obecnie oparta na chmurze i nie ma opcji uruchamiania lokalnie, więc zintegrowane możliwości AI nowego procesora są obecnie bardzo ograniczone.
Pomimo deficytu wydajności w stosunku do Core i7-13700HX, m16 R2 jest w stanie uruchomić Core Ultra 7 155H zauważalnie szybciej niż inne laptopy wyposażone w ten sam procesor. Dla przykładu, Core Ultra 7 155H w najnowszym MSI Prestige 16 działa prawie 20 procent wolniej.
Dell twierdzi, że planuje zaoferować Ultra 9 185H SKU w najbliższej przyszłości, co powinno pomóc zmniejszyć lukę w wydajności w stosunku do Core i7-13700HX. Bardziej wymagające Core i7-14700HX lub Core i9-14900HX nie są oferowane ze względu na ograniczenia termiczne; Dell priorytetowo traktował maksymalizację TGP GPU, a nie TDP procesora.
Cinebench R15 Multi Loop
Cinebench R23: Multi Core | Single Core
Cinebench R20: CPU (Multi Core) | CPU (Single Core)
Cinebench R15: CPU Multi 64Bit | CPU Single 64Bit
Blender: v2.79 BMW27 CPU
7-Zip 18.03: 7z b 4 | 7z b 4 -mmt1
Geekbench 6.7: Multi-Core | Single-Core
Geekbench 5.5: Multi-Core | Single-Core
HWBOT x265 Benchmark v2.2: 4k Preset
LibreOffice : 20 Documents To PDF
R Benchmark 2.5: Overall mean
| CPU Performance rating | |
| Lenovo Legion 9 16IRX8 | |
| Lenovo Legion Pro 7 16IRX8H -2! | |
| Alienware m16 R1 AMD | |
| HP Omen Transcend 16-u1095ng | |
| Alienware m16 R1 Intel | |
| Alienware x16 R1 -3! | |
| Lenovo Legion Slim 7i 16 Gen 8 -3! | |
| Razer Blade 14 RZ09-0508 | |
| Framework Laptop 16 | |
| Alienware m16 R2 -1! | |
| Asus ROG Zephyrus G16 2024 GU605M | |
| Lenovo Legion Slim 7 16APH8 | |
| Przeciętny Intel Core Ultra 7 155H | |
| Lenovo Legion S7 16ARHA7 -2! | |
| Asus ROG Zephyrus M16 GU603H -4! | |
| Cinebench R23 / Multi Core | |
| Lenovo Legion Pro 7 16IRX8H | |
| Lenovo Legion 9 16IRX8 | |
| Alienware m16 R1 AMD | |
| Alienware m16 R1 Intel | |
| HP Omen Transcend 16-u1095ng | |
| Lenovo Legion Slim 7i 16 Gen 8 | |
| Alienware x16 R1 | |
| Alienware m16 R2 | |
| Razer Blade 14 RZ09-0508 | |
| Asus ROG Zephyrus G16 2024 GU605M | |
| Framework Laptop 16 | |
| Lenovo Legion Slim 7 16APH8 | |
| Przeciętny Intel Core Ultra 7 155H (9769 - 19007, n=52) | |
| Lenovo Legion S7 16ARHA7 | |
| Cinebench R23 / Single Core | |
| HP Omen Transcend 16-u1095ng | |
| Lenovo Legion 9 16IRX8 | |
| Lenovo Legion Pro 7 16IRX8H | |
| Lenovo Legion Slim 7i 16 Gen 8 | |
| Alienware x16 R1 | |
| Alienware m16 R1 Intel | |
| Alienware m16 R1 AMD | |
| Razer Blade 14 RZ09-0508 | |
| Lenovo Legion Slim 7 16APH8 | |
| Alienware m16 R2 | |
| Framework Laptop 16 | |
| Przeciętny Intel Core Ultra 7 155H (1496 - 1815, n=52) | |
| Asus ROG Zephyrus G16 2024 GU605M | |
| Lenovo Legion S7 16ARHA7 | |
| Cinebench R20 / CPU (Multi Core) | |
| Lenovo Legion Pro 7 16IRX8H | |
| Lenovo Legion 9 16IRX8 | |
| Alienware m16 R1 AMD | |
| HP Omen Transcend 16-u1095ng | |
| Alienware m16 R1 Intel | |
| Lenovo Legion Slim 7i 16 Gen 8 | |
| Alienware x16 R1 | |
| Alienware m16 R2 | |
| Razer Blade 14 RZ09-0508 | |
| Asus ROG Zephyrus G16 2024 GU605M | |
| Framework Laptop 16 | |
| Lenovo Legion Slim 7 16APH8 | |
| Przeciętny Intel Core Ultra 7 155H (3798 - 7409, n=50) | |
| Lenovo Legion S7 16ARHA7 | |
| Asus ROG Zephyrus M16 GU603H | |
| Cinebench R20 / CPU (Single Core) | |
| HP Omen Transcend 16-u1095ng | |
| Lenovo Legion Pro 7 16IRX8H | |
| Lenovo Legion Slim 7i 16 Gen 8 | |
| Alienware x16 R1 | |
| Alienware m16 R1 Intel | |
| Lenovo Legion 9 16IRX8 | |
| Alienware m16 R1 AMD | |
| Razer Blade 14 RZ09-0508 | |
| Asus ROG Zephyrus G16 2024 GU605M | |
| Framework Laptop 16 | |
| Alienware m16 R2 | |
| Lenovo Legion Slim 7 16APH8 | |
| Przeciętny Intel Core Ultra 7 155H (601 - 696, n=50) | |
| Lenovo Legion S7 16ARHA7 | |
| Asus ROG Zephyrus M16 GU603H | |
| Cinebench R15 / CPU Multi 64Bit | |
| Lenovo Legion Pro 7 16IRX8H | |
| Lenovo Legion 9 16IRX8 | |
| Alienware m16 R1 AMD | |
| HP Omen Transcend 16-u1095ng | |
| Alienware m16 R1 Intel | |
| Lenovo Legion Slim 7i 16 Gen 8 | |
| Alienware x16 R1 | |
| Alienware m16 R2 | |
| Razer Blade 14 RZ09-0508 | |
| Asus ROG Zephyrus G16 2024 GU605M | |
| Framework Laptop 16 | |
| Lenovo Legion Slim 7 16APH8 | |
| Przeciętny Intel Core Ultra 7 155H (1932 - 2880, n=56) | |
| Lenovo Legion S7 16ARHA7 | |
| Asus ROG Zephyrus M16 GU603H | |
| Cinebench R15 / CPU Single 64Bit | |
| Lenovo Legion 9 16IRX8 | |
| Lenovo Legion Pro 7 16IRX8H | |
| HP Omen Transcend 16-u1095ng | |
| Alienware m16 R1 AMD | |
| Razer Blade 14 RZ09-0508 | |
| Alienware x16 R1 | |
| Alienware m16 R1 Intel | |
| Framework Laptop 16 | |
| Lenovo Legion Slim 7 16APH8 | |
| Asus ROG Zephyrus G16 2024 GU605M | |
| Lenovo Legion S7 16ARHA7 | |
| Alienware m16 R2 | |
| Przeciętny Intel Core Ultra 7 155H (99.6 - 268, n=52) | |
| Asus ROG Zephyrus M16 GU603H | |
| Lenovo Legion Slim 7i 16 Gen 8 | |
| Blender / v2.79 BMW27 CPU | |
| Asus ROG Zephyrus M16 GU603H | |
| Przeciętny Intel Core Ultra 7 155H (175 - 381, n=47) | |
| Lenovo Legion S7 16ARHA7 | |
| Lenovo Legion Slim 7 16APH8 | |
| Framework Laptop 16 | |
| Asus ROG Zephyrus G16 2024 GU605M | |
| Razer Blade 14 RZ09-0508 | |
| HP Omen Transcend 16-u1095ng | |
| Alienware m16 R1 Intel | |
| Alienware m16 R1 AMD | |
| Lenovo Legion Pro 7 16IRX8H | |
| Lenovo Legion 9 16IRX8 | |
| 7-Zip 18.03 / 7z b 4 | |
| Lenovo Legion Pro 7 16IRX8H | |
| Lenovo Legion 9 16IRX8 | |
| Alienware m16 R1 AMD | |
| HP Omen Transcend 16-u1095ng | |
| Alienware m16 R1 Intel | |
| Alienware x16 R1 | |
| Razer Blade 14 RZ09-0508 | |
| Framework Laptop 16 | |
| Lenovo Legion Slim 7i 16 Gen 8 | |
| Lenovo Legion Slim 7 16APH8 | |
| Asus ROG Zephyrus G16 2024 GU605M | |
| Alienware m16 R2 | |
| Lenovo Legion S7 16ARHA7 | |
| Przeciętny Intel Core Ultra 7 155H (41739 - 70254, n=50) | |
| Asus ROG Zephyrus M16 GU603H | |
| 7-Zip 18.03 / 7z b 4 -mmt1 | |
| HP Omen Transcend 16-u1095ng | |
| Lenovo Legion Pro 7 16IRX8H | |
| Alienware m16 R1 AMD | |
| Lenovo Legion 9 16IRX8 | |
| Lenovo Legion Slim 7 16APH8 | |
| Framework Laptop 16 | |
| Razer Blade 14 RZ09-0508 | |
| Alienware m16 R1 Intel | |
| Lenovo Legion Slim 7i 16 Gen 8 | |
| Lenovo Legion S7 16ARHA7 | |
| Alienware x16 R1 | |
| Asus ROG Zephyrus M16 GU603H | |
| Asus ROG Zephyrus G16 2024 GU605M | |
| Przeciętny Intel Core Ultra 7 155H (4594 - 5621, n=50) | |
| Alienware m16 R2 | |
| Geekbench 6.7 / Multi-Core | |
| Lenovo Legion 9 16IRX8 | |
| HP Omen Transcend 16-u1095ng | |
| Alienware m16 R1 Intel | |
| Razer Blade 14 RZ09-0508 | |
| Asus ROG Zephyrus G16 2024 GU605M | |
| Framework Laptop 16 | |
| Lenovo Legion Slim 7 16APH8 | |
| Alienware m16 R2 | |
| Alienware m16 R1 AMD | |
| Przeciętny Intel Core Ultra 7 155H (7732 - 13656, n=55) | |
| Geekbench 6.7 / Single-Core | |
| Lenovo Legion 9 16IRX8 | |
| HP Omen Transcend 16-u1095ng | |
| Alienware m16 R1 AMD | |
| Razer Blade 14 RZ09-0508 | |
| Alienware m16 R1 Intel | |
| Framework Laptop 16 | |
| Lenovo Legion Slim 7 16APH8 | |
| Asus ROG Zephyrus G16 2024 GU605M | |
| Alienware m16 R2 | |
| Przeciętny Intel Core Ultra 7 155H (1901 - 2473, n=52) | |
| Geekbench 5.5 / Multi-Core | |
| Lenovo Legion Pro 7 16IRX8H | |
| Lenovo Legion 9 16IRX8 | |
| HP Omen Transcend 16-u1095ng | |
| Alienware m16 R1 AMD | |
| Alienware x16 R1 | |
| Alienware m16 R1 Intel | |
| Asus ROG Zephyrus G16 2024 GU605M | |
| Lenovo Legion Slim 7i 16 Gen 8 | |
| Framework Laptop 16 | |
| Razer Blade 14 RZ09-0508 | |
| Alienware m16 R2 | |
| Przeciętny Intel Core Ultra 7 155H (10017 - 13556, n=52) | |
| Lenovo Legion Slim 7 16APH8 | |
| Lenovo Legion S7 16ARHA7 | |
| Asus ROG Zephyrus M16 GU603H | |
| Geekbench 5.5 / Single-Core | |
| Lenovo Legion 9 16IRX8 | |
| HP Omen Transcend 16-u1095ng | |
| Lenovo Legion Pro 7 16IRX8H | |
| Alienware m16 R1 AMD | |
| Razer Blade 14 RZ09-0508 | |
| Framework Laptop 16 | |
| Lenovo Legion Slim 7i 16 Gen 8 | |
| Lenovo Legion Slim 7 16APH8 | |
| Alienware x16 R1 | |
| Alienware m16 R1 Intel | |
| Asus ROG Zephyrus G16 2024 GU605M | |
| Przeciętny Intel Core Ultra 7 155H (1462 - 1824, n=52) | |
| Alienware m16 R2 | |
| Lenovo Legion S7 16ARHA7 | |
| Asus ROG Zephyrus M16 GU603H | |
| HWBOT x265 Benchmark v2.2 / 4k Preset | |
| Lenovo Legion Pro 7 16IRX8H | |
| Lenovo Legion 9 16IRX8 | |
| Alienware m16 R1 AMD | |
| HP Omen Transcend 16-u1095ng | |
| Alienware m16 R1 Intel | |
| Razer Blade 14 RZ09-0508 | |
| Alienware x16 R1 | |
| Lenovo Legion Slim 7i 16 Gen 8 | |
| Alienware m16 R2 | |
| Framework Laptop 16 | |
| Lenovo Legion Slim 7 16APH8 | |
| Asus ROG Zephyrus G16 2024 GU605M | |
| Lenovo Legion S7 16ARHA7 | |
| Przeciętny Intel Core Ultra 7 155H (9.93 - 21.2, n=50) | |
| Asus ROG Zephyrus M16 GU603H | |
| LibreOffice / 20 Documents To PDF | |
| Lenovo Legion Slim 7 16APH8 | |
| HP Omen Transcend 16-u1095ng | |
| Alienware m16 R2 | |
| Asus ROG Zephyrus G16 2024 GU605M | |
| Przeciętny Intel Core Ultra 7 155H (37.5 - 79.2, n=49) | |
| Lenovo Legion S7 16ARHA7 | |
| Razer Blade 14 RZ09-0508 | |
| Alienware m16 R1 Intel | |
| Alienware x16 R1 | |
| Lenovo Legion Pro 7 16IRX8H | |
| Framework Laptop 16 | |
| Asus ROG Zephyrus M16 GU603H | |
| Alienware m16 R1 AMD | |
| Lenovo Legion 9 16IRX8 | |
| Lenovo Legion Slim 7i 16 Gen 8 | |
| R Benchmark 2.5 / Overall mean | |
| Asus ROG Zephyrus M16 GU603H | |
| Alienware m16 R2 | |
| Przeciętny Intel Core Ultra 7 155H (0.4457 - 0.53, n=49) | |
| Asus ROG Zephyrus G16 2024 GU605M | |
| Lenovo Legion S7 16ARHA7 | |
| Framework Laptop 16 | |
| Lenovo Legion Slim 7 16APH8 | |
| Alienware m16 R1 Intel | |
| Razer Blade 14 RZ09-0508 | |
| Alienware x16 R1 | |
| Alienware m16 R1 AMD | |
| Lenovo Legion Slim 7i 16 Gen 8 | |
| Lenovo Legion Pro 7 16IRX8H | |
| HP Omen Transcend 16-u1095ng | |
| Lenovo Legion 9 16IRX8 | |
Cinebench R23: Multi Core | Single Core
Cinebench R20: CPU (Multi Core) | CPU (Single Core)
Cinebench R15: CPU Multi 64Bit | CPU Single 64Bit
Blender: v2.79 BMW27 CPU
7-Zip 18.03: 7z b 4 | 7z b 4 -mmt1
Geekbench 6.7: Multi-Core | Single-Core
Geekbench 5.5: Multi-Core | Single-Core
HWBOT x265 Benchmark v2.2: 4k Preset
LibreOffice : 20 Documents To PDF
R Benchmark 2.5: Overall mean
* ... im mniej tym lepiej
AIDA64: FP32 Ray-Trace | FPU Julia | CPU SHA3 | CPU Queen | FPU SinJulia | FPU Mandel | CPU AES | CPU ZLib | FP64 Ray-Trace | CPU PhotoWorxx
| Performance rating | |
| Lenovo Legion Slim 7 16APH8 | |
| Alienware m16 R1 Intel | |
| Alienware x16 R1 | |
| HP Omen Transcend 16-u1095ng | |
| Alienware m16 R2 | |
| Asus ROG Zephyrus G16 2024 GU605M | |
| Przeciętny Intel Core Ultra 7 155H | |
| AIDA64 / FP32 Ray-Trace | |
| Lenovo Legion Slim 7 16APH8 | |
| Alienware m16 R1 Intel | |
| Alienware m16 R2 | |
| Alienware x16 R1 | |
| HP Omen Transcend 16-u1095ng | |
| Asus ROG Zephyrus G16 2024 GU605M | |
| Przeciętny Intel Core Ultra 7 155H (6670 - 18470, n=50) | |
| AIDA64 / FPU Julia | |
| Lenovo Legion Slim 7 16APH8 | |
| Alienware m16 R1 Intel | |
| Alienware m16 R2 | |
| Alienware x16 R1 | |
| HP Omen Transcend 16-u1095ng | |
| Asus ROG Zephyrus G16 2024 GU605M | |
| Przeciętny Intel Core Ultra 7 155H (40905 - 93181, n=50) | |
| AIDA64 / CPU SHA3 | |
| Alienware m16 R1 Intel | |
| Lenovo Legion Slim 7 16APH8 | |
| HP Omen Transcend 16-u1095ng | |
| Alienware m16 R2 | |
| Alienware x16 R1 | |
| Asus ROG Zephyrus G16 2024 GU605M | |
| Przeciętny Intel Core Ultra 7 155H (1940 - 4436, n=50) | |
| AIDA64 / CPU Queen | |
| HP Omen Transcend 16-u1095ng | |
| Alienware x16 R1 | |
| Lenovo Legion Slim 7 16APH8 | |
| Alienware m16 R1 Intel | |
| Asus ROG Zephyrus G16 2024 GU605M | |
| Alienware m16 R2 | |
| Przeciętny Intel Core Ultra 7 155H (64698 - 94181, n=50) | |
| AIDA64 / FPU SinJulia | |
| Lenovo Legion Slim 7 16APH8 | |
| Alienware m16 R1 Intel | |
| HP Omen Transcend 16-u1095ng | |
| Alienware x16 R1 | |
| Asus ROG Zephyrus G16 2024 GU605M | |
| Alienware m16 R2 | |
| Przeciętny Intel Core Ultra 7 155H (5639 - 10647, n=50) | |
| AIDA64 / FPU Mandel | |
| Lenovo Legion Slim 7 16APH8 | |
| Alienware m16 R1 Intel | |
| Alienware m16 R2 | |
| Alienware x16 R1 | |
| HP Omen Transcend 16-u1095ng | |
| Asus ROG Zephyrus G16 2024 GU605M | |
| Przeciętny Intel Core Ultra 7 155H (18236 - 47685, n=50) | |
| AIDA64 / CPU AES | |
| Alienware m16 R1 Intel | |
| HP Omen Transcend 16-u1095ng | |
| Alienware m16 R2 | |
| Alienware x16 R1 | |
| Asus ROG Zephyrus G16 2024 GU605M | |
| Przeciętny Intel Core Ultra 7 155H (45713 - 152179, n=50) | |
| Lenovo Legion Slim 7 16APH8 | |
| AIDA64 / CPU ZLib | |
| Alienware m16 R1 Intel | |
| HP Omen Transcend 16-u1095ng | |
| Alienware x16 R1 | |
| Alienware m16 R2 | |
| Asus ROG Zephyrus G16 2024 GU605M | |
| Lenovo Legion Slim 7 16APH8 | |
| Przeciętny Intel Core Ultra 7 155H (557 - 1250, n=50) | |
| AIDA64 / FP64 Ray-Trace | |
| Lenovo Legion Slim 7 16APH8 | |
| Alienware m16 R1 Intel | |
| Alienware x16 R1 | |
| Alienware m16 R2 | |
| HP Omen Transcend 16-u1095ng | |
| Asus ROG Zephyrus G16 2024 GU605M | |
| Przeciętny Intel Core Ultra 7 155H (3569 - 9802, n=50) | |
| AIDA64 / CPU PhotoWorxx | |
| Alienware x16 R1 | |
| HP Omen Transcend 16-u1095ng | |
| Asus ROG Zephyrus G16 2024 GU605M | |
| Przeciętny Intel Core Ultra 7 155H (32719 - 54223, n=50) | |
| Lenovo Legion Slim 7 16APH8 | |
| Alienware m16 R2 | |
| Alienware m16 R1 Intel | |
Test warunków skrajnych
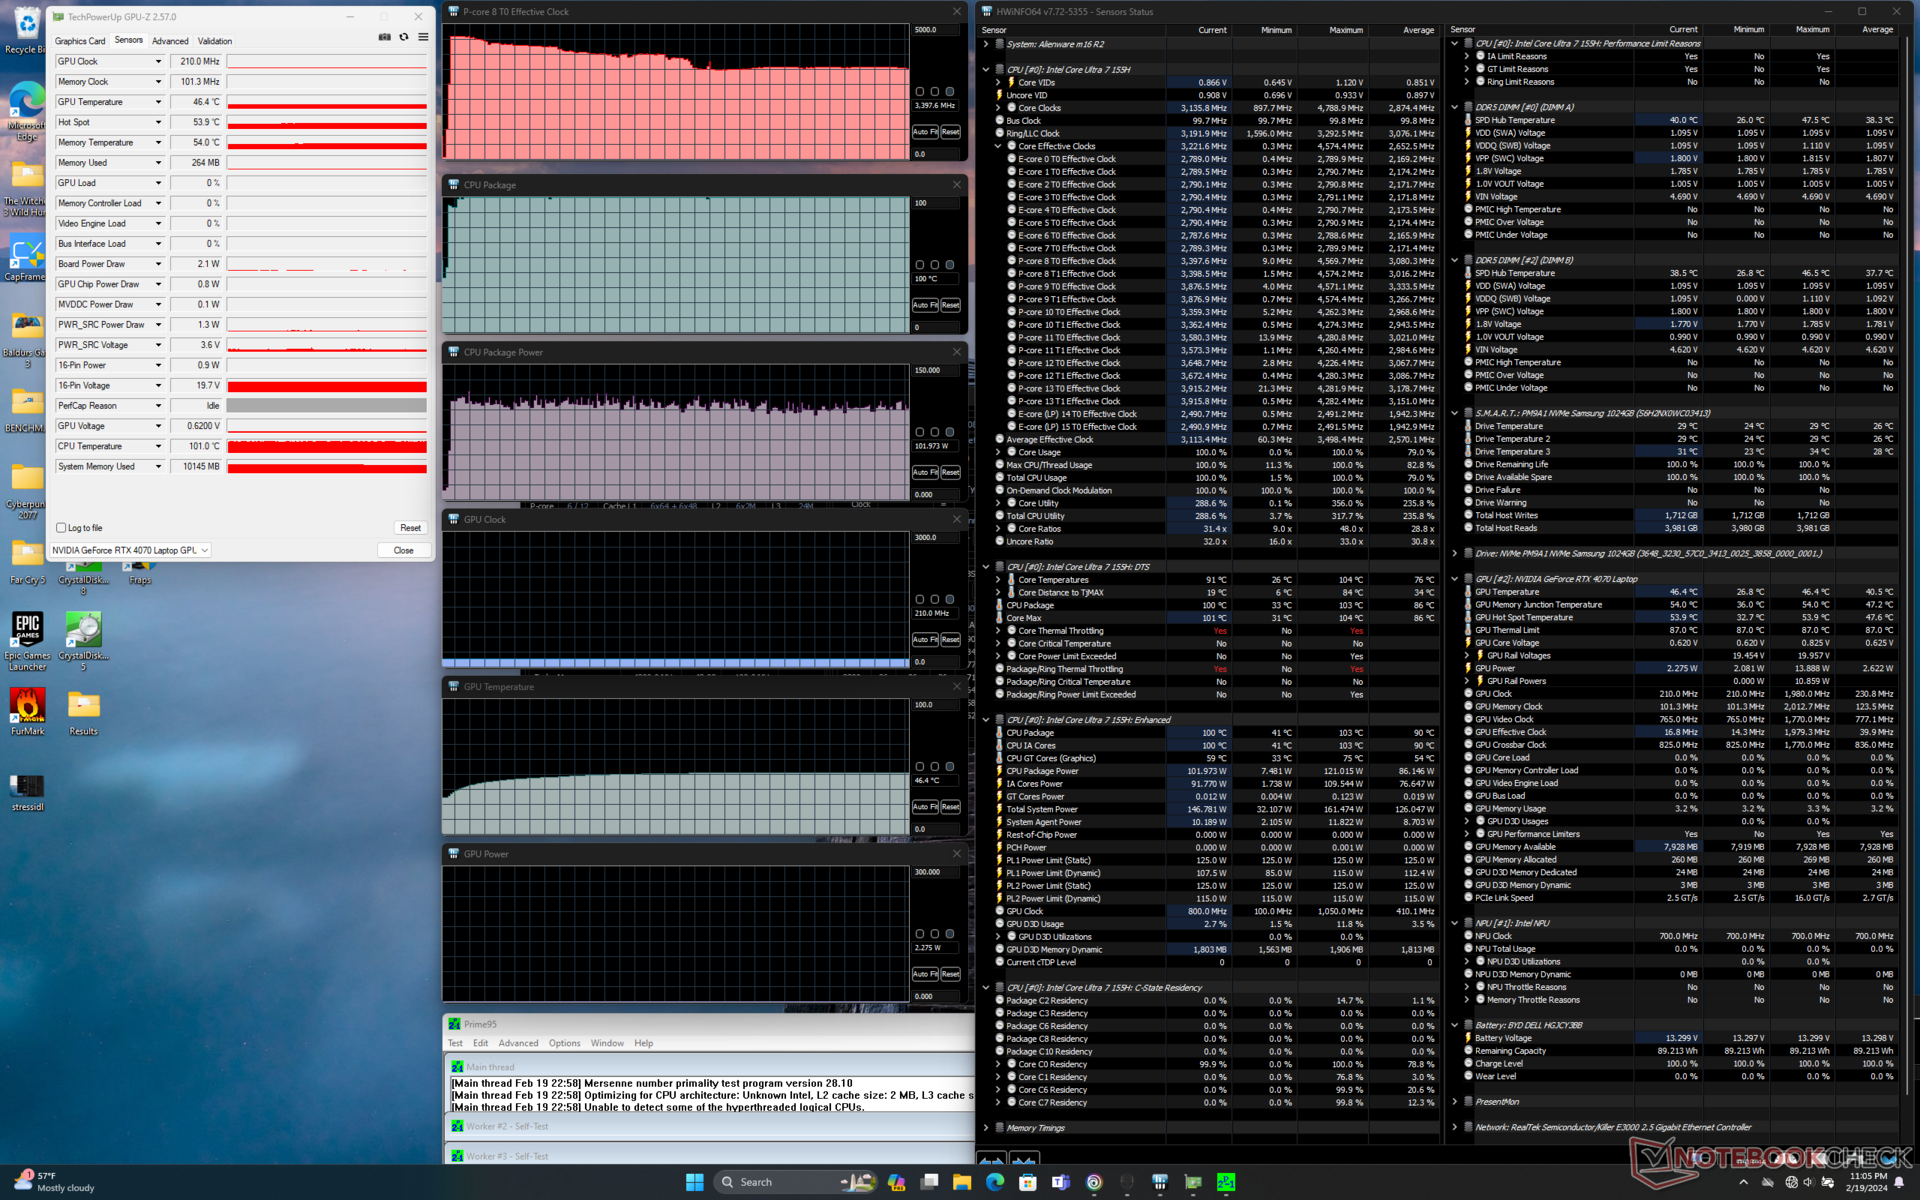
Podczas uruchamiania obciążenia Prime95 w trybie Overdrive, procesor zwiększał taktowanie do 4,6 GHz i 115 W przez kilka sekund, po czym stale spadał i ostatecznie ustabilizował się na poziomie 3,4 GHz i 102 W. Temperatura rdzenia była jednak bardzo wysoka i wynosiła 100 C, co sugeruje, że procesor już teraz przesuwa rozwiązanie chłodzące do granic możliwości.
Co ciekawe, nie ma prawie żadnych zmian w częstotliwościach taktowania GPU lub poborze mocy płyty podczas pracy Witcher 3 w trybach Balanced, Performance lub Overdrive, co koreluje z naszymi ustaleniami poniżej w sekcji Wydajność GPU. Zamiast tego, temperatura GPU ma tendencję do zmniejszania się w trybie Performance lub Overdrive ze względu na głośniejsze sufity wentylatorów w tych trybach. Innymi słowy, częstotliwości taktowania i TGP w czasie rzeczywistym pozostałyby stałe, podczas gdy hałas wentylatora uległby zmianie. Mogą wystąpić pewne niewielkie zmiany w wydajności procesora między trybami, ale większość gier i tak nie jest związana z procesorem.
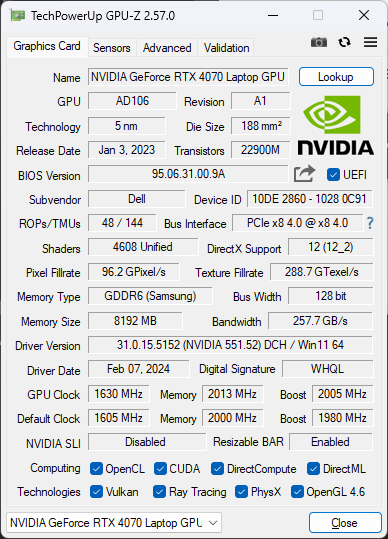
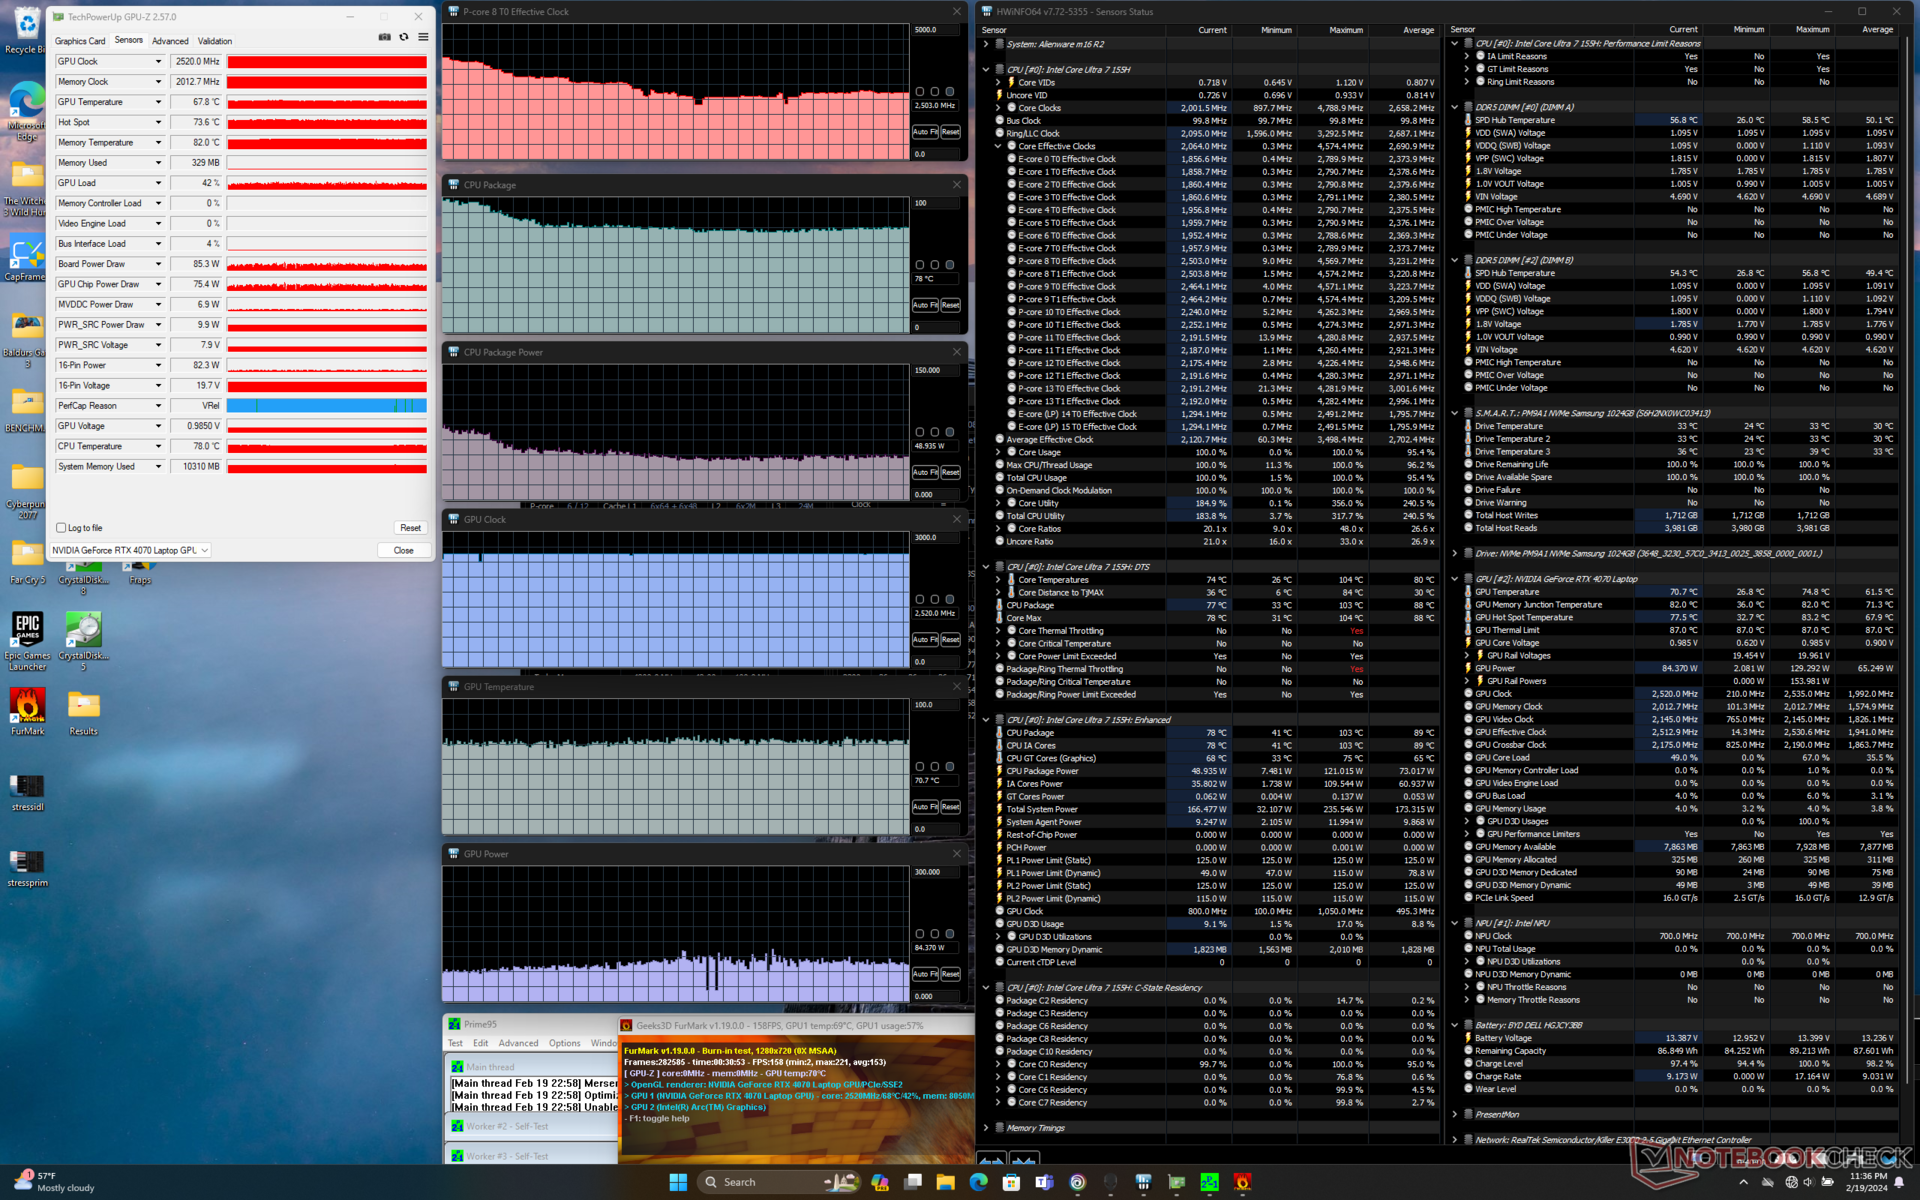
Warto zauważyć, że podczas gdy GPU jest oceniane na 140 W TGP zgodnie z panelem sterowania Nvidii, ma tendencję do stabilizowania się na poziomie 106 W podczas grania. Udało nam się osiągnąć tymczasowe maksimum na poziomie 121 W.
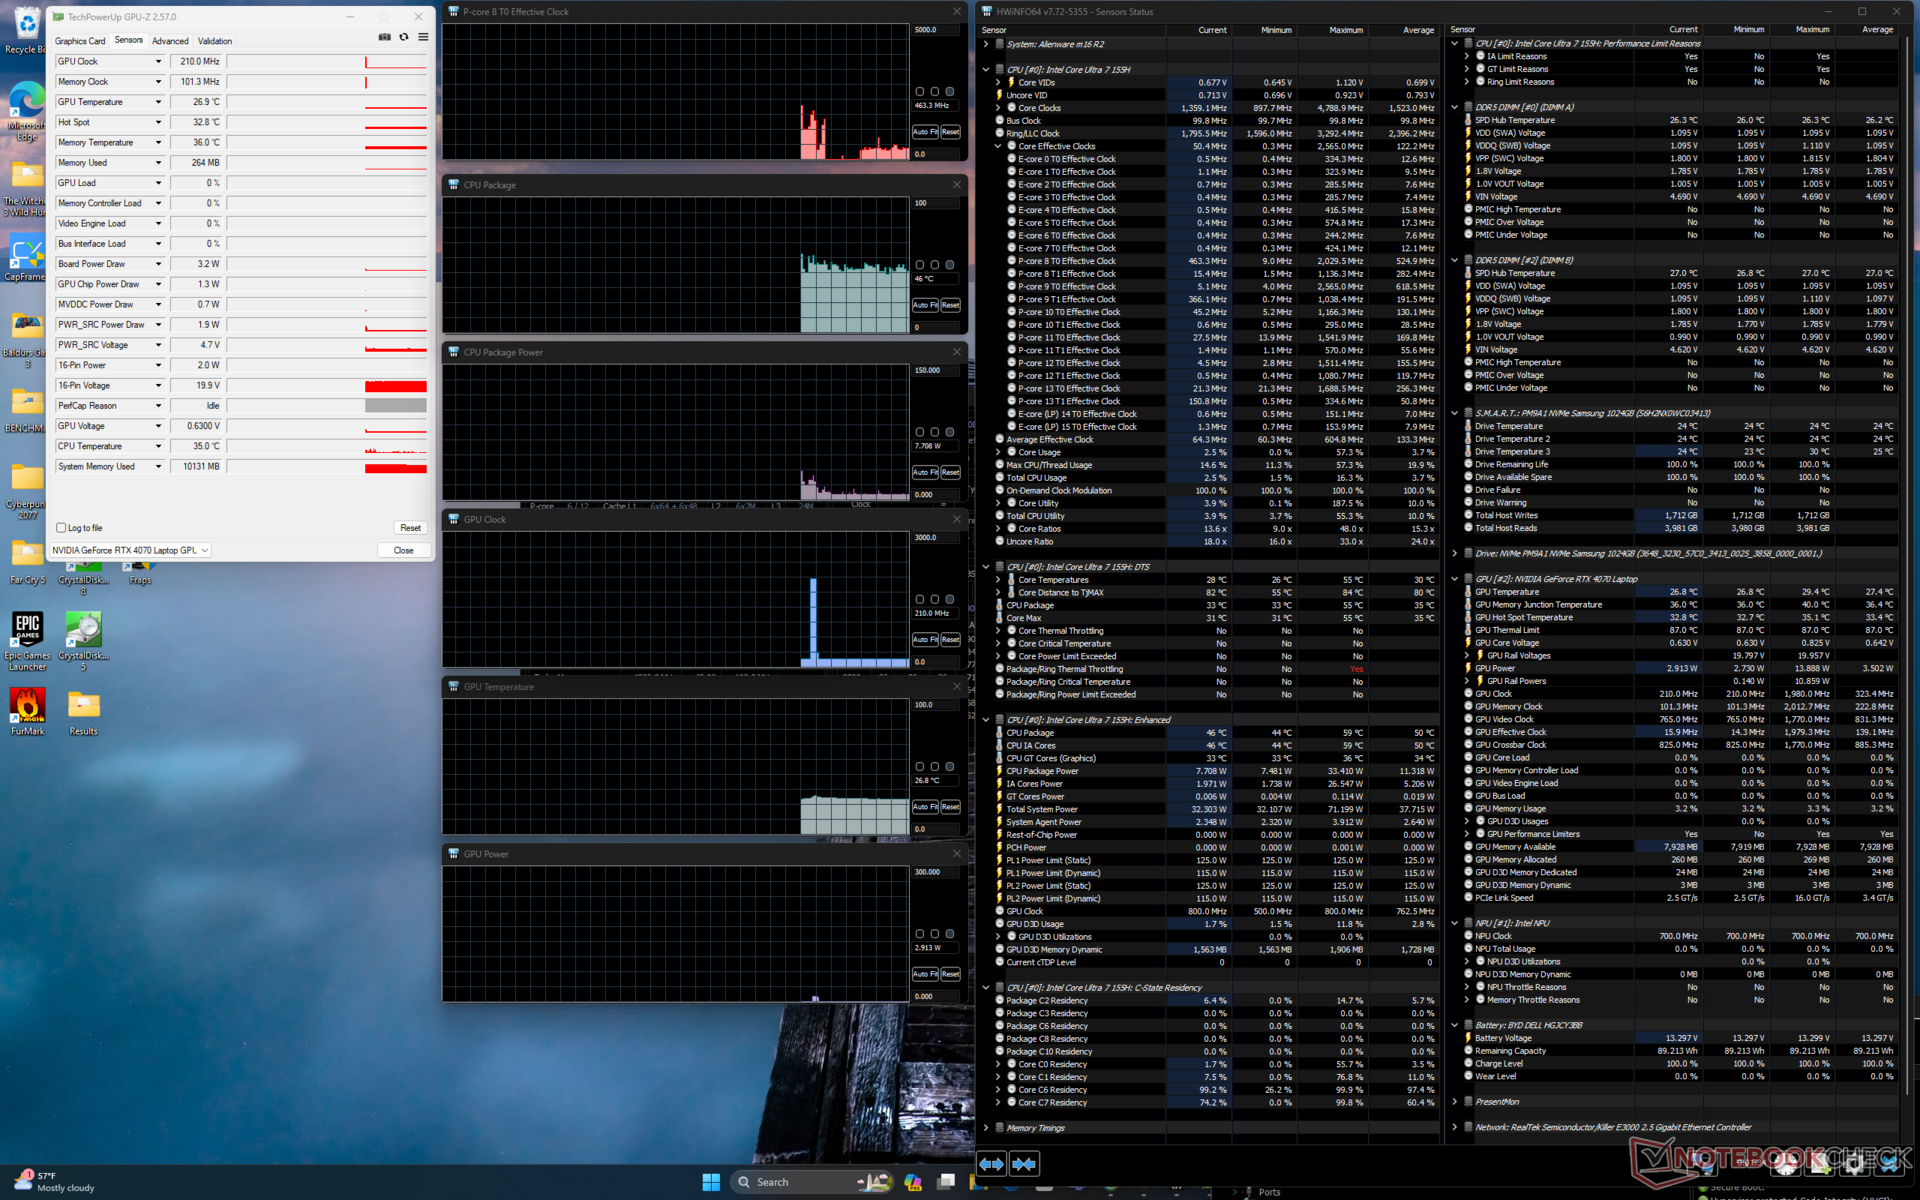
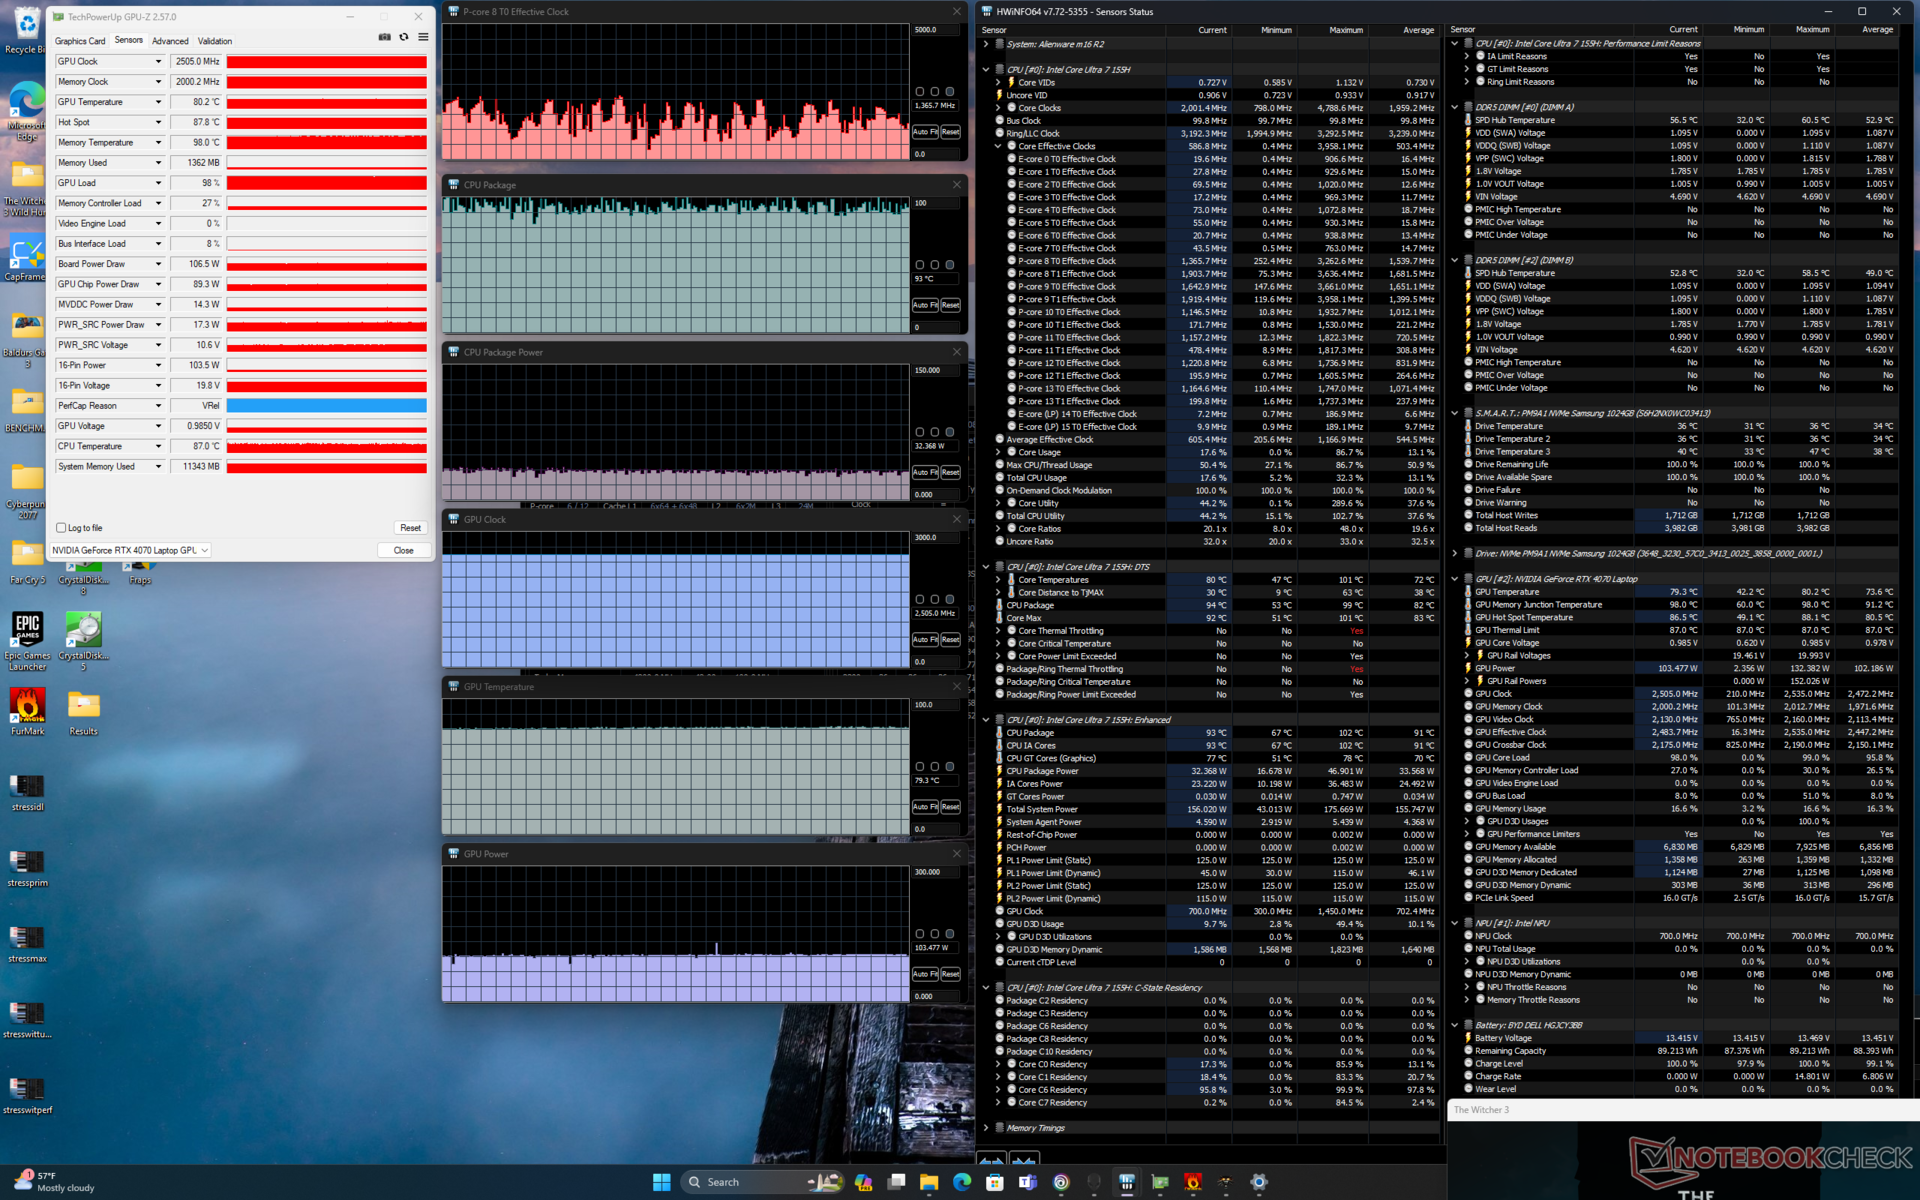

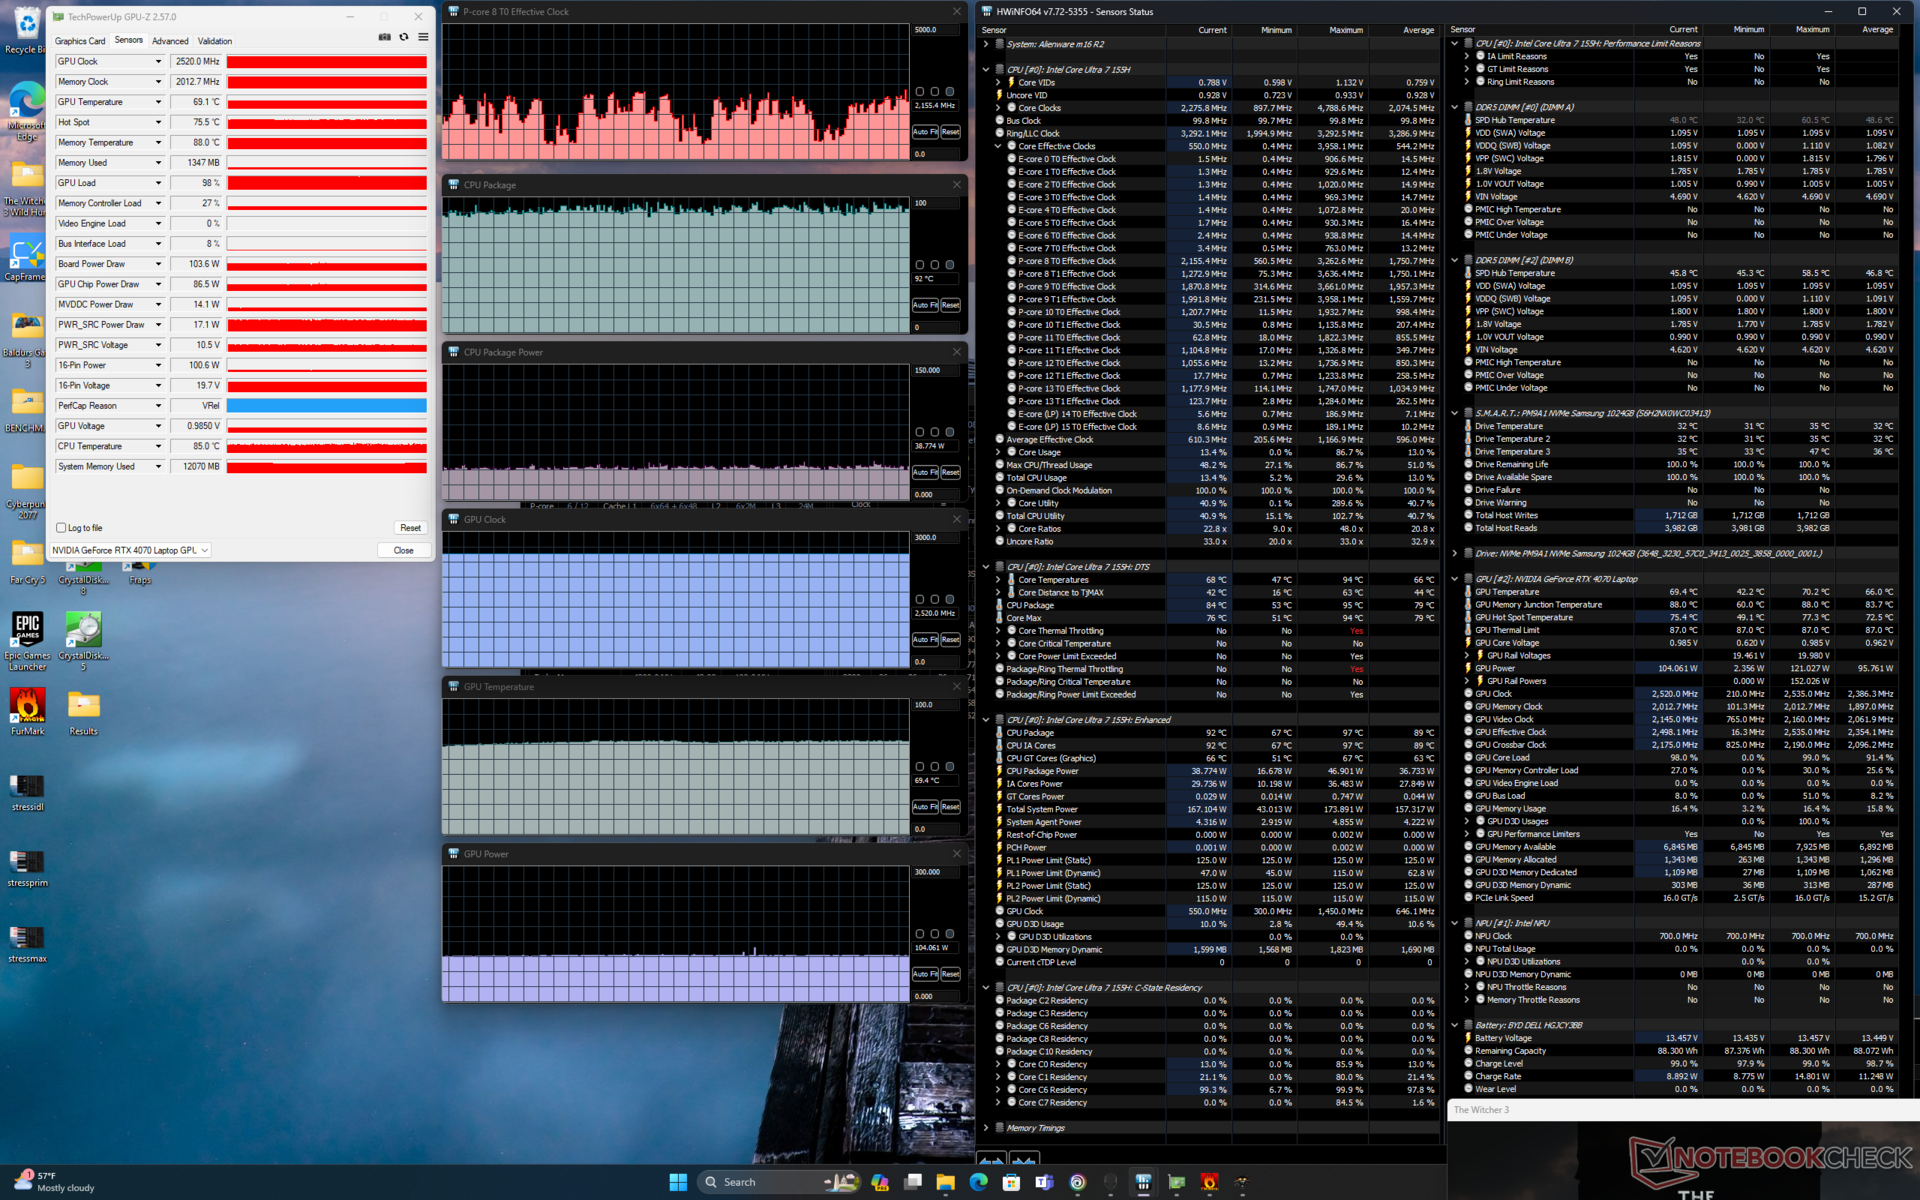
| Taktowanie CPU (GHz) | Taktowanie GPU (MHz) | Średnia temperatura CPU (°C) | Średnia temperatura GPU (°C) | |
| System w stanie spoczynku | -- | -- | 46 | 27 |
| Prime95Stress | 3.4 | -- | 100 | 47 |
| Prime95+ FurMark Stress | 2.5 | 2520 | 78 | 71 |
| Witcher 3 Obciążenie (trybzrównoważony) | ~1,8 | 2502 | 93 | 80 |
| Witcher 3 Obciążenie (trybwydajności) | ~1.8 | 2520 | 91 | 77 |
| Witcher 3 Obciążenie (trybOverdrive) | ~2.0 | 2520 | 92 | 69 |
Wydajność systemu
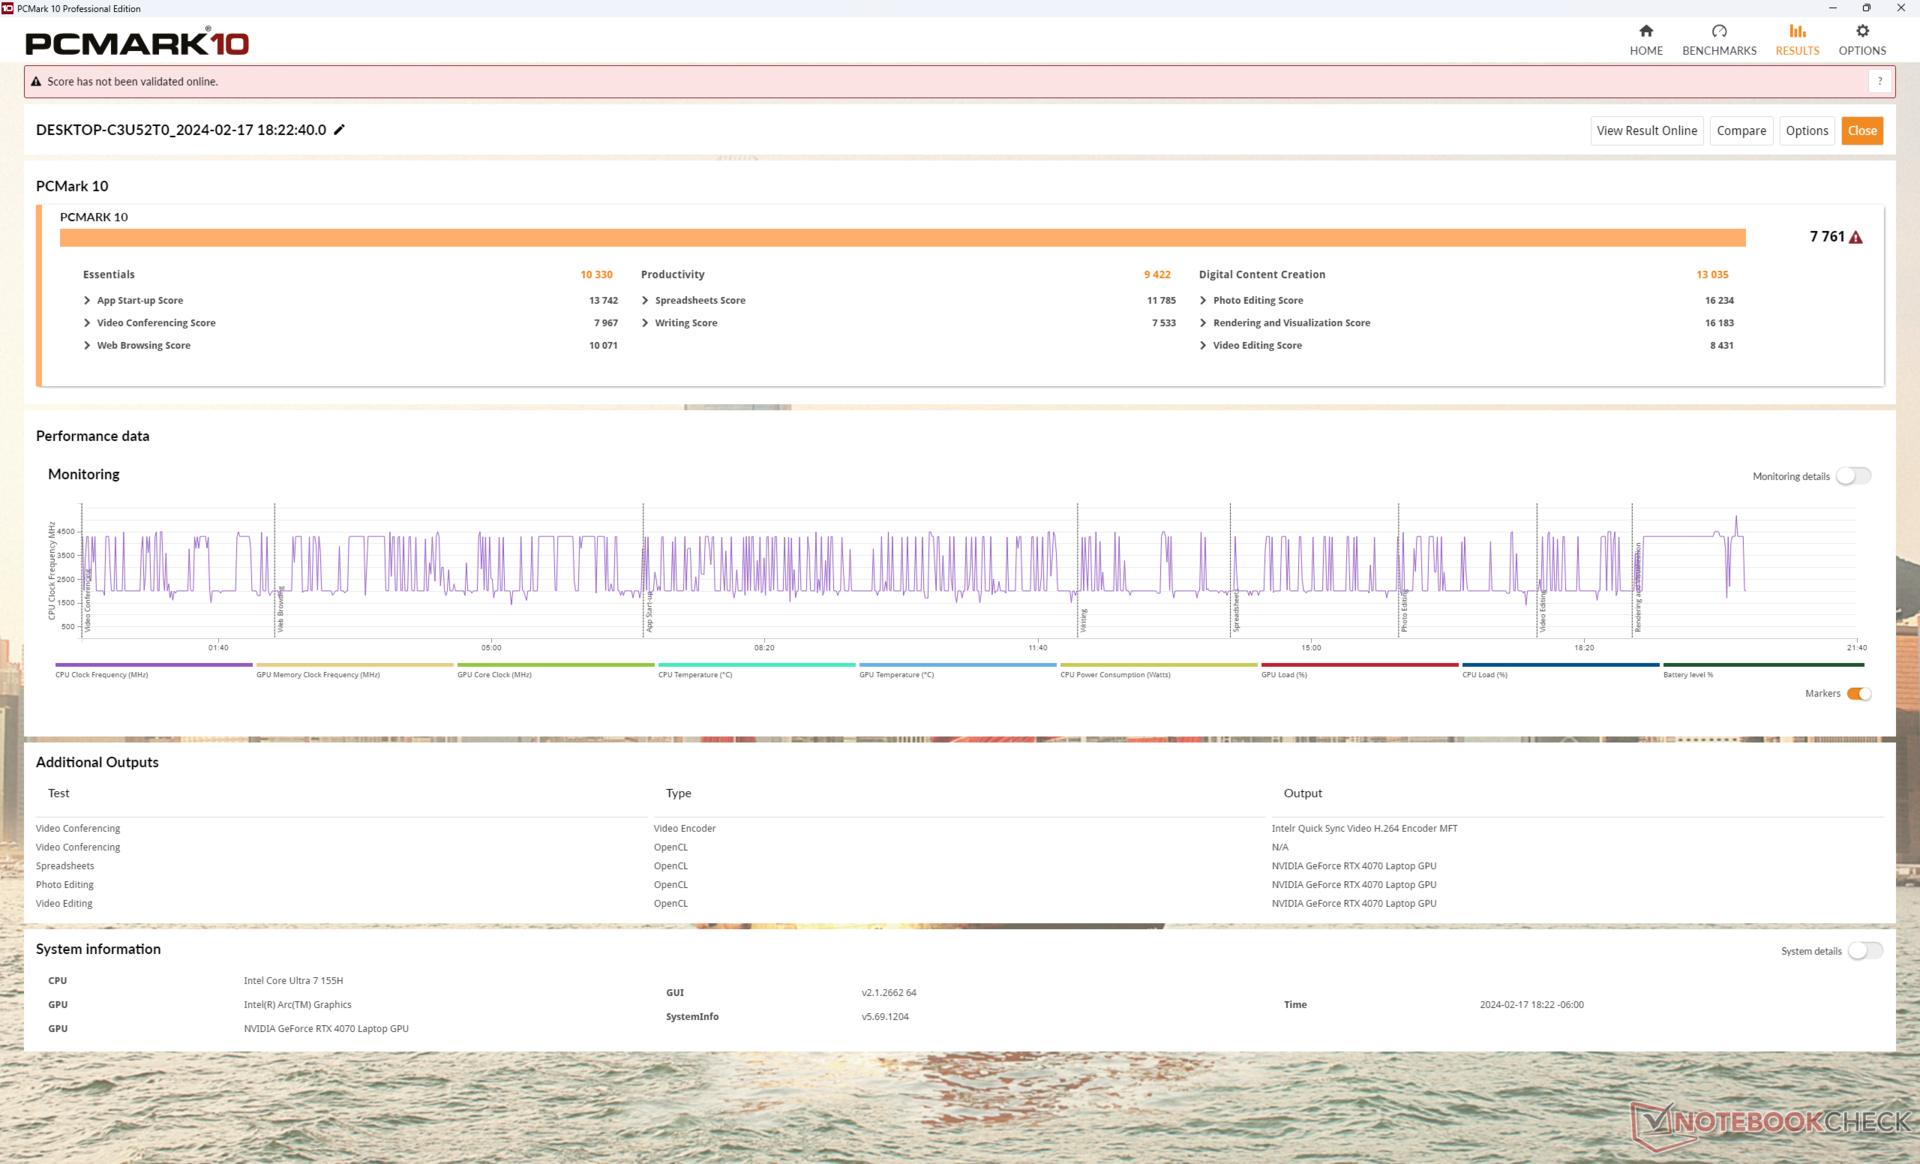
Wyniki PCMark 10 są porównywalne z m16 R1, z wyjątkiem niższego wyniku w podteście Digital Content Creation, ponieważ m16 R2 jest wyposażony w wolniejszą kartę RTX 4070. Wydajność systemu jest poza tym bardzo podobna i nie wykazuje znaczących wzrostów w większości codziennych obciążeń, pomimo procesora nowszej generacji.
CrossMark: Overall | Productivity | Creativity | Responsiveness
WebXPRT 3: Overall
WebXPRT 4: Overall
Mozilla Kraken 1.1: Total
| PCMark 10 / Score | |
| Alienware x16 R1 | |
| HP Omen Transcend 16-u1095ng | |
| Alienware m16 R2 | |
| Lenovo Legion Slim 7 16APH8 | |
| Przeciętny Intel Core Ultra 7 155H, NVIDIA GeForce RTX 4070 Laptop GPU (7084 - 7761, n=4) | |
| Alienware m16 R1 Intel | |
| Asus ROG Zephyrus G16 2024 GU605M | |
| PCMark 10 / Essentials | |
| Alienware x16 R1 | |
| Alienware m16 R1 Intel | |
| HP Omen Transcend 16-u1095ng | |
| Lenovo Legion Slim 7 16APH8 | |
| Alienware m16 R2 | |
| Przeciętny Intel Core Ultra 7 155H, NVIDIA GeForce RTX 4070 Laptop GPU (10038 - 10393, n=4) | |
| Asus ROG Zephyrus G16 2024 GU605M | |
| PCMark 10 / Productivity | |
| HP Omen Transcend 16-u1095ng | |
| Alienware x16 R1 | |
| Lenovo Legion Slim 7 16APH8 | |
| Alienware m16 R1 Intel | |
| Alienware m16 R2 | |
| Przeciętny Intel Core Ultra 7 155H, NVIDIA GeForce RTX 4070 Laptop GPU (9192 - 9518, n=4) | |
| Asus ROG Zephyrus G16 2024 GU605M | |
| PCMark 10 / Digital Content Creation | |
| Alienware x16 R1 | |
| Alienware m16 R2 | |
| HP Omen Transcend 16-u1095ng | |
| Przeciętny Intel Core Ultra 7 155H, NVIDIA GeForce RTX 4070 Laptop GPU (10100 - 13035, n=4) | |
| Lenovo Legion Slim 7 16APH8 | |
| Asus ROG Zephyrus G16 2024 GU605M | |
| Alienware m16 R1 Intel | |
| CrossMark / Overall | |
| Alienware m16 R1 Intel | |
| Alienware x16 R1 | |
| Alienware m16 R2 | |
| Przeciętny Intel Core Ultra 7 155H, NVIDIA GeForce RTX 4070 Laptop GPU (1687 - 1848, n=4) | |
| Asus ROG Zephyrus G16 2024 GU605M | |
| CrossMark / Productivity | |
| Alienware m16 R1 Intel | |
| Alienware x16 R1 | |
| Alienware m16 R2 | |
| Przeciętny Intel Core Ultra 7 155H, NVIDIA GeForce RTX 4070 Laptop GPU (1589 - 1750, n=4) | |
| Asus ROG Zephyrus G16 2024 GU605M | |
| CrossMark / Creativity | |
| Alienware m16 R1 Intel | |
| Alienware x16 R1 | |
| Asus ROG Zephyrus G16 2024 GU605M | |
| Przeciętny Intel Core Ultra 7 155H, NVIDIA GeForce RTX 4070 Laptop GPU (1860 - 2014, n=4) | |
| Alienware m16 R2 | |
| CrossMark / Responsiveness | |
| Alienware x16 R1 | |
| Alienware m16 R1 Intel | |
| Alienware m16 R2 | |
| Przeciętny Intel Core Ultra 7 155H, NVIDIA GeForce RTX 4070 Laptop GPU (1424 - 1683, n=4) | |
| Asus ROG Zephyrus G16 2024 GU605M | |
| WebXPRT 3 / Overall | |
| HP Omen Transcend 16-u1095ng | |
| Alienware m16 R1 Intel | |
| Alienware x16 R1 | |
| Alienware m16 R2 | |
| Asus ROG Zephyrus G16 2024 GU605M | |
| Przeciętny Intel Core Ultra 7 155H, NVIDIA GeForce RTX 4070 Laptop GPU (264 - 294, n=4) | |
| WebXPRT 4 / Overall | |
| Alienware m16 R1 Intel | |
| Alienware x16 R1 | |
| Alienware m16 R2 | |
| Asus ROG Zephyrus G16 2024 GU605M | |
| Przeciętny Intel Core Ultra 7 155H, NVIDIA GeForce RTX 4070 Laptop GPU (247 - 257, n=4) | |
| Mozilla Kraken 1.1 / Total | |
| Przeciętny Intel Core Ultra 7 155H, NVIDIA GeForce RTX 4070 Laptop GPU (546 - 568, n=3) | |
| Asus ROG Zephyrus G16 2024 GU605M | |
| Alienware m16 R2 | |
| Alienware m16 R1 Intel | |
| Alienware x16 R1 | |
| HP Omen Transcend 16-u1095ng | |
* ... im mniej tym lepiej
| PCMark 10 Score | 7761 pkt. | |
Pomoc | ||
| AIDA64 / Memory Copy | |
| Asus ROG Zephyrus G16 2024 GU605M | |
| Przeciętny Intel Core Ultra 7 155H (62397 - 96791, n=50) | |
| HP Omen Transcend 16-u1095ng | |
| Alienware x16 R1 | |
| Lenovo Legion Slim 7 16APH8 | |
| Alienware m16 R2 | |
| Alienware m16 R1 Intel | |
| AIDA64 / Memory Read | |
| Asus ROG Zephyrus G16 2024 GU605M | |
| HP Omen Transcend 16-u1095ng | |
| Przeciętny Intel Core Ultra 7 155H (60544 - 90647, n=50) | |
| Alienware m16 R2 | |
| Alienware x16 R1 | |
| Alienware m16 R1 Intel | |
| Lenovo Legion Slim 7 16APH8 | |
| AIDA64 / Memory Write | |
| Lenovo Legion Slim 7 16APH8 | |
| Alienware x16 R1 | |
| HP Omen Transcend 16-u1095ng | |
| Asus ROG Zephyrus G16 2024 GU605M | |
| Przeciętny Intel Core Ultra 7 155H (58692 - 93451, n=50) | |
| Alienware m16 R2 | |
| Alienware m16 R1 Intel | |
| AIDA64 / Memory Latency | |
| Przeciętny Intel Core Ultra 7 155H (116.2 - 233, n=50) | |
| Asus ROG Zephyrus G16 2024 GU605M | |
| Alienware m16 R2 | |
| Alienware x16 R1 | |
| Lenovo Legion Slim 7 16APH8 | |
| Alienware m16 R1 Intel | |
| HP Omen Transcend 16-u1095ng | |
* ... im mniej tym lepiej
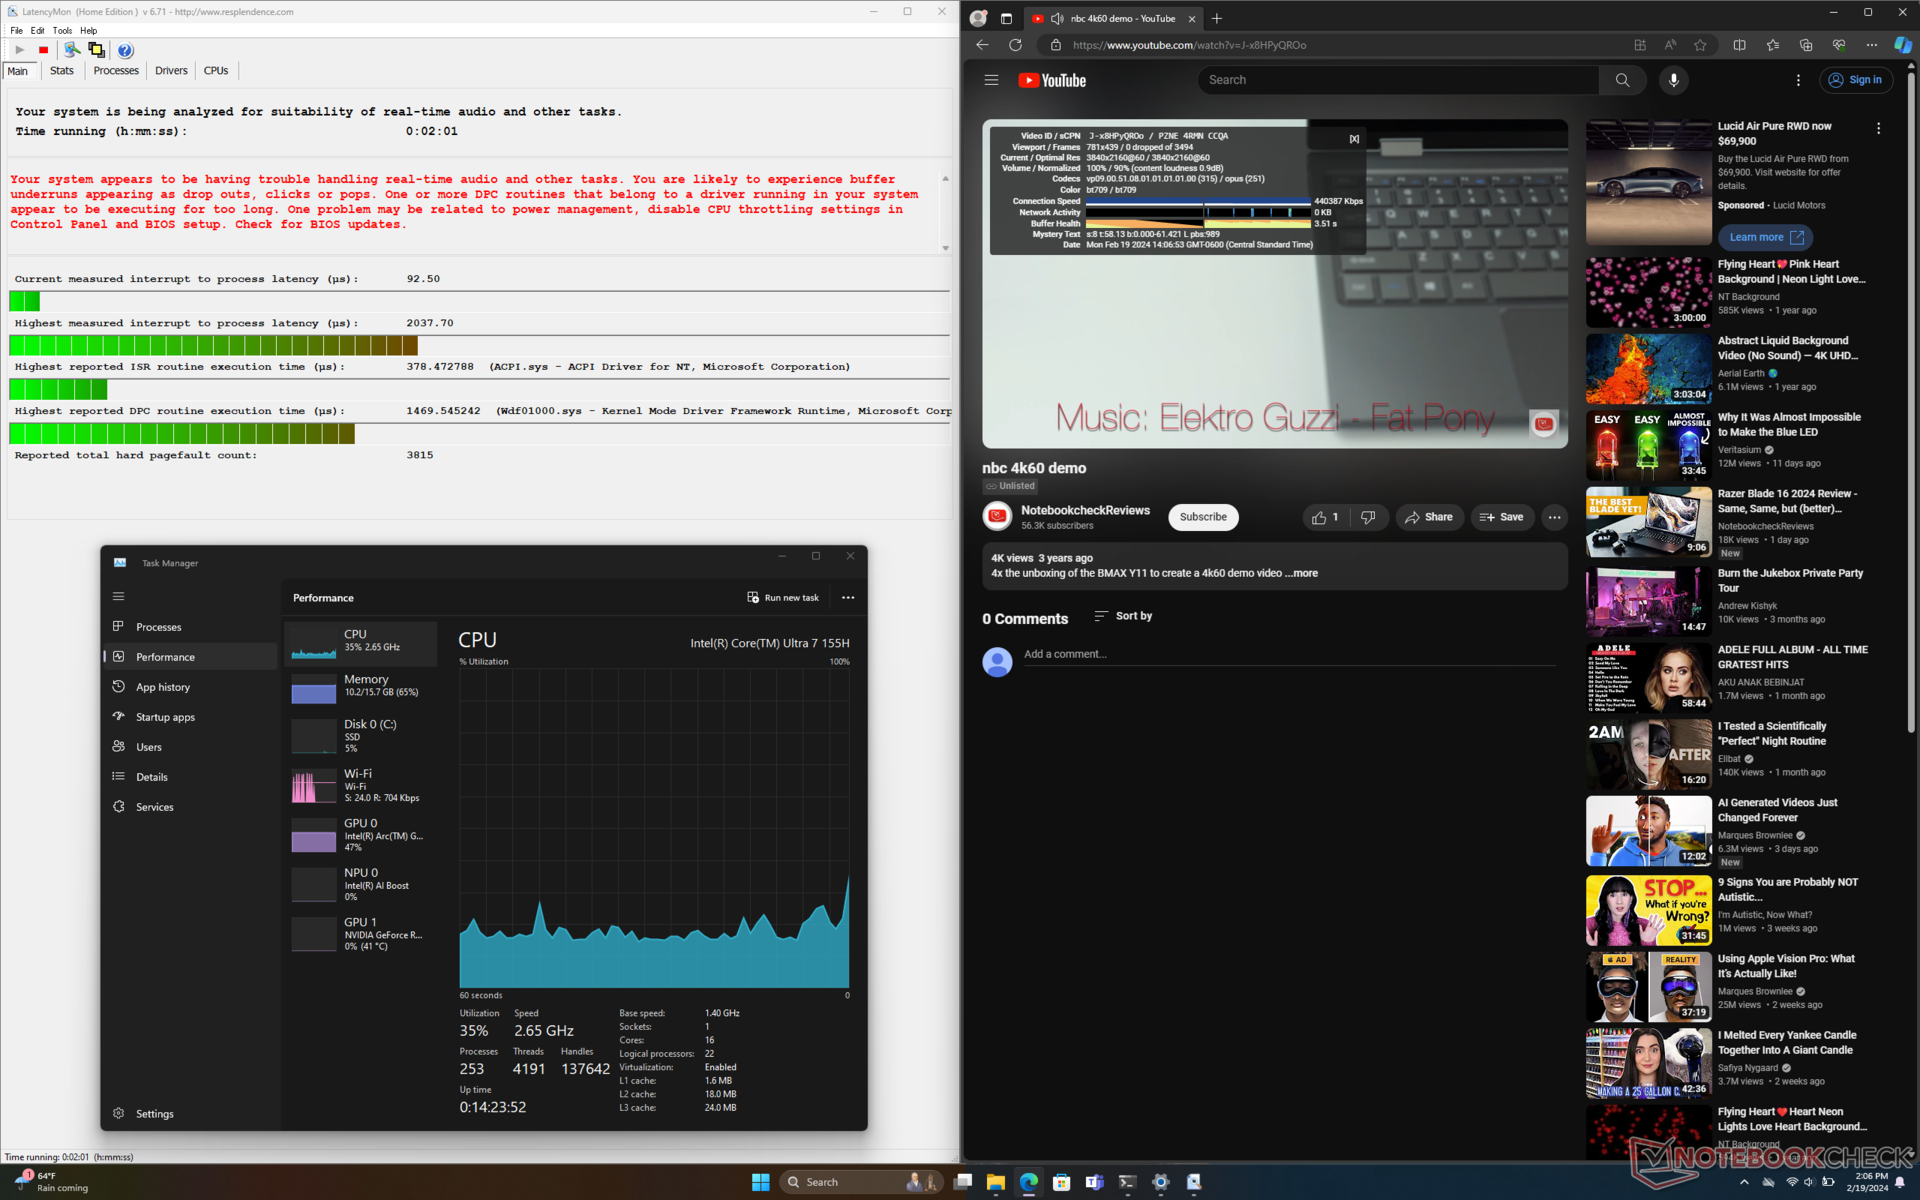
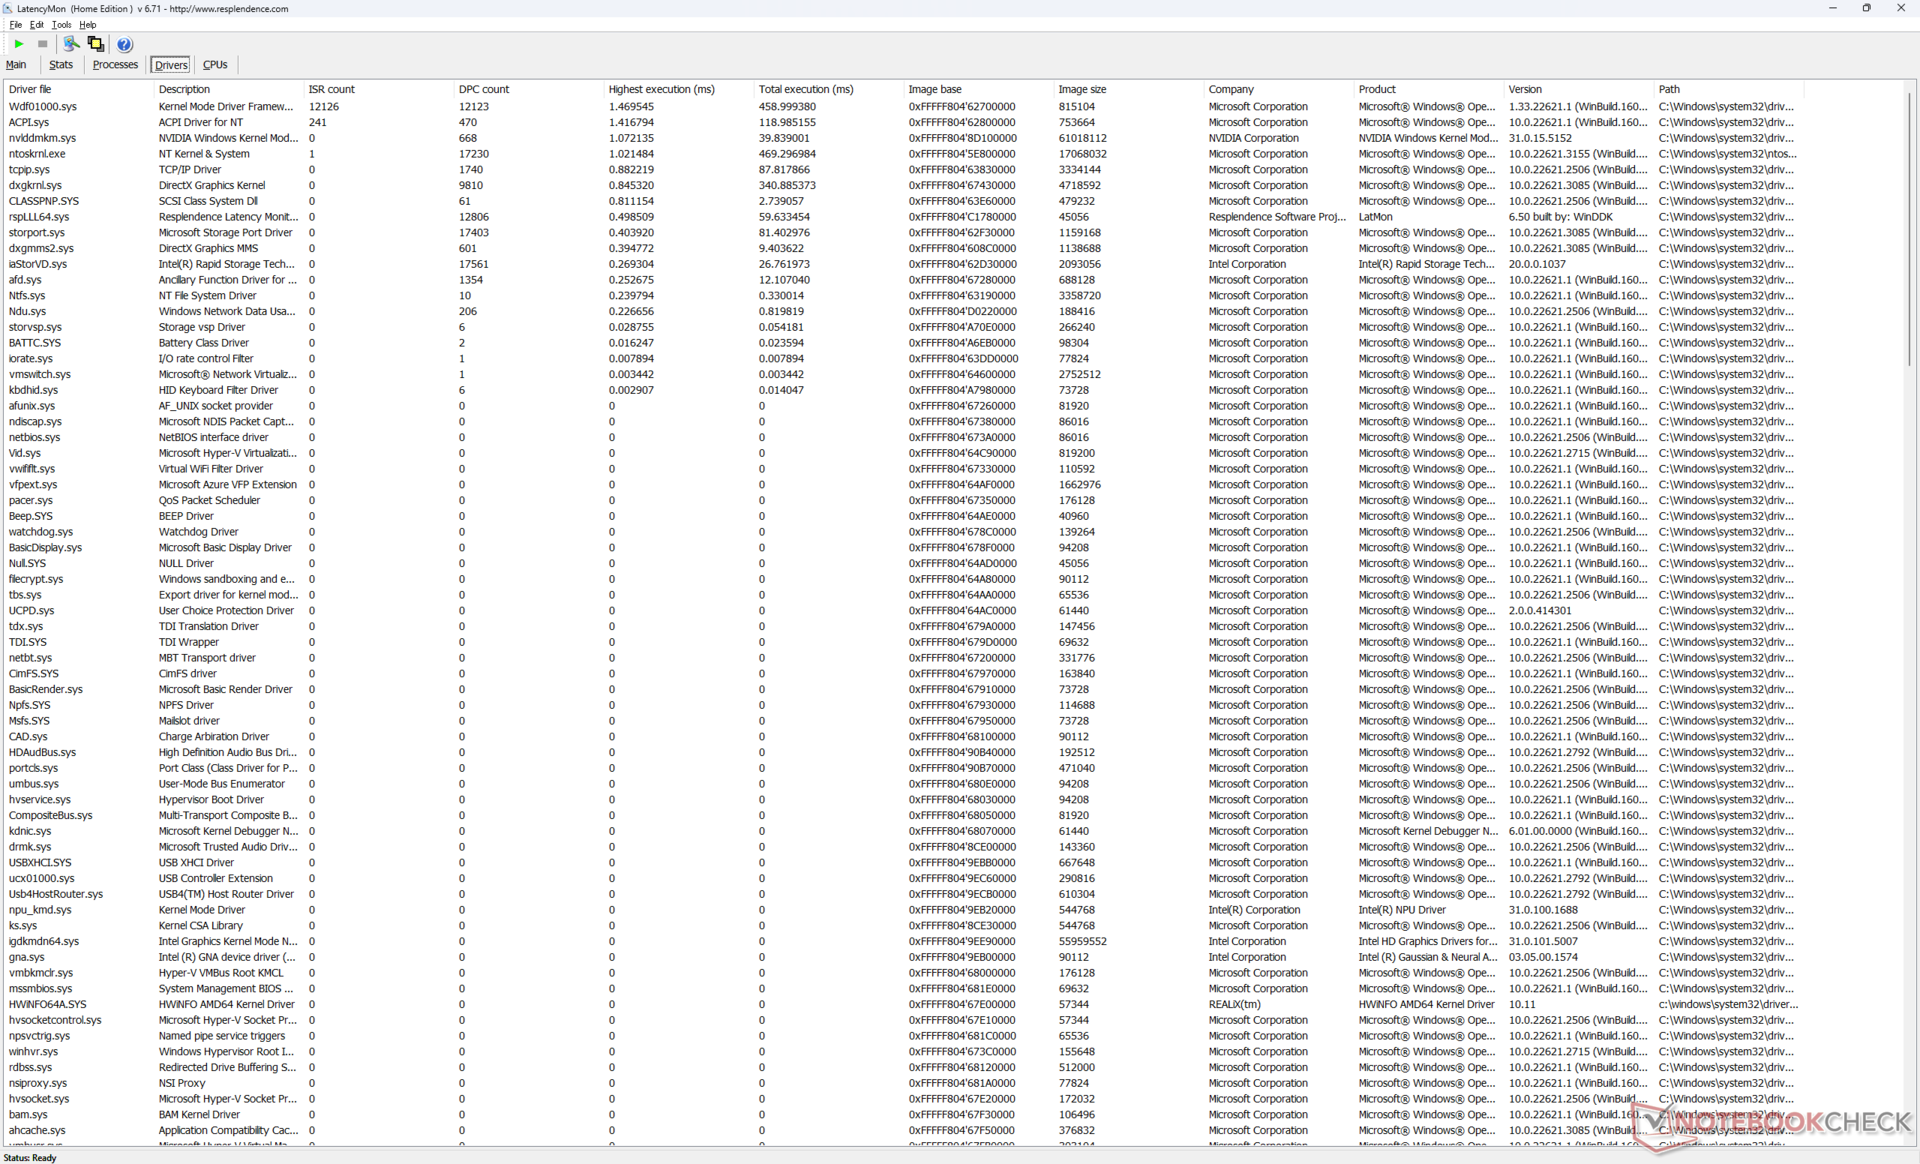
Opóźnienie DPC
LatencyMon ujawnia problemy z DPC podczas otwierania wielu kart na naszej stronie głównej. odtwarzanie wideo 4K przy 60 FPS jest poza tym idealne i nie odnotowano żadnych spadków klatek.
| DPC Latencies / LatencyMon - interrupt to process latency (max), Web, Youtube, Prime95 | |
| Alienware m16 R1 Intel | |
| Asus ROG Zephyrus G16 2024 GU605M | |
| Alienware m16 R2 | |
| HP Omen Transcend 16-u1095ng | |
| Alienware x16 R1 | |
| Lenovo Legion Slim 7 16APH8 | |
* ... im mniej tym lepiej
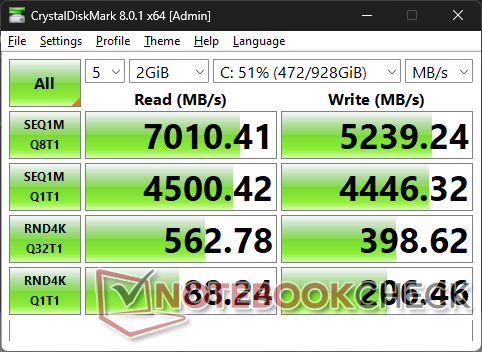
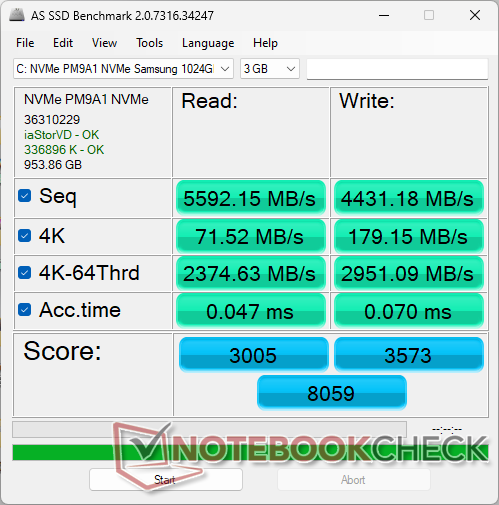
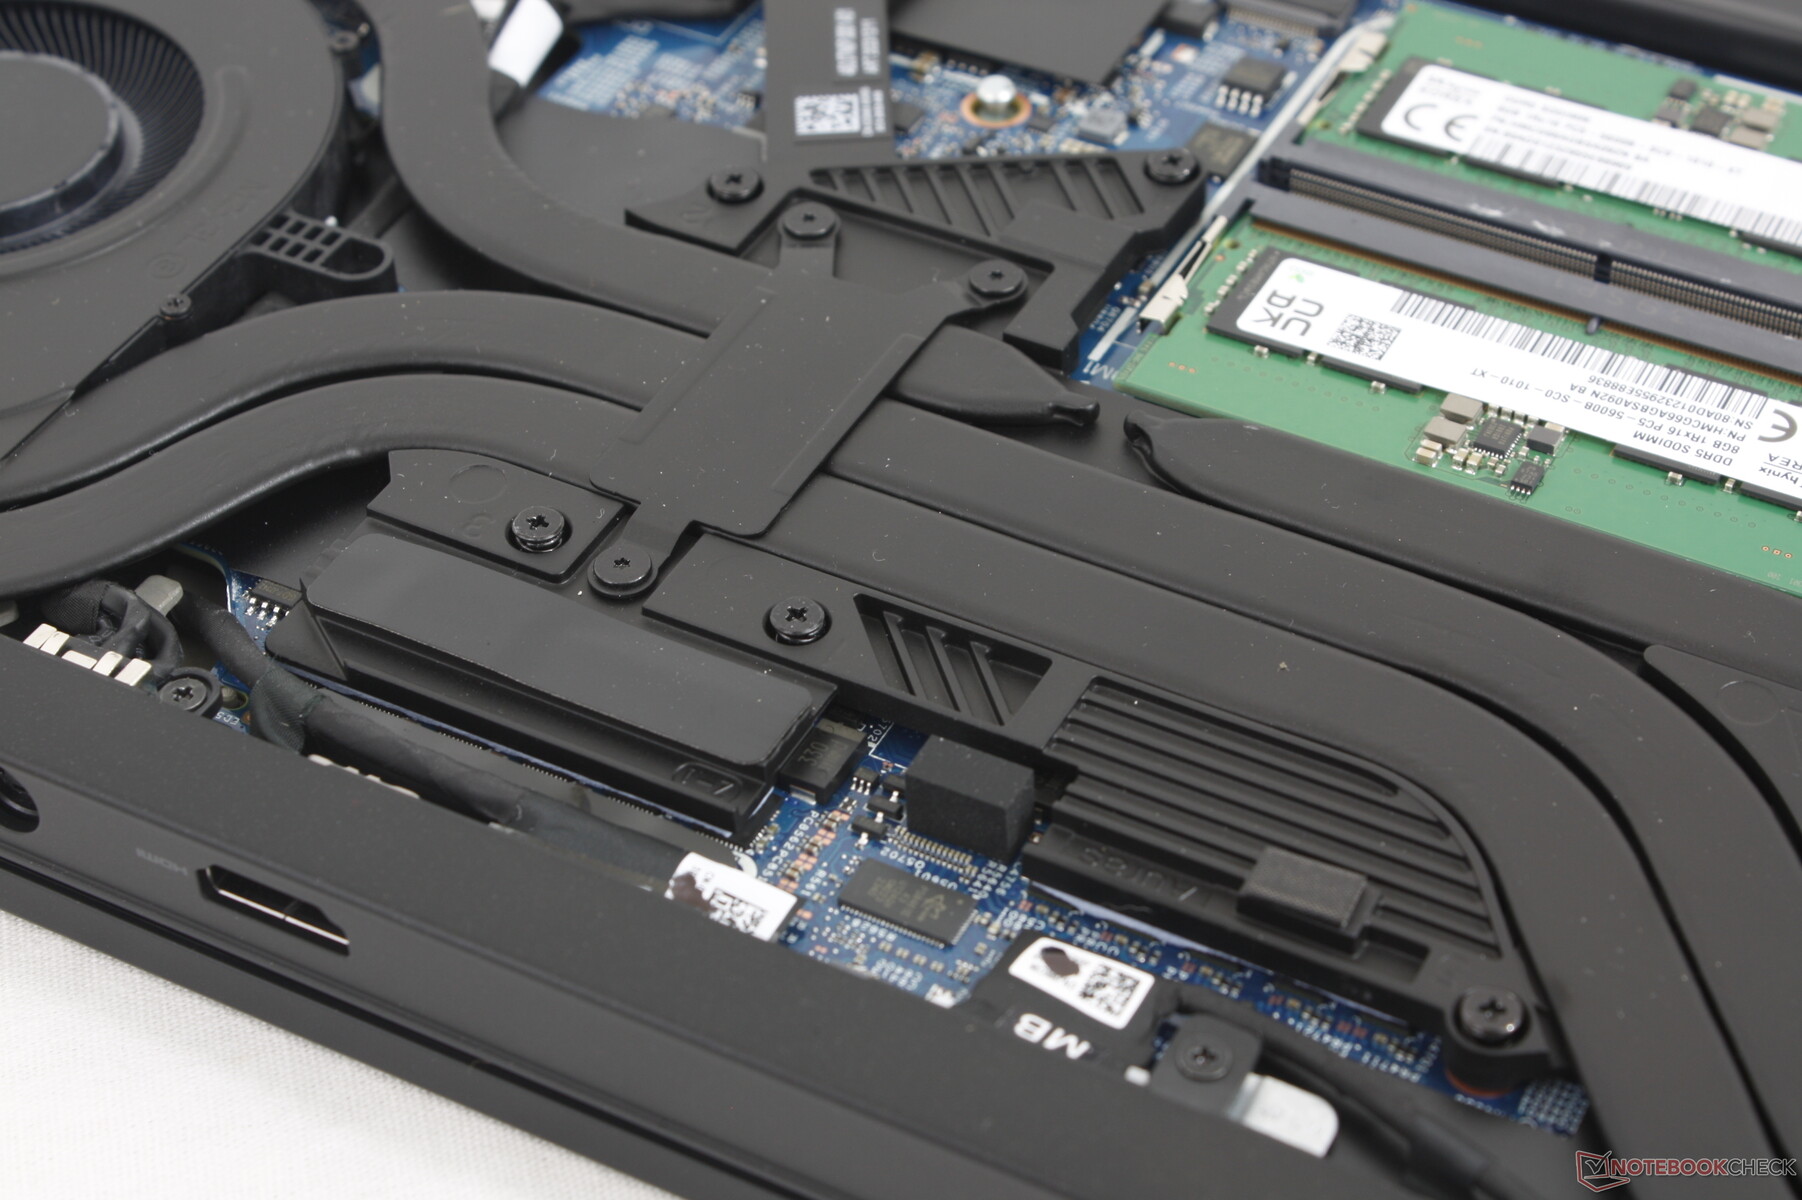
Urządzenia pamięci masowej
Nasze urządzenie jest dostarczane z Samsung PM9A1 PCIe4 x4 NVMe SSD zamiast dysku Kioxia z zeszłorocznego modelu m16 R1. Dysk nie wykazuje żadnych problemów z utrzymaniem maksymalnej szybkości transferu na poziomie 7000 MB/s przez dłuższy czas. Do każdego z dwóch gniazd M.2 2280 dołączono rozpraszacz ciepła.

| Drive Performance rating - Percent | |
| Alienware x16 R1 | |
| Alienware m16 R2 | |
| Alienware m16 R1 Intel | |
| Lenovo Legion Slim 7 16APH8 | |
| HP Omen Transcend 16-u1095ng | |
| Asus ROG Zephyrus G16 2024 GU605M | |
* ... im mniej tym lepiej
Disk Throttling: DiskSpd Read Loop, Queue Depth 8
Wydajność GPU
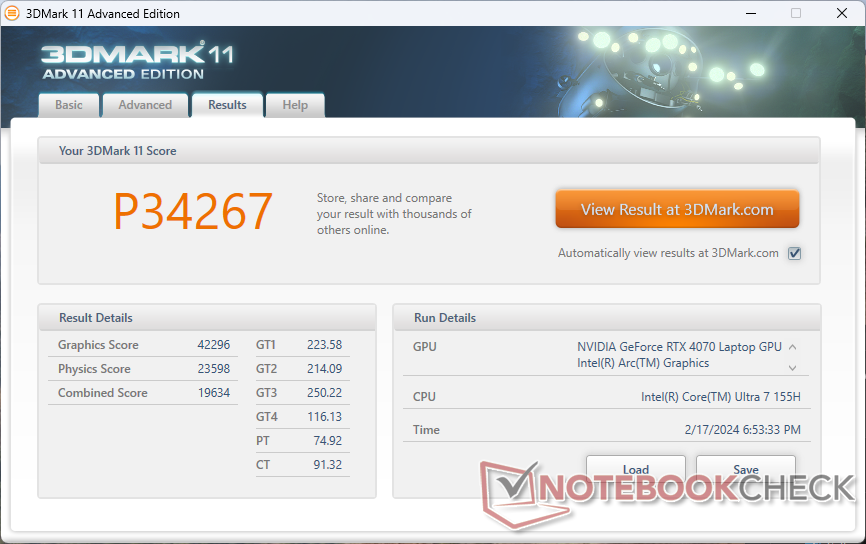
Wydajność graficzna naszego 140 W GeForce RTX 4070 jest o około 10 procent szybsza niż przeciętnego laptopa w naszej bazie danych wyposażonego w ten sam procesor graficzny. Chociaż jest to spadek w stosunku do m16 R1 nawet o 30 do 45 procent ze względu na brak opcji RTX 4080 lub 4090 , dobrze jest przynajmniej zobaczyć, że RTX 4070 osiąga tutaj lepsze wyniki niż oczekiwano. Użytkownicy, którzy chcą RTX 4080 lub 4090, będą musieli zamiast tego rozważyć starszą kartę m16 R1 lub droższą Alienware x16 series.
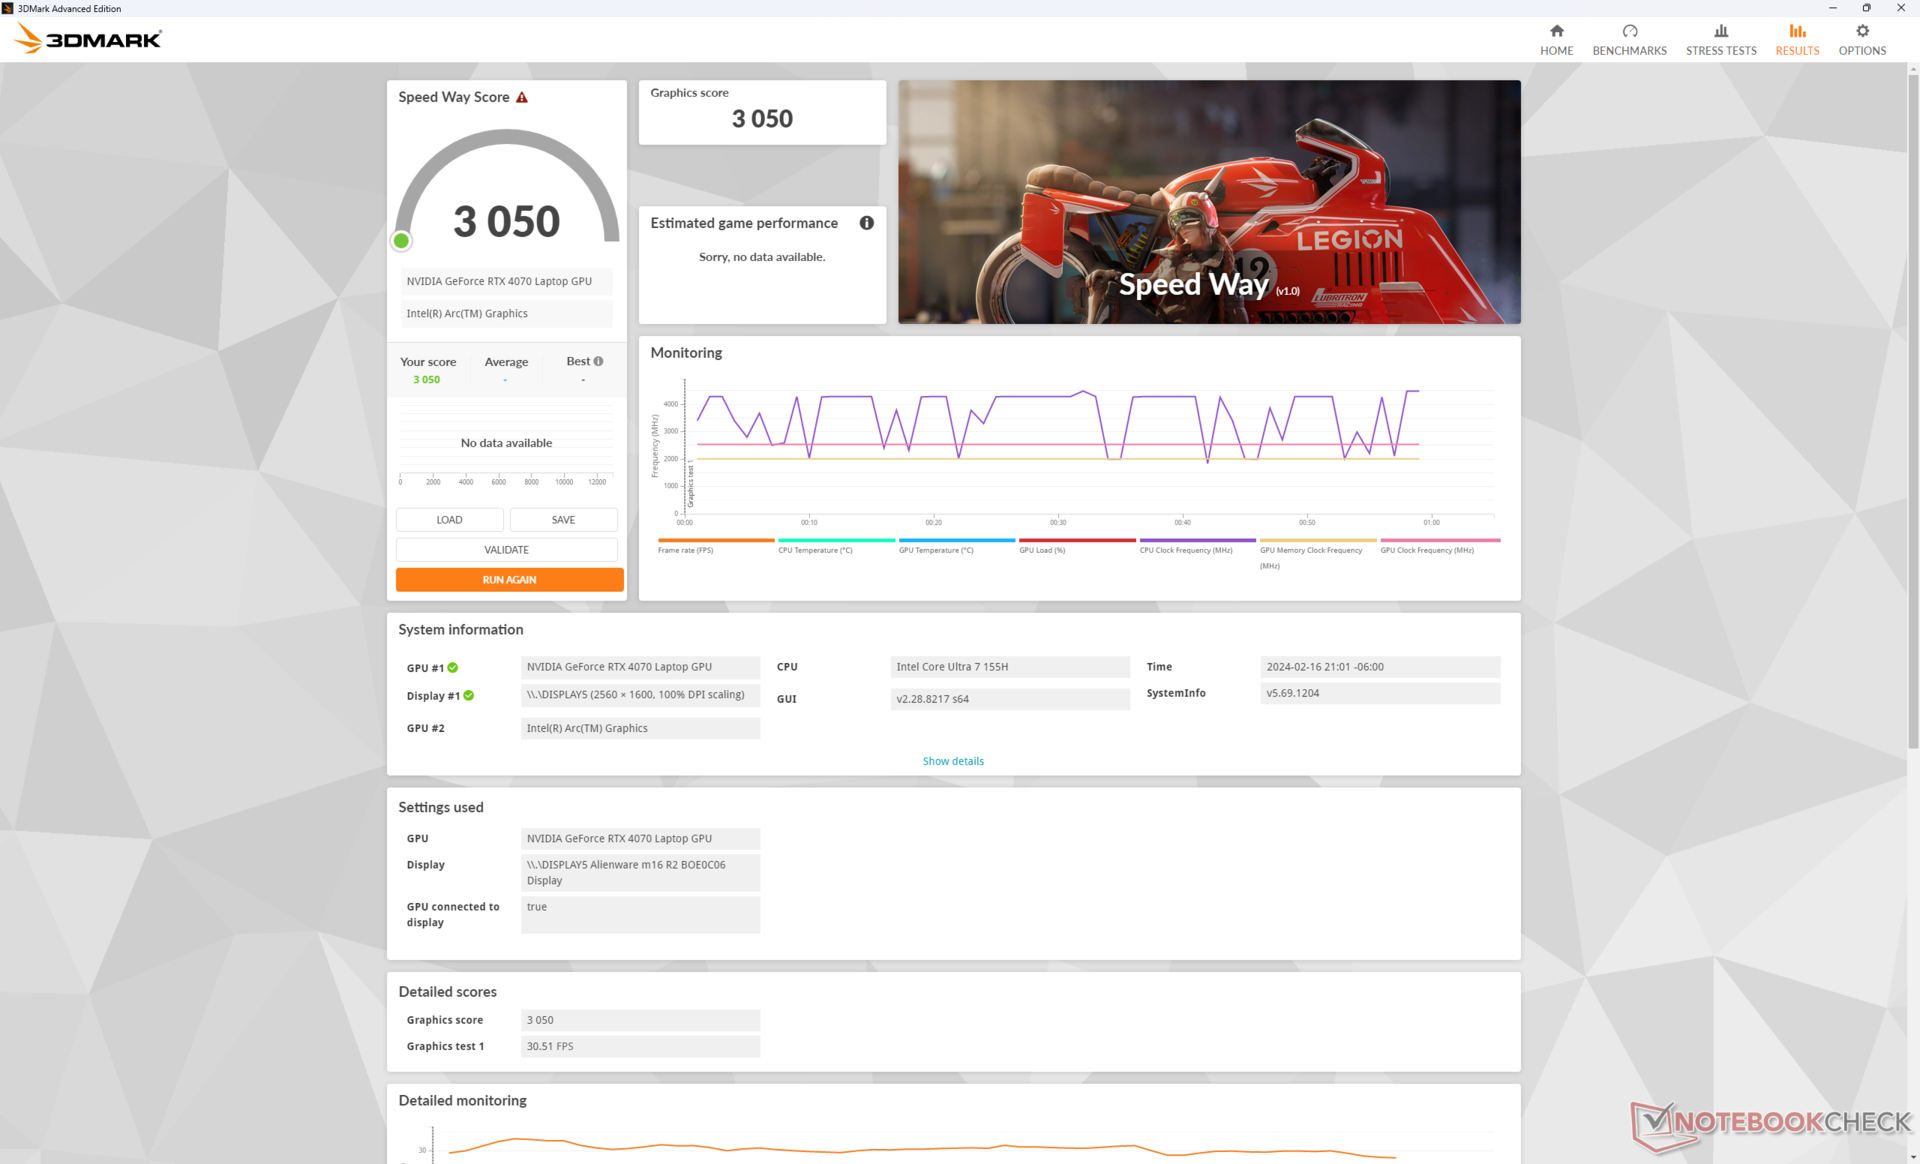
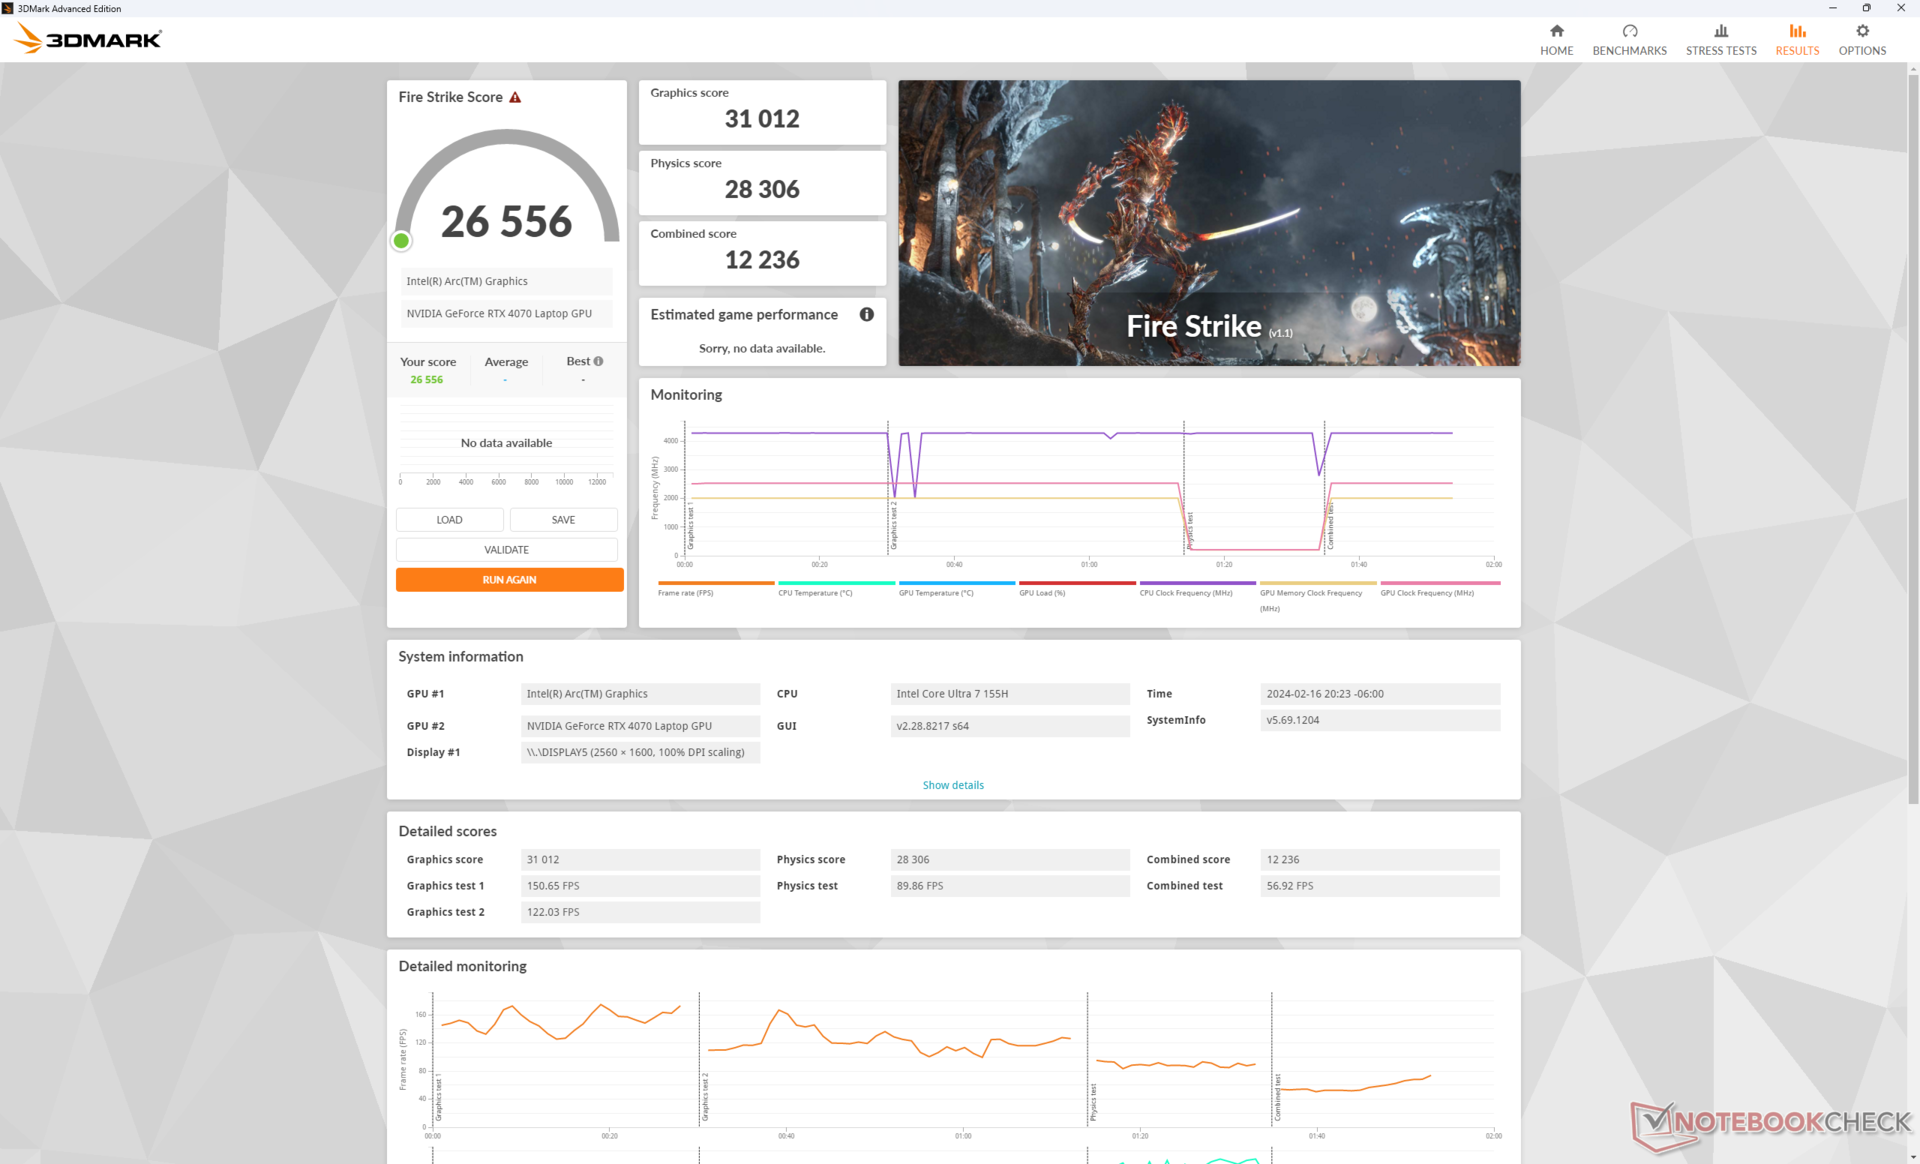
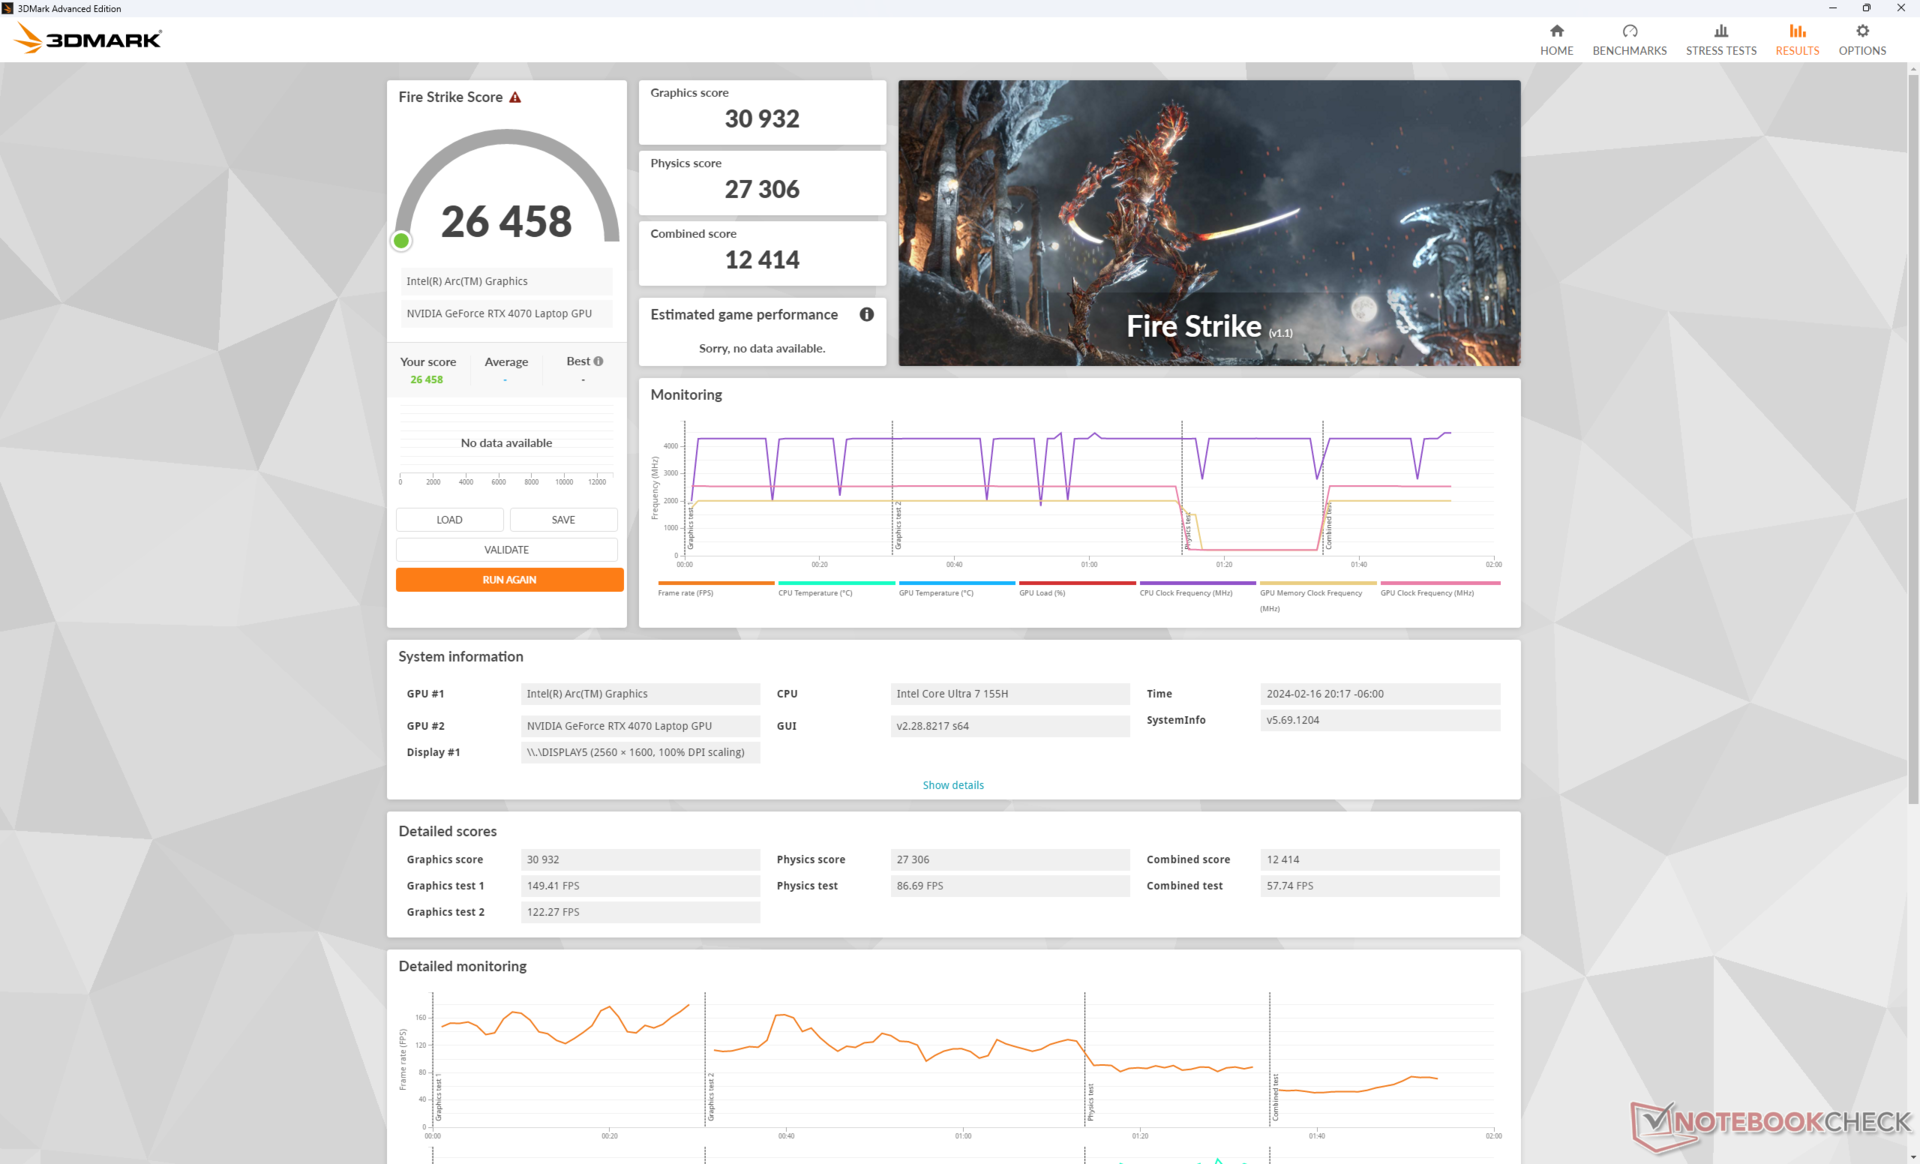
Co ciekawe, różnice w wydajności między trybami Overdrive, Performance i Balanced są w najlepszym razie niewielkie. Jest to zaskakujące, ponieważ przejście do trybu Balanced zazwyczaj wiązałoby się z 10-30% spadkiem wydajności w większości innych laptopów do gier, ale wyniki Fire Strike pozostałyby prawie niezmienione na naszym Alienware m16 R2. Dell zdecydowanie zmienił profile hałasu wentylatora i wynikające z tego zachowania wydajności podczas opracowywania tego modelu.
| Profil zasilania | Wynik grafiki | Wynik fizyki | Łączny wynik |
| Tryb Overdrive | 30932 | 27306 | 12414 |
| Tryb wydajności | 31012 (-0%) | 28306 (-0%) | 12236 (-0%) |
| Tryb zrównoważony | 30603 (-0%) | 28281 (-0%) | 12448 (-0%) |
| Zasilanie bateryjne | 24398 (-21%) | 24684 (-10%) | 10088 (-19%) |
Obniżenie wydajności do RTX 4060 powinno wpłynąć na wydajność o 10 do 15 procent.
| 3DMark Performance rating - Percent | |
| Lenovo Legion 9 16IRX8 | |
| Alienware m16 R1 AMD | |
| Lenovo Legion 7 16IAX7-82TD004SGE -2! | |
| Alienware m16 R2 | |
| HP Omen Transcend 16-u1095ng -2! | |
| Przeciętny NVIDIA GeForce RTX 4070 Laptop GPU | |
| Lenovo Legion 5 16IRX G9 | |
| Asus ROG Zephyrus M16 GU603Z -2! | |
| Framework Laptop 16 | |
| Lenovo Legion S7 16ARHA7 -1! | |
| HP Victus 16-r0076TX -1! | |
| Dell G16 7620 -1! | |
| Asus ROG Zephyrus M16 GU603H -2! | |
| 3DMark 11 - 1280x720 Performance GPU | |
| Lenovo Legion 9 16IRX8 | |
| Alienware m16 R1 AMD | |
| Lenovo Legion 7 16IAX7-82TD004SGE | |
| Alienware m16 R2 | |
| Przeciętny NVIDIA GeForce RTX 4070 Laptop GPU (24229 - 46434, n=67) | |
| HP Omen Transcend 16-u1095ng | |
| Framework Laptop 16 | |
| Lenovo Legion 5 16IRX G9 | |
| Lenovo Legion S7 16ARHA7 | |
| Asus ROG Zephyrus M16 GU603Z | |
| HP Victus 16-r0076TX | |
| Dell G16 7620 | |
| Asus ROG Zephyrus M16 GU603H | |
| 3DMark 11 Performance | 34267 pkt. | |
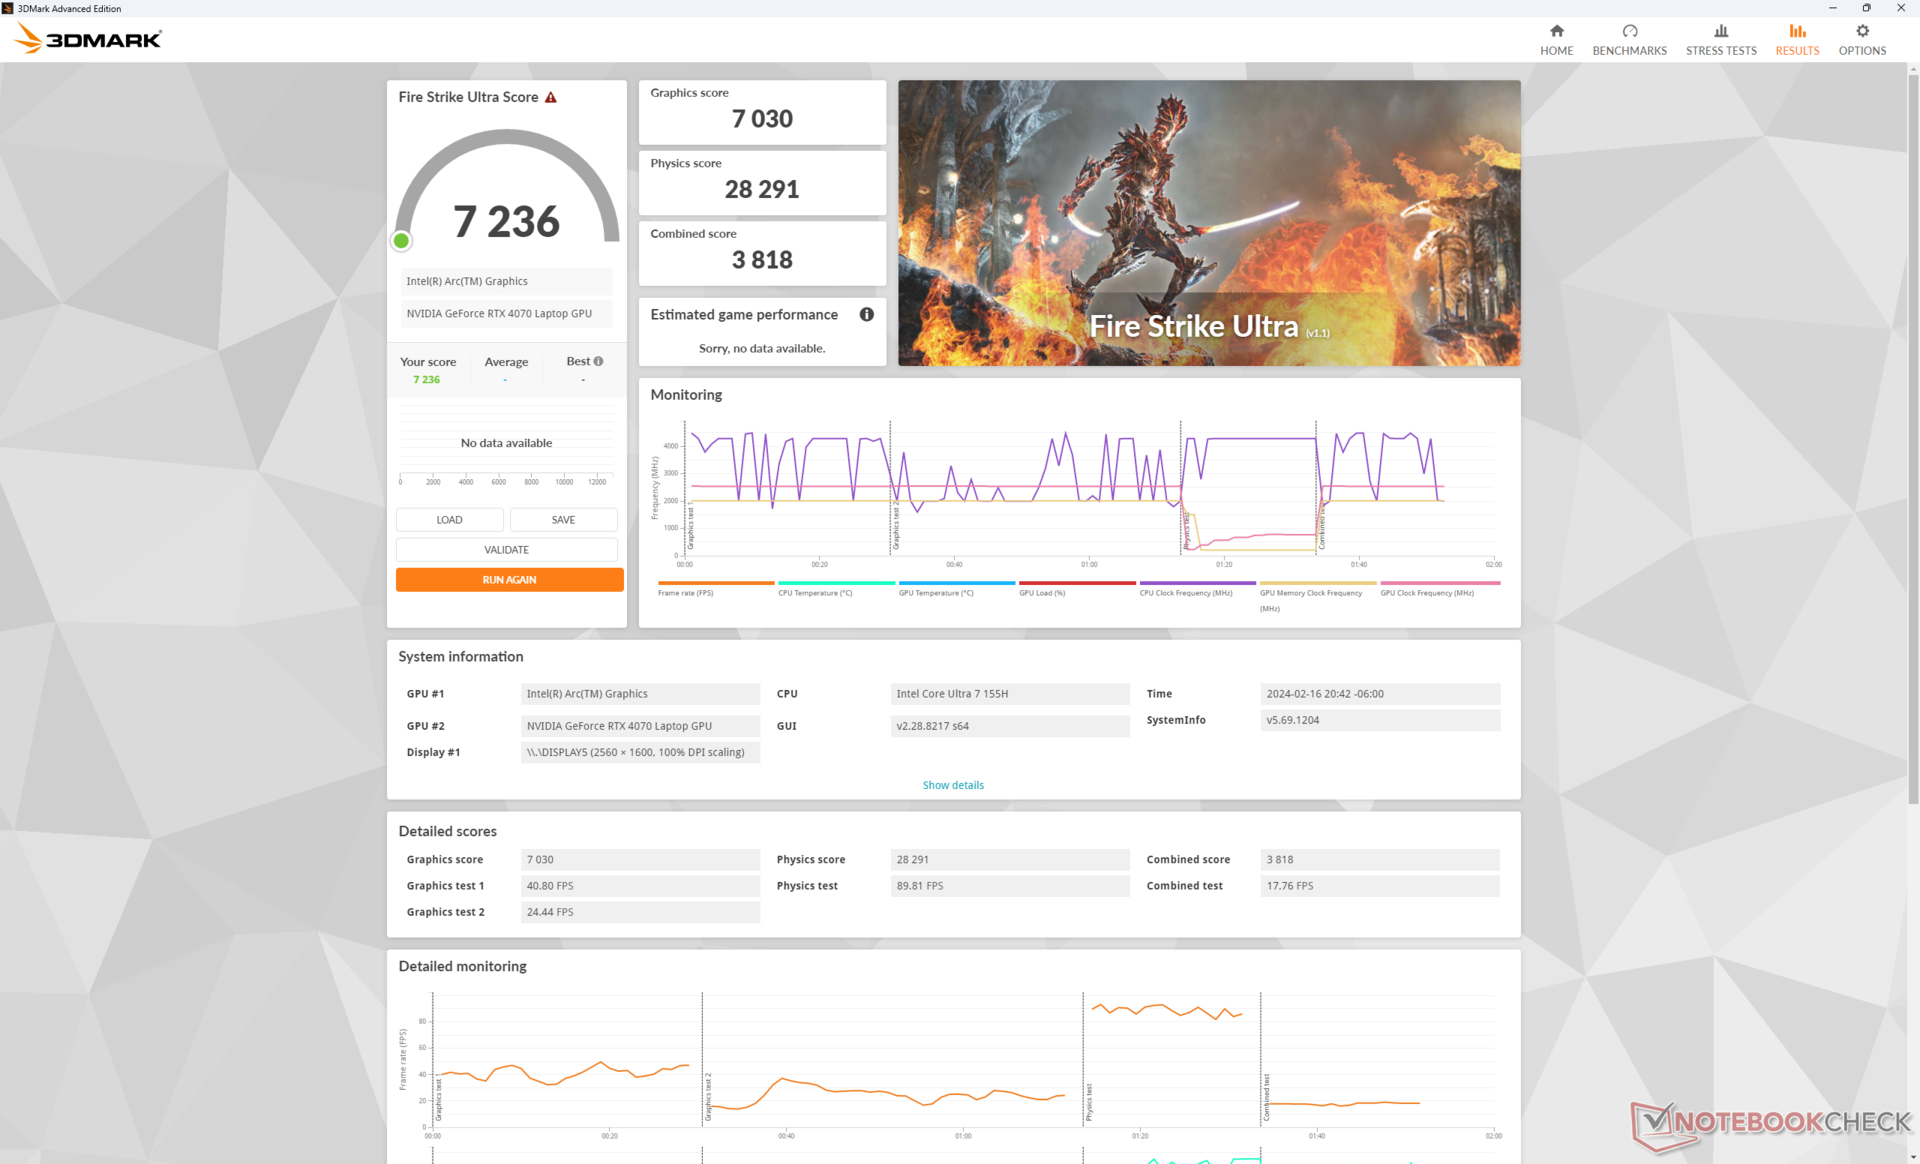
| 3DMark Fire Strike Score | 26458 pkt. | |
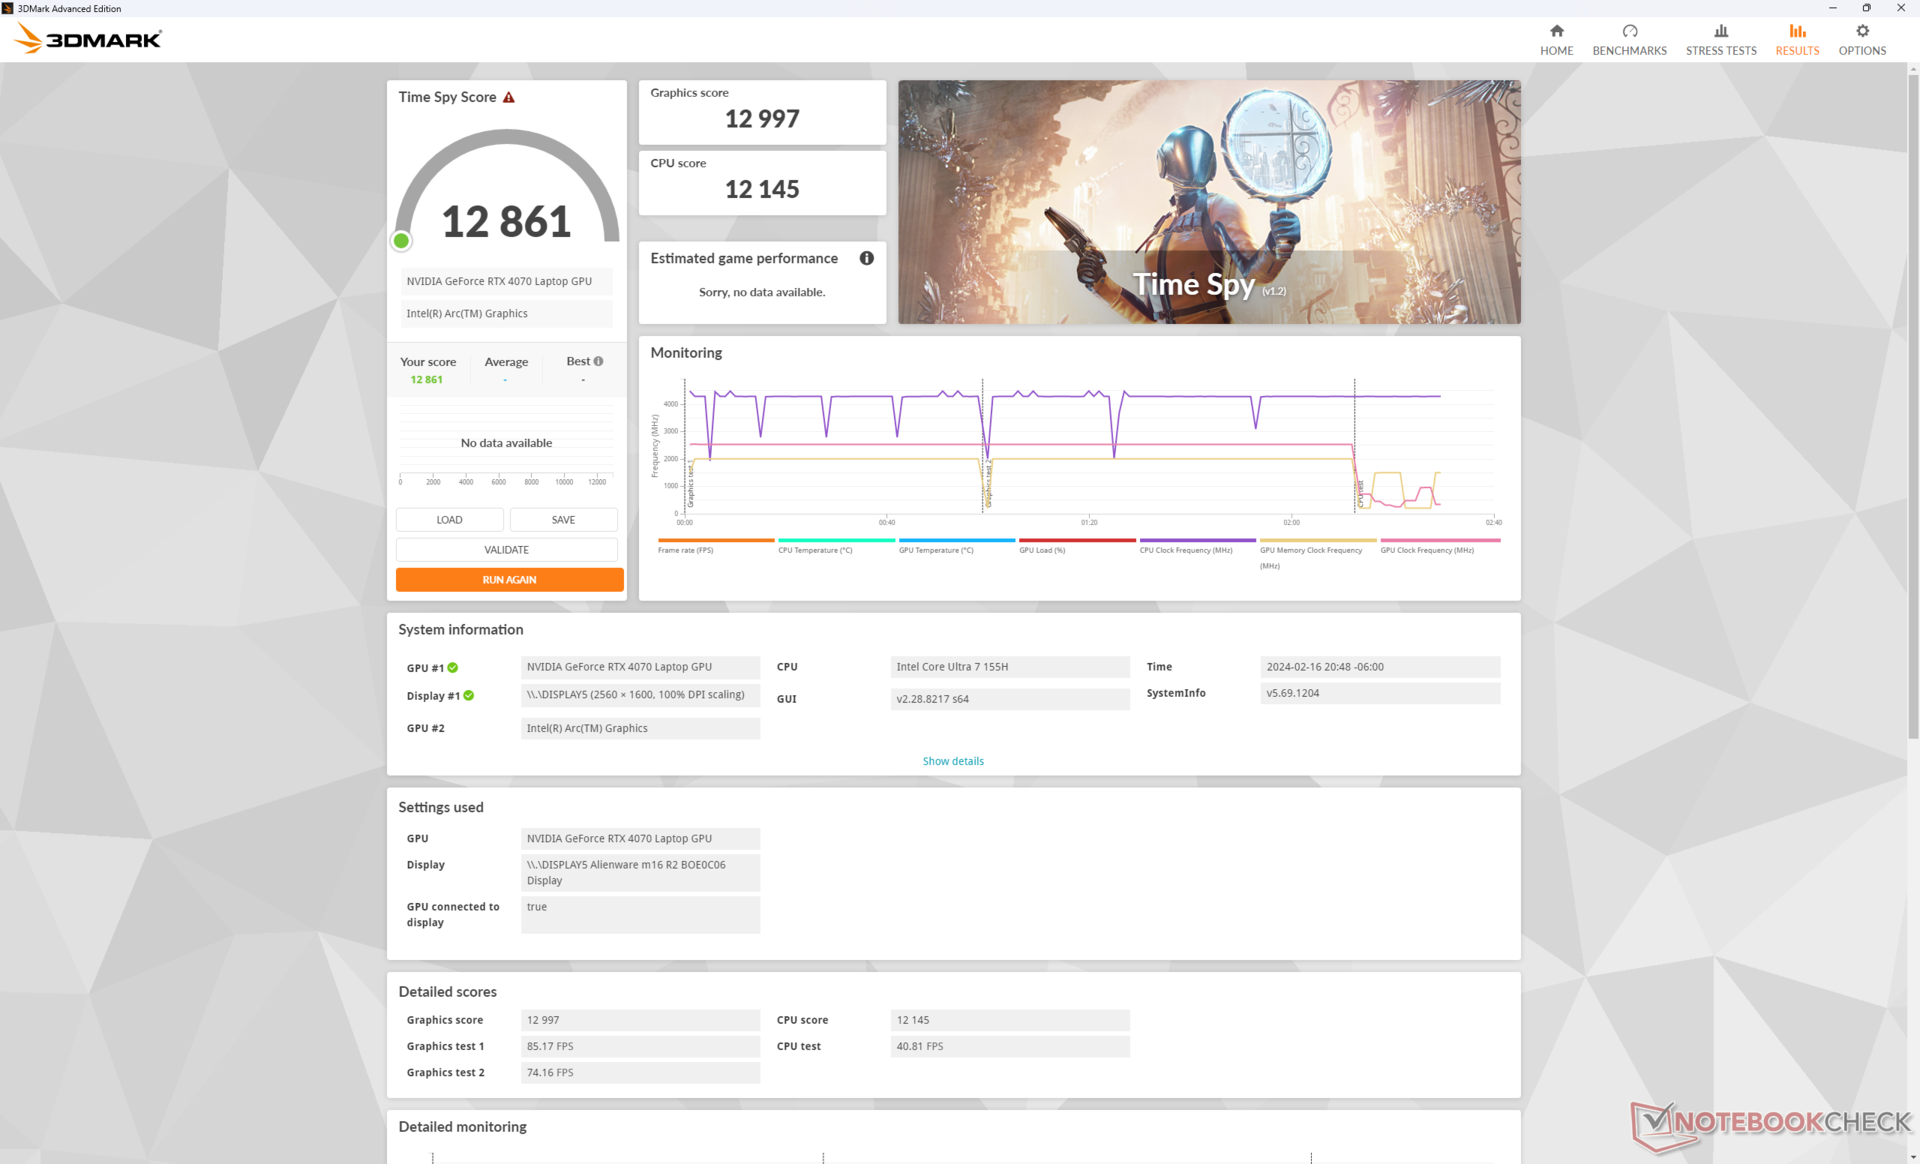
| 3DMark Time Spy Score | 12861 pkt. | |
Pomoc | ||
* ... im mniej tym lepiej
| Performance rating - Percent | |
| Lenovo Legion 9 16IRX8 | |
| Alienware m16 R1 AMD -1! | |
| Lenovo Legion 5 16IRX G9 | |
| Lenovo Legion 7 16IAX7-82TD004SGE | |
| HP Omen Transcend 16-u1095ng | |
| Alienware m16 R2 -1! | |
| Asus ROG Zephyrus M16 GU603Z | |
| Dell G16 7620 | |
| HP Victus 16-r0076TX -1! | |
| Framework Laptop 16 | |
| Asus ROG Zephyrus M16 GU603H | |
| Lenovo Legion S7 16ARHA7 | |
| The Witcher 3 - 1920x1080 Ultra Graphics & Postprocessing (HBAO+) | |
| Lenovo Legion 9 16IRX8 | |
| Alienware m16 R1 AMD | |
| Alienware m16 R2 | |
| Lenovo Legion 7 16IAX7-82TD004SGE | |
| HP Omen Transcend 16-u1095ng | |
| Asus ROG Zephyrus M16 GU603Z | |
| Lenovo Legion 5 16IRX G9 | |
| HP Victus 16-r0076TX | |
| Lenovo Legion S7 16ARHA7 | |
| Asus ROG Zephyrus M16 GU603H | |
| Dell G16 7620 | |
| Framework Laptop 16 | |
| GTA V - 1920x1080 Highest AA:4xMSAA + FX AF:16x | |
| Lenovo Legion 9 16IRX8 | |
| Lenovo Legion 5 16IRX G9 | |
| HP Omen Transcend 16-u1095ng | |
| Lenovo Legion 7 16IAX7-82TD004SGE | |
| Dell G16 7620 | |
| Asus ROG Zephyrus M16 GU603Z | |
| Framework Laptop 16 | |
| Lenovo Legion S7 16ARHA7 | |
| Asus ROG Zephyrus M16 GU603H | |
| Final Fantasy XV Benchmark - 1920x1080 High Quality | |
| Lenovo Legion 9 16IRX8 | |
| Alienware m16 R1 AMD | |
| Lenovo Legion 7 16IAX7-82TD004SGE | |
| Alienware m16 R2 | |
| HP Omen Transcend 16-u1095ng | |
| Lenovo Legion 5 16IRX G9 | |
| Asus ROG Zephyrus M16 GU603Z | |
| Dell G16 7620 | |
| Lenovo Legion S7 16ARHA7 | |
| HP Victus 16-r0076TX | |
| Framework Laptop 16 | |
| Asus ROG Zephyrus M16 GU603H | |
| Strange Brigade - 1920x1080 ultra AA:ultra AF:16 | |
| Lenovo Legion 9 16IRX8 | |
| Alienware m16 R1 AMD | |
| Alienware m16 R2 | |
| Lenovo Legion 5 16IRX G9 | |
| HP Omen Transcend 16-u1095ng | |
| Lenovo Legion S7 16ARHA7 | |
| Asus ROG Zephyrus M16 GU603Z | |
| Dell G16 7620 | |
| HP Victus 16-r0076TX | |
| Framework Laptop 16 | |
| Lenovo Legion 7 16IAX7-82TD004SGE | |
| Asus ROG Zephyrus M16 GU603H | |
| Dota 2 Reborn - 1920x1080 ultra (3/3) best looking | |
| Lenovo Legion 9 16IRX8 | |
| Lenovo Legion 5 16IRX G9 | |
| Lenovo Legion 7 16IAX7-82TD004SGE | |
| Alienware m16 R1 AMD | |
| Asus ROG Zephyrus M16 GU603Z | |
| HP Omen Transcend 16-u1095ng | |
| Dell G16 7620 | |
| HP Victus 16-r0076TX | |
| Alienware m16 R2 | |
| Asus ROG Zephyrus M16 GU603H | |
| Framework Laptop 16 | |
| Lenovo Legion S7 16ARHA7 | |
| X-Plane 11.11 - 1920x1080 high (fps_test=3) | |
| Lenovo Legion 9 16IRX8 | |
| Lenovo Legion 5 16IRX G9 | |
| Lenovo Legion 7 16IAX7-82TD004SGE | |
| Asus ROG Zephyrus M16 GU603Z | |
| HP Omen Transcend 16-u1095ng | |
| Alienware m16 R1 AMD | |
| HP Victus 16-r0076TX | |
| Dell G16 7620 | |
| Alienware m16 R2 | |
| Asus ROG Zephyrus M16 GU603H | |
| Framework Laptop 16 | |
| Lenovo Legion S7 16ARHA7 | |
| F1 22 | |
| 1920x1080 Ultra High Preset AA:T AF:16x | |
| Lenovo Legion 9 16IRX8 | |
| Alienware m16 R1 AMD | |
| Alienware m16 R2 | |
| Przeciętny NVIDIA GeForce RTX 4070 Laptop GPU (39.2 - 88.7, n=32) | |
| Lenovo Legion 5 16IRX G9 | |
| HP Victus 16-r0076TX | |
| Framework Laptop 16 | |
| 2560x1440 Ultra High Preset AA:T AF:16x | |
| Lenovo Legion 9 16IRX8 | |
| Alienware m16 R1 AMD | |
| Alienware m16 R2 | |
| Przeciętny NVIDIA GeForce RTX 4070 Laptop GPU (10.6 - 58.8, n=30) | |
| Lenovo Legion 5 16IRX G9 | |
| Framework Laptop 16 | |
| 3840x2160 Ultra High Preset AA:T AF:16x | |
| Alienware m16 R1 AMD | |
| Alienware m16 R2 | |
| Przeciętny NVIDIA GeForce RTX 4070 Laptop GPU (4.7 - 27.6, n=15) | |
| Framework Laptop 16 | |
| The Witcher 3 | |
| 1920x1080 Ultra Graphics & Postprocessing (HBAO+) | |
| Lenovo Legion 9 16IRX8 | |
| Alienware m16 R1 AMD | |
| Alienware m16 R2 | |
| Lenovo Legion 7 16IAX7-82TD004SGE | |
| HP Omen Transcend 16-u1095ng | |
| Przeciętny NVIDIA GeForce RTX 4070 Laptop GPU (69.8 - 133.7, n=57) | |
| Asus ROG Zephyrus M16 GU603Z | |
| Lenovo Legion 5 16IRX G9 | |
| HP Victus 16-r0076TX | |
| Lenovo Legion S7 16ARHA7 | |
| Asus ROG Zephyrus M16 GU603H | |
| Dell G16 7620 | |
| Framework Laptop 16 | |
| 3840x2160 High Graphics & Postprocessing (Nvidia HairWorks Off) | |
| Alienware m16 R1 AMD | |
| Alienware m16 R2 | |
| Przeciętny NVIDIA GeForce RTX 4070 Laptop GPU (26.5 - 83.5, n=16) | |
| Framework Laptop 16 | |
| Dota 2 Reborn | |
| 1920x1080 ultra (3/3) best looking | |
| Lenovo Legion 9 16IRX8 | |
| Lenovo Legion 5 16IRX G9 | |
| Lenovo Legion 7 16IAX7-82TD004SGE | |
| Alienware m16 R1 AMD | |
| Asus ROG Zephyrus M16 GU603Z | |
| HP Omen Transcend 16-u1095ng | |
| Przeciętny NVIDIA GeForce RTX 4070 Laptop GPU (89.7 - 191.2, n=67) | |
| Dell G16 7620 | |
| HP Victus 16-r0076TX | |
| Alienware m16 R2 | |
| Asus ROG Zephyrus M16 GU603H | |
| Framework Laptop 16 | |
| Lenovo Legion S7 16ARHA7 | |
| 3840x2160 ultra (3/3) best looking | |
| Alienware m16 R1 AMD | |
| Alienware m16 R2 | |
| Przeciętny NVIDIA GeForce RTX 4070 Laptop GPU (88.4 - 153.3, n=26) | |
| Framework Laptop 16 | |
| Final Fantasy XV Benchmark | |
| 1920x1080 High Quality | |
| Lenovo Legion 9 16IRX8 | |
| Alienware m16 R1 AMD | |
| Lenovo Legion 7 16IAX7-82TD004SGE | |
| Alienware m16 R2 | |
| Przeciętny NVIDIA GeForce RTX 4070 Laptop GPU (41 - 131.9, n=65) | |
| HP Omen Transcend 16-u1095ng | |
| Lenovo Legion 5 16IRX G9 | |
| Asus ROG Zephyrus M16 GU603Z | |
| Dell G16 7620 | |
| Lenovo Legion S7 16ARHA7 | |
| HP Victus 16-r0076TX | |
| Framework Laptop 16 | |
| Asus ROG Zephyrus M16 GU603H | |
| 2560x1440 High Quality | |
| Lenovo Legion 9 16IRX8 | |
| Alienware m16 R1 AMD | |
| Lenovo Legion 7 16IAX7-82TD004SGE | |
| Alienware m16 R2 | |
| Przeciętny NVIDIA GeForce RTX 4070 Laptop GPU (32.5 - 119.9, n=57) | |
| Lenovo Legion 5 16IRX G9 | |
| Asus ROG Zephyrus M16 GU603Z | |
| Dell G16 7620 | |
| Lenovo Legion S7 16ARHA7 | |
| Framework Laptop 16 | |
| Asus ROG Zephyrus M16 GU603H | |
| 3840x2160 High Quality | |
| Alienware m16 R1 AMD | |
| Alienware m16 R2 | |
| Przeciętny NVIDIA GeForce RTX 4070 Laptop GPU (26.6 - 52.8, n=23) | |
| Asus ROG Zephyrus M16 GU603Z | |
| Framework Laptop 16 | |
| X-Plane 11.11 | |
| 1920x1080 high (fps_test=3) | |
| Lenovo Legion 9 16IRX8 | |
| Lenovo Legion 5 16IRX G9 | |
| Lenovo Legion 7 16IAX7-82TD004SGE | |
| Asus ROG Zephyrus M16 GU603Z | |
| HP Omen Transcend 16-u1095ng | |
| Alienware m16 R1 AMD | |
| HP Victus 16-r0076TX | |
| Przeciętny NVIDIA GeForce RTX 4070 Laptop GPU (52.1 - 147.9, n=69) | |
| Dell G16 7620 | |
| Alienware m16 R2 | |
| Asus ROG Zephyrus M16 GU603H | |
| Framework Laptop 16 | |
| Lenovo Legion S7 16ARHA7 | |
| 3840x2160 high (fps_test=3) | |
| Alienware m16 R1 AMD | |
| Przeciętny NVIDIA GeForce RTX 4070 Laptop GPU (63.4 - 125.8, n=26) | |
| Alienware m16 R2 | |
| Framework Laptop 16 | |
| Tiny Tina's Wonderlands | |
| 1920x1080 Badass Preset (DX12) | |
| Lenovo Legion 9 16IRX8 | |
| Alienware m16 R1 AMD | |
| Alienware m16 R2 | |
| Przeciętny NVIDIA GeForce RTX 4070 Laptop GPU (58.6 - 115.9, n=18) | |
| Framework Laptop 16 | |
| 2560x1440 Badass Preset (DX12) | |
| Lenovo Legion 9 16IRX8 | |
| Alienware m16 R1 AMD | |
| Alienware m16 R2 | |
| Przeciętny NVIDIA GeForce RTX 4070 Laptop GPU (49.8 - 79.5, n=17) | |
| Framework Laptop 16 | |
| 3840x2160 Badass Preset (DX12) | |
| Alienware m16 R1 AMD | |
| Przeciętny NVIDIA GeForce RTX 4070 Laptop GPU (28.3 - 39.7, n=13) | |
| Alienware m16 R2 | |
| Framework Laptop 16 | |
| Baldur's Gate 3 | |
| 1920x1080 Ultra Preset AA:T | |
| Alienware m16 R2 | |
| Przeciętny NVIDIA GeForce RTX 4070 Laptop GPU (66.7 - 128.5, n=30) | |
| Framework Laptop 16 | |
| 2560x1440 Ultra Preset AA:T | |
| Alienware m16 R2 | |
| Przeciętny NVIDIA GeForce RTX 4070 Laptop GPU (54.4 - 89.6, n=25) | |
| Framework Laptop 16 | |
| 3840x2160 Ultra Preset AA:T | |
| Alienware m16 R2 | |
| Przeciętny NVIDIA GeForce RTX 4070 Laptop GPU (33.4 - 45.2, n=12) | |
| Framework Laptop 16 | |
| Cyberpunk 2077 | |
| 1920x1080 Ultra Preset (FSR off) | |
| Lenovo Legion 9 16IRX8 | |
| Alienware m16 R2 | |
| Lenovo Legion 5 16IRX G9 | |
| Przeciętny NVIDIA GeForce RTX 4070 Laptop GPU (30.7 - 90.7, n=40) | |
| Framework Laptop 16 | |
| 2560x1440 Ultra Preset (FSR off) | |
| Lenovo Legion 9 16IRX8 | |
| Alienware m16 R2 | |
| Lenovo Legion 5 16IRX G9 | |
| Przeciętny NVIDIA GeForce RTX 4070 Laptop GPU (24.8 - 57.1, n=37) | |
| Framework Laptop 16 | |
| 3840x2160 Ultra Preset (FSR off) | |
| Przeciętny NVIDIA GeForce RTX 4070 Laptop GPU (20.2 - 24, n=13) | |
| Alienware m16 R2 | |
| Framework Laptop 16 | |
Witcher 3 FPS Chart
| low | med. | high | ultra | QHD | 4K | |
|---|---|---|---|---|---|---|
| The Witcher 3 (2015) | 399.6 | 344.6 | 240.5 | 121.3 | 72 | |
| Dota 2 Reborn (2015) | 166.8 | 149 | 149.5 | 139.7 | 130.6 | |
| Final Fantasy XV Benchmark (2018) | 184.6 | 165.1 | 119.3 | 85.2 | 48.5 | |
| X-Plane 11.11 (2018) | 132.3 | 116 | 90.8 | 78.2 | ||
| Far Cry 5 (2018) | 146 | 134 | 123 | 115 | 61 | |
| Strange Brigade (2018) | 427 | 308 | 255 | 219 | 141.7 | 73.8 |
| Tiny Tina's Wonderlands (2022) | 244 | 202.8 | 138.3 | 107.6 | 74.6 | 34.8 |
| F1 22 (2022) | 235 | 225 | 217 | 83.6 | 52.9 | 26.6 |
| Baldur's Gate 3 (2023) | 168.7 | 148.9 | 129.3 | 128.5 | 88.3 | 44.3 |
| Cyberpunk 2077 (2023) | 125.7 | 114.1 | 95.6 | 83.1 | 52.7 | 21 |
Emisje
Hałas systemowy
Hałas wentylatorów uległ znacznej poprawie w porównaniu do m16 R1. Na przykład podczas uruchamiania 3DMark 06 w trybie zrównoważonym, m16 R2 pozostawał cichszy przez dłuższy czas na poziomie 32 dB(A), podczas gdy m16 R1 był niepotrzebnie głośny na poziomie 52 dB(A) przez całą pierwszą scenę testu porównawczego. To sprawia, że m16 R2 jest bardziej porównywalny z konkurentami, takimi jak Lenovo Legion Slim 7 w podobnych warunkach.
Hałas wentylatora podczas grania jest ściśle powiązany z wybranym profilem zasilania. Na przykład, hałas wentylatora oscylowałby na poziomie 52 dB(A), 54 dB(A) i 62 dB(A) podczas pracy w trybie Witcher 3 odpowiednio w trybie zrównoważonym, trybie wydajności i trybie Overdrive. Ponieważ różnice w wydajności między tymi trzema trybami są bardzo niewielkie, jak wspomniano powyżej, zalecamy granie w trybie wydajności i unikanie trybu Overdrive w większości scenariuszy. Maksymalne 62 dB(A) jest znacznie głośniejsze niż to, co zarejestrowaliśmy nawet na mocniejszym Alienware x16 R1, ale ten tryb jest przeznaczony głównie do podkręcania przez użytkowników końcowych; tryb wydajności jest wystarczający dla ustawień fabrycznych.
Hałas
| luz |
| 25.3 / 25.3 / 25.3 dB |
| obciążenie |
| 31.7 / 62 dB |
 | ||
30 dB cichy 40 dB(A) słyszalny 50 dB(A) irytujący |
||
min: | ||
| Alienware m16 R2 GeForce RTX 4070 Laptop GPU, Ultra 7 155H, Samsung PM9A1 MZVL21T0HCLR | Alienware m16 R1 Intel GeForce RTX 4060 Laptop GPU, i7-13700HX, Kioxia KXG70ZNV512G | Alienware x16 R1 GeForce RTX 4080 Laptop GPU, i9-13900HK, SK hynix PC801 HFS001TEJ9X101N | HP Omen Transcend 16-u1095ng GeForce RTX 4070 Laptop GPU, i9-14900HX, Kioxia XG8 KXG80ZNV1T02 | Asus ROG Zephyrus G16 2024 GU605M GeForce RTX 4070 Laptop GPU, Ultra 7 155H, WD PC SN560 SDDPNQE-1T00 | Lenovo Legion Slim 7 16APH8 GeForce RTX 4060 Laptop GPU, R7 7840HS, WDC PC SN810 1TB | |
|---|---|---|---|---|---|---|
| Noise | -8% | 1% | -8% | 2% | 0% | |
| wyłączone / środowisko * (dB) | 24.7 | 25 -1% | 22.7 8% | 24 3% | 23.9 3% | 24 3% |
| Idle Minimum * (dB) | 25.3 | 25 1% | 23.1 9% | 29 -15% | 23.9 6% | 25 1% |
| Idle Average * (dB) | 25.3 | 26 -3% | 25.8 -2% | 30 -19% | 27.8 -10% | 28 -11% |
| Idle Maximum * (dB) | 25.3 | 27 -7% | 25.8 -2% | 31 -23% | 30.1 -19% | 31 -23% |
| Load Average * (dB) | 31.7 | 52 -64% | 39.3 -24% | 45 -42% | 34.2 -8% | 33 -4% |
| Witcher 3 ultra * (dB) | 53.8 | 51 5% | 49.9 7% | 44 18% | 46.4 14% | 47 13% |
| Load Maximum * (dB) | 62 | 53 15% | 54.8 12% | 47 24% | 46.4 25% | 49 21% |
* ... im mniej tym lepiej
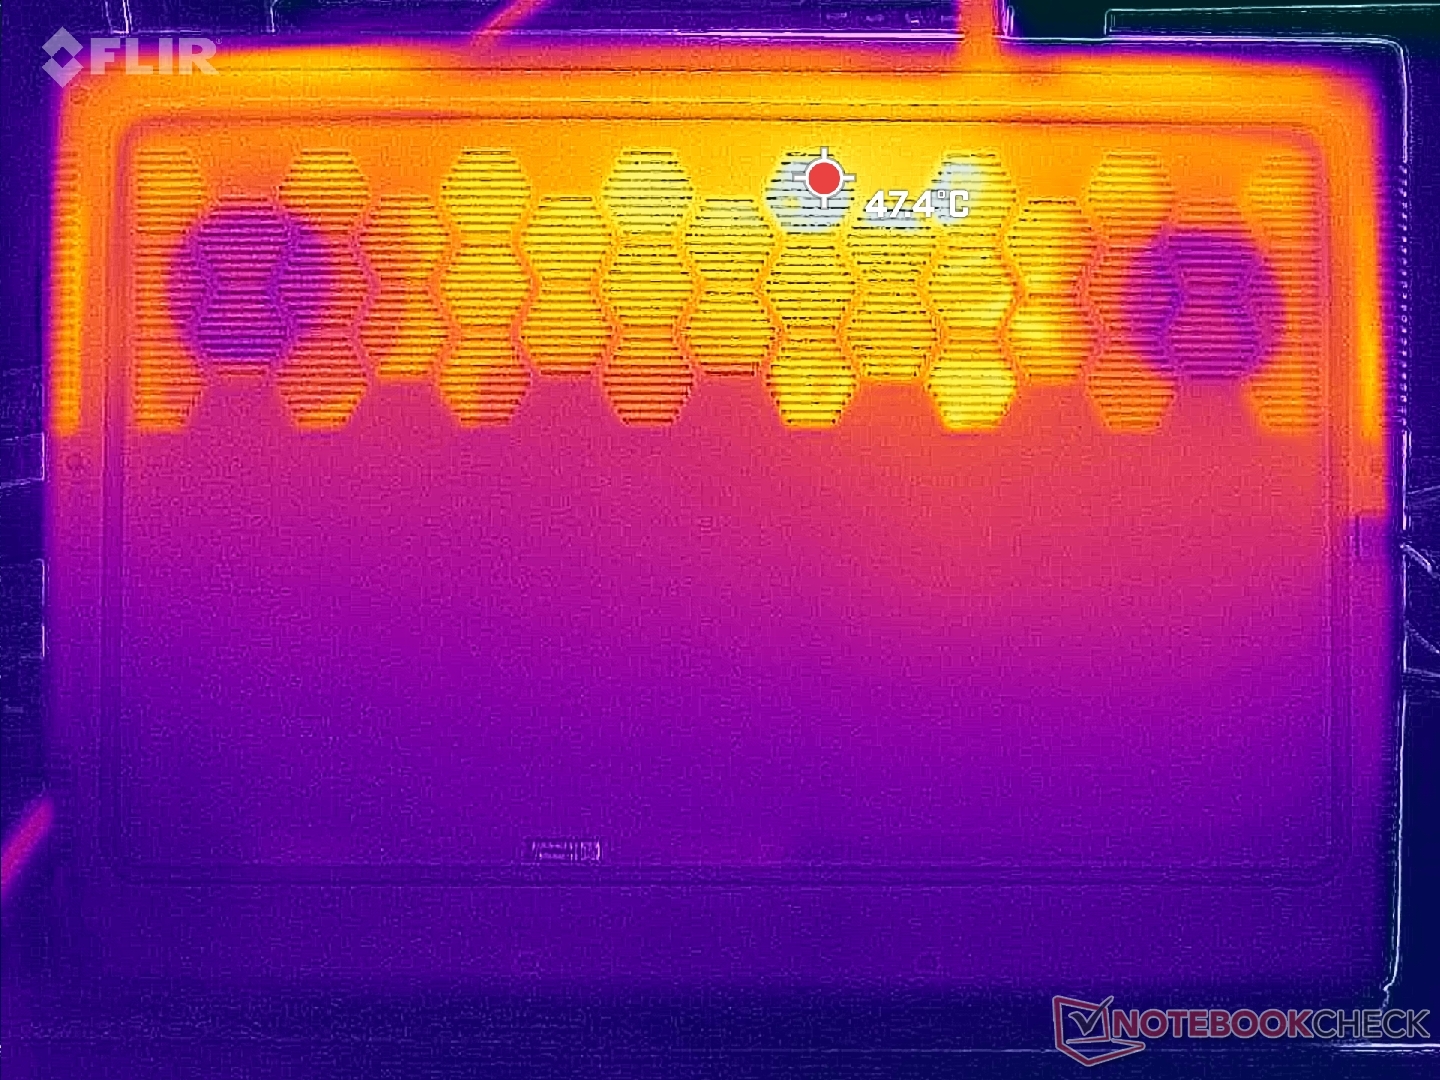
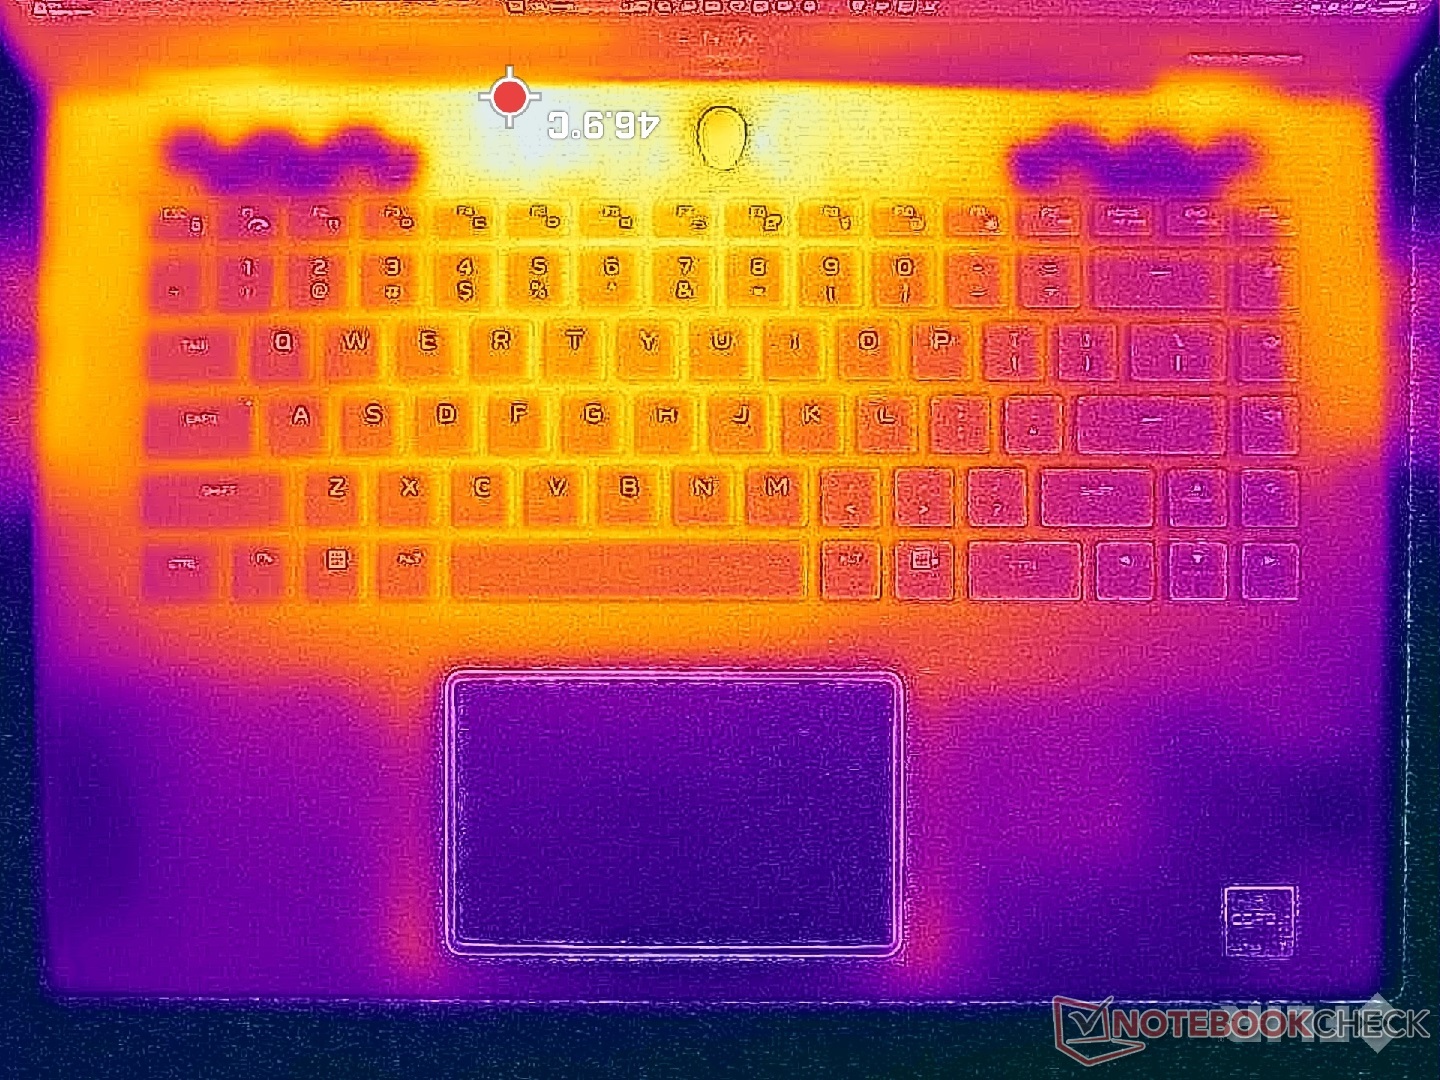
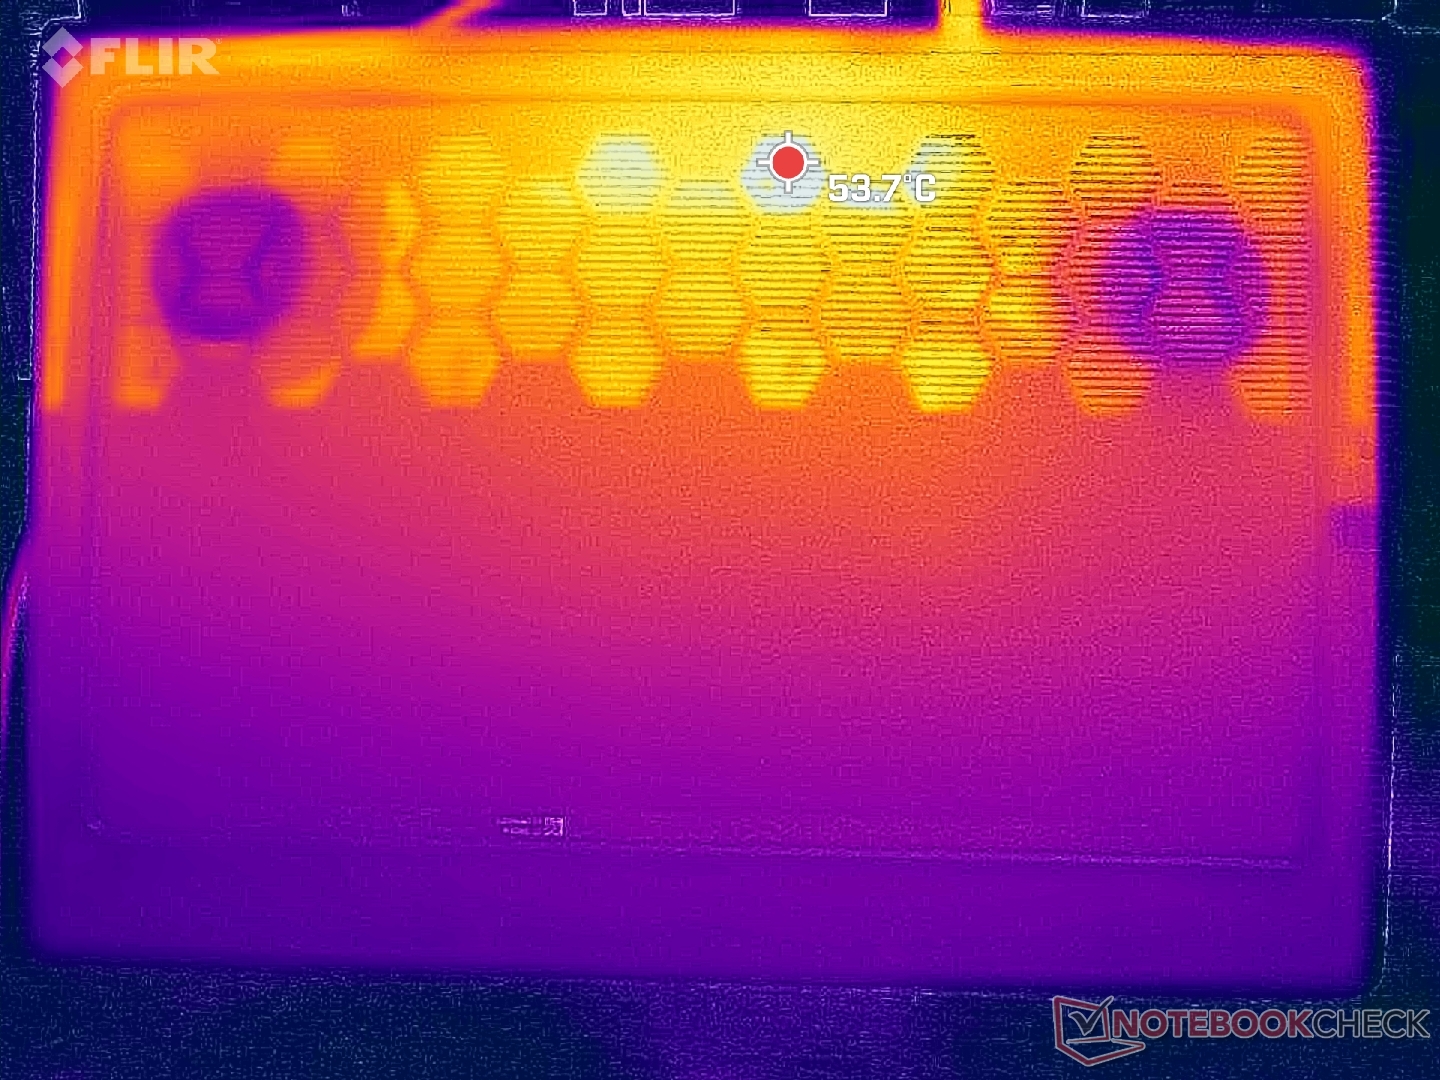
Temperatura
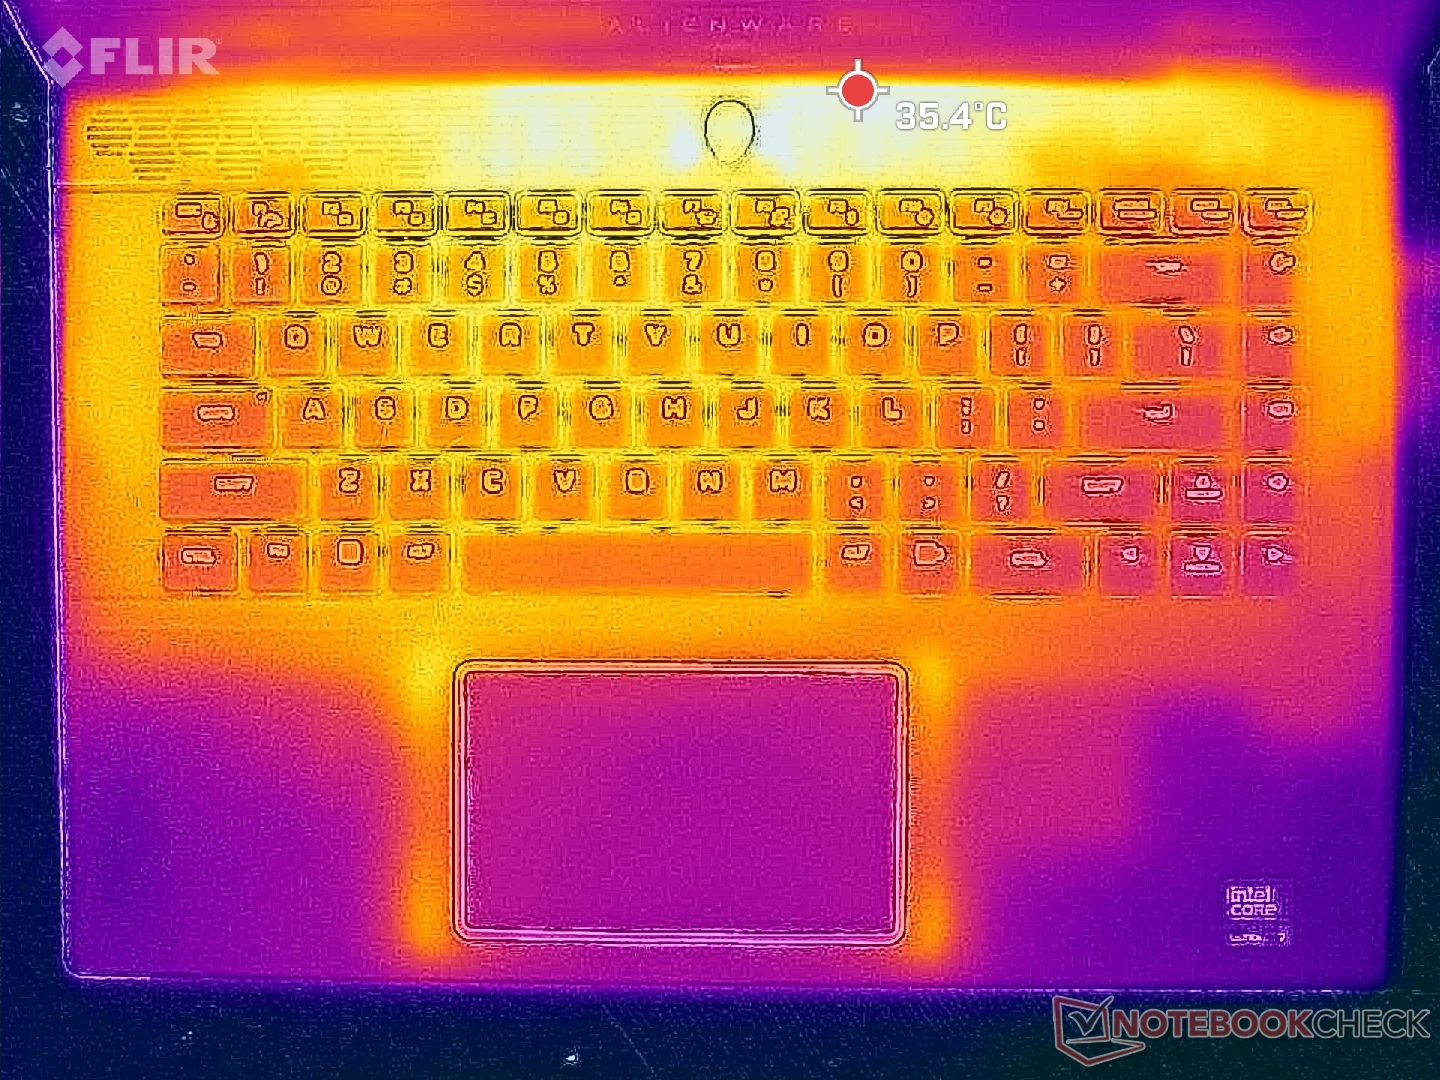
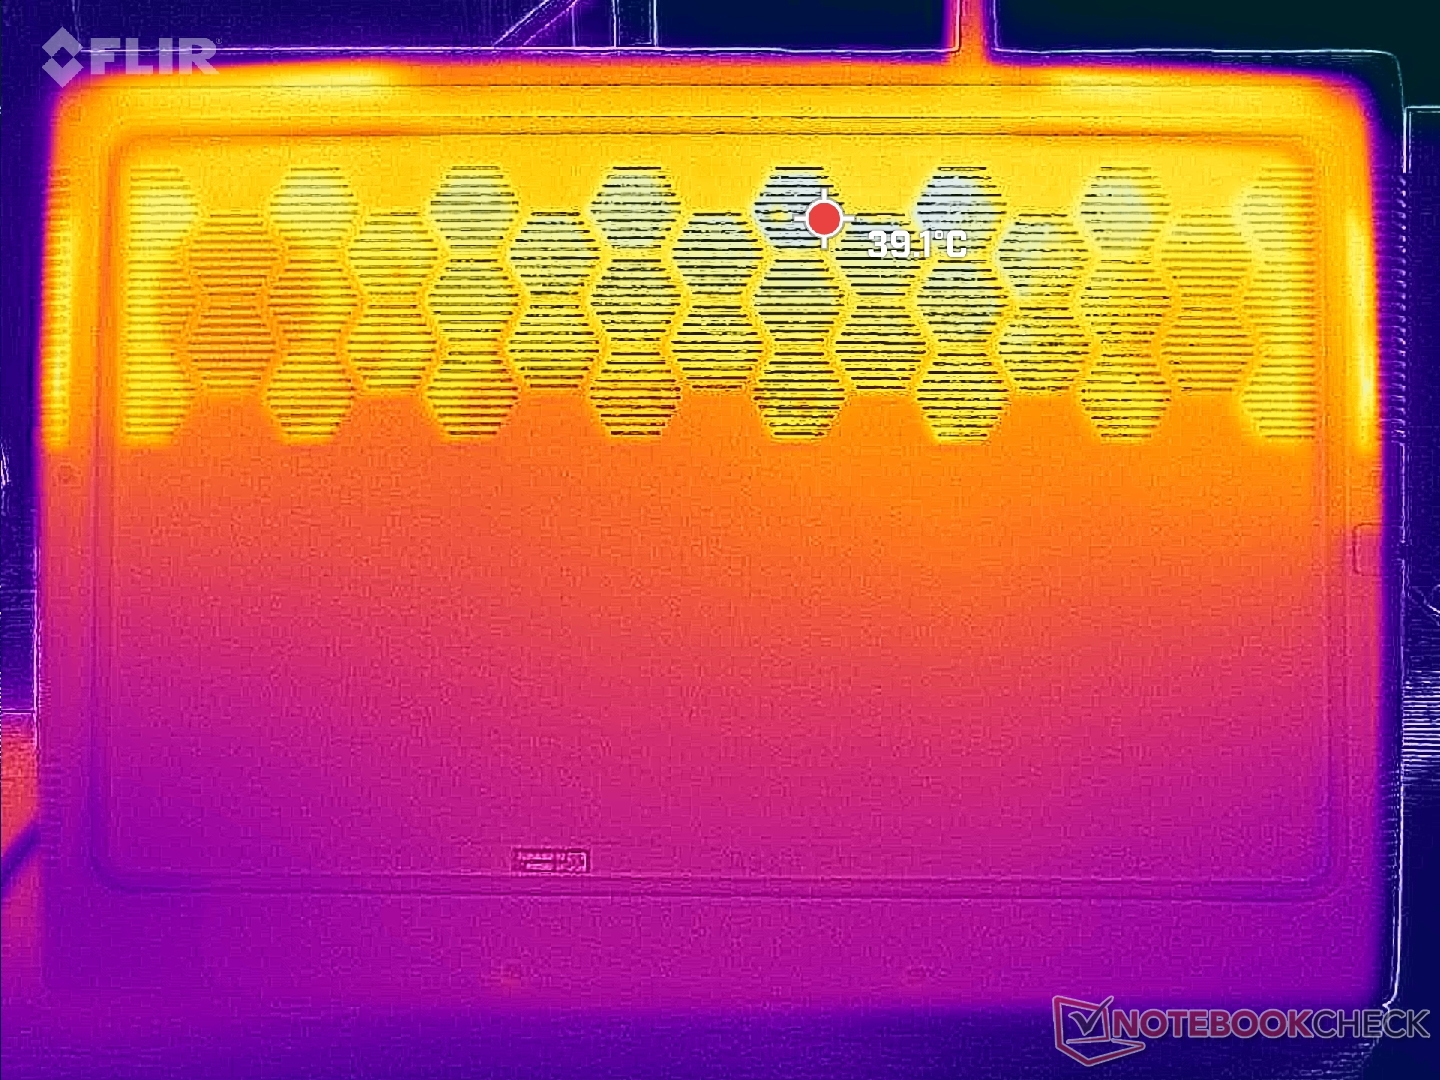
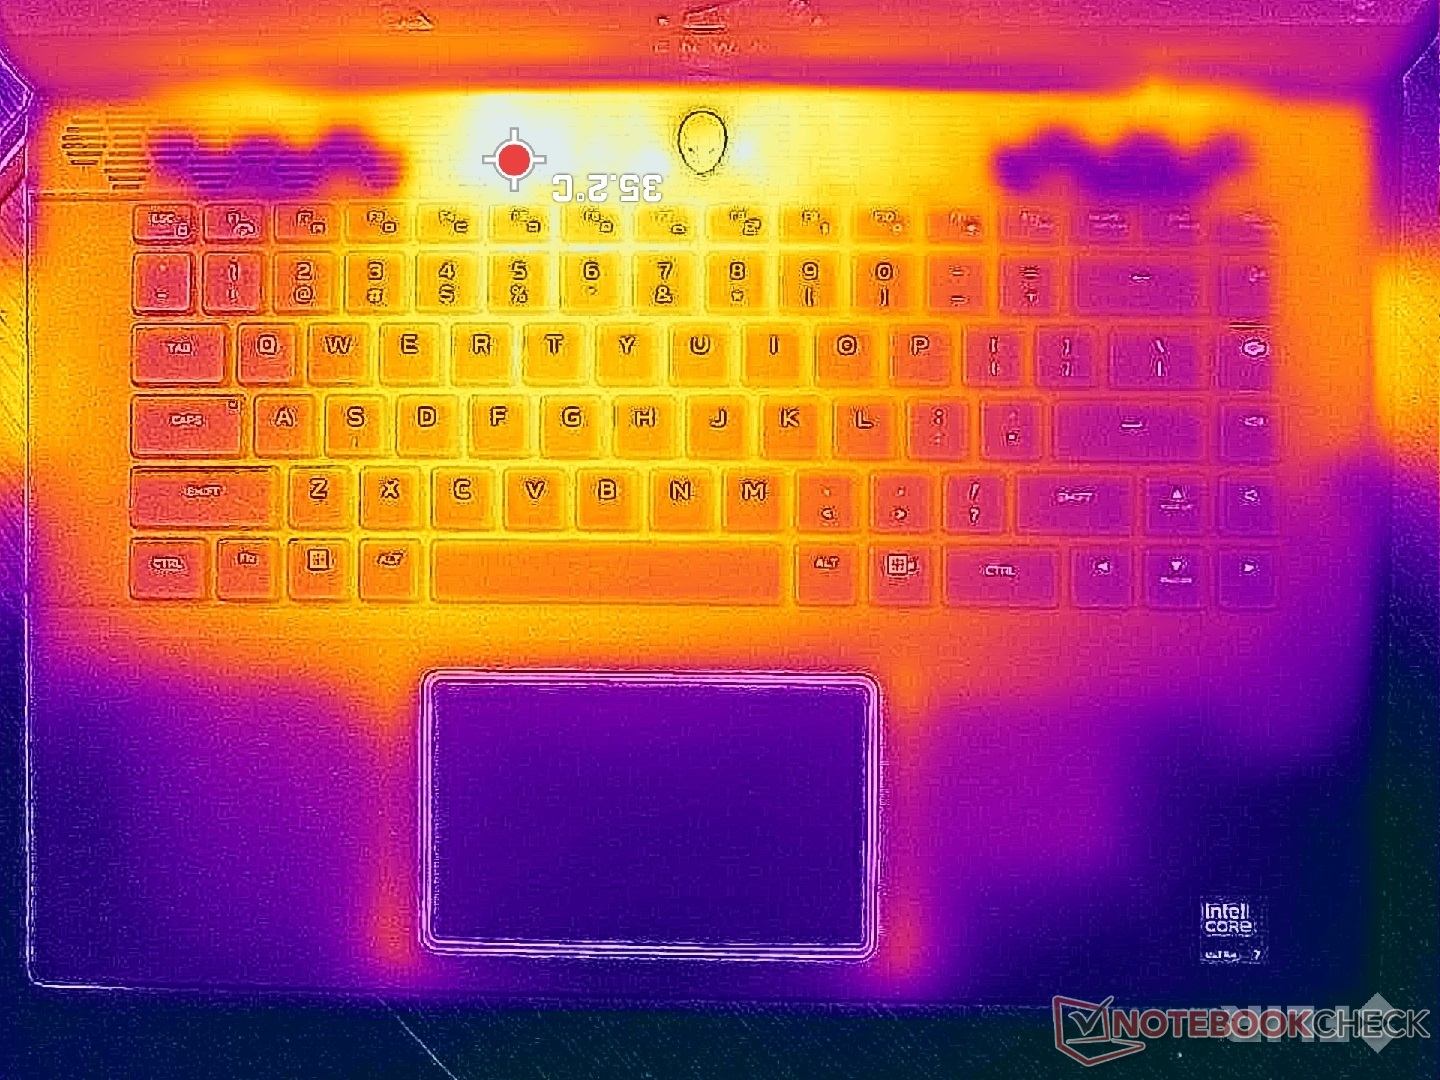
Gorące punkty podczas uruchamiania wymagających obciążeń, takich jak gry, koncentrują się w tylnej części obudowy, gdzie dłonie raczej się nie dotykają. Podpórki pod nadgarstki i klawiatura pozostaną odpowiednio chłodne w zakresie odpowiednio około 20 C i 30 C, podczas gdy tył może zbliżyć się do 50 C. Średnie temperatury powierzchni są cieplejsze niż te, które zarejestrowaliśmy na Blade 16 ale wciąż chłodniejsze niż na HP Omen Transcend 16 gdzie niektóre obszary mogą osiągnąć ponad 60 C.
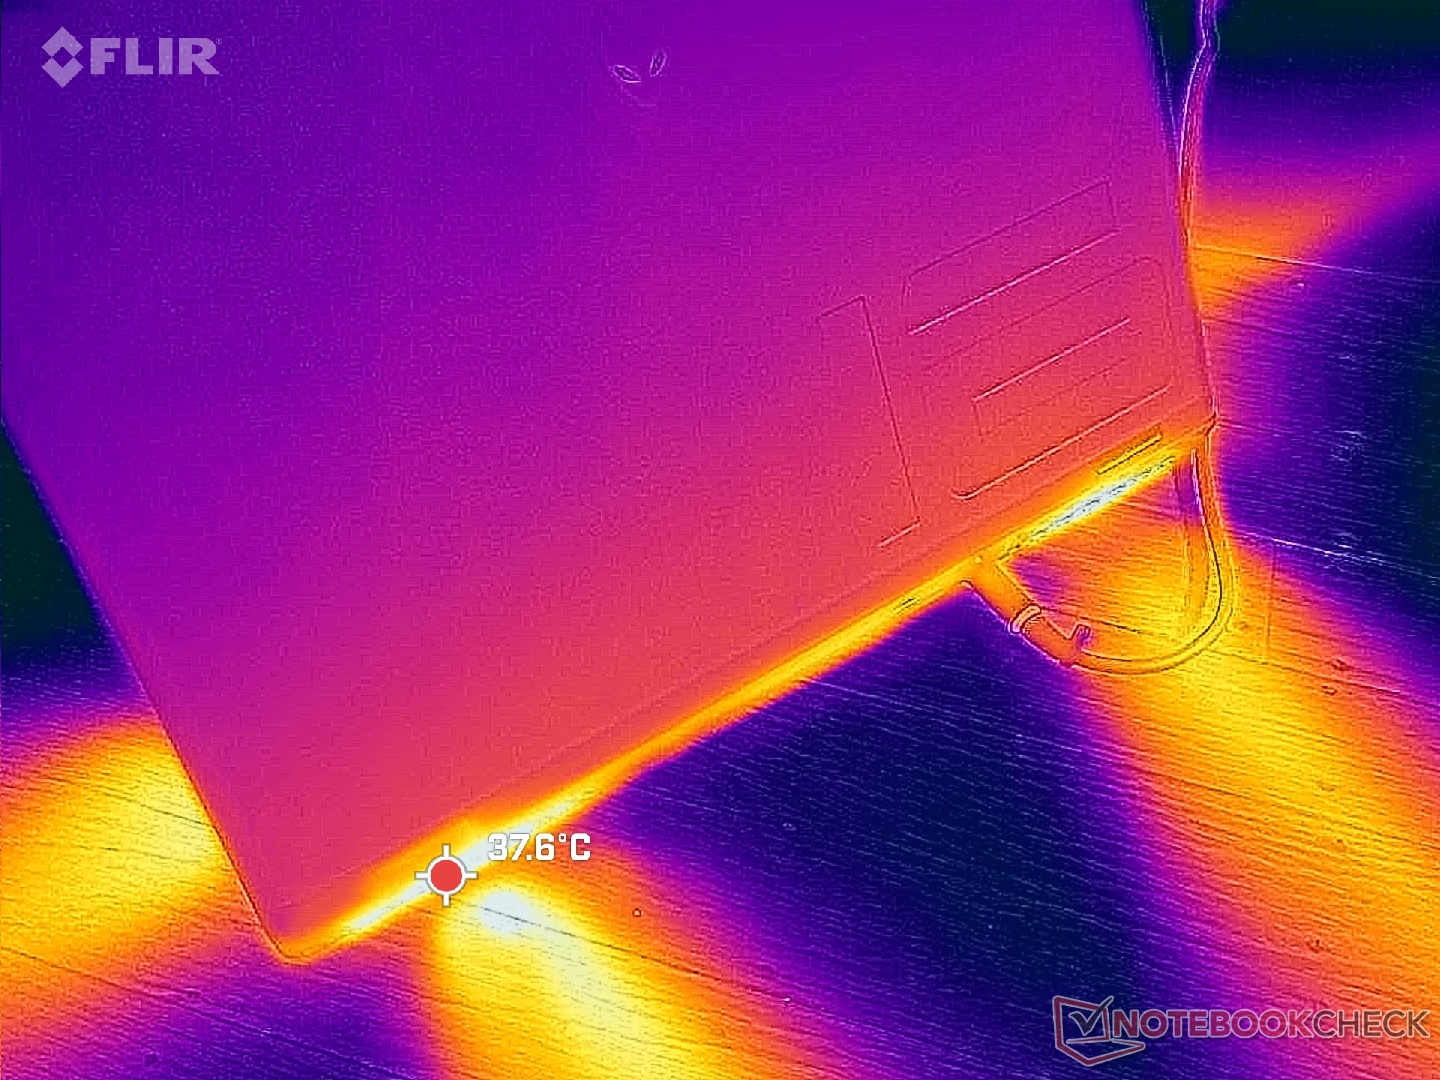
(±) Maksymalna temperatura w górnej części wynosi 44.8 °C / 113 F, w porównaniu do średniej 40.4 °C / 105 F , począwszy od 21.2 do 68.8 °C dla klasy Gaming.
(-) Dno nagrzewa się maksymalnie do 48 °C / 118 F, w porównaniu do średniej 43.2 °C / 110 F
(+) W stanie bezczynności średnia temperatura górnej części wynosi 30.9 °C / 88 F, w porównaniu ze średnią temperaturą urządzenia wynoszącą 33.9 °C / ### class_avg_f### F.
(+) Podczas gry w Wiedźmina 3 średnia temperatura górnej części wynosi 28.7 °C / 84 F, w porównaniu do średniej temperatury urządzenia wynoszącej 33.9 °C / ## #class_avg_f### F.
(+) Podpórki pod nadgarstki i touchpad są chłodniejsze niż temperatura skóry i maksymalnie 27.2 °C / 81 F i dlatego są chłodne w dotyku.
(±) Średnia temperatura obszaru podparcia dłoni w podobnych urządzeniach wynosiła 28.8 °C / 83.8 F (+1.6 °C / 2.8 F).
| Alienware m16 R2 Intel Core Ultra 7 155H, NVIDIA GeForce RTX 4070 Laptop GPU | Alienware m16 R1 Intel Intel Core i7-13700HX, NVIDIA GeForce RTX 4060 Laptop GPU | Alienware x16 R1 Intel Core i9-13900HK, NVIDIA GeForce RTX 4080 Laptop GPU | HP Omen Transcend 16-u1095ng Intel Core i9-14900HX, NVIDIA GeForce RTX 4070 Laptop GPU | Asus ROG Zephyrus G16 2024 GU605M Intel Core Ultra 7 155H, NVIDIA GeForce RTX 4070 Laptop GPU | Lenovo Legion Slim 7 16APH8 AMD Ryzen 7 7840HS, NVIDIA GeForce RTX 4060 Laptop GPU | |
|---|---|---|---|---|---|---|
| Heat | -3% | 3% | 3% | 10% | 8% | |
| Maximum Upper Side * (°C) | 44.8 | 49 -9% | 47.2 -5% | 49 -9% | 50.3 -12% | 46 -3% |
| Maximum Bottom * (°C) | 48 | 48 -0% | 47.8 -0% | 63 -31% | 48 -0% | 46 4% |
| Idle Upper Side * (°C) | 37.2 | 40 -8% | 36.8 1% | 30 19% | 28.8 23% | 33 11% |
| Idle Bottom * (°C) | 42 | 39 7% | 35.8 15% | 29 31% | 29.8 29% | 34 19% |
* ... im mniej tym lepiej
Głośniki
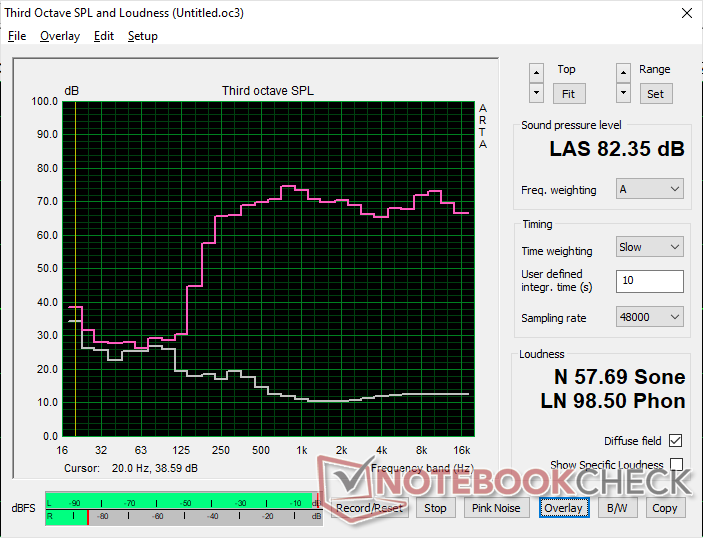
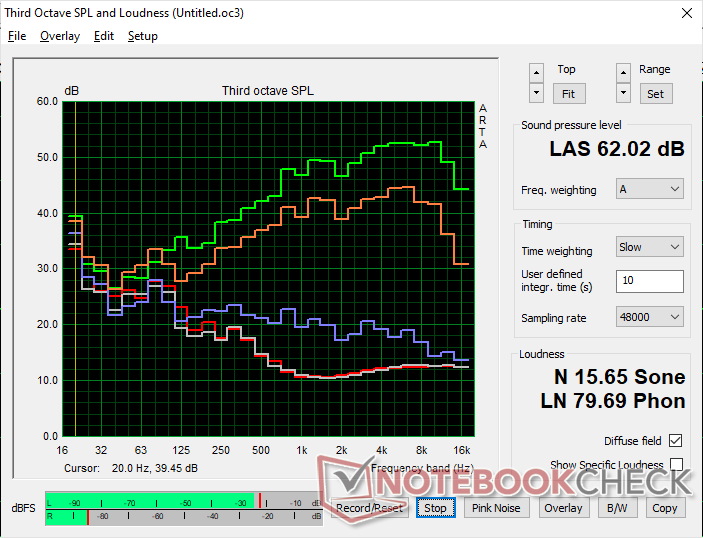
Alienware m16 R2 analiza dźwięku
(+) | głośniki mogą odtwarzać stosunkowo głośno (82.4 dB)
Bas 100 - 315 Hz
(-) | prawie brak basu - średnio 20.1% niższa od mediany
(±) | liniowość basu jest średnia (11.1% delta do poprzedniej częstotliwości)
Średnie 400 - 2000 Hz
(+) | zbalansowane środki średnie - tylko 2.2% od mediany
(+) | średnie są liniowe (3.1% delta do poprzedniej częstotliwości)
Wysokie 2–16 kHz
(+) | zrównoważone maksima - tylko 2.2% od mediany
(+) | wzloty są liniowe (3.5% delta do poprzedniej częstotliwości)
Ogólnie 100 - 16.000 Hz
(+) | ogólny dźwięk jest liniowy (12.9% różnicy w stosunku do mediany)
W porównaniu do tej samej klasy
» 17% wszystkich testowanych urządzeń w tej klasie było lepszych, 4% podobnych, 79% gorszych
» Najlepszy miał deltę 6%, średnia wynosiła ###średnia###%, najgorsza wynosiła 132%
W porównaniu do wszystkich testowanych urządzeń
» 12% wszystkich testowanych urządzeń było lepszych, 3% podobnych, 85% gorszych
» Najlepszy miał deltę 4%, średnia wynosiła ###średnia###%, najgorsza wynosiła 134%
Apple MacBook Pro 16 2021 M1 Pro analiza dźwięku
(+) | głośniki mogą odtwarzać stosunkowo głośno (84.7 dB)
Bas 100 - 315 Hz
(+) | dobry bas - tylko 3.8% od mediany
(+) | bas jest liniowy (5.2% delta do poprzedniej częstotliwości)
Średnie 400 - 2000 Hz
(+) | zbalansowane środki średnie - tylko 1.3% od mediany
(+) | średnie są liniowe (2.1% delta do poprzedniej częstotliwości)
Wysokie 2–16 kHz
(+) | zrównoważone maksima - tylko 1.9% od mediany
(+) | wzloty są liniowe (2.7% delta do poprzedniej częstotliwości)
Ogólnie 100 - 16.000 Hz
(+) | ogólny dźwięk jest liniowy (4.6% różnicy w stosunku do mediany)
W porównaniu do tej samej klasy
» 0% wszystkich testowanych urządzeń w tej klasie było lepszych, 0% podobnych, 100% gorszych
» Najlepszy miał deltę 5%, średnia wynosiła ###średnia###%, najgorsza wynosiła 45%
W porównaniu do wszystkich testowanych urządzeń
» 0% wszystkich testowanych urządzeń było lepszych, 0% podobnych, 100% gorszych
» Najlepszy miał deltę 4%, średnia wynosiła ###średnia###%, najgorsza wynosiła 134%
Zarządzanie energią - oszczędniejsze i mniej energochłonne
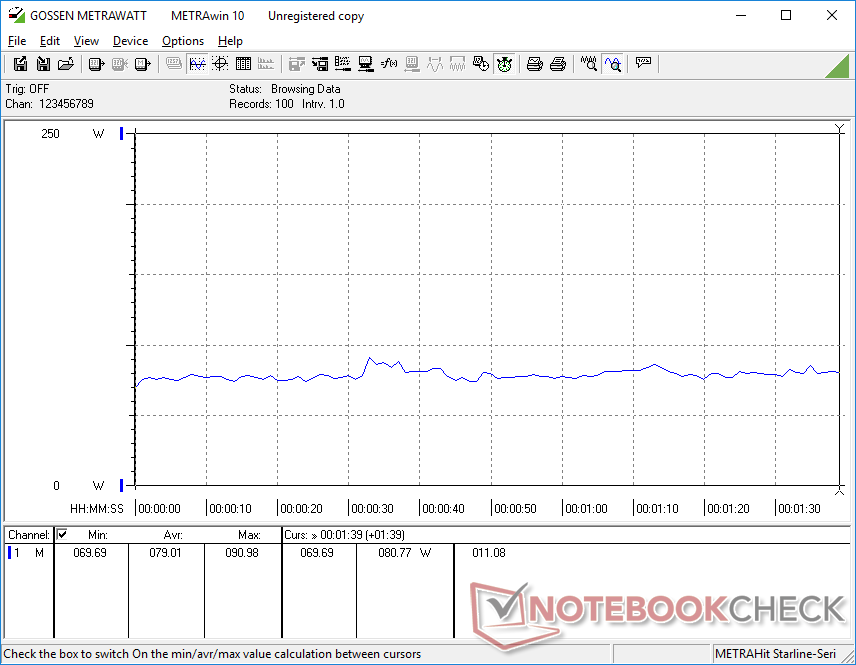
Zużycie energii
Praca na biegu jałowym na komputerze stacjonarnym może wynosić zaledwie 8 W przy ustawieniu minimalnej jasności w trybie cichym i trybie iGPU lub do 40 W przy ustawieniu maksymalnej jasności w trybie Overdrive i trybie dGPU. Gdy dodatkowa moc nie jest potrzebna do wydłużenia żywotności baterii, warto włączyć tryb zrównoważony i tryb iGPU, jak pokazano w następnej sekcji.
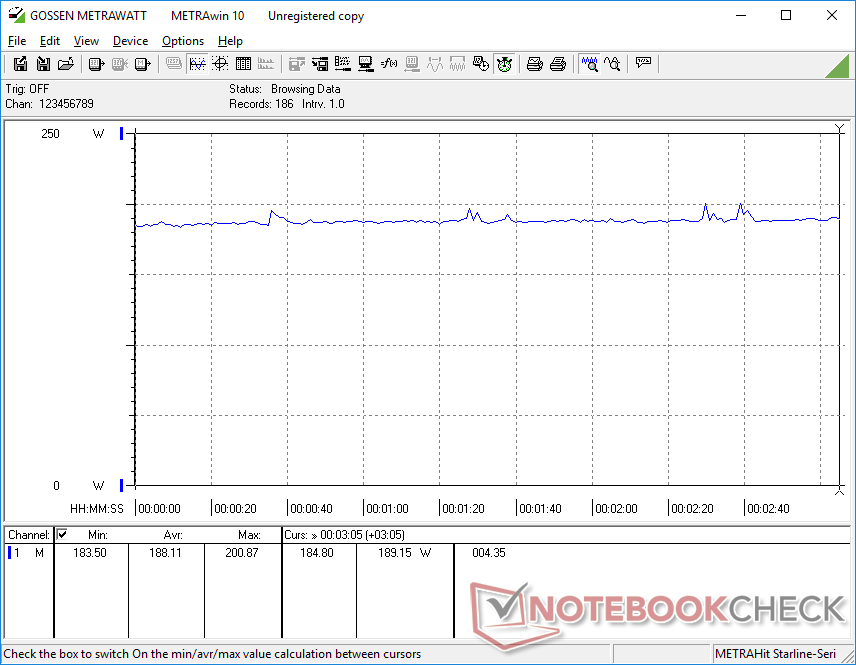
Podczas grania lub obciążania procesora, ogólne zużycie energii staje się mniej więcej takie samo, jak w przypadku m16 R1 z RTX 4060, przy nieco wyższej wydajności w przeliczeniu na wat.
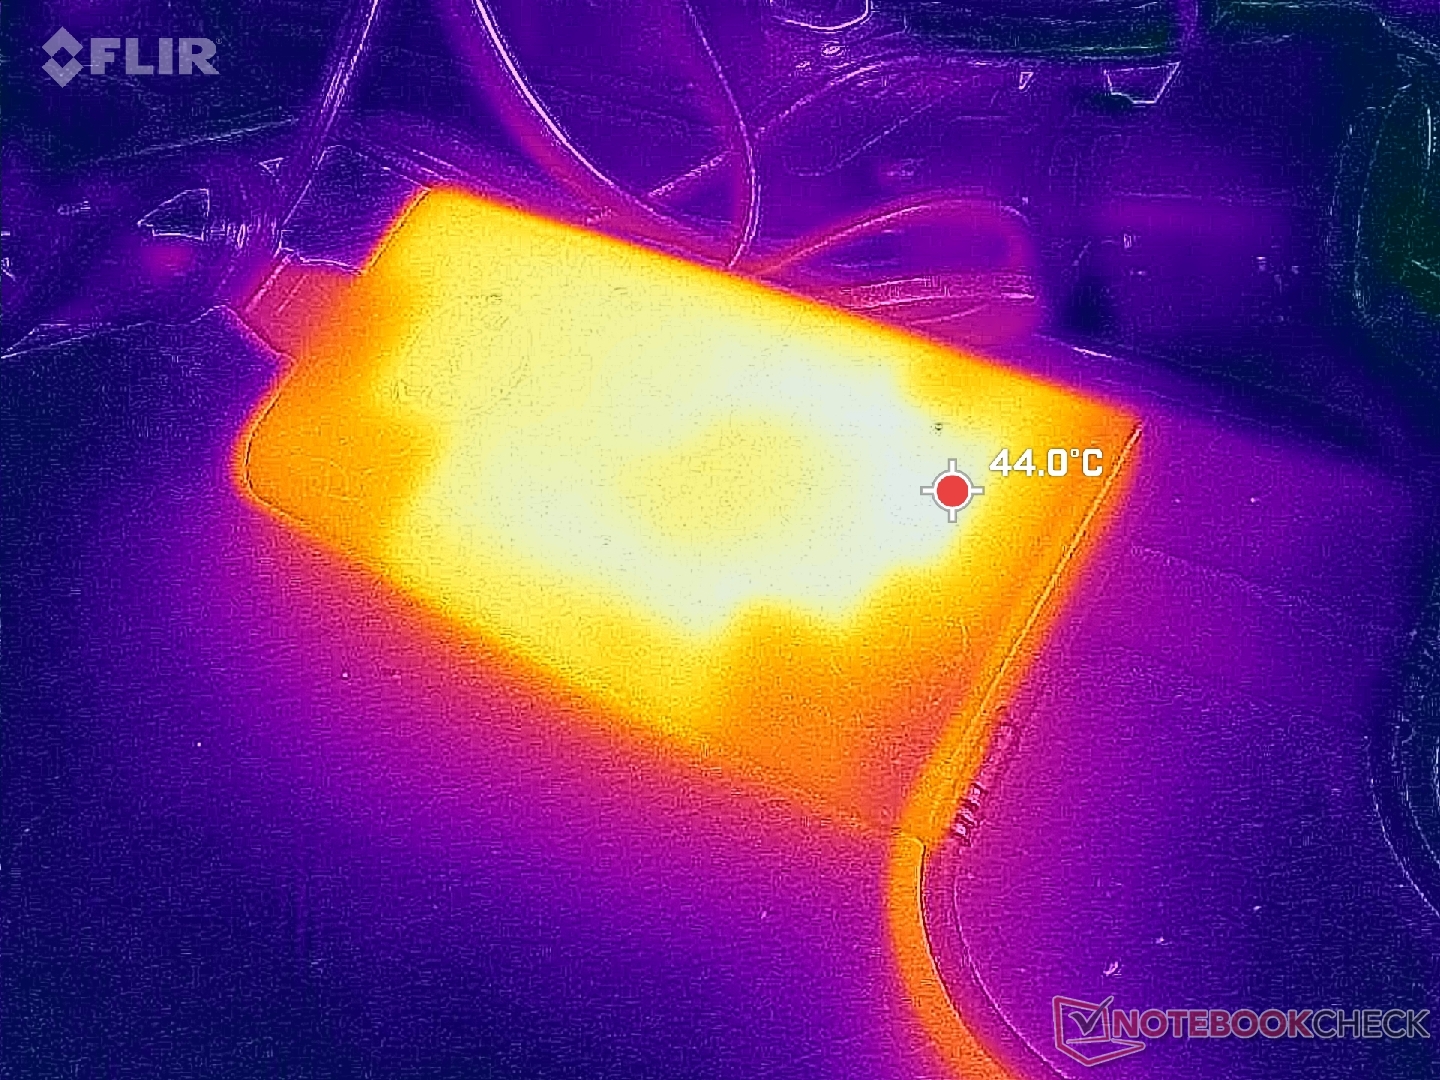
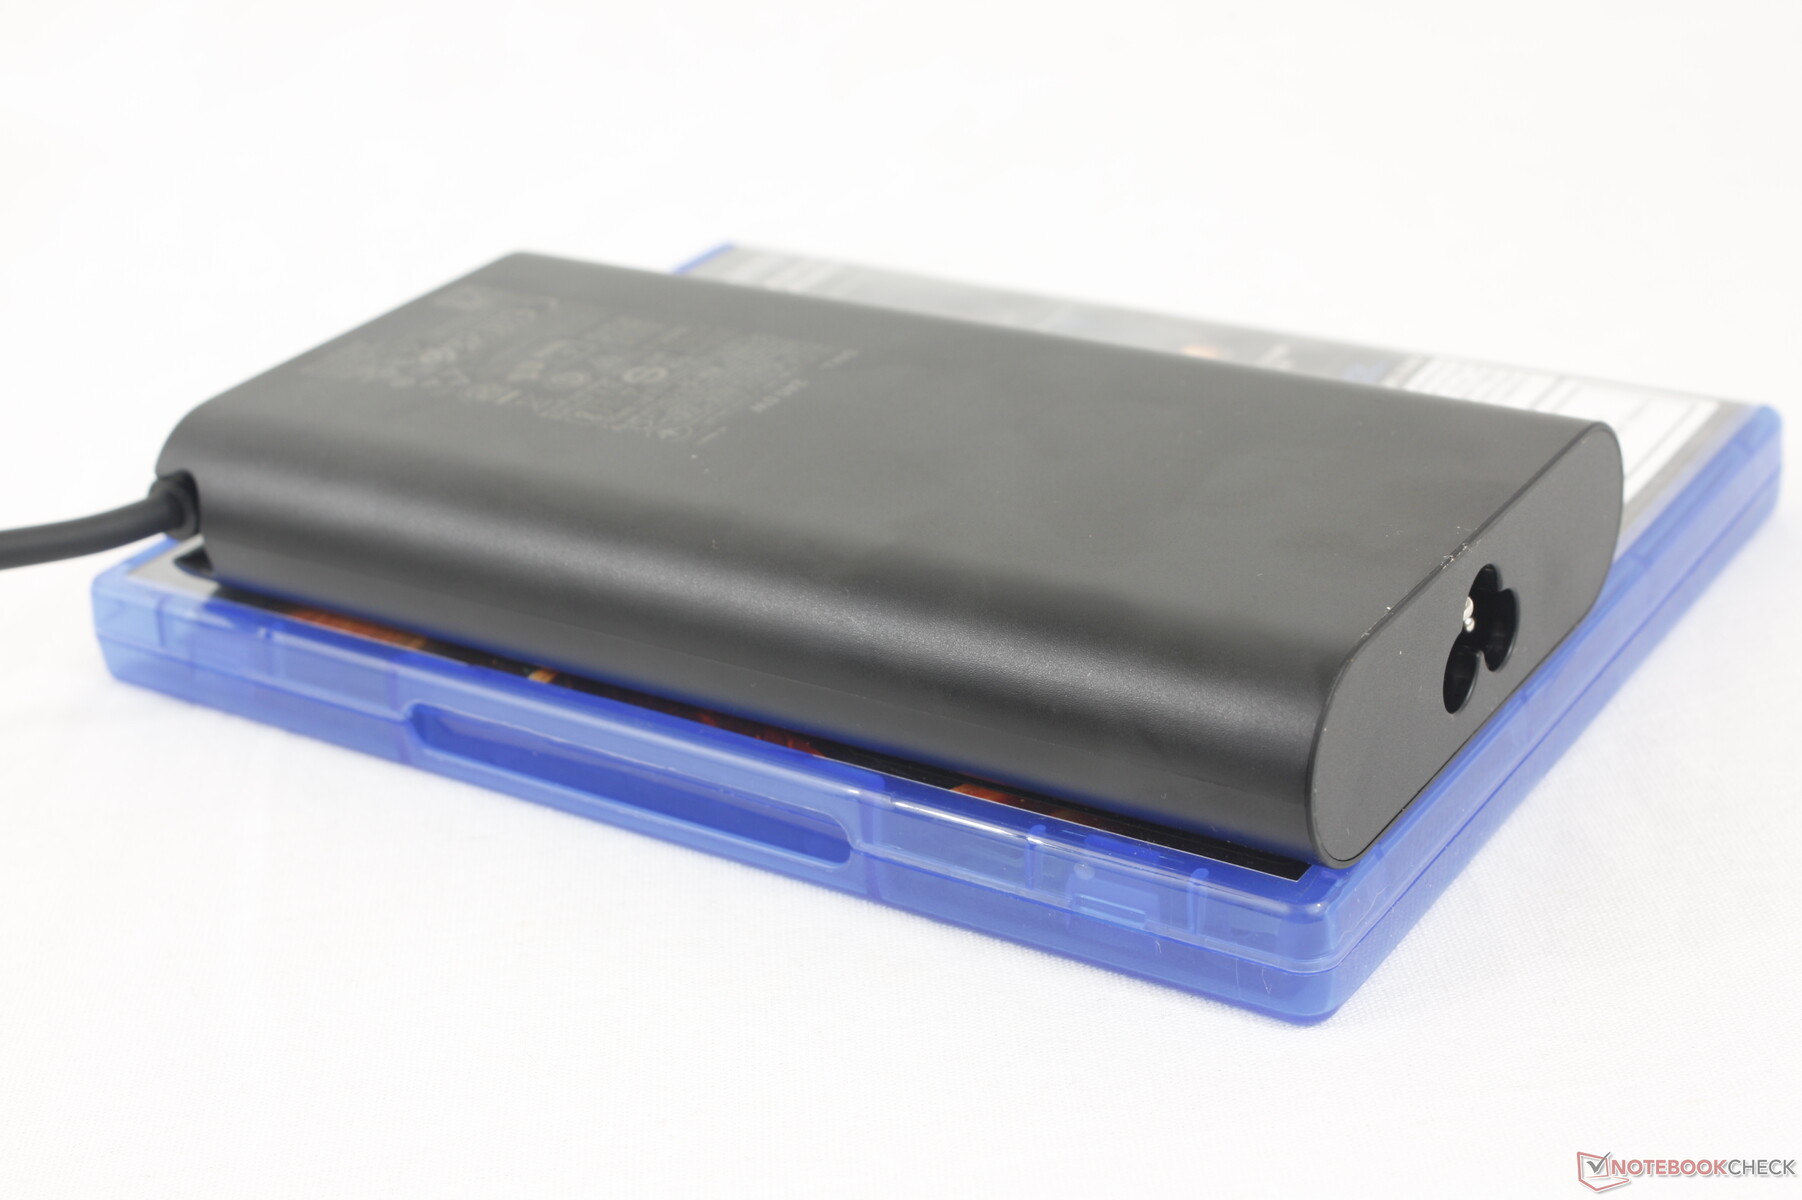
Kartę m16 R2 można skonfigurować tak, aby była dostarczana z małym (~15,2 x 7,7 x 2,3 cm) zasilaczem GaN AC o mocy 240 W, podczas gdy m16 R1 jest dostarczana z większym (~20 x 10 x 4,5 cm) zasilaczem o mocy 330 W, aby pomieścić konfiguracje RTX 4080 i 4090. Niektóre jednostki SKU, takie jak nasza, mogą być dostarczane z zasilaczem o mocy 280 W.

| wyłączony / stan wstrzymania | |
| luz | |
| obciążenie |
|
Legenda:
min: | |
| Alienware m16 R2 Ultra 7 155H, GeForce RTX 4070 Laptop GPU, Samsung PM9A1 MZVL21T0HCLR, IPS, 2560x1600, 16" | Alienware m16 R1 Intel i7-13700HX, GeForce RTX 4060 Laptop GPU, Kioxia KXG70ZNV512G, IPS, 2560x1600, 16" | Alienware x16 R1 i9-13900HK, GeForce RTX 4080 Laptop GPU, SK hynix PC801 HFS001TEJ9X101N, IPS, 2560x1600, 16" | HP Omen Transcend 16-u1095ng i9-14900HX, GeForce RTX 4070 Laptop GPU, Kioxia XG8 KXG80ZNV1T02, OLED, 2560x1600, 16" | Asus ROG Zephyrus G16 2024 GU605M Ultra 7 155H, GeForce RTX 4070 Laptop GPU, WD PC SN560 SDDPNQE-1T00, OLED, 2560x1600, 16" | Lenovo Legion Slim 7 16APH8 R7 7840HS, GeForce RTX 4060 Laptop GPU, WDC PC SN810 1TB, IPS, 2560x1600, 16" | |
|---|---|---|---|---|---|---|
| Power Consumption | -10% | -77% | -13% | 24% | -67% | |
| Idle Minimum * (Watt) | 8.1 | 10 -23% | 25.2 -211% | 10 -23% | 8.3 -2% | 33 -307% |
| Idle Average * (Watt) | 13 | 14 -8% | 29.9 -130% | 18 -38% | 12.5 4% | 35 -169% |
| Idle Maximum * (Watt) | 40.3 | 21 48% | 49.8 -24% | 32 21% | 12.8 68% | 45 -12% |
| Load Average * (Watt) | 79 | 119 -51% | 105.4 -33% | 128 -62% | 71.3 10% | 59 25% |
| Witcher 3 ultra * (Watt) | 188.1 | 186.7 1% | 263 -40% | 148.4 21% | 127.5 32% | 131 30% |
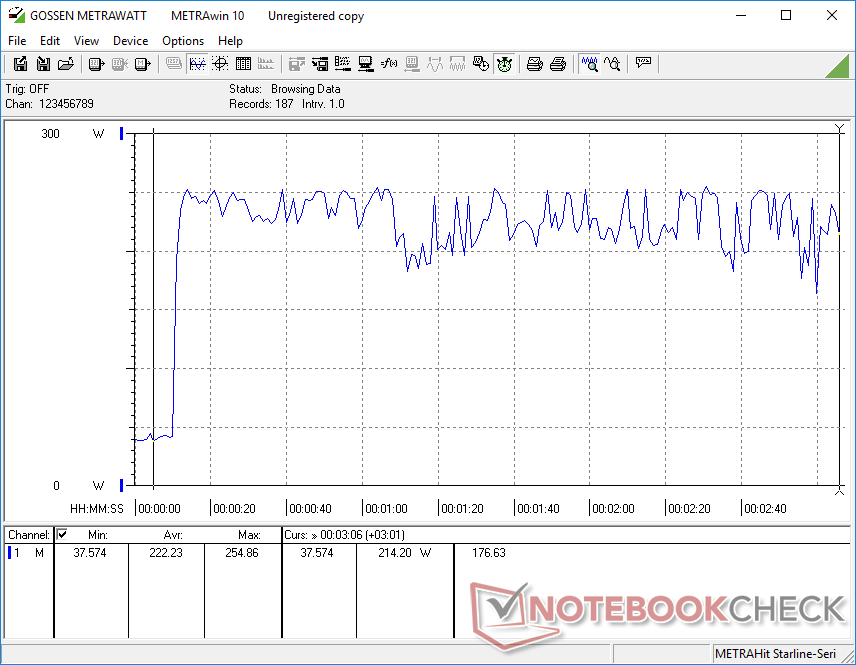
| Load Maximum * (Watt) | 254.9 | 323 -27% | 313.8 -23% | 242 5% | 169.1 34% | 177 31% |
* ... im mniej tym lepiej
Power Consumption Witcher 3 / Stresstest
Power Consumption external Monitor
Żywotność baterii
Pojemność baterii jest w rzeczywistości nieco większa w tym roku i wynosi 90 Wh pomimo mniejszej konstrukcji obudowy. Wygląda również na to, że Dell naprawił problemy z żywotnością baterii, których doświadczyliśmy na wielu starszych laptopach Alienware; przeglądanie stron internetowych w trybie zrównoważonym i Optimus trwało aż 8 godzin, w porównaniu do prawie połowy tego czasu na Alienware m16 R1. System może nawet przetrwać najnowsze Asus ROG Zephyrus G16 GU605M o prawie godzinę.
Ładowanie od stanu pustego do pełnej pojemności zajmuje około 90 minut. Alternatywnie, ładowanie do 85 procent zajęłoby niecałe 40 minut. Model ten można również ładować za pomocą ogólnych adapterów USB-C, aczkolwiek znacznie wolniej.
| Alienware m16 R2 Ultra 7 155H, GeForce RTX 4070 Laptop GPU, 90 Wh | Alienware m16 R1 Intel i7-13700HX, GeForce RTX 4060 Laptop GPU, 86 Wh | Alienware x16 R1 i9-13900HK, GeForce RTX 4080 Laptop GPU, 90 Wh | HP Omen Transcend 16-u1095ng i9-14900HX, GeForce RTX 4070 Laptop GPU, 97 Wh | Asus ROG Zephyrus G16 2024 GU605M Ultra 7 155H, GeForce RTX 4070 Laptop GPU, 90 Wh | Lenovo Legion Slim 7 16APH8 R7 7840HS, GeForce RTX 4060 Laptop GPU, 99.9 Wh | |
|---|---|---|---|---|---|---|
| Czasy pracy | -30% | -47% | -40% | 5% | -12% | |
| Reader / Idle (h) | 12.6 | 6.4 -49% | 7.3 -42% | |||
| WiFi v1.3 (h) | 8.1 | 4.8 -41% | 2.5 -69% | 4.9 -40% | 7.3 -10% | 7.1 -12% |
| Load (h) | 1 | 1 0% | 0.7 -30% | 1.2 20% | ||
| H.264 (h) | 5.6 | 11.2 |
Za
Przeciw
Werdykt - nowa równowaga między grami a pracą hybrydową
Alienware m16 R2 został stworzony z myślą o jednym jasnym celu: być mniejszym niż Alienware m16 R1 nawet jeśli oznacza to pogorszenie wydajności. Model jest zdecydowanie bardziej przenośny niż wcześniej, ale użytkownicy tracą na grafice GeForce RTX 4080/4090, procesorach Core HX i klawiszach mechanicznych. Dell ma nadzieję, że dzięki usunięciu tych entuzjastycznych funkcji na rzecz mniejszej konstrukcji, odchudzony m16 R2 może przyciągnąć większą liczbę pracowników hybrydowych, studentów i graczy głównego nurtu, którzy mogli pominąć bardziej "hardkorowe" i mniej przyjazne w podróży m16 R1 lub x16 R1.
Efektem końcowym jest system, który bardzo dobrze równoważy wszystkie aspekty, od wydajności po żywotność baterii i przenośność, podczas gdy m16 R1 skupiał się prawie wyłącznie na wydajności kosztem wagi i czasu pracy. Nawet poziom hałasu wentylatora i zachowanie uległy poprawie, aby były bardziej odpowiednie w klasie lub biurze, gdzie dodatkowa moc nie jest potrzebna. Jest to zdecydowanie najbardziej wszechstronny laptop Alienware, jaki testowaliśmy ze względu na wszystkie zmiany sprzętowe i programowe.
Jeśli są Państwo zadowoleni z grafiki GeForce RTX 4060 lub 4070, to Alienware m16 R2 jest z łatwością najlepszą opcją typu jack-of-all-trades, jaką można wybrać w tej serii. Jeśli potrzebują Państwo więcej mocy i chcą zachować przenośność, to droższy Blade 16 jest nadal najlepszym wyborem.
Choć imponujący i często zaskakujący, m16 R2 wciąż musi stawić czoła silnej konkurencji w kategorii 16-calowych urządzeń. The Razer Blade 16jest nadal lżejszy, mniejszy i szybszy niż m16 R2, a także oferuje głębsze kolory DCI-P3. The Asus ROG Zephyrus G16 jest podobnie lżejszy i ma więcej opcji wyświetlania, ale wydajność GPU jest nieco niższa. W tym scenariuszu Dell wycenił Alienware m16 R2 tak, aby był tańszy niż systemy Razer i Asus.
Cena i dostępność
Dell wysyła teraz Alienware m16 R2 w cenie od 1650 USD za konfigurację RTX 4060 lub do 1850 USD + za konfigurację RTX 4070. Podstawowa konfiguracja RTX 4050 jest również dostępna za 1500 USD.
Alienware m16 R2
- 24/02/2024 v7 (old)
Allen Ngo
Przezroczystość
Wyboru urządzeń do recenzji dokonuje nasza redakcja. Próbka testowa została udostępniona autorowi jako pożyczka od producenta lub sprzedawcy detalicznego na potrzeby tej recenzji. Pożyczkodawca nie miał wpływu na tę recenzję, producent nie otrzymał też kopii tej recenzji przed publikacją. Nie było obowiązku publikowania tej recenzji. Jako niezależna firma medialna, Notebookcheck nie podlega władzy producentów, sprzedawców detalicznych ani wydawców.
Tak testuje Notebookcheck
Każdego roku Notebookcheck niezależnie sprawdza setki laptopów i smartfonów, stosując standardowe procedury, aby zapewnić porównywalność wszystkich wyników. Od około 20 lat stale rozwijamy nasze metody badawcze, ustanawiając przy tym standardy branżowe. W naszych laboratoriach testowych doświadczeni technicy i redaktorzy korzystają z wysokiej jakości sprzętu pomiarowego. Testy te obejmują wieloetapowy proces walidacji. Nasz kompleksowy system ocen opiera się na setkach uzasadnionych pomiarów i benchmarków, co pozwala zachować obiektywizm.Price comparison

