Testy dla Intel Core i7-14700HX procesor
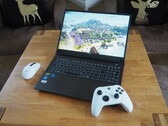
Niedrogi laptop do gier z RTX 5060: Recenzja Tulpar T6 V3.5
Tulpar T6 V3.5 ma na celu zmierzenie się z głównymi graczami, takimi jak Acer, Gigabyte i HP. W naszej recenzji dowiedzą się Państwo, czy ten 16-calowy laptop do gier odniesie sukces.
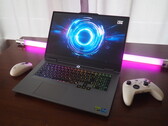
Intel Core i7-14700HX, NVIDIA GeForce RTX 5060 Laptop, 16", 2.4 kgSzybciej, wyżej, dalej dzięki OC: Recenzja gamingowego laptopa Lenovo LOQ 17 RTX 5070
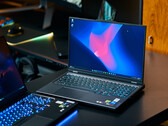
Po zapoznaniu się z serią LOQ Lenovo w kilku 15- i 16-calowych wersjach, nadszedł czas na jeszcze większy model, LOQ 17. Jak ten gamingowy laptop radzi sobie na konkurencyjnym rynku średniej klasy?
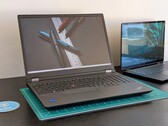
Intel Core i7-14700HX, NVIDIA GeForce RTX 5070 Laptop, 17.3", 2.9 kgRecenzja stacji roboczej Lenovo ThinkPad P16 Gen 2: Ciężki z doładowaną grafiką
Opcja grafiki TGP o mocy 130 W sprawia, że jest to jedna z najszybszych 16-calowych stacji roboczych w portfolio Lenovo. Jednak takie aspekty jak temperatura i hałas wentylatora są odpowiednio cieplejsze i głośniejsze niż przeciętnie, co wynika z wymagającego GPU.
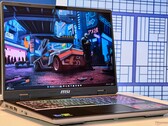
Intel Core i7-14700HX, NVIDIA RTX 4000 Ada Generation Laptop, 16", 3.1 kgRecenzja laptopa MSI Sword 16 HX: Gamingowa potęga stłumiona przez mało imponujący ekran
MSI Sword 16 HX ma wszystkie dzwonki i gwizdki współczesnego laptopa do gier, wraz z procesorem Intel Core i7-14700HX, 115-watową kartą graficzną Nvidia GeForce RTX 4070, 16 GB pamięci RAM DDR5, 1 TB SSD i 16-calowym ekranem 144 Hz WUXGA (1920 x 1200). W tej recenzji określamy, jak Sword 16 HX wypada na tle innych komputerów z podobnym sprzętem i przyglądamy się niektórym z jego mocnych stron i kompromisów.
Intel Core i7-14700HX, NVIDIA GeForce RTX 4070 Laptop GPU, 16", 2.3 kgRecenzja laptopa Lenovo Legion Pro 5i: Super wydajny i7-14700HX i wydajność RTX 4060
Podczas naszego testu wszystkie oczy były zwrócone na Lenovo Legion Pro 5 16IRX9 dzięki jego mocnemu procesorowi i wydajności w grach. Nasza recenzja ujawni, jakie jeszcze mocne - a także słabe - strony ma ten gracz.
Intel Core i7-14700HX, NVIDIA GeForce RTX 4060 Laptop GPU, 16", 2.5 kgHP Victus 16 (2024): NVIDIA GeForce RTX 4060 Laptop GPU, 16.10", 2.4 kg
Recenzja » Recenzja laptopa HP Victus 16 (2024): Moc RTX 4060 w połączeniu z długim czasem pracy
Acer Predator Helios Neo 16 (2024): NVIDIA GeForce RTX 4070 Laptop GPU, 16.00", 2.6 kg
Recenzja » Recenzja Acer Predator Helios Neo 16 (2024): Laptop do gier z RTX 4070 i panelem DCI-P3
Lenovo LOQ 15IRX10, i7-14700HX: NVIDIA GeForce RTX 5060 Laptop, 15.60", 2.4 kg
Zewnętrzna recenzja » Lenovo LOQ 15IRX10, i7-14700HX
Lenovo LOQ 17IRX10: NVIDIA GeForce RTX 5070 Laptop, 17.30", 2.9 kg
Zewnętrzna recenzja » Lenovo LOQ 17IRX10
Lenovo Legion 5 15IRX10: NVIDIA GeForce RTX 5070 Laptop, 15.10", 1.9 kg
Zewnętrzna recenzja » Lenovo Legion 5 15IRX10
Lenovo LOQ 17IRX10, RTX 5060: NVIDIA GeForce RTX 5060 Laptop, 17.30", 2.9 kg
Zewnętrzna recenzja » Lenovo LOQ 17IRX10, RTX 5060
Lenovo Legion 5 15IRX10, i7-14700HX RTX 5060: NVIDIA GeForce RTX 5060 Laptop, 15.10", 1.9 kg
Zewnętrzna recenzja » Lenovo Legion 5 15IRX10, i7-14700HX RTX 5060
Lenovo Legion 5 16IRX9, i7-14700HX: NVIDIA GeForce RTX 4070 Laptop GPU, 6.00", 2.5 kg
Zewnętrzna recenzja » Lenovo Legion 5 16IRX9, i7-14700HX
Lenovo ThinkPad P16 Gen 2: NVIDIA RTX 4000 Ada Generation Laptop, 16.00", 3.1 kg
Zewnętrzna recenzja » Lenovo ThinkPad P16 Gen 2
MSI Sword 16 HX B14VFKG, i7-14700HX: NVIDIA GeForce RTX 4060 Laptop GPU, 16.00", 2.3 kg
Zewnętrzna recenzja » MSI Sword 16 HX B14VFKG, i7-14700HX
Acer Nitro 16 AN16-73, i7-14700HX: NVIDIA GeForce RTX 4060 Laptop GPU, 16.00", 2.5 kg
Zewnętrzna recenzja » Acer Nitro 16 AN16-73, i7-14700HX
MSI Crosshair 16 HX D14VFKG: NVIDIA GeForce RTX 4060 Laptop GPU, 16.00", 2.5 kg
Zewnętrzna recenzja » MSI Crosshair 16 HX D14VFKG
Lenovo Legion 7 16IRX9, i7-14700HX: NVIDIA GeForce RTX 4070 Laptop GPU, 16.00", 2.2 kg
Zewnętrzna recenzja » Lenovo Legion 7 16IRX9, i7-14700HX
MSI Raider GE68 HX 14VFG: NVIDIA GeForce RTX 4060 Laptop GPU, 16.00", 2.8 kg
Zewnętrzna recenzja » MSI Raider GE68 HX 14VFG
HP Omen 16-wf1000: NVIDIA GeForce RTX 4060 Laptop GPU, 16.10", 2.4 kg
Zewnętrzna recenzja » HP Omen 16-wf1000
HP Victus 16-r1000: NVIDIA GeForce RTX 4070 Laptop GPU, 16.10", 2.3 kg
Zewnętrzna recenzja » HP Victus 16-r1000
HP Omen Transcend 16-u1000ng: NVIDIA GeForce RTX 4060 Laptop GPU, 16.00", 2.2 kg
Zewnętrzna recenzja » HP Omen Transcend 16-u1000ng
Lenovo Legion Pro 5 16IRX9, i7-14700HX: NVIDIA GeForce RTX 4070 Laptop GPU, 16.00", 2.5 kg
Zewnętrzna recenzja » Lenovo Legion Pro 5 16IRX9, i7-14700HX
MSI Sword 16 HX B14VGKG: NVIDIA GeForce RTX 4070 Laptop GPU, 16.00", 2.3 kg
Zewnętrzna recenzja » MSI Sword 16 HX B14VGKG
MSI Sword 17 HX B14VGKG: NVIDIA GeForce RTX 4070 Laptop GPU, 17.00", 2.6 kg
Zewnętrzna recenzja » MSI Sword 17 HX B14VGKG
Acer Predator Helios Neo 16 (2024): NVIDIA GeForce RTX 4070 Laptop GPU, 16.00", 2.6 kg
Zewnętrzna recenzja » Acer Predator Helios Neo 16 (2024)