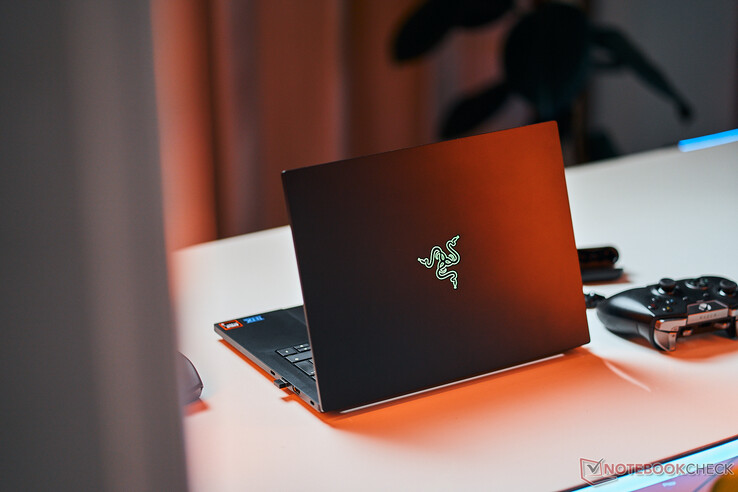
Recenzja laptopa Razer Blade 14 2024: Przyszłościowe rozwiązania z Ryzen AI
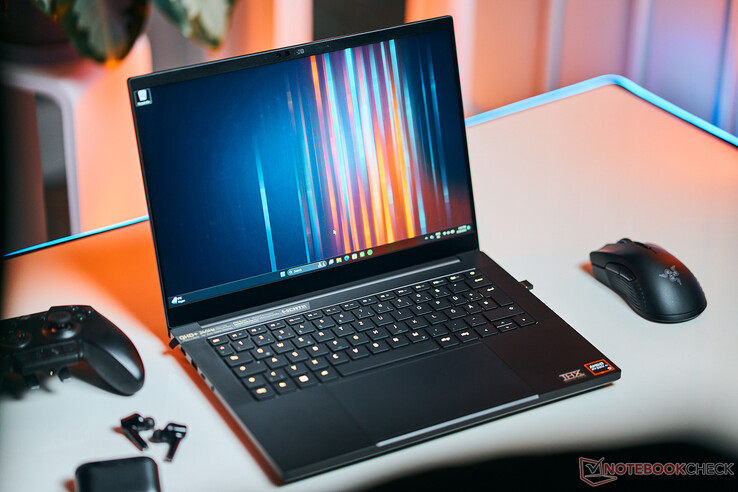
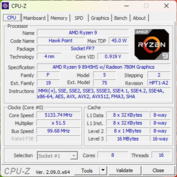
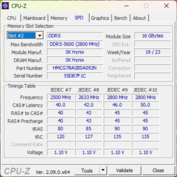
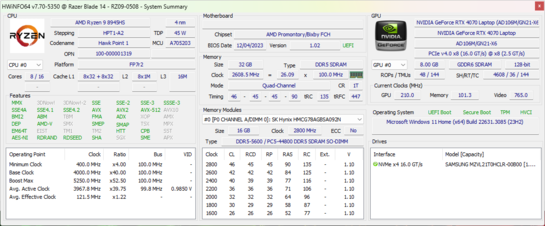
Ponieważ Blade 14 z 2023 roku był już znaczącą aktualizacją modelu z 2022 roku, najnowszy model z 2024 roku jest stosunkowo niewielką aktualizacją w stosunku do modelu z 2023 roku. Najnowsza wersja zastępuje procesor "Phoenix" Ryzen 9 7940HS w modelu 2023 procesorem "Hawk Point" Ryzen 9 8945HS. Poza tym, prawie wszystko inne w modelu 2024 pozostaje takie samo jak w modelu 2023, dlatego zalecamy zapoznanie się z naszą recenzją modelu 2023, aby dowiedzieć się więcej o fizycznych cechach Blade 14.
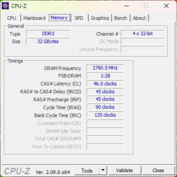
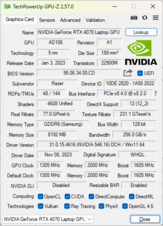
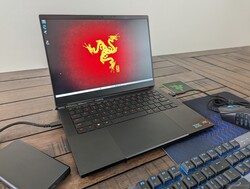
Nasza jednostka testowa to najwyższej klasy konfiguracja wyposażona we wspomniany procesor Zen 4, 32 GB wymiennej pamięci RAM DDR5-5600, 140 W kartę graficzną GeForce RTX 4070 i wyświetlacz IPS 1600p 240 Hz za około 2700 USD. Mniejsze jednostki SKU są dostarczane z RTX 4060, ale wszystkie konfiguracje 2024 są wyposażone w ten sam procesor Ryzen 9 i wyświetlacz. Opcja kolorystyczna Mercury jest dostępna tylko z grafiką RTX 4070.
Alternatywy dla Blade 14 obejmują inne 14-calowe laptopy do gier, takie jak Lenovo Legion Slim 5 14, Acer Predator Triton 14, Dell Alienware x14 lub popularny Asus Zephyrus G14.
Więcej recenzji Razer:
Potencjalni konkurenci w porównaniu
Ocena | Data | Model | Waga | Wysokość | Rozmiar | Rezolucja | Cena |
|---|---|---|---|---|---|---|---|
| 89.7 % v7 (old) | 02/2024 | Razer Blade 14 RZ09-0508 R9 8945HS, GeForce RTX 4070 Laptop GPU | 1.9 kg | 17.99 mm | 14.00" | 2560x1600 | |
| 88.7 % v7 (old) | 06/2023 | Razer Blade 14 RTX 4070 R9 7940HS, GeForce RTX 4070 Laptop GPU | 1.8 kg | 17.99 mm | 14.00" | 2560x1600 | |
| 92.8 % v7 (old) | 11/2023 | Apple MacBook Pro 14 2023 M3 Max Apple M3 Max 16-Core, M3 Max 40-Core GPU | 1.6 kg | 15.5 mm | 14.20" | 3024x1964 | |
| 87.7 % v7 (old) | 09/2023 | Lenovo Legion Slim 5 14APH8 R7 7840HS, GeForce RTX 4060 Laptop GPU | 1.7 kg | 20.79 mm | 14.50" | 2880x1600 | |
| 87.3 % v7 (old) | 07/2023 | Acer Predator Triton 14 PT14-51 i7-13700H, GeForce RTX 4050 Laptop GPU | 1.7 kg | 19.81 mm | 14.00" | 2560x1600 | |
| 90 % v7 (old) | 05/2023 | Asus ROG Zephyrus G14 GA402XY R9 7940HS, GeForce RTX 4090 Laptop GPU | 1.7 kg | 20.5 mm | 14.00" | 2560x1600 | |
| 89.4 % v7 (old) | 05/2023 | Gigabyte Aero 14 OLED BMF i7-13700H, GeForce RTX 4050 Laptop GPU | 1.4 kg | 17 mm | 14.00" | 2880x1800 |
Komunikacja
Moduł bezprzewodowy został zaktualizowany z Qualcomm WCN685x do Qualcomm FastConnect 7800 w celu zapewnienia kompatybilności z Wi-Fi 7. Zdecydowana większość użytkowników nie skorzysta z nowych funkcji układu, ponieważ routery Wi-Fi 7 nie są jeszcze powszechne. Tak więc, jego włączenie jest bardziej związane z zabezpieczeniem na przyszłość, gdy lub jeśli właściciele zdecydują się na uaktualnienie swoich sieci domowych do Wi-Fi 7.
Nie doświadczyliśmy żadnych problemów z łącznością ani niestabilności po sparowaniu z naszym routerem testowym Asus AXE11000 Wi-Fi 6E.
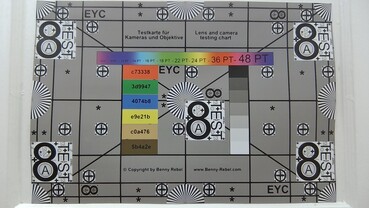
Kamera internetowa
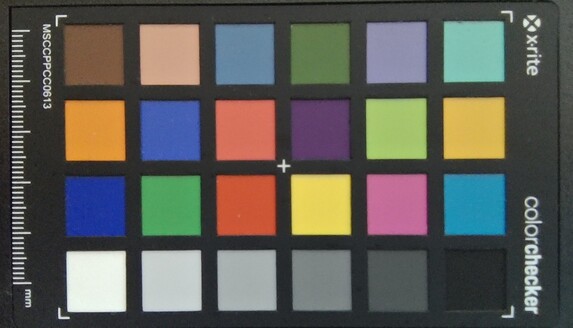
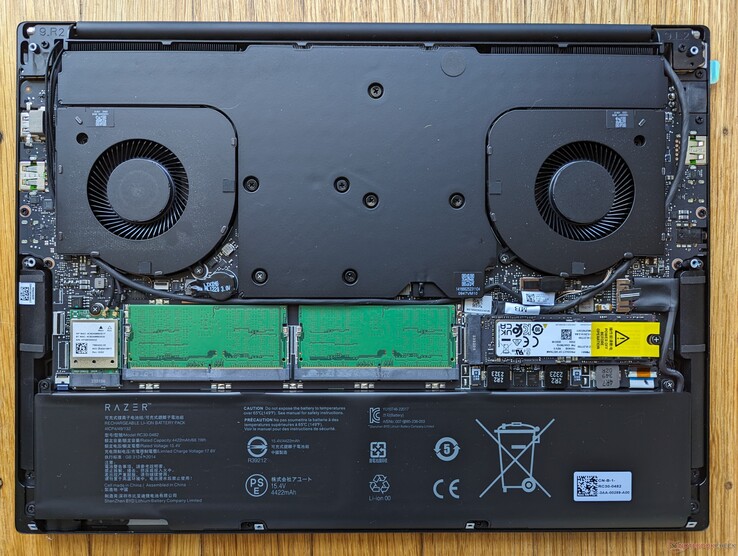
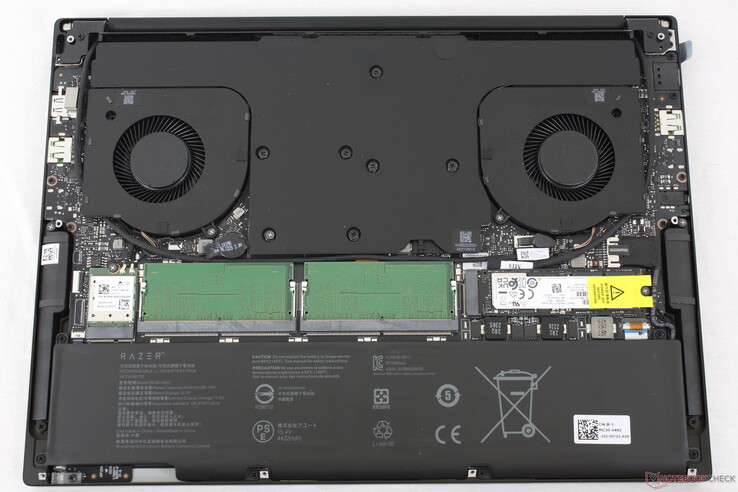
Konserwacja
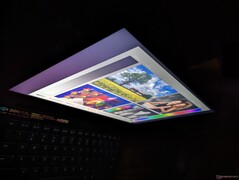
Wyświetlacz - IPS do gier i tworzenia treści
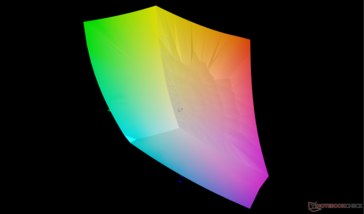
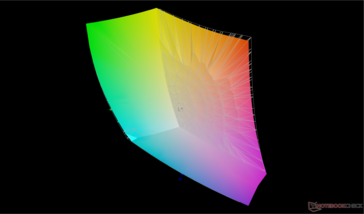
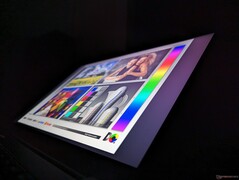
Co ciekawe, panel w tegorocznym modelu Blade 14 jest inny niż w zeszłorocznym modelu (TL140ADXP04-0 vs. B140QAN06.U). Nowy panel jest nieco ciemniejszy, gdy zmierzyliśmy go naszym kolorymetrem, ale wszystko inne, w tym szybki czas reakcji, pełne kolory DCI-P3, częstotliwość odświeżania 240 Hz i współczynnik kontrastu ~1300:1 pozostają zasadniczo takie same, zapewniając podobne wrażenia wizualne rok do roku.
Proszę zauważyć, że FreeSync Premium jest obsługiwany, ale nie G-Sync, tak jak w zeszłorocznym modelu.
| |||||||||||||||||||||||||
rozświetlenie: 89 %
na akumulatorze: 484.1 cd/m²
kontrast: 1274:1 (czerń: 0.38 cd/m²)
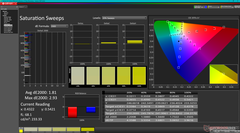
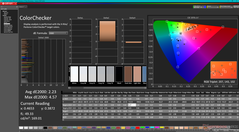
ΔE ColorChecker Calman: 2.23 | ∀{0.5-29.43 Ø4.76}
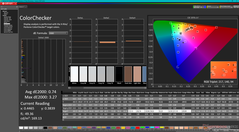
calibrated: 0.74
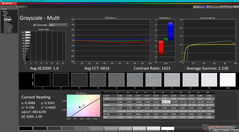
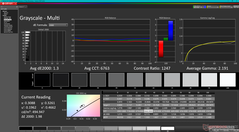
ΔE Greyscale Calman: 1.6 | ∀{0.09-98 Ø5}
85% AdobeRGB 1998 (Argyll 3D)
99.8% sRGB (Argyll 3D)
96.9% Display P3 (Argyll 3D)
Gamma: 2.24
CCT: 6816 K
| Razer Blade 14 RZ09-0508 TL140ADXP04-0, IPS, 2560x1600, 14" | Razer Blade 14 RTX 4070 AU Optronics B140QAN06.U, IPS, 2560x1600, 14" | Apple MacBook Pro 14 2023 M3 Max Mini-LED, 3024x1964, 14.2" | Lenovo Legion Slim 5 14APH8 Samsung SDC ATNA45AF02-2, OLED, 2880x1600, 14.5" | Acer Predator Triton 14 PT14-51 BOE NE140QDM-NY1, IPS, 2560x1600, 14" | Asus ROG Zephyrus G14 GA402XY B140QAN06.S, Mini-LED, 2560x1600, 14" | Gigabyte Aero 14 OLED BMF Samsung SDC4192 (ATNA40YK14-0), OLED, 2880x1800, 14" | |
|---|---|---|---|---|---|---|---|
| Display | 0% | 2% | 6% | 0% | 4% | 2% | |
| Display P3 Coverage (%) | 96.9 | 97.3 0% | 99.2 2% | 99.9 3% | 96.9 0% | 99.6 3% | 99.8 3% |
| sRGB Coverage (%) | 99.8 | 99.8 0% | 100 0% | 99.9 0% | 100 0% | 100 0% | |
| AdobeRGB 1998 Coverage (%) | 85 | 85.3 0% | 96.5 14% | 85.5 1% | 93.4 10% | 88.7 4% | |
| Response Times | -47% | -1048% | 88% | -61% | -103% | 66% | |
| Response Time Grey 50% / Grey 80% * (ms) | 6 ? | 11.9 ? -98% | 80.8 ? -1247% | 0.79 ? 87% | 15.1 ? -152% | 17.2 ? -187% | 2.4 ? 60% |
| Response Time Black / White * (ms) | 8.3 ? | 8 ? 4% | 78.8 ? -849% | 1.01 ? 88% | 5.8 ? 30% | 9.9 ? -19% | 2.4 ? 71% |
| PWM Frequency (Hz) | 14878 ? | 240.5 ? | 5430 | 300 | |||
| Screen | -51% | 18% | -22% | -45% | 19% | 50% | |
| Brightness middle (cd/m²) | 484.1 | 559.3 16% | 610 26% | 377.5 -22% | 547 13% | 535 11% | 423 -13% |
| Brightness (cd/m²) | 466 | 560 20% | 600 29% | 381 -18% | 516 11% | 563 21% | 427 -8% |
| Brightness Distribution (%) | 89 | 88 -1% | 96 8% | 97 9% | 88 -1% | 91 2% | 98 10% |
| Black Level * (cd/m²) | 0.38 | 0.44 -16% | 0.56 -47% | 0.1 74% | |||
| Contrast (:1) | 1274 | 1271 0% | 977 -23% | 4230 232% | |||
| Colorchecker dE 2000 * | 2.23 | 4.44 -99% | 1.7 24% | 4.19 -88% | 3.28 -47% | 1 55% | 0.55 75% |
| Colorchecker dE 2000 max. * | 4.57 | 9.3 -104% | 2.3 50% | 7.02 -54% | 8.57 -88% | 2.8 39% | 1.15 75% |
| Colorchecker dE 2000 calibrated * | 0.74 | 0.39 47% | 0.81 -9% | 1.09 -47% | 1.15 -55% | ||
| Greyscale dE 2000 * | 1.6 | 6.8 -325% | 2.1 -31% | 1.2 25% | 4.4 -175% | 1.8 -13% | 0.69 57% |
| Gamma | 2.24 98% | 2.3 96% | 2.22 99% | 2.22 99% | 2.168 101% | 2.24 98% | 2.42 91% |
| CCT | 6816 95% | 6242 104% | 6874 95% | 6296 103% | 7767 84% | 6337 103% | 6479 100% |
| Całkowita średnia (program / ustawienia) | -33% /
-40% | -343% /
-221% | 24% /
3% | -35% /
-38% | -27% /
-7% | 39% /
42% |
* ... im mniej tym lepiej
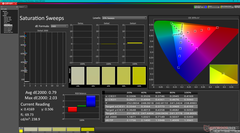
Wszystkie urządzenia są wstępnie skalibrowane, aby lepiej wykorzystać szerokie pokrycie kolorów panelu. Nasza konkretna jednostka ma średnią wartość deltaE w skali szarości i kolorze wynoszącą odpowiednio zaledwie 1,6 i 2,23 w stosunku do standardu P3, jak pokazują nasze wyniki CalMAN poniżej. Kalibracja przez użytkownika końcowego nie jest zatem konieczna dla większości użytkowników.
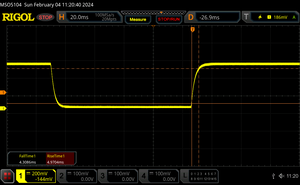
Wyświetl czasy reakcji
| ↔ Czas reakcji od czerni do bieli | ||
|---|---|---|
| 8.3 ms ... wzrost ↗ i spadek ↘ łącznie | ↗ 5 ms wzrost | |
| ↘ 4.3 ms upadek | ||
| W naszych testach ekran wykazuje szybki czas reakcji i powinien nadawać się do gier. Dla porównania, wszystkie testowane urządzenia wahają się od 0.1 (minimum) do 240 (maksimum) ms. » 23 % wszystkich urządzeń jest lepszych. Oznacza to, że zmierzony czas reakcji jest lepszy od średniej wszystkich testowanych urządzeń (20.1 ms). | ||
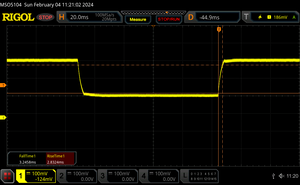
| ↔ Czas reakcji 50% szarości do 80% szarości | ||
| 6 ms ... wzrost ↗ i spadek ↘ łącznie | ↗ 2.8 ms wzrost | |
| ↘ 3.2 ms upadek | ||
| W naszych testach ekran wykazuje bardzo szybką reakcję i powinien bardzo dobrze nadawać się do szybkich gier. Dla porównania, wszystkie testowane urządzenia wahają się od 0.165 (minimum) do 636 (maksimum) ms. » 18 % wszystkich urządzeń jest lepszych. Oznacza to, że zmierzony czas reakcji jest lepszy od średniej wszystkich testowanych urządzeń (31.5 ms). | ||
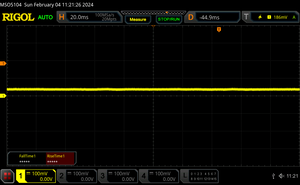
Migotanie ekranu / PWM (modulacja szerokości impulsu)
| Migotanie ekranu/nie wykryto PWM | |||
Dla porównania: 53 % wszystkich testowanych urządzeń nie używa PWM do przyciemniania wyświetlacza. Jeśli wykryto PWM, zmierzono średnio 8036 (minimum: 5 - maksimum: 343500) Hz. | |||
Wydajność
Warunki testowania
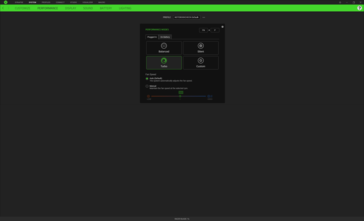
Przed wykonaniem poniższych testów porównawczych ustawiliśmy system w trybie Turbo i dGPU za pomocą preinstalowanego oprogramowania Synapse. Wydajność spada, jeśli ustawiony jest tryb zrównoważony, jak opisano szczegółowo w sekcji Wydajność GPU.
Nowością w Synapse w tym roku jest przełącznik MUX, podczas gdy starsza wersja w modelu 2023 nie miała takiej opcji. Profile zasilania również zostały usprawnione dzięki nowej opcji "Turbo" zamiast indywidualnych ustawień dla CPU i GPU.
Procesor - Ryzen 9 7940HS w przebraniu
Ryzen Ryzen 9 8945HS jest rebrandowanym Ryzen 9 7940HS w swoim rdzeniu. Oba procesory celują w podobne częstotliwości taktowania z identycznymi rozmiarami pamięci podręcznej i liczbą rdzeni wyprodukowanych w ramach tej samej platformy Zen 4. Nie dziwi więc fakt, że benchmarki intensywnie wykorzystujące CPU dają niemal identyczne wyniki dla obu procesorów. W przypadku tradycyjnych zadań, takich jak kodowanie wideo, kompresja plików lub gry, Blade 14 2024 ma tylko marginalną przewagę nad modelem 2023.
Główna różnica między Ryzen 9 8945HS i 7940HS polega na szybszej zintegrowanej jednostce NPU w nowszym procesorze, która umożliwia korzystanie z efektów Windows Studio, takich jak automatyczne kadrowanie kamery internetowej, korekcja kontaktu wzrokowego i rozmycie tła. Jednak takie funkcje są dostępne w laptopach z procesorami Intela od co najmniej roku, więc nie są niczym nowym. Automatyczne kadrowanie nie współgra również dobrze z kamerą internetową Razer o niskiej rozdzielczości 2 MP; HP oferuje tę samą funkcję, ale z kamerą internetową o wyższej rozdzielczości 5 MP, która zapewnia wyraźniejsze przesuwanie i powiększanie.
Oprócz Windows Studio Effects, zintegrowany procesor NPU w Ryzen 9 8945HS powinien również być w stanie uruchomić Microsoft Co-Pilot lokalnie, zamiast polegać na chmurze i łączności z Internetem. W ten sposób wyniki byłyby generowane niemal natychmiastowo, w przeciwieństwie do kilku sekund na starszych procesorach. Niestety, w chwili pisania tego tekstu Co-Pilot jest całkowicie oparty na chmurze i nie ma opcji uruchamiania go lokalnie lub offline, co oznacza, że nie można nawet wykorzystać fantazyjnego nowego NPU do tego, do czego został zaprojektowany. Oczekuje się, że zmieni się to w przyszłości, gdy aplikacje AI dojrzeją, oczywiście, ale NPU na początku 2024 roku jest bardzo ograniczony.
Cinebench R15 Multi Loop
Cinebench R23: Multi Core | Single Core
Cinebench R20: CPU (Multi Core) | CPU (Single Core)
Cinebench R15: CPU Multi 64Bit | CPU Single 64Bit
Blender: v2.79 BMW27 CPU
7-Zip 18.03: 7z b 4 | 7z b 4 -mmt1
Geekbench 6.5: Multi-Core | Single-Core
Geekbench 5.5: Multi-Core | Single-Core
HWBOT x265 Benchmark v2.2: 4k Preset
LibreOffice : 20 Documents To PDF
R Benchmark 2.5: Overall mean
* ... im mniej tym lepiej
AIDA64: FP32 Ray-Trace | FPU Julia | CPU SHA3 | CPU Queen | FPU SinJulia | FPU Mandel | CPU AES | CPU ZLib | FP64 Ray-Trace | CPU PhotoWorxx
| Performance rating | |
| Razer Blade 14 RZ09-0508 | |
| Razer Blade 14 RTX 4070 | |
| Lenovo Legion Slim 5 14APH8 | |
| Przeciętny AMD Ryzen 9 8945HS | |
| Acer Predator Triton 14 PT14-51 | |
| Gigabyte Aero 14 OLED BMF | |
| AIDA64 / FP32 Ray-Trace | |
| Razer Blade 14 RTX 4070 | |
| Lenovo Legion Slim 5 14APH8 | |
| Razer Blade 14 RZ09-0508 | |
| Przeciętny AMD Ryzen 9 8945HS (23462 - 28836, n=8) | |
| Acer Predator Triton 14 PT14-51 | |
| Gigabyte Aero 14 OLED BMF | |
| AIDA64 / FPU Julia | |
| Razer Blade 14 RTX 4070 | |
| Lenovo Legion Slim 5 14APH8 | |
| Razer Blade 14 RZ09-0508 | |
| Przeciętny AMD Ryzen 9 8945HS (95557 - 122633, n=8) | |
| Acer Predator Triton 14 PT14-51 | |
| Gigabyte Aero 14 OLED BMF | |
| AIDA64 / CPU SHA3 | |
| Razer Blade 14 RTX 4070 | |
| Razer Blade 14 RZ09-0508 | |
| Lenovo Legion Slim 5 14APH8 | |
| Przeciętny AMD Ryzen 9 8945HS (4338 - 5077, n=8) | |
| Acer Predator Triton 14 PT14-51 | |
| Gigabyte Aero 14 OLED BMF | |
| AIDA64 / CPU Queen | |
| Razer Blade 14 RZ09-0508 | |
| Razer Blade 14 RTX 4070 | |
| Lenovo Legion Slim 5 14APH8 | |
| Przeciętny AMD Ryzen 9 8945HS (101809 - 125044, n=8) | |
| Gigabyte Aero 14 OLED BMF | |
| Acer Predator Triton 14 PT14-51 | |
| AIDA64 / FPU SinJulia | |
| Razer Blade 14 RZ09-0508 | |
| Razer Blade 14 RTX 4070 | |
| Lenovo Legion Slim 5 14APH8 | |
| Przeciętny AMD Ryzen 9 8945HS (13669 - 15661, n=8) | |
| Acer Predator Triton 14 PT14-51 | |
| Gigabyte Aero 14 OLED BMF | |
| AIDA64 / FPU Mandel | |
| Razer Blade 14 RTX 4070 | |
| Razer Blade 14 RZ09-0508 | |
| Lenovo Legion Slim 5 14APH8 | |
| Przeciętny AMD Ryzen 9 8945HS (50872 - 65746, n=8) | |
| Acer Predator Triton 14 PT14-51 | |
| Gigabyte Aero 14 OLED BMF | |
| AIDA64 / CPU AES | |
| Acer Predator Triton 14 PT14-51 | |
| Przeciętny AMD Ryzen 9 8945HS (77854 - 169431, n=8) | |
| Gigabyte Aero 14 OLED BMF | |
| Razer Blade 14 RZ09-0508 | |
| Razer Blade 14 RTX 4070 | |
| Lenovo Legion Slim 5 14APH8 | |
| AIDA64 / CPU ZLib | |
| Acer Predator Triton 14 PT14-51 | |
| Razer Blade 14 RTX 4070 | |
| Razer Blade 14 RZ09-0508 | |
| Lenovo Legion Slim 5 14APH8 | |
| Przeciętny AMD Ryzen 9 8945HS (935 - 1135, n=8) | |
| Gigabyte Aero 14 OLED BMF | |
| AIDA64 / FP64 Ray-Trace | |
| Razer Blade 14 RTX 4070 | |
| Razer Blade 14 RZ09-0508 | |
| Lenovo Legion Slim 5 14APH8 | |
| Przeciętny AMD Ryzen 9 8945HS (12443 - 15588, n=8) | |
| Acer Predator Triton 14 PT14-51 | |
| Gigabyte Aero 14 OLED BMF | |
| AIDA64 / CPU PhotoWorxx | |
| Gigabyte Aero 14 OLED BMF | |
| Acer Predator Triton 14 PT14-51 | |
| Razer Blade 14 RZ09-0508 | |
| Przeciętny AMD Ryzen 9 8945HS (33371 - 40815, n=8) | |
| Lenovo Legion Slim 5 14APH8 | |
| Razer Blade 14 RTX 4070 | |
Test warunków skrajnych
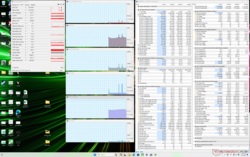
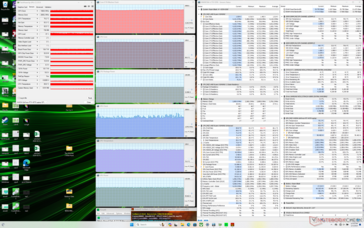
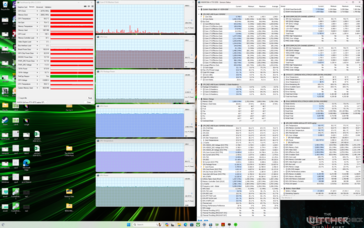
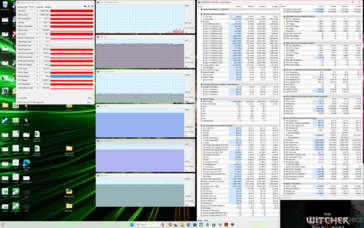
Przyglądając się bliżej parametrom systemu w czasie rzeczywistym, możemy zobaczyć, dlaczego GPU w modelu 2024 konsekwentnie przewyższa model 2023, mimo że oba wykorzystują tę samą grafikę RTX 4070. GPU w nowszym Blade 14 ustabilizowałby się przy wyższym TGP wynoszącym 114 W w porównaniu do zaledwie 87 W w zeszłorocznym modelu podczas uruchamiania gier w trybie Turbo. Zarówno częstotliwość taktowania GPU (2550 MHz vs 2310 MHz), jak i temperatura rdzenia (76 C vs 67 C) są w konsekwencji wyższe w nowszym modelu. Zejście do trybu zrównoważonego obniżyłoby TGP i częstotliwość taktowania GPU tylko nieznacznie, odpowiednio do 103 W i 2475 MHz, ale zarówno temperatura, jak i hałas wentylatora są również obniżone, co zapewnia cichszą rozgrywkę.
Proszę zauważyć, że podczas gdy Razer reklamuje maksymalne TGP na poziomie 140 W, cel ten jest nie do utrzymania w większości warunków. Zamiast tego, stała moc GPU wynosząca 114 W podczas grania jest dokładniejszym oczekiwaniem dla 2024 Blade 14.
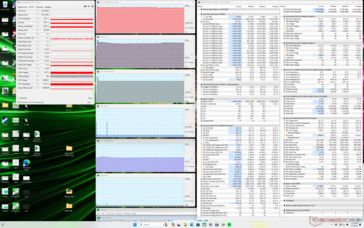
Procesor Ryzen 9 8945HS ustabilizowałby się przy prawie takich samych częstotliwościach taktowania rdzenia, temperaturze i mocy pakietu, jak Ryzen 9 7940HS w zeszłorocznym modelu podczas stresu Prime95. Wyniki te uzupełniają nasze obserwacje CineBench powyżej, gdzie oba procesory zwróciłyby niemal identyczne wyniki wydajności. Częstotliwość taktowania Turbo Core, temperatura i pobór mocy osiągnęły szczytowe wartości, odpowiednio, 4,7 GHz, 97 C i 90 W, tylko przez kilka pierwszych sekund testu warunków skrajnych, po czym spadły i ustabilizowały się na nieco niższych wartościach, jak pokazano w poniższej tabeli.
Wydajność systemu
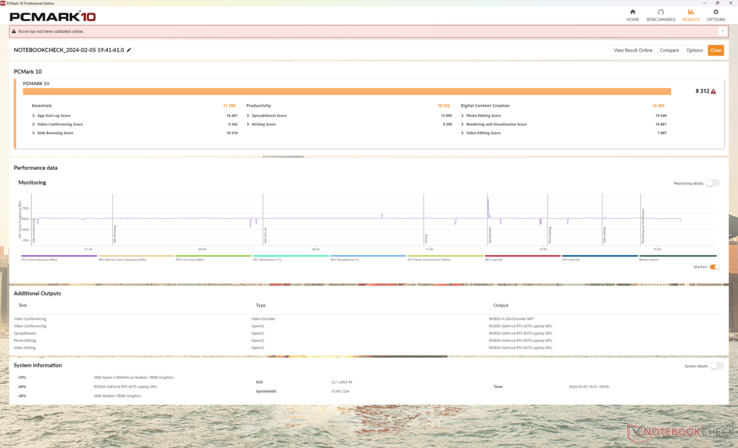
Wyniki PCMark mieszczą się w granicach jednocyfrowych punktów procentowych w stosunku do modelu 2023, co pokazuje, że codzienne zadania, takie jak przeglądanie i lekka edycja, nie są zauważalnie szybsze na najnowszym modelu. Wydajność pamięci RAM jest jednak konsekwentnie szybsza niż wcześniej, co może pomóc zwiększyć wydajność w grach, nawet jeśli tylko nieznacznie.
CrossMark: Overall | Productivity | Creativity | Responsiveness
WebXPRT 3: Overall
WebXPRT 4: Overall
Mozilla Kraken 1.1: Total
| PCMark 10 / Score | |
| Razer Blade 14 RZ09-0508 | |
| Asus ROG Zephyrus G14 GA402XY | |
| Razer Blade 14 RTX 4070 | |
| Lenovo Legion Slim 5 14APH8 | |
| Przeciętny AMD Ryzen 9 8945HS, NVIDIA GeForce RTX 4070 Laptop GPU (7436 - 8312, n=3) | |
| Acer Predator Triton 14 PT14-51 | |
| Gigabyte Aero 14 OLED BMF | |
| PCMark 10 / Essentials | |
| Gigabyte Aero 14 OLED BMF | |
| Razer Blade 14 RZ09-0508 | |
| Lenovo Legion Slim 5 14APH8 | |
| Razer Blade 14 RTX 4070 | |
| Asus ROG Zephyrus G14 GA402XY | |
| Acer Predator Triton 14 PT14-51 | |
| Przeciętny AMD Ryzen 9 8945HS, NVIDIA GeForce RTX 4070 Laptop GPU (9672 - 11290, n=3) | |
| PCMark 10 / Productivity | |
| Razer Blade 14 RTX 4070 | |
| Asus ROG Zephyrus G14 GA402XY | |
| Razer Blade 14 RZ09-0508 | |
| Acer Predator Triton 14 PT14-51 | |
| Przeciętny AMD Ryzen 9 8945HS, NVIDIA GeForce RTX 4070 Laptop GPU (9502 - 10332, n=3) | |
| Lenovo Legion Slim 5 14APH8 | |
| Gigabyte Aero 14 OLED BMF | |
| PCMark 10 / Digital Content Creation | |
| Razer Blade 14 RZ09-0508 | |
| Asus ROG Zephyrus G14 GA402XY | |
| Razer Blade 14 RTX 4070 | |
| Przeciętny AMD Ryzen 9 8945HS, NVIDIA GeForce RTX 4070 Laptop GPU (11907 - 13363, n=3) | |
| Lenovo Legion Slim 5 14APH8 | |
| Acer Predator Triton 14 PT14-51 | |
| Gigabyte Aero 14 OLED BMF | |
| CrossMark / Overall | |
| Apple MacBook Pro 14 2023 M3 Max | |
| Lenovo Legion Slim 5 14APH8 | |
| Acer Predator Triton 14 PT14-51 | |
| Gigabyte Aero 14 OLED BMF | |
| Asus ROG Zephyrus G14 GA402XY | |
| Razer Blade 14 RZ09-0508 | |
| Razer Blade 14 RTX 4070 | |
| Przeciętny AMD Ryzen 9 8945HS, NVIDIA GeForce RTX 4070 Laptop GPU (1767 - 1830, n=2) | |
| CrossMark / Productivity | |
| Apple MacBook Pro 14 2023 M3 Max | |
| Lenovo Legion Slim 5 14APH8 | |
| Gigabyte Aero 14 OLED BMF | |
| Razer Blade 14 RZ09-0508 | |
| Razer Blade 14 RTX 4070 | |
| Asus ROG Zephyrus G14 GA402XY | |
| Acer Predator Triton 14 PT14-51 | |
| Przeciętny AMD Ryzen 9 8945HS, NVIDIA GeForce RTX 4070 Laptop GPU (1686 - 1783, n=2) | |
| CrossMark / Creativity | |
| Apple MacBook Pro 14 2023 M3 Max | |
| Asus ROG Zephyrus G14 GA402XY | |
| Acer Predator Triton 14 PT14-51 | |
| Razer Blade 14 RTX 4070 | |
| Przeciętny AMD Ryzen 9 8945HS, NVIDIA GeForce RTX 4070 Laptop GPU (1935 - 1960, n=2) | |
| Lenovo Legion Slim 5 14APH8 | |
| Razer Blade 14 RZ09-0508 | |
| Gigabyte Aero 14 OLED BMF | |
| CrossMark / Responsiveness | |
| Lenovo Legion Slim 5 14APH8 | |
| Acer Predator Triton 14 PT14-51 | |
| Gigabyte Aero 14 OLED BMF | |
| Razer Blade 14 RZ09-0508 | |
| Przeciętny AMD Ryzen 9 8945HS, NVIDIA GeForce RTX 4070 Laptop GPU (1489 - 1672, n=2) | |
| Razer Blade 14 RTX 4070 | |
| Apple MacBook Pro 14 2023 M3 Max | |
| Asus ROG Zephyrus G14 GA402XY | |
| WebXPRT 3 / Overall | |
| Apple MacBook Pro 14 2023 M3 Max | |
| Razer Blade 14 RZ09-0508 | |
| Asus ROG Zephyrus G14 GA402XY | |
| Razer Blade 14 RTX 4070 | |
| Lenovo Legion Slim 5 14APH8 | |
| Przeciętny AMD Ryzen 9 8945HS, NVIDIA GeForce RTX 4070 Laptop GPU (268 - 324, n=3) | |
| Gigabyte Aero 14 OLED BMF | |
| Acer Predator Triton 14 PT14-51 | |
| WebXPRT 4 / Overall | |
| Razer Blade 14 RZ09-0508 | |
| Gigabyte Aero 14 OLED BMF | |
| Asus ROG Zephyrus G14 GA402XY | |
| Razer Blade 14 RTX 4070 | |
| Lenovo Legion Slim 5 14APH8 | |
| Przeciętny AMD Ryzen 9 8945HS, NVIDIA GeForce RTX 4070 Laptop GPU (226 - 269, n=3) | |
| Acer Predator Triton 14 PT14-51 | |
| Mozilla Kraken 1.1 / Total | |
| Acer Predator Triton 14 PT14-51 | |
| Przeciętny AMD Ryzen 9 8945HS, NVIDIA GeForce RTX 4070 Laptop GPU (488 - 586, n=4) | |
| Asus ROG Zephyrus G14 GA402XY | |
| Gigabyte Aero 14 OLED BMF | |
| Lenovo Legion Slim 5 14APH8 | |
| Razer Blade 14 RTX 4070 | |
| Razer Blade 14 RZ09-0508 | |
| Apple MacBook Pro 14 2023 M3 Max | |
* ... im mniej tym lepiej
| PCMark 10 Score | 8312 pkt. | |
Pomoc | ||
| AIDA64 / Memory Copy | |
| Gigabyte Aero 14 OLED BMF | |
| Acer Predator Triton 14 PT14-51 | |
| Lenovo Legion Slim 5 14APH8 | |
| Razer Blade 14 RZ09-0508 | |
| Przeciętny AMD Ryzen 9 8945HS (62371 - 69218, n=8) | |
| Razer Blade 14 RTX 4070 | |
| AIDA64 / Memory Read | |
| Gigabyte Aero 14 OLED BMF | |
| Acer Predator Triton 14 PT14-51 | |
| Razer Blade 14 RZ09-0508 | |
| Razer Blade 14 RTX 4070 | |
| Przeciętny AMD Ryzen 9 8945HS (49966 - 61710, n=8) | |
| Lenovo Legion Slim 5 14APH8 | |
| AIDA64 / Memory Write | |
| Lenovo Legion Slim 5 14APH8 | |
| Gigabyte Aero 14 OLED BMF | |
| Razer Blade 14 RZ09-0508 | |
| Przeciętny AMD Ryzen 9 8945HS (78351 - 93153, n=8) | |
| Acer Predator Triton 14 PT14-51 | |
| Razer Blade 14 RTX 4070 | |
| AIDA64 / Memory Latency | |
| Lenovo Legion Slim 5 14APH8 | |
| Acer Predator Triton 14 PT14-51 | |
| Razer Blade 14 RZ09-0508 | |
| Przeciętny AMD Ryzen 9 8945HS (87.8 - 110.4, n=8) | |
| Gigabyte Aero 14 OLED BMF | |
| Razer Blade 14 RTX 4070 | |
* ... im mniej tym lepiej
Opóźnienie DPC
| DPC Latencies / LatencyMon - interrupt to process latency (max), Web, Youtube, Prime95 | |
| Gigabyte Aero 14 OLED BMF | |
| Lenovo Legion Slim 5 14APH8 | |
| Acer Predator Triton 14 PT14-51 | |
| Asus ROG Zephyrus G14 GA402XY | |
| Razer Blade 14 RZ09-0508 | |
| Razer Blade 14 RTX 4070 | |
* ... im mniej tym lepiej
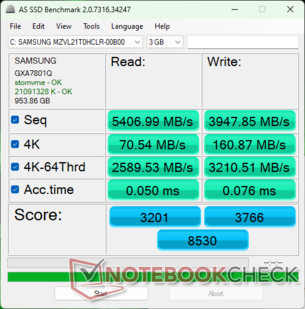
Urządzenia pamięci masowej
| Drive Performance rating - Percent | |
| Lenovo Legion Slim 5 14APH8 | |
| Razer Blade 14 RTX 4070 | |
| Razer Blade 14 RZ09-0508 | |
| Gigabyte Aero 14 OLED BMF | |
| Asus ROG Zephyrus G14 GA402XY | |
| Acer Predator Triton 14 PT14-51 | |
* ... im mniej tym lepiej
Disk Throttling: DiskSpd Read Loop, Queue Depth 8
Wydajność GPU
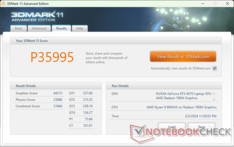
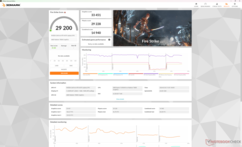
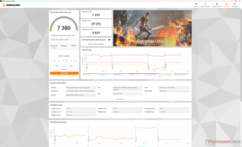
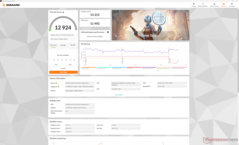
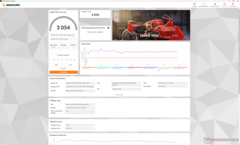
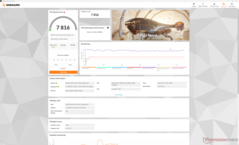
Pomimo pracy na tym samym 140 W mobilnym procesorze graficznym GeForce RTX 4070 co model 2023, wyniki graficzne 3DMark wzrosły o prawie 10 procent. Wyniki są konsekwentnie wyższe niż nawet większy MSI Raider GE68 HX wyposażony w ten sam procesor graficzny RTX 4070. Proszę zauważyć, że system musi pracować w trybie Performance, aby osiągnąć wyniki lepsze od oczekiwanych. W przeciwnym razie praca w trybie zrównoważonym spowodowałaby spadek ogólnej wydajności nawet o 11 procent, zgodnie z naszą tabelą wyników Fire Strike poniżej.
| Profil zasilania | Wynik grafiki | Wynik fizyki | Wynik łączny |
| Tryb wydajności | 33451 | 29228 | 14940 |
| Tryb zrównoważony | 32305 (-4%) | 28019 (-4%) | 13356 (-11%) |
| Zasilanie bateryjne | 21602 (-35%) | 24961 (-15%) | 8881 (-41%) |
Oczekuje się, że wybór konfiguracji RTX 4060 w Blade 14 wpłynie na wydajność GPU o około 10 do 20 procent. Niestety, Razer nie oferuje żadnych opcji graficznych poza RTX 4070, podczas gdy konkurencyjny Asus Zephyrus G14 może przejść na RTX 4090, aby uzyskać jeszcze większą wydajność i dwa razy więcej pamięci VRAM.
| 3DMark Performance rating - Percent | |
| KFA2 GeForce RTX 4070 Ti SG | |
| MSI Vector 16 HX A14V | |
| Asus ROG Zephyrus G14 GA402XY | |
| Razer Blade 14 RZ09-0508 | |
| Razer Blade 14 RTX 4070 | |
| MSI Raider GE68 HX 13VG, i7-13700HX -1! | |
| Przeciętny NVIDIA GeForce RTX 4070 Laptop GPU | |
| Lenovo Legion Slim 5 14APH8 | |
| Gigabyte Aero 14 OLED BMF -1! | |
| Acer Swift Go 14 SFG14-72 -2! | |
| Lenovo Yoga Slim 7 14APU G8 -2! | |
| Asus VivoBook 14X K3405 | |
| HP Pavilion Plus 14-ew0153TU -2! | |
| 3DMark 11 Performance | 35995 pkt. | |
| 3DMark Fire Strike Score | 29200 pkt. | |
| 3DMark Time Spy Score | 12924 pkt. | |
| 3DMark Steel Nomad Score | 2795 pkt. | |
Pomoc | ||
* ... im mniej tym lepiej
Wydajność w grach
Zdecydowana większość testowanych gier działa nieco szybciej na naszym Blade 14 2024 w porównaniu do naszego modelu 2023, zgodnie z przewidywaniami wynikającymi z powyższych wyników 3DMark. Tytuły bardziej wymagające pod względem GPU, takie jak Final Fantasy XV czy Cyberpunk 2077, działają nieco szybciej, podczas gdy starsze i mniej wymagające tytuły, takie jak DOTA 2 Reborn czy GTA V, nie odnotowują żadnej poprawy.
Rozgrywka w 4K jest możliwa, aczkolwiek satysfakcjonująca tylko w tytułach z DLSS i generowaniem klatek w celu zwiększenia liczby klatek na sekundę. Przykładowo, Cyberpunk 2077 na maksymalnych natywnych ustawieniach 4K uzyskałby średnio zaledwie 5,8 FPS w porównaniu do 41 FPS, gdyby włączono zarówno DLSS Auto, jak i generowanie klatek.
| The Witcher 3 - 1920x1080 Ultra Graphics & Postprocessing (HBAO+) | |
| Asus ROG Zephyrus G14 GA402XY | |
| Razer Blade 14 RZ09-0508 | |
| Razer Blade 14 RTX 4070 | |
| Lenovo Legion Slim 5 14APH8 | |
| Apple MacBook Pro 14 2023 M3 Max | |
| Acer Predator Triton 14 PT14-51 | |
| Gigabyte Aero 14 OLED BMF | |
| Gigabyte Aero 14 OLED BMF | |
| GTA V - 1920x1080 Highest AA:4xMSAA + FX AF:16x | |
| Asus ROG Zephyrus G14 GA402XY | |
| Razer Blade 14 RZ09-0508 | |
| Razer Blade 14 RTX 4070 | |
| Lenovo Legion Slim 5 14APH8 | |
| Gigabyte Aero 14 OLED BMF | |
| Apple MacBook Pro 14 2023 M3 Max | |
| Final Fantasy XV Benchmark - 1920x1080 High Quality | |
| Asus ROG Zephyrus G14 GA402XY | |
| Razer Blade 14 RZ09-0508 | |
| Razer Blade 14 RTX 4070 | |
| Lenovo Legion Slim 5 14APH8 | |
| Acer Predator Triton 14 PT14-51 | |
| Gigabyte Aero 14 OLED BMF | |
| Strange Brigade - 1920x1080 ultra AA:ultra AF:16 | |
| Asus ROG Zephyrus G14 GA402XY | |
| Razer Blade 14 RTX 4070 | |
| Lenovo Legion Slim 5 14APH8 | |
| Acer Predator Triton 14 PT14-51 | |
| Gigabyte Aero 14 OLED BMF | |
| Dota 2 Reborn - 1920x1080 ultra (3/3) best looking | |
| Razer Blade 14 RTX 4070 | |
| Razer Blade 14 RZ09-0508 | |
| Asus ROG Zephyrus G14 GA402XY | |
| Lenovo Legion Slim 5 14APH8 | |
| Gigabyte Aero 14 OLED BMF | |
| Acer Predator Triton 14 PT14-51 | |
Witcher 3 FPS Chart
| low | med. | high | ultra | QHD DLSS | QHD | 4K | |
|---|---|---|---|---|---|---|---|
| GTA V (2015) | 183.1 | 179 | 169 | 109.9 | 92.3 | 90.1 | |
| The Witcher 3 (2015) | 313.8 | 277.3 | 228.7 | 116.8 | 69.4 | ||
| Dota 2 Reborn (2015) | 165.3 | 149.8 | 145.3 | 136.1 | 119.6 | ||
| Final Fantasy XV Benchmark (2018) | 212 | 166.2 | 121.5 | 89 | 48.5 | ||
| X-Plane 11.11 (2018) | 109.9 | 101.9 | 76.8 | 65.2 | |||
| Far Cry 5 (2018) | 138 | 133 | 123 | 114 | 61 | ||
| Tiny Tina's Wonderlands (2022) | 239.8 | 201.5 | 137.8 | 107.7 | 73.7 | 35.2 | |
| F1 22 (2022) | 247 | 240 | 217 | 84.2 | 55.1 | 26.3 | |
| Star Wars Jedi Survivor (2023) | 99.8 | 91.7 | 86.5 | 80.1 | 51.1 | 24.2 | |
| F1 23 (2023) | 235 | 240 | 206 | 77 | 49 | 23 | |
| Baldur's Gate 3 (2023) | 162.1 | 136.5 | 89.2 | 71.3 | 54.4 | 34.5 | |
| Cyberpunk 2077 (2023) | 142.5 | 118.9 | 100.2 | 88.6 | 52.1 | 22.5 | |
| Call of Duty Modern Warfare 3 2023 (2023) | 180 | 158 | 124 | 114 | 82 | 50 | |
| Avatar Frontiers of Pandora (2023) | 101 | 94 | 82 | 62 | 41 | 20 | |
| Assassin's Creed Shadows (2025) | 77 | 65 | 55 | 42 | 36 | 33 | |
| Doom: The Dark Ages (2025) | 86.9 | 77 | 68.8 | 66.8 | 41 |
Emisje
Hałas systemowy
Zachowanie hałasu wentylatora jest zasadniczo takie samo, jak to, które zaobserwowaliśmy w modelu 2023, ale z niewielkimi różnicami wynikającymi z wyżej wymienionych zmian profilu mocy. Podczas pracy Witcher 3 na przykład w trybie zrównoważonym, hałas wentylatora ustabilizowałby się na poziomie 43,2 dB (A). Jednak w trybie Turbo hałas wentylatora byłby zauważalnie głośniejszy w zakresie od 46 do 50 dB(A). Spadek wydajności podczas grania w trybie zrównoważonym jest stosunkowo niewielki i wynosi zaledwie kilka punktów procentowych, więc użytkownicy mogą rozważyć ten tryb zamiast trybu Turbo, jeśli hałas wentylatora jest problemem.
Niski zakres 50 dB(A) stawia Blade 14 w jednym szeregu z konkurencyjnym modelem Zephyrus G14 i innymi większymi laptopami do gier w trybie wysokiej wydajności. Jeśli jest to zbyt głośne, zalecamy granie w trybie zrównoważonym, a następnie włączenie DLSS, jeśli jest obsługiwany, aby skorzystać zarówno ze zwiększonej wydajności, jak i niższego hałasu wentylatora.
Hałas
| luz |
| 25 / 25 / 25 dB |
| obciążenie |
| 33 / 51.9 dB |
 | ||
30 dB cichy 40 dB(A) słyszalny 50 dB(A) irytujący |
||
min: | ||
| Razer Blade 14 RZ09-0508 GeForce RTX 4070 Laptop GPU, R9 8945HS, Samsung PM9A1 MZVL21T0HCLR | Razer Blade 14 RTX 4070 GeForce RTX 4070 Laptop GPU, R9 7940HS, Samsung PM9A1 MZVL21T0HCLR | Apple MacBook Pro 14 2023 M3 Max M3 Max 40-Core GPU, Apple M3 Max 16-Core, Apple SSD AP2048Z | Lenovo Legion Slim 5 14APH8 GeForce RTX 4060 Laptop GPU, R7 7840HS, SK Hynix HFS001TEJ9X115N | Acer Predator Triton 14 PT14-51 GeForce RTX 4050 Laptop GPU, i7-13700H, Micron 3400 MTFDKBA512TFH 512GB | Asus ROG Zephyrus G14 GA402XY GeForce RTX 4090 Laptop GPU, R9 7940HS, Samsung PM9A1 MZVL21T0HCLR | Gigabyte Aero 14 OLED BMF GeForce RTX 4050 Laptop GPU, i7-13700H, Gigabyte AG470S1TB-SI B10 | |
|---|---|---|---|---|---|---|---|
| Noise | 2% | 7% | -7% | -7% | -10% | -3% | |
| wyłączone / środowisko * (dB) | 24.3 | 22.7 7% | 24.8 -2% | 22.8 6% | 25 -3% | 23.3 4% | 24 1% |
| Idle Minimum * (dB) | 25 | 23.4 6% | 24.8 1% | 22.8 9% | 27 -8% | 23.6 6% | 24 4% |
| Idle Average * (dB) | 25 | 23.4 6% | 24.8 1% | 27.3 -9% | 29 -16% | 23.6 6% | 24 4% |
| Idle Maximum * (dB) | 25 | 23.4 6% | 24.8 1% | 30.7 -23% | 31 -24% | 33 -32% | 35.71 -43% |
| Load Average * (dB) | 33 | 33 -0% | 25.8 22% | 41.6 -26% | 42 -27% | 49.5 -50% | |
| Witcher 3 ultra * (dB) | 49.5 | 51.8 -5% | 43.4 12% | 52.8 -7% | 43 13% | 52.2 -5% | 40.22 19% |
| Load Maximum * (dB) | 51.9 | 55.6 -7% | 43.4 16% | 52.6 -1% | 45 13% | 52.2 -1% | 51.93 -0% |
* ... im mniej tym lepiej
Temperatura
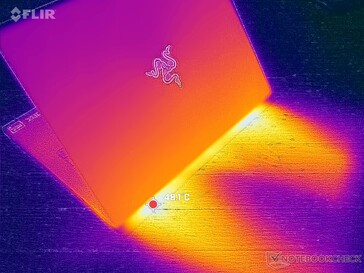
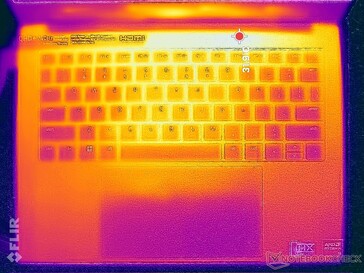
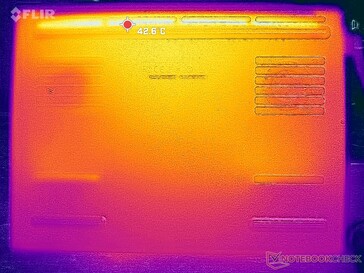
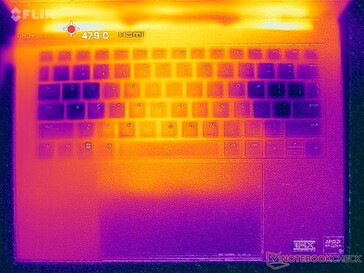
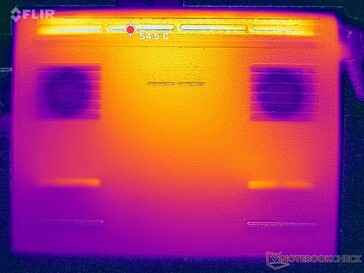
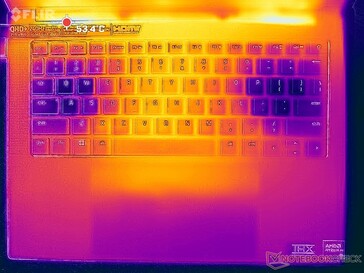
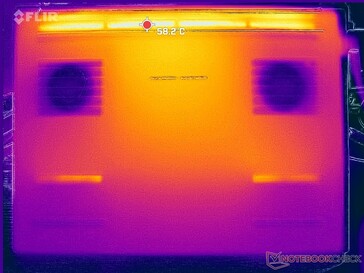
Temperatury powierzchniowe są dość wysokie nawet na biegu jałowym na pulpicie, ponieważ wentylatory mają tendencję do letargu, gdy nie są uruchomione żadne wymagające obciążenia. System jest więc średnio cieplejszy niż inne ultrabooki podczas przeglądania stron internetowych lub odtwarzania wideo, ale cichsze wentylatory są dobrym kompromisem.
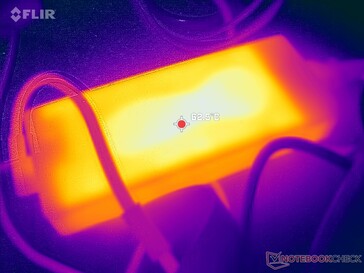
Proszę pamiętać, że zasilacze AC od Razer mogą być zauważalnie cieplejsze niż większość innych zasilaczy AC na rynku, jak wspomniano wcześniej. Dla bezpieczeństwa należy uważać na wszelkie wrażliwe materiały lub przewody, które wchodzą w kontakt.
(±) Maksymalna temperatura w górnej części wynosi 41.8 °C / 107 F, w porównaniu do średniej 40.4 °C / 105 F , począwszy od 21.2 do 68.8 °C dla klasy Gaming.
(±) Dno nagrzewa się maksymalnie do 42.2 °C / 108 F, w porównaniu do średniej 43.3 °C / 110 F
(+) W stanie bezczynności średnia temperatura górnej części wynosi 31.4 °C / 89 F, w porównaniu ze średnią temperaturą urządzenia wynoszącą 33.9 °C / ### class_avg_f### F.
(+) Podczas gry w Wiedźmina 3 średnia temperatura górnej części wynosi 30.6 °C / 87 F, w porównaniu do średniej temperatury urządzenia wynoszącej 33.9 °C / ## #class_avg_f### F.
(+) Podpórki pod nadgarstki i touchpad są chłodniejsze niż temperatura skóry i maksymalnie 30.4 °C / 86.7 F i dlatego są chłodne w dotyku.
(±) Średnia temperatura obszaru podparcia dłoni w podobnych urządzeniach wynosiła 28.8 °C / 83.8 F (-1.6 °C / -2.9 F).
| Razer Blade 14 RZ09-0508 AMD Ryzen 9 8945HS, NVIDIA GeForce RTX 4070 Laptop GPU | Razer Blade 14 RTX 4070 AMD Ryzen 9 7940HS, NVIDIA GeForce RTX 4070 Laptop GPU | Apple MacBook Pro 14 2023 M3 Max Apple M3 Max 16-Core, Apple M3 Max 40-Core GPU | Lenovo Legion Slim 5 14APH8 AMD Ryzen 7 7840HS, NVIDIA GeForce RTX 4060 Laptop GPU | Acer Predator Triton 14 PT14-51 Intel Core i7-13700H, NVIDIA GeForce RTX 4050 Laptop GPU | Asus ROG Zephyrus G14 GA402XY AMD Ryzen 9 7940HS, NVIDIA GeForce RTX 4090 Laptop GPU | Gigabyte Aero 14 OLED BMF Intel Core i7-13700H, NVIDIA GeForce RTX 4050 Laptop GPU | |
|---|---|---|---|---|---|---|---|
| Heat | 9% | 15% | 6% | -9% | 7% | 8% | |
| Maximum Upper Side * (°C) | 41.8 | 37.4 11% | 45.9 -10% | 40.4 3% | 54 -29% | 47 -12% | 42 -0% |
| Maximum Bottom * (°C) | 42.2 | 35.2 17% | 42.1 -0% | 49.4 -17% | 56 -33% | 46.5 -10% | 52 -23% |
| Idle Upper Side * (°C) | 34.8 | 33.2 5% | 23.4 33% | 28.2 19% | 31 11% | 25.9 26% | 26 25% |
| Idle Bottom * (°C) | 37.4 | 36.2 3% | 23.8 36% | 29.8 20% | 31 17% | 28 25% | 27 28% |
* ... im mniej tym lepiej
| Taktowanie CPU (GHz) | Taktowanie GPU (MHz) | Średnia temperatura CPU (°C) | Średnia temperatura GPU (°C) | |
| System w stanie spoczynku | -- | -- | 46 | 45 |
| Prime95Stress | 4.4 | -- | 87 | 49 |
| Prime95+ FurMark Stress | 4.1 | 1980 | 90 | 75 |
| Witcher 3 Obciążenie(tryb Turbo) | ~1.1 | 2550 | 81 | 76 |
| Witcher 3 Obciążenie(tryb zrównoważony) | ~0,8 | 2475 | 59 | 69 |
Głośniki
Razer Blade 14 RZ09-0508 analiza dźwięku
(±) | głośność głośnika jest średnia, ale dobra (79.2 dB)
Bas 100 - 315 Hz
(±) | zredukowany bas - średnio 14% niższy od mediany
(±) | liniowość basu jest średnia (12.7% delta do poprzedniej częstotliwości)
Średnie 400 - 2000 Hz
(+) | zbalansowane środki średnie - tylko 2.7% od mediany
(+) | średnie są liniowe (2.6% delta do poprzedniej częstotliwości)
Wysokie 2–16 kHz
(±) | wyższe maksima - średnio 6.2% wyższe od mediany
(±) | liniowość wysokich wartości jest średnia (7% delta do poprzedniej częstotliwości)
Ogólnie 100 - 16.000 Hz
(±) | liniowość ogólnego dźwięku jest średnia (17.1% różnicy w stosunku do mediany)
W porównaniu do tej samej klasy
» 45% wszystkich testowanych urządzeń w tej klasie było lepszych, 12% podobnych, 43% gorszych
» Najlepszy miał deltę 6%, średnia wynosiła ###średnia###%, najgorsza wynosiła 132%
W porównaniu do wszystkich testowanych urządzeń
» 30% wszystkich testowanych urządzeń było lepszych, 8% podobnych, 62% gorszych
» Najlepszy miał deltę 4%, średnia wynosiła ###średnia###%, najgorsza wynosiła 134%
Apple MacBook Pro 16 2021 M1 Pro analiza dźwięku
(+) | głośniki mogą odtwarzać stosunkowo głośno (84.7 dB)
Bas 100 - 315 Hz
(+) | dobry bas - tylko 3.8% od mediany
(+) | bas jest liniowy (5.2% delta do poprzedniej częstotliwości)
Średnie 400 - 2000 Hz
(+) | zbalansowane środki średnie - tylko 1.3% od mediany
(+) | średnie są liniowe (2.1% delta do poprzedniej częstotliwości)
Wysokie 2–16 kHz
(+) | zrównoważone maksima - tylko 1.9% od mediany
(+) | wzloty są liniowe (2.7% delta do poprzedniej częstotliwości)
Ogólnie 100 - 16.000 Hz
(+) | ogólny dźwięk jest liniowy (4.6% różnicy w stosunku do mediany)
W porównaniu do tej samej klasy
» 0% wszystkich testowanych urządzeń w tej klasie było lepszych, 0% podobnych, 100% gorszych
» Najlepszy miał deltę 5%, średnia wynosiła ###średnia###%, najgorsza wynosiła 45%
W porównaniu do wszystkich testowanych urządzeń
» 0% wszystkich testowanych urządzeń było lepszych, 0% podobnych, 100% gorszych
» Najlepszy miał deltę 4%, średnia wynosiła ###średnia###%, najgorsza wynosiła 134%
Zarządzanie energią
Zużycie energii
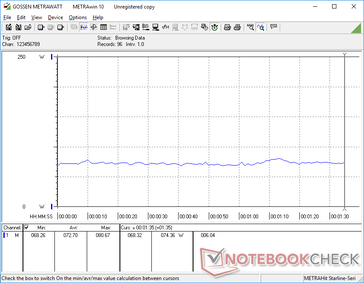
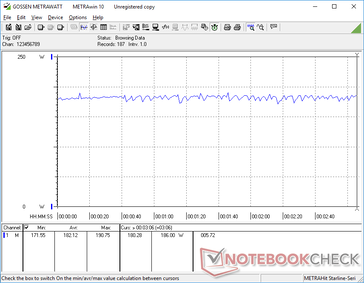
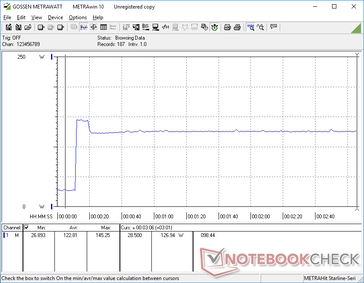
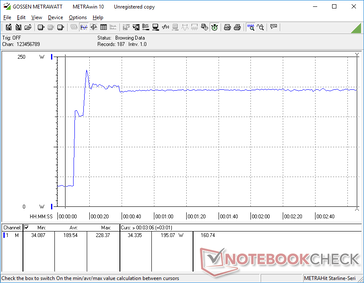
Wyższa z roku na rok wydajność GPU nie przychodzi "za darmo", że tak powiem, ponieważ Blade 14 2024 zużywa nieco więcej energii niż model 2023 podczas grania. Przykładowo, uruchomienie Witcher 3 pobierałoby od 9 do 10 procent więcej energii niż wcześniej, co, być może nieprzypadkowo, odpowiada wzrostowi wydajności GPU o 9 do 10 procent, który oferuje model 2024.
Praca na biegu jałowym na komputerze stacjonarnym pobierałaby od 20 W do 32 W w zależności od jasności i ustawienia MUX. Przeskoczenie z minimalnej do maksymalnej jasności pobrałoby około 5 W więcej energii, podczas gdy włączenie trybu dGPU wymagałoby dodatkowych 7 W.
| wyłączony / stan wstrzymania | |
| luz | |
| obciążenie |
|
Legenda:
min: | |
| Razer Blade 14 RZ09-0508 R9 8945HS, GeForce RTX 4070 Laptop GPU, Samsung PM9A1 MZVL21T0HCLR, IPS, 2560x1600, 14" | Razer Blade 14 RTX 4070 R9 7940HS, GeForce RTX 4070 Laptop GPU, Samsung PM9A1 MZVL21T0HCLR, IPS, 2560x1600, 14" | Apple MacBook Pro 14 2023 M3 Max Apple M3 Max 16-Core, M3 Max 40-Core GPU, Apple SSD AP2048Z, Mini-LED, 3024x1964, 14.2" | Lenovo Legion Slim 5 14APH8 R7 7840HS, GeForce RTX 4060 Laptop GPU, SK Hynix HFS001TEJ9X115N, OLED, 2880x1600, 14.5" | Acer Predator Triton 14 PT14-51 i7-13700H, GeForce RTX 4050 Laptop GPU, Micron 3400 MTFDKBA512TFH 512GB, IPS, 2560x1600, 14" | Asus ROG Zephyrus G14 GA402XY R9 7940HS, GeForce RTX 4090 Laptop GPU, Samsung PM9A1 MZVL21T0HCLR, Mini-LED, 2560x1600, 14" | Gigabyte Aero 14 OLED BMF i7-13700H, GeForce RTX 4050 Laptop GPU, Gigabyte AG470S1TB-SI B10, OLED, 2880x1800, 14" | |
|---|---|---|---|---|---|---|---|
| Power Consumption | 5% | 45% | 36% | 22% | 26% | 51% | |
| Idle Minimum * (Watt) | 20.9 | 19.5 7% | 2.6 88% | 7.3 65% | 12 43% | 9.4 55% | 7.4 65% |
| Idle Average * (Watt) | 25.6 | 24.7 4% | 11.8 54% | 9.6 63% | 14 45% | 14.2 45% | 8.3 68% |
| Idle Maximum * (Watt) | 32.1 | 27 16% | 12.2 62% | 17.3 46% | 26 19% | 14.5 55% | 8.7 73% |
| Load Average * (Watt) | 72.7 | 83.2 -14% | 99.9 -37% | 76.6 -5% | 88 -21% | 79 -9% | 76 -5% |
| Witcher 3 ultra * (Watt) | 182.1 | 165.8 9% | 92.5 49% | 152 17% | 114.9 37% | 172 6% | 70 62% |
| Load Maximum * (Watt) | 228.4 | 204.5 10% | 101.7 55% | 160.9 30% | 213 7% | 220.8 3% | 132 42% |
* ... im mniej tym lepiej
Power Consumption Witcher 3 / Stresstest
Power Consumption external Monitor
Żywotność baterii
Wynoszący nieco ponad 7 godzin czas pracy na baterii jest o prawie godzinę dłuższy niż w przypadku zeszłorocznego modelu. Proszę pamiętać, że Synapse automatycznie zmienia częstotliwość odświeżania z 240 Hz na 60 Hz podczas pracy na baterii, aby wydłużyć czas pracy. W przeciwnym razie czas pracy na baterii naszego modelu 2024 byłby znacznie bliższy naszym wynikom z 2023 roku.
Ładowanie od stanu pustego do pełnej pojemności za pomocą opatentowanego zasilacza sieciowego trwa od 90 do 120 minut. Ładowanie za pomocą adapterów USB-C innych firm jest obsługiwane, ale tylko do 140 W, tak jak w zeszłorocznym modelu, mimo że laptopy z ładowarkami USB-C o mocy 240 W są już dostępne na rynku. To niefortunne, że Blade 14 nadal opiera się na zastrzeżonym porcie ładowania 240 W, gdy istnieją uniwersalne opcje USB-C 240 W.
| Razer Blade 14 RZ09-0508 R9 8945HS, GeForce RTX 4070 Laptop GPU, 68 Wh | Razer Blade 14 RTX 4070 R9 7940HS, GeForce RTX 4070 Laptop GPU, 68 Wh | Apple MacBook Pro 14 2023 M3 Max Apple M3 Max 16-Core, M3 Max 40-Core GPU, 72.6 Wh | Lenovo Legion Slim 5 14APH8 R7 7840HS, GeForce RTX 4060 Laptop GPU, 73.6 Wh | Acer Predator Triton 14 PT14-51 i7-13700H, GeForce RTX 4050 Laptop GPU, 76.3 Wh | Asus ROG Zephyrus G14 GA402XY R9 7940HS, GeForce RTX 4090 Laptop GPU, 76 Wh | Gigabyte Aero 14 OLED BMF i7-13700H, GeForce RTX 4050 Laptop GPU, 63 Wh | |
|---|---|---|---|---|---|---|---|
| Czasy pracy | -7% | 57% | 15% | 20% | -6% | 24% | |
| Reader / Idle (h) | 8 | 8.6 8% | 10.5 31% | 11.2 40% | 11.3 41% | ||
| WiFi v1.3 (h) | 7.1 | 6.2 -13% | 15.2 114% | 7.5 6% | 5 -30% | 7.5 6% | 7.6 7% |
| Load (h) | 1.2 | 1 -17% | 1.2 0% | 1.3 8% | 1.8 50% | 1 -17% | 1.5 25% |
| H.264 (h) | 18 | 9 | 7.2 |
Za
Przeciw
Werdykt - Ryzen AI nie został jeszcze odblokowany
Na początku 2024 roku, przeskok z Ryzen 9 7840HS na Ryzen 9 8945HS jest tak samo nieistotny, jak przeskok z Wi-Fi 6E na Wi-Fi 7. Większość aplikacji w tej chwili nie wykorzystuje jeszcze w pełni Ryzen AI, aby nowy procesor był opłacalny, podobnie jak większość użytkowników nie ma jeszcze routerów Wi-Fi 7, aby w pełni wykorzystać zalety Wi-Fi 7. Zakup Blade'a 14 2024 jest zatem bardziej zabezpieczeniem na przyszłość dla zdecydowanej większości użytkowników, gdyby chcieli "odblokować" funkcje AI i Wi-Fi 7 systemu w późniejszym terminie.
Ważniejszą różnicą między modelami 2023 i 2024 jest natomiast nieco szybszy procesor graficzny w nowszym modelu. Blade 14 2024 jest w stanie uruchomić ten sam układ GeForce RTX 4070 z nieco wyższymi częstotliwościami taktowania, co zapewnia od 5 do 10 procent wyższą wydajność. W rezultacie temperatura rdzenia i zużycie energii są nieco wyższe, ale to niewielka cena dla łowców wydajności, którzy chcą zmaksymalizować wydajność w przeliczeniu na objętość.
Jeśli nie są Państwo zainteresowani sztuczną inteligencją procesora lub Wi-Fi 7, to niewielki wzrost wydajności GPU w Blade 14 2024 może Państwa przekonać. Jeśli nie, to wizualnie identyczny model 2023 oferuje zasadniczo taką samą wydajność za mniej.
Podczas gdy marne aktualizacje w tym roku są zrozumiałe, chcielibyśmy zobaczyć bardziej znaczące zmiany w przyszłości, takie jak przejście na uniwersalne ładowanie 240 W USB-C, Windows VRR i wsparcie dla opcji RTX 4080 lub 4090. Konkurencyjny Asus ROG Zephyrus G14 nadal jest jednym z niewielu 14-calowych laptopów do gier, które mogą przewyższyć Blade 14, więc niefortunne jest to, że nowy Razer ponownie ogranicza się do RTX 4070.
Cena i dostępność
Amazon wysyła teraz Razer Blade 14 2024 za 2700 USD zgodnie z recenzją. Model ten jest również dostępny pod adresem bezpośrednio od Razera.
Razer Blade 14 RZ09-0508
- 13/02/2024 v7 (old)
Allen Ngo
Przezroczystość
Wyboru urządzeń do recenzji dokonuje nasza redakcja. Próbka testowa została udostępniona autorowi jako pożyczka od producenta lub sprzedawcy detalicznego na potrzeby tej recenzji. Pożyczkodawca nie miał wpływu na tę recenzję, producent nie otrzymał też kopii tej recenzji przed publikacją. Nie było obowiązku publikowania tej recenzji. Jako niezależna firma medialna, Notebookcheck nie podlega władzy producentów, sprzedawców detalicznych ani wydawców.
Tak testuje Notebookcheck
Każdego roku Notebookcheck niezależnie sprawdza setki laptopów i smartfonów, stosując standardowe procedury, aby zapewnić porównywalność wszystkich wyników. Od około 20 lat stale rozwijamy nasze metody badawcze, ustanawiając przy tym standardy branżowe. W naszych laboratoriach testowych doświadczeni technicy i redaktorzy korzystają z wysokiej jakości sprzętu pomiarowego. Testy te obejmują wieloetapowy proces walidacji. Nasz kompleksowy system ocen opiera się na setkach uzasadnionych pomiarów i benchmarków, co pozwala zachować obiektywizm.

