Testy dla Intel Core i9-13900H procesor
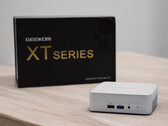
Recenzja Geekom XT13 Pro: NUC mini-PC bez Meteor Lake i tylko z procesorem Intel Core i9-13900H
Geekom zaprezentował XT13 Pro jako potężny mini-PC NUC oparty na procesorze Intel Core i9-13900H. Oznacza to, że procesory Intel Meteor Lake wciąż pozostają pominięte. Przeanalizowaliśmy, jak dobrze high-endowy model z serii Raptor Lake H radzi sobie z nowszymi procesorami, korzystając z licznych pomiarów i testów porównawczych.
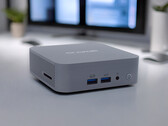
Intel Core i9-13900H, Iris Xe G7 96EUs, 555 gRecenzja mini-PC Geekom GT13 Pro - stylowa alternatywa dla NUC z procesorem Intel Core i9-13900H, 32 GB pamięci RAM DDR4 i dyskiem SSD 2 TB
GT13 Pro firmy Geekom jest kontynuacją istniejącej gamy modeli o stylowym wyglądzie. Procesor Intel Core i9-13900H obiecuje wiele, ale w tej szczegółowej recenzji przyjrzymy się bliżej, jak dobrze ten wysokiej klasy SoC radzi sobie w małej obudowie o pojemności 0,5 litra. Dzięki 32 GB pamięci RAM i dyskowi SSD o pojemności 2 TB, mini PC jest dobrze wyposażony, co znajduje również odzwierciedlenie w połączeniach z dwoma portami USB4.
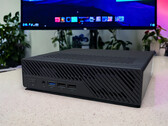
Intel Core i9-13900H, Iris Xe G7 96EUs, 440 gRecenzja stacji roboczej: Minisforum MS-01 debiutuje z Intel Core i9-13900H, ale brakuje dedykowanej karty graficznej ex-works
Według producenta, Minisforum MS-01 to stacja robocza przeznaczona do zadań wymagających dużej wydajności. Wyposażona w procesor Intel Core i9-13900H, a także szybką pamięć RAM DDR5, może pomieścić w urządzeniu kilka dysków SSD - wszystko to brzmi obiecująco. MS-01 posiada również fizyczny interfejs PCIe x16 do instalacji kart rozszerzeń. W niniejszej recenzji zastanawiamy się, czy Minisforum udało się stworzyć potężną stację roboczą, czy też jest to po prostu prosty mini-PC do codziennego użytku.
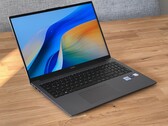
Intel Core i9-13900H, Iris Xe G7 96EUs, 1.5 kgRecenzja laptopa Asus VivoBook S15 BAPE: Niezwykle wydajny laptop OLED? A może edycja specjalna okaże się niewypałem?
Asus VivoBook S15 OLED BAPE Edition wyróżnia się nie tylko ze względu na swój design, ale także ze względu na to, co znajduje się w pudełku. Proszę zanurzyć się w naszej recenzji laptopa "A Bathing Ape" i przekonać się, czy ta multimedialna maszyna, jej wyświetlacz OLED i procesor Intel Core i9-13900H zdołają zaimponować w codziennym użytkowaniu.
Intel Core i9-13900H, Iris Xe G7 96EUs, 15.6", 1.6 kgRecenzja Huawei MateBook D 16 2024 - multimedialny laptop teraz z procesorem Intel Core i9-13900H
Huawei wyposażył model 2024 swojego multimedialnego laptopa, MateBook D 16, w procesor Intel Core i9-13900H. Ograniczają go jednak limity mocy. Dokonano poważnych cięć, zwłaszcza w odniesieniu do portów, ale z kolei żywotność baterii uległa poprawie.
Intel Core i9-13900H, Iris Xe G7 96EUs, 16", 1.7 kgGeekom Mini IT13: Intel Iris Xe Graphics G7 96EUs, 0.7 kg
Recenzja » Recenzja Geekom Mini IT13 Mini PC - Mini komputer stacjonarny z procesorem Core i9 overkill
MSI Stealth 16 Mercedes-AMG Motorsport A13VG: NVIDIA GeForce RTX 4070 Laptop GPU, 16.00", 1.9 kg
Recenzja » Recenzja laptopa MSI Stealth 16 Mercedes-AMG Motorsport: Mobilny samochód wyścigowy z wyświetlaczem OLED
Asus VivoBook Pro 16 K6602VU: NVIDIA GeForce RTX 4050 Laptop GPU, 16.00", 1.9 kg
Recenzja » Recenzja laptopa Asus VivoBook Pro 16 (2023): Core i9-13900H, RTX 4050 i OLED 3,2K dobrze wróżą twórcom-hobbystom
Schenker XMG Pro 16 Studio (Mid 23): NVIDIA GeForce RTX 4070 Laptop GPU, 16.00", 2.6 kg
Recenzja » Recenzja XMG Pro 16 Studio (Mid 23): Laptop RTX 4070 dla graczy i twórców
Lenovo ThinkPad P1 G6-21FV000DGE: NVIDIA RTX 2000 Ada Generation Laptop, 16.00", 1.9 kg
Recenzja » Recenzja laptopa Lenovo ThinkPad P1 G6 - Mobilna stacja robocza zastępuje ThinkPad X1 Extreme
Dell Precision 5480: NVIDIA RTX 3000 Ada Generation Laptop, 14.00", 1.6 kg
Recenzja » Debiut wydajnościowy Nvidia RTX 3000 Ada: Recenzja stacji roboczej Dell Precision 5480
Dell Precision 5000 5680: NVIDIA RTX 5000 Ada Generation Laptop, 16.00", 2.3 kg
Recenzja » Recenzja Dell Precision 5680: Ada Lovelace dominuje na stacjach roboczych
Lenovo Legion Slim 7i 16 Gen 8: NVIDIA GeForce RTX 4070 Laptop GPU, 16.00", 2.1 kg
Recenzja » Recenzja laptopa Lenovo Legion Slim 7i 16 Gen 8: Smuklejszy niż Razer Blade 16
Asus ZenBook 14X UX3404VC: Intel Iris Xe Graphics G7 96EUs, 14.50", 1.6 kg
Recenzja » Recenzja laptopa Asus ZenBook 14X (2023): Ultrabook OLED na granicy możliwości
Asus ROG Flow X16 GV601V: NVIDIA GeForce RTX 4060 Laptop GPU, 16.00", 2.1 kg
Recenzja » Recenzja smukłego laptopa Asus ROG Flow X16: Wydajna, 16-calowa stacja robocza do gier 2 w 1 z ekranem dotykowym
Huawei MateBook 16s i9: Intel Iris Xe Graphics G7 96EUs, 16.00", 2 kg
Recenzja » Recenzja Huawei MateBook 16s 2023 - multimedialny laptop z jaśniejszym wyświetlaczem 3:2
Asus Zenbook Pro 14 OLED UX6404VI: NVIDIA GeForce RTX 4070 Laptop GPU, 14.50", 1.7 kg
Recenzja » Recenzja laptopa Asus Zenbook Pro 14 OLED: Rywal MacBooka Pro z wyświetlaczem OLED 120 Hz
Asus ZenBook Pro 14 Duo UX8402VV-P1021W: NVIDIA GeForce RTX 4060 Laptop GPU, 14.50", 1.8 kg
Recenzja » Recenzja laptopa Asus ZenBook Pro 14 Duo z drugim wyświetlaczem dla twórców: Większa produktywność
Samsung Galaxy Book3 Ultra 16, i9-13900H RTX 4070: NVIDIA GeForce RTX 4070 Laptop GPU, 16.00", 1.8 kg
Recenzja » Samsung Galaxy Book3 Ultra 16 z RTX 4070 w recenzji: Wysoka wydajność graficzna w biznesowym notebooku
Asus ROG Flow Z13 GZ301V: NVIDIA GeForce RTX 4060 Laptop GPU, 13.40", 1.6 kg
Recenzja » Asus ROG Flow Z13 w recenzji: Szaleństwo - RTX 4060 w imponującym tablecie do gier
MSI Stealth 17 Studio A13VH-014: NVIDIA GeForce RTX 4080 Laptop GPU, 17.30", 3 kg
Recenzja » Recenzja MSI Stealth 17 Studio: Laptop z cichym RTX 4080 na niemal każdą okazję
Asus ROG Flow Z13 ACRNM: NVIDIA GeForce RTX 4070 Laptop GPU, 13.40", 1.7 kg
Recenzja » Recenzja Asus ROG Flow Z13 ACRNM - laptop konwertowalny dla graczy z RTX 4070
Asus ROG Zephyrus M16 GU604VY-NM042X: NVIDIA GeForce RTX 4090 Laptop GPU, 16.00", 2.3 kg
Recenzja » Recenzja laptopa Asus ROG Zephyrus M16 (2023): RTX 4090 z super jasnym wyświetlaczem Mini-LED
Gigabyte AERO 16 OLED BSF: NVIDIA GeForce RTX 4070 Laptop GPU, 16.00", 2.1 kg
Recenzja » Recenzja smukłego laptopa Gigabyte AERO 16 OLED: Wydajny RTX 4070 dla graczy i twórców
Acer Aspire 17 A17-51M: Intel Iris Xe Graphics G7 96EUs, 17.30", 2.1 kg
Zewnętrzna recenzja » Acer Aspire 17 A17-51M
MSI Modern 15 H B13M: Intel Iris Xe Graphics G7 96EUs, 15.60", 1.9 kg
Zewnętrzna recenzja » MSI Modern 15 H B13M
Asus VivoBook Pro 16 OLED K6602V: NVIDIA GeForce RTX 4050 Laptop GPU, 16.00", 1.9 kg
Zewnętrzna recenzja » Asus VivoBook Pro 16 OLED K6602V
Asus Vivobook 17X K3704VA: Intel Iris Xe Graphics G7 96EUs, 17.30", 2.1 kg
Zewnętrzna recenzja » Asus Vivobook 17X K3704VA
MSI Modern 14 H D13MG: Intel Iris Xe Graphics G7 96EUs, 14.00", 1.6 kg
Zewnętrzna recenzja » MSI Modern 14 H D13MG
Acer Nitro V 15 ANV15-51, i9-13900H: NVIDIA GeForce RTX 4060 Laptop GPU, 15.60", 2.1 kg
Zewnętrzna recenzja » Acer Nitro V 15 ANV15-51, i9-13900H
Asus Zenbook Pro 14 OLED UX6404VV: NVIDIA GeForce RTX 4060 Laptop GPU, 14.50", 1.6 kg
Zewnętrzna recenzja » Asus Zenbook Pro 14 OLED UX6404VV
HP Envy 16-h1000: NVIDIA GeForce RTX 4060 Laptop GPU, 16.00", 2.7 kg
Zewnętrzna recenzja » HP Envy 16-h1000
Infinix GT Book 16: NVIDIA GeForce RTX 4060 Laptop GPU, 16.00", 2 kg
Zewnętrzna recenzja » Infinix GT Book 16
Asus Zenbook Pro 14 OLED UX6404VI: NVIDIA GeForce RTX 4070 Laptop GPU, 14.50", 1.7 kg
Zewnętrzna recenzja » Asus Zenbook Pro 14 OLED UX6404VI
Asus Vivobook S 14 Flip TP3402VA, i9-13900H: Intel Iris Xe Graphics G7 96EUs, 14.00", 1.5 kg
Zewnętrzna recenzja » Asus Vivobook S 14 Flip TP3402VA, i9-13900H
Asus VivoBook Pro 15 OLED K6502VU: NVIDIA GeForce RTX 4050 Laptop GPU, 15.60", 1.8 kg
Zewnętrzna recenzja » Asus VivoBook Pro 15 OLED K6502VU
Asus TUF Gaming F17 FX707VV: NVIDIA GeForce RTX 4060 Laptop GPU, 17.30", 2.6 kg
Zewnętrzna recenzja » Asus TUF Gaming F17 FX707VV
Huawei MateBook D 16 2024: Intel Iris Xe Graphics G7 96EUs, 16.00", 1.7 kg
Zewnętrzna recenzja » Huawei MateBook D 16 2024
Minisforum MS-01: Intel Iris Xe Graphics G7 96EUs, 1.5 kg
» Minisforum MS-A1 to zasilany przez AMD high-endowy mini PC z pamięcią do 96 GB i obsługą OCuLink
Lenovo Legion Slim 7i 16 Gen 8: NVIDIA GeForce RTX 4070 Laptop GPU, 16.00", 2.1 kg
» Niewielka dbałość o szczegóły w Lenovo Legion Slim Gen 8 rozwiązuje irytujący problem w Alienware x16 r1