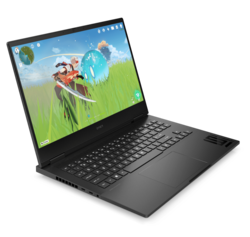
Recenzja laptopa HP Omen Transcend 16: Więcej niż tylko mała różnica w nazwie
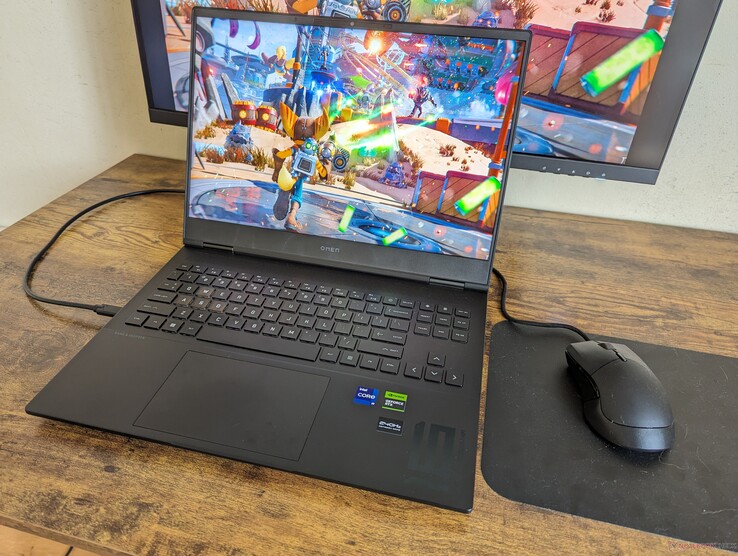
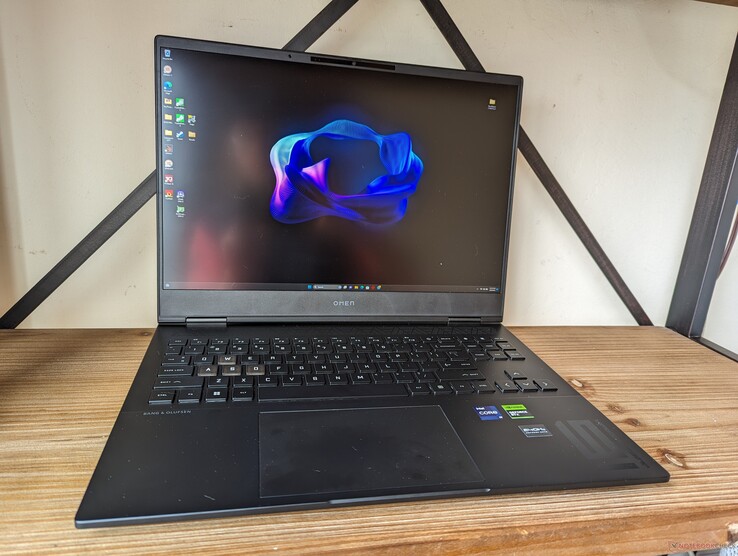
Omen Transcend 16 jest wariantem standardowego modelu Omen 16. Chociaż wykorzystują one podobną konstrukcję obudowy i materiały, Omen Transcend 16 może pochwalić się kilkoma istotnymi różnicami, o których potencjalni nabywcy powinni wiedzieć.
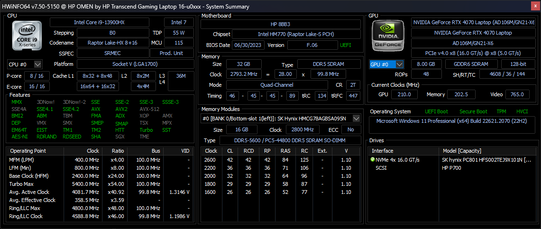
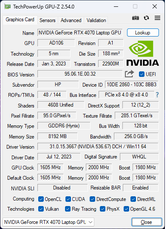
Nasza konkretna jednostka testowa to najwyższa dostępna konfiguracja z procesorem Core i9-13900HX 13. generacji Raptor Lake, kartą graficzną RTX 4070 o mocy 130 W GeForce i wyświetlaczem mini-LED QHD+ (2560 x 1600) 240 Hz z pełnymi kolorami DCI-P3 za około 2500 USD w sprzedaży detalicznej. Mniejsze jednostki SKU są dostępne z procesorem Core i7-13700HX, GPU RTX 4050 i 165 Hz 1200p IPS za około 1250 USD.
Konkurenci w tej dziedzinie obejmują inne wysokiej klasy 16-calowe laptopy do gier, takie jak Lenovo Legion Slim 7i 16 G8, Acer Nitro 16, Alienware x16 R1 lub Asus ROG Zephyrus M16.
Więcej recenzji HP:
Potencjalni konkurenci w porównaniu
Ocena | Data | Model | Waga | Wysokość | Rozmiar | Rezolucja | Cena |
|---|---|---|---|---|---|---|---|
| 87.9 % v7 (old) | 08/2023 | HP Omen Transcend 16 i9-13900HX, GeForce RTX 4070 Laptop GPU | 2.3 kg | 19.8 mm | 16.00" | 2560x1600 | |
| 90 % v7 (old) | 07/2023 | Lenovo Legion Slim 7i 16 Gen 8 i9-13900H, GeForce RTX 4070 Laptop GPU | 2.1 kg | 19.9 mm | 16.00" | 2560x1600 | |
| 87.4 % v7 (old) | 07/2023 | HP Omen 16-wf000 i7-13700HX, GeForce RTX 4080 Laptop GPU | 2.4 kg | 23.6 mm | 16.10" | 2560x1440 | |
| 88.4 % v7 (old) | 06/2023 | Alienware x16 R1 i9-13900HK, GeForce RTX 4080 Laptop GPU | 2.6 kg | 18.57 mm | 16.00" | 2560x1600 | |
| 88.1 % v7 (old) | 06/2023 | Acer Nitro 16 AN16-41 R7 7735HS, GeForce RTX 4070 Laptop GPU | 2.7 kg | 27.9 mm | 16.00" | 2560x1600 | |
| 87.8 % v7 (old) | 02/2023 | Asus ROG Zephyrus M16 GU603Z i9-12900H, GeForce RTX 3070 Ti Laptop GPU | 2.1 kg | 19.9 mm | 16.00" | 2560x1600 |
Obudowa - te same materiały, inne wymiary
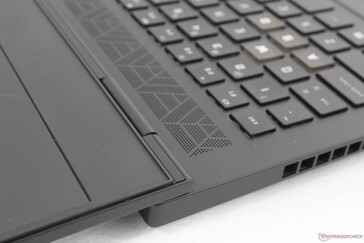
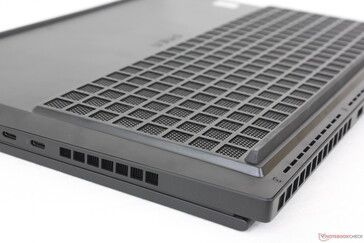
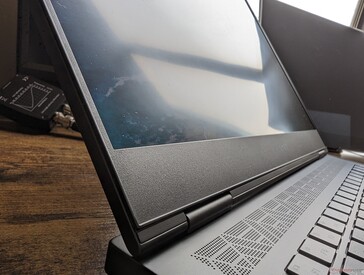
Jedną z największych różnic zewnętrznych między Omen 16 i Omen Transcend 16 jest przejście z proporcji 16:9 na 16:10, a zatem ich stopy są nieco inne. Poza tym oba modele mają podobne materiały metalowe i teksturę. Warto zauważyć, że ramka wzdłuż dolnej krawędzi ekranu nie jest węższa niż w zwykłym Omen 16 pomimo zmiany proporcji.
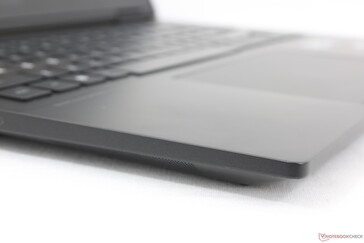
Nowy współczynnik kształtu 16:10 sprawia, że Omen Transcend 16 jest bardziej kwadratowy niż zwykły Omen 16, ale ma ogólnie cieńszy profil o prawie 4 mm. W rezultacie jest nieco lżejszy, ale nadal nie jest tak lekki jak Asus ROG Zephyrus M16 lubLenovo Legion Slim 7i 16 G8.
Łączność
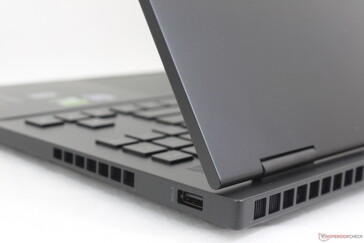
Opcje portów pozostają identyczne jak w modelu Omen 16, pomimo zmian fizycznych opisanych powyżej. Niemniej jednak, byłoby przynajmniej miło zobaczyć aktualizację z 1 Gbps RJ-45 do 2,5 Gbps.
Komunikacja
Kamera internetowa
Podczerwień jest dołączona do obsługi Hello, podczas gdy nie ma jej w zwykłym Omen 16. Kamera internetowa 2 MP i migawka prywatności są poza tym takie same w obu modelach Omen.
Konserwacja
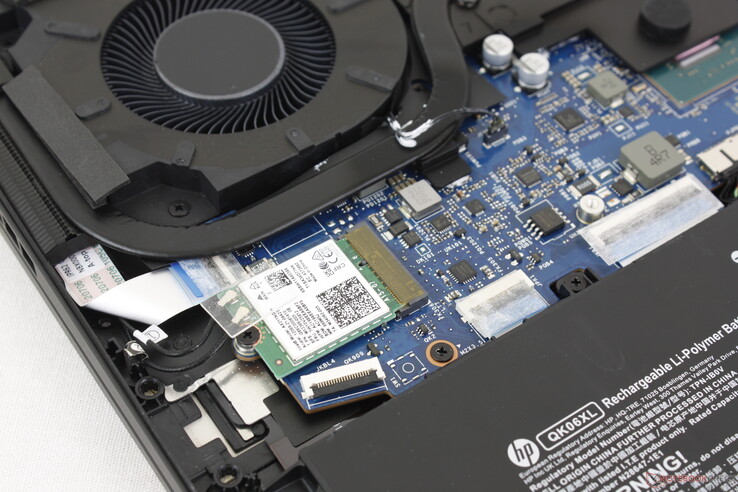
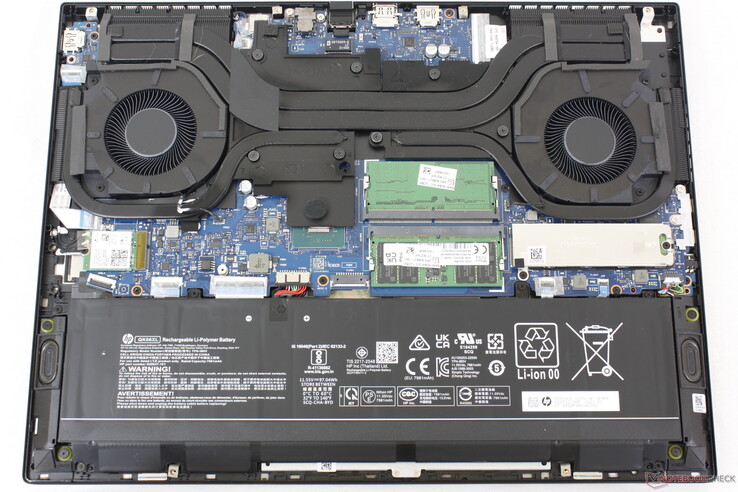
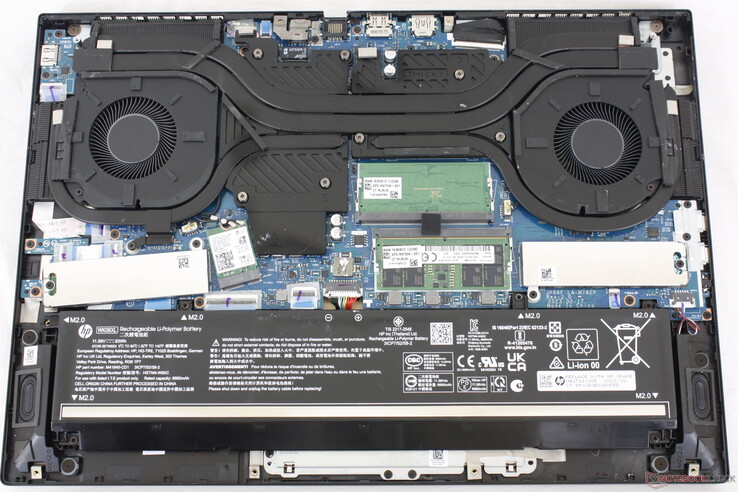
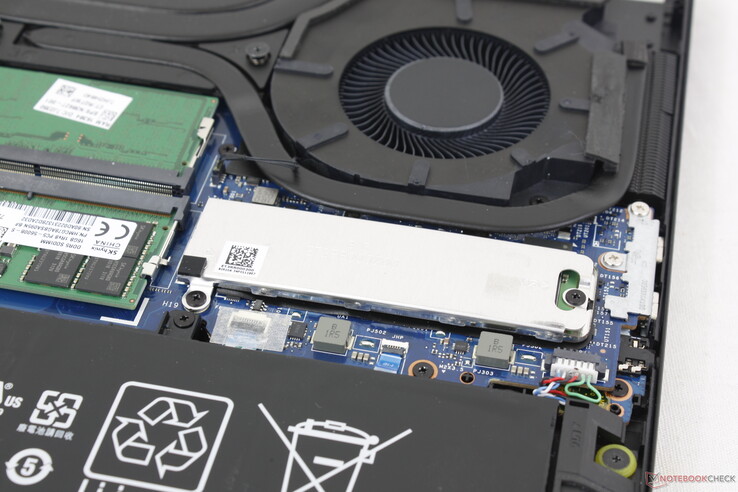
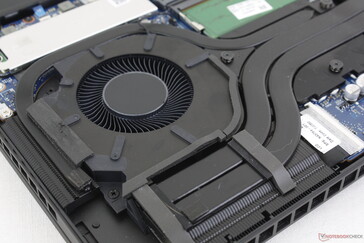
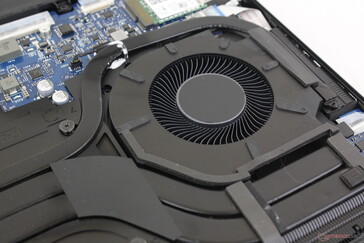
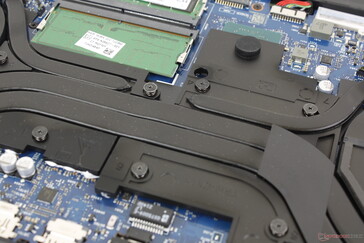
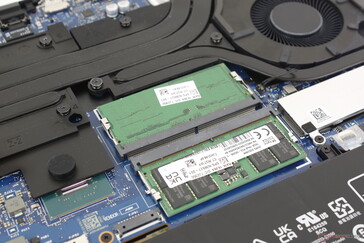
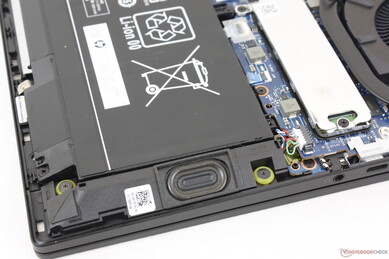
Dolny panel jest zabezpieczony tylko sześcioma śrubami krzyżakowymi, co zapewnia łatwy dostęp. Jedną z zauważalnych zmian w stosunku do Omen 16 jest jednak usunięcie drugiego gniazda M.2 SSD ze względu na zmianę położenia gniazda M.2 WLAN, jak pokazano na poniższych zdjęciach porównawczych. Tym samym Omen Transcend 16 może obsługiwać tylko jeden wewnętrzny dysk SSD zamiast dwóch. Wprowadzono również inne drobne zmiany w głośnikach i rozwiązaniu chłodzącym.
Akcesoria i gwarancja
Niektóre konfiguracje zawierają bezprzewodowy zestaw słuchawkowy HyperX Cloud II Core gratis. W przeciwnym razie pudełko detaliczne zawiera tylko standardowy zasilacz sieciowy i dokumentację.
Obowiązuje standardowa roczna ograniczona gwarancja producenta.
Urządzenia wejściowe - znajomy wygląd i działanie Omen
Klawiatura
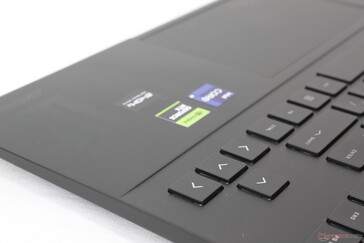
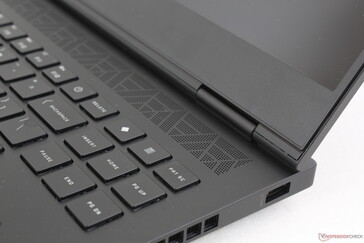
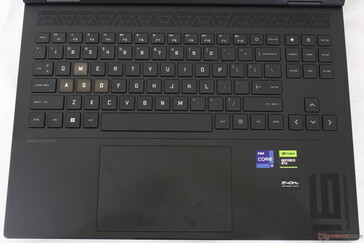
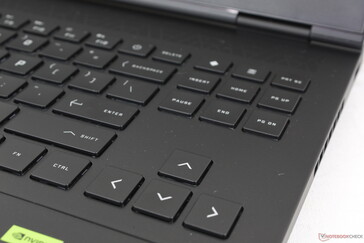
Klawisze WASD są teraz stylizowane za pomocą półprzezroczystych nakładek na klawisze, co nadaje im bardziej gamingowy wygląd. Wszystkie nasze komentarze na temat klawiatury w modelu Omen 16 nadal mają zastosowanie do Omen Transcend 16.
Touchpad
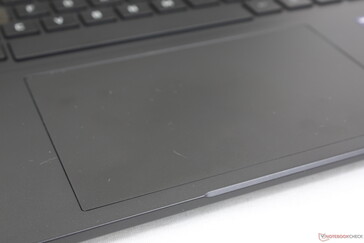
Rozmiar clickpada zmienił się z 12,5 x 8 cm w ostatnim modelu Omen 16 na większy 13,5 x 8,6 cm w modelu Omen Transcend 16. Chociaż jest on responsywny i bardzo przestronny do przewijania, sprzężenie zwrotne podczas klikania jest płytkie i mogłoby być mocniejsze, aby uzyskać bardziej satysfakcjonujące kliknięcie.
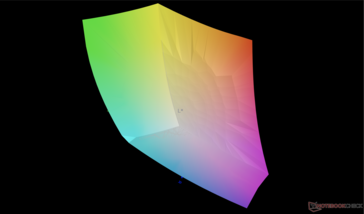
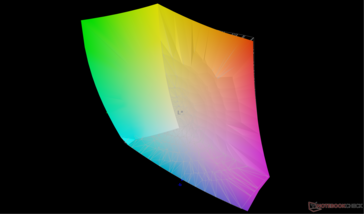
Wyświetlacz - Mini-LED, 240 Hz, 1600p, 16:10, 1180 nitów, 100% kolorów P3
Kolejnym ważnym czynnikiem odróżniającym modele Omen Transcend 16 i Omen 16 jest nowa opcja panelu mini-LED. Mini-LED łączy zalety IPS (tj. szybkie częstotliwości odświeżania i względną przystępność cenową) z zaletami OLED (tj. wyższymi poziomami jasności i głębszymi poziomami czerni), aby być dobrą opcją pośrednią między trzema technologiami wyświetlania. 1000 indywidualnie podświetlanych stref za panelem oferuje wrażenia wizualne zbliżone do indywidualnie podświetlanych pikseli OLED.
HP reklamuje szczytową jasność na poziomie 1180 nitów. Nasze niezależne pomiary przy użyciu testu jasności HDR zarejestrowałyby maksymalnie 1233 nitów, aby potwierdzić twierdzenia HP. Należy pamiętać, że ta maksymalna wartość jest dostępna tylko w określonych warunkach HDR, podobnie jak w przypadku Asus VivoBook ponieważ maksymalna jasność jest ograniczona do ~800 nitów przy wyświetlaniu całej bieli i bez czerni. Mimo to, 800 nitów jest prawie 2x jaśniejsze niż w większości innych laptopów IPS.
W porównaniu do wyświetlacza mini-LED w konkurencyjnych laptopachLenovo Slim Pro 9 16nasz wyświetlacz HP ma niższą rozdzielczość natywną (2560 x 1600 vs. 3200 x 2000), ale z wyższą częstotliwością odświeżania (240 Hz vs. 165 Hz).
| |||||||||||||||||||||||||
rozświetlenie: 95 %
na akumulatorze: 791.1 cd/m²
kontrast: 19778:1 (czerń: 0.04 cd/m²)
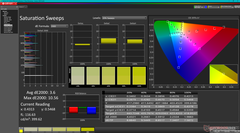
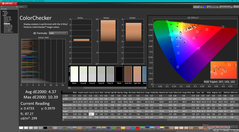
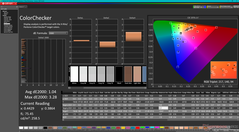
ΔE ColorChecker Calman: 4.37 | ∀{0.5-29.43 Ø4.76}
calibrated: 1.04
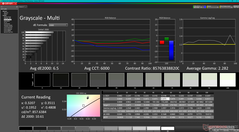
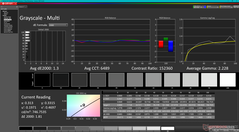
ΔE Greyscale Calman: 6.5 | ∀{0.09-98 Ø5}
87.6% AdobeRGB 1998 (Argyll 3D)
100% sRGB (Argyll 3D)
99.2% Display P3 (Argyll 3D)
Gamma: 2.28
CCT: 6000 K
| HP Omen Transcend 16 AUOA3A6, Mini-LED, 2560x1600, 16" | Lenovo Legion Slim 7i 16 Gen 8 CSOT T3 MNG007DA2-3, IPS, 2560x1600, 16" | HP Omen 16-wf000 BOE0B7D, IPS, 2560x1440, 16.1" | Alienware x16 R1 BOE NE16NZ4, IPS, 2560x1600, 16" | Acer Nitro 16 AN16-41 BOE CQ NE16QDM-NY1, IPS, 2560x1600, 16" | Asus ROG Zephyrus M16 GU603Z BOE0A0B (BOE CQ NE160QDM-NY3), IPS, 2560x1600, 16" | |
|---|---|---|---|---|---|---|
| Display | -16% | -17% | 0% | -18% | -4% | |
| Display P3 Coverage (%) | 99.2 | 70.4 -29% | 69 -30% | 99.2 0% | 67.9 -32% | 92.8 -6% |
| sRGB Coverage (%) | 100 | 99.4 -1% | 99.2 -1% | 100 0% | 99.1 -1% | 98.5 -1% |
| AdobeRGB 1998 Coverage (%) | 87.6 | 72.5 -17% | 71.2 -19% | 88.6 1% | 69.9 -20% | 83.1 -5% |
| Response Times | 62% | 75% | 72% | 70% | 68% | |
| Response Time Grey 50% / Grey 80% * (ms) | 26.4 ? | 12 ? 55% | 4.6 ? 83% | 5.1 ? 81% | 11 ? 58% | 7.6 ? 71% |
| Response Time Black / White * (ms) | 28.2 ? | 8.9 ? 68% | 9.7 ? 66% | 10.3 ? 63% | 5 ? 82% | 10 ? 65% |
| PWM Frequency (Hz) | 3506 ? | |||||
| Screen | -95% | -86% | -67% | -95% | -79% | |
| Brightness middle (cd/m²) | 791.1 | 474.6 -40% | 310.9 -61% | 302.2 -62% | 520 -34% | 497 -37% |
| Brightness (cd/m²) | 800 | 445 -44% | 296 -63% | 285 -64% | 494 -38% | 481 -40% |
| Brightness Distribution (%) | 95 | 86 -9% | 91 -4% | 89 -6% | 91 -4% | 82 -14% |
| Black Level * (cd/m²) | 0.04 | 0.39 -875% | 0.35 -775% | 0.26 -550% | 0.39 -875% | 0.21 -425% |
| Contrast (:1) | 19778 | 1217 -94% | 888 -96% | 1162 -94% | 1333 -93% | 2367 -88% |
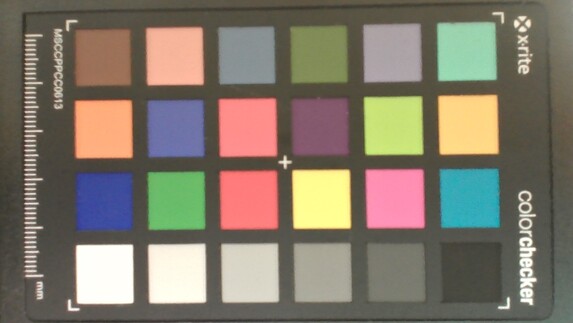
| Colorchecker dE 2000 * | 4.37 | 2.12 51% | 2.18 50% | 1.63 63% | 1.94 56% | 3.53 19% |
| Colorchecker dE 2000 max. * | 10.39 | 4.73 54% | 3.58 66% | 4.13 60% | 5.62 46% | 6.15 41% |
| Colorchecker dE 2000 calibrated * | 1.04 | 0.57 45% | 0.52 50% | 1.17 -13% | 0.74 29% | 3.53 -239% |
| Greyscale dE 2000 * | 6.5 | 2.8 57% | 2.8 57% | 2.5 62% | 2.94 55% | 1.74 73% |
| Gamma | 2.28 96% | 2.22 99% | 2.18 101% | 2.23 99% | 2.37 93% | 2.2 100% |
| CCT | 6000 108% | 6542 99% | 6002 108% | 6590 99% | 6443 101% | 6418 101% |
| Całkowita średnia (program / ustawienia) | -16% /
-56% | -9% /
-48% | 2% /
-33% | -14% /
-55% | -5% /
-42% |
* ... im mniej tym lepiej
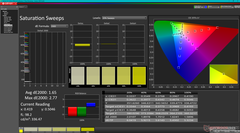
Panel nie jest skalibrowany fabrycznie. Temperatura barwowa jest wyższa niż oczekiwano i wynosi 6000 K, więc kolory na niższych poziomach nasycenia nie są tak dokładne, jak mogłyby być. Kalibracja panelu za pomocą naszego kolorymetru X-Rite zwiększyłaby temperaturę barwową do standardowej 6500K, zapewniając bardziej stabilne kolory na wszystkich poziomach nasycenia.
Wyświetl czasy reakcji
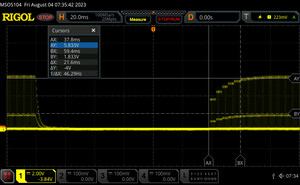
| ↔ Czas reakcji od czerni do bieli | ||
|---|---|---|
| 28.2 ms ... wzrost ↗ i spadek ↘ łącznie | ↗ 21.6 ms wzrost | |
| ↘ 6.6 ms upadek | ||
| W naszych testach ekran wykazuje stosunkowo powolne tempo reakcji i może być zbyt wolny dla graczy. Dla porównania, wszystkie testowane urządzenia wahają się od 0.1 (minimum) do 240 (maksimum) ms. » 74 % wszystkich urządzeń jest lepszych. Oznacza to, że zmierzony czas reakcji jest gorszy od średniej wszystkich testowanych urządzeń (20.1 ms). | ||
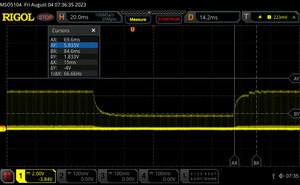
| ↔ Czas reakcji 50% szarości do 80% szarości | ||
| 26.4 ms ... wzrost ↗ i spadek ↘ łącznie | ↗ 15 ms wzrost | |
| ↘ 11.4 ms upadek | ||
| W naszych testach ekran wykazuje stosunkowo powolne tempo reakcji i może być zbyt wolny dla graczy. Dla porównania, wszystkie testowane urządzenia wahają się od 0.165 (minimum) do 636 (maksimum) ms. » 35 % wszystkich urządzeń jest lepszych. Oznacza to, że zmierzony czas reakcji jest lepszy od średniej wszystkich testowanych urządzeń (31.5 ms). | ||
Migotanie ekranu / PWM (modulacja szerokości impulsu)
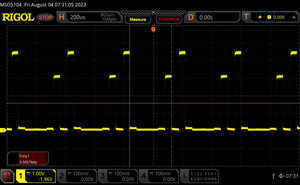
| Wykryto migotanie ekranu/wykryto PWM | 3506 Hz | ≤ 100 % ustawienia jasności | |
Podświetlenie wyświetlacza miga z częstotliwością 3506 Hz (najgorszy przypadek, np. przy użyciu PWM) Wykryto migotanie przy ustawieniu jasności 100 % i poniżej. Powyżej tego ustawienia jasności nie powinno być żadnego migotania ani PWM. Częstotliwość 3506 Hz jest dość wysoka, więc większość użytkowników wrażliwych na PWM nie powinna zauważyć żadnego migotania. Dla porównania: 53 % wszystkich testowanych urządzeń nie używa PWM do przyciemniania wyświetlacza. Jeśli wykryto PWM, zmierzono średnio 8023 (minimum: 5 - maksimum: 343500) Hz. | |||
Migotanie jest obecne na wszystkich poziomach jasności. Jednak stosunkowo wysoka częstotliwość 3506 Hz powinna sprawić, że nie będzie to problemem dla większości użytkowników. Migotanie ma również niefortunną konsekwencję w postaci utrudnienia precyzyjnego pomiaru czasu reakcji.
Wydajność - Intel Raptor Lake-HX 13. generacji
Warunki testowania
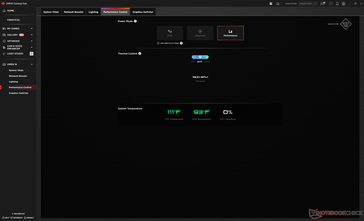
Przed wykonaniem poniższych testów ustawiliśmy naszą jednostkę na tryb wydajności za pośrednictwem systemu Windows i ponownie na tryb wydajności za pośrednictwem oprogramowania Omen Gaming Hub. Irytujące jest to, że dostosowanie jednego ustawienia profilu zasilania nie powoduje automatycznego dostosowania drugiego.
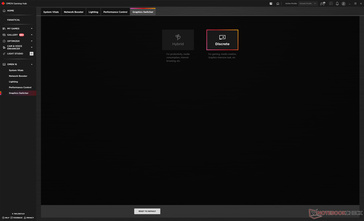
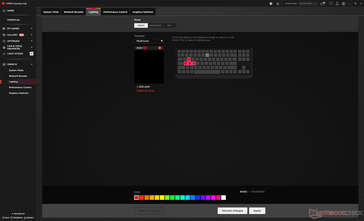
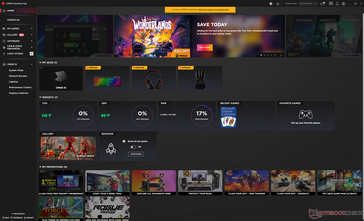
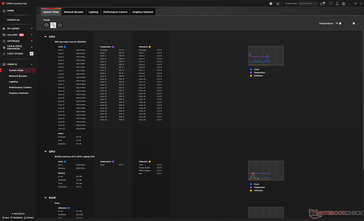
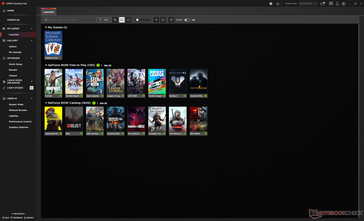
Przełącznik MUX jest dostępny za pośrednictwem Omen Gaming Hub, jak pokazano na poniższych zrzutach ekranu. W związku z tym zdecydowanie zaleca się, aby właściciele zapoznali się z oprogramowaniem, ponieważ kluczowe funkcje są tutaj przełączane. Profile wydajności są ukryte pod kilkoma podmenu, co jest kolejnym irytującym aspektem oprogramowania.
Advanced Optimus lub Optimus 2.0 nie są obsługiwane. Podczas przełączania między iGPU i dGPU wymagany jest miękki restart. G-Sync jest obsługiwany na wewnętrznym wyświetlaczu.
Procesor
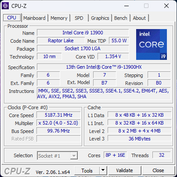
ProcesorCore i9-13900HX w Omen Transcend 16 działa o około 5 do 10 procent wolniej niż przeciętny laptop w naszej bazie danych wyposażony w ten sam procesor. Ekstremalnym przykładem jest Lenovo Legion Pro 7 który może być nawet o 20 procent szybszy niż nasz HP, mimo że oba są dostarczane z Core i9-13900HX. Nasz Omen Transcend 16 nadal jest jednym z najszybszych laptopów do gier na rynku, ale wydajność procesora z pewnością mogłaby być nieco szybsza w oparciu o nasz czas spędzony z innymi wysokiej klasy modelami do gier.
Stabilność wydajności jest poza tym doskonała, bez większych problemów z dławieniem podczas uruchamiania CineBench R15 xT w pętli.
Cinebench R15 Multi Loop
Cinebench R23: Multi Core | Single Core
Cinebench R20: CPU (Multi Core) | CPU (Single Core)
Cinebench R15: CPU Multi 64Bit | CPU Single 64Bit
Blender: v2.79 BMW27 CPU
7-Zip 18.03: 7z b 4 | 7z b 4 -mmt1
Geekbench 5.5: Multi-Core | Single-Core
HWBOT x265 Benchmark v2.2: 4k Preset
LibreOffice : 20 Documents To PDF
R Benchmark 2.5: Overall mean
| CPU Performance rating | |
| Asus Zephyrus Duo 16 GX650PY-NM006W | |
| Przeciętny Intel Core i9-13900HX | |
| HP Omen Transcend 16 | |
| Lenovo Legion Slim 7i 16 Gen 8 -1! | |
| Alienware x16 R1 -1! | |
| Lenovo Legion Pro 5 16ARX8 | |
| HP Omen 16-wf000 -1! | |
| Asus ROG Zephyrus M16 GU603Z | |
| Lenovo Legion S7 16ARHA7 | |
| Acer Nitro 16 AN16-41 | |
| HP Omen 16-n0033dx | |
| Dell Inspiron 16 Plus 7610-MHJ8F | |
| Cinebench R23 / Multi Core | |
| Asus Zephyrus Duo 16 GX650PY-NM006W | |
| Przeciętny Intel Core i9-13900HX (24270 - 32623, n=23) | |
| HP Omen Transcend 16 | |
| HP Omen 16-wf000 | |
| Lenovo Legion Slim 7i 16 Gen 8 | |
| Alienware x16 R1 | |
| Lenovo Legion Pro 5 16ARX8 | |
| Asus ROG Zephyrus M16 GU603Z | |
| Lenovo Legion S7 16ARHA7 | |
| Acer Nitro 16 AN16-41 | |
| HP Omen 16-n0033dx | |
| Dell Inspiron 16 Plus 7610-MHJ8F | |
| Cinebench R23 / Single Core | |
| HP Omen Transcend 16 | |
| Przeciętny Intel Core i9-13900HX (1867 - 2105, n=20) | |
| Lenovo Legion Slim 7i 16 Gen 8 | |
| Alienware x16 R1 | |
| Asus Zephyrus Duo 16 GX650PY-NM006W | |
| Asus ROG Zephyrus M16 GU603Z | |
| HP Omen 16-wf000 | |
| Lenovo Legion Pro 5 16ARX8 | |
| Lenovo Legion S7 16ARHA7 | |
| Acer Nitro 16 AN16-41 | |
| HP Omen 16-n0033dx | |
| Dell Inspiron 16 Plus 7610-MHJ8F | |
| Cinebench R20 / CPU (Multi Core) | |
| Asus Zephyrus Duo 16 GX650PY-NM006W | |
| Przeciętny Intel Core i9-13900HX (9152 - 12541, n=21) | |
| HP Omen Transcend 16 | |
| HP Omen 16-wf000 | |
| Lenovo Legion Slim 7i 16 Gen 8 | |
| Alienware x16 R1 | |
| Lenovo Legion Pro 5 16ARX8 | |
| Asus ROG Zephyrus M16 GU603Z | |
| Lenovo Legion S7 16ARHA7 | |
| Acer Nitro 16 AN16-41 | |
| HP Omen 16-n0033dx | |
| Dell Inspiron 16 Plus 7610-MHJ8F | |
| Cinebench R20 / CPU (Single Core) | |
| HP Omen Transcend 16 | |
| Przeciętny Intel Core i9-13900HX (722 - 810, n=21) | |
| Lenovo Legion Slim 7i 16 Gen 8 | |
| Asus Zephyrus Duo 16 GX650PY-NM006W | |
| Alienware x16 R1 | |
| HP Omen 16-wf000 | |
| Lenovo Legion Pro 5 16ARX8 | |
| Asus ROG Zephyrus M16 GU603Z | |
| Lenovo Legion S7 16ARHA7 | |
| Acer Nitro 16 AN16-41 | |
| HP Omen 16-n0033dx | |
| Dell Inspiron 16 Plus 7610-MHJ8F | |
| Cinebench R15 / CPU Multi 64Bit | |
| Asus Zephyrus Duo 16 GX650PY-NM006W | |
| Przeciętny Intel Core i9-13900HX (3913 - 4970, n=22) | |
| HP Omen Transcend 16 | |
| HP Omen 16-wf000 | |
| Lenovo Legion Pro 5 16ARX8 | |
| Lenovo Legion Slim 7i 16 Gen 8 | |
| Alienware x16 R1 | |
| Asus ROG Zephyrus M16 GU603Z | |
| Lenovo Legion S7 16ARHA7 | |
| Acer Nitro 16 AN16-41 | |
| HP Omen 16-n0033dx | |
| Dell Inspiron 16 Plus 7610-MHJ8F | |
| Cinebench R15 / CPU Single 64Bit | |
| Asus Zephyrus Duo 16 GX650PY-NM006W | |
| HP Omen Transcend 16 | |
| Lenovo Legion Pro 5 16ARX8 | |
| Przeciętny Intel Core i9-13900HX (247 - 304, n=22) | |
| Alienware x16 R1 | |
| HP Omen 16-wf000 | |
| Asus ROG Zephyrus M16 GU603Z | |
| Lenovo Legion S7 16ARHA7 | |
| Acer Nitro 16 AN16-41 | |
| HP Omen 16-n0033dx | |
| Lenovo Legion Slim 7i 16 Gen 8 | |
| Dell Inspiron 16 Plus 7610-MHJ8F | |
| Blender / v2.79 BMW27 CPU | |
| Dell Inspiron 16 Plus 7610-MHJ8F | |
| HP Omen 16-n0033dx | |
| Acer Nitro 16 AN16-41 | |
| Lenovo Legion S7 16ARHA7 | |
| Asus ROG Zephyrus M16 GU603Z | |
| Lenovo Legion Pro 5 16ARX8 | |
| HP Omen Transcend 16 | |
| Przeciętny Intel Core i9-13900HX (101 - 153, n=22) | |
| Asus Zephyrus Duo 16 GX650PY-NM006W | |
| 7-Zip 18.03 / 7z b 4 | |
| Asus Zephyrus Duo 16 GX650PY-NM006W | |
| Przeciętny Intel Core i9-13900HX (90675 - 127283, n=21) | |
| HP Omen Transcend 16 | |
| HP Omen 16-wf000 | |
| Alienware x16 R1 | |
| Lenovo Legion Pro 5 16ARX8 | |
| Lenovo Legion Slim 7i 16 Gen 8 | |
| Asus ROG Zephyrus M16 GU603Z | |
| Lenovo Legion S7 16ARHA7 | |
| Acer Nitro 16 AN16-41 | |
| HP Omen 16-n0033dx | |
| Dell Inspiron 16 Plus 7610-MHJ8F | |
| 7-Zip 18.03 / 7z b 4 -mmt1 | |
| Asus Zephyrus Duo 16 GX650PY-NM006W | |
| Lenovo Legion Pro 5 16ARX8 | |
| HP Omen Transcend 16 | |
| Przeciętny Intel Core i9-13900HX (6340 - 7177, n=21) | |
| Lenovo Legion Slim 7i 16 Gen 8 | |
| Asus ROG Zephyrus M16 GU603Z | |
| Lenovo Legion S7 16ARHA7 | |
| HP Omen 16-wf000 | |
| Alienware x16 R1 | |
| HP Omen 16-n0033dx | |
| Acer Nitro 16 AN16-41 | |
| Dell Inspiron 16 Plus 7610-MHJ8F | |
| Geekbench 5.5 / Multi-Core | |
| Przeciętny Intel Core i9-13900HX (17614 - 21075, n=22) | |
| Asus Zephyrus Duo 16 GX650PY-NM006W | |
| HP Omen Transcend 16 | |
| Alienware x16 R1 | |
| HP Omen 16-wf000 | |
| Lenovo Legion Slim 7i 16 Gen 8 | |
| Asus ROG Zephyrus M16 GU603Z | |
| Lenovo Legion Pro 5 16ARX8 | |
| Lenovo Legion S7 16ARHA7 | |
| Acer Nitro 16 AN16-41 | |
| HP Omen 16-n0033dx | |
| Dell Inspiron 16 Plus 7610-MHJ8F | |
| Dell Inspiron 16 Plus 7610-MHJ8F | |
| Dell Inspiron 16 Plus 7610-MHJ8F | |
| Geekbench 5.5 / Single-Core | |
| Asus Zephyrus Duo 16 GX650PY-NM006W | |
| HP Omen Transcend 16 | |
| Lenovo Legion Pro 5 16ARX8 | |
| Przeciętny Intel Core i9-13900HX (1345 - 2093, n=22) | |
| Lenovo Legion Slim 7i 16 Gen 8 | |
| Alienware x16 R1 | |
| HP Omen 16-wf000 | |
| Asus ROG Zephyrus M16 GU603Z | |
| Lenovo Legion S7 16ARHA7 | |
| Dell Inspiron 16 Plus 7610-MHJ8F | |
| Dell Inspiron 16 Plus 7610-MHJ8F | |
| Dell Inspiron 16 Plus 7610-MHJ8F | |
| Acer Nitro 16 AN16-41 | |
| HP Omen 16-n0033dx | |
| HWBOT x265 Benchmark v2.2 / 4k Preset | |
| Asus Zephyrus Duo 16 GX650PY-NM006W | |
| Przeciętny Intel Core i9-13900HX (23.5 - 34.4, n=22) | |
| HP Omen Transcend 16 | |
| Lenovo Legion Pro 5 16ARX8 | |
| Alienware x16 R1 | |
| Lenovo Legion Slim 7i 16 Gen 8 | |
| HP Omen 16-wf000 | |
| Asus ROG Zephyrus M16 GU603Z | |
| Lenovo Legion S7 16ARHA7 | |
| Acer Nitro 16 AN16-41 | |
| HP Omen 16-n0033dx | |
| Dell Inspiron 16 Plus 7610-MHJ8F | |
| LibreOffice / 20 Documents To PDF | |
| Asus Zephyrus Duo 16 GX650PY-NM006W | |
| HP Omen 16-n0033dx | |
| Acer Nitro 16 AN16-41 | |
| Lenovo Legion S7 16ARHA7 | |
| Dell Inspiron 16 Plus 7610-MHJ8F | |
| HP Omen 16-wf000 | |
| Alienware x16 R1 | |
| HP Omen Transcend 16 | |
| Przeciętny Intel Core i9-13900HX (32.8 - 51.1, n=21) | |
| Asus ROG Zephyrus M16 GU603Z | |
| Lenovo Legion Pro 5 16ARX8 | |
| Lenovo Legion Slim 7i 16 Gen 8 | |
| R Benchmark 2.5 / Overall mean | |
| Dell Inspiron 16 Plus 7610-MHJ8F | |
| HP Omen 16-n0033dx | |
| Acer Nitro 16 AN16-41 | |
| Lenovo Legion S7 16ARHA7 | |
| HP Omen 16-wf000 | |
| Asus ROG Zephyrus M16 GU603Z | |
| Alienware x16 R1 | |
| Lenovo Legion Pro 5 16ARX8 | |
| Lenovo Legion Slim 7i 16 Gen 8 | |
| HP Omen Transcend 16 | |
| Przeciętny Intel Core i9-13900HX (0.375 - 0.4564, n=22) | |
| Asus Zephyrus Duo 16 GX650PY-NM006W | |
* ... im mniej tym lepiej
AIDA64: FP32 Ray-Trace | FPU Julia | CPU SHA3 | CPU Queen | FPU SinJulia | FPU Mandel | CPU AES | CPU ZLib | FP64 Ray-Trace | CPU PhotoWorxx
| Performance rating | |
| Przeciętny Intel Core i9-13900HX | |
| HP Omen Transcend 16 | |
| Alienware x16 R1 | |
| HP Omen 16-wf000 | |
| Lenovo Legion Slim 7i 16 Gen 8 | |
| Acer Nitro 16 AN16-41 | |
| Asus ROG Zephyrus M16 GU603Z | |
| AIDA64 / FP32 Ray-Trace | |
| Przeciętny Intel Core i9-13900HX (17589 - 27615, n=22) | |
| HP Omen Transcend 16 | |
| HP Omen 16-wf000 | |
| Alienware x16 R1 | |
| Lenovo Legion Slim 7i 16 Gen 8 | |
| Acer Nitro 16 AN16-41 | |
| Asus ROG Zephyrus M16 GU603Z | |
| AIDA64 / FPU Julia | |
| Przeciętny Intel Core i9-13900HX (88686 - 137015, n=22) | |
| HP Omen Transcend 16 | |
| Acer Nitro 16 AN16-41 | |
| HP Omen 16-wf000 | |
| Alienware x16 R1 | |
| Lenovo Legion Slim 7i 16 Gen 8 | |
| Asus ROG Zephyrus M16 GU603Z | |
| AIDA64 / CPU SHA3 | |
| Przeciętny Intel Core i9-13900HX (4362 - 7029, n=22) | |
| HP Omen Transcend 16 | |
| HP Omen 16-wf000 | |
| Alienware x16 R1 | |
| Lenovo Legion Slim 7i 16 Gen 8 | |
| Asus ROG Zephyrus M16 GU603Z | |
| Acer Nitro 16 AN16-41 | |
| AIDA64 / CPU Queen | |
| Przeciętny Intel Core i9-13900HX (125644 - 141385, n=22) | |
| HP Omen Transcend 16 | |
| Lenovo Legion Slim 7i 16 Gen 8 | |
| Alienware x16 R1 | |
| Acer Nitro 16 AN16-41 | |
| Asus ROG Zephyrus M16 GU603Z | |
| HP Omen 16-wf000 | |
| AIDA64 / FPU SinJulia | |
| Przeciętny Intel Core i9-13900HX (12334 - 17179, n=22) | |
| HP Omen Transcend 16 | |
| Acer Nitro 16 AN16-41 | |
| HP Omen 16-wf000 | |
| Alienware x16 R1 | |
| Lenovo Legion Slim 7i 16 Gen 8 | |
| Asus ROG Zephyrus M16 GU603Z | |
| AIDA64 / FPU Mandel | |
| Przeciętny Intel Core i9-13900HX (43850 - 69202, n=22) | |
| HP Omen Transcend 16 | |
| Acer Nitro 16 AN16-41 | |
| HP Omen 16-wf000 | |
| Alienware x16 R1 | |
| Lenovo Legion Slim 7i 16 Gen 8 | |
| Asus ROG Zephyrus M16 GU603Z | |
| AIDA64 / CPU AES | |
| Przeciętny Intel Core i9-13900HX (89413 - 237881, n=22) | |
| Asus ROG Zephyrus M16 GU603Z | |
| HP Omen Transcend 16 | |
| HP Omen 16-wf000 | |
| Alienware x16 R1 | |
| Lenovo Legion Slim 7i 16 Gen 8 | |
| Acer Nitro 16 AN16-41 | |
| AIDA64 / CPU ZLib | |
| Przeciętny Intel Core i9-13900HX (1284 - 1958, n=22) | |
| HP Omen Transcend 16 | |
| HP Omen 16-wf000 | |
| Lenovo Legion Slim 7i 16 Gen 8 | |
| Alienware x16 R1 | |
| Asus ROG Zephyrus M16 GU603Z | |
| Acer Nitro 16 AN16-41 | |
| AIDA64 / FP64 Ray-Trace | |
| Przeciętny Intel Core i9-13900HX (9481 - 15279, n=22) | |
| HP Omen Transcend 16 | |
| HP Omen 16-wf000 | |
| Alienware x16 R1 | |
| Lenovo Legion Slim 7i 16 Gen 8 | |
| Acer Nitro 16 AN16-41 | |
| Asus ROG Zephyrus M16 GU603Z | |
| AIDA64 / CPU PhotoWorxx | |
| HP Omen Transcend 16 | |
| Alienware x16 R1 | |
| Przeciętny Intel Core i9-13900HX (42994 - 51994, n=22) | |
| Asus ROG Zephyrus M16 GU603Z | |
| HP Omen 16-wf000 | |
| Acer Nitro 16 AN16-41 | |
| Lenovo Legion Slim 7i 16 Gen 8 | |
Wydajność systemu
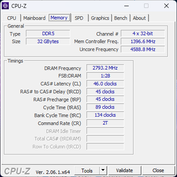
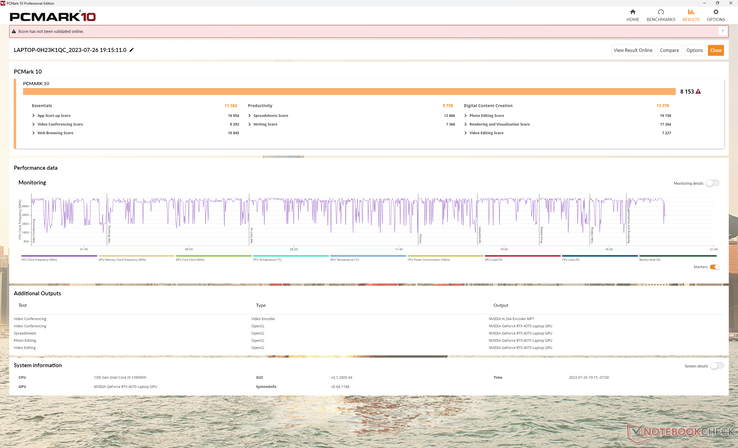
Wyniki PCMark tylko nieznacznie wyprzedzają Omen 16 napędzany RTX 4080, z wyjątkiem Digital Content Creation ze względu na wolniejszy RTX 4070. Nie doświadczyliśmy żadnych problemów z wybudzaniem z uśpienia ani BSOD-ów, w przeciwieństwie do naszego niedawnego Lenovo Slim Pro 9i 16.
CrossMark: Overall | Productivity | Creativity | Responsiveness
| PCMark 10 / Score | |
| Lenovo Legion Slim 7i 16 Gen 8 | |
| Alienware x16 R1 | |
| HP Omen Transcend 16 | |
| Asus ROG Zephyrus M16 GU603Z | |
| HP Omen 16-wf000 | |
| Przeciętny Intel Core i9-13900HX, NVIDIA GeForce RTX 4070 Laptop GPU (6956 - 8153, n=3) | |
| Acer Nitro 16 AN16-41 | |
| PCMark 10 / Essentials | |
| Lenovo Legion Slim 7i 16 Gen 8 | |
| HP Omen Transcend 16 | |
| Alienware x16 R1 | |
| Przeciętny Intel Core i9-13900HX, NVIDIA GeForce RTX 4070 Laptop GPU (9865 - 11653, n=3) | |
| Asus ROG Zephyrus M16 GU603Z | |
| Acer Nitro 16 AN16-41 | |
| HP Omen 16-wf000 | |
| PCMark 10 / Productivity | |
| Lenovo Legion Slim 7i 16 Gen 8 | |
| Asus ROG Zephyrus M16 GU603Z | |
| Alienware x16 R1 | |
| HP Omen Transcend 16 | |
| Przeciętny Intel Core i9-13900HX, NVIDIA GeForce RTX 4070 Laptop GPU (9470 - 9850, n=3) | |
| Acer Nitro 16 AN16-41 | |
| HP Omen 16-wf000 | |
| PCMark 10 / Digital Content Creation | |
| Alienware x16 R1 | |
| Lenovo Legion Slim 7i 16 Gen 8 | |
| HP Omen 16-wf000 | |
| HP Omen Transcend 16 | |
| Asus ROG Zephyrus M16 GU603Z | |
| Przeciętny Intel Core i9-13900HX, NVIDIA GeForce RTX 4070 Laptop GPU (9776 - 13370, n=3) | |
| Acer Nitro 16 AN16-41 | |
| CrossMark / Overall | |
| Lenovo Legion Slim 7i 16 Gen 8 | |
| HP Omen Transcend 16 | |
| Przeciętny Intel Core i9-13900HX, NVIDIA GeForce RTX 4070 Laptop GPU (1842 - 2029, n=3) | |
| Alienware x16 R1 | |
| Asus ROG Zephyrus M16 GU603Z | |
| HP Omen 16-wf000 | |
| Acer Nitro 16 AN16-41 | |
| CrossMark / Productivity | |
| Lenovo Legion Slim 7i 16 Gen 8 | |
| Alienware x16 R1 | |
| HP Omen Transcend 16 | |
| Asus ROG Zephyrus M16 GU603Z | |
| Przeciętny Intel Core i9-13900HX, NVIDIA GeForce RTX 4070 Laptop GPU (1700 - 1872, n=3) | |
| HP Omen 16-wf000 | |
| Acer Nitro 16 AN16-41 | |
| CrossMark / Creativity | |
| HP Omen Transcend 16 | |
| Przeciętny Intel Core i9-13900HX, NVIDIA GeForce RTX 4070 Laptop GPU (2088 - 2316, n=3) | |
| Lenovo Legion Slim 7i 16 Gen 8 | |
| Alienware x16 R1 | |
| Asus ROG Zephyrus M16 GU603Z | |
| HP Omen 16-wf000 | |
| Acer Nitro 16 AN16-41 | |
| CrossMark / Responsiveness | |
| Alienware x16 R1 | |
| Lenovo Legion Slim 7i 16 Gen 8 | |
| Asus ROG Zephyrus M16 GU603Z | |
| Przeciętny Intel Core i9-13900HX, NVIDIA GeForce RTX 4070 Laptop GPU (1557 - 1752, n=3) | |
| HP Omen Transcend 16 | |
| HP Omen 16-wf000 | |
| Acer Nitro 16 AN16-41 | |
| PCMark 10 Score | 8153 pkt. | |
Pomoc | ||
| AIDA64 / Memory Copy | |
| HP Omen Transcend 16 | |
| Przeciętny Intel Core i9-13900HX (67716 - 79193, n=22) | |
| Alienware x16 R1 | |
| HP Omen 16-wf000 | |
| Asus ROG Zephyrus M16 GU603Z | |
| Acer Nitro 16 AN16-41 | |
| Lenovo Legion Slim 7i 16 Gen 8 | |
| AIDA64 / Memory Read | |
| HP Omen Transcend 16 | |
| Przeciętny Intel Core i9-13900HX (73998 - 88462, n=22) | |
| Alienware x16 R1 | |
| HP Omen 16-wf000 | |
| Asus ROG Zephyrus M16 GU603Z | |
| Acer Nitro 16 AN16-41 | |
| Lenovo Legion Slim 7i 16 Gen 8 | |
| AIDA64 / Memory Write | |
| Alienware x16 R1 | |
| HP Omen Transcend 16 | |
| Przeciętny Intel Core i9-13900HX (65472 - 77045, n=22) | |
| HP Omen 16-wf000 | |
| Asus ROG Zephyrus M16 GU603Z | |
| Acer Nitro 16 AN16-41 | |
| Lenovo Legion Slim 7i 16 Gen 8 | |
| AIDA64 / Memory Latency | |
| Alienware x16 R1 | |
| Acer Nitro 16 AN16-41 | |
| Asus ROG Zephyrus M16 GU603Z | |
| HP Omen Transcend 16 | |
| HP Omen 16-wf000 | |
| Przeciętny Intel Core i9-13900HX (75.3 - 91.1, n=22) | |
| Lenovo Legion Slim 7i 16 Gen 8 | |
* ... im mniej tym lepiej
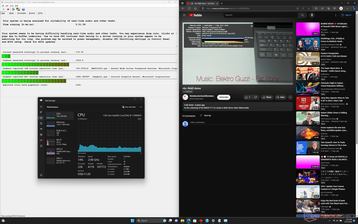
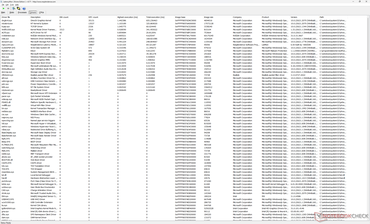
Opóźnienie DPC
| DPC Latencies / LatencyMon - interrupt to process latency (max), Web, Youtube, Prime95 | |
| Lenovo Legion Slim 7i 16 Gen 8 | |
| HP Omen 16-wf000 | |
| HP Omen Transcend 16 | |
| Alienware x16 R1 | |
| Acer Nitro 16 AN16-41 | |
| Asus ROG Zephyrus M16 GU603Z | |
* ... im mniej tym lepiej
Urządzenia pamięci masowej
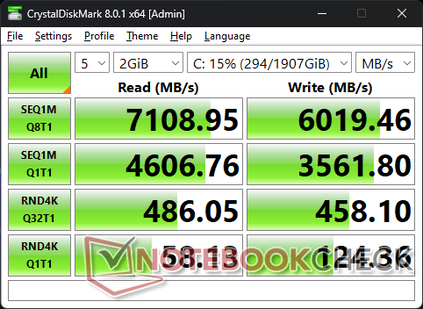
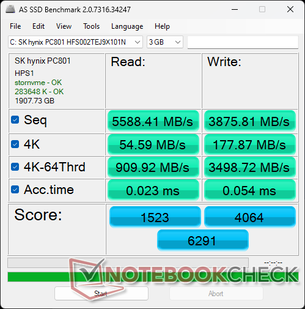
Omen Transcend 16 jest dostarczany z tym samym SK hynix PC801 SSD, który znalazł się w modelu Omen 16. Dysk nie wykazuje żadnych problemów z dławieniem wydajności, dzięki czemu jest w stanie utrzymać wysoką maksymalną szybkość transferu wynoszącą prawie 7000 MB/s bez żadnych problemów podczas naszego testu obciążeniowego.
| Drive Performance rating - Percent | |
| Alienware x16 R1 | |
| Lenovo Legion Slim 7i 16 Gen 8 | |
| Asus ROG Zephyrus M16 GU603Z | |
| HP Omen 16-wf000 | |
| Acer Nitro 16 AN16-41 | |
| HP Omen Transcend 16 | |
* ... im mniej tym lepiej
Disk Throttling: DiskSpd Read Loop, Queue Depth 8
Wydajność GPU - 130 W GPU TGP
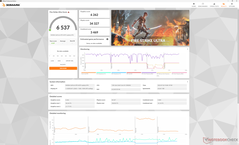
Wydajność graficzna jest porównywalna z przeciętnym laptopem w naszej bazie danych wyposażonym w ten sam mobilny RTX 4070 GPU. Niemniej jednakLenovo Legion Slim 7i 16 G8 z tym samym GPU jest nadal o około 10 procent szybszy, częściowo ze względu na nieco wyższy docelowy TGP (145 W w porównaniu do 130 W).
Obniżenie wydajności do RTX 4060 SKU zmniejszyłby wydajność graficzną o około 10 do 20 procent. Tymczasem RTX 4080 może znacznie zwiększyć wydajność o 40 do 50 procent, ale Omen Transcend 16 jest na razie ograniczony do RTX 4070. Z kolei zwykły Omen 16 można skonfigurować z opcjami GPU większymi niż RTX 4070.
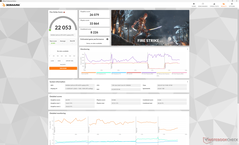
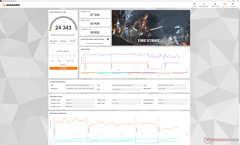
Uruchamianie w trybie zrównoważonym zamiast w trybie wydajności zmniejszyłoby wydajność tylko nieznacznie, jak pokazuje poniższa tabela Fire Strike. Należy o tym pamiętać, ponieważ różnice w hałasie wentylatora między trybem zrównoważonym a trybem wydajności mogą być znaczące, co pokażemy w naszej sekcji Hałas systemu.
| Profil zasilania | Wynik grafiki | Wynik fizyki | Wynik łączny |
| Zrównoważony | 26079 (-5%) | 33864 (-0%) | 8226 (-24%) |
| Wydajność | 27343 | 33936 | 10832 |
| 3DMark Performance rating - Percent | |
| KFA2 GeForce RTX 4070 Ti EX Gamer | |
| Asus Zephyrus Duo 16 GX650PY-NM006W | |
| HP Omen 16-wf000 | |
| Lenovo Legion Slim 7i 16 Gen 8 | |
| Przeciętny NVIDIA GeForce RTX 4070 Laptop GPU | |
| HP Omen Transcend 16 | |
| Lenovo Yoga Pro 9 16-IRP G8 | |
| Asus ROG Zephyrus M16 GU603Z -2! | |
| Lenovo Legion S7 16ARHA7 -1! | |
| HP Omen 16-n0033dx | |
| Asus ZenBook Pro 16X OLED UX7602ZM-ME115W -2! | |
| HP Omen 15-en0375ng -1! | |
| 3DMark 11 - 1280x720 Performance GPU | |
| KFA2 GeForce RTX 4070 Ti EX Gamer | |
| Asus Zephyrus Duo 16 GX650PY-NM006W | |
| HP Omen 16-wf000 | |
| Lenovo Legion Slim 7i 16 Gen 8 | |
| Przeciętny NVIDIA GeForce RTX 4070 Laptop GPU (24229 - 46434, n=67) | |
| HP Omen Transcend 16 | |
| Lenovo Yoga Pro 9 16-IRP G8 | |
| Lenovo Legion S7 16ARHA7 | |
| HP Omen 16-n0033dx | |
| Asus ROG Zephyrus M16 GU603Z | |
| Asus ZenBook Pro 16X OLED UX7602ZM-ME115W | |
| HP Omen 15-en0375ng | |
| 3DMark 11 Performance | 32031 pkt. | |
| 3DMark Fire Strike Score | 24341 pkt. | |
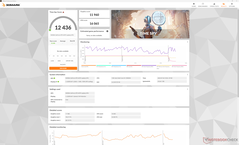
| 3DMark Time Spy Score | 12436 pkt. | |
Pomoc | ||
* ... im mniej tym lepiej
Wydajność w grach
Wszystkie tytuły są grywalne na wysokich lub maksymalnych ustawieniach w natywnej rozdzielczości QHD+, w tym nawet wymagające tytuły, takie jak Returnal lub Cyberpunk 2077. DLSS jest nadal zalecany w przypadku włączenia funkcji RT lub grania na zewnętrznym monitorze 4K.
Witcher 3 FPS Chart
| low | med. | high | ultra | QHD | 4K | |
|---|---|---|---|---|---|---|
| The Witcher 3 (2015) | 500.9 | 375.9 | 222.7 | 111.8 | 65.7 | |
| Dota 2 Reborn (2015) | 212 | 192 | 188.4 | 168.4 | 142.5 | |
| Final Fantasy XV Benchmark (2018) | 220 | 164.8 | 82.6 | 47.1 | ||
| X-Plane 11.11 (2018) | 191.5 | 169.8 | 132.9 | 114 | ||
| Strange Brigade (2018) | 414 | 310 | 245 | 208 | 133.3 | 71.4 |
| Cyberpunk 2077 1.6 (2022) | 128.5 | 118.1 | 103 | 87.5 | 54.5 | 23.5 |
| Tiny Tina's Wonderlands (2022) | 241.7 | 195.6 | 132.5 | 102 | 70.4 | 33.6 |
| F1 22 (2022) | 301 | 289 | 221 | 79.3 | 50.4 | 24.7 |
| Returnal (2023) | 109 | 115 | 101 | 79 | 64 | 37 |
Emisje
Hałas systemowy - duża różnica między trybem zrównoważonym a trybem wydajnościowym
Ogólny hałas wentylatora jest nieco cichszy niż ten, którego doświadczyliśmy na Omen 16ale warto zauważyć, że Omen 16 jest wyposażony w szybszy procesor graficzny RTX 4080 o wyższym współczynniku TGP wynoszącym 145 W w porównaniu do naszego wolniejszego RTX 4070 o mocy 130 W.
Hałas wentylatora podczas grania w trybie wydajności może wynosić nawet 54,3 dB(A) w porównaniu do zaledwie 42 dB(A) w trybie zrównoważonym. Stracisz trochę na wydajności, jak wspomniano powyżej, ale znaczny spadek hałasu może sprawić, że warto rozważyć ten kompromis. W przeciwnym razie średni zakres 50 dB(A) podczas grania jest porównywalny z alternatywami, takimi jakAlienware x16 R1.
Hałas
| luz |
| 29.1 / 29.1 / 29.1 dB |
| obciążenie |
| 45.7 / 54.3 dB |
 | ||
30 dB cichy 40 dB(A) słyszalny 50 dB(A) irytujący |
||
min: | ||
| HP Omen Transcend 16 GeForce RTX 4070 Laptop GPU, i9-13900HX, SK hynix PC801 HFS002TEJ9X101N | Lenovo Legion Slim 7i 16 Gen 8 GeForce RTX 4070 Laptop GPU, i9-13900H, Samsung PM9A1 MZVL21T0HCLR | HP Omen 16-wf000 GeForce RTX 4080 Laptop GPU, i7-13700HX, SK hynix PC801 HFS002TEJ9X101N | Alienware x16 R1 GeForce RTX 4080 Laptop GPU, i9-13900HK, SK hynix PC801 HFS001TEJ9X101N | Acer Nitro 16 AN16-41 GeForce RTX 4070 Laptop GPU, R7 7735HS, Samsung PM9A1 MZVL21T0HCLR | Asus ROG Zephyrus M16 GU603Z GeForce RTX 3070 Ti Laptop GPU, i9-12900H, Micron 3400 1TB MTFDKBA1T0TFH | |
|---|---|---|---|---|---|---|
| Noise | 13% | 1% | 9% | 6% | -2% | |
| wyłączone / środowisko * (dB) | 22.9 | 22.8 -0% | 23 -0% | 22.7 1% | 25.7 -12% | 23 -0% |
| Idle Minimum * (dB) | 29.1 | 23.6 19% | 29.6 -2% | 23.1 21% | 25.7 12% | 23 21% |
| Idle Average * (dB) | 29.1 | 23.6 19% | 29.8 -2% | 25.8 11% | 25.7 12% | 24 18% |
| Idle Maximum * (dB) | 29.1 | 25.7 12% | 30.4 -4% | 25.8 11% | 26.3 10% | 47 -62% |
| Load Average * (dB) | 45.7 | 27.6 40% | 33.8 26% | 39.3 14% | 33.9 26% | 47.91 -5% |
| Witcher 3 ultra * (dB) | 54.3 | 54.4 -0% | 57 -5% | 49.9 8% | 48.91 10% | |
| Load Maximum * (dB) | 54.3 | 54.4 -0% | 58.3 -7% | 54.8 -1% | 62 -14% | 50.25 7% |
* ... im mniej tym lepiej
Temperatura
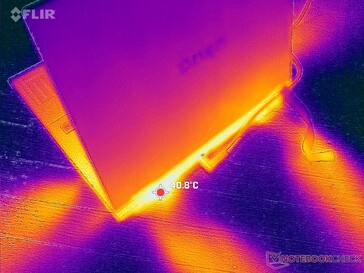
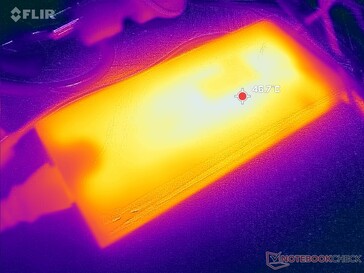
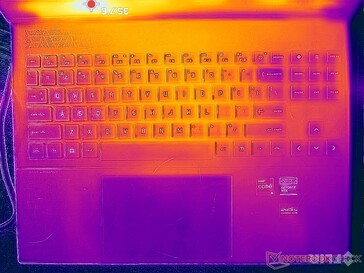
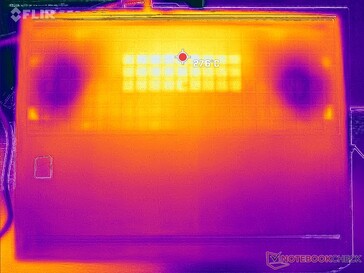
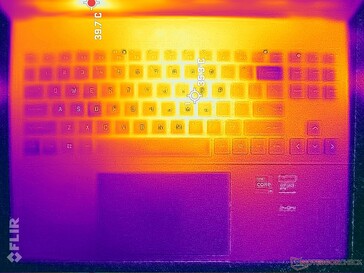
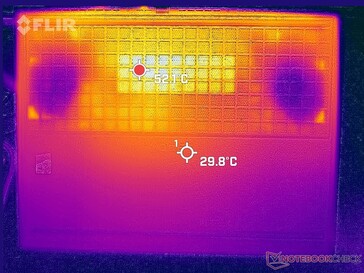
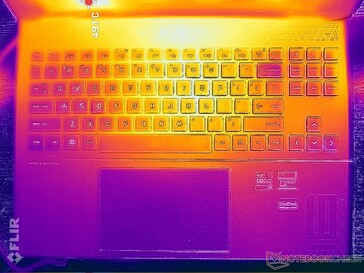
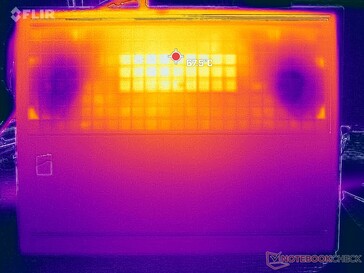
Temperatury powierzchni są najcieplejsze w kierunku środka ze względu na symetryczne rozwiązanie chłodzenia wewnątrz. Środek klawiatury może osiągnąć od 40 do 45 C podczas grania, a spód może być jeszcze cieplejszy. Jednak zakres ten jest nadal porównywalny doLegion Slim 7i 16 G8. Reszta laptopa jest chłodniejsza, w tym podpórki pod nadgarstki, klawisze WASD i klawisze strzałek, gdzie skóra jest częściej w kontakcie podczas grania.
(-) Maksymalna temperatura w górnej części wynosi 47.4 °C / 117 F, w porównaniu do średniej 40.4 °C / 105 F , począwszy od 21.2 do 68.8 °C dla klasy Gaming.
(-) Dno nagrzewa się maksymalnie do 54.4 °C / 130 F, w porównaniu do średniej 43.3 °C / 110 F
(+) W stanie bezczynności średnia temperatura górnej części wynosi 25.4 °C / 78 F, w porównaniu ze średnią temperaturą urządzenia wynoszącą 33.9 °C / ### class_avg_f### F.
(±) Podczas gry w Wiedźmina 3 średnia temperatura górnej części wynosi 32.5 °C / 91 F, w porównaniu do średniej temperatury urządzenia wynoszącej 33.9 °C / ## #class_avg_f### F.
(+) Podpórki pod nadgarstki i touchpad są chłodniejsze niż temperatura skóry i maksymalnie 29.6 °C / 85.3 F i dlatego są chłodne w dotyku.
(±) Średnia temperatura obszaru podparcia dłoni w podobnych urządzeniach wynosiła 28.8 °C / 83.8 F (-0.8 °C / -1.5 F).
| HP Omen Transcend 16 Intel Core i9-13900HX, NVIDIA GeForce RTX 4070 Laptop GPU | Lenovo Legion Slim 7i 16 Gen 8 Intel Core i9-13900H, NVIDIA GeForce RTX 4070 Laptop GPU | HP Omen 16-wf000 Intel Core i7-13700HX, NVIDIA GeForce RTX 4080 Laptop GPU | Alienware x16 R1 Intel Core i9-13900HK, NVIDIA GeForce RTX 4080 Laptop GPU | Acer Nitro 16 AN16-41 AMD Ryzen 7 7735HS, NVIDIA GeForce RTX 4070 Laptop GPU | Asus ROG Zephyrus M16 GU603Z Intel Core i9-12900H, NVIDIA GeForce RTX 3070 Ti Laptop GPU | |
|---|---|---|---|---|---|---|
| Heat | -1% | 3% | -10% | -3% | -5% | |
| Maximum Upper Side * (°C) | 47.4 | 49.8 -5% | 45 5% | 47.2 -0% | 41.5 12% | 52 -10% |
| Maximum Bottom * (°C) | 54.4 | 48.8 10% | 48.8 10% | 47.8 12% | 51.8 5% | 51 6% |
| Idle Upper Side * (°C) | 28.4 | 29.4 -4% | 29.2 -3% | 36.8 -30% | 31.6 -11% | 29 -2% |
| Idle Bottom * (°C) | 29.2 | 30 -3% | 28.8 1% | 35.8 -23% | 34.5 -18% | 33 -13% |
* ... im mniej tym lepiej
Test warunków skrajnych
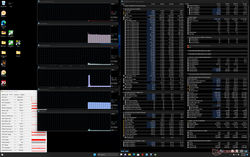
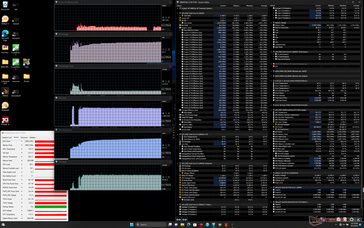
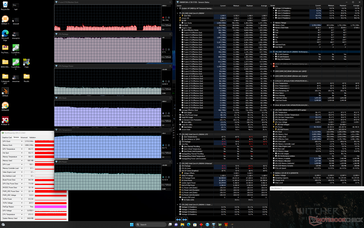
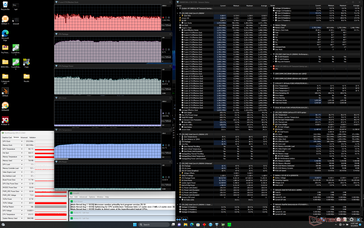
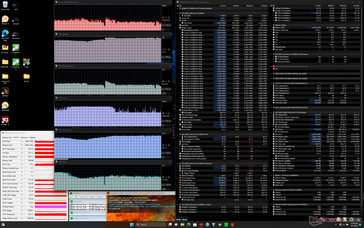
Po uruchomieniu obciążenia Prime95, procesor przyspieszał do 3,1 GHz i 101 W, po czym szybko spadał i stabilizował się na poziomie około 2,4 GHz i 84 W, aby utrzymać rozsądną temperaturę rdzenia na poziomie 81 C. Temperatura rdzenia może osiągnąć nawet 97 C, jeśli GPU jest również obciążane w tym samym czasie, jak pokazano na poniższych zrzutach ekranu.
Procesor graficzny Nvidii ustabilizowałby się na poziomie 2115 MHz, 86 C i 94 W, odpowiednio, podczas pracy w trybie Witcher 3 w trybie wydajności. W trybie zrównoważonym, GPU spadłby do 2085 MHz, 76 C i 86 W. Jesteśmy w stanie osiągnąć rzeczywisty szczyt mocy GPU na poziomie 105 W w porównaniu do docelowego poziomu 130 W TGP.
Praca na zasilaniu bateryjnym ogranicza wydajność. Test Fire Strike na baterii zwróciłby wyniki fizyki i grafiki na poziomie odpowiednio 21003 i 17627 punktów, w porównaniu do 33936 i 27343 punktów przy zasilaniu sieciowym.
| Taktowanie CPU (GHz) | Taktowanie GPU (MHz) | Średnia temperatura CPU (°C) | Średnia temperatura GPU (°C) | |
| System w stanie spoczynku | -- | -- | 48 | 38 |
| Prime95Stress | ~2.0 - 2.4 | -- | 81 | 56 |
| Prime95+ FurMark Stress | ~1.5 | 1605 | 94 | 87 |
| Witcher 3 Obciążenie (trybzrównoważony) | ~0,7 | 2085 | 80 | 77 |
| Witcher 3 Obciążenie (trybwydajności) | ~0,7 | 2115 | 97 | 87 |
Głośniki
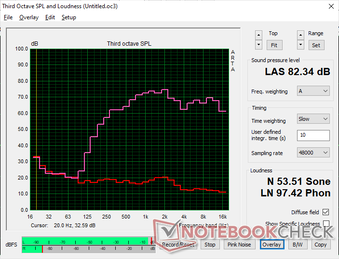
HP Omen Transcend 16 analiza dźwięku
(+) | głośniki mogą odtwarzać stosunkowo głośno (82.3 dB)
Bas 100 - 315 Hz
(-) | prawie brak basu - średnio 20% niższa od mediany
(±) | liniowość basu jest średnia (14.3% delta do poprzedniej częstotliwości)
Średnie 400 - 2000 Hz
(±) | wyższe średnie - średnio 5.2% wyższe niż mediana
(+) | średnie są liniowe (3.7% delta do poprzedniej częstotliwości)
Wysokie 2–16 kHz
(+) | zrównoważone maksima - tylko 2% od mediany
(+) | wzloty są liniowe (6.7% delta do poprzedniej częstotliwości)
Ogólnie 100 - 16.000 Hz
(±) | liniowość ogólnego dźwięku jest średnia (17% różnicy w stosunku do mediany)
W porównaniu do tej samej klasy
» 44% wszystkich testowanych urządzeń w tej klasie było lepszych, 12% podobnych, 44% gorszych
» Najlepszy miał deltę 6%, średnia wynosiła ###średnia###%, najgorsza wynosiła 132%
W porównaniu do wszystkich testowanych urządzeń
» 30% wszystkich testowanych urządzeń było lepszych, 8% podobnych, 62% gorszych
» Najlepszy miał deltę 4%, średnia wynosiła ###średnia###%, najgorsza wynosiła 134%
Apple MacBook Pro 16 2021 M1 Pro analiza dźwięku
(+) | głośniki mogą odtwarzać stosunkowo głośno (84.7 dB)
Bas 100 - 315 Hz
(+) | dobry bas - tylko 3.8% od mediany
(+) | bas jest liniowy (5.2% delta do poprzedniej częstotliwości)
Średnie 400 - 2000 Hz
(+) | zbalansowane środki średnie - tylko 1.3% od mediany
(+) | średnie są liniowe (2.1% delta do poprzedniej częstotliwości)
Wysokie 2–16 kHz
(+) | zrównoważone maksima - tylko 1.9% od mediany
(+) | wzloty są liniowe (2.7% delta do poprzedniej częstotliwości)
Ogólnie 100 - 16.000 Hz
(+) | ogólny dźwięk jest liniowy (4.6% różnicy w stosunku do mediany)
W porównaniu do tej samej klasy
» 0% wszystkich testowanych urządzeń w tej klasie było lepszych, 0% podobnych, 100% gorszych
» Najlepszy miał deltę 5%, średnia wynosiła ###średnia###%, najgorsza wynosiła 45%
W porównaniu do wszystkich testowanych urządzeń
» 0% wszystkich testowanych urządzeń było lepszych, 0% podobnych, 100% gorszych
» Najlepszy miał deltę 4%, średnia wynosiła ###średnia###%, najgorsza wynosiła 134%
Zarządzanie energią
Zużycie energii - wysokie wartości na biegu jałowym
Nasz Omen Transcend 16 jest wyposażony w szybszy procesor, ale wolniejszy układ graficzny niż Omen 16, więc średni pobór mocy jest mniej więcej taki sam. Różnice między nimi stają się bardziej zauważalne, gdy obciążany jest tylko procesor lub karta graficzna. Na przykład, nasz Omen Transcend 16 zużywałby około 15 do 20 W więcej energii podczas uruchamiania Prime95, podczas gdy zużywałby około 15 W mniej podczas uruchamiania FurMark.
Praca na biegu jałowym na komputerze stacjonarnym może pobierać nawet 55 W w profilu Performance. Mini-LED jest ogólnie bardziej wymagający niż standardowa alternatywa IPS.
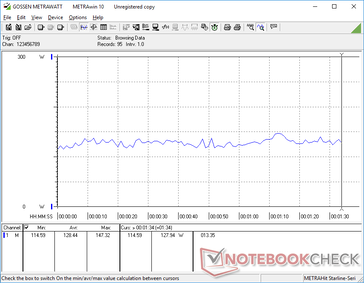
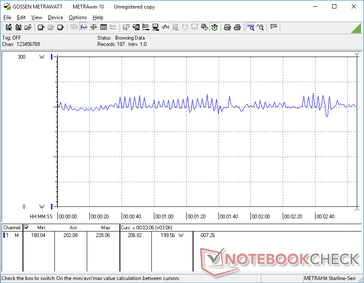
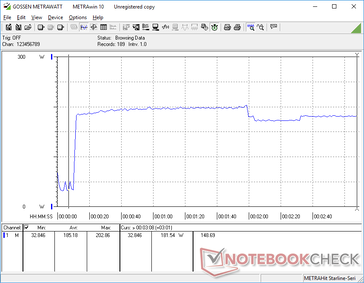
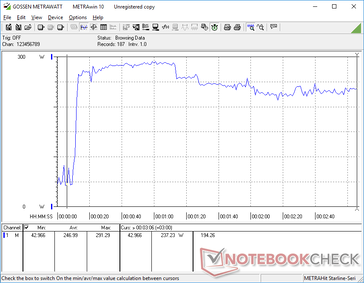
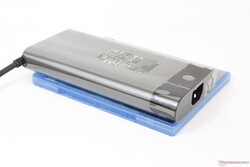
Jesteśmy w stanie zarejestrować maksymalny pobór 292 W ze średniego (~18 x 8,7 x 2,6 cm) zasilacza sieciowego 280 W, gdy procesor i karta graficzna są wykorzystywane w 100 procentach. Zużycie ustabilizowałoby się w zakresie 240 W po około minucie pełnego obciążenia.
| wyłączony / stan wstrzymania | |
| luz | |
| obciążenie |
|
Legenda:
min: | |
| HP Omen Transcend 16 i9-13900HX, GeForce RTX 4070 Laptop GPU, SK hynix PC801 HFS002TEJ9X101N, Mini-LED, 2560x1600, 16" | Lenovo Legion Slim 7i 16 Gen 8 i9-13900H, GeForce RTX 4070 Laptop GPU, Samsung PM9A1 MZVL21T0HCLR, IPS, 2560x1600, 16" | HP Omen 16-wf000 i7-13700HX, GeForce RTX 4080 Laptop GPU, SK hynix PC801 HFS002TEJ9X101N, IPS, 2560x1440, 16.1" | Alienware x16 R1 i9-13900HK, GeForce RTX 4080 Laptop GPU, SK hynix PC801 HFS001TEJ9X101N, IPS, 2560x1600, 16" | Acer Nitro 16 AN16-41 R7 7735HS, GeForce RTX 4070 Laptop GPU, Samsung PM9A1 MZVL21T0HCLR, IPS, 2560x1600, 16" | Asus ROG Zephyrus M16 GU603Z i9-12900H, GeForce RTX 3070 Ti Laptop GPU, Micron 3400 1TB MTFDKBA1T0TFH, IPS, 2560x1600, 16" | |
|---|---|---|---|---|---|---|
| Power Consumption | 9% | 3% | -12% | 29% | 34% | |
| Idle Minimum * (Watt) | 19.2 | 22 -15% | 21.8 -14% | 25.2 -31% | 11.6 40% | 10.8 44% |
| Idle Average * (Watt) | 22.7 | 29 -28% | 26 -15% | 29.9 -32% | 15.6 31% | 17 25% |
| Idle Maximum * (Watt) | 55.4 | 39.5 29% | 36 35% | 49.8 10% | 16.5 70% | 17.8 68% |
| Load Average * (Watt) | 128.4 | 98.7 23% | 115.5 10% | 105.4 18% | 155 -21% | 116 10% |
| Witcher 3 ultra * (Watt) | 206 | 171.8 17% | 214 -4% | 263 -28% | 154.8 25% | 144 30% |
| Load Maximum * (Watt) | 292 | 213.2 27% | 269.7 8% | 313.8 -7% | 205 30% | 220 25% |
* ... im mniej tym lepiej
Power Consumption Witcher 3 / Stresstest
Power Consumption external Monitor
Żywotność baterii
Pojemność baterii wzrosła z 83 Wh w Omen 16 do 97 Wh w naszym Omen Transcend 16. Niemniej jednak, żywotność baterii jest nadal krótsza ze względu na bardziej wymagający panel mini-LED. Jesteśmy w stanie taktować nieco ponad 4 godziny przeglądania sieci WLAN w świecie rzeczywistym na zrównoważonym profilu zasilania z aktywnym iGPU, podczas gdy Omen 16 może zbliżyć się do 5 godzin przy podobnych ustawieniach.
Ładowanie od stanu pustego do pełnej pojemności za pomocą dołączonego zasilacza sieciowego zajmuje około 90 minut. System można również ładować przez USB-C, ale adaptery o niższej pojemności mogą nie działać. Na przykład nasz zasilacz USB-C o mocy 65 W wygenerowałby komunikat o błędzie zgodności, podczas gdy nasz zasilacz USB-C o mocy 135 W ładowałby się bez problemów.
| HP Omen Transcend 16 i9-13900HX, GeForce RTX 4070 Laptop GPU, 97 Wh | Lenovo Legion Slim 7i 16 Gen 8 i9-13900H, GeForce RTX 4070 Laptop GPU, 99.9 Wh | HP Omen 16-wf000 i7-13700HX, GeForce RTX 4080 Laptop GPU, 83 Wh | Alienware x16 R1 i9-13900HK, GeForce RTX 4080 Laptop GPU, 90 Wh | Acer Nitro 16 AN16-41 R7 7735HS, GeForce RTX 4070 Laptop GPU, 90 Wh | Asus ROG Zephyrus M16 GU603Z i9-12900H, GeForce RTX 3070 Ti Laptop GPU, 90 Wh | |
|---|---|---|---|---|---|---|
| Czasy pracy | -13% | 0% | -22% | 86% | 47% | |
| Reader / Idle (h) | 6.3 | 5.1 -19% | 5.5 -13% | 7.3 16% | 12.2 94% | |
| WiFi v1.3 (h) | 4.2 | 4.4 5% | 5.1 21% | 2.5 -40% | 9 114% | 7.4 76% |
| Load (h) | 1.2 | 0.9 -25% | 1.1 -8% | 0.7 -42% | 1.8 50% | 1.4 17% |
| H.264 (h) | 10.2 | 7.3 |
Za
Przeciw
Werdykt - Świetny design i unikalny wyświetlacz Mini-LED, ale gdzie jest GeForce RTX 4080?
Omen Transcend 16 oferuje kilka ulepszeń w stosunku do standardowego Omena 16, w tym czujnik podczerwieni, proporcje 16:10, baterię o większej pojemności i opcję mini-LED. Ta ostatnia jest prawdopodobnie najbardziej wyjątkowa, ponieważ model ten jest jednym z pierwszych wyposażonych w wyświetlacz mini-LED QHD + 240 Hz, zapewniający wrażenia wizualne w przeciwieństwie do większości innych laptopów do gier, w których IPS i OLED są nadal powszechne. Użytkownicy, którzy cenią sobie jasność i funkcje HDR1000, szczególnie docenią zalety mini-LED.
Omen Transcend 16 rezygnuje z wyższych opcji GPU na rzecz szybszego procesora oraz cieńszego i lżejszego profilu. Tymczasem jego wyświetlacz Mini-LED jest wyjątkowo jasny, zapewniając najbardziej żywe treści HDR na każdym laptopie do gier.
Najnowszy model niekoniecznie jest lepszy od zwykłego Omena 16, ponieważ pomija kilka ważnych funkcji. Po pierwsze, Omen Transcend 16 obsługuje tylko jeden wewnętrzny dysk SSD, podczas gdy Omen 16 może obsługiwać dwa. Po drugie i być może najważniejsze, Omen Transcend 16 osiąga maksimum przy 130 W GeForce RTX 4070 GPU, podczas gdy Omen 16 można skonfigurować z maksymalnie 145 W GeForce RTX 4080. To ograniczenie GPU może wynikać z cieńszego profilu i wyższej opcji procesora Core i9-13900HX w Omen Transcend 16. Dlatego użytkownicy, którzy wolą szybszą wydajność GPU, mogą rozważyć zwykły Omen 16 podczas gdy ci, którzy preferują szybszą wydajność procesora, mogą rozważyć Omen Transcend 16.
Cena i dostępność
HP wysyła teraz swój Omen Transcend 16 w cenie od 1250 USD za podstawową konfigurację Core i7-13700HX i RTX 4050 do 2500 USD za naszą konfigurację testową.
HP Omen Transcend 16
- 04/08/2023 v7 (old)
Allen Ngo
Przezroczystość
Wyboru urządzeń do recenzji dokonuje nasza redakcja. Próbka testowa została udostępniona autorowi jako pożyczka od producenta lub sprzedawcy detalicznego na potrzeby tej recenzji. Pożyczkodawca nie miał wpływu na tę recenzję, producent nie otrzymał też kopii tej recenzji przed publikacją. Nie było obowiązku publikowania tej recenzji. Jako niezależna firma medialna, Notebookcheck nie podlega władzy producentów, sprzedawców detalicznych ani wydawców.
Tak testuje Notebookcheck
Każdego roku Notebookcheck niezależnie sprawdza setki laptopów i smartfonów, stosując standardowe procedury, aby zapewnić porównywalność wszystkich wyników. Od około 20 lat stale rozwijamy nasze metody badawcze, ustanawiając przy tym standardy branżowe. W naszych laboratoriach testowych doświadczeni technicy i redaktorzy korzystają z wysokiej jakości sprzętu pomiarowego. Testy te obejmują wieloetapowy proces walidacji. Nasz kompleksowy system ocen opiera się na setkach uzasadnionych pomiarów i benchmarków, co pozwala zachować obiektywizm.

