Testy dla Intel Core i9-14900HX procesor
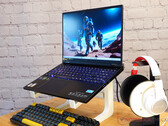
Recenzja laptopa do gier Acer Predator Helios 16 (PH16-72): Drapieżnik z ostrymi zębami i cichymi łapami
Wysokiej klasy sprzęt, świetny wyświetlacz mini LED i wydajne chłodzenie sprawiają, że Acer Predator Helios 16 to prawdziwe marzenie graczy. W rzeczywistości ten drapieżnik wśród laptopów do gier jest naprawdę cichy. Niemniej jednak, nasza recenzja ujawnia, że wiele zalet laptopa idzie w parze z pewnymi kompromisami.
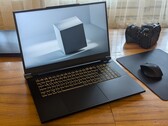
Intel Core i9-14900HX, NVIDIA GeForce RTX 4080 Laptop GPU, 16", 2.7 kgRecenzja Minisforum AtomMan G7 Ti: Laptop do gier bez ekranu jako oszczędzająca miejsce alternatywa dla komputera stacjonarnego
Minisforum AtomMan G7 Ti to obietnica wydajności komputera stacjonarnego w kompaktowym formacie. Wyposażony w potężny procesor Intel Core i9-14900HX i kartę graficzną Nvidia GeForce RTX 4070 laptop jest skierowany do graczy, twórców i profesjonalistów, którzy potrzebują maksymalnej wydajności na minimalnej przestrzeni. W tym teście przyjrzymy się bliżej temu mini PC i sprawdzimy, czy spełnia on wysokie oczekiwania.
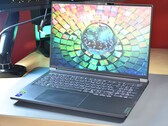
Intel Core i9-14900HX, NVIDIA GeForce RTX 4070 Laptop GPU, 2.6 kgRecenzja XMG Neo 17 E24 - Szybki laptop do gier z opcjonalnym chłodzeniem wodnym
Dzięki XMG Neo 17 otrzymują Państwo rasowego gracza, który może być wyposażony w najszybsze komponenty na rynku. Mechaniczna klawiatura Cherry i zewnętrzny system chłodzenia wodą są również dostępne jako opcje, które nie tylko obniżają temperatury, ale także hałas w tle.
Intel Core i9-14900HX, NVIDIA GeForce RTX 4080 Laptop GPU, 17", 2.9 kgRecenzja SCHENKER Key 17 Pro (M24) - ultraszybkie dwa złącza Thunderbolt 5 i moc i9-14900HX
Schenker KEY 17 Pro to jedna z pierwszych wysokiej klasy mobilnych stacji roboczych zastępujących komputery stacjonarne, wyposażona w dwa porty Thunderbolt 5. Integruje najlepsze komponenty, w tym ulepszony procesor Intel i9-14900HX uzupełniony kartą graficzną Nvidia RTX 4090, a także najszybszą łączność Wi-Fi 7.
Intel Core i9-14900HX, NVIDIA GeForce RTX 4090 Laptop GPU, 17.3", 3.4 kgRecenzja laptopa Lenovo ThinkBook 16p Gen 5: Ukryty Lenovo Legion dla twórców
Lenovo ThinkBook 16p Gen 5 IRX to najmocniejszy model z serii laptopów ThinkBook dla małych i średnich firm. Dzięki wyświetlaczowi o szerokiej gamie kolorów, najmocniejszemu i9 dla laptopów i karcie graficznej Nvidia GeForce RTX 4060, jest on skierowany do twórców i rynku multimediów. Ale nie tylko twórcy mogą uznać go za atrakcyjny - ThinkBook jest również gotowy do gier.
Intel Core i9-14900HX, NVIDIA GeForce RTX 4060 Laptop GPU, 16", 2.2 kgMSI Raider 18 HX A14V: NVIDIA GeForce RTX 4080 Laptop GPU, 18.00", 3.6 kg
Recenzja » Recenzja MSI Raider 18 HX A14V: Wydajność Tytana bez ceny Tytana
Nubia RedMagic Titan 16 Pro: NVIDIA GeForce RTX 4060 Laptop GPU, 16.00", 2.4 kg
Recenzja » Recenzja RedMagic Titan 16 Pro: Laptop do gier stworzony przez producenta smartfonów
HP ZBook Fury 16 G11: NVIDIA RTX 3500 Ada Generation Laptop, 16.00", 2.6 kg
Recenzja » Debiut wydajności Nvidia RTX 3500 Ada: Recenzja stacji roboczej HP ZBook Fury 16 G11
Schenker XMG Pro 16 Studio (Mid 24): NVIDIA GeForce RTX 4070 Laptop GPU, 16.00", 2.3 kg
Recenzja » Recenzja XMG Pro 16 Studio (Mid 24): Core i9 i RTX 4070 dla graczy i twórców
Lenovo Legion 9 16IRX9, RTX 4090: NVIDIA GeForce RTX 4090 Laptop GPU, 16.00", 2.5 kg
Recenzja » Recenzja Lenovo Legion 9 16IRX9 (Legion 9i): Jak wysokiej klasy jest RTX 4090 dla graczy?
Schenker XMG Neo 16 (Early 24): NVIDIA GeForce RTX 4090 Laptop GPU, 16.00", 2.5 kg
Recenzja » Recenzja XMG Neo 16 (Early 24): Pełna moc RTX 4090 w kompaktowym laptopie do gier
Razer Blade 18 2024 RZ09-0509: NVIDIA GeForce RTX 4090 Laptop GPU, 18.00", 3.1 kg
Recenzja » Recenzja Razer Blade 18 2024: Pierwszy laptop na rynku z mini-LED i Thunderbolt 5
Schenker XMG Fusion 15 (Early 24): NVIDIA GeForce RTX 4070 Laptop GPU, 15.30", 2.1 kg
Recenzja » Recenzja XMG Fusion 15 (Early 24): Kompaktowy laptop RTX 4070 dla graczy i twórców
Asus ROG Strix Scar 16 G634JZR: NVIDIA GeForce RTX 4080 Laptop GPU, 16.00", 2.7 kg
Recenzja » Recenzja laptopa Asus ROG Strix Scar 16 (2024): Ognista wydajność i blask mini LED w przystępnej cenie
Lenovo Legion 7 16 IRX G9: NVIDIA GeForce RTX 4070 Laptop GPU, 16.00", 2.3 kg
Recenzja » Recenzja laptopa Lenovo Legion 7 16 G9 - gamingowa maszyna z wyświetlaczem 3,2K, procesorem HX i podkręconą kartą graficzną RTX 4070
Aorus 16X 2024: NVIDIA GeForce RTX 4070 Laptop GPU, 16.00", 2.3 kg
Recenzja » Recenzja Aorus 16X (2024): Core i9 i RTX 4070 za 2000 USD
Lenovo Legion Pro 5 16IRX9: NVIDIA GeForce RTX 4070 Laptop GPU, 16.00", 2.5 kg
Recenzja » Recenzja laptopa Lenovo Legion Pro 5 16IRX9: Świetna wydajność, ale trochę ciężki
Lenovo Legion Pro 7 16IRX9H: NVIDIA GeForce RTX 4080 Laptop GPU, 16.00", 2.7 kg
Recenzja » Recenzja Lenovo Legion Pro 7 16 (2024): Śmietanka towarzyska wśród laptopów z RTX 4080
Alienware m18 R2: NVIDIA GeForce RTX 4090 Laptop GPU, 18.00", 4 kg
Recenzja » Recenzja laptopa Alienware m18 R2: Przeskok z Core i9-13980HX na i9-14900HX
Eurocom Raptor X17 Core i9-14900HX: NVIDIA GeForce RTX 4090 Laptop GPU, 17.30", 3.4 kg
Recenzja » Recenzja laptopa Eurocom Raptor X17 Core i9-14900HX: 175 W GPU dla maksymalnej wydajności
Acer Predator Helios 18 PH18-72-98MW: NVIDIA GeForce RTX 4090 Laptop GPU, 18.00", 3.3 kg
Recenzja » Recenzja laptopa Acer Predator Helios 18 2024: Nowy sprzęt dla 18-calowych graczy
Medion Erazer Beast X40 2024: NVIDIA GeForce RTX 4090 Laptop GPU, 17.00", 2.9 kg
Recenzja » Recenzja Medion Erazer Beast X40 (2024): Wysokiej klasy laptop do gier z RTX 4090 i klawiaturą mechaniczną
HP Omen 16 (2024): NVIDIA GeForce RTX 4080 Laptop GPU, 16.10", 2.4 kg
Recenzja » Recenzja HP Omen 16 (2024): Gamingowy notebook QHD z Core i9 i RTX 4080 za 3200 euro
Razer Blade 16 2024, RTX 4090: NVIDIA GeForce RTX 4090 Laptop GPU, 16.00", 2.5 kg
Recenzja » Recenzja laptopa Razer Blade 16 (2024): Teraz z superszybkim Samsung OLED
HP Omen Transcend 16-u1095ng: NVIDIA GeForce RTX 4070 Laptop GPU, 16.00", 2.3 kg
Recenzja » Recenzja laptopa HP Omen Transcend 16 (2024): Maszyna do gier RTX 4070 z wyświetlaczem OLED
Asus ROG Strix Scar 18 G834JYR (2024): NVIDIA GeForce RTX 4090 Laptop GPU, 18.00", 3.1 kg
Recenzja » Recenzja Asus ROG Strix Scar 18 (2024): Laptop do gier z RTX 4090 i panelem mini-LED
MSI Vector 16 HX A14V: NVIDIA GeForce RTX 4080 Laptop GPU, 16.00", 2.7 kg
Recenzja » Recenzja laptopa MSI Vector 16 HX: Wydajność Tytana bez ceny Tytana
MSI Titan 18 HX A14VIG: NVIDIA GeForce RTX 4090 Laptop GPU, 18.00", 3.6 kg
Recenzja » Recenzja laptopa MSI Titan 18 HX A14VIG: Rok smoka
Schenker XMG Neo 17 2024 Engineering Sample: NVIDIA GeForce RTX 4090 Laptop GPU
Recenzja » Analiza Intel Raptor Lake-HX Refresh - Core i9-14900HX z większą wydajnością pojedynczego rdzenia
HP Omen 16-am0000ng: NVIDIA GeForce RTX 5060 Laptop, 16.00", 2.4 kg
Zewnętrzna recenzja » HP Omen 16-am0000ng
MSI Katana 15 HX B14WGK: NVIDIA GeForce RTX 5070 Laptop, 15.60", 2.4 kg
Zewnętrzna recenzja » MSI Katana 15 HX B14WGK
Lenovo Legion 5 15IRX10: NVIDIA GeForce RTX 5070 Laptop, 15.10", 1.9 kg
Zewnętrzna recenzja » Lenovo Legion 5 15IRX10
Acer Predator Helios 16 PH16-72, RTX 4070: NVIDIA GeForce RTX 4070, 16.00", 2.7 kg
Zewnętrzna recenzja » Acer Predator Helios 16 PH16-72, RTX 4070
HP Omen 16 (2024): NVIDIA GeForce RTX 4080 Laptop GPU, 16.10", 2.4 kg
Zewnętrzna recenzja » HP Omen 16 (2024)
Origin PC EON17-X 2024: NVIDIA GeForce RTX 4090 Laptop GPU, 17.30", 3.4 kg
Zewnętrzna recenzja » Origin PC EON17-X 2024
Asus ROG Strix G18 G814JZR: NVIDIA GeForce RTX 4080 Laptop GPU, 18.00", 3 kg
Zewnętrzna recenzja » Asus ROG Strix G18 G814JZR
Lenovo Legion 5 16IRX9, i9-14900HX: NVIDIA GeForce RTX 4060 Laptop GPU, 16.00", 2.3 kg
Zewnętrzna recenzja » Lenovo Legion 5 16IRX9, i9-14900HX
MSI Raider GE78 HX 14VIG: NVIDIA GeForce RTX 4090 Laptop GPU, 17.00", 3.1 kg
Zewnętrzna recenzja » MSI Raider GE78 HX 14VIG
MSI Raider GE68 HX 14VIG: NVIDIA GeForce RTX 4090 Laptop GPU, 16.00", 2.8 kg
Zewnętrzna recenzja » MSI Raider GE68 HX 14VIG
Origin PC Eon16-X: NVIDIA GeForce RTX 4090 Laptop GPU, 16.00", 2.5 kg
Zewnętrzna recenzja » Origin PC Eon16-X
HP ZBook Fury 16 G11: NVIDIA RTX 3500 Ada Generation Laptop, 16.00", 2.6 kg
Zewnętrzna recenzja » HP ZBook Fury 16 G11
Lenovo ThinkBook 16p G5 IRX 21N50011GE: NVIDIA GeForce RTX 4060 Laptop GPU, 16.00", 2.2 kg
Zewnętrzna recenzja » Lenovo ThinkBook 16p G5 IRX 21N50011GE
HP Omen 16-wf1: NVIDIA GeForce RTX 4060 Laptop GPU, 16.10", 2.4 kg
Zewnętrzna recenzja » HP Omen 16-wf1
Aorus 17X AXG: NVIDIA GeForce RTX 4080 Laptop GPU, 17.30", 2.8 kg
Zewnętrzna recenzja » Aorus 17X AXG
Nubia RedMagic Titan 16 Pro: NVIDIA GeForce RTX 4060 Laptop GPU, 16.00", 2.4 kg
Zewnętrzna recenzja » Nubia RedMagic Titan 16 Pro
MSI Creator M16 HX C14VGG: NVIDIA GeForce RTX 4070 Laptop GPU, 16.00", 2.4 kg
Zewnętrzna recenzja » MSI Creator M16 HX C14VGG
MSI Raider 18 HX A14V: NVIDIA GeForce RTX 4080 Laptop GPU, 18.00", 3.6 kg
Zewnętrzna recenzja » MSI Raider 18 HX A14V
Lenovo Legion Pro 7 16IRX9H, RTX 4090: NVIDIA GeForce RTX 4090 Laptop GPU, 16.00", 2.6 kg
Zewnętrzna recenzja » Lenovo Legion Pro 7 16IRX9H, RTX 4090
Schenker XMG Neo 16 (Early 24): NVIDIA GeForce RTX 4090 Laptop GPU, 16.00", 2.5 kg
Zewnętrzna recenzja » SCHENKER XMG Neo 16 (Early 24)
Schenker XMG Fusion 15 (Early 24): NVIDIA GeForce RTX 4070 Laptop GPU, 15.30", 2.1 kg
Zewnętrzna recenzja » SCHENKER XMG Fusion 15 (Early 24)
Medion Erazer Beast X40 2024, RTX 4070: NVIDIA GeForce RTX 4070 Laptop GPU, 17.00", 2.9 kg
Zewnętrzna recenzja » Medion Erazer Beast X40 2024, RTX 4070
Asus ROG Strix Scar 16 G634JYR, RTX 4080: NVIDIA GeForce RTX 4080 Laptop GPU, 16.00", 2.7 kg
Zewnętrzna recenzja » Asus ROG Strix Scar 16 G634JYR, RTX 4080
Acer Predator Helios 18 PH18-72: NVIDIA GeForce RTX 4080 Laptop GPU, 18.00", 3.3 kg
Zewnętrzna recenzja » Acer Predator Helios 18 PH18-72
Lenovo Legion Pro 5 16IRX9, i9-14900HX RTX 4060: NVIDIA GeForce RTX 4060 Laptop GPU, 16.00", 2.5 kg
Zewnętrzna recenzja » Lenovo Legion Pro 5 16IRX9, i9-14900HX RTX 4060
MSI Vector 16 HX A14V: NVIDIA GeForce RTX 4080 Laptop GPU, 16.00", 2.7 kg
Zewnętrzna recenzja » MSI Vector 16 HX A14V
MSI Sword 16 HX B14VFKG, i9-14900HX: NVIDIA GeForce RTX 4060 Laptop GPU, 16.00", 2.3 kg
Zewnętrzna recenzja » MSI Sword 16 HX B14VFKG, i9-14900HX
Asus ROG Strix G16 G614JZR: NVIDIA GeForce RTX 4070 Laptop GPU, 16.00", 2.8 kg
Zewnętrzna recenzja » Asus ROG Strix G16 G614JZR
Asus ROG Strix G18 G814JIR: NVIDIA GeForce RTX 4070 Laptop GPU, 18.00", 3 kg
Zewnętrzna recenzja » Asus ROG Strix G18 G814JIR
Acer Predator Helios Neo 16 PHN16-72, RTX 4060: NVIDIA GeForce RTX 4060 Laptop GPU, 16.00", 2.5 kg
Zewnętrzna recenzja » Acer Predator Helios Neo 16 PHN16-72, RTX 4060
Asus ROG Strix G16 G614JIR: NVIDIA GeForce RTX 4070 Laptop GPU, 16.00", 2.8 kg
Zewnętrzna recenzja » Asus ROG Strix G16 G614JIR
Acer Predator Helios 16 PH16-72: NVIDIA GeForce RTX 4080 Laptop GPU, 16.00", 2.7 kg
Zewnętrzna recenzja » Acer Predator Helios 16 PH16-72
Lenovo Legion 9 16IRX9: NVIDIA GeForce RTX 4090 Laptop GPU, 16.00", 2.6 kg
Zewnętrzna recenzja » Lenovo Legion 9 16IRX9
Aorus 16X 2024: NVIDIA GeForce RTX 4070 Laptop GPU, 16.00", 2.3 kg
Zewnętrzna recenzja » Aorus 16X 2024
Lenovo Legion Pro 5 16IRX9: NVIDIA GeForce RTX 4070 Laptop GPU, 16.00", 2.5 kg
Zewnętrzna recenzja » Lenovo Legion Pro 5 16IRX9
HP Omen Transcend 16-u1095ng: NVIDIA GeForce RTX 4070 Laptop GPU, 16.00", 2.3 kg
Zewnętrzna recenzja » HP Omen Transcend 16-u1095ng
Acer Predator Helios Neo 16 PHN16-72, i9-14900HX: NVIDIA GeForce RTX 4070, 18.00", 3.4 kg
Zewnętrzna recenzja » Acer Predator Helios Neo 16 PHN16-72, i9-14900HX
Lenovo Legion 7 16IRX9, i9-14900HX: NVIDIA GeForce RTX 4070 Laptop GPU, 16.00", 2.2 kg
Zewnętrzna recenzja » Lenovo Legion 7 16IRX9, i9-14900HX
MSI Raider GE78 HX 14VHG: NVIDIA GeForce RTX 4080 Laptop GPU, 17.30", 3.1 kg
Zewnętrzna recenzja » MSI Raider GE78 HX 14VHG
Lenovo Legion Pro 7 16IRX9H: NVIDIA GeForce RTX 4080 Laptop GPU, 16.00", 2.7 kg
Zewnętrzna recenzja » Lenovo Legion Pro 7 16IRX9H
Razer Blade 18 2024 RZ09-0509: NVIDIA GeForce RTX 4090 Laptop GPU, 18.00", 3.1 kg
Zewnętrzna recenzja » Razer Blade 18 2024 RZ09-0509
MSI Raider GE68 HX 14VHG: NVIDIA GeForce RTX 4080 Laptop GPU, 17.30", 3.1 kg
Zewnętrzna recenzja » MSI Raider GE68 HX 14VHG
Asus ROG Strix Scar 18 G834JYR (2024): NVIDIA GeForce RTX 4090 Laptop GPU, 18.00", 3.1 kg
Zewnętrzna recenzja » Asus ROG Strix Scar 18 G834JYR (2024)
Acer Predator Helios Neo 18 PHN18-71: NVIDIA GeForce RTX 4070 Laptop GPU, 18.00", 3.4 kg
Zewnętrzna recenzja » Acer Predator Helios Neo 18 PHN18-71
Razer Blade 16 2024, RTX 4090: NVIDIA GeForce RTX 4090 Laptop GPU, 16.00", 2.5 kg
Zewnętrzna recenzja » Razer Blade 16 2024, RTX 4090
MSI Vector 17 HX A14VGG: NVIDIA GeForce RTX 4070 Laptop GPU, 17.30", 3 kg
Zewnętrzna recenzja » MSI Vector 17 HX A14VGG
MSI Titan 18 HX A14VIG: NVIDIA GeForce RTX 4090 Laptop GPU, 18.00", 3.6 kg
Zewnętrzna recenzja » MSI Titan 18 HX A14VIG
Acer Predator Helios 18 PH18-72-98MW: NVIDIA GeForce RTX 4090 Laptop GPU, 18.00", 3.3 kg
Zewnętrzna recenzja » Acer Predator Helios 18 PH18-72-98MW
Alienware m18 R2: NVIDIA GeForce RTX 4090 Laptop GPU, 18.00", 4 kg
Zewnętrzna recenzja » Alienware m18 R2
Aorus 17X AZG: NVIDIA GeForce RTX 4090 Laptop GPU, 17.30", 2.8 kg
Zewnętrzna recenzja » Aorus 17X AZG
Schenker Key 17 Pro (M24): NVIDIA GeForce RTX 4090 Laptop GPU, 17.30", 3.4 kg
» Stacja robocza Schenker Key 17 Pro M24: może służyć jako wysokiej klasy laptop do gier, wyposażony w podwójny port Thunderbolt 5