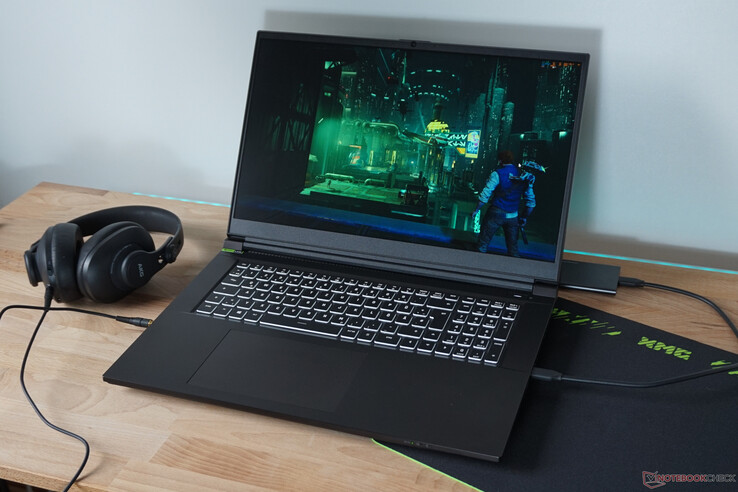
Recenzja Schenker XMG Focus 17 (E23): Laptop do gier z RTX 4070 nie oszczędza na wydajności
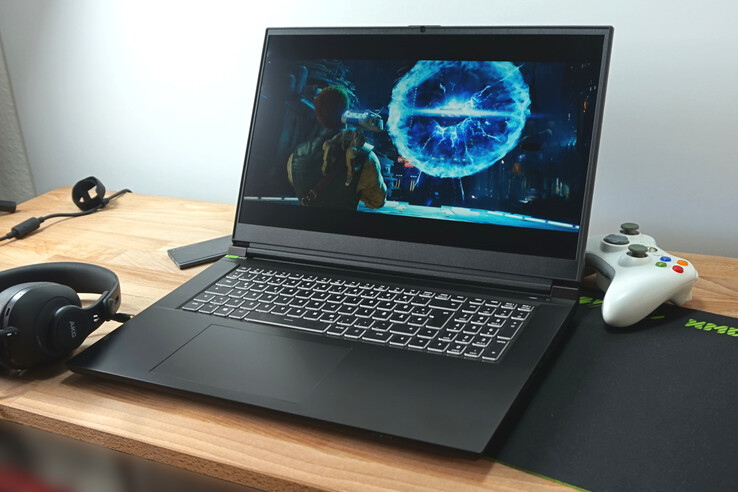
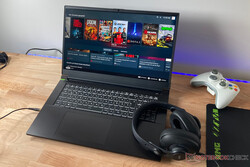
Notebook do gier Schenker XMG Focus 17 E23 (barebone: NP70SNE-G) skupia się na tym, co najważniejsze. Dzięki wyjątkowemu procesor i9 i opcjonalnieRTX 4050, 4060lub 4070wydajność jest wystarczająca do gier. Wyświetlacz oferuje również 240 Hz i wystarczającą ilość pikseli.
Nie ma tu jednak żadnych nadzwyczajnych dodatków, specjalnych funkcji czy najlepszego designu. Obudowa zmieniła się w porównaniu do naszej ostatniej recenzji XMG Focus 17 (Clevo NP70HK)z 2021 roku, więc bardziej szczegółowe informacje na temat obudowy, budowy i wyposażenia można znaleźć w tym artykule. Oprócz wydajności w grach, laptop jest również raczej skromny. W zamian pozostaje znacznie poniżej 2000 euro (w zależności od konfiguracji) i nie jest dużo droższy w topowej konfiguracji, którą testowaliśmy.
Rywale tacy jak Medion Erazer Major X20 lub Lenovo Legion Pro 5 podążają podobnymi ścieżkami i używają porównywalnego sprzętu. Jednak nie oszczędzają tak konsekwentnie jak laptop Schenkera, jak pokazuje nasza szczegółowa aktualizacja testu.
Potencjalni konkurenci w porównaniu
Ocena | Data | Model | Waga | Wysokość | Rozmiar | Rezolucja | Cena |
|---|---|---|---|---|---|---|---|
| 85.9 % v7 (old) | 06/2023 | Schenker XMG Focus 17 (E23) i9-13900HX, GeForce RTX 4070 Laptop GPU | 2.9 kg | 29.3 mm | 17.30" | 2560x1440 | |
| 88.4 % v7 (old) | 05/2023 | Lenovo Legion Pro 5 16ARX8 R7 7745HX, GeForce RTX 4070 Laptop GPU | 2.5 kg | 26.8 mm | 16.00" | 2560x1600 | |
| 89 % v7 (old) | 04/2023 | Medion Erazer Major X20 i9-13900HX, GeForce RTX 4070 Laptop GPU | 2.4 kg | 29 mm | 16.00" | 2560x1600 | |
| 87.6 % v7 (old) | 09/2022 | Schenker XMG Neo 17 M22 R9 6900HX, GeForce RTX 3080 Ti Laptop GPU | 2.8 kg | 27 mm | 17.00" | 2560x1600 | |
| 85.4 % v7 (old) | 03/2023 | HP Omen 17-ck2097ng i9-13900HX, GeForce RTX 4080 Laptop GPU | 2.8 kg | 27 mm | 17.30" | 2560x1440 | |
| 84.6 % v7 (old) | 05/2023 | Medion Erazer Defender P40 i7-13700HX, GeForce RTX 4060 Laptop GPU | 2.9 kg | 33 mm | 17.30" | 2560x1440 |
Sprzęt - wszystko od TB4 do USB 2.0
W porównaniu do poprzednika jest wiele podobieństw w portach, ale na szczęście kilka odświeżeń. Nadal jest port USB 2.0, który powinien wystarczyć do podłączenia myszy lub drukarki. Mini-DP również zostało zachowane.
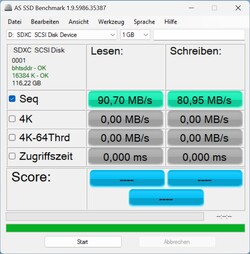
Proste złącze USB-C zostało przeniesione na tył i zapewnia prędkość do 10 Gbit / s, ale ani PD, ani DP nie są obsługiwane. Thunderbolt 4 znajduje się po prawej stronie, ale niestety nie ma już portu USB-A. Ponadto w obecnej wersji slot na karty skurczył się do microSD, co znacznie ogranicza wszechstronność.
Czytnik kart SD
| SD Card Reader | |
| average JPG Copy Test (av. of 3 runs) | |
| Średnia w klasie Gaming (20 - 210, n=71, ostatnie 2 lata) | |
| Medion Erazer Defender P40 (AV PRO microSD 128 GB V60) | |
| Schenker XMG Focus 17 (E23) | |
| Medion Erazer Major X20 (AV PRO microSD 128 GB V60) | |
| HP Omen 17-ck2097ng (AV PRO microSD 128 GB V60) | |
| Schenker XMG Neo 17 M22 (AV PRO microSD 128 GB V60) | |
| maximum AS SSD Seq Read Test (1GB) | |
| Średnia w klasie Gaming (25.5 - 261, n=67, ostatnie 2 lata) | |
| Medion Erazer Defender P40 (AV PRO microSD 128 GB V60) | |
| Schenker XMG Focus 17 (E23) | |
| Medion Erazer Major X20 (AV PRO microSD 128 GB V60) | |
| HP Omen 17-ck2097ng (AV PRO microSD 128 GB V60) | |
Komunikacja
Moduł WLAN Intel AX211 spełnia oczekiwania. Jednak typowe średnie szybkości są osiągane tylko w sieci 6 GHz w naszych pomiarach, a nawet nieznacznie przekraczane. Niewielka słabość przy 5 GHz jest najprawdopodobniej wyjaśniona przez zakłócające wpływy sąsiednich sieci bezprzewodowych, których naturalnie nie mogliśmy dezaktywować w teście.
Konserwacja
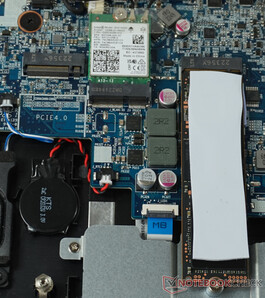
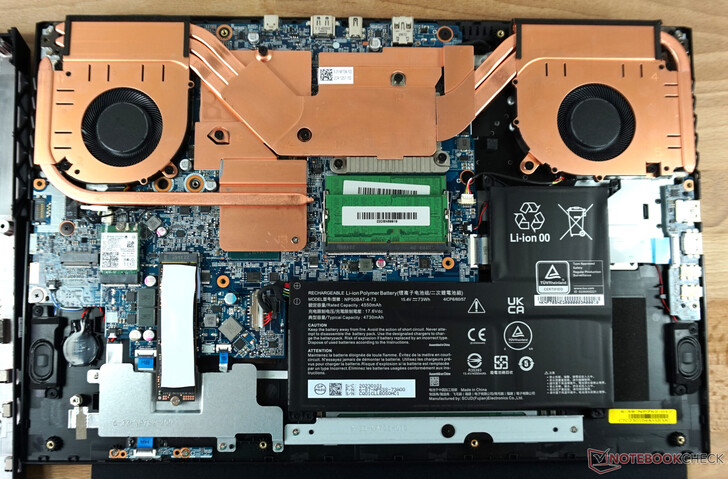
Znaczące zmiany z myślą o XMG Focus 17 od 2021 roku zostały wprowadzone do wnętrza. Wszystkie elementy chłodzące są teraz wykonane z miedzi, a powietrze może wydostawać się na obie strony. Zniknął przestarzały port SATA dla 2,5-calowego dysku SSD. Zamiast tego jest drugie gniazdo na dysk SSD M.2 NVMe.
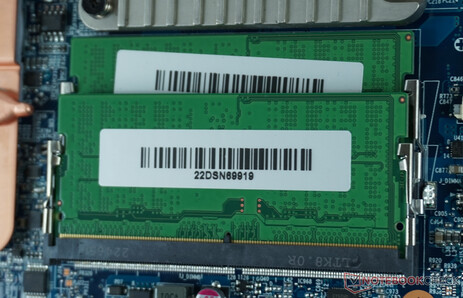
Zgodnie z oczekiwaniami firmy Schenker, dostęp do podzespołów jest łatwy. Po odkręceniu dwunastu identycznych śrub, spód można zdjąć przy niewielkim wysiłku, zaczynając od tylnego chłodzenia. Pamięć RAM, dysk SSD, moduł WLAN i bateria są łatwo dostępne i można je wymienić.
Wyświetlacz - mocne kolory, skromne kontrasty w notebooku do gier XMG
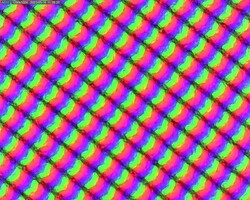
Matowy panel IPS w XMG Focus 17 spełnia oczekiwania solidnego, ale nie wybitnego notebooka do gier. Rozdzielczość QHD daje o sobie znać na dużej przekątnej 17,3 cala/ Ponadto częstotliwość odświeżania 240 Hz zapewnia niskie opóźnienia, nawet gdy liczba klatek na sekundę nie jest osiągana w grach.
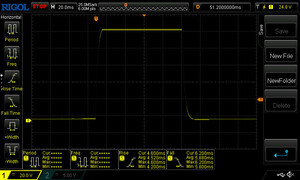
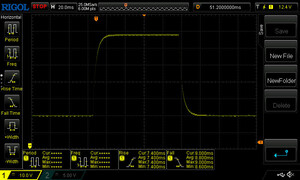
Nie do końca przekonujące są czasy reakcji, które nie są optymalne przy ponad 10 ms, ale akceptowalne. Słaby poziom czerni uniemożliwia uzyskanie lepszego kontrastu. Szara mgiełka jest widoczna w bardzo ciemnych scenach przy minimalnym oświetleniu w pomieszczeniu. Przy zmierzonym przez nas współczynniku 623:1 kontrast jest tylko o połowę niższy niż w przypadku Medion Erazer Defender P40 lub HP Omen 17-ck. Krwawienie ekranu jest również wyraźnie widoczne.
Podświetlenie mogłoby być nieco bardziej równomierne, a jasność 320 cd/m² nieco wyższa. Tak więc wskaźniki wyświetlania są poniżej średniej w porównaniu do wielu podobnie wycenionych modeli.
| |||||||||||||||||||||||||
rozświetlenie: 82 %
na akumulatorze: 349 cd/m²
kontrast: 623:1 (czerń: 0.56 cd/m²)
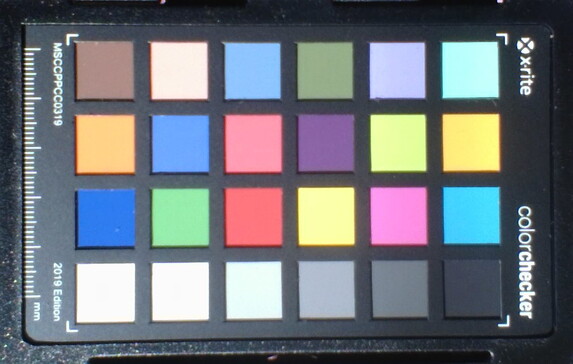
ΔE ColorChecker Calman: 1.08 | ∀{0.5-29.43 Ø4.77}
calibrated: 1.08
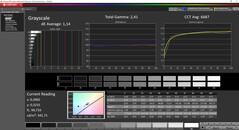
ΔE Greyscale Calman: 1.14 | ∀{0.09-98 Ø5}
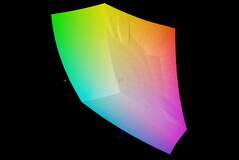
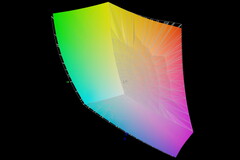
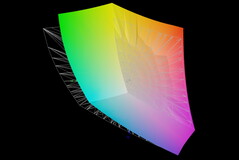
84.5% AdobeRGB 1998 (Argyll 3D)
99.9% sRGB (Argyll 3D)
96.6% Display P3 (Argyll 3D)
Gamma: 2.41
CCT: 6687 K
| Schenker XMG Focus 17 (E23) BOE09F9 NE173QHM-NZ1, IPS, 2560x1440, 17.3" | Lenovo Legion Pro 5 16ARX8 CSOT T3 MNG007DA1-Q, IPS, 2560x1600, 16" | Medion Erazer Major X20 BOE CQ NE160QDM-NZ1, IPS, 2560x1600, 16" | Schenker XMG Neo 17 M22 BOE0A99, IPS, 2560x1600, 17" | HP Omen 17-ck2097ng BOE BOE09BF, IPS, 2560x1440, 17.3" | Medion Erazer Defender P40 BOE CQ NE173QHM-NZ3, IPS, 2560x1440, 17.3" | |
|---|---|---|---|---|---|---|
| Display | -14% | -15% | -16% | -17% | -16% | |
| Display P3 Coverage (%) | 96.6 | 70.4 -27% | 69.4 -28% | 69 -29% | 67.4 -30% | 68.3 -29% |
| sRGB Coverage (%) | 99.9 | 99.6 0% | 98 -2% | 99.8 0% | 97.6 -2% | 98.1 -2% |
| AdobeRGB 1998 Coverage (%) | 84.5 | 72.6 -14% | 70.9 -16% | 69.6 -18% | 69.6 -18% | 69.8 -17% |
| Response Times | 37% | 26% | 39% | 12% | 15% | |
| Response Time Grey 50% / Grey 80% * (ms) | 16.4 ? | 7 ? 57% | 13.1 ? 20% | 10.8 ? 34% | 15.6 ? 5% | 14.6 ? 11% |
| Response Time Black / White * (ms) | 10.8 ? | 9.1 ? 16% | 7.3 ? 32% | 6.1 ? 44% | 8.9 ? 18% | 8.7 ? 19% |
| PWM Frequency (Hz) | ||||||
| Screen | 21% | -23% | 9% | -7% | 11% | |
| Brightness middle (cd/m²) | 349 | 355.3 2% | 374 7% | 415 19% | 371 6% | 364 4% |
| Brightness (cd/m²) | 318 | 340 7% | 357 12% | 399 25% | 350 10% | 343 8% |
| Brightness Distribution (%) | 82 | 91 11% | 92 12% | 90 10% | 90 10% | 86 5% |
| Black Level * (cd/m²) | 0.56 | 0.32 43% | 0.33 41% | 0.43 23% | 0.32 43% | 0.28 50% |
| Contrast (:1) | 623 | 1110 78% | 1133 82% | 965 55% | 1159 86% | 1300 109% |
| Colorchecker dE 2000 * | 1.08 | 1.13 -5% | 2.43 -125% | 1.44 -33% | 1.74 -61% | 1.67 -55% |
| Colorchecker dE 2000 max. * | 3.05 | 2.78 9% | 3.97 -30% | 2.33 24% | 3.59 -18% | 2.78 9% |
| Colorchecker dE 2000 calibrated * | 1.08 | 0.32 70% | 1.4 -30% | 0.89 18% | 1.01 6% | 1.14 -6% |
| Greyscale dE 2000 * | 1.14 | 1.4 -23% | 3.1 -172% | 1.8 -58% | 2.8 -146% | 1.4 -23% |
| Gamma | 2.41 91% | 2.24 98% | 2.191 100% | 2.132 103% | 2.19 100% | 2.091 105% |
| CCT | 6687 97% | 6372 102% | 6194 105% | 6327 103% | 6474 100% | 6568 99% |
| Całkowita średnia (program / ustawienia) | 15% /
16% | -4% /
-14% | 11% /
8% | -4% /
-7% | 3% /
6% |
* ... im mniej tym lepiej
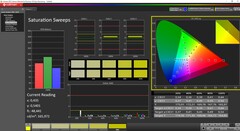
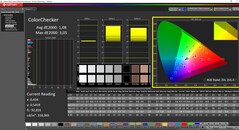
Niskie odchylenia kolorów zmierzone bez wcześniejszej kalibracji są niezwykłe. Nawet maksymalna określona wartość DeltaE wynosząca nieco poniżej 3 oznacza, że gołym okiem nie można wykryć żadnych różnic. Dzięki temu wyświetlacz nie musi być później dostosowywany do optymalnego wyświetlania.
Wyświetl czasy reakcji
| ↔ Czas reakcji od czerni do bieli | ||
|---|---|---|
| 10.8 ms ... wzrost ↗ i spadek ↘ łącznie | ↗ 4.6 ms wzrost | |
| ↘ 6.2 ms upadek | ||
| W naszych testach ekran wykazuje dobry współczynnik reakcji, ale może być zbyt wolny dla graczy rywalizujących ze sobą. Dla porównania, wszystkie testowane urządzenia wahają się od 0.1 (minimum) do 240 (maksimum) ms. » 28 % wszystkich urządzeń jest lepszych. Oznacza to, że zmierzony czas reakcji jest lepszy od średniej wszystkich testowanych urządzeń (20.2 ms). | ||
| ↔ Czas reakcji 50% szarości do 80% szarości | ||
| 16.4 ms ... wzrost ↗ i spadek ↘ łącznie | ↗ 7.4 ms wzrost | |
| ↘ 9 ms upadek | ||
| W naszych testach ekran wykazuje dobry współczynnik reakcji, ale może być zbyt wolny dla graczy rywalizujących ze sobą. Dla porównania, wszystkie testowane urządzenia wahają się od 0.165 (minimum) do 636 (maksimum) ms. » 29 % wszystkich urządzeń jest lepszych. Oznacza to, że zmierzony czas reakcji jest lepszy od średniej wszystkich testowanych urządzeń (31.6 ms). | ||
Migotanie ekranu / PWM (modulacja szerokości impulsu)
| Migotanie ekranu/nie wykryto PWM | |||
Dla porównania: 53 % wszystkich testowanych urządzeń nie używa PWM do przyciemniania wyświetlacza. Jeśli wykryto PWM, zmierzono średnio 8081 (minimum: 5 - maksimum: 343500) Hz. | |||
Wydajność - solidna rozgrywka z Focus 17
Szczególnie mocne Nvidia Geforce RTX 4070 determinuje możliwości zastosowania Focusa 17 E23. Procesor graficzny oferuje dużą wydajność w połączeniu z wystarczającą ilością pamięci VRAM dla obecnych tytułów, które w większości można odtwarzać w natywnej rozdzielczości QHD i prawie wszystkich szczegółach. Powinno to również dotyczyć nadchodzących gier w najbliższej przyszłości.
Jednocześnie gwarantowana jest dobra prędkość pracy dzięki procesorowi Intel Core i9-13900HX. Złożone aplikacje mogą być przetwarzane szybko. Wielozadaniowość nie stanowi problemu nawet w wysokim stopniu. Wydajność procesora jest jednak co najwyżej drugorzędna w notebooku do gier.
Warunki testowe
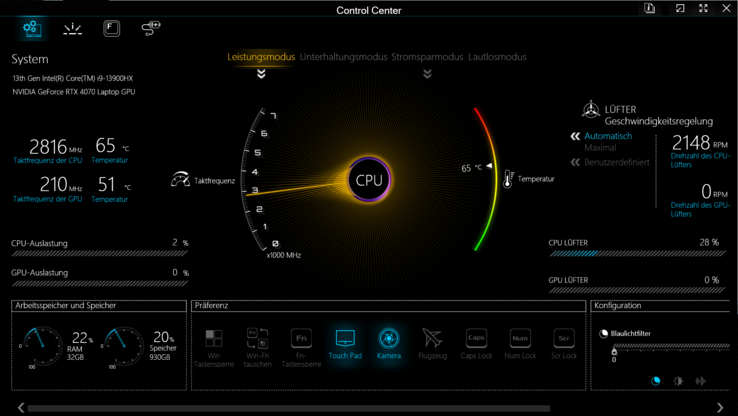
Cztery predefiniowane tryby wydajności można wybrać w preinstalowanym ControlCenter. Do naszych testów i benchmarków zawsze używaliśmy "Trybu wydajności", który zapewnia najwyższe prędkości wentylatorów i maksymalne zasilanie GPU i CPU.
W "Trybie Rozrywki" wartości są minimalnie niższe. Tylko wydajność procesora jest tutaj nieznacznie zmniejszona, więc trudno oczekiwać zauważalnego wpływu na gry. z drugiej strony "Tryb cichy" znacznie ogranicza wydajność systemu, ale rozwój hałasu zanika w tle, nawet jeśli nie znika całkowicie. Mniej wymagające gry pozostają grywalne nawet w tym trybie. Między innymi Witcher 3 osiąga ponad 60 klatek na sekundę na najwyższych ustawieniach i w rozdzielczości Full HD.
"Tryb oszczędzania energii" całkowicie wyłącza dedykowany układ graficzny i jest, zgodnie z obecnym stanem rzeczy, obowiązkowy do osiągnięcia w połowie akceptowalnego czasu pracy na baterii, przynajmniej w testowanym przez nas systemie.
Procesor
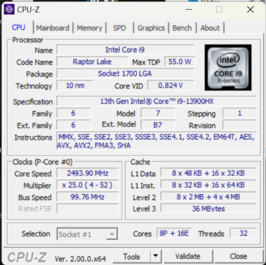
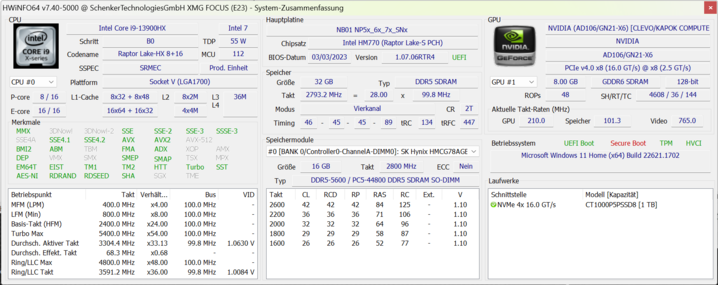
Wskazują na to 32 wątki i 36 MB pamięci podręcznej trzeciego poziomu, a także maksymalna częstotliwość taktowania wynosząca 5,4 GHz: The Intel Core i9-13900HX jest obecnie jednym z najlepszych procesorów mobilnych. Jest optymalnie wykorzystywany do wielozadaniowości i intensywnych obliczeniowo aplikacji i pozostawia poprzednika Intel Core i9-12900HX lub AMD Ryzen 7 7745HX w tyle.
W XMG Focus 17 procesor otrzymuje do 162 W przez ułamki sekund. Co najmniej 135 W można podawać przez pół minuty. Niestety, chłodzenie nie jest w stanie poradzić sobie z wysokim wydzielaniem ciepła. W Medion Erazer Major X20 identyczny procesor pozostaje stabilny przy maksymalnej wydajności. W Focusie 17 wydajność spada o ponad 20% w teście Cinebench R15. Jednak i9 w HP Omen 17-ck2097ng traci nawet 30%, więc ogólne zachowanie wydaje się akceptowalne.
Fakt, że procesor jest nieco przewymiarowany, staje się widoczny, gdy spojrzymy na "Tryb rozrywki". Tutaj również wentylator pozostaje głośny, chociaż moc zasilacza została obniżona ze 135 W do 55 W. Jednocześnie nie mierzymy żadnego poważnego spadku wydajności, zwłaszcza w grach. Wynika to z faktu, że procesor może działać wystarczająco stabilnie tylko przy takim zużyciu energii na dłuższą metę. W związku z tym tryb zasilania ma wpływ tylko podczas krótkotrwałych obciążeń.
W trybie cichym i energooszczędnym przyznawane jest tylko 15 W, a w trybie krótkotrwałym 30 W.
Więcej pomiarów, danych porównawczych i informacji można znaleźć w naszym Lista porównawcza procesorów.
Cinebench R15 Multi loop
Cinebench R23: Multi Core | Single Core
Cinebench R20: CPU (Multi Core) | CPU (Single Core)
Cinebench R15: CPU Multi 64Bit | CPU Single 64Bit
Blender: v2.79 BMW27 CPU
7-Zip 18.03: 7z b 4 | 7z b 4 -mmt1
Geekbench 5.5: Multi-Core | Single-Core
HWBOT x265 Benchmark v2.2: 4k Preset
LibreOffice : 20 Documents To PDF
R Benchmark 2.5: Overall mean
| CPU Performance rating | |
| Przeciętny Intel Core i9-13900HX | |
| Medion Erazer Major X20 | |
| HP Omen 17-ck2097ng | |
| Schenker XMG Focus 17 (E23) | |
| Średnia w klasie Gaming | |
| MSI Titan GT77 12UHS | |
| Lenovo Legion Pro 5 16ARX8 | |
| Medion Erazer Defender P40 | |
| Schenker XMG Neo 17 M22 | |
| Cinebench R23 / Multi Core | |
| Przeciętny Intel Core i9-13900HX (24270 - 32623, n=23) | |
| Medion Erazer Major X20 | |
| Schenker XMG Focus 17 (E23) | |
| HP Omen 17-ck2097ng | |
| Średnia w klasie Gaming (5668 - 40970, n=148, ostatnie 2 lata) | |
| MSI Titan GT77 12UHS | |
| Medion Erazer Defender P40 | |
| Lenovo Legion Pro 5 16ARX8 | |
| Schenker XMG Neo 17 M22 | |
| Cinebench R23 / Single Core | |
| HP Omen 17-ck2097ng | |
| Przeciętny Intel Core i9-13900HX (1867 - 2105, n=20) | |
| Medion Erazer Major X20 | |
| Schenker XMG Focus 17 (E23) | |
| Średnia w klasie Gaming (1136 - 2267, n=148, ostatnie 2 lata) | |
| MSI Titan GT77 12UHS | |
| Lenovo Legion Pro 5 16ARX8 | |
| Medion Erazer Defender P40 | |
| Schenker XMG Neo 17 M22 | |
| Cinebench R20 / CPU (Multi Core) | |
| Przeciętny Intel Core i9-13900HX (9152 - 12541, n=21) | |
| Medion Erazer Major X20 | |
| Schenker XMG Focus 17 (E23) | |
| HP Omen 17-ck2097ng | |
| Średnia w klasie Gaming (2179 - 16108, n=147, ostatnie 2 lata) | |
| MSI Titan GT77 12UHS | |
| Medion Erazer Defender P40 | |
| Lenovo Legion Pro 5 16ARX8 | |
| Schenker XMG Neo 17 M22 | |
| Cinebench R20 / CPU (Single Core) | |
| HP Omen 17-ck2097ng | |
| Przeciętny Intel Core i9-13900HX (722 - 810, n=21) | |
| Medion Erazer Major X20 | |
| Schenker XMG Focus 17 (E23) | |
| Średnia w klasie Gaming (439 - 870, n=147, ostatnie 2 lata) | |
| MSI Titan GT77 12UHS | |
| Lenovo Legion Pro 5 16ARX8 | |
| Medion Erazer Defender P40 | |
| Schenker XMG Neo 17 M22 | |
| Cinebench R15 / CPU Multi 64Bit | |
| Przeciętny Intel Core i9-13900HX (3913 - 4970, n=22) | |
| Schenker XMG Focus 17 (E23) | |
| Medion Erazer Major X20 | |
| HP Omen 17-ck2097ng | |
| Średnia w klasie Gaming (1537 - 6271, n=147, ostatnie 2 lata) | |
| MSI Titan GT77 12UHS | |
| Medion Erazer Defender P40 | |
| Lenovo Legion Pro 5 16ARX8 | |
| Schenker XMG Neo 17 M22 | |
| Cinebench R15 / CPU Single 64Bit | |
| HP Omen 17-ck2097ng | |
| Medion Erazer Major X20 | |
| Lenovo Legion Pro 5 16ARX8 | |
| Średnia w klasie Gaming (188.8 - 343, n=146, ostatnie 2 lata) | |
| Przeciętny Intel Core i9-13900HX (247 - 304, n=22) | |
| Schenker XMG Focus 17 (E23) | |
| MSI Titan GT77 12UHS | |
| Schenker XMG Neo 17 M22 | |
| Medion Erazer Defender P40 | |
| Blender / v2.79 BMW27 CPU | |
| Schenker XMG Neo 17 M22 | |
| Medion Erazer Defender P40 | |
| Lenovo Legion Pro 5 16ARX8 | |
| Średnia w klasie Gaming (80 - 517, n=143, ostatnie 2 lata) | |
| HP Omen 17-ck2097ng | |
| MSI Titan GT77 12UHS | |
| Schenker XMG Focus 17 (E23) | |
| Przeciętny Intel Core i9-13900HX (101 - 153, n=22) | |
| Medion Erazer Major X20 | |
| 7-Zip 18.03 / 7z b 4 | |
| Medion Erazer Major X20 | |
| Przeciętny Intel Core i9-13900HX (90675 - 127283, n=21) | |
| Schenker XMG Focus 17 (E23) | |
| HP Omen 17-ck2097ng | |
| Średnia w klasie Gaming (23795 - 148086, n=145, ostatnie 2 lata) | |
| MSI Titan GT77 12UHS | |
| Lenovo Legion Pro 5 16ARX8 | |
| Medion Erazer Defender P40 | |
| Schenker XMG Neo 17 M22 | |
| 7-Zip 18.03 / 7z b 4 -mmt1 | |
| Lenovo Legion Pro 5 16ARX8 | |
| HP Omen 17-ck2097ng | |
| Medion Erazer Major X20 | |
| Przeciętny Intel Core i9-13900HX (6340 - 7177, n=21) | |
| Schenker XMG Focus 17 (E23) | |
| Średnia w klasie Gaming (4199 - 7508, n=145, ostatnie 2 lata) | |
| MSI Titan GT77 12UHS | |
| Schenker XMG Neo 17 M22 | |
| Medion Erazer Defender P40 | |
| Geekbench 5.5 / Multi-Core | |
| HP Omen 17-ck2097ng | |
| Przeciętny Intel Core i9-13900HX (17614 - 21075, n=22) | |
| Medion Erazer Major X20 | |
| Schenker XMG Focus 17 (E23) | |
| Średnia w klasie Gaming (4557 - 27010, n=144, ostatnie 2 lata) | |
| MSI Titan GT77 12UHS | |
| Medion Erazer Defender P40 | |
| Lenovo Legion Pro 5 16ARX8 | |
| Schenker XMG Neo 17 M22 | |
| Geekbench 5.5 / Single-Core | |
| HP Omen 17-ck2097ng | |
| Lenovo Legion Pro 5 16ARX8 | |
| Medion Erazer Major X20 | |
| Średnia w klasie Gaming (986 - 2423, n=144, ostatnie 2 lata) | |
| Przeciętny Intel Core i9-13900HX (1345 - 2093, n=22) | |
| Schenker XMG Focus 17 (E23) | |
| MSI Titan GT77 12UHS | |
| Medion Erazer Defender P40 | |
| Schenker XMG Neo 17 M22 | |
| HWBOT x265 Benchmark v2.2 / 4k Preset | |
| Przeciętny Intel Core i9-13900HX (23.5 - 34.4, n=22) | |
| Medion Erazer Major X20 | |
| Schenker XMG Focus 17 (E23) | |
| Średnia w klasie Gaming (7.7 - 44.3, n=145, ostatnie 2 lata) | |
| MSI Titan GT77 12UHS | |
| HP Omen 17-ck2097ng | |
| Lenovo Legion Pro 5 16ARX8 | |
| Medion Erazer Defender P40 | |
| Schenker XMG Neo 17 M22 | |
| LibreOffice / 20 Documents To PDF | |
| Schenker XMG Neo 17 M22 | |
| Schenker XMG Focus 17 (E23) | |
| Medion Erazer Defender P40 | |
| Średnia w klasie Gaming (19 - 88.8, n=144, ostatnie 2 lata) | |
| HP Omen 17-ck2097ng | |
| Przeciętny Intel Core i9-13900HX (32.8 - 51.1, n=21) | |
| Medion Erazer Major X20 | |
| MSI Titan GT77 12UHS | |
| Lenovo Legion Pro 5 16ARX8 | |
| R Benchmark 2.5 / Overall mean | |
| Medion Erazer Defender P40 | |
| Schenker XMG Neo 17 M22 | |
| Średnia w klasie Gaming (0.3551 - 0.759, n=146, ostatnie 2 lata) | |
| Schenker XMG Focus 17 (E23) | |
| Lenovo Legion Pro 5 16ARX8 | |
| MSI Titan GT77 12UHS | |
| Przeciętny Intel Core i9-13900HX (0.375 - 0.4564, n=22) | |
| Medion Erazer Major X20 | |
| HP Omen 17-ck2097ng | |
* ... im mniej tym lepiej
AIDA64: FP32 Ray-Trace | FPU Julia | CPU SHA3 | CPU Queen | FPU SinJulia | FPU Mandel | CPU AES | CPU ZLib | FP64 Ray-Trace | CPU PhotoWorxx
| Performance rating | |
| Przeciętny Intel Core i9-13900HX | |
| Medion Erazer Major X20 | |
| Średnia w klasie Gaming | |
| Schenker XMG Focus 17 (E23) | |
| Lenovo Legion Pro 5 16ARX8 | |
| HP Omen 17-ck2097ng | |
| Schenker XMG Neo 17 M22 | |
| Medion Erazer Defender P40 | |
| AIDA64 / FP32 Ray-Trace | |
| Lenovo Legion Pro 5 16ARX8 | |
| Średnia w klasie Gaming (7192 - 85542, n=144, ostatnie 2 lata) | |
| Medion Erazer Major X20 | |
| Przeciętny Intel Core i9-13900HX (17589 - 27615, n=22) | |
| Schenker XMG Focus 17 (E23) | |
| HP Omen 17-ck2097ng | |
| Schenker XMG Neo 17 M22 | |
| Medion Erazer Defender P40 | |
| AIDA64 / FPU Julia | |
| Średnia w klasie Gaming (35040 - 238426, n=144, ostatnie 2 lata) | |
| Medion Erazer Major X20 | |
| Przeciętny Intel Core i9-13900HX (88686 - 137015, n=22) | |
| Lenovo Legion Pro 5 16ARX8 | |
| Schenker XMG Focus 17 (E23) | |
| Schenker XMG Neo 17 M22 | |
| HP Omen 17-ck2097ng | |
| Medion Erazer Defender P40 | |
| AIDA64 / CPU SHA3 | |
| Medion Erazer Major X20 | |
| Przeciętny Intel Core i9-13900HX (4362 - 7029, n=22) | |
| Średnia w klasie Gaming (1728 - 9817, n=144, ostatnie 2 lata) | |
| Schenker XMG Focus 17 (E23) | |
| Lenovo Legion Pro 5 16ARX8 | |
| HP Omen 17-ck2097ng | |
| Schenker XMG Neo 17 M22 | |
| Medion Erazer Defender P40 | |
| AIDA64 / CPU Queen | |
| Schenker XMG Focus 17 (E23) | |
| HP Omen 17-ck2097ng | |
| Medion Erazer Major X20 | |
| Przeciętny Intel Core i9-13900HX (125644 - 141385, n=22) | |
| Lenovo Legion Pro 5 16ARX8 | |
| Średnia w klasie Gaming (49785 - 173351, n=144, ostatnie 2 lata) | |
| Medion Erazer Defender P40 | |
| Schenker XMG Neo 17 M22 | |
| AIDA64 / FPU SinJulia | |
| Lenovo Legion Pro 5 16ARX8 | |
| Medion Erazer Major X20 | |
| Przeciętny Intel Core i9-13900HX (12334 - 17179, n=22) | |
| Średnia w klasie Gaming (4424 - 33636, n=144, ostatnie 2 lata) | |
| Schenker XMG Focus 17 (E23) | |
| Schenker XMG Neo 17 M22 | |
| HP Omen 17-ck2097ng | |
| Medion Erazer Defender P40 | |
| AIDA64 / FPU Mandel | |
| Średnia w klasie Gaming (17585 - 128721, n=144, ostatnie 2 lata) | |
| Lenovo Legion Pro 5 16ARX8 | |
| Medion Erazer Major X20 | |
| Przeciętny Intel Core i9-13900HX (43850 - 69202, n=22) | |
| Schenker XMG Neo 17 M22 | |
| Schenker XMG Focus 17 (E23) | |
| HP Omen 17-ck2097ng | |
| Medion Erazer Defender P40 | |
| AIDA64 / CPU AES | |
| Przeciętny Intel Core i9-13900HX (89413 - 237881, n=22) | |
| Schenker XMG Neo 17 M22 | |
| Medion Erazer Major X20 | |
| Średnia w klasie Gaming (19065 - 247074, n=144, ostatnie 2 lata) | |
| Schenker XMG Focus 17 (E23) | |
| HP Omen 17-ck2097ng | |
| Medion Erazer Defender P40 | |
| Lenovo Legion Pro 5 16ARX8 | |
| AIDA64 / CPU ZLib | |
| Medion Erazer Major X20 | |
| Przeciętny Intel Core i9-13900HX (1284 - 1958, n=22) | |
| Schenker XMG Focus 17 (E23) | |
| Średnia w klasie Gaming (373 - 2531, n=144, ostatnie 2 lata) | |
| HP Omen 17-ck2097ng | |
| Lenovo Legion Pro 5 16ARX8 | |
| Medion Erazer Defender P40 | |
| Schenker XMG Neo 17 M22 | |
| AIDA64 / FP64 Ray-Trace | |
| Lenovo Legion Pro 5 16ARX8 | |
| Średnia w klasie Gaming (3856 - 45446, n=144, ostatnie 2 lata) | |
| Medion Erazer Major X20 | |
| Przeciętny Intel Core i9-13900HX (9481 - 15279, n=22) | |
| Schenker XMG Focus 17 (E23) | |
| HP Omen 17-ck2097ng | |
| Schenker XMG Neo 17 M22 | |
| Medion Erazer Defender P40 | |
| AIDA64 / CPU PhotoWorxx | |
| HP Omen 17-ck2097ng | |
| Schenker XMG Focus 17 (E23) | |
| Przeciętny Intel Core i9-13900HX (42994 - 51994, n=22) | |
| Średnia w klasie Gaming (10805 - 62916, n=144, ostatnie 2 lata) | |
| Medion Erazer Major X20 | |
| Medion Erazer Defender P40 | |
| Schenker XMG Neo 17 M22 | |
| Lenovo Legion Pro 5 16ARX8 | |
Wydajność systemu
Wiele rdzeni procesora, dużo pamięci RAM o szybkim dostępie i szybki dysk SSD napędzają system w każdej sytuacji. Nawet gra wstrzymana w tle spowalnia tylko nieznacznie. Od rozległej wielozadaniowości z otwartym oprogramowaniem do edycji wideo po niezliczone karty przeglądarki, prawie nic nie sprawia Focusowi 17 poważnych problemów.
Chociaż jest stosunkowo daleko w tyle w dziedzinie rywali z podobnym sprzętem, to jednak osiąga więcej niż solidną ocenę, która obiecuje więcej niż wystarczającą wydajność do wymagających zadań.
CrossMark: Overall | Productivity | Creativity | Responsiveness
| PCMark 10 / Score | |
| Lenovo Legion Pro 5 16ARX8 | |
| Średnia w klasie Gaming (5776 - 9667, n=123, ostatnie 2 lata) | |
| HP Omen 17-ck2097ng | |
| Medion Erazer Major X20 | |
| Przeciętny Intel Core i9-13900HX, NVIDIA GeForce RTX 4070 Laptop GPU (6956 - 8153, n=3) | |
| Schenker XMG Neo 17 M22 | |
| Schenker XMG Focus 17 (E23) | |
| Medion Erazer Defender P40 | |
| PCMark 10 / Essentials | |
| HP Omen 17-ck2097ng | |
| Medion Erazer Major X20 | |
| Lenovo Legion Pro 5 16ARX8 | |
| Przeciętny Intel Core i9-13900HX, NVIDIA GeForce RTX 4070 Laptop GPU (9865 - 11653, n=3) | |
| Średnia w klasie Gaming (8810 - 12600, n=127, ostatnie 2 lata) | |
| Schenker XMG Focus 17 (E23) | |
| Medion Erazer Defender P40 | |
| Schenker XMG Neo 17 M22 | |
| PCMark 10 / Productivity | |
| Lenovo Legion Pro 5 16ARX8 | |
| HP Omen 17-ck2097ng | |
| Średnia w klasie Gaming (6662 - 16716, n=123, ostatnie 2 lata) | |
| Medion Erazer Major X20 | |
| Medion Erazer Defender P40 | |
| Przeciętny Intel Core i9-13900HX, NVIDIA GeForce RTX 4070 Laptop GPU (9470 - 9850, n=3) | |
| Schenker XMG Neo 17 M22 | |
| Schenker XMG Focus 17 (E23) | |
| PCMark 10 / Digital Content Creation | |
| Średnia w klasie Gaming (7440 - 19351, n=123, ostatnie 2 lata) | |
| Lenovo Legion Pro 5 16ARX8 | |
| Przeciętny Intel Core i9-13900HX, NVIDIA GeForce RTX 4070 Laptop GPU (9776 - 13370, n=3) | |
| Medion Erazer Major X20 | |
| HP Omen 17-ck2097ng | |
| Schenker XMG Neo 17 M22 | |
| Schenker XMG Focus 17 (E23) | |
| Medion Erazer Defender P40 | |
| CrossMark / Overall | |
| Schenker XMG Focus 17 (E23) | |
| Lenovo Legion Pro 5 16ARX8 | |
| HP Omen 17-ck2097ng | |
| Średnia w klasie Gaming (1247 - 2344, n=119, ostatnie 2 lata) | |
| Przeciętny Intel Core i9-13900HX, NVIDIA GeForce RTX 4070 Laptop GPU (1842 - 2029, n=3) | |
| Medion Erazer Major X20 | |
| Medion Erazer Defender P40 | |
| Schenker XMG Neo 17 M22 | |
| CrossMark / Productivity | |
| Lenovo Legion Pro 5 16ARX8 | |
| Schenker XMG Focus 17 (E23) | |
| Średnia w klasie Gaming (1299 - 2211, n=119, ostatnie 2 lata) | |
| HP Omen 17-ck2097ng | |
| Przeciętny Intel Core i9-13900HX, NVIDIA GeForce RTX 4070 Laptop GPU (1700 - 1872, n=3) | |
| Medion Erazer Major X20 | |
| Schenker XMG Neo 17 M22 | |
| Medion Erazer Defender P40 | |
| CrossMark / Creativity | |
| Schenker XMG Focus 17 (E23) | |
| HP Omen 17-ck2097ng | |
| Przeciętny Intel Core i9-13900HX, NVIDIA GeForce RTX 4070 Laptop GPU (2088 - 2316, n=3) | |
| Lenovo Legion Pro 5 16ARX8 | |
| Średnia w klasie Gaming (1275 - 2729, n=119, ostatnie 2 lata) | |
| Medion Erazer Major X20 | |
| Medion Erazer Defender P40 | |
| Schenker XMG Neo 17 M22 | |
| CrossMark / Responsiveness | |
| HP Omen 17-ck2097ng | |
| Lenovo Legion Pro 5 16ARX8 | |
| Schenker XMG Focus 17 (E23) | |
| Średnia w klasie Gaming (1030 - 2330, n=119, ostatnie 2 lata) | |
| Przeciętny Intel Core i9-13900HX, NVIDIA GeForce RTX 4070 Laptop GPU (1557 - 1752, n=3) | |
| Medion Erazer Major X20 | |
| Medion Erazer Defender P40 | |
| Schenker XMG Neo 17 M22 | |
| PCMark 10 Score | 6956 pkt. | |
Pomoc | ||
| AIDA64 / Memory Copy | |
| HP Omen 17-ck2097ng | |
| Schenker XMG Focus 17 (E23) | |
| Przeciętny Intel Core i9-13900HX (67716 - 79193, n=22) | |
| Średnia w klasie Gaming (21750 - 108104, n=144, ostatnie 2 lata) | |
| Medion Erazer Major X20 | |
| Medion Erazer Defender P40 | |
| Schenker XMG Neo 17 M22 | |
| Lenovo Legion Pro 5 16ARX8 | |
| AIDA64 / Memory Read | |
| HP Omen 17-ck2097ng | |
| Schenker XMG Focus 17 (E23) | |
| Przeciętny Intel Core i9-13900HX (73998 - 88462, n=22) | |
| Średnia w klasie Gaming (22956 - 104349, n=144, ostatnie 2 lata) | |
| Medion Erazer Major X20 | |
| Medion Erazer Defender P40 | |
| Schenker XMG Neo 17 M22 | |
| Lenovo Legion Pro 5 16ARX8 | |
| AIDA64 / Memory Write | |
| HP Omen 17-ck2097ng | |
| Schenker XMG Focus 17 (E23) | |
| Średnia w klasie Gaming (22297 - 133486, n=144, ostatnie 2 lata) | |
| Przeciętny Intel Core i9-13900HX (65472 - 77045, n=22) | |
| Medion Erazer Major X20 | |
| Medion Erazer Defender P40 | |
| Schenker XMG Neo 17 M22 | |
| Lenovo Legion Pro 5 16ARX8 | |
| AIDA64 / Memory Latency | |
| Średnia w klasie Gaming (59.5 - 259, n=144, ostatnie 2 lata) | |
| Medion Erazer Defender P40 | |
| Schenker XMG Focus 17 (E23) | |
| Schenker XMG Neo 17 M22 | |
| Medion Erazer Major X20 | |
| Lenovo Legion Pro 5 16ARX8 | |
| Przeciętny Intel Core i9-13900HX (75.3 - 91.1, n=22) | |
| HP Omen 17-ck2097ng | |
* ... im mniej tym lepiej
Opóźnienia DPC
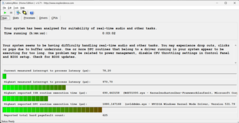
Inne notebooki dla graczy z tym samym procesorem radzą sobie znacznie gorzej niż XMG Focus 17. Nie osiąga optymalnego wyniku, ale powinien działać zadowalająco w większości zadań, w których wymagany jest płynny proces. Może być nawet lepiej, ale dla większości użytkowników powinno mieć to drugorzędne znaczenie.
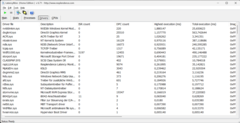
Największe problemy sprawia sterownik karty graficznej od Nvidii, który miejmy nadzieję zostanie poprawiony poprzez aktualizację w przyszłości. Na pochwałę i bynajmniej nie normę zasługuje również płynne odtwarzanie wideo w 4K bez spadków klatek. Tak więc obecna kompilacja i sprzęt sterownika wydają się harmonizować.
| DPC Latencies / LatencyMon - interrupt to process latency (max), Web, Youtube, Prime95 | |
| Schenker XMG Neo 17 M22 | |
| Medion Erazer Defender P40 | |
| HP Omen 17-ck2097ng | |
| Medion Erazer Major X20 | |
| Schenker XMG Focus 17 (E23) | |
| Lenovo Legion Pro 5 16ARX8 | |
* ... im mniej tym lepiej
Pamięć masowa
Zainstalowany dysk SSD M.2 Crucial P5 Plus nie jest modelem klasy premium. Osiąga jednak dobre prędkości transferu za pośrednictwem PCIe 4.0 i pozostaje bardzo stabilny w teście długoterminowym, co wynika z dodatkowego chłodzenia w płycie bazowej laptopa do gier.
W związku z tym nie należy oczekiwać od pamięci masowej żadnych przeszkód ani opóźnień podczas ładowania, wykonywania programów itp.
* ... im mniej tym lepiej
Continuous reading: DiskSpd Read Loop, Queue Depth 8
Karta graficzna
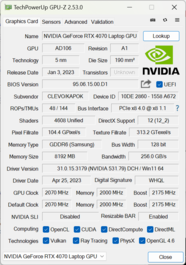
Tylko kilka procesorów graficznych jest szybszych niż Nvidia GeForce RTX 4070, który słusznie można zaklasyfikować do wyższej klasy średniej. Oferuje on 4 608 jednostek cieniujących, 144 rdzenie tensorowe dla Nvidia DLSS i 36 rdzeni ray tracingu. To wystarczy do wymagających zadań i złożonych gier na najwyższym poziomie detali. Jedynie pamięci VRAM jest trochę mało - 8 GB. Powinno to jednak sprawiać problemy dopiero po podłączeniu monitora 4K. W indywidualnych testach losowych w natywnej rozdzielczości QHD ekranu, w aktualnych grach nigdy nie zajęto więcej niż 7 GB
W Focusie 17 E23 układ graficzny może pobierać maksymalnie 140 W, przy czym 25 W jest przekierowywane z procesora jako dynamiczny boost. Odpowiada to typowym ustawieniom RTX 4070 w laptopie do gier. Jednak syntetyczne testy porównawcze, które przeprowadziliśmy, są nieco poniżej oczekiwań, ponieważ wysoki pobór mocy nie może być utrzymany w czasie.
Zarówno w wynikach 3DMark, jak i w grach, Focus 17 zawsze pozostaje w tyle za niemal identycznie wyposażonym Medion Erazer Major X20 lub Lenovo Legion Pro 5 z innym procesorem. Najwyraźniej duży i9-13900HX z odpowiednimi wymaganiami dotyczącymi chłodzenia również raczej przeszkadza niż pomaga w aplikacjach graficznych. Oprócz Legion Pro, jako przykład można wymienić Asus ROG Strix G18 z RTX 4070, ale mniejszym i7-13650HX, który osiąga mniej więcej takie same wskaźniki wydajności.
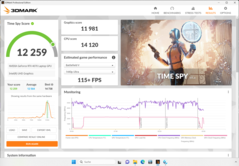
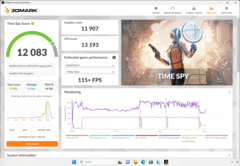
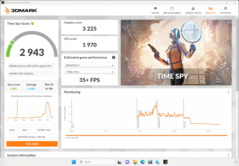
Co więcej, tryby wydajności nie wydają się jeszcze dojrzałe. Porównując wyniki w benchmarku Time Spy, tryby wydajności i rozrywki są niemal na równi. Nawet w poszczególnych grach, które testowaliśmy, różnica w zmierzonych FPS była tylko minimalna. Z drugiej strony tryb cichy, który przynajmniej działa bardzo cicho, spada zbyt znacząco. Osiągnięte 2,943 punkty są również osiągane przez AMD Radeon 780M, zintegrowany układ graficzny
Więcej benchmarków i danych dotyczących wydajności można znaleźć na naszej liście benchmarków GPU Mobile Graphics Cards - Benchmark List .
| 3DMark Performance rating - Percent | |
| HP Omen 17-ck2097ng | |
| MSI Titan GT77 12UHS | |
| Średnia w klasie Gaming | |
| Schenker XMG Neo 17 M22 -1! | |
| Medion Erazer Major X20 | |
| Lenovo Legion Pro 5 16ARX8 -1! | |
| Asus ROG Strix G18 G814JI | |
| Przeciętny NVIDIA GeForce RTX 4070 Laptop GPU | |
| Schenker XMG Focus 17 (E23) | |
| Medion Erazer Defender P40 | |
| 3DMark 11 Performance | 33424 pkt. | |
| 3DMark Cloud Gate Standard Score | 58621 pkt. | |
| 3DMark Fire Strike Score | 25541 pkt. | |
| 3DMark Time Spy Score | 12339 pkt. | |
Pomoc | ||
* ... im mniej tym lepiej
Wydajność w grach
Wszystkie testowane przez nas gry osiągają co najmniej zadowalającą liczbę klatek na sekundę. Wskaźniki są tylko poniżej 60 klatek na sekundę w obecnych i dość wymagających grach na najwyższym poziomie szczegółowości i rozdzielczości QHD. Tak więc sprzęt powinien wystarczyć do przyszłych gier przez dłuższy czas. Większość gier jest grywalna przy 100 fps lub więcej, gdy zrezygnujesz z kilku szczegółów i użyjesz rozdzielczości Full HD
XMG Focus 17 plasuje się pomiędzy naszymi wybranymi rywalami z identycznymi procesorami graficznymi w grach, dla których dostępne są wskaźniki porównawcze. Jest również mniej więcej na równi z MSI Titan GT77 z RTX 3080 Ti, który był około dwa razy droższy, gdy został wydany w zeszłym roku. Notebooki do gier z poprzednim GPU RTX 3070 mogą być lepsze o ponad 10% w zależności od modelu.
Ponieważ procesor jest mniej obciążony w grach niż w wielu innych testach porównawczych, nieco słabe chłodzenie nie ma większego znaczenia. Tylko GPU musi odprowadzać dużo ciepła, podczas gdy wydajność procesora może być dławiona bez znaczących strat w liczbie klatek na sekundę. Notebook XMG nie wykazuje więc słabości w grach, choć kilka punktów procentowych więcej przy pełnym obciążeniu wydaje się realne.
Między innymi, maksymalne możliwe 140 W, które GPU może zużywać, prawie nigdy nie jest osiągane. Byliśmy w stanie sprowokować pojedynczy szczyt pomiarowy 143 W w specjalnym scenariuszu naszego testu warunków skrajnych. W przeciwnym razie średni pobór mocy w grach wynosi 100 W, czyli ponownie znacznie poniżej 115 W, które układ graficzny powinien zużywać nawet bez dynamicznego wzmocnienia.
Wszystko wskazuje na to, że układ chłodzenia nie radzi sobie z odprowadzaniem ciepła odpadowego wystarczająco szybko. Schenker XMG niejednokrotnie pokazał, że wentylator notebooka może również poradzić sobie z maksymalnym poborem mocy układu graficznego na stałe - patrz na przykład XMG Neo 16 E23.
| The Witcher 3 - 1920x1080 Ultra Graphics & Postprocessing (HBAO+) | |
| HP Omen 17-ck2097ng | |
| Średnia w klasie Gaming (18.4 - 240, n=53, ostatnie 2 lata) | |
| MSI Titan GT77 12UHS | |
| Medion Erazer Major X20 | |
| Schenker XMG Neo 17 M22 | |
| Lenovo Legion Pro 5 16ARX8 | |
| Asus ROG Strix G18 G814JI | |
| Lenovo Legion 5 Pro 16ARH7H RTX 3070 Ti | |
| Schenker XMG Focus 17 (E23) | |
| Medion Erazer Defender P40 | |
| Asus ROG Zephyrus M16 GU603Z | |
| Final Fantasy XV Benchmark - 1920x1080 High Quality | |
| HP Omen 17-ck2097ng | |
| MSI Titan GT77 12UHS | |
| Średnia w klasie Gaming (19.2 - 215, n=142, ostatnie 2 lata) | |
| Schenker XMG Neo 17 M22 | |
| Medion Erazer Major X20 | |
| Lenovo Legion Pro 5 16ARX8 | |
| Lenovo Legion 5 Pro 16ARH7H RTX 3070 Ti | |
| Asus ROG Strix G18 G814JI | |
| Schenker XMG Focus 17 (E23) | |
| Medion Erazer Defender P40 | |
| Asus ROG Zephyrus M16 GU603Z | |
| Dota 2 Reborn - 1920x1080 ultra (3/3) best looking | |
| Lenovo Legion Pro 5 16ARX8 | |
| MSI Titan GT77 12UHS | |
| Schenker XMG Focus 17 (E23) | |
| Asus ROG Zephyrus M16 GU603Z | |
| Medion Erazer Major X20 | |
| HP Omen 17-ck2097ng | |
| Asus ROG Strix G18 G814JI | |
| Średnia w klasie Gaming (65.1 - 248, n=146, ostatnie 2 lata) | |
| Medion Erazer Defender P40 | |
| Lenovo Legion 5 Pro 16ARH7H RTX 3070 Ti | |
| Schenker XMG Neo 17 M22 | |
| The Witcher 3 | |
| 1920x1080 High Graphics & Postprocessing (Nvidia HairWorks Off) | |
| HP Omen 17-ck2097ng | |
| Średnia w klasie Gaming (110 - 424, n=35, ostatnie 2 lata) | |
| MSI Titan GT77 12UHS | |
| Lenovo Legion Pro 5 16ARX8 | |
| Medion Erazer Major X20 | |
| Asus ROG Strix G18 G814JI | |
| Schenker XMG Neo 17 M22 | |
| Przeciętny NVIDIA GeForce RTX 4070 Laptop GPU (123.9 - 268, n=41) | |
| Lenovo Legion 5 Pro 16ARH7H RTX 3070 Ti | |
| Schenker XMG Focus 17 (E23) | |
| Medion Erazer Defender P40 | |
| Asus ROG Zephyrus M16 GU603Z | |
| 1920x1080 Ultra Graphics & Postprocessing (HBAO+) | |
| HP Omen 17-ck2097ng | |
| Średnia w klasie Gaming (18.4 - 240, n=53, ostatnie 2 lata) | |
| MSI Titan GT77 12UHS | |
| Medion Erazer Major X20 | |
| Schenker XMG Neo 17 M22 | |
| Lenovo Legion Pro 5 16ARX8 | |
| Asus ROG Strix G18 G814JI | |
| Lenovo Legion 5 Pro 16ARH7H RTX 3070 Ti | |
| Schenker XMG Focus 17 (E23) | |
| Przeciętny NVIDIA GeForce RTX 4070 Laptop GPU (69.8 - 133.7, n=57) | |
| Medion Erazer Defender P40 | |
| Asus ROG Zephyrus M16 GU603Z | |
Test wytrzymałościowy z Witcher 3 nie zawiera żadnych niespodzianek. Należy to rozumieć jako całkowicie pozytywne. Nie można zaobserwować spadków wydajności ani ciągłego dławienia. Typowe wahania można wytłumaczyć zmieniającą się porą dnia w grze. W związku z tym w innych grach nie należy obserwować spadku liczby klatek na sekundę w miarę upływu czasu.
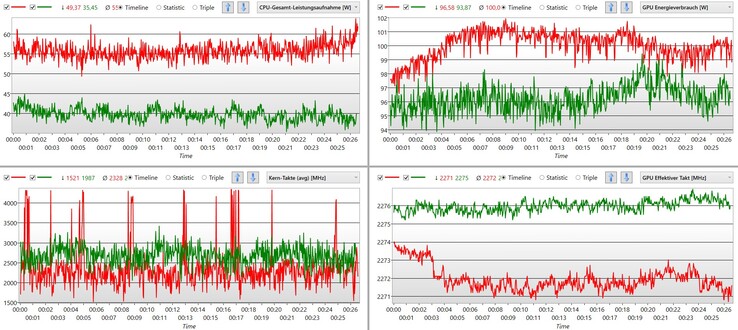
W teście wytrzymałości gry mogliśmy jeszcze raz sprawdzić, jak zachowują się tryby rozrywki i wydajności. W trybie rozrywkowym system wymaga prawie 20 W mniej, podczas gdy GPU ma wyższą częstotliwość taktowania niż w trybie wydajności. Zachowanie procesora wydaje się bardziej regularne i zazwyczaj częstotliwość taktowania (zielona) jest również nieco wyższa w porównaniu do trybu wydajności. Przy mniejszym zużyciu energii i nieco niższym poziomie hałasu, mierzymy również identyczną liczbę klatek na sekundę.
Witcher 3 FPS chart
| low | med. | high | ultra | QHD | |
|---|---|---|---|---|---|
| GTA V (2015) | 180.8 | 117.4 | 88.5 | ||
| The Witcher 3 (2015) | 226 | 115 | |||
| Dota 2 Reborn (2015) | 177.3 | 164.5 | |||
| Final Fantasy XV Benchmark (2018) | 114.8 | 81.3 | |||
| X-Plane 11.11 (2018) | 123 | ||||
| Far Cry 5 (2018) | 145 | 136 | 112 | ||
| Strange Brigade (2018) | 247 | 211 | 135.2 | ||
| Cyberpunk 2077 1.6 (2022) | 100.7 | 102.3 | 63.9 | ||
| F1 22 (2022) | 211 | 77.8 | 49 | ||
| Hogwarts Legacy (2023) | 86 | 71 | 50 | ||
| Star Wars Jedi Survivor (2023) | 79 | 73 | 45 |
Emisje - Focus 17 może być cichy
Emisja hałasu
Focus 17 jest jednym z głośniejszych przedstawicieli swojej gildii. Jest wyraźnie słyszalny przy około 58 dB, nawet przez zamknięte drzwi. JednakMedion Erazer Defender P40 pokazuje, że może być jeszcze głośniejszy. Pomimo mniejszego układu graficznego, wyraźnie osiąga ponad 60 dB.
Obroty wentylatora podczas normalnego użytkowania laptopa z dala od stałego obciążenia rzucają się w oczy. Chłodzenie rozkręca się bez wyraźnego powodu. Kilka sekund później prędkość obrotowa ponownie spada. Z drugiej strony, prędkość pozostaje stała podczas grania, więc stały hałas jest słyszalny, ale bez irytujących zmian prędkości.
Zmierzyliśmy kilka decybeli mniej na Witcher 3 w trybie rozrywki, co jest dość odczuwalne. Przy okazji, liczba klatek na sekundę pozostaje stała. W "trybie cichym" można zmierzyć 15 dB mniej, co przypomina jedną trzecią oryginalnej głośności. Notebook jest wtedy słyszalny, ale nie przeszkadza nawet w cichym otoczeniu. Nadal mierzymy nieco poniżej połowy liczby klatek na sekundę na Witcher 3. Gra jest nadal grywalna przy 60 fps na najwyższych ustawieniach detali, co jest prawdopodobnie prawdą w przypadku wielu niezbyt wymagających lub nieco starszych tytułów, które są wtedy również grywalne tak cicho jak szept.
Hałas
| luz |
| 24 / 24 / 26.47 dB |
| obciążenie |
| 55.72 / 57.94 dB |
 | ||
30 dB cichy 40 dB(A) słyszalny 50 dB(A) irytujący |
||
min: | ||
| Schenker XMG Focus 17 (E23) GeForce RTX 4070 Laptop GPU, i9-13900HX, Crucial P5 Plus 1TB CT1000P5PSSD8 | Lenovo Legion Pro 5 16ARX8 GeForce RTX 4070 Laptop GPU, R7 7745HX, Samsung PM9A1 MZVL21T0HCLR | Medion Erazer Major X20 GeForce RTX 4070 Laptop GPU, i9-13900HX, Phison E18-1TB-PHISON-SSD-B47R | Schenker XMG Neo 17 M22 GeForce RTX 3080 Ti Laptop GPU, R9 6900HX, Samsung SSD 980 Pro 1TB MZ-V8P1T0BW | HP Omen 17-ck2097ng GeForce RTX 4080 Laptop GPU, i9-13900HX, SK hynix PC801 HFS001TEJ9X101N | Medion Erazer Defender P40 GeForce RTX 4060 Laptop GPU, i7-13700HX, Phison PS5021-E21 1TB | |
|---|---|---|---|---|---|---|
| Noise | 11% | -3% | -8% | -5% | -7% | |
| wyłączone / środowisko * (dB) | 24 | 23.2 3% | 24 -0% | 26 -8% | 24 -0% | 25 -4% |
| Idle Minimum * (dB) | 24 | 23.2 3% | 25 -4% | 26 -8% | 31 -29% | 26 -8% |
| Idle Average * (dB) | 24 | 23.2 3% | 29 -21% | 29 -21% | 32 -33% | 27 -13% |
| Idle Maximum * (dB) | 26.47 | 26.2 1% | 31 -17% | 40 -51% | 33 -25% | 32 -21% |
| Load Average * (dB) | 55.72 | 31.4 44% | 50 10% | 47 16% | 45 19% | 53 5% |
| Witcher 3 ultra * (dB) | 57.94 | 48.4 16% | 53 9% | 52 10% | 45 22% | 56 3% |
| Load Maximum * (dB) | 57.94 | 53.8 7% | 57 2% | 54 7% | 50 14% | 64 -10% |
* ... im mniej tym lepiej
Temperatura
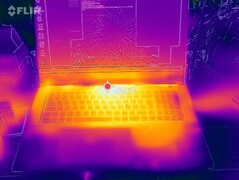
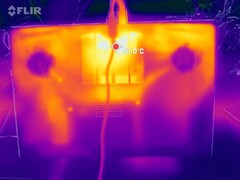
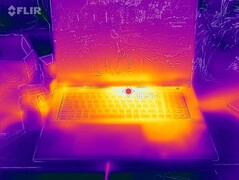
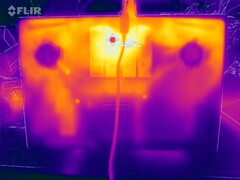
Miejsca oparcia dłoni są ciepłe, ale nie gorące (zmierzyliśmy maksymalnie 36°C). Jednak w kluczowym obszarze temperatura wynosi już 42 °C, a na prawo od środka nadal jest 40 °C. Po lewej stronie laptop do gier pozostaje nieco chłodniejszy. Może to być irytujące, zwłaszcza w ciepłe dni podczas pisania i grania.
Spód nagrzewa się nawet bez znacznego obciążenia, więc XMG Focus 17 E23 powinien być używany tylko na płaskiej, twardej powierzchni.
(-) Maksymalna temperatura w górnej części wynosi 50 °C / 122 F, w porównaniu do średniej 40.4 °C / 105 F , począwszy od 21.2 do 68.8 °C dla klasy Gaming.
(-) Dno nagrzewa się maksymalnie do 56 °C / 133 F, w porównaniu do średniej 43.3 °C / 110 F
(+) W stanie bezczynności średnia temperatura górnej części wynosi 30.9 °C / 88 F, w porównaniu ze średnią temperaturą urządzenia wynoszącą 33.9 °C / ### class_avg_f### F.
(±) Podczas gry w Wiedźmina 3 średnia temperatura górnej części wynosi 36.8 °C / 98 F, w porównaniu do średniej temperatury urządzenia wynoszącej 33.9 °C / ## #class_avg_f### F.
(±) Podpórki pod nadgarstki i touchpad mogą się bardzo nagrzać w dotyku, maksymalnie do 37 °C / 98.6 F.
(-) Średnia temperatura obszaru podparcia dłoni w podobnych urządzeniach wynosiła 28.8 °C / 83.8 F (-8.2 °C / -14.8 F).
| Schenker XMG Focus 17 (E23) Intel Core i9-13900HX, NVIDIA GeForce RTX 4070 Laptop GPU | Lenovo Legion Pro 5 16ARX8 AMD Ryzen 7 7745HX, NVIDIA GeForce RTX 4070 Laptop GPU | Medion Erazer Major X20 Intel Core i9-13900HX, NVIDIA GeForce RTX 4070 Laptop GPU | Schenker XMG Neo 17 M22 AMD Ryzen 9 6900HX, NVIDIA GeForce RTX 3080 Ti Laptop GPU | HP Omen 17-ck2097ng Intel Core i9-13900HX, NVIDIA GeForce RTX 4080 Laptop GPU | Medion Erazer Defender P40 Intel Core i7-13700HX, NVIDIA GeForce RTX 4060 Laptop GPU | |
|---|---|---|---|---|---|---|
| Heat | 20% | 4% | 9% | 23% | 19% | |
| Maximum Upper Side * (°C) | 50 | 41.8 16% | 46 8% | 49 2% | 41 18% | 42 16% |
| Maximum Bottom * (°C) | 56 | 41.4 26% | 49 12% | 52 7% | 51 9% | 45 20% |
| Idle Upper Side * (°C) | 37 | 29 22% | 37 -0% | 30 19% | 24 35% | 28 24% |
| Idle Bottom * (°C) | 36 | 30.4 16% | 38 -6% | 33 8% | 25 31% | 30 17% |
* ... im mniej tym lepiej
Test warunków skrajnych
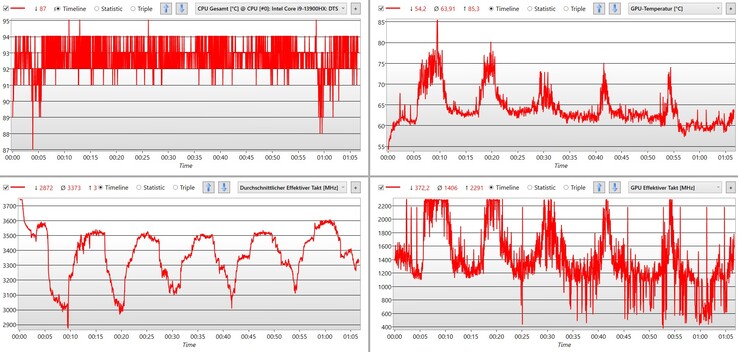
W naszym teście obciążeniowym z Prime95 i Furmark, procesor osiągnął temperaturę powyżej 95 °C. GPU z drugiej strony nie jest w pełni wykorzystywany i waha się między 60 a 75 °C. Zasilacz jest ograniczony w tej ekstremalnej sytuacji i wynosi około 200 W dla GPU i CPU razem, podczas gdy teoretycznie możliwe byłoby 240 W. Co więcej, trwa to tylko przez kilka sekund, zanim zasilanie i częstotliwość taktowania zostaną znacznie zmniejszone.
Chłodzenie nie może stale utrzymywać maksymalnej wydajności, jak ma to miejsce na przykład w przypadku XMG Neo 16 E23 to przypadek.
Głośnik
Reprodukcja dźwięku jest wystarczająco mocna jak na notebooka. Nie ma na co narzekać, szczególnie w zakresie niskich częstotliwości i wysokich tonów. Mowa i typowe efekty w grach akcji są dobrze odtwarzane.
W muzyce, a nawet w filmach, słychać również brak jakości dźwięku i brak niższych średnich i wyższych basów, co jest wyraźnie zauważalne w naszych pomiarach. W przypadku tych zadań nie ma prawie żadnej możliwości korzystania z zewnętrznych głośników lub słuchawek.
Schenker XMG Focus 17 (E23) analiza dźwięku
(±) | głośność głośnika jest średnia, ale dobra (78.08 dB)
Bas 100 - 315 Hz
(-) | prawie brak basu - średnio 33.5% niższa od mediany
(+) | bas jest liniowy (6.1% delta do poprzedniej częstotliwości)
Średnie 400 - 2000 Hz
(±) | zmniejszone średnie - średnio 7.2% niższe niż mediana
(±) | liniowość środka jest średnia (9.5% delta do poprzedniej częstotliwości)
Wysokie 2–16 kHz
(+) | zrównoważone maksima - tylko 4.4% od mediany
(+) | wzloty są liniowe (5.2% delta do poprzedniej częstotliwości)
Ogólnie 100 - 16.000 Hz
(±) | liniowość ogólnego dźwięku jest średnia (26.9% różnicy w stosunku do mediany)
W porównaniu do tej samej klasy
» 93% wszystkich testowanych urządzeń w tej klasie było lepszych, 2% podobnych, 6% gorszych
» Najlepszy miał deltę 6%, średnia wynosiła ###średnia###%, najgorsza wynosiła 132%
W porównaniu do wszystkich testowanych urządzeń
» 82% wszystkich testowanych urządzeń było lepszych, 4% podobnych, 14% gorszych
» Najlepszy miał deltę 4%, średnia wynosiła ###średnia###%, najgorsza wynosiła 134%
Apple MacBook Pro 16 2021 M1 Pro analiza dźwięku
(+) | głośniki mogą odtwarzać stosunkowo głośno (84.7 dB)
Bas 100 - 315 Hz
(+) | dobry bas - tylko 3.8% od mediany
(+) | bas jest liniowy (5.2% delta do poprzedniej częstotliwości)
Średnie 400 - 2000 Hz
(+) | zbalansowane środki średnie - tylko 1.3% od mediany
(+) | średnie są liniowe (2.1% delta do poprzedniej częstotliwości)
Wysokie 2–16 kHz
(+) | zrównoważone maksima - tylko 1.9% od mediany
(+) | wzloty są liniowe (2.7% delta do poprzedniej częstotliwości)
Ogólnie 100 - 16.000 Hz
(+) | ogólny dźwięk jest liniowy (4.6% różnicy w stosunku do mediany)
W porównaniu do tej samej klasy
» 0% wszystkich testowanych urządzeń w tej klasie było lepszych, 0% podobnych, 100% gorszych
» Najlepszy miał deltę 5%, średnia wynosiła ###średnia###%, najgorsza wynosiła 45%
W porównaniu do wszystkich testowanych urządzeń
» 0% wszystkich testowanych urządzeń było lepszych, 0% podobnych, 100% gorszych
» Najlepszy miał deltę 4%, średnia wynosiła ###średnia###%, najgorsza wynosiła 134%
Zarządzanie energią - mocny procesor w notebooku do gier jest bardzo głodny
Zużycie energii
Zużycie energii jest wyraźnie zbyt wysokie, gdy nie są uruchomione żadne procesy. Zwłaszcza rywale z procesorami AMD, tacy jak XMG Neo 17 M22 radzą sobie z mniej niż połową mocy.
Focus 17 nie jest również oszczędny pod obciążeniem. Potrzebuje o jedną trzecią więcej mocy dla identycznej liczby klatek na sekundę w Witcher 3 niż Lenovo Legion Pro 5. Nie jest to wydajne i w dużej mierze wyjaśnia, dlaczego Legion jest tylko o połowę głośniejszy.
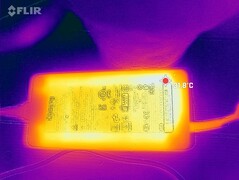
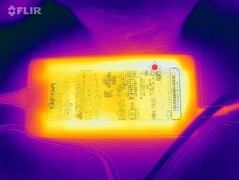
280-watowy zasilacz jest przynajmniej wystarczająco duży, nigdy nie jest przeciążony i zawsze powinien zapewnić wystarczającą moc do naładowania baterii.
| wyłączony / stan wstrzymania | |
| luz | |
| obciążenie |
|
Legenda:
min: | |
| Schenker XMG Focus 17 (E23) i9-13900HX, GeForce RTX 4070 Laptop GPU, Crucial P5 Plus 1TB CT1000P5PSSD8, IPS, 2560x1440, 17.3" | Lenovo Legion Pro 5 16ARX8 R7 7745HX, GeForce RTX 4070 Laptop GPU, Samsung PM9A1 MZVL21T0HCLR, IPS, 2560x1600, 16" | Schenker XMG Neo 17 M22 R9 6900HX, GeForce RTX 3080 Ti Laptop GPU, Samsung SSD 980 Pro 1TB MZ-V8P1T0BW, IPS, 2560x1600, 17" | HP Omen 17-ck2097ng i9-13900HX, GeForce RTX 4080 Laptop GPU, SK hynix PC801 HFS001TEJ9X101N, IPS, 2560x1440, 17.3" | Medion Erazer Defender P40 i7-13700HX, GeForce RTX 4060 Laptop GPU, Phison PS5021-E21 1TB, IPS, 2560x1440, 17.3" | MSI Titan GT77 12UHS i9-12900HX, GeForce RTX 3080 Ti Laptop GPU, Samsung PM9A1 MZVL21T0HCLR, IPS-Level, 1920x1080, 17.3" | Przeciętny NVIDIA GeForce RTX 4070 Laptop GPU | Średnia w klasie Gaming | |
|---|---|---|---|---|---|---|---|---|
| Power Consumption | 17% | 31% | 5% | 31% | -29% | 18% | 11% | |
| Idle Minimum * (Watt) | 17 | 8.1 52% | 7 59% | 16 6% | 8 53% | 30.21 -78% | 13.2 ? 22% | 13.6 ? 20% |
| Idle Average * (Watt) | 18 | 15.9 12% | 11 39% | 20 -11% | 12 33% | 32.42 -80% | 18.2 ? -1% | 19.4 ? -8% |
| Idle Maximum * (Watt) | 25.8 | 37.2 -44% | 17 34% | 26 -1% | 18 30% | 33.7 -31% | 24.6 ? 5% | 26 ? -1% |
| Load Average * (Watt) | 178 | 90.9 49% | 92 48% | 135 24% | 101 43% | 125.09 30% | 97 ? 46% | 111.2 ? 38% |
| Witcher 3 ultra * (Watt) | 265 | 189.6 28% | 221 17% | 215 19% | 180.8 32% | 256 3% | ||
| Load Maximum * (Watt) | 275 | 263.5 4% | 306 -11% | 299 -9% | 284 -3% | 321.88 -17% | 221 ? 20% | 261 ? 5% |
* ... im mniej tym lepiej
Power consumption Witcher 3 / Stress test
Power consumption external monitor
Żywotność baterii
Wysoki pobór mocy bez obciążenia idzie w parze ze słabym czasem pracy na baterii. Nawet w trybie oszczędzania energii nie udaje się osiągnąć 4 godzin. Kolejne 20 min więcej uzyskuje się w trybie cichym, czego nie należało się spodziewać, biorąc pod uwagę aktywowaną dGPU. Jeśli wtyczka jest wyciągnięta w trybie wydajności, a Advanced Optimus jest aktywny, czas pracy nie wynosi nawet 2 godzin w naszym teście WLAN z naprzemiennymi połączeniami internetowymi.
XMG zgłosiło w tym względzie, że tryb oszczędzania energii nie działa obecnie zgodnie z oczekiwaniami. Możemy to potwierdzić w świetle naszych wyników testów. Aktualizacja powinna zdecydowanie poprawić sytuację.
| Schenker XMG Focus 17 (E23) i9-13900HX, GeForce RTX 4070 Laptop GPU, 73 Wh | Lenovo Legion Pro 5 16ARX8 R7 7745HX, GeForce RTX 4070 Laptop GPU, 80 Wh | Medion Erazer Major X20 i9-13900HX, GeForce RTX 4070 Laptop GPU, 62.3 Wh | Schenker XMG Neo 17 M22 R9 6900HX, GeForce RTX 3080 Ti Laptop GPU, 99 Wh | HP Omen 17-ck2097ng i9-13900HX, GeForce RTX 4080 Laptop GPU, 83 Wh | Medion Erazer Defender P40 i7-13700HX, GeForce RTX 4060 Laptop GPU, 73 Wh | Średnia w klasie Gaming | |
|---|---|---|---|---|---|---|---|
| Czasy pracy | 3% | 18% | 122% | 6% | 72% | 77% | |
| H.264 (h) | 3.1 | 4.2 35% | 6.6 113% | 3.7 19% | 5.7 84% | 8.1 ? 161% | |
| WiFi v1.3 (h) | 3.9 | 4 3% | 3.9 0% | 9 131% | 3.6 -8% | 6.2 59% | 6.76 ? 73% |
| Witcher 3 ultra (h) | 1 | 0.958 ? -4% |
Za
Przeciw
Werdykt - najlepszy do gier, z kilkoma wadami
Nie ma wątpliwości co do wydajności systemu. Focus 17 plasuje się wśród podobnie silnej konkurencji. Jedynie nie do końca przekonujące chłodzenie uniemożliwia uzyskanie lepszego wyniku. Wydaje się, że nie jest ono precyzyjnie dostosowane do Intel Core i9. Niemniej jednak, nie ma chyba obecnie gry, która byłaby zbyt wymagająca dla rozdzielczości QHD i wiernie odwzorowującego kolory ekranu.
Nacisk na wydajność w grach: Mocny sprzęt znajdziemy w Focusie 17 E23 z wyposażeniem poniżej przeciętnej.
Jeśli laptop nie musi być zdolny do czegoś więcej, XMG Focus z naciskiem na wydajność w grach, co jest już przewidziane w nazwie. W przeciwnym razie ocena okazuje się raczej słaba w porównaniu do (prawie powszechnie droższej) konkurencji.
Klawiatura oferuje tylko kilka ustawień kolorów, zawsze dla wszystkich klawiszy. Podobnie jak w poprzedniku, touchpad nie może przekonać, ale i tak nie będzie używany do gier. Czas pracy na baterii jest zdecydowanie zbyt krótki i tylko w połowie akceptowalny w trybie ścisłego oszczędzania energii. Głośniki brzmią przeciętnie. Co więcej, wentylacja jest głośniejsza niż przeciętna, a podzespoły zużywają zdecydowanie za dużo energii w stosunku do założonej wydajności. Co więcej, USB 2.0 nie wydaje się już aktualne, a Mini-DisplayPort można znaleźć na przykład w zestawach VR, ale USB-C z obsługą DP byłoby bardziej zróżnicowane.
W zamian ceny są odpowiednio atrakcyjne. Stosunek ceny do wydajności jest dobry. Jeśli Schenkerowi uda się również dostosować pozornie niedokończone tryby wydajności poprzez aktualizację oprogramowania, niektóre wady, takie jak krótki czas pracy baterii lub słabe zachowanie wentylatora, mogą zostać znacznie złagodzone.
Większa wydajność z porównywalnych komponentów jest dostępna na przykład z XMG Neo 16 E23 (wyposażonej w RTX 4090). Mniej więcej tak samo szybki i cichszy niż XMG Focus 17 jest Lenovo Legion Pro 5 16 Gen8. Jednak oba laptopy do gier są również zauważalnie droższe z ich ogólnie lepszym wyposażeniem.
Cena i dostępność
Schenker XMG Focus 17 (E23)
- 04/06/2023 v7 (old)
Mario Petzold
Przezroczystość
Wyboru urządzeń do recenzji dokonuje nasza redakcja. Próbka testowa została udostępniona autorowi jako pożyczka od producenta lub sprzedawcy detalicznego na potrzeby tej recenzji. Pożyczkodawca nie miał wpływu na tę recenzję, producent nie otrzymał też kopii tej recenzji przed publikacją. Nie było obowiązku publikowania tej recenzji. Jako niezależna firma medialna, Notebookcheck nie podlega władzy producentów, sprzedawców detalicznych ani wydawców.
Tak testuje Notebookcheck
Każdego roku Notebookcheck niezależnie sprawdza setki laptopów i smartfonów, stosując standardowe procedury, aby zapewnić porównywalność wszystkich wyników. Od około 20 lat stale rozwijamy nasze metody badawcze, ustanawiając przy tym standardy branżowe. W naszych laboratoriach testowych doświadczeni technicy i redaktorzy korzystają z wysokiej jakości sprzętu pomiarowego. Testy te obejmują wieloetapowy proces walidacji. Nasz kompleksowy system ocen opiera się na setkach uzasadnionych pomiarów i benchmarków, co pozwala zachować obiektywizm.

