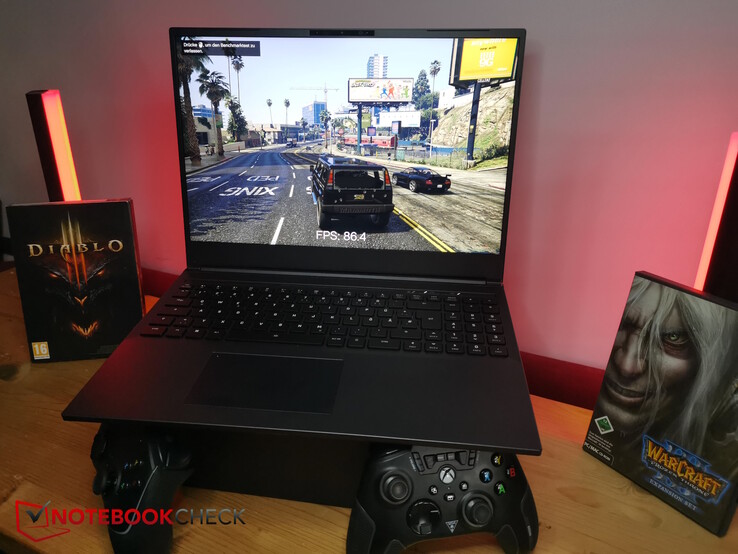
Recenzja laptopa do gier SCHENKER XMG Core 16 - prawdziwy konkurent dla Lenovo Legion Pro 5 16
Ostatnim XMG Core, który również testowaliśmy, byłXMG Core 15(88%) sprzed roku - wówczas z kartą graficznąRTX 3060. Teraz Schenker wprowadził 16-calową wersję Core. Przyjrzymy się wszystkim, co się zmieniło, poza rozmiarem ekranu.
Porównamy Core 16 z Lenovo Legion Pro 5 16 Gen 8, Acer Nitro 16 AN16-41, HP Omen Transcend 16, MSI Stealth 16 Studio i HP Victus 16.
Potencjalni konkurenci w porównaniu
Ocena | Data | Model | Waga | Wysokość | Rozmiar | Rezolucja | Cena |
|---|---|---|---|---|---|---|---|
| 89.2 % v7 (old) | 10/2023 | Schenker XMG CORE 16 (L23) R7 7840HS, GeForce RTX 4070 Laptop GPU | 2.4 kg | 26.1 mm | 16.00" | 2560x1600 | |
| 88.4 % v7 (old) | 05/2023 | Lenovo Legion Pro 5 16ARX8 R7 7745HX, GeForce RTX 4070 Laptop GPU | 2.5 kg | 26.8 mm | 16.00" | 2560x1600 | |
| 88.1 % v7 (old) | 06/2023 | Acer Nitro 16 AN16-41 R7 7735HS, GeForce RTX 4070 Laptop GPU | 2.7 kg | 27.9 mm | 16.00" | 2560x1600 | |
| 87.9 % v7 (old) | 08/2023 | HP Omen Transcend 16 i9-13900HX, GeForce RTX 4070 Laptop GPU | 2.3 kg | 19.8 mm | 16.00" | 2560x1600 | |
| 88.8 % v7 (old) | 07/2023 | MSI Stealth 16 Studio A13VG i7-13700H, GeForce RTX 4070 Laptop GPU | 2 kg | 19.95 mm | 16.00" | 2560x1600 | |
| 85.1 % v7 (old) | 09/2023 | HP Victus 16-r0077ng i7-13700H, GeForce RTX 4070 Laptop GPU | 2.4 kg | 24 mm | 16.10" | 1920x1080 |
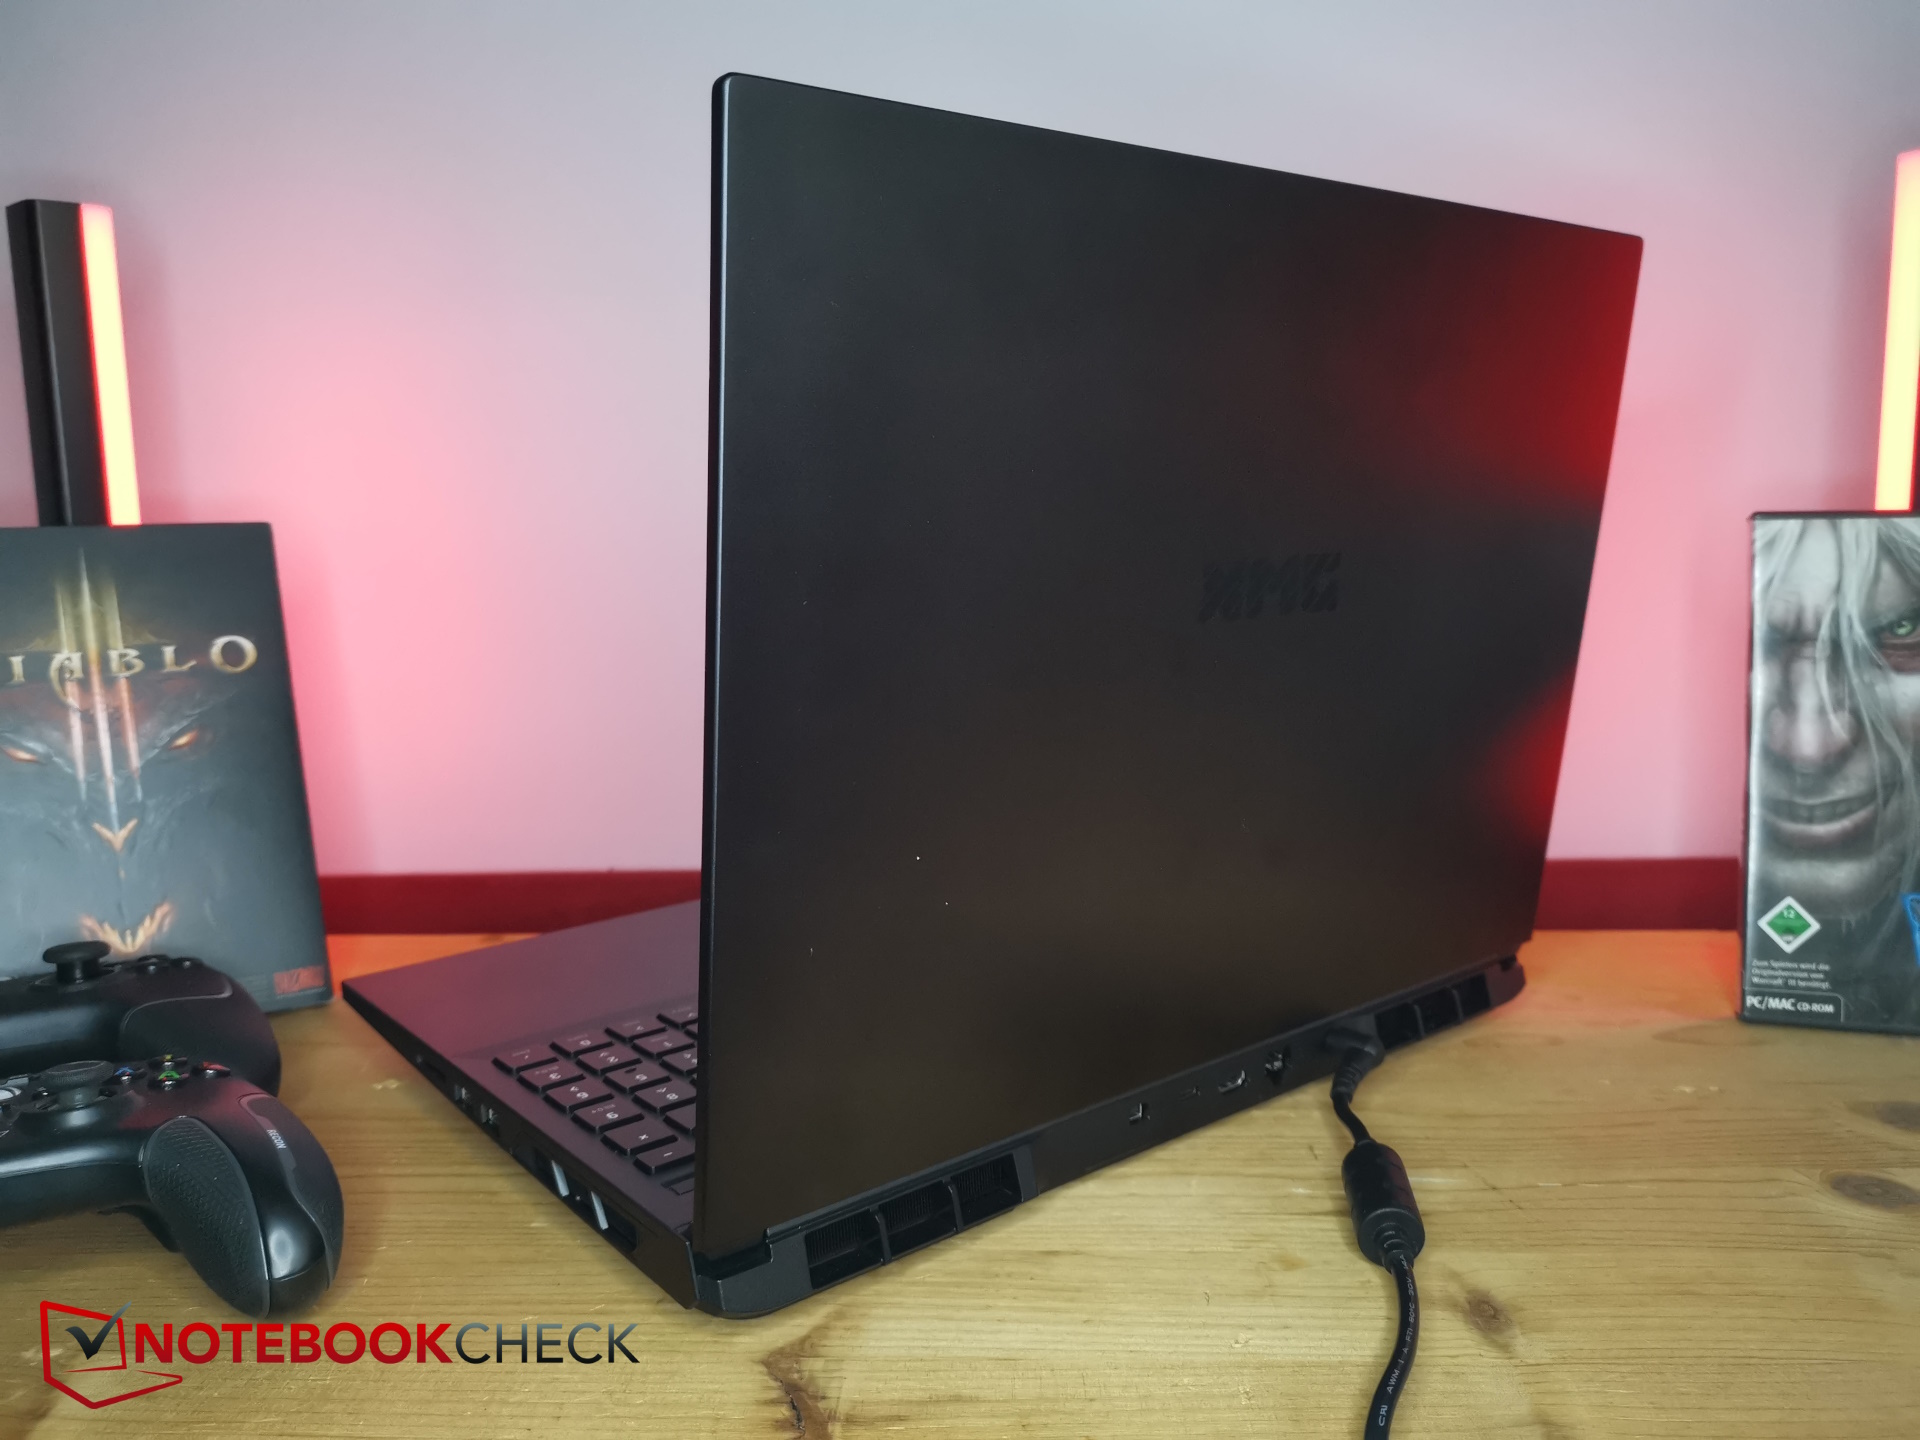
Obudowa i łączność - Elegancki Core 16
Ten laptop przyjął typowe dla Schenkera eleganckie podejście - wszystko jest utrzymane w ciemnoszarym kolorze. Twardsza podstawa i bardziej miękka płyta dolna są wykonane z tworzywa sztucznego, a błyszcząca pokrywa wyświetlacza jest wykonana z metalu. Ten ostatni jest trochę magnesem na odciski palców. Pokrywę można otworzyć do 135 stopni.
Całość wydaje się dość stabilna, a jej wykonanie jest dobre. Lewa strona podstawy skrzypiała tylko za pierwszym razem, gdy próbowaliśmy ją przekręcić.
Ma przeciętny rozmiar i wagę - porównywalną do Lenovo Legion Pro 5 16.
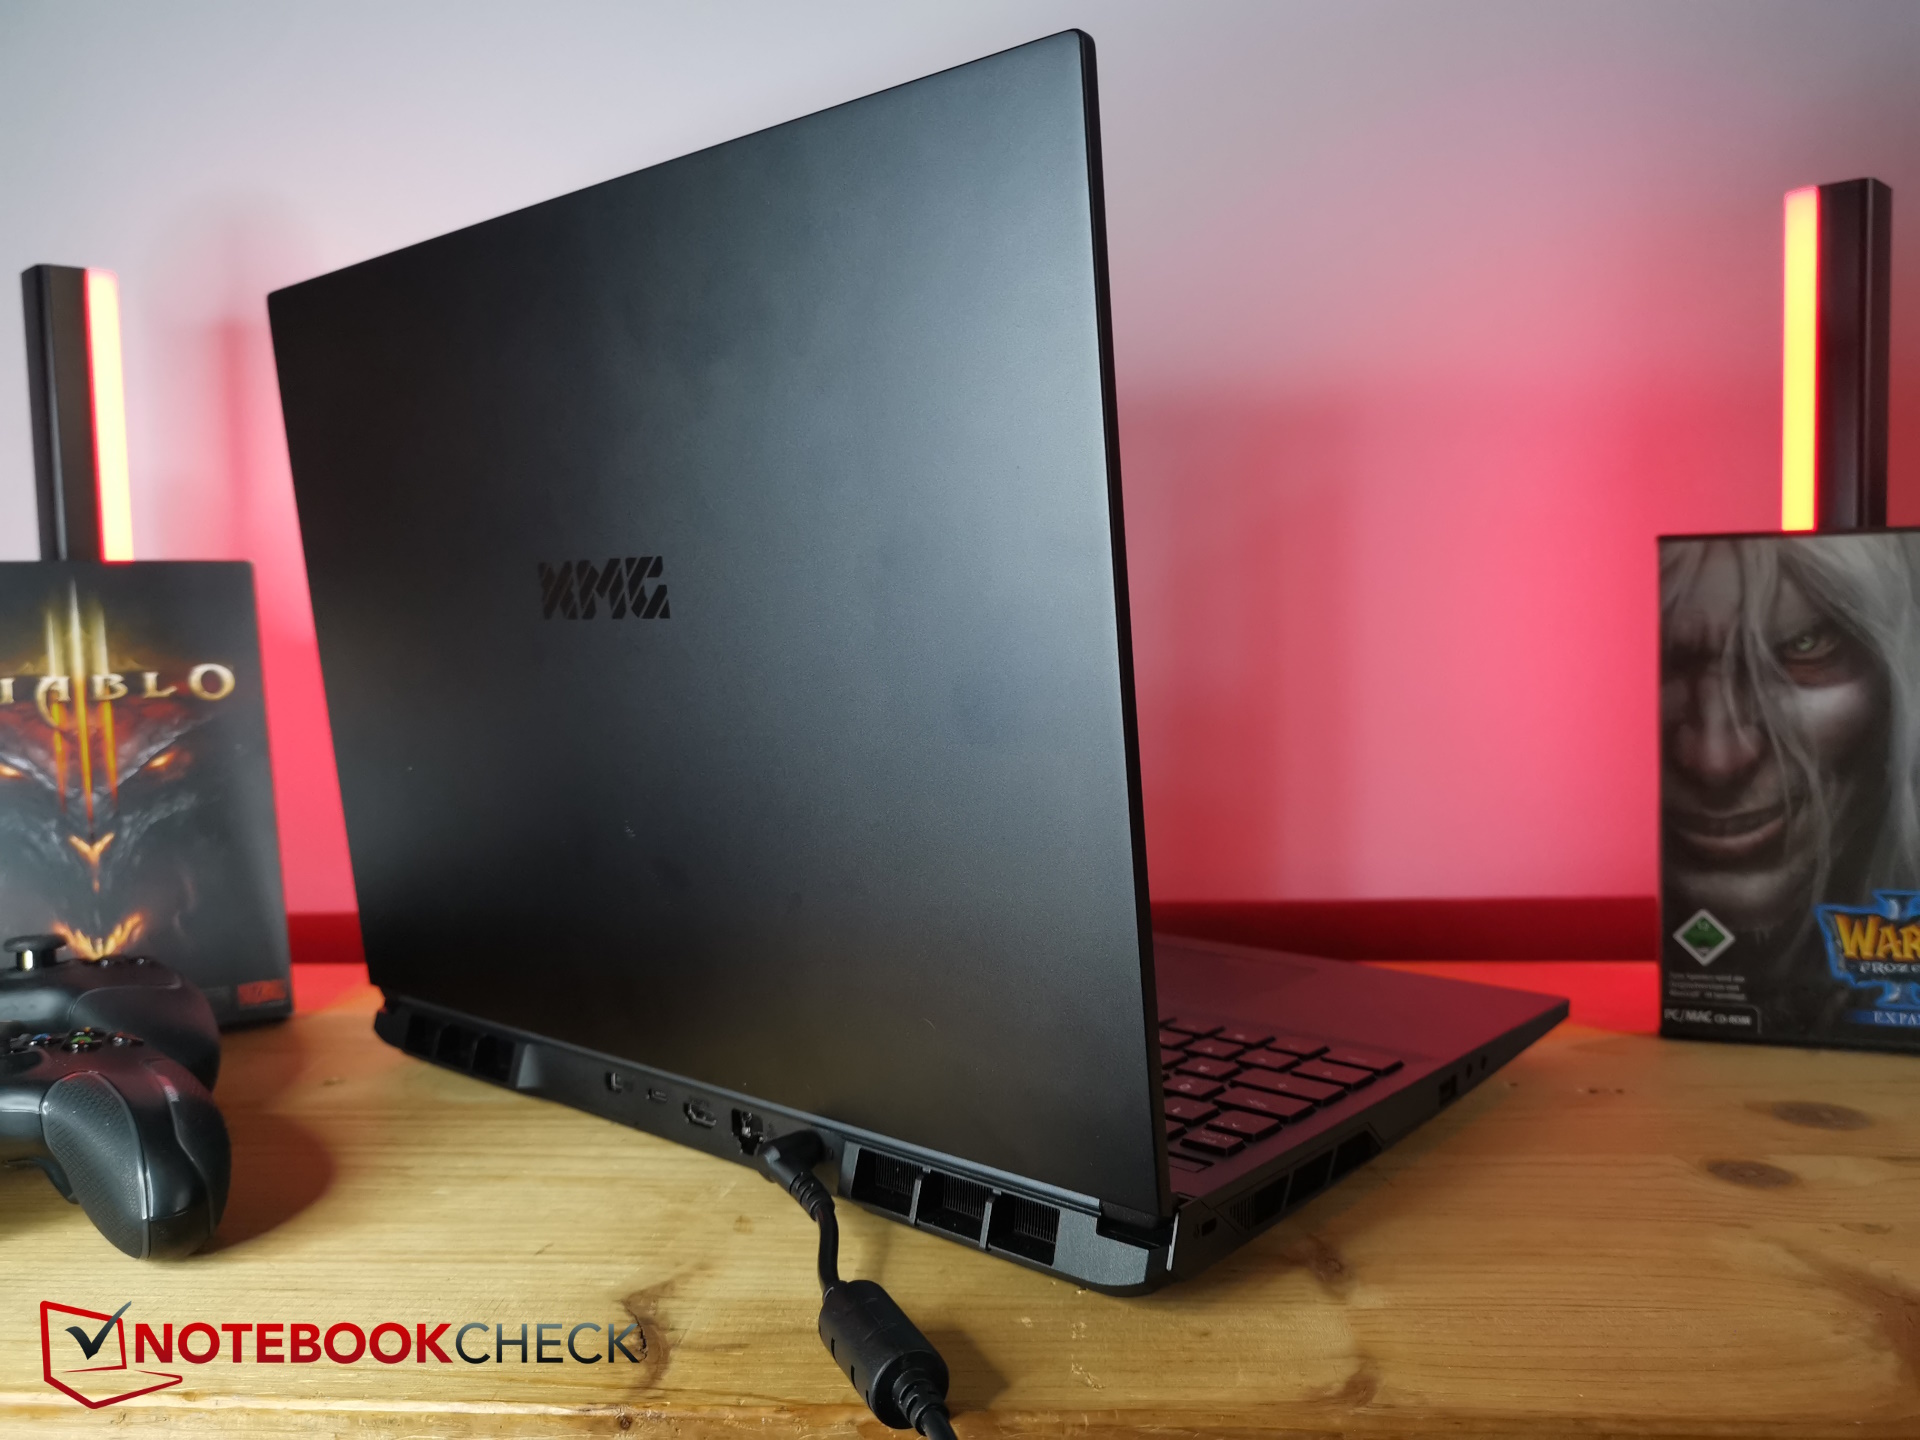
Laptop do gier zawiera wszystkie najważniejsze porty, w tym pełny czytnik kart SD. Niestety, port USB-C nie obsługuje Thunderbolt, Power Delivery ani DisplayPort. Dla tego ostatniego laptop posiada dedykowany MiniDisplayPort. Urządzenie nie może być ładowane przez USB-C, a port USB-A po lewej stronie jest nadal typu 2.0!
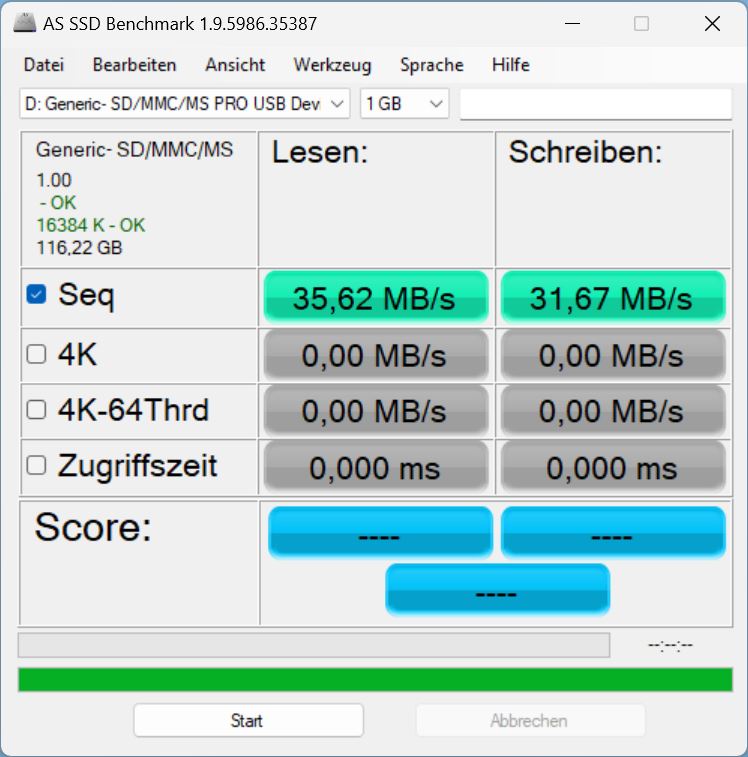
Wspomniany wcześniej czytnik kart SD jest niestety bardzo wolny - wolniejszy niż we wszystkich poprzednikach i konkurentach. Przynajmniej w ogóle go posiada.
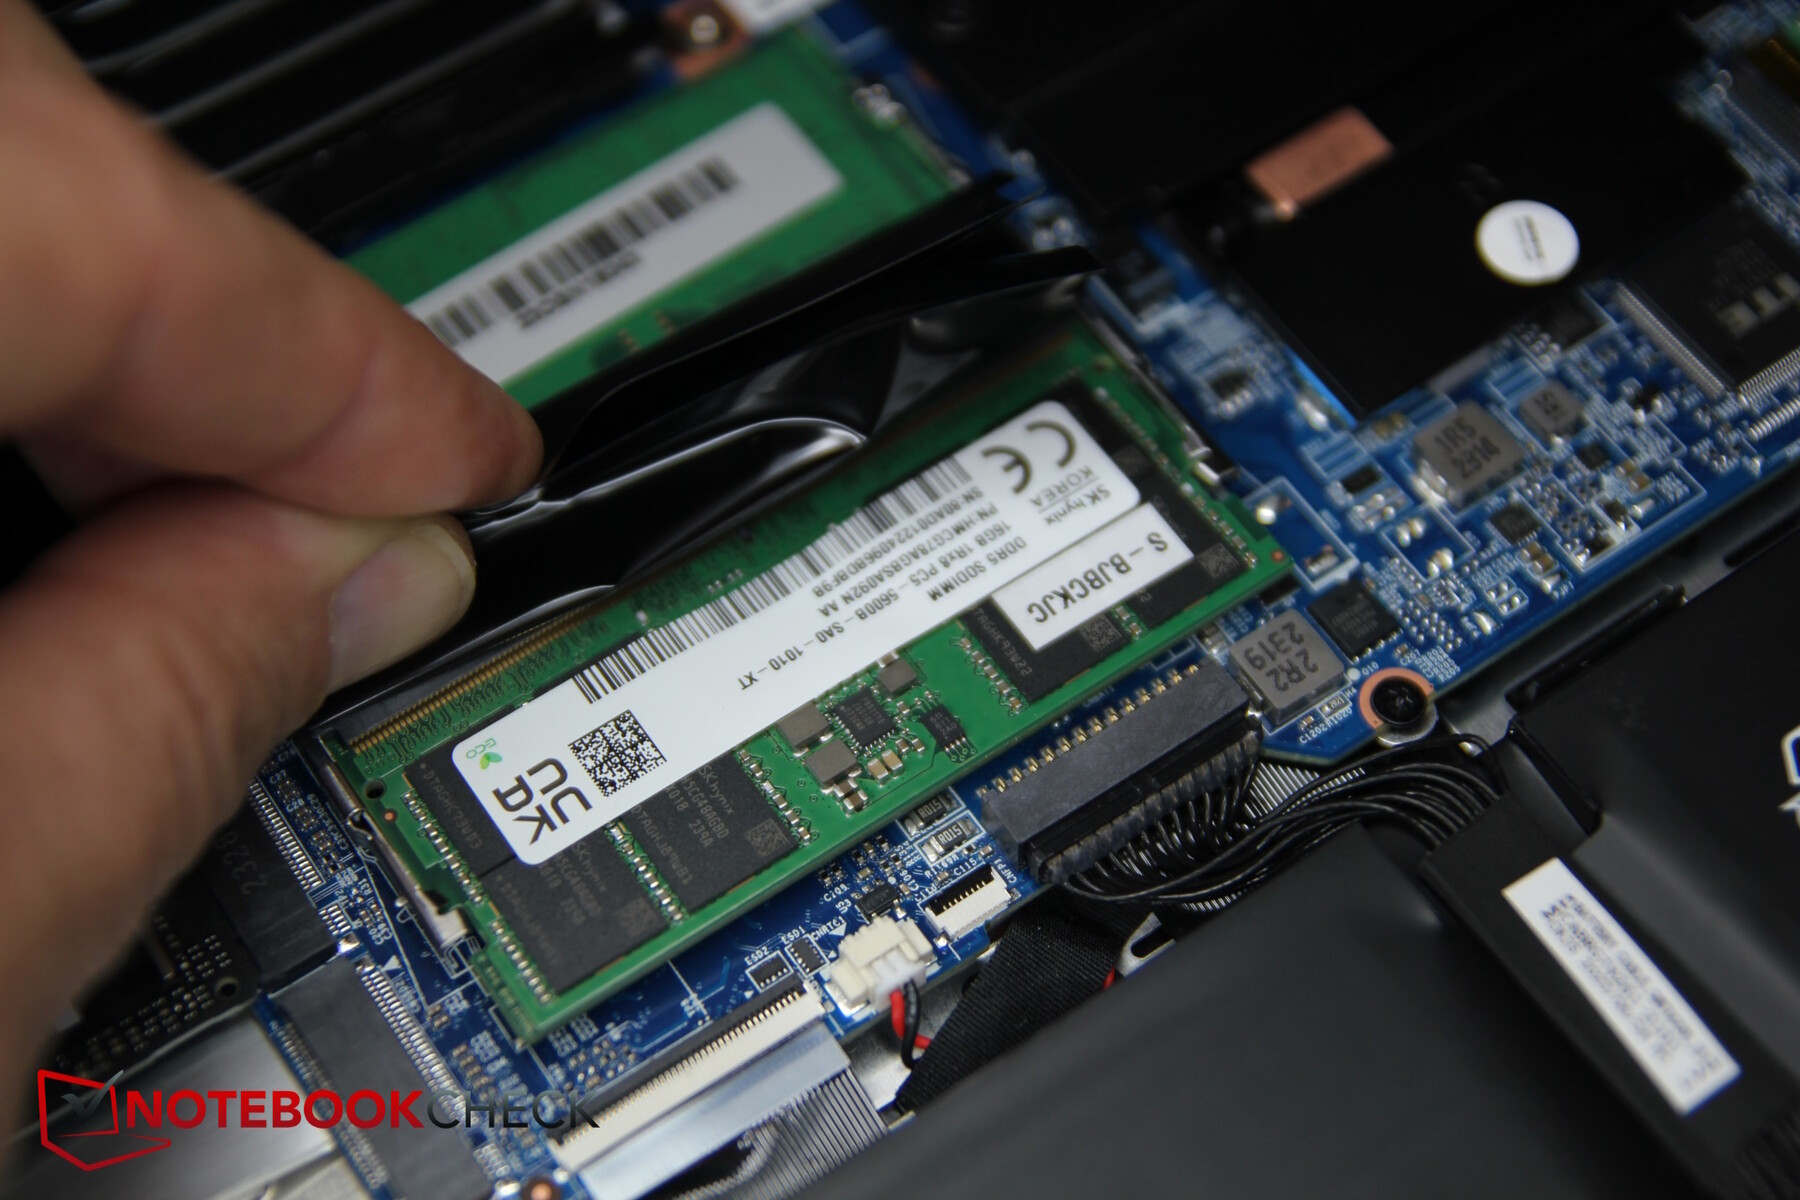
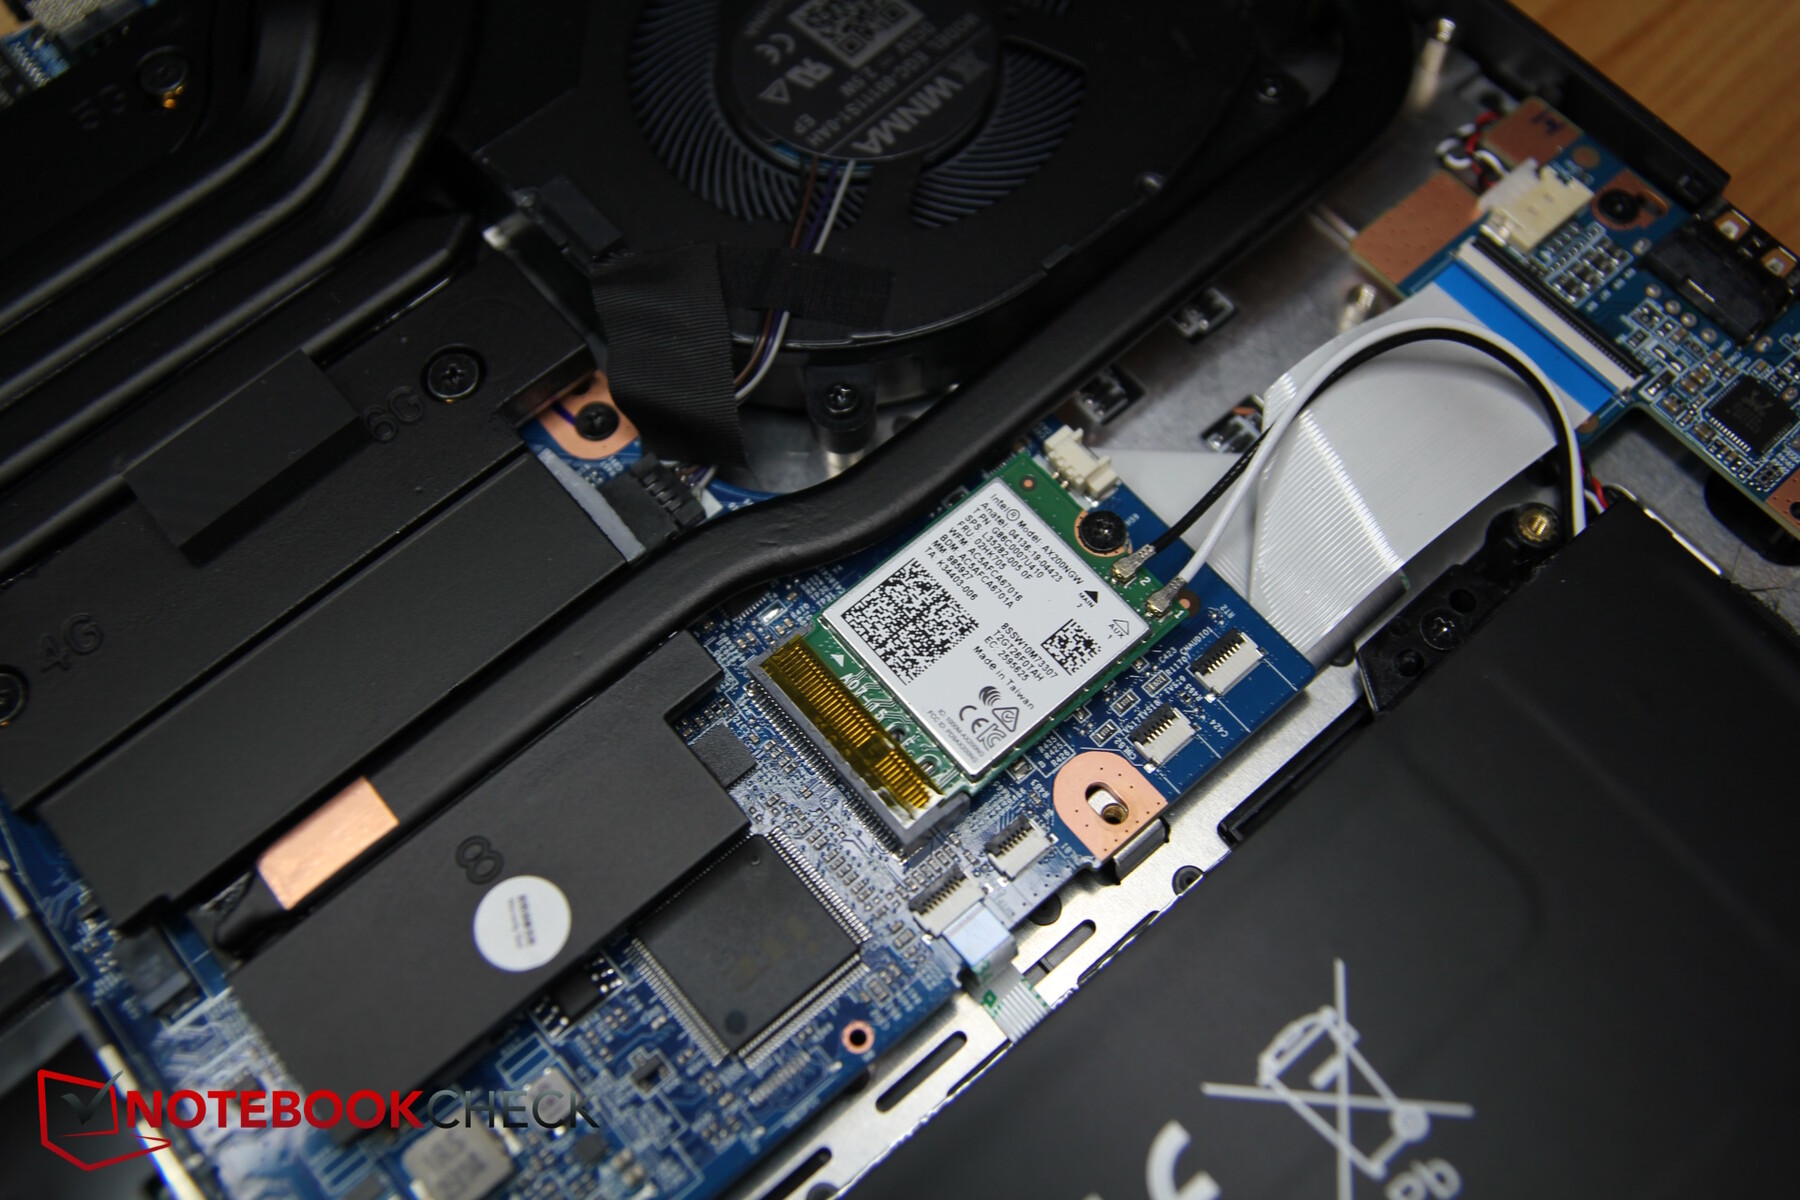
Intel AX200 obsługuje WiFi 6, ale tylko w zakresie częstotliwości 5 GHz. Szybkość transferu jest dobra i stosunkowo stabilna.
| SD Card Reader | |
| average JPG Copy Test (av. of 3 runs) | |
| MSI Stealth 16 Studio A13VG | |
| Średnia w klasie Gaming (20.9 - 210, n=54, ostatnie 2 lata) | |
| Acer Nitro 16 AN16-41 (AV Pro SD microSD 128 GB V60) | |
| Schenker XMG CORE 16 (L23) | |
| maximum AS SSD Seq Read Test (1GB) | |
| MSI Stealth 16 Studio A13VG | |
| Średnia w klasie Gaming (25.5 - 261, n=51, ostatnie 2 lata) | |
| Acer Nitro 16 AN16-41 (AV Pro SD microSD 128 GB V60) | |
| Schenker XMG CORE 16 (L23) | |

 GeForce RTX 4070 Laptop GPU, R7 7840HS, Samsung 990 Pro 1 TB")
 GeForce RTX 4070 Laptop GPU, R7 7840HS, Samsung 990 Pro 1 TB")
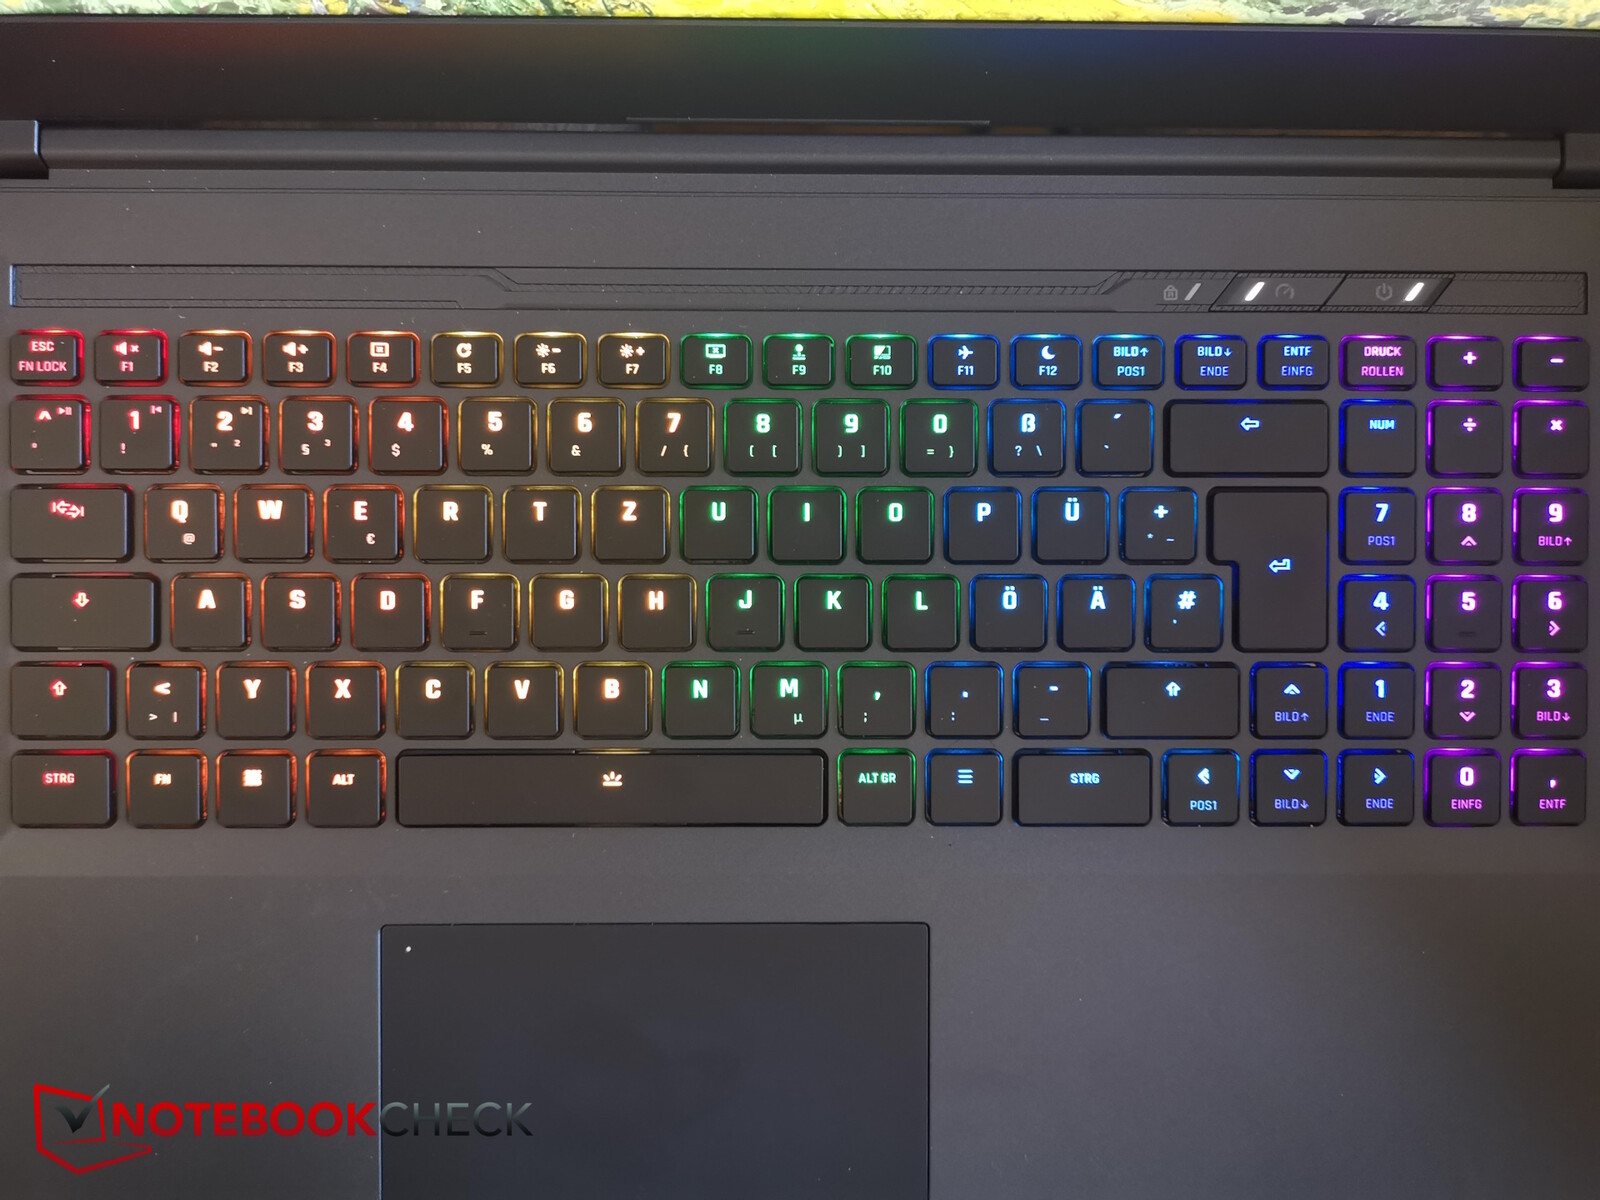
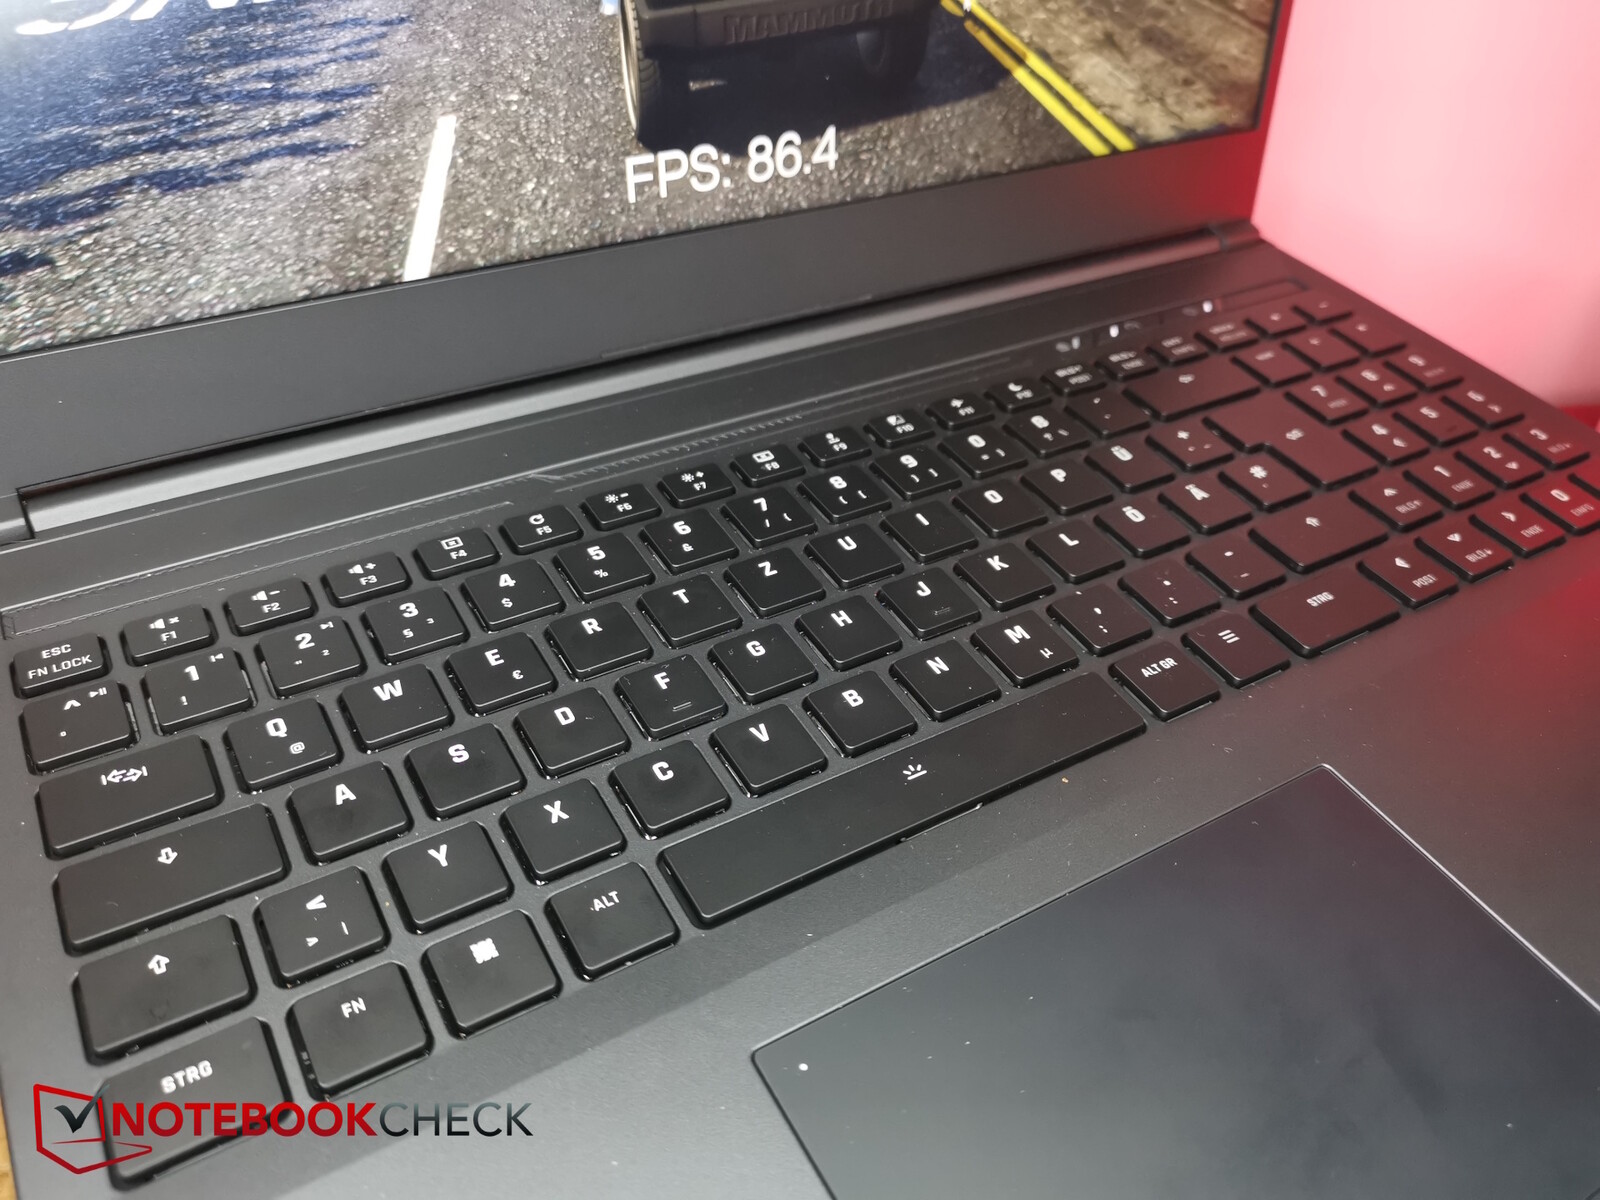
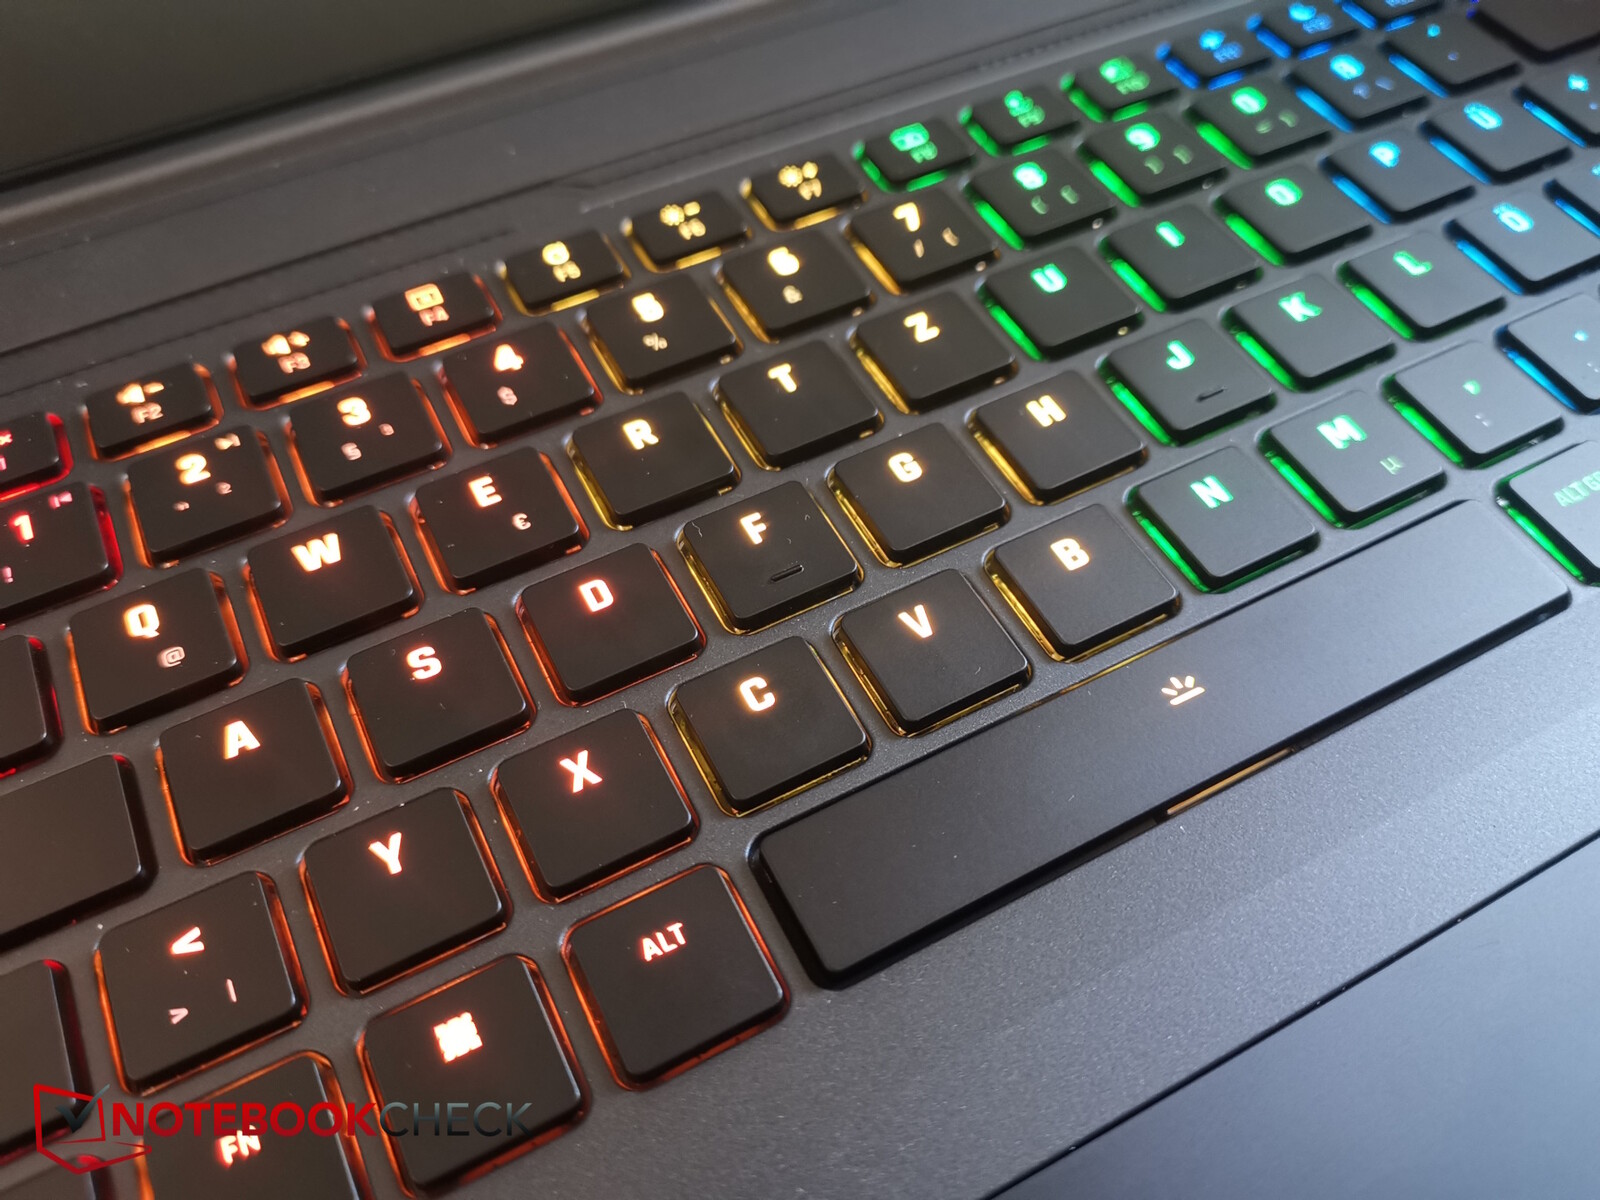
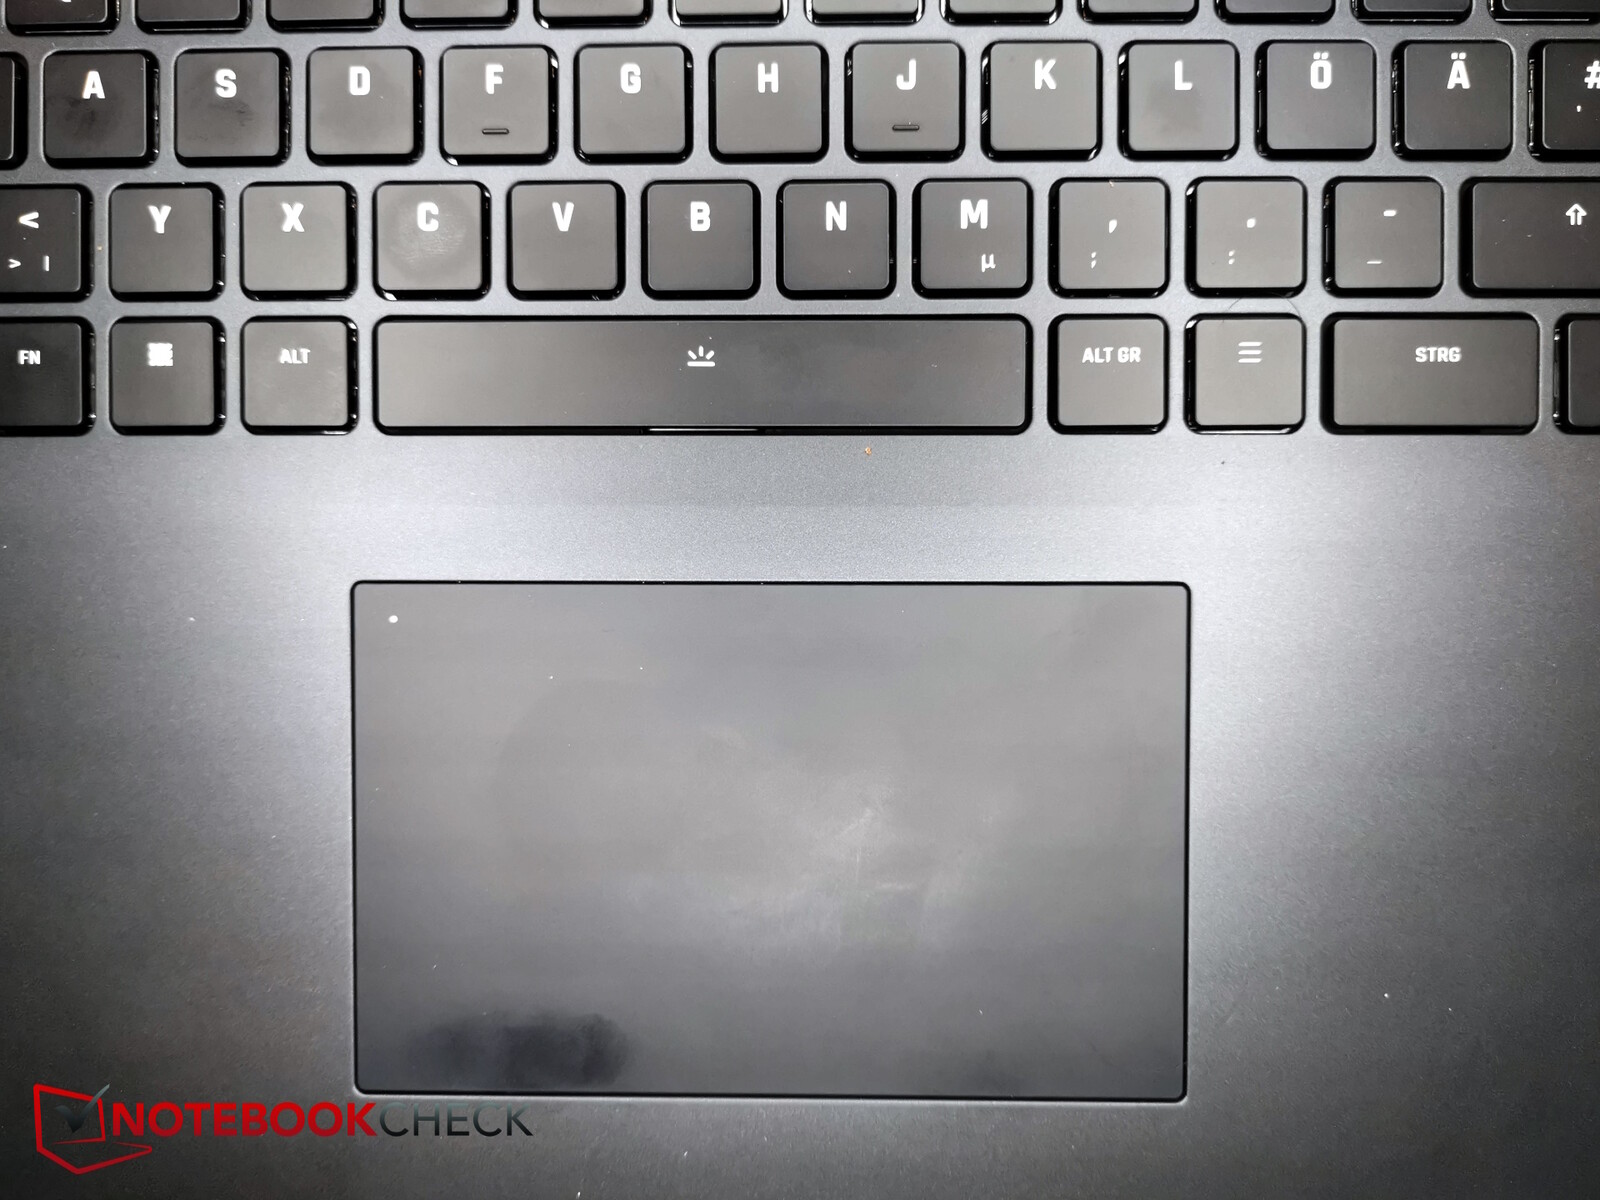
Urządzenia wejściowe - Klawisze mechaniczne lub membranowe
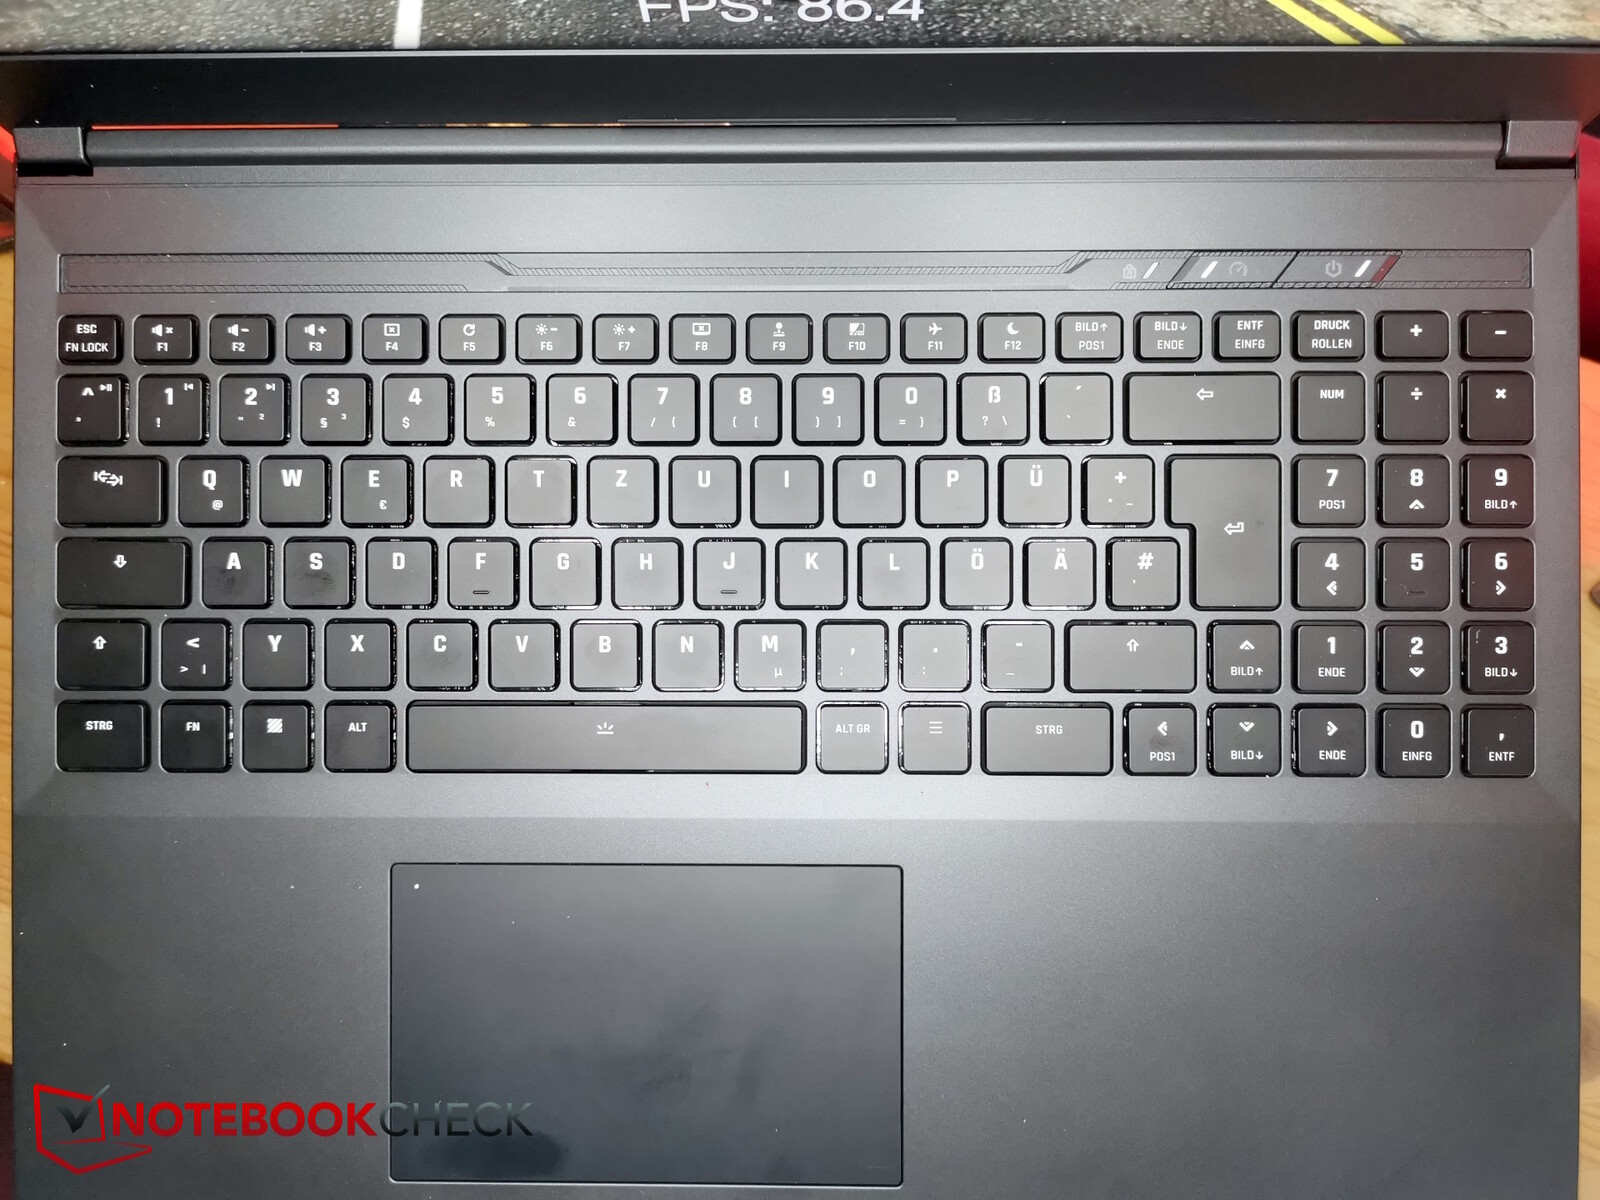
W przypadku tego laptopa można wybierać między klawiszami mechanicznymi, takimi jak te w naszym modelu testowym, a "cichą klawiaturą membranową". Obie są wyposażone w podświetlenie RGB - ale tylko klawiatura mechaniczna ma indywidualnie podświetlane klawisze RGB. Cichsza wersja membranowa ma tylko jednostrefowe podświetlenie RGB.
Klawiatura mechaniczna posiada cichsze przełączniki membranowe tylko w przypadku klawiszy funkcyjnych. Wszystkie inne klawisze mają świetny punkt nacisku i zapewniają wyraźne sprzężenie zwrotne. Trzeba polubić głośny hałas podczas pisania i z pewnością nie nadaje się do zabrania ze sobą do biblioteki.
Jak zwykle, Schenker zaimplementował bardzo schludny układ bez żadnych akcentów. Wszystko mieści się w sześciu prostych rzędach klawiszy - łącznie z klawiaturą numeryczną. Oznacza to, że można znaleźć wszystko bardzo łatwo - zwykle klawisze są dość małe (około 1,45 x 1,45 cm).
Touchpad jest nieco mniejszy (około 11,7 x 7,2 cm), ale jest przyjemny i gładki, nawet jeśli palce nie są całkowicie suche. Podkładkę można (de)aktywować poprzez dwukrotne kliknięcie lewego górnego rogu, a mini dioda LED pokazuje jej aktualny stan. Zintegrowane przyciski zapewniają przyzwoitą informację zwrotną, ale nie są zbyt głośne. Czasami kliknięcie nieco się zacina, co oznacza, że nie jest zwalniane natychmiast po puszczeniu po przeciągnięciu i upuszczeniu.
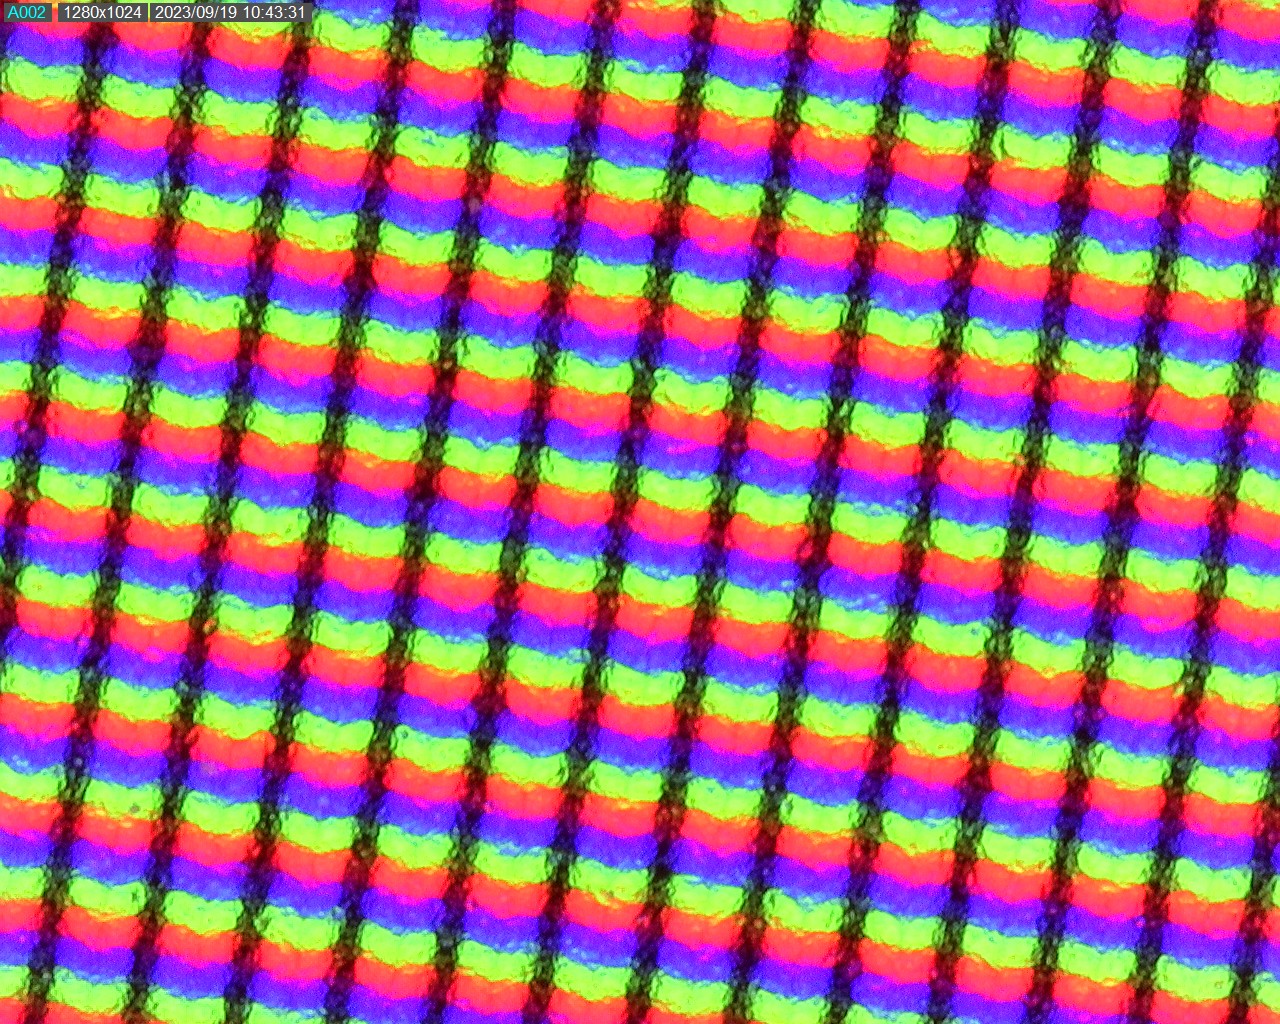
Wyświetlacz - dobrze znany panel IPS 16:10 1600p
Wygląda na to, że Schenker używa tego samego matowego wyświetlacza 1:10 240-Hz o rozdzielczości 1600p we wszystkich swoich 16-calowych modelach. Oznacza to, że widzieliśmy ten sam panel BOE naSchenker Vision 16 ProiXMG Neo 16.
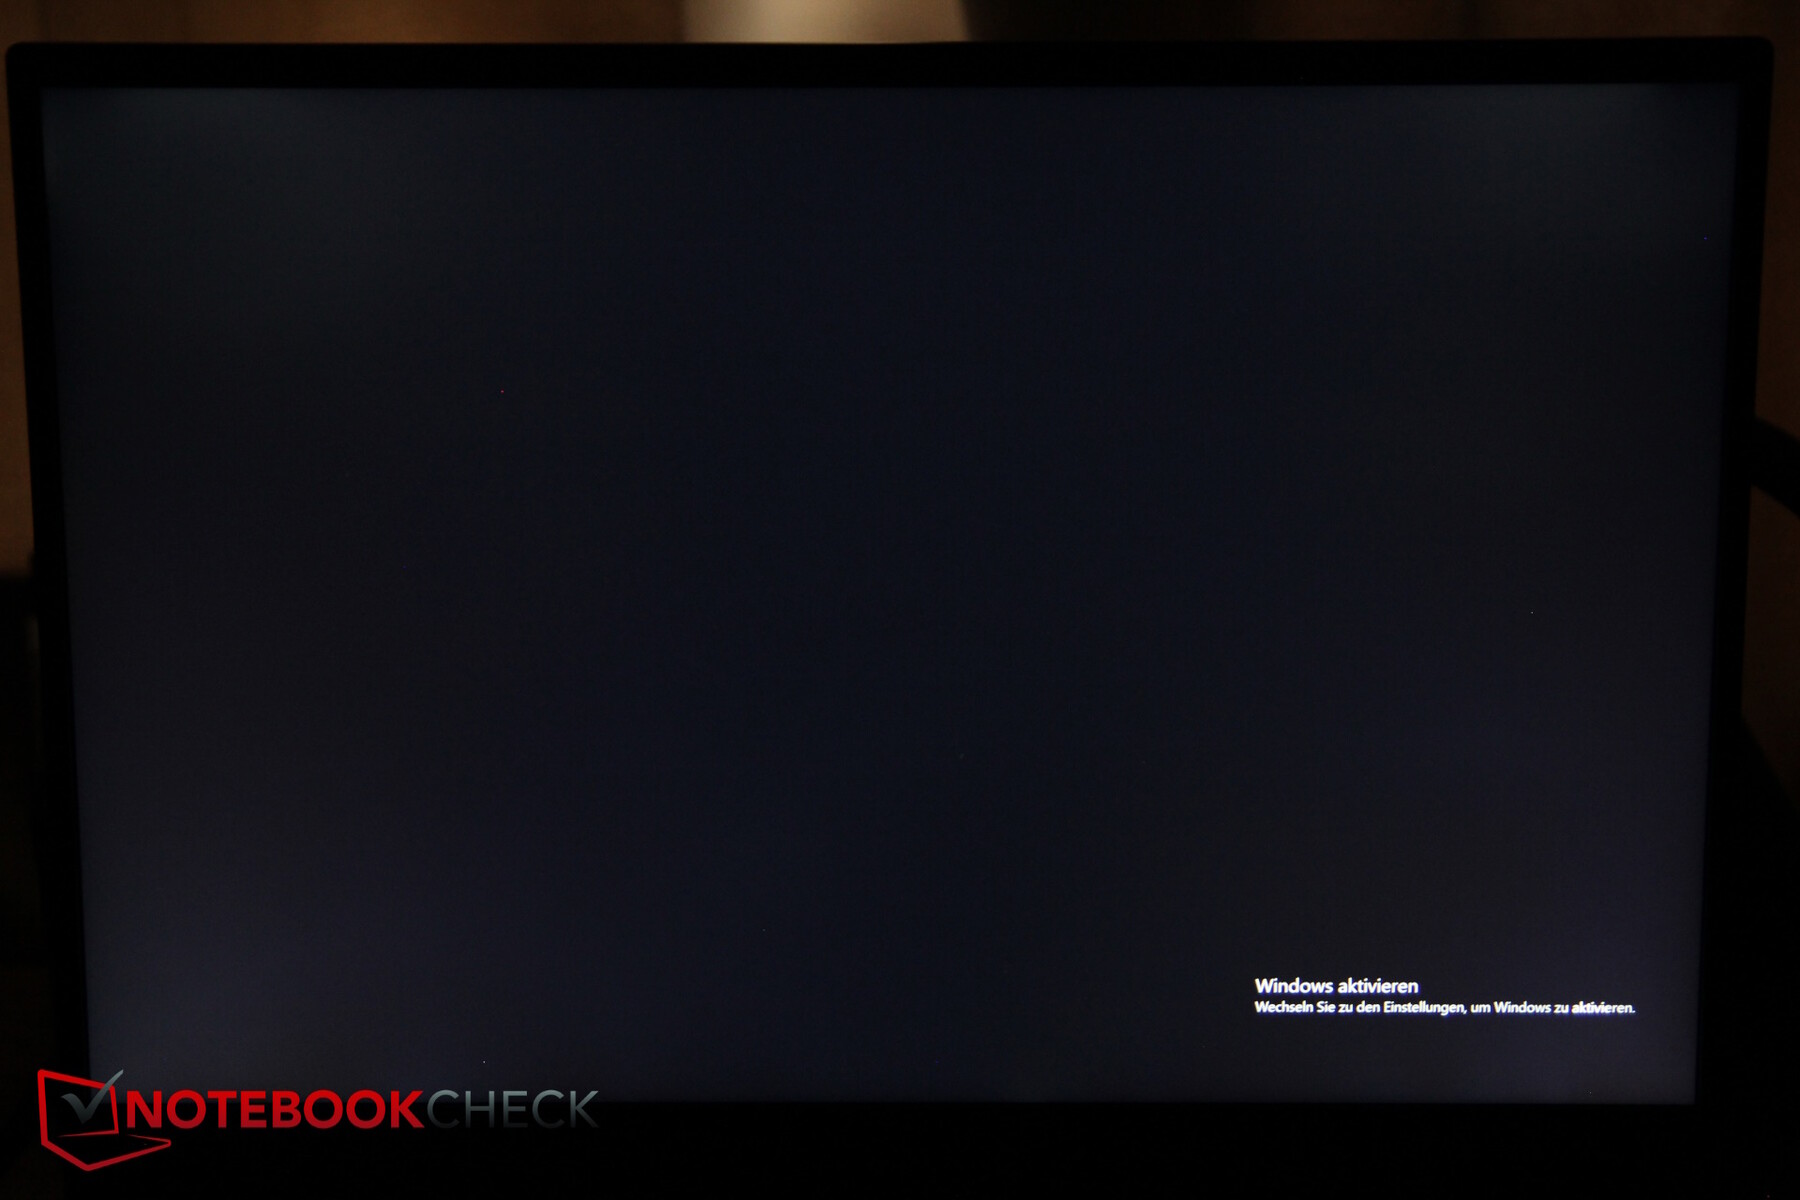
Ekran z pewnością osiąga dobre wartości. Jego jasność wynosi 350 nitów, a kontrast nieco ponad 1000:1. Wyświetlacz sRGB jest wystarczająco szybki i nie zauważyliśmy żadnego PWM. Można zauważyć pewne krwawienie podświetlenia, ale nic złego.
Jedną rzeczą, którą zauważyliśmy, jest to, że zmiana jasności za pomocą specjalnych klawiszy wchodzi w życie dopiero po ponownym puszczeniu klawiszy, co jest trochę denerwujące.
| |||||||||||||||||||||||||
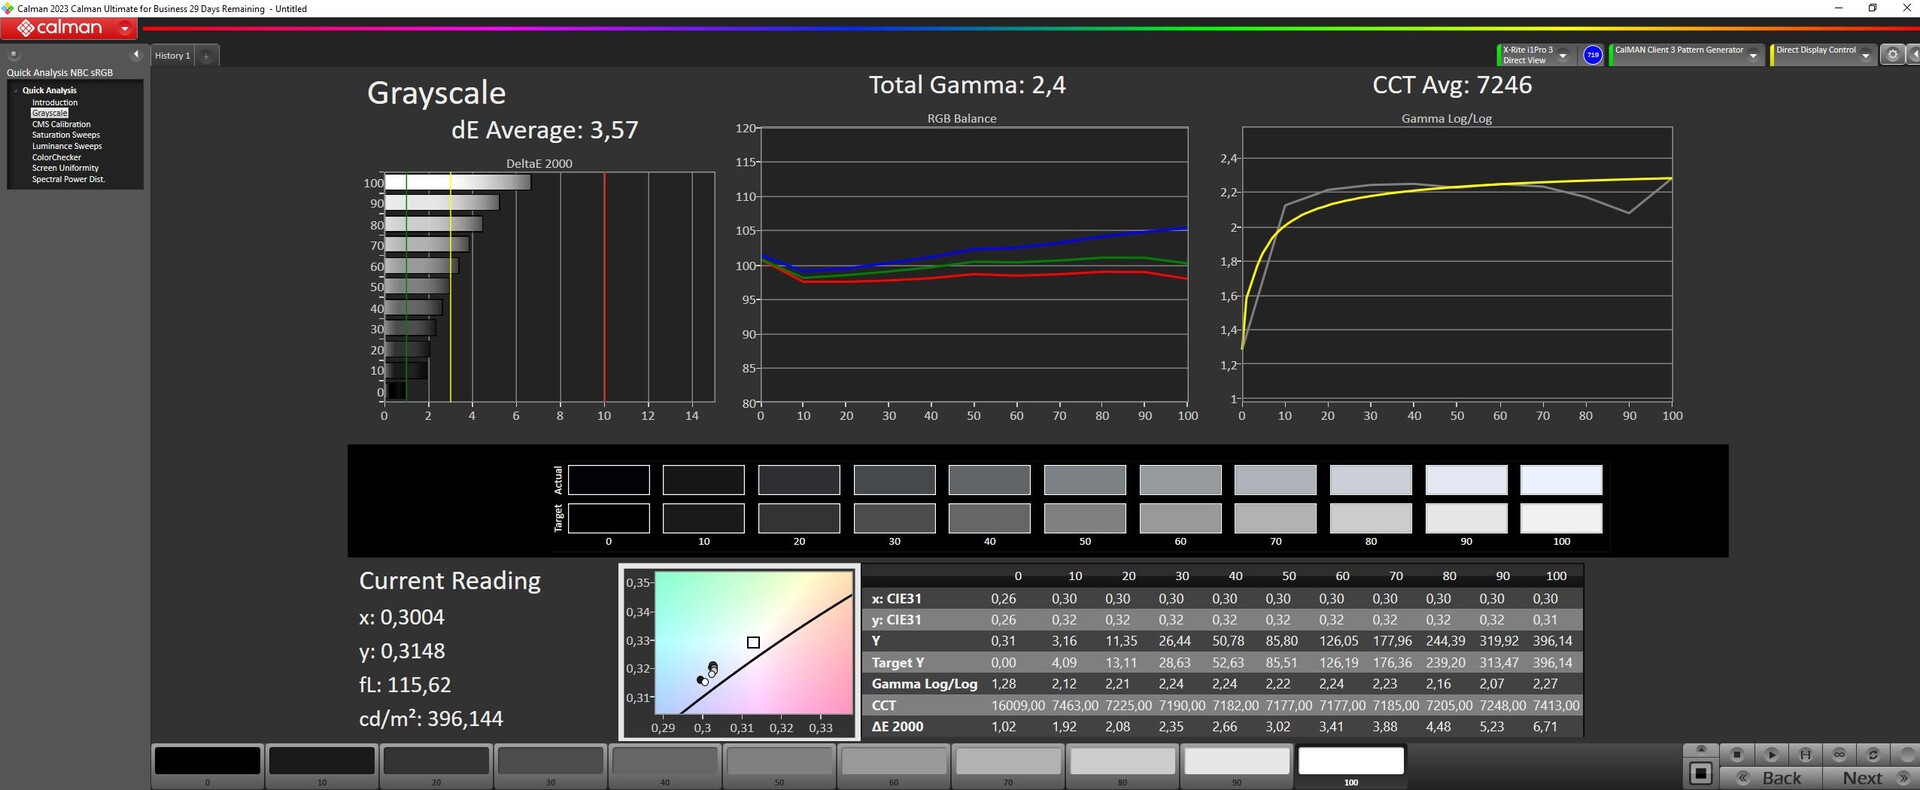
rozświetlenie: 88 %
na akumulatorze: 372 cd/m²
kontrast: 1139:1 (czerń: 0.33 cd/m²)
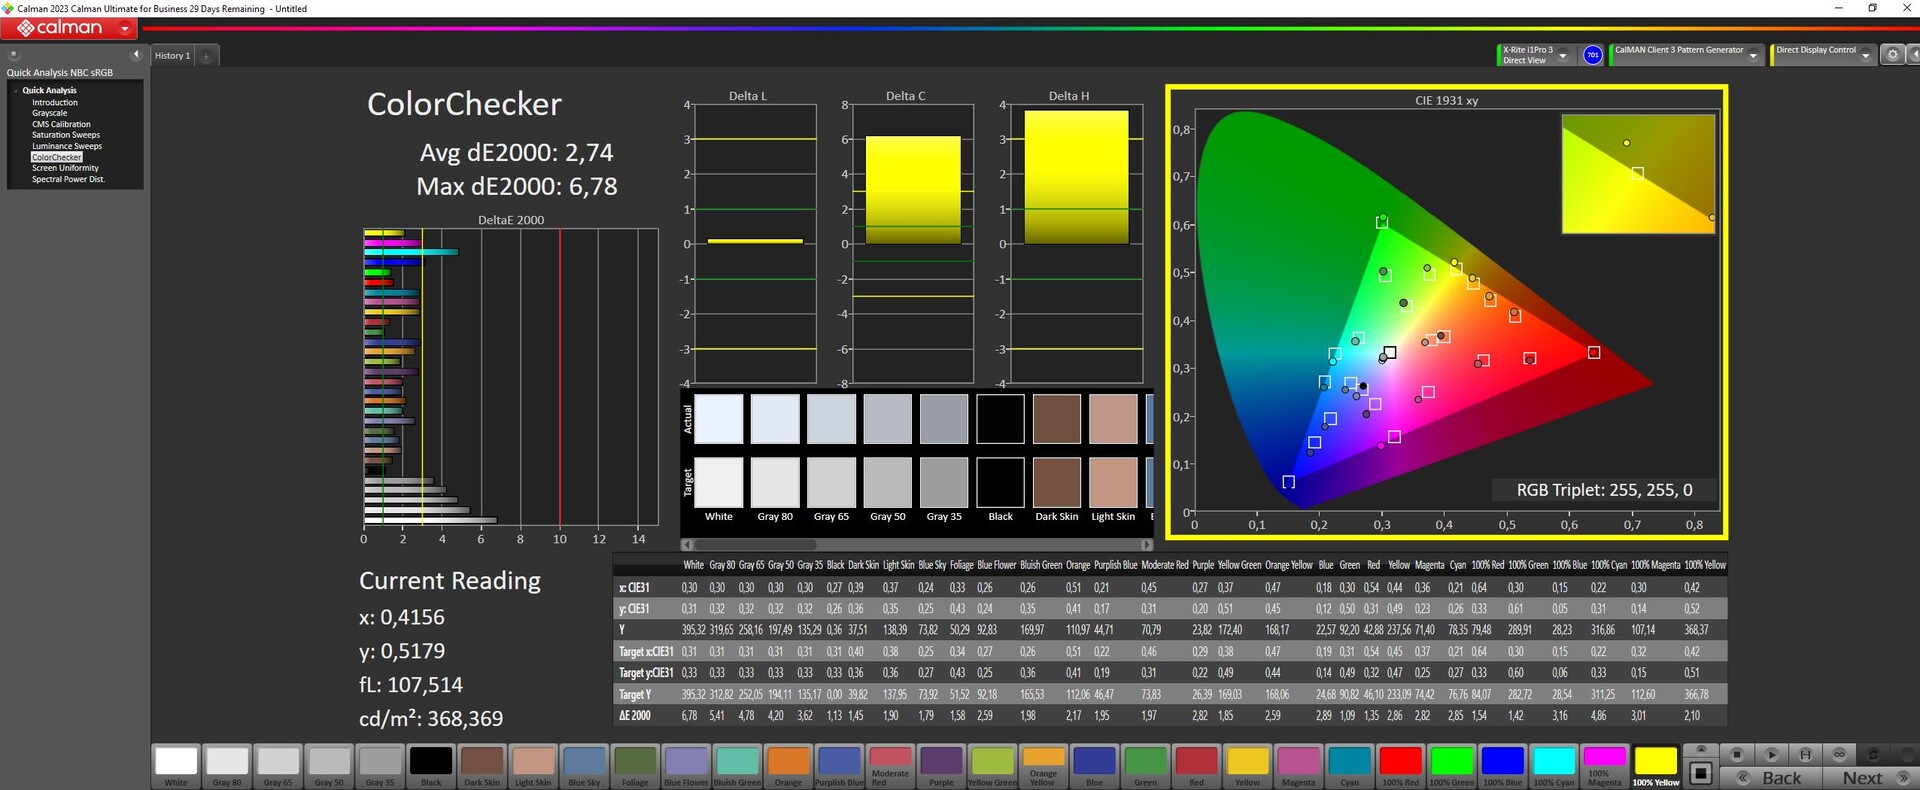
ΔE ColorChecker Calman: 2.74 | ∀{0.5-29.43 Ø4.72}
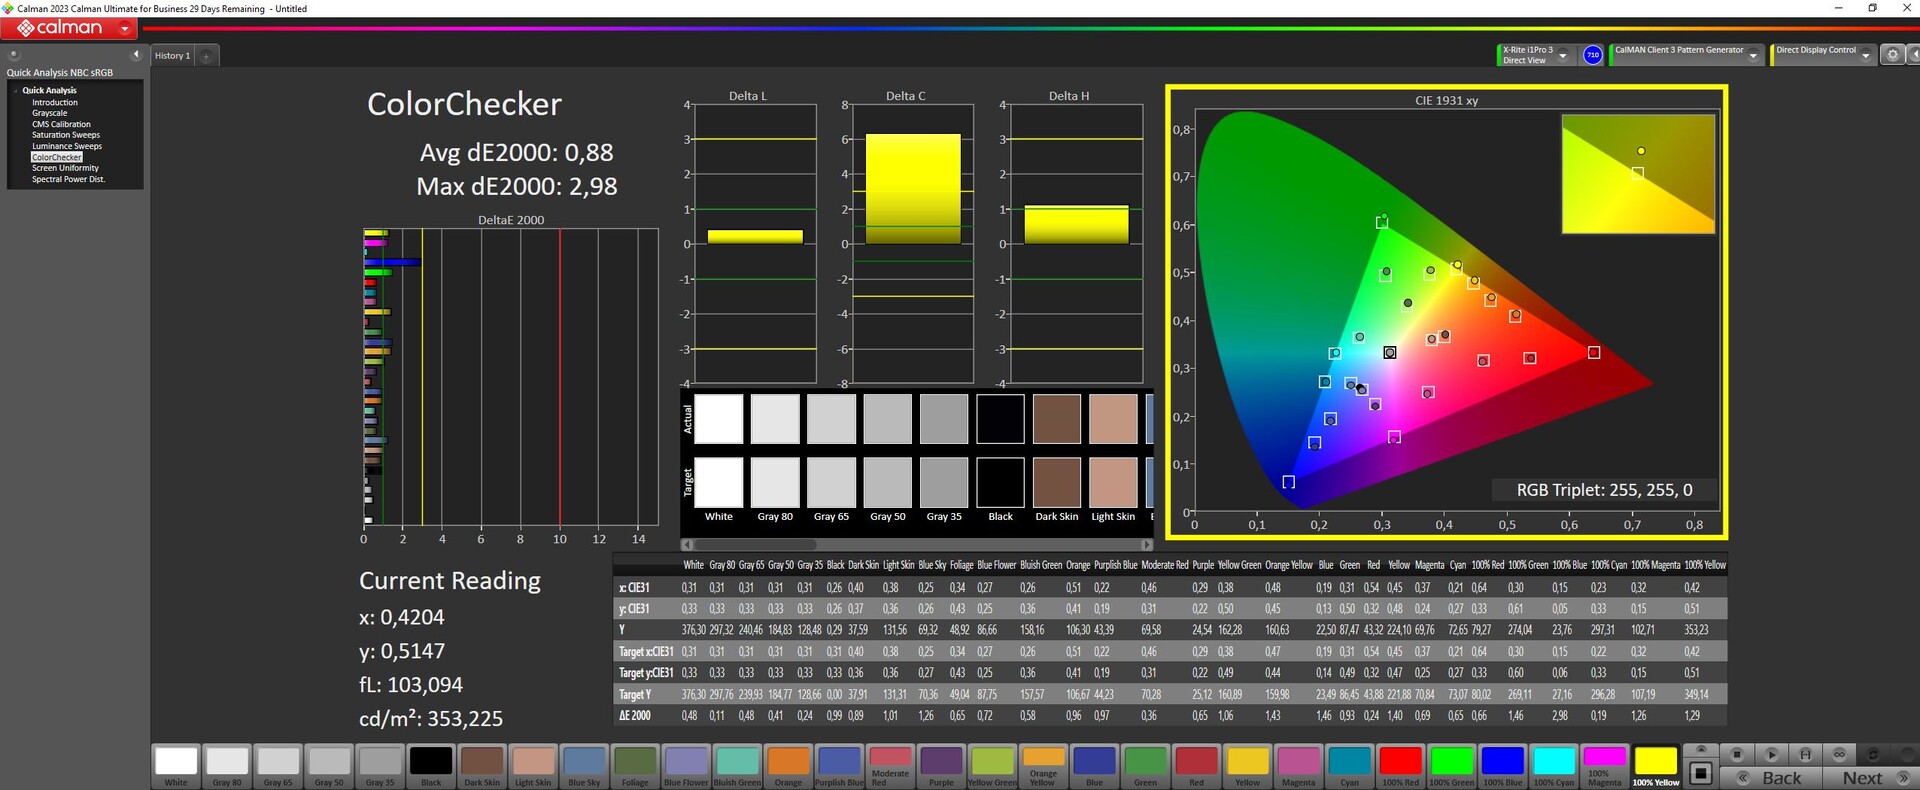
calibrated: 0.88
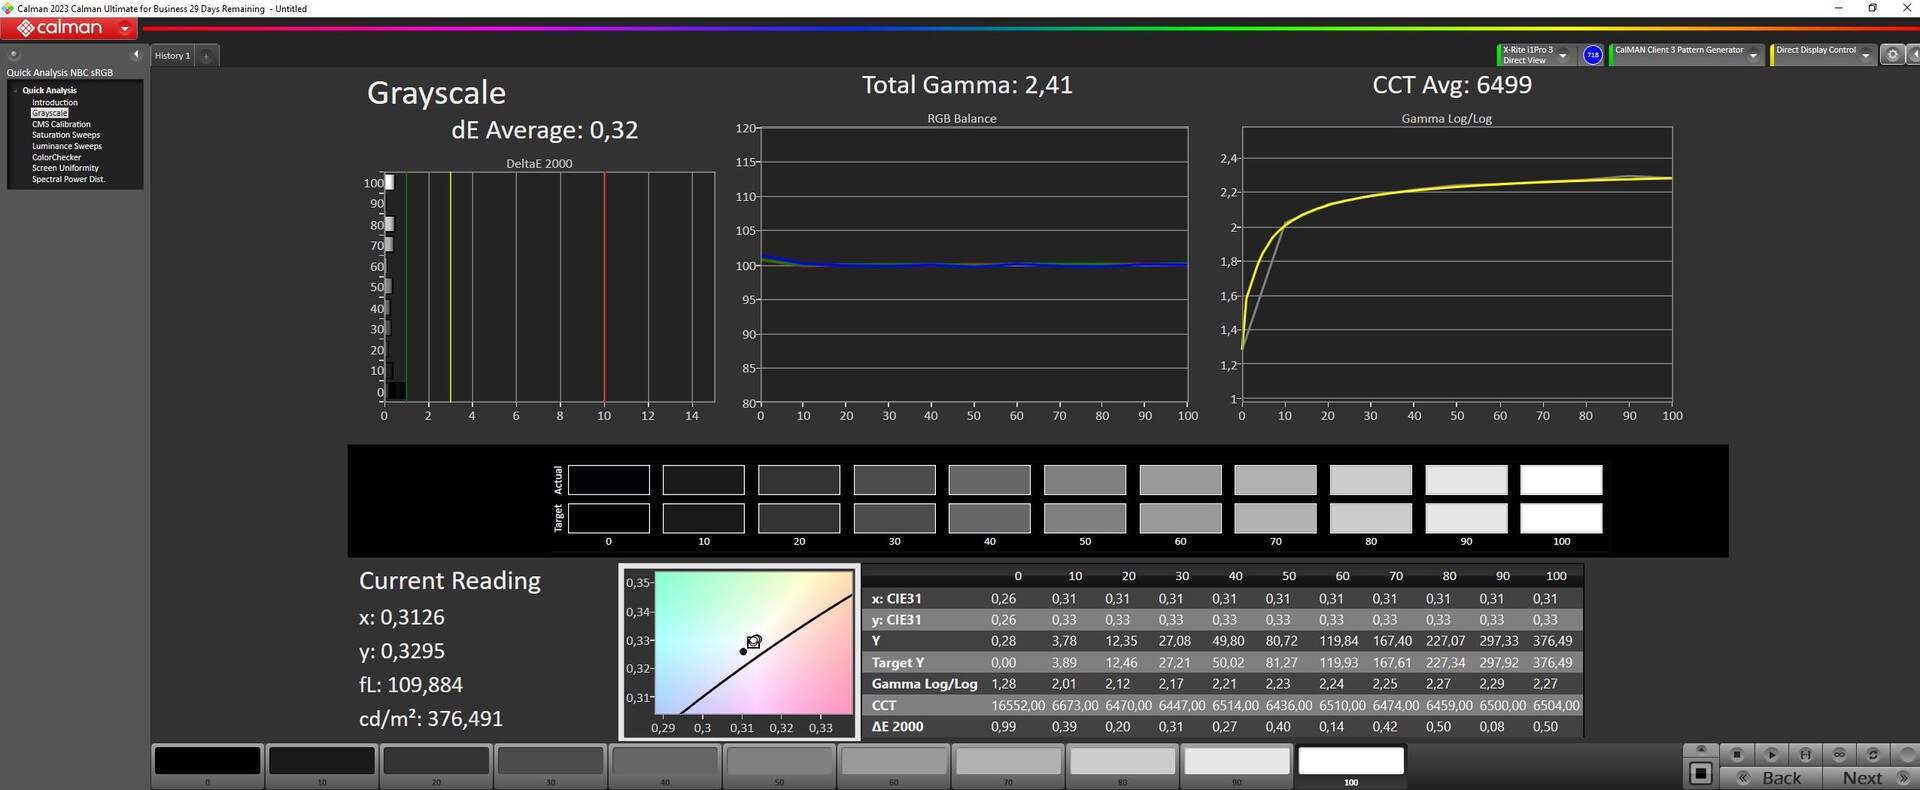
ΔE Greyscale Calman: 3.57 | ∀{0.09-98 Ø4.97}
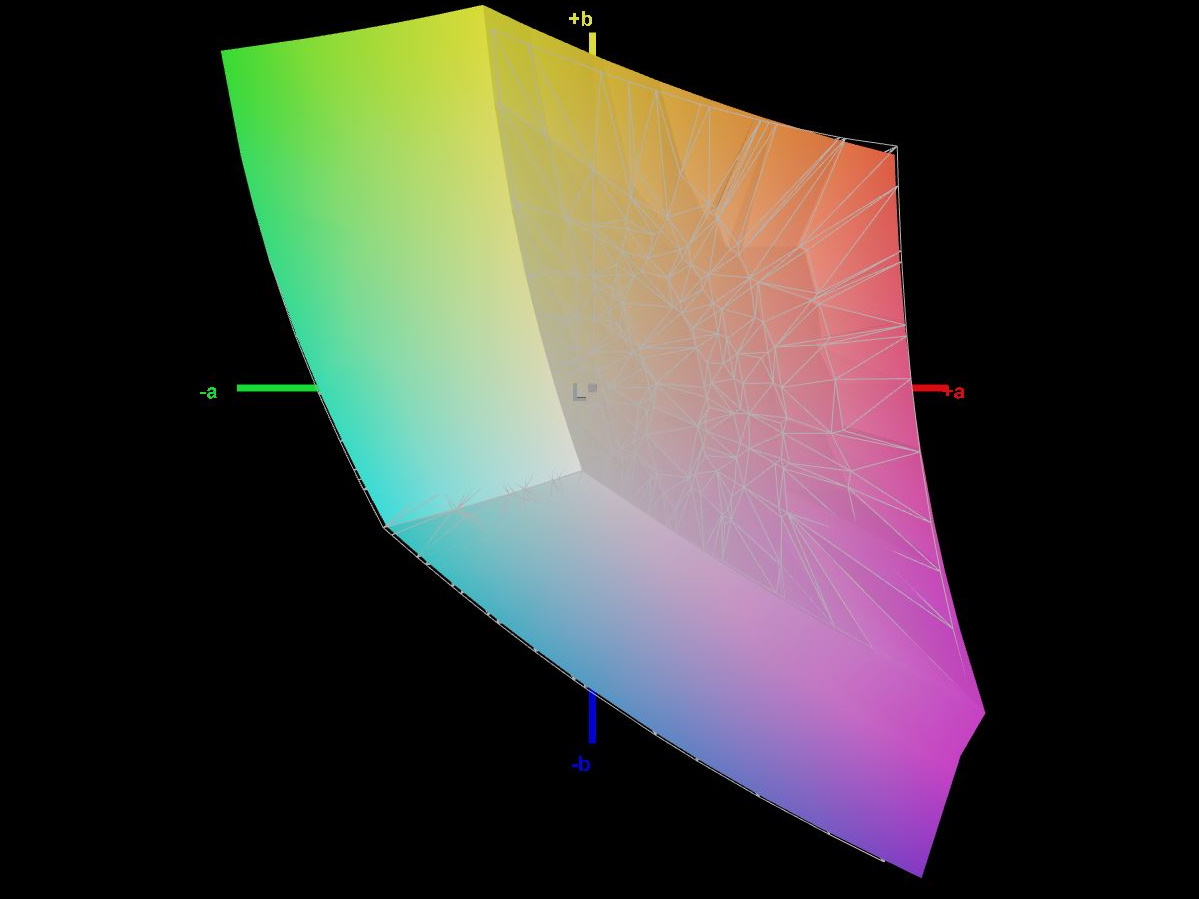
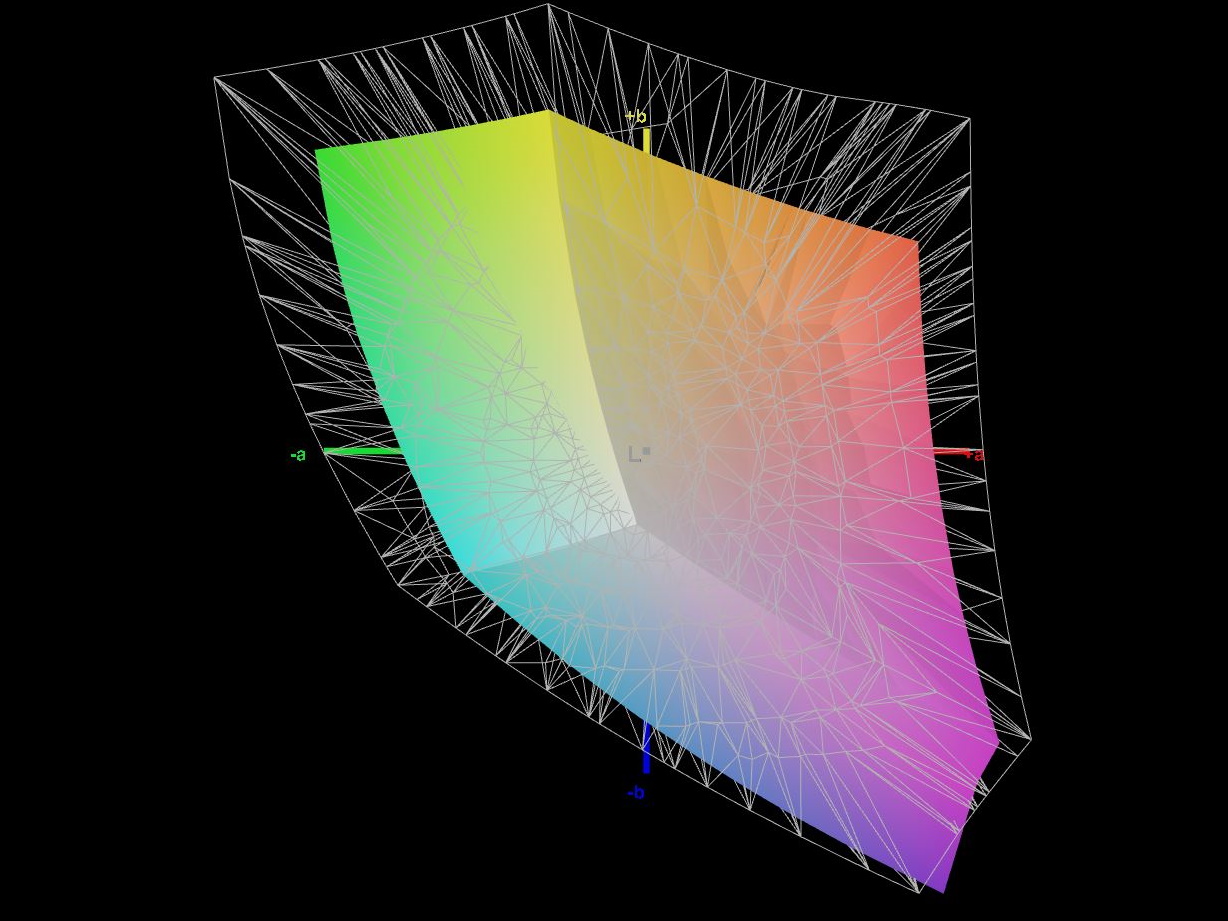
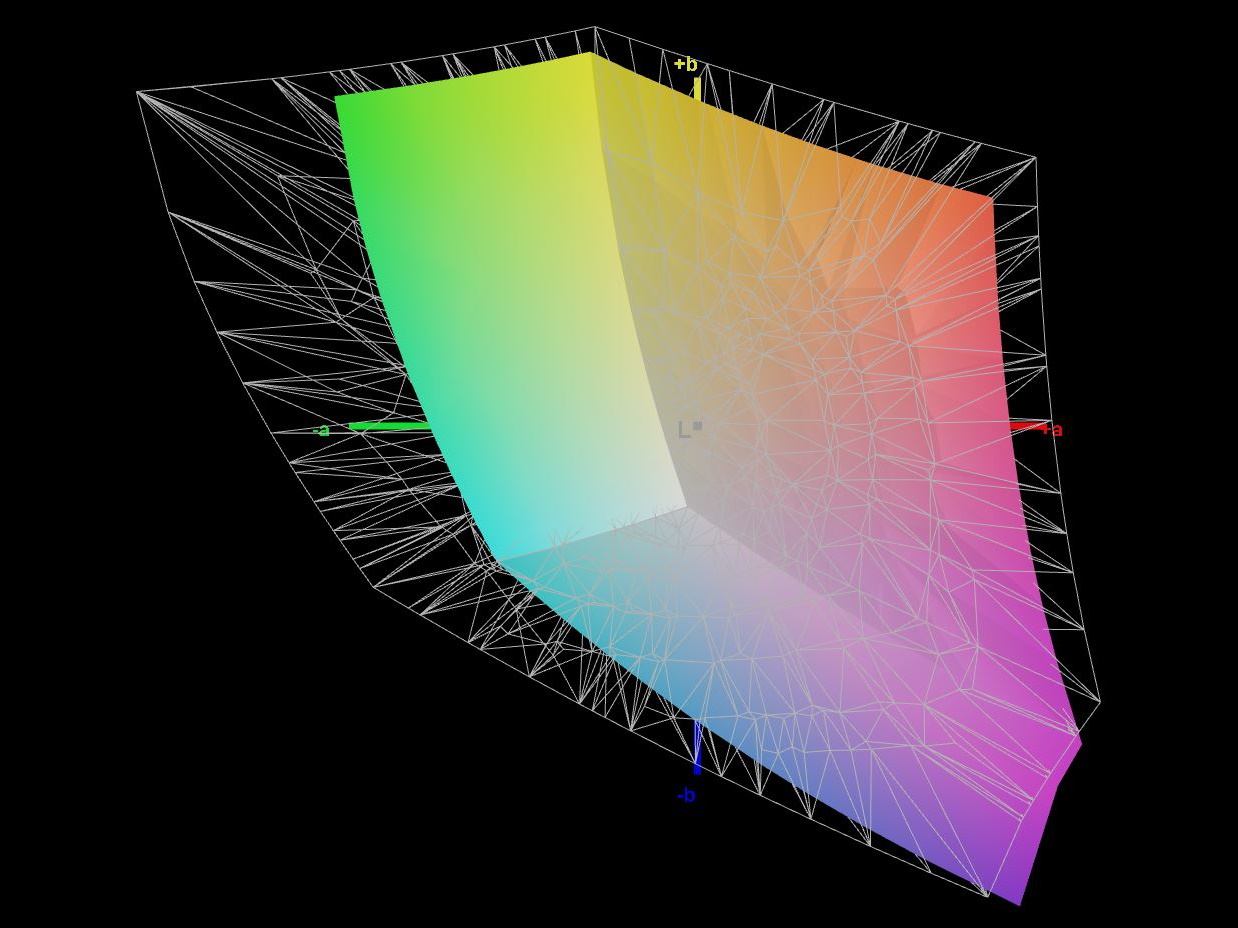
69.6% AdobeRGB 1998 (Argyll 3D)
98.6% sRGB (Argyll 3D)
68.3% Display P3 (Argyll 3D)
Gamma: 2.4
CCT: 7246 K
| Schenker XMG CORE 16 (L23) BOE0AF0 (), IPS, 2560x1600, 16" | Lenovo Legion Pro 5 16ARX8 CSOT T3 MNG007DA1-Q, IPS, 2560x1600, 16" | Acer Nitro 16 AN16-41 BOE CQ NE16QDM-NY1, IPS, 2560x1600, 16" | HP Omen Transcend 16 AUOA3A6, Mini-LED, 2560x1600, 16" | MSI Stealth 16 Studio A13VG AUO26A9, IPS, 2560x1600, 16" | HP Victus 16-r0077ng CMN162D, IPS, 1920x1080, 16.1" | |
|---|---|---|---|---|---|---|
| Display | 3% | 0% | 24% | 21% | -1% | |
| Display P3 Coverage (%) | 68.3 | 70.4 3% | 67.9 -1% | 99.2 45% | 96.4 41% | 66.7 -2% |
| sRGB Coverage (%) | 98.6 | 99.6 1% | 99.1 1% | 100 1% | 99.7 1% | 98 -1% |
| AdobeRGB 1998 Coverage (%) | 69.6 | 72.6 4% | 69.9 0% | 87.6 26% | 84.8 22% | 69 -1% |
| Response Times | 5% | 21% | -214% | 41% | -13% | |
| Response Time Grey 50% / Grey 80% * (ms) | 13.2 ? | 7 ? 47% | 11 ? 17% | 26.4 ? -100% | 4.4 ? 67% | 13.3 ? -1% |
| Response Time Black / White * (ms) | 6.6 ? | 9.1 ? -38% | 5 ? 24% | 28.2 ? -327% | 5.6 ? 15% | 8.2 ? -24% |
| PWM Frequency (Hz) | 3506 ? | |||||
| Screen | 26% | 18% | 195% | -30% | 17% | |
| Brightness middle (cd/m²) | 376 | 355.3 -6% | 520 38% | 791.1 110% | 424 13% | 308 -18% |
| Brightness (cd/m²) | 358 | 340 -5% | 494 38% | 800 123% | 411 15% | 285 -20% |
| Brightness Distribution (%) | 88 | 91 3% | 91 3% | 95 8% | 88 0% | 85 -3% |
| Black Level * (cd/m²) | 0.33 | 0.32 3% | 0.39 -18% | 0.04 88% | 0.37 -12% | 0.25 24% |
| Contrast (:1) | 1139 | 1110 -3% | 1333 17% | 19778 1636% | 1146 1% | 1232 8% |
| Colorchecker dE 2000 * | 2.74 | 1.13 59% | 1.94 29% | 4.37 -59% | 3.04 -11% | 1.3 53% |
| Colorchecker dE 2000 max. * | 6.78 | 2.78 59% | 5.62 17% | 10.39 -53% | 7.5 -11% | 2.76 59% |
| Colorchecker dE 2000 calibrated * | 0.88 | 0.32 64% | 0.74 16% | 1.04 -18% | 3.04 -245% | 0.92 -5% |
| Greyscale dE 2000 * | 3.57 | 1.4 61% | 2.94 18% | 6.5 -82% | 4.34 -22% | 1.7 52% |
| Gamma | 2.4 92% | 2.24 98% | 2.37 93% | 2.28 96% | 2.32 95% | 2.167 102% |
| CCT | 7246 90% | 6372 102% | 6443 101% | 6000 108% | 6952 93% | 6767 96% |
| Całkowita średnia (program / ustawienia) | 11% /
18% | 13% /
14% | 2% /
100% | 11% /
-9% | 1% /
9% |
* ... im mniej tym lepiej
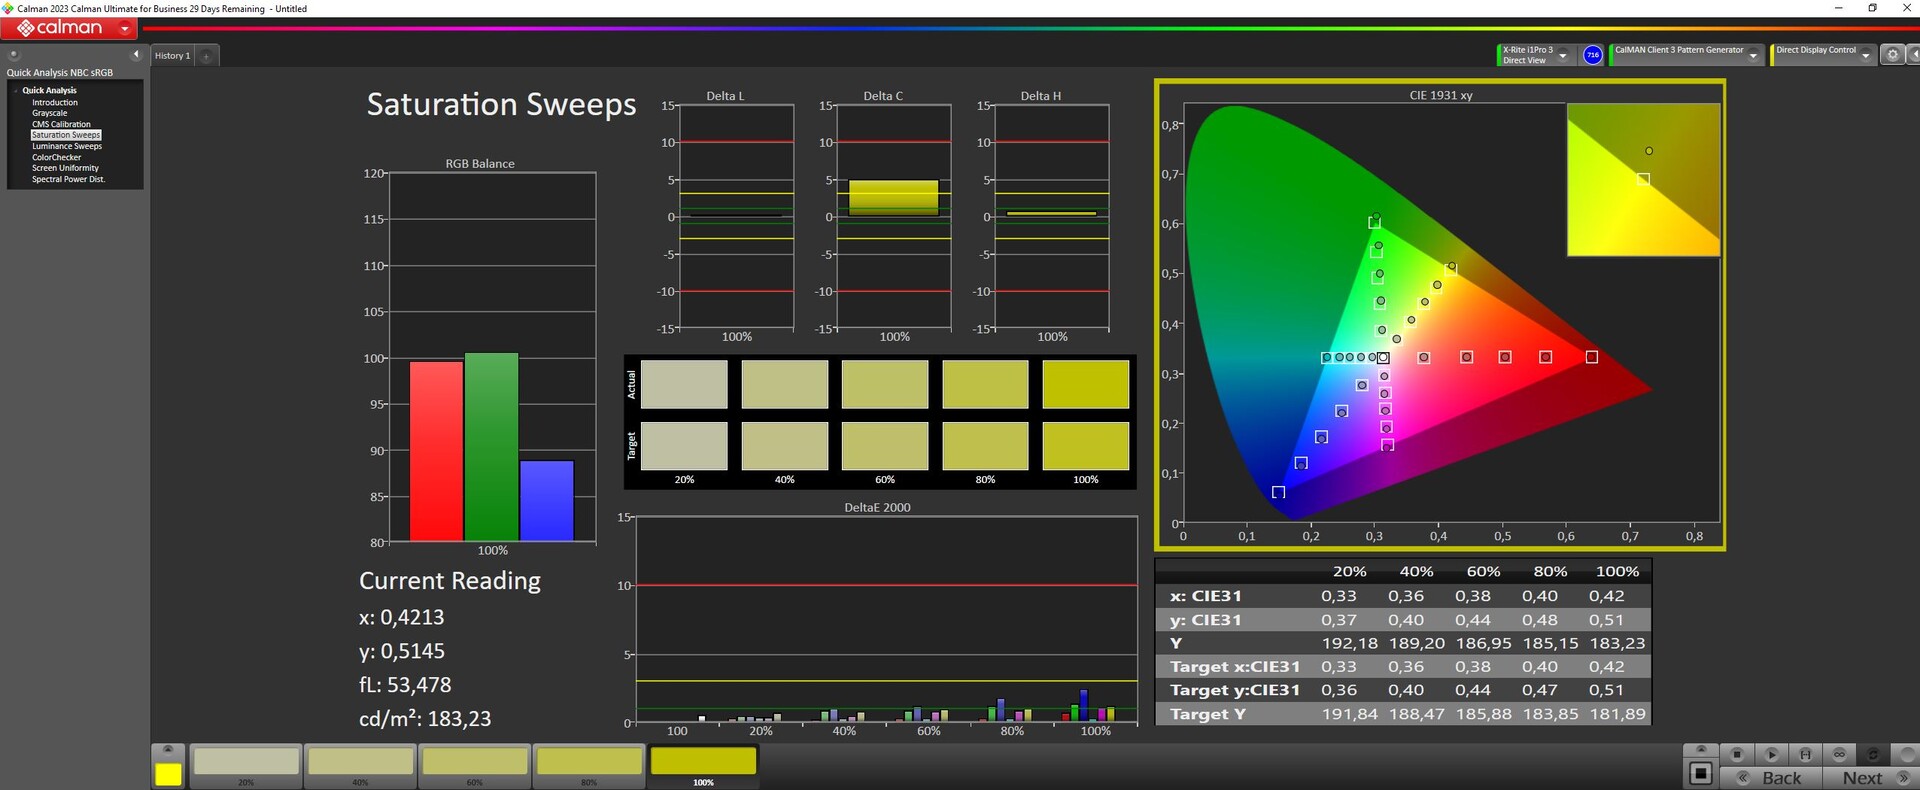
Korzystając z naszego urządzenia do pomiaru kolorów Xrite i oprogramowania Calman, byliśmy w stanie znacznie poprawić dobre (ale nie do końca optymalne) odwzorowanie kolorów ekranu zaraz po wyjęciu z pudełka, co doprowadziło do tego, że wartości DeltaE kolorów i skali szarości (odchylenia od normy) spadły do 1. Oznacza to, że wyświetlacz nadaje się do edycji zdjęć - przynajmniej w przestrzeni kolorów sRGB.

Wyświetl czasy reakcji
| ↔ Czas reakcji od czerni do bieli | ||
|---|---|---|
| 6.6 ms ... wzrost ↗ i spadek ↘ łącznie | ↗ 2.5 ms wzrost | 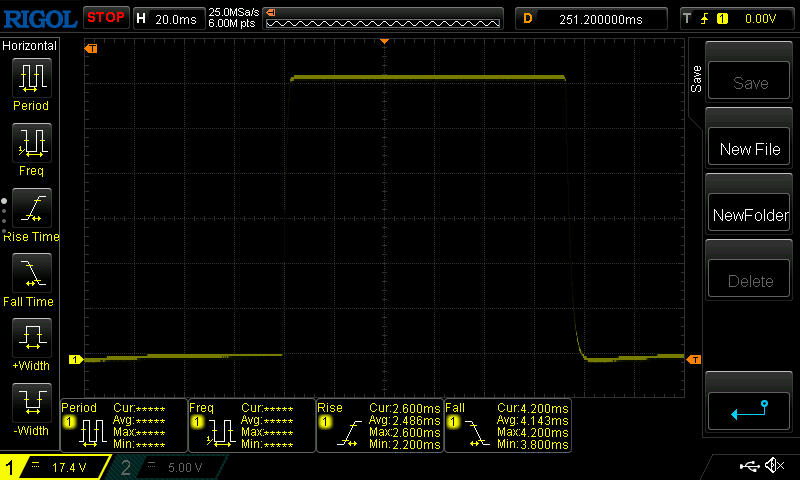 |
| ↘ 4.1 ms upadek | ||
| W naszych testach ekran wykazuje bardzo szybką reakcję i powinien bardzo dobrze nadawać się do szybkich gier. Dla porównania, wszystkie testowane urządzenia wahają się od 0.1 (minimum) do 240 (maksimum) ms. » 21 % wszystkich urządzeń jest lepszych. Oznacza to, że zmierzony czas reakcji jest lepszy od średniej wszystkich testowanych urządzeń (19.9 ms). | ||
| ↔ Czas reakcji 50% szarości do 80% szarości | ||
| 13.2 ms ... wzrost ↗ i spadek ↘ łącznie | ↗ 6.1 ms wzrost | 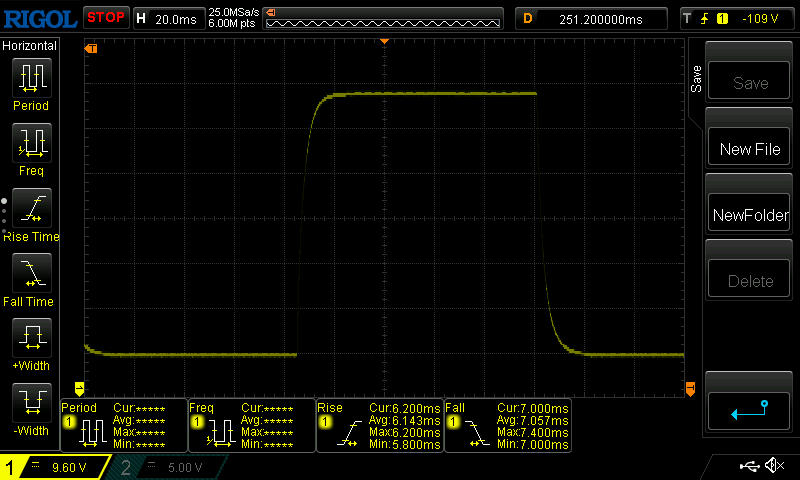 |
| ↘ 7.1 ms upadek | ||
| W naszych testach ekran wykazuje dobry współczynnik reakcji, ale może być zbyt wolny dla graczy rywalizujących ze sobą. Dla porównania, wszystkie testowane urządzenia wahają się od 0.165 (minimum) do 636 (maksimum) ms. » 27 % wszystkich urządzeń jest lepszych. Oznacza to, że zmierzony czas reakcji jest lepszy od średniej wszystkich testowanych urządzeń (31.1 ms). | ||
Migotanie ekranu / PWM (modulacja szerokości impulsu)
| Migotanie ekranu/nie wykryto PWM | 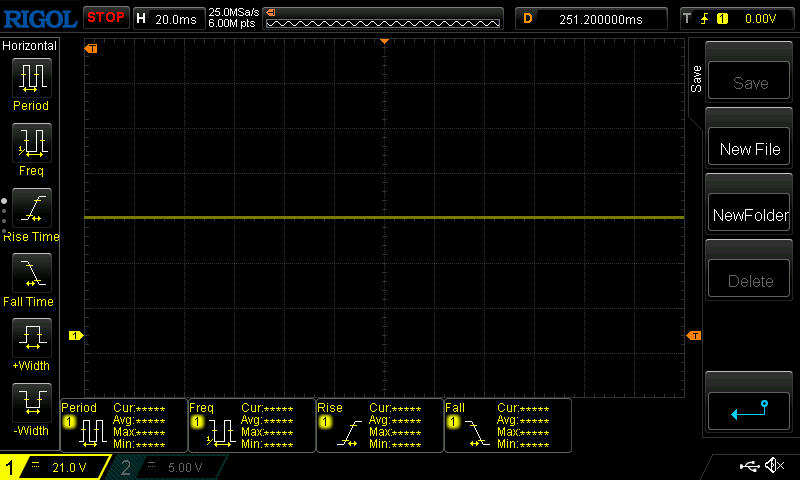 | ||
Dla porównania: 52 % wszystkich testowanych urządzeń nie używa PWM do przyciemniania wyświetlacza. Jeśli wykryto PWM, zmierzono średnio 7784 (minimum: 5 - maksimum: 343500) Hz. | |||
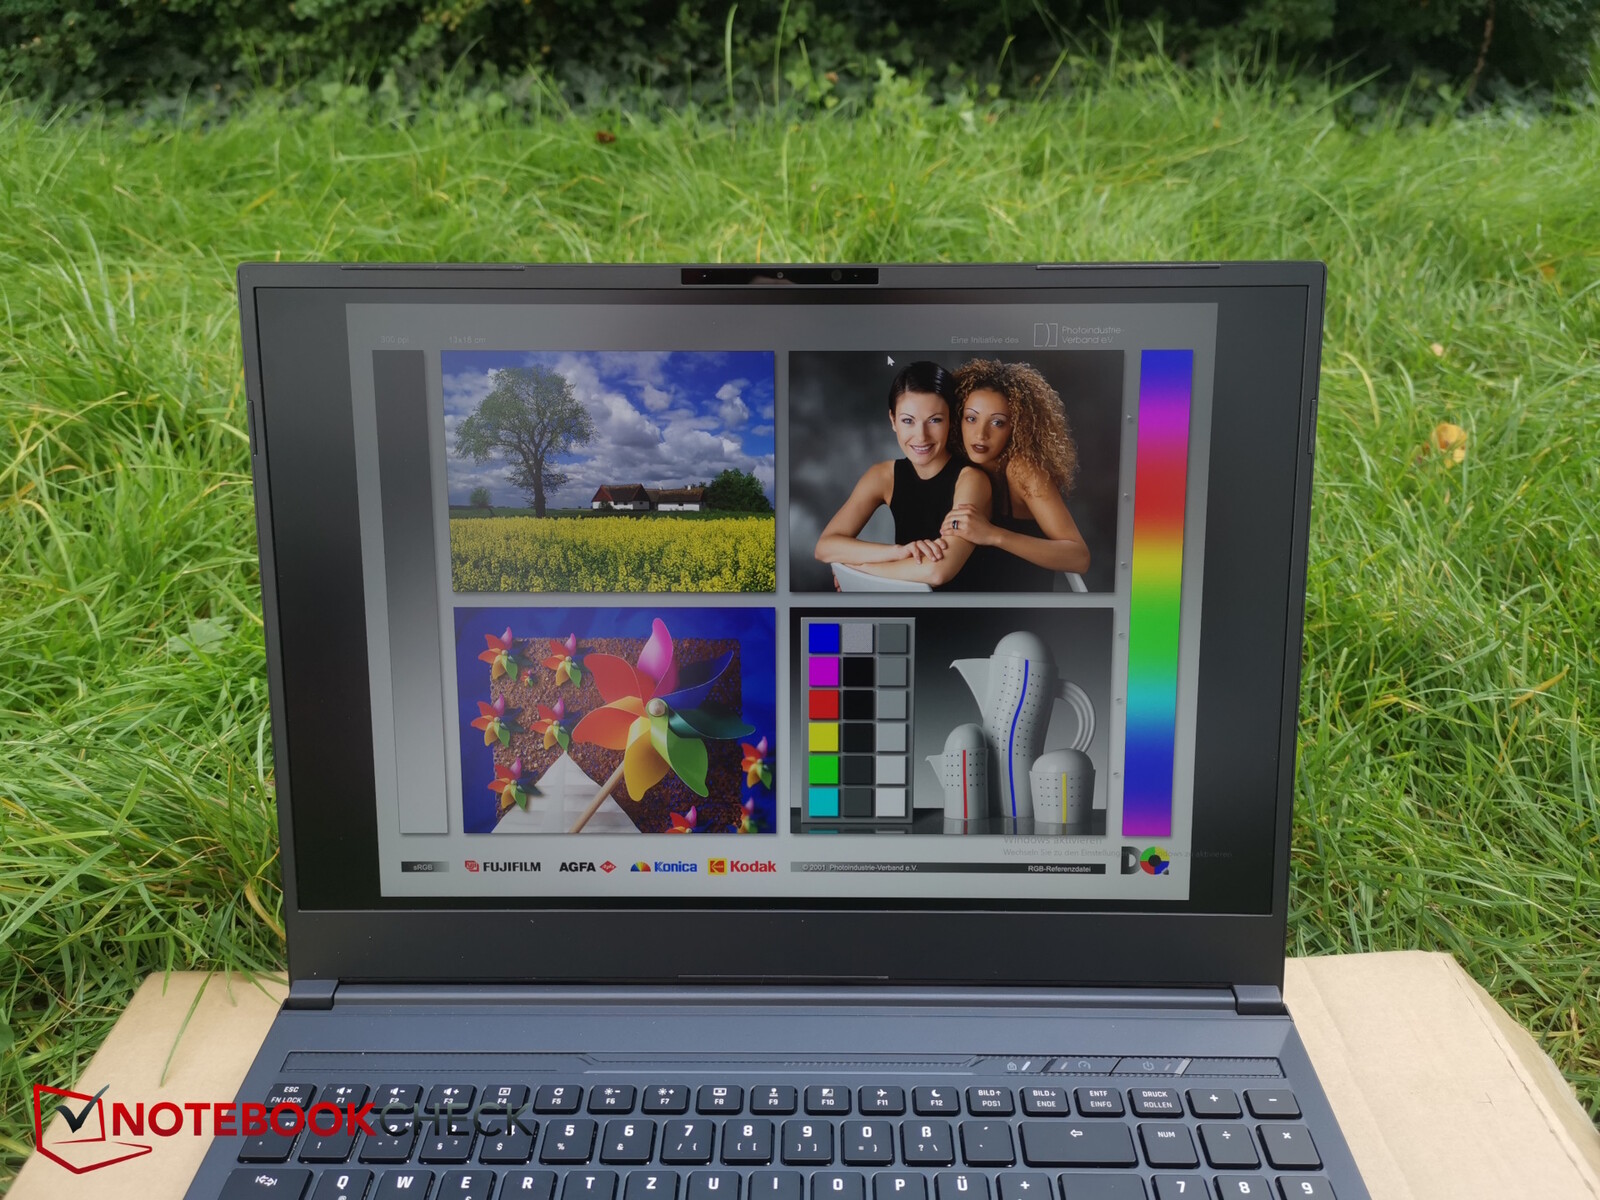
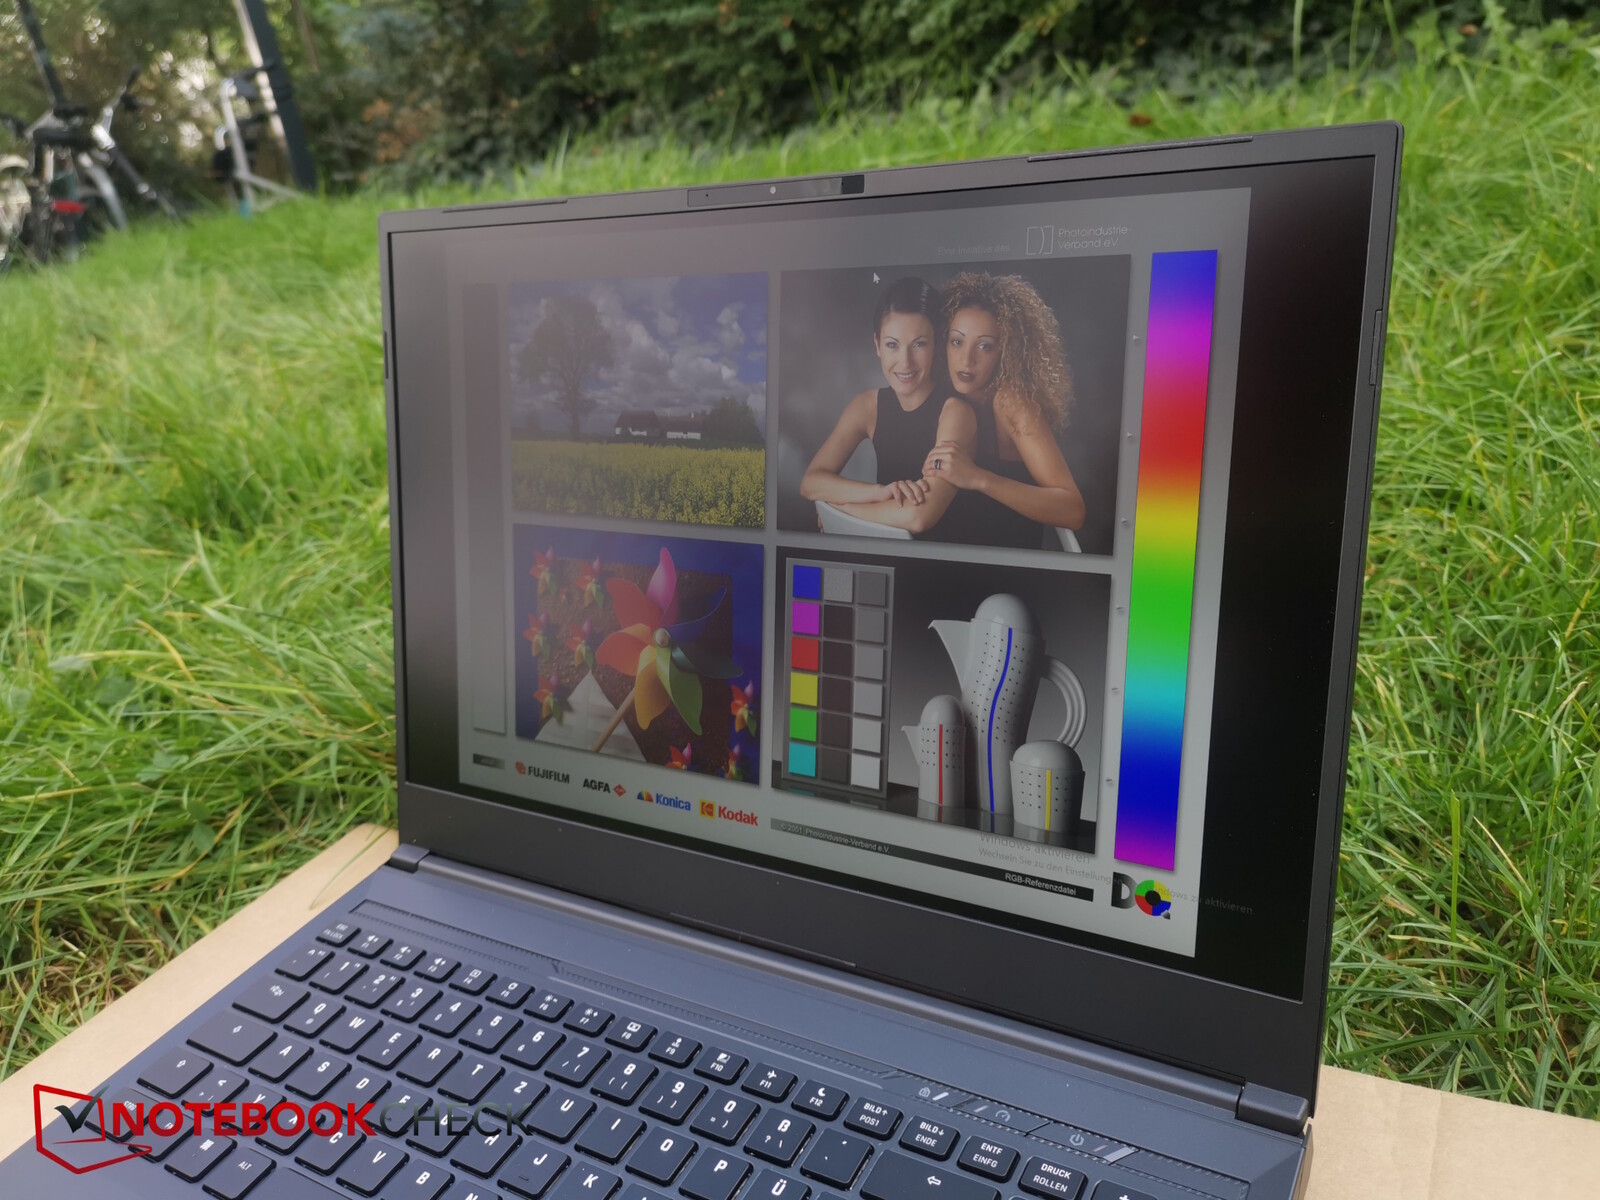
Na zewnątrz można dobrze czytać z wyświetlacza w zacienionych miejscach, gdy jest się do niego zwróconym przodem.

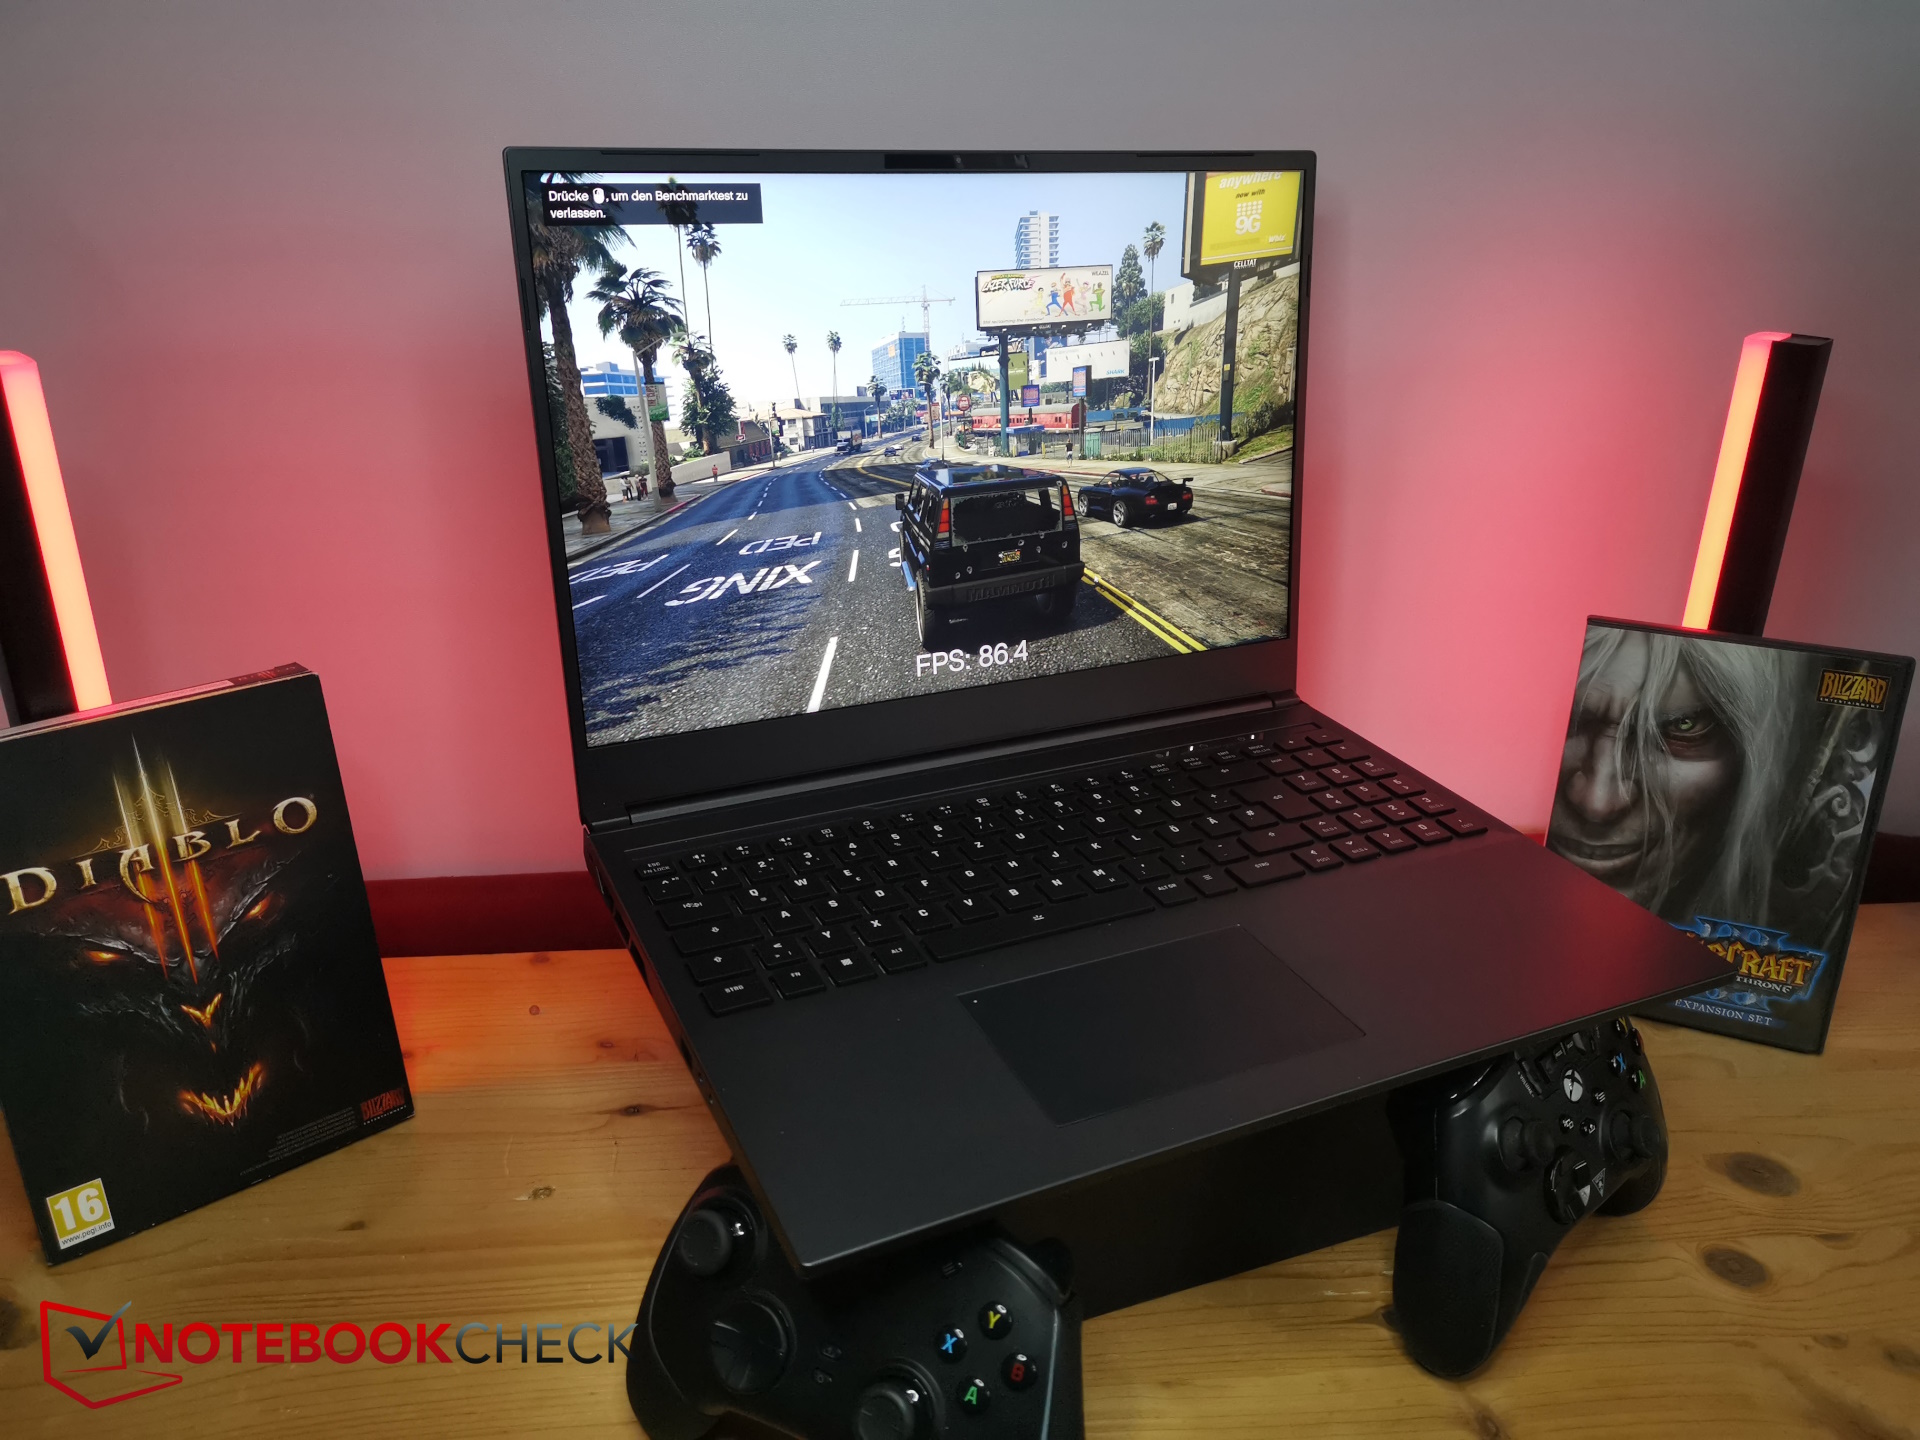
Wydajność - mocne RTX 4070 z Ryzen 7
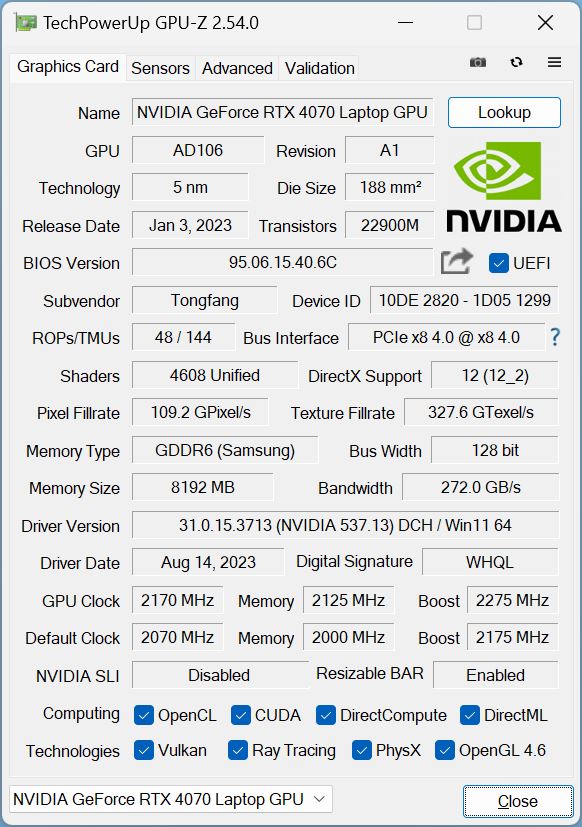
Karta graficznaRTX 4070sprawia, że Core 16 jest laptopem gamingowym. Urządzenie może być również interesujące dla profesjonalistów i twórców - jednak przestrzeń kolorów sRGB może nie być wystarczająca dla tych osób, a DisplayP3 nie jest objęty.
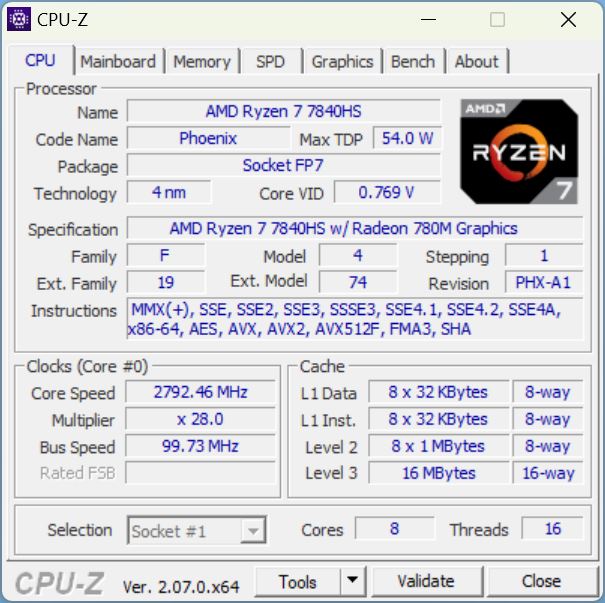
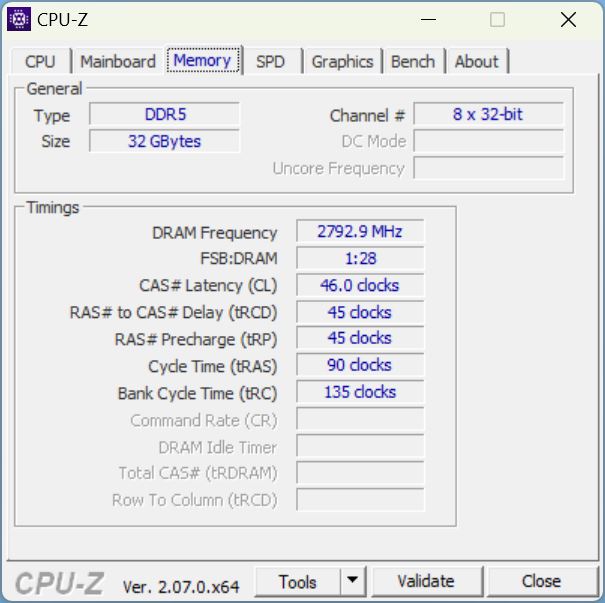
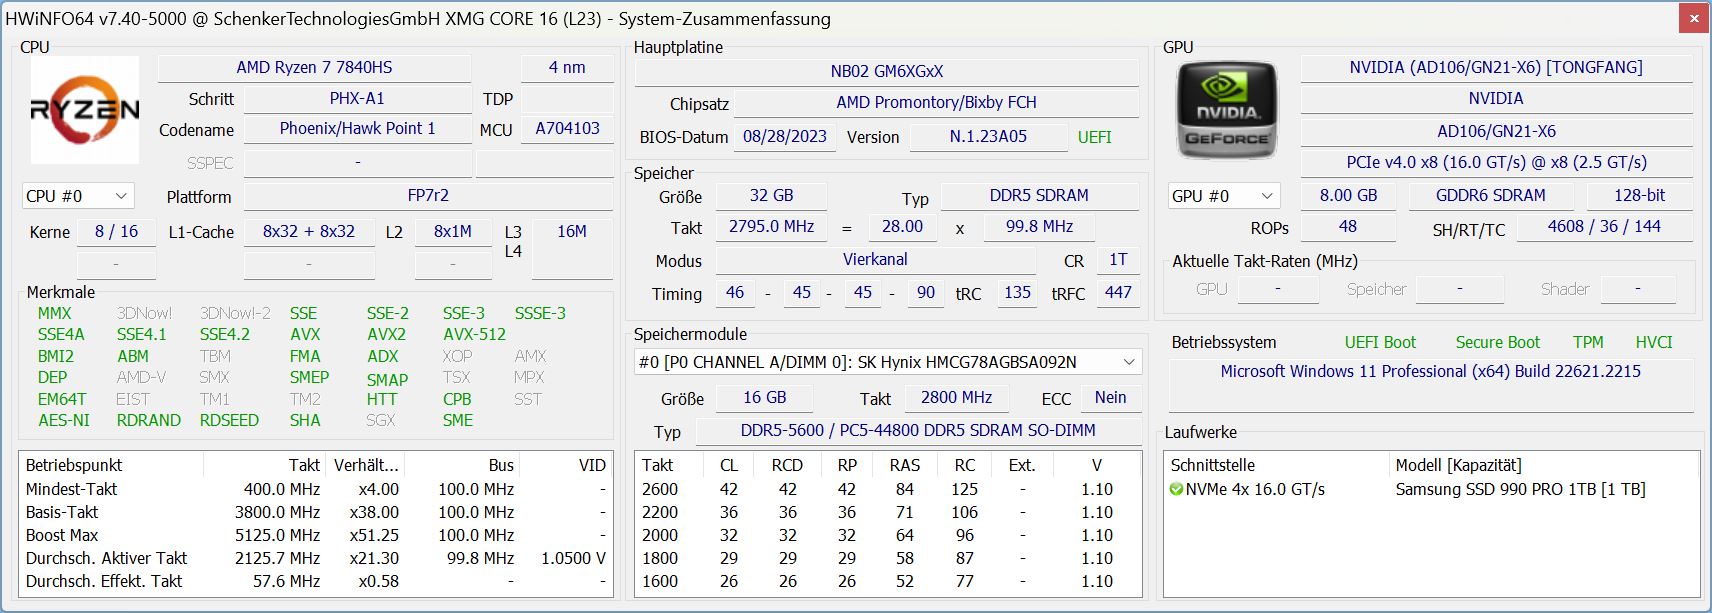
W porównaniu do bardziej rozpowszechnionej kombinacji z procesorem Intel, to urządzenie ma zainstalowany procesor AMD Ryzen 7 7840HSzainstalowany. Wysokiej klasy procesor, wraz z 32 GB pamięci RAM i kartą graficzną, sprawia, że urządzenie jest bardziej wysokiej klasy laptopem do gier. Prawie wszystkie obecne gry mogą być płynnie odtwarzane w natywnej rozdzielczości 1600p i przy maksymalnych szczegółach.
Na bestware.com, stronie zamówieniowej Schenkera, można skonfigurować laptopa w szerokim zakresie, wybrać między różnymi producentami dysków SSD i pamięci RAM i wiele więcej. Proszę mieć to na uwadze, ponieważ nasz test uwzględnia tylko naszą konkretną konfigurację.
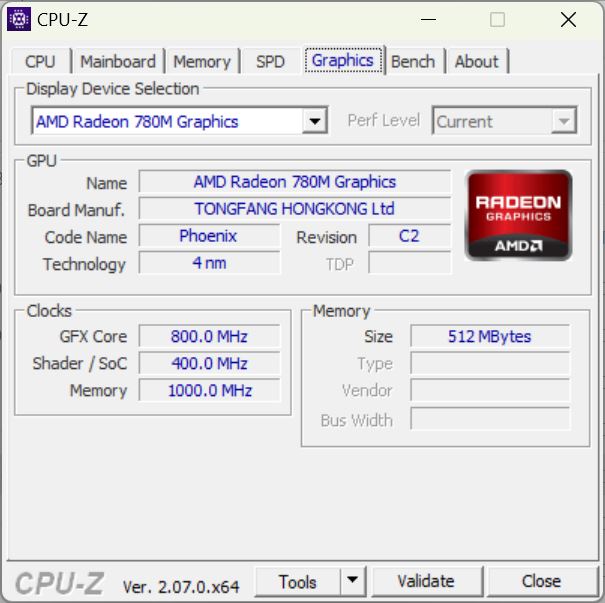
Warunki testowania
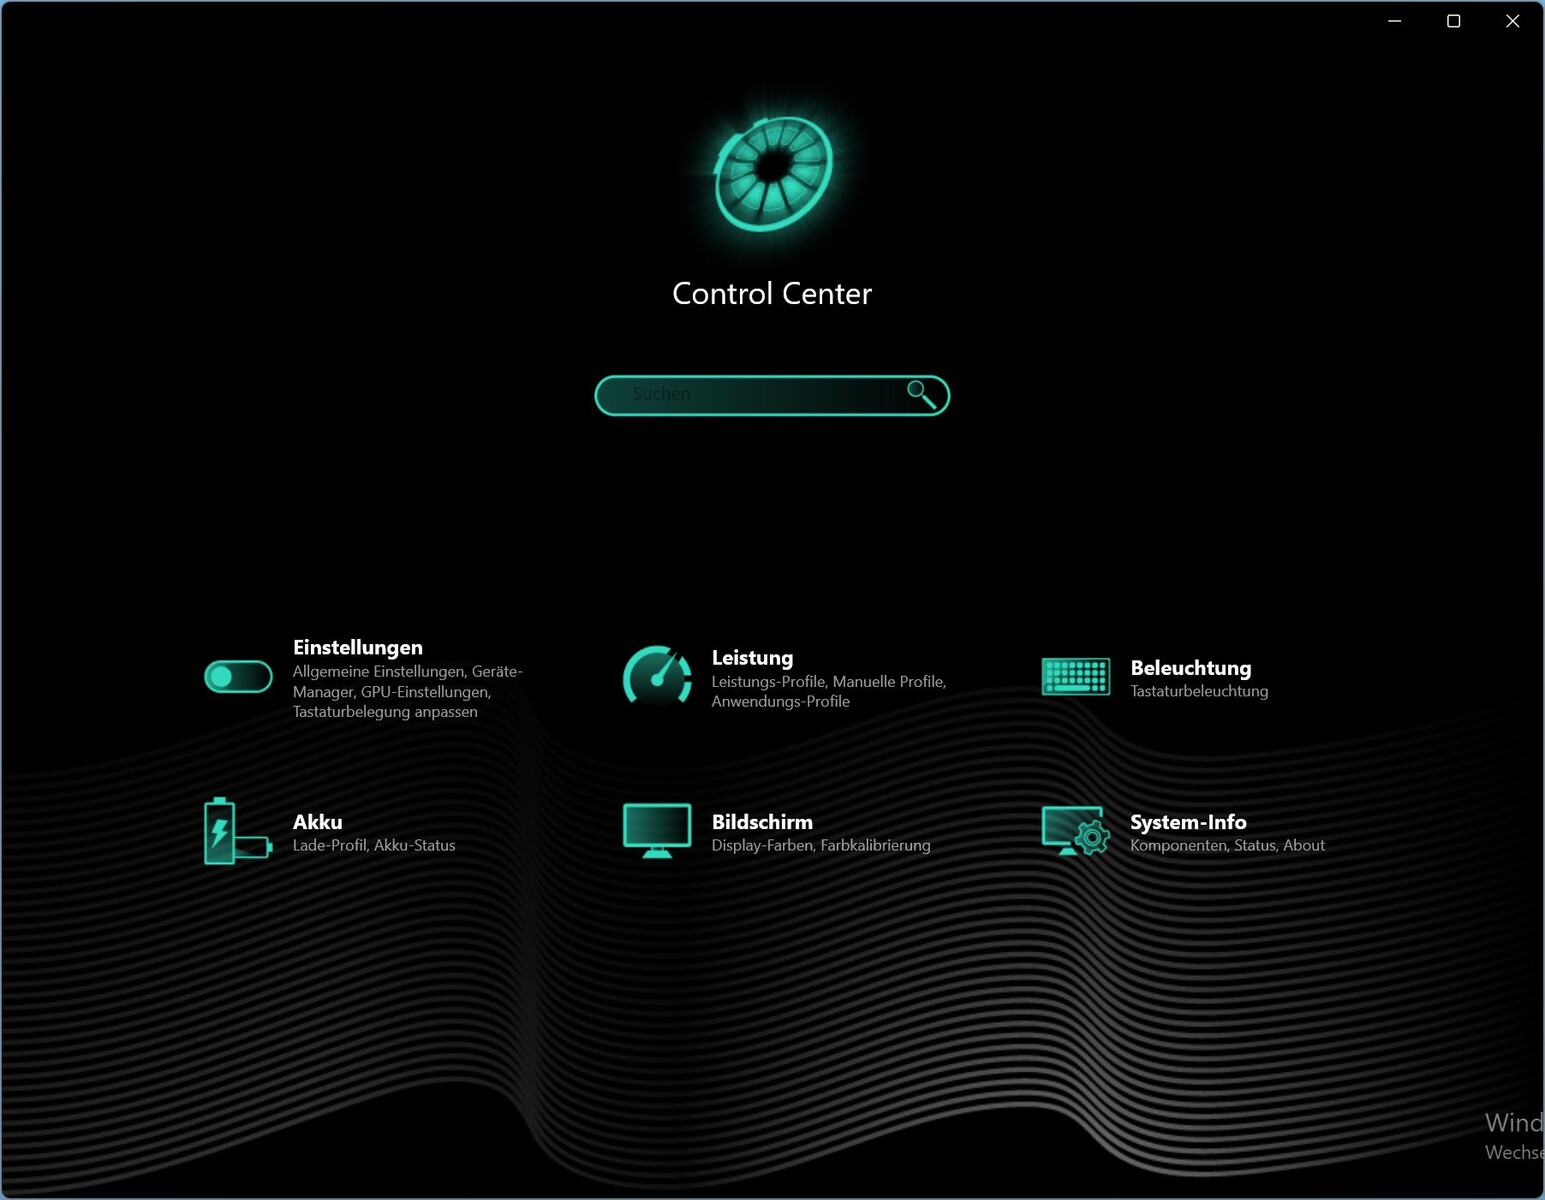
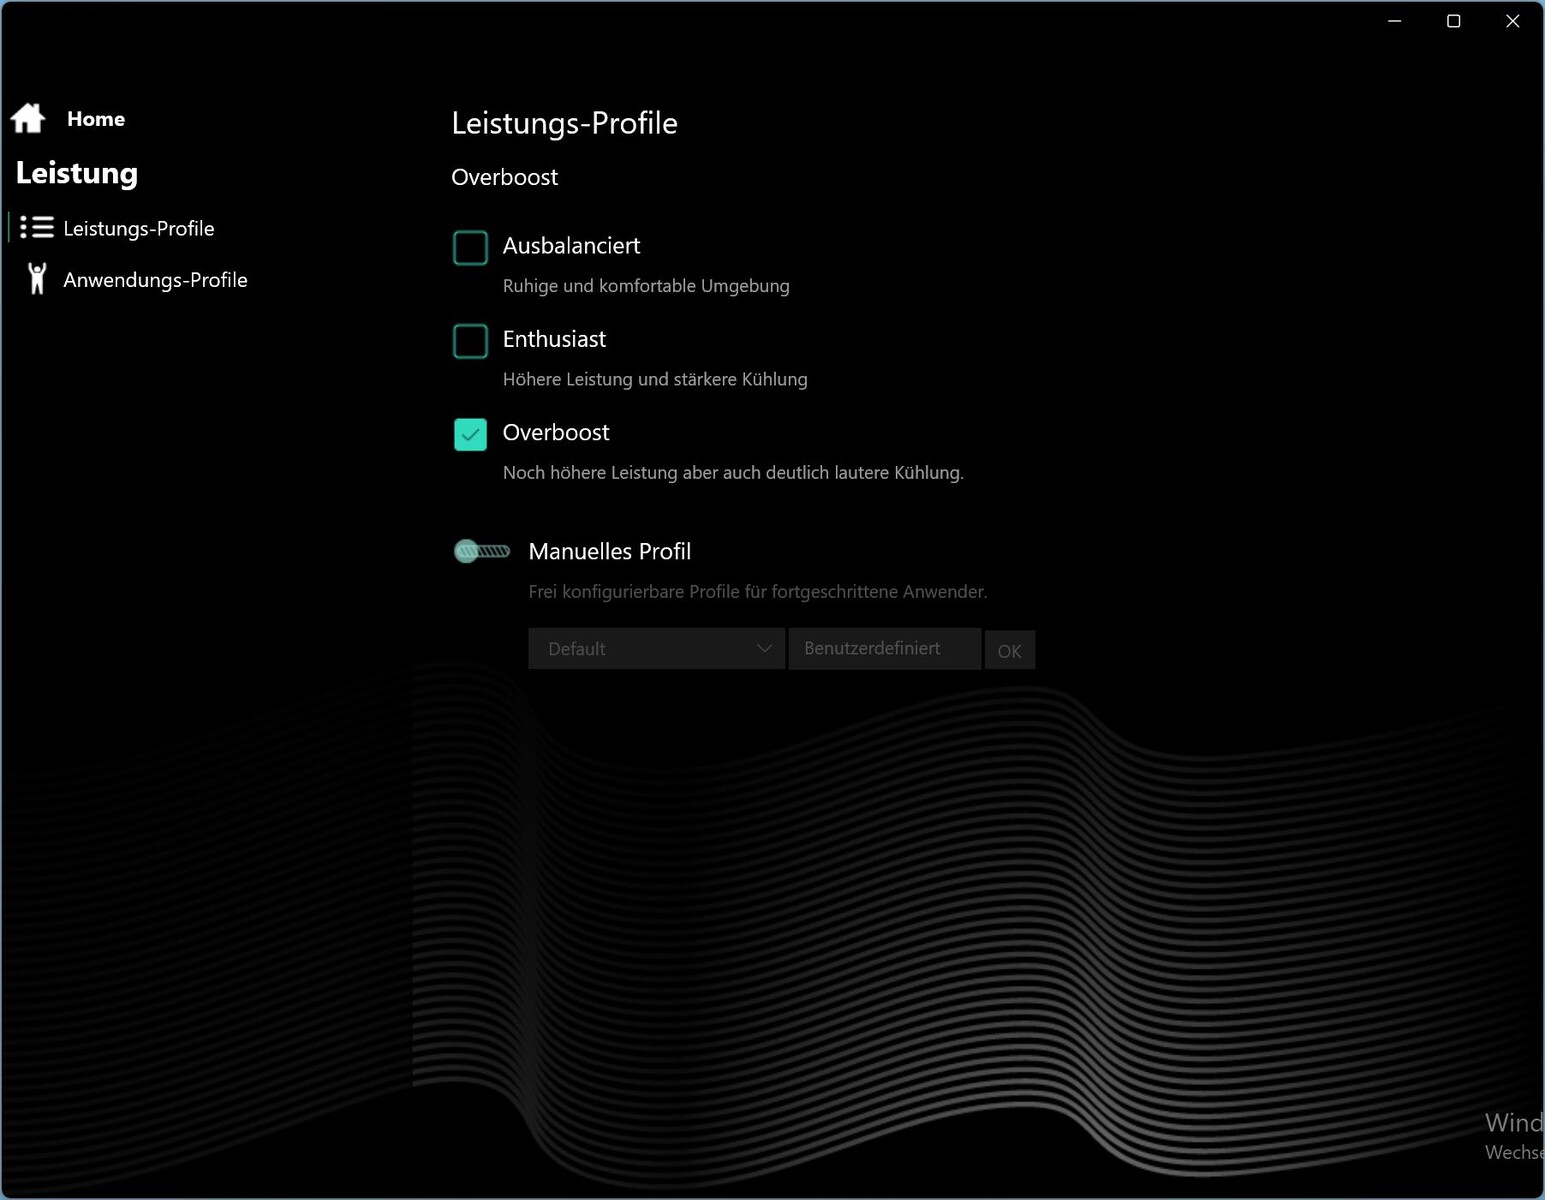
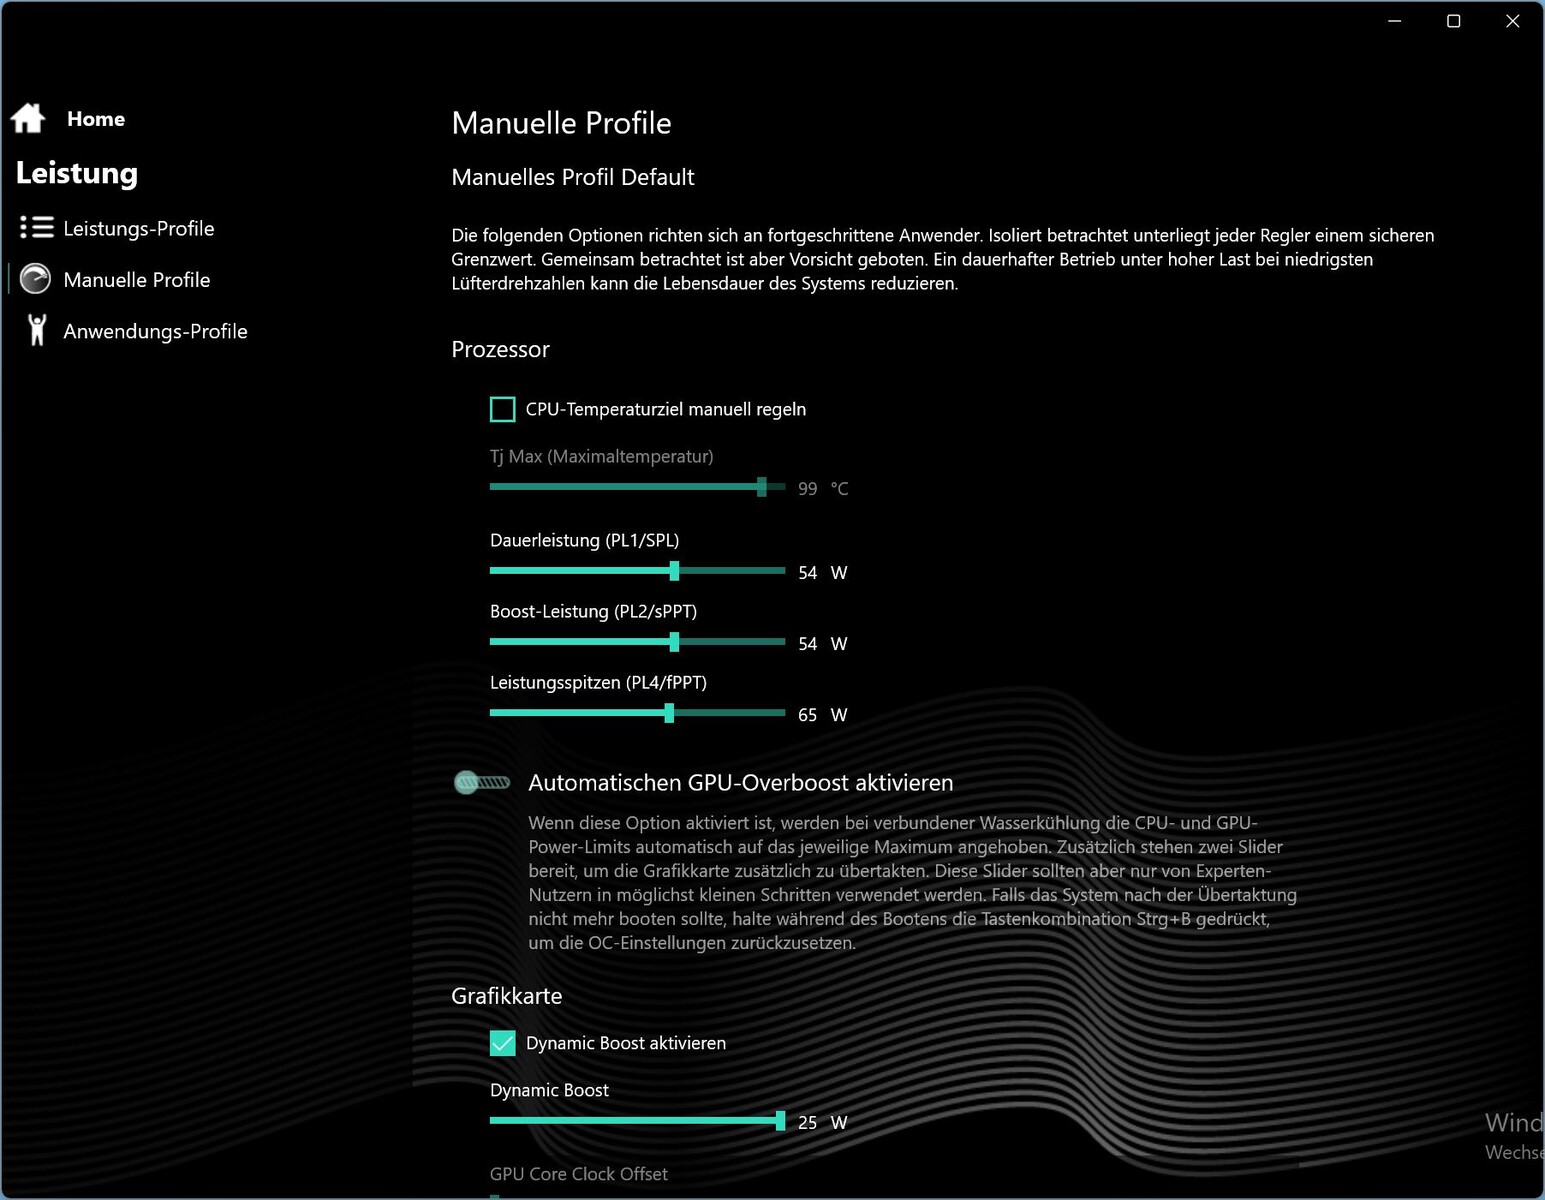
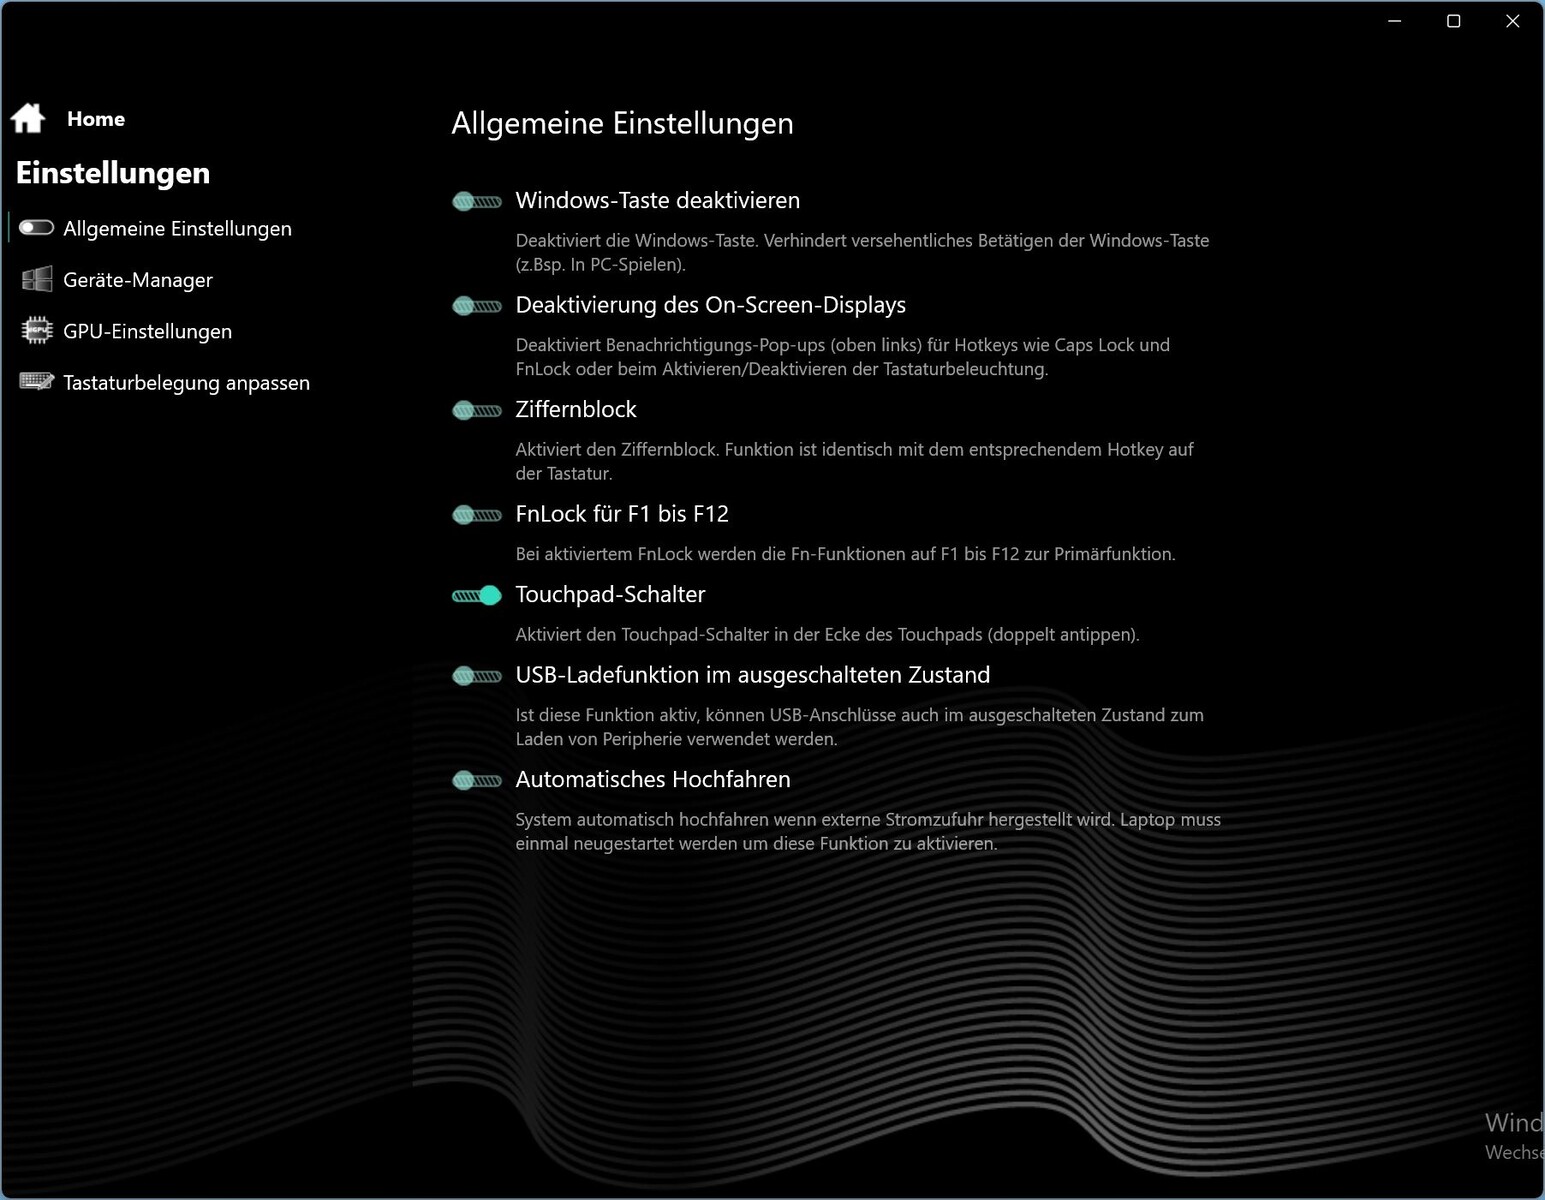
Centrum sterowania urządzeń Schenker umożliwia ustawienie wstępnych ustawień wydajności, a także ręczne ustawienie poszczególnych parametrów wydajności. Oznacza to, że można zmienić zachowanie laptopa do gier, aby dostosować go do indywidualnych potrzeb. To samo można powiedzieć o innych ustawieniach, takich jak podświetlenie klawiatury, sposób ładowania i wyświetlacz.
Procesor
AMD Ryzen 7 7840HSwyposażono w 8 rdzeni Zen 4, które dzięki technologii SMT sumują się do 16 wątków. Taktowanie rdzeni wynosi od 3,8 GHz (zegar bazowy) do 5,1 GHz (boost dla pojedynczego rdzenia). Czyni go to drugim najszybszym procesorem z serii Pheonix, zaraz zaRyzen 9 7940HS.

Dla porównania, jego wydajność jest na podobnym poziomie doCore i7-13700H. HPVictus 16jest wolniejszy z tym procesorem, aMSI Stealth 16 Studioz tym samym procesorem jest szybszy. Procesory Intel HX, zwłaszcza znacznie droższei9-13900HXwyraźnie wysuwają się na prowadzenie.
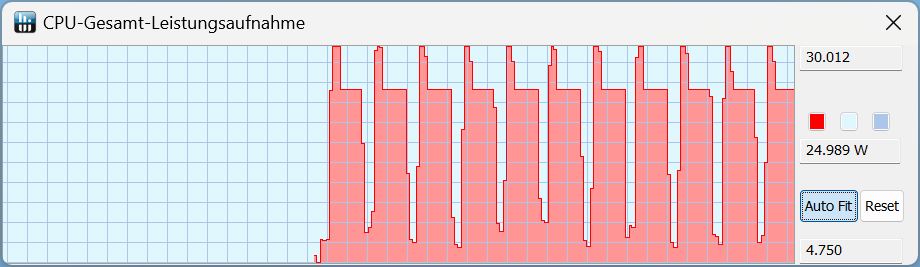
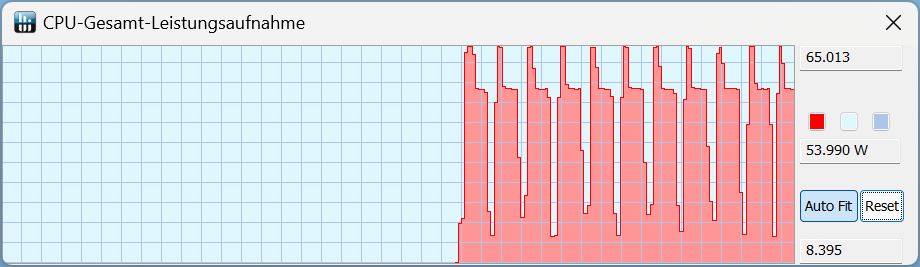
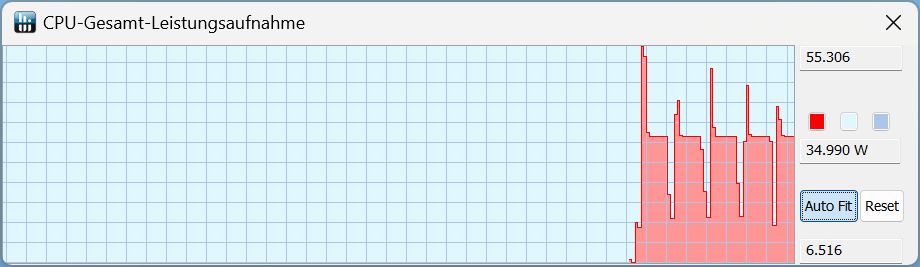
Podczas ciągłego testu Cinebench R15 nie odnotowaliśmy spadku wydajności - pozostała ona niezmiennie wysoka nawet po pierwszych uruchomieniach. Procesor osiągnął przy tym stałe TDP na poziomie 80 watów.
W trybie Enthusiast, uruchomienia rozpoczynały się przy 65 watach, a następnie spadały do 55 watów. W trybie zrównoważonym, wartość ta utrzymywała się na poziomie 50-55 W tylko przez krótki czas, po czym spadła do 35 W.
W trybie baterii zmierzyliśmy 30 watów przez krótki czas na początku, a następnie 25 watów. Wynik w teście Cinebench R15 spadł z 2681 do 1730 punktów, co oznacza 35-procentowy spadek.
Cinebench R15 Multi continuous test
Cinebench R23: Multi Core | Single Core
Cinebench R20: CPU (Multi Core) | CPU (Single Core)
Cinebench R15: CPU Multi 64Bit | CPU Single 64Bit
Blender: v2.79 BMW27 CPU
7-Zip 18.03: 7z b 4 | 7z b 4 -mmt1
Geekbench 5.5: Multi-Core | Single-Core
HWBOT x265 Benchmark v2.2: 4k Preset
LibreOffice : 20 Documents To PDF
R Benchmark 2.5: Overall mean
| CPU Performance rating | |
| HP Omen Transcend 16 | |
| Średnia w klasie Gaming | |
| Lenovo Legion Pro 5 16ARX8 | |
| MSI Stealth 16 Studio A13VG | |
| Przeciętny AMD Ryzen 7 7840HS | |
| Schenker XMG CORE 16 (L23) | |
| HP Victus 16-r0077ng | |
| Acer Nitro 16 AN16-41 | |
| Cinebench R23 / Multi Core | |
| HP Omen Transcend 16 | |
| Średnia w klasie Gaming (10488 - 40970, n=110, ostatnie 2 lata) | |
| MSI Stealth 16 Studio A13VG | |
| Lenovo Legion Pro 5 16ARX8 | |
| Schenker XMG CORE 16 (L23) | |
| Przeciętny AMD Ryzen 7 7840HS (14784 - 17214, n=19) | |
| HP Victus 16-r0077ng | |
| Acer Nitro 16 AN16-41 | |
| Cinebench R23 / Single Core | |
| HP Omen Transcend 16 | |
| Średnia w klasie Gaming (1166 - 2356, n=110, ostatnie 2 lata) | |
| MSI Stealth 16 Studio A13VG | |
| Lenovo Legion Pro 5 16ARX8 | |
| Przeciętny AMD Ryzen 7 7840HS (1718 - 1812, n=19) | |
| Schenker XMG CORE 16 (L23) | |
| HP Victus 16-r0077ng | |
| Acer Nitro 16 AN16-41 | |
| Cinebench R20 / CPU (Multi Core) | |
| Średnia w klasie Gaming (4029 - 16108, n=109, ostatnie 2 lata) | |
| HP Omen Transcend 16 | |
| MSI Stealth 16 Studio A13VG | |
| Lenovo Legion Pro 5 16ARX8 | |
| Schenker XMG CORE 16 (L23) | |
| Przeciętny AMD Ryzen 7 7840HS (5761 - 6744, n=19) | |
| HP Victus 16-r0077ng | |
| Acer Nitro 16 AN16-41 | |
| Cinebench R20 / CPU (Single Core) | |
| HP Omen Transcend 16 | |
| Średnia w klasie Gaming (442 - 895, n=109, ostatnie 2 lata) | |
| MSI Stealth 16 Studio A13VG | |
| Lenovo Legion Pro 5 16ARX8 | |
| Schenker XMG CORE 16 (L23) | |
| Przeciętny AMD Ryzen 7 7840HS (661 - 705, n=19) | |
| HP Victus 16-r0077ng | |
| Acer Nitro 16 AN16-41 | |
| Cinebench R15 / CPU Multi 64Bit | |
| HP Omen Transcend 16 | |
| Średnia w klasie Gaming (1578 - 6271, n=109, ostatnie 2 lata) | |
| Lenovo Legion Pro 5 16ARX8 | |
| MSI Stealth 16 Studio A13VG | |
| Schenker XMG CORE 16 (L23) | |
| Przeciętny AMD Ryzen 7 7840HS (2300 - 2729, n=19) | |
| Acer Nitro 16 AN16-41 | |
| HP Victus 16-r0077ng | |
| Cinebench R15 / CPU Single 64Bit | |
| HP Omen Transcend 16 | |
| Średnia w klasie Gaming (188.8 - 343, n=109, ostatnie 2 lata) | |
| Lenovo Legion Pro 5 16ARX8 | |
| Przeciętny AMD Ryzen 7 7840HS (270 - 286, n=19) | |
| MSI Stealth 16 Studio A13VG | |
| Schenker XMG CORE 16 (L23) | |
| Acer Nitro 16 AN16-41 | |
| HP Victus 16-r0077ng | |
| Blender / v2.79 BMW27 CPU | |
| Acer Nitro 16 AN16-41 | |
| HP Victus 16-r0077ng | |
| Przeciętny AMD Ryzen 7 7840HS (185 - 231, n=20) | |
| Schenker XMG CORE 16 (L23) | |
| Lenovo Legion Pro 5 16ARX8 | |
| MSI Stealth 16 Studio A13VG | |
| Średnia w klasie Gaming (80 - 330, n=107, ostatnie 2 lata) | |
| HP Omen Transcend 16 | |
| 7-Zip 18.03 / 7z b 4 | |
| HP Omen Transcend 16 | |
| Średnia w klasie Gaming (33491 - 148086, n=108, ostatnie 2 lata) | |
| MSI Stealth 16 Studio A13VG | |
| Lenovo Legion Pro 5 16ARX8 | |
| Schenker XMG CORE 16 (L23) | |
| Przeciętny AMD Ryzen 7 7840HS (59538 - 73035, n=20) | |
| HP Victus 16-r0077ng | |
| Acer Nitro 16 AN16-41 | |
| 7-Zip 18.03 / 7z b 4 -mmt1 | |
| Lenovo Legion Pro 5 16ARX8 | |
| HP Omen Transcend 16 | |
| Schenker XMG CORE 16 (L23) | |
| Przeciętny AMD Ryzen 7 7840HS (6049 - 6754, n=20) | |
| Średnia w klasie Gaming (4199 - 7436, n=108, ostatnie 2 lata) | |
| MSI Stealth 16 Studio A13VG | |
| Acer Nitro 16 AN16-41 | |
| HP Victus 16-r0077ng | |
| Geekbench 5.5 / Multi-Core | |
| HP Omen Transcend 16 | |
| Średnia w klasie Gaming (6460 - 27010, n=108, ostatnie 2 lata) | |
| MSI Stealth 16 Studio A13VG | |
| Lenovo Legion Pro 5 16ARX8 | |
| Schenker XMG CORE 16 (L23) | |
| Przeciętny AMD Ryzen 7 7840HS (8446 - 12339, n=23) | |
| HP Victus 16-r0077ng | |
| Acer Nitro 16 AN16-41 | |
| Geekbench 5.5 / Single-Core | |
| HP Omen Transcend 16 | |
| Średnia w klasie Gaming (986 - 2474, n=108, ostatnie 2 lata) | |
| Lenovo Legion Pro 5 16ARX8 | |
| Przeciętny AMD Ryzen 7 7840HS (1837 - 2017, n=23) | |
| Schenker XMG CORE 16 (L23) | |
| MSI Stealth 16 Studio A13VG | |
| HP Victus 16-r0077ng | |
| Acer Nitro 16 AN16-41 | |
| HWBOT x265 Benchmark v2.2 / 4k Preset | |
| Średnia w klasie Gaming (11.5 - 44.3, n=108, ostatnie 2 lata) | |
| HP Omen Transcend 16 | |
| Lenovo Legion Pro 5 16ARX8 | |
| Schenker XMG CORE 16 (L23) | |
| Przeciętny AMD Ryzen 7 7840HS (11.7 - 21.8, n=20) | |
| MSI Stealth 16 Studio A13VG | |
| Acer Nitro 16 AN16-41 | |
| HP Victus 16-r0077ng | |
| LibreOffice / 20 Documents To PDF | |
| Schenker XMG CORE 16 (L23) | |
| HP Victus 16-r0077ng | |
| MSI Stealth 16 Studio A13VG | |
| Acer Nitro 16 AN16-41 | |
| Średnia w klasie Gaming (19 - 88.8, n=108, ostatnie 2 lata) | |
| Przeciętny AMD Ryzen 7 7840HS (38.3 - 68.3, n=20) | |
| HP Omen Transcend 16 | |
| Lenovo Legion Pro 5 16ARX8 | |
| R Benchmark 2.5 / Overall mean | |
| HP Victus 16-r0077ng | |
| Acer Nitro 16 AN16-41 | |
| MSI Stealth 16 Studio A13VG | |
| Przeciętny AMD Ryzen 7 7840HS (0.4184 - 0.4739, n=20) | |
| Schenker XMG CORE 16 (L23) | |
| Średnia w klasie Gaming (0.3439 - 0.759, n=109, ostatnie 2 lata) | |
| Lenovo Legion Pro 5 16ARX8 | |
| HP Omen Transcend 16 | |
* ... im mniej tym lepiej
AIDA64: FP32 Ray-Trace | FPU Julia | CPU SHA3 | CPU Queen | FPU SinJulia | FPU Mandel | CPU AES | CPU ZLib | FP64 Ray-Trace | CPU PhotoWorxx
| Performance rating | |
| Średnia w klasie Gaming | |
| HP Omen Transcend 16 | |
| Przeciętny AMD Ryzen 7 7840HS | |
| Lenovo Legion Pro 5 16ARX8 | |
| Schenker XMG CORE 16 (L23) | |
| MSI Stealth 16 Studio A13VG | |
| Acer Nitro 16 AN16-41 | |
| HP Victus 16-r0077ng | |
| AIDA64 / FP32 Ray-Trace | |
| Średnia w klasie Gaming (10227 - 85542, n=107, ostatnie 2 lata) | |
| Lenovo Legion Pro 5 16ARX8 | |
| Schenker XMG CORE 16 (L23) | |
| Przeciętny AMD Ryzen 7 7840HS (22845 - 28921, n=21) | |
| HP Omen Transcend 16 | |
| MSI Stealth 16 Studio A13VG | |
| Acer Nitro 16 AN16-41 | |
| HP Victus 16-r0077ng | |
| AIDA64 / FPU Julia | |
| Średnia w klasie Gaming (51376 - 238426, n=107, ostatnie 2 lata) | |
| Lenovo Legion Pro 5 16ARX8 | |
| Schenker XMG CORE 16 (L23) | |
| HP Omen Transcend 16 | |
| Przeciętny AMD Ryzen 7 7840HS (97164 - 123167, n=21) | |
| Acer Nitro 16 AN16-41 | |
| MSI Stealth 16 Studio A13VG | |
| HP Victus 16-r0077ng | |
| AIDA64 / CPU SHA3 | |
| Średnia w klasie Gaming (2180 - 9817, n=107, ostatnie 2 lata) | |
| HP Omen Transcend 16 | |
| Lenovo Legion Pro 5 16ARX8 | |
| Schenker XMG CORE 16 (L23) | |
| Przeciętny AMD Ryzen 7 7840HS (4293 - 5155, n=21) | |
| MSI Stealth 16 Studio A13VG | |
| Acer Nitro 16 AN16-41 | |
| HP Victus 16-r0077ng | |
| AIDA64 / CPU Queen | |
| Lenovo Legion Pro 5 16ARX8 | |
| HP Omen Transcend 16 | |
| Średnia w klasie Gaming (49785 - 173351, n=98, ostatnie 2 lata) | |
| Przeciętny AMD Ryzen 7 7840HS (102271 - 125820, n=21) | |
| Acer Nitro 16 AN16-41 | |
| MSI Stealth 16 Studio A13VG | |
| Schenker XMG CORE 16 (L23) | |
| HP Victus 16-r0077ng | |
| AIDA64 / FPU SinJulia | |
| Lenovo Legion Pro 5 16ARX8 | |
| Schenker XMG CORE 16 (L23) | |
| Przeciętny AMD Ryzen 7 7840HS (13767 - 15525, n=21) | |
| Średnia w klasie Gaming (4424 - 33636, n=107, ostatnie 2 lata) | |
| HP Omen Transcend 16 | |
| Acer Nitro 16 AN16-41 | |
| MSI Stealth 16 Studio A13VG | |
| HP Victus 16-r0077ng | |
| AIDA64 / FPU Mandel | |
| Średnia w klasie Gaming (25115 - 128721, n=107, ostatnie 2 lata) | |
| Lenovo Legion Pro 5 16ARX8 | |
| Schenker XMG CORE 16 (L23) | |
| Przeciętny AMD Ryzen 7 7840HS (52084 - 65812, n=21) | |
| HP Omen Transcend 16 | |
| Acer Nitro 16 AN16-41 | |
| MSI Stealth 16 Studio A13VG | |
| HP Victus 16-r0077ng | |
| AIDA64 / CPU AES | |
| Przeciętny AMD Ryzen 7 7840HS (67389 - 177158, n=21) | |
| HP Omen Transcend 16 | |
| Średnia w klasie Gaming (39258 - 247074, n=107, ostatnie 2 lata) | |
| Schenker XMG CORE 16 (L23) | |
| MSI Stealth 16 Studio A13VG | |
| Lenovo Legion Pro 5 16ARX8 | |
| HP Victus 16-r0077ng | |
| Acer Nitro 16 AN16-41 | |
| AIDA64 / CPU ZLib | |
| HP Omen Transcend 16 | |
| Średnia w klasie Gaming (574 - 2531, n=107, ostatnie 2 lata) | |
| Lenovo Legion Pro 5 16ARX8 | |
| Schenker XMG CORE 16 (L23) | |
| Przeciętny AMD Ryzen 7 7840HS (944 - 1123, n=21) | |
| MSI Stealth 16 Studio A13VG | |
| HP Victus 16-r0077ng | |
| Acer Nitro 16 AN16-41 | |
| AIDA64 / FP64 Ray-Trace | |
| Średnia w klasie Gaming (5509 - 45446, n=107, ostatnie 2 lata) | |
| Lenovo Legion Pro 5 16ARX8 | |
| Schenker XMG CORE 16 (L23) | |
| Przeciętny AMD Ryzen 7 7840HS (12248 - 15599, n=21) | |
| HP Omen Transcend 16 | |
| MSI Stealth 16 Studio A13VG | |
| Acer Nitro 16 AN16-41 | |
| HP Victus 16-r0077ng | |
| AIDA64 / CPU PhotoWorxx | |
| HP Omen Transcend 16 | |
| MSI Stealth 16 Studio A13VG | |
| Średnia w klasie Gaming (12271 - 89891, n=107, ostatnie 2 lata) | |
| Schenker XMG CORE 16 (L23) | |
| HP Victus 16-r0077ng | |
| Przeciętny AMD Ryzen 7 7840HS (17615 - 41516, n=21) | |
| Lenovo Legion Pro 5 16ARX8 | |
| Acer Nitro 16 AN16-41 | |
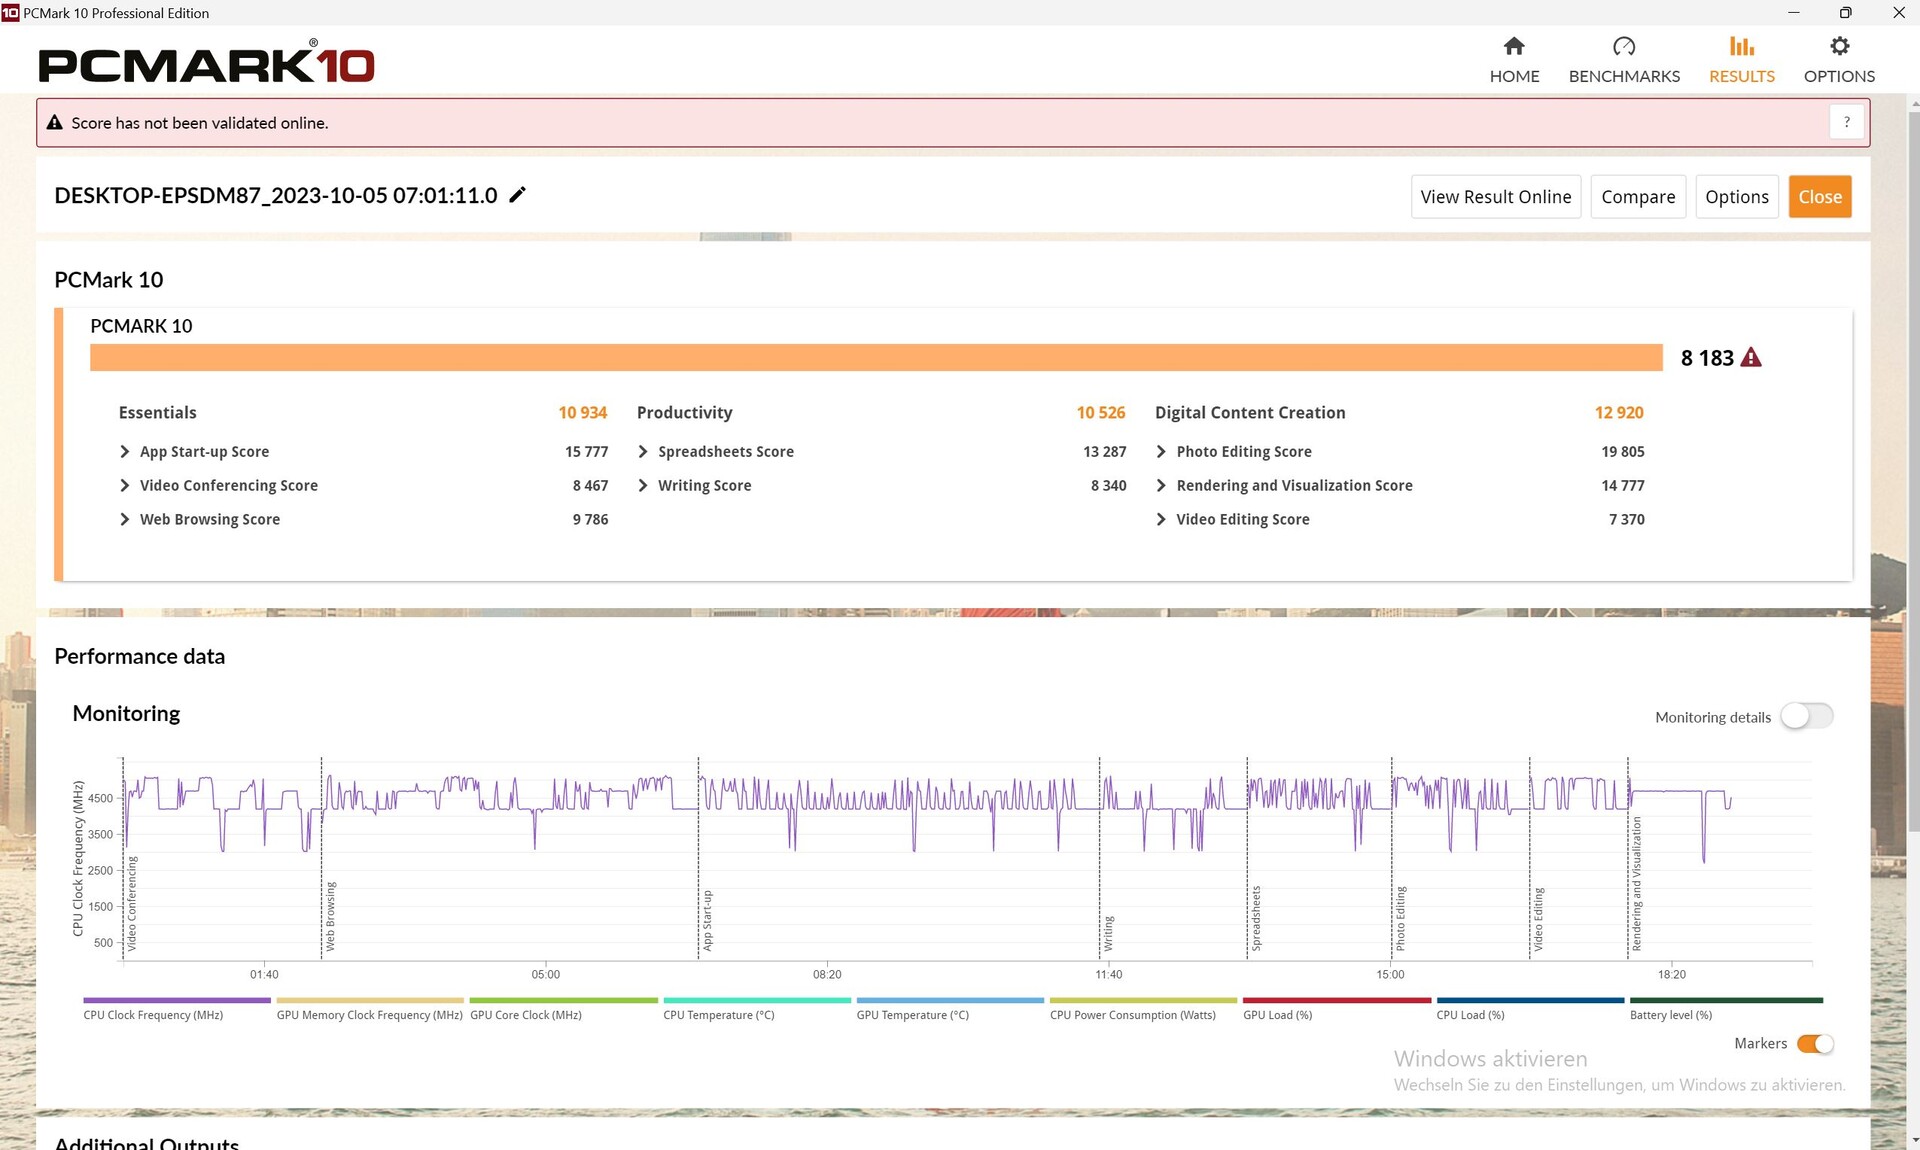
Wydajność systemu
Razem z Lenovo Legion Pro 5 16i HP Omen Transcend 16, Core 16 wyszedł na szczyt, jeśli chodzi o wydajność systemu. Subiektywnie, wszystko działa płynnie.
CrossMark: Overall | Productivity | Creativity | Responsiveness
| PCMark 10 / Score | |
| Średnia w klasie Gaming (5828 - 11574, n=94, ostatnie 2 lata) | |
| Lenovo Legion Pro 5 16ARX8 | |
| Schenker XMG CORE 16 (L23) | |
| Przeciętny AMD Ryzen 7 7840HS, NVIDIA GeForce RTX 4070 Laptop GPU (8167 - 8183, n=2) | |
| HP Omen Transcend 16 | |
| MSI Stealth 16 Studio A13VG | |
| Acer Nitro 16 AN16-41 | |
| HP Victus 16-r0077ng | |
| PCMark 10 / Essentials | |
| HP Omen Transcend 16 | |
| Przeciętny AMD Ryzen 7 7840HS, NVIDIA GeForce RTX 4070 Laptop GPU (10934 - 11250, n=2) | |
| Lenovo Legion Pro 5 16ARX8 | |
| Schenker XMG CORE 16 (L23) | |
| HP Victus 16-r0077ng | |
| Średnia w klasie Gaming (8810 - 12600, n=98, ostatnie 2 lata) | |
| Acer Nitro 16 AN16-41 | |
| MSI Stealth 16 Studio A13VG | |
| PCMark 10 / Productivity | |
| Średnia w klasie Gaming (6845 - 18766, n=96, ostatnie 2 lata) | |
| Schenker XMG CORE 16 (L23) | |
| Przeciętny AMD Ryzen 7 7840HS, NVIDIA GeForce RTX 4070 Laptop GPU (10179 - 10526, n=2) | |
| Lenovo Legion Pro 5 16ARX8 | |
| HP Omen Transcend 16 | |
| MSI Stealth 16 Studio A13VG | |
| Acer Nitro 16 AN16-41 | |
| HP Victus 16-r0077ng | |
| PCMark 10 / Digital Content Creation | |
| Średnia w klasie Gaming (7602 - 19657, n=96, ostatnie 2 lata) | |
| HP Omen Transcend 16 | |
| Lenovo Legion Pro 5 16ARX8 | |
| Schenker XMG CORE 16 (L23) | |
| Przeciętny AMD Ryzen 7 7840HS, NVIDIA GeForce RTX 4070 Laptop GPU (12908 - 12920, n=2) | |
| MSI Stealth 16 Studio A13VG | |
| Acer Nitro 16 AN16-41 | |
| HP Victus 16-r0077ng | |
| CrossMark / Overall | |
| Lenovo Legion Pro 5 16ARX8 | |
| Średnia w klasie Gaming (1366 - 2409, n=96, ostatnie 2 lata) | |
| HP Omen Transcend 16 | |
| MSI Stealth 16 Studio A13VG | |
| Schenker XMG CORE 16 (L23) | |
| Przeciętny AMD Ryzen 7 7840HS, NVIDIA GeForce RTX 4070 Laptop GPU (n=1) | |
| Acer Nitro 16 AN16-41 | |
| CrossMark / Productivity | |
| Lenovo Legion Pro 5 16ARX8 | |
| Średnia w klasie Gaming (1386 - 2254, n=96, ostatnie 2 lata) | |
| HP Omen Transcend 16 | |
| MSI Stealth 16 Studio A13VG | |
| Schenker XMG CORE 16 (L23) | |
| Przeciętny AMD Ryzen 7 7840HS, NVIDIA GeForce RTX 4070 Laptop GPU (n=1) | |
| Acer Nitro 16 AN16-41 | |
| CrossMark / Creativity | |
| HP Omen Transcend 16 | |
| Średnia w klasie Gaming (1343 - 2729, n=96, ostatnie 2 lata) | |
| Lenovo Legion Pro 5 16ARX8 | |
| MSI Stealth 16 Studio A13VG | |
| Schenker XMG CORE 16 (L23) | |
| Przeciętny AMD Ryzen 7 7840HS, NVIDIA GeForce RTX 4070 Laptop GPU (n=1) | |
| Acer Nitro 16 AN16-41 | |
| CrossMark / Responsiveness | |
| Lenovo Legion Pro 5 16ARX8 | |
| Średnia w klasie Gaming (1226 - 2334, n=96, ostatnie 2 lata) | |
| MSI Stealth 16 Studio A13VG | |
| HP Omen Transcend 16 | |
| Schenker XMG CORE 16 (L23) | |
| Przeciętny AMD Ryzen 7 7840HS, NVIDIA GeForce RTX 4070 Laptop GPU (n=1) | |
| Acer Nitro 16 AN16-41 | |
| PCMark 10 Score | 8183 pkt. | |
Pomoc | ||
| AIDA64 / Memory Copy | |
| HP Omen Transcend 16 | |
| Średnia w klasie Gaming (21750 - 129946, n=107, ostatnie 2 lata) | |
| MSI Stealth 16 Studio A13VG | |
| Schenker XMG CORE 16 (L23) | |
| Przeciętny AMD Ryzen 7 7840HS (30937 - 72158, n=21) | |
| HP Victus 16-r0077ng | |
| Lenovo Legion Pro 5 16ARX8 | |
| Acer Nitro 16 AN16-41 | |
| AIDA64 / Memory Read | |
| HP Omen Transcend 16 | |
| Średnia w klasie Gaming (22956 - 118858, n=107, ostatnie 2 lata) | |
| MSI Stealth 16 Studio A13VG | |
| HP Victus 16-r0077ng | |
| Schenker XMG CORE 16 (L23) | |
| Przeciętny AMD Ryzen 7 7840HS (30497 - 62147, n=21) | |
| Lenovo Legion Pro 5 16ARX8 | |
| Acer Nitro 16 AN16-41 | |
| AIDA64 / Memory Write | |
| Schenker XMG CORE 16 (L23) | |
| Przeciętny AMD Ryzen 7 7840HS (34590 - 93323, n=21) | |
| Średnia w klasie Gaming (22297 - 135096, n=107, ostatnie 2 lata) | |
| HP Omen Transcend 16 | |
| MSI Stealth 16 Studio A13VG | |
| HP Victus 16-r0077ng | |
| Acer Nitro 16 AN16-41 | |
| Lenovo Legion Pro 5 16ARX8 | |
| AIDA64 / Memory Latency | |
| Średnia w klasie Gaming (75.3 - 259, n=107, ostatnie 2 lata) | |
| HP Victus 16-r0077ng | |
| Acer Nitro 16 AN16-41 | |
| Przeciętny AMD Ryzen 7 7840HS (85.1 - 112, n=21) | |
| Schenker XMG CORE 16 (L23) | |
| HP Omen Transcend 16 | |
| MSI Stealth 16 Studio A13VG | |
| Lenovo Legion Pro 5 16ARX8 | |
* ... im mniej tym lepiej
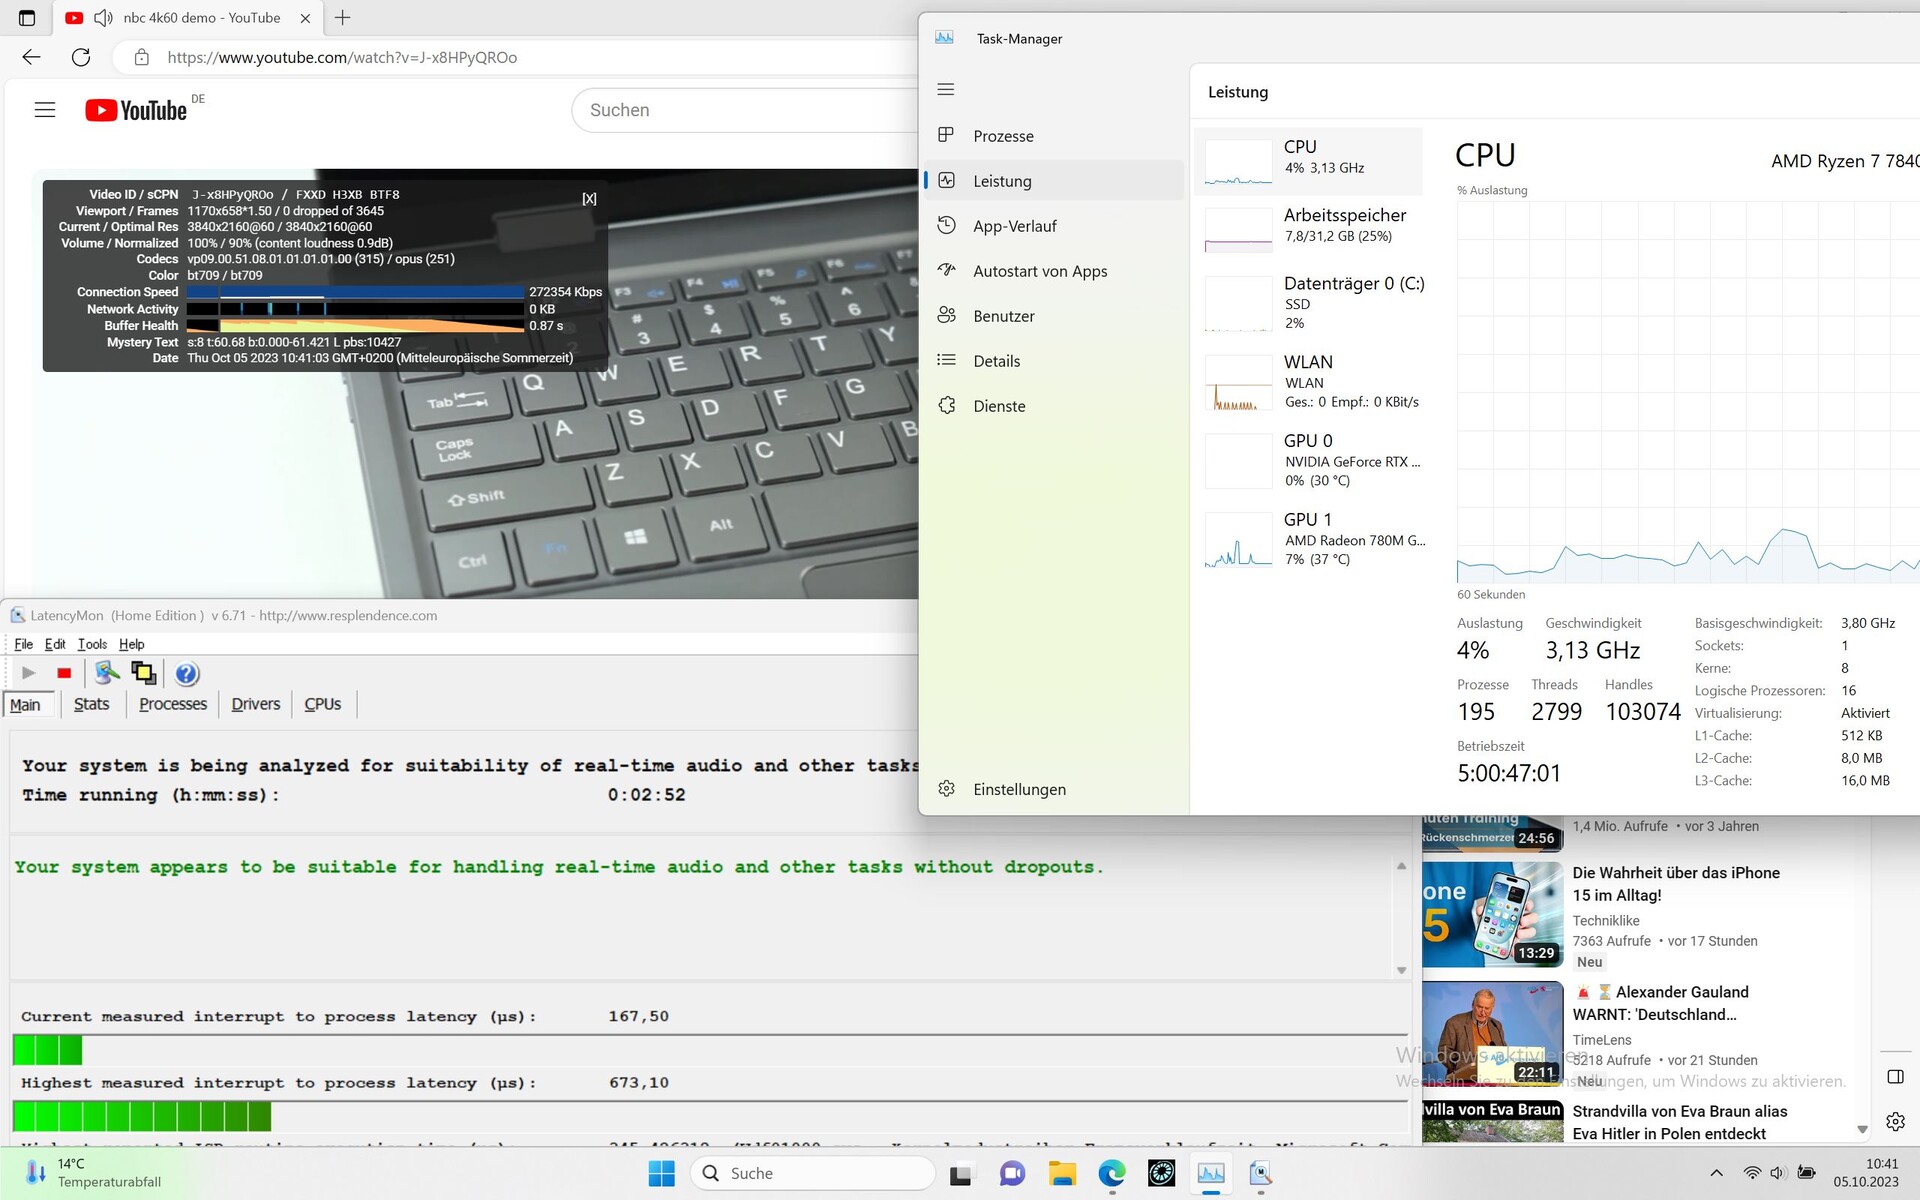
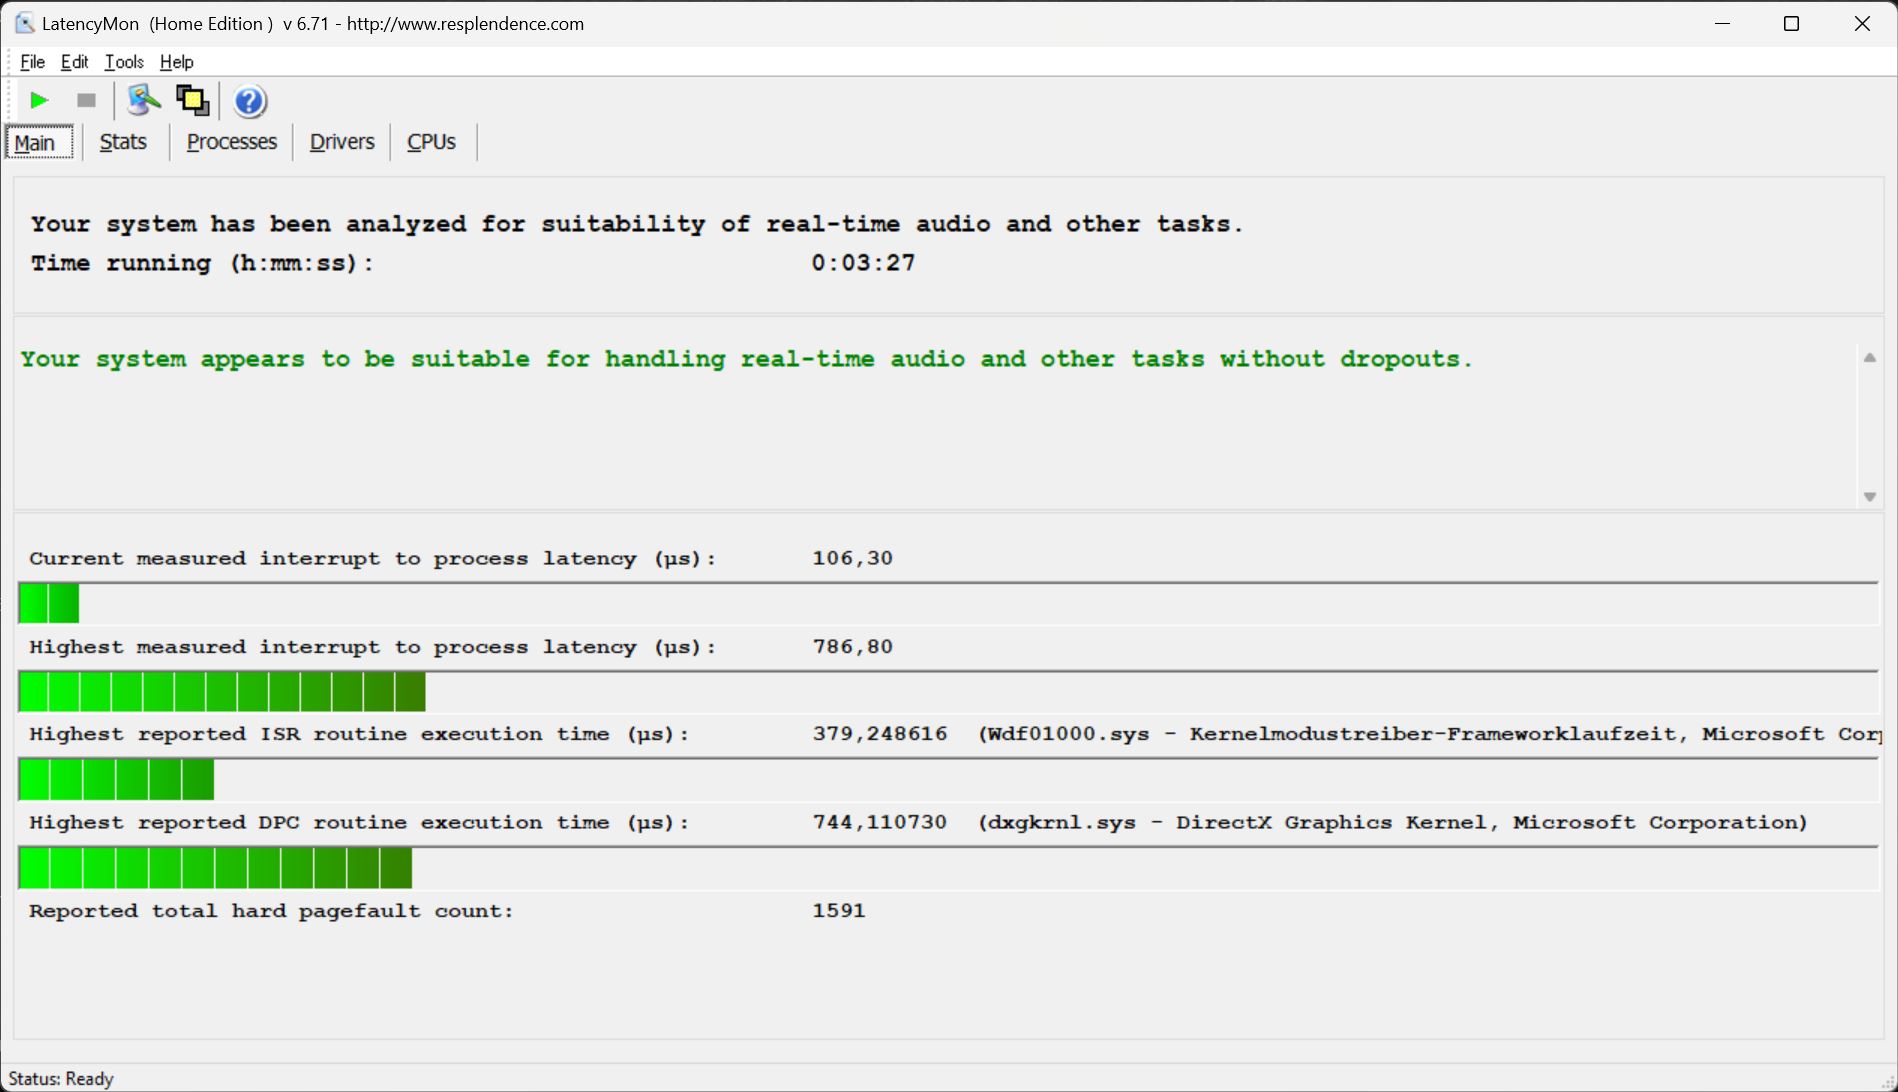
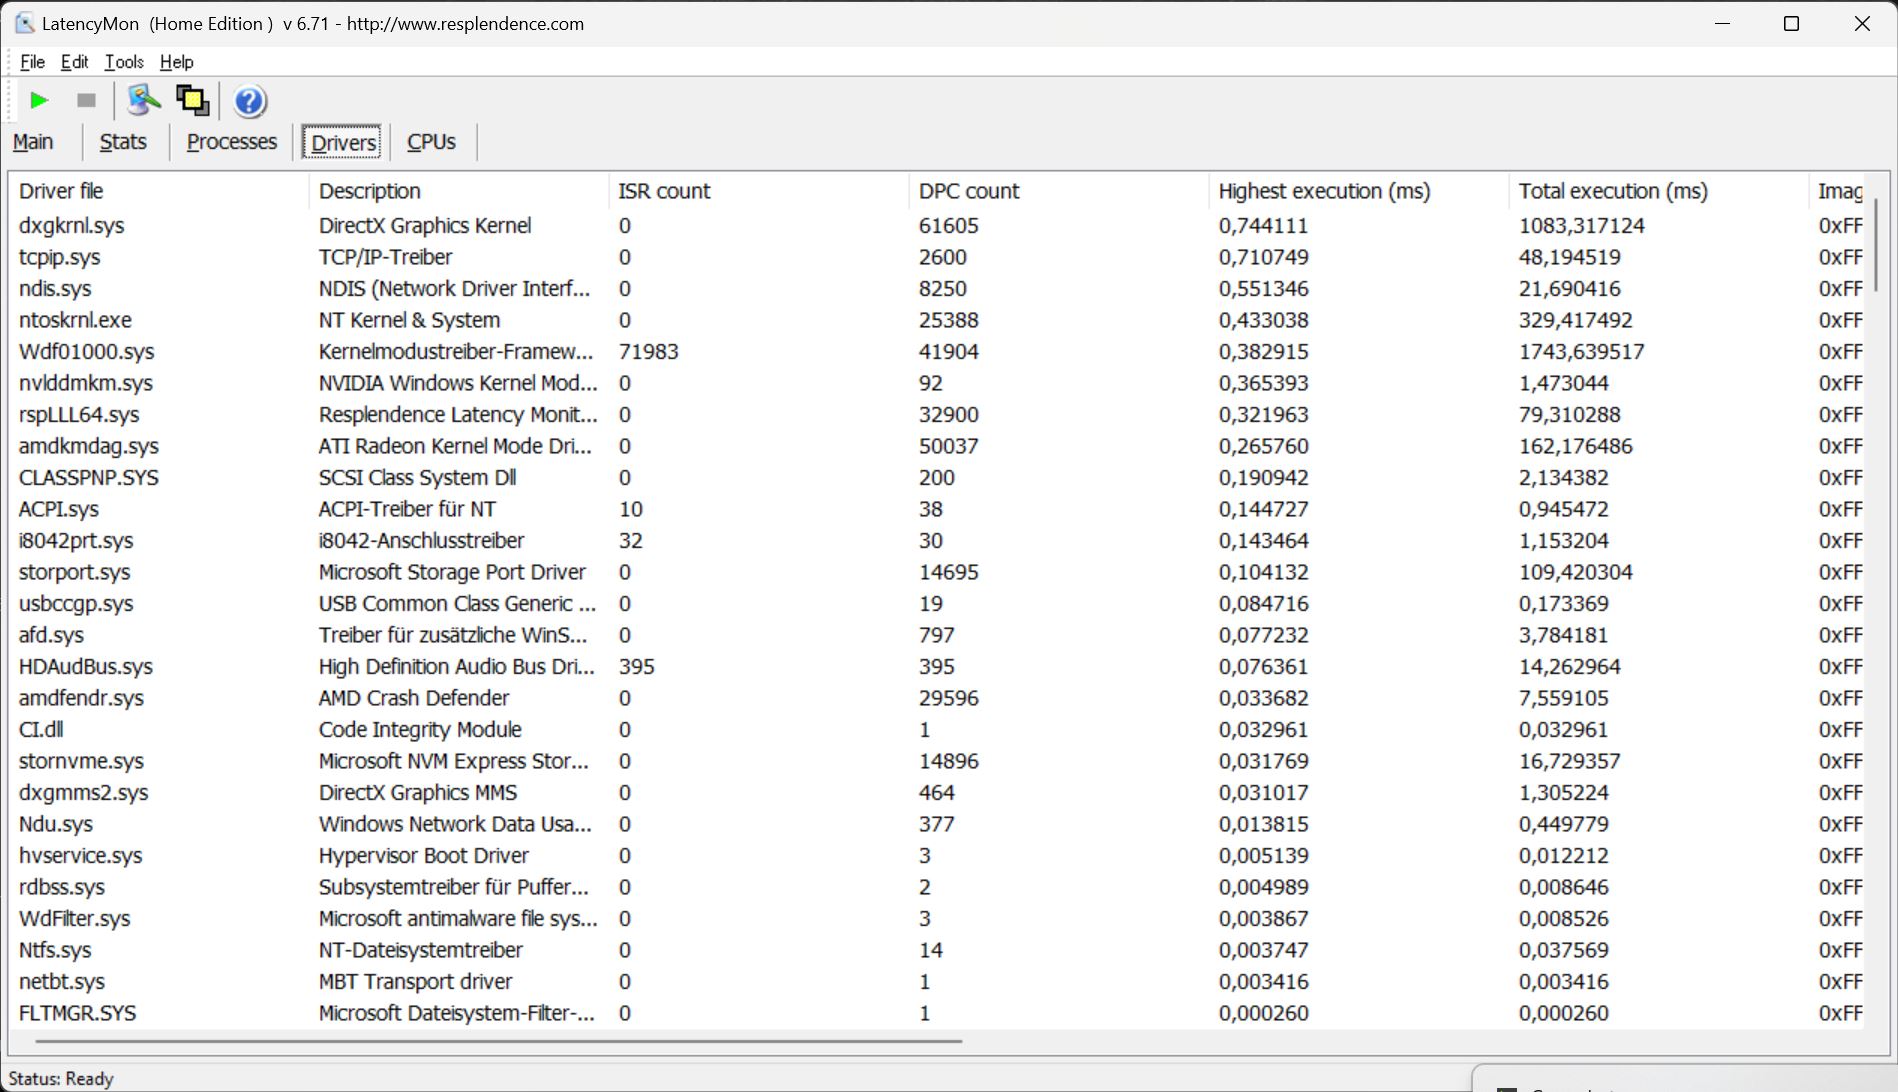
Opóźnienie DPC
Dla porównania, Core 16 jest jednym z niewielu laptopów gamingowych, które nie muszą walczyć z żadnymi opóźnieniami według LatencyMon. Przynajmniej narzędzie nie było w stanie zidentyfikować żadnych wyjątkowo wysokich opóźnień w naszym teście - bardzo dobrze! Nasze wideo 4K/60 fps na YouTube było odtwarzane płynnie i bez spadków klatek. Tylko Lenovo Legion Pro 5 16wypadł na tym polu podobnie dobrze.
| DPC Latencies / LatencyMon - interrupt to process latency (max), Web, Youtube, Prime95 | |
| MSI Stealth 16 Studio A13VG | |
| HP Victus 16-r0077ng | |
| HP Omen Transcend 16 | |
| Acer Nitro 16 AN16-41 | |
| Schenker XMG CORE 16 (L23) | |
| Lenovo Legion Pro 5 16ARX8 | |
* ... im mniej tym lepiej
Urządzenia pamięci masowej
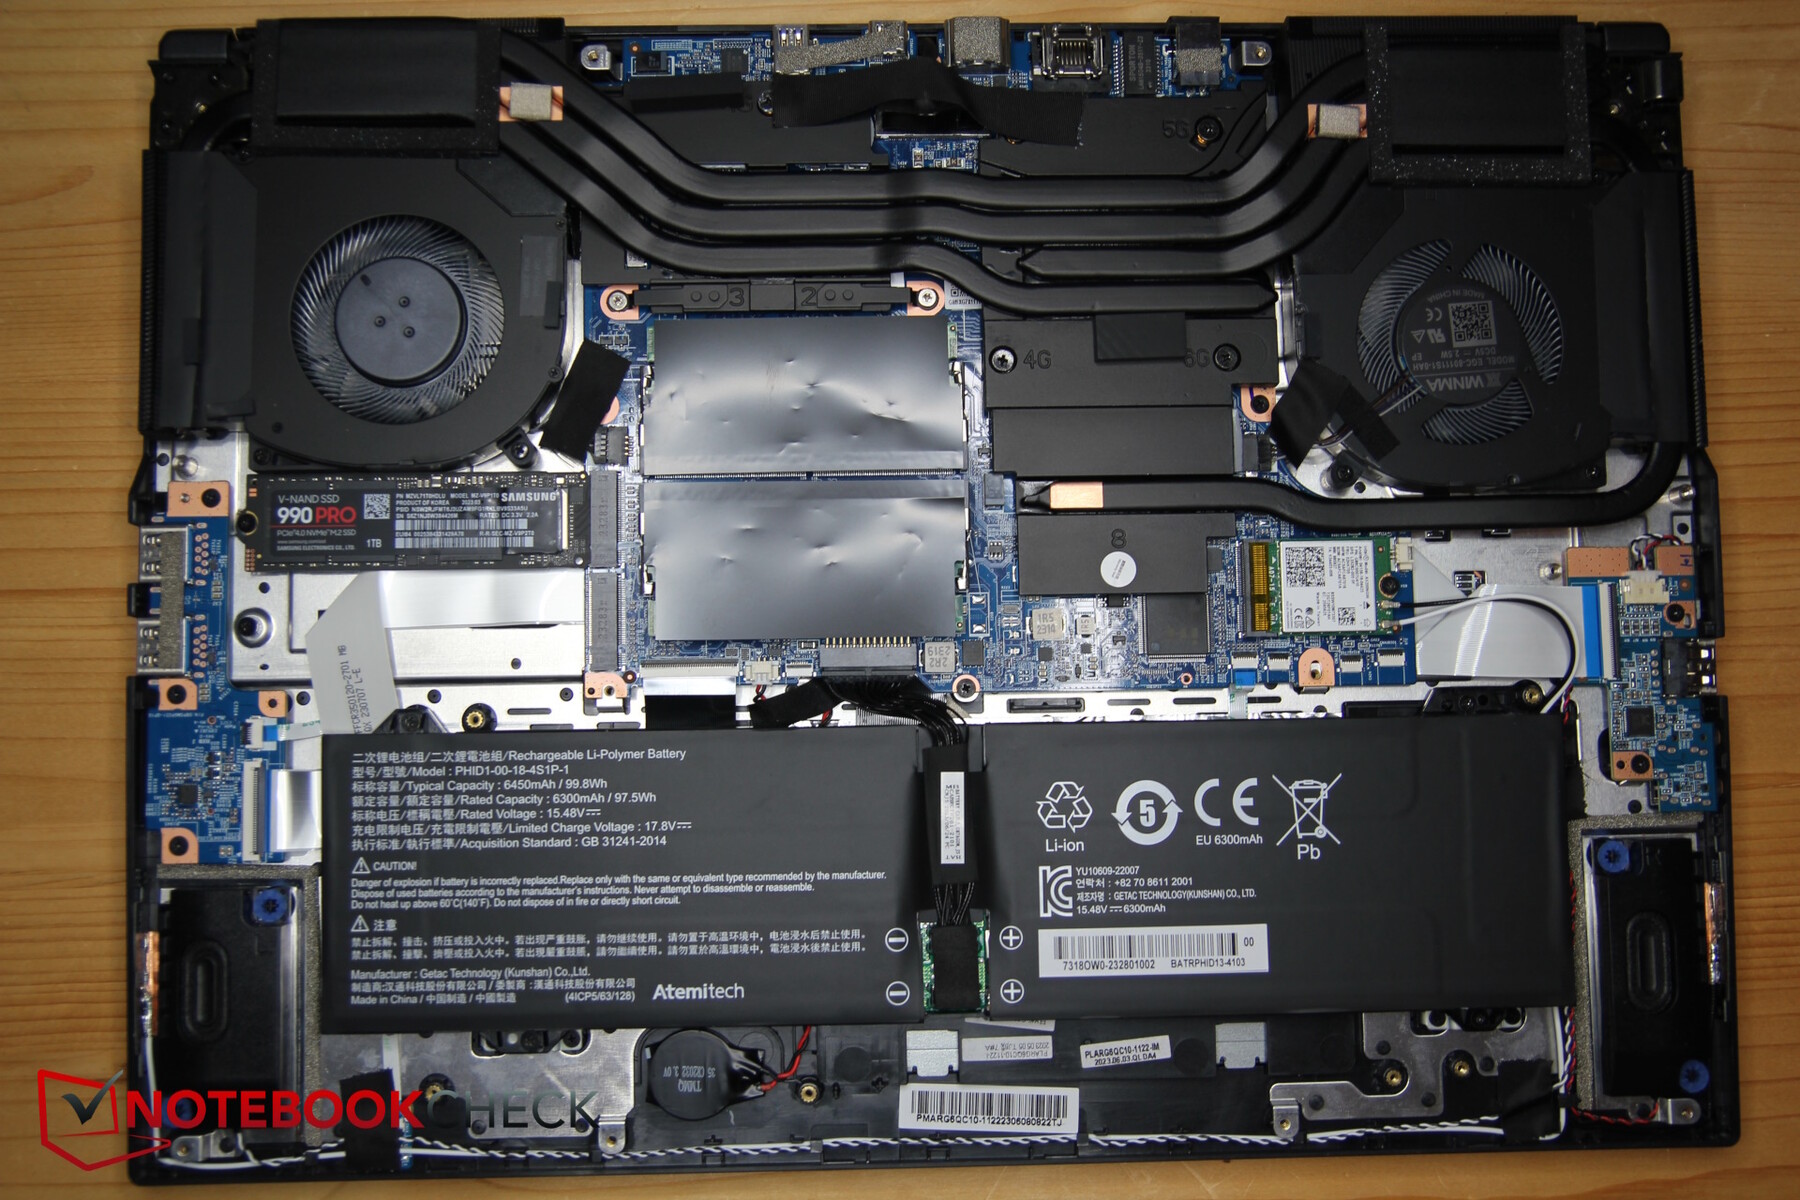
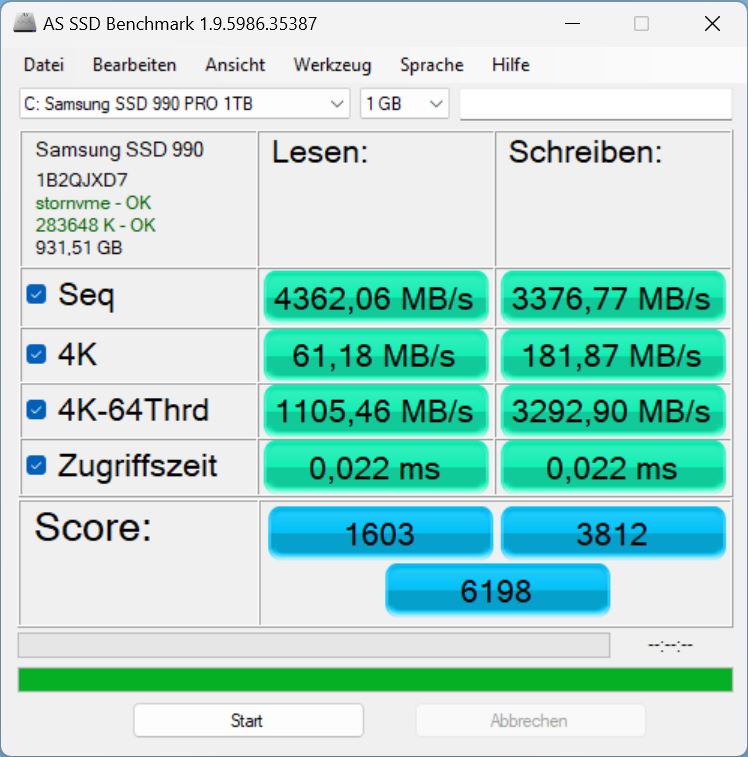
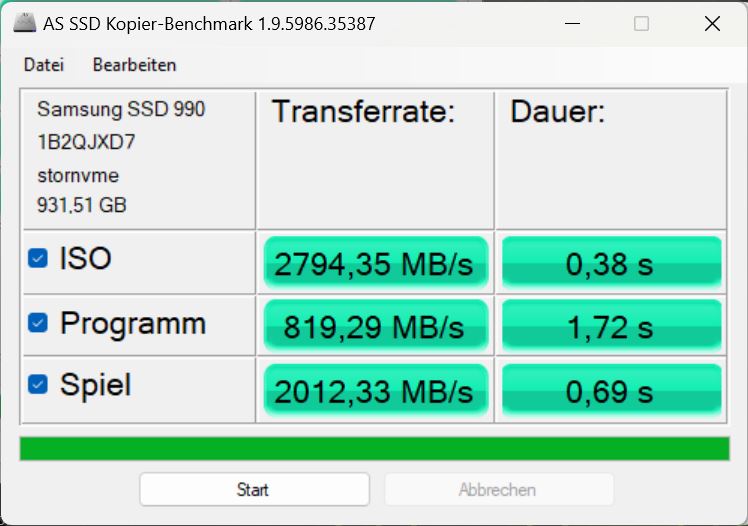
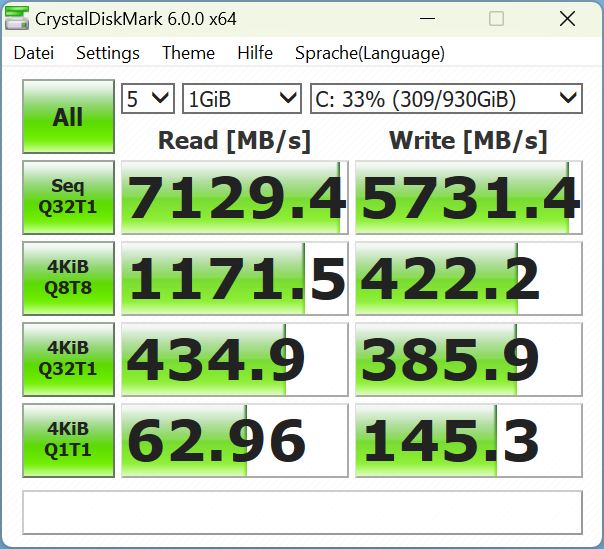
Schenker zainstalował w urządzeniu dysk Samsung 990 Pro o pojemności 1 TB. Ten dysk SSD jest jednym z najszybszych dostępnych modeli - w naszym zestawieniuLiście najlepszych dysków SSD,zajmuje 4. miejsce. W Core 16 nie jest on w pełni wykorzystywany, ale nadal jest niezwykle szybki. Co więcej, jego wydajność pozostaje niezmienna przez długi czas, w przeciwieństwie do równie szybkiego dysku SSD w modeluLenovo Legion Pro 5 16.

* ... im mniej tym lepiej
Reading continuous performance: DiskSpd Read Loop, Queue Depth 8
Karta graficzna
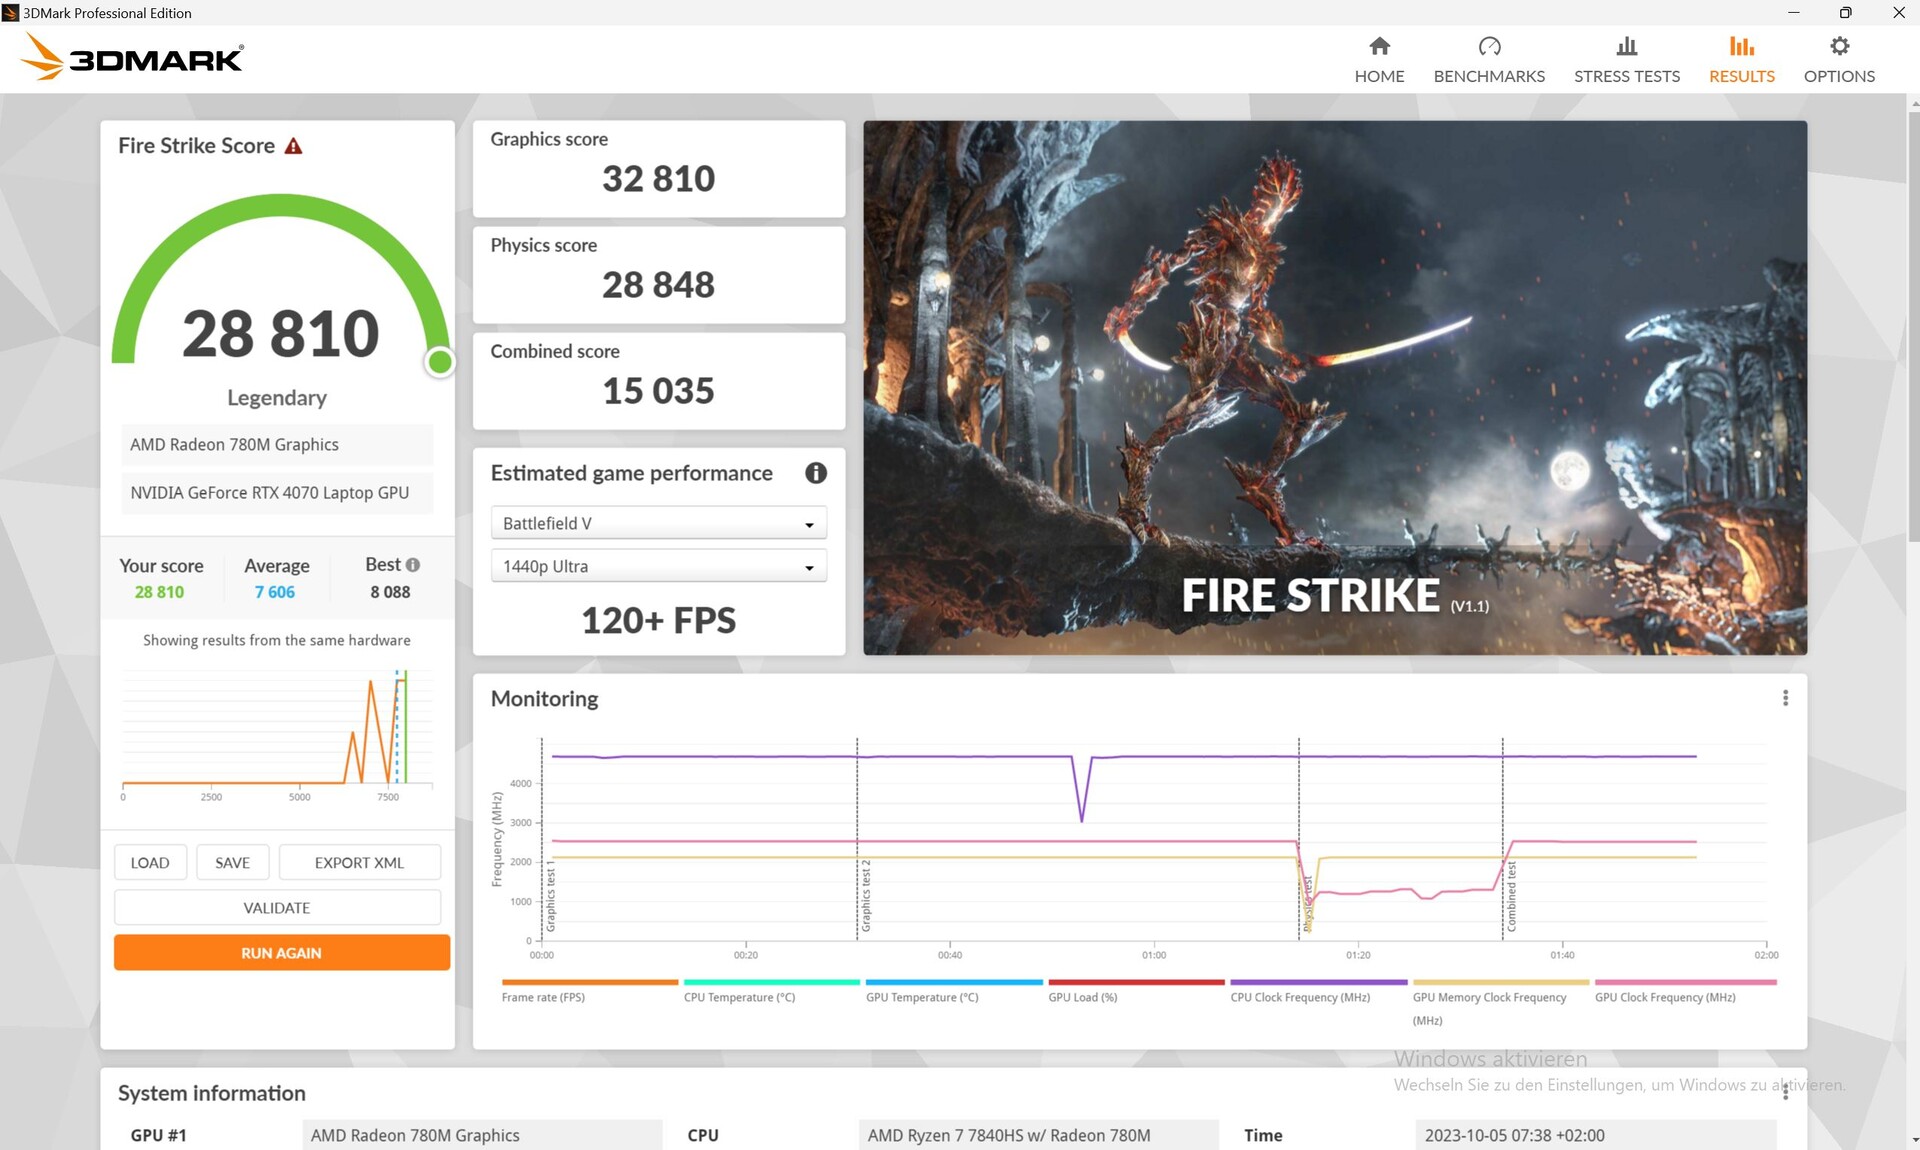
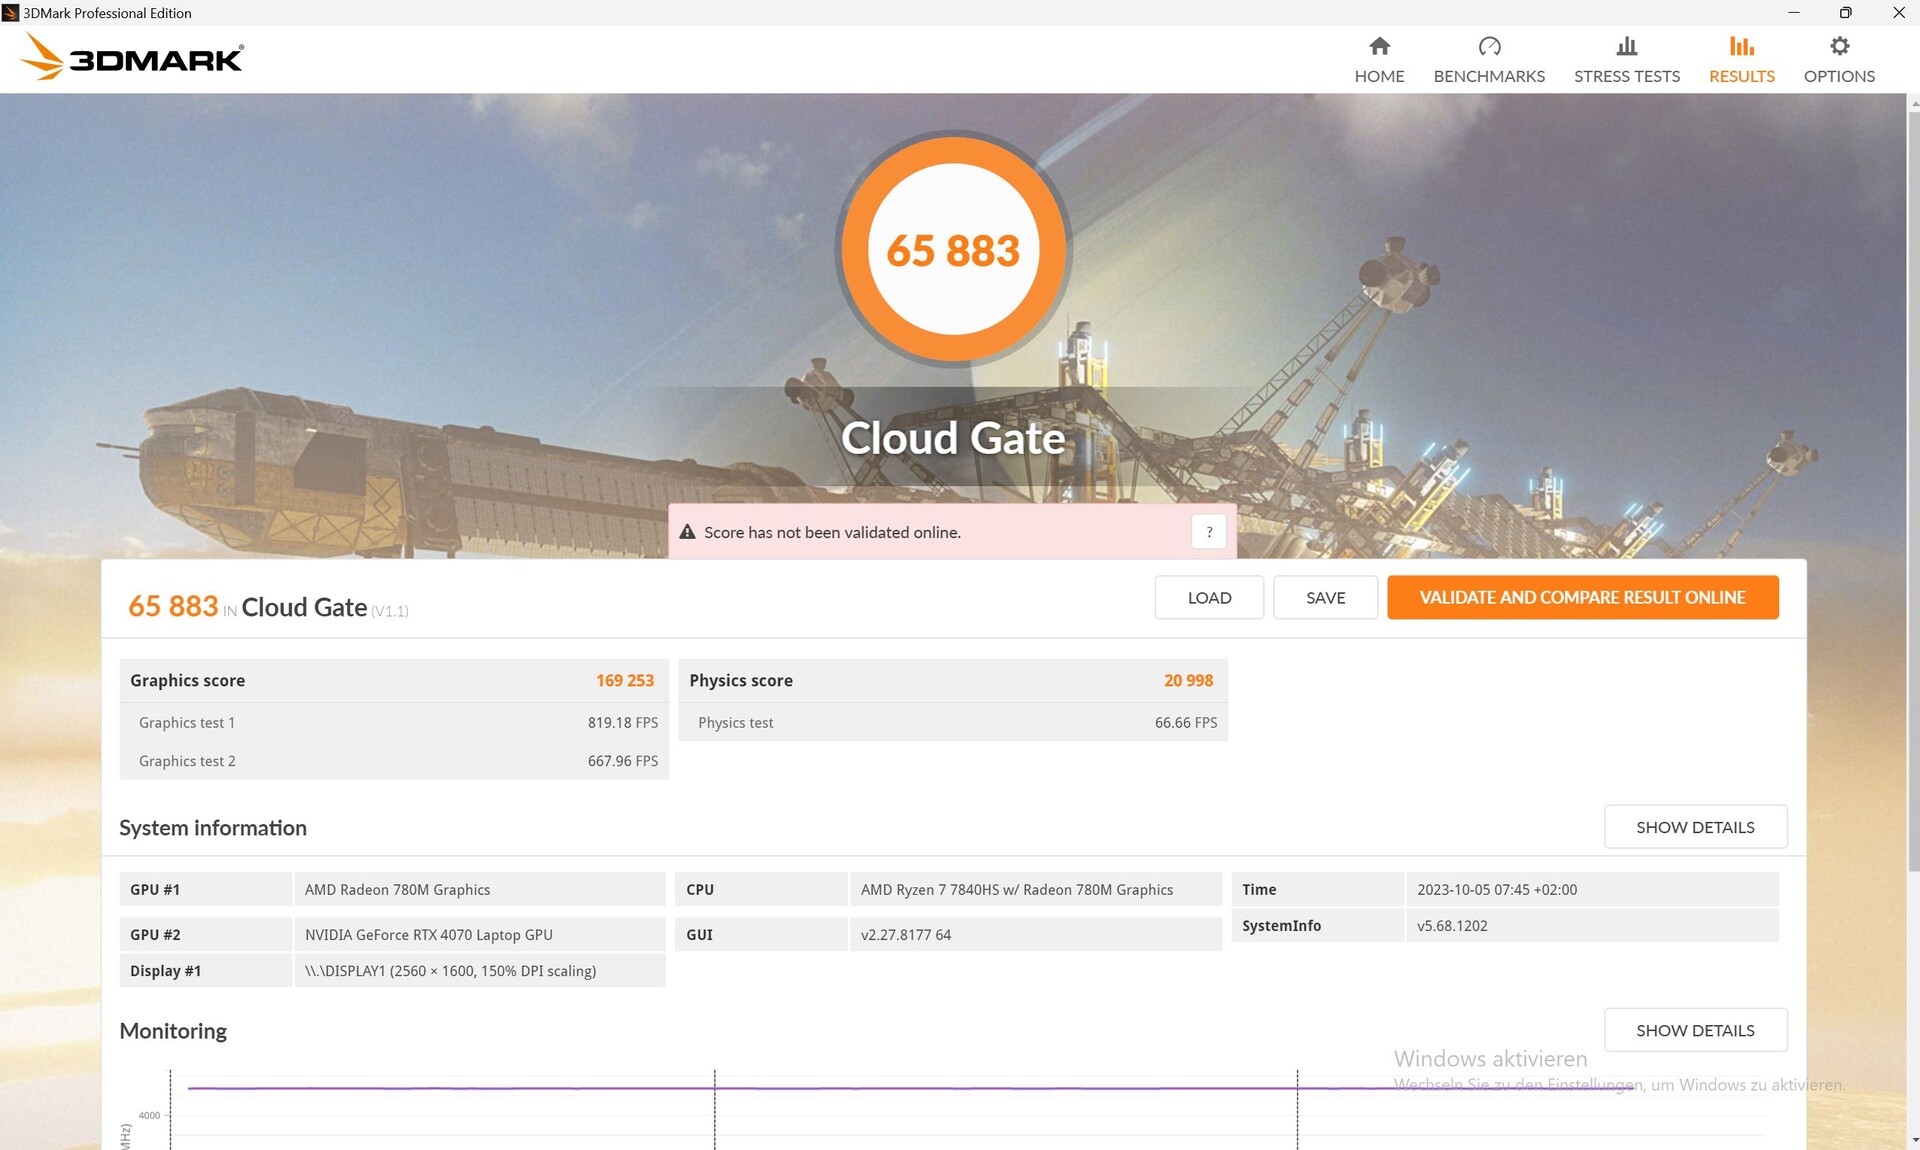
Karta graficznaNVIDIA GeForce RTX 4070 Laptop GPUjest w stanie wykorzystać pełne 140 W (115 W + 25 W Dynamic Boost). Alternatywnie, mogą Państwo nabyć laptopa za nieco mniejszą kwotę z kartą graficznąRTX 4060. W syntetycznych 3DMarkach Core 16 wysunął się na prowadzenie nad konkurentami - jego wydajność była o około 13 procent wyższa od typowej średniej RTX 4070 w naszej bazie danych.
W trybie bateryjnym pozostało tylko 16 407 punktów z pierwotnych 32 810 punktów osiągniętych przy ponownym uruchomieniu Fire Strike ponownie - spadek o 50 procent.
Core 16 jest również szybki podczas grania - jednak tym razem nie znalazł się na szczycie. Jest to prawdopodobnie spowodowane grami obciążającymi procesor, takimi jak DOTA 2. Tutaj sporo konkurentów osiągnęło lepsze wyniki CPU.
W trybie zrównoważonym zachowywał się dziwnie podczas uruchamiania The Witcher 3: Gra działała z prędkością około 117 klatek na sekundę, czyli prawie tak szybko, jak w trybie overdrive. Oznaczało to również, że wentylatory wcale nie pracowały ciszej. Po około minucie liczba klatek na sekundę nagle spadła do 30, a wentylatory emitowały tylko 28 dB hałasu. Wygląda na to, że ten tryb nie jest w pełni zoptymalizowany.
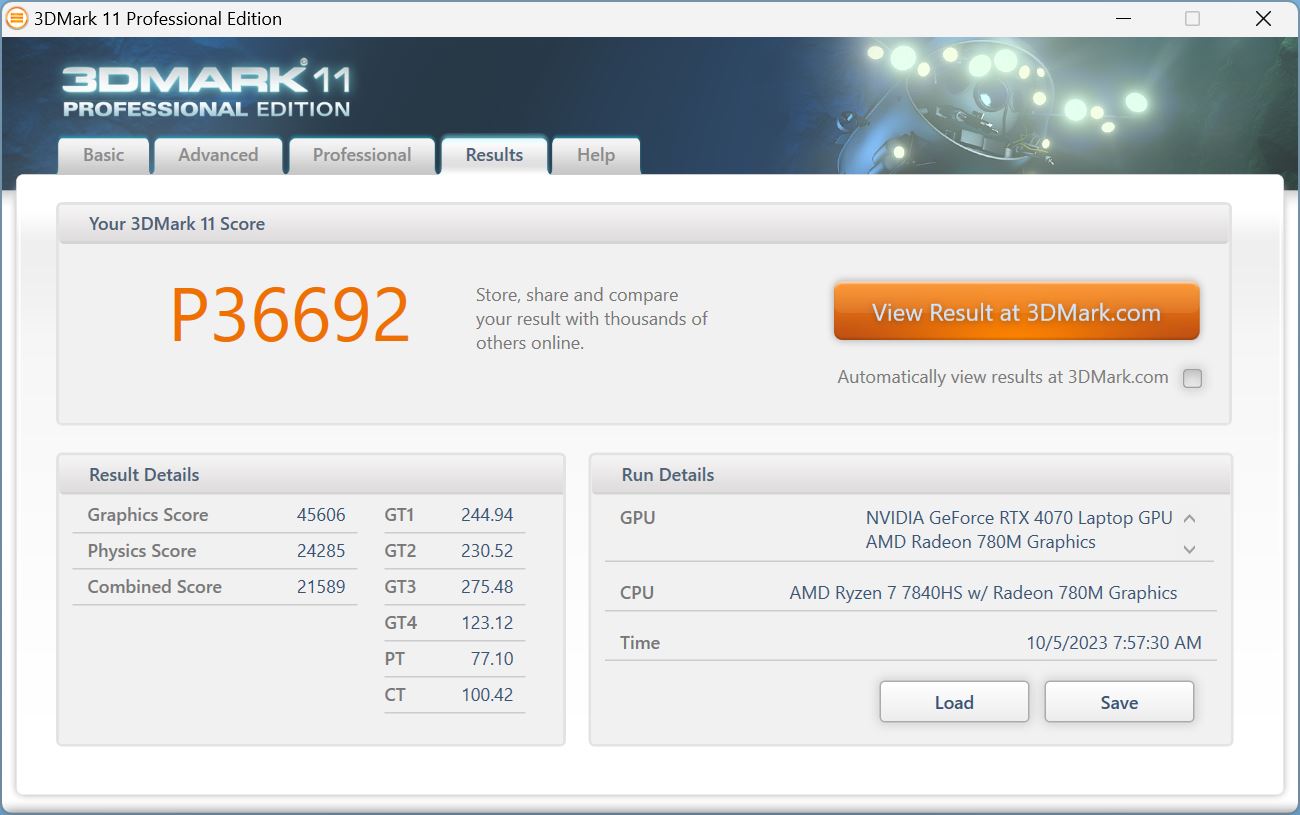
| 3DMark 11 Performance | 36692 pkt. | |
| 3DMark Cloud Gate Standard Score | 65883 pkt. | |
| 3DMark Fire Strike Score | 28810 pkt. | |
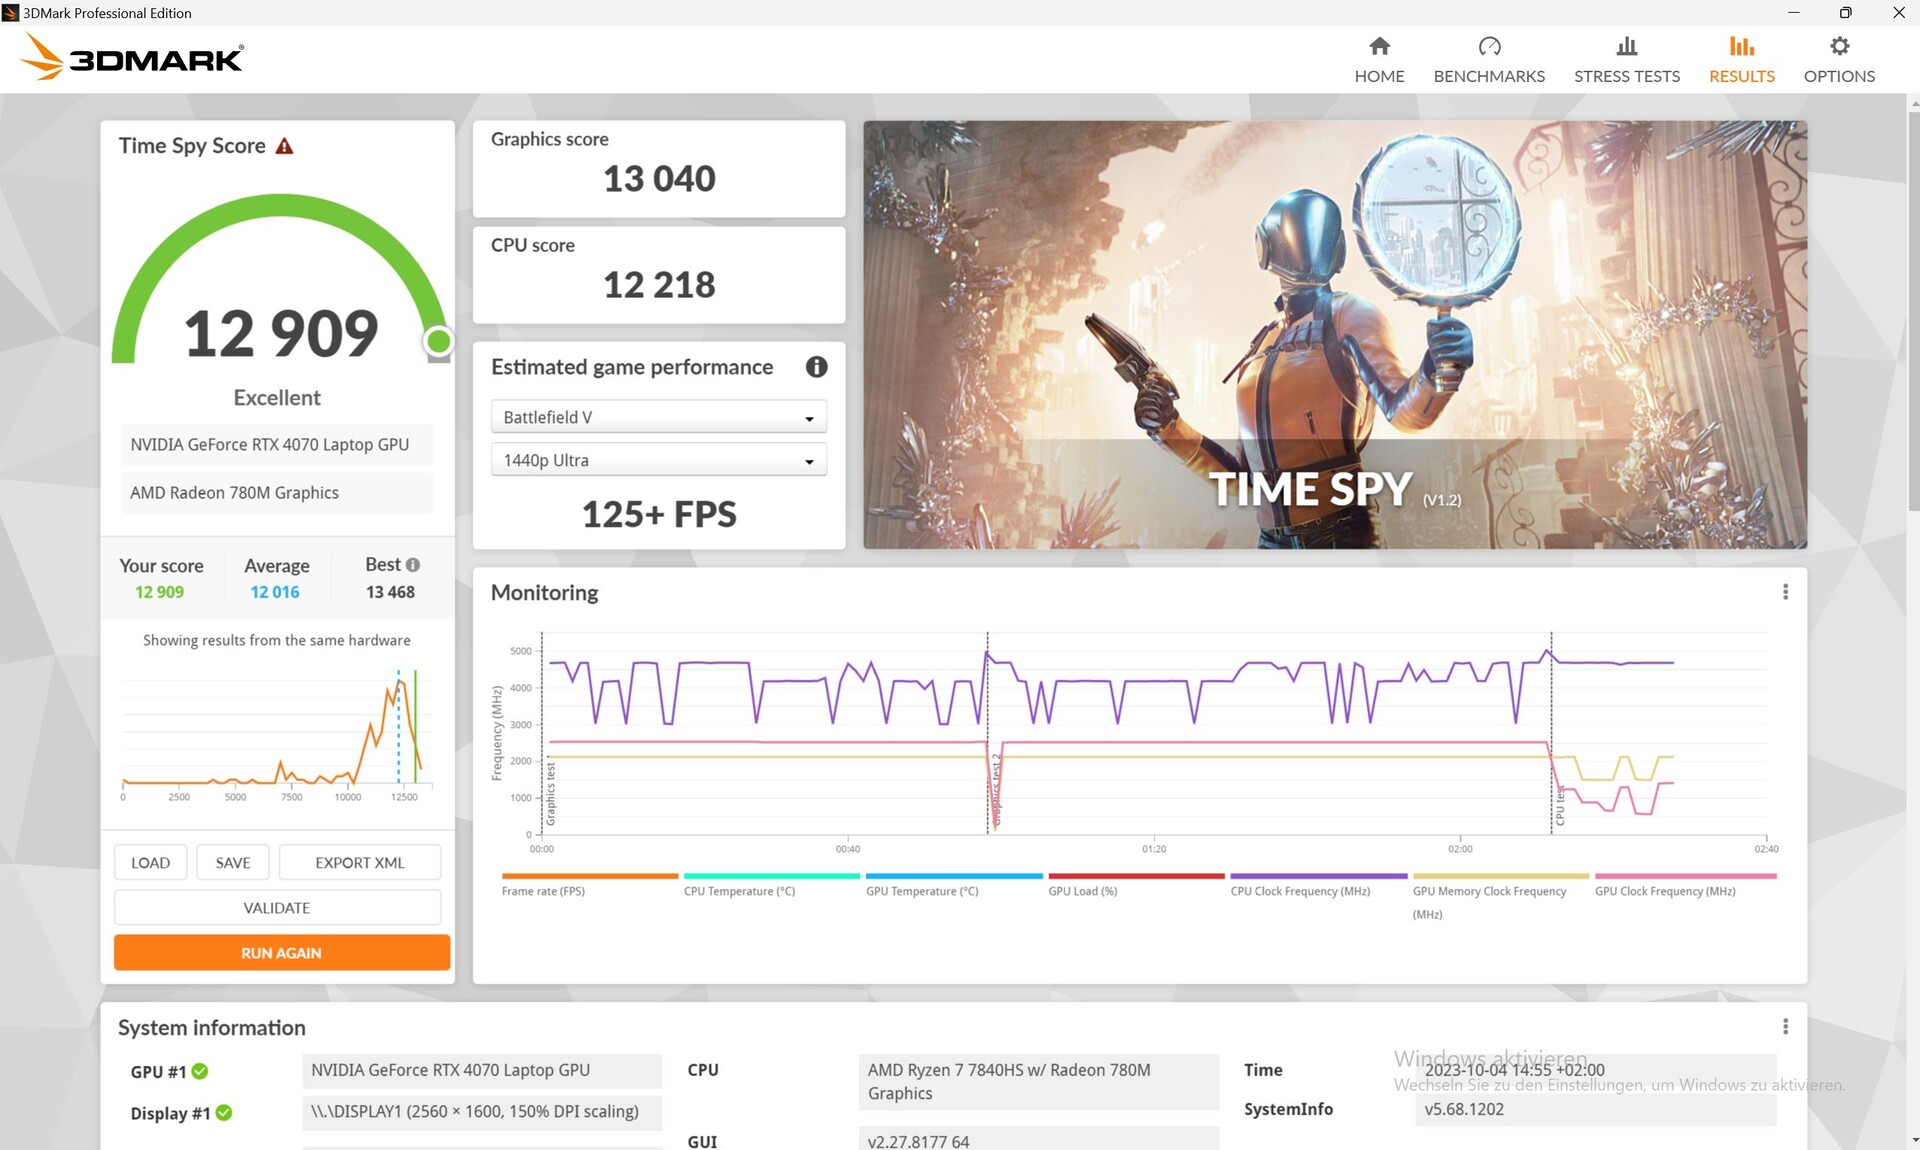
| 3DMark Time Spy Score | 12909 pkt. | |
Pomoc | ||
* ... im mniej tym lepiej
| Performance rating - Percent | |
| Średnia w klasie Gaming | |
| Lenovo Legion Pro 5 16ARX8 | |
| HP Omen Transcend 16 -2! | |
| MSI Stealth 16 Studio A13VG | |
| Schenker XMG CORE 16 (L23) | |
| HP Victus 16-r0077ng | |
| Acer Nitro 16 AN16-41 | |
| The Witcher 3 - 1920x1080 Ultra Graphics & Postprocessing (HBAO+) | |
| Średnia w klasie Gaming (95 - 240, n=8, ostatnie 2 lata) | |
| Schenker XMG CORE 16 (L23) | |
| Lenovo Legion Pro 5 16ARX8 | |
| MSI Stealth 16 Studio A13VG | |
| HP Victus 16-r0077ng | |
| Acer Nitro 16 AN16-41 | |
| HP Omen Transcend 16 | |
| GTA V - 1920x1080 Highest AA:4xMSAA + FX AF:16x | |
| Średnia w klasie Gaming (48.3 - 186.9, n=100, ostatnie 2 lata) | |
| Lenovo Legion Pro 5 16ARX8 | |
| MSI Stealth 16 Studio A13VG | |
| Schenker XMG CORE 16 (L23) | |
| HP Victus 16-r0077ng | |
| Acer Nitro 16 AN16-41 | |
| Final Fantasy XV Benchmark - 1920x1080 High Quality | |
| Średnia w klasie Gaming (41 - 215, n=101, ostatnie 2 lata) | |
| Schenker XMG CORE 16 (L23) | |
| Lenovo Legion Pro 5 16ARX8 | |
| MSI Stealth 16 Studio A13VG | |
| HP Victus 16-r0077ng | |
| Acer Nitro 16 AN16-41 | |
| Strange Brigade - 1920x1080 ultra AA:ultra AF:16 | |
| Średnia w klasie Gaming (76.3 - 456, n=91, ostatnie 2 lata) | |
| Lenovo Legion Pro 5 16ARX8 | |
| Schenker XMG CORE 16 (L23) | |
| HP Omen Transcend 16 | |
| MSI Stealth 16 Studio A13VG | |
| Acer Nitro 16 AN16-41 | |
| HP Victus 16-r0077ng | |
| Dota 2 Reborn - 1920x1080 ultra (3/3) best looking | |
| Lenovo Legion Pro 5 16ARX8 | |
| HP Omen Transcend 16 | |
| MSI Stealth 16 Studio A13VG | |
| Średnia w klasie Gaming (84.8 - 248, n=110, ostatnie 2 lata) | |
| Schenker XMG CORE 16 (L23) | |
| HP Victus 16-r0077ng | |
| Acer Nitro 16 AN16-41 | |
Witcher 3 FPS diagram
| low | med. | high | ultra | QHD | 4K | |
|---|---|---|---|---|---|---|
| GTA V (2015) | 185.4 | 174.1 | 116.1 | |||
| The Witcher 3 (2015) | 364.2 | 291.5 | 245.2 | 120 | 92 | |
| Dota 2 Reborn (2015) | 161.2 | 153.5 | 142.2 | 134.8 | 136.9 | |
| Final Fantasy XV Benchmark (2018) | 215 | 171.4 | 124.8 | 91 | ||
| X-Plane 11.11 (2018) | 123.7 | 108.3 | 85.5 | 85.7 | ||
| Strange Brigade (2018) | 367 | 302 | 249 | 218 | ||
| Hogwarts Legacy (2023) | 77.2 | 55.3 |
Emisje i moc - fajny Core 16 z wytrzymałością
Emisja hałasu
W trybie bezczynności wentylatory często w ogóle się nie obracają - zwłaszcza w trybie zrównoważonym. Nawet w trybie Overdrive często ma to miejsce, ale tutaj wentylatory czasami również obracają się szybko.
Pod obciążeniem poziom hałasu Core 16 rośnie równomiernie, a nie skokowo. Oznacza to, że jego poziom hałasu pozostaje stosunkowo niski przy średnim obciążeniu, takim jak w pierwszej scenie testu porównawczego 3DMark06.
Podczas ciągłych sesji gamingowych może być nieco głośniej, ale konkurencja osiąga podobne poziomy hałasu - Acer Nitro 16 staje się wręcz nieznośnie głośny. MSI Stealth 16 Studio, a zwłaszcza słabszy HP Victus 16 pozostają cichsze.
Hałas
| luz |
| 23 / 28.48 / 28.48 dB |
| obciążenie |
| 30 / 54.12 dB |
 | ||
30 dB cichy 40 dB(A) słyszalny 50 dB(A) irytujący |
||
min: | ||
| Schenker XMG CORE 16 (L23) GeForce RTX 4070 Laptop GPU, R7 7840HS, Samsung 990 Pro 1 TB | Lenovo Legion Pro 5 16ARX8 GeForce RTX 4070 Laptop GPU, R7 7745HX, Samsung PM9A1 MZVL21T0HCLR | Acer Nitro 16 AN16-41 GeForce RTX 4070 Laptop GPU, R7 7735HS, Samsung PM9A1 MZVL21T0HCLR | HP Omen Transcend 16 GeForce RTX 4070 Laptop GPU, i9-13900HX, SK hynix PC801 HFS002TEJ9X101N | MSI Stealth 16 Studio A13VG GeForce RTX 4070 Laptop GPU, i7-13700H, Micron 3400 2TB MTFDKBA2T0TFH | HP Victus 16-r0077ng GeForce RTX 4070 Laptop GPU, i7-13700H, Kioxia XG8 KXG80ZNV1T02 | |
|---|---|---|---|---|---|---|
| Noise | 5% | -6% | -12% | 5% | -8% | |
| wyłączone / środowisko * (dB) | 23 | 23.2 -1% | 25.7 -12% | 22.9 -0% | 24 -4% | 25 -9% |
| Idle Minimum * (dB) | 23 | 23.2 -1% | 25.7 -12% | 29.1 -27% | 24 -4% | 28 -22% |
| Idle Average * (dB) | 28.48 | 23.2 19% | 25.7 10% | 29.1 -2% | 24 16% | 29 -2% |
| Idle Maximum * (dB) | 28.48 | 26.2 8% | 26.3 8% | 29.1 -2% | 24 16% | 30 -5% |
| Load Average * (dB) | 30 | 31.4 -5% | 33.9 -13% | 45.7 -52% | 34.81 -16% | 43 -43% |
| Witcher 3 ultra * (dB) | 54.12 | 48.4 11% | 54.3 -0% | 44.05 19% | 46 15% | |
| Load Maximum * (dB) | 54.12 | 53.8 1% | 62 -15% | 54.3 -0% | 51.57 5% | 48 11% |
* ... im mniej tym lepiej
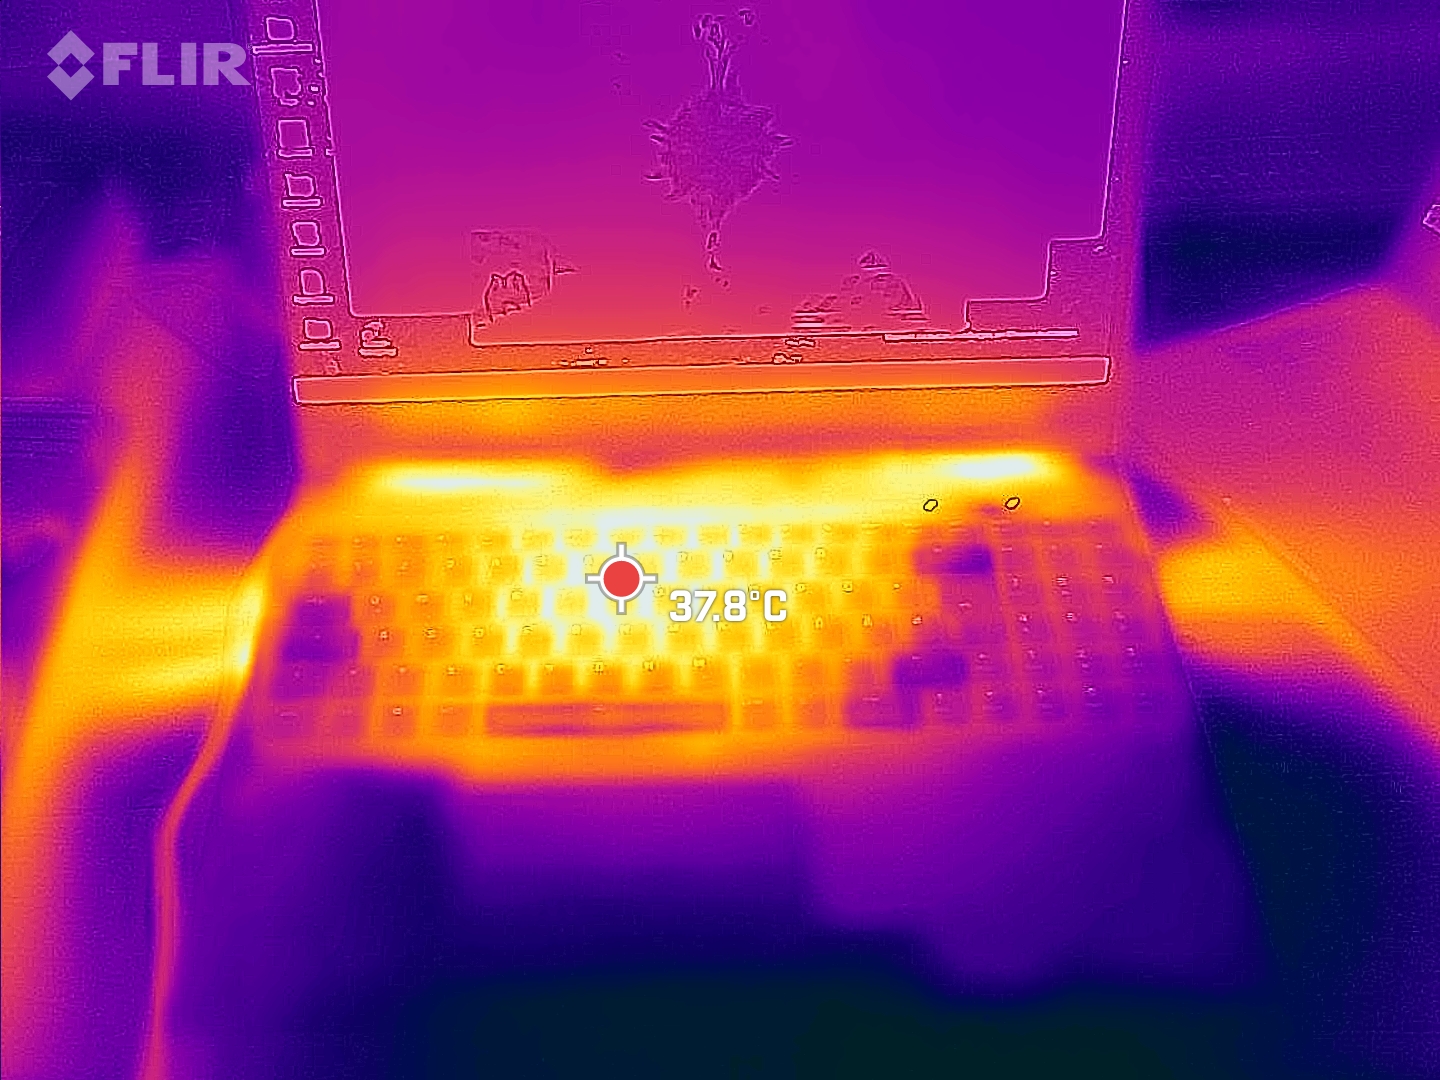
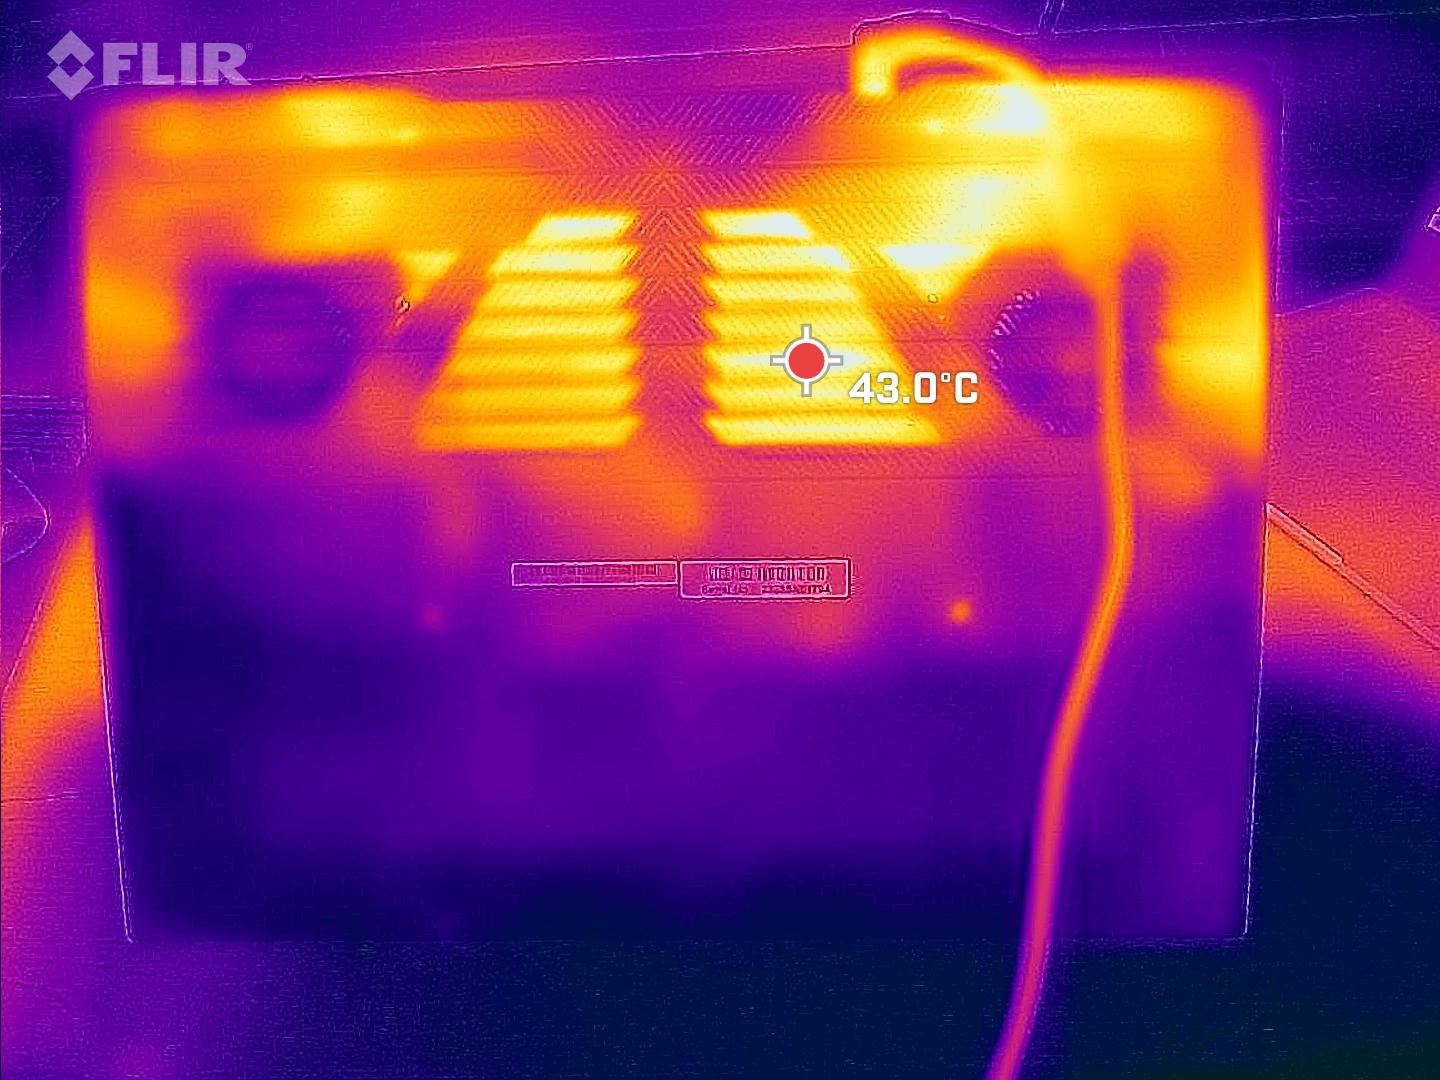
Temperatura
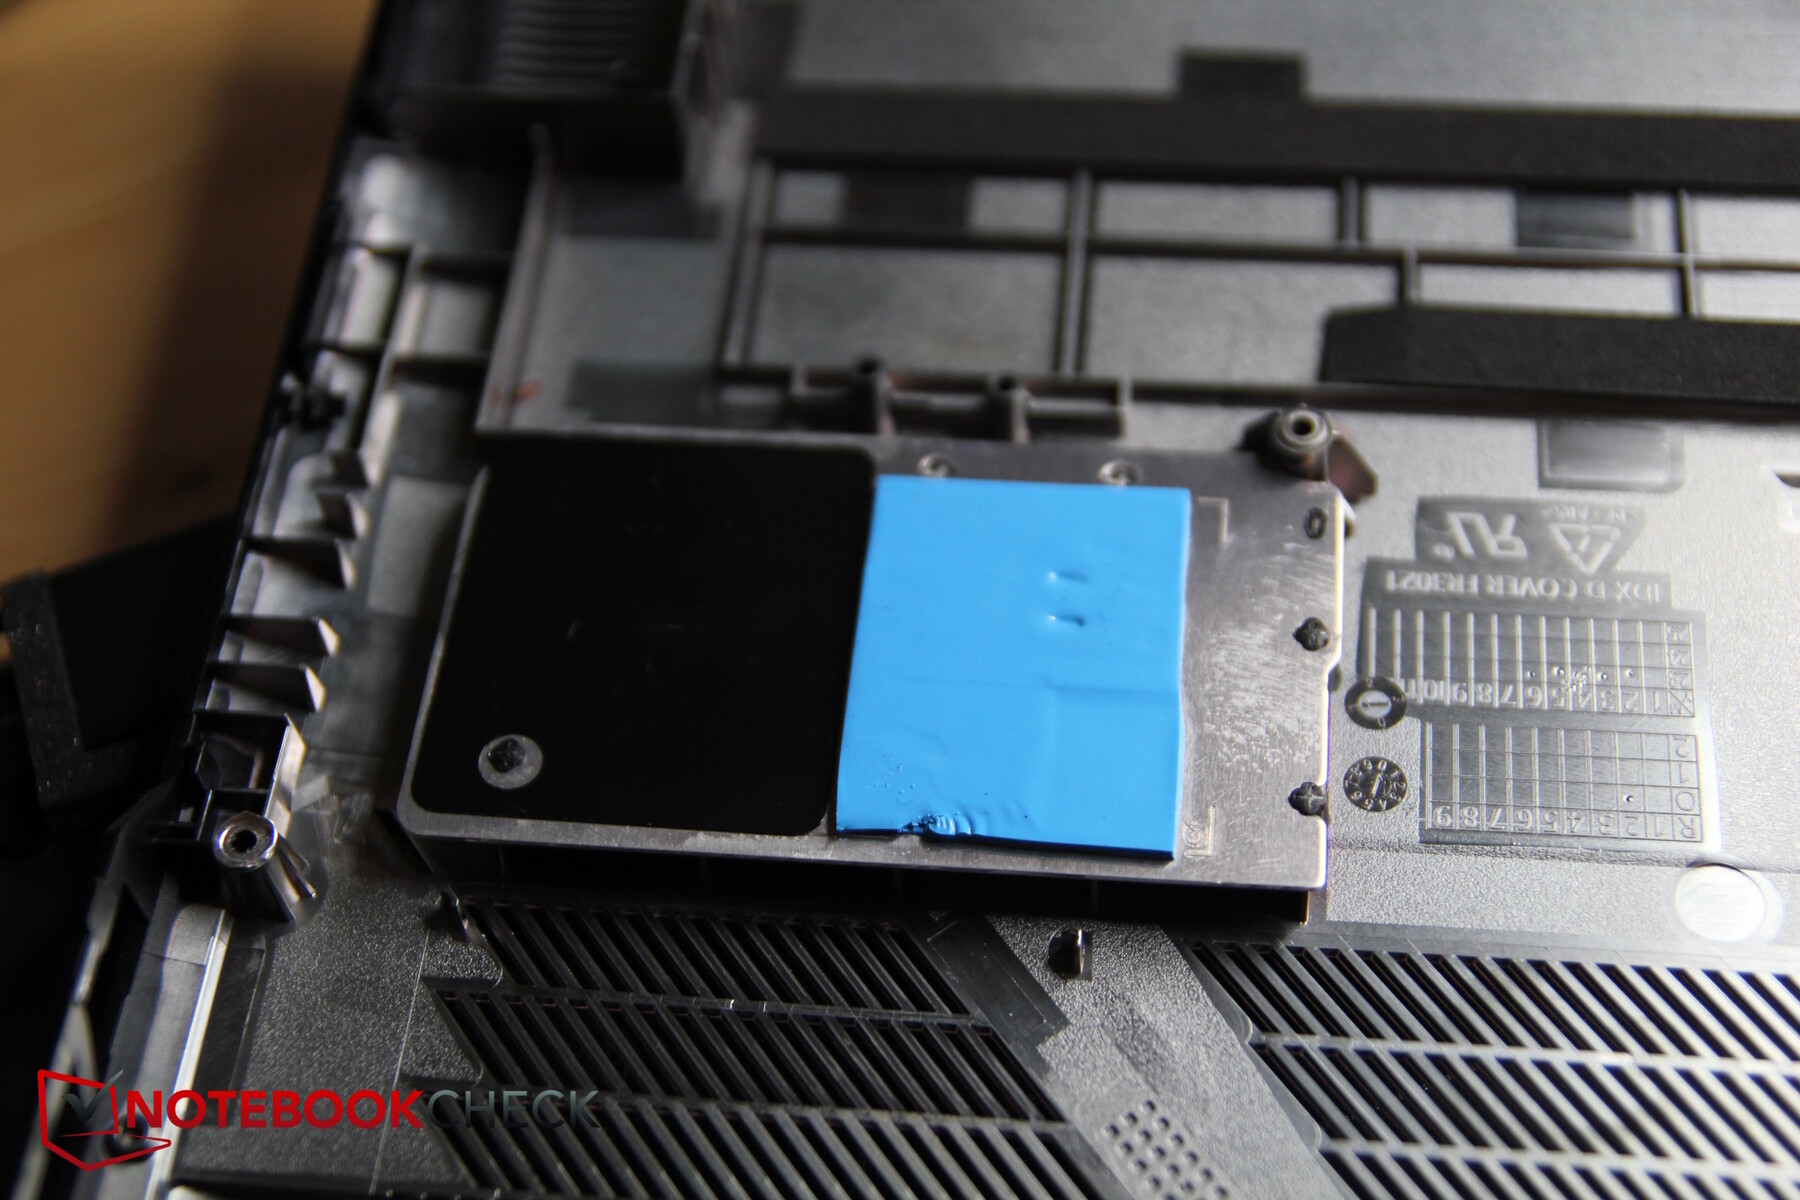
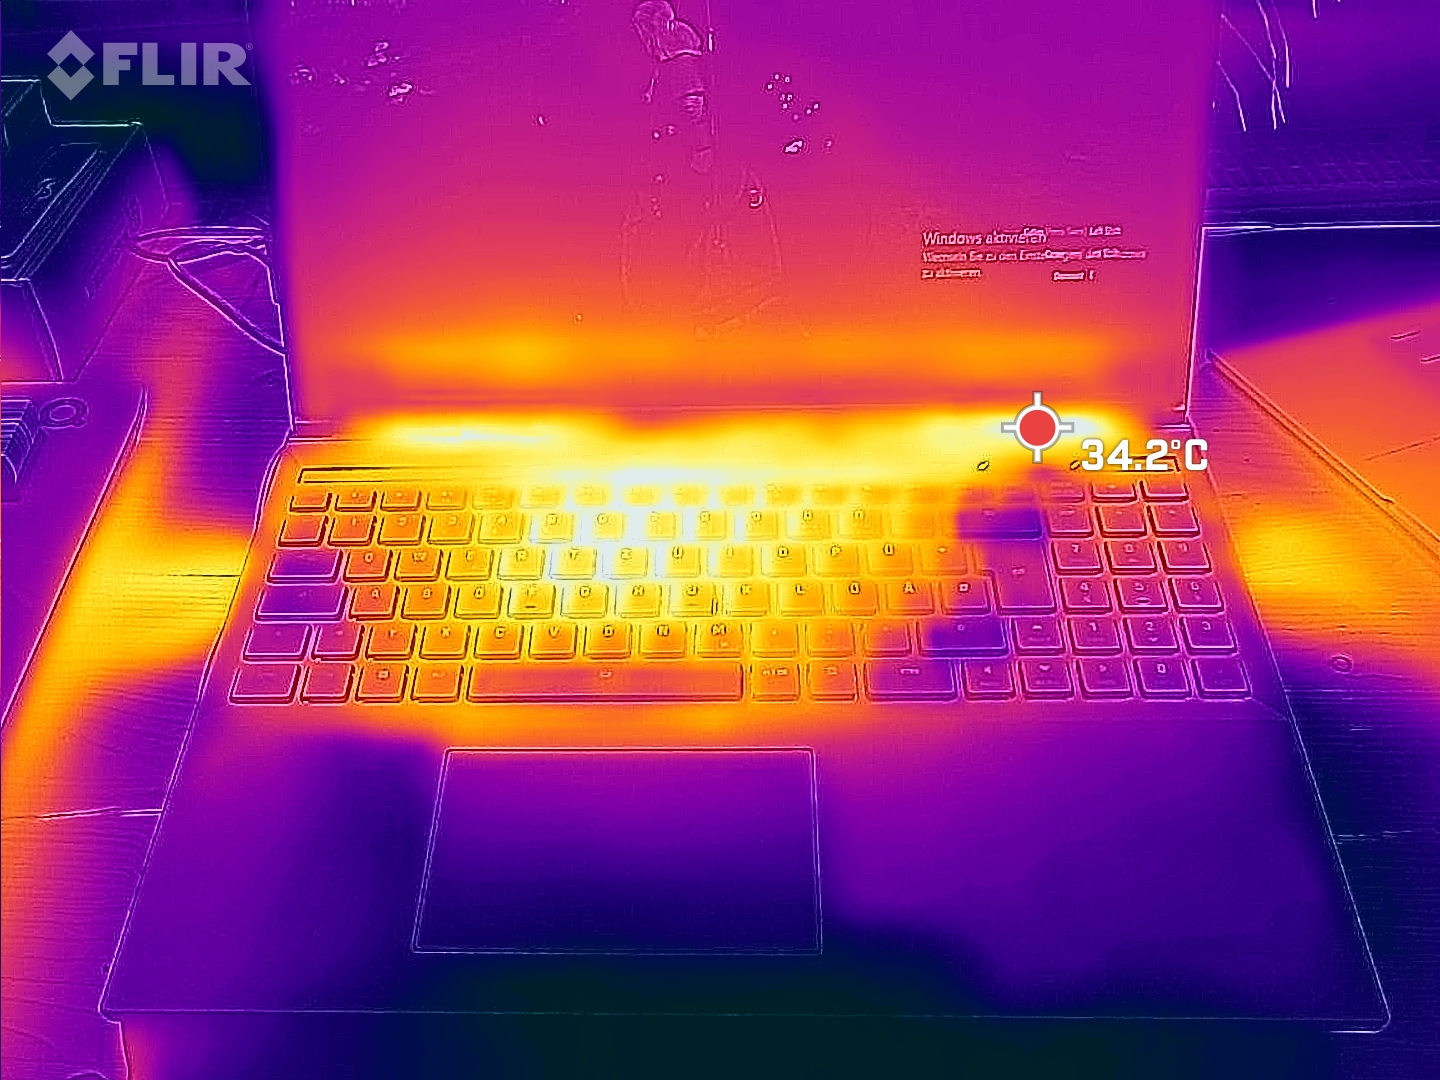
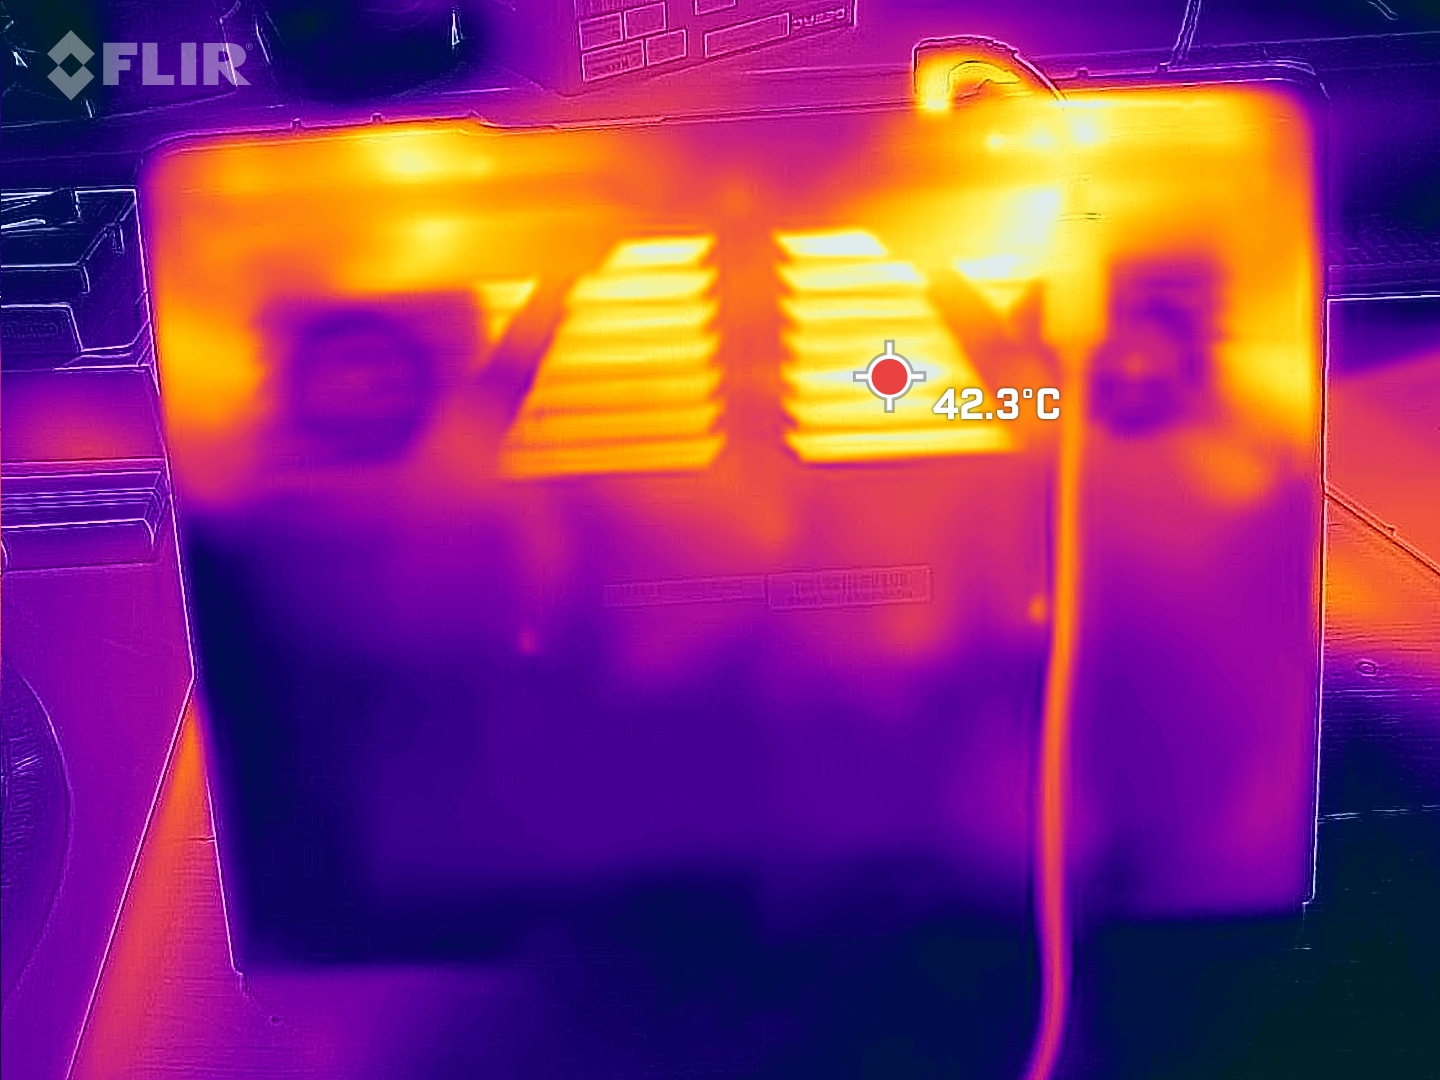
Schenker podkreśla, że wykorzystuje pastę termoprzewodzącą z ciekłego metalu. Core 16 nigdy nie nagrzewa się zbytnio - zmierzyliśmy 46°C wokół środka tylnej części pod ciągłym obciążeniem. Lewa strona i klawisze WASD wydają się być nieco cieplejsze niż prawa strona. 39 °C pod obciążeniem jest nadal w porządku.
(-) Maksymalna temperatura w górnej części wynosi 46 °C / 115 F, w porównaniu do średniej 40.4 °C / 105 F , począwszy od 21.2 do 68.8 °C dla klasy Gaming.
(±) Dno nagrzewa się maksymalnie do 44 °C / 111 F, w porównaniu do średniej 43.2 °C / 110 F
(+) W stanie bezczynności średnia temperatura górnej części wynosi 29.7 °C / 85 F, w porównaniu ze średnią temperaturą urządzenia wynoszącą 33.9 °C / ### class_avg_f### F.
(±) Podczas gry w Wiedźmina 3 średnia temperatura górnej części wynosi 35 °C / 95 F, w porównaniu do średniej temperatury urządzenia wynoszącej 33.9 °C / ## #class_avg_f### F.
(+) Podpórki pod nadgarstki i touchpad są chłodniejsze niż temperatura skóry i maksymalnie 27 °C / 80.6 F i dlatego są chłodne w dotyku.
(±) Średnia temperatura obszaru podparcia dłoni w podobnych urządzeniach wynosiła 28.8 °C / 83.8 F (+1.8 °C / 3.2 F).
| Schenker XMG CORE 16 (L23) AMD Ryzen 7 7840HS, NVIDIA GeForce RTX 4070 Laptop GPU | Lenovo Legion Pro 5 16ARX8 AMD Ryzen 7 7745HX, NVIDIA GeForce RTX 4070 Laptop GPU | Acer Nitro 16 AN16-41 AMD Ryzen 7 7735HS, NVIDIA GeForce RTX 4070 Laptop GPU | HP Omen Transcend 16 Intel Core i9-13900HX, NVIDIA GeForce RTX 4070 Laptop GPU | MSI Stealth 16 Studio A13VG Intel Core i7-13700H, NVIDIA GeForce RTX 4070 Laptop GPU | HP Victus 16-r0077ng Intel Core i7-13700H, NVIDIA GeForce RTX 4070 Laptop GPU | |
|---|---|---|---|---|---|---|
| Heat | 8% | -3% | -1% | -26% | -10% | |
| Maximum Upper Side * (°C) | 46 | 41.8 9% | 41.5 10% | 47.4 -3% | 60 -30% | 51 -11% |
| Maximum Bottom * (°C) | 44 | 41.4 6% | 51.8 -18% | 54.4 -24% | 61 -39% | 54 -23% |
| Idle Upper Side * (°C) | 32 | 29 9% | 31.6 1% | 28.4 11% | 38.2 -19% | 37 -16% |
| Idle Bottom * (°C) | 33 | 30.4 8% | 34.5 -5% | 29.2 12% | 37.7 -14% | 29 12% |
* ... im mniej tym lepiej
Głośniki
Głośniki stereo nie mogą pochwalić się wysoką głośnością, dużą ilością basu lub zrównoważonymi niskimi i średnimi tonami. Jedynie wysokie tony są zrównoważone i liniowe. Aby uzyskać lepsze wrażenia dźwiękowe, należy użyć słuchawek lub zewnętrznego systemu. Gniazdo słuchawkowe i wejście mikrofonowe są dostępne do podłączenia tych pierwszych.
Schenker XMG CORE 16 (L23) analiza dźwięku
(±) | głośność głośnika jest średnia, ale dobra (79.4 dB)
Bas 100 - 315 Hz
(-) | prawie brak basu - średnio 21.6% niższa od mediany
(±) | liniowość basu jest średnia (11.4% delta do poprzedniej częstotliwości)
Średnie 400 - 2000 Hz
(±) | wyższe średnie - średnio 5.4% wyższe niż mediana
(+) | średnie są liniowe (6.7% delta do poprzedniej częstotliwości)
Wysokie 2–16 kHz
(+) | zrównoważone maksima - tylko 2.3% od mediany
(+) | wzloty są liniowe (6.6% delta do poprzedniej częstotliwości)
Ogólnie 100 - 16.000 Hz
(±) | liniowość ogólnego dźwięku jest średnia (17.1% różnicy w stosunku do mediany)
W porównaniu do tej samej klasy
» 46% wszystkich testowanych urządzeń w tej klasie było lepszych, 12% podobnych, 43% gorszych
» Najlepszy miał deltę 6%, średnia wynosiła ###średnia###%, najgorsza wynosiła 132%
W porównaniu do wszystkich testowanych urządzeń
» 31% wszystkich testowanych urządzeń było lepszych, 8% podobnych, 61% gorszych
» Najlepszy miał deltę 4%, średnia wynosiła ###średnia###%, najgorsza wynosiła 134%
Lenovo Legion Pro 5 16ARX8 analiza dźwięku
(±) | głośność głośnika jest średnia, ale dobra (80.9 dB)
Bas 100 - 315 Hz
(-) | prawie brak basu - średnio 24% niższa od mediany
(±) | liniowość basu jest średnia (13.4% delta do poprzedniej częstotliwości)
Średnie 400 - 2000 Hz
(+) | zbalansowane środki średnie - tylko 4.7% od mediany
(+) | średnie są liniowe (6.2% delta do poprzedniej częstotliwości)
Wysokie 2–16 kHz
(+) | zrównoważone maksima - tylko 2.5% od mediany
(+) | wzloty są liniowe (6.2% delta do poprzedniej częstotliwości)
Ogólnie 100 - 16.000 Hz
(±) | liniowość ogólnego dźwięku jest średnia (21.9% różnicy w stosunku do mediany)
W porównaniu do tej samej klasy
» 79% wszystkich testowanych urządzeń w tej klasie było lepszych, 6% podobnych, 16% gorszych
» Najlepszy miał deltę 6%, średnia wynosiła ###średnia###%, najgorsza wynosiła 132%
W porównaniu do wszystkich testowanych urządzeń
» 63% wszystkich testowanych urządzeń było lepszych, 7% podobnych, 31% gorszych
» Najlepszy miał deltę 4%, średnia wynosiła ###średnia###%, najgorsza wynosiła 134%
Zużycie energii
W trybie bezczynności zużycie energii jest umiarkowane - jesteśmy przyzwyczajeni do wyższych wartości z ostatnich modeli XMG. Podczas grania zużycie energii jest powiązane z wydajnością, dlatego ten laptop plasuje się pomiędzyLenovo Legion Pro 5a HP Omen Transcend 16z jednej strony, a pomiędzy MSI Stealth 16 Studioi HP Victus 16z drugiej.
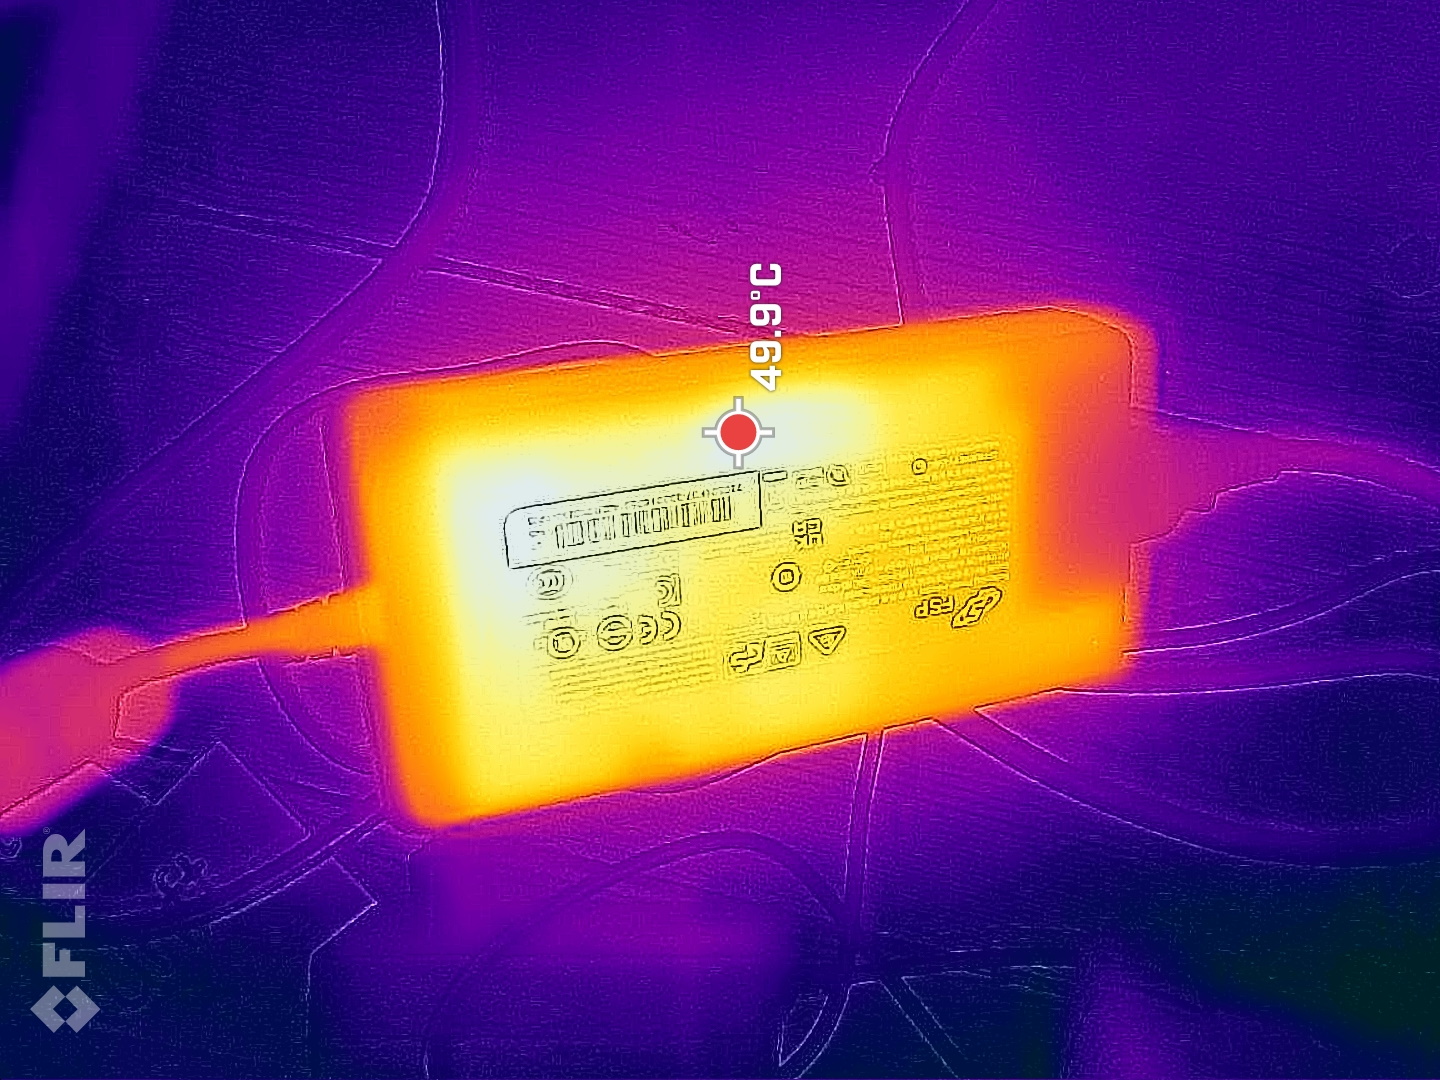
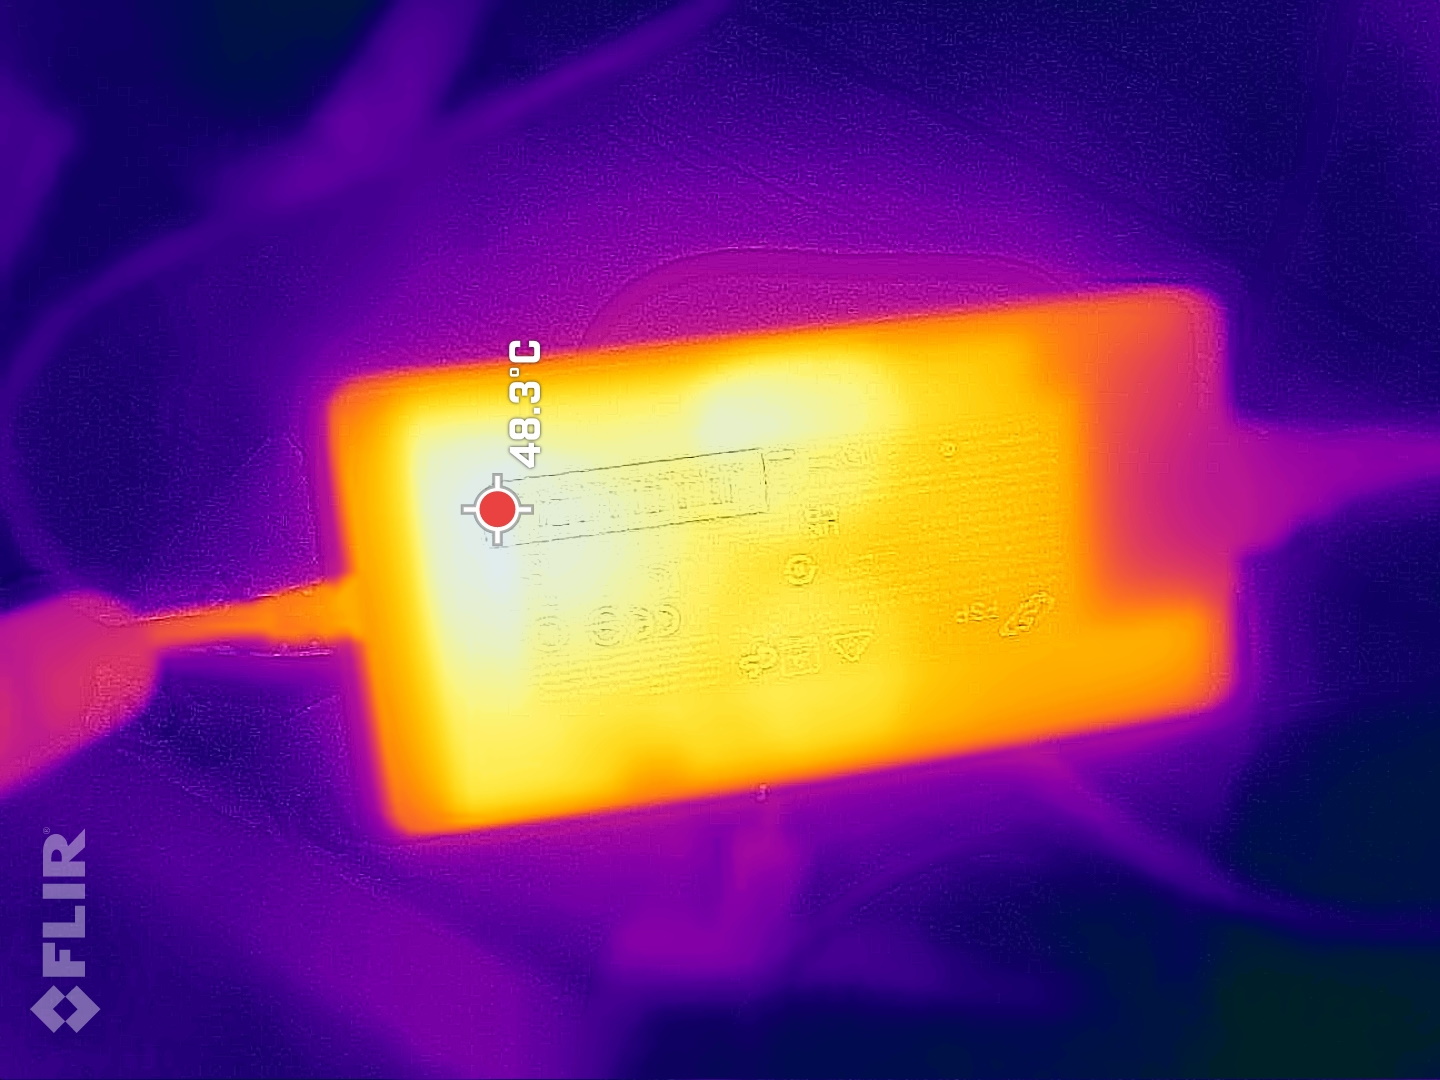
Zmierzyliśmy krótkoterminowe maksymalne zużycie energii na poziomie 280 watów - 230-watowy zasilacz (teraz FSP zamiast LiteOn) może mieć z tym spore trudności. Jednak Core zużywa średnio 179 watów podczas uruchamiania The Witcher 3 w Full HD Ultra, co oznacza, że zasilacz powinien mieć wystarczające rezerwy do gier i zawsze może niezawodnie ładować laptopa. Zmierzyliśmy jednak zużycie, które stale przekraczało 230 watów w pierwszych minutach testu warunków skrajnych - patrz krzywa poniżej.
| wyłączony / stan wstrzymania | |
| luz | |
| obciążenie |
|
Legenda:
min: | |
| Schenker XMG CORE 16 (L23) R7 7840HS, GeForce RTX 4070 Laptop GPU, Samsung 990 Pro 1 TB, IPS, 2560x1600, 16" | Lenovo Legion Pro 5 16ARX8 R7 7745HX, GeForce RTX 4070 Laptop GPU, Samsung PM9A1 MZVL21T0HCLR, IPS, 2560x1600, 16" | Acer Nitro 16 AN16-41 R7 7735HS, GeForce RTX 4070 Laptop GPU, Samsung PM9A1 MZVL21T0HCLR, IPS, 2560x1600, 16" | HP Omen Transcend 16 i9-13900HX, GeForce RTX 4070 Laptop GPU, SK hynix PC801 HFS002TEJ9X101N, Mini-LED, 2560x1600, 16" | MSI Stealth 16 Studio A13VG i7-13700H, GeForce RTX 4070 Laptop GPU, Micron 3400 2TB MTFDKBA2T0TFH, IPS, 2560x1600, 16" | HP Victus 16-r0077ng i7-13700H, GeForce RTX 4070 Laptop GPU, Kioxia XG8 KXG80ZNV1T02, IPS, 1920x1080, 16.1" | Przeciętny NVIDIA GeForce RTX 4070 Laptop GPU | Średnia w klasie Gaming | |
|---|---|---|---|---|---|---|---|---|
| Power Consumption | -26% | -19% | -82% | -6% | 1% | -25% | -31% | |
| Idle Minimum * (Watt) | 11 | 8.1 26% | 11.6 -5% | 19.2 -75% | 11 -0% | 8 27% | 13.2 ? -20% | 13.2 ? -20% |
| Idle Average * (Watt) | 15.2 | 15.9 -5% | 15.6 -3% | 22.7 -49% | 18 -18% | 13 14% | 18.2 ? -20% | 18.9 ? -24% |
| Idle Maximum * (Watt) | 16 | 37.2 -133% | 16.5 -3% | 55.4 -246% | 19 -19% | 22 -38% | 24.6 ? -54% | 24.3 ? -52% |
| Load Average * (Watt) | 64 | 90.9 -42% | 155 -142% | 128.4 -101% | 91 -42% | 86 -34% | 97 ? -52% | 108.3 ? -69% |
| Witcher 3 ultra * (Watt) | 179 | 189.6 -6% | 154.8 14% | 206 -15% | 130 27% | 141.8 21% | ||
| Load Maximum * (Watt) | 280 | 263.5 6% | 205 27% | 292 -4% | 228 19% | 233 17% | 221 ? 21% | 254 ? 9% |
* ... im mniej tym lepiej
Power consumption Witcher 3 / stress test
Power consumption with external monitor
Czas trwania
Schenker zainstalował w laptopie baterię o pojemności 99 Wh. BateriaLenovo Legion Pro 5 16ma tylko model 80 Wh, ale niektórzy konkurenci, tacy jak MSI Stealth 16lub HP Omen Transcend 16mają baterie o takiej samej pojemności.
Mimo to brakuje nam trybu oszczędzania energii w Centrum sterowania - tryb zrównoważony jest najniższym dostępnym trybem. Nasz film zakodowany w H.264 był odtwarzany w ciągłej pętli przez ponad 8 godzin przy zmniejszonej jasności. Core osiągnął prawie 8,5 godziny w teście WLAN przy 150 nitach. Jedynie Acer Nitro 16 https://www.notebookcheck.com/Acer-Nitro-16-AN16-41-im-Test-Gaming-Notebook-mit-RTX-4070-bietet-gute-Laufzeiten.721488.0.html był w stanie dotrzymać mu kroku.
| Schenker XMG CORE 16 (L23) R7 7840HS, GeForce RTX 4070 Laptop GPU, 99 Wh | Lenovo Legion Pro 5 16ARX8 R7 7745HX, GeForce RTX 4070 Laptop GPU, 80 Wh | Acer Nitro 16 AN16-41 R7 7735HS, GeForce RTX 4070 Laptop GPU, 90 Wh | HP Omen Transcend 16 i9-13900HX, GeForce RTX 4070 Laptop GPU, 97 Wh | MSI Stealth 16 Studio A13VG i7-13700H, GeForce RTX 4070 Laptop GPU, 99.9 Wh | HP Victus 16-r0077ng i7-13700H, GeForce RTX 4070 Laptop GPU, 83 Wh | Średnia w klasie Gaming | |
|---|---|---|---|---|---|---|---|
| Czasy pracy | -55% | -6% | -50% | -11% | -15% | -25% | |
| H.264 (h) | 10.2 | 10.2 0% | 7.7 -25% | 8.26 ? -19% | |||
| WiFi v1.3 (h) | 8.4 | 4 -52% | 9 7% | 4.2 -50% | 7.8 -7% | 7.1 -15% | 7.04 ? -16% |
| Load (h) | 2.4 | 1 -58% | 1.8 -25% | 1.2 -50% | 2.4 0% | 1.47 ? -39% | |
| Reader / Idle (h) | 6.5 | 12.2 | 6.3 | 11 | 8.71 ? |
Za
Przeciw
Werdykt - Świetny laptop do gier bez większych słabości

ceny 16-calowych laptopów z RTX 4070 zaczynają się od około 1600 USD. Nie czyni to Core 16 całkowicie niedrogim (patrz poniżej). Z drugiej strony zapewnia dobrą wydajność 3D, jeden z najszybszych dysków SSD na rynku, opcjonalną klawiaturę mechaniczną, dobry panel sRGB 1600p z niskimi wartościami DeltaE i wiele więcej. Jest to wszechstronny laptop do gier, którego wydajność jest w sam raz. Aby uzyskać jeszcze lepsze poziomy wydajności, musiałby to być procesor HX, ponieważ RTX 4070 radzi sobie świetnie.
Trzeba bliżej przyjrzeć się urządzeniu, aby znaleźć jakiekolwiek punkty godne krytyki. Jego 230-watowy zasilacz może być przeciążony w ekstremalnych scenariuszach - przynajmniej przekroczył swoje specyfikacje przez kilka minut podczas naszego testu warunków skrajnych. Podczas grania nie stanowiło to żadnego problemu. Tryb zbalansowany nie został dopracowany do końca, przez co działał dopiero po minucie grania, a wydajność spadała do poziomu baterii.
XMG Core 16 okazał się dobrym laptopem do gier we wszystkich naszych testach, z potężnym RTX 4070 i bardzo dobrze skalibrowanym wyświetlaczem sRGB.
Największym konkurentem Core 16 jestLenovo Legion Pro 5 16ARX8który wypadł podobnie dobrze w wielu obszarach, ale kosztuje mniej. Z drugiej strony, nie ma tak dobrych czasów pracy.
Cena i dostępność
Laptopy Schenker mogą Państwo kupić na stronie bestware.com. Naszą konfigurację można nabyć za około 2 360 USD.
Schenker XMG CORE 16 (L23)
- 05/10/2023 v7 (old)
Christian Hintze
Przezroczystość
Wyboru urządzeń do recenzji dokonuje nasza redakcja. Próbka testowa została udostępniona autorowi jako pożyczka od producenta lub sprzedawcy detalicznego na potrzeby tej recenzji. Pożyczkodawca nie miał wpływu na tę recenzję, producent nie otrzymał też kopii tej recenzji przed publikacją. Nie było obowiązku publikowania tej recenzji. Jako niezależna firma medialna, Notebookcheck nie podlega władzy producentów, sprzedawców detalicznych ani wydawców.
Tak testuje Notebookcheck
Każdego roku Notebookcheck niezależnie sprawdza setki laptopów i smartfonów, stosując standardowe procedury, aby zapewnić porównywalność wszystkich wyników. Od około 20 lat stale rozwijamy nasze metody badawcze, ustanawiając przy tym standardy branżowe. W naszych laboratoriach testowych doświadczeni technicy i redaktorzy korzystają z wysokiej jakości sprzętu pomiarowego. Testy te obejmują wieloetapowy proces walidacji. Nasz kompleksowy system ocen opiera się na setkach uzasadnionych pomiarów i benchmarków, co pozwala zachować obiektywizm.Price comparison

