Recenzja laptopa Lenovo Legion Slim 7i 16 Gen 8: Smuklejszy niż Razer Blade 16

Lenovo Legion Slim 7i Gen 8 zastępuje zeszłoroczny model Legion Slim 7i Gen 7 z nowszymi procesorami Raptor Lake-H 13. generacji, procesorami graficznymi Nvidia Ada Lovelace i zmienioną konstrukcją obudowy. Uzupełnia on grubszą i bardziej wydajną serię Legion Serię Pro 7.
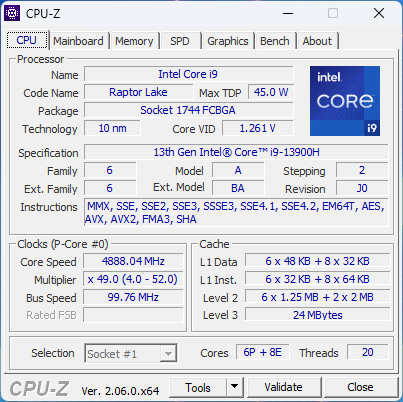
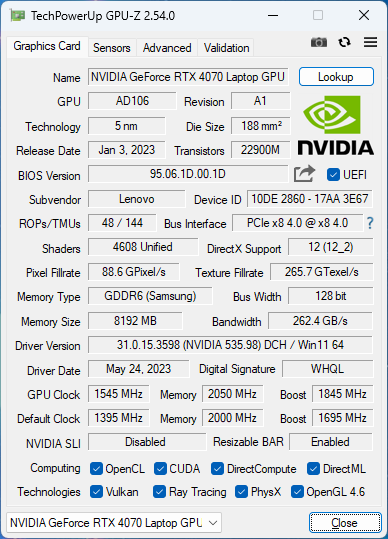
Nasza jednostka testowa to konfiguracja z wyższej półki z procesorem Core i9-13900H, 140 W GeForce RTX 4070 GPU i wyświetlaczem IPS 2560 x 1600 240 Hz w cenie detalicznej około 1600 USD. Inne jednostki SKU są dostępne z mniejszym Core i7-13700H, RTX 4060 lub wyświetlaczem o wyższej rozdzielczości 3200 x 2000 165 Hz, zaczynając od około 1500 USD.
Konkurenci dla Legion Slim 7i G8 obejmują inne cienkie i lekkie 16-calowe laptopy do gier, takie jak Razer Blade 16, HP Omen 16, Asus ROG Zephyrus M16lub Alienware x16 R1.
Więcej recenzji Lenovo:
Potencjalni konkurenci w porównaniu
Ocena | Data | Model | Waga | Wysokość | Rozmiar | Rezolucja | Cena |
|---|---|---|---|---|---|---|---|
| 90 % v7 (old) | 07/2023 | Lenovo Legion Slim 7i 16 Gen 8 i9-13900H, GeForce RTX 4070 Laptop GPU | 2.1 kg | 19.9 mm | 16.00" | 2560x1600 | |
| 87.4 % v7 (old) | 07/2023 | HP Omen 16-wf000 i7-13700HX, GeForce RTX 4080 Laptop GPU | 2.4 kg | 23.6 mm | 16.10" | 2560x1440 | |
| 88.4 % v7 (old) | 06/2023 | Alienware x16 R1 i9-13900HK, GeForce RTX 4080 Laptop GPU | 2.6 kg | 18.57 mm | 16.00" | 2560x1600 | |
| 88.8 % v7 (old) | 06/2023 | Lenovo Legion Pro 7 RTX4090 i9-13900HX, GeForce RTX 4090 Laptop GPU | 2.7 kg | 26 mm | 16.00" | 2560x1600 | |
| 88.4 % v7 (old) | 03/2023 | Asus ROG Strix G16 G614JZ i9-13980HX, GeForce RTX 4080 Laptop GPU | 2.4 kg | 30.4 mm | 16.00" | 2560x1600 | |
| 91.2 % v7 (old) | 02/2023 | Razer Blade 16 Early 2023 i9-13950HX, GeForce RTX 4080 Laptop GPU | 2.4 kg | 21.99 mm | 16.00" | 2560x1600 |
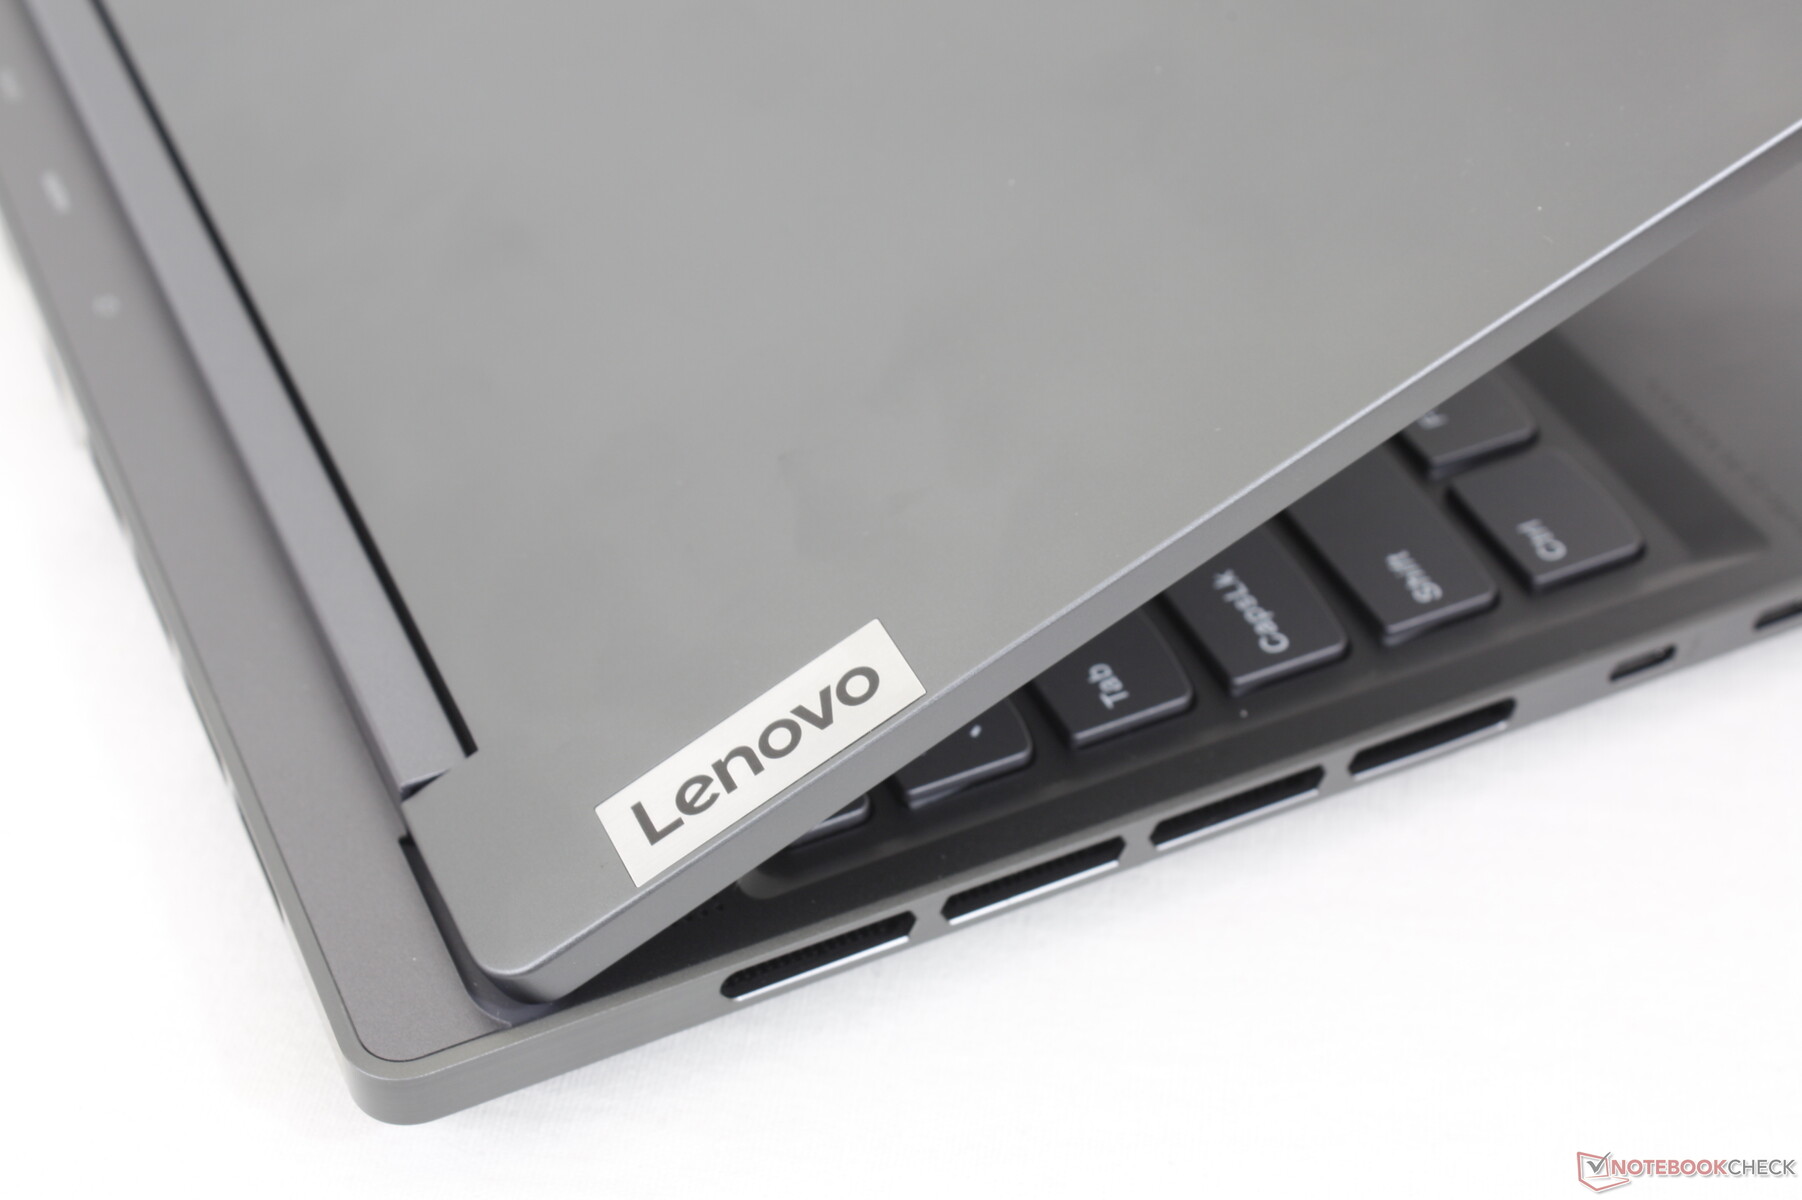
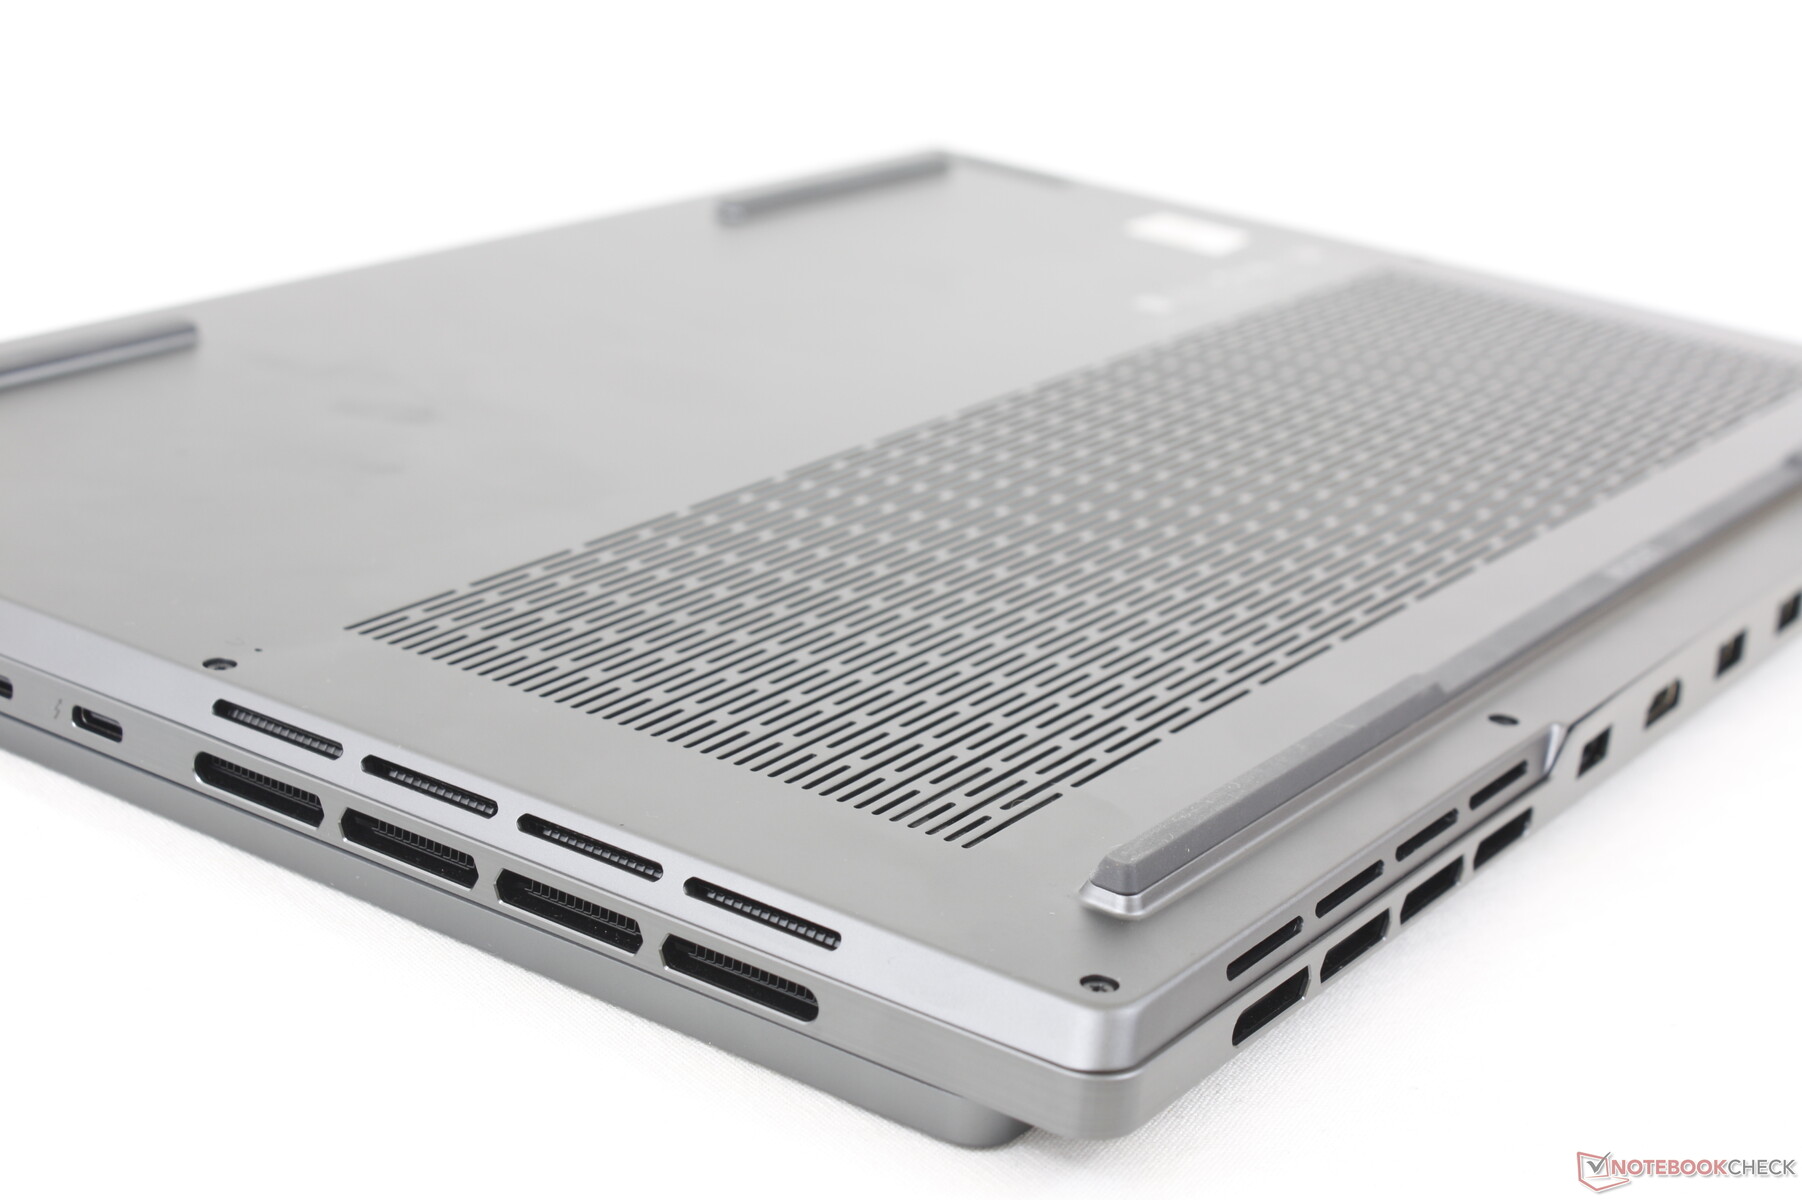
Obudowa - teraz z większą liczbą kratek wentylacyjnych
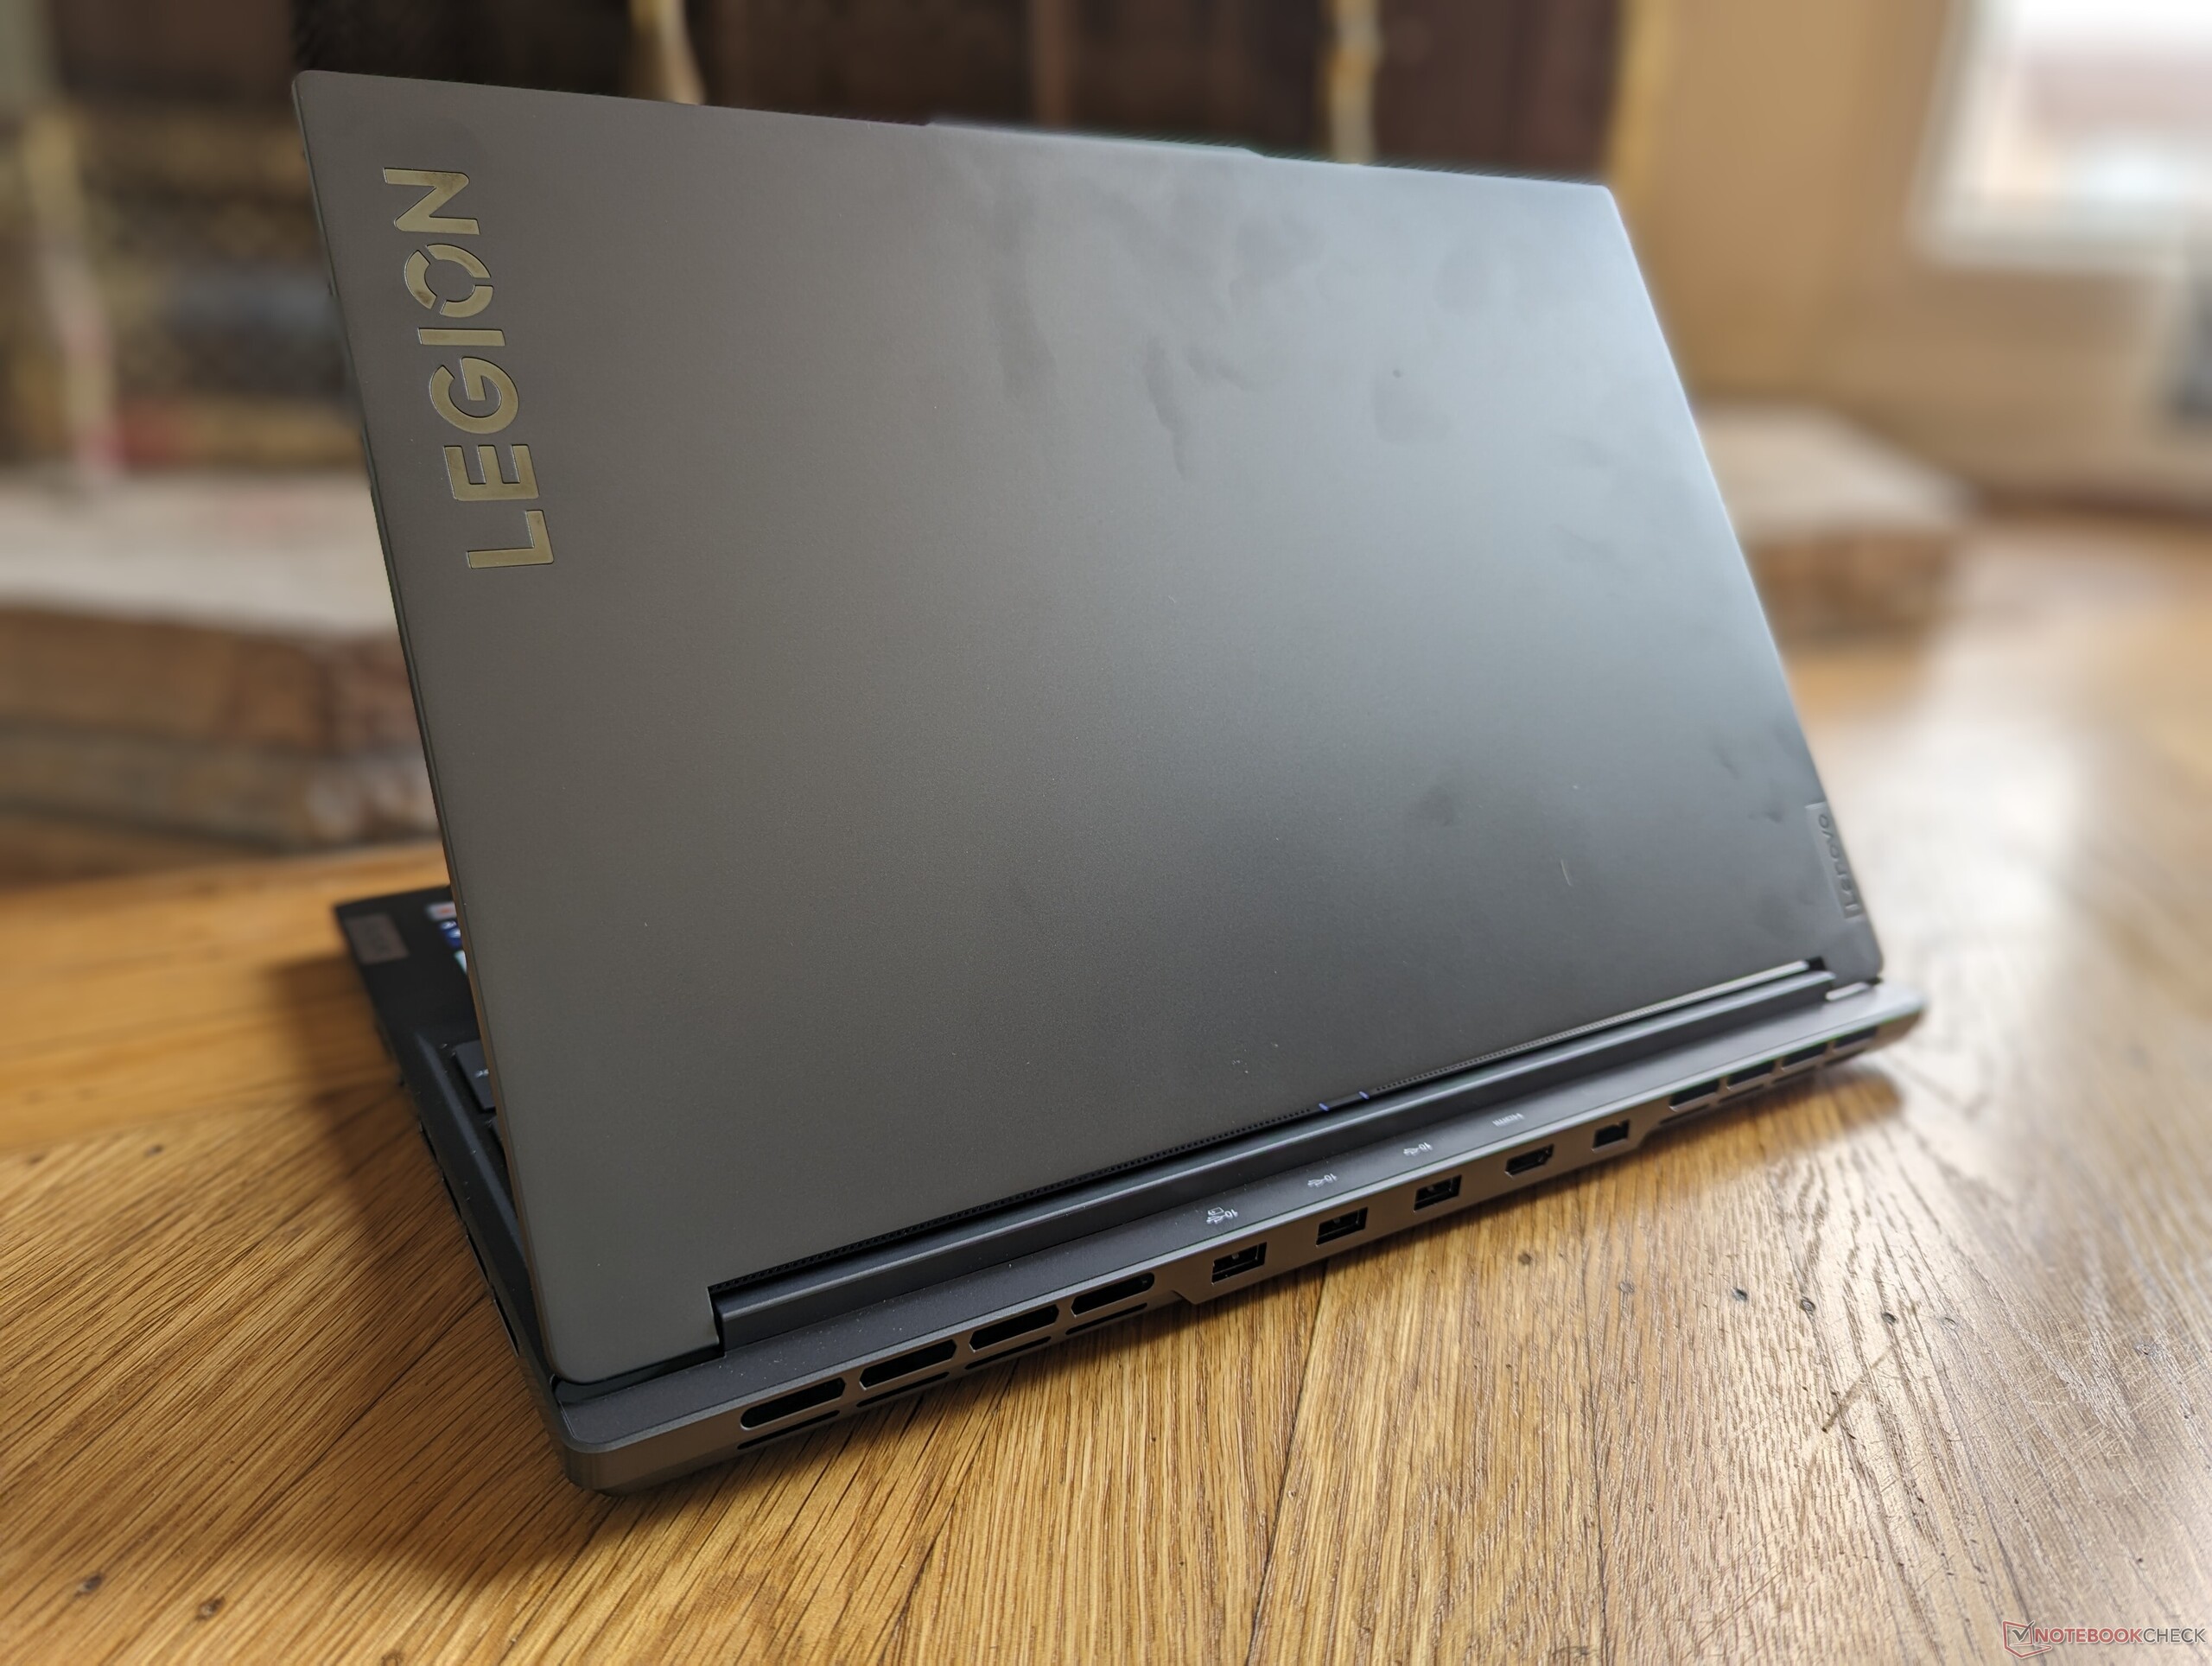
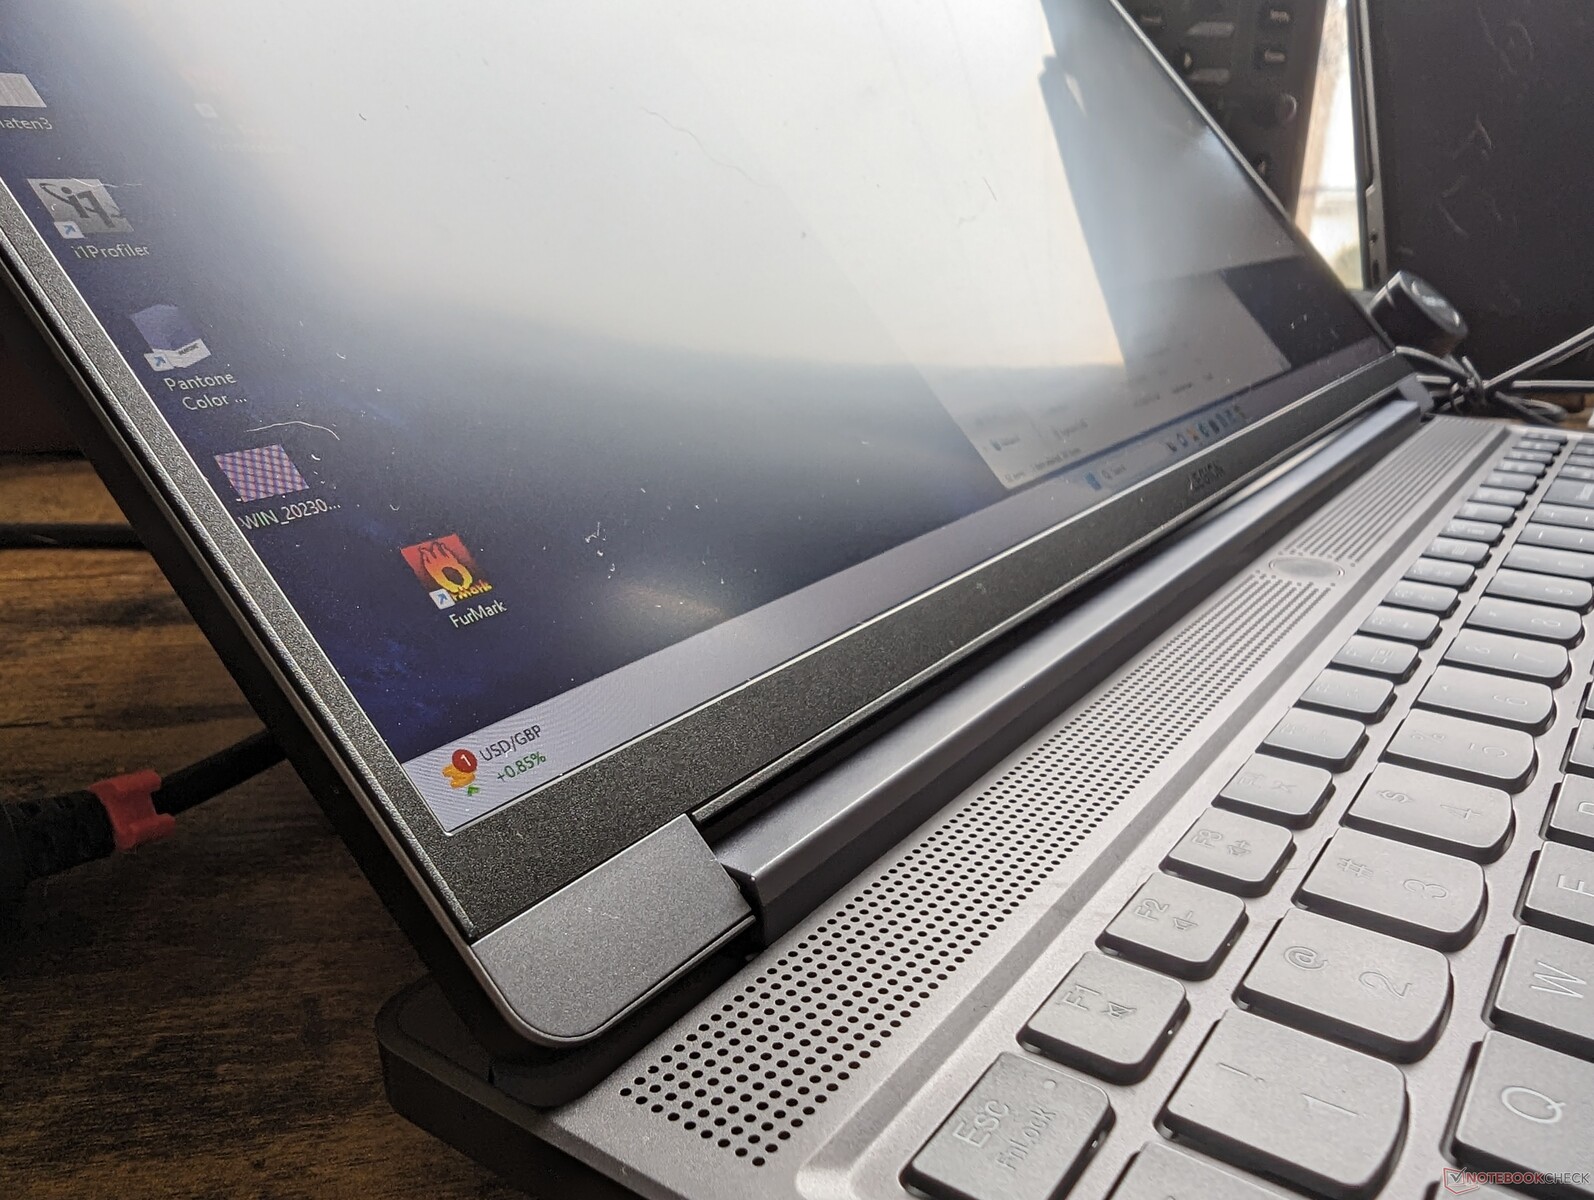
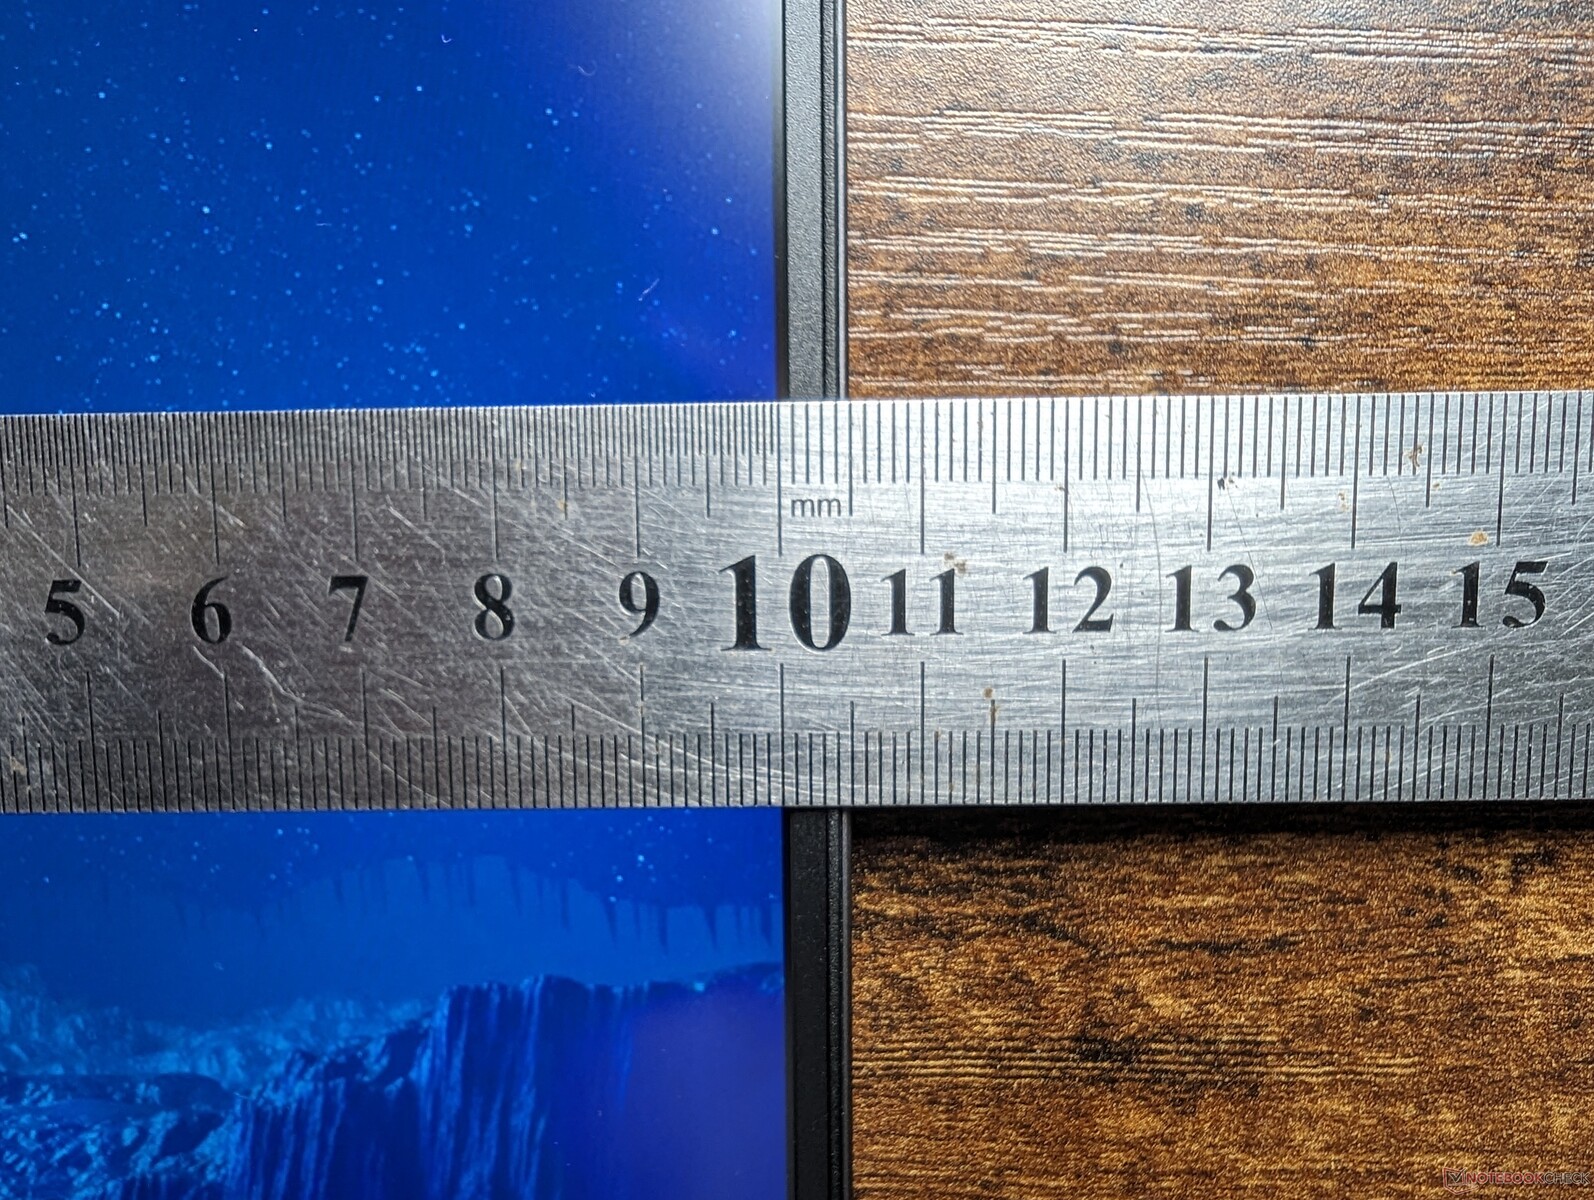
Obudowa może wydawać się podobna do zeszłorocznej Legion Slim 7i 16 G7 z przodu, ale większość zmian zewnętrznych znajduje się z tyłu i na dole. Na przykład tylna krawędź jest teraz płaska, co zapewnia bardziej przejrzysty wygląd, podczas gdy kratki wentylacyjne są tym razem zauważalnie większe, co poprawia chłodzenie.
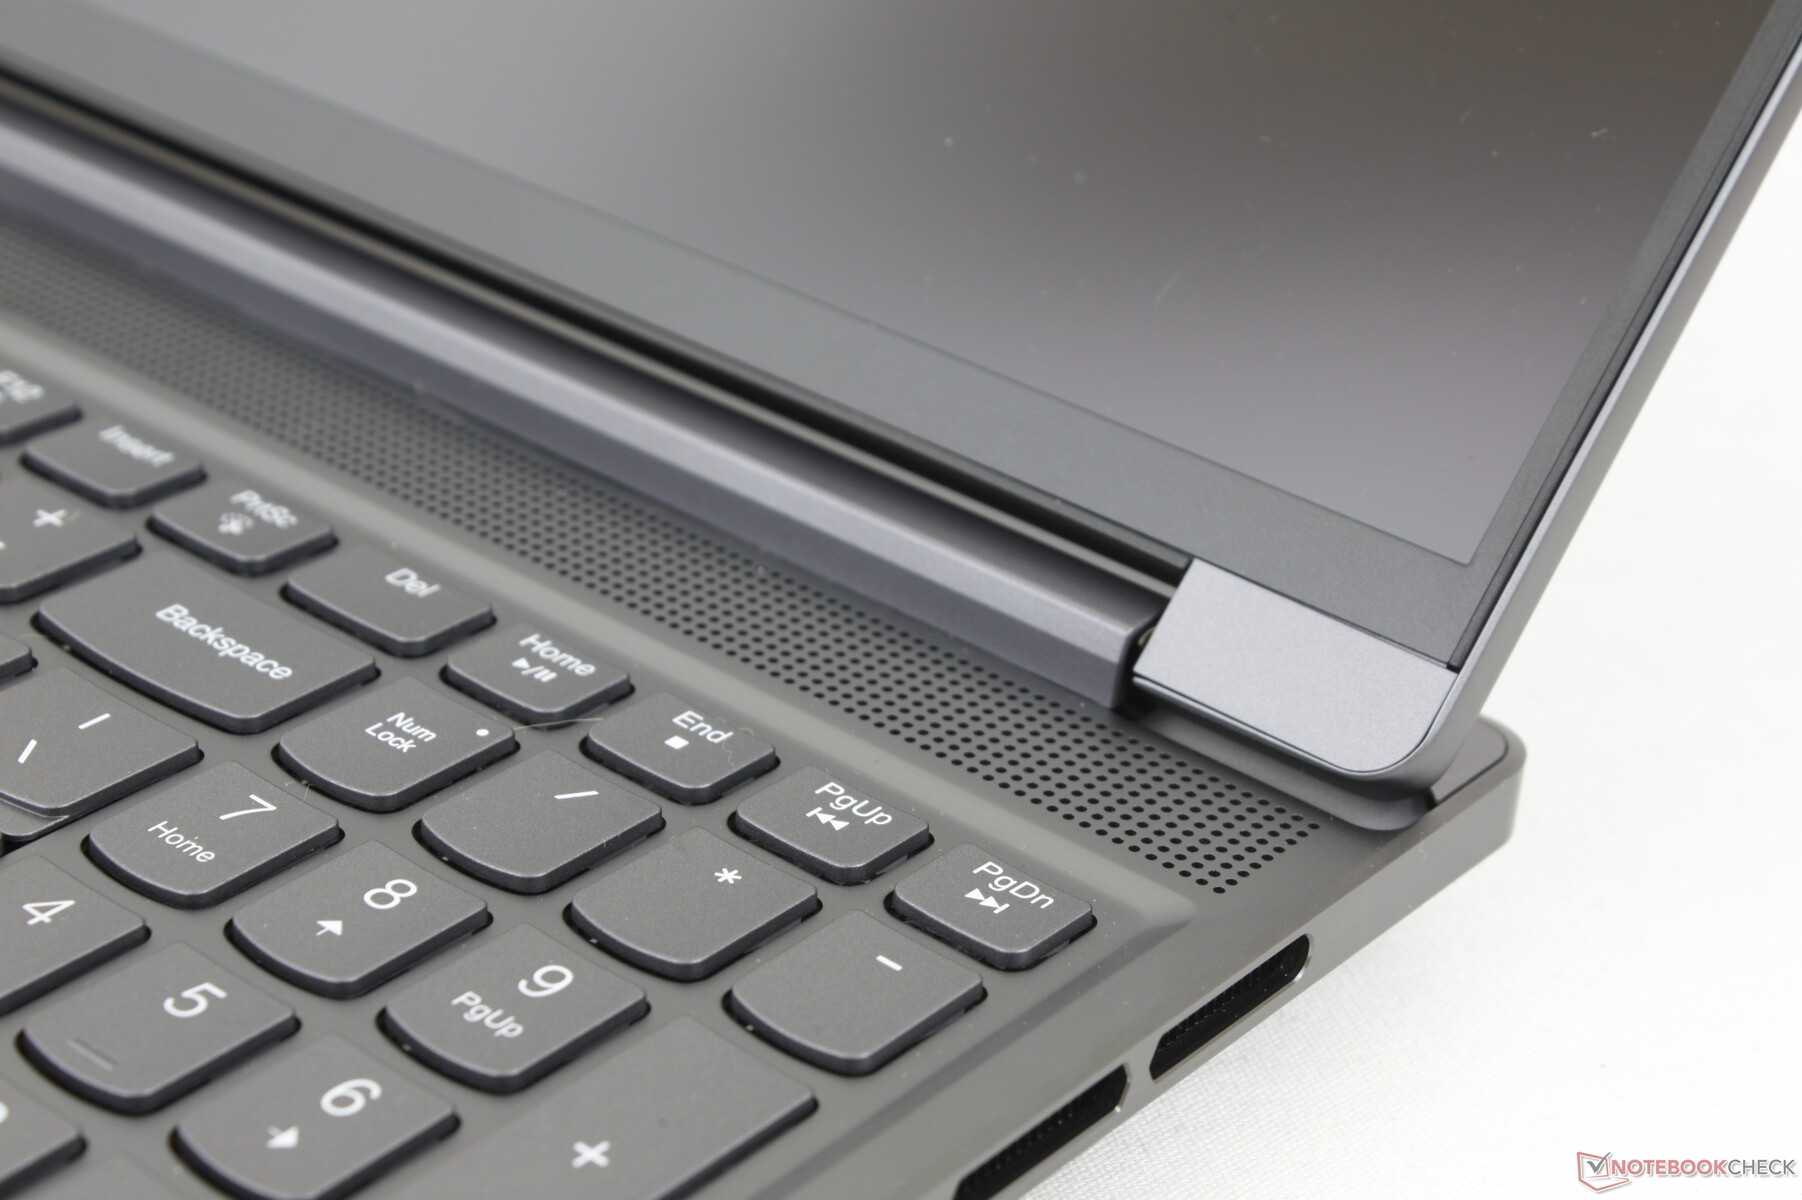
Materiały obudowy mają takie samo szare aluminiowe wykończenie i są takie same jak w innych modelach Legion 7. Podstawa pozostaje sztywna pomimo cienkiego profilu, a pokrywa jest również stosunkowo solidna. Małe zawiasy nie są tak solidne, jak większe w modelu Asus ROG Strix G16ale pozwalają na pełne otwarcie o 180 stopni, co jest rzadkością w laptopach do gier.
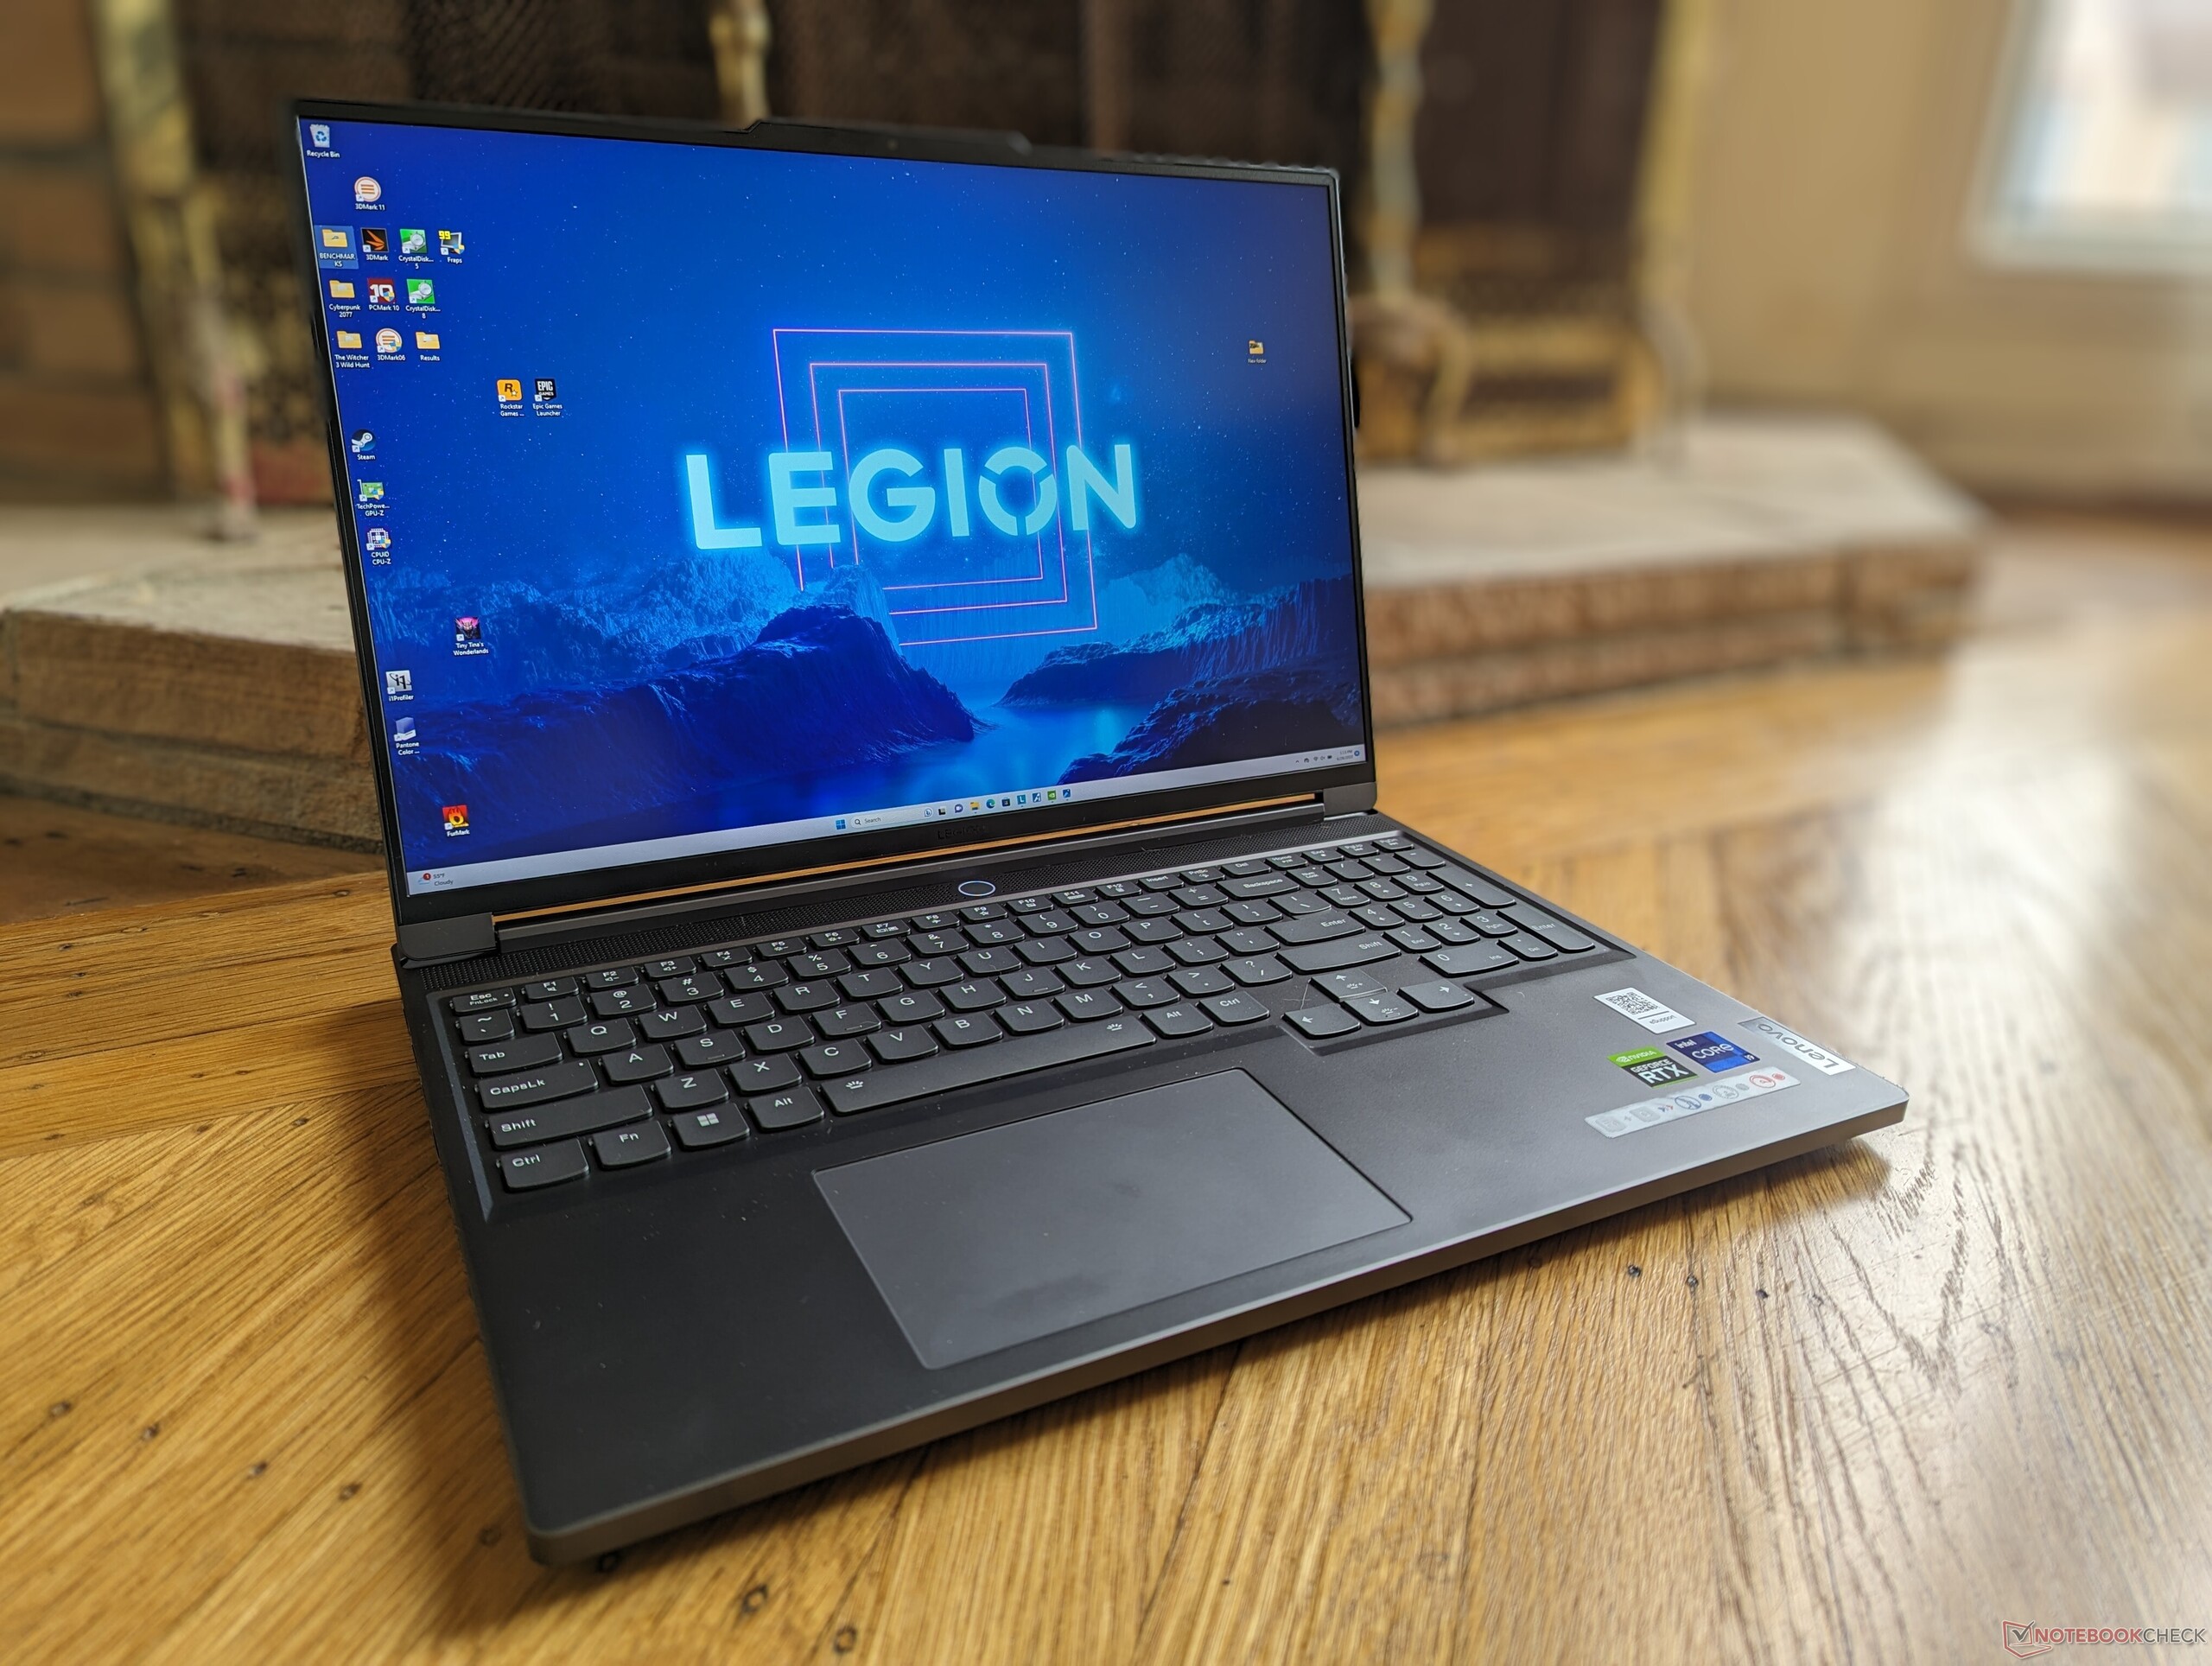
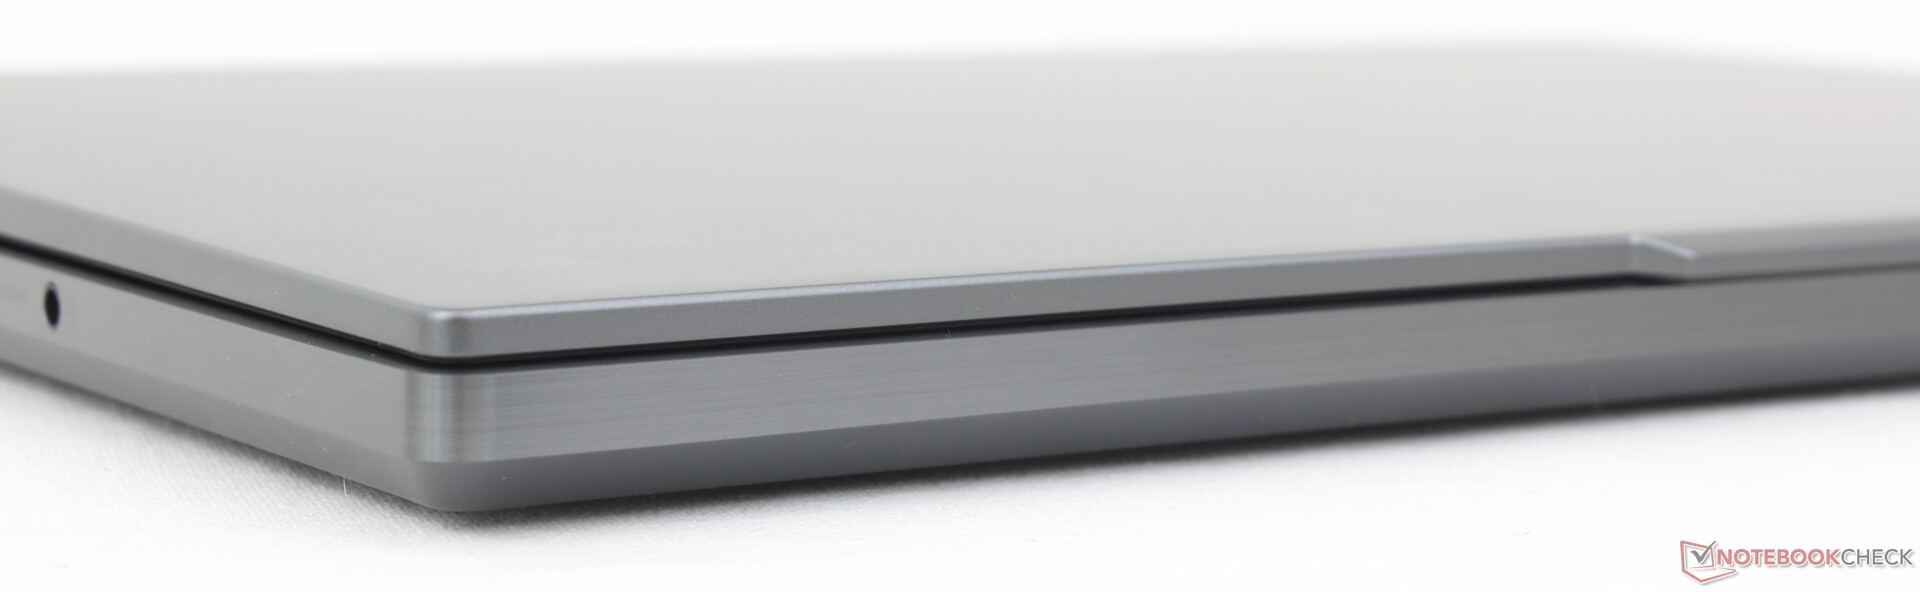
Lenovo nie bez powodu nazywa go Legion Slim 7. W porównaniu do Legion Pro 7, nasza wersja Slim jest znacznie lżejsza o 600 g i zauważalnie cieńsza o ponad 6 mm. W rzeczywistości Legion Slim 7 jest jednym z najcieńszych i najlżejszych 16-calowych laptopów do gier dostępnych na rynku, ustępując jedynie nieco cieńszym i lżejszym MSI GS66.
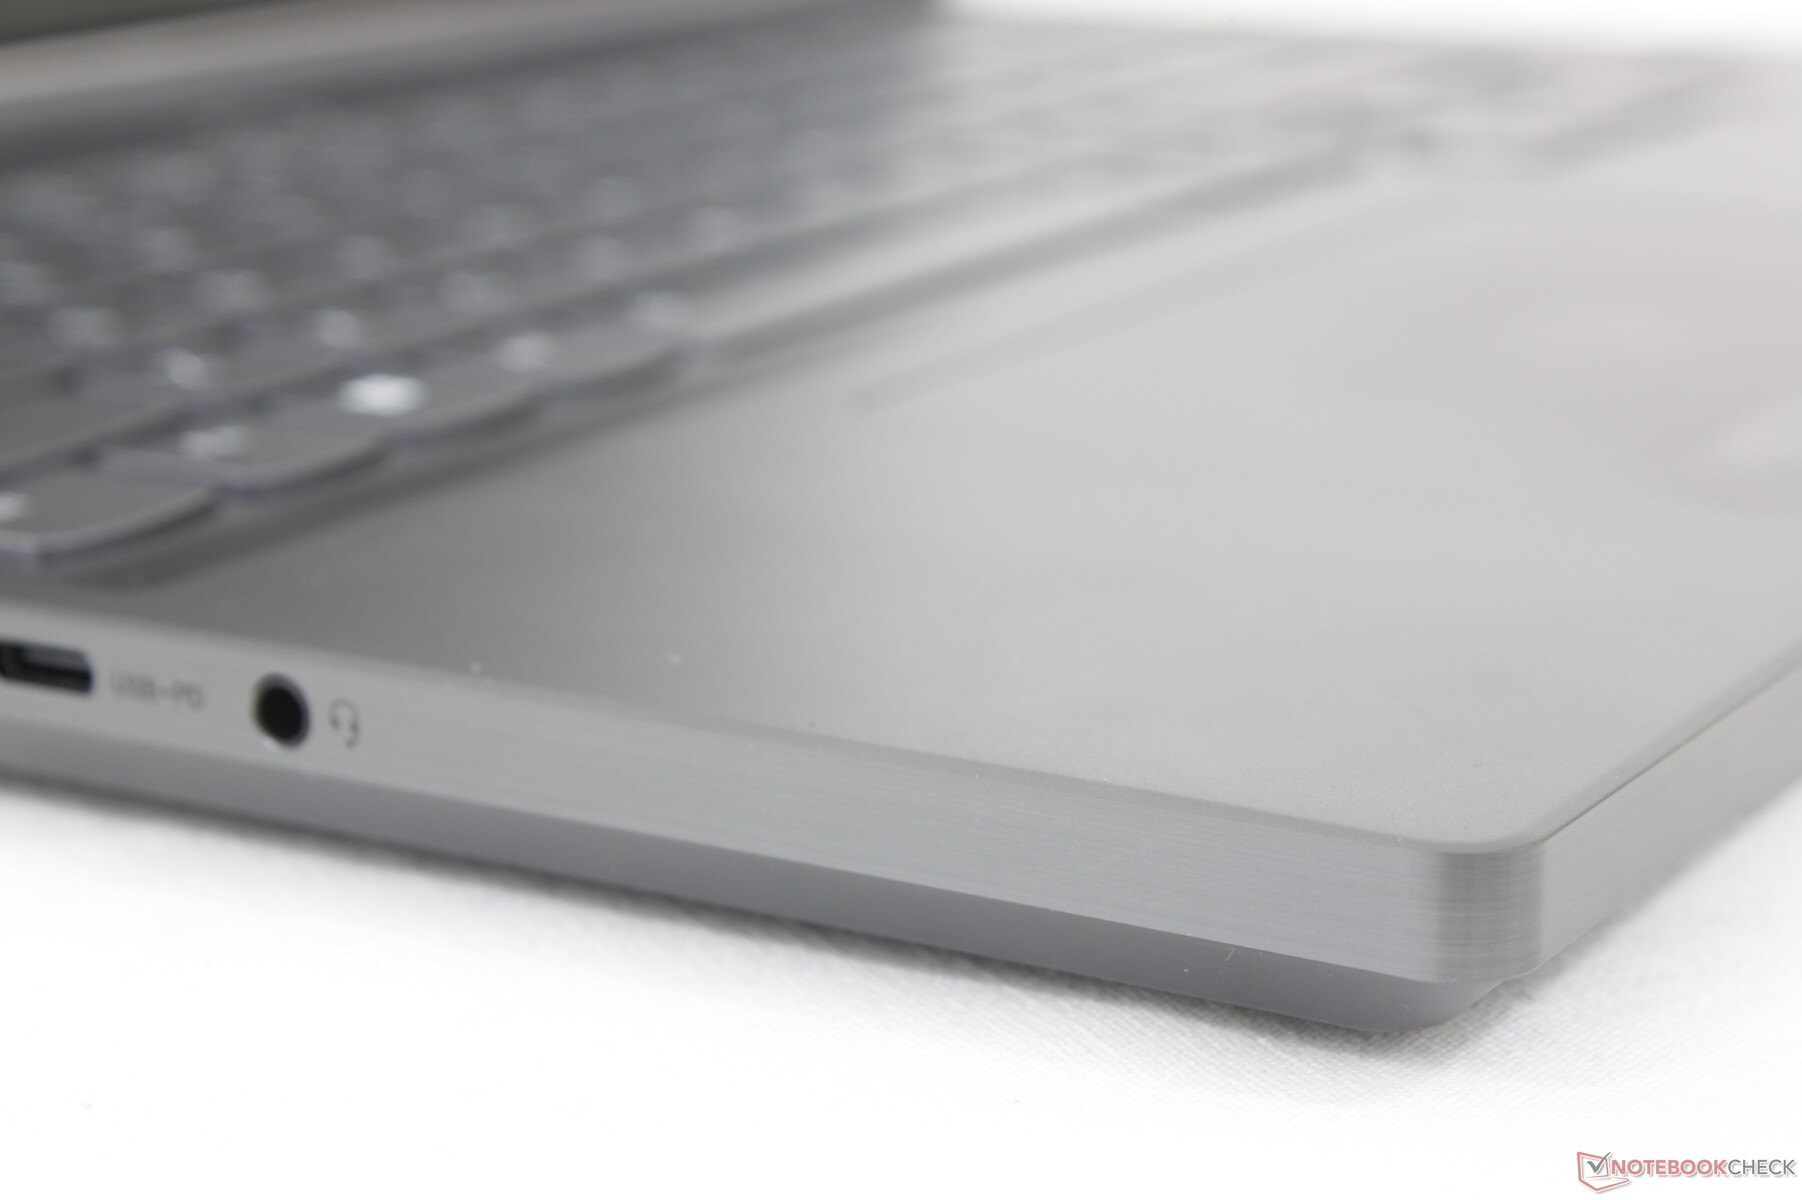
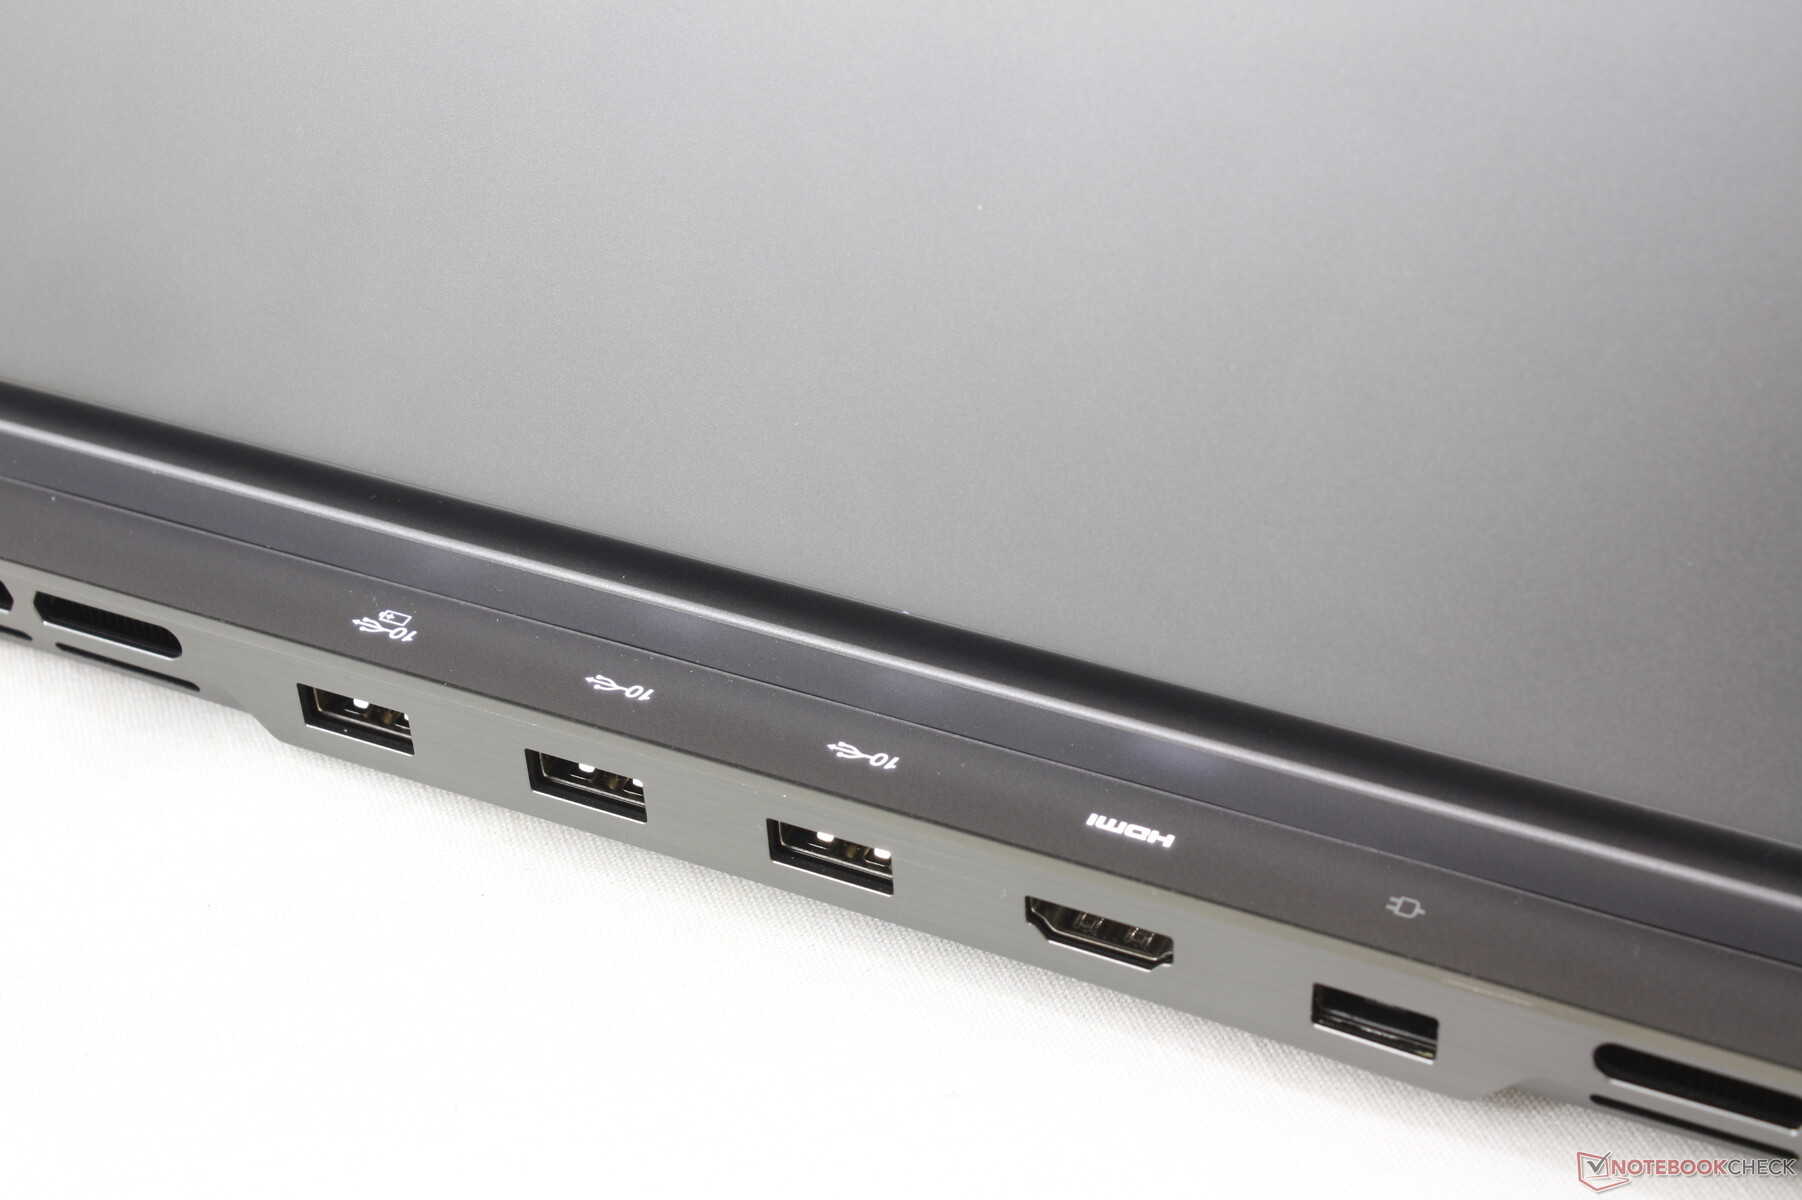
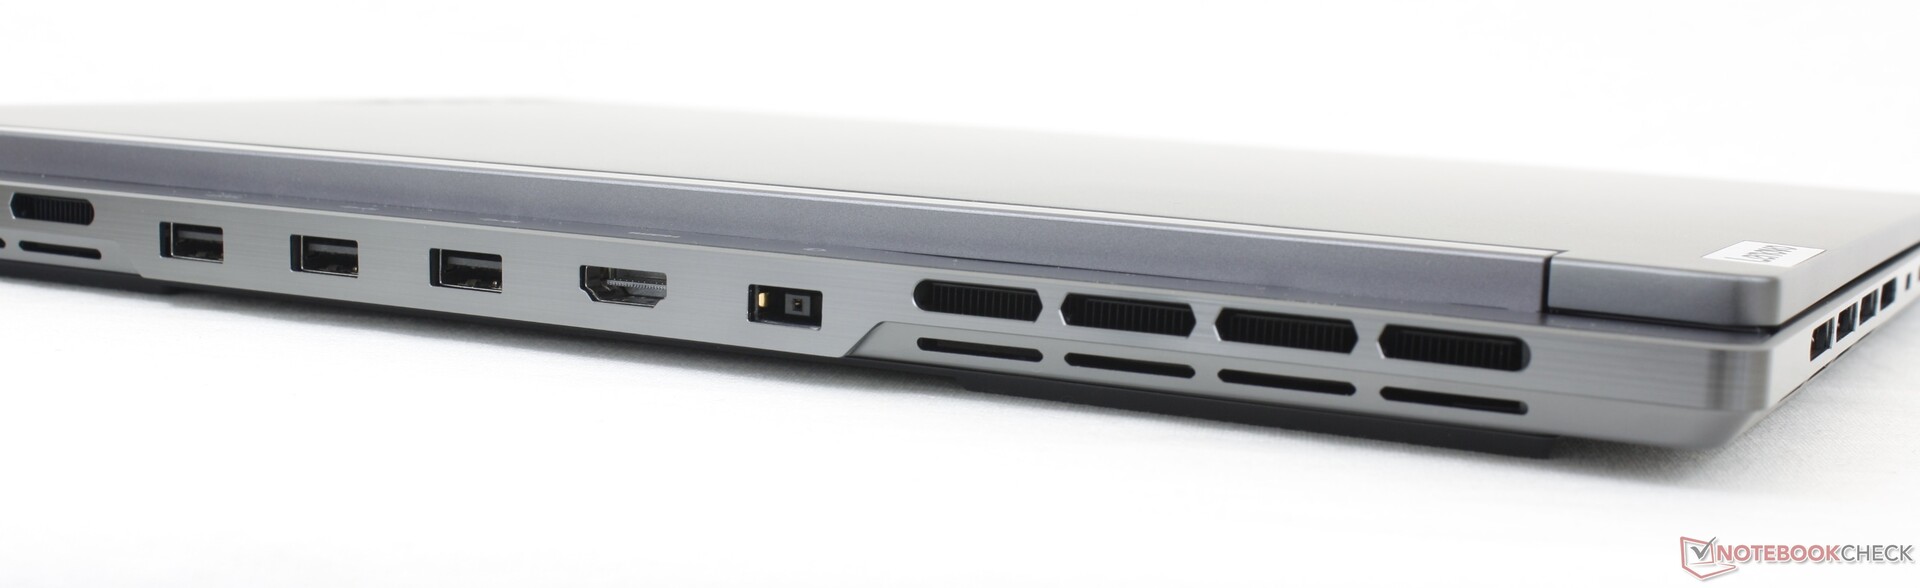
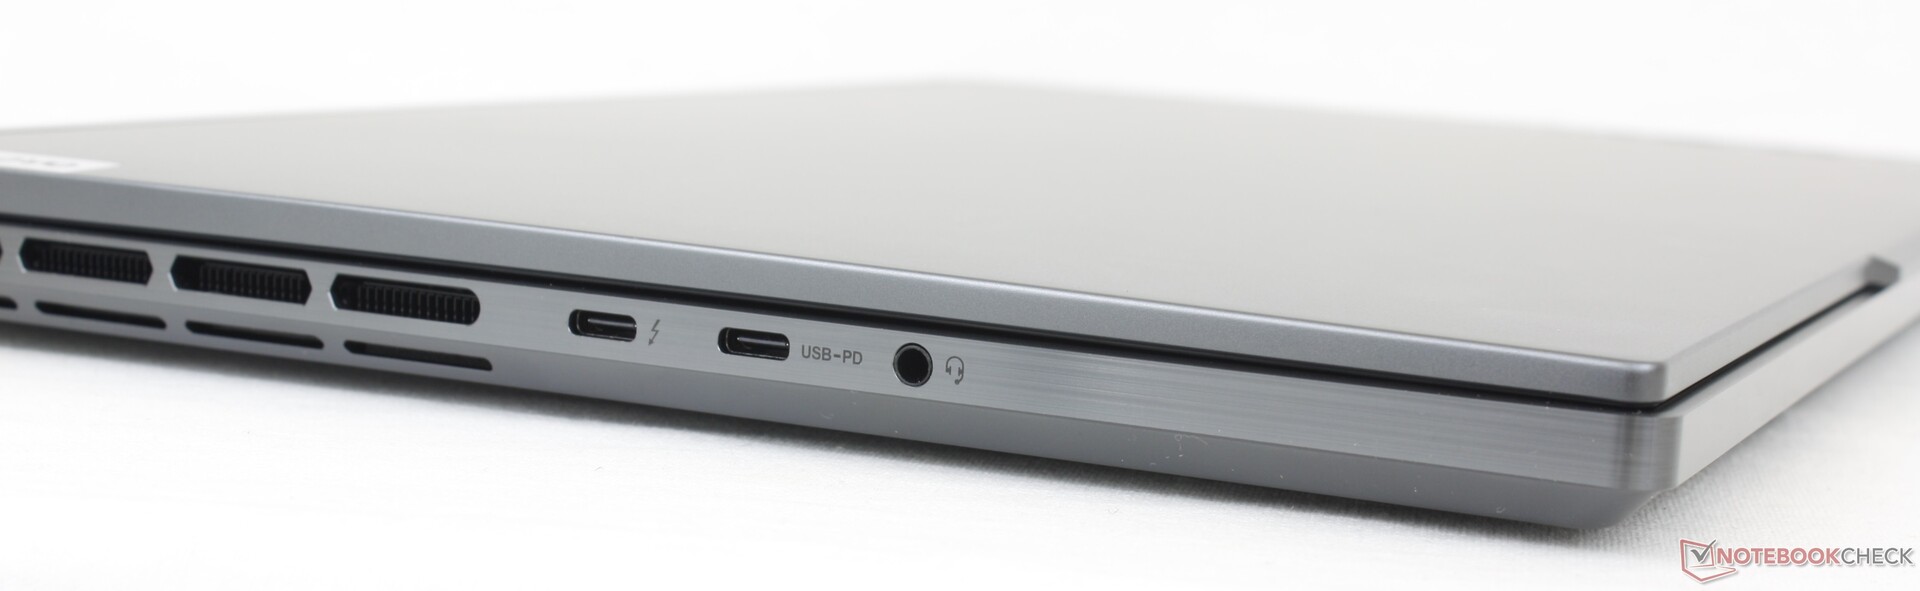
Łączność - obsługa Thunderbolt 4
Opcje portów są zróżnicowane, a większość z nich znajduje się wzdłuż tylnej krawędzi, podobnie jak w serii Alienware. Jednak w przeciwieństwie do Alienware, dwa porty USB-C w naszym Lenovo znajdują się wzdłuż lewej krawędzi, co zapewnia łatwiejszy dostęp.
Należy pamiętać, że tylko jeden z dwóch portów USB-C obsługuje Thunderbolt 4. Jeśli niektóre akcesoria nie działają na jednym porcie, należy wypróbować drugi. Na przykład nasz zewnętrzny monitor Lepow działałby na porcie USB-C 3.2, ale nie na porcie USB-C Thunderbolt.
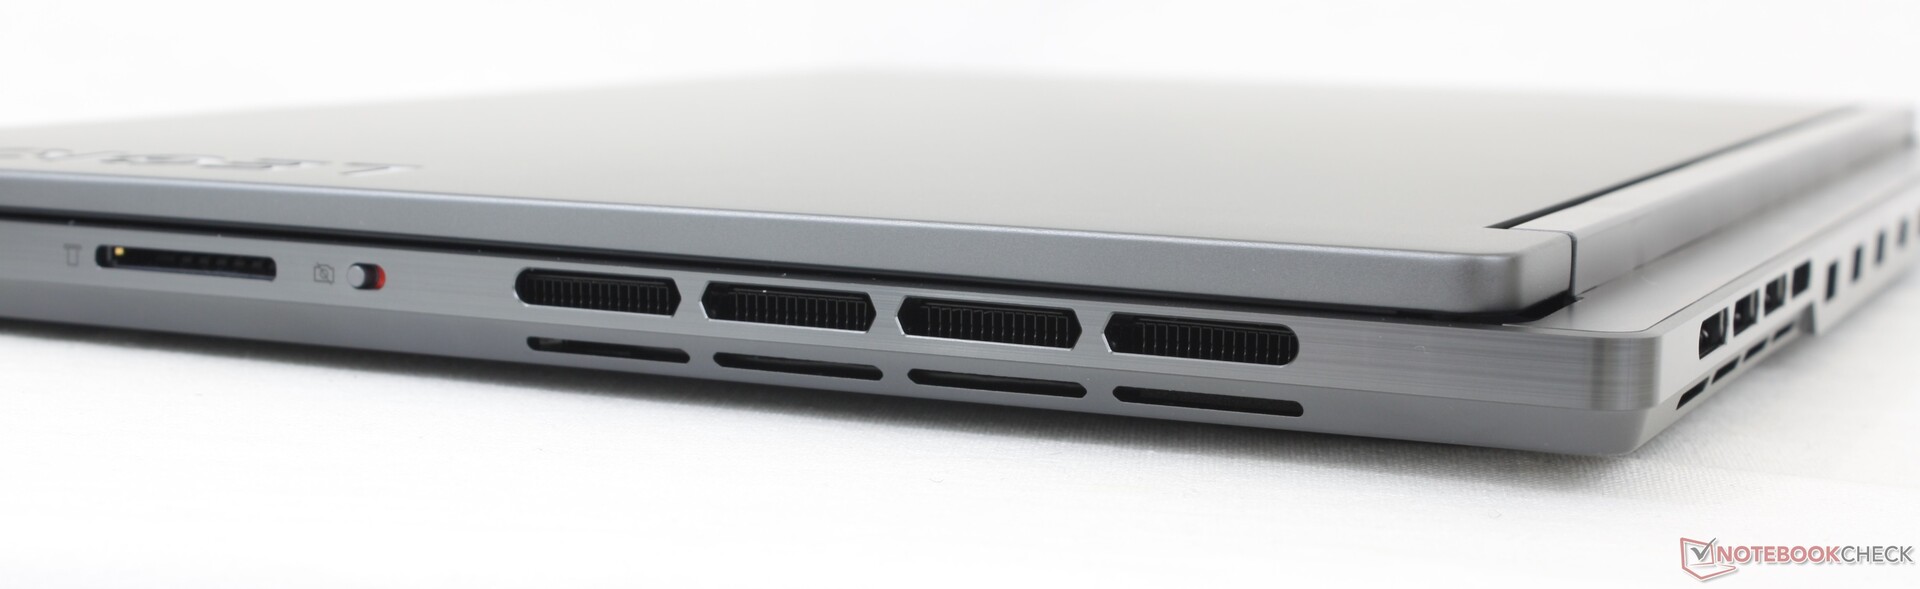
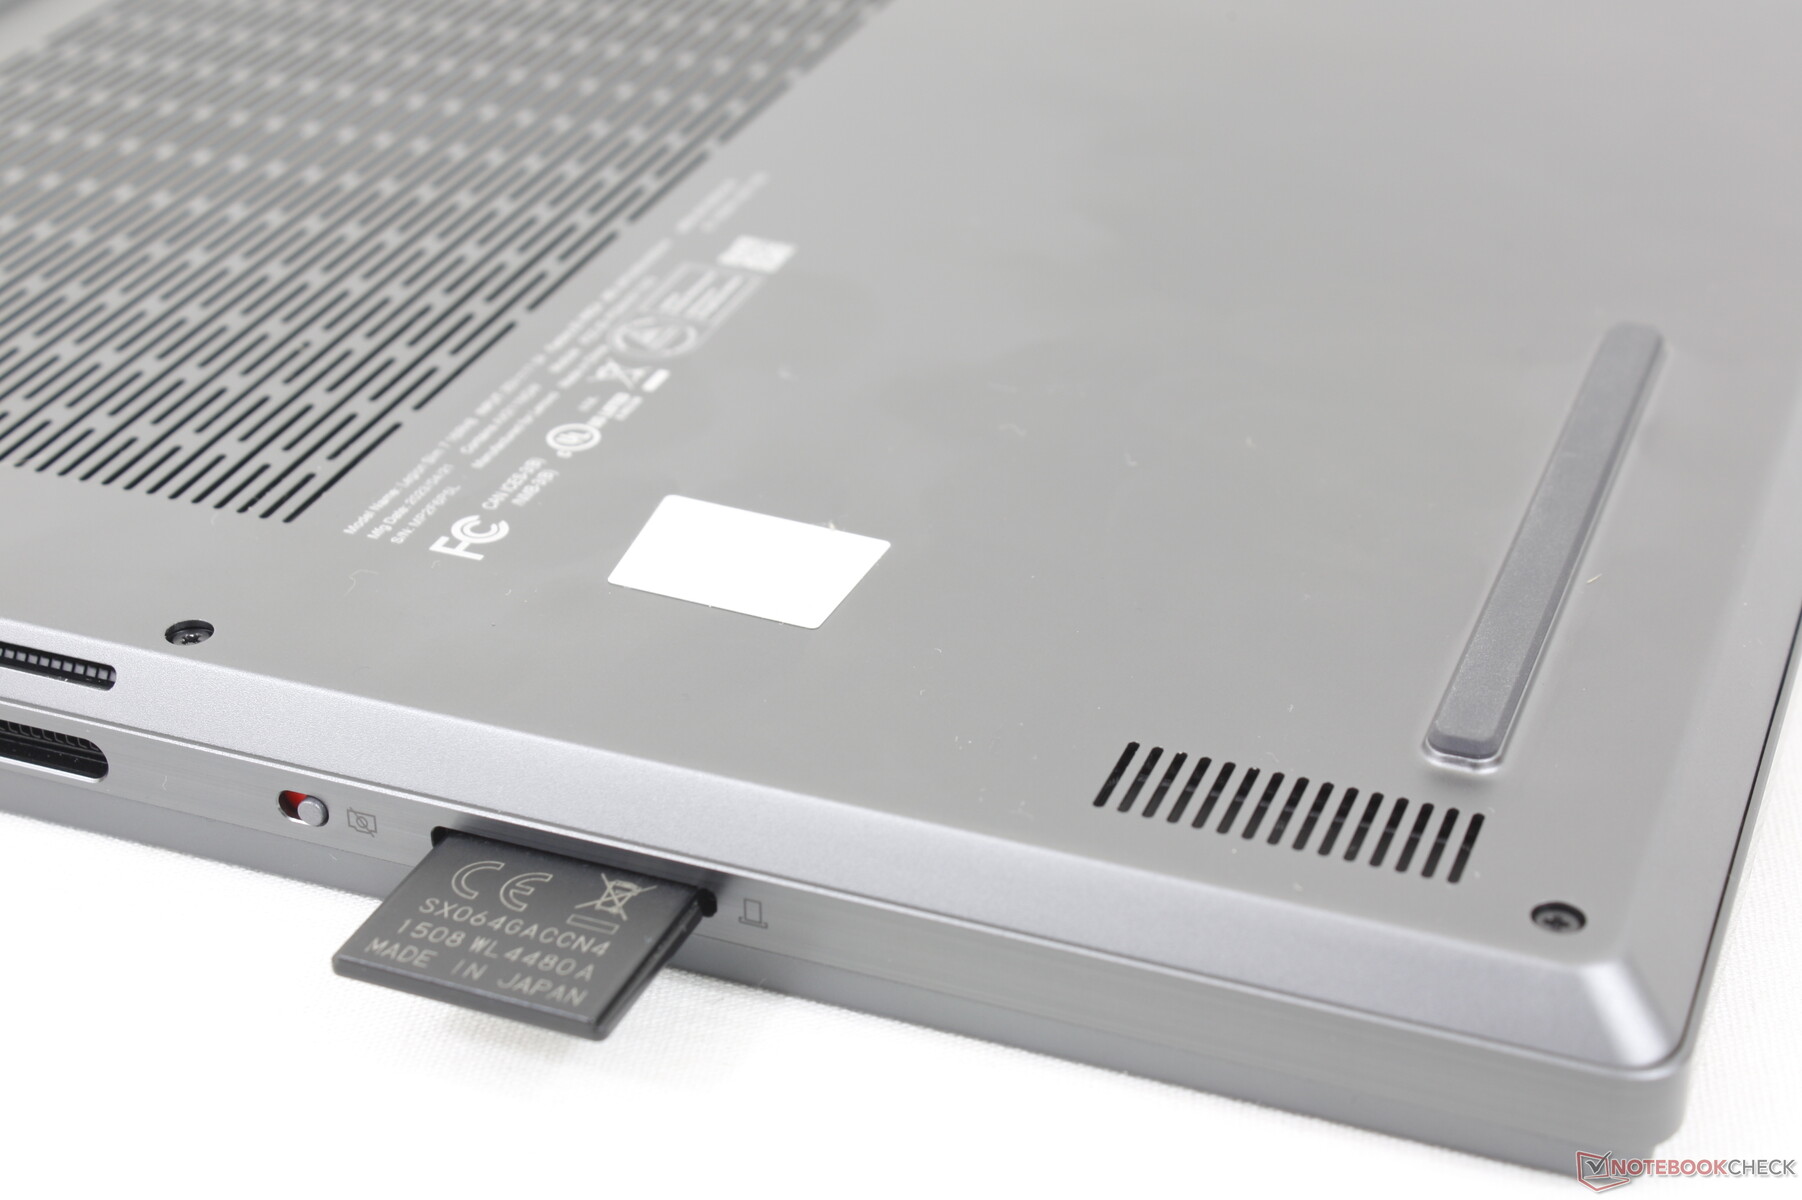
Czytnik kart SD
Szybkość transferu przez czytnik kart SD wynosi średnio około 80 MB/s z naszą kartą testową UHS-II, co stanowi około połowę szybkości czytnika kart w Blade 16 Blade 16.
| SD Card Reader | |
| average JPG Copy Test (av. of 3 runs) | |
| Razer Blade 16 Early 2023 (AV PRO microSD 128 GB V60) | |
| Lenovo Legion Slim 7i 16 Gen 8 (Toshiba Exceria Pro SDXC 64 GB UHS-II) | |
| Alienware x16 R1 (AV PRO microSD 128 GB V60) | |
| maximum AS SSD Seq Read Test (1GB) | |
| Alienware x16 R1 (AV PRO microSD 128 GB V60) | |
| Razer Blade 16 Early 2023 (AV PRO microSD 128 GB V60) | |
| Lenovo Legion Slim 7i 16 Gen 8 (Toshiba Exceria Pro SDXC 64 GB UHS-II) | |
Komunikacja
Intel AX211 jest standardowo wyposażony w łączność Wi-Fi 6E i Bluetooth 5.3. Wydajność jest stabilna i niezawodna po sparowaniu z naszą siecią Asus AXE11000 6 GHz.
| Networking | |
| iperf3 transmit AXE11000 | |
| Lenovo Legion Pro 7 RTX4090 | |
| Asus ROG Strix G16 G614JZ | |
| Razer Blade 16 Early 2023 | |
| Lenovo Legion Slim 7i 16 Gen 8 | |
| HP Omen 16-wf000 | |
| Alienware x16 R1 | |
| iperf3 receive AXE11000 | |
| Lenovo Legion Pro 7 RTX4090 | |
| Asus ROG Strix G16 G614JZ | |
| Razer Blade 16 Early 2023 | |
| Alienware x16 R1 | |
| HP Omen 16-wf000 | |
| Lenovo Legion Slim 7i 16 Gen 8 | |
| iperf3 transmit AXE11000 6GHz | |
| Lenovo Legion Slim 7i 16 Gen 8 | |
| Razer Blade 16 Early 2023 | |
| HP Omen 16-wf000 | |
| Alienware x16 R1 | |
| iperf3 receive AXE11000 6GHz | |
| Lenovo Legion Slim 7i 16 Gen 8 | |
| Razer Blade 16 Early 2023 | |
| HP Omen 16-wf000 | |
| Alienware x16 R1 | |
Kamera internetowa
Kamera internetowa 2 MP pozostaje taka sama jak w zeszłorocznym modelu. Nie ma obsługi podczerwieni, ale wyłącznik kamery internetowej jest standardem.


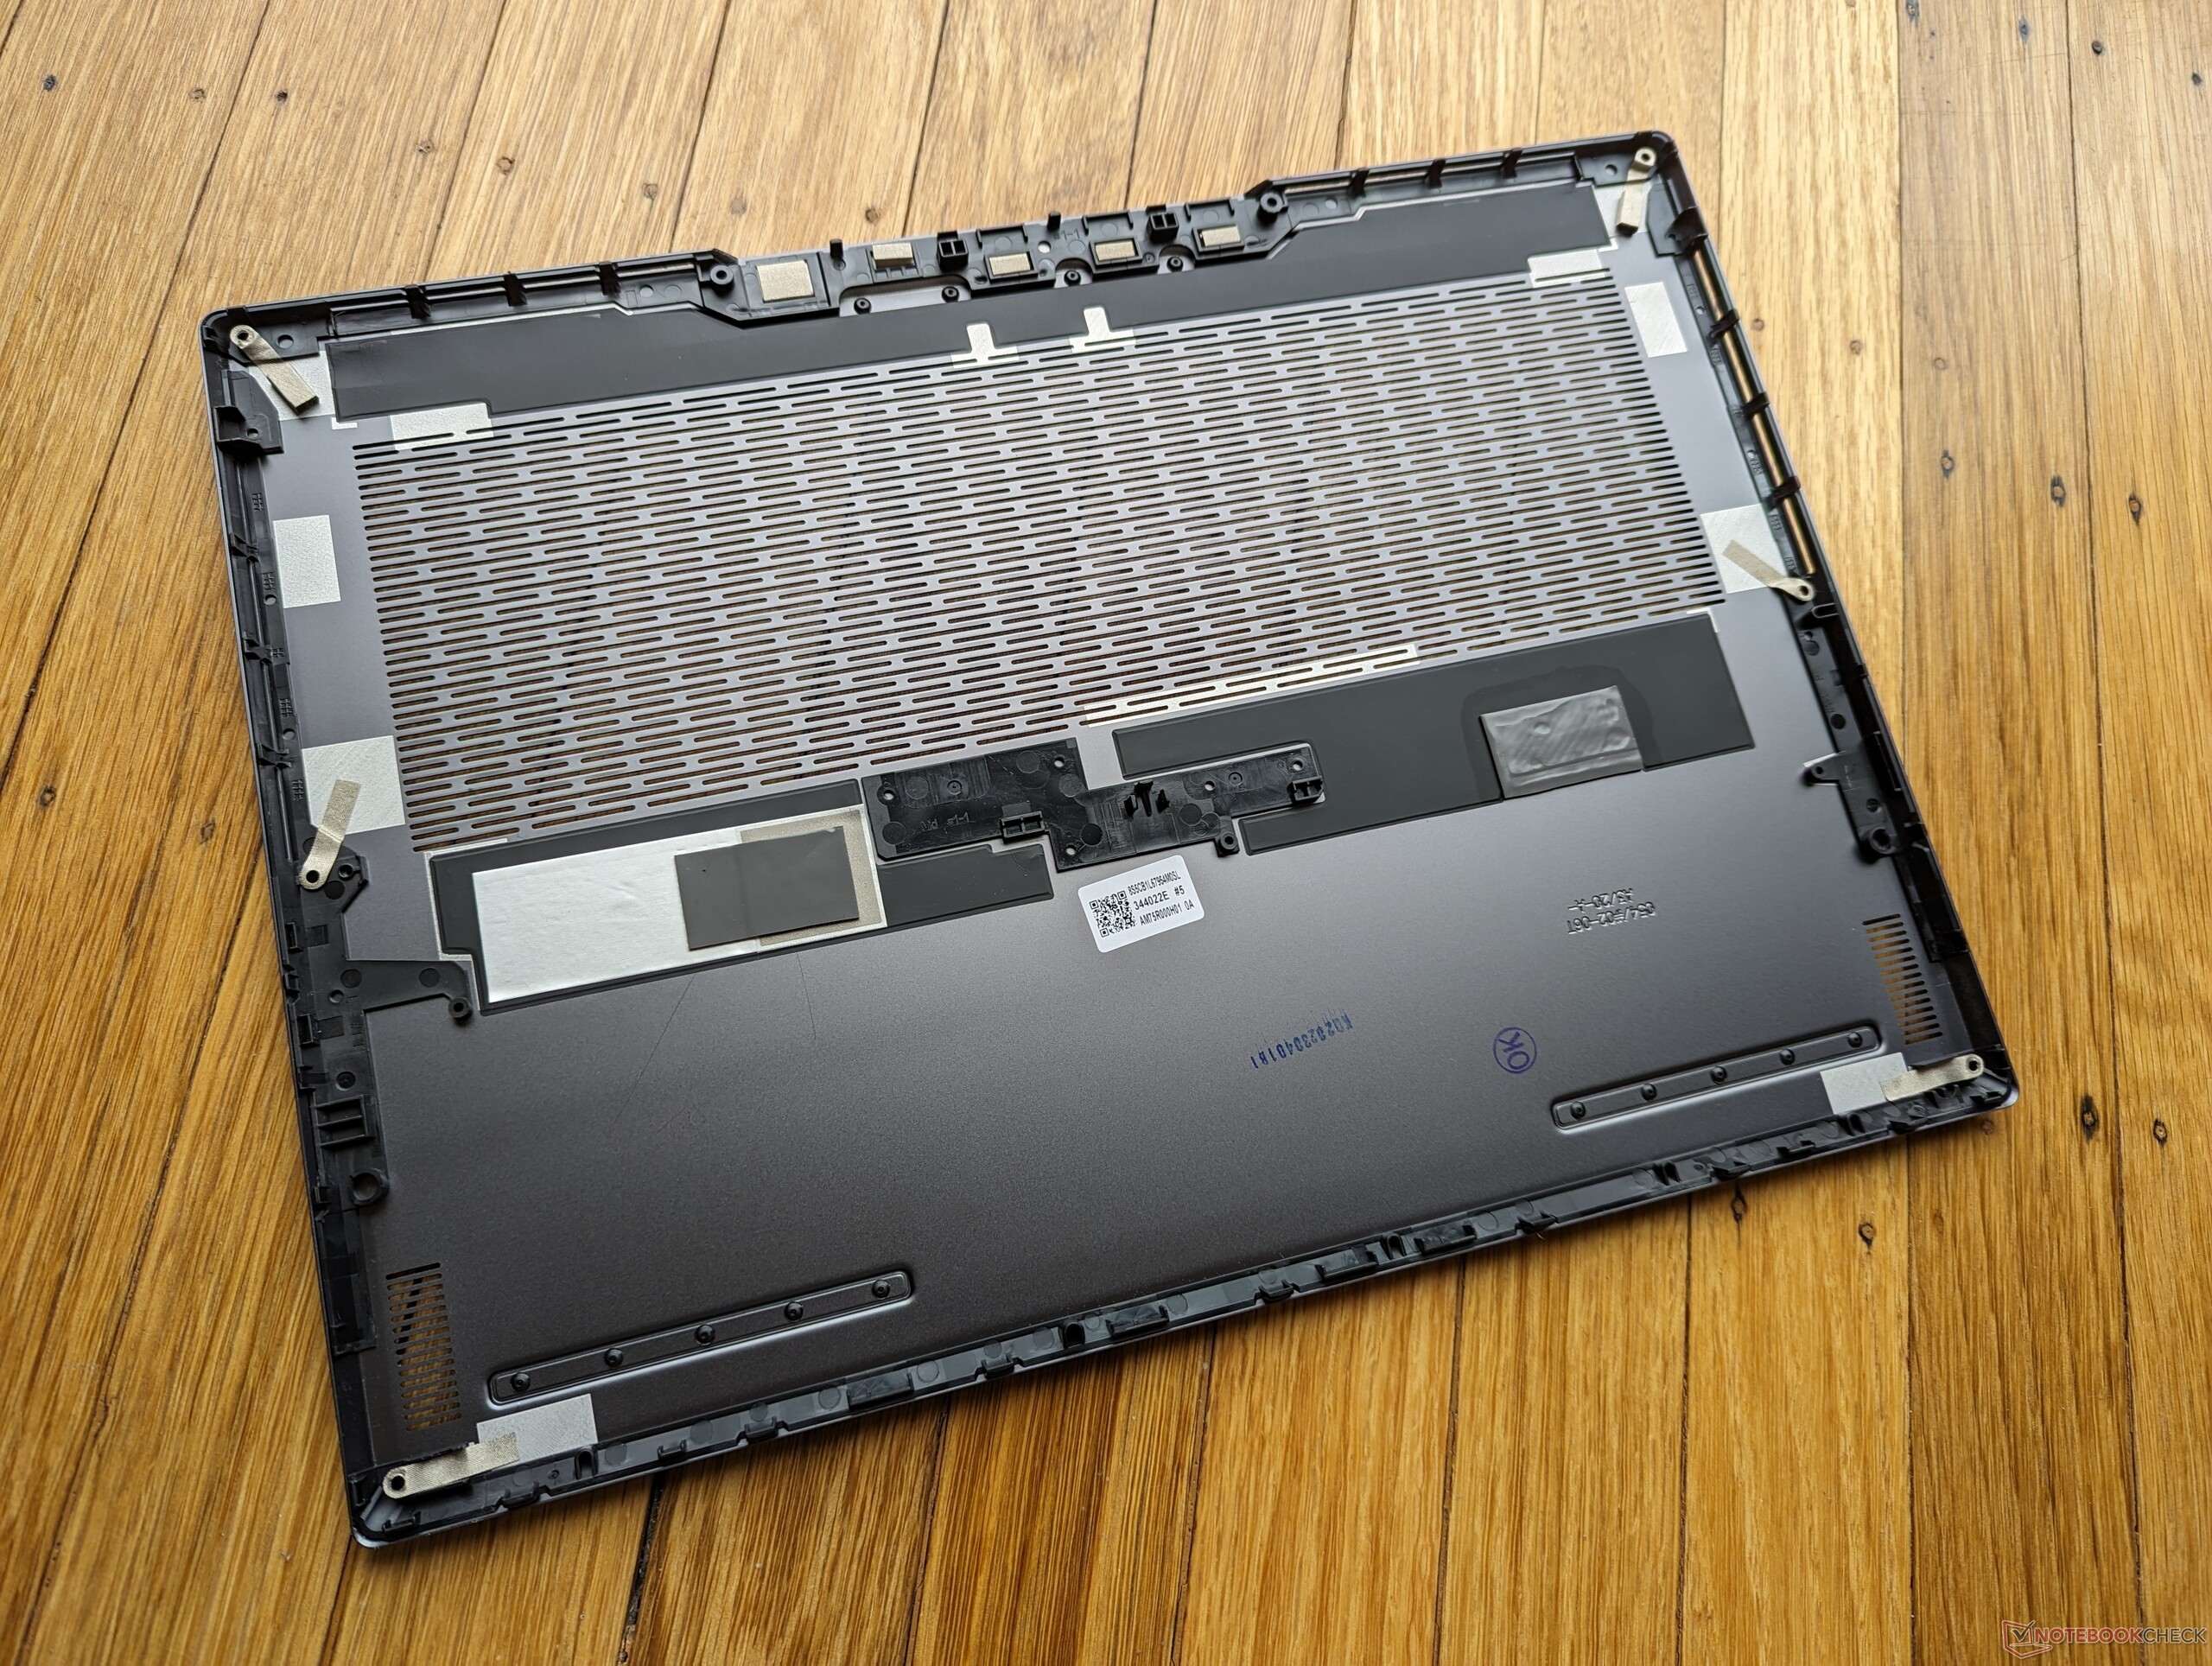
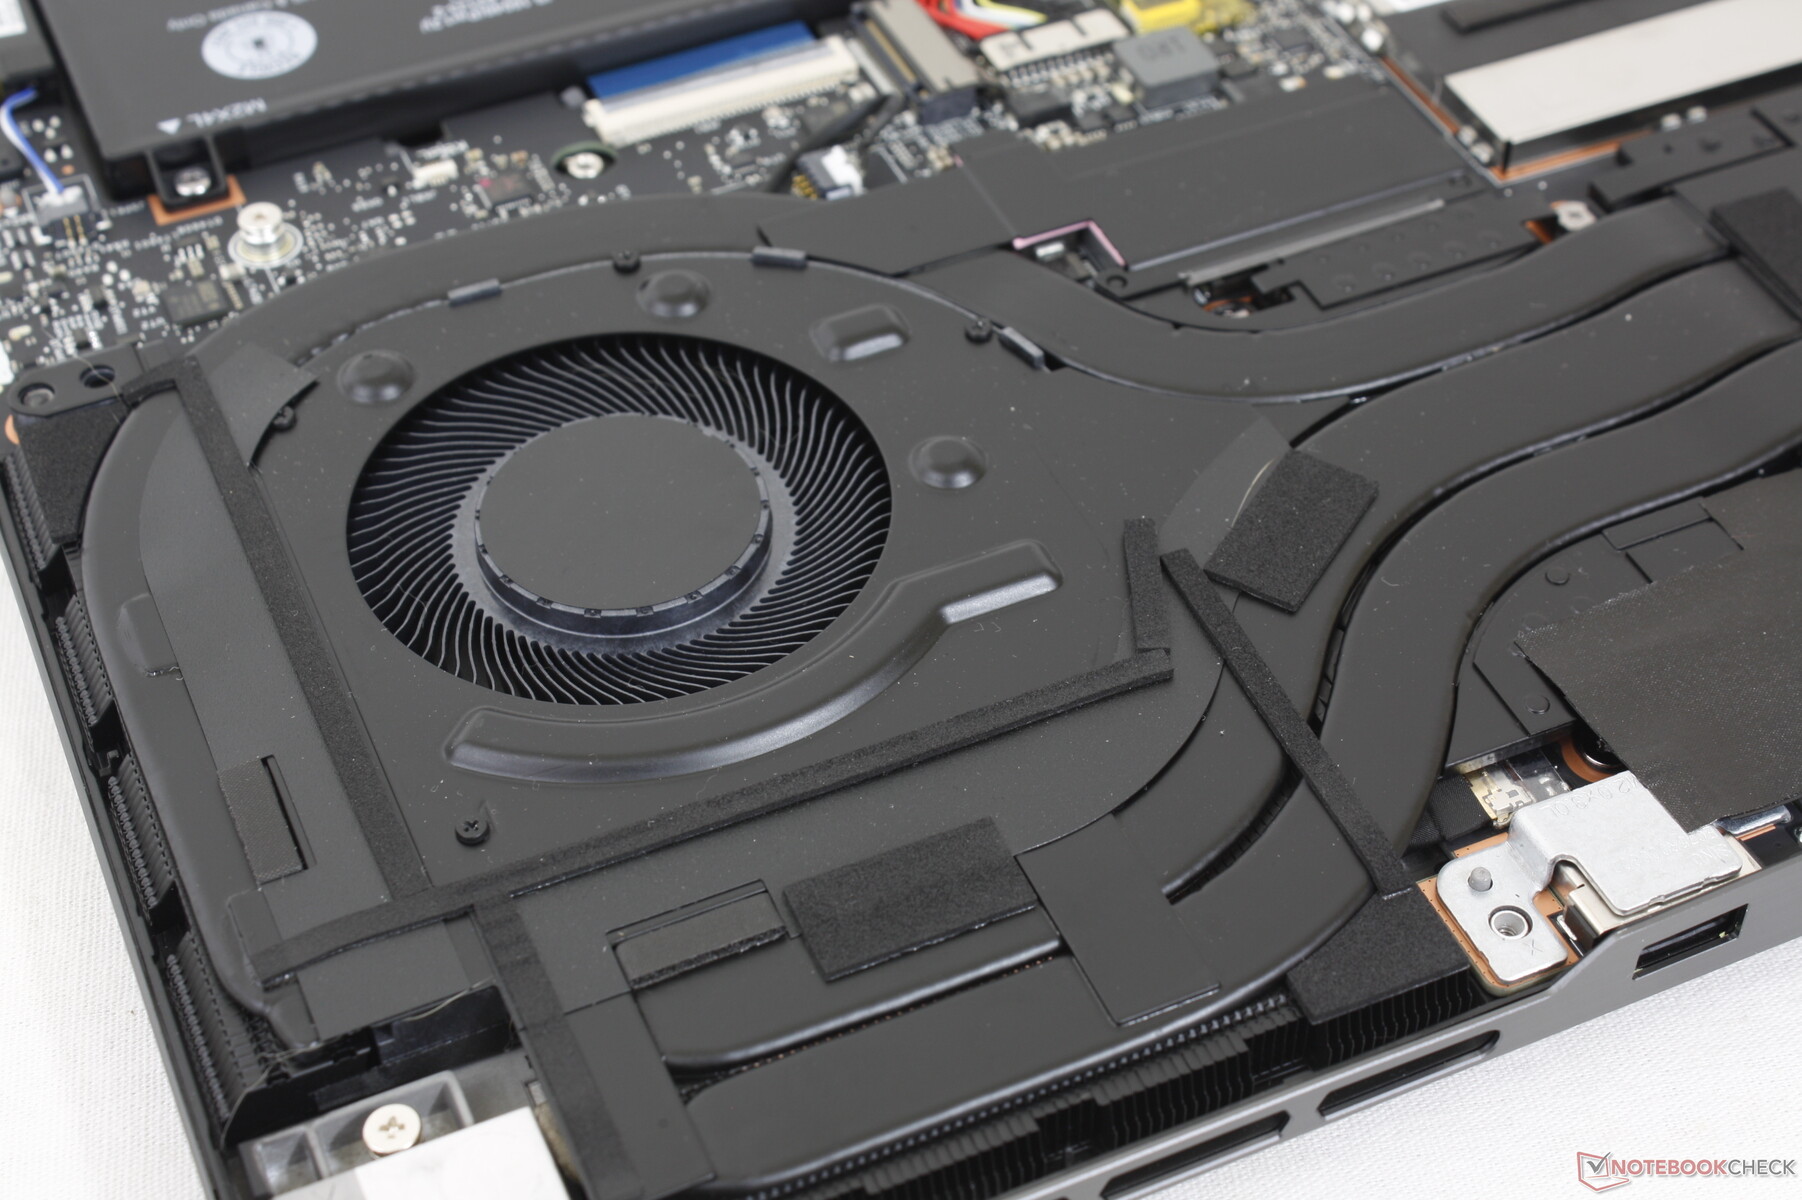
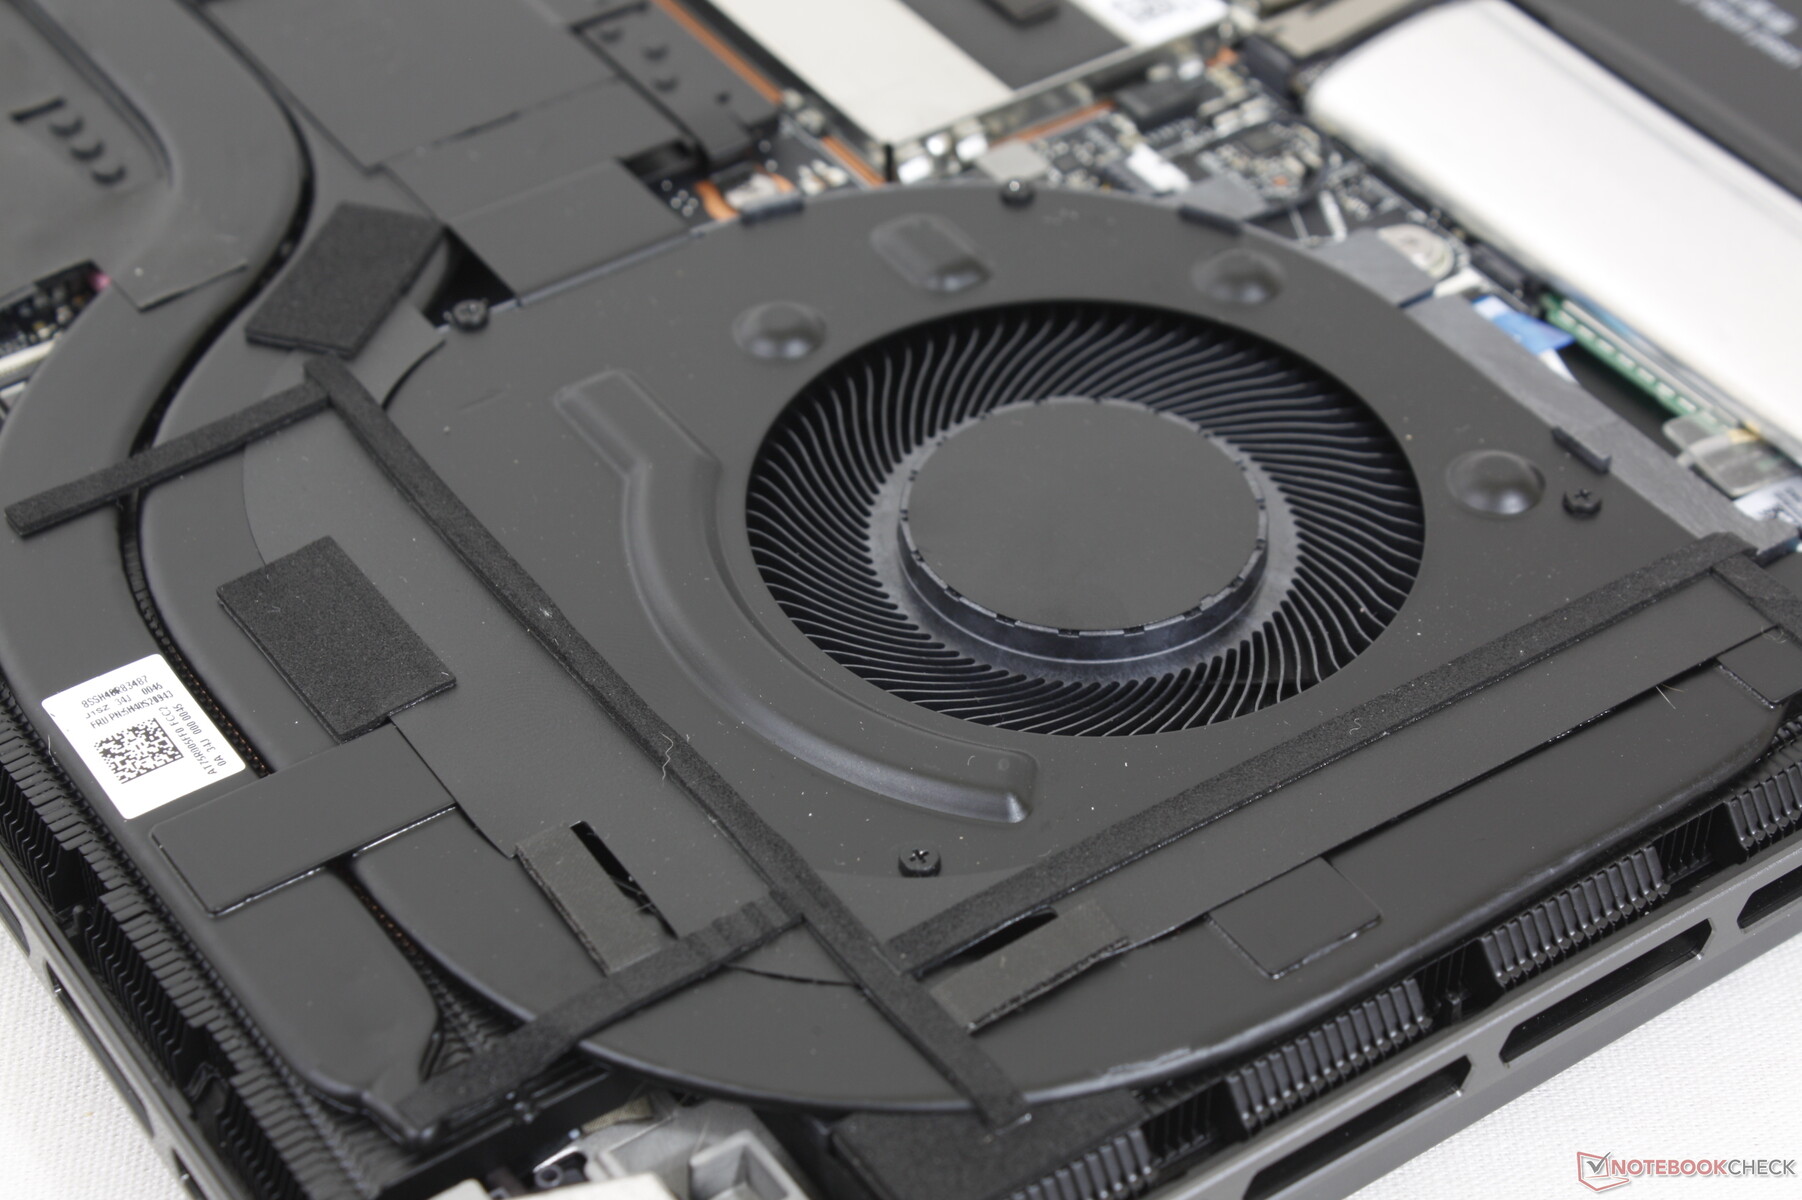
Konserwacja
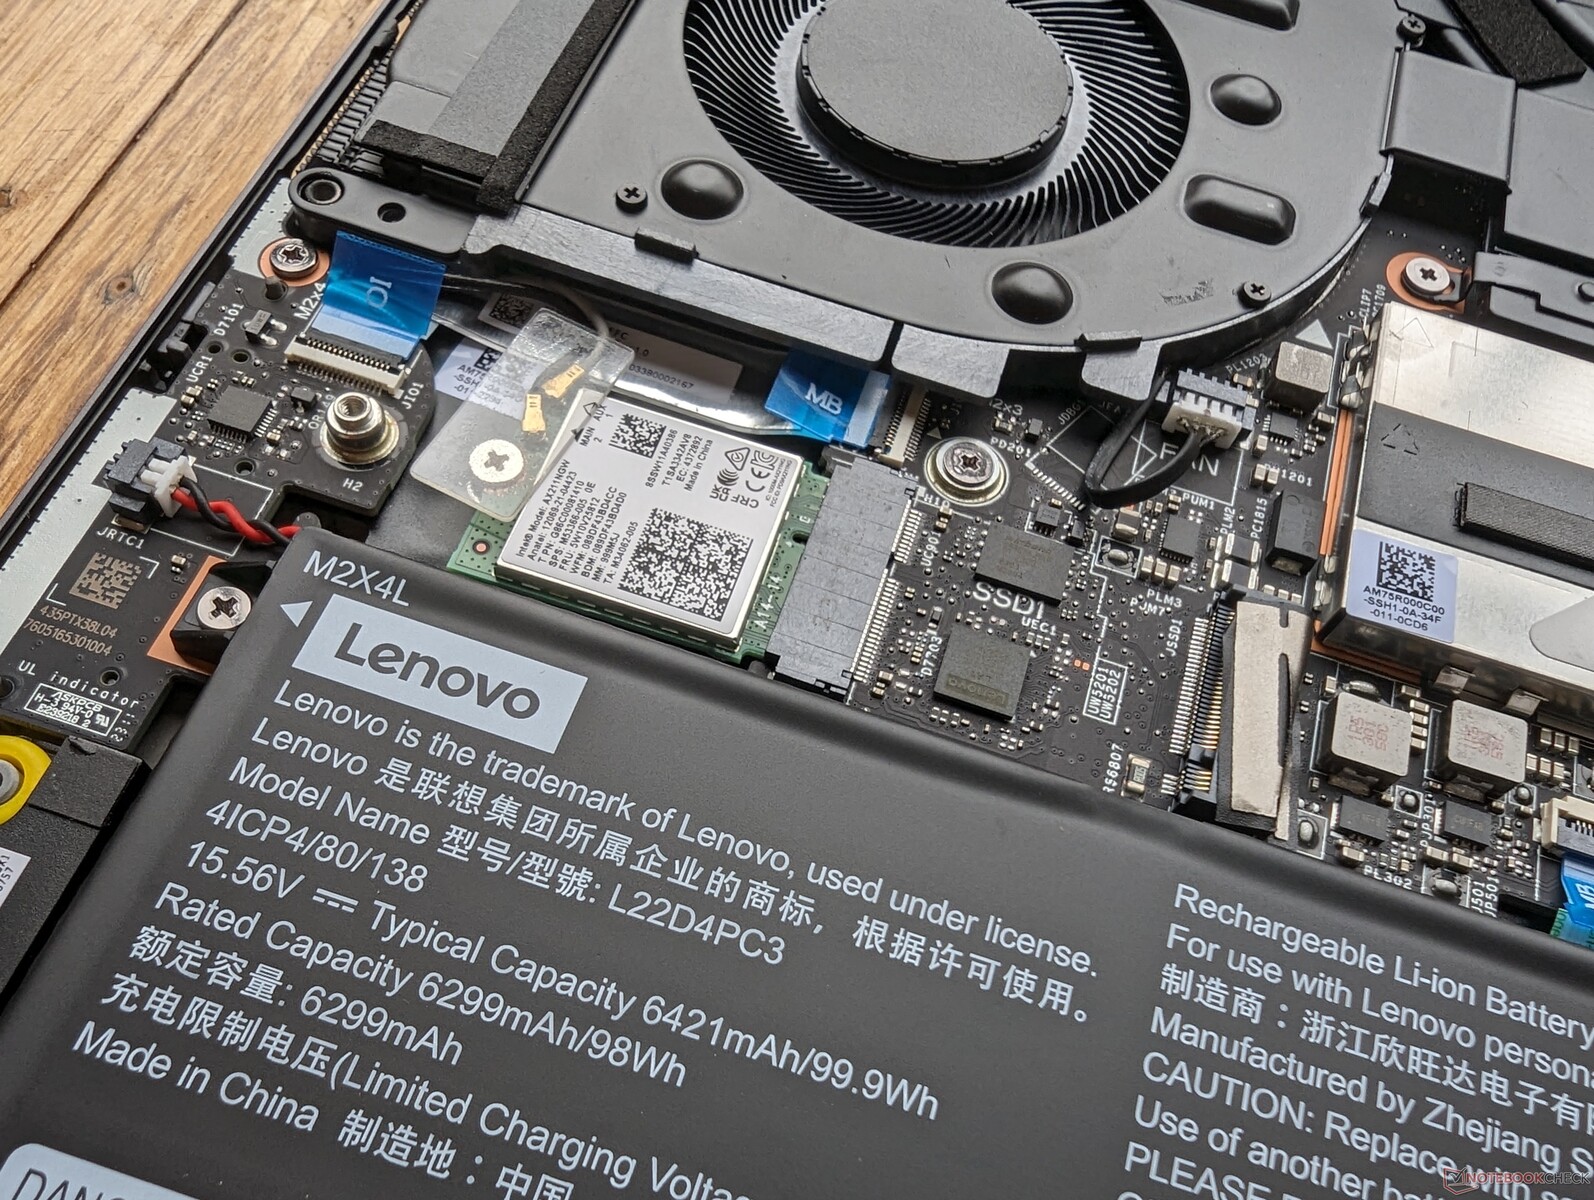
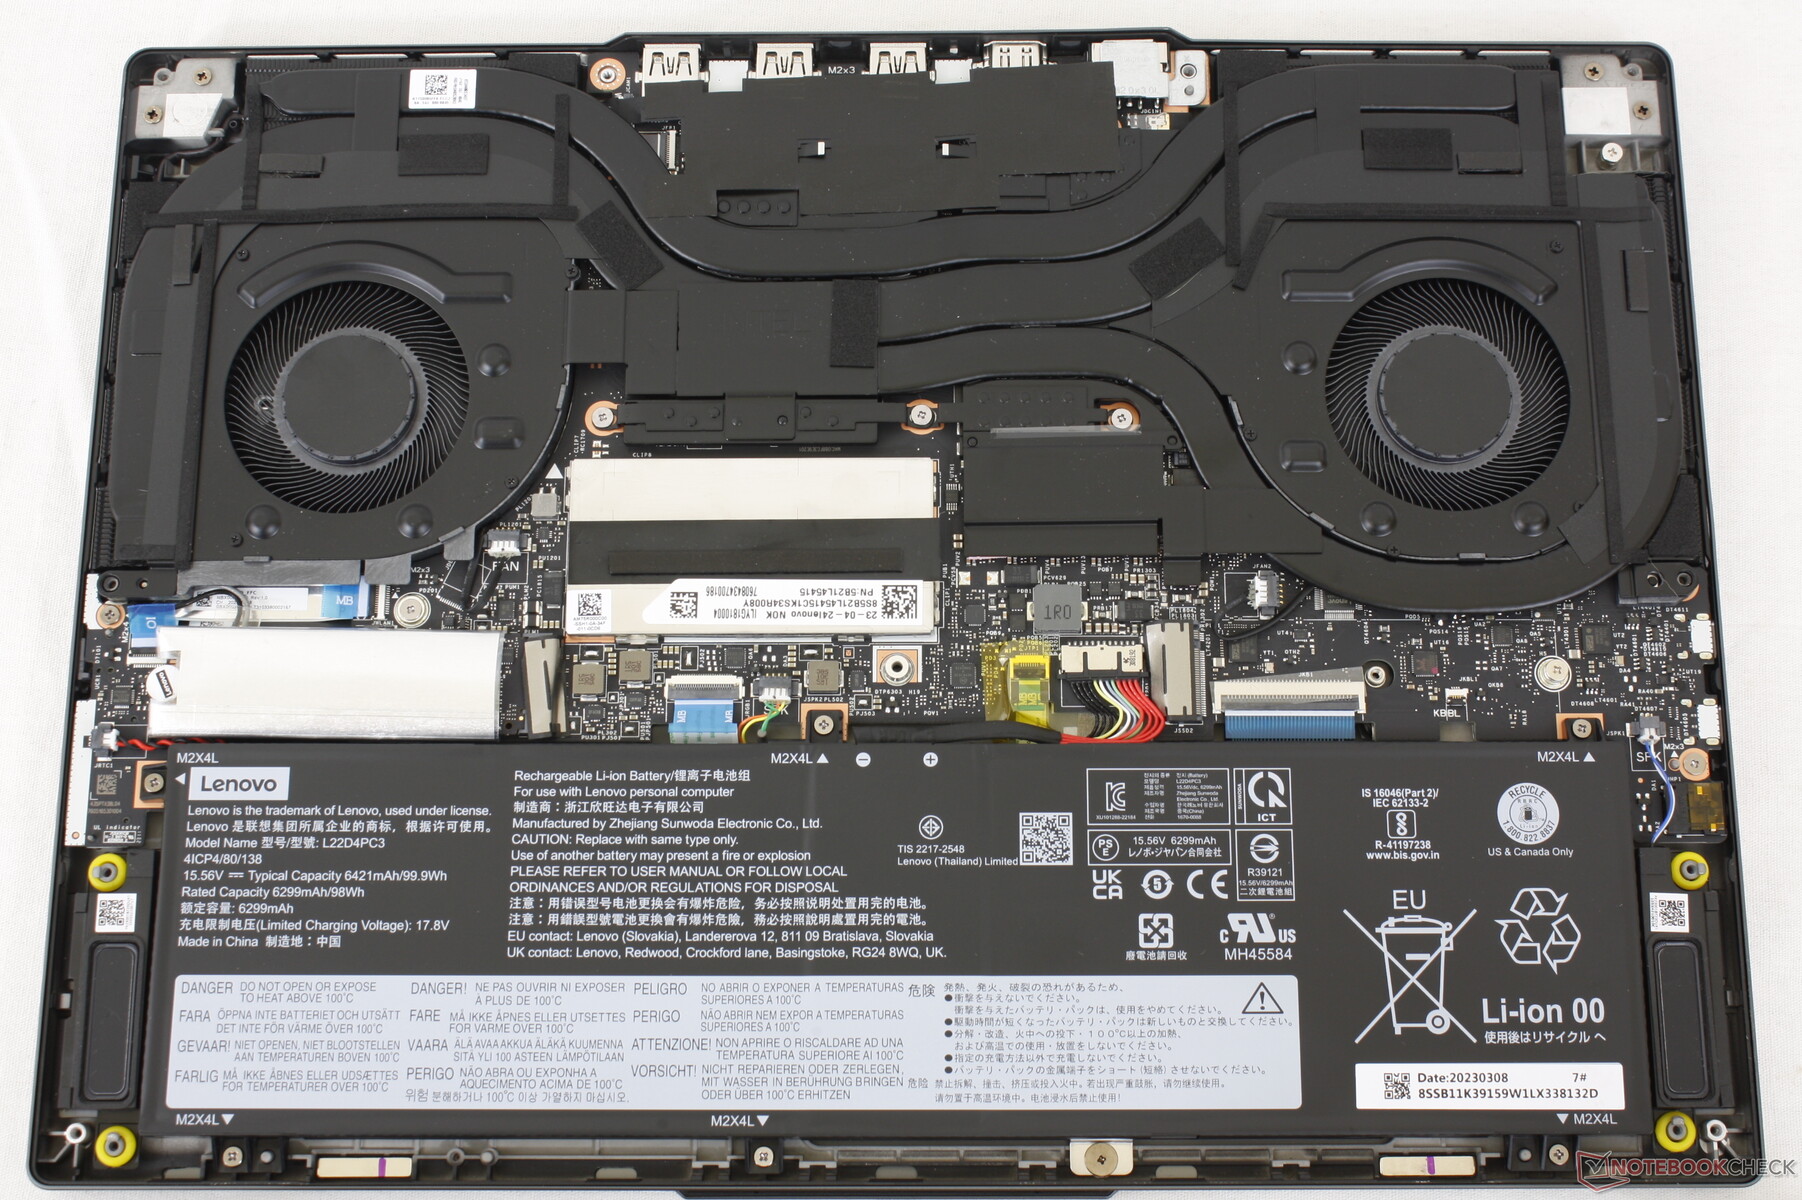
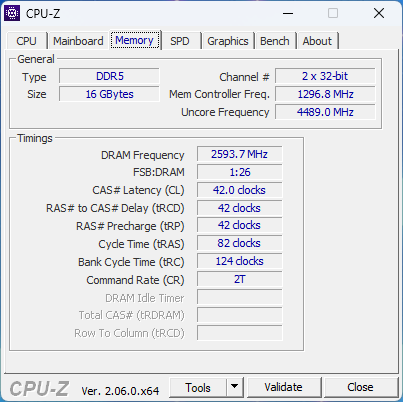
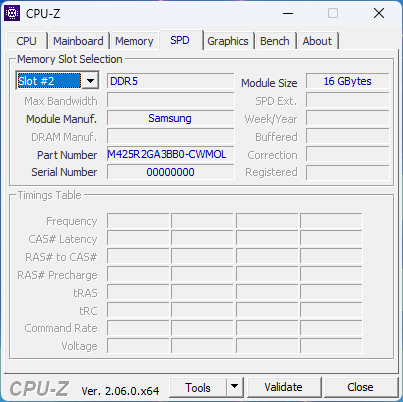
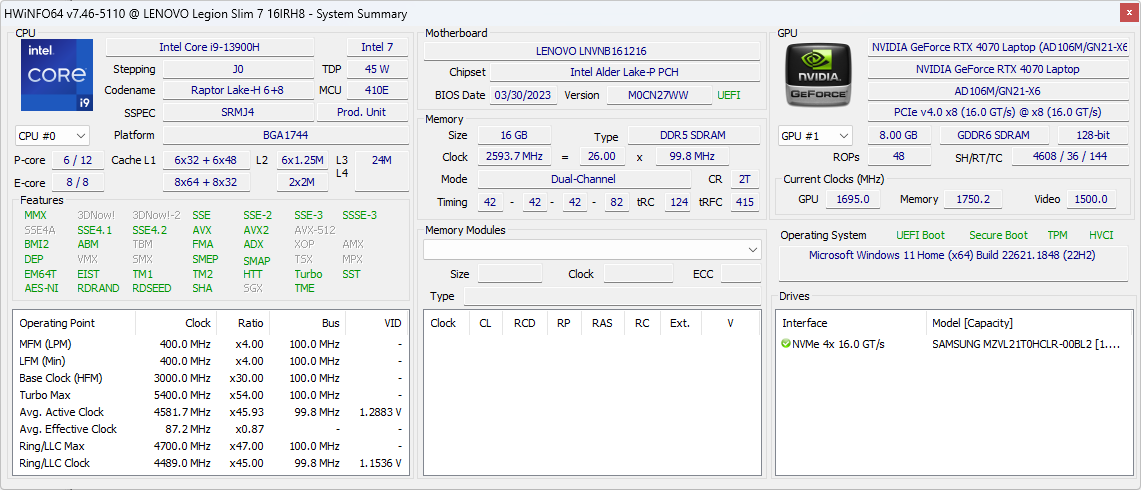
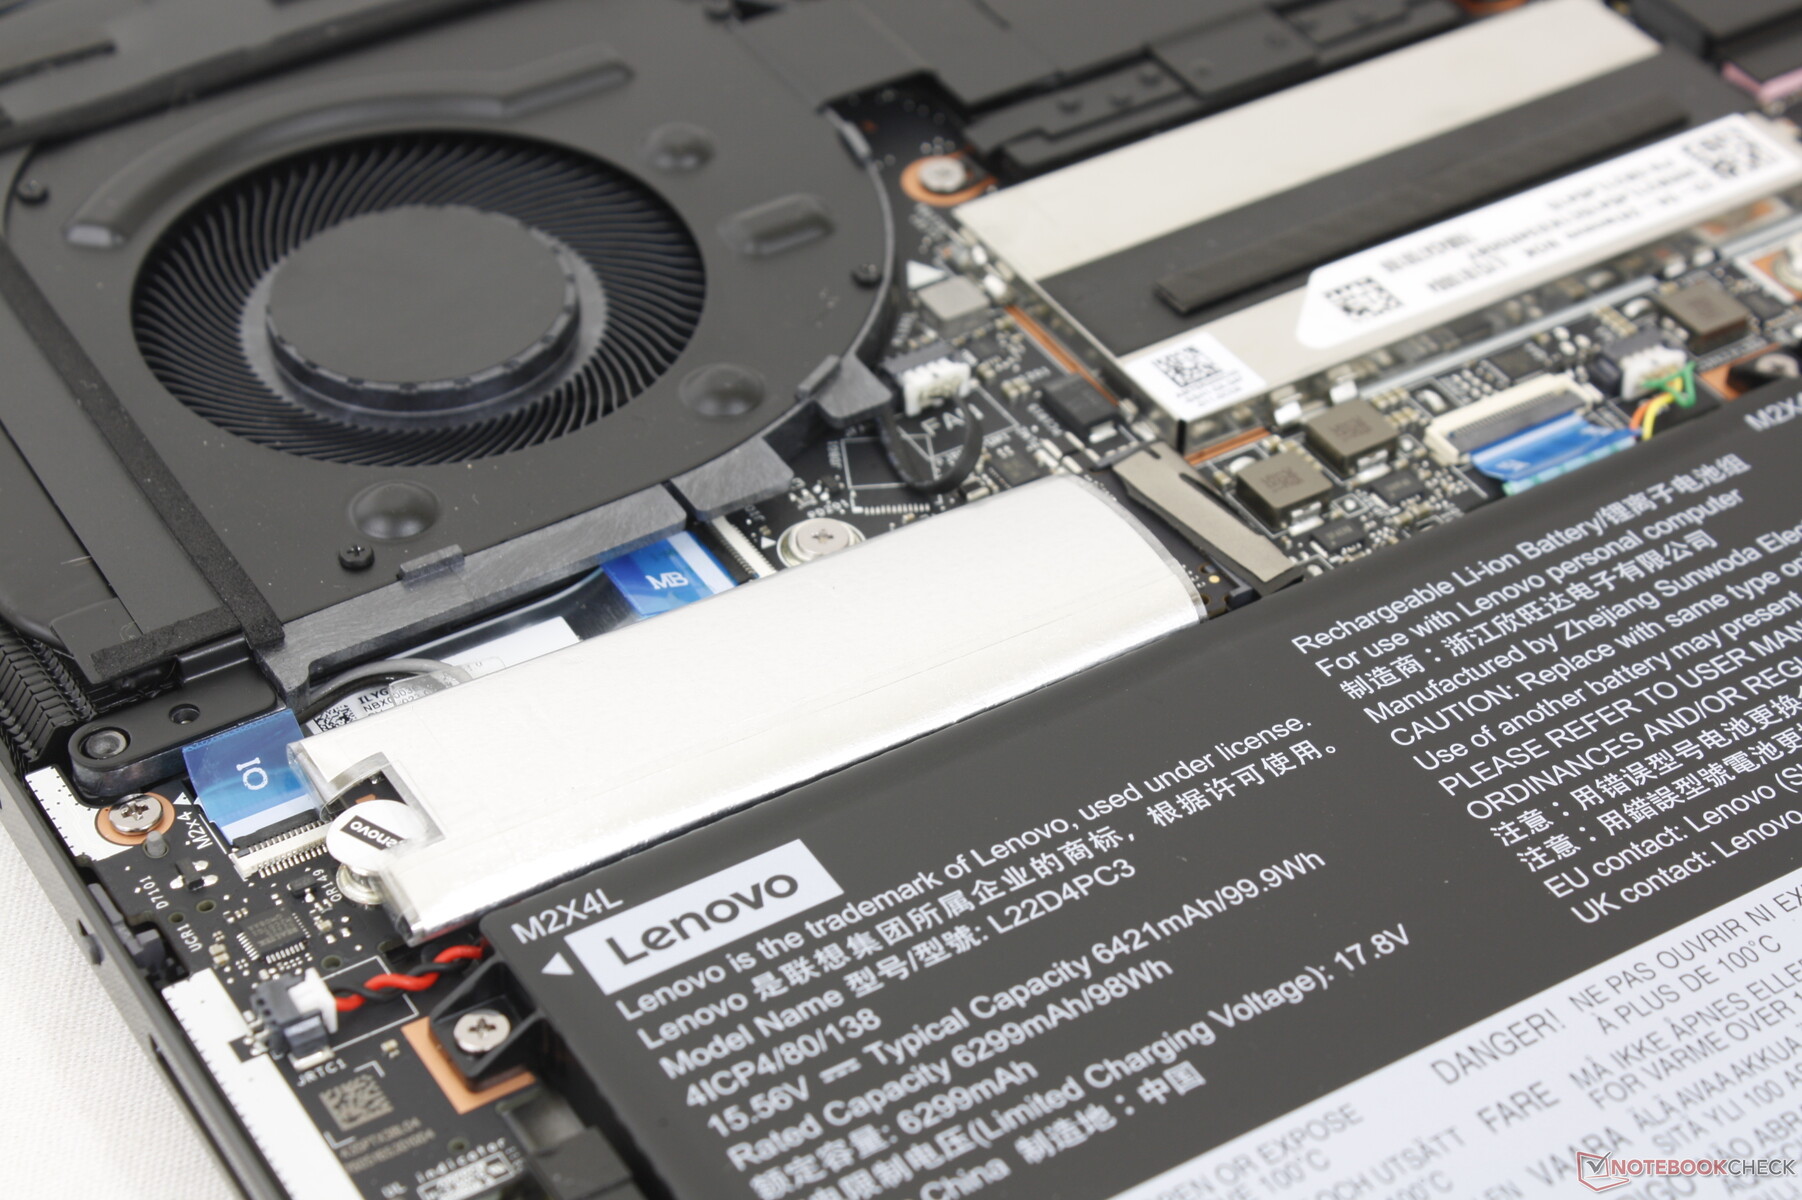
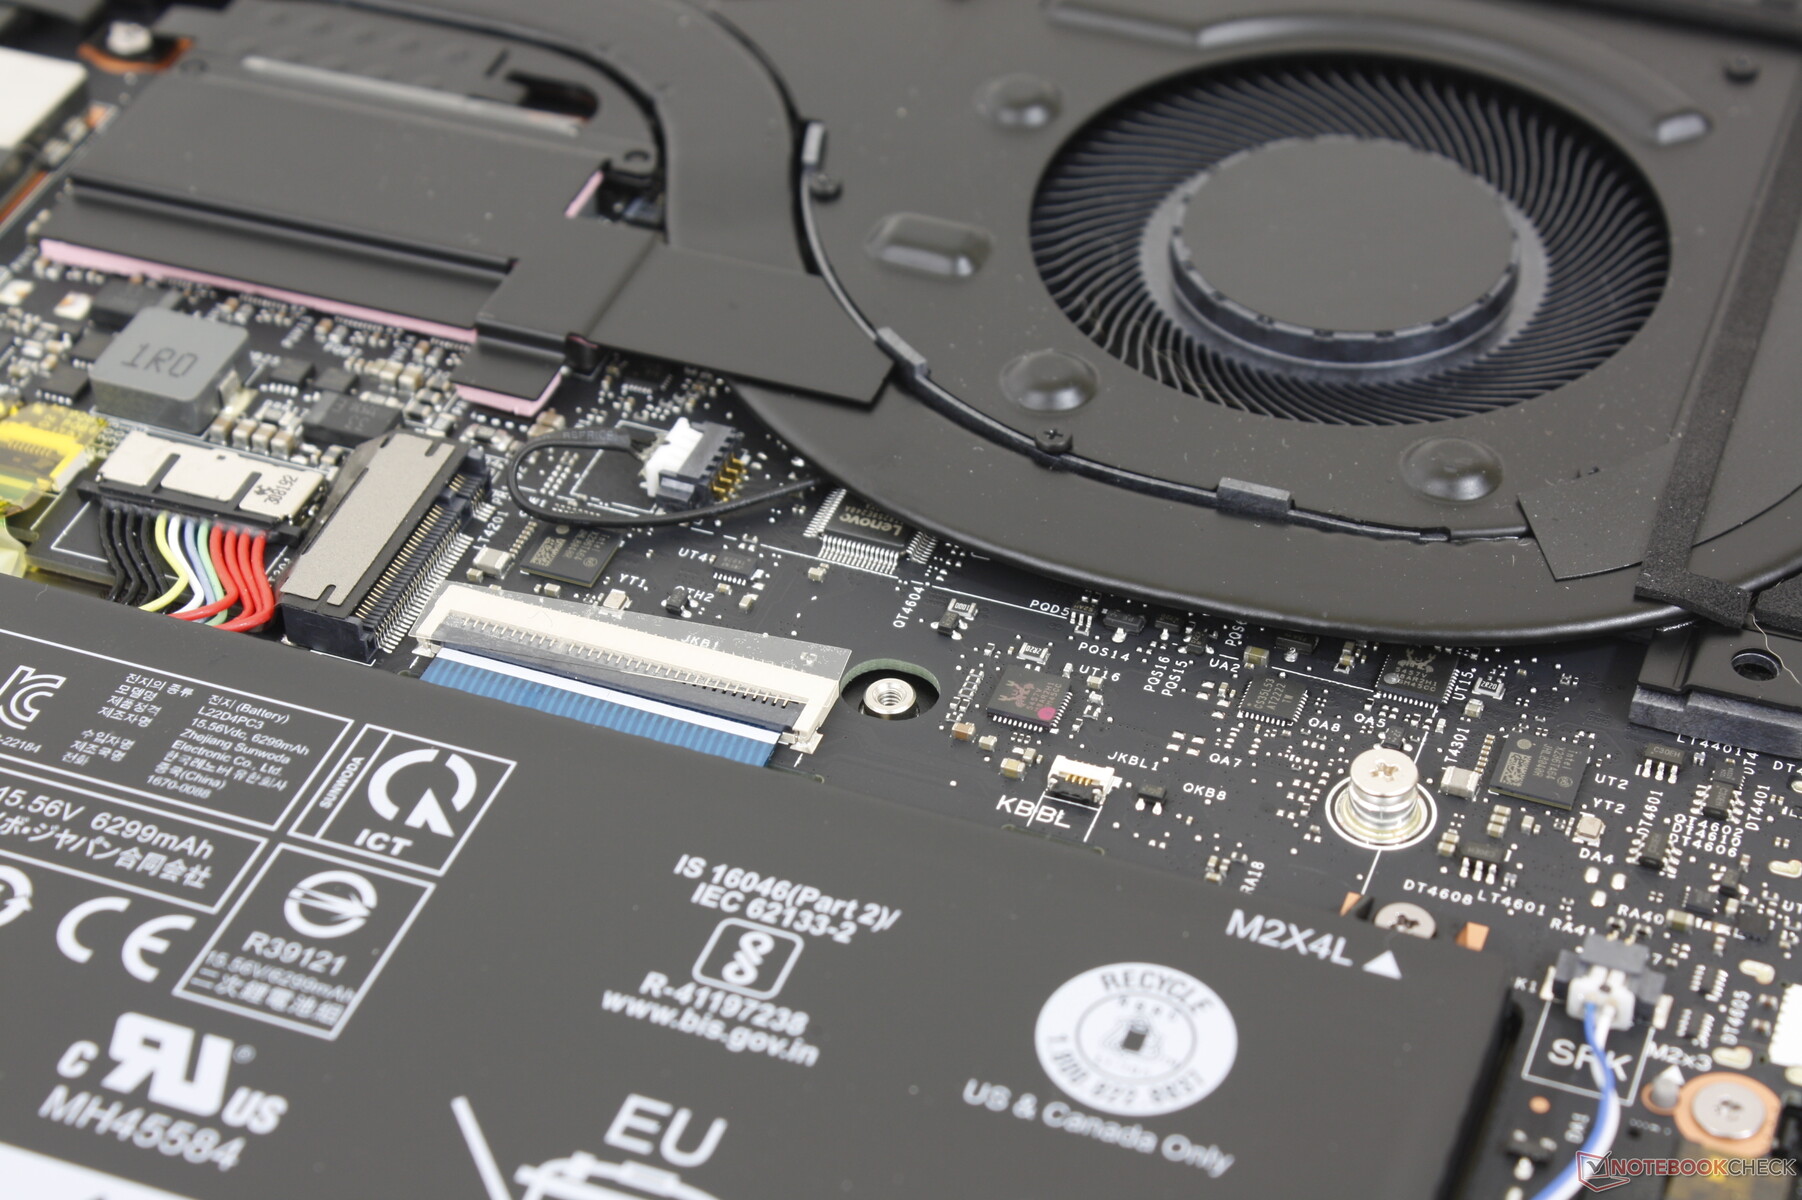
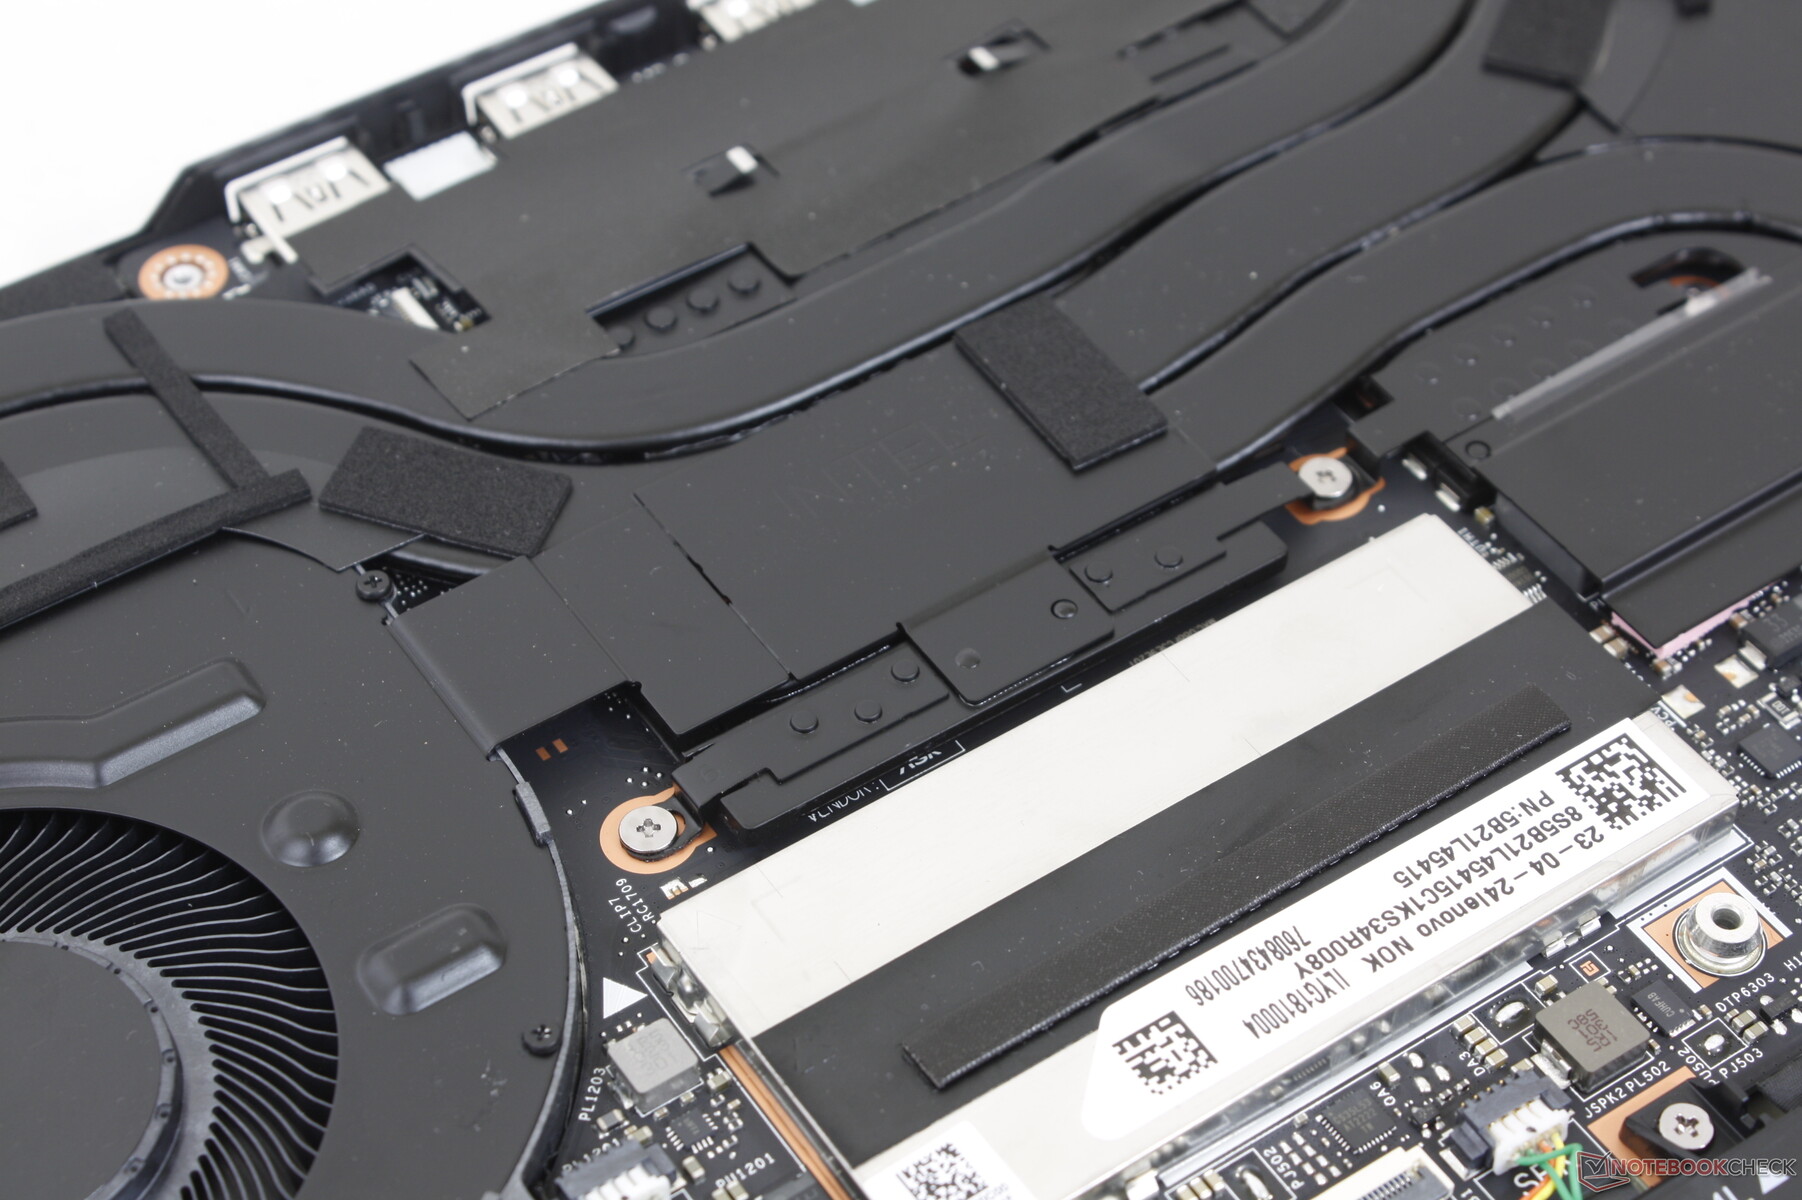
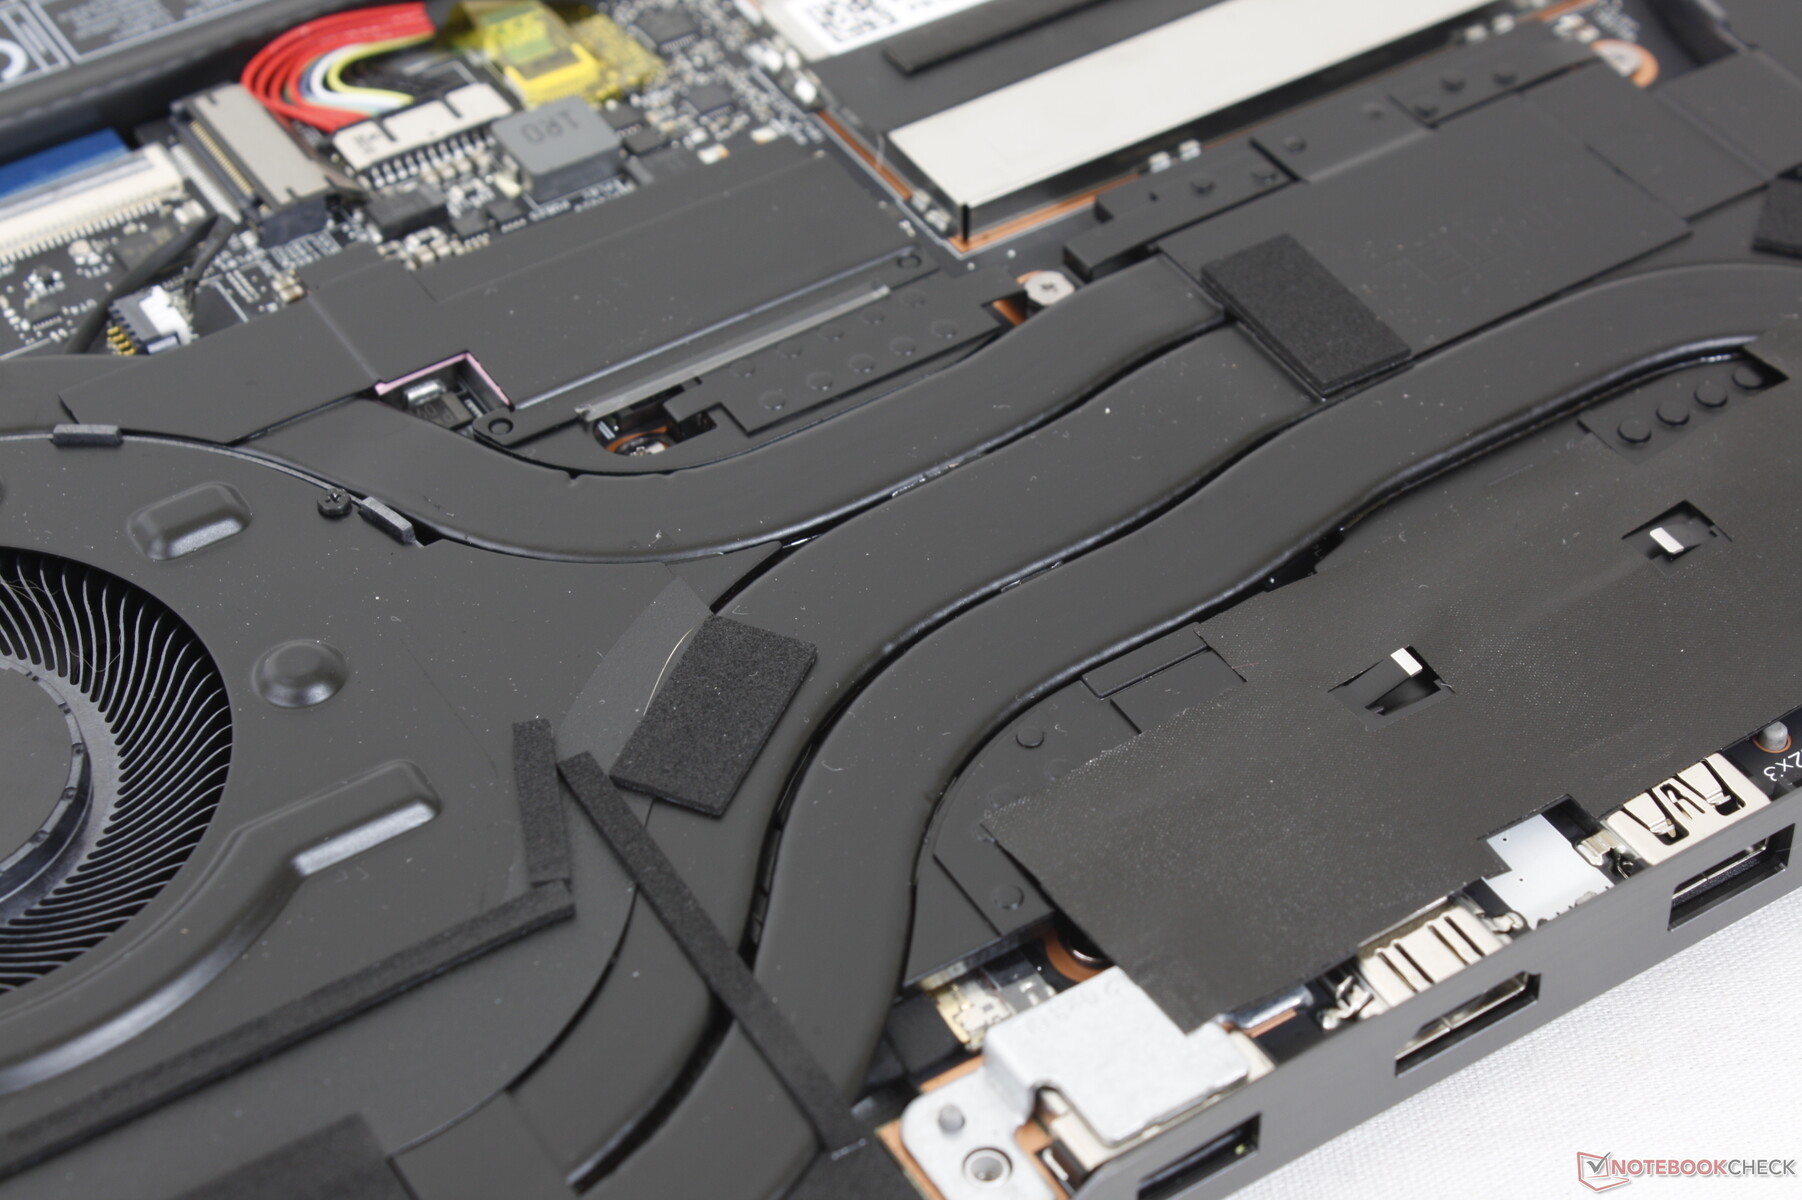
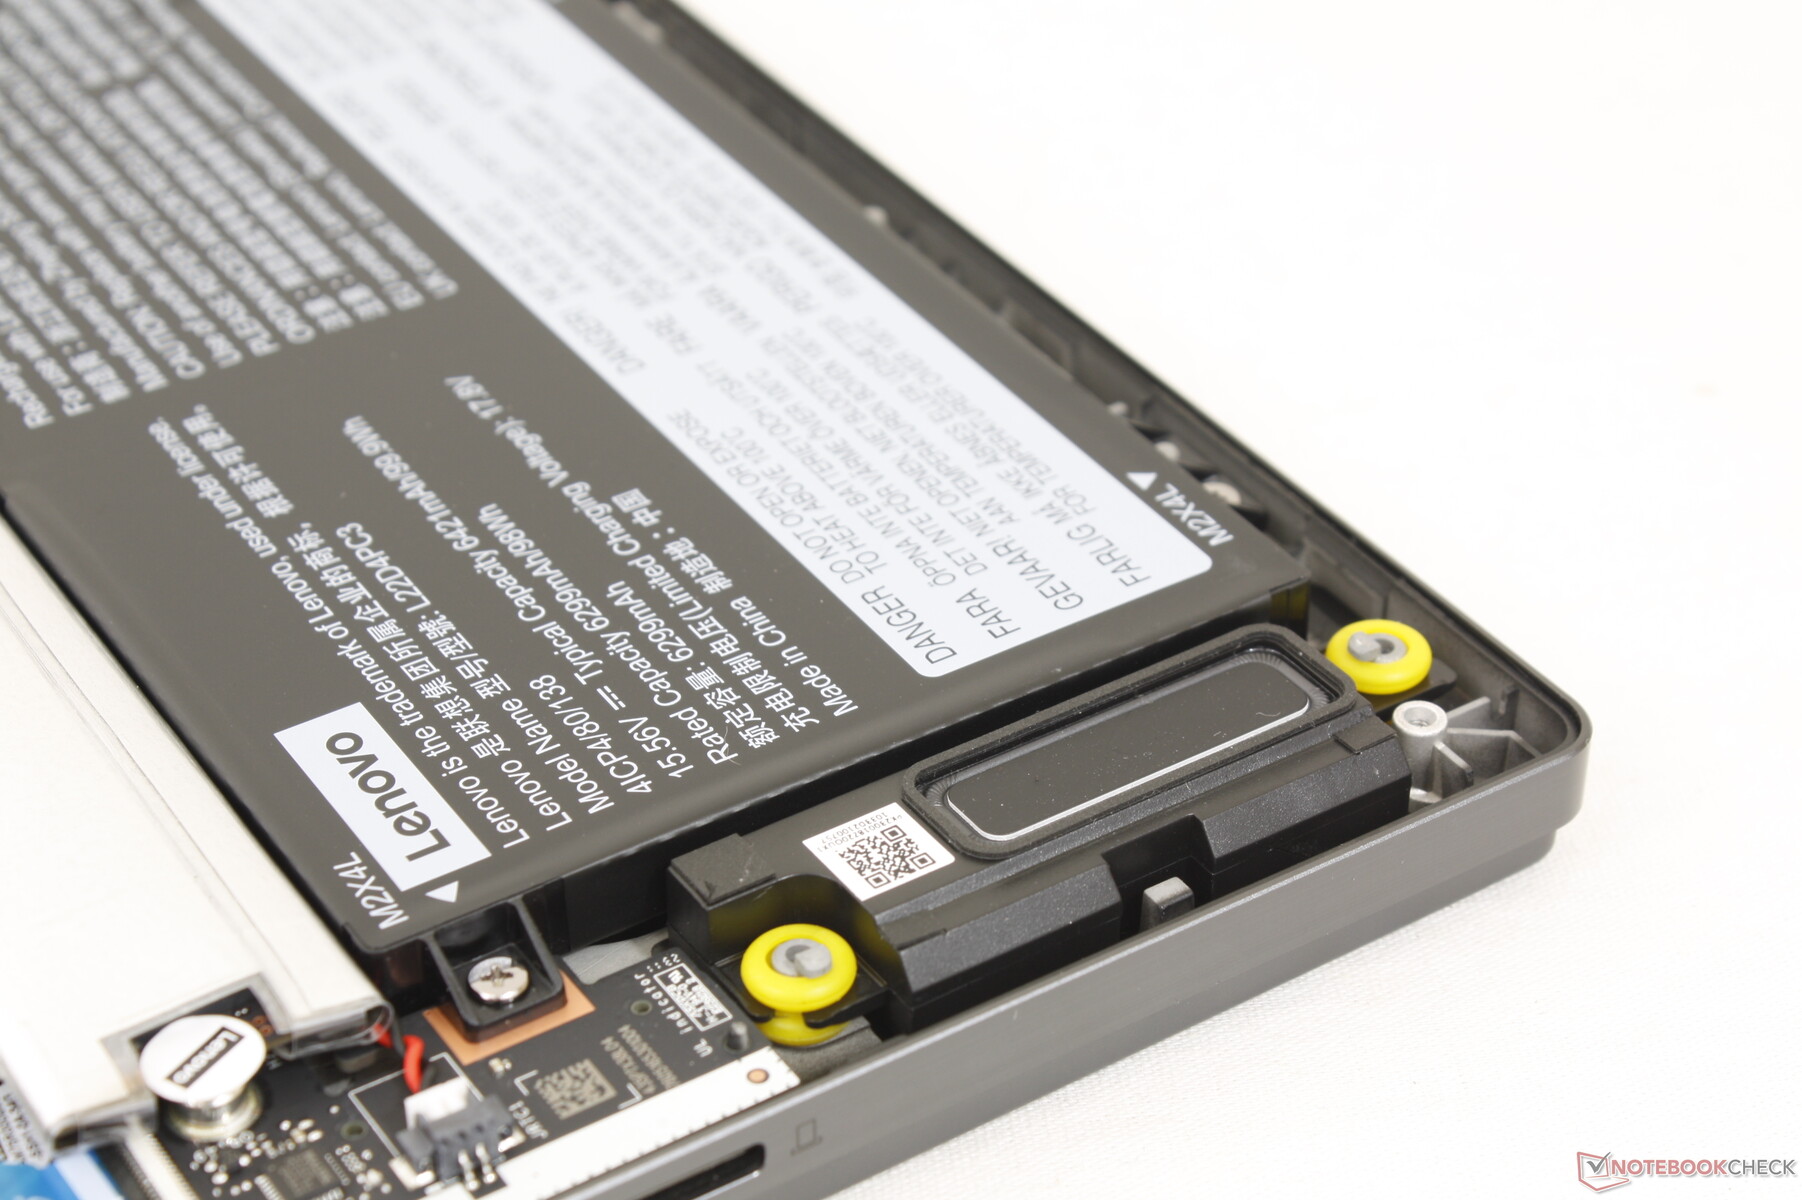
Dolny panel jest zabezpieczony ośmioma śrubami krzyżakowymi w celu łatwego demontażu. Właściciele mają bezpośredni dostęp do dwóch slotów M.2 2280 PCIe4, modułu WLAN i baterii. Pamięć RAM składa się z 16 GB wlutowanych DDR5-5200 oraz jednego rozszerzalnego gniazda SODIMM pod aluminiową osłoną w pobliżu środka.
Akcesoria i gwarancja
W pudełku nie ma żadnych dodatków poza zasilaczem sieciowym i dokumentacją. Standardowa roczna ograniczona gwarancja producenta ma zastosowanie w przypadku zakupu w USA.
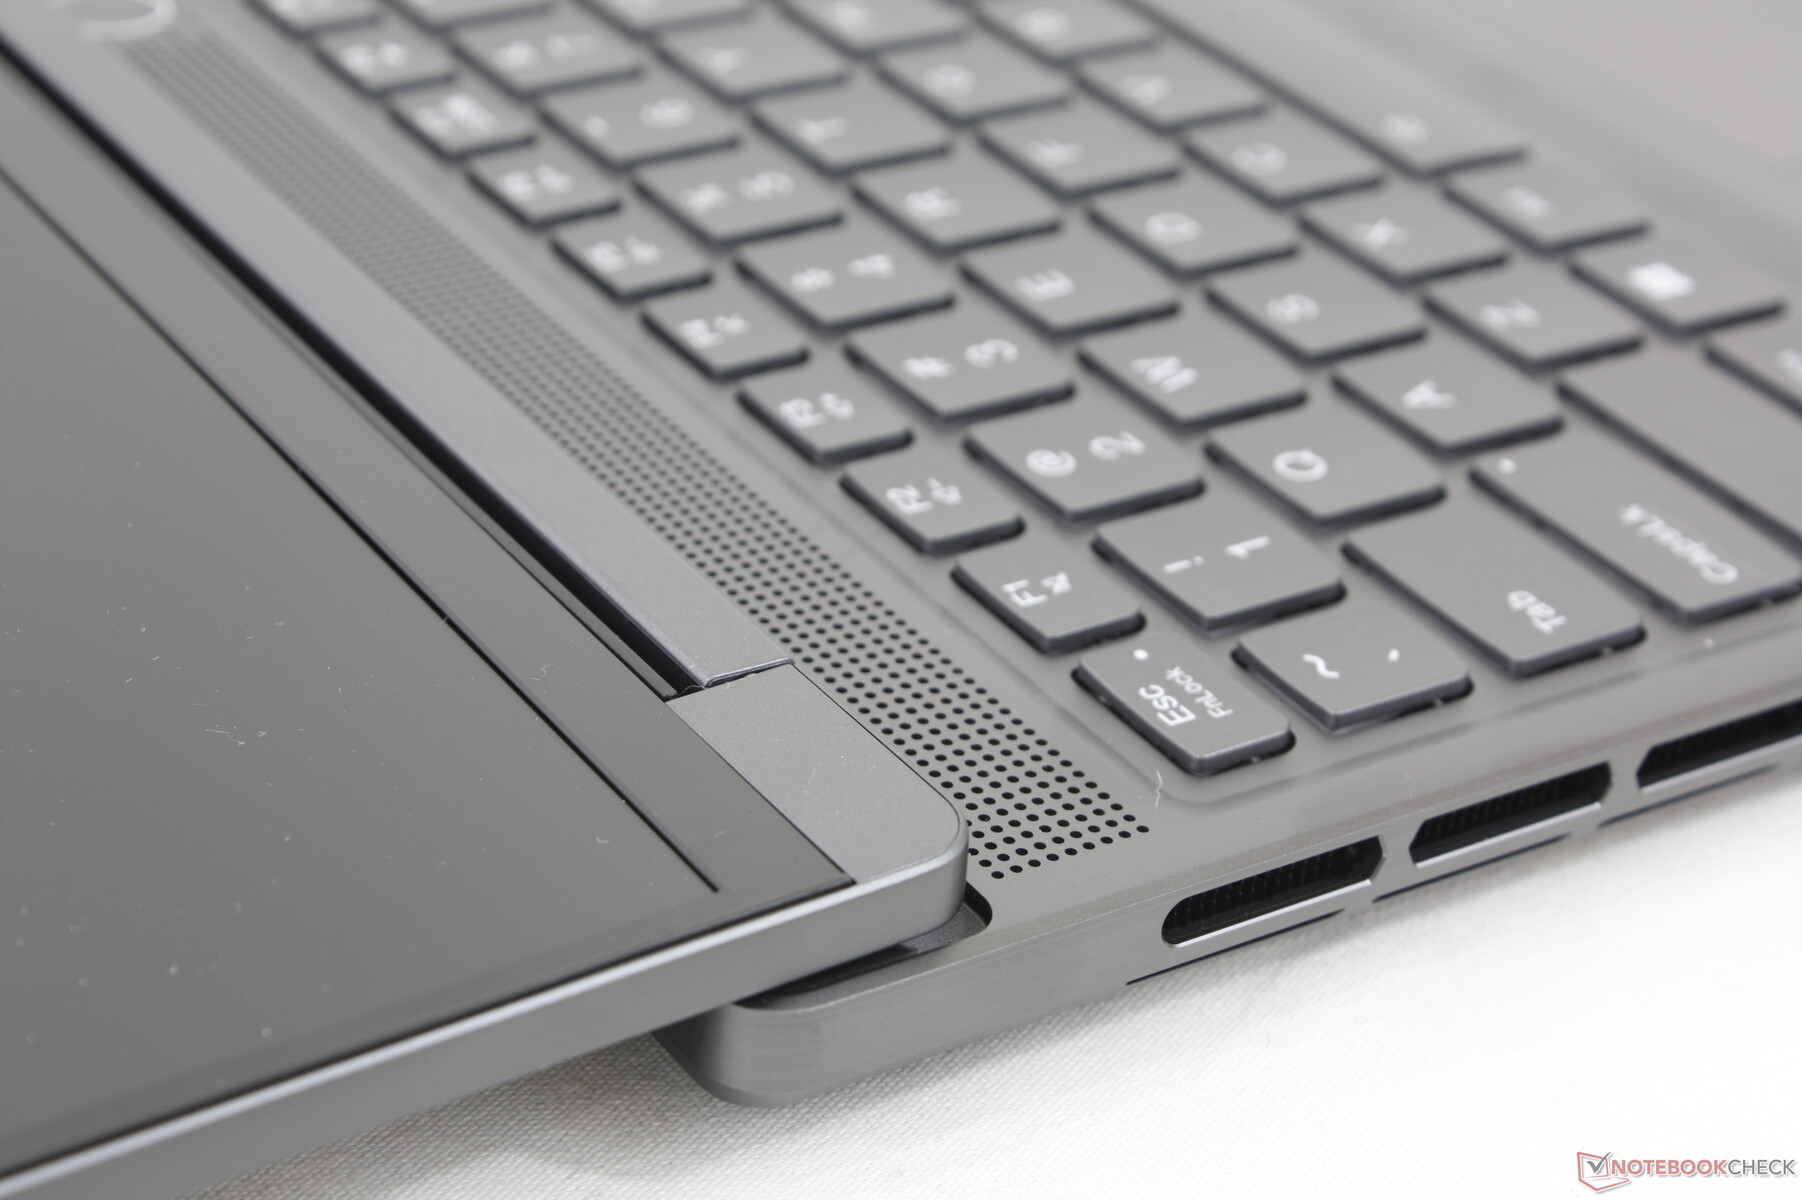
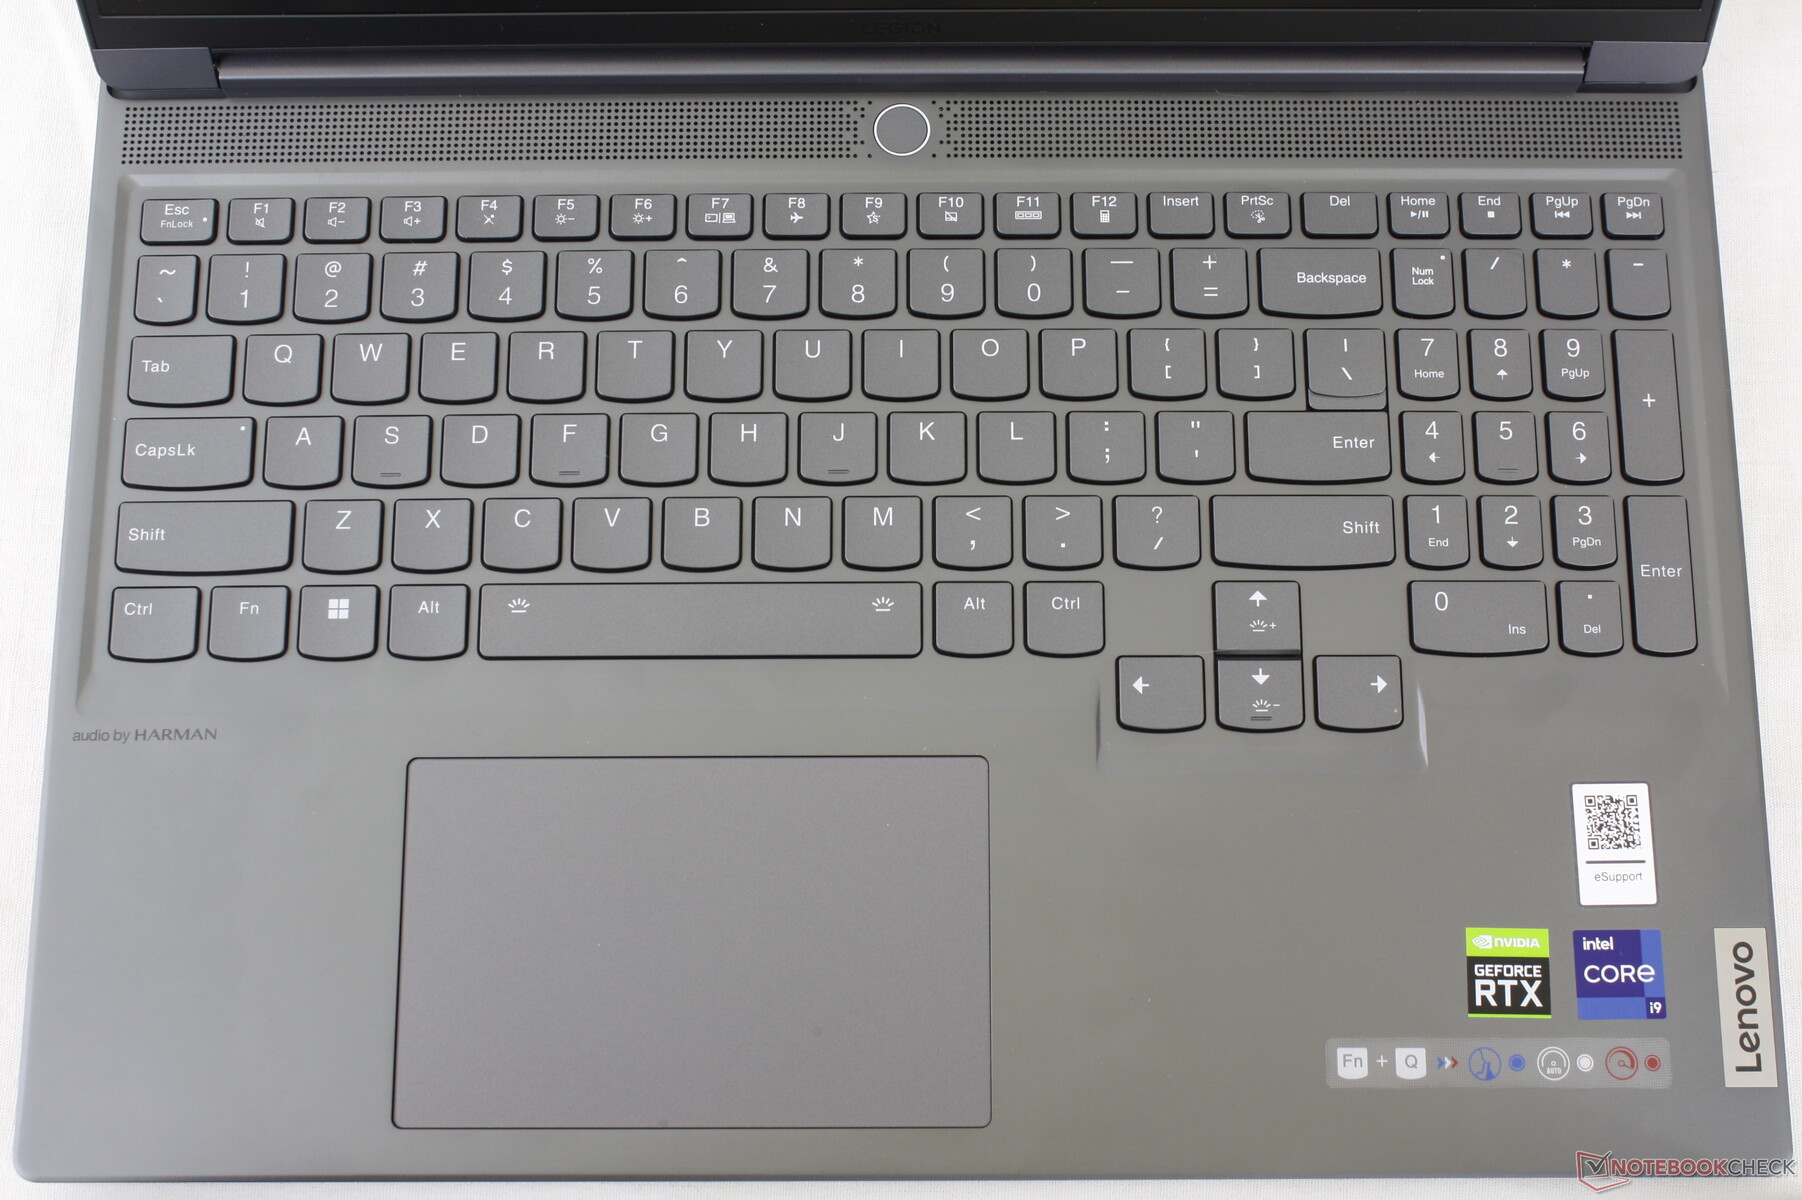
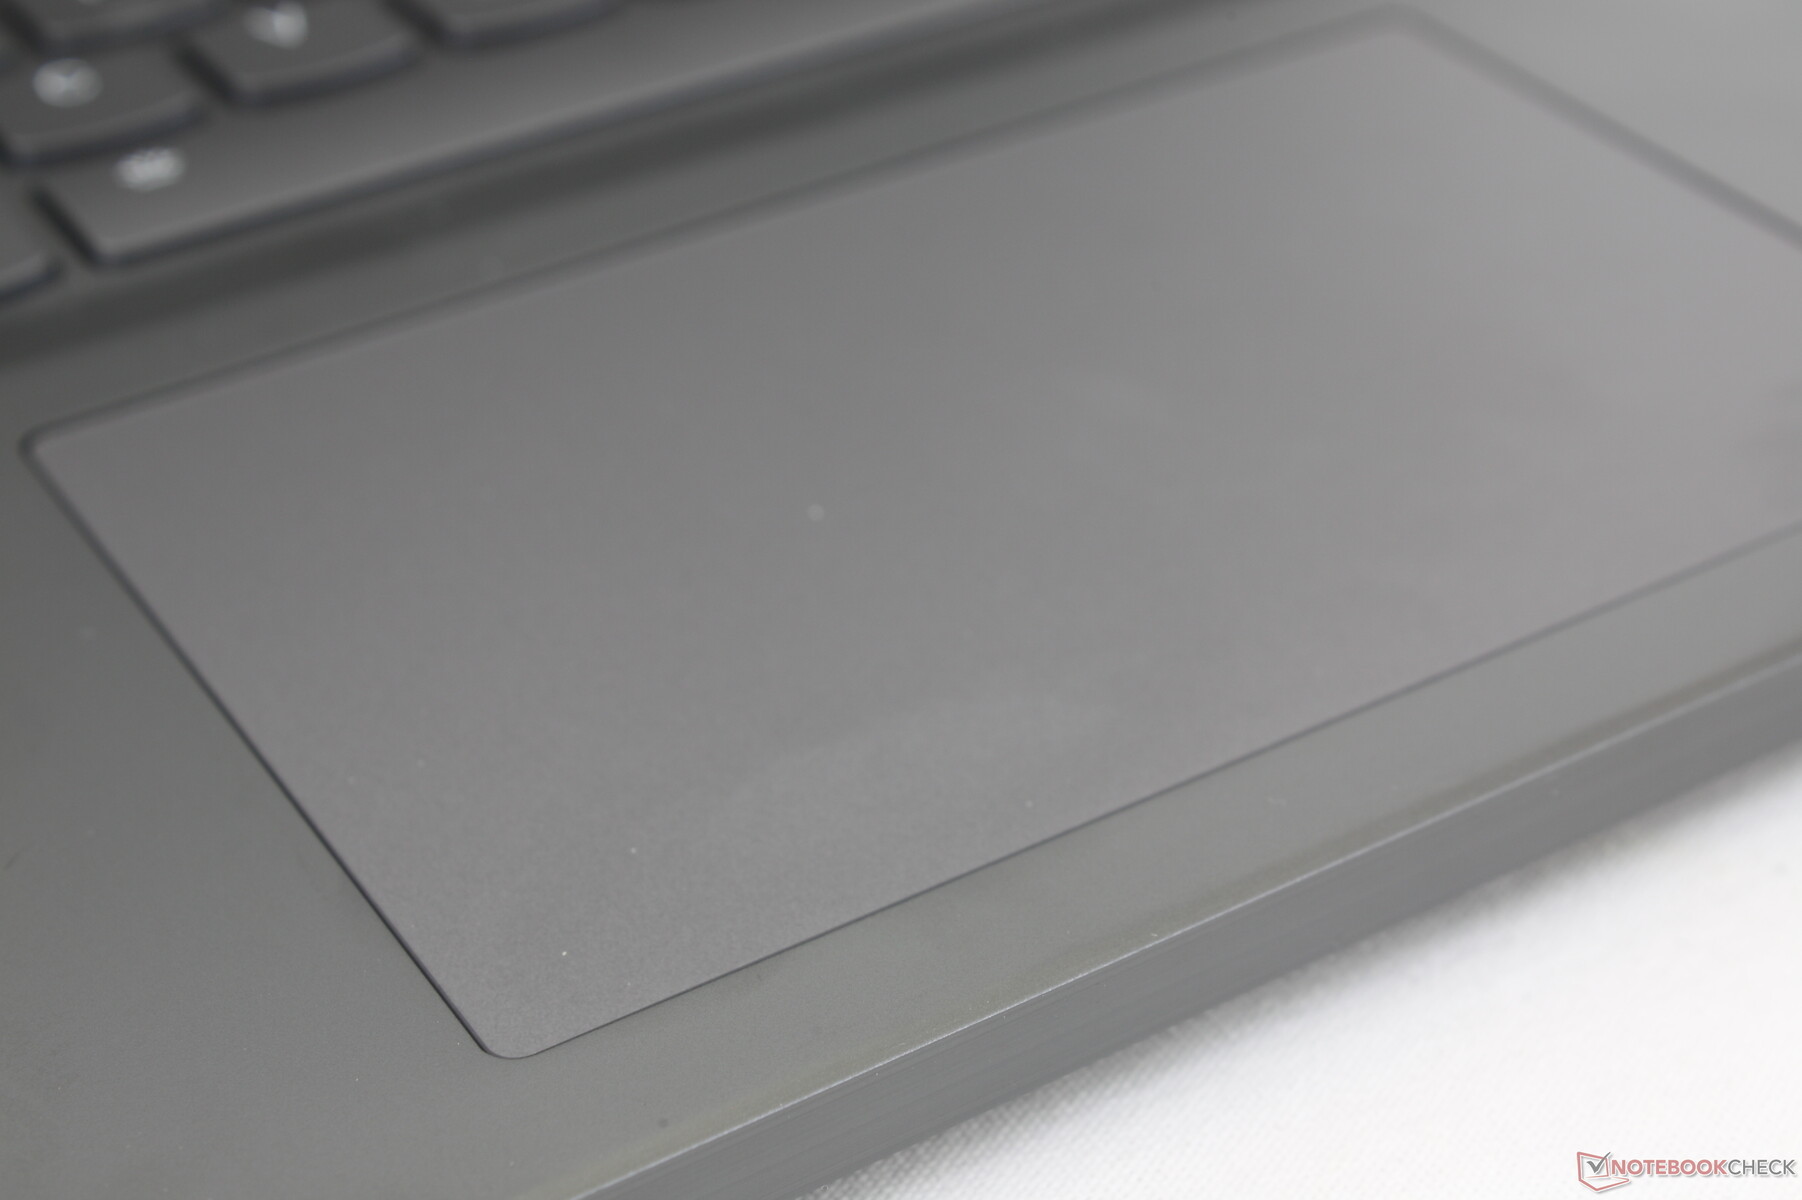
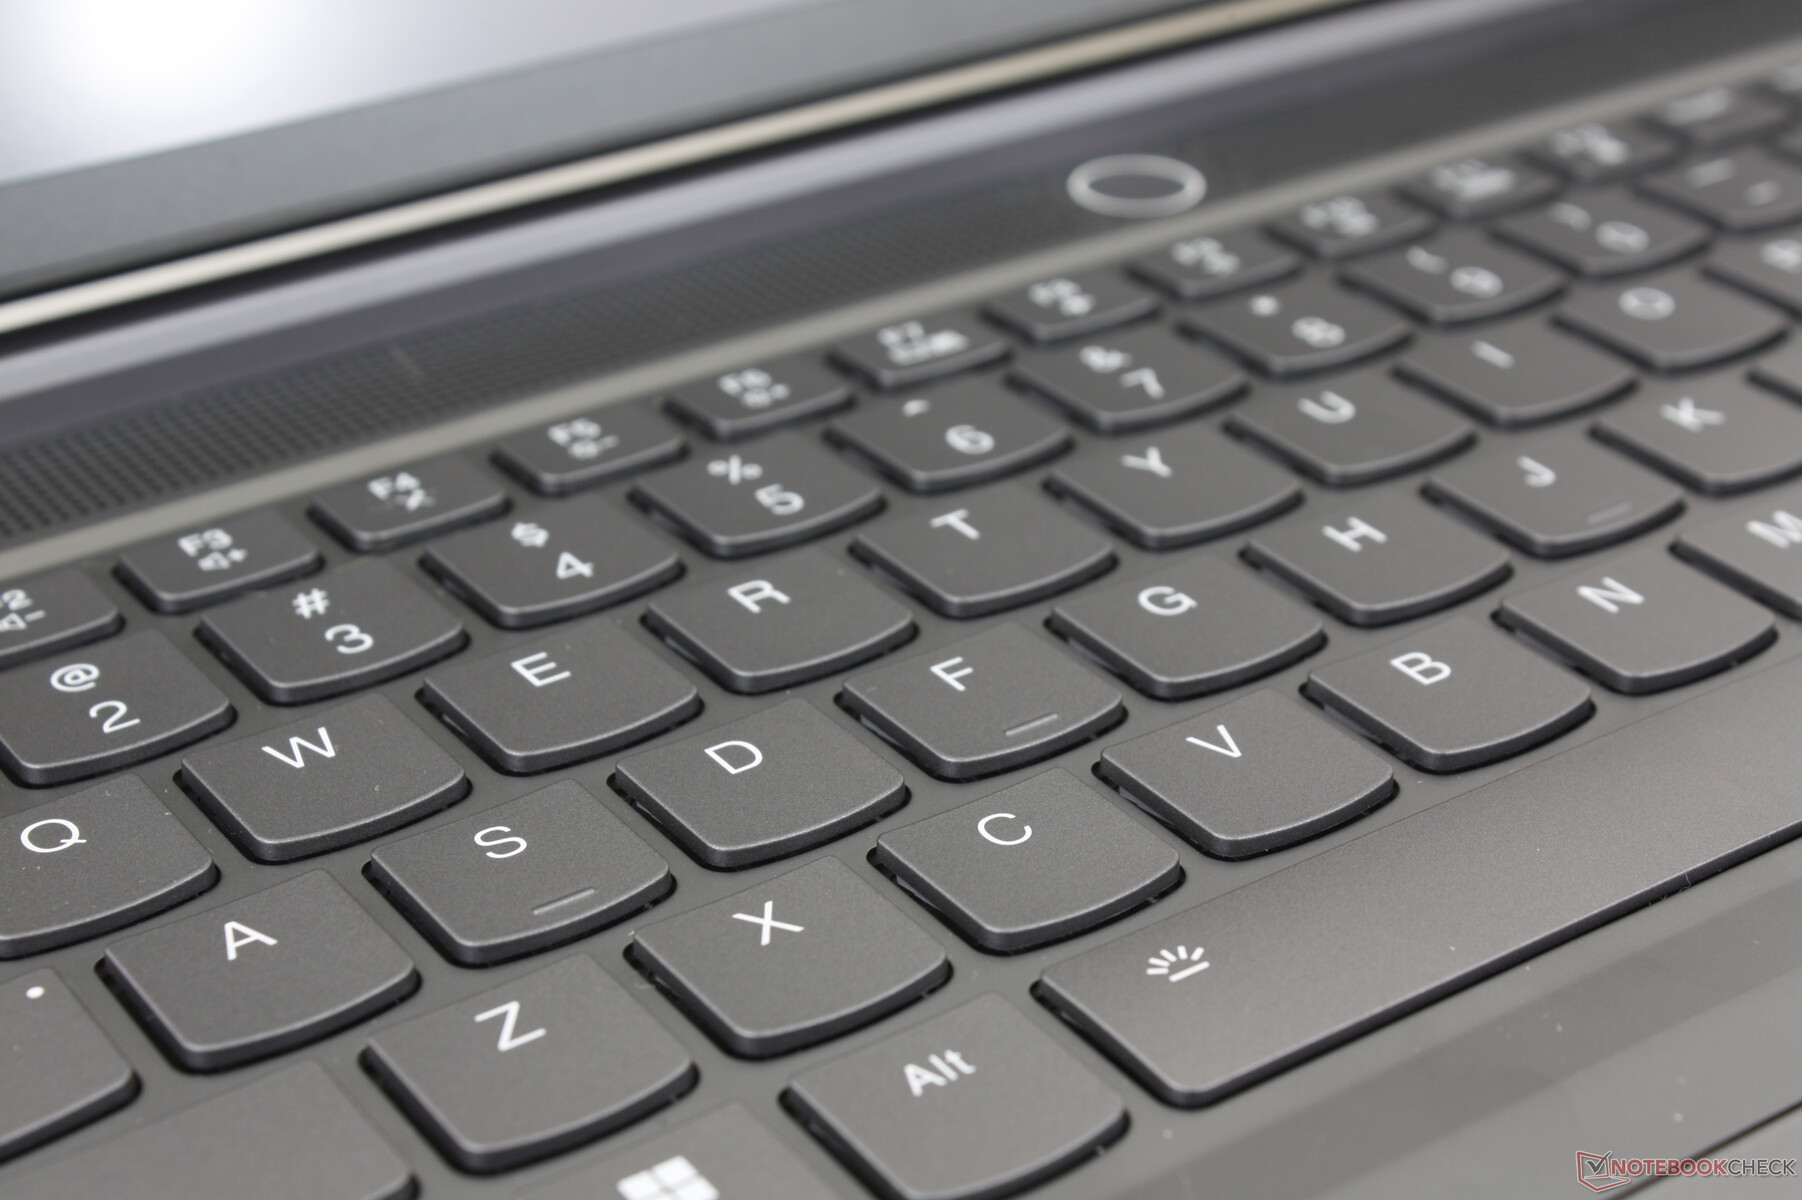
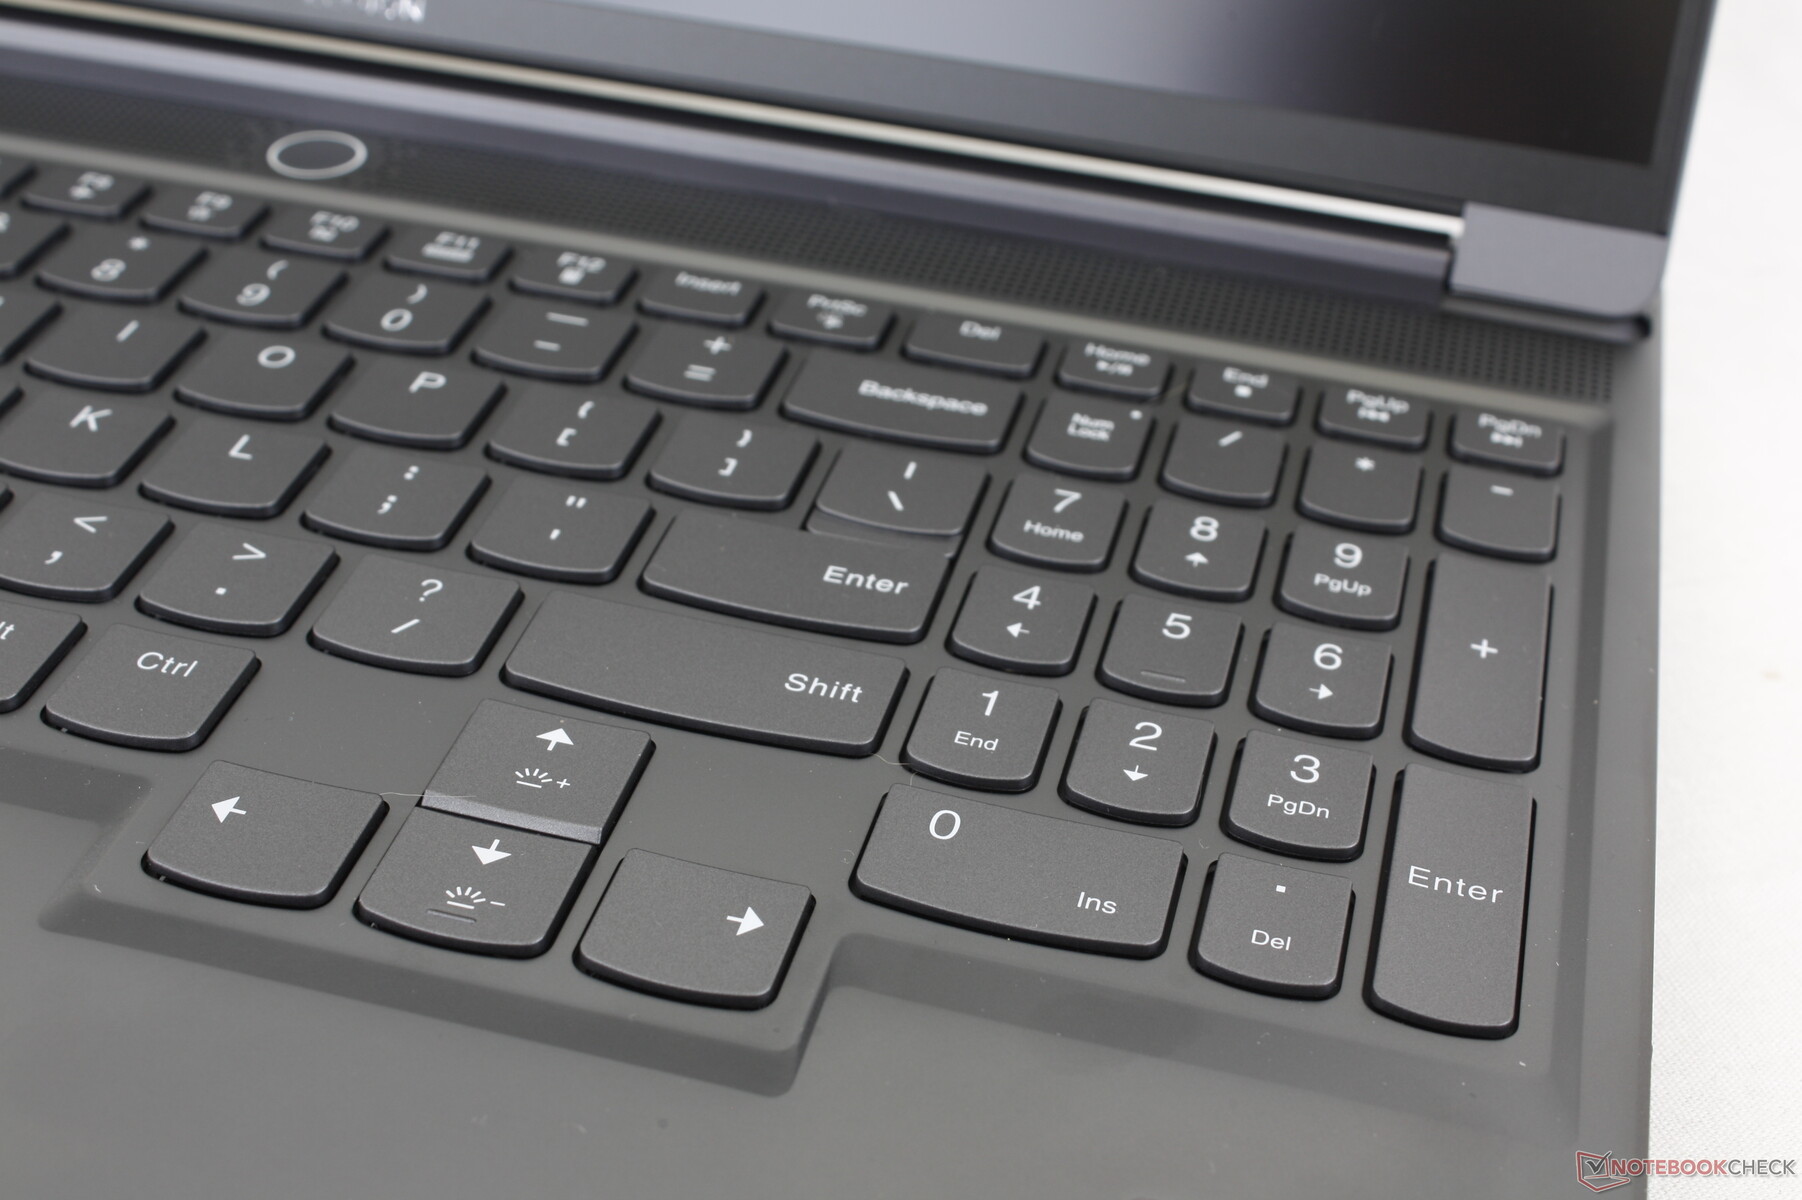
Urządzenia wejściowe - przestronne z podświetleniem RGB dla każdego klawisza
Klawiatura i clickpad nie zmieniły się w porównaniu do zeszłorocznego modelu Legion Slim 7i G7 więc interfejs użytkownika pozostaje taki sam. Niekoniecznie jest to złe, ponieważ skok klawiszy wynoszący 1,5 mm i solidne sprzężenie zwrotne są nadal wygodniejsze podczas pisania w porównaniu do płytszych klawiszy Blade 16. Doceniamy również duże klawisze strzałek, ponieważ te same klawisze są często frustrująco małe w innych laptopach do gier, takich jak Asus ROG Strix lub MSI Pulse.
Wyświetlacz - identyczny jak w Legion Pro 7
Dostępne są dwie opcje paneli, obie z obsługą G-Sync:
- 2560 x 1600, 240 Hz, czas reakcji 5 ms, 100% sRGB, 500 nitów, certyfikat Pantone
- 3000 x 2000, 165 Hz, czas reakcji 3 ms, 100% DCI-P3, 430 nitów, certyfikat Pantone
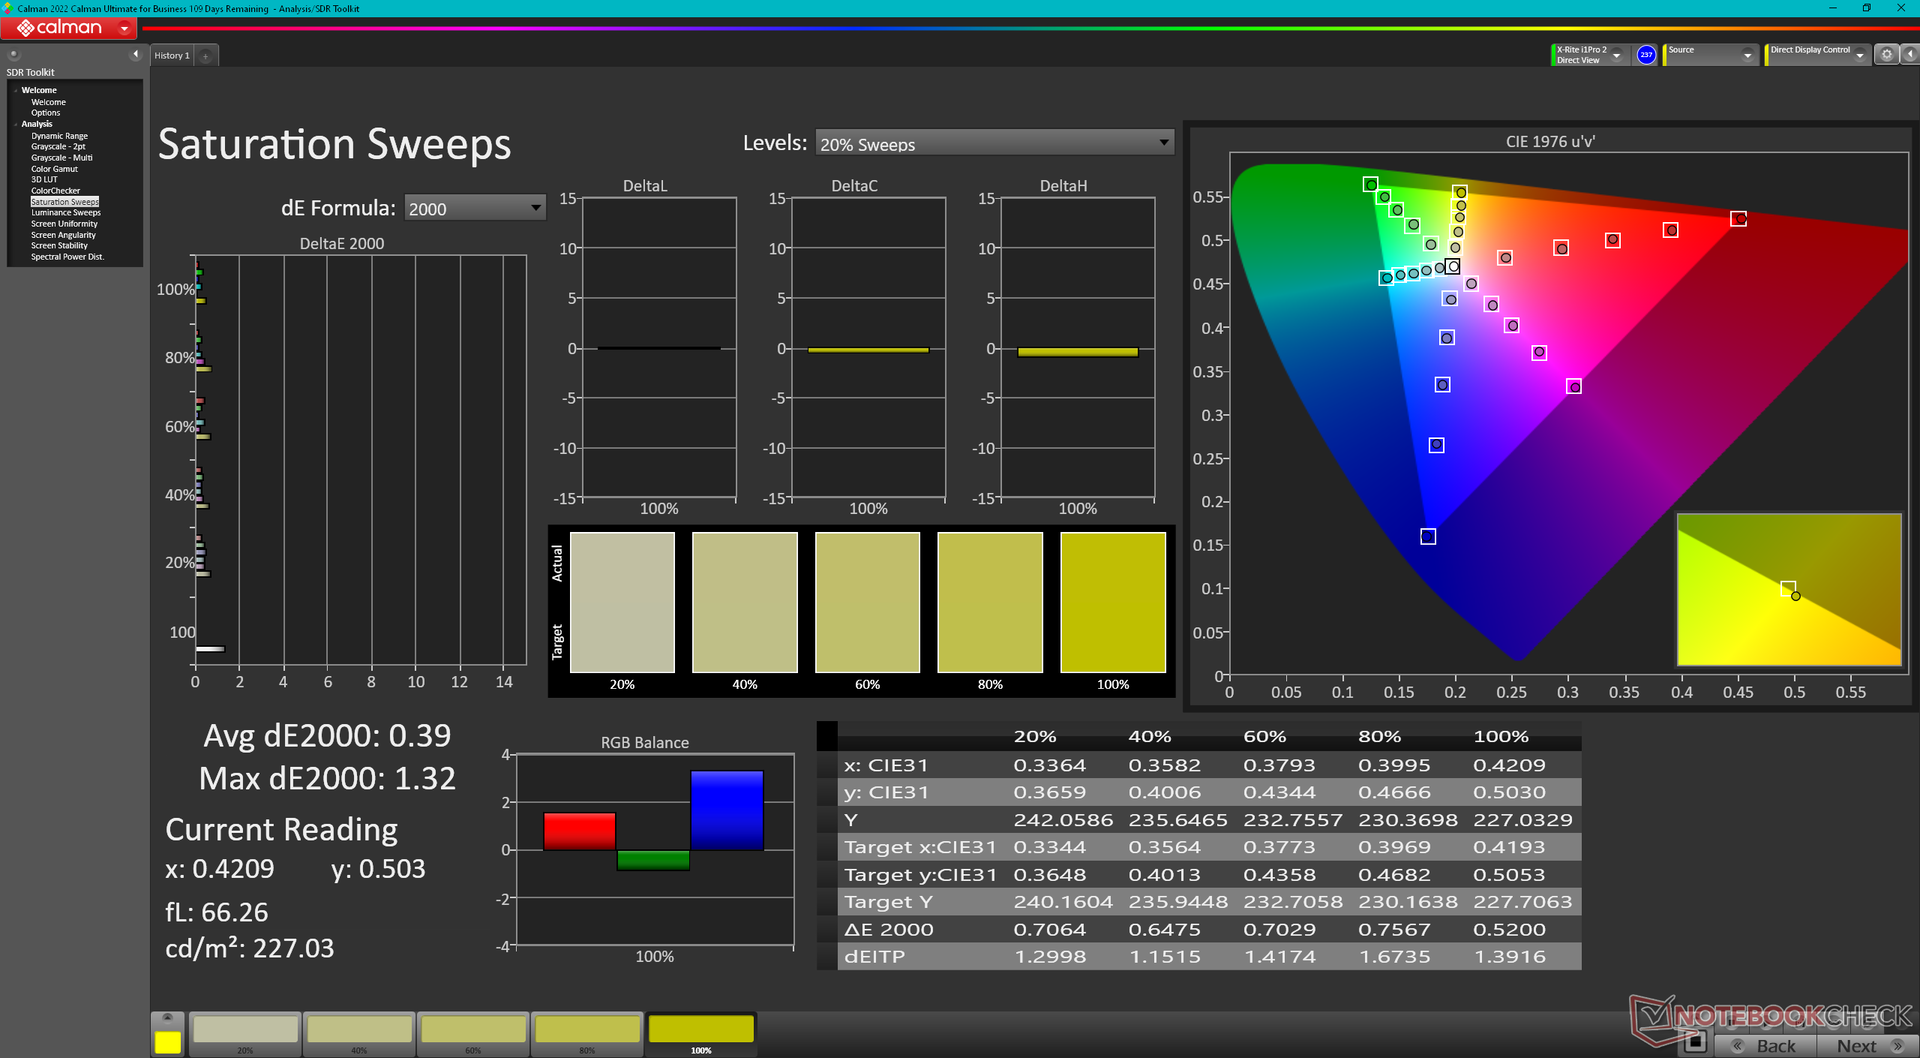
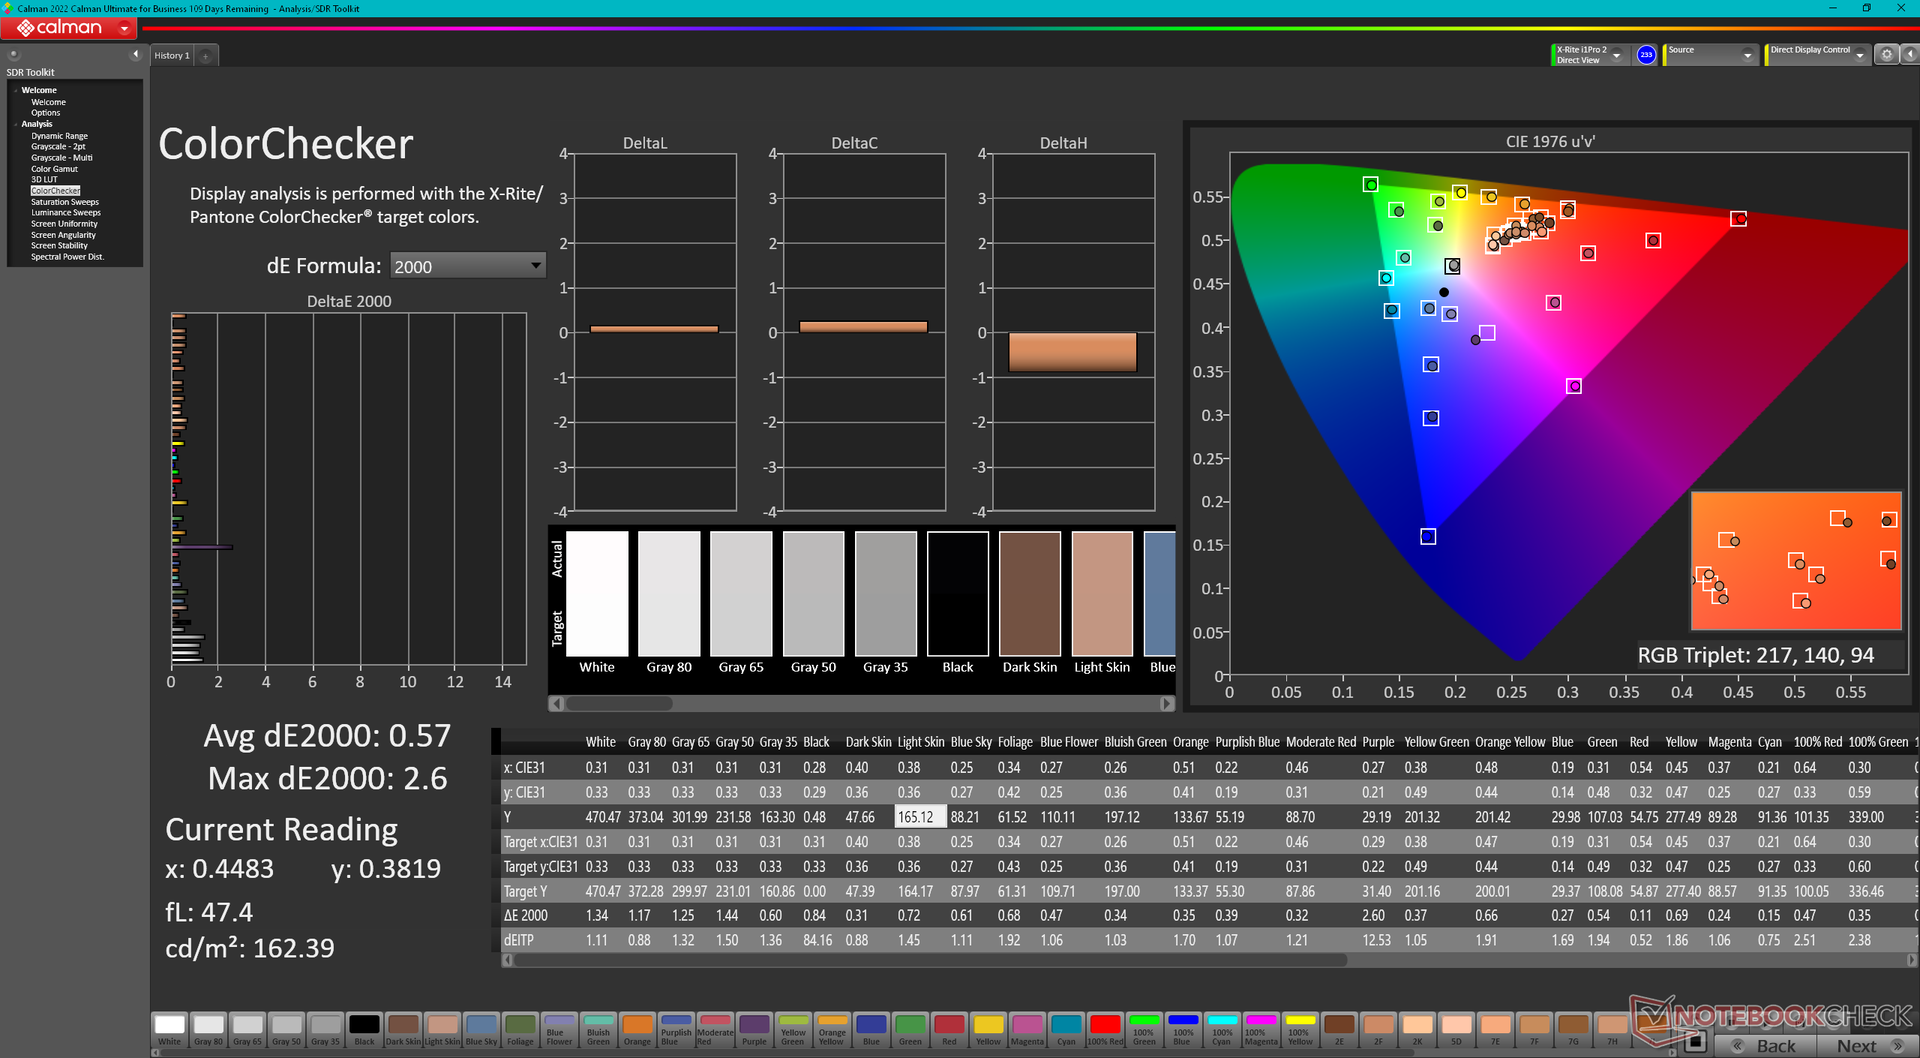
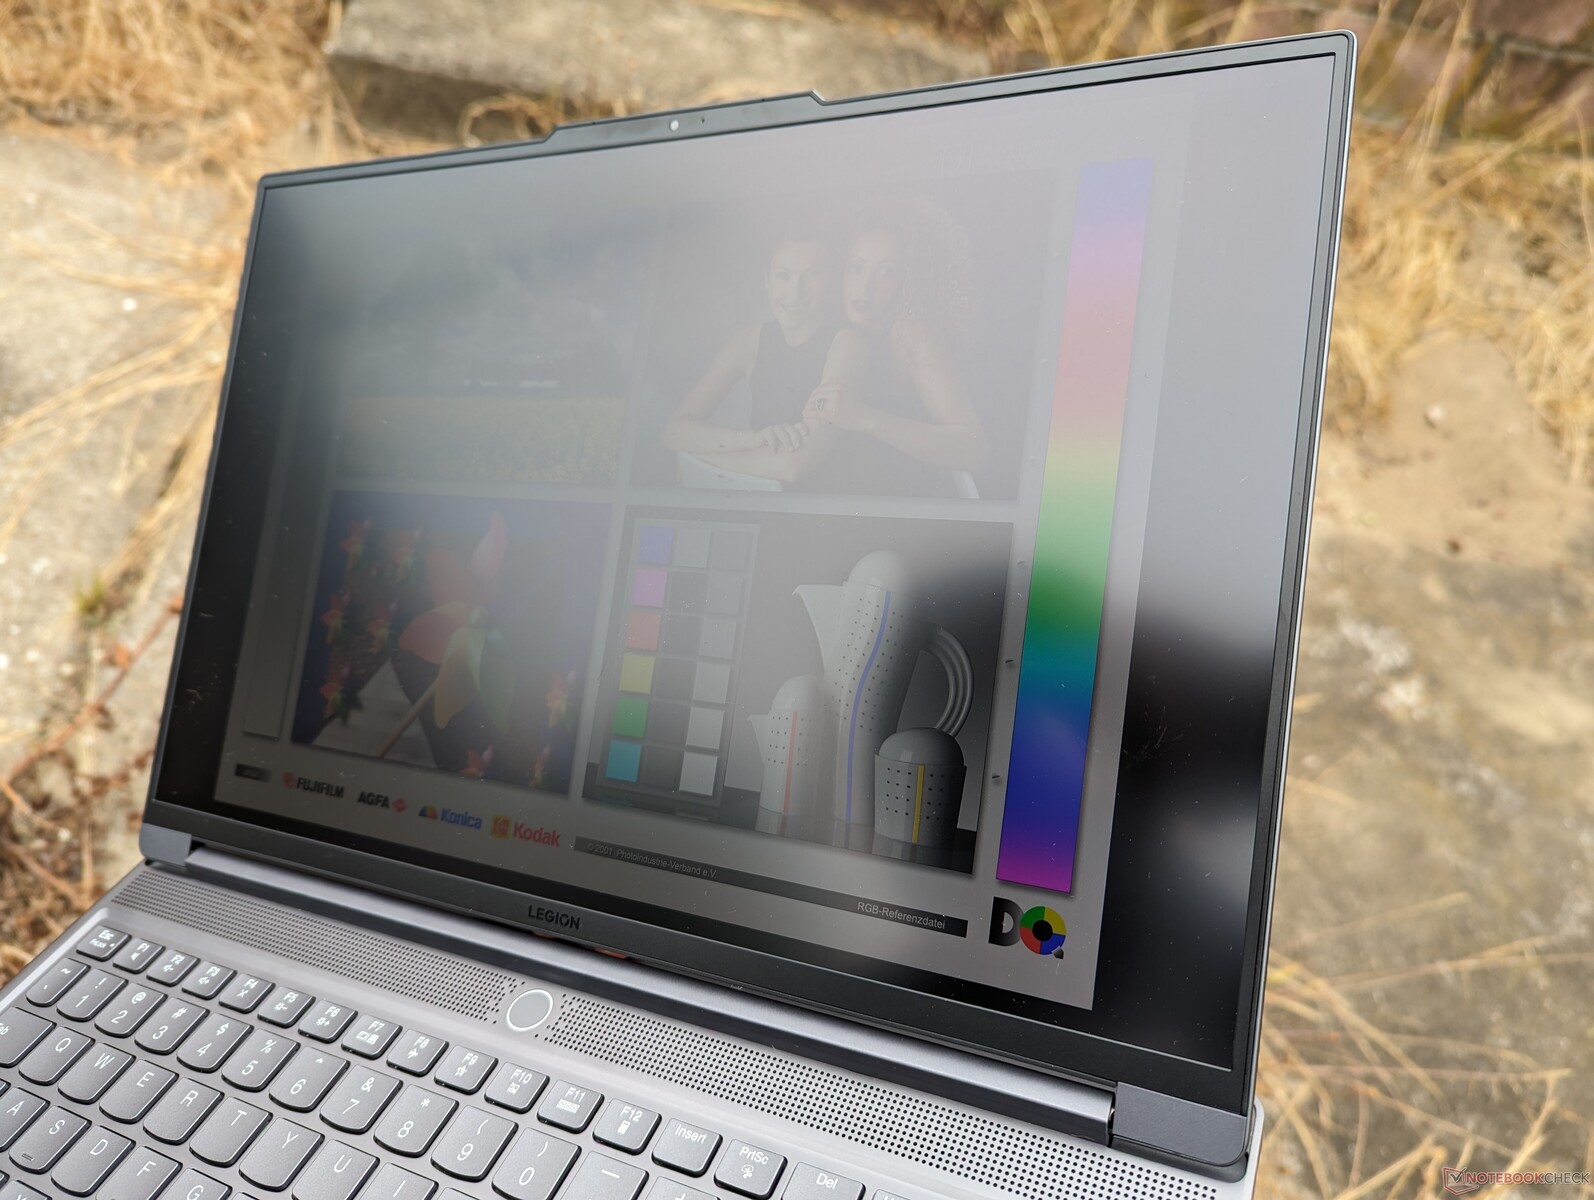
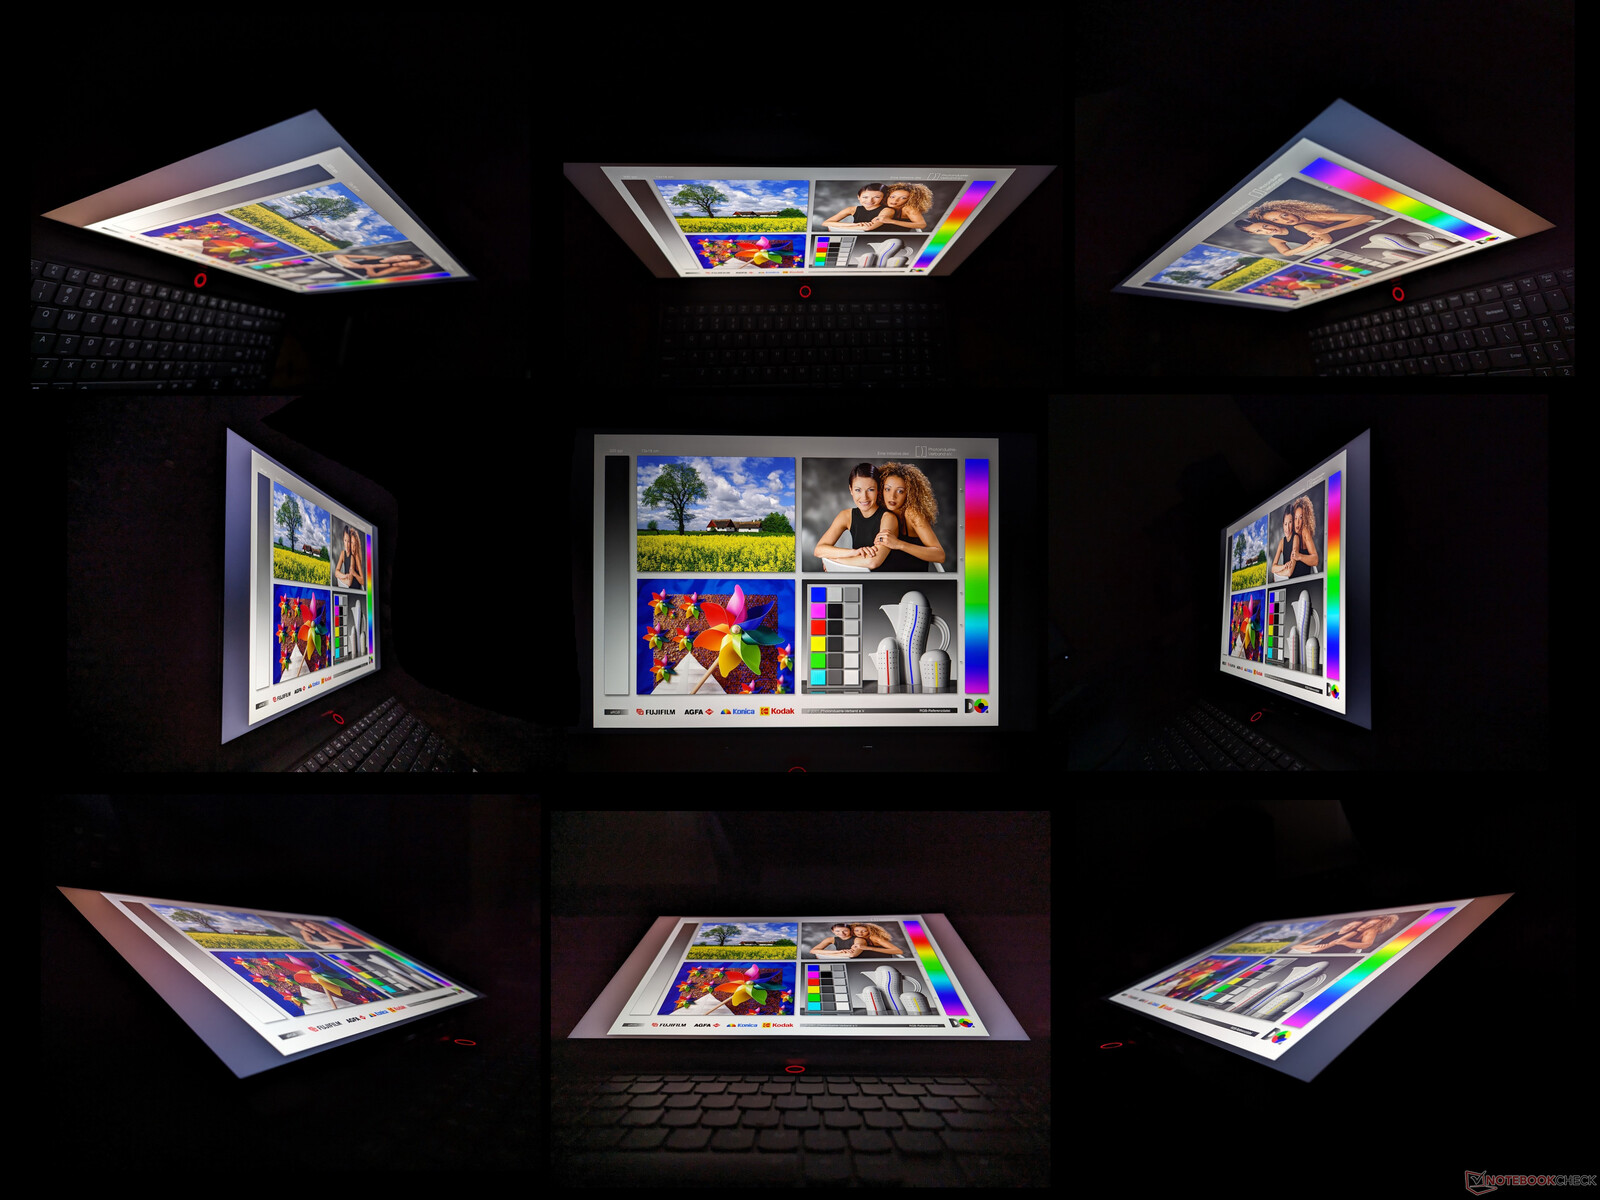
Nasza konfiguracja 1600p jest wyposażona w dokładnie ten sam panel IPS MNG007DA2-3, który można znaleźć w większych i droższych modelach Legion Pro 7 zapewniając identyczne wrażenia wizualne między tymi dwoma modelami. Jest to wysokiej klasy panel nadający się zarówno do gier, jak i amatorskiej edycji grafiki, mimo że jest to opcja podstawowa. Krwawienie podświetlenia jest jednak bardziej zauważalne niż byśmy chcieli, co pokazuje poniższy zrzut ekranu.


| |||||||||||||||||||||||||
rozświetlenie: 86 %
na akumulatorze: 474.6 cd/m²
kontrast: 1217:1 (czerń: 0.39 cd/m²)
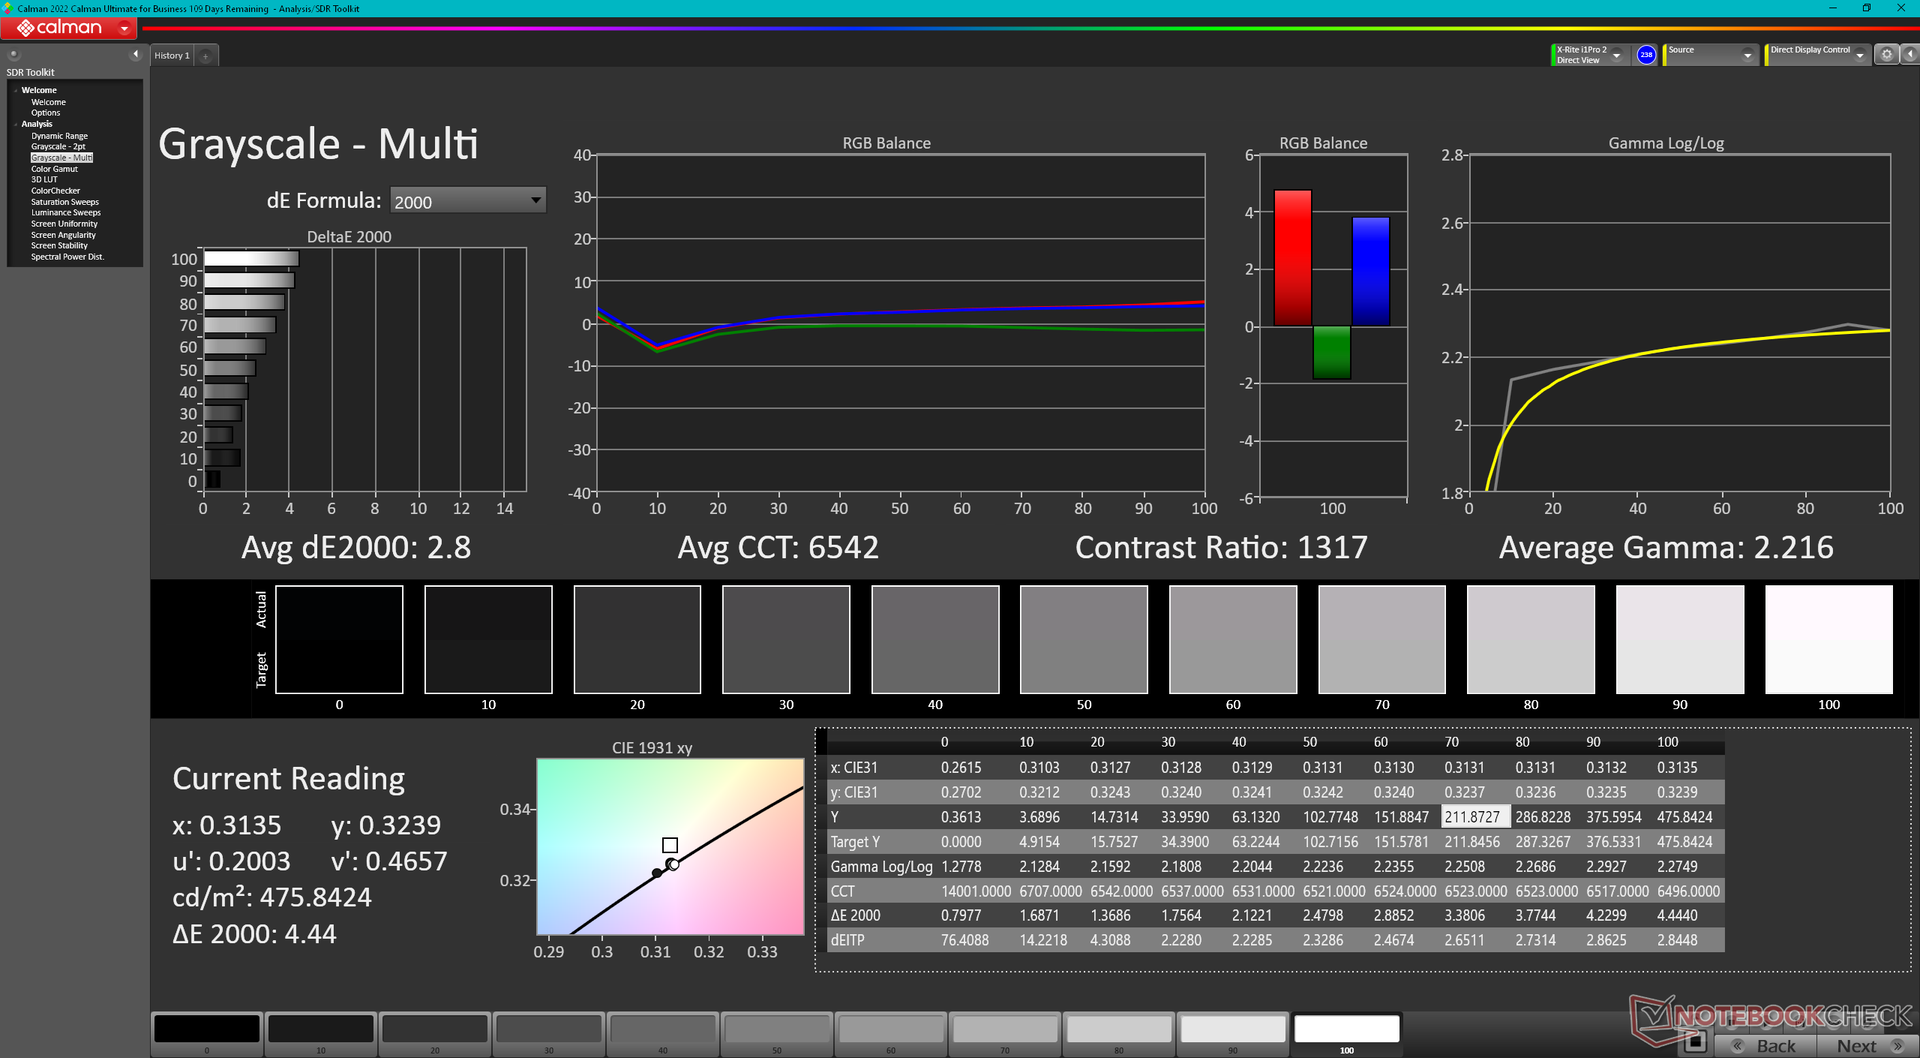
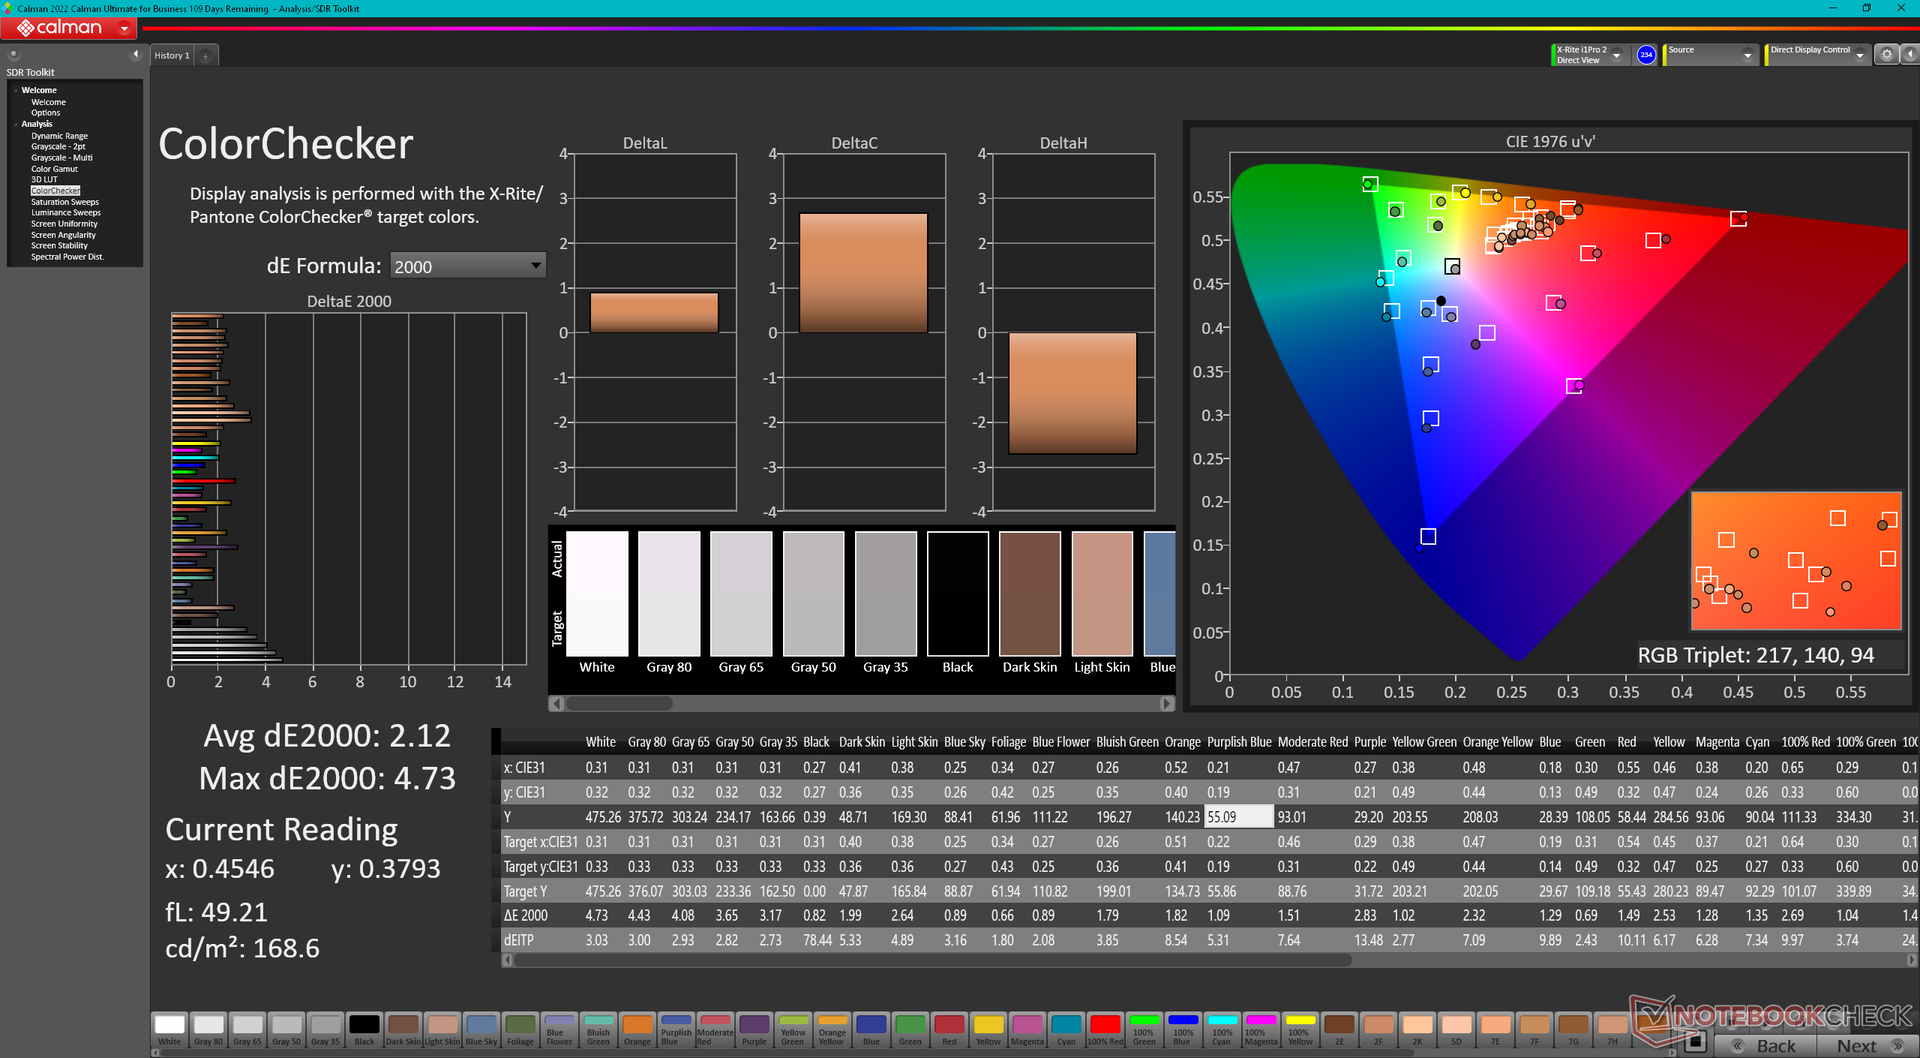
ΔE ColorChecker Calman: 2.12 | ∀{0.5-29.43 Ø4.73}
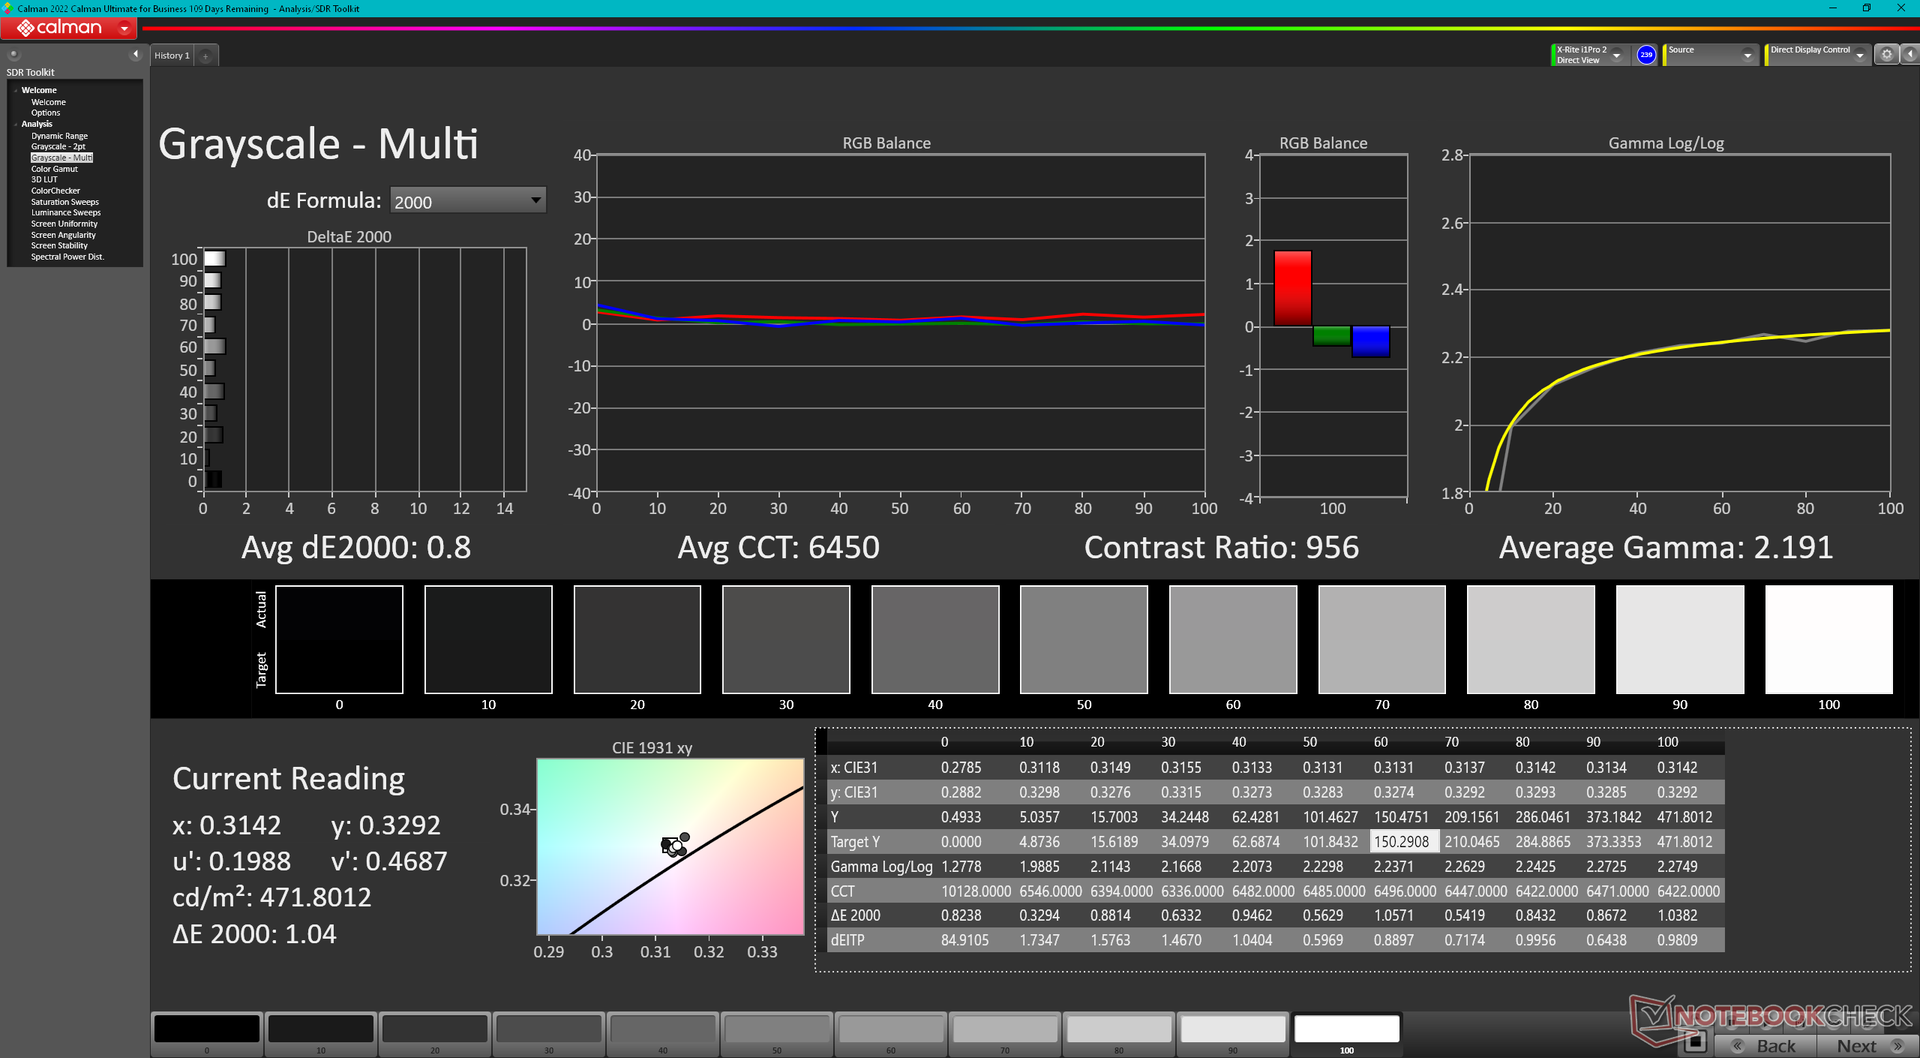
calibrated: 0.57
ΔE Greyscale Calman: 2.8 | ∀{0.09-98 Ø4.97}
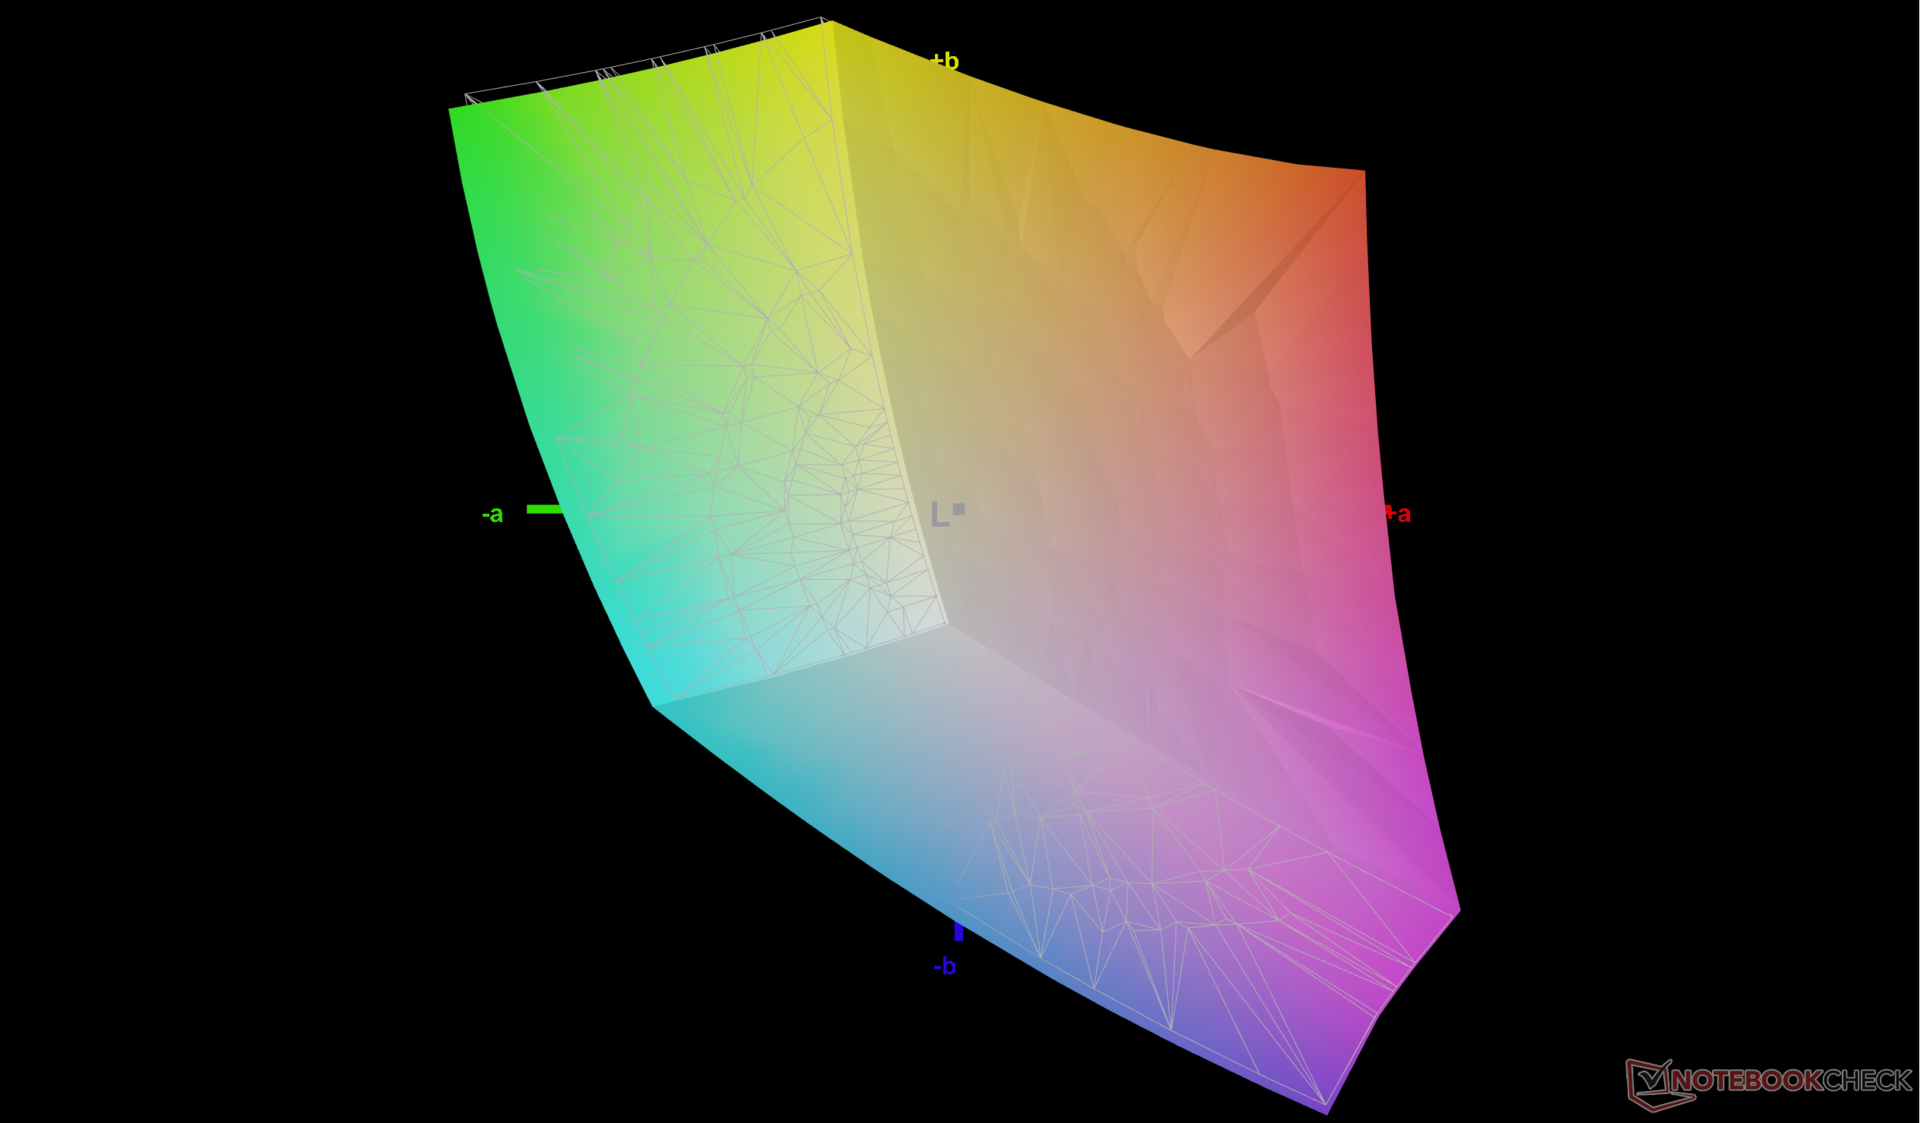
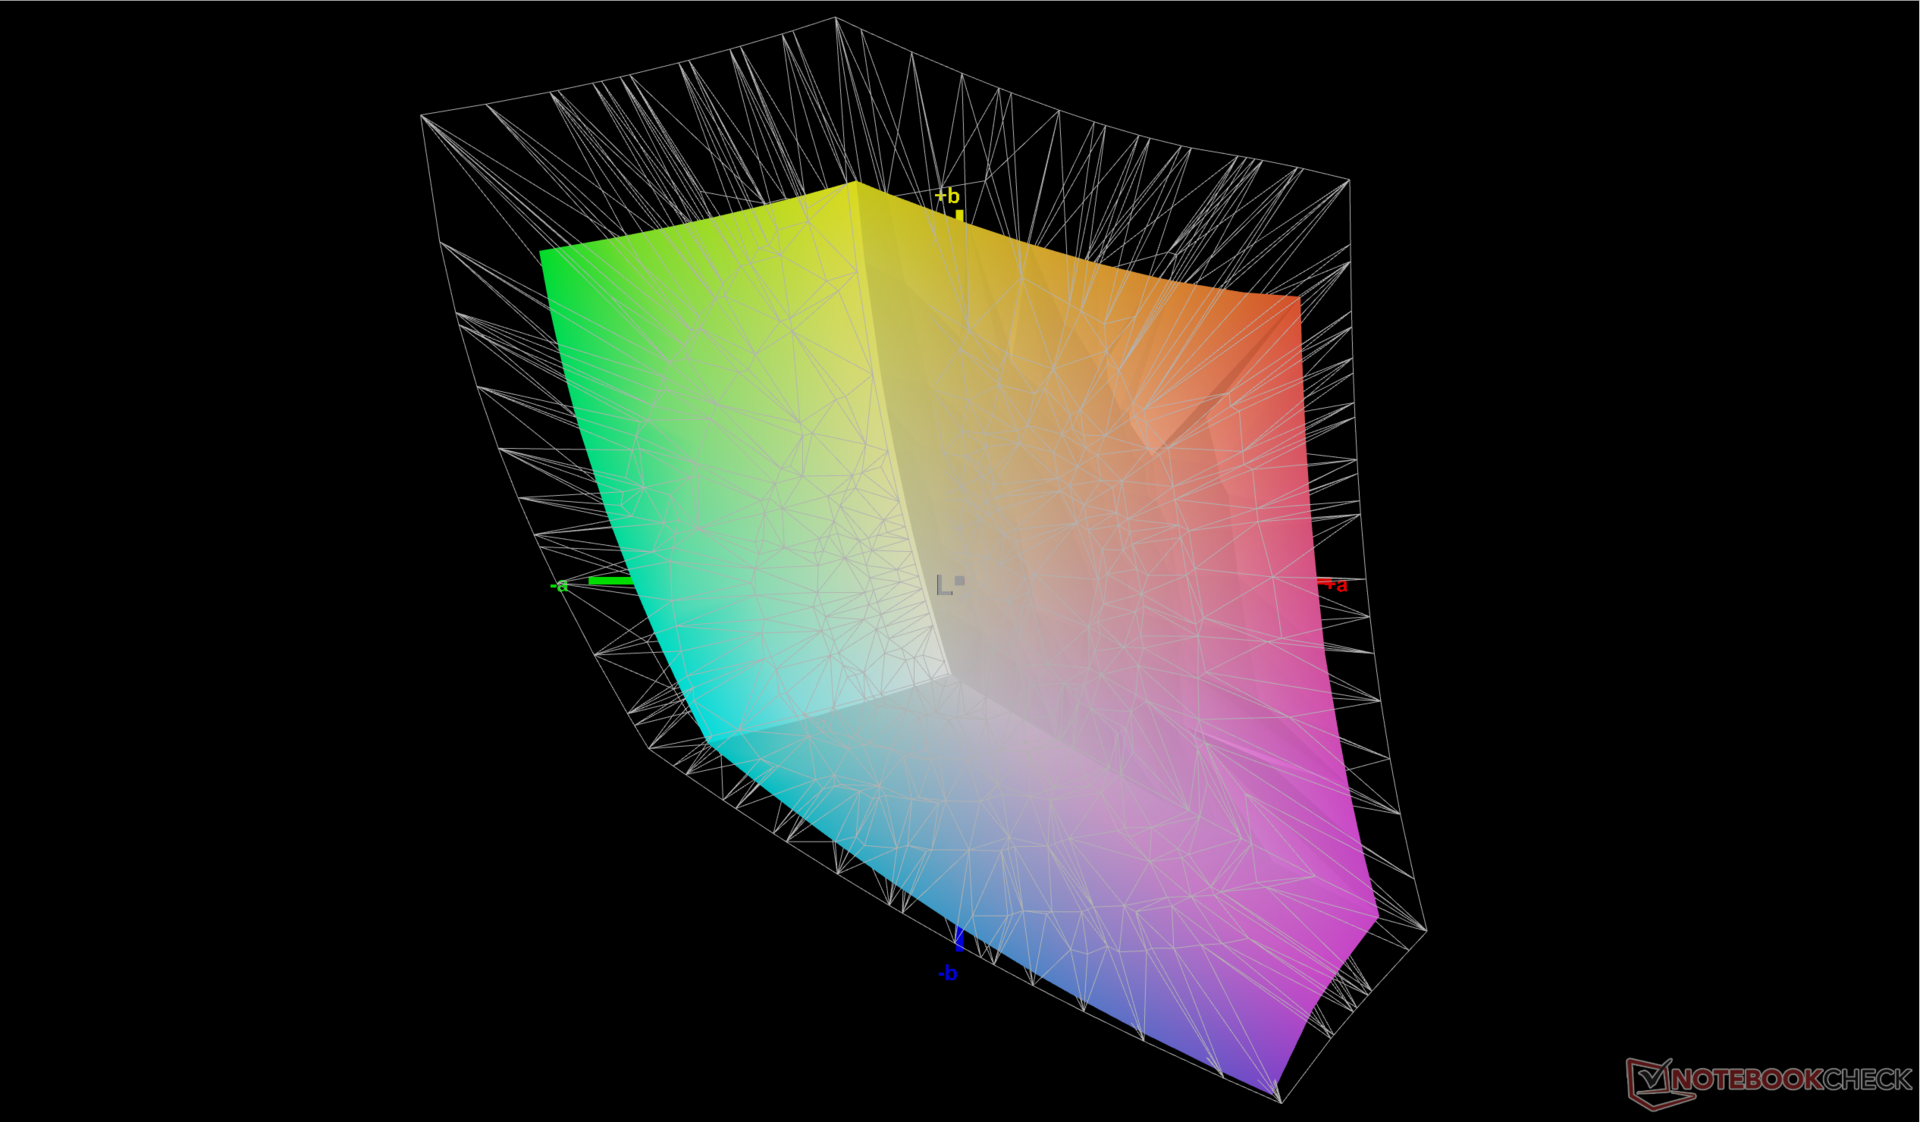
72.5% AdobeRGB 1998 (Argyll 3D)
99.4% sRGB (Argyll 3D)
70.4% Display P3 (Argyll 3D)
Gamma: 2.22
CCT: 6542 K
| Lenovo Legion Slim 7i 16 Gen 8 CSOT T3 MNG007DA2-3, IPS, 2560x1600, 16" | HP Omen 16-wf000 BOE0B7D, IPS, 2560x1440, 16.1" | Alienware x16 R1 BOE NE16NZ4, IPS, 2560x1600, 16" | Lenovo Legion Pro 7 RTX4090 MNG007DA2-3 (CSO1628), IPS, 2560x1600, 16" | Asus ROG Strix G16 G614JZ TL160ADMP03-0, IPS, 2560x1600, 16" | Razer Blade 16 Early 2023 CSOT T3 MNG007DA4-1, IPS, 2560x1600, 16" | |
|---|---|---|---|---|---|---|
| Display | -1% | 21% | -1% | 19% | 22% | |
| Display P3 Coverage (%) | 70.4 | 69 -2% | 99.2 41% | 69.5 -1% | 97 38% | 98.5 40% |
| sRGB Coverage (%) | 99.4 | 99.2 0% | 100 1% | 99.8 0% | 99.9 1% | 100 1% |
| AdobeRGB 1998 Coverage (%) | 72.5 | 71.2 -2% | 88.6 22% | 71.6 -1% | 84.9 17% | 89.7 24% |
| Response Times | 27% | 21% | 29% | 42% | 5% | |
| Response Time Grey 50% / Grey 80% * (ms) | 12 ? | 4.6 ? 62% | 5.1 ? 57% | 10.9 ? 9% | 5.1 ? 57% | 6.6 ? 45% |
| Response Time Black / White * (ms) | 8.9 ? | 9.7 ? -9% | 10.3 ? -16% | 4.6 ? 48% | 6.6 ? 26% | 12 ? -35% |
| PWM Frequency (Hz) | ||||||
| Screen | -5% | -11% | -5% | -4% | -12% | |
| Brightness middle (cd/m²) | 474.6 | 310.9 -34% | 302.2 -36% | 491 3% | 470 -1% | 456.8 -4% |
| Brightness (cd/m²) | 445 | 296 -33% | 285 -36% | 472 6% | 459 3% | 437 -2% |
| Brightness Distribution (%) | 86 | 91 6% | 89 3% | 91 6% | 93 8% | 83 -3% |
| Black Level * (cd/m²) | 0.39 | 0.35 10% | 0.26 33% | 0.4 -3% | 0.42 -8% | 0.35 10% |
| Contrast (:1) | 1217 | 888 -27% | 1162 -5% | 1228 1% | 1119 -8% | 1305 7% |
| Colorchecker dE 2000 * | 2.12 | 2.18 -3% | 1.63 23% | 1.6 25% | 1.86 12% | 3.7 -75% |
| Colorchecker dE 2000 max. * | 4.73 | 3.58 24% | 4.13 13% | 5.15 -9% | 3.87 18% | 6.42 -36% |
| Colorchecker dE 2000 calibrated * | 0.57 | 0.52 9% | 1.17 -105% | 0.97 -70% | 0.93 -63% | 0.66 -16% |
| Greyscale dE 2000 * | 2.8 | 2.8 -0% | 2.5 11% | 3 -7% | 2.7 4% | 2.6 7% |
| Gamma | 2.22 99% | 2.18 101% | 2.23 99% | 2.211 100% | 2.246 98% | 2.3 96% |
| CCT | 6542 99% | 6002 108% | 6590 99% | 6979 93% | 6711 97% | 6108 106% |
| Całkowita średnia (program / ustawienia) | 7% /
0% | 10% /
0% | 8% /
1% | 19% /
7% | 5% /
-3% |
* ... im mniej tym lepiej
Wyświetlacz jest wstępnie skalibrowany ze średnimi wartościami deltaE w skali szarości i kolorów wynoszącymi odpowiednio 2,8 i 2,12. Samodzielna kalibracja za pomocą kolorymetru X-Rite jeszcze bardziej poprawiłaby te średnie wartości, odpowiednio do 0,8 i 0,57. Kalibracja przez użytkownika końcowego nie jest więc całkowicie konieczna, niemniej jednak nasz skalibrowany profil ICM jest dostępny powyżej za darmo dla zainteresowanych użytkowników.
Wyświetl czasy reakcji
| ↔ Czas reakcji od czerni do bieli | ||
|---|---|---|
| 8.9 ms ... wzrost ↗ i spadek ↘ łącznie | ↗ 5.1 ms wzrost | 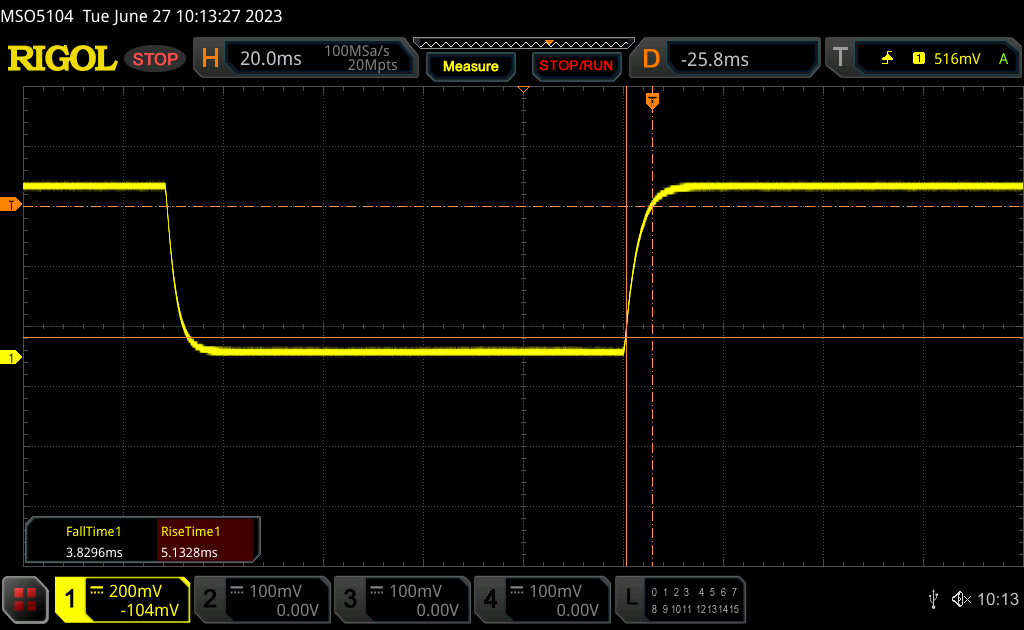 |
| ↘ 3.8 ms upadek | ||
| W naszych testach ekran wykazuje szybki czas reakcji i powinien nadawać się do gier. Dla porównania, wszystkie testowane urządzenia wahają się od 0.1 (minimum) do 240 (maksimum) ms. » 25 % wszystkich urządzeń jest lepszych. Oznacza to, że zmierzony czas reakcji jest lepszy od średniej wszystkich testowanych urządzeń (19.9 ms). | ||
| ↔ Czas reakcji 50% szarości do 80% szarości | ||
| 12 ms ... wzrost ↗ i spadek ↘ łącznie | ↗ 6 ms wzrost | 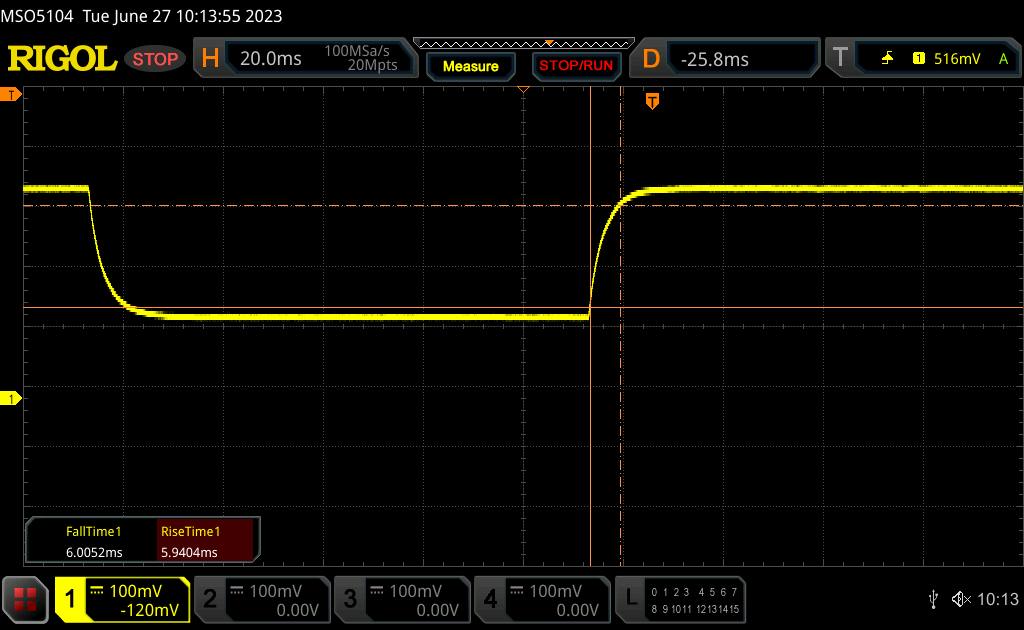 |
| ↘ 6 ms upadek | ||
| W naszych testach ekran wykazuje dobry współczynnik reakcji, ale może być zbyt wolny dla graczy rywalizujących ze sobą. Dla porównania, wszystkie testowane urządzenia wahają się od 0.165 (minimum) do 636 (maksimum) ms. » 25 % wszystkich urządzeń jest lepszych. Oznacza to, że zmierzony czas reakcji jest lepszy od średniej wszystkich testowanych urządzeń (31.1 ms). | ||
Migotanie ekranu / PWM (modulacja szerokości impulsu)
| Migotanie ekranu/nie wykryto PWM | 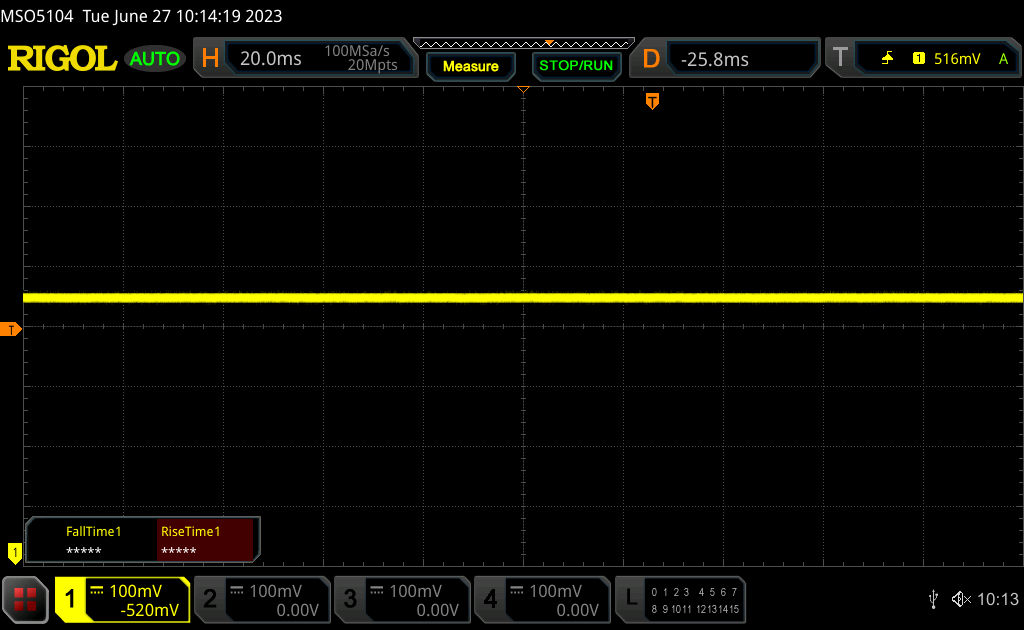 | ||
Dla porównania: 52 % wszystkich testowanych urządzeń nie używa PWM do przyciemniania wyświetlacza. Jeśli wykryto PWM, zmierzono średnio 7791 (minimum: 5 - maksimum: 343500) Hz. | |||
Wyświetlacz jest zauważalnie jaśniejszy niż wOmen 16 lub Alienware x16 R1 dla łatwiejszej czytelności na zewnątrz. W rzeczywistości jego maksymalne ustawienie jasności jest tylko o około 10 procent słabsze niż w MacBook Pro 16.
Wydajność - Core i9 13. generacji
Warunki testowania
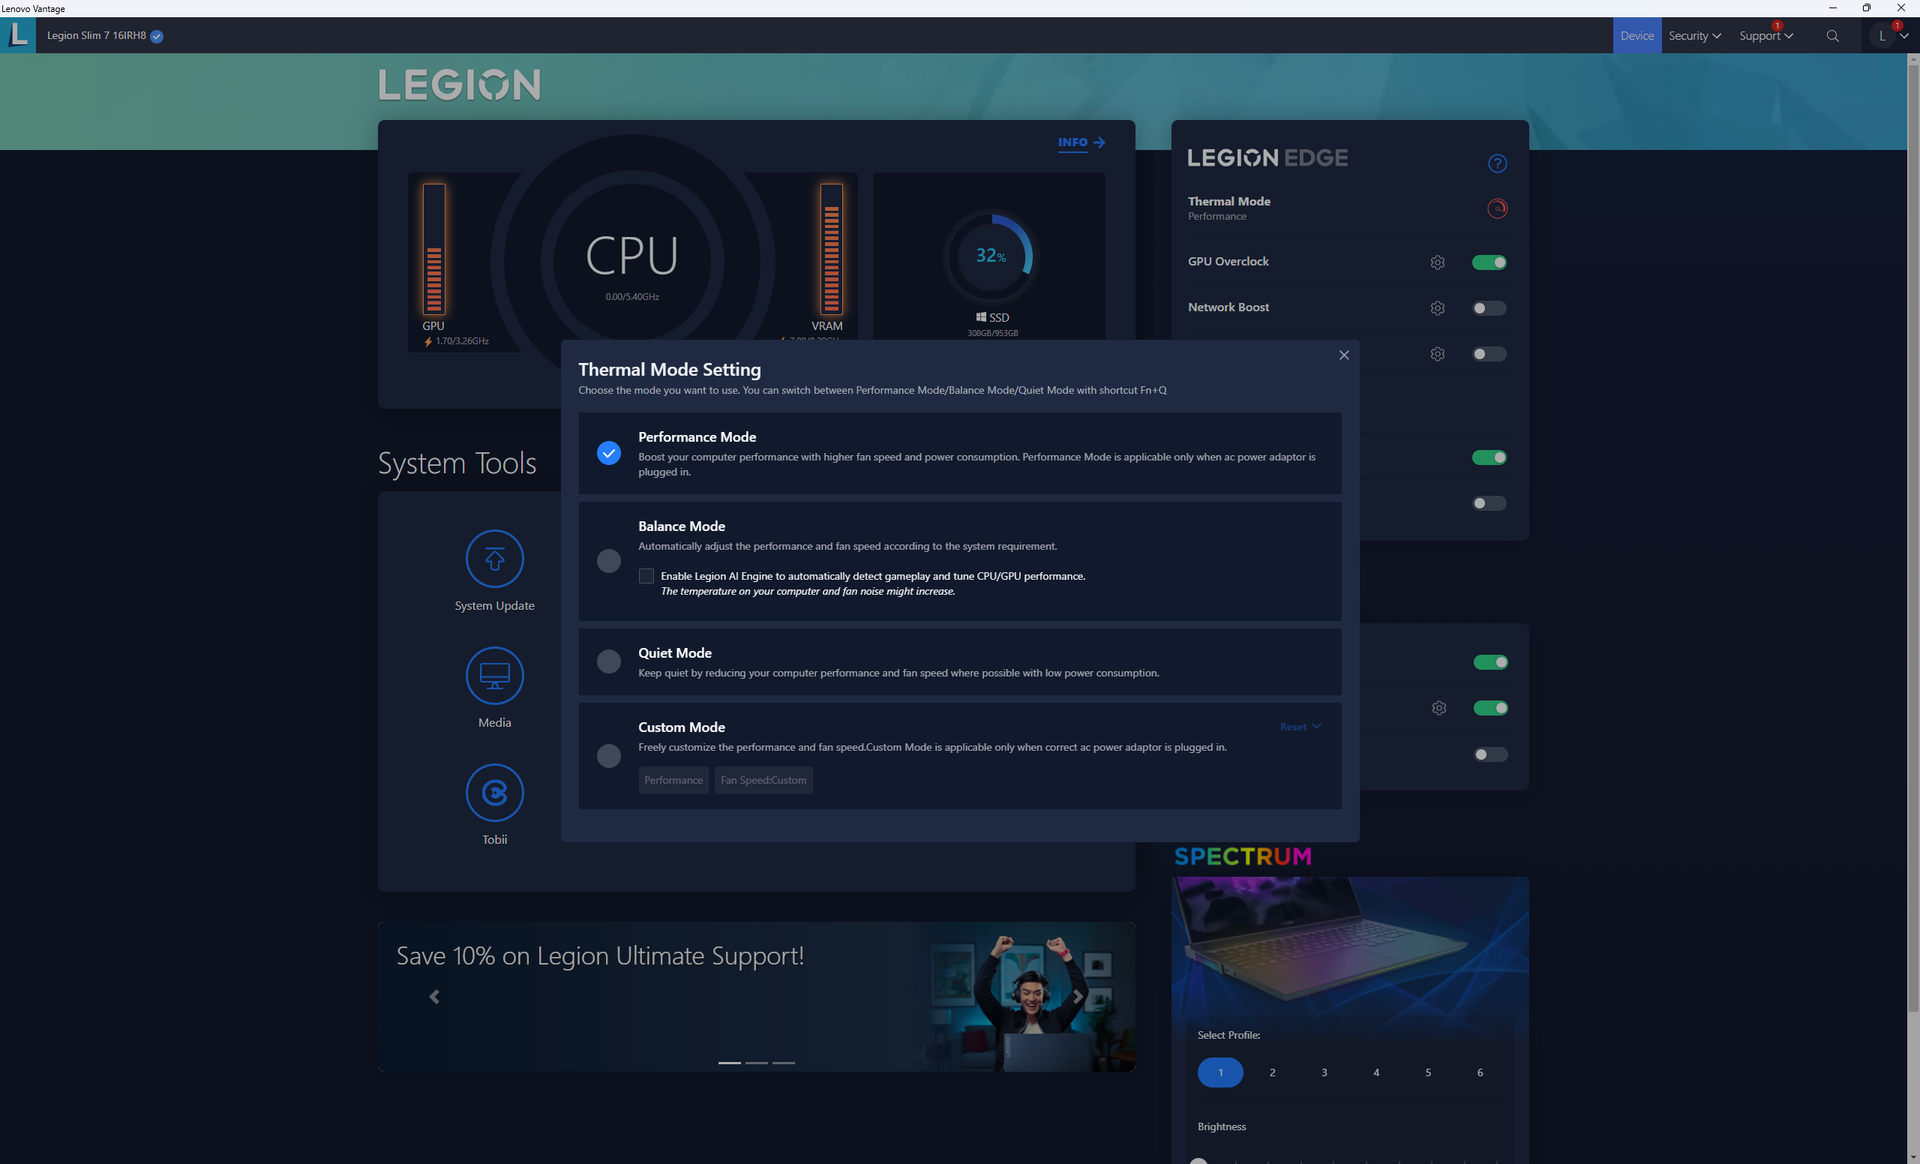
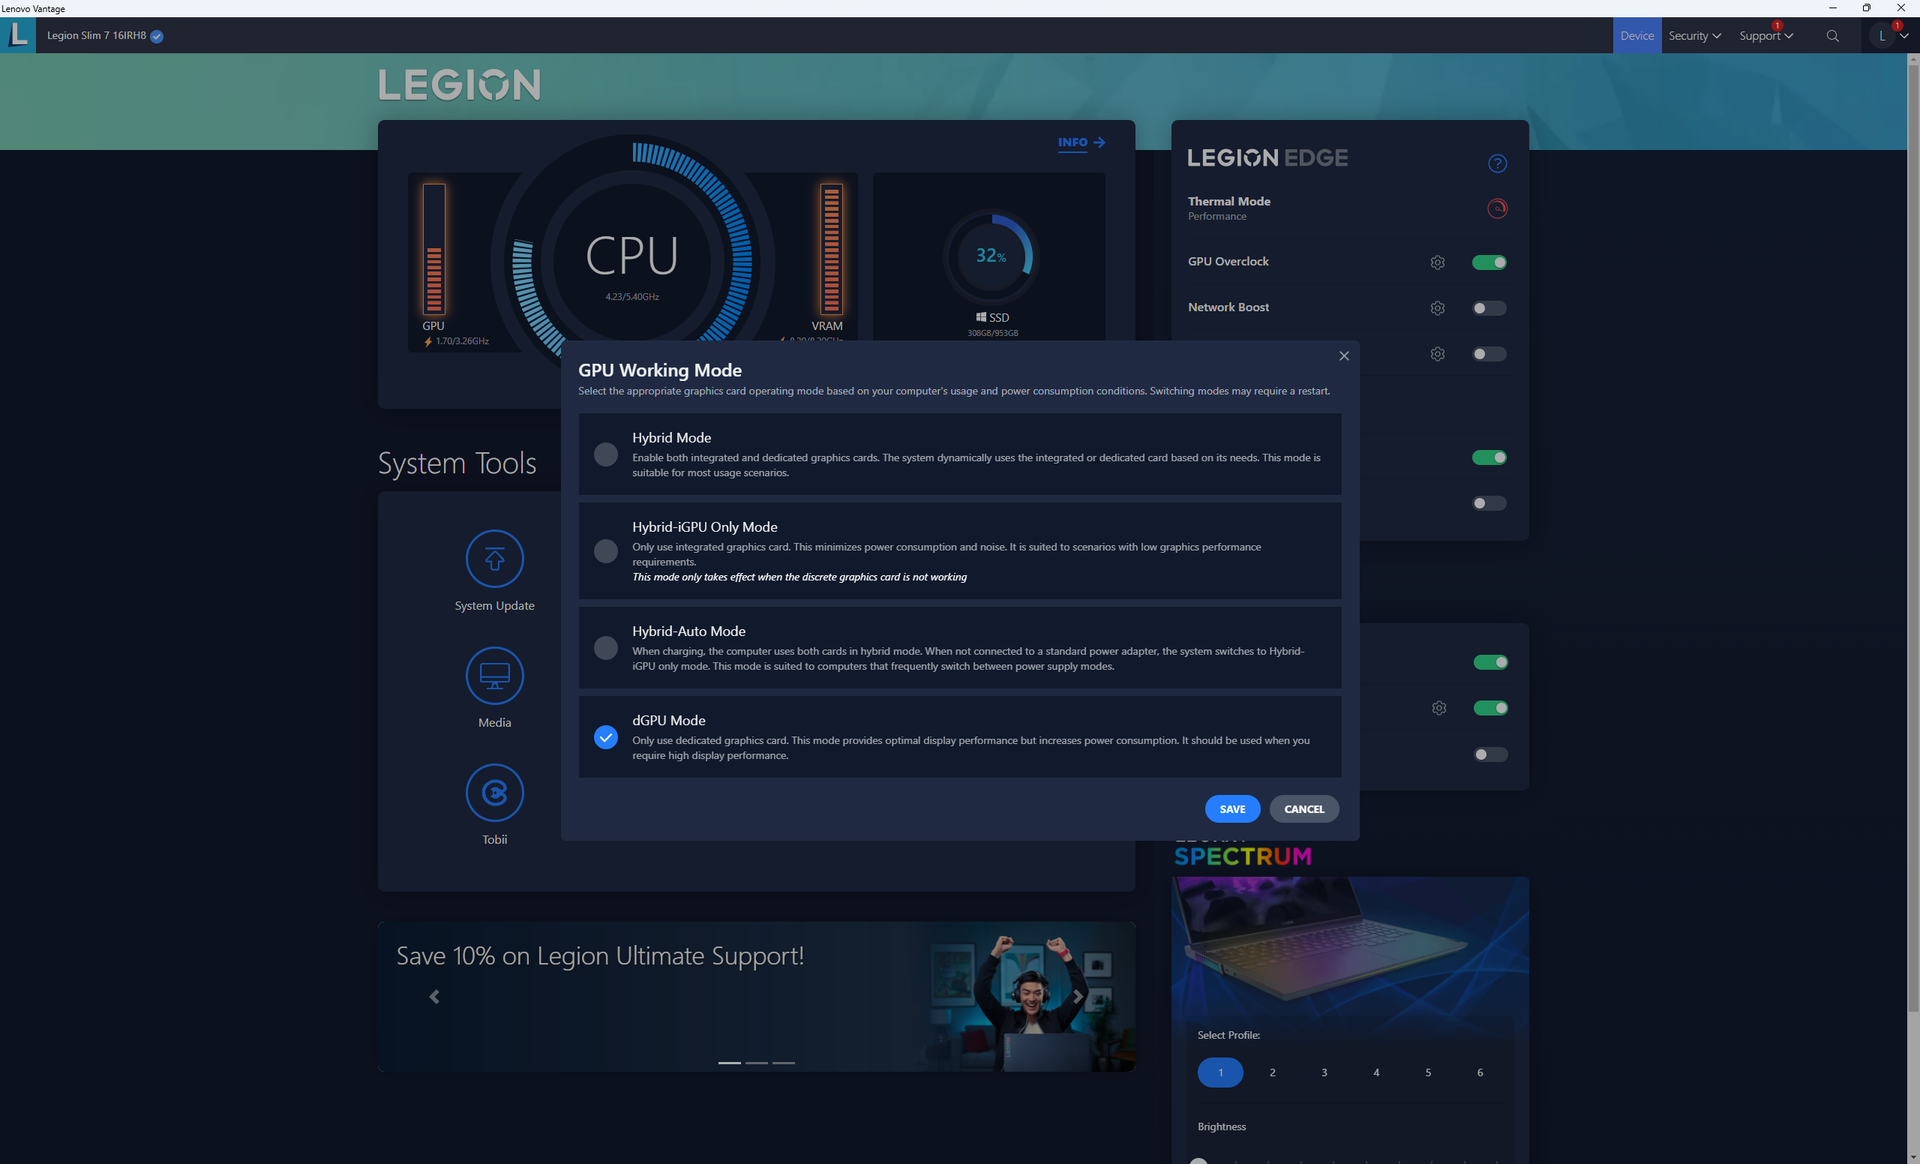
Przed uruchomieniem poniższych testów porównawczych ustawiliśmy naszą jednostkę w trybie dGPU i trybie wydajności z aktywnym podkręcaniem GPU i Overdrive. Lenovo Vantage to centrum sterowania do dostosowywania wydajności, aktualizacji, gwarancji, RGB i innych funkcji.
Advanced Optimus lub MUX są obsługiwane.
Ważne jest, aby pamiętać, że nasza jednostka ma wolne gniazdo SODIMM, więc działa tylko na 16 GB jednokanałowej pamięci RAM. Wyniki testów pamięci AIDA64 są zatem znacznie niższe niż w przypadku większości innych laptopów do gier.
Procesor
Raptor Lake-H Core i9-13900H oferuje 25-procentowy wzrost wydajności wielowątkowej w porównaniu do modelu Alder Lake-H Core i9-12900H. Co najważniejsze, jego wydajność jest zasadniczo identyczna z droższym modelemCore i7-13700HX i Core i9-13900HK. Jeśli kiedykolwiek będziesz musiał zdecydować między którymkolwiek z tych trzech procesorów 13. generacji, opcja Core i9-13900H będzie najlepszym wyborem.
Obniżenie wersji do podstawowej Core i7-13700H spowoduje spadek wydajności procesora o około 20 do 25 procent.
Cinebench R15 Multi Loop
Cinebench R20: CPU (Multi Core) | CPU (Single Core)
Cinebench R23: Multi Core | Single Core
Cinebench R15: CPU Multi 64Bit | CPU Single 64Bit
Blender: v2.79 BMW27 CPU
7-Zip 18.03: 7z b 4 | 7z b 4 -mmt1
Geekbench 5.5: Multi-Core | Single-Core
HWBOT x265 Benchmark v2.2: 4k Preset
LibreOffice : 20 Documents To PDF
R Benchmark 2.5: Overall mean
| CPU Performance rating | |
| Asus Zephyrus Duo 16 GX650PY-NM006W | |
| Lenovo Legion Pro 7 RTX4090 | |
| Lenovo Legion 7 16IAX7-82TD004SGE | |
| Lenovo Legion Slim 7i 16 Gen 8 -1! | |
| Alienware x16 R1 -1! | |
| Lenovo Legion Pro 5 16ARX8 | |
| Lenovo Legion Pro 5 16IRX8 | |
| Asus ROG Zephyrus M16 GU603Z | |
| Przeciętny Intel Core i9-13900H | |
| Dell G16 7620 | |
| Samsung Galaxy Book3 Ultra 16 | |
| Asus ROG Zephyrus Duo 16 GX650RX | |
| HP Omen 16-n0033dx | |
| Lenovo Legion 7 15IMH05-81YT001VGE | |
| Lenovo Legion C7 15IMH05 82EH0030GE | |
| Cinebench R20 / CPU (Multi Core) | |
| Asus Zephyrus Duo 16 GX650PY-NM006W | |
| Lenovo Legion Pro 7 RTX4090 | |
| Lenovo Legion 7 16IAX7-82TD004SGE | |
| Lenovo Legion Slim 7i 16 Gen 8 | |
| Alienware x16 R1 | |
| Lenovo Legion Pro 5 16ARX8 | |
| Lenovo Legion Pro 5 16IRX8 | |
| Dell G16 7620 | |
| Przeciętny Intel Core i9-13900H (4935 - 7716, n=25) | |
| Asus ROG Zephyrus M16 GU603Z | |
| Samsung Galaxy Book3 Ultra 16 | |
| Asus ROG Zephyrus Duo 16 GX650RX | |
| HP Omen 16-n0033dx | |
| Lenovo Legion 7 15IMH05-81YT001VGE | |
| Lenovo Legion C7 15IMH05 82EH0030GE | |
| Cinebench R20 / CPU (Single Core) | |
| Lenovo Legion Pro 7 RTX4090 | |
| Lenovo Legion Slim 7i 16 Gen 8 | |
| Asus Zephyrus Duo 16 GX650PY-NM006W | |
| Alienware x16 R1 | |
| Lenovo Legion 7 16IAX7-82TD004SGE | |
| Przeciętny Intel Core i9-13900H (428 - 792, n=25) | |
| Lenovo Legion Pro 5 16ARX8 | |
| Asus ROG Zephyrus M16 GU603Z | |
| Dell G16 7620 | |
| Samsung Galaxy Book3 Ultra 16 | |
| Lenovo Legion Pro 5 16IRX8 | |
| HP Omen 16-n0033dx | |
| Asus ROG Zephyrus Duo 16 GX650RX | |
| Lenovo Legion 7 15IMH05-81YT001VGE | |
| Lenovo Legion C7 15IMH05 82EH0030GE | |
| Cinebench R23 / Multi Core | |
| Asus Zephyrus Duo 16 GX650PY-NM006W | |
| Lenovo Legion Pro 7 RTX4090 | |
| Lenovo Legion 7 16IAX7-82TD004SGE | |
| Lenovo Legion Pro 5 16IRX8 | |
| Lenovo Legion Slim 7i 16 Gen 8 | |
| Alienware x16 R1 | |
| Lenovo Legion Pro 5 16ARX8 | |
| Dell G16 7620 | |
| Przeciętny Intel Core i9-13900H (11997 - 20385, n=28) | |
| Asus ROG Zephyrus M16 GU603Z | |
| Samsung Galaxy Book3 Ultra 16 | |
| Asus ROG Zephyrus Duo 16 GX650RX | |
| HP Omen 16-n0033dx | |
| Lenovo Legion 7 15IMH05-81YT001VGE | |
| Lenovo Legion C7 15IMH05 82EH0030GE | |
| Cinebench R23 / Single Core | |
| Lenovo Legion Pro 7 RTX4090 | |
| Lenovo Legion Slim 7i 16 Gen 8 | |
| Alienware x16 R1 | |
| Asus Zephyrus Duo 16 GX650PY-NM006W | |
| Lenovo Legion 7 16IAX7-82TD004SGE | |
| Przeciętny Intel Core i9-13900H (1297 - 2054, n=26) | |
| Asus ROG Zephyrus M16 GU603Z | |
| Lenovo Legion Pro 5 16ARX8 | |
| Dell G16 7620 | |
| Samsung Galaxy Book3 Ultra 16 | |
| Lenovo Legion Pro 5 16IRX8 | |
| Asus ROG Zephyrus Duo 16 GX650RX | |
| HP Omen 16-n0033dx | |
| Lenovo Legion 7 15IMH05-81YT001VGE | |
| Lenovo Legion C7 15IMH05 82EH0030GE | |
| Cinebench R15 / CPU Multi 64Bit | |
| Asus Zephyrus Duo 16 GX650PY-NM006W | |
| Lenovo Legion Pro 7 RTX4090 | |
| Lenovo Legion 7 16IAX7-82TD004SGE | |
| Lenovo Legion Pro 5 16IRX8 | |
| Lenovo Legion Pro 5 16ARX8 | |
| Lenovo Legion Slim 7i 16 Gen 8 | |
| Alienware x16 R1 | |
| Przeciętny Intel Core i9-13900H (2061 - 3100, n=26) | |
| Dell G16 7620 | |
| Asus ROG Zephyrus M16 GU603Z | |
| Samsung Galaxy Book3 Ultra 16 | |
| Asus ROG Zephyrus Duo 16 GX650RX | |
| HP Omen 16-n0033dx | |
| Lenovo Legion C7 15IMH05 82EH0030GE | |
| Lenovo Legion 7 15IMH05-81YT001VGE | |
| Cinebench R15 / CPU Single 64Bit | |
| Asus Zephyrus Duo 16 GX650PY-NM006W | |
| Lenovo Legion Pro 5 16ARX8 | |
| Lenovo Legion Pro 7 RTX4090 | |
| Lenovo Legion 7 16IAX7-82TD004SGE | |
| Alienware x16 R1 | |
| Przeciętny Intel Core i9-13900H (211 - 297, n=26) | |
| Lenovo Legion Pro 5 16IRX8 | |
| Asus ROG Zephyrus M16 GU603Z | |
| Asus ROG Zephyrus Duo 16 GX650RX | |
| Dell G16 7620 | |
| Samsung Galaxy Book3 Ultra 16 | |
| HP Omen 16-n0033dx | |
| Lenovo Legion Slim 7i 16 Gen 8 | |
| Lenovo Legion 7 15IMH05-81YT001VGE | |
| Lenovo Legion C7 15IMH05 82EH0030GE | |
| Blender / v2.79 BMW27 CPU | |
| Lenovo Legion C7 15IMH05 82EH0030GE | |
| Lenovo Legion 7 15IMH05-81YT001VGE | |
| HP Omen 16-n0033dx | |
| Samsung Galaxy Book3 Ultra 16 | |
| Asus ROG Zephyrus Duo 16 GX650RX | |
| Przeciętny Intel Core i9-13900H (166 - 268, n=24) | |
| Asus ROG Zephyrus M16 GU603Z | |
| Dell G16 7620 | |
| Lenovo Legion Pro 5 16ARX8 | |
| Lenovo Legion Pro 5 16IRX8 | |
| Lenovo Legion 7 16IAX7-82TD004SGE | |
| Lenovo Legion Pro 7 RTX4090 | |
| Asus Zephyrus Duo 16 GX650PY-NM006W | |
| 7-Zip 18.03 / 7z b 4 | |
| Asus Zephyrus Duo 16 GX650PY-NM006W | |
| Lenovo Legion Pro 7 RTX4090 | |
| Lenovo Legion 7 16IAX7-82TD004SGE | |
| Lenovo Legion Pro 5 16IRX8 | |
| Alienware x16 R1 | |
| Lenovo Legion Pro 5 16ARX8 | |
| Lenovo Legion Slim 7i 16 Gen 8 | |
| Przeciętny Intel Core i9-13900H (45045 - 79032, n=25) | |
| Asus ROG Zephyrus M16 GU603Z | |
| Dell G16 7620 | |
| Asus ROG Zephyrus Duo 16 GX650RX | |
| Samsung Galaxy Book3 Ultra 16 | |
| HP Omen 16-n0033dx | |
| Lenovo Legion 7 15IMH05-81YT001VGE | |
| Lenovo Legion C7 15IMH05 82EH0030GE | |
| 7-Zip 18.03 / 7z b 4 -mmt1 | |
| Asus Zephyrus Duo 16 GX650PY-NM006W | |
| Lenovo Legion Pro 5 16ARX8 | |
| Lenovo Legion Pro 7 RTX4090 | |
| Lenovo Legion Slim 7i 16 Gen 8 | |
| Lenovo Legion 7 16IAX7-82TD004SGE | |
| Asus ROG Zephyrus M16 GU603Z | |
| Przeciętny Intel Core i9-13900H (3665 - 6600, n=25) | |
| Alienware x16 R1 | |
| Asus ROG Zephyrus Duo 16 GX650RX | |
| Lenovo Legion Pro 5 16IRX8 | |
| HP Omen 16-n0033dx | |
| Lenovo Legion 7 15IMH05-81YT001VGE | |
| Samsung Galaxy Book3 Ultra 16 | |
| Lenovo Legion C7 15IMH05 82EH0030GE | |
| Dell G16 7620 | |
| Geekbench 5.5 / Multi-Core | |
| Lenovo Legion Pro 7 RTX4090 | |
| Asus Zephyrus Duo 16 GX650PY-NM006W | |
| Lenovo Legion 7 16IAX7-82TD004SGE | |
| Alienware x16 R1 | |
| Lenovo Legion Pro 5 16IRX8 | |
| Lenovo Legion Slim 7i 16 Gen 8 | |
| Asus ROG Zephyrus M16 GU603Z | |
| Przeciętny Intel Core i9-13900H (9094 - 15410, n=26) | |
| Lenovo Legion Pro 5 16ARX8 | |
| Dell G16 7620 | |
| Samsung Galaxy Book3 Ultra 16 | |
| Asus ROG Zephyrus Duo 16 GX650RX | |
| HP Omen 16-n0033dx | |
| Lenovo Legion 7 15IMH05-81YT001VGE | |
| Lenovo Legion C7 15IMH05 82EH0030GE | |
| Geekbench 5.5 / Single-Core | |
| Asus Zephyrus Duo 16 GX650PY-NM006W | |
| Lenovo Legion Pro 5 16ARX8 | |
| Lenovo Legion Pro 7 RTX4090 | |
| Lenovo Legion Slim 7i 16 Gen 8 | |
| Alienware x16 R1 | |
| Przeciętny Intel Core i9-13900H (1140 - 2043, n=26) | |
| Lenovo Legion 7 16IAX7-82TD004SGE | |
| Asus ROG Zephyrus M16 GU603Z | |
| Lenovo Legion Pro 5 16IRX8 | |
| Samsung Galaxy Book3 Ultra 16 | |
| Dell G16 7620 | |
| Asus ROG Zephyrus Duo 16 GX650RX | |
| HP Omen 16-n0033dx | |
| Lenovo Legion 7 15IMH05-81YT001VGE | |
| Lenovo Legion C7 15IMH05 82EH0030GE | |
| HWBOT x265 Benchmark v2.2 / 4k Preset | |
| Asus Zephyrus Duo 16 GX650PY-NM006W | |
| Lenovo Legion Pro 7 RTX4090 | |
| Lenovo Legion 7 16IAX7-82TD004SGE | |
| Lenovo Legion Pro 5 16IRX8 | |
| Lenovo Legion Pro 5 16ARX8 | |
| Alienware x16 R1 | |
| Lenovo Legion Slim 7i 16 Gen 8 | |
| Asus ROG Zephyrus M16 GU603Z | |
| Dell G16 7620 | |
| Przeciętny Intel Core i9-13900H (14.1 - 22.3, n=25) | |
| Asus ROG Zephyrus Duo 16 GX650RX | |
| Samsung Galaxy Book3 Ultra 16 | |
| HP Omen 16-n0033dx | |
| Lenovo Legion 7 15IMH05-81YT001VGE | |
| Lenovo Legion C7 15IMH05 82EH0030GE | |
| LibreOffice / 20 Documents To PDF | |
| Asus Zephyrus Duo 16 GX650PY-NM006W | |
| HP Omen 16-n0033dx | |
| Lenovo Legion C7 15IMH05 82EH0030GE | |
| Dell G16 7620 | |
| Lenovo Legion 7 15IMH05-81YT001VGE | |
| Samsung Galaxy Book3 Ultra 16 | |
| Przeciętny Intel Core i9-13900H (34.4 - 82.8, n=25) | |
| Asus ROG Zephyrus Duo 16 GX650RX | |
| Alienware x16 R1 | |
| Asus ROG Zephyrus M16 GU603Z | |
| Lenovo Legion Pro 7 RTX4090 | |
| Lenovo Legion Pro 5 16ARX8 | |
| Lenovo Legion Pro 5 16IRX8 | |
| Lenovo Legion 7 16IAX7-82TD004SGE | |
| Lenovo Legion Slim 7i 16 Gen 8 | |
| R Benchmark 2.5 / Overall mean | |
| Lenovo Legion C7 15IMH05 82EH0030GE | |
| Lenovo Legion 7 15IMH05-81YT001VGE | |
| Dell G16 7620 | |
| HP Omen 16-n0033dx | |
| Samsung Galaxy Book3 Ultra 16 | |
| Asus ROG Zephyrus Duo 16 GX650RX | |
| Lenovo Legion Pro 5 16IRX8 | |
| Przeciętny Intel Core i9-13900H (0.4052 - 0.723, n=25) | |
| Asus ROG Zephyrus M16 GU603Z | |
| Alienware x16 R1 | |
| Lenovo Legion Pro 5 16ARX8 | |
| Lenovo Legion 7 16IAX7-82TD004SGE | |
| Lenovo Legion Slim 7i 16 Gen 8 | |
| Lenovo Legion Pro 7 RTX4090 | |
| Asus Zephyrus Duo 16 GX650PY-NM006W | |
Cinebench R20: CPU (Multi Core) | CPU (Single Core)
Cinebench R23: Multi Core | Single Core
Cinebench R15: CPU Multi 64Bit | CPU Single 64Bit
Blender: v2.79 BMW27 CPU
7-Zip 18.03: 7z b 4 | 7z b 4 -mmt1
Geekbench 5.5: Multi-Core | Single-Core
HWBOT x265 Benchmark v2.2: 4k Preset
LibreOffice : 20 Documents To PDF
R Benchmark 2.5: Overall mean
* ... im mniej tym lepiej
AIDA64: FP32 Ray-Trace | FPU Julia | CPU SHA3 | CPU Queen | FPU SinJulia | FPU Mandel | CPU AES | CPU ZLib | FP64 Ray-Trace | CPU PhotoWorxx
| Performance rating | |
| Lenovo Legion Pro 7 RTX4090 | |
| Asus ROG Strix G16 G614JZ | |
| Razer Blade 16 Early 2023 | |
| Alienware x16 R1 | |
| HP Omen 16-wf000 | |
| Lenovo Legion Slim 7i 16 Gen 8 | |
| Przeciętny Intel Core i9-13900H | |
| AIDA64 / FP32 Ray-Trace | |
| Asus ROG Strix G16 G614JZ | |
| Lenovo Legion Pro 7 RTX4090 | |
| Razer Blade 16 Early 2023 | |
| Razer Blade 16 Early 2023 | |
| Razer Blade 16 Early 2023 | |
| HP Omen 16-wf000 | |
| Alienware x16 R1 | |
| Lenovo Legion Slim 7i 16 Gen 8 | |
| Przeciętny Intel Core i9-13900H (6788 - 19557, n=25) | |
| AIDA64 / FPU Julia | |
| Lenovo Legion Pro 7 RTX4090 | |
| Asus ROG Strix G16 G614JZ | |
| Razer Blade 16 Early 2023 | |
| Razer Blade 16 Early 2023 | |
| Razer Blade 16 Early 2023 | |
| HP Omen 16-wf000 | |
| Alienware x16 R1 | |
| Lenovo Legion Slim 7i 16 Gen 8 | |
| Przeciętny Intel Core i9-13900H (22551 - 95579, n=25) | |
| AIDA64 / CPU SHA3 | |
| Lenovo Legion Pro 7 RTX4090 | |
| Asus ROG Strix G16 G614JZ | |
| Razer Blade 16 Early 2023 | |
| Razer Blade 16 Early 2023 | |
| Razer Blade 16 Early 2023 | |
| HP Omen 16-wf000 | |
| Alienware x16 R1 | |
| Lenovo Legion Slim 7i 16 Gen 8 | |
| Przeciętny Intel Core i9-13900H (2491 - 4270, n=25) | |
| AIDA64 / CPU Queen | |
| Asus ROG Strix G16 G614JZ | |
| Lenovo Legion Pro 7 RTX4090 | |
| Razer Blade 16 Early 2023 | |
| Razer Blade 16 Early 2023 | |
| Lenovo Legion Slim 7i 16 Gen 8 | |
| Alienware x16 R1 | |
| Przeciętny Intel Core i9-13900H (65121 - 120936, n=25) | |
| HP Omen 16-wf000 | |
| AIDA64 / FPU SinJulia | |
| Asus ROG Strix G16 G614JZ | |
| Razer Blade 16 Early 2023 | |
| Razer Blade 16 Early 2023 | |
| Razer Blade 16 Early 2023 | |
| Lenovo Legion Pro 7 RTX4090 | |
| HP Omen 16-wf000 | |
| Alienware x16 R1 | |
| Lenovo Legion Slim 7i 16 Gen 8 | |
| Przeciętny Intel Core i9-13900H (6108 - 11631, n=25) | |
| AIDA64 / FPU Mandel | |
| Lenovo Legion Pro 7 RTX4090 | |
| Asus ROG Strix G16 G614JZ | |
| Razer Blade 16 Early 2023 | |
| Razer Blade 16 Early 2023 | |
| Razer Blade 16 Early 2023 | |
| HP Omen 16-wf000 | |
| Alienware x16 R1 | |
| Lenovo Legion Slim 7i 16 Gen 8 | |
| Przeciętny Intel Core i9-13900H (11283 - 48474, n=25) | |
| AIDA64 / CPU ZLib | |
| Lenovo Legion Pro 7 RTX4090 | |
| Asus ROG Strix G16 G614JZ | |
| Razer Blade 16 Early 2023 | |
| Razer Blade 16 Early 2023 | |
| Razer Blade 16 Early 2023 | |
| HP Omen 16-wf000 | |
| Lenovo Legion Slim 7i 16 Gen 8 | |
| Alienware x16 R1 | |
| Przeciętny Intel Core i9-13900H (789 - 1254, n=25) | |
| AIDA64 / FP64 Ray-Trace | |
| Asus ROG Strix G16 G614JZ | |
| Lenovo Legion Pro 7 RTX4090 | |
| Razer Blade 16 Early 2023 | |
| Razer Blade 16 Early 2023 | |
| Razer Blade 16 Early 2023 | |
| HP Omen 16-wf000 | |
| Alienware x16 R1 | |
| Lenovo Legion Slim 7i 16 Gen 8 | |
| Przeciętny Intel Core i9-13900H (3655 - 10716, n=25) | |
| AIDA64 / CPU PhotoWorxx | |
| Razer Blade 16 Early 2023 | |
| Razer Blade 16 Early 2023 | |
| Razer Blade 16 Early 2023 | |
| Lenovo Legion Pro 7 RTX4090 | |
| Alienware x16 R1 | |
| HP Omen 16-wf000 | |
| Przeciętny Intel Core i9-13900H (10871 - 50488, n=25) | |
| Asus ROG Strix G16 G614JZ | |
| Lenovo Legion Slim 7i 16 Gen 8 | |
Wydajność systemu
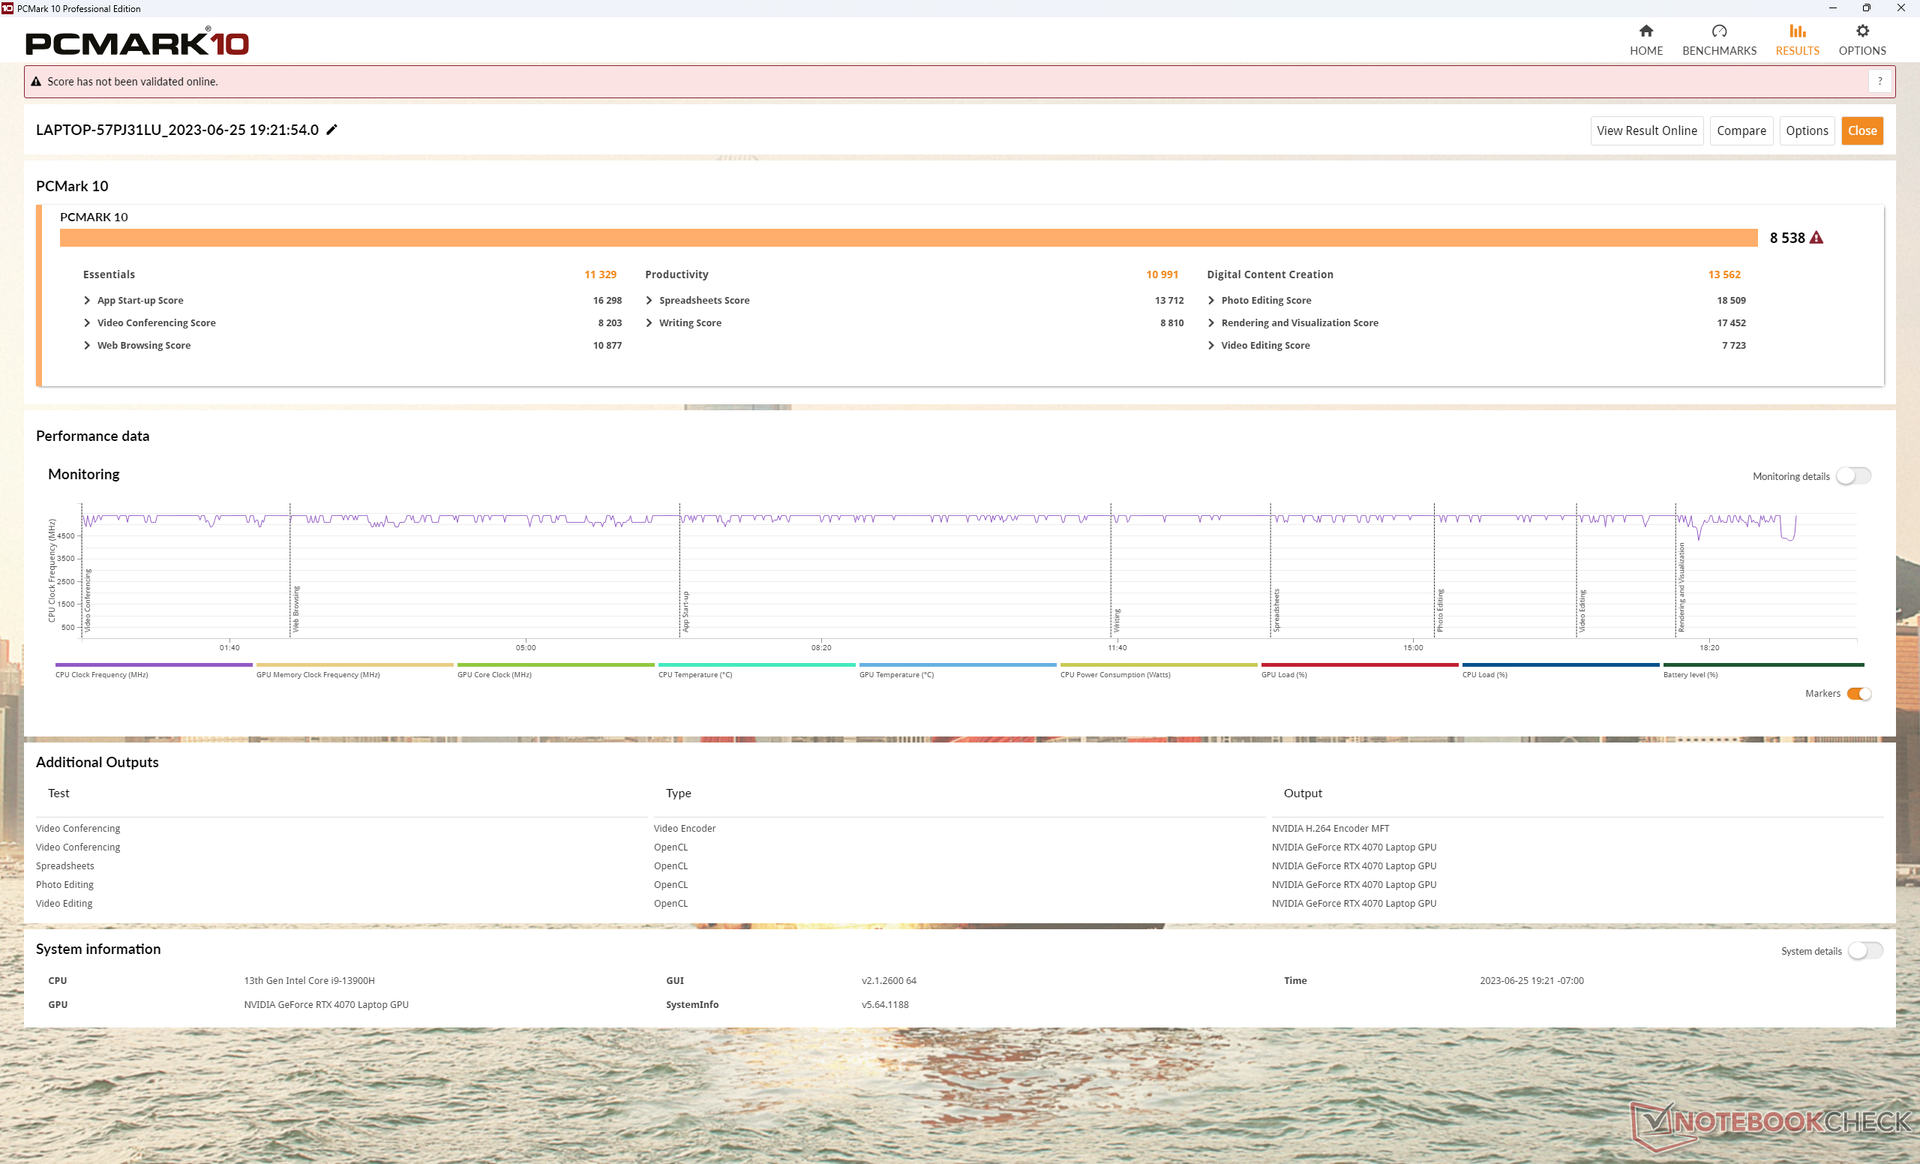
Wyniki PCMark są doskonałe i porównywalne z innymi wysokiej klasy laptopami do gier. Doświadczyliśmy jednak problemów z wybudzaniem z uśpienia, gdzie laptop często potrzebował nawet 10 sekund, zanim ekran włączył się prawidłowo, w porównaniu do zaledwie kilku sekund w przypadku innych laptopów.
CrossMark: Overall | Productivity | Creativity | Responsiveness
| PCMark 10 / Score | |
| Lenovo Legion Slim 7i 16 Gen 8 | |
| Alienware x16 R1 | |
| Lenovo Legion Pro 7 RTX4090 | |
| Razer Blade 16 Early 2023 | |
| HP Omen 16-wf000 | |
| Przeciętny Intel Core i9-13900H, NVIDIA GeForce RTX 4070 Laptop GPU (5855 - 8538, n=8) | |
| Asus ROG Strix G16 G614JZ | |
| PCMark 10 / Essentials | |
| Asus ROG Strix G16 G614JZ | |
| Lenovo Legion Slim 7i 16 Gen 8 | |
| Alienware x16 R1 | |
| Lenovo Legion Pro 7 RTX4090 | |
| Razer Blade 16 Early 2023 | |
| Przeciętny Intel Core i9-13900H, NVIDIA GeForce RTX 4070 Laptop GPU (8835 - 11940, n=8) | |
| HP Omen 16-wf000 | |
| PCMark 10 / Productivity | |
| Lenovo Legion Slim 7i 16 Gen 8 | |
| Alienware x16 R1 | |
| Przeciętny Intel Core i9-13900H, NVIDIA GeForce RTX 4070 Laptop GPU (7967 - 10991, n=8) | |
| HP Omen 16-wf000 | |
| Lenovo Legion Pro 7 RTX4090 | |
| Razer Blade 16 Early 2023 | |
| Asus ROG Strix G16 G614JZ | |
| PCMark 10 / Digital Content Creation | |
| Lenovo Legion Pro 7 RTX4090 | |
| Razer Blade 16 Early 2023 | |
| Alienware x16 R1 | |
| Lenovo Legion Slim 7i 16 Gen 8 | |
| HP Omen 16-wf000 | |
| Przeciętny Intel Core i9-13900H, NVIDIA GeForce RTX 4070 Laptop GPU (7738 - 13575, n=8) | |
| Asus ROG Strix G16 G614JZ | |
| CrossMark / Overall | |
| Asus ROG Strix G16 G614JZ | |
| Lenovo Legion Slim 7i 16 Gen 8 | |
| Alienware x16 R1 | |
| Przeciętny Intel Core i9-13900H, NVIDIA GeForce RTX 4070 Laptop GPU (1104 - 1974, n=7) | |
| HP Omen 16-wf000 | |
| Razer Blade 16 Early 2023 | |
| CrossMark / Productivity | |
| Asus ROG Strix G16 G614JZ | |
| Lenovo Legion Slim 7i 16 Gen 8 | |
| Alienware x16 R1 | |
| Przeciętny Intel Core i9-13900H, NVIDIA GeForce RTX 4070 Laptop GPU (1058 - 1914, n=7) | |
| HP Omen 16-wf000 | |
| Razer Blade 16 Early 2023 | |
| CrossMark / Creativity | |
| Asus ROG Strix G16 G614JZ | |
| Lenovo Legion Slim 7i 16 Gen 8 | |
| Alienware x16 R1 | |
| Przeciętny Intel Core i9-13900H, NVIDIA GeForce RTX 4070 Laptop GPU (1178 - 2254, n=7) | |
| HP Omen 16-wf000 | |
| Razer Blade 16 Early 2023 | |
| CrossMark / Responsiveness | |
| Asus ROG Strix G16 G614JZ | |
| Alienware x16 R1 | |
| Lenovo Legion Slim 7i 16 Gen 8 | |
| Przeciętny Intel Core i9-13900H, NVIDIA GeForce RTX 4070 Laptop GPU (1037 - 1952, n=7) | |
| HP Omen 16-wf000 | |
| Razer Blade 16 Early 2023 | |
| PCMark 10 Score | 8538 pkt. | |
Pomoc | ||
| AIDA64 / Memory Copy | |
| Razer Blade 16 Early 2023 | |
| Razer Blade 16 Early 2023 | |
| Razer Blade 16 Early 2023 | |
| Lenovo Legion Pro 7 RTX4090 | |
| Alienware x16 R1 | |
| HP Omen 16-wf000 | |
| Asus ROG Strix G16 G614JZ | |
| Przeciętny Intel Core i9-13900H (37448 - 74486, n=25) | |
| Lenovo Legion Slim 7i 16 Gen 8 | |
| AIDA64 / Memory Read | |
| Lenovo Legion Pro 7 RTX4090 | |
| Razer Blade 16 Early 2023 | |
| Razer Blade 16 Early 2023 | |
| Razer Blade 16 Early 2023 | |
| Asus ROG Strix G16 G614JZ | |
| Alienware x16 R1 | |
| HP Omen 16-wf000 | |
| Przeciętny Intel Core i9-13900H (41599 - 75433, n=25) | |
| Lenovo Legion Slim 7i 16 Gen 8 | |
| AIDA64 / Memory Write | |
| Alienware x16 R1 | |
| Razer Blade 16 Early 2023 | |
| Razer Blade 16 Early 2023 | |
| Razer Blade 16 Early 2023 | |
| Lenovo Legion Pro 7 RTX4090 | |
| HP Omen 16-wf000 | |
| Przeciętny Intel Core i9-13900H (36152 - 88505, n=25) | |
| Asus ROG Strix G16 G614JZ | |
| Lenovo Legion Slim 7i 16 Gen 8 | |
| AIDA64 / Memory Latency | |
| Alienware x16 R1 | |
| Razer Blade 16 Early 2023 | |
| Razer Blade 16 Early 2023 | |
| Razer Blade 16 Early 2023 | |
| Przeciętny Intel Core i9-13900H (75.8 - 102.3, n=25) | |
| Asus ROG Strix G16 G614JZ | |
| HP Omen 16-wf000 | |
| Lenovo Legion Pro 7 RTX4090 | |
| Lenovo Legion Slim 7i 16 Gen 8 | |
* ... im mniej tym lepiej
Opóźnienie DPC
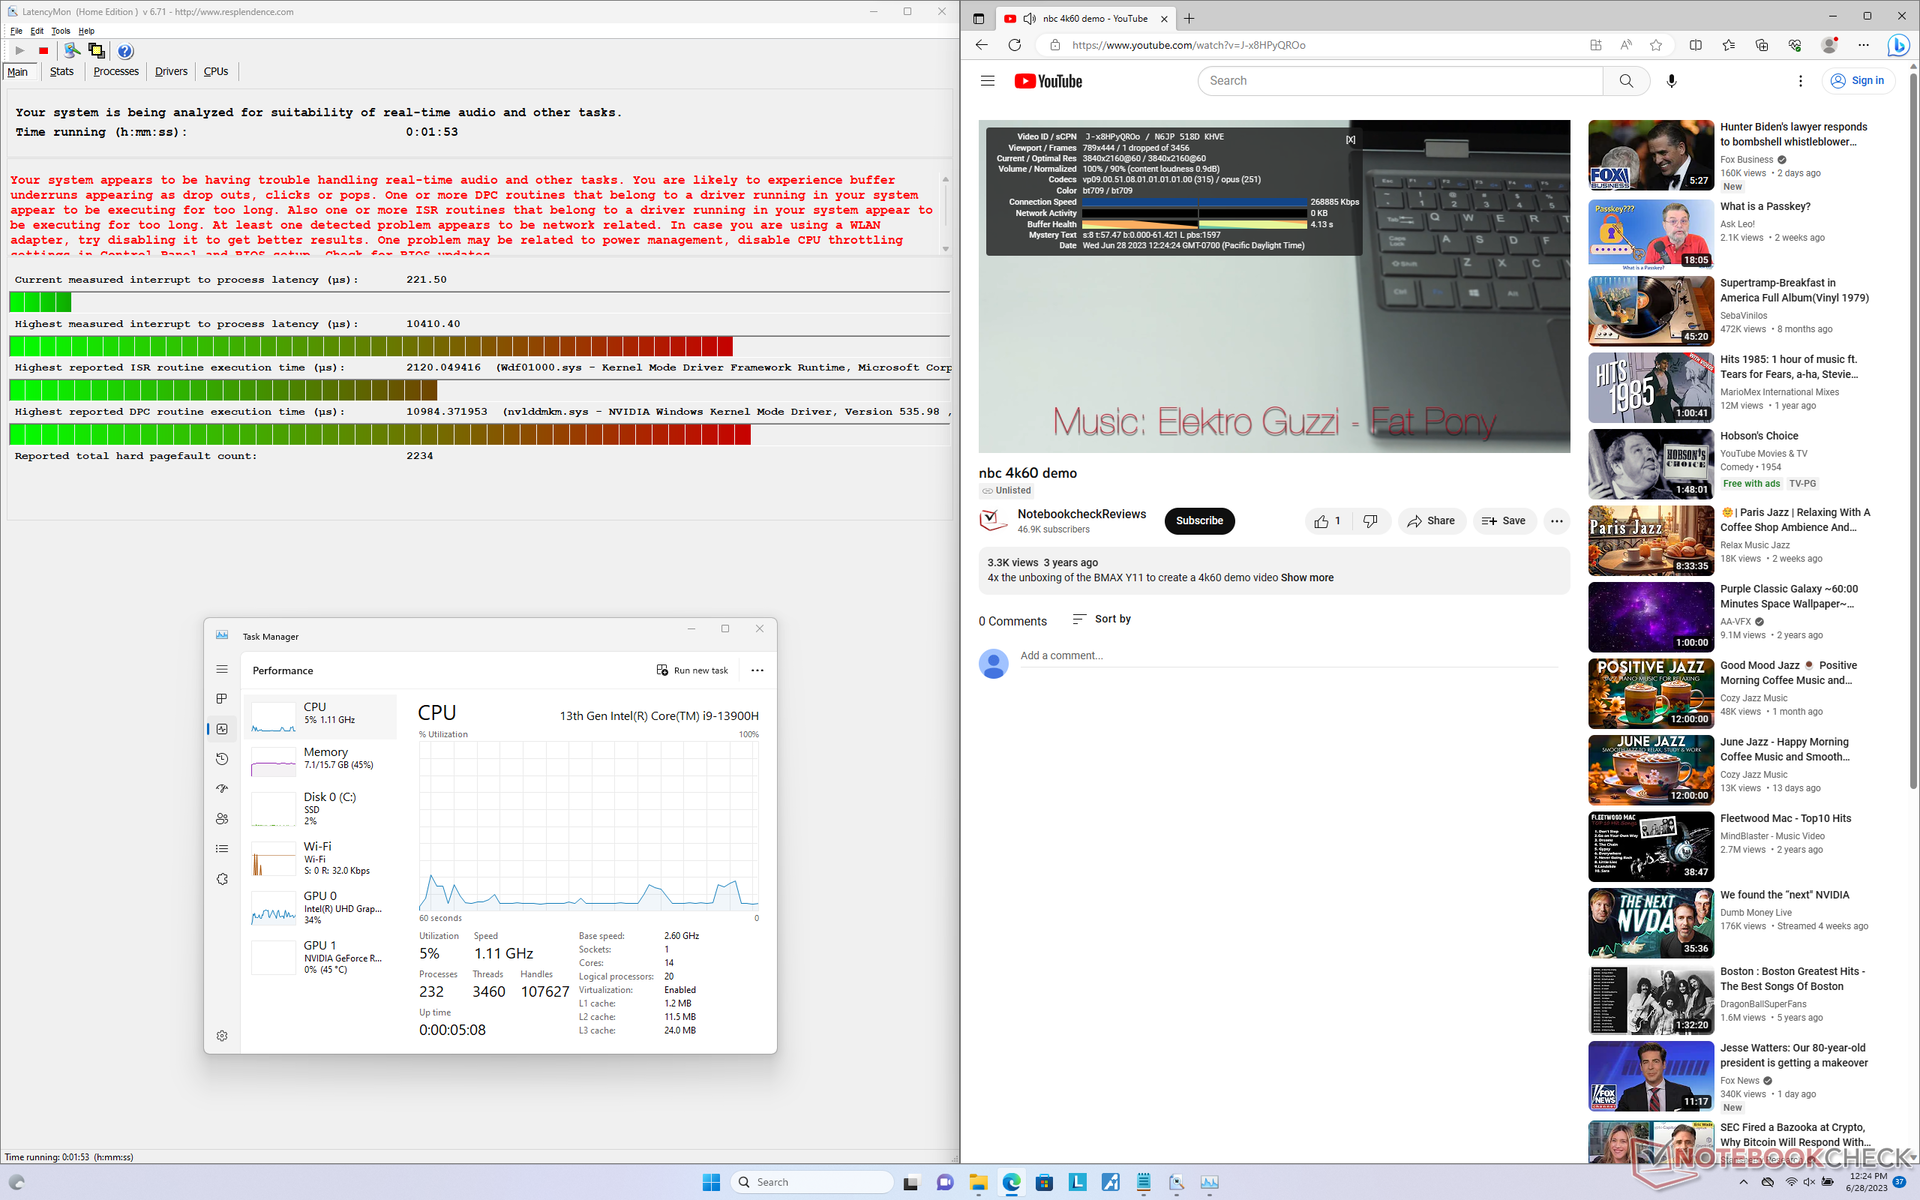
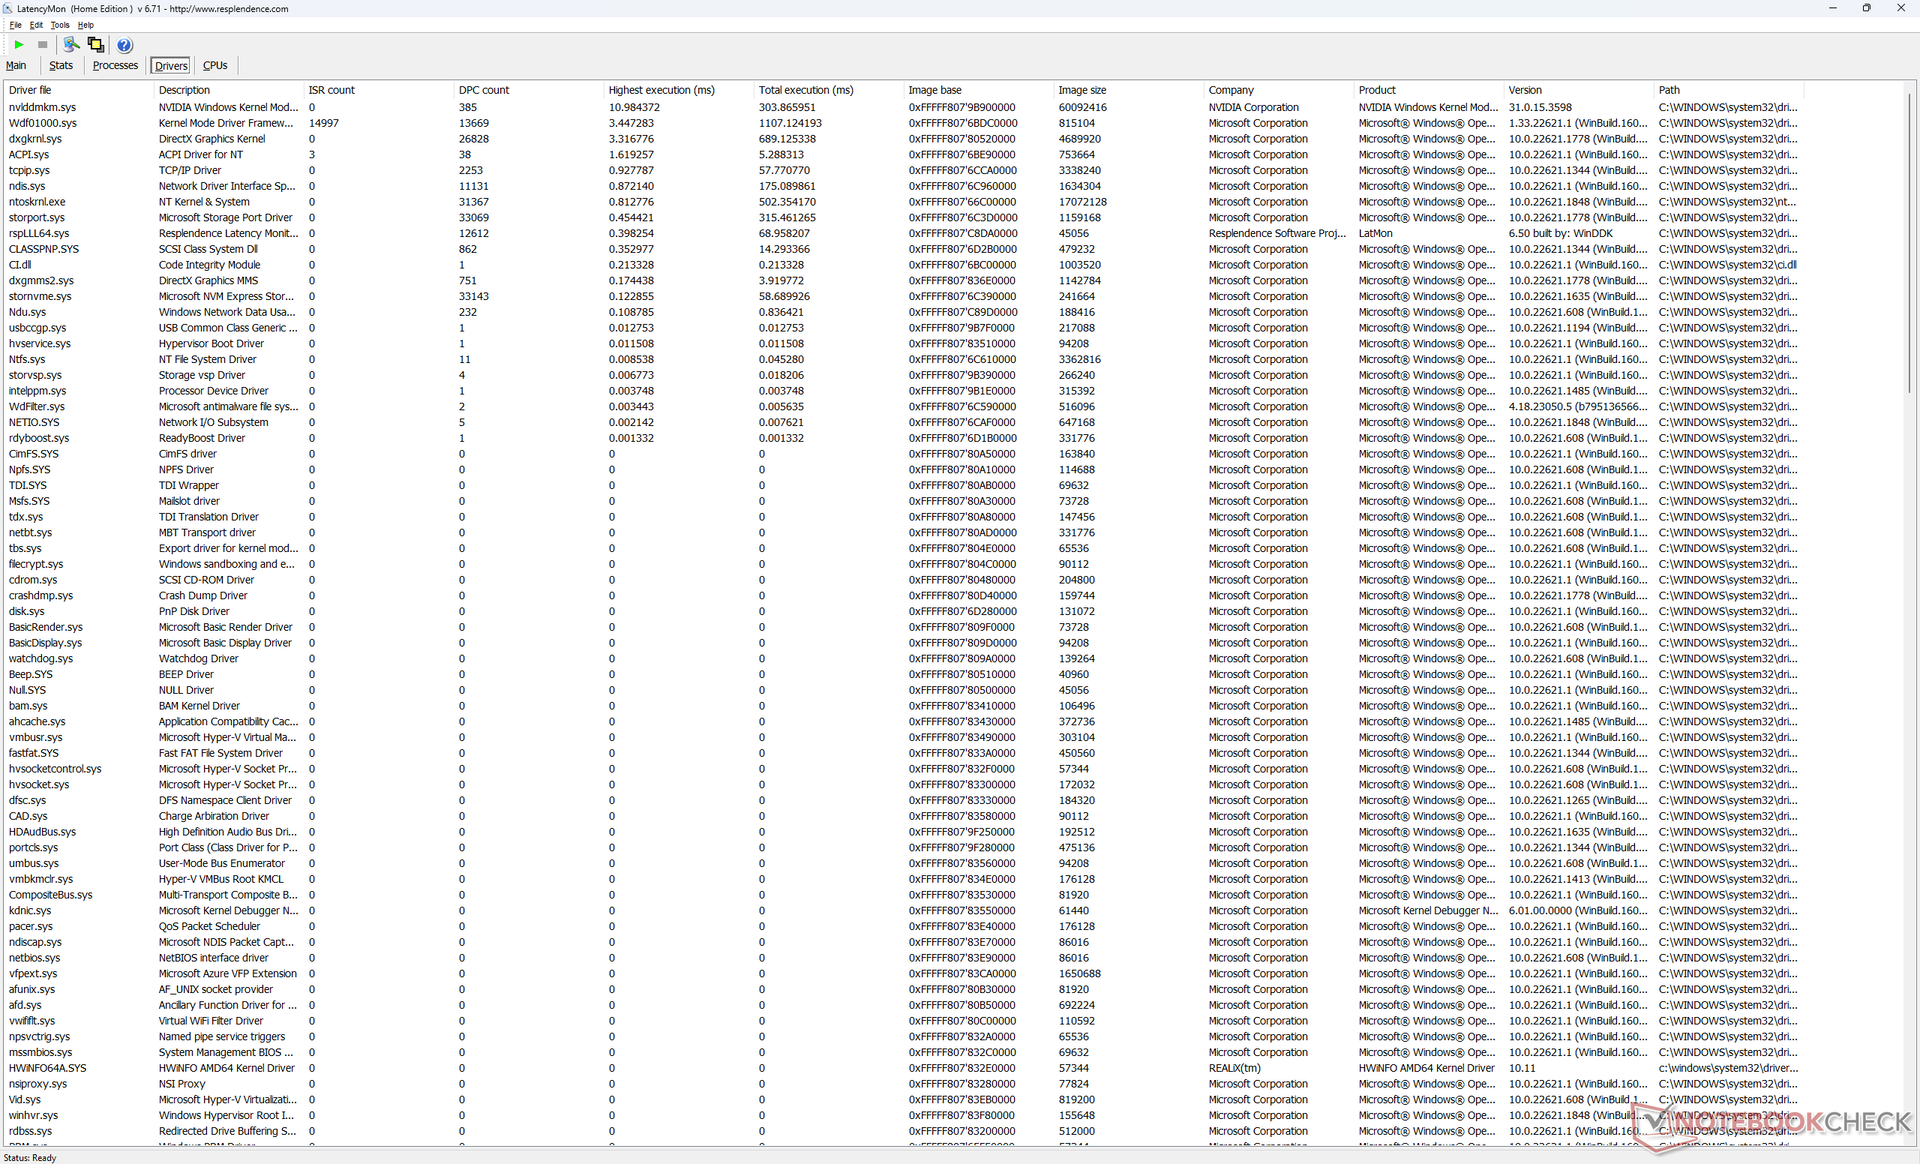
LatencyMon ujawnia problemy DPC związane ze sterownikiem Nvidia NVLDDMKM, podobnie jak to, co zaobserwowaliśmy na Legion Pro 7 nawet po kilku próbach. odtwarzanie wideo 4K przy 60 FPS jest prawie idealne, z tylko jedną utraconą klatką podczas naszego testu wideo.
| DPC Latencies / LatencyMon - interrupt to process latency (max), Web, Youtube, Prime95 | |
| Lenovo Legion Pro 7 RTX4090 | |
| Lenovo Legion Slim 7i 16 Gen 8 | |
| HP Omen 16-wf000 | |
| Asus ROG Strix G16 G614JZ | |
| Razer Blade 16 Early 2023 | |
| Alienware x16 R1 | |
* ... im mniej tym lepiej
Urządzenia pamięci masowej - do dwóch dysków SSD M.2
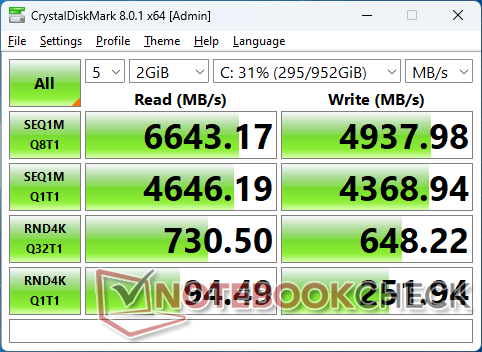
Nasze urządzenie jest dostarczane z dyskiem 1 TBSamsung PM9A1 który jest jednym z najszybszych dostępnych dysków PCIe4 x4. Niestety, prędkość transferu spadła z 6700 MB/s do zaledwie 3300 MB/s, gdy dysk był obciążony, jak pokazano w poniższej tabeli, co sugeruje słabe rozpraszanie ciepła. DyskRazer Blade 14 jest dostarczany z dokładnie tym samym dyskiem SSD Samsunga i nie wykazuje takich problemów.
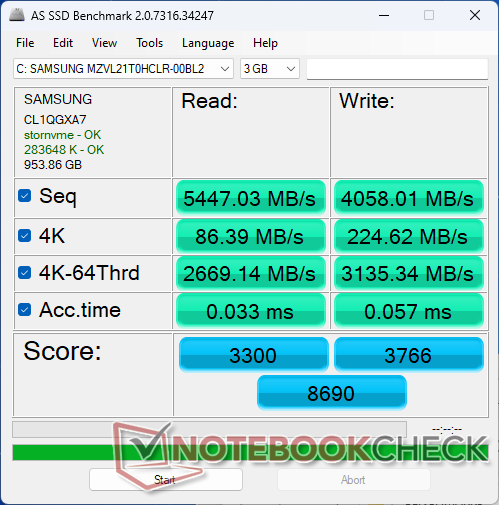

| Drive Performance rating - Percent | |
| Alienware x16 R1 | |
| Lenovo Legion Slim 7i 16 Gen 8 | |
| Lenovo Legion Pro 7 RTX4090 | |
| HP Omen 16-wf000 | |
| Razer Blade 16 Early 2023 | |
| Asus ROG Strix G16 G614JZ | |
* ... im mniej tym lepiej
Disk Throttling: DiskSpd Read Loop, Queue Depth 8
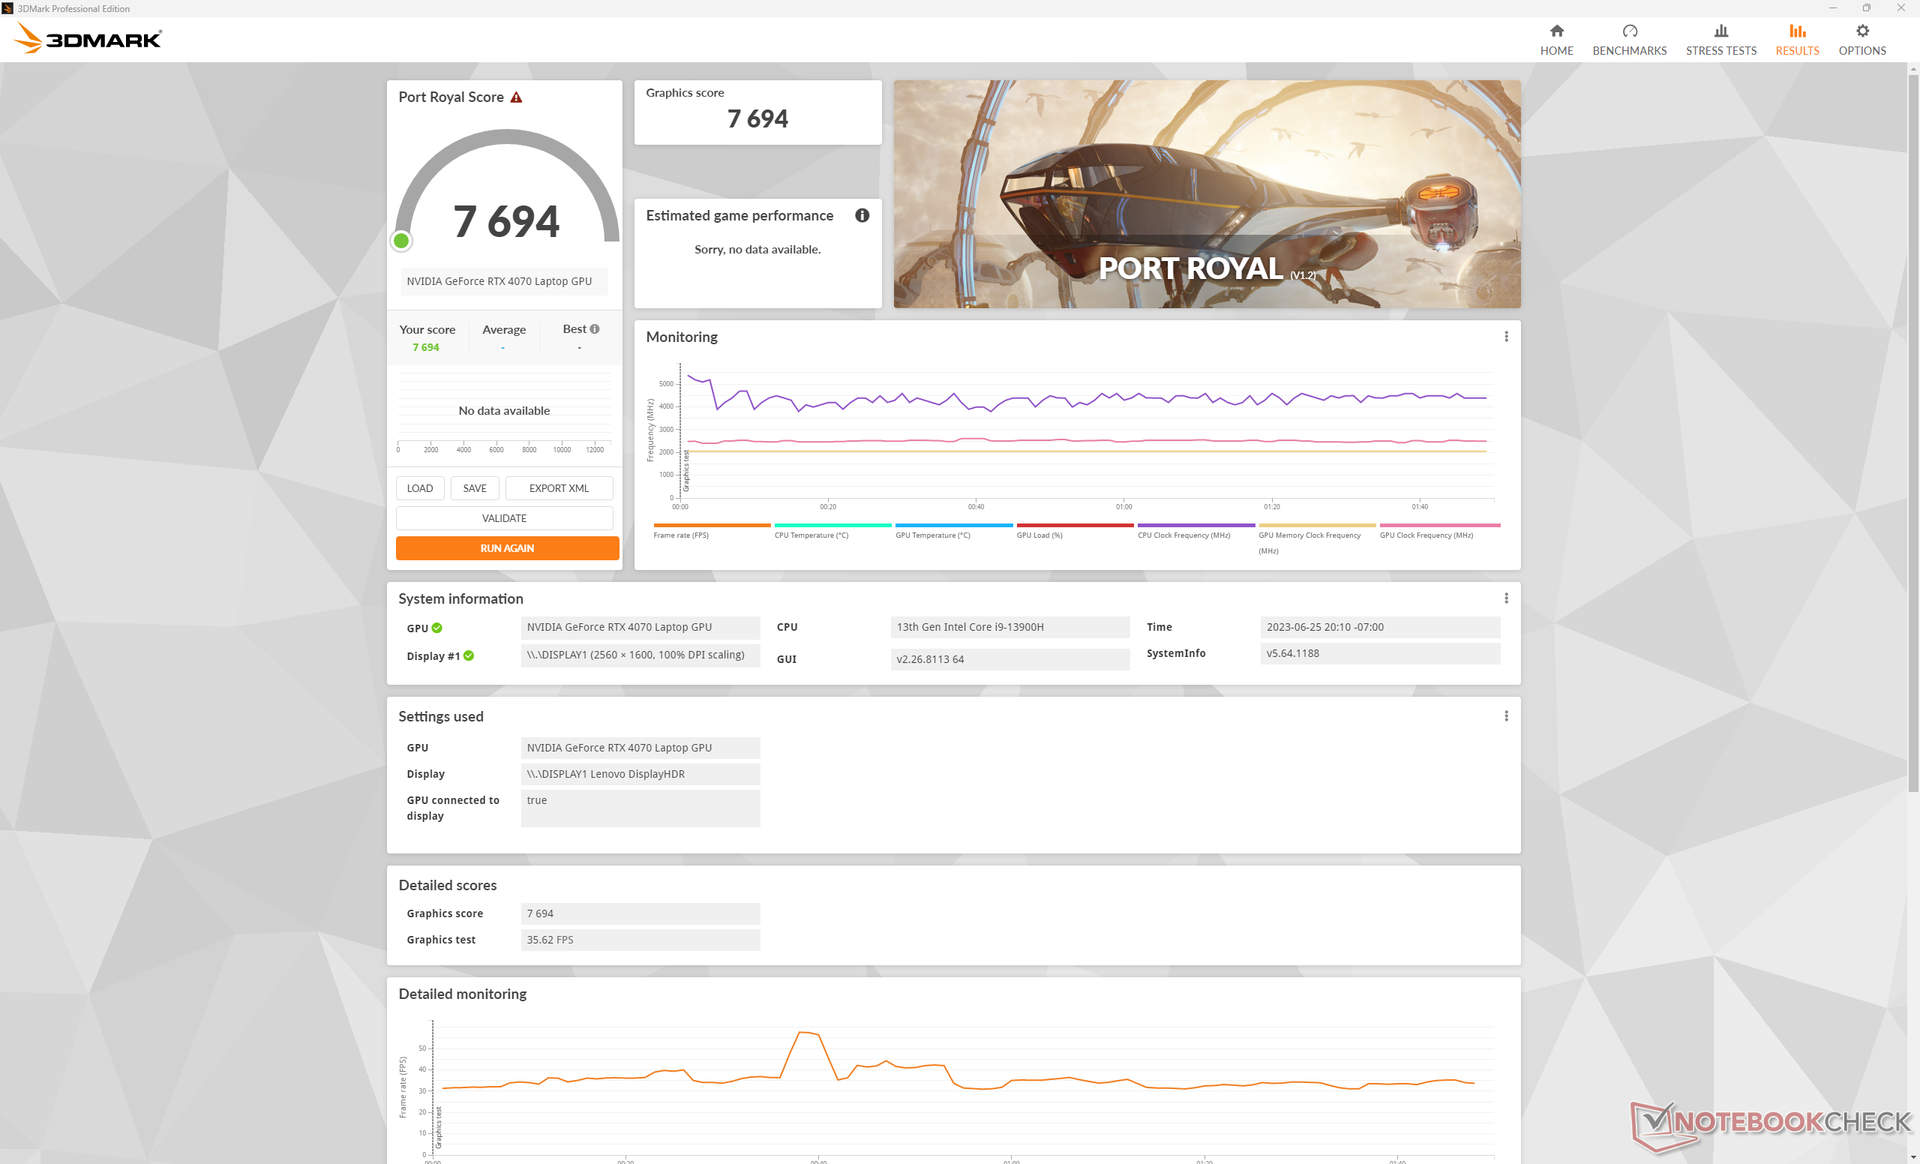
Wydajność GPU - karta graficzna RTX 140 W
Surowa wydajność graficzna jest o około 5 do 10 procent wyższa niż w przypadku przeciętnego laptopa w naszej bazie danych z tym samym mobilnym RTX 4070 GPU. Ogólna wydajność jest zatem mniej więcej na równi z zeszłorocznym mobilnym RTX 3080 Ti.
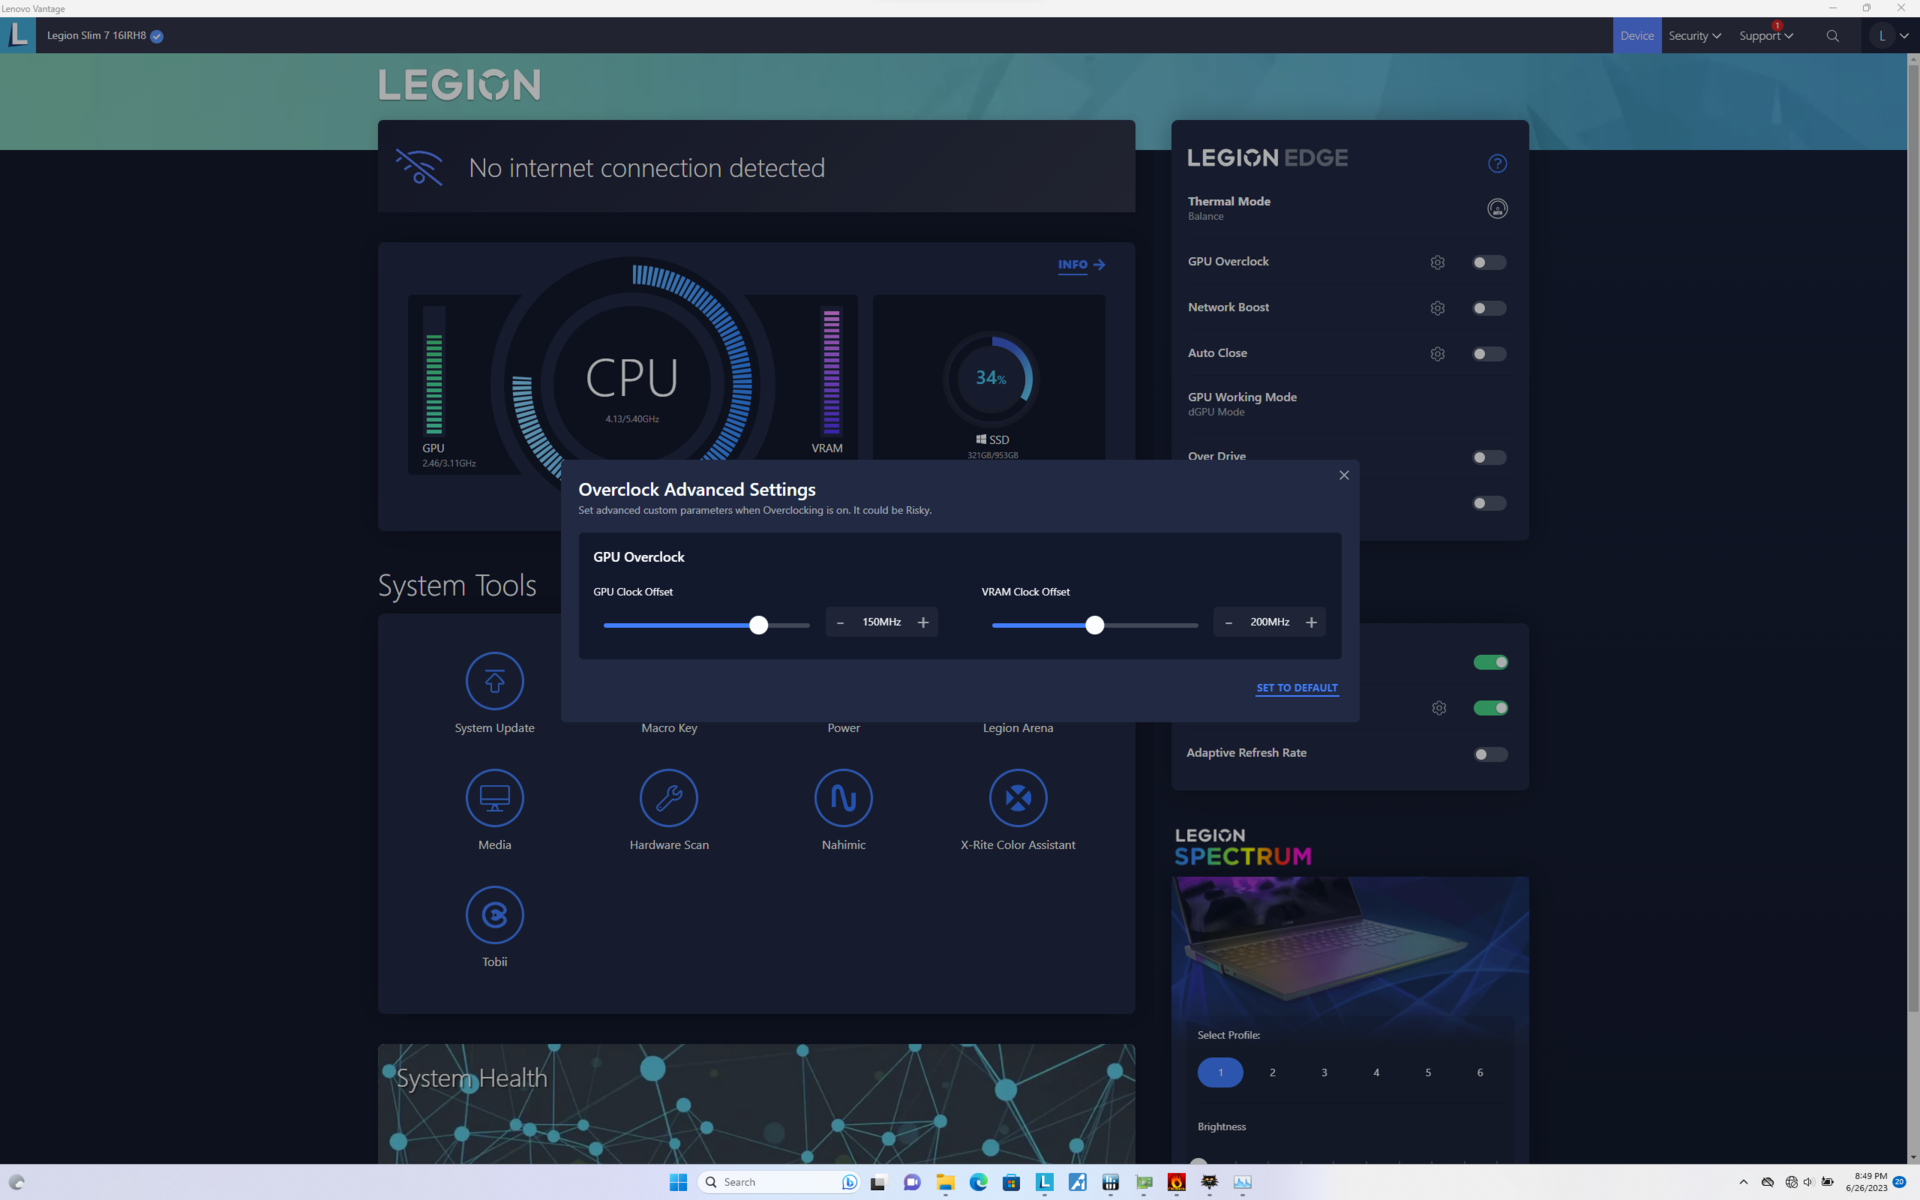
Wydajność GPU spada o 5 procent, jeśli funkcja Overclock jest wyłączona. W trybie zrównoważonym wydajność CPU i GPU spadłaby odpowiednio o około 10% i 15%, jak pokazuje poniższa tabela. Niektórzy użytkownicy mogą preferować cichsze wentylatory w trybie zrównoważonym, nawet jeśli oznacza to niższą wydajność.
Obniżenie wydajności do RTX 4060 z naszej konfiguracji RTX 4070 powinno wpłynąć na wydajność GPU o około 10 do 15 procent, bazując na naszych doświadczeniach z kartami Legion Pro 5 16.
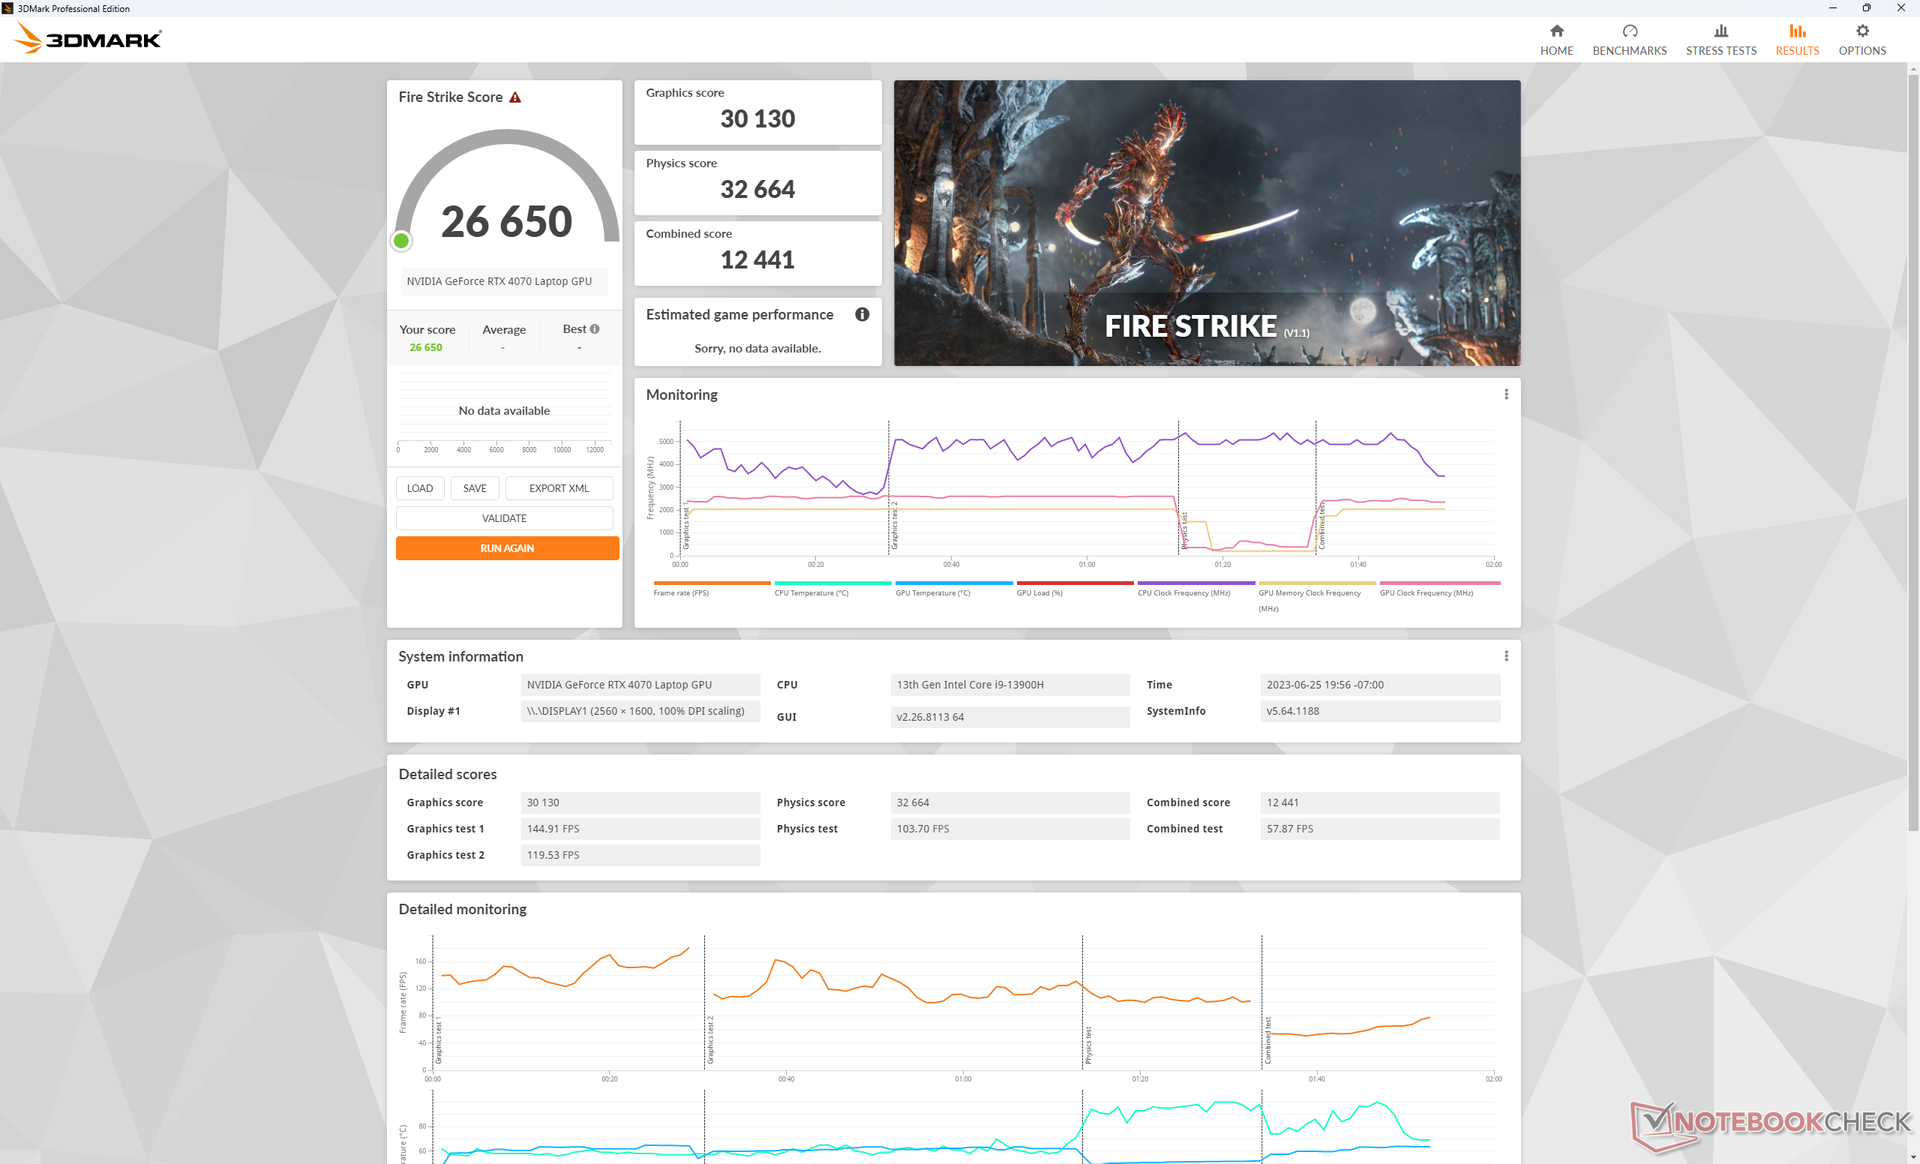
| Ustawienie profilu zasilania | Fire Strike Wynik fizyki | Fire Strike Wynik GPU | Fire Strike Wynik łączny |
| Wydajność + włączone podkręcanie GPU + włączony Overdrive | 32664 | 30130 | 12441 |
| Wydajność + włączone podkręcanie GPU + wyłączony Overdrive | 32439 | 30153 | 13360 |
| Wydajność + Podkręcenie GPU wyłączone + Overdrive wyłączony | 32550 | 28629 (-5%) | 12319 |
| Zrównoważony | 27499 (-16%) | 27708 (-8%) | 11295 (-9%) |
| 3DMark Performance rating - Percent | |
| Lenovo Legion Pro 7 RTX4090 -1! | |
| Alienware x16 R1 | |
| Zotac Gaming GeForce RTX 4070 AMP Airo | |
| Lenovo Legion Slim 7i 16 Gen 8 | |
| Przeciętny NVIDIA GeForce RTX 4070 Laptop GPU | |
| Asus ROG Zephyrus Duo 16 GX650RX -2! | |
| Lenovo Legion Pro 5 16IRX8 | |
| HP Omen 16-b1090ng -1! | |
| Lenovo Legion 7 15IMH05-81YT001VGE -1! | |
| Dell G16 7620 -1! | |
| Lenovo Legion C7 15IMH05 82EH0030GE -1! | |
| 3DMark 11 - 1280x720 Performance GPU | |
| Lenovo Legion Pro 7 RTX4090 | |
| Alienware x16 R1 | |
| Zotac Gaming GeForce RTX 4070 AMP Airo | |
| Lenovo Legion Slim 7i 16 Gen 8 | |
| Przeciętny NVIDIA GeForce RTX 4070 Laptop GPU (24229 - 46434, n=67) | |
| Asus ROG Zephyrus Duo 16 GX650RX | |
| Lenovo Legion Pro 5 16IRX8 | |
| HP Omen 16-b1090ng | |
| Lenovo Legion 7 15IMH05-81YT001VGE | |
| Dell G16 7620 | |
| Lenovo Legion C7 15IMH05 82EH0030GE | |
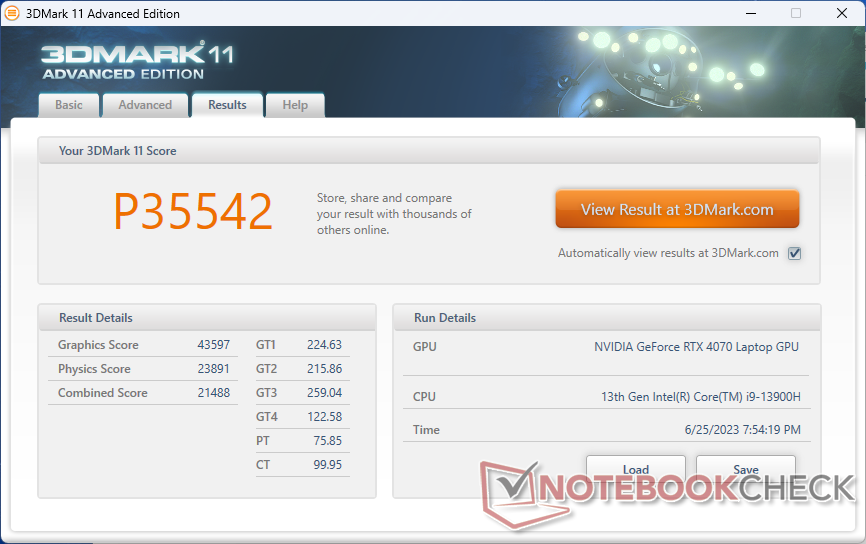
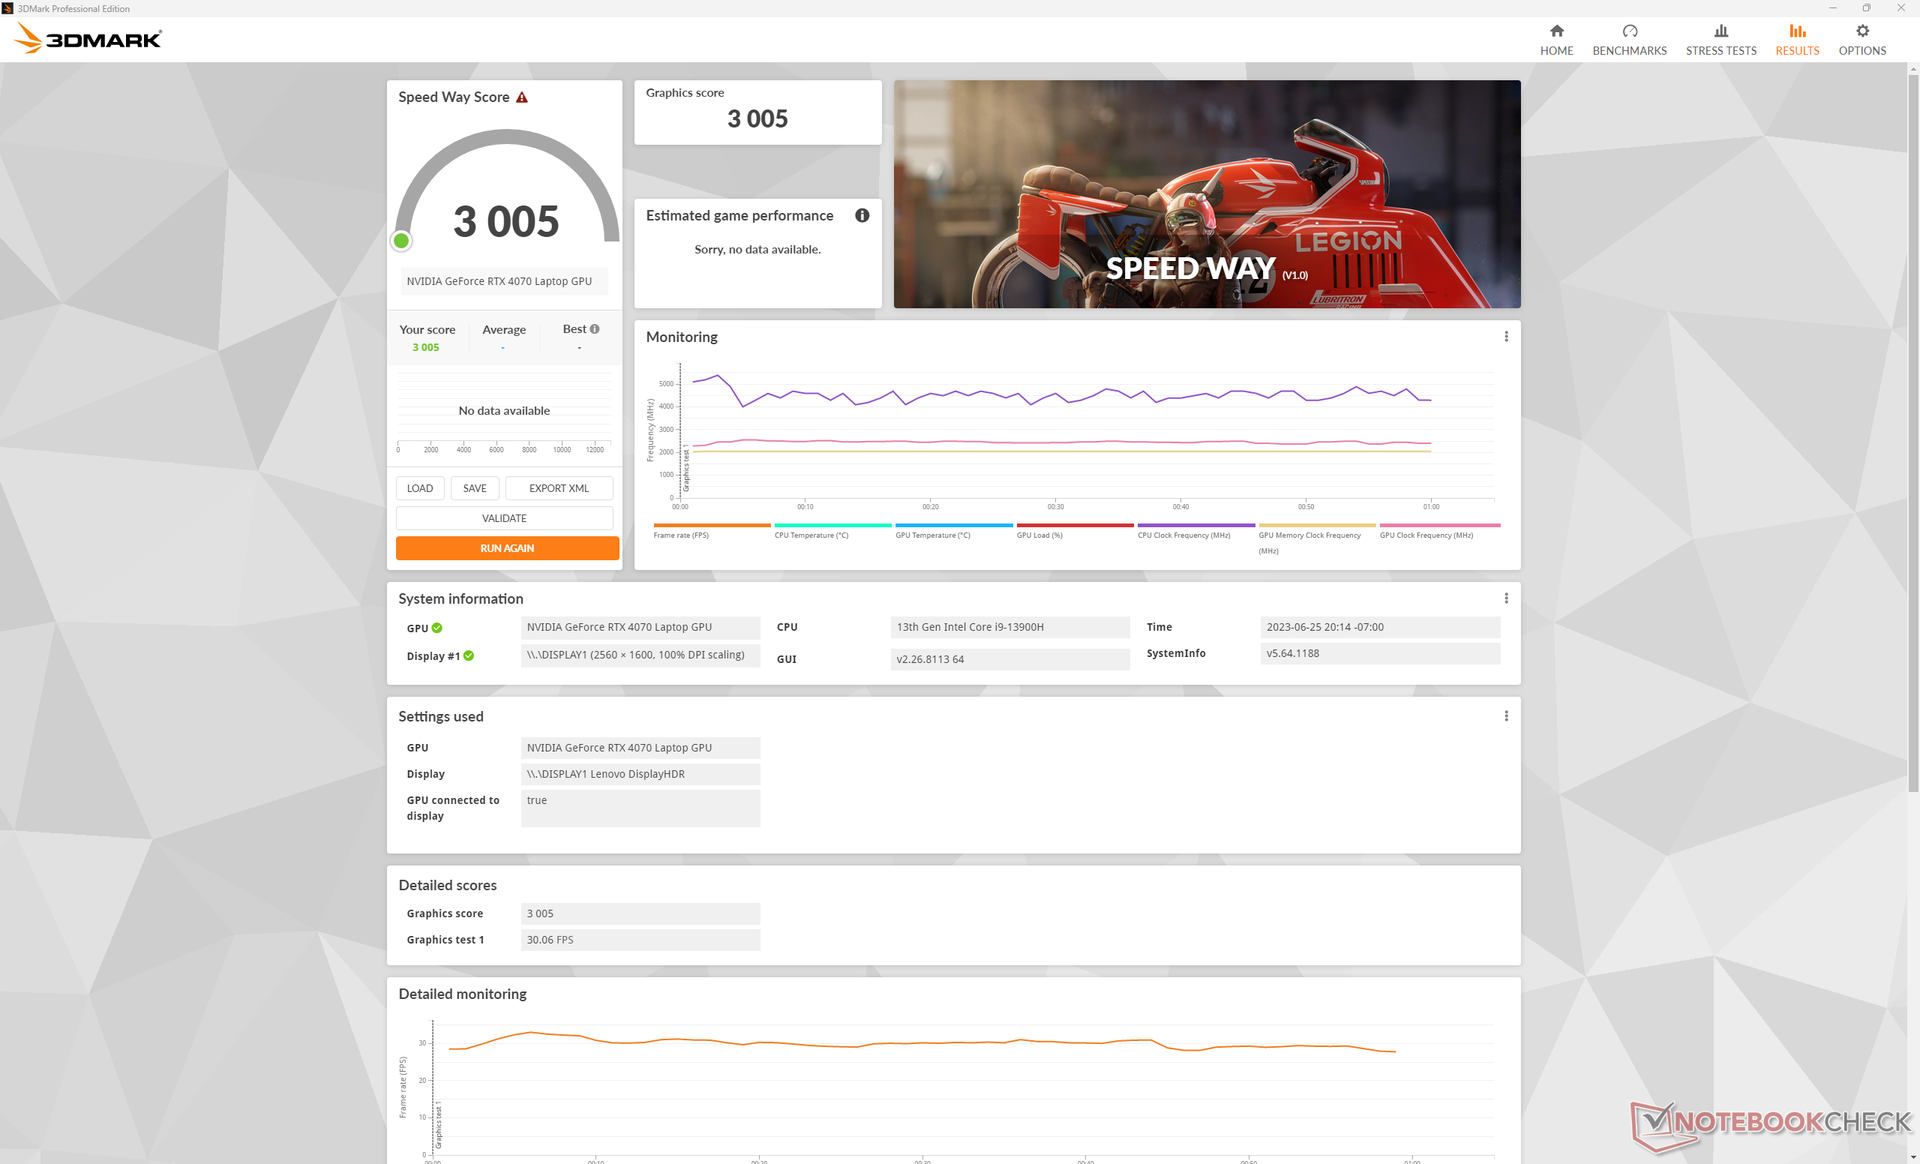
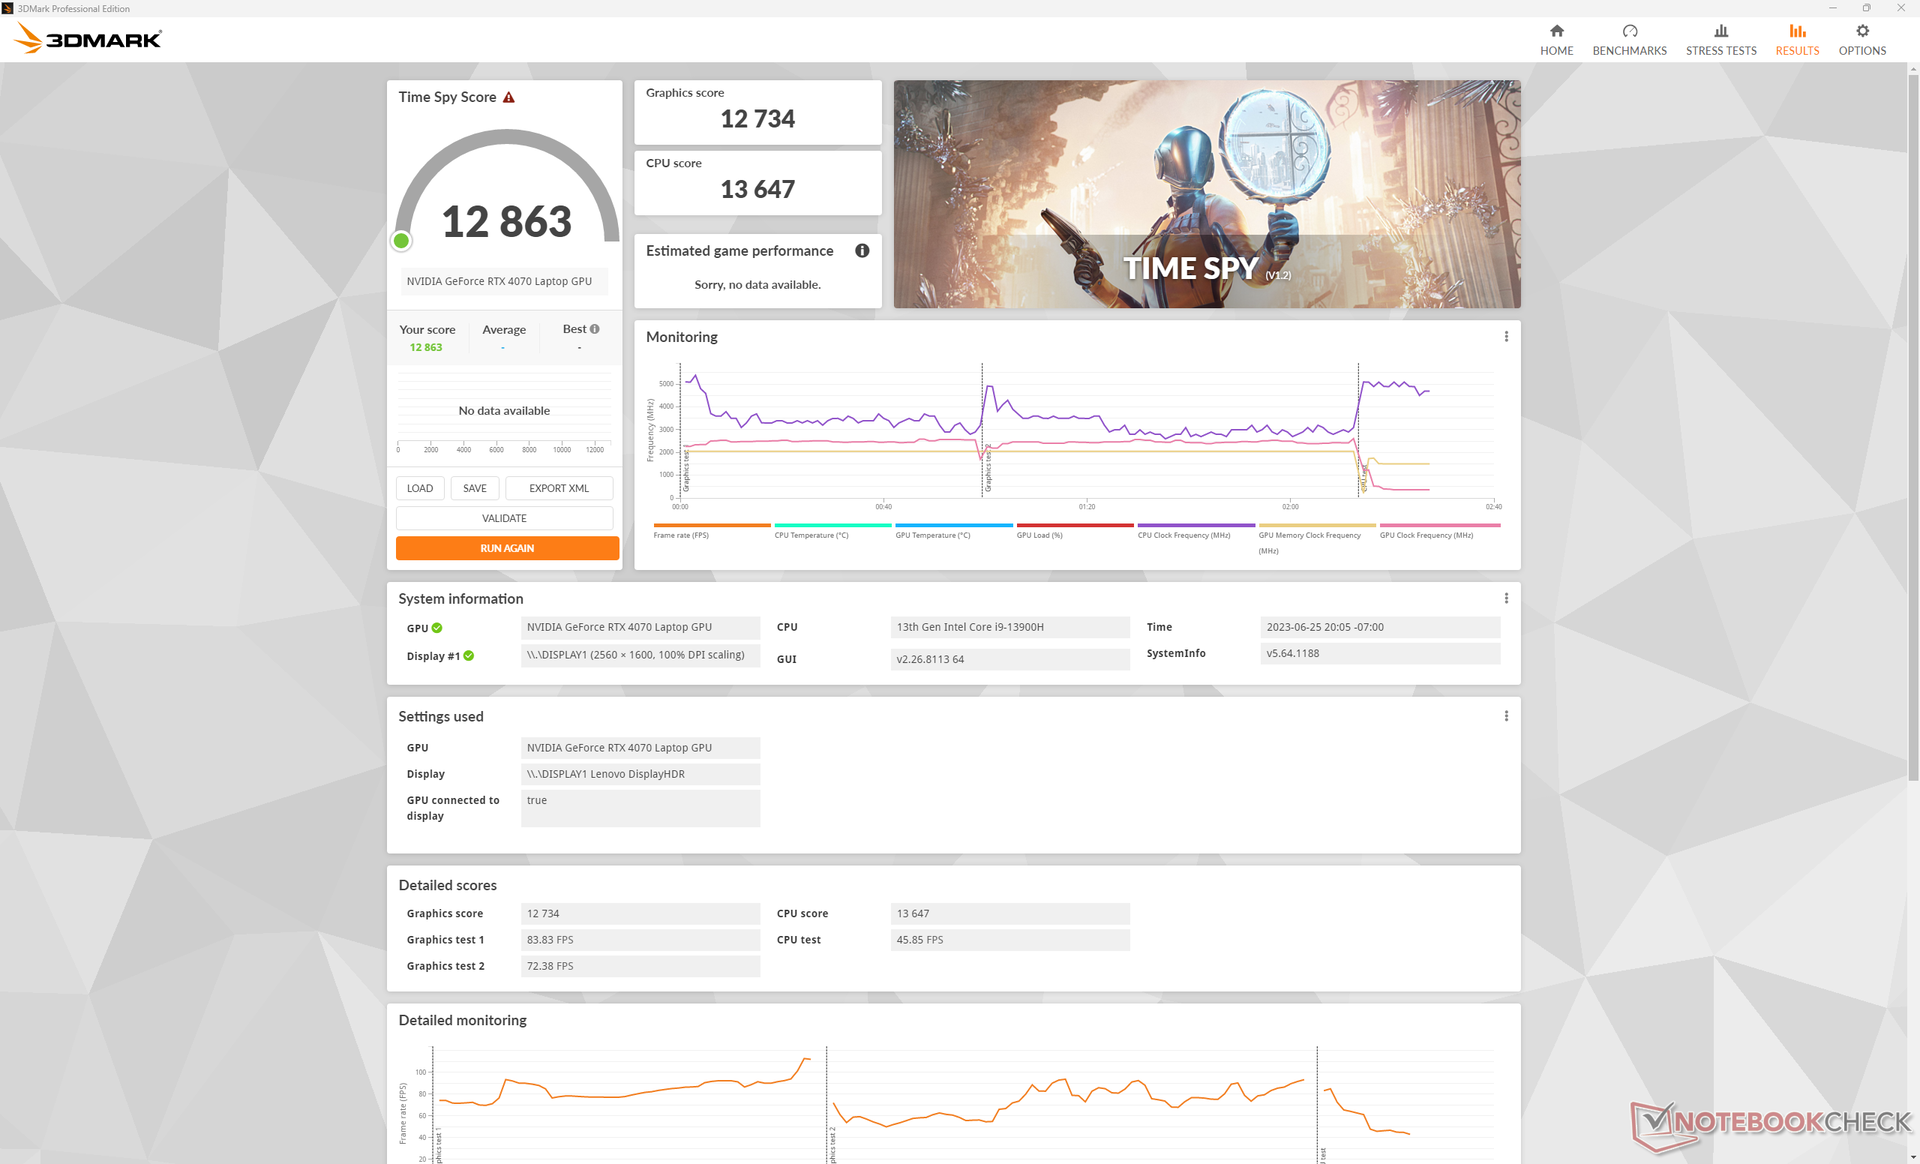
| 3DMark 11 Performance | 35542 pkt. | |
| 3DMark Fire Strike Score | 26650 pkt. | |
| 3DMark Time Spy Score | 12863 pkt. | |
Pomoc | ||
* ... im mniej tym lepiej
Wydajność w grach
Mobilny RTX 4070 dobrze sprawdza się w rozdzielczości 1440p/1600p i 60 FPS przy wysokich ustawieniach, podczas gdy znacznie szybszy desktopowy RTX 4070 Ti może celować w ustawienia Ultra lub maksymalne. Przykładowo, uruchomienie Returnal na maksymalnych ustawieniach 1440p z naszym Lenovo ledwo przekroczyłoby 50 FPS.
DLSS staje się znacznie ważniejszy, gdy RTX 4070 zaczyna odczuwać brak mocy. Uruchamiając Cyberpunk 2077 w ustawieniach 4K Ultra, na przykład, średnia wyniosłaby zaledwie 23 FPS bez DLSS do bardziej grywalnych 38 FPS z włączonym DLSS2.
Witcher 3 FPS Chart
| low | med. | high | ultra | QHD | 4K | |
|---|---|---|---|---|---|---|
| GTA V (2015) | 184 | 180.3 | 175 | 115.2 | 94.3 | 98.7 |
| The Witcher 3 (2015) | 459.3 | 356.8 | 225.9 | 117.9 | 70 | |
| Dota 2 Reborn (2015) | 203 | 183.2 | 175.8 | 165.3 | 141.3 | |
| Final Fantasy XV Benchmark (2018) | 213 | 168.8 | 122.7 | 91.4 | 51.5 | |
| X-Plane 11.11 (2018) | 182.9 | 158.7 | 122.4 | 105.7 | ||
| Strange Brigade (2018) | 483 | 316 | 259 | 228 | 149.2 | 75.7 |
| Cyberpunk 2077 1.6 (2022) | 138.3 | 141.9 | 106.1 | 91 | 54.4 | 23.1 |
| Tiny Tina's Wonderlands (2022) | 244.3 | 204.8 | 143.7 | 113.9 | 78.1 | 37 |
| F1 22 (2022) | 258 | 261 | 219 | 81.5 | 46.2 | 25.9 |
| Returnal (2023) | 83 | 81 | 76 | 61 | 52 | 27 |
Emisje
Hałas systemowy
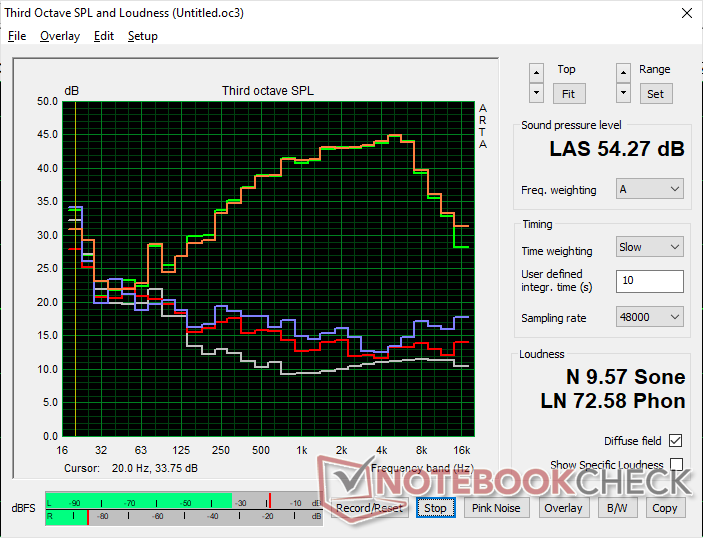
Wewnętrzne wentylatory są zawsze aktywne na poziomie nieco poniżej 26 dB(A) na cichym tle 23 dB(A). Nie jest to wystarczająco głośne, aby rozpraszać uwagę w większości biur lub na konferencjach, a wentylatory doskonale radzą sobie z utrzymaniem ciszy przez dłuższy czas, nawet przy wyższych obciążeniach, takich jak 3DMark 06.
Granie w trybie wydajności spowodowałoby stały hałas wentylatora na poziomie 54,4 dB (A), który jest podobny do Alienware x16 R1, ale głośniejszy niż w Blade 16. Przejście w tryb zrównoważony oznacza spadek wydajności, jak wspomniano powyżej, na rzecz zauważalnie cichszego hałasu wentylatora na poziomie 48,9 dB(A).
Hałas
| luz |
| 23.6 / 23.6 / 25.7 dB |
| obciążenie |
| 27.6 / 54.4 dB |
 | ||
30 dB cichy 40 dB(A) słyszalny 50 dB(A) irytujący |
||
min: | ||
| Lenovo Legion Slim 7i 16 Gen 8 GeForce RTX 4070 Laptop GPU, i9-13900H, Samsung PM9A1 MZVL21T0HCLR | HP Omen 16-wf000 GeForce RTX 4080 Laptop GPU, i7-13700HX, SK hynix PC801 HFS002TEJ9X101N | Alienware x16 R1 GeForce RTX 4080 Laptop GPU, i9-13900HK, SK hynix PC801 HFS001TEJ9X101N | Lenovo Legion Pro 7 RTX4090 GeForce RTX 4090 Laptop GPU, i9-13900HX, Samsung PM9A1 MZVL21T0HCLR | Asus ROG Strix G16 G614JZ GeForce RTX 4080 Laptop GPU, i9-13980HX, WD PC SN560 SDDPNQE-1T00 | Razer Blade 16 Early 2023 GeForce RTX 4080 Laptop GPU, i9-13950HX, SSSTC CA6-8D1024 | |
|---|---|---|---|---|---|---|
| Noise | -15% | -6% | -25% | -17% | -2% | |
| wyłączone / środowisko * (dB) | 22.8 | 23 -1% | 22.7 -0% | 25 -10% | 25 -10% | 23 -1% |
| Idle Minimum * (dB) | 23.6 | 29.6 -25% | 23.1 2% | 28 -19% | 26 -10% | 23 3% |
| Idle Average * (dB) | 23.6 | 29.8 -26% | 25.8 -9% | 30 -27% | 28 -19% | 23 3% |
| Idle Maximum * (dB) | 25.7 | 30.4 -18% | 25.8 -0% | 38 -48% | 30 -17% | 23.6 8% |
| Load Average * (dB) | 27.6 | 33.8 -22% | 39.3 -42% | 48 -74% | 48 -74% | 39 -41% |
| Witcher 3 ultra * (dB) | 54.4 | 57 -5% | 49.9 8% | 53 3% | 49 10% | 51.6 5% |
| Load Maximum * (dB) | 54.4 | 58.3 -7% | 54.8 -1% | 55 -1% | 52 4% | 51.3 6% |
* ... im mniej tym lepiej
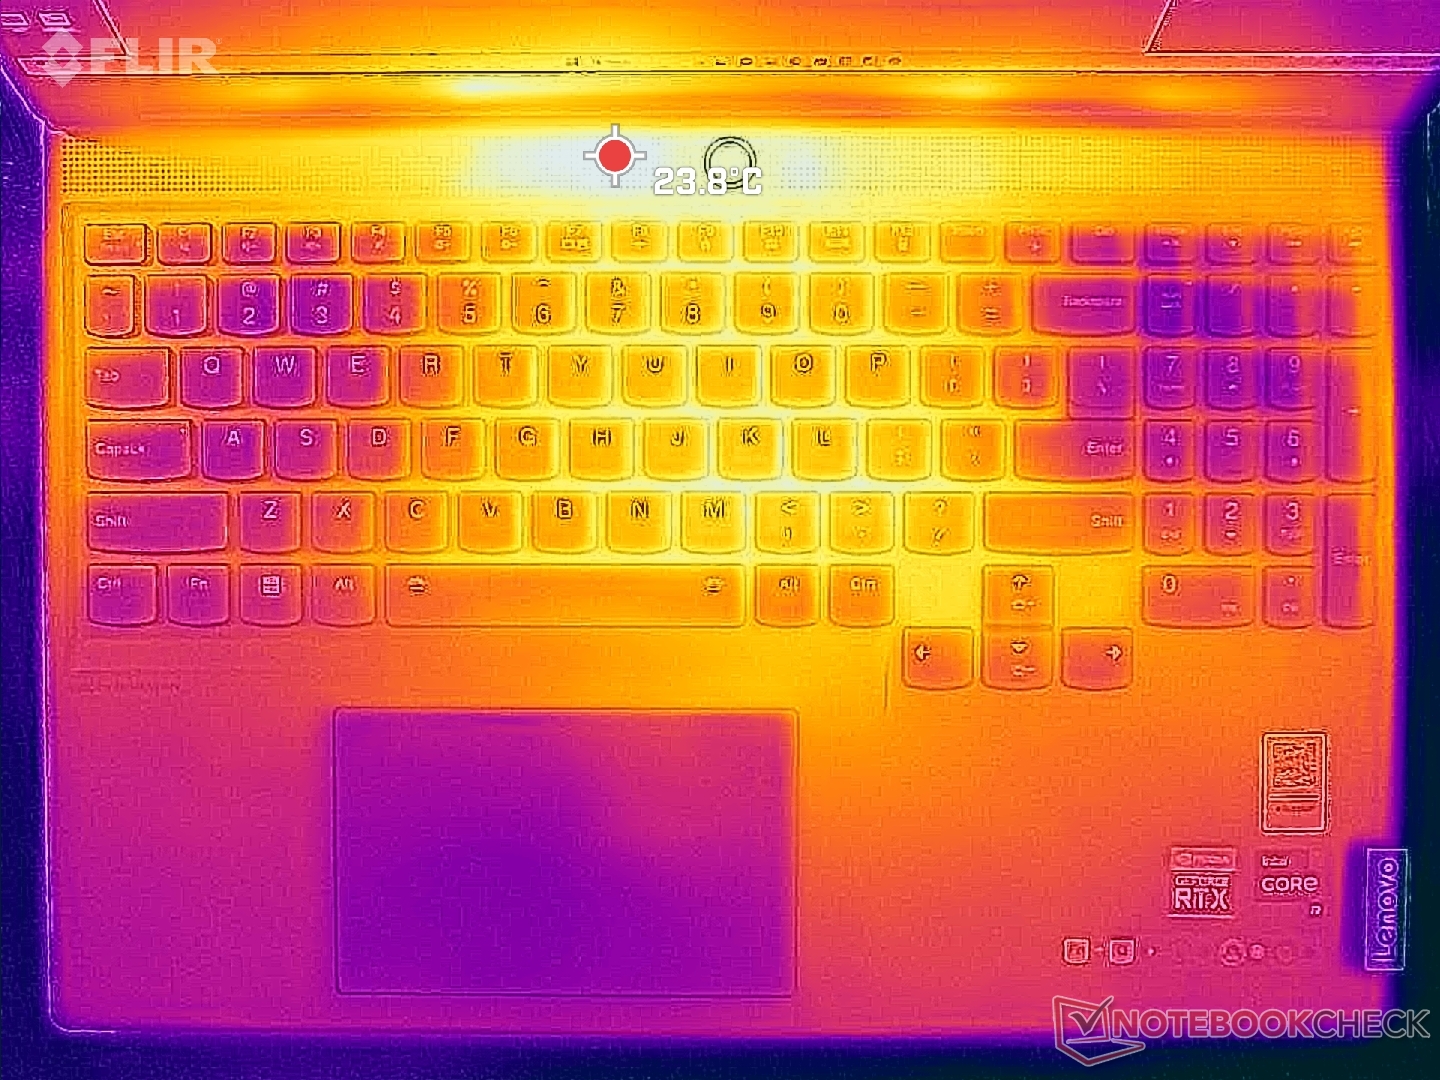
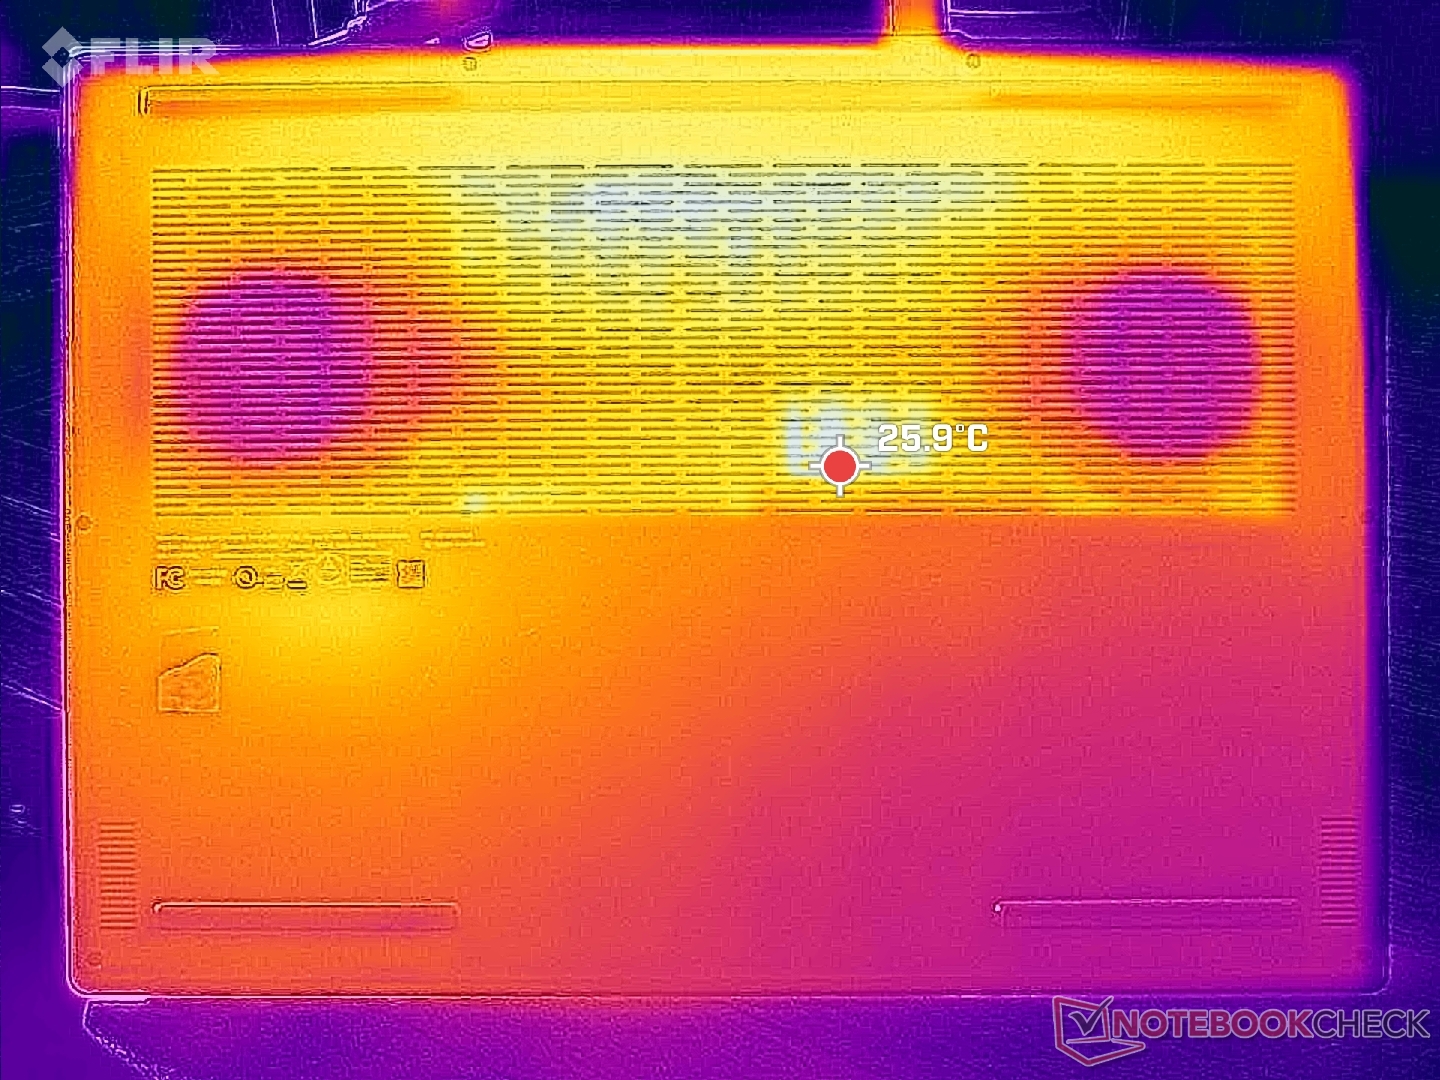
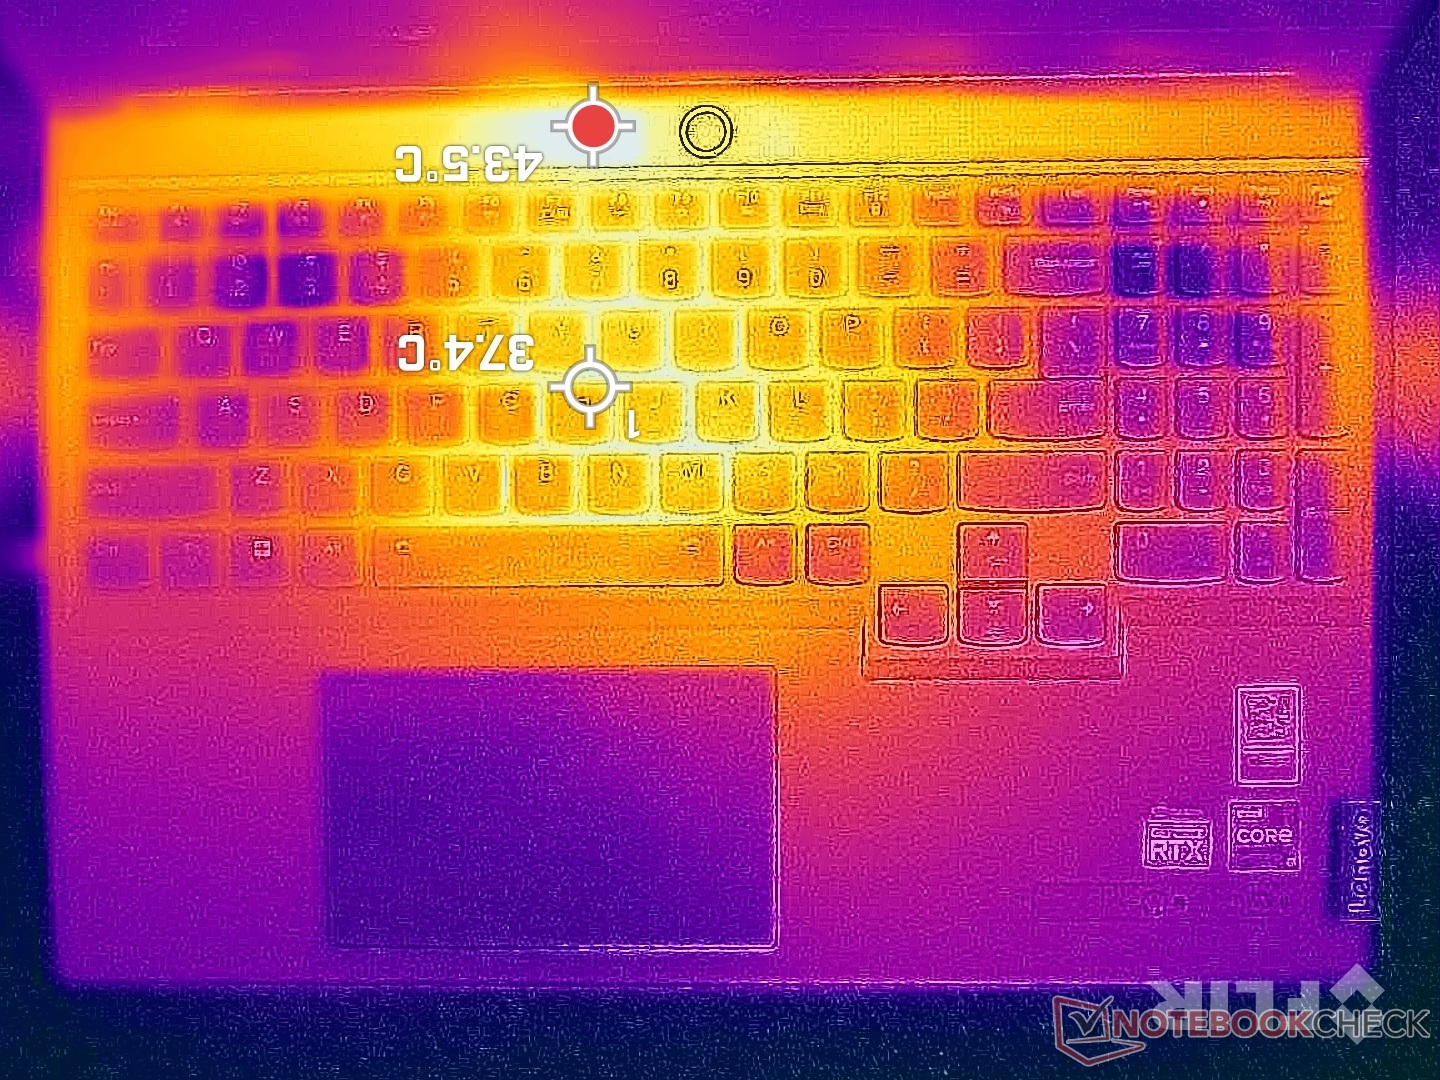
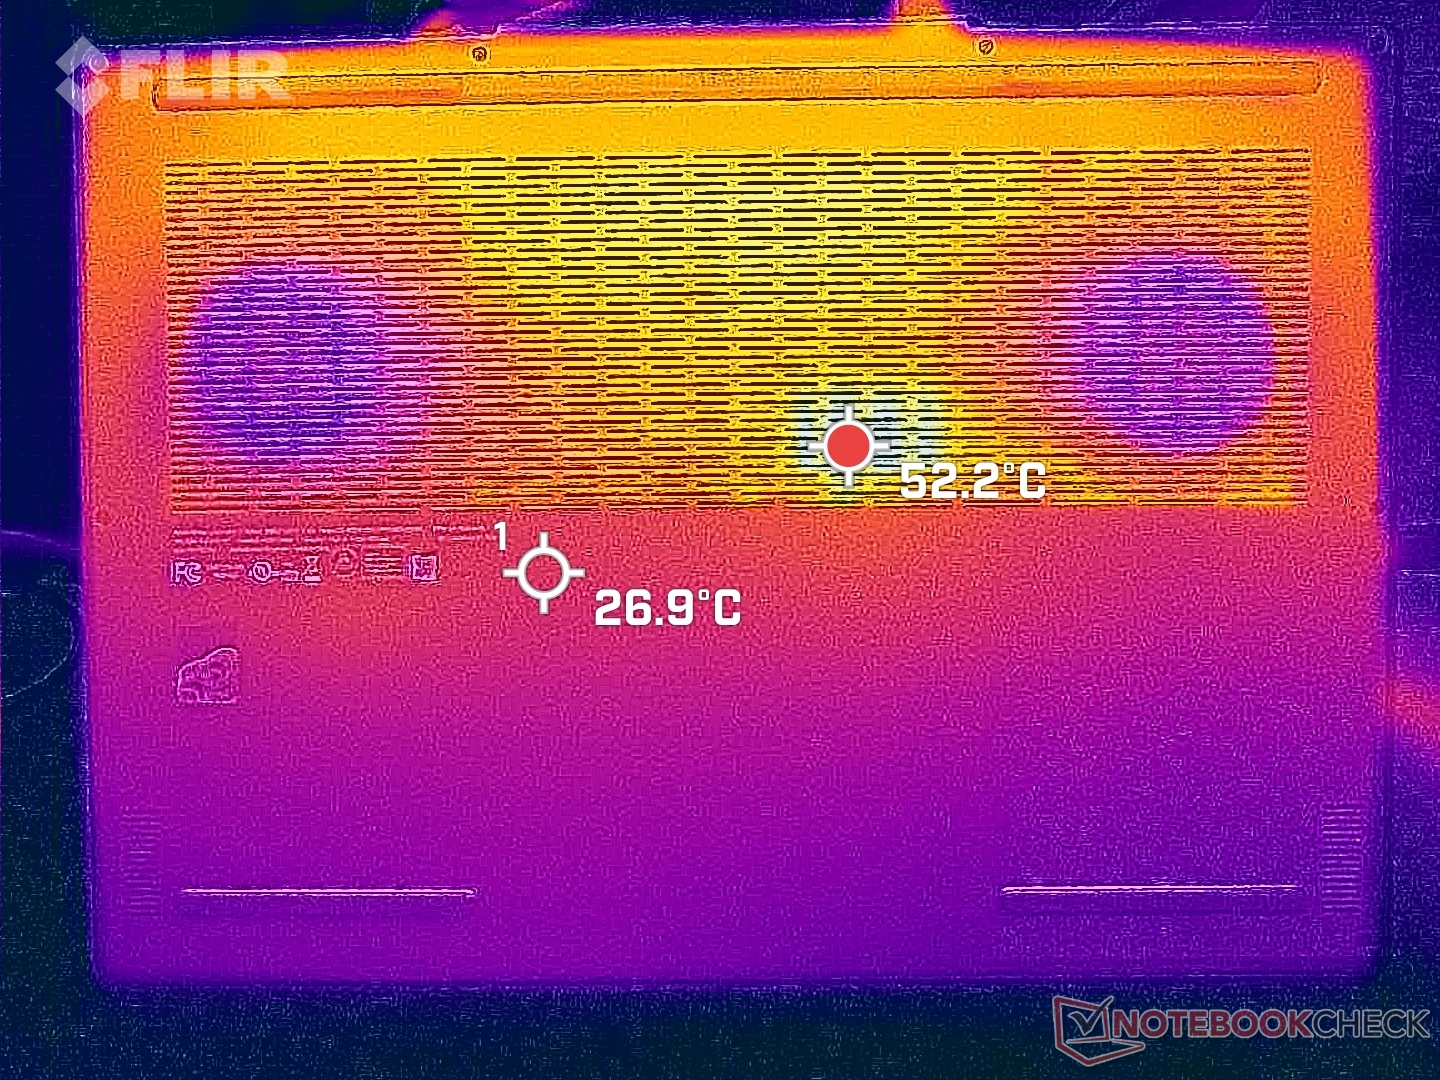
Temperatura
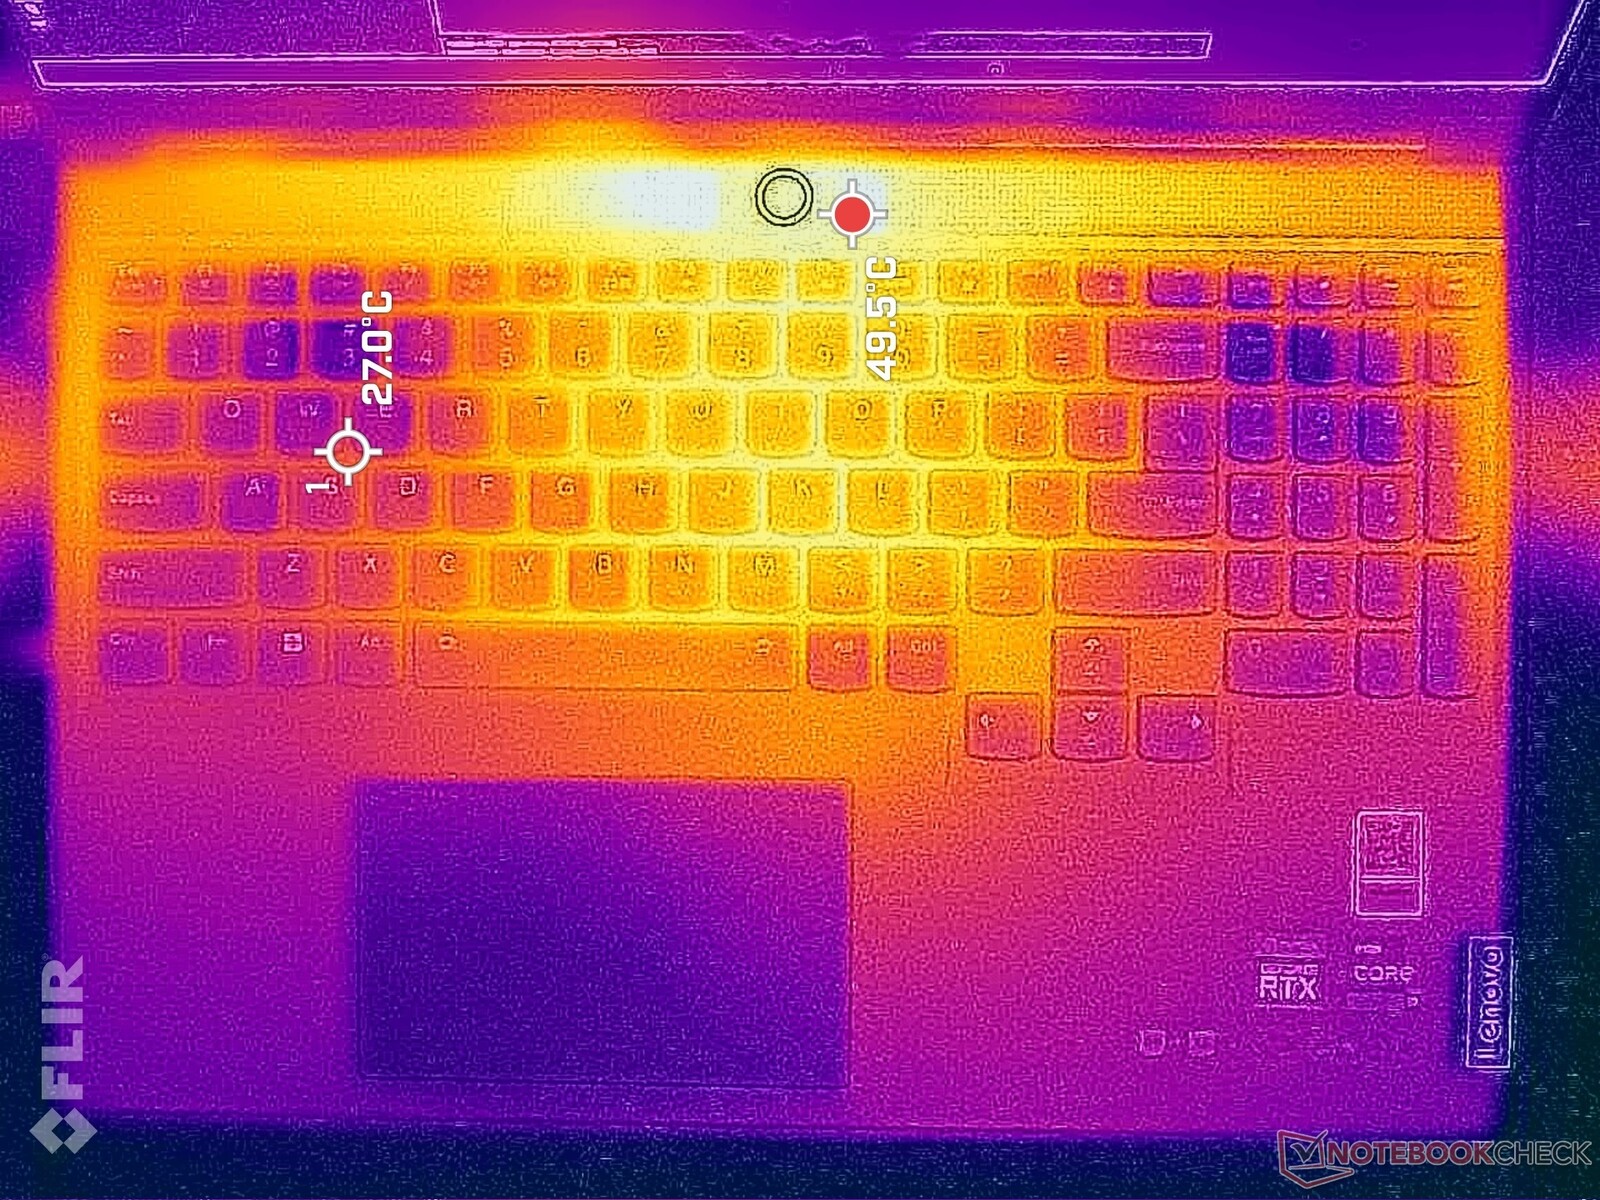
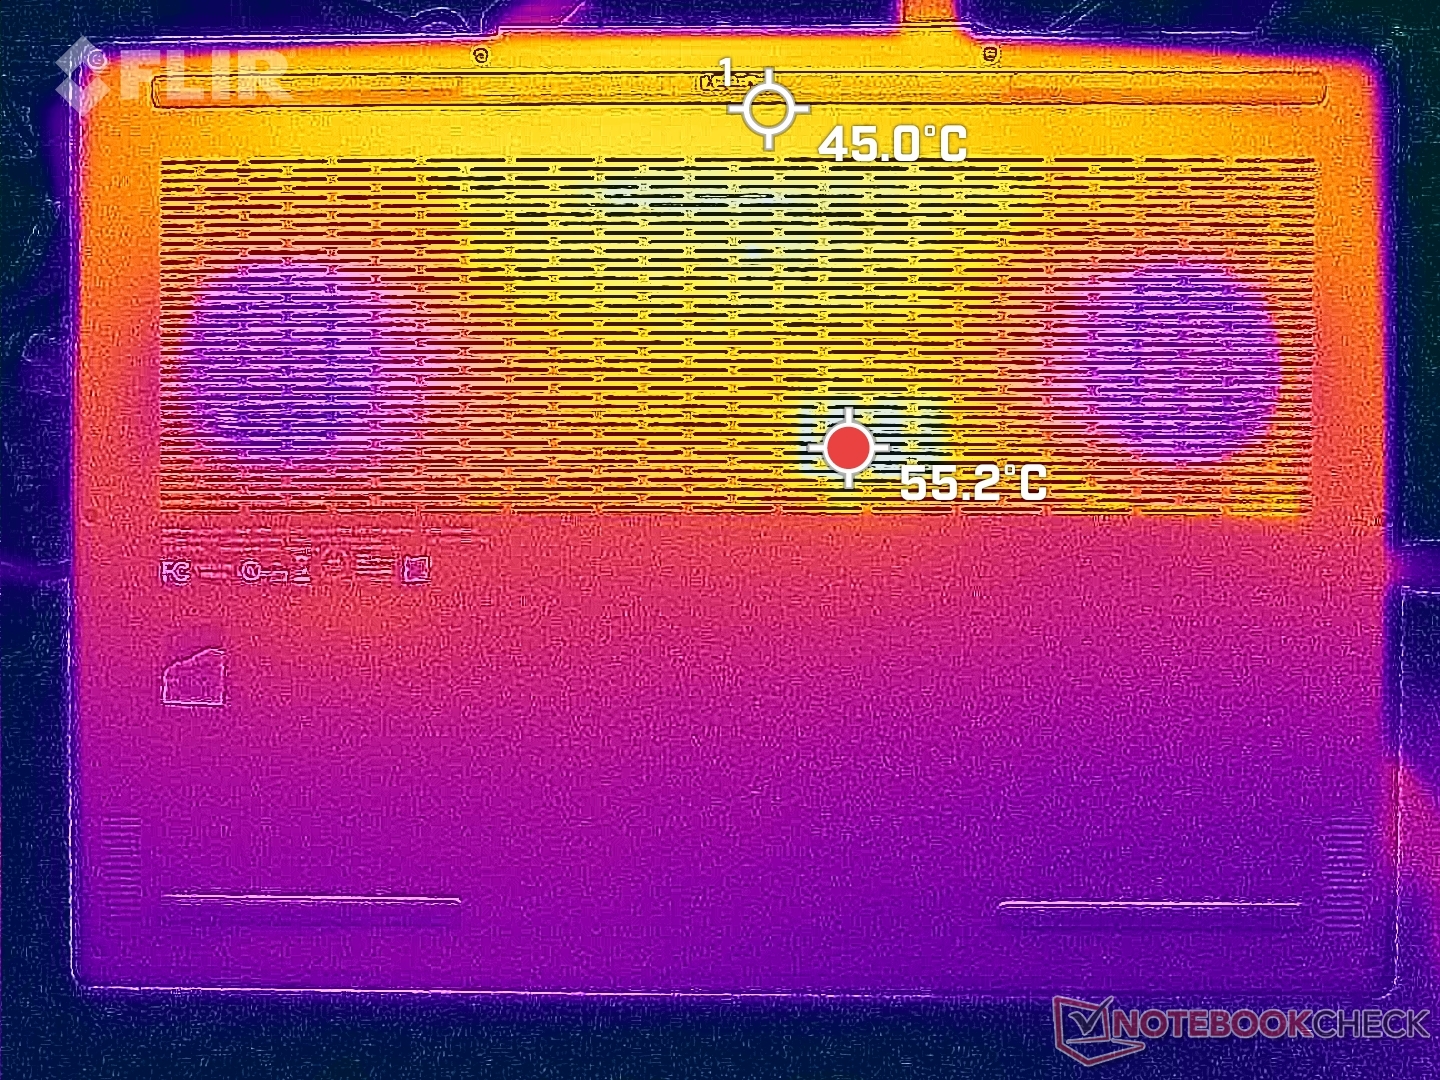
Temperatura powierzchni w gorących punktach może sięgać od 43 C do 50 C, podobnie jak w przypadku Alienware x16 R1 podczas uruchamiania wymagających obciążeń, takich jak gry. Na szczęście gorący punkt znajduje się najbliżej tylnej krawędzi i tuż nad pierwszym rzędem klawiszy klawiatury, jak pokazują poniższe mapy temperatur, gdzie palce i skóra raczej się nie dotykają. Podpórki pod nadgarstki i klawisze WASD pozostają chłodniejsze w porównaniu.
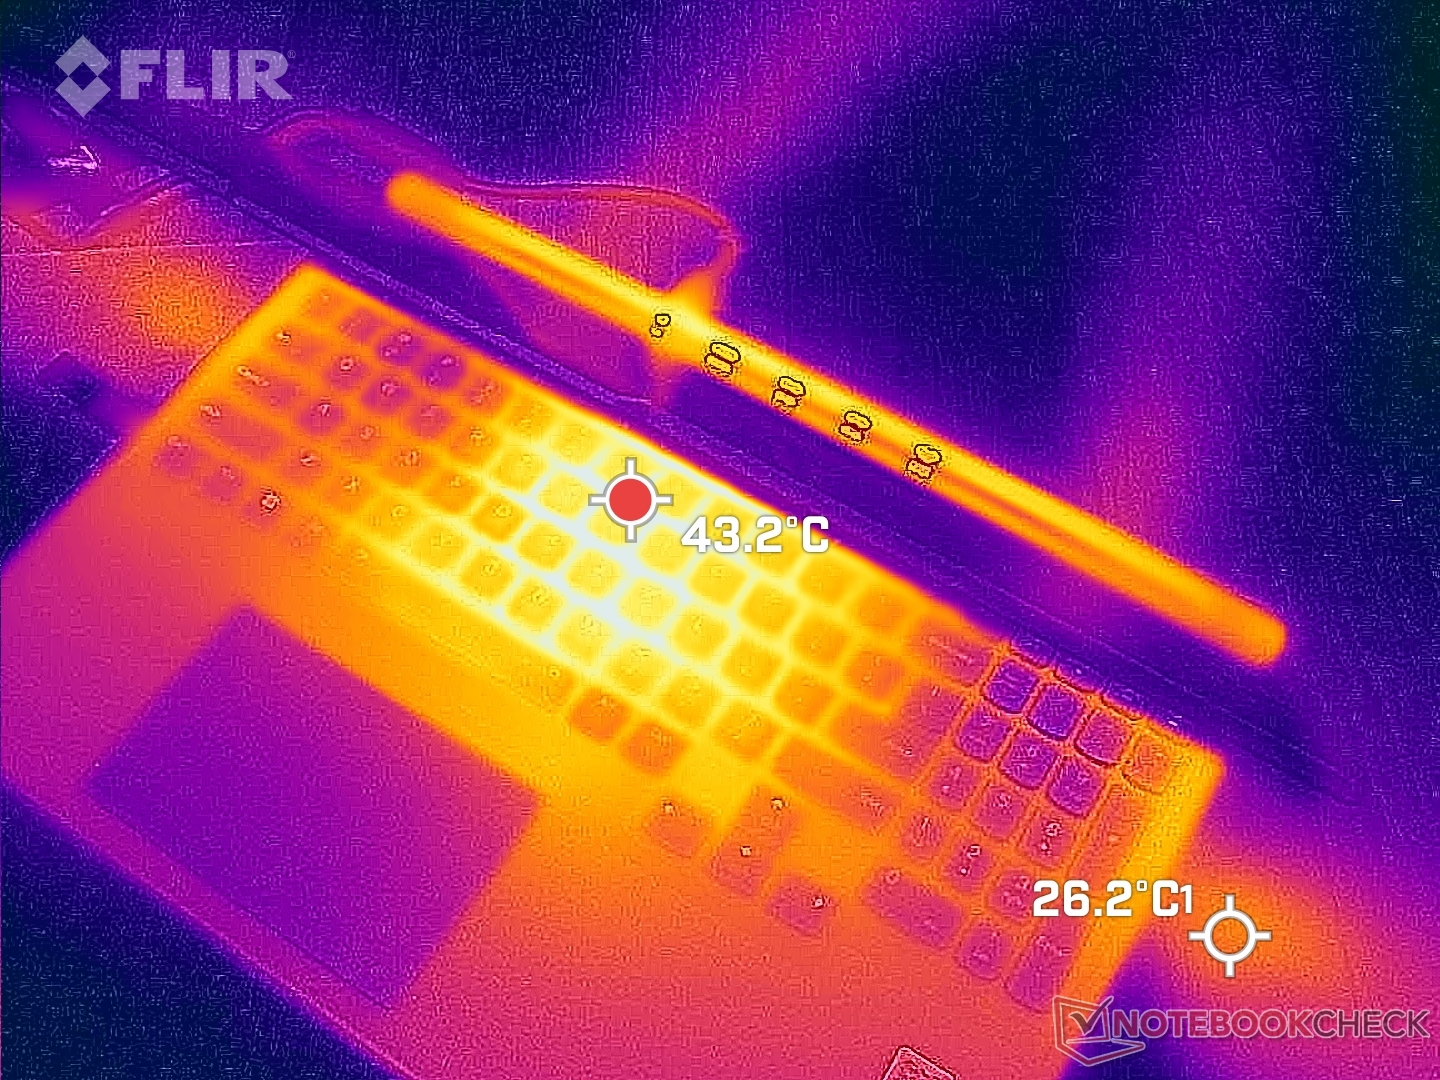
(-) Maksymalna temperatura w górnej części wynosi 49.8 °C / 122 F, w porównaniu do średniej 40.4 °C / 105 F , począwszy od 21.2 do 68.8 °C dla klasy Gaming.
(-) Dno nagrzewa się maksymalnie do 48.8 °C / 120 F, w porównaniu do średniej 43.2 °C / 110 F
(+) W stanie bezczynności średnia temperatura górnej części wynosi 26 °C / 79 F, w porównaniu ze średnią temperaturą urządzenia wynoszącą 33.9 °C / ### class_avg_f### F.
(±) Podczas gry w Wiedźmina 3 średnia temperatura górnej części wynosi 35.1 °C / 95 F, w porównaniu do średniej temperatury urządzenia wynoszącej 33.9 °C / ## #class_avg_f### F.
(+) Podpórki pod nadgarstki i touchpad są chłodniejsze niż temperatura skóry i maksymalnie 29.4 °C / 84.9 F i dlatego są chłodne w dotyku.
(±) Średnia temperatura obszaru podparcia dłoni w podobnych urządzeniach wynosiła 28.8 °C / 83.8 F (-0.6 °C / -1.1 F).
| Lenovo Legion Slim 7i 16 Gen 8 Intel Core i9-13900H, NVIDIA GeForce RTX 4070 Laptop GPU | HP Omen 16-wf000 Intel Core i7-13700HX, NVIDIA GeForce RTX 4080 Laptop GPU | Alienware x16 R1 Intel Core i9-13900HK, NVIDIA GeForce RTX 4080 Laptop GPU | Lenovo Legion Pro 7 RTX4090 Intel Core i9-13900HX, NVIDIA GeForce RTX 4090 Laptop GPU | Asus ROG Strix G16 G614JZ Intel Core i9-13980HX, NVIDIA GeForce RTX 4080 Laptop GPU | Razer Blade 16 Early 2023 Intel Core i9-13950HX, NVIDIA GeForce RTX 4080 Laptop GPU | |
|---|---|---|---|---|---|---|
| Heat | 4% | -9% | -13% | -8% | 7% | |
| Maximum Upper Side * (°C) | 49.8 | 45 10% | 47.2 5% | 53 -6% | 54 -8% | 40 20% |
| Maximum Bottom * (°C) | 48.8 | 48.8 -0% | 47.8 2% | 59 -21% | 55 -13% | 37.6 23% |
| Idle Upper Side * (°C) | 29.4 | 29.2 1% | 36.8 -25% | 34 -16% | 29 1% | 32.4 -10% |
| Idle Bottom * (°C) | 30 | 28.8 4% | 35.8 -19% | 32 -7% | 33 -10% | 31.4 -5% |
* ... im mniej tym lepiej
Test warunków skrajnych
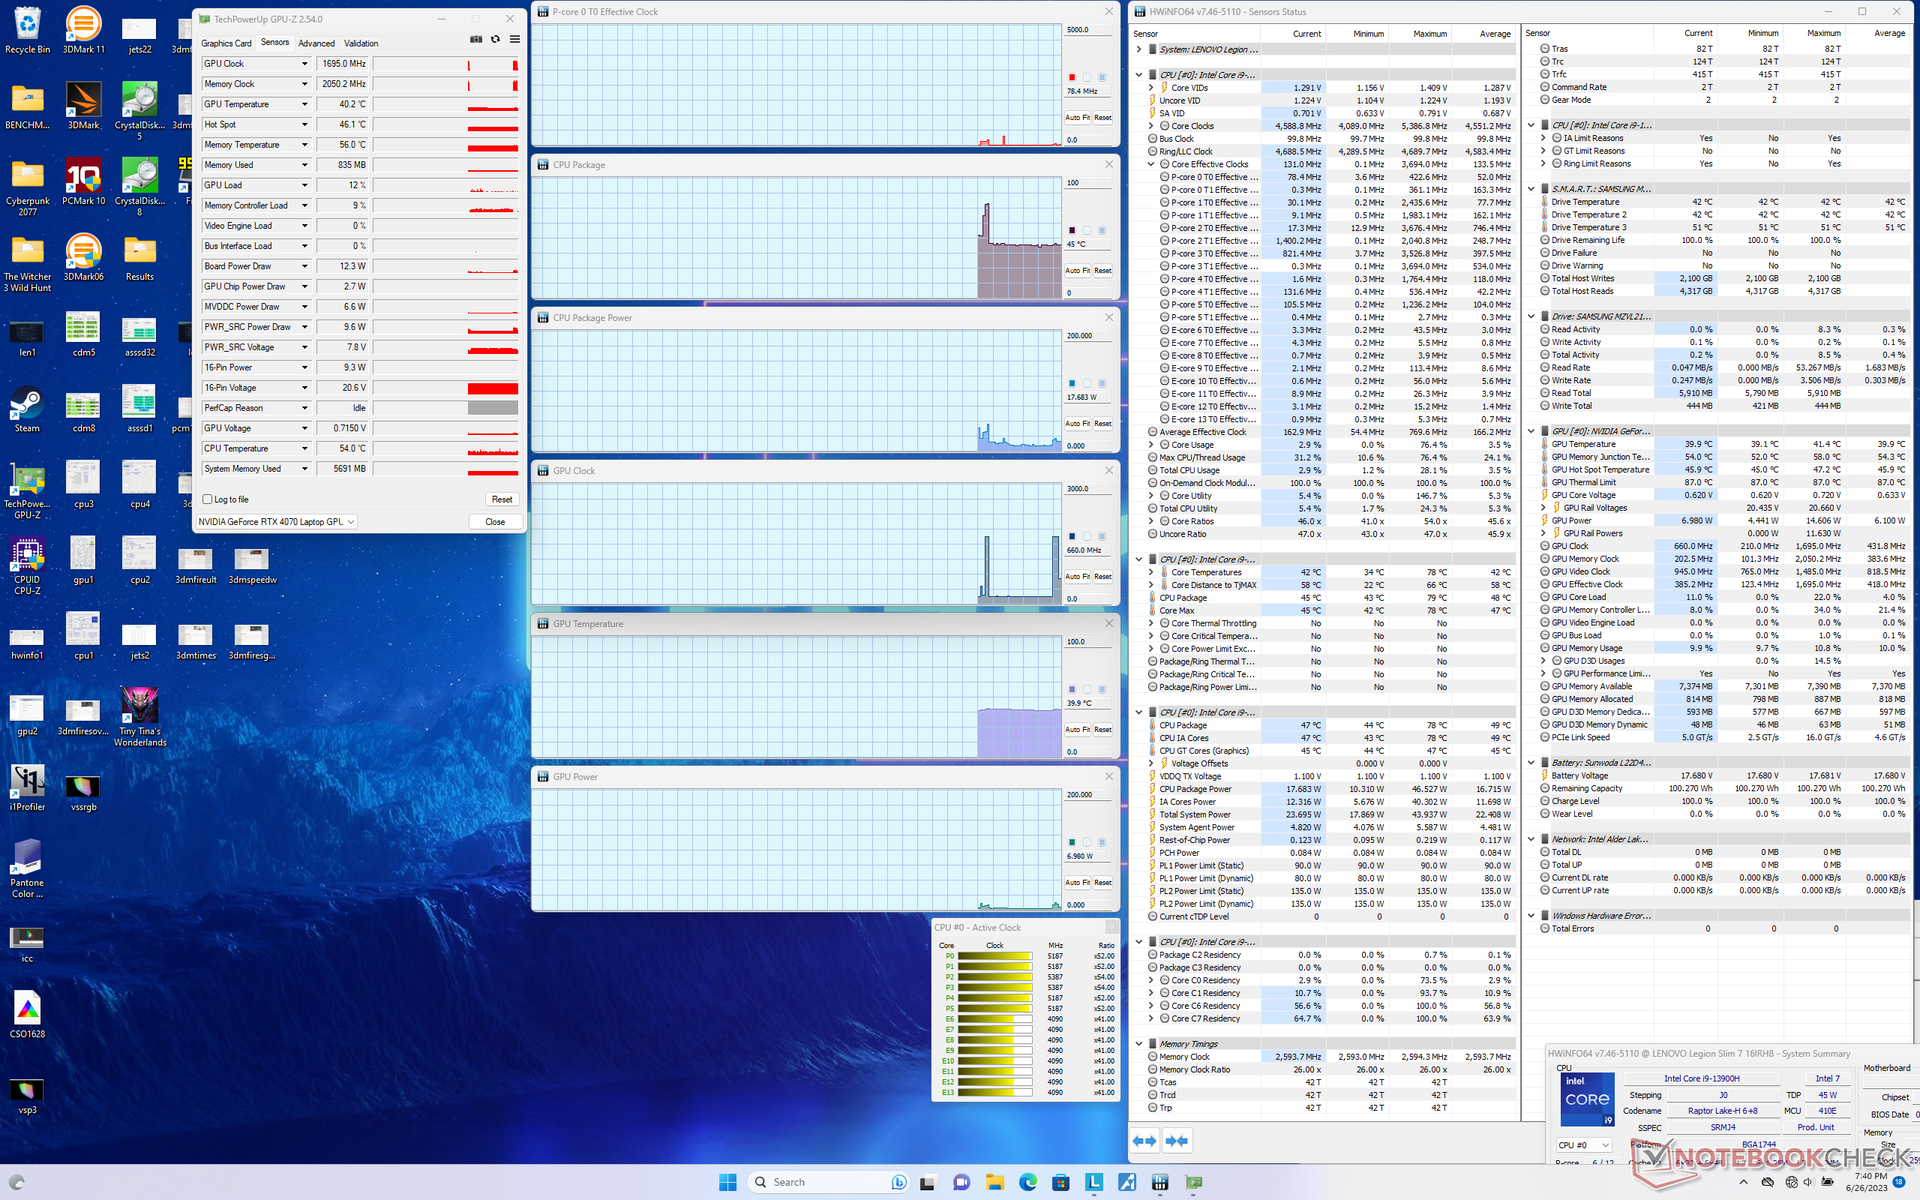
Częstotliwość taktowania procesora, temperatura i pobór mocy płyty podczas uruchamiania Prime95 wzrosły odpowiednio do 4,5 GHz, 87 C i 100 W, utrzymując się przez około minutę. Następnie procesor ostatecznie ustabilizował się na poziomie 3,5 GHz i 80 W, aby utrzymać rozsądną temperaturę rdzenia na poziomie 76 C. Powtórzenie tego samego testu na blade 16 z szybszym Core i9-13950HX spowodowałoby wyższą temperaturę rdzenia wynoszącą 82 C.
Procesor graficzny Nvidii ustabilizowałby się na poziomie 2580 MHz, 114 W i 71 C, odpowiednio, po ustawieniu w trybie Performance z aktywnymi Overdrive i GPU Overclock. Na papierze GPU celuje w 140 W, ale jesteśmy w stanie osiągnąć tylko 123 W nawet podczas uruchamiania Cyberpunk 2077. Pobór mocy płyty i temperatura rdzenia spadłyby odpowiednio do 84 W i 64 C, gdybyśmy grali w trybie zrównoważonym. Temperatury rdzenia są po chłodnej stronie jak na cienki i lekki laptop do gier; na przykład temperatury CPU i GPU w Alienware x16 R1 wynosiłyby od 80 do 95 C podczas uruchamiania tych samych gier.
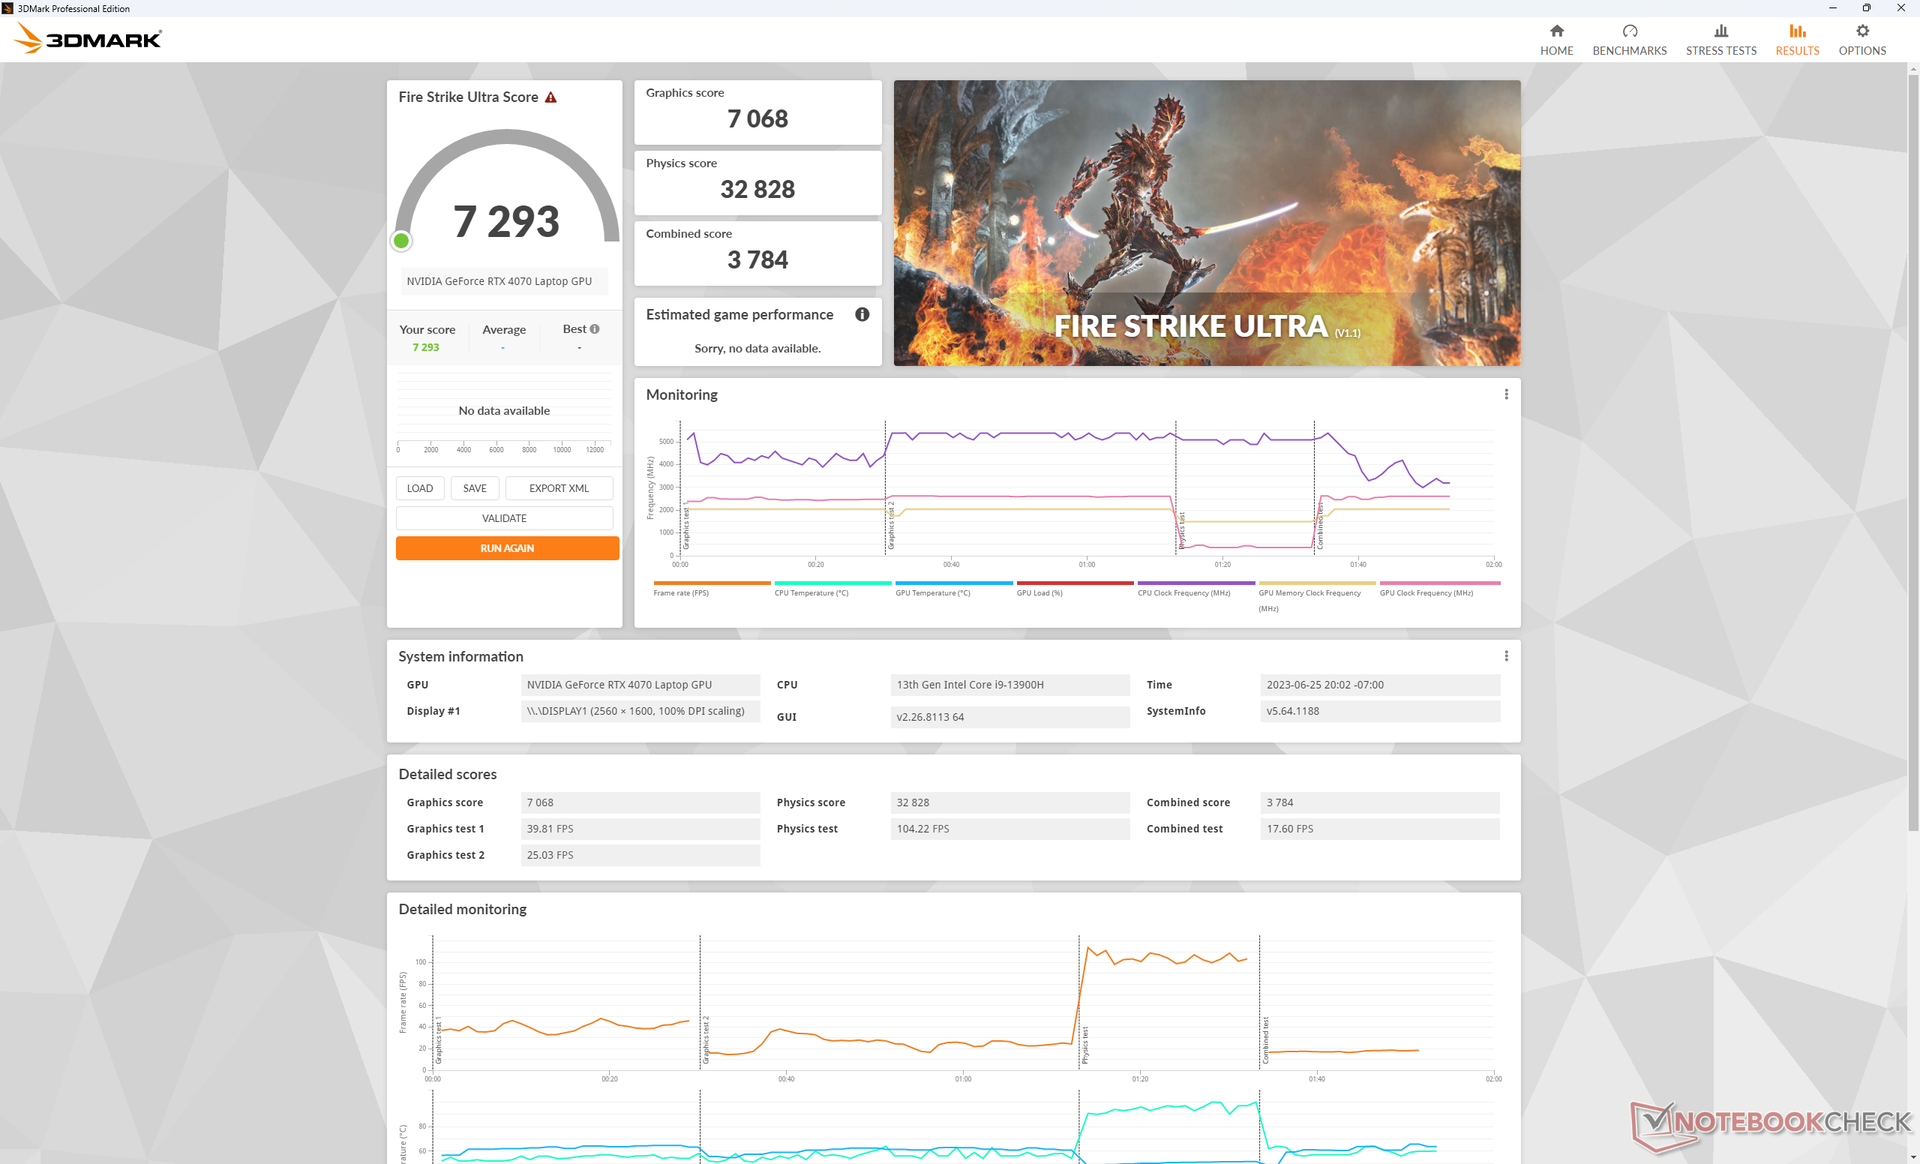
Praca na zasilaniu bateryjnym ogranicza wydajność, ponieważ profil zasilania Wydajność staje się wyszarzony. Fire Strike na bateriach zwróciłby wyniki fizyki i grafiki wynoszące odpowiednio 25602 i 21049 punktów, w porównaniu do 32664 i 30130 punktów przy zasilaniu sieciowym.
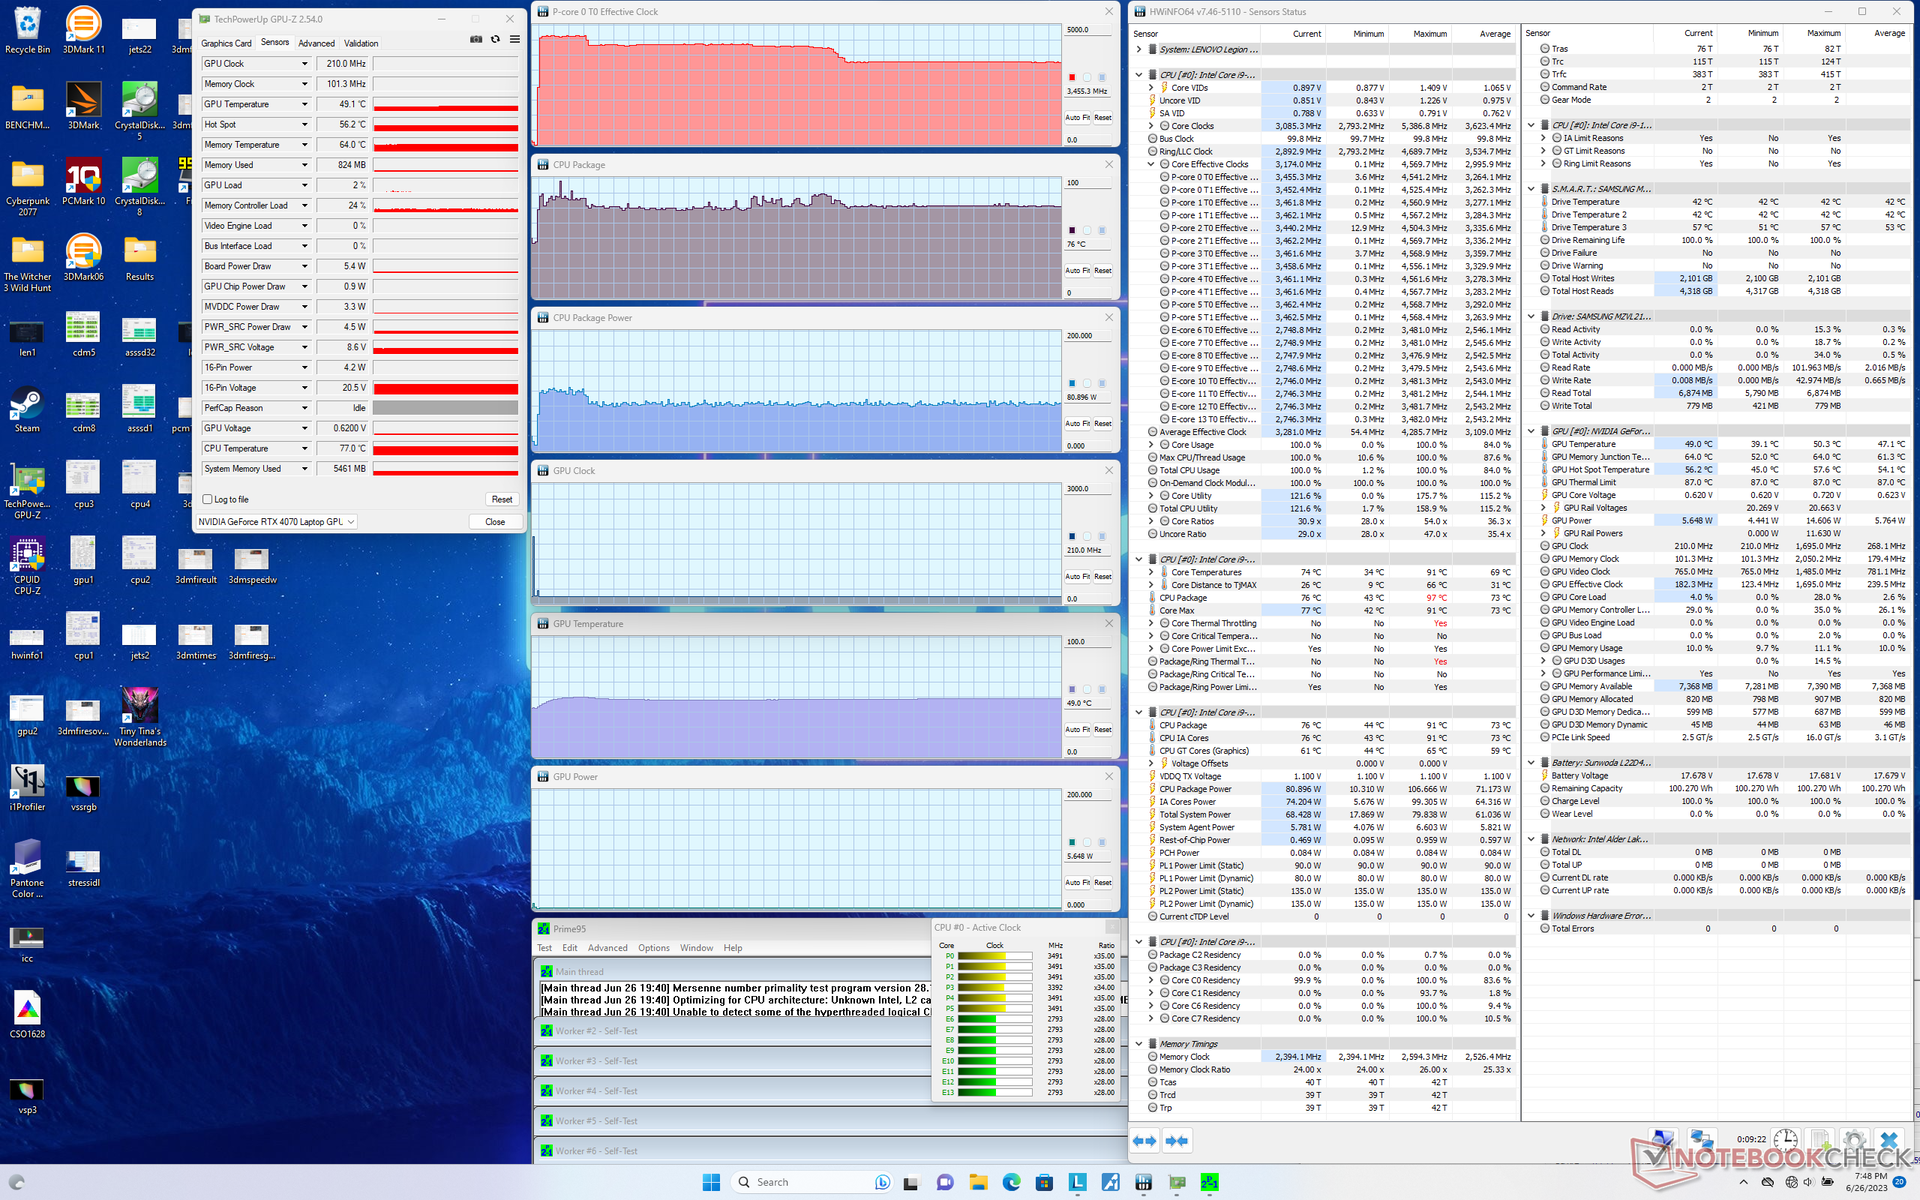
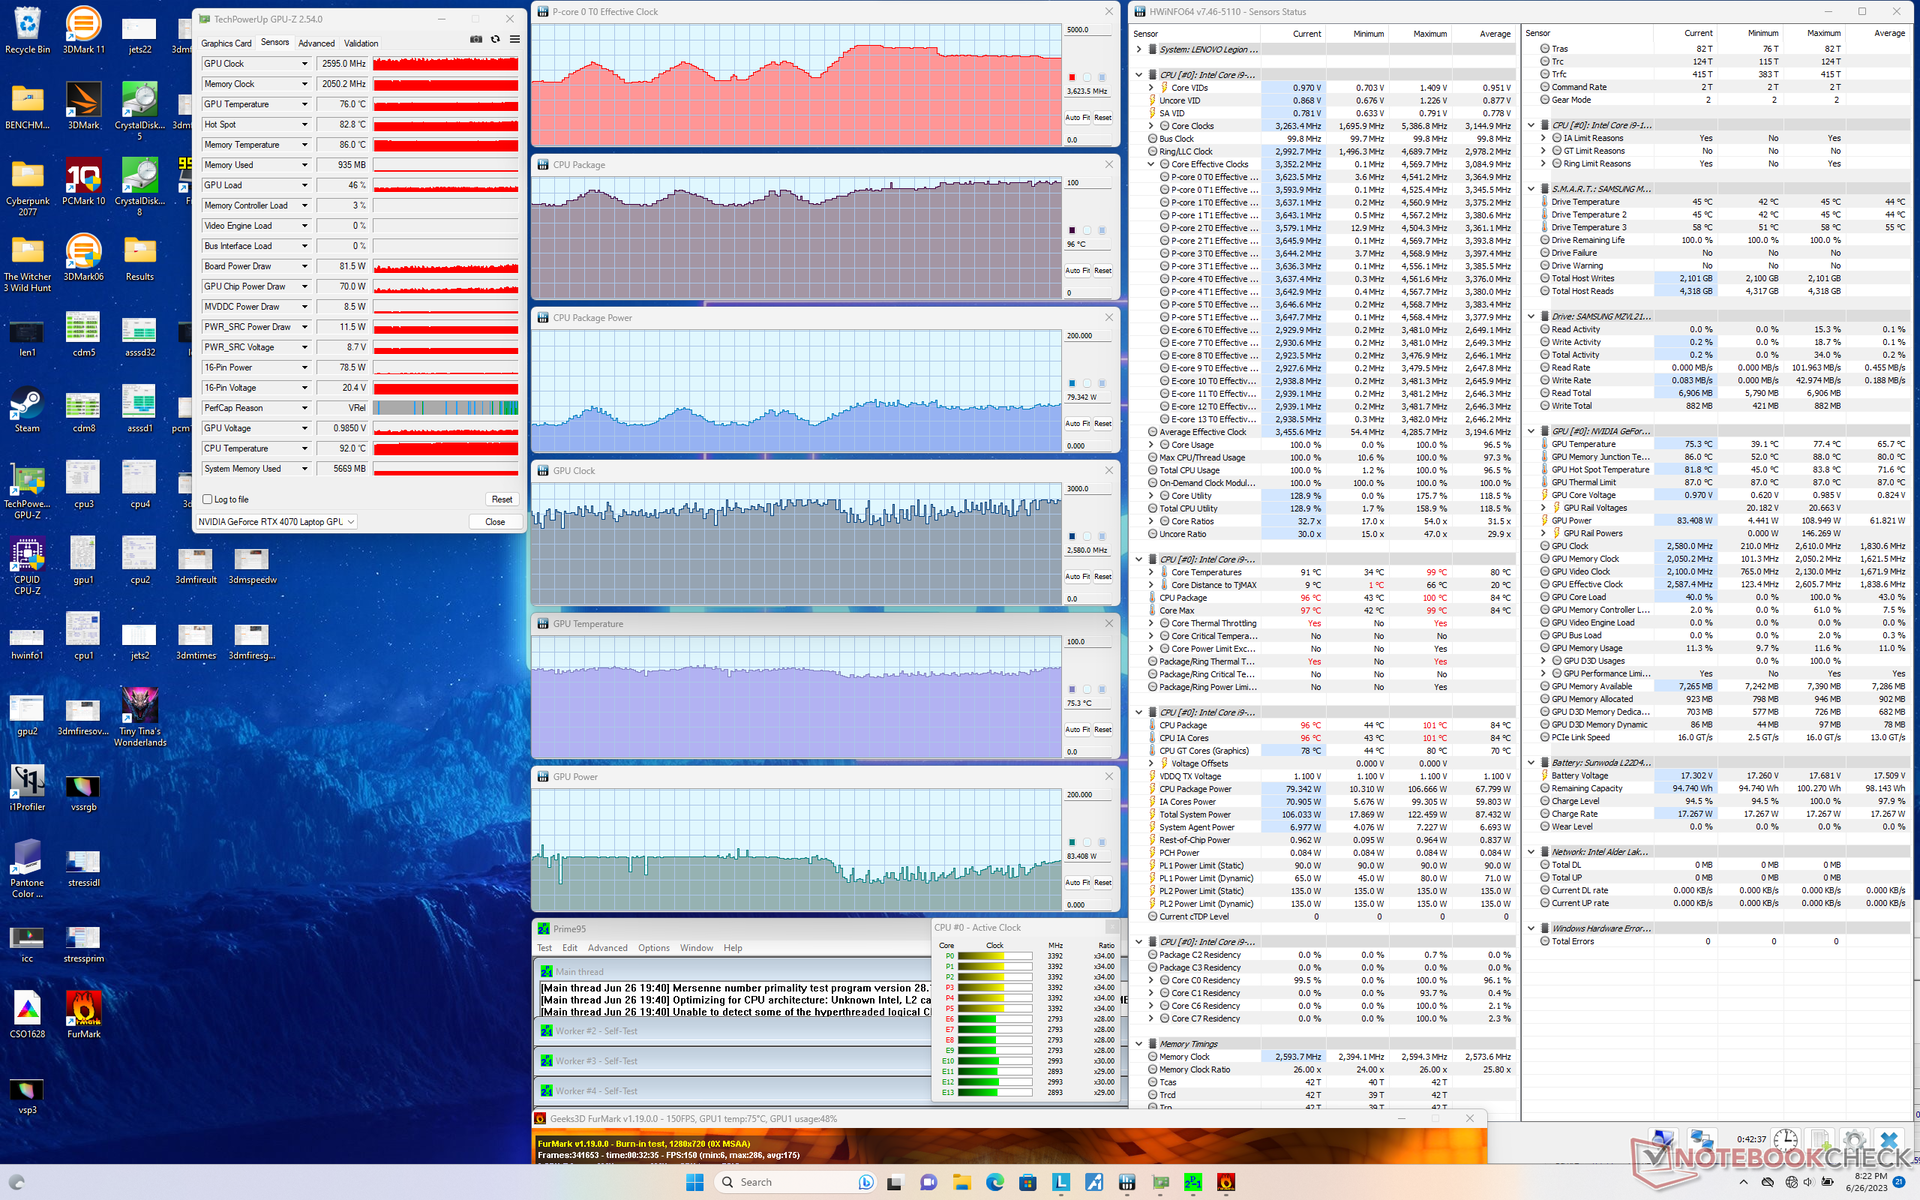
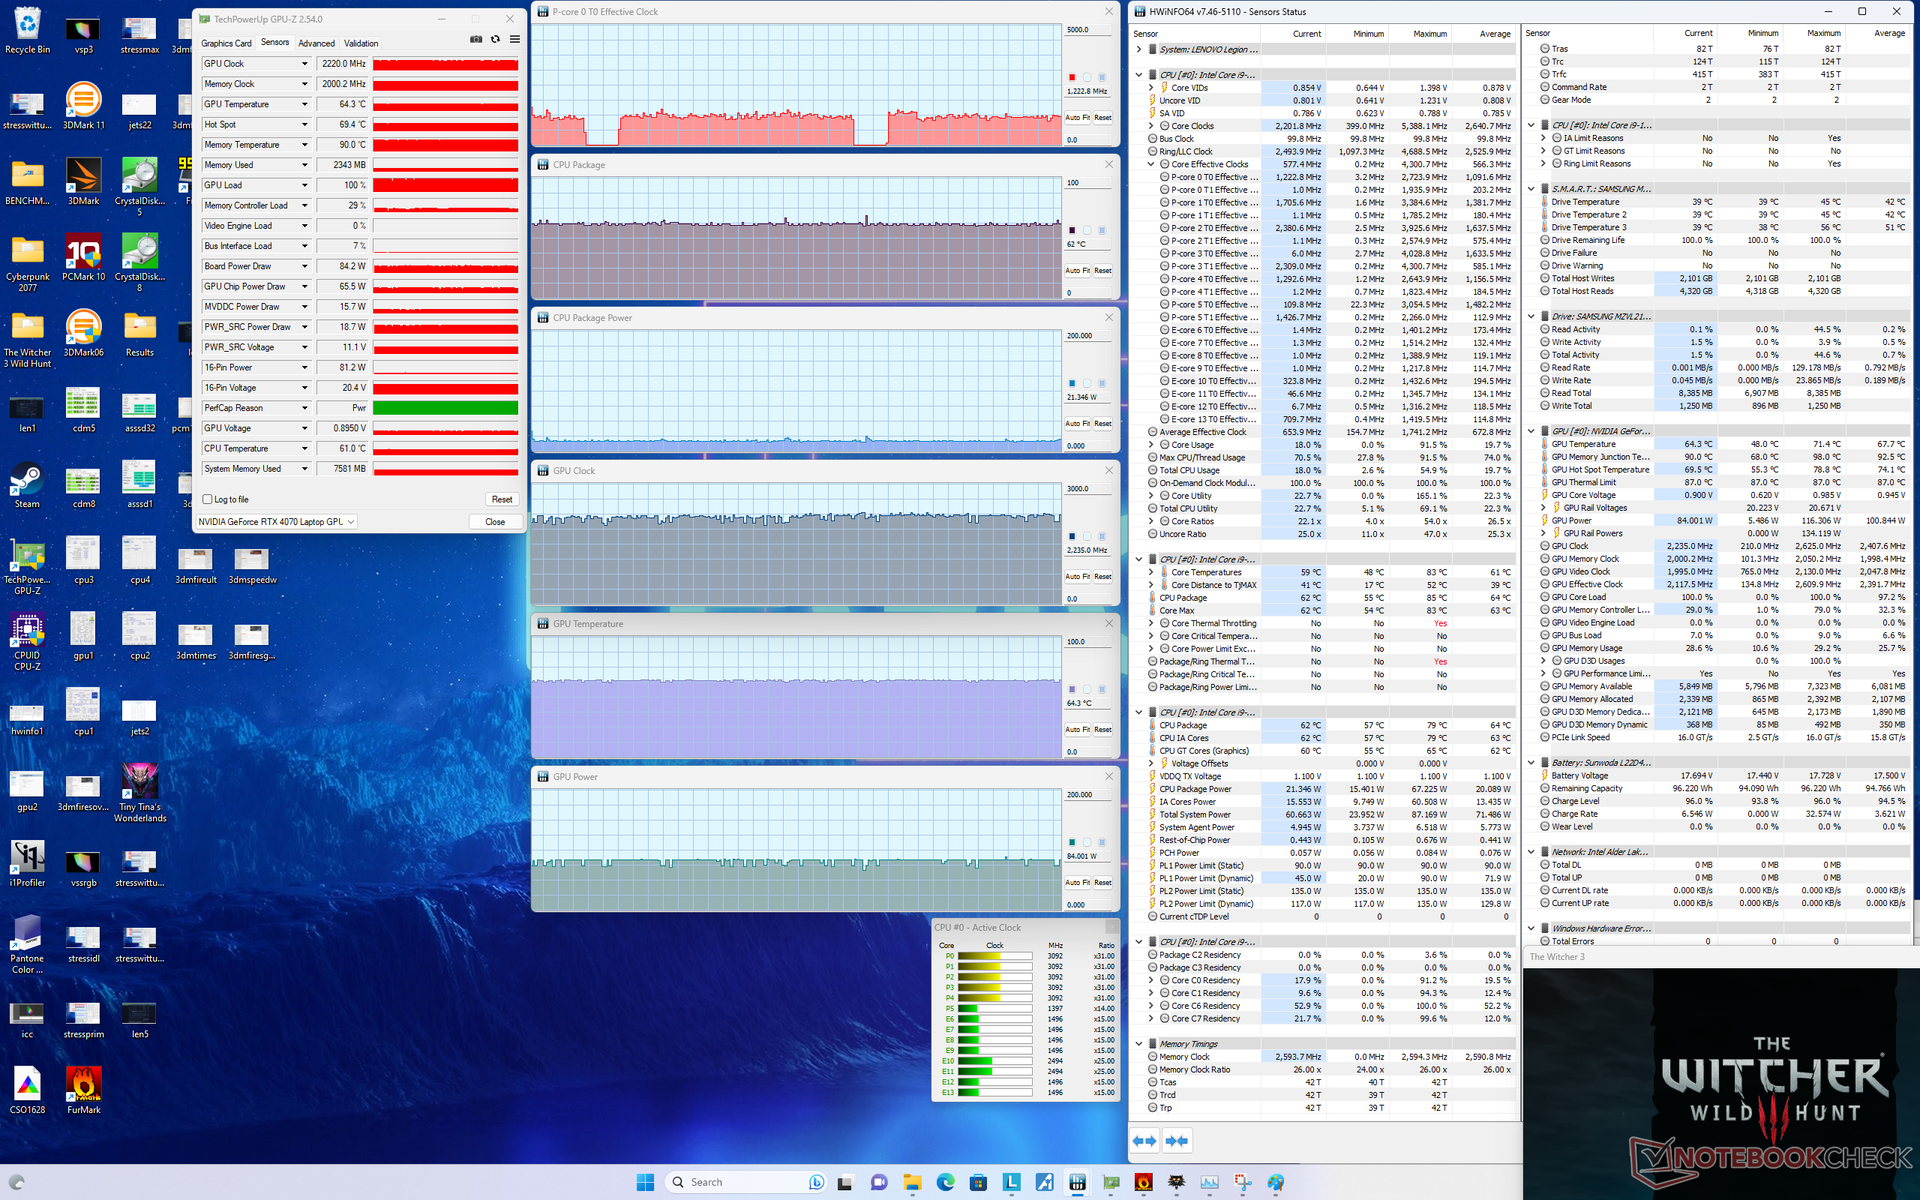
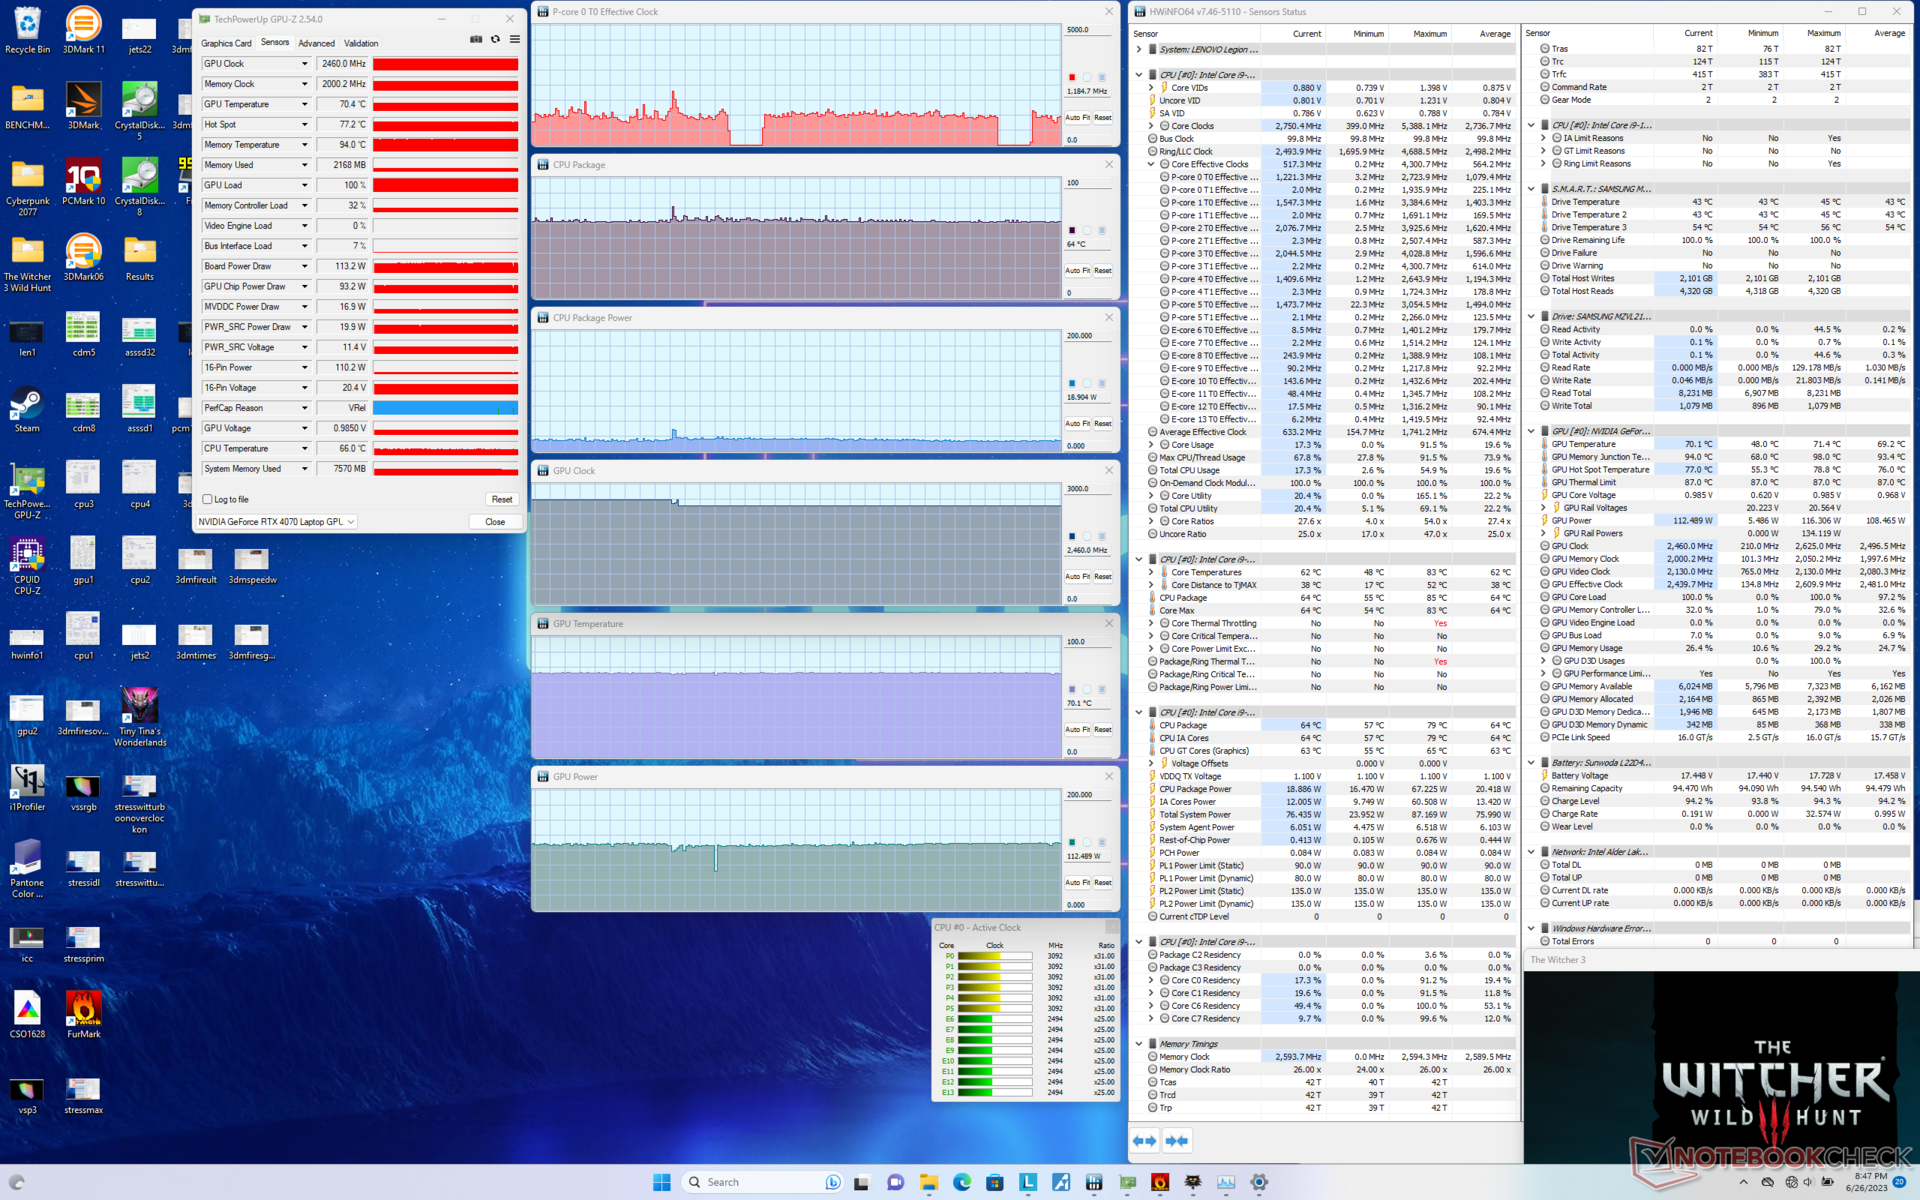
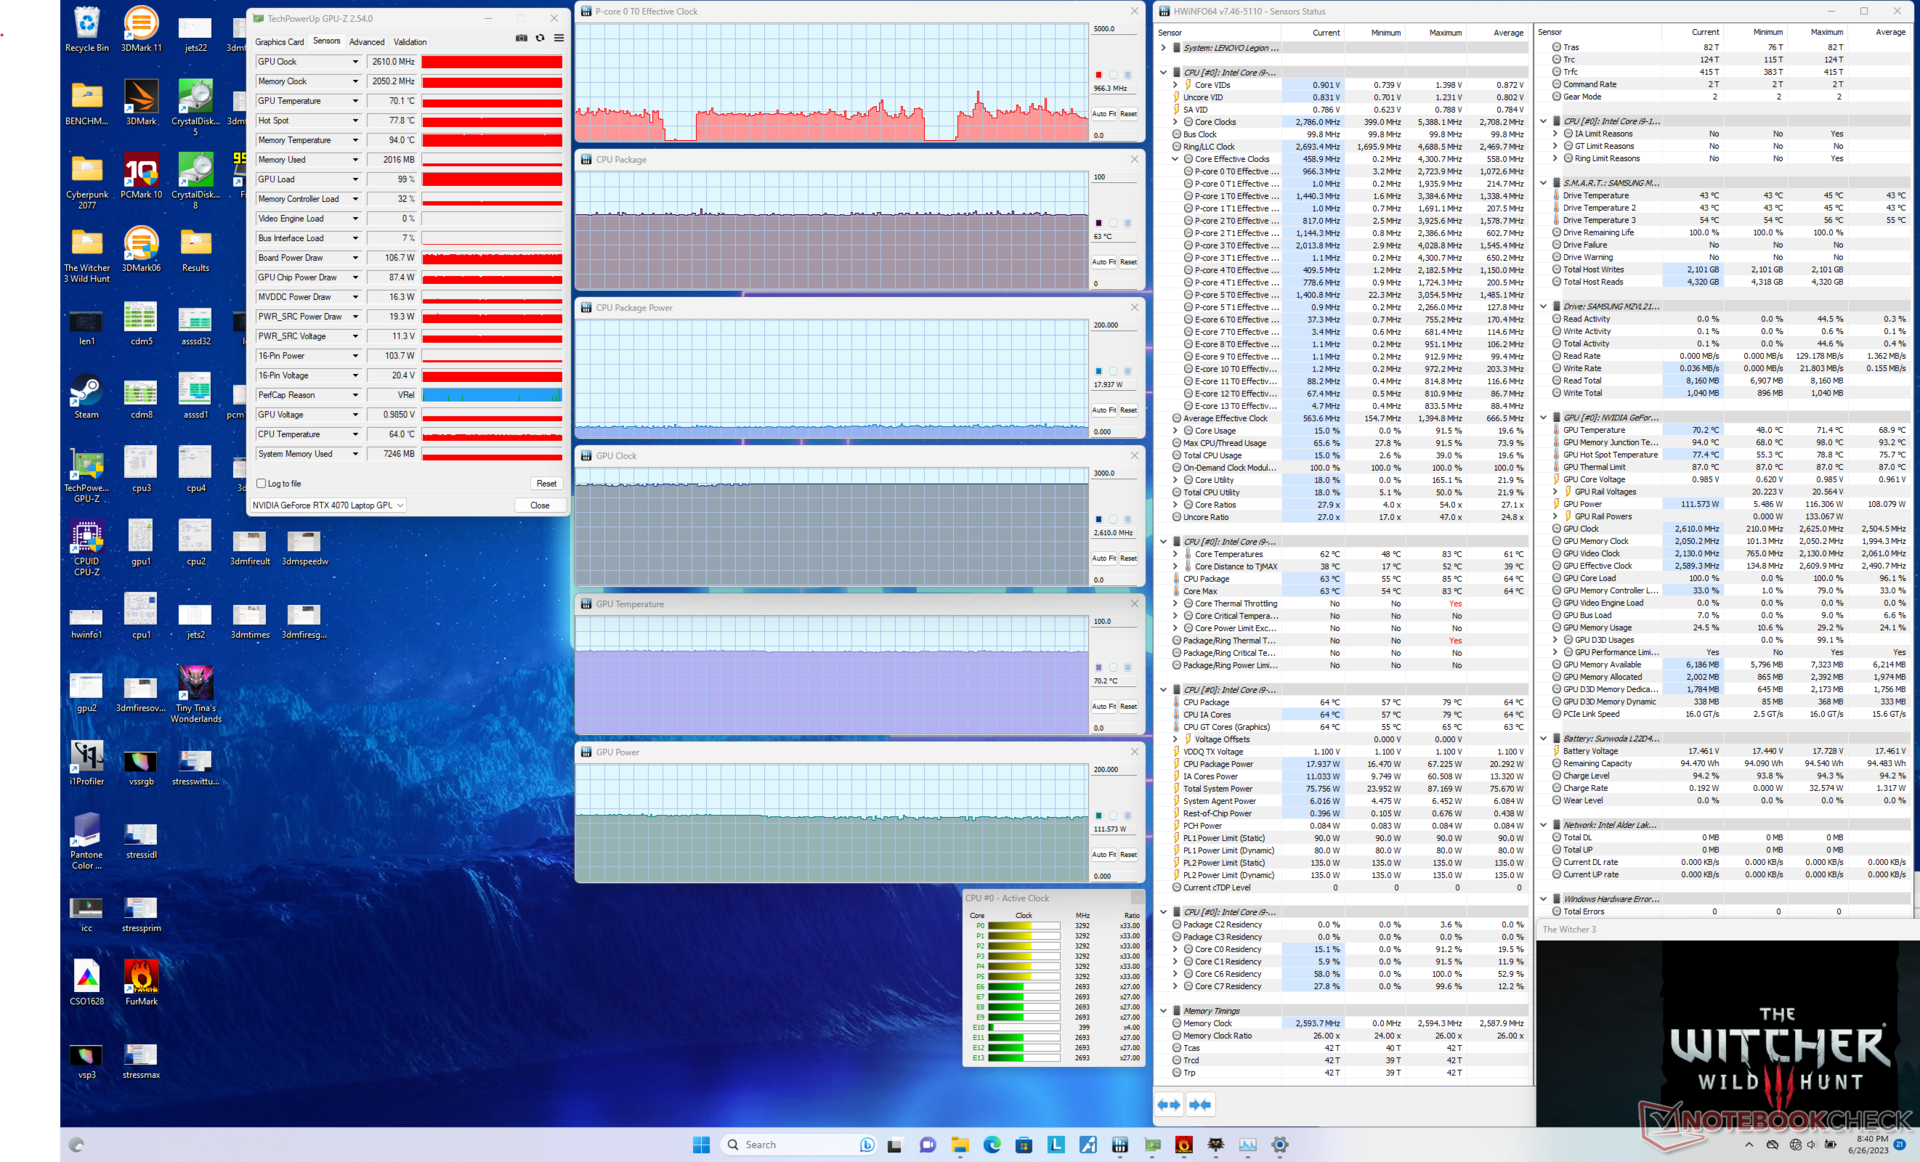
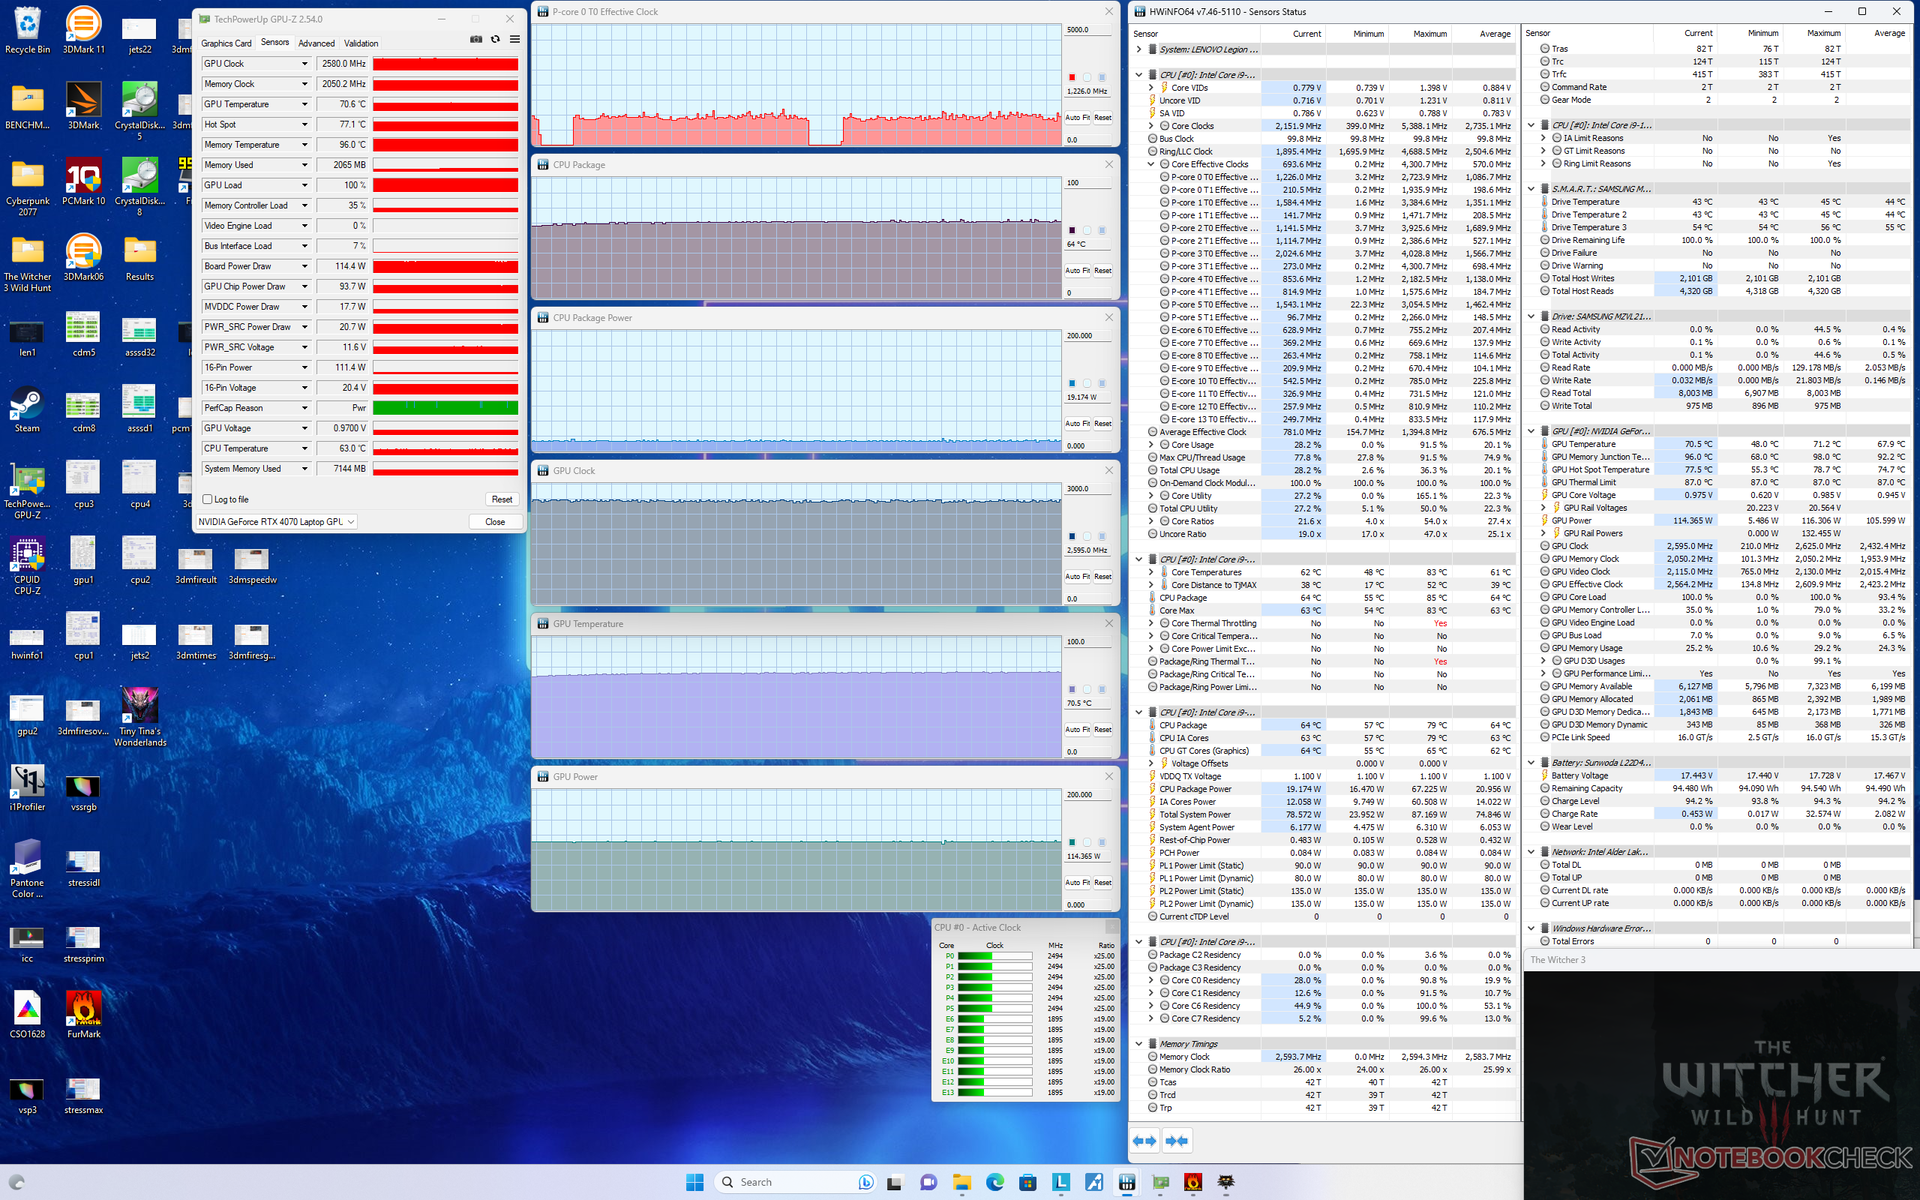
| Taktowanie CPU (GHz) | Taktowanie GPU (MHz) | Średnia temperatura CPU (°C) | Średnia temperatura GPU (°C) | |
| System w stanie spoczynku | -- | -- | 45 | 40 |
| Prime95Stress | 3.5 | -- | 76 | 49 |
| Prime95+ FurMark Stress | 2.6 - 3.5 | 1920 - 2610 | 77 - 90 | 75 |
| Witcher 3 Obciążenie(tryb zrównoważony) | ~1,2 | 2220 | 62 | 64 |
| Witcher 3 Stres (wydajnośćz wyłączonym podkręcaniem GPU + wyłączonym Overdrive) | ~1.2 | 2460 | 64 | 70 |
| Witcher 3 Stres (wydajność zwłączonym podkręcaniem GPU + wyłączony overdrive) | ~1.2 | 2610 | 63 | 70 |
| Witcher 3 Stres (wydajność z włączonympodkręcaniem GPU + włączonym Overdrive) | ~1.2 | 2580 | 64 | 71 |
Głośniki
Przy maksymalnej głośności około 85 dB(A), głośniki są mniej więcej tak głośne, jak w większości innych laptopów do gier. Nie ma też nic szczególnego w jakości dźwięku lub reprodukcji basów. Głośniki działają lepiej podczas grania w trybie zrównoważonym, ponieważ wentylatory nie są tak głośne.
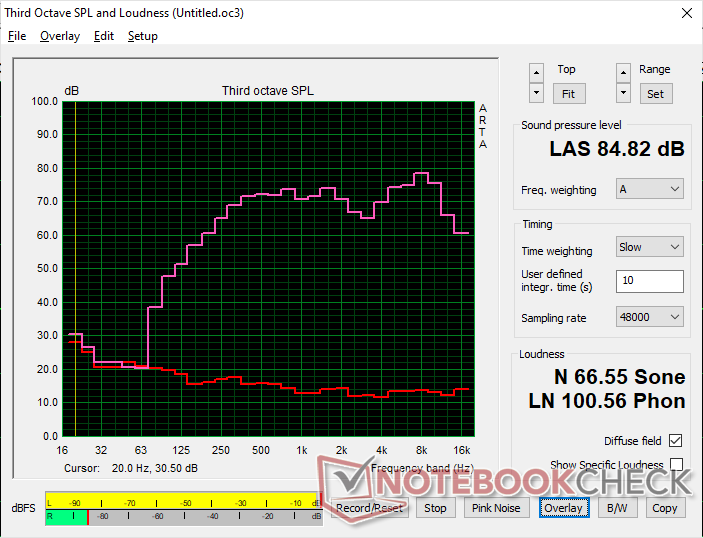
Lenovo Legion Slim 7i 16 Gen 8 analiza dźwięku
(+) | głośniki mogą odtwarzać stosunkowo głośno (84.8 dB)
Bas 100 - 315 Hz
(±) | zredukowany bas - średnio 12.1% niższy od mediany
(±) | liniowość basu jest średnia (9% delta do poprzedniej częstotliwości)
Średnie 400 - 2000 Hz
(+) | zbalansowane środki średnie - tylko 1.4% od mediany
(+) | średnie są liniowe (3.3% delta do poprzedniej częstotliwości)
Wysokie 2–16 kHz
(+) | zrównoważone maksima - tylko 4.4% od mediany
(+) | wzloty są liniowe (5.6% delta do poprzedniej częstotliwości)
Ogólnie 100 - 16.000 Hz
(+) | ogólny dźwięk jest liniowy (10.5% różnicy w stosunku do mediany)
W porównaniu do tej samej klasy
» 6% wszystkich testowanych urządzeń w tej klasie było lepszych, 2% podobnych, 92% gorszych
» Najlepszy miał deltę 6%, średnia wynosiła ###średnia###%, najgorsza wynosiła 132%
W porównaniu do wszystkich testowanych urządzeń
» 5% wszystkich testowanych urządzeń było lepszych, 1% podobnych, 93% gorszych
» Najlepszy miał deltę 4%, średnia wynosiła ###średnia###%, najgorsza wynosiła 134%
Apple MacBook Pro 16 2021 M1 Pro analiza dźwięku
(+) | głośniki mogą odtwarzać stosunkowo głośno (84.7 dB)
Bas 100 - 315 Hz
(+) | dobry bas - tylko 3.8% od mediany
(+) | bas jest liniowy (5.2% delta do poprzedniej częstotliwości)
Średnie 400 - 2000 Hz
(+) | zbalansowane środki średnie - tylko 1.3% od mediany
(+) | średnie są liniowe (2.1% delta do poprzedniej częstotliwości)
Wysokie 2–16 kHz
(+) | zrównoważone maksima - tylko 1.9% od mediany
(+) | wzloty są liniowe (2.7% delta do poprzedniej częstotliwości)
Ogólnie 100 - 16.000 Hz
(+) | ogólny dźwięk jest liniowy (4.6% różnicy w stosunku do mediany)
W porównaniu do tej samej klasy
» 0% wszystkich testowanych urządzeń w tej klasie było lepszych, 0% podobnych, 100% gorszych
» Najlepszy miał deltę 5%, średnia wynosiła ###średnia###%, najgorsza wynosiła 45%
W porównaniu do wszystkich testowanych urządzeń
» 0% wszystkich testowanych urządzeń było lepszych, 0% podobnych, 100% gorszych
» Najlepszy miał deltę 4%, średnia wynosiła ###średnia###%, najgorsza wynosiła 134%
Zarządzanie energią
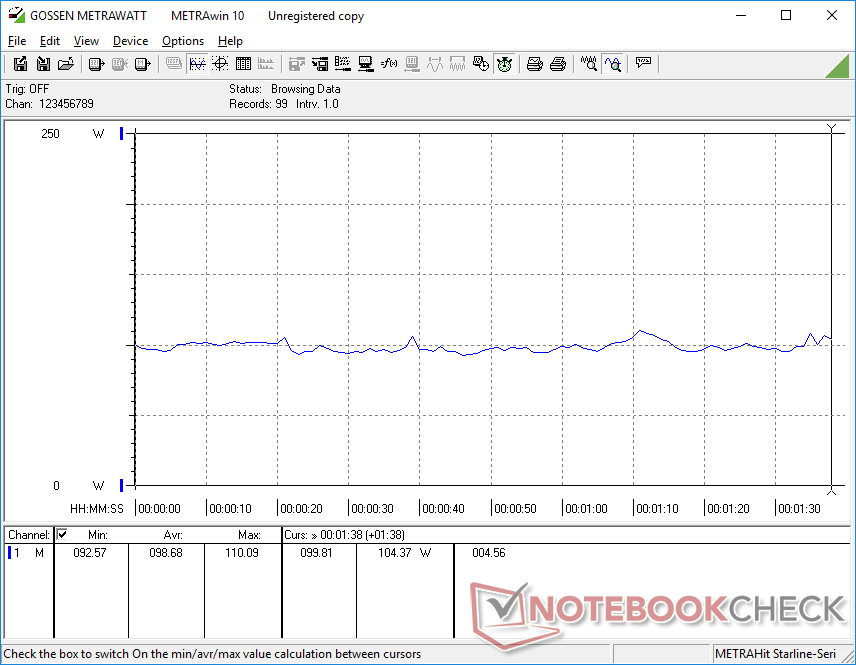
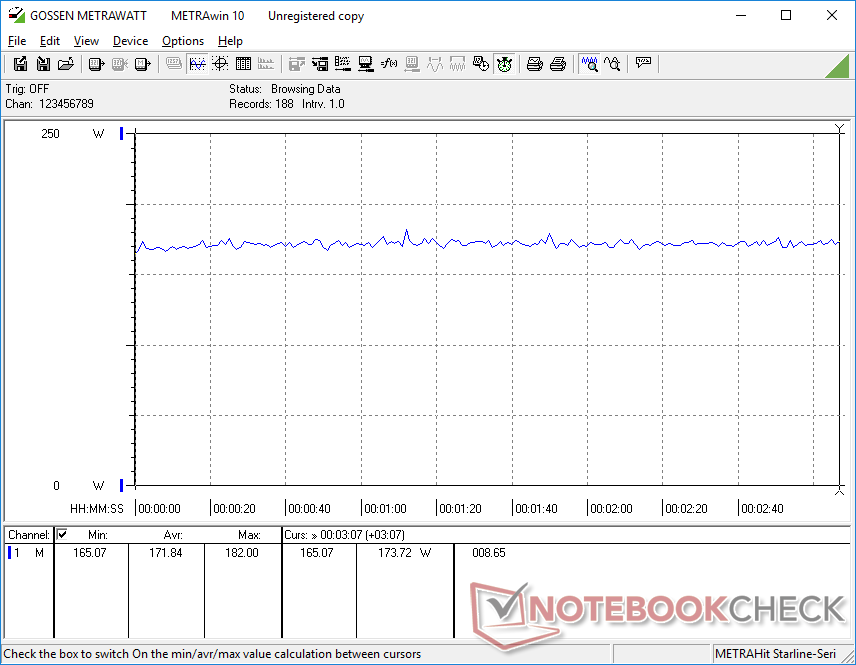
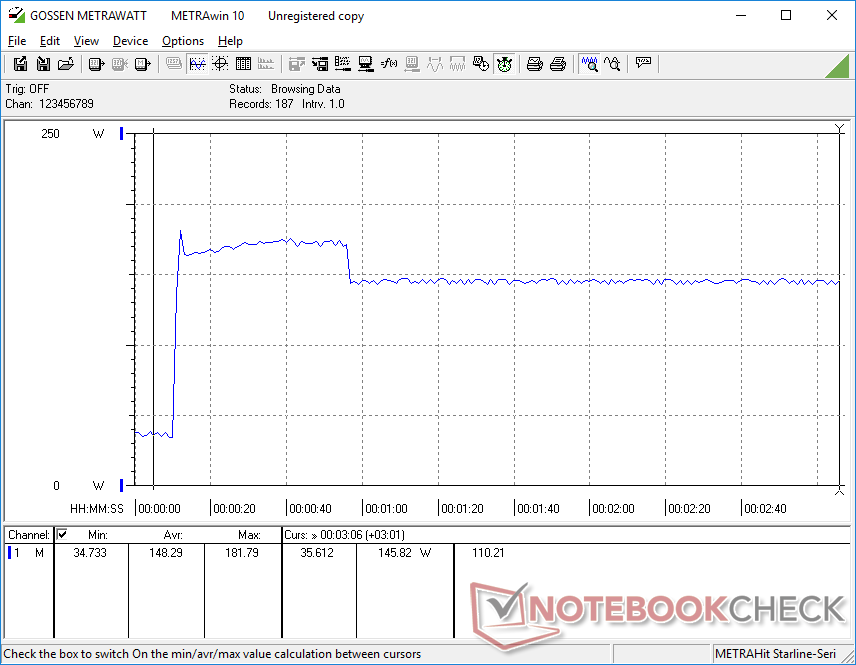
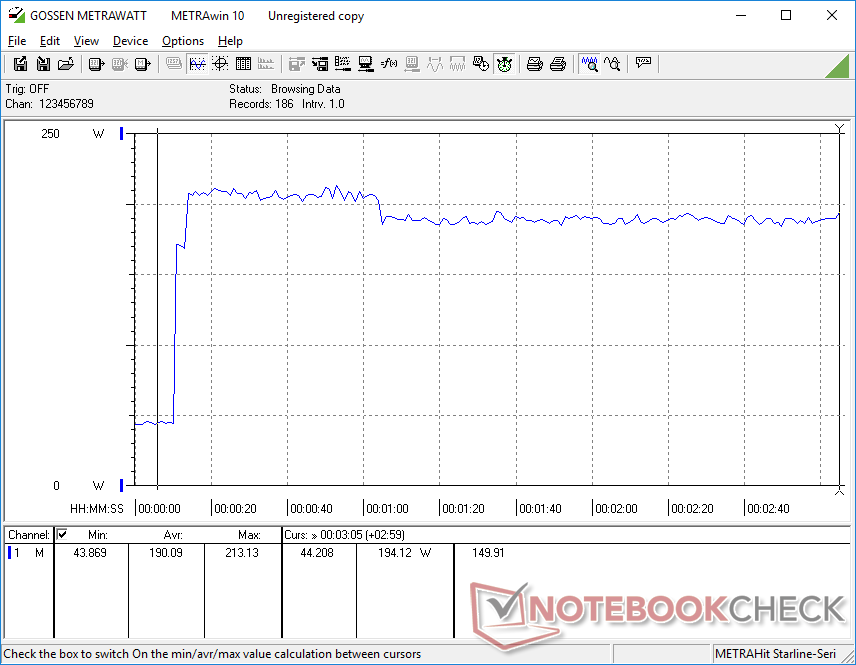
Zużycie energii - wysokie prędkości biegu jałowego
Zużycie energii na biegu jałowym na pulpicie jest stosunkowo wysokie i wynosi 22 W, nawet przy włączonym trybie oszczędzania energii i minimalnych ustawieniach jasności. Wydaje się to być powszechną cechą wśród laptopów do gier zasilanych przez procesory Core-H 13. generacji, jak pokazuje poniższa tabela, co prawdopodobnie przyczynia się do przeciętnych czasów pracy na baterii. Dla porównania, napędzany przez AMD Zen 4 Legion Pro 5 16 może osiągnąć nawet 8 W w podobnych warunkach.
W grach zużywa około 172 W, co jest bardzo podobne do starszego Zephyrus M16 napędzanego przez Core i9-12900H i RTX 3070 Ti. Nasz Legion Slim 7 jest zatem w stanie zapewnić o około 15 procent wyższą wydajność graficzną bez konieczności zużywania większej ilości energii, co przekłada się na wyższą wydajność w przeliczeniu na wat w porównaniu do starszych laptopów do gier z zasilaniem Ampere.
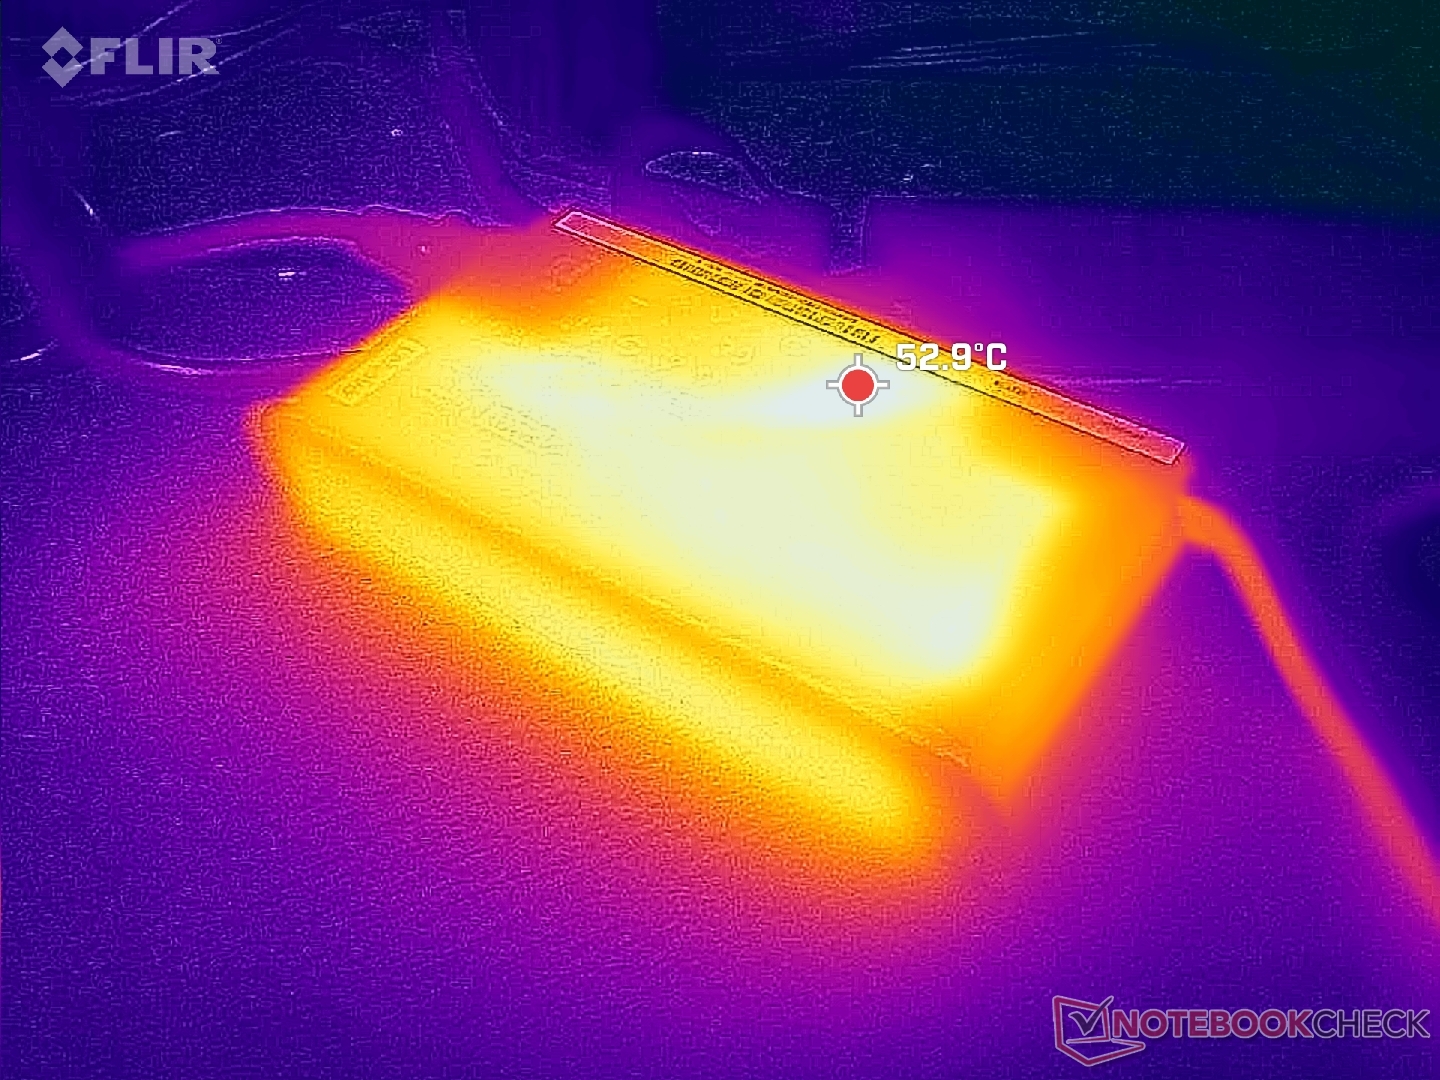
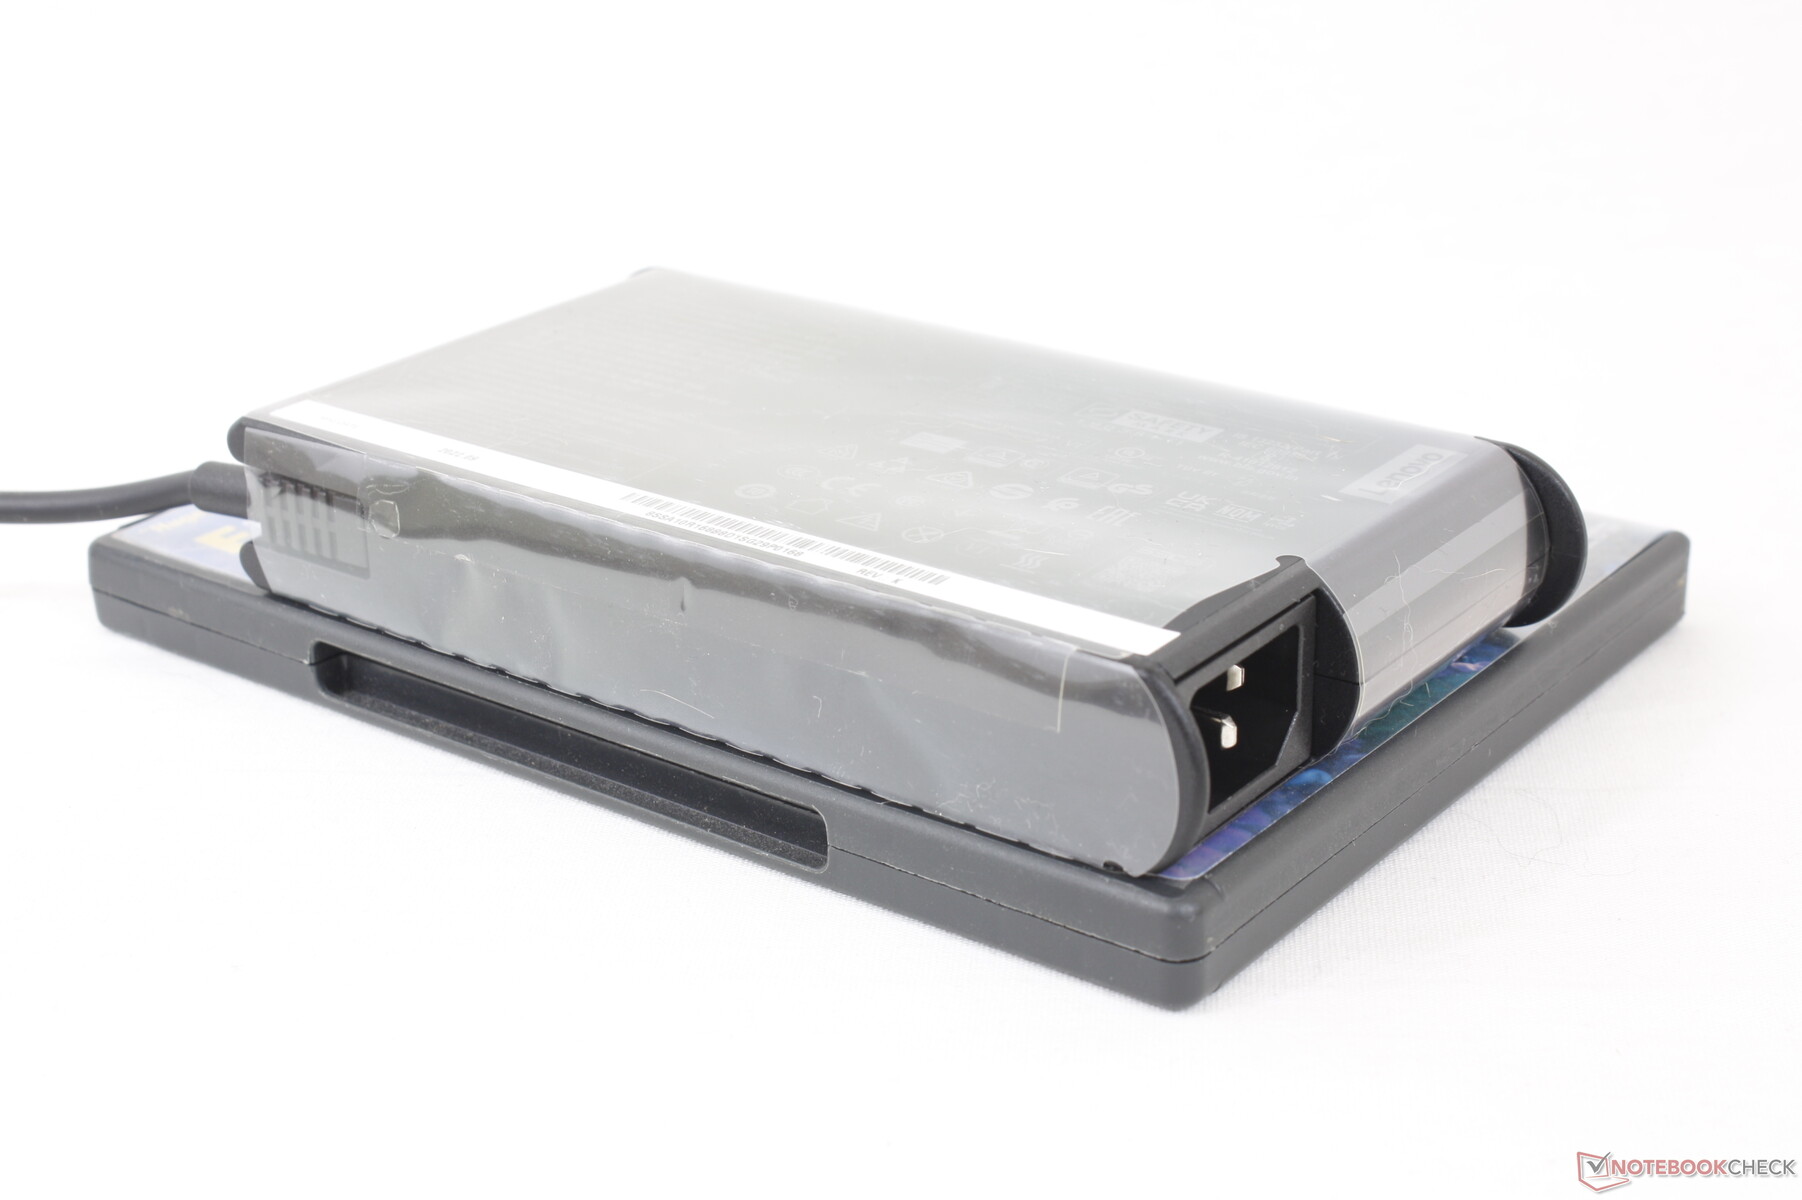
Jesteśmy w stanie zmierzyć szczytowe zużycie energii na poziomie 213 W z zasilacza 230 W średniej wielkości (~16,9 x 8,8 x 2,6 cm). Wyższy zasilacz 330 W jest dołączony do większego Legion Pro 7, który jest wyposażony w znacznie mocniejszy Core i9-13900HX i RTX 4080.
| wyłączony / stan wstrzymania | |
| luz | |
| obciążenie |
|
Legenda:
min: | |
| Lenovo Legion Slim 7i 16 Gen 8 i9-13900H, GeForce RTX 4070 Laptop GPU, Samsung PM9A1 MZVL21T0HCLR, IPS, 2560x1600, 16" | Acer Predator Helios 16 PH16-71-731Q i7-13700HX, GeForce RTX 4060 Laptop GPU, Micron 3400 1TB MTFDKBA1T0TFH, IPS-LED, 2560x1600, 16" | HP Omen 16-wf000 i7-13700HX, GeForce RTX 4080 Laptop GPU, SK hynix PC801 HFS002TEJ9X101N, IPS, 2560x1440, 16.1" | Lenovo Legion Pro 7 RTX4090 i9-13900HX, GeForce RTX 4090 Laptop GPU, Samsung PM9A1 MZVL21T0HCLR, IPS, 2560x1600, 16" | Alienware x16 R1 i9-13900HK, GeForce RTX 4080 Laptop GPU, SK hynix PC801 HFS001TEJ9X101N, IPS, 2560x1600, 16" | Lenovo Legion Pro 5 16ARX8 R7 7745HX, GeForce RTX 4070 Laptop GPU, Samsung PM9A1 MZVL21T0HCLR, IPS, 2560x1600, 16" | |
|---|---|---|---|---|---|---|
| Power Consumption | 11% | -8% | -20% | -25% | 15% | |
| Idle Minimum * (Watt) | 22 | 15.9 28% | 21.8 1% | 20 9% | 25.2 -15% | 8.1 63% |
| Idle Average * (Watt) | 29 | 20.5 29% | 26 10% | 25 14% | 29.9 -3% | 15.9 45% |
| Idle Maximum * (Watt) | 39.5 | 20.9 47% | 36 9% | 35 11% | 49.8 -26% | 37.2 6% |
| Load Average * (Watt) | 98.7 | 106 -7% | 115.5 -17% | 136 -38% | 105.4 -7% | 90.9 8% |
| Witcher 3 ultra * (Watt) | 171.8 | 175 -2% | 214 -25% | 282 -64% | 263 -53% | 189.6 -10% |
| Load Maximum * (Watt) | 213.2 | 276 -29% | 269.7 -27% | 320 -50% | 313.8 -47% | 263.5 -24% |
* ... im mniej tym lepiej
Power Consumption Witcher 3 / Stresstest
Power Consumption external Monitor
Żywotność baterii
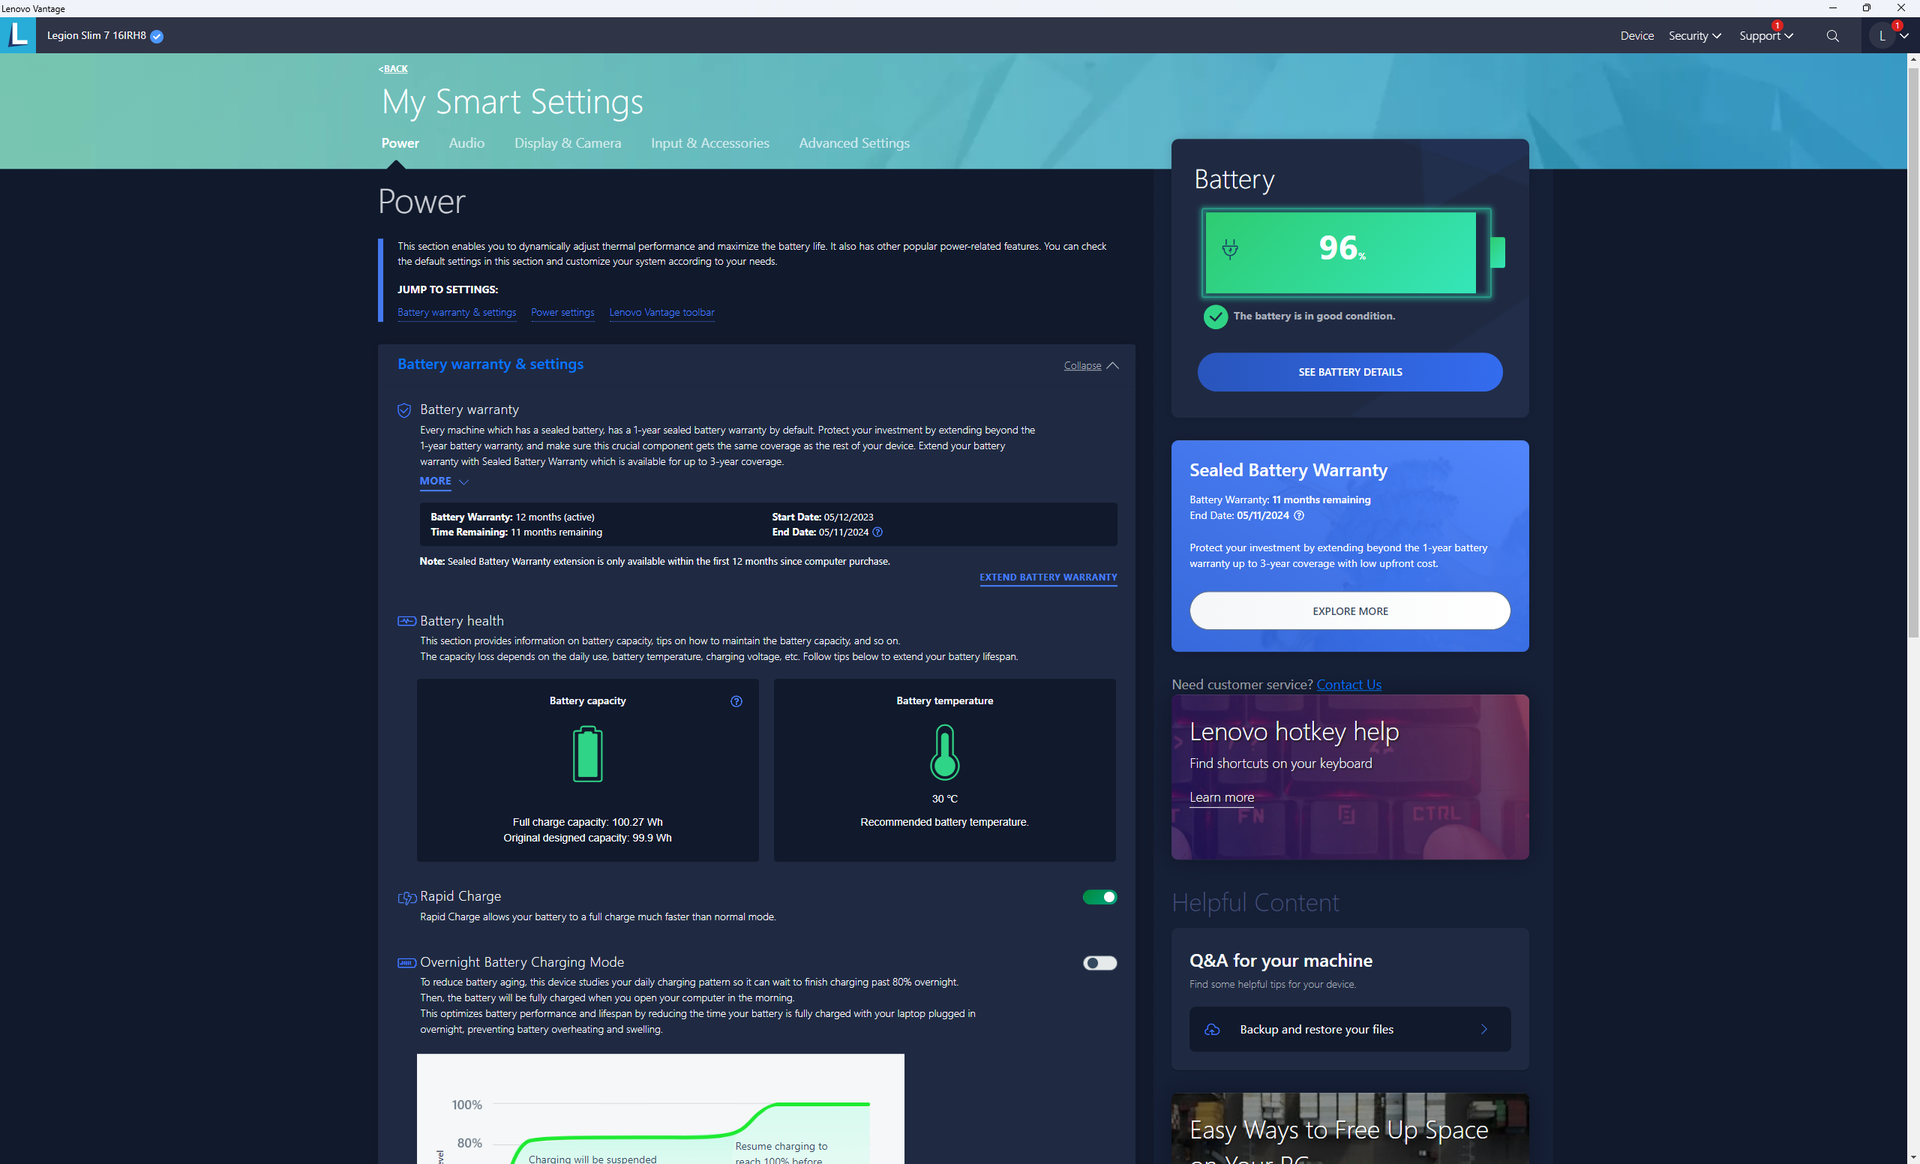
Pojemność baterii jest zaskakująco tak duża, jak w Legion Pro 7 17, pomimo cieńszego profilu naszej konstrukcji Slim 7i. Niemniej jednak, czas pracy na baterii jest w najlepszym razie przeciętny i wynosi nieco poniżej 4,5 godziny rzeczywistego przeglądania stron internetowych. Większość innych laptopów do gier z procesorami Intel 13. generacji zwróciłaby podobne lub krótsze czasy pracy, w tym Omen 16 lub Alienware x16 R1.
Ładowanie od pustego do pełnego akumulatora trwa zaledwie 70 minut z włączoną funkcją Rapid Charge, w porównaniu do 90 minut lub dłużej w przypadku większości innych laptopów do gier. System może być również ładowany przez USB-C z mocą do 140 W.
| Lenovo Legion Slim 7i 16 Gen 8 i9-13900H, GeForce RTX 4070 Laptop GPU, 99.9 Wh | HP Omen 16-wf000 i7-13700HX, GeForce RTX 4080 Laptop GPU, 83 Wh | Alienware x16 R1 i9-13900HK, GeForce RTX 4080 Laptop GPU, 90 Wh | Lenovo Legion Pro 7 RTX4090 i9-13900HX, GeForce RTX 4090 Laptop GPU, 99.9 Wh | Asus ROG Strix G16 G614JZ i9-13980HX, GeForce RTX 4080 Laptop GPU, 90 Wh | Razer Blade 16 Early 2023 i9-13950HX, GeForce RTX 4080 Laptop GPU, 95.2 Wh | |
|---|---|---|---|---|---|---|
| Czasy pracy | 15% | -7% | 16% | 71% | 57% | |
| Reader / Idle (h) | 5.1 | 5.5 8% | 7.3 43% | 8.9 75% | ||
| WiFi v1.3 (h) | 4.4 | 5.1 16% | 2.5 -43% | 5.1 16% | 9.7 120% | 6.1 39% |
| Load (h) | 0.9 | 1.1 22% | 0.7 -22% | 1.1 22% | 1.4 56% |
Za
Przeciw
Werdykt - przekonujący w niemal każdym aspekcie
Legion Slim 7i 16 Gen 8 to jeden z najbardziej zrównoważonych laptopów gamingowych w rodzinie Legion. Nie tylko jest cieńszy i lżejszy niż większość w kategorii 16-calowych rozmiarów, ale także nie idzie na skróty, jeśli chodzi o opcje portów, przestronną klawiaturę RGB na klawisz, przyzwoite opcje wyświetlania zarówno dla graczy, jak i twórców treści, a nawet pojemność baterii i czytnik SD. Model ten spełnia wiele wymagań, biorąc pod uwagę jego cienki profil.
Lenovo Legion Slim 7i 16 G8 poświęca niektóre opcje wydajności na rzecz cieńszego rozmiaru i mniejszej wagi, ale poza tym model jest tak dobrze wyważony pod względem wydajności i przenośności, że większość graczy prawdopodobnie nie będzie
miał
a nic przeciwko.
Kilka pęknięć zaczyna się pojawiać, gdy zagłębimy się w maszynę. Na przykład lutowana i rozszerzalna konfiguracja pamięci RAM jest rzadkością w laptopach do gier, podczas gdy dysk SSD ma tendencję do dławienia się pod obciążeniem. Opcje CPU i GPU pomijają odpowiednio Core i9-13900HX i RTX 4080, które są dostępne tylko w grubszym i cięższym Legion Pro 7 16. Entuzjaści, którzy chcą mieć wszystko i kuchnię, musieliby zatem zadowolić się większymi i cięższymi alternatywami, takimi jak Legion Pro 7alienware m16 lub Razer Blade 16 z których każdy oferuje szybsze opcje procesora.
Cena i dostępność
Lenovo wysyła teraz swój Legion Slim 7i 16 Gen 8 od 1500 USD za podstawową konfigurację Core i7-13700H i RTX 4060 do 1800 USD z naszą konfiguracją Core i9-13900H i RTX 4070. Wyższa konfiguracja jest również dostępna w Best Buy.
Lenovo Legion Slim 7i 16 Gen 8
- 03/07/2023 v7 (old)
Allen Ngo
Przezroczystość
Wyboru urządzeń do recenzji dokonuje nasza redakcja. Próbka testowa została udostępniona autorowi jako pożyczka od producenta lub sprzedawcy detalicznego na potrzeby tej recenzji. Pożyczkodawca nie miał wpływu na tę recenzję, producent nie otrzymał też kopii tej recenzji przed publikacją. Nie było obowiązku publikowania tej recenzji. Jako niezależna firma medialna, Notebookcheck nie podlega władzy producentów, sprzedawców detalicznych ani wydawców.
Tak testuje Notebookcheck
Każdego roku Notebookcheck niezależnie sprawdza setki laptopów i smartfonów, stosując standardowe procedury, aby zapewnić porównywalność wszystkich wyników. Od około 20 lat stale rozwijamy nasze metody badawcze, ustanawiając przy tym standardy branżowe. W naszych laboratoriach testowych doświadczeni technicy i redaktorzy korzystają z wysokiej jakości sprzętu pomiarowego. Testy te obejmują wieloetapowy proces walidacji. Nasz kompleksowy system ocen opiera się na setkach uzasadnionych pomiarów i benchmarków, co pozwala zachować obiektywizm.Price comparison

