Recenzja laptopa Dell XPS 15 9530 RTX 4070: Zarówno imponujący, jak i niezadowalający

XPS 15 9530 to wewnętrzna aktualizacja względem modelu XPS 15 9520 z 2022 roku. Procesory 12. generacji Alder Lake-H i karty graficzne Nvidia Ampere z zeszłorocznego modelu zostały uaktualnione odpowiednio do opcji 13. generacji Raptor Lake-H i Ada Lovelace. W pozostałych przypadkach obudowa i opcje wyświetlania pozostają identyczne w porównaniu z rokiem ubiegłym, dlatego polecamy sprawdzenie naszych dotychczasowych recenzji modelu XPS 15 9520, 9510, i 9500 aby dowiedzieć się więcej o cechach fizycznych danego modelu.
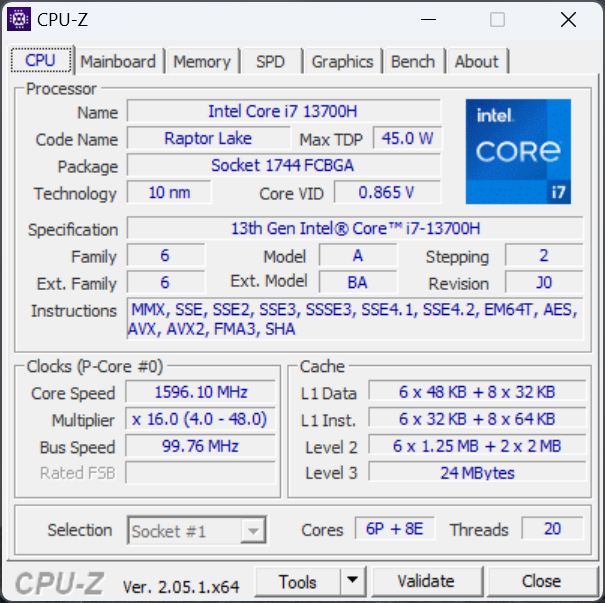
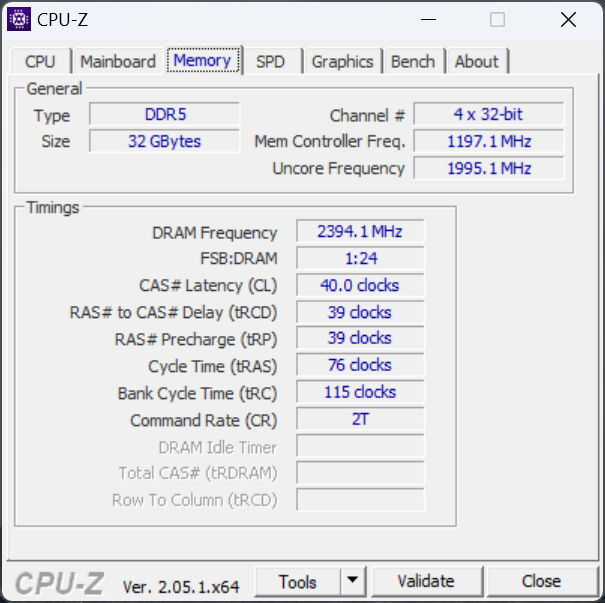
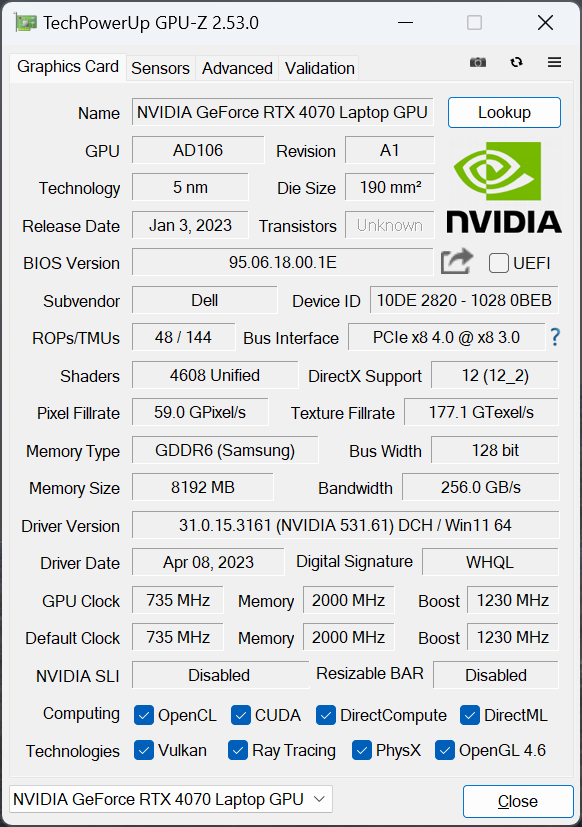
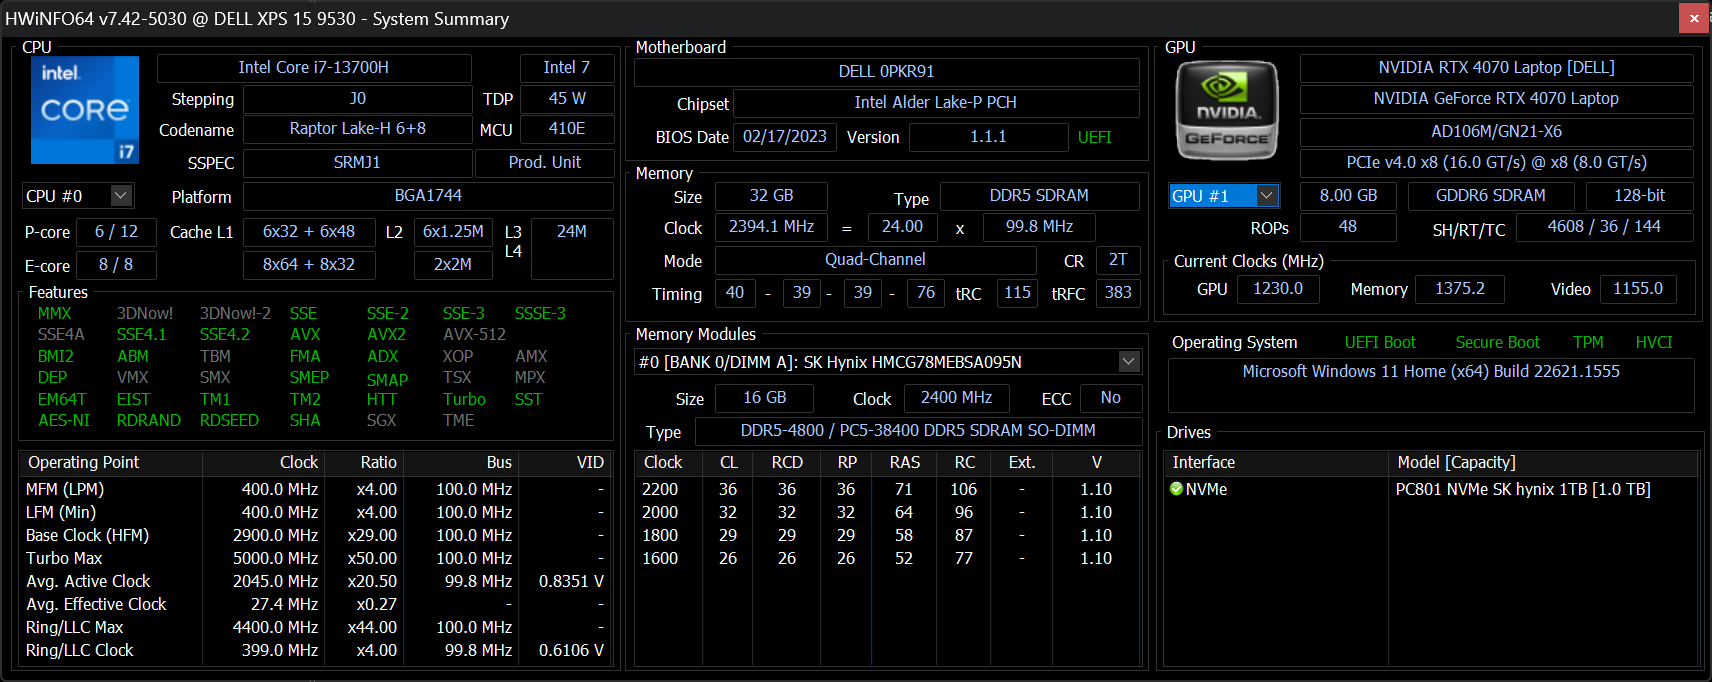
Nasz konkretny egzemplarz recenzencki to konfiguracja z wyższej półki z procesorem Core i7-13700H, RTX 4070, 32 GB RAM, 1 TB SSD i błyszczącym ekranem dotykowym OLED 3,5K za około 2800 USD. Pozostałe SKU są dostępne z szybszym Core i9-13900H, wolniejszym RTX 4060 lub matowym panelem FHD+ o niższej rozdzielczości. Warto zauważyć, że jest to jeden z niewielu laptopów z 50 W GeForce RTX 4070 w porównaniu z 100 W lub więcej w większości innych laptopów z tym samym GPU.
Wśród konkurentów są inne 15-calowe laptopy multimedialne z wyższej półki, np.Asus Zenbook Pro 15, MSI Summit E15,Gigabyte Aero 15, lub Razer Blade 15 Studio.
Więcej recenzji Della:
Potencjalni konkurenci w porównaniu
Ocena | Data | Model | Waga | Wysokość | Rozmiar | Rezolucja | Cena |
|---|---|---|---|---|---|---|---|
| 90.3 % v7 (old) | 04/2023 | Dell XPS 15 9530 RTX 4070 i7-13700H, GeForce RTX 4070 Laptop GPU | 1.9 kg | 18 mm | 15.60" | 3456x2160 | |
| 89.5 % v7 (old) | Dell XPS 15 9520 RTX 3050 Ti i7-12700H, GeForce RTX 3050 Ti Laptop GPU | 1.9 kg | 18 mm | 15.60" | 3456x2160 | ||
| 90.1 % v7 (old) | Dell XPS 15 9500 Core i7 4K UHD i7-10875H, GeForce GTX 1650 Ti Mobile | 2 kg | 18 mm | 15.60" | 3840x2400 | ||
| 87.7 % v7 (old) | Asus Zenbook Pro 15 OLED UM535Q R9 5900HX, GeForce RTX 3050 Ti Laptop GPU | 1.9 kg | 18 mm | 15.60" | 1920x1080 | ||
| 85.4 % v7 (old) | 12/2022 | MSI Prestige 15 A12UD-093 i7-1280P, GeForce RTX 3050 Ti Laptop GPU | 1.8 kg | 20.1 mm | 15.60" | 3840x2160 | |
| 85.6 % v7 (old) | Gigabyte Aero 15 OLED XD i7-11800H, GeForce RTX 3070 Laptop GPU | 2.2 kg | 20 mm | 15.60" | 3840x2160 |
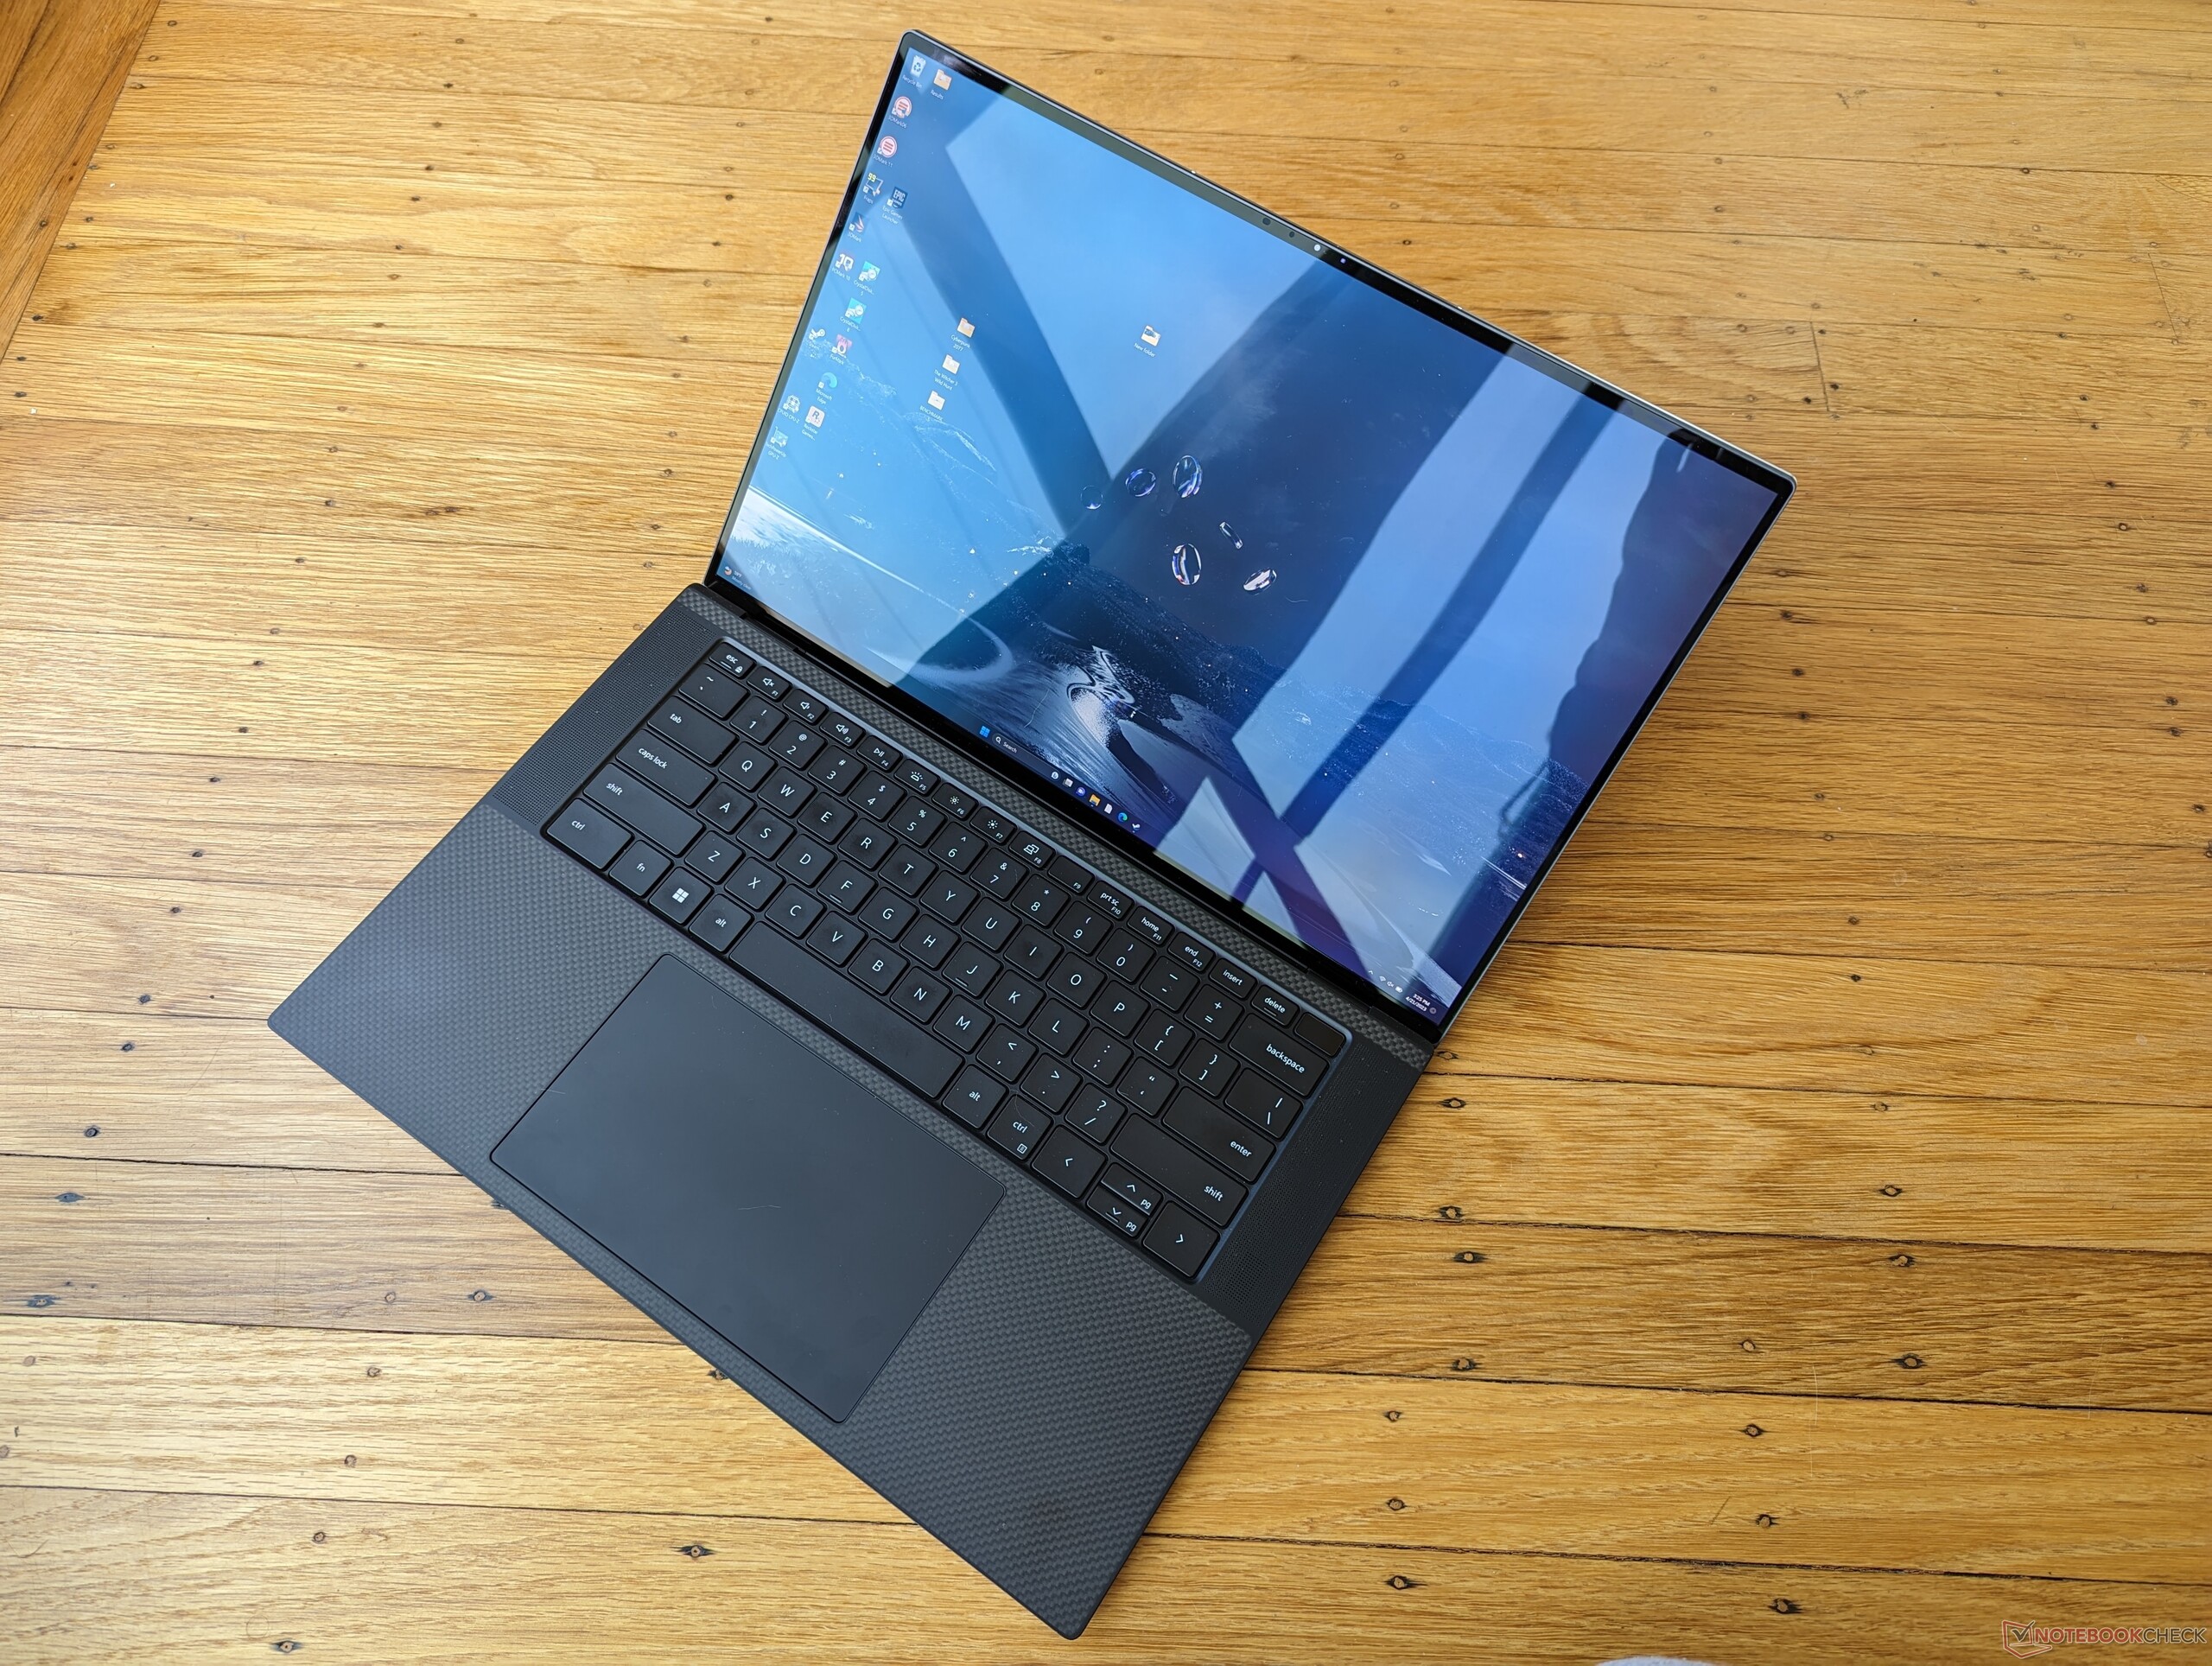
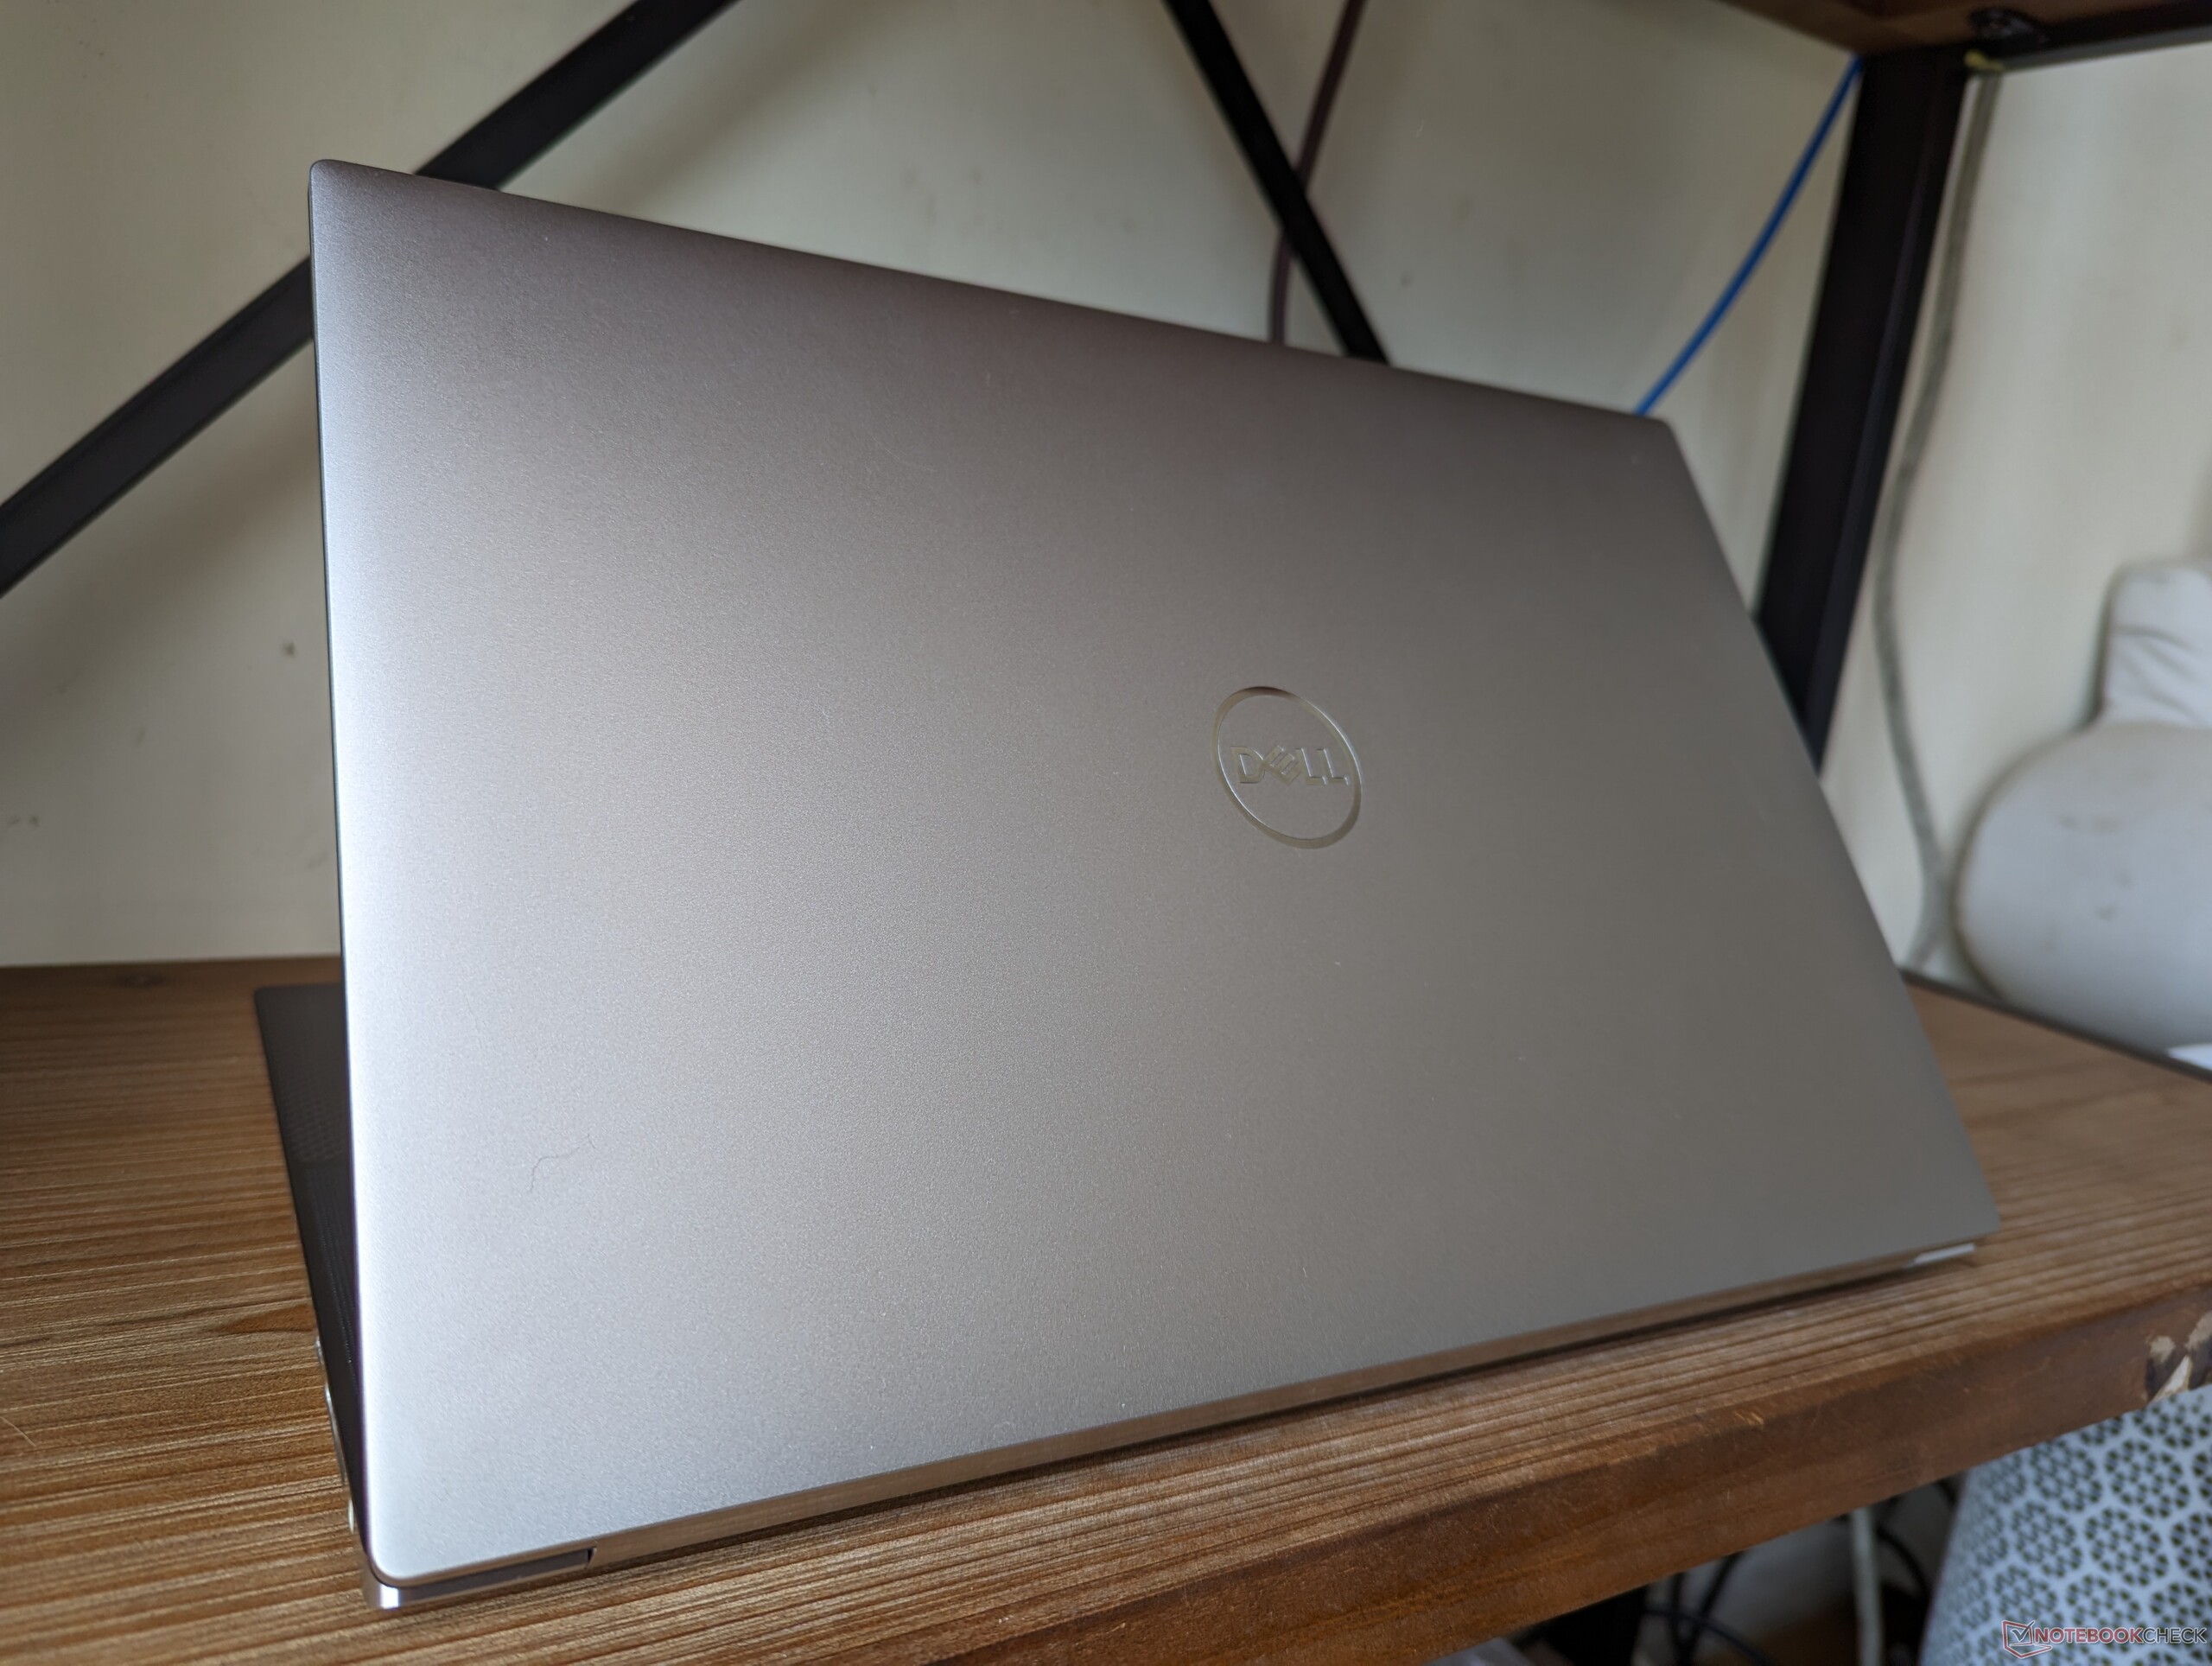
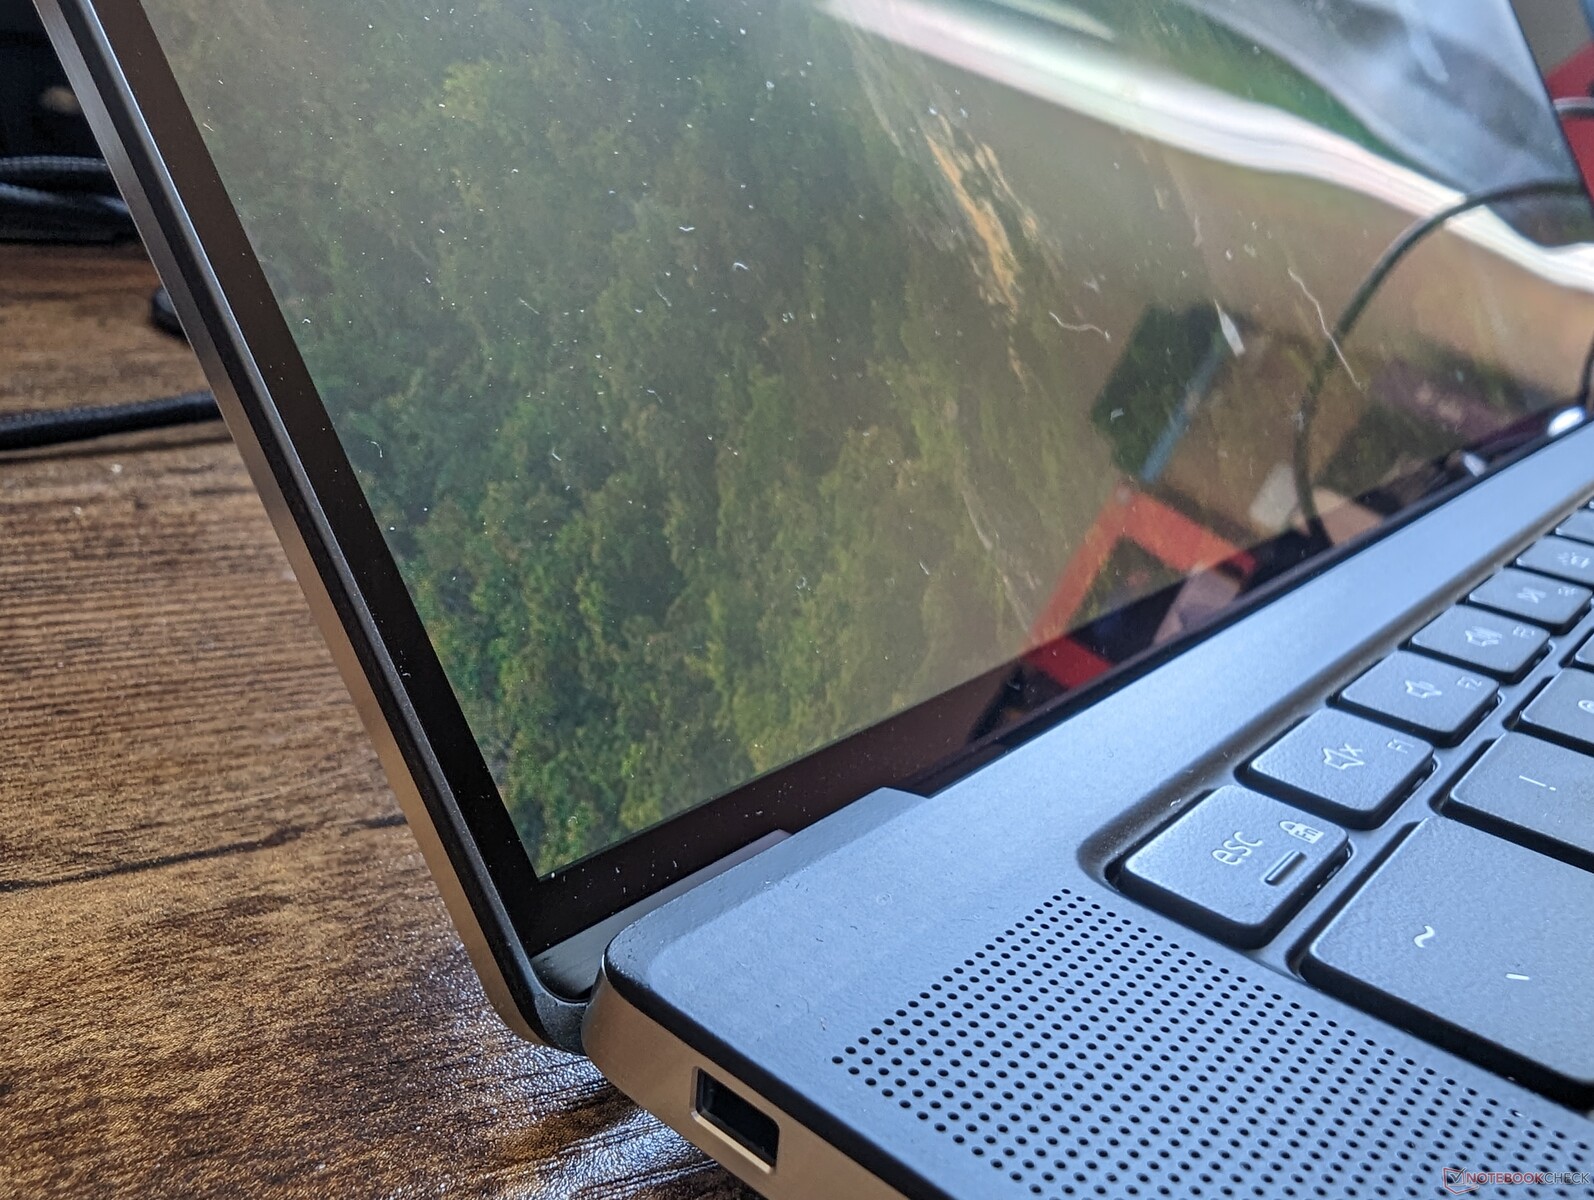
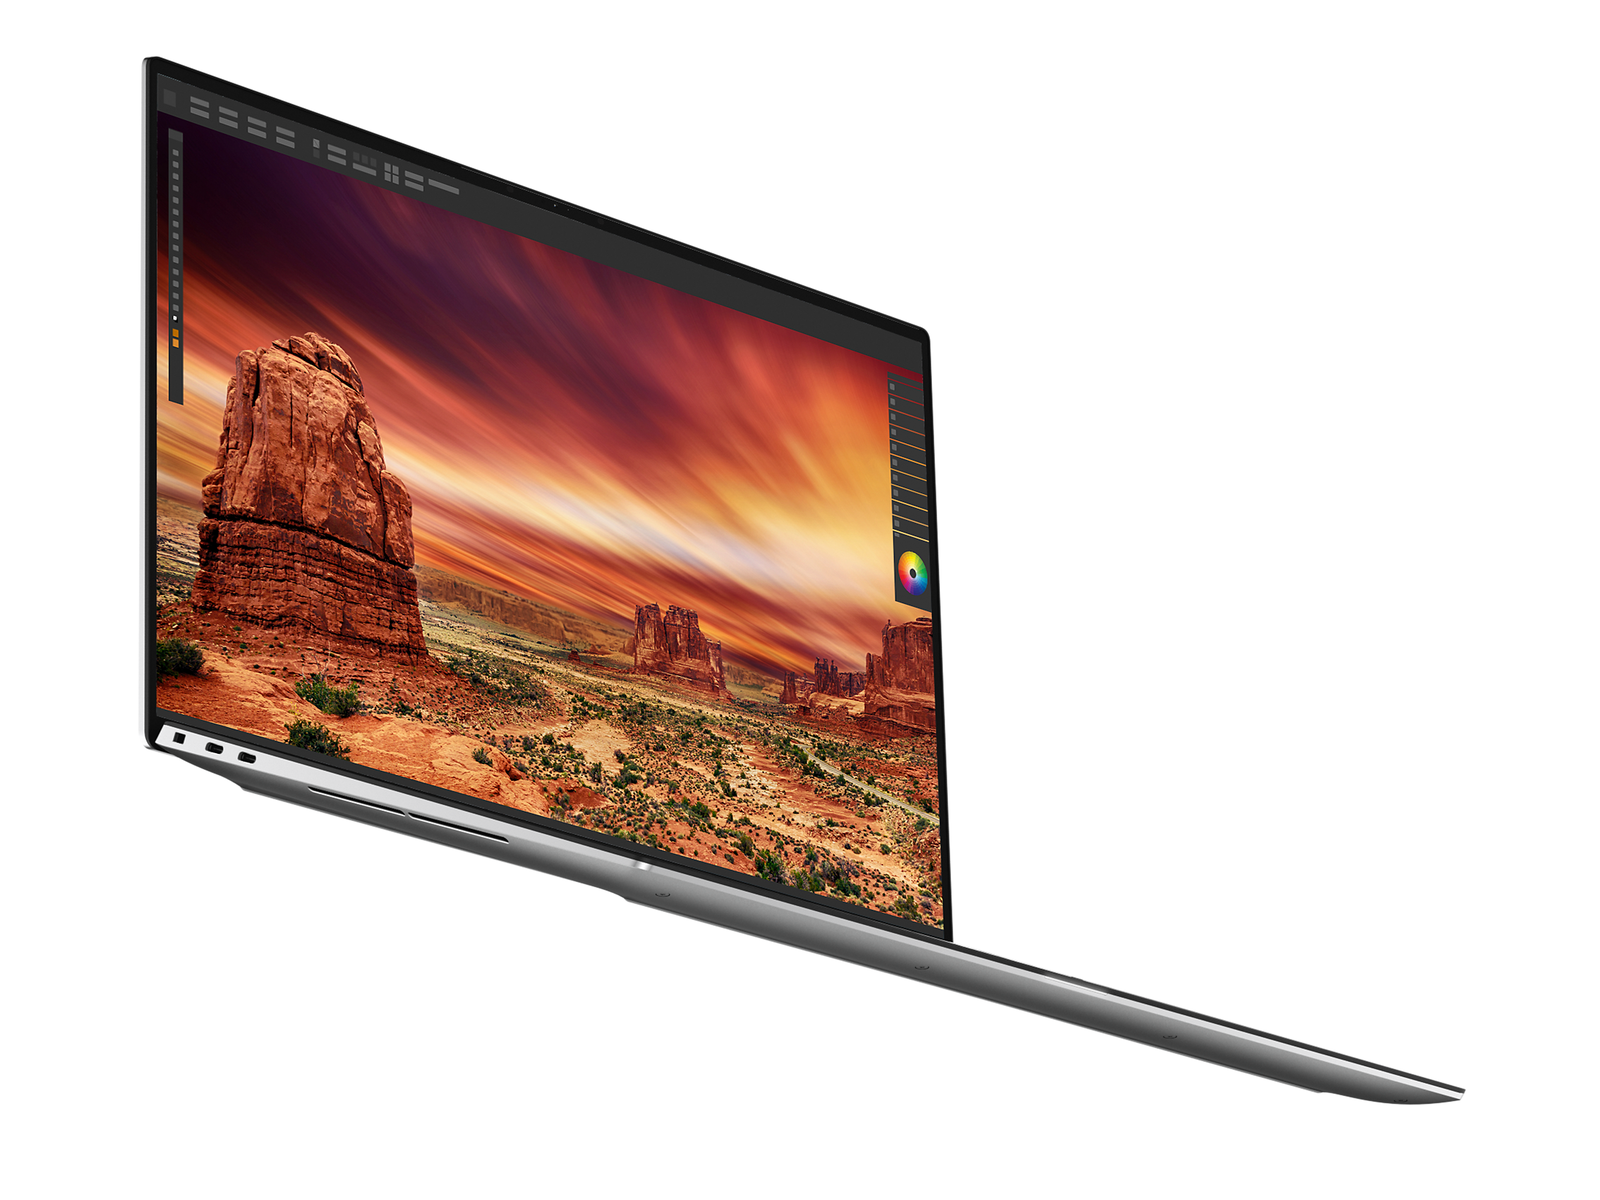
Obudowa - bez większych zmian od czasu XPS 15 9500
Czytnik kart SD
| SD Card Reader | |
| average JPG Copy Test (av. of 3 runs) | |
| Dell XPS 15 9500 Core i7 4K UHD (Toshiba Exceria Pro SDXC 64 GB UHS-II) | |
| Gigabyte Aero 15 OLED XD (AV PRO microSD 128 GB V60) | |
| Dell XPS 15 9520 RTX 3050 Ti (Toshiba Exceria Pro SDXC 64 GB UHS-II) | |
| Dell XPS 15 9530 RTX 4070 (Toshiba Exceria Pro SDXC 64 GB UHS-II) | |
| Asus Zenbook Pro 15 OLED UM535Q (Toshiba Exceria Pro SDXC 64 GB UHS-II) | |
| MSI Prestige 15 A12UD-093 (AV Pro SD microSD 128 GB V60) | |
| maximum AS SSD Seq Read Test (1GB) | |
| Dell XPS 15 9500 Core i7 4K UHD (Toshiba Exceria Pro SDXC 64 GB UHS-II) | |
| Gigabyte Aero 15 OLED XD (AV PRO microSD 128 GB V60) | |
| Dell XPS 15 9530 RTX 4070 (Toshiba Exceria Pro SDXC 64 GB UHS-II) | |
| Dell XPS 15 9520 RTX 3050 Ti (Toshiba Exceria Pro SDXC 64 GB UHS-II) | |
| MSI Prestige 15 A12UD-093 (AV Pro SD microSD 128 GB V60) | |
| Asus Zenbook Pro 15 OLED UM535Q (Toshiba Exceria Pro SDXC 64 GB UHS-II) | |
Komunikacja
Intel AX211 jest standardowo wyposażony w obsługę Wi-Fi 6E i Bluetooth 5.2. Jesteśmy w stanie połączyć się z naszą siecią Asus AXE11000 Wi-Fi 6 bez problemów, ale laptop dziwnie nie rozpoznaje i nie łączy się z naszą siecią Wi-Fi 6 GHz. Inne urządzenia z obsługą Wi-Fi 6E, jak np Pixel 7 Pro mogły rozpoznać i połączyć się z naszą siecią 6 GHz bez żadnych problemów.
| Networking | |
| iperf3 transmit AX12 | |
| Gigabyte Aero 15 OLED XD | |
| Dell XPS 15 9500 Core i7 4K UHD | |
| Asus Zenbook Pro 15 OLED UM535Q | |
| iperf3 receive AX12 | |
| Dell XPS 15 9500 Core i7 4K UHD | |
| Gigabyte Aero 15 OLED XD | |
| Asus Zenbook Pro 15 OLED UM535Q | |
| iperf3 transmit AXE11000 | |
| Dell XPS 15 9530 RTX 4070 | |
| Dell XPS 15 9520 RTX 3050 Ti | |
| MSI Prestige 15 A12UD-093 | |
| iperf3 receive AXE11000 | |
| Dell XPS 15 9520 RTX 3050 Ti | |
| Dell XPS 15 9530 RTX 4070 | |
| MSI Prestige 15 A12UD-093 | |
| iperf3 transmit AXE11000 6GHz | |
| MSI Prestige 15 A12UD-093 | |
| iperf3 receive AXE11000 6GHz | |
| MSI Prestige 15 A12UD-093 | |
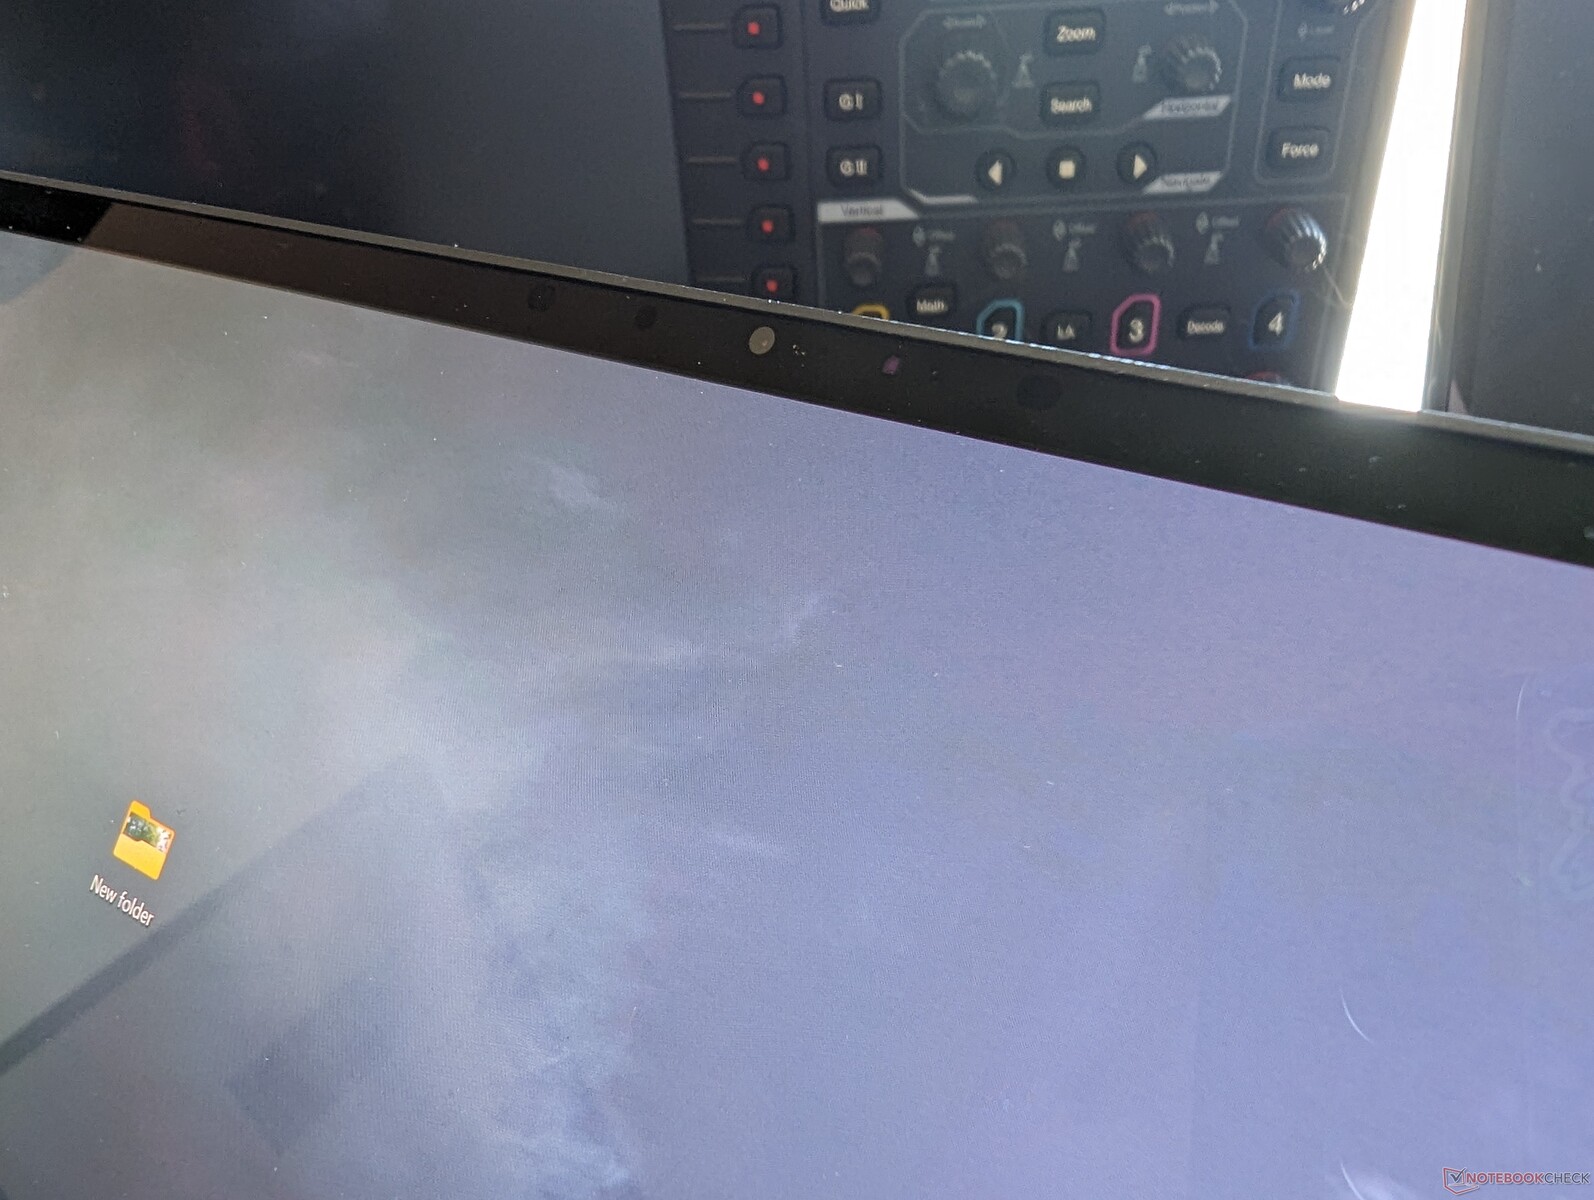
Kamera internetowa - rozdzielczość 1 MP robi się żenująca
Najnowszy XPS 15 *wciąż* opiera się na niskiej rozdzielczości 1 MP/720p kamerze internetowej bez migawki prywatności, pomimo ceny wywoławczej 2000 USD. Konkurencyjne modele, jak np HP Spectre x360 16 czy seria Razer Blade, przeszły już na sensory 2 MP lub nawet 5 MP. Nie trzeba dodawać, że jakość obrazu jest bardzo rozmyta na pięknym wyświetlaczu OLED. Przynajmniej podczerwień jest obsługiwana.
Dell twierdzi, że niska rozdzielczość kamerki jest konsekwencją posiadania jednej z najwęższych ramek w laptopie. Wyższa rozdzielczość kamerki miałaby rzekomo pogrubić ramkę.


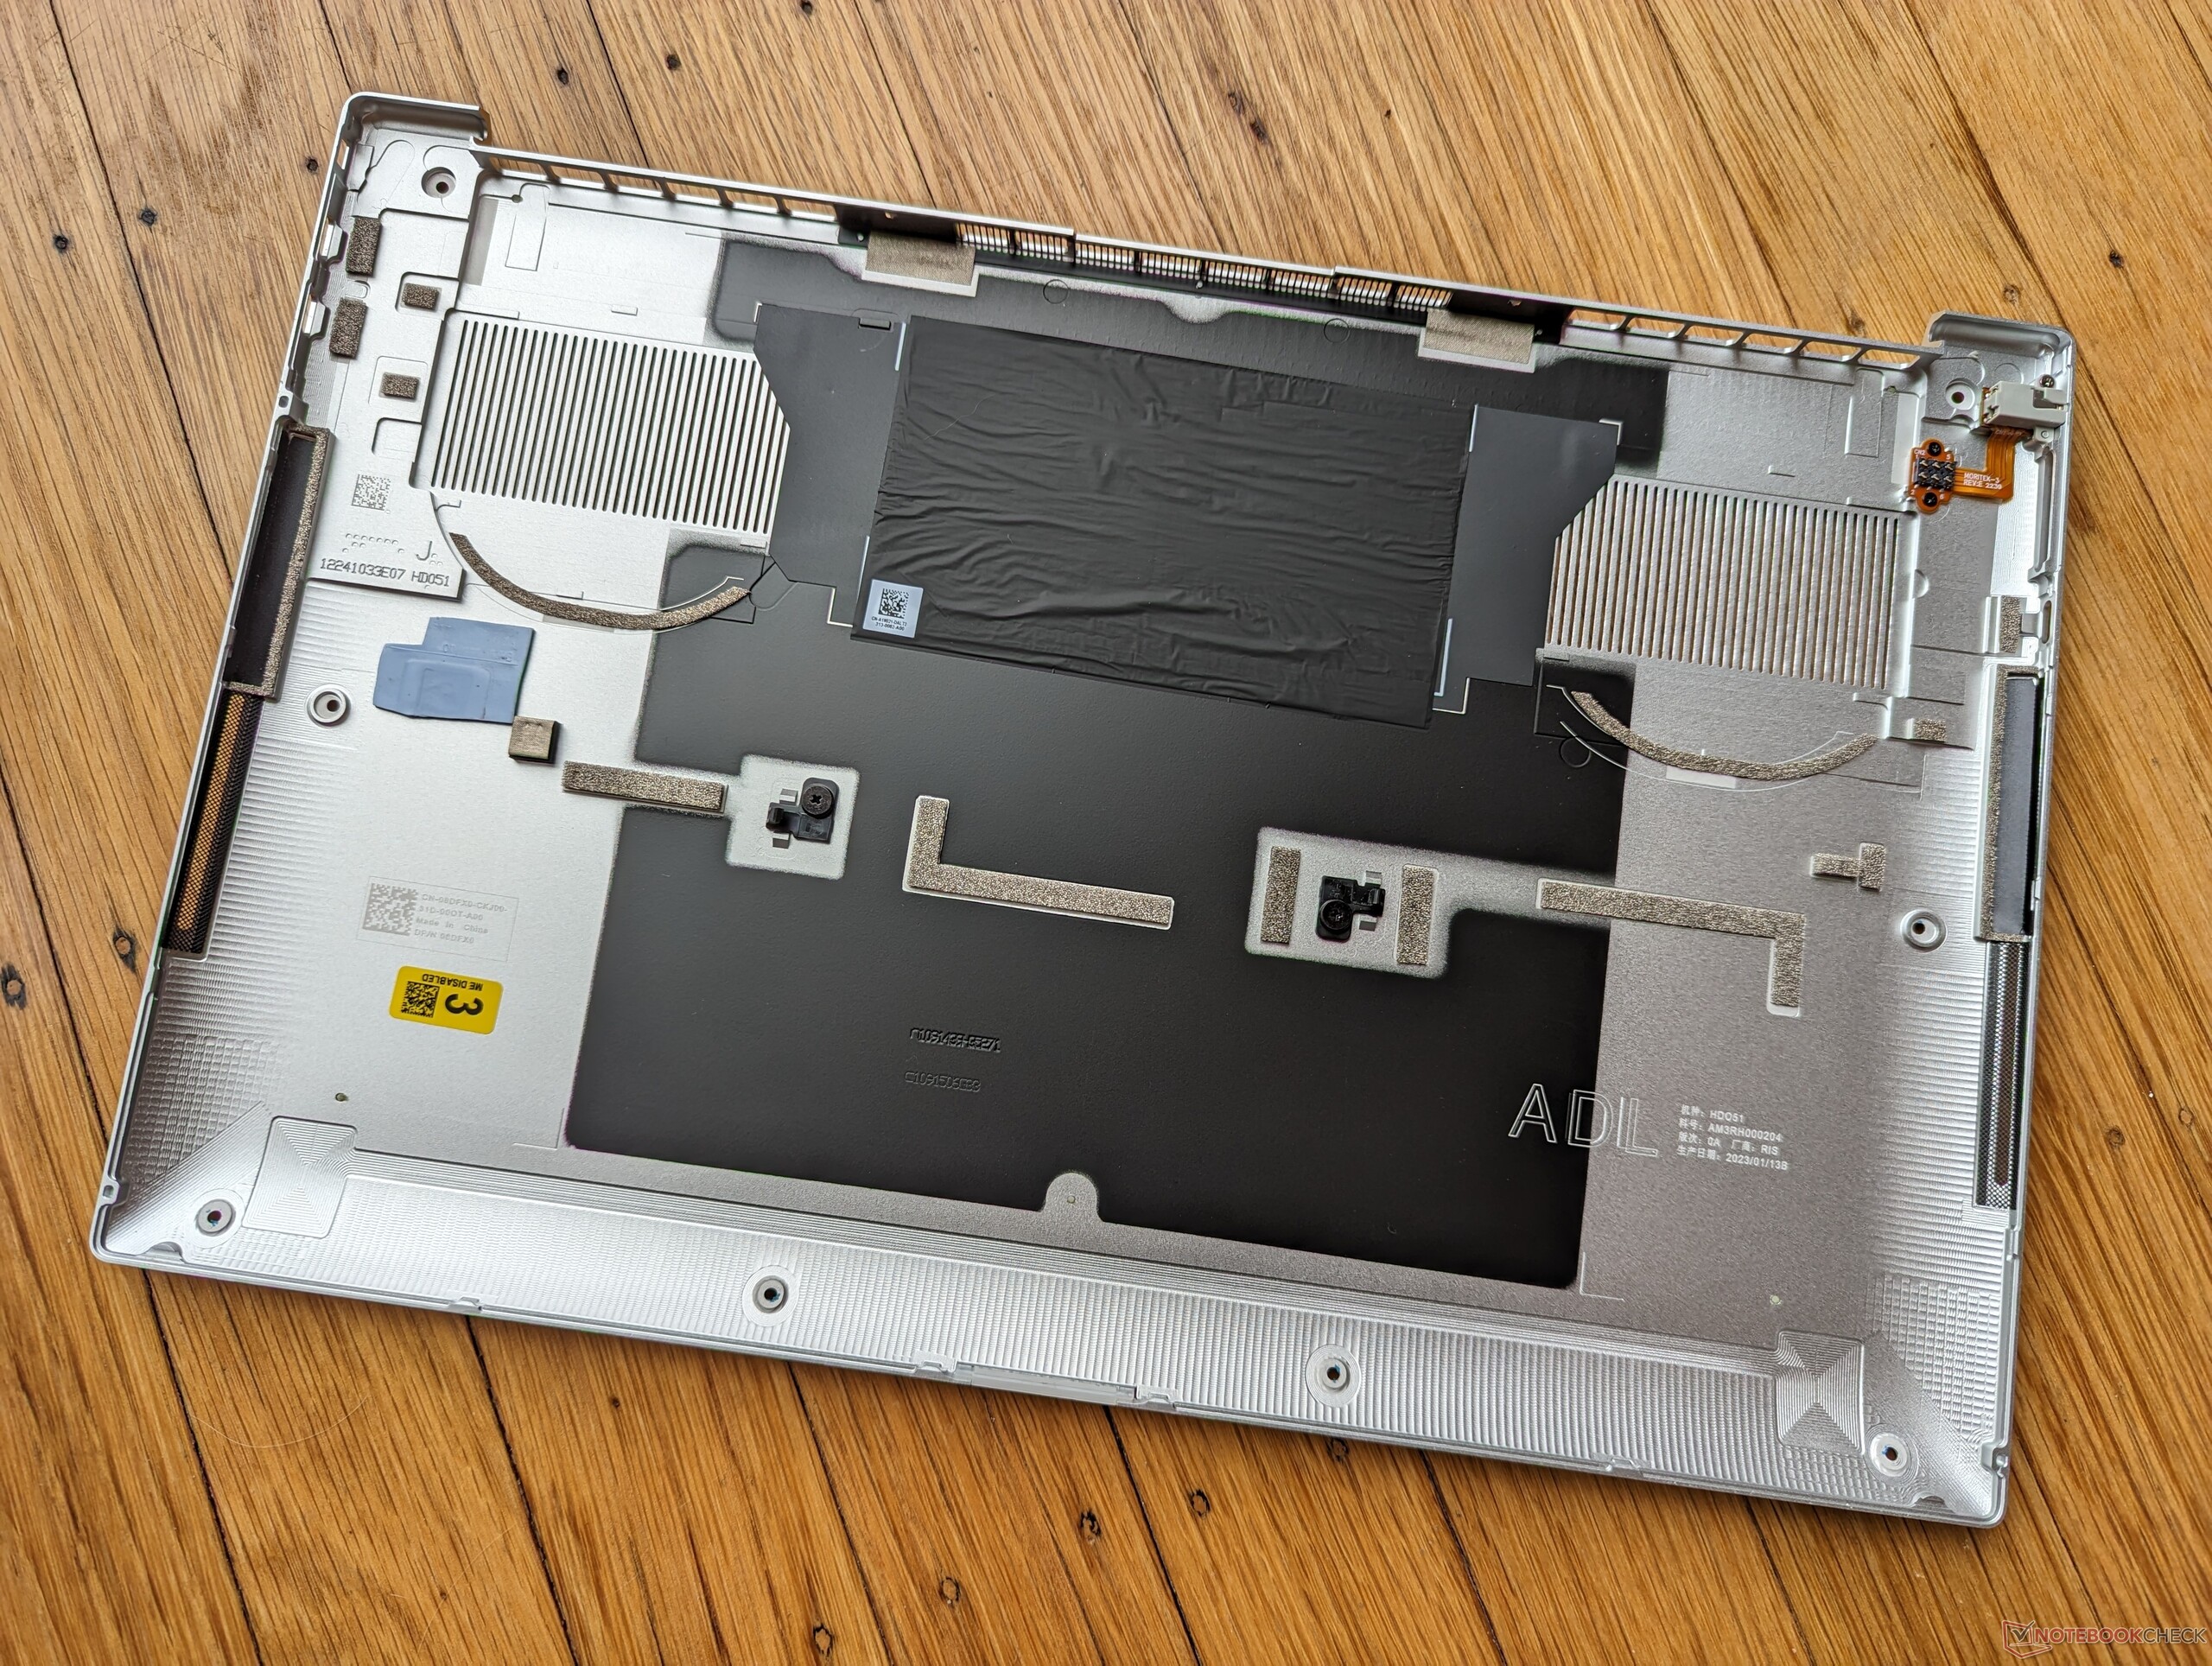
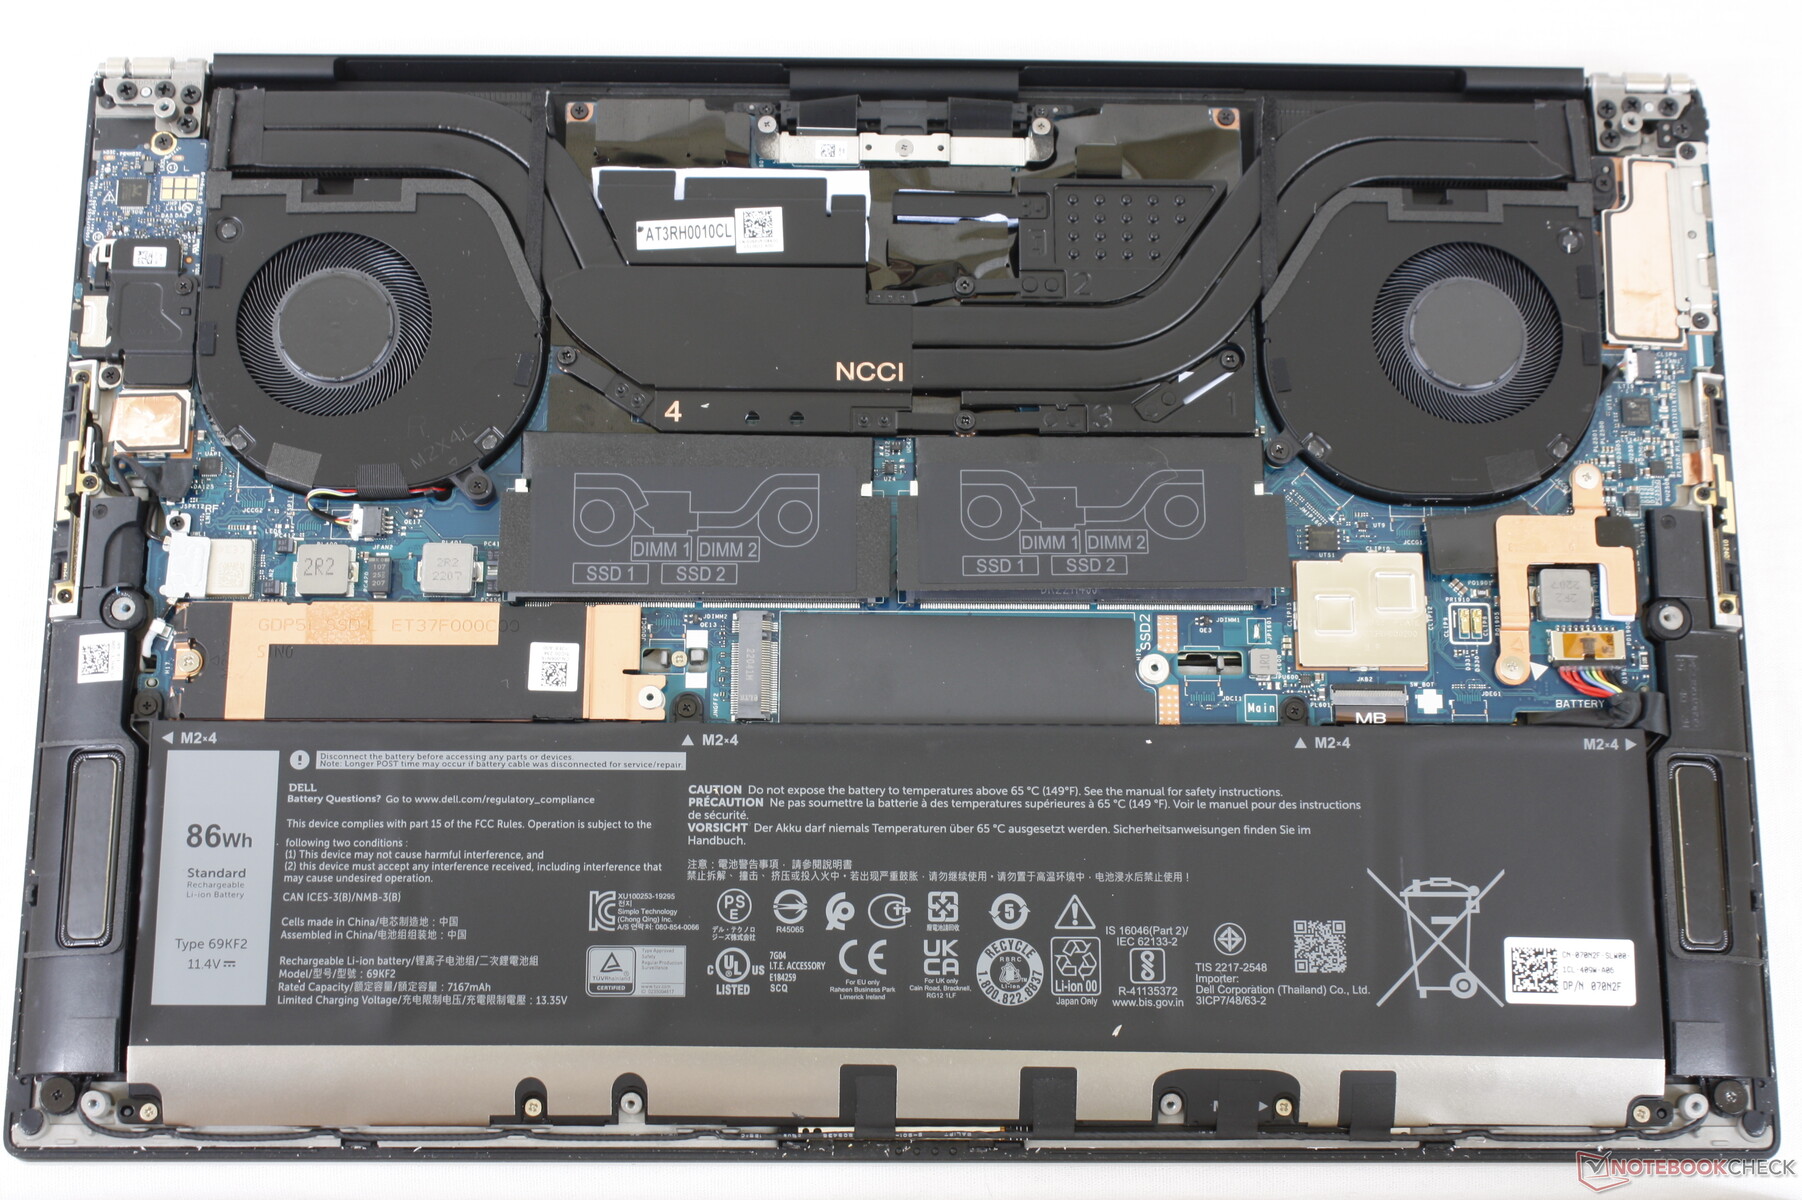
Konserwacja
Akcesoria i gwarancja
Dell nadal zawiera poręczny adapter USB-C do USB-A i HDMI wewnątrz każdego pudełka detalicznego, co doceniamy. Obowiązuje zwykła roczna ograniczona gwarancja producenta.
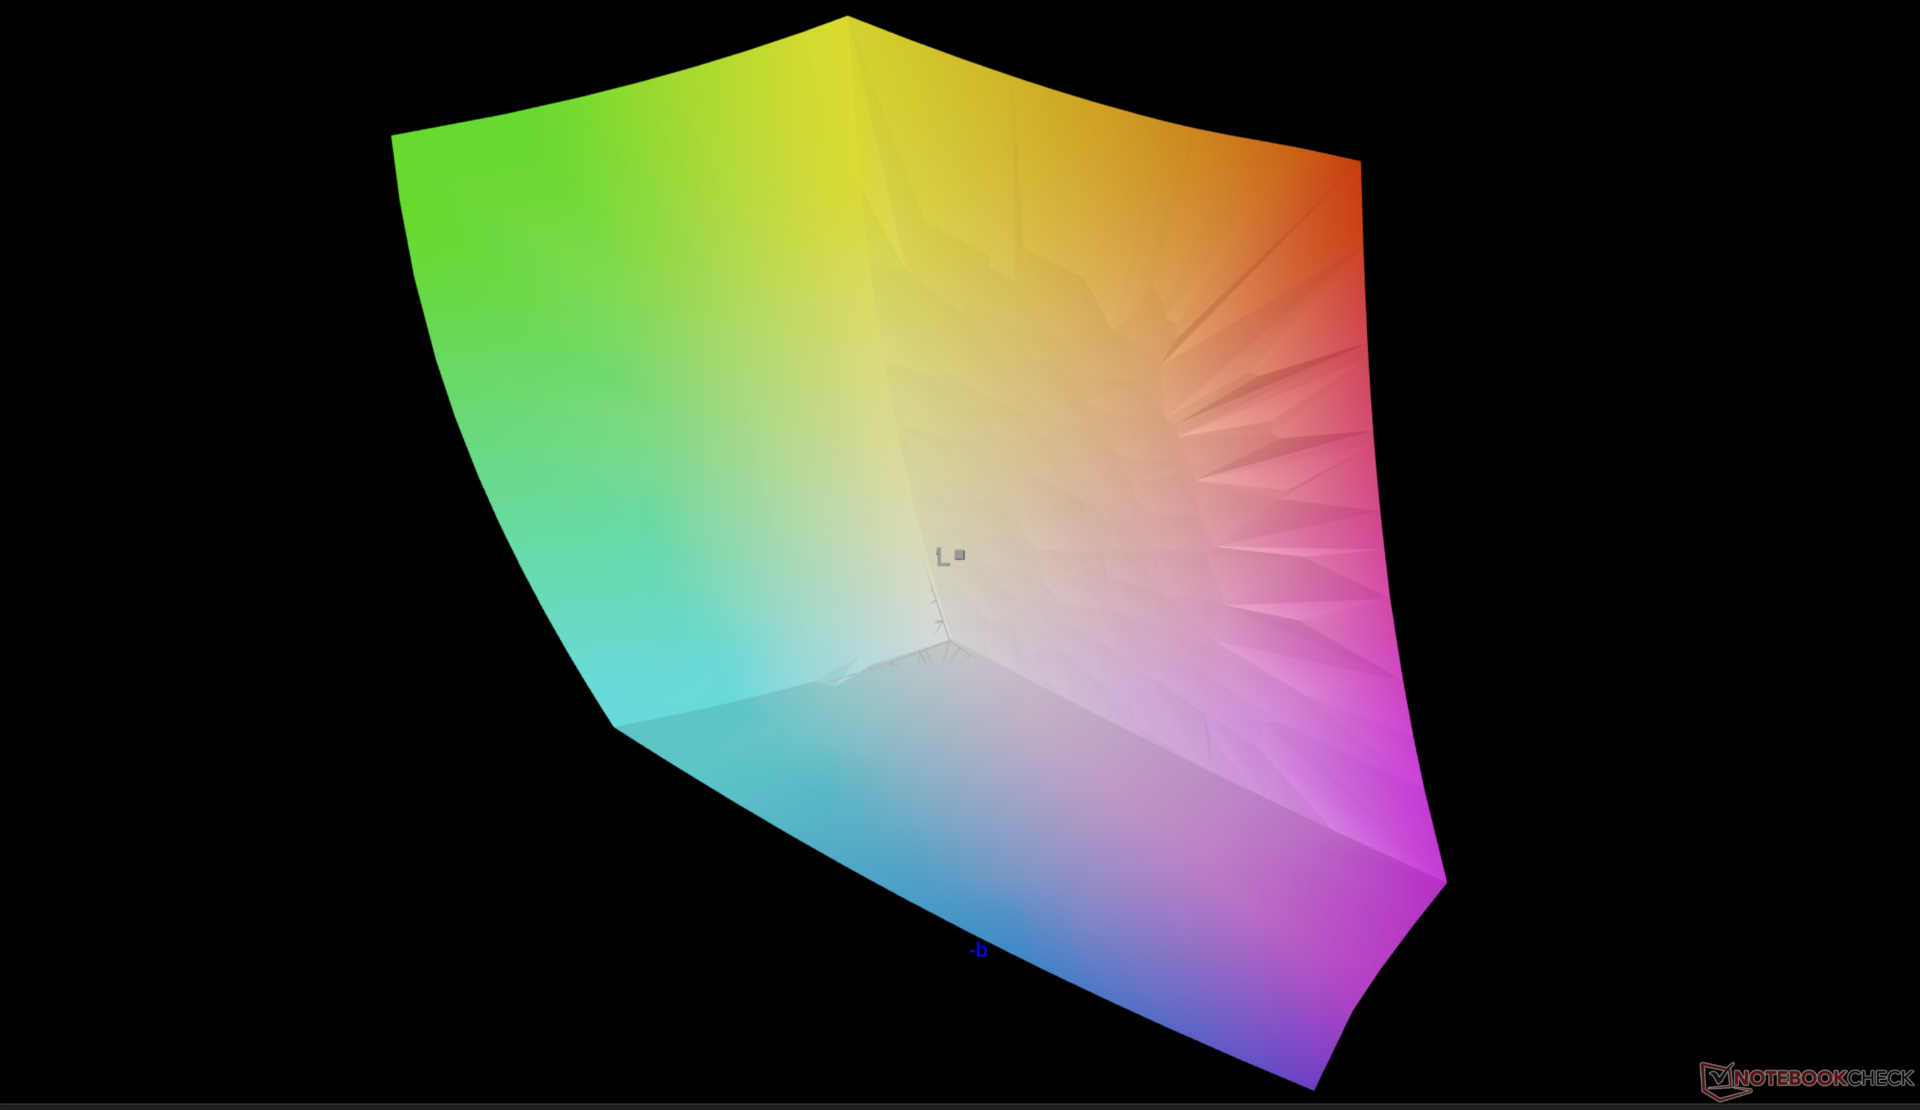
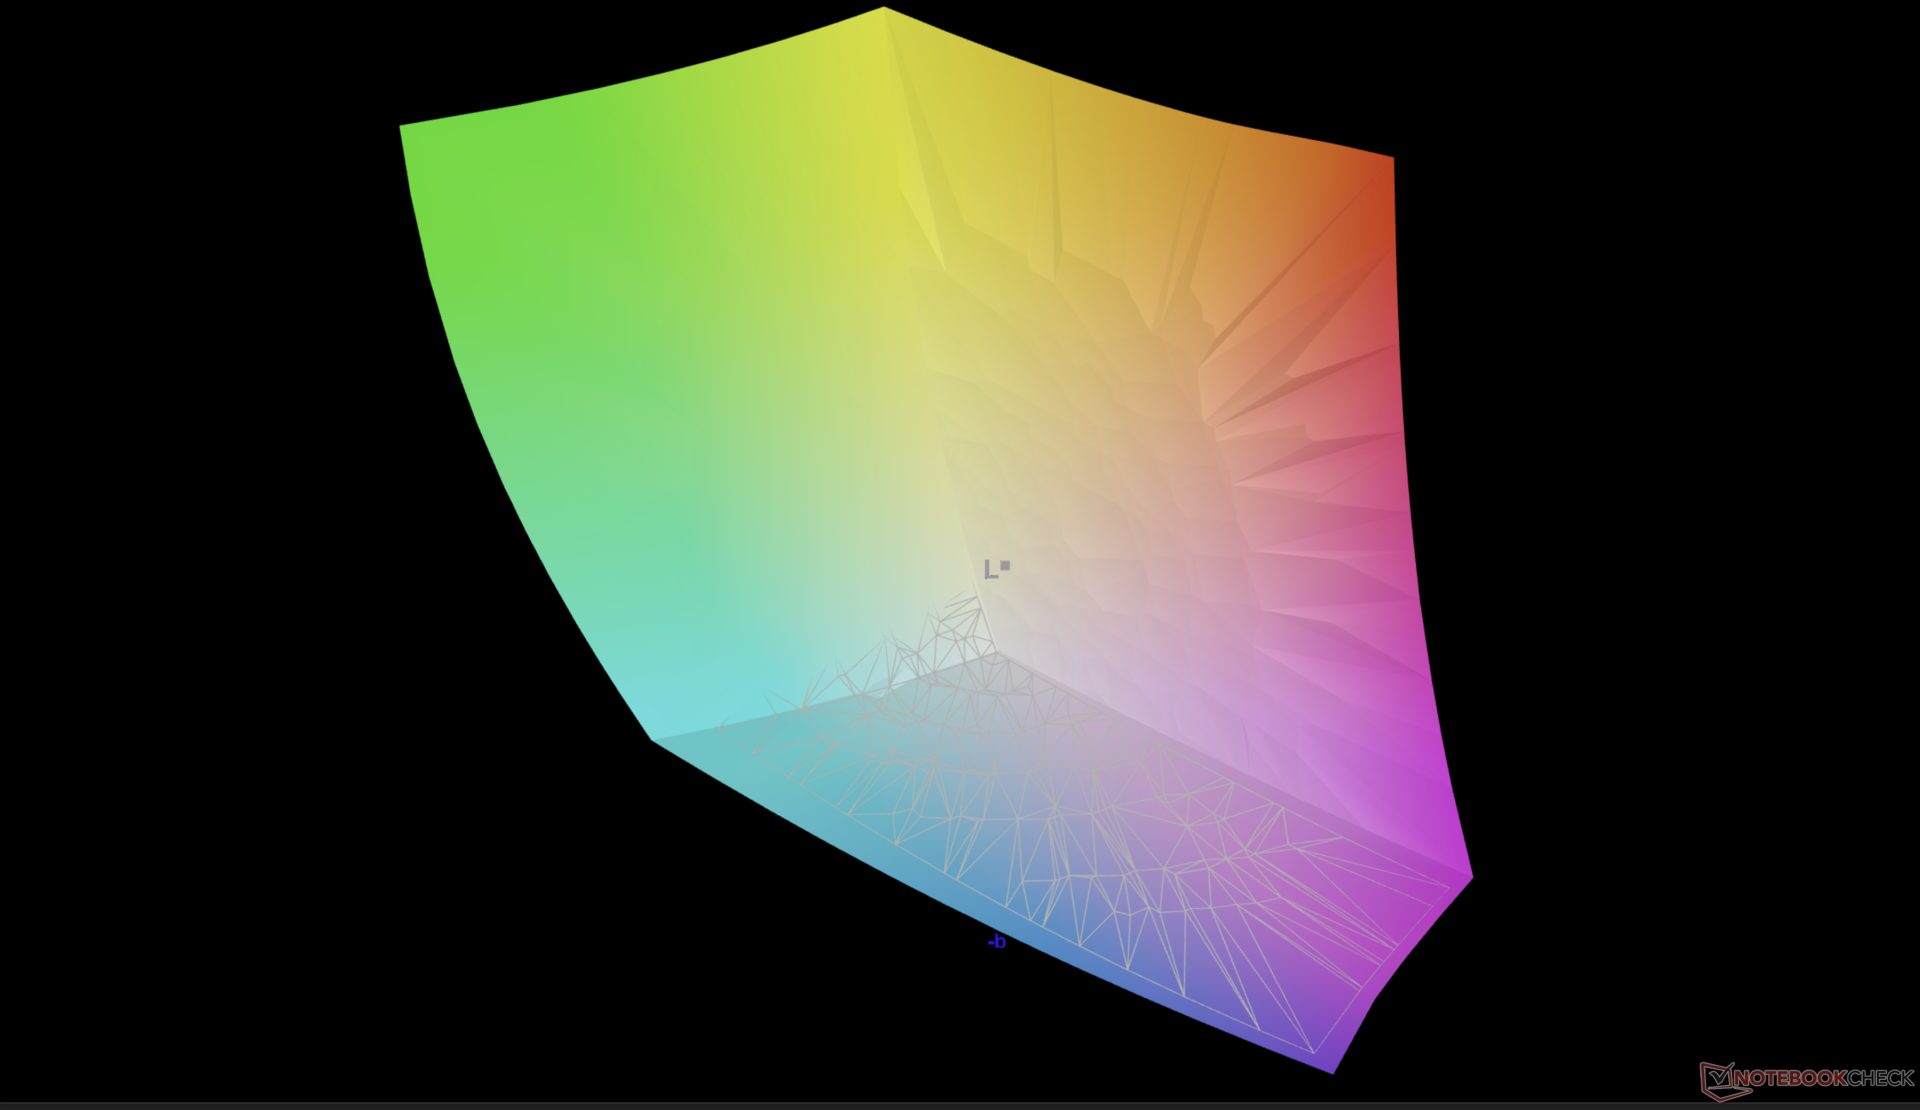
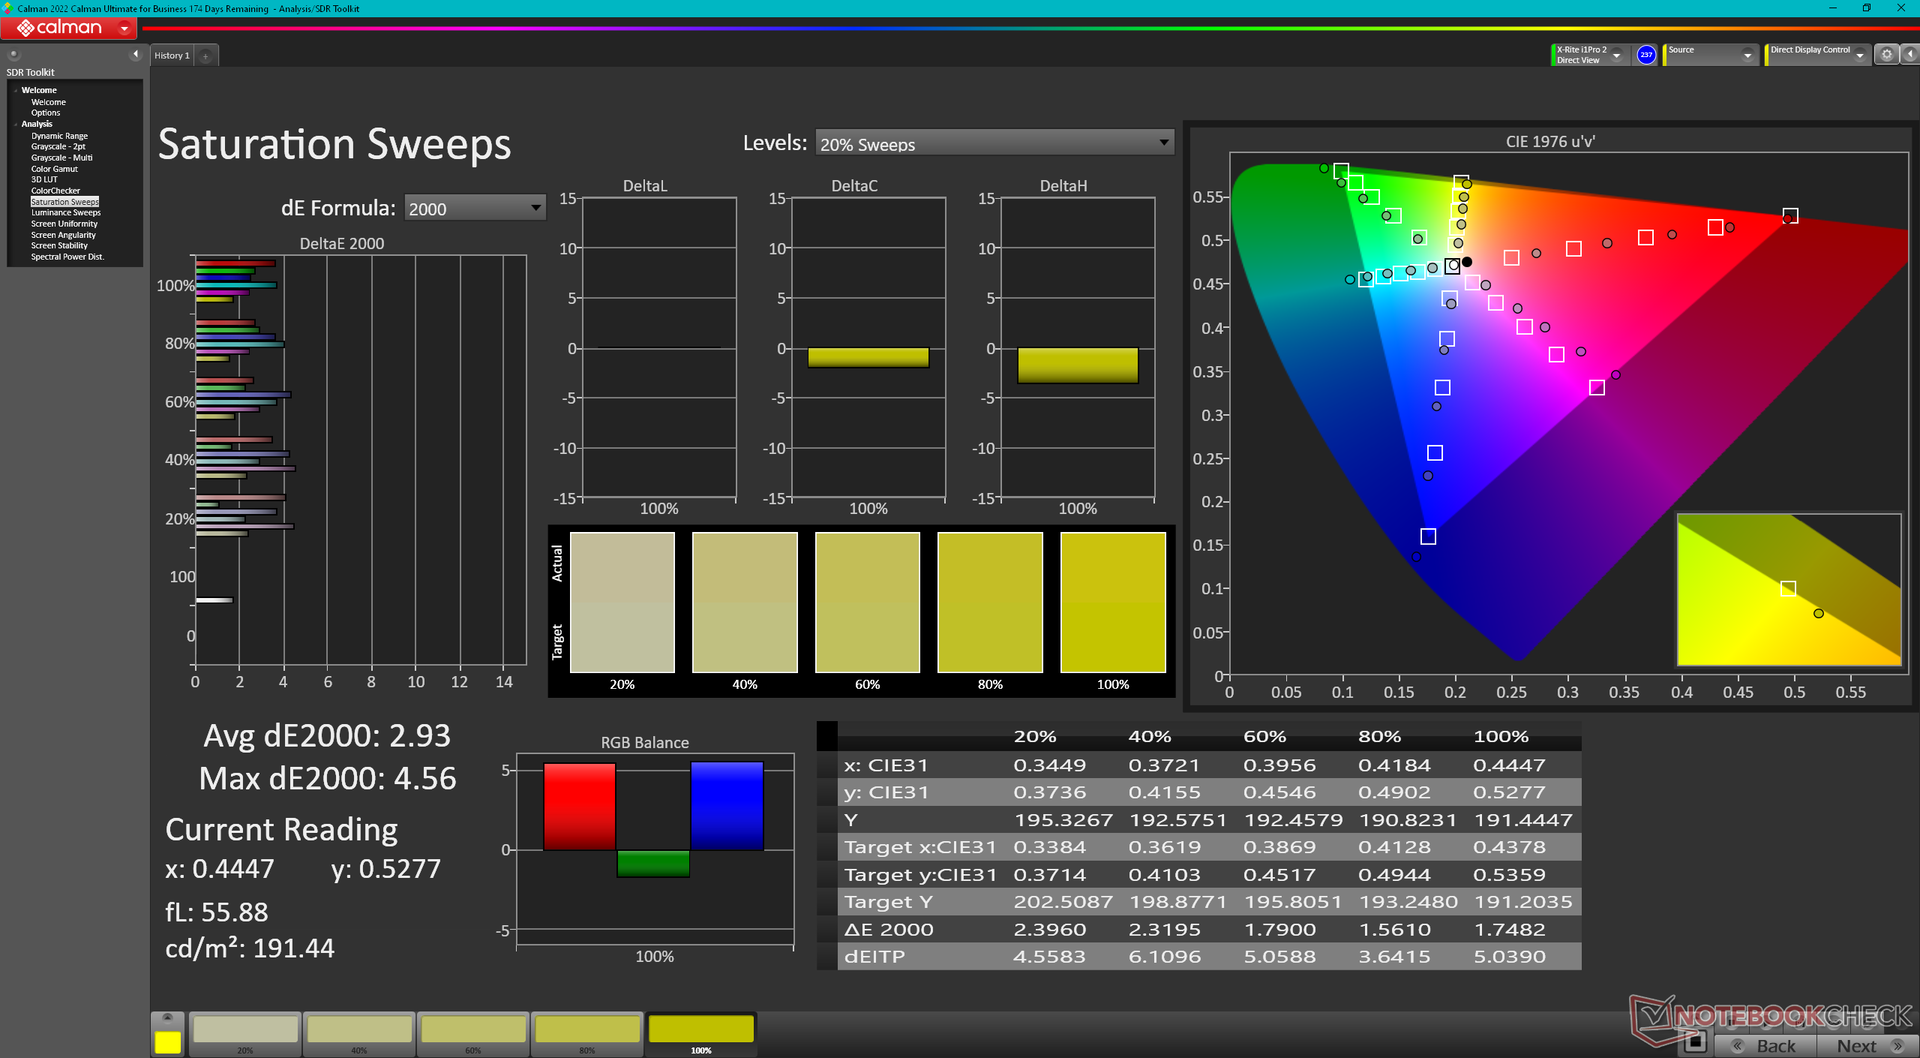
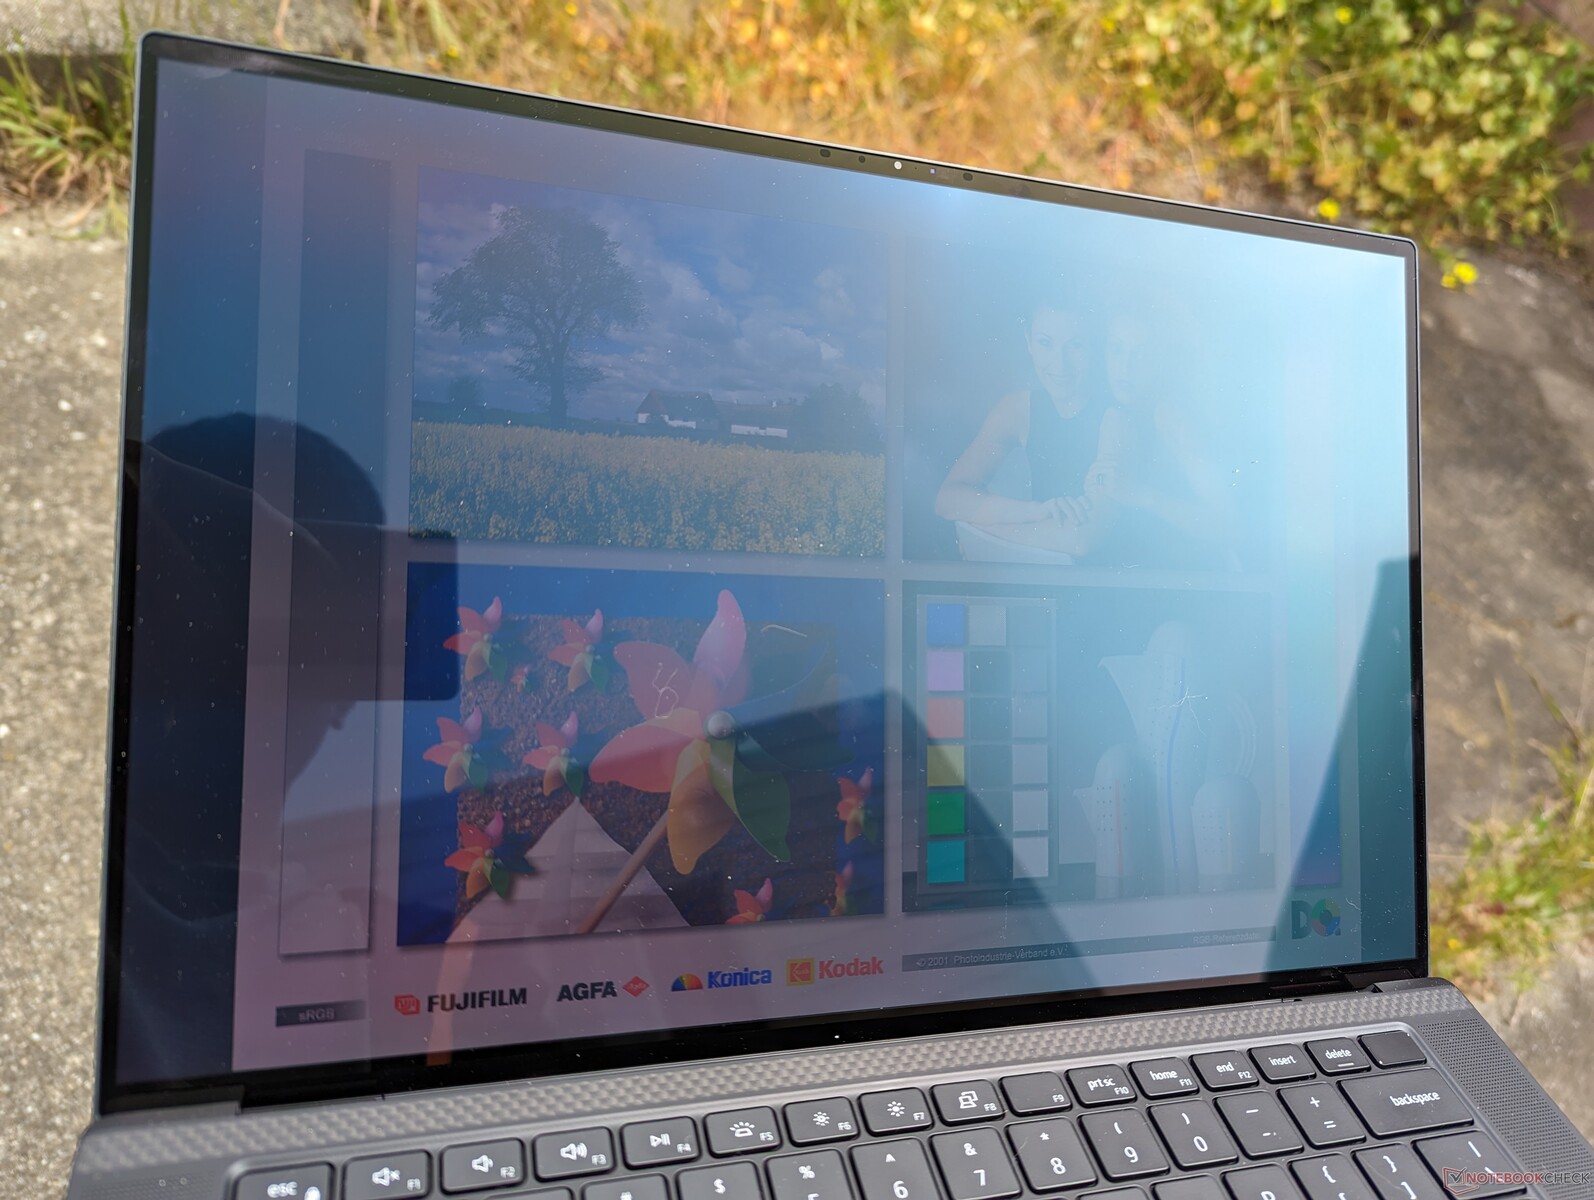
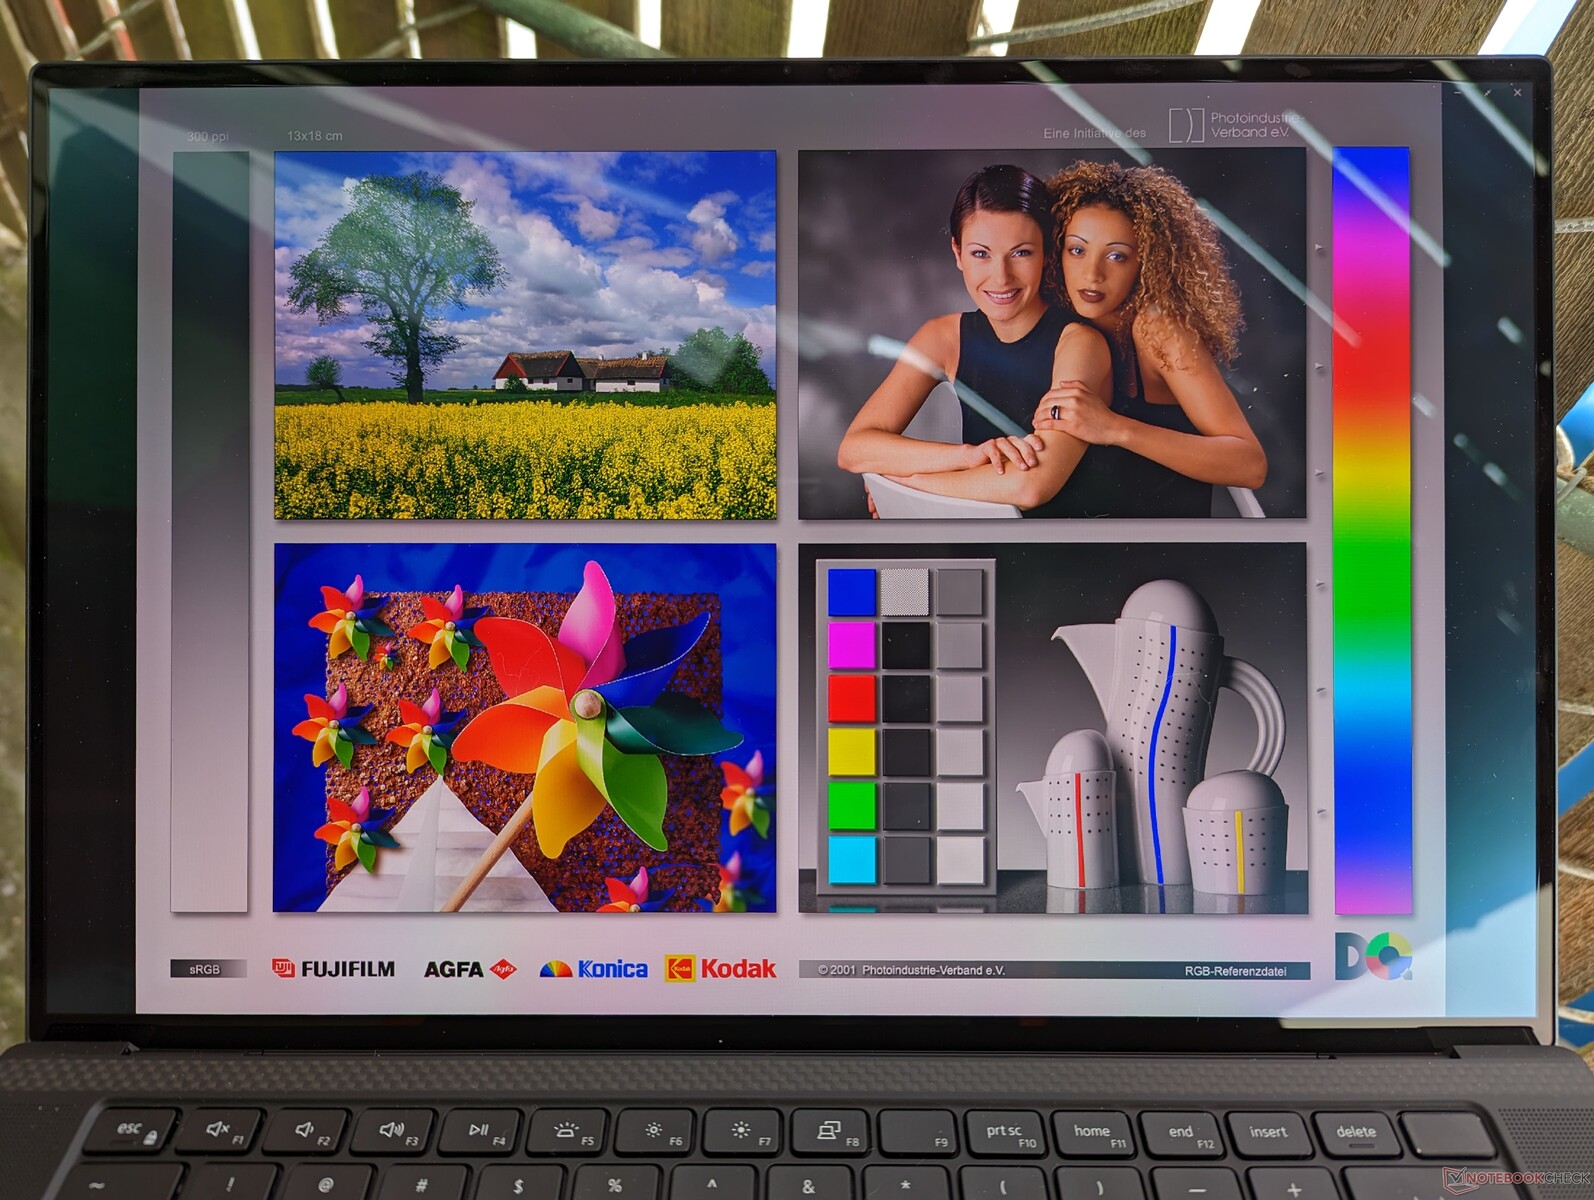
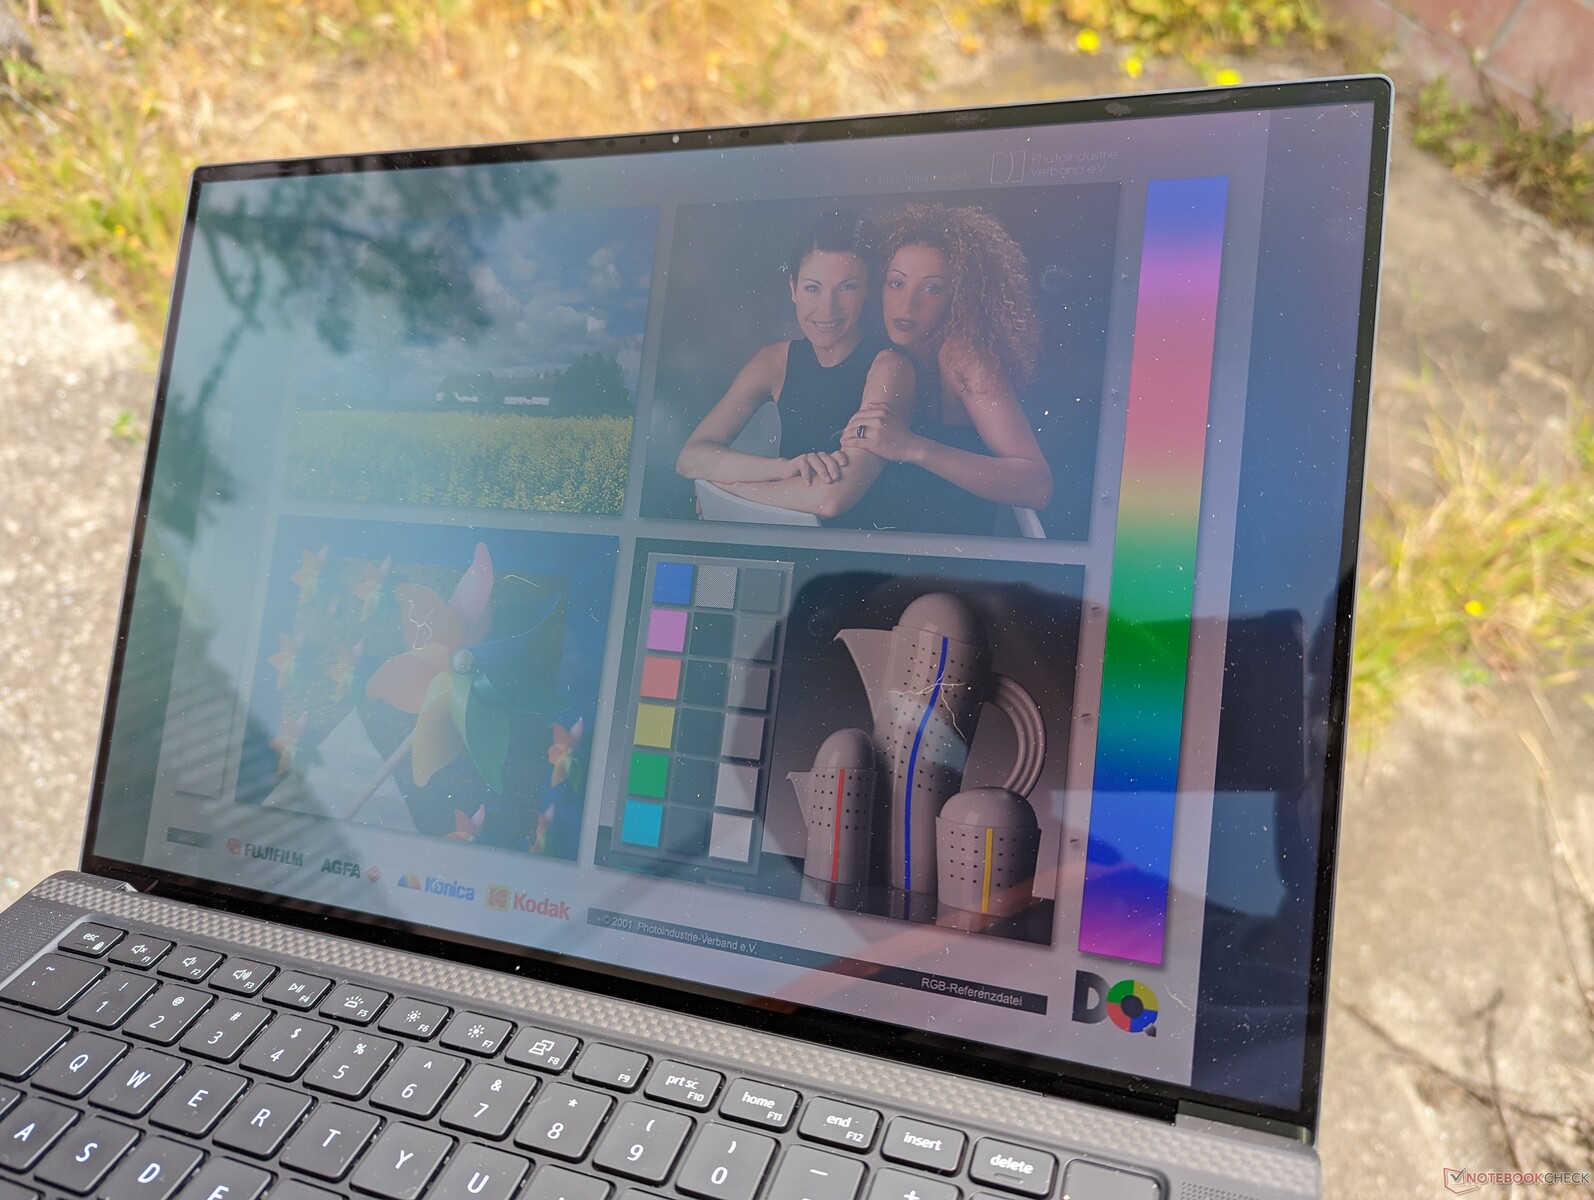
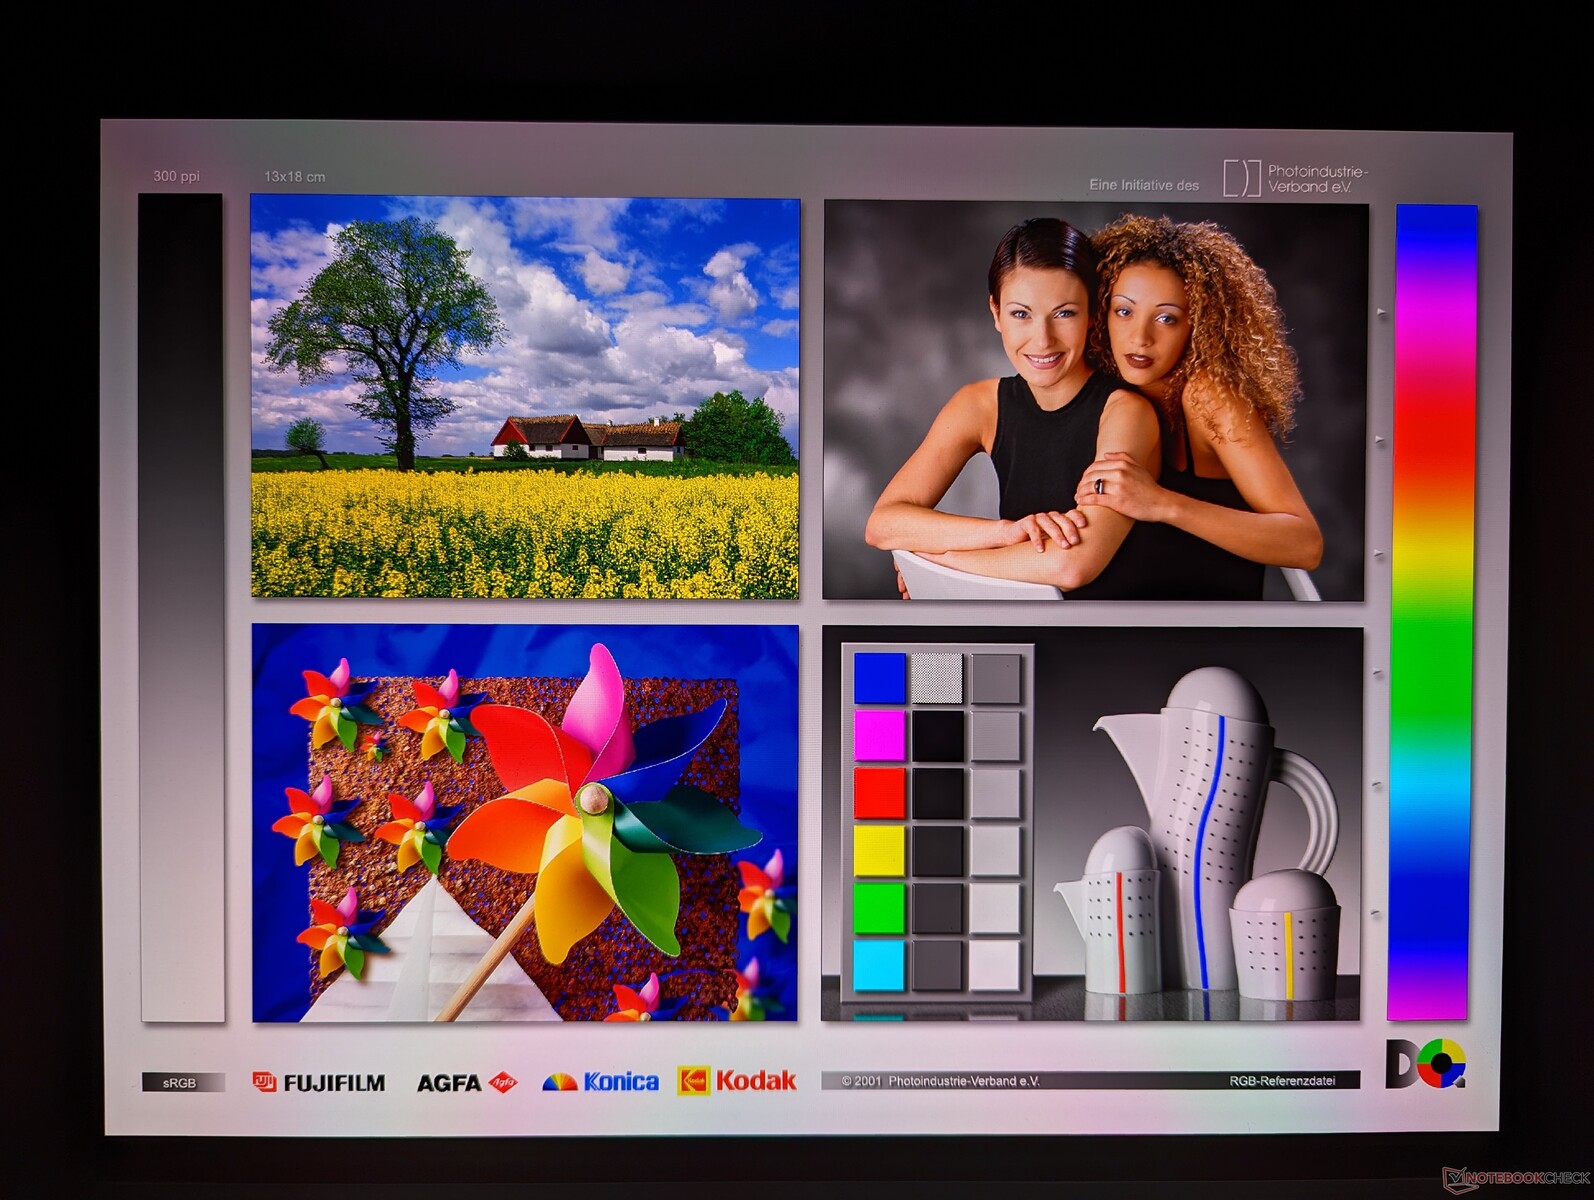
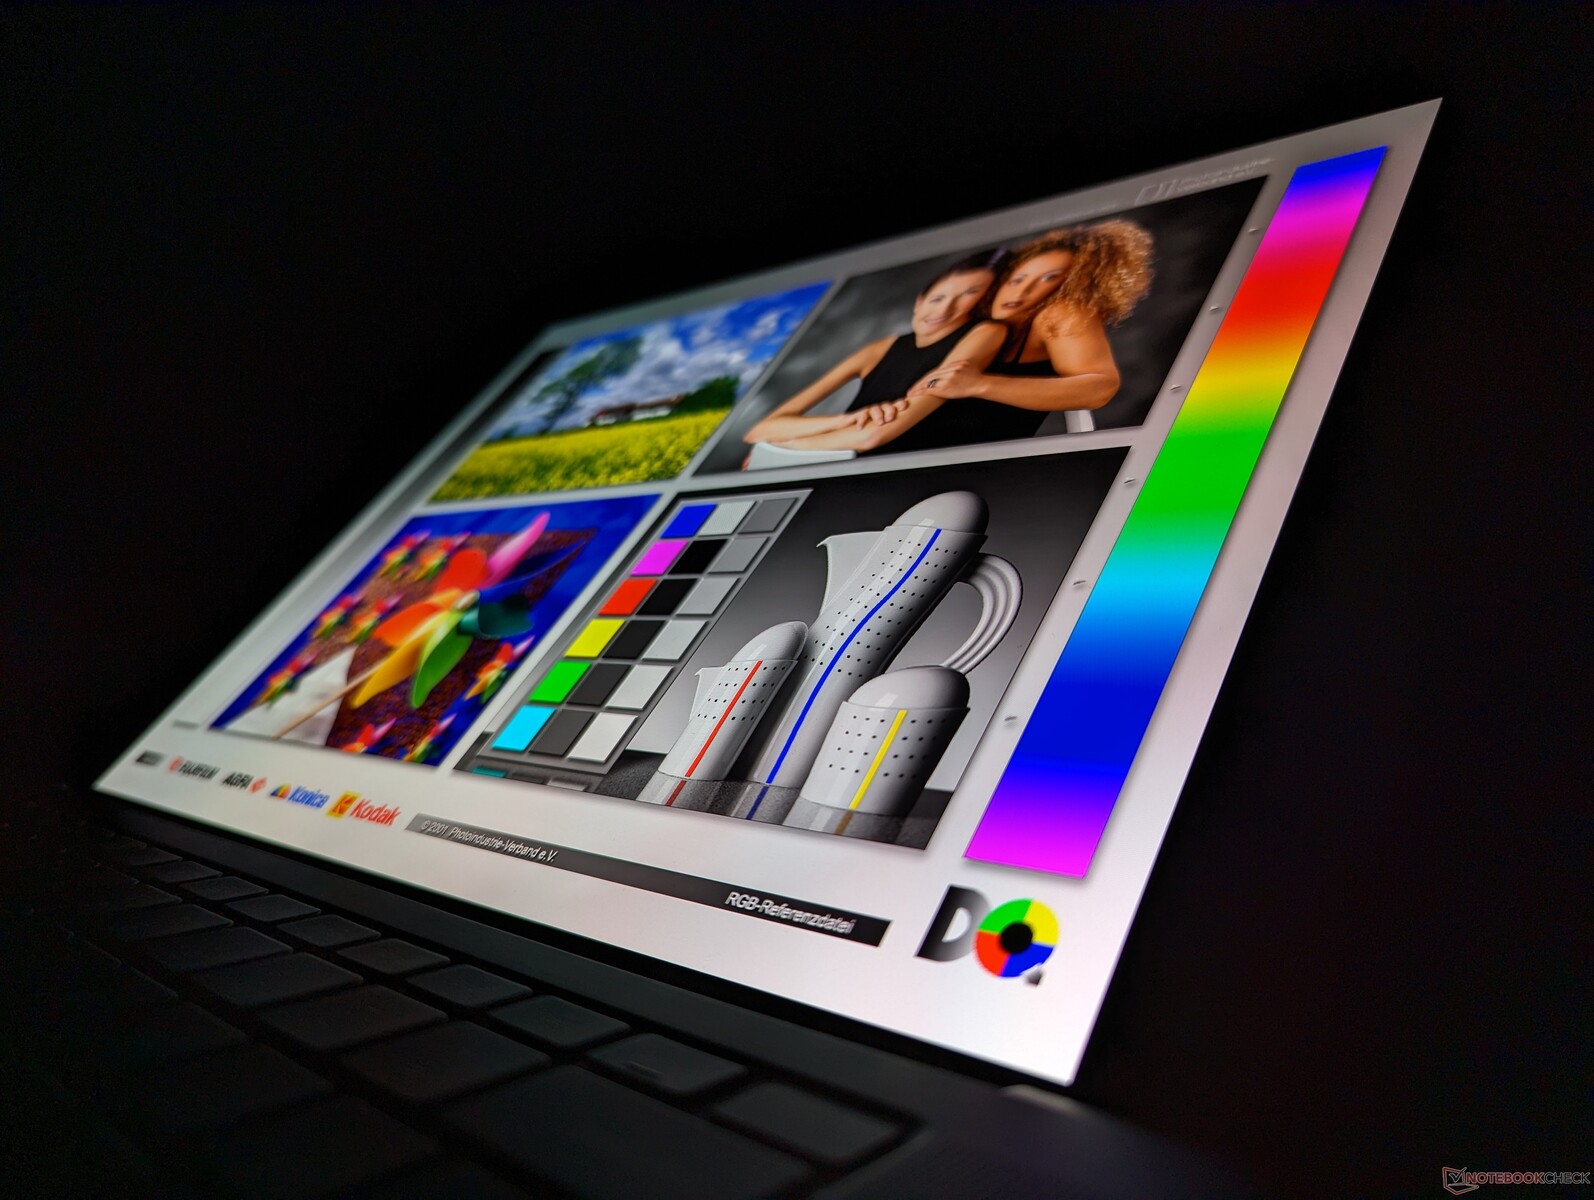
Wyświetlacz - 3,5K Samsung OLED wciąż wygląda niesamowicie

Dell wykorzystuje ten sam panel Samsung 156XG01 OLED w swoich modelach XPS 15 z lat 2023 i 2022, aby zapewnić podobne wrażenia z oglądania. Nie jest to koniecznie zła rzecz, ponieważ panel Samsunga nadal oferuje zarówno pełne kolory DCI-P3, jak i ostry obraz, ale chętnie zobaczylibyśmy w przyszłości opcje paneli 90 Hz lub szybszych. Niektóre modele Asus VivoBooksą wyposażone w panele OLED o częstotliwości 120 Hz, co zapewnia znacznie płynniejsze wrażenia wizualne.
| |||||||||||||||||||||||||
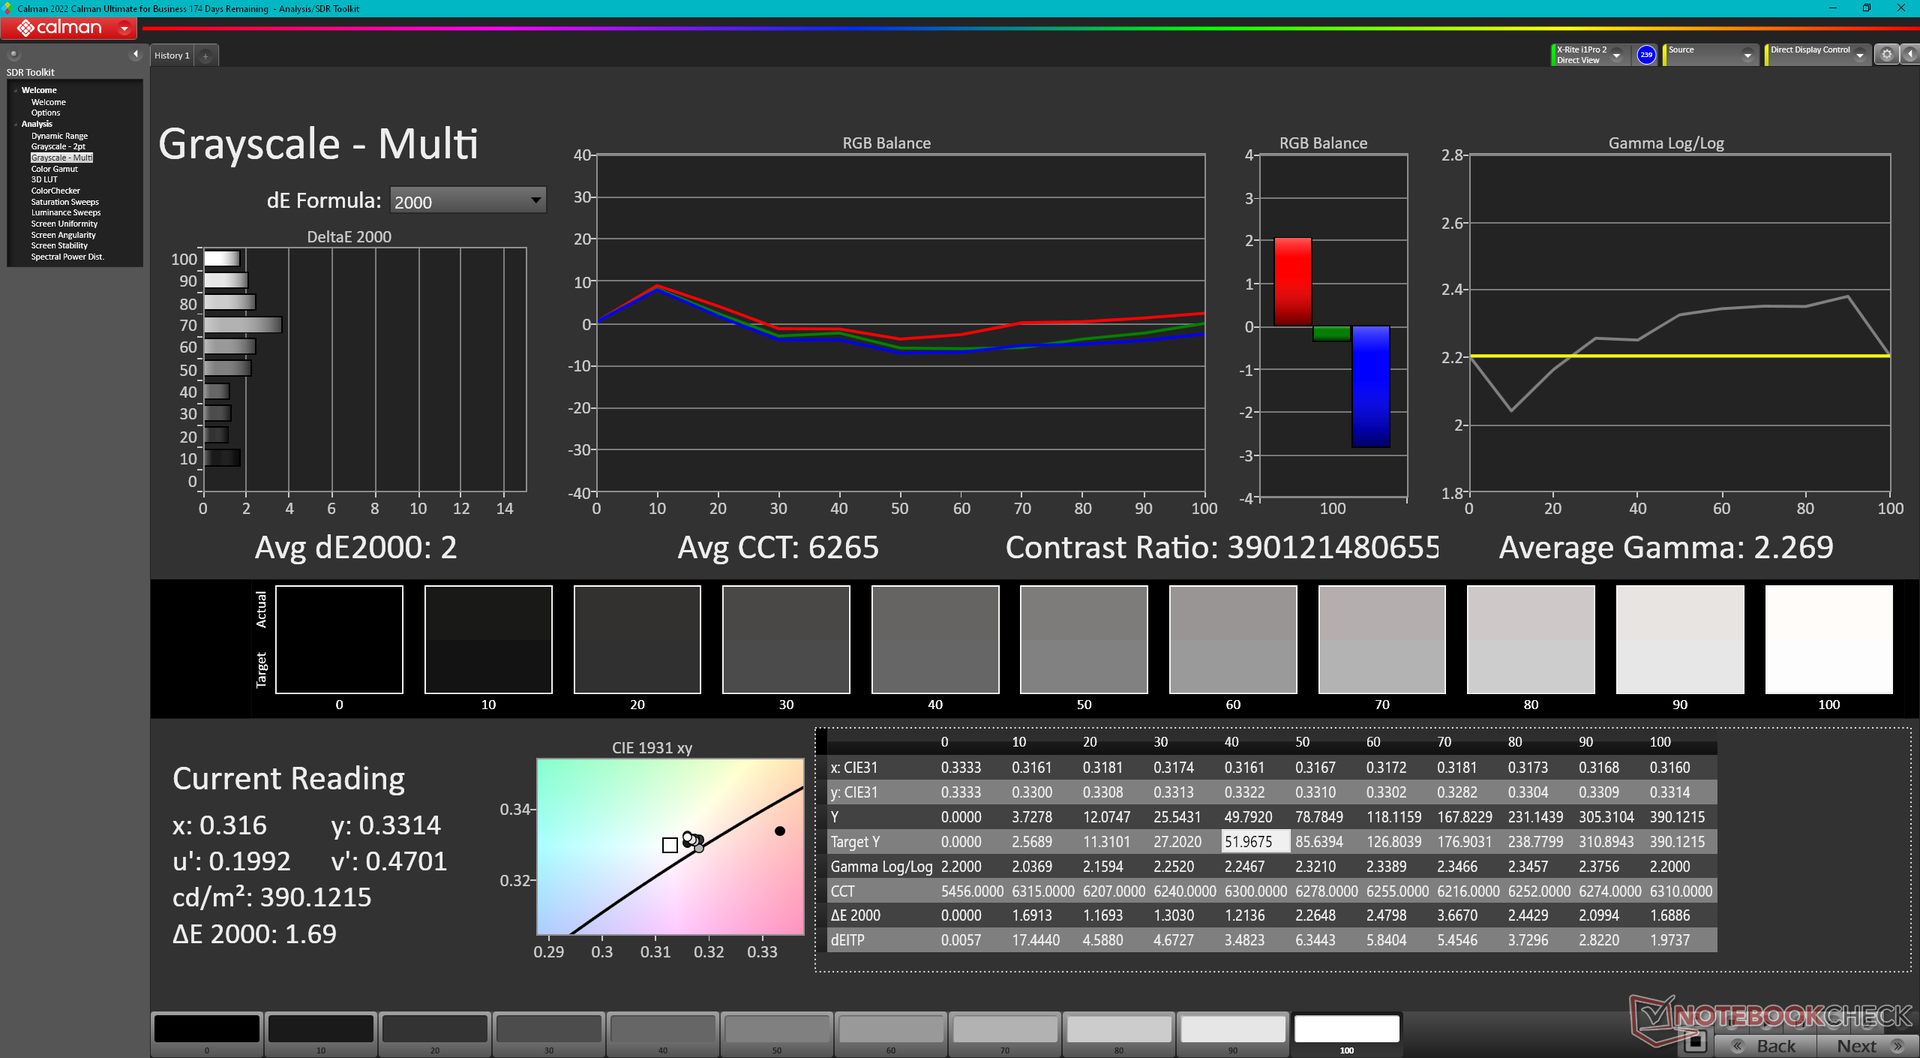
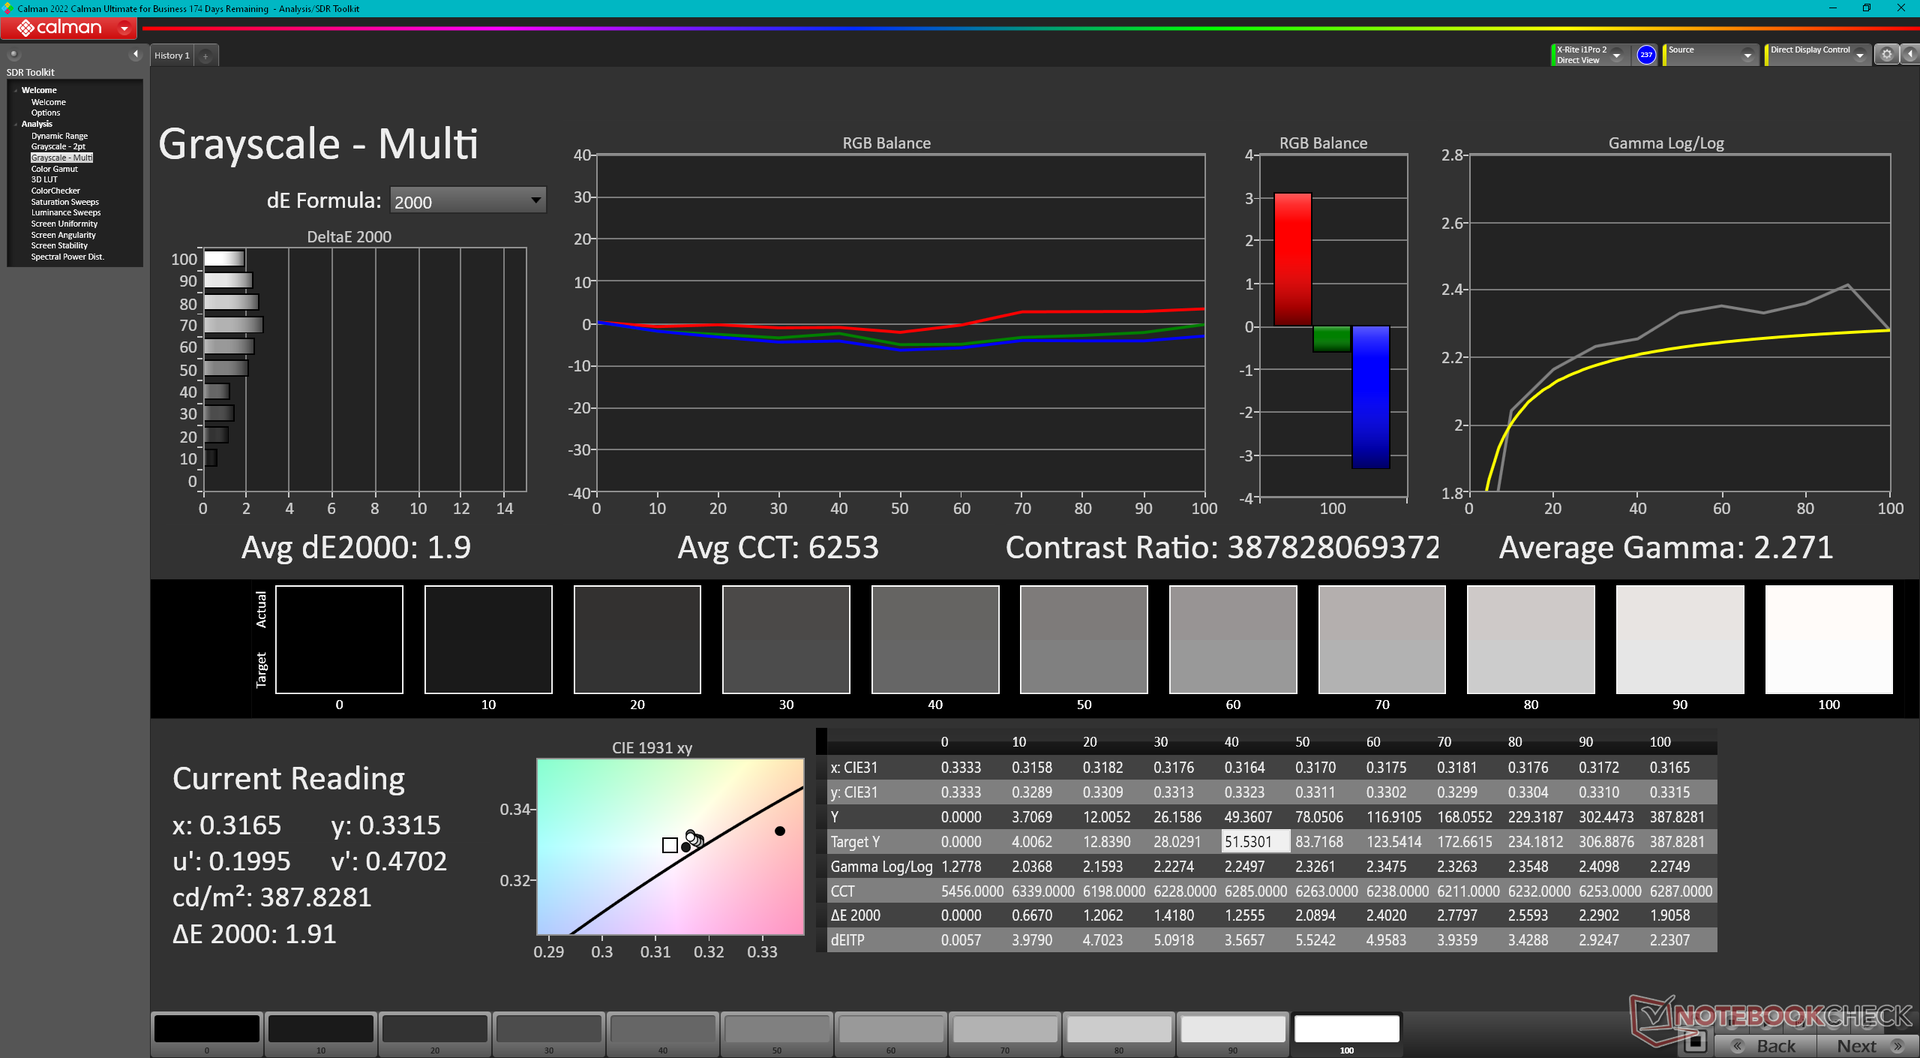
rozświetlenie: 98 %
na akumulatorze: 389.5 cd/m²
kontrast: ∞:1 (czerń: 0 cd/m²)
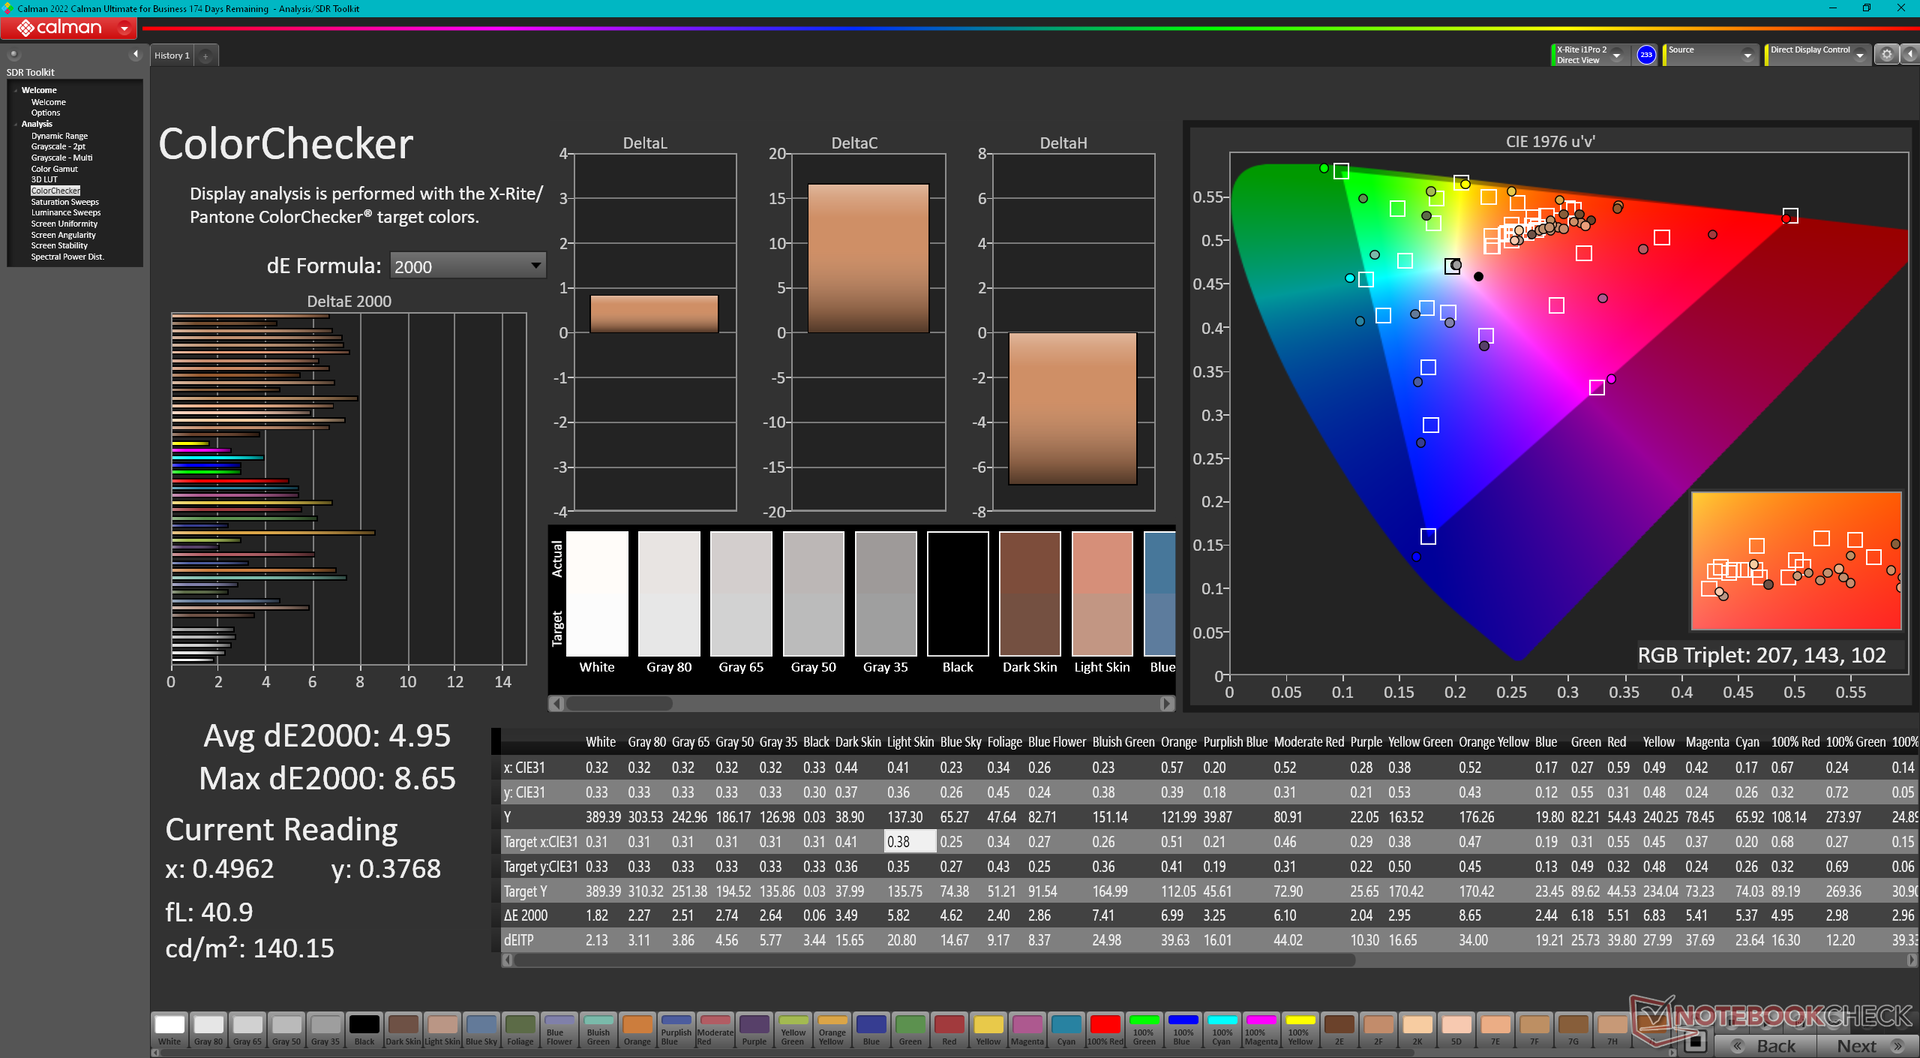
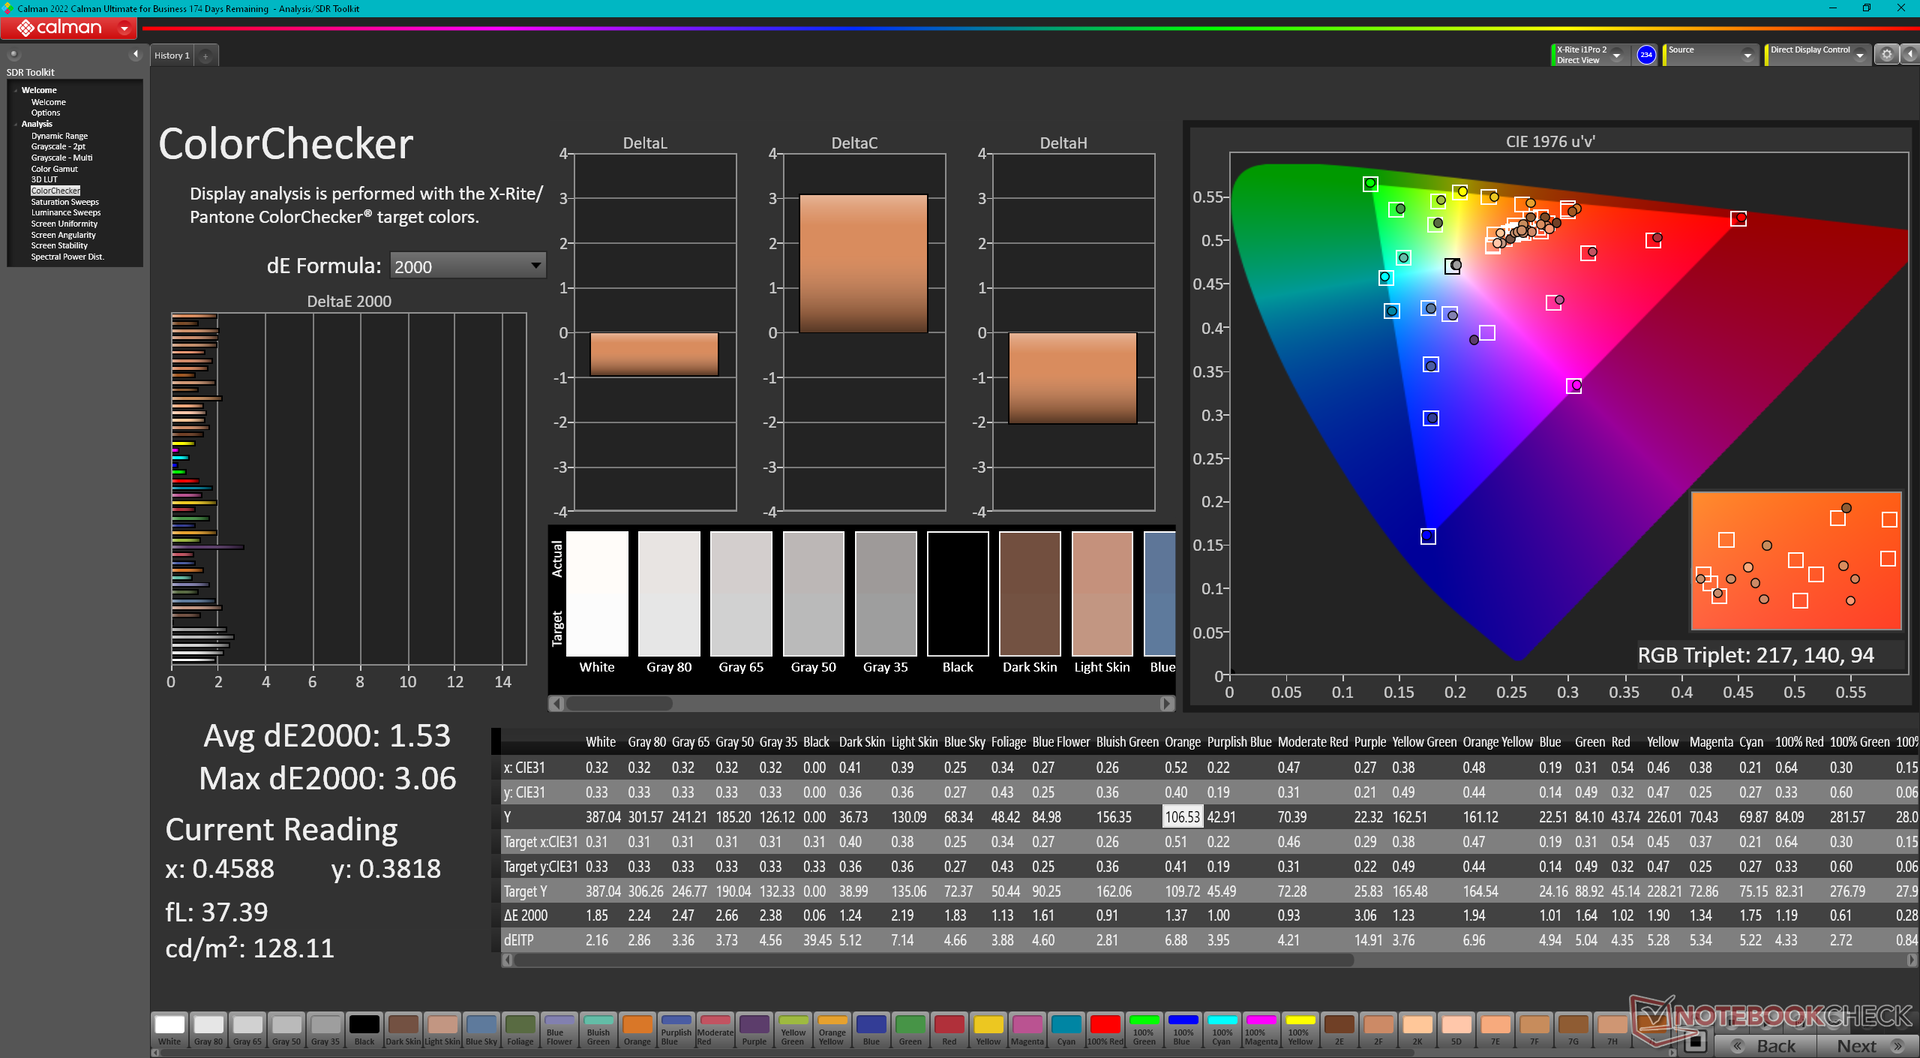
ΔE ColorChecker Calman: 4.95 | ∀{0.5-29.43 Ø4.72}
calibrated: 1.53
ΔE Greyscale Calman: 2 | ∀{0.09-98 Ø4.97}
98.4% AdobeRGB 1998 (Argyll 3D)
100% sRGB (Argyll 3D)
99.8% Display P3 (Argyll 3D)
Gamma: 2.27
CCT: 6265 K
| Dell XPS 15 9530 RTX 4070 Samsung 156XG01, OLED, 3456x2160, 15.6" | Dell XPS 15 9520 RTX 3050 Ti Samsung 156XG01, OLED, 3456x2160, 15.6" | Dell XPS 15 9500 Core i7 4K UHD Sharp LQ156R1, IPS, 3840x2400, 15.6" | Asus Zenbook Pro 15 OLED UM535Q Samsung ATNA56YX03-0, OLED, 1920x1080, 15.6" | MSI Prestige 15 A12UD-093 Sharp LQ156D1JW42, IPS, 3840x2160, 15.6" | Gigabyte Aero 15 OLED XD Samsung SDC4143, OLED, 3840x2160, 15.6" | |
|---|---|---|---|---|---|---|
| Display | -5% | -3% | -12% | -9% | 0% | |
| Display P3 Coverage (%) | 99.8 | 97.8 -2% | 89.7 -10% | 79.3 -21% | 80.48 -19% | 99.9 0% |
| sRGB Coverage (%) | 100 | 99.9 0% | 100 0% | 95.6 -4% | 96.95 -3% | 100 0% |
| AdobeRGB 1998 Coverage (%) | 98.4 | 86 -13% | 99.8 1% | 87.3 -11% | 94.02 -4% | 99.5 1% |
| Response Times | -6% | -2363% | -22% | -2088% | -35% | |
| Response Time Grey 50% / Grey 80% * (ms) | 1.68 ? | 1.9 ? -13% | 54 ? -3114% | 2.1 ? -25% | 51 ? -2936% | 2.8 ? -67% |
| Response Time Black / White * (ms) | 1.94 ? | 1.9 ? 2% | 33.2 ? -1611% | 2.3 ? -19% | 26 ? -1240% | 2 ? -3% |
| PWM Frequency (Hz) | 239 | 59.52 ? | 60.2 | 240 ? | ||
| Screen | -0% | -17% | 13% | 18% | 7% | |
| Brightness middle (cd/m²) | 389.5 | 381.4 -2% | 557.9 43% | 342.9 -12% | 441 13% | 440 13% |
| Brightness (cd/m²) | 392 | 384 -2% | 541 38% | 346 -12% | 416 6% | 446 14% |
| Brightness Distribution (%) | 98 | 95 -3% | 91 -7% | 98 0% | 85 -13% | 92 -6% |
| Black Level * (cd/m²) | 0.39 | 0.155 | 0.04 | |||
| Colorchecker dE 2000 * | 4.95 | 4.34 12% | 4.54 8% | 2.42 51% | 1.51 69% | 2.53 49% |
| Colorchecker dE 2000 max. * | 8.65 | 9.24 -7% | 7.92 8% | 4.05 53% | 3.56 59% | 7.82 10% |
| Colorchecker dE 2000 calibrated * | 1.53 | 3.82 -150% | 2.57 -68% | |||
| Greyscale dE 2000 * | 2 | 2 -0% | 3.2 -60% | 2.1 -5% | 2.49 -25% | 1.2 40% |
| Gamma | 2.27 97% | 2.13 103% | 1.99 111% | 2.21 100% | 2.17 101% | 2.206 100% |
| CCT | 6265 104% | 6210 105% | 6451 101% | 6364 102% | 6292 103% | 6371 102% |
| Contrast (:1) | 1431 | 2845 | 11000 | |||
| Color Space (Percent of AdobeRGB 1998) (%) | 89.5 | |||||
| Color Space (Percent of sRGB) (%) | 100 | |||||
| Całkowita średnia (program / ustawienia) | -4% /
-3% | -794% /
-405% | -7% /
-0% | -693% /
-372% | -9% /
-1% |
* ... im mniej tym lepiej
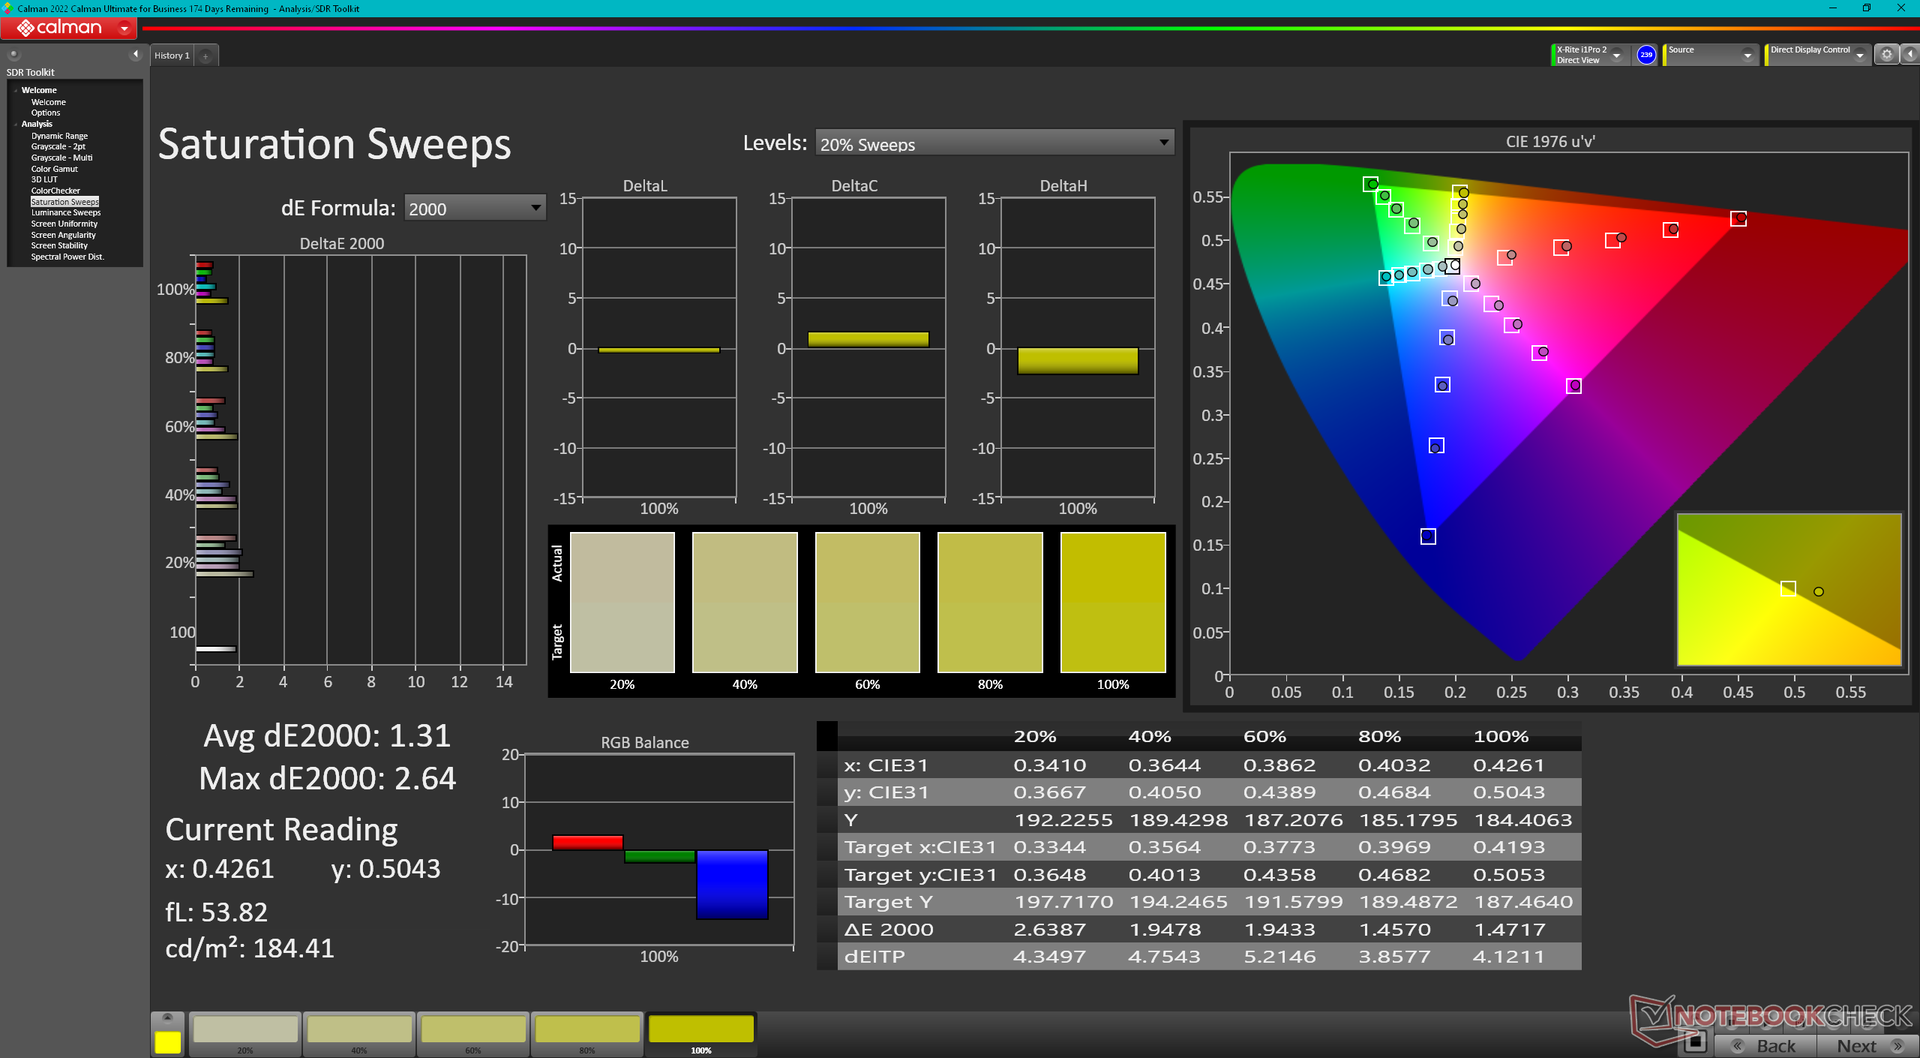
Panel jest przyzwoicie skalibrowany po wyjęciu z pudełka, ale użytkownicy mogą jeszcze zastosować nasz skalibrowany profil ICM powyżej, aby nieco poprawić dokładność kolorów. Dell wreszcie zintegrował różne profile kolorów, takie jak sRGB, AdobeRGB, DCI-P3 i inne w menu Windows Display, co ułatwia przełączanie profili.
Wyświetl czasy reakcji
| ↔ Czas reakcji od czerni do bieli | ||
|---|---|---|
| 1.94 ms ... wzrost ↗ i spadek ↘ łącznie | ↗ 0.97 ms wzrost | 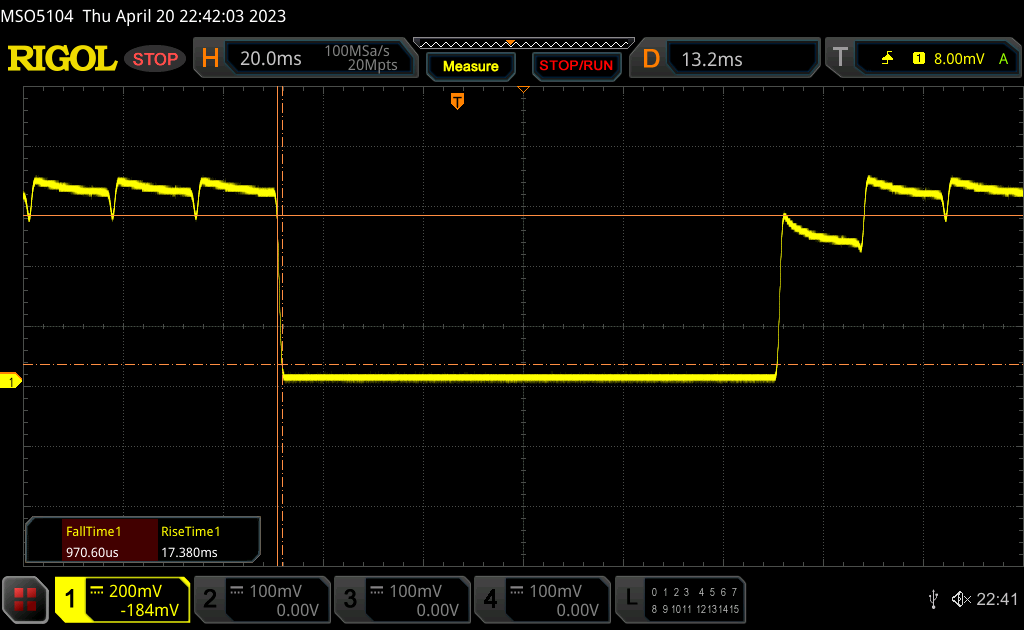 |
| ↘ 0.97 ms upadek | ||
| W naszych testach ekran wykazuje bardzo szybką reakcję i powinien bardzo dobrze nadawać się do szybkich gier. Dla porównania, wszystkie testowane urządzenia wahają się od 0.1 (minimum) do 240 (maksimum) ms. » 11 % wszystkich urządzeń jest lepszych. Oznacza to, że zmierzony czas reakcji jest lepszy od średniej wszystkich testowanych urządzeń (19.8 ms). | ||
| ↔ Czas reakcji 50% szarości do 80% szarości | ||
| 1.68 ms ... wzrost ↗ i spadek ↘ łącznie | ↗ 0.8 ms wzrost | 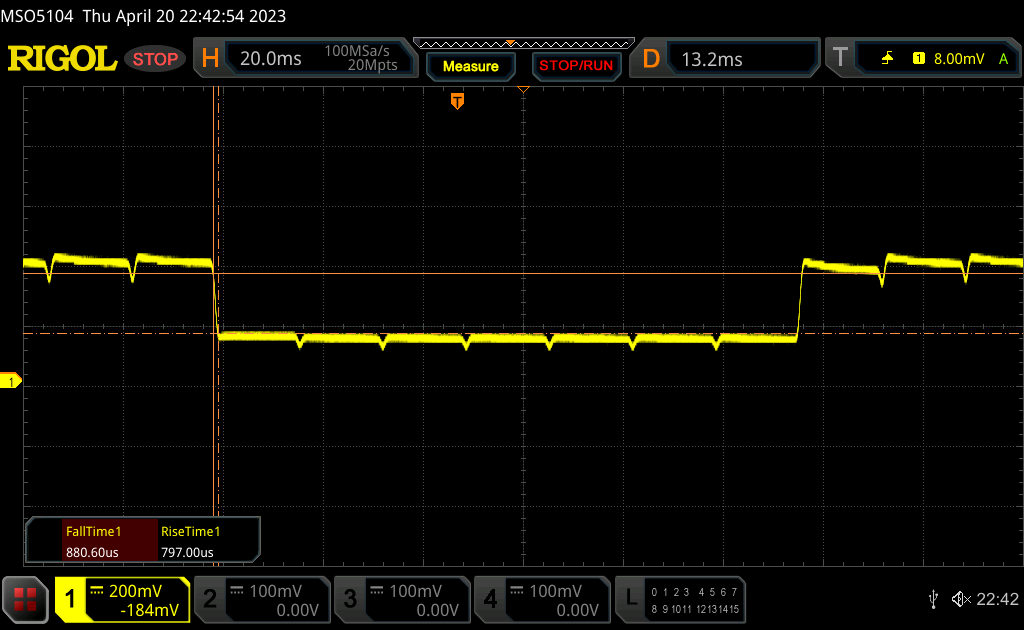 |
| ↘ 0.88 ms upadek | ||
| W naszych testach ekran wykazuje bardzo szybką reakcję i powinien bardzo dobrze nadawać się do szybkich gier. Dla porównania, wszystkie testowane urządzenia wahają się od 0.165 (minimum) do 636 (maksimum) ms. » 8 % wszystkich urządzeń jest lepszych. Oznacza to, że zmierzony czas reakcji jest lepszy od średniej wszystkich testowanych urządzeń (31 ms). | ||
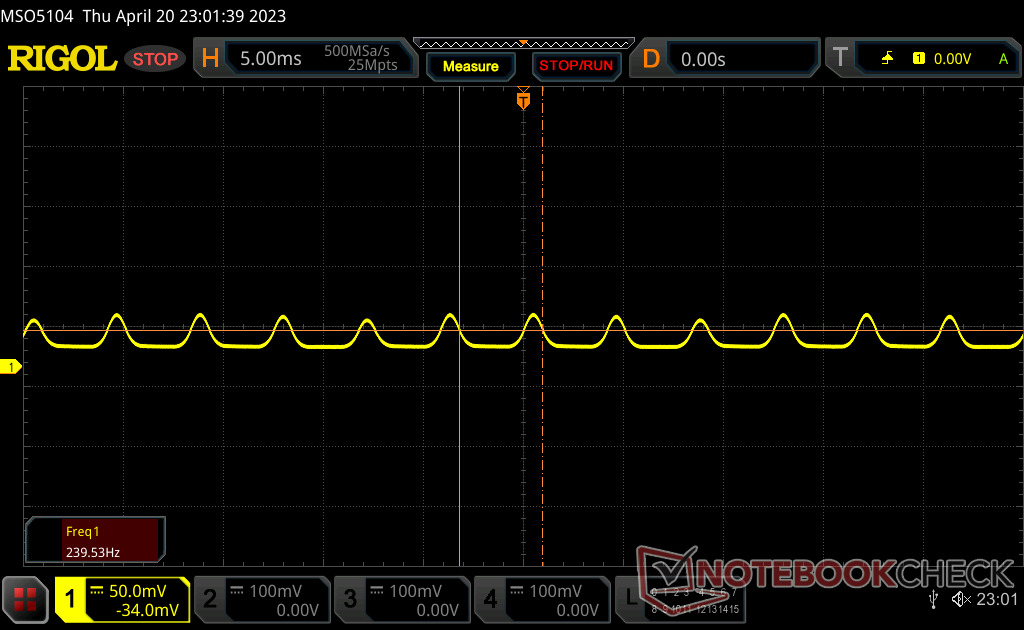
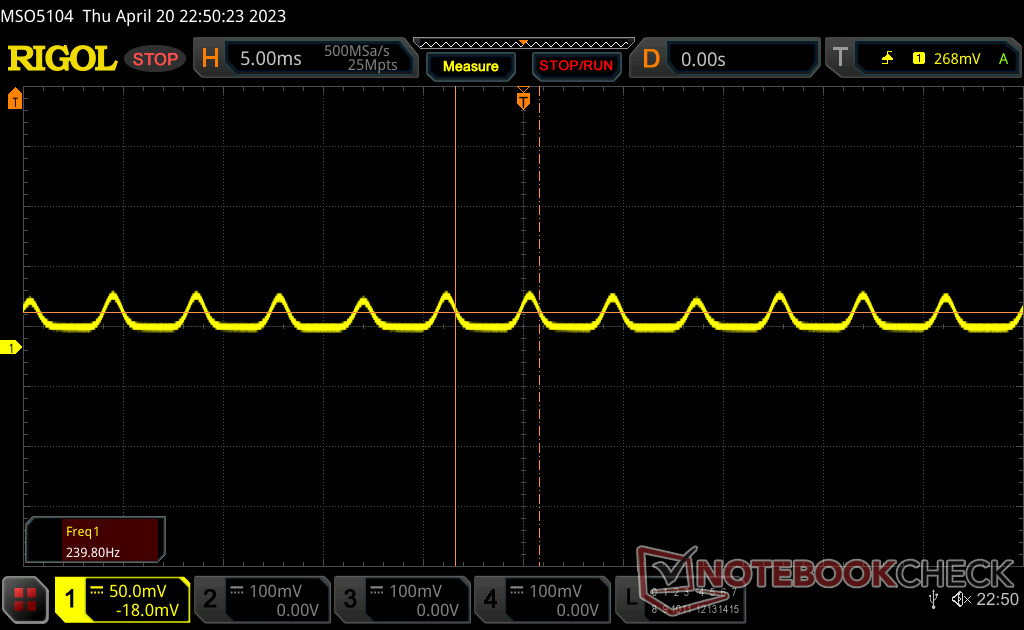
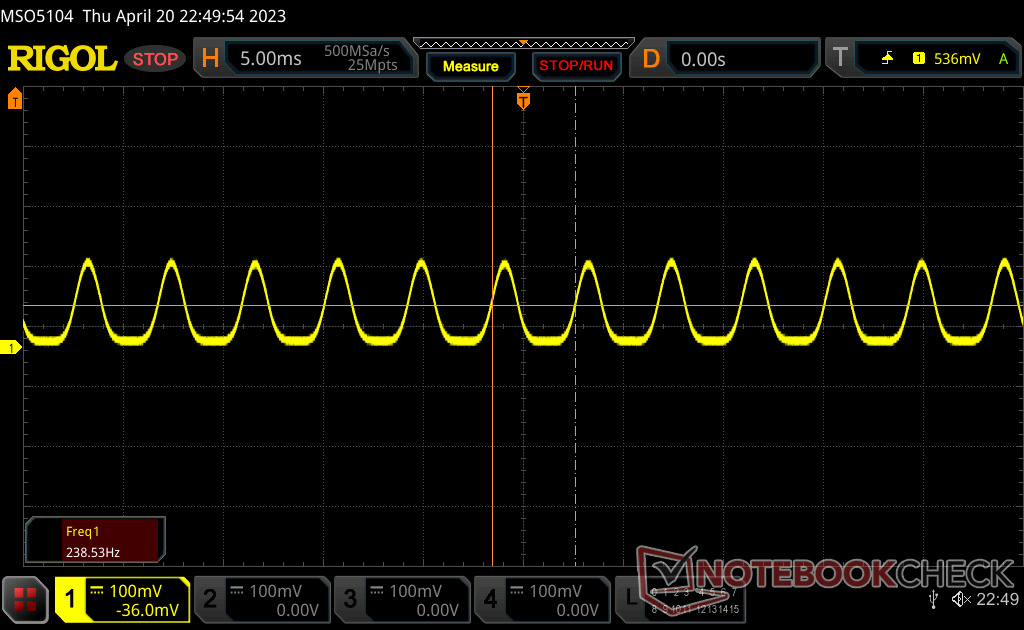
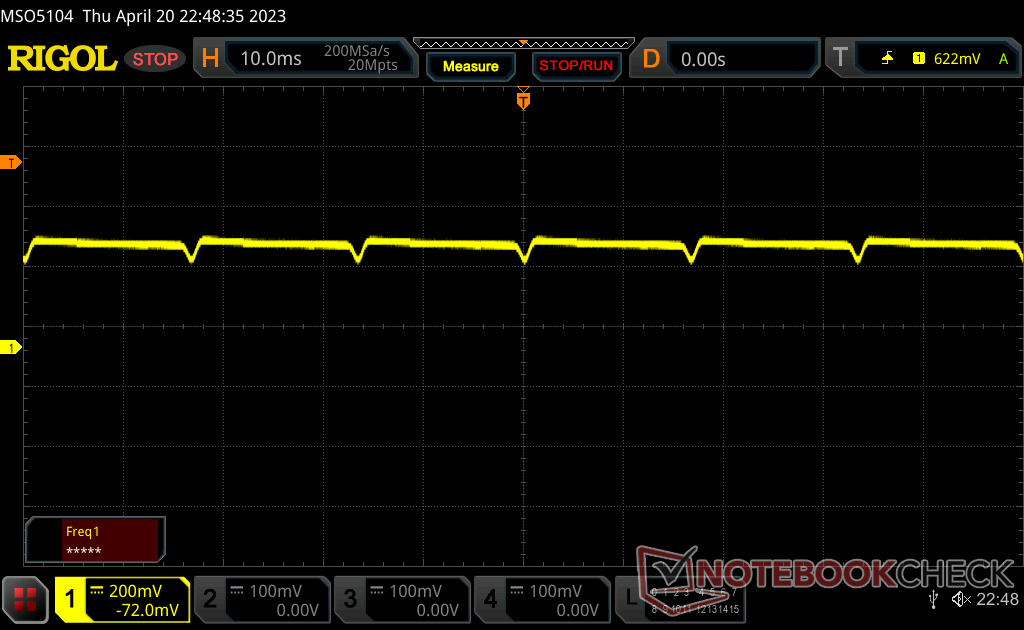
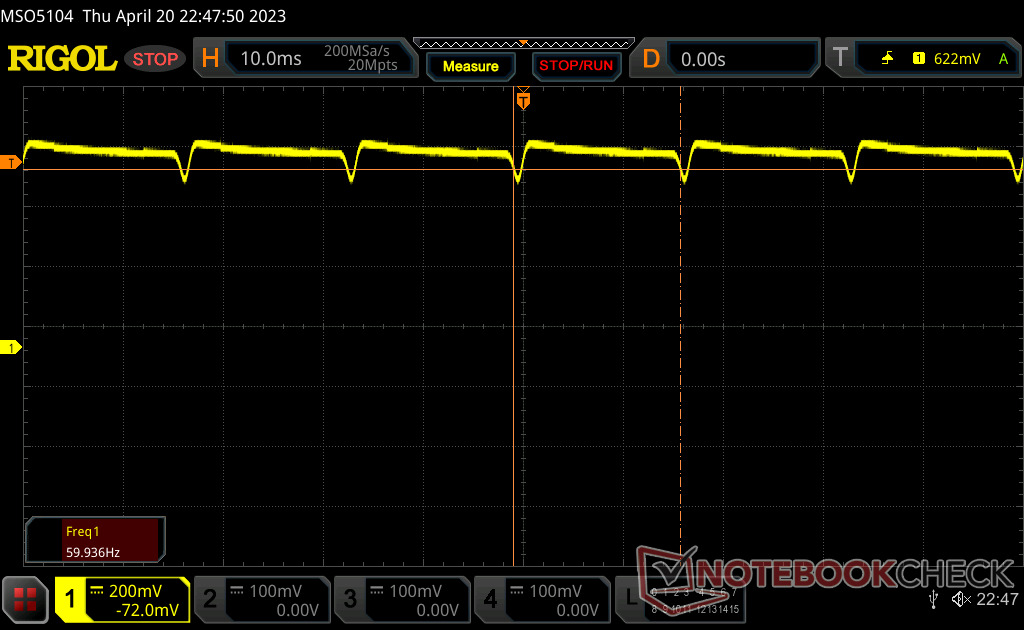
Migotanie ekranu / PWM (modulacja szerokości impulsu)
| Wykryto migotanie ekranu/wykryto PWM | 239 Hz | 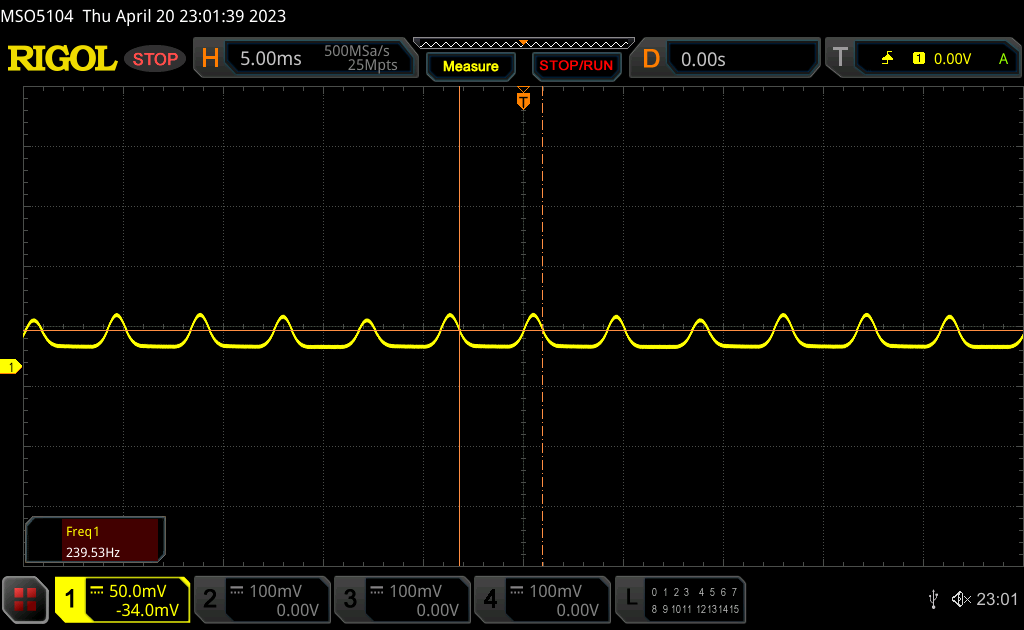 | |
Podświetlenie wyświetlacza miga z częstotliwością 239 Hz (najgorszy przypadek, np. przy użyciu PWM) . Częstotliwość 239 Hz jest stosunkowo niska, więc wrażliwi użytkownicy prawdopodobnie zauważą migotanie i odczują zmęczenie oczu przy podanym ustawieniu jasności i poniżej. Dla porównania: 52 % wszystkich testowanych urządzeń nie używa PWM do przyciemniania wyświetlacza. Jeśli wykryto PWM, zmierzono średnio 7747 (minimum: 5 - maksimum: 343500) Hz. | |||
Migotanie jest obecne na wszystkich poziomach jasności, podobnie jak w przypadku paneli OLED w innych laptopach. Jesteśmy w stanie zarejestrować częstotliwości 240 Hz od 0 do 52 procent jasności i 60 Hz od 53 do 100 procent jasności.

Wydajność - 13. gen. Intel + GeForce Grafika RTX 4070
Warunki badania
Przed uruchomieniem poniższych benchmarków ustawiliśmy naszą jednostkę w trybach Performance i dGPU. Zaawansowany Optimus czy MUX nie są obsługiwane.
Procesor
Wydajność procesora jest mieszana ze względu na ograniczony potencjał Turbo Boost. Na przykład nasz Core i7-13700H CineBench R15 xT uzyskał wynik o 19% wyższy niż i7-12700H w zeszłorocznym XPS-ie 15 9520. Po kilku pętlach benchmarku różnica w wydajności zmniejszyłaby się jednak i znacznie zbliżyła do zeszłorocznego procesora. Mniejszy MSI Stealth 14 Studio, w którym zastosowano ten sam procesor Core i7-13700H, co w naszym XPS-ie 15 9530, wykazywał podobne zachowania dławiące.
Aktualizacja do Core i9-13900H może zwiększyć wydajność o 15-25%. Korzyści mogą być jednak minimalne, gdyż procesory Core i9 mają tendencję do ostrzejszego dławienia się w cienkich laptopach multimedialnych, takich jak XPS 15.
Cinebench R15 Multi Loop
Cinebench R23: Multi Core | Single Core
Cinebench R20: CPU (Multi Core) | CPU (Single Core)
Cinebench R15: CPU Multi 64Bit | CPU Single 64Bit
Blender: v2.79 BMW27 CPU
7-Zip 18.03: 7z b 4 | 7z b 4 -mmt1
Geekbench 5.5: Multi-Core | Single-Core
HWBOT x265 Benchmark v2.2: 4k Preset
LibreOffice : 20 Documents To PDF
R Benchmark 2.5: Overall mean
| CPU Performance rating | |
| Asus Zephyrus Duo 16 GX650PY-NM006W | |
| Uniwill GM6PX7X RTX 4070 | |
| Asus ROG Zephyrus M16 GU604VY-NM042X | |
| Alienware x15 R2 P111F | |
| Dell XPS 15 9530 RTX 4070 | |
| Przeciętny Intel Core i7-13700H | |
| Dell XPS 15 9520 RTX 3050 Ti | |
| MSI Prestige 15 A12UD-093 -1! | |
| Asus ROG Strix G15 G513RW | |
| Asus Zenbook Pro 15 OLED UM535Q | |
| Gigabyte Aero 15 OLED XD | |
| Dell XPS 15 9500 Core i7 4K UHD -2! | |
| Cinebench R23 / Multi Core | |
| Asus Zephyrus Duo 16 GX650PY-NM006W | |
| Uniwill GM6PX7X RTX 4070 | |
| Asus ROG Zephyrus M16 GU604VY-NM042X | |
| Alienware x15 R2 P111F | |
| Dell XPS 15 9530 RTX 4070 | |
| Przeciętny Intel Core i7-13700H (5890 - 20034, n=29) | |
| Dell XPS 15 9520 RTX 3050 Ti | |
| Asus ROG Strix G15 G513RW | |
| Asus Zenbook Pro 15 OLED UM535Q | |
| MSI Prestige 15 A12UD-093 | |
| Gigabyte Aero 15 OLED XD | |
| Cinebench R23 / Single Core | |
| Asus ROG Zephyrus M16 GU604VY-NM042X | |
| Asus Zephyrus Duo 16 GX650PY-NM006W | |
| Alienware x15 R2 P111F | |
| Dell XPS 15 9530 RTX 4070 | |
| Uniwill GM6PX7X RTX 4070 | |
| Przeciętny Intel Core i7-13700H (1323 - 1914, n=29) | |
| Dell XPS 15 9520 RTX 3050 Ti | |
| MSI Prestige 15 A12UD-093 | |
| Asus ROG Strix G15 G513RW | |
| Asus Zenbook Pro 15 OLED UM535Q | |
| Gigabyte Aero 15 OLED XD | |
| Cinebench R20 / CPU (Multi Core) | |
| Asus Zephyrus Duo 16 GX650PY-NM006W | |
| Uniwill GM6PX7X RTX 4070 | |
| Asus ROG Zephyrus M16 GU604VY-NM042X | |
| Alienware x15 R2 P111F | |
| Dell XPS 15 9530 RTX 4070 | |
| Przeciętny Intel Core i7-13700H (2322 - 7674, n=29) | |
| Dell XPS 15 9520 RTX 3050 Ti | |
| Asus ROG Strix G15 G513RW | |
| Asus Zenbook Pro 15 OLED UM535Q | |
| MSI Prestige 15 A12UD-093 | |
| Gigabyte Aero 15 OLED XD | |
| Dell XPS 15 9500 Core i7 4K UHD | |
| Cinebench R20 / CPU (Single Core) | |
| Asus Zephyrus Duo 16 GX650PY-NM006W | |
| Asus ROG Zephyrus M16 GU604VY-NM042X | |
| Alienware x15 R2 P111F | |
| Uniwill GM6PX7X RTX 4070 | |
| Dell XPS 15 9530 RTX 4070 | |
| Przeciętny Intel Core i7-13700H (508 - 741, n=29) | |
| Dell XPS 15 9520 RTX 3050 Ti | |
| MSI Prestige 15 A12UD-093 | |
| Asus ROG Strix G15 G513RW | |
| Asus Zenbook Pro 15 OLED UM535Q | |
| Gigabyte Aero 15 OLED XD | |
| Dell XPS 15 9500 Core i7 4K UHD | |
| Cinebench R15 / CPU Multi 64Bit | |
| Asus Zephyrus Duo 16 GX650PY-NM006W | |
| Uniwill GM6PX7X RTX 4070 | |
| Asus ROG Zephyrus M16 GU604VY-NM042X | |
| Alienware x15 R2 P111F | |
| Dell XPS 15 9530 RTX 4070 | |
| Przeciętny Intel Core i7-13700H (905 - 2982, n=29) | |
| MSI Prestige 15 A12UD-093 | |
| Dell XPS 15 9520 RTX 3050 Ti | |
| Asus ROG Strix G15 G513RW | |
| Asus Zenbook Pro 15 OLED UM535Q | |
| Gigabyte Aero 15 OLED XD | |
| Dell XPS 15 9500 Core i7 4K UHD | |
| Cinebench R15 / CPU Single 64Bit | |
| Asus Zephyrus Duo 16 GX650PY-NM006W | |
| Asus ROG Zephyrus M16 GU604VY-NM042X | |
| Alienware x15 R2 P111F | |
| Dell XPS 15 9530 RTX 4070 | |
| Uniwill GM6PX7X RTX 4070 | |
| Przeciętny Intel Core i7-13700H (213 - 278, n=29) | |
| Dell XPS 15 9520 RTX 3050 Ti | |
| Asus ROG Strix G15 G513RW | |
| Asus Zenbook Pro 15 OLED UM535Q | |
| Dell XPS 15 9500 Core i7 4K UHD | |
| Gigabyte Aero 15 OLED XD | |
| MSI Prestige 15 A12UD-093 | |
| Blender / v2.79 BMW27 CPU | |
| Dell XPS 15 9500 Core i7 4K UHD | |
| Gigabyte Aero 15 OLED XD | |
| MSI Prestige 15 A12UD-093 | |
| Asus Zenbook Pro 15 OLED UM535Q | |
| Asus ROG Strix G15 G513RW | |
| Przeciętny Intel Core i7-13700H (169 - 555, n=29) | |
| Dell XPS 15 9520 RTX 3050 Ti | |
| Dell XPS 15 9530 RTX 4070 | |
| Alienware x15 R2 P111F | |
| Asus ROG Zephyrus M16 GU604VY-NM042X | |
| Uniwill GM6PX7X RTX 4070 | |
| Asus Zephyrus Duo 16 GX650PY-NM006W | |
| 7-Zip 18.03 / 7z b 4 | |
| Asus Zephyrus Duo 16 GX650PY-NM006W | |
| Uniwill GM6PX7X RTX 4070 | |
| Asus ROG Zephyrus M16 GU604VY-NM042X | |
| Alienware x15 R2 P111F | |
| Dell XPS 15 9520 RTX 3050 Ti | |
| Przeciętny Intel Core i7-13700H (27322 - 76344, n=29) | |
| Dell XPS 15 9530 RTX 4070 | |
| Asus ROG Strix G15 G513RW | |
| Asus Zenbook Pro 15 OLED UM535Q | |
| MSI Prestige 15 A12UD-093 | |
| Gigabyte Aero 15 OLED XD | |
| Dell XPS 15 9500 Core i7 4K UHD | |
| 7-Zip 18.03 / 7z b 4 -mmt1 | |
| Asus Zephyrus Duo 16 GX650PY-NM006W | |
| Asus ROG Zephyrus M16 GU604VY-NM042X | |
| Dell XPS 15 9530 RTX 4070 | |
| Uniwill GM6PX7X RTX 4070 | |
| Przeciętny Intel Core i7-13700H (4825 - 6238, n=29) | |
| Alienware x15 R2 P111F | |
| Asus ROG Strix G15 G513RW | |
| Dell XPS 15 9520 RTX 3050 Ti | |
| Asus Zenbook Pro 15 OLED UM535Q | |
| MSI Prestige 15 A12UD-093 | |
| Gigabyte Aero 15 OLED XD | |
| Dell XPS 15 9500 Core i7 4K UHD | |
| Geekbench 5.5 / Multi-Core | |
| Asus Zephyrus Duo 16 GX650PY-NM006W | |
| Uniwill GM6PX7X RTX 4070 | |
| Asus ROG Zephyrus M16 GU604VY-NM042X | |
| Alienware x15 R2 P111F | |
| Dell XPS 15 9530 RTX 4070 | |
| Dell XPS 15 9520 RTX 3050 Ti | |
| MSI Prestige 15 A12UD-093 | |
| Przeciętny Intel Core i7-13700H (6165 - 14215, n=29) | |
| Asus ROG Strix G15 G513RW | |
| Gigabyte Aero 15 OLED XD | |
| Asus Zenbook Pro 15 OLED UM535Q | |
| Dell XPS 15 9500 Core i7 4K UHD | |
| Geekbench 5.5 / Single-Core | |
| Asus Zephyrus Duo 16 GX650PY-NM006W | |
| Asus ROG Zephyrus M16 GU604VY-NM042X | |
| Dell XPS 15 9530 RTX 4070 | |
| Alienware x15 R2 P111F | |
| Uniwill GM6PX7X RTX 4070 | |
| Przeciętny Intel Core i7-13700H (1362 - 1919, n=29) | |
| Dell XPS 15 9520 RTX 3050 Ti | |
| Asus ROG Strix G15 G513RW | |
| MSI Prestige 15 A12UD-093 | |
| Asus Zenbook Pro 15 OLED UM535Q | |
| Gigabyte Aero 15 OLED XD | |
| Dell XPS 15 9500 Core i7 4K UHD | |
| HWBOT x265 Benchmark v2.2 / 4k Preset | |
| Asus Zephyrus Duo 16 GX650PY-NM006W | |
| Uniwill GM6PX7X RTX 4070 | |
| Asus ROG Zephyrus M16 GU604VY-NM042X | |
| Alienware x15 R2 P111F | |
| Dell XPS 15 9530 RTX 4070 | |
| Przeciętny Intel Core i7-13700H (6.72 - 21.2, n=29) | |
| Asus ROG Strix G15 G513RW | |
| Asus Zenbook Pro 15 OLED UM535Q | |
| Dell XPS 15 9520 RTX 3050 Ti | |
| Gigabyte Aero 15 OLED XD | |
| Dell XPS 15 9500 Core i7 4K UHD | |
| LibreOffice / 20 Documents To PDF | |
| Asus ROG Strix G15 G513RW | |
| MSI Prestige 15 A12UD-093 | |
| MSI Prestige 15 A12UD-093 | |
| Asus Zephyrus Duo 16 GX650PY-NM006W | |
| Dell XPS 15 9500 Core i7 4K UHD | |
| Asus ROG Zephyrus M16 GU604VY-NM042X | |
| Asus Zenbook Pro 15 OLED UM535Q | |
| Przeciętny Intel Core i7-13700H (31.3 - 62.4, n=29) | |
| Gigabyte Aero 15 OLED XD | |
| Alienware x15 R2 P111F | |
| Dell XPS 15 9530 RTX 4070 | |
| Dell XPS 15 9520 RTX 3050 Ti | |
| Uniwill GM6PX7X RTX 4070 | |
| R Benchmark 2.5 / Overall mean | |
| Gigabyte Aero 15 OLED XD | |
| Dell XPS 15 9500 Core i7 4K UHD | |
| Asus Zenbook Pro 15 OLED UM535Q | |
| Asus ROG Strix G15 G513RW | |
| Przeciętny Intel Core i7-13700H (0.4308 - 0.607, n=29) | |
| Uniwill GM6PX7X RTX 4070 | |
| Dell XPS 15 9520 RTX 3050 Ti | |
| MSI Prestige 15 A12UD-093 | |
| Dell XPS 15 9530 RTX 4070 | |
| Alienware x15 R2 P111F | |
| Asus ROG Zephyrus M16 GU604VY-NM042X | |
| Asus Zephyrus Duo 16 GX650PY-NM006W | |
* ... im mniej tym lepiej
AIDA64: FP32 Ray-Trace | FPU Julia | CPU SHA3 | CPU Queen | FPU SinJulia | FPU Mandel | CPU AES | CPU ZLib | FP64 Ray-Trace | CPU PhotoWorxx
| Performance rating | |
| Asus Zenbook Pro 15 OLED UM535Q | |
| Dell XPS 15 9530 RTX 4070 | |
| Przeciętny Intel Core i7-13700H | |
| MSI Prestige 15 A12UD-093 | |
| Dell XPS 15 9520 RTX 3050 Ti | |
| Dell XPS 15 9500 Core i7 4K UHD | |
| Gigabyte Aero 15 OLED XD -9! | |
| AIDA64 / FP32 Ray-Trace | |
| Asus Zenbook Pro 15 OLED UM535Q | |
| Dell XPS 15 9530 RTX 4070 | |
| Przeciętny Intel Core i7-13700H (4986 - 18908, n=29) | |
| MSI Prestige 15 A12UD-093 | |
| Dell XPS 15 9500 Core i7 4K UHD | |
| Dell XPS 15 9520 RTX 3050 Ti | |
| AIDA64 / FPU Julia | |
| Asus Zenbook Pro 15 OLED UM535Q | |
| Przeciętny Intel Core i7-13700H (25360 - 92359, n=29) | |
| Dell XPS 15 9530 RTX 4070 | |
| Dell XPS 15 9500 Core i7 4K UHD | |
| MSI Prestige 15 A12UD-093 | |
| Dell XPS 15 9520 RTX 3050 Ti | |
| AIDA64 / CPU SHA3 | |
| Asus Zenbook Pro 15 OLED UM535Q | |
| Przeciętny Intel Core i7-13700H (1339 - 4224, n=29) | |
| Dell XPS 15 9530 RTX 4070 | |
| Dell XPS 15 9500 Core i7 4K UHD | |
| Dell XPS 15 9520 RTX 3050 Ti | |
| MSI Prestige 15 A12UD-093 | |
| AIDA64 / CPU Queen | |
| Dell XPS 15 9530 RTX 4070 | |
| Asus Zenbook Pro 15 OLED UM535Q | |
| Dell XPS 15 9520 RTX 3050 Ti | |
| Przeciętny Intel Core i7-13700H (59324 - 107159, n=29) | |
| Dell XPS 15 9500 Core i7 4K UHD | |
| MSI Prestige 15 A12UD-093 | |
| AIDA64 / FPU SinJulia | |
| Asus Zenbook Pro 15 OLED UM535Q | |
| Dell XPS 15 9500 Core i7 4K UHD | |
| Przeciętny Intel Core i7-13700H (4800 - 11050, n=29) | |
| Dell XPS 15 9530 RTX 4070 | |
| Dell XPS 15 9520 RTX 3050 Ti | |
| MSI Prestige 15 A12UD-093 | |
| AIDA64 / FPU Mandel | |
| Asus Zenbook Pro 15 OLED UM535Q | |
| Przeciętny Intel Core i7-13700H (12321 - 45118, n=29) | |
| Dell XPS 15 9530 RTX 4070 | |
| Dell XPS 15 9500 Core i7 4K UHD | |
| MSI Prestige 15 A12UD-093 | |
| Dell XPS 15 9520 RTX 3050 Ti | |
| AIDA64 / CPU AES | |
| Asus Zenbook Pro 15 OLED UM535Q | |
| MSI Prestige 15 A12UD-093 | |
| Dell XPS 15 9520 RTX 3050 Ti | |
| Przeciętny Intel Core i7-13700H (28769 - 151254, n=29) | |
| Dell XPS 15 9530 RTX 4070 | |
| Dell XPS 15 9500 Core i7 4K UHD | |
| AIDA64 / CPU ZLib | |
| Przeciętny Intel Core i7-13700H (389 - 1215, n=29) | |
| Dell XPS 15 9530 RTX 4070 | |
| Dell XPS 15 9520 RTX 3050 Ti | |
| Asus Zenbook Pro 15 OLED UM535Q | |
| MSI Prestige 15 A12UD-093 | |
| Dell XPS 15 9500 Core i7 4K UHD | |
| Gigabyte Aero 15 OLED XD | |
| AIDA64 / FP64 Ray-Trace | |
| Asus Zenbook Pro 15 OLED UM535Q | |
| Dell XPS 15 9530 RTX 4070 | |
| Przeciętny Intel Core i7-13700H (2540 - 10135, n=29) | |
| MSI Prestige 15 A12UD-093 | |
| Dell XPS 15 9520 RTX 3050 Ti | |
| Dell XPS 15 9500 Core i7 4K UHD | |
| AIDA64 / CPU PhotoWorxx | |
| Dell XPS 15 9530 RTX 4070 | |
| MSI Prestige 15 A12UD-093 | |
| Przeciętny Intel Core i7-13700H (12872 - 52727, n=29) | |
| Dell XPS 15 9520 RTX 3050 Ti | |
| Dell XPS 15 9500 Core i7 4K UHD | |
| Asus Zenbook Pro 15 OLED UM535Q | |
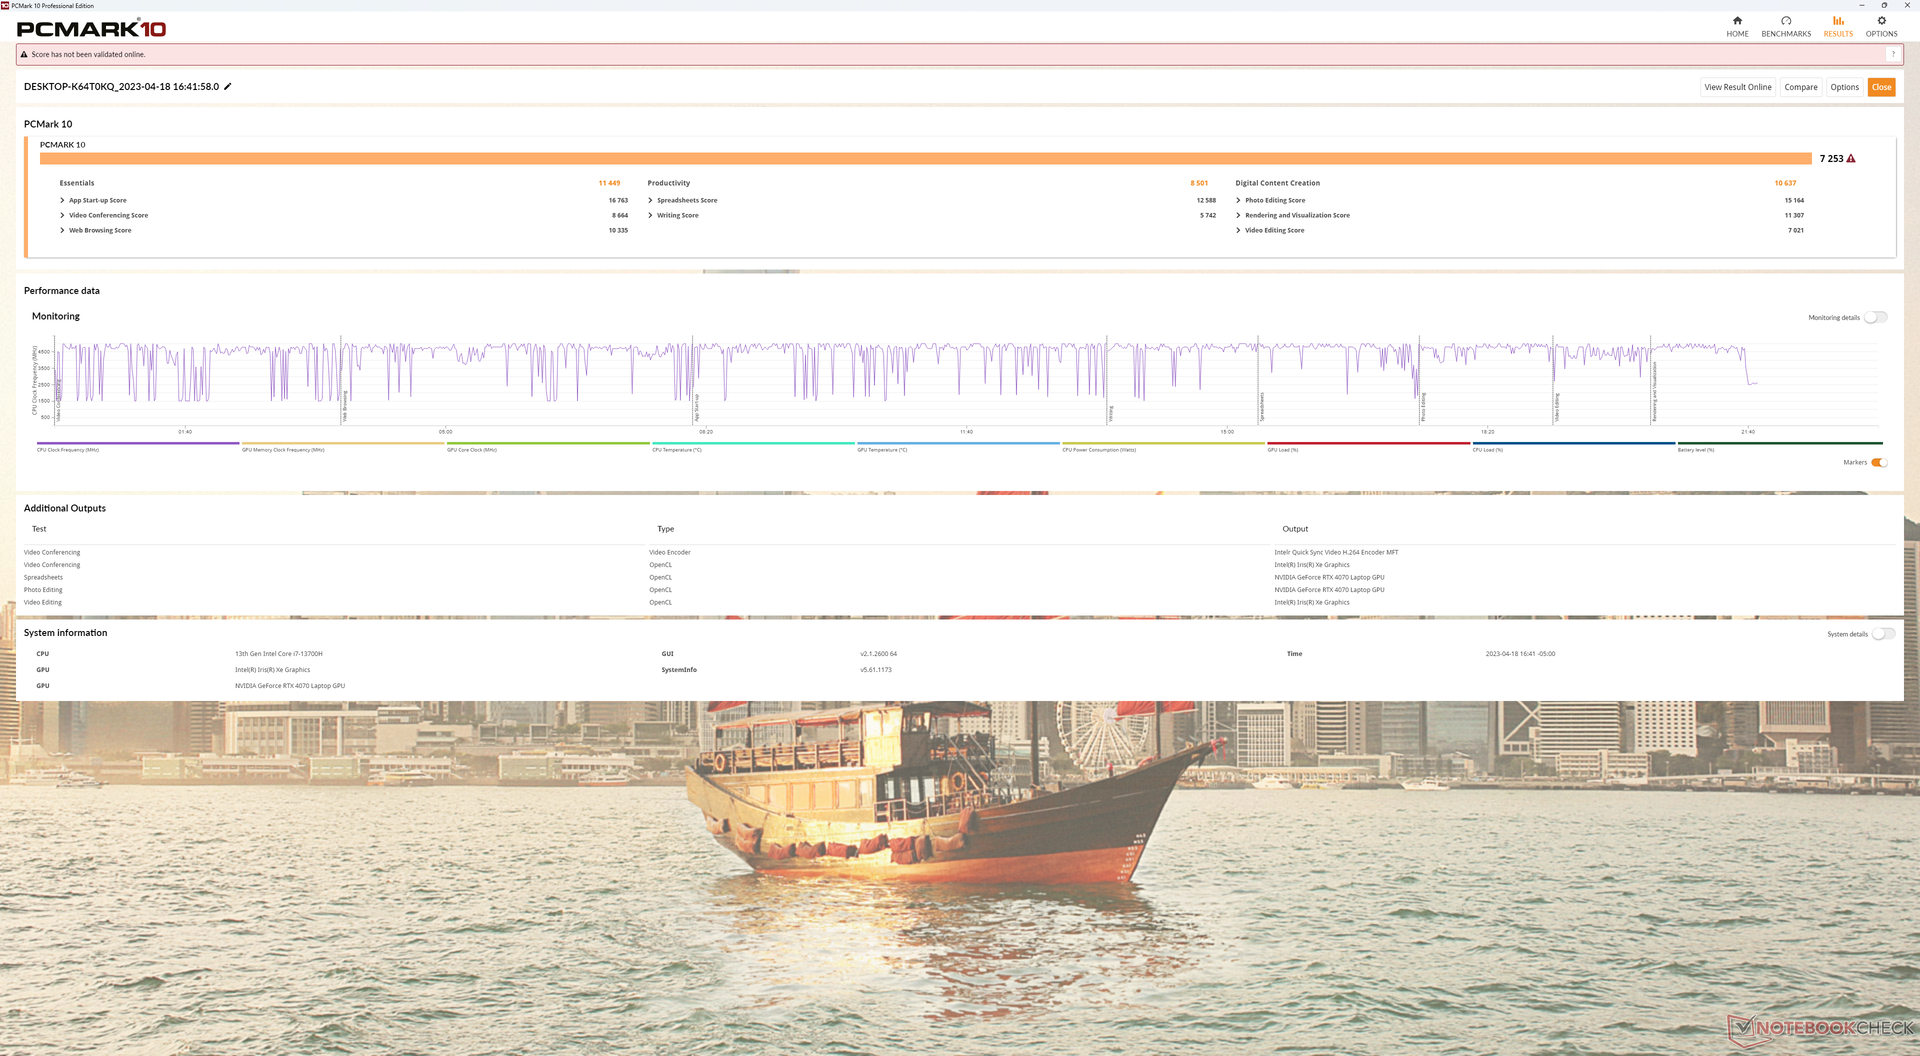
Wydajność systemu
CrossMark: Overall | Productivity | Creativity | Responsiveness
| PCMark 10 / Score | |
| Przeciętny Intel Core i7-13700H, NVIDIA GeForce RTX 4070 Laptop GPU (7158 - 7956, n=8) | |
| Dell XPS 15 9530 RTX 4070 | |
| Dell XPS 15 9520 RTX 3050 Ti | |
| Gigabyte Aero 15 OLED XD | |
| Asus Zenbook Pro 15 OLED UM535Q | |
| MSI Prestige 15 A12UD-093 | |
| Dell XPS 15 9500 Core i7 4K UHD | |
| PCMark 10 / Essentials | |
| Dell XPS 15 9530 RTX 4070 | |
| Dell XPS 15 9520 RTX 3050 Ti | |
| Przeciętny Intel Core i7-13700H, NVIDIA GeForce RTX 4070 Laptop GPU (10252 - 11449, n=8) | |
| Asus Zenbook Pro 15 OLED UM535Q | |
| MSI Prestige 15 A12UD-093 | |
| Gigabyte Aero 15 OLED XD | |
| Dell XPS 15 9500 Core i7 4K UHD | |
| PCMark 10 / Productivity | |
| Gigabyte Aero 15 OLED XD | |
| Asus Zenbook Pro 15 OLED UM535Q | |
| Dell XPS 15 9520 RTX 3050 Ti | |
| Przeciętny Intel Core i7-13700H, NVIDIA GeForce RTX 4070 Laptop GPU (8501 - 10769, n=8) | |
| MSI Prestige 15 A12UD-093 | |
| Dell XPS 15 9530 RTX 4070 | |
| Dell XPS 15 9500 Core i7 4K UHD | |
| PCMark 10 / Digital Content Creation | |
| Przeciętny Intel Core i7-13700H, NVIDIA GeForce RTX 4070 Laptop GPU (10358 - 12908, n=8) | |
| Dell XPS 15 9530 RTX 4070 | |
| Gigabyte Aero 15 OLED XD | |
| Dell XPS 15 9520 RTX 3050 Ti | |
| Asus Zenbook Pro 15 OLED UM535Q | |
| MSI Prestige 15 A12UD-093 | |
| Dell XPS 15 9500 Core i7 4K UHD | |
| CrossMark / Overall | |
| Dell XPS 15 9530 RTX 4070 | |
| Przeciętny Intel Core i7-13700H, NVIDIA GeForce RTX 4070 Laptop GPU (1768 - 2073, n=6) | |
| Dell XPS 15 9520 RTX 3050 Ti | |
| MSI Prestige 15 A12UD-093 | |
| Asus Zenbook Pro 15 OLED UM535Q | |
| CrossMark / Productivity | |
| Dell XPS 15 9520 RTX 3050 Ti | |
| Przeciętny Intel Core i7-13700H, NVIDIA GeForce RTX 4070 Laptop GPU (1645 - 2006, n=6) | |
| Dell XPS 15 9530 RTX 4070 | |
| MSI Prestige 15 A12UD-093 | |
| Asus Zenbook Pro 15 OLED UM535Q | |
| CrossMark / Creativity | |
| Dell XPS 15 9530 RTX 4070 | |
| Przeciętny Intel Core i7-13700H, NVIDIA GeForce RTX 4070 Laptop GPU (1936 - 2137, n=6) | |
| Dell XPS 15 9520 RTX 3050 Ti | |
| MSI Prestige 15 A12UD-093 | |
| Asus Zenbook Pro 15 OLED UM535Q | |
| CrossMark / Responsiveness | |
| Dell XPS 15 9520 RTX 3050 Ti | |
| Przeciętny Intel Core i7-13700H, NVIDIA GeForce RTX 4070 Laptop GPU (1451 - 2202, n=6) | |
| Dell XPS 15 9530 RTX 4070 | |
| MSI Prestige 15 A12UD-093 | |
| Asus Zenbook Pro 15 OLED UM535Q | |
| PCMark 10 Score | 7253 pkt. | |
Pomoc | ||
| AIDA64 / Memory Copy | |
| Dell XPS 15 9530 RTX 4070 | |
| MSI Prestige 15 A12UD-093 | |
| Przeciętny Intel Core i7-13700H (24334 - 78081, n=29) | |
| Dell XPS 15 9520 RTX 3050 Ti | |
| Asus Zenbook Pro 15 OLED UM535Q | |
| Dell XPS 15 9500 Core i7 4K UHD | |
| AIDA64 / Memory Read | |
| Dell XPS 15 9530 RTX 4070 | |
| Przeciętny Intel Core i7-13700H (23681 - 79656, n=29) | |
| MSI Prestige 15 A12UD-093 | |
| Dell XPS 15 9520 RTX 3050 Ti | |
| Asus Zenbook Pro 15 OLED UM535Q | |
| Dell XPS 15 9500 Core i7 4K UHD | |
| AIDA64 / Memory Write | |
| Przeciętny Intel Core i7-13700H (22986 - 99898, n=29) | |
| Dell XPS 15 9530 RTX 4070 | |
| MSI Prestige 15 A12UD-093 | |
| Dell XPS 15 9520 RTX 3050 Ti | |
| Asus Zenbook Pro 15 OLED UM535Q | |
| Dell XPS 15 9500 Core i7 4K UHD | |
| AIDA64 / Memory Latency | |
| Dell XPS 15 9520 RTX 3050 Ti | |
| MSI Prestige 15 A12UD-093 | |
| Asus Zenbook Pro 15 OLED UM535Q | |
| Przeciętny Intel Core i7-13700H (82.4 - 136.8, n=29) | |
| Dell XPS 15 9530 RTX 4070 | |
| Dell XPS 15 9500 Core i7 4K UHD | |
| Gigabyte Aero 15 OLED XD | |
* ... im mniej tym lepiej
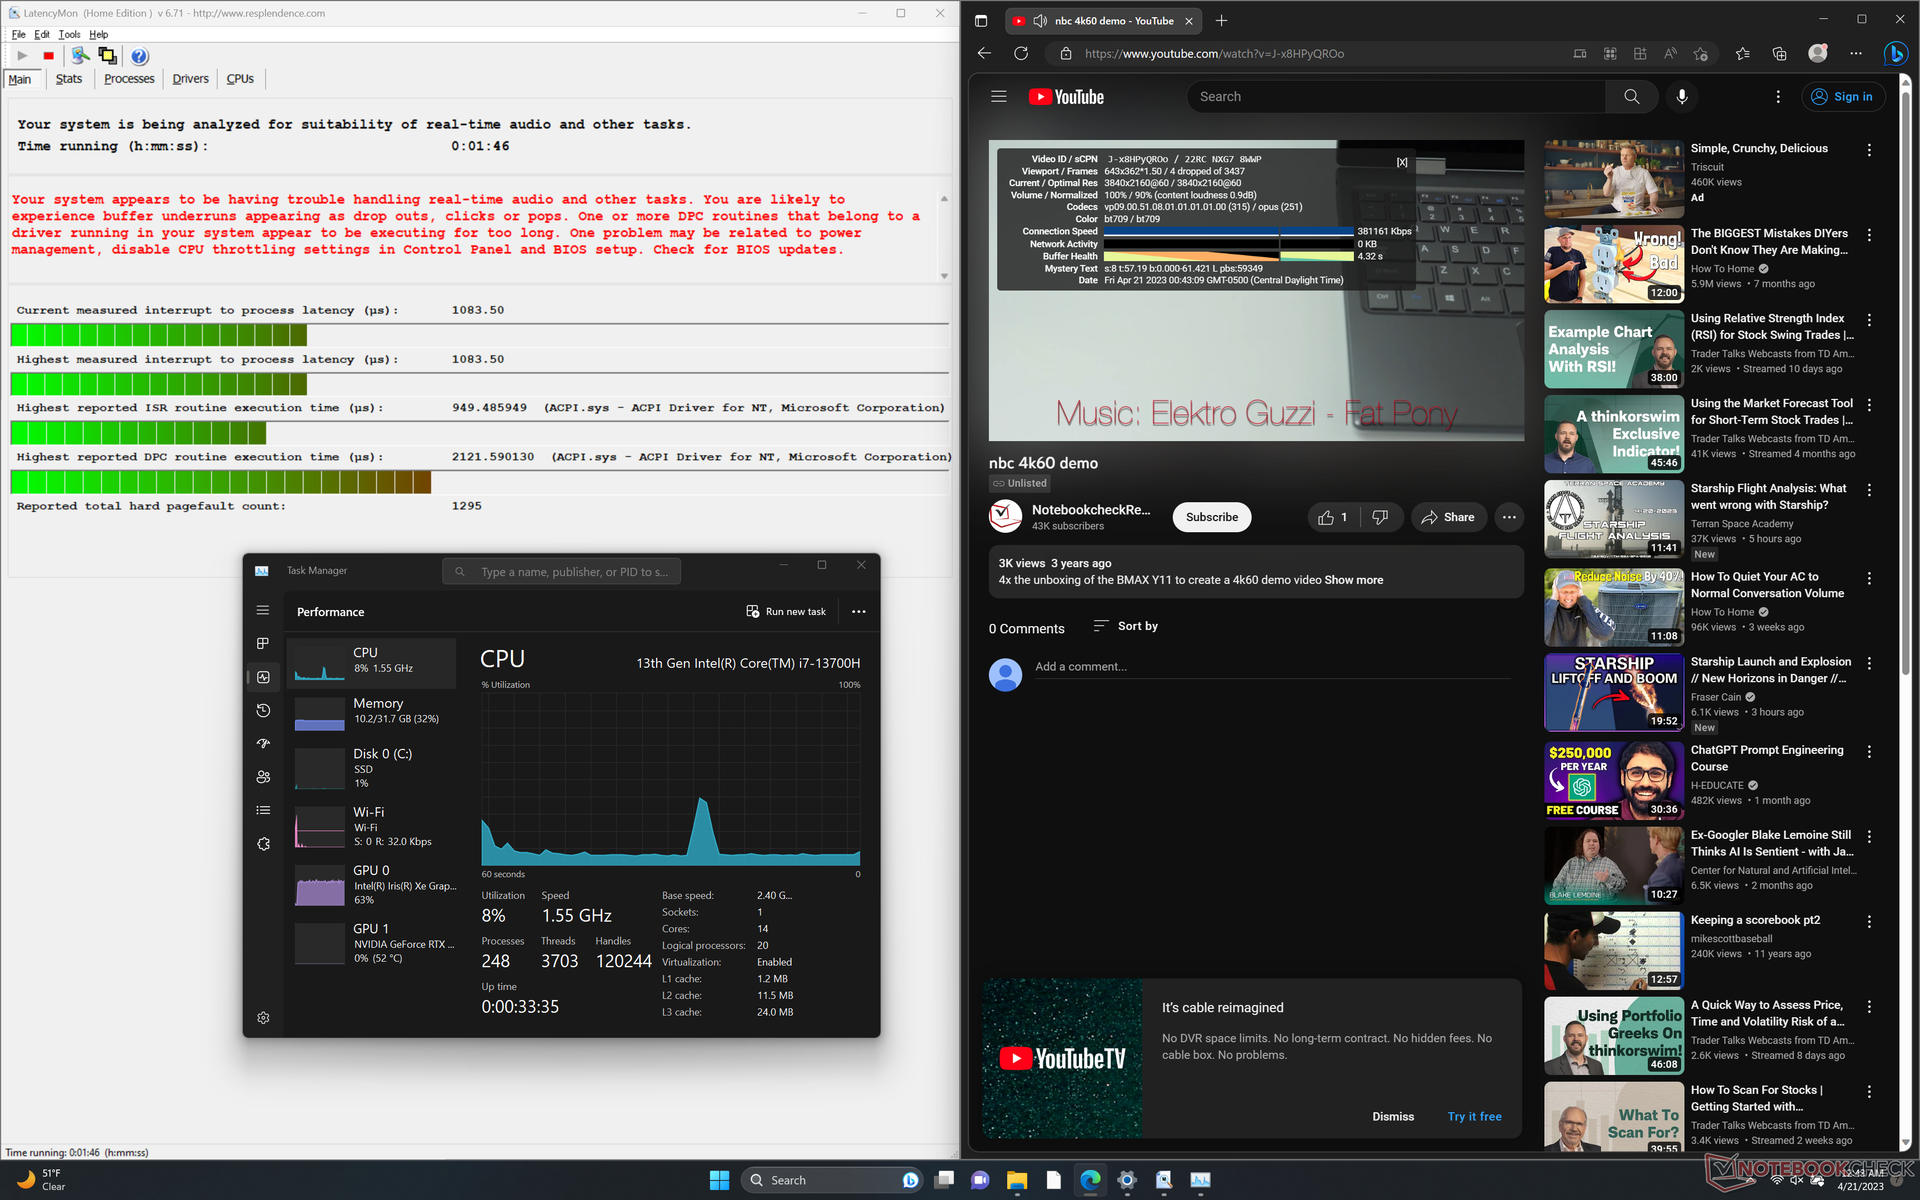
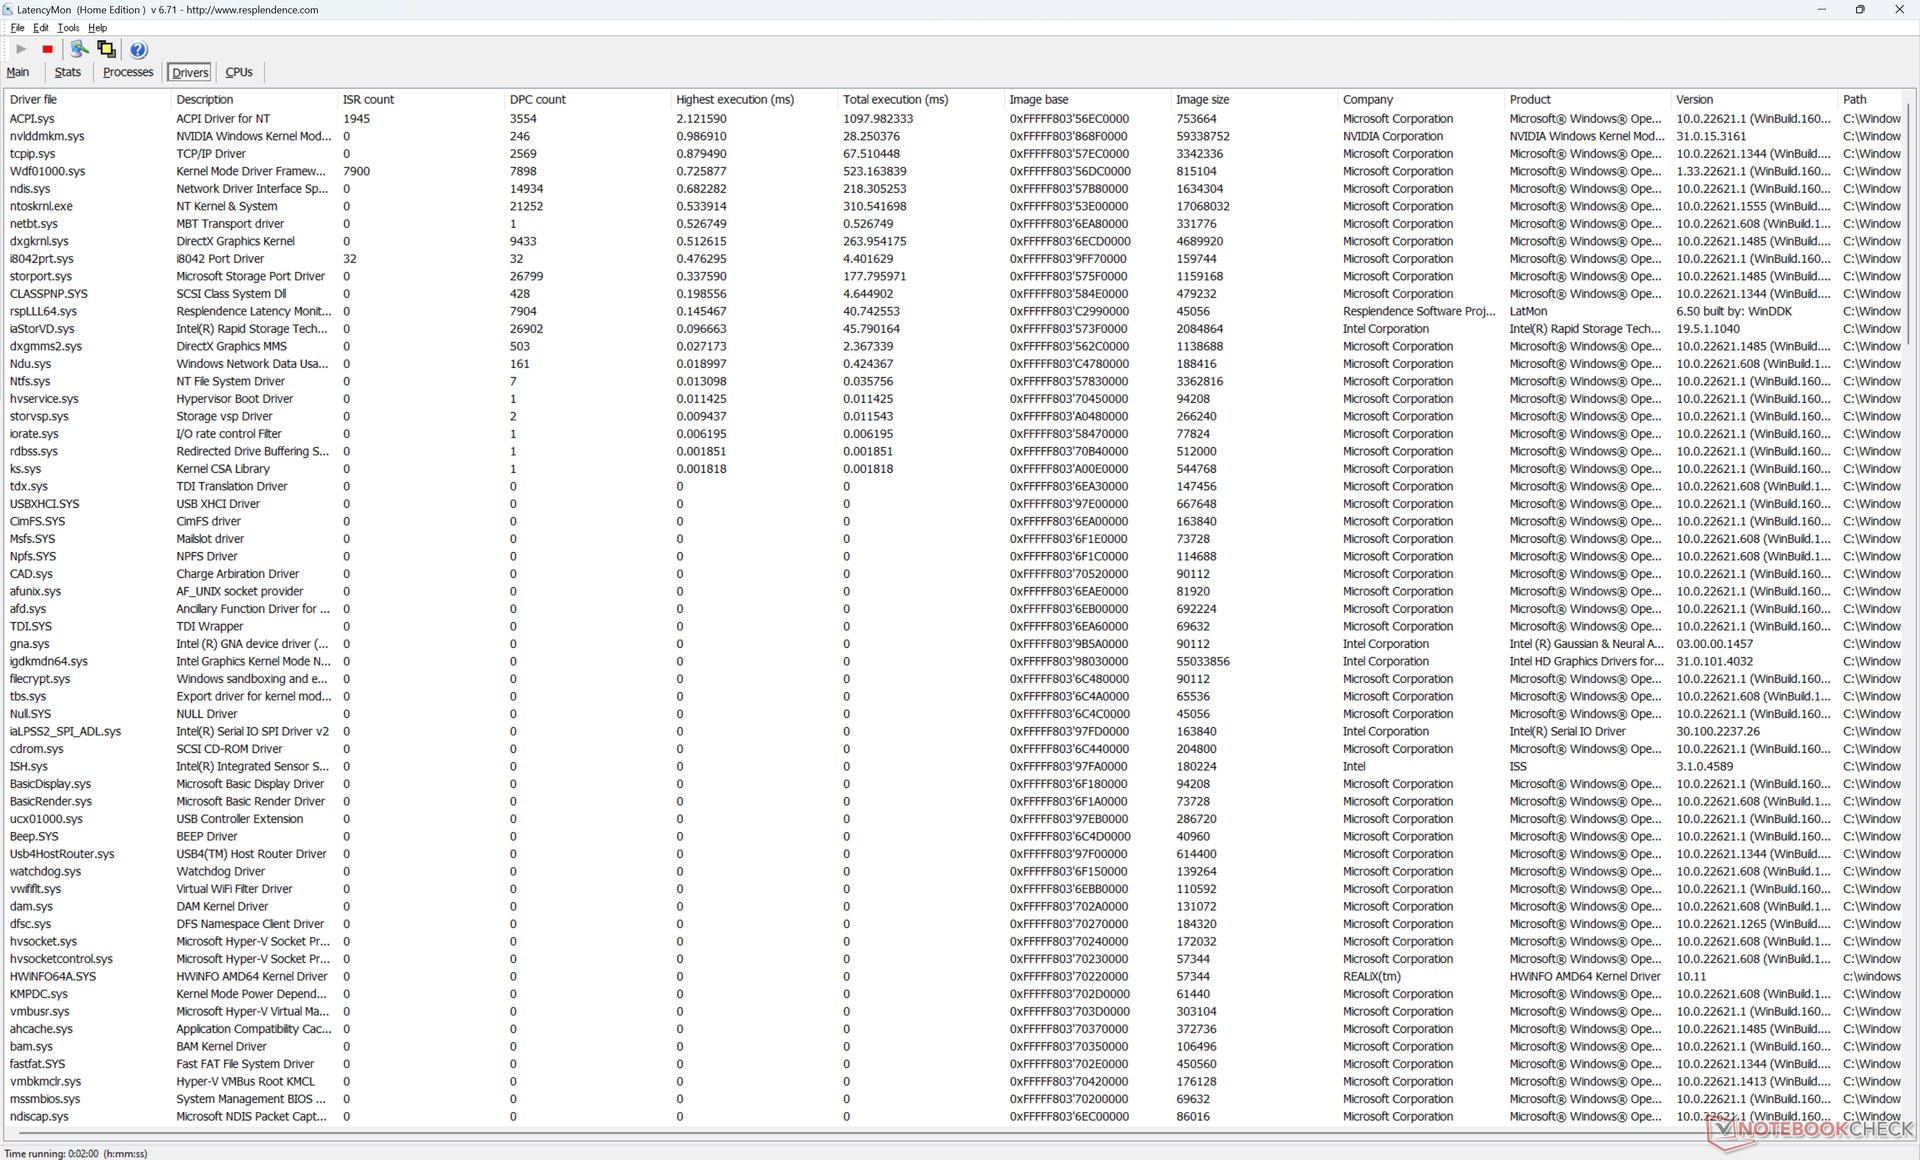
Opóźnienie DPC
LatencyMon ujawnia problemy z DPC podczas otwierania wielu kart przeglądarki na naszej stronie głównej. odtwarzanie wideo w rozdzielczości 4K60 jest również niedoskonałe - podczas naszego minutowego testu pojawiły się 4 klatki.
| DPC Latencies / LatencyMon - interrupt to process latency (max), Web, Youtube, Prime95 | |
| Dell XPS 15 9500 Core i7 4K UHD | |
| MSI Prestige 15 A12UD-093 | |
| Dell XPS 15 9530 RTX 4070 | |
| Dell XPS 15 9520 RTX 3050 Ti | |
| Gigabyte Aero 15 OLED XD | |
| Asus Zenbook Pro 15 OLED UM535Q | |
* ... im mniej tym lepiej
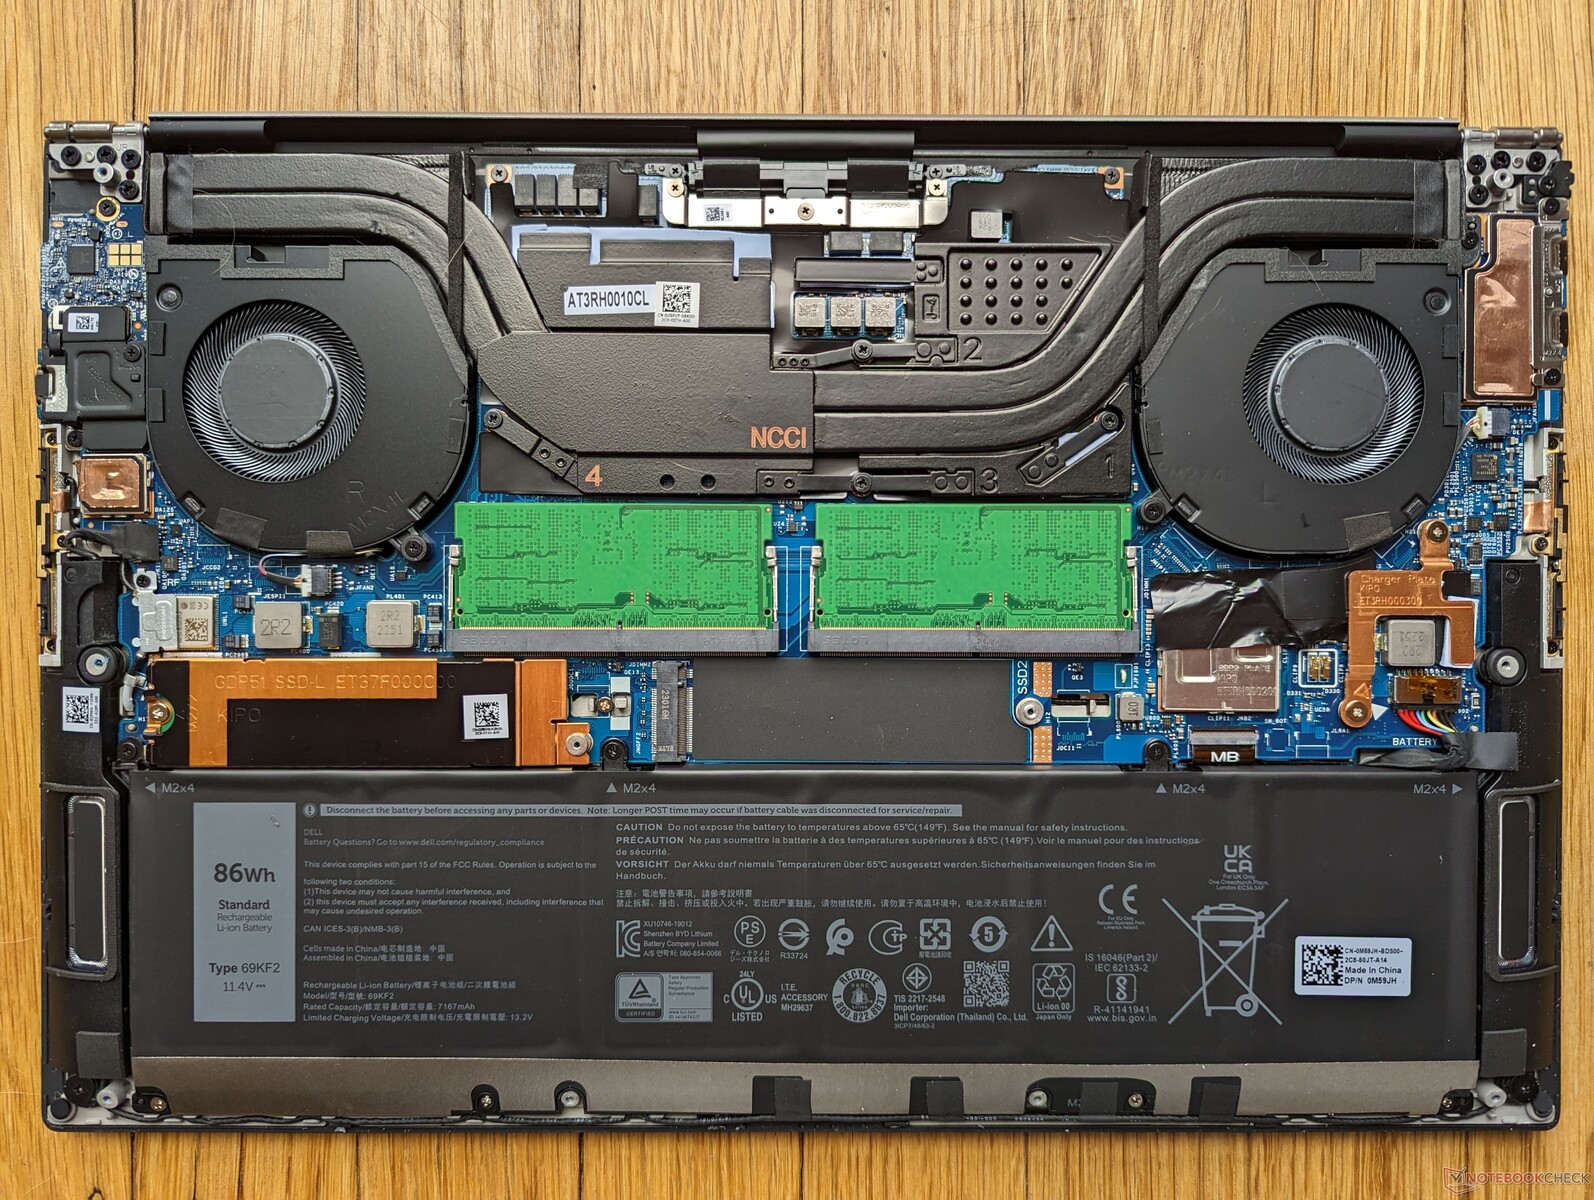
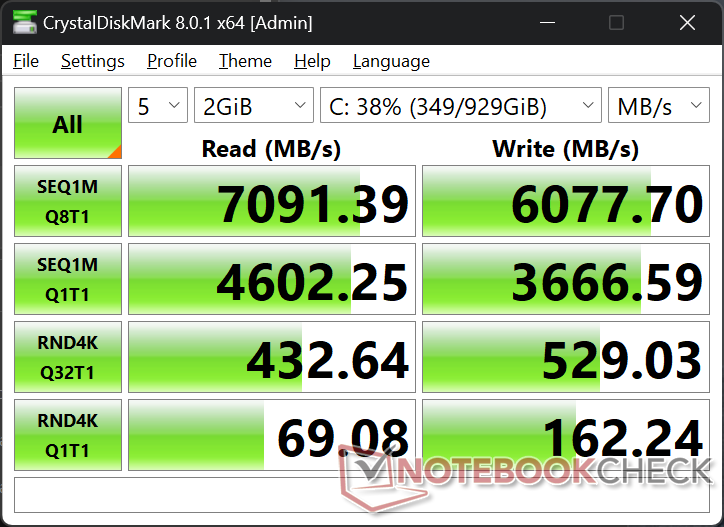
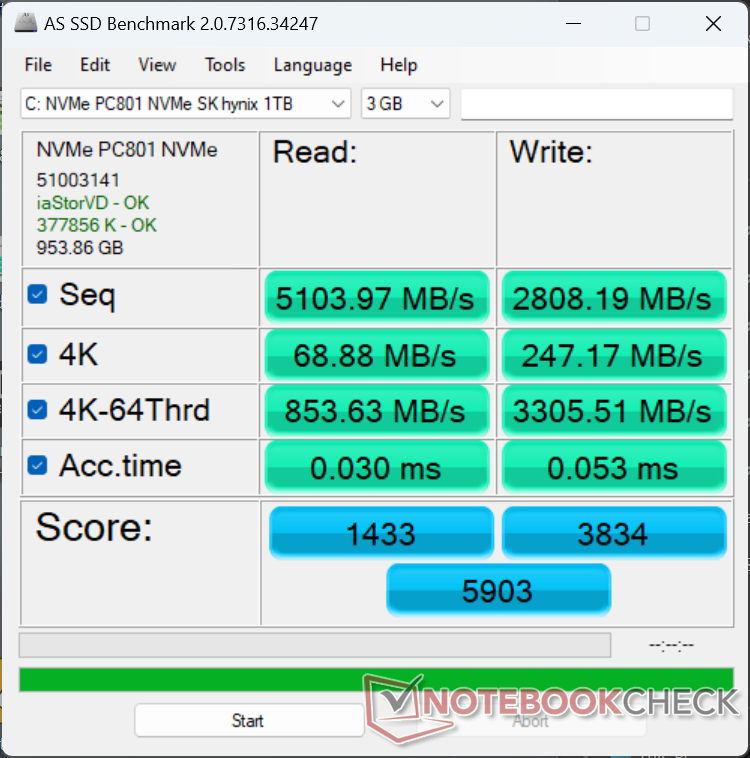
Urządzenia pamięci masowej - do dwóch dysków PCIe4
Nasz egzemplarz recenzencki wyposażony jest w SK Hynix PC801 PCIe4 x4 NVMe SSD zamiast WD SN810 w naszym starszym egzemplarzu testowym XPS 15 9510. Wydajność obu dysków SSD jest generalnie porównywalna, ale ustępują one popularnemu Samsungowi PM9A1.
Zrównoważenie wydajności jest doskonałe, bez dławienia w warunkach stresu. Szkoda, że dyski SSD PCIe5 nie są oferowane w kasie.

| Drive Performance rating - Percent | |
| Gigabyte Aero 15 OLED XD | |
| Dell XPS 15 9530 RTX 4070 | |
| Dell XPS 15 9520 RTX 3050 Ti | |
| MSI Prestige 15 A12UD-093 | |
| Asus Zenbook Pro 15 OLED UM535Q | |
| Dell XPS 15 9500 Core i7 4K UHD | |
| DiskSpd | |
| seq read | |
| Dell XPS 15 9520 RTX 3050 Ti | |
| Gigabyte Aero 15 OLED XD | |
| Dell XPS 15 9530 RTX 4070 | |
| Asus Zenbook Pro 15 OLED UM535Q | |
| Dell XPS 15 9500 Core i7 4K UHD | |
| MSI Prestige 15 A12UD-093 | |
| seq write | |
| Dell XPS 15 9530 RTX 4070 | |
| Gigabyte Aero 15 OLED XD | |
| Dell XPS 15 9520 RTX 3050 Ti | |
| Asus Zenbook Pro 15 OLED UM535Q | |
| MSI Prestige 15 A12UD-093 | |
| Dell XPS 15 9500 Core i7 4K UHD | |
| seq q8 t1 read | |
| Dell XPS 15 9520 RTX 3050 Ti | |
| Gigabyte Aero 15 OLED XD | |
| Dell XPS 15 9530 RTX 4070 | |
| MSI Prestige 15 A12UD-093 | |
| Dell XPS 15 9500 Core i7 4K UHD | |
| Asus Zenbook Pro 15 OLED UM535Q | |
| seq q8 t1 write | |
| Dell XPS 15 9530 RTX 4070 | |
| Gigabyte Aero 15 OLED XD | |
| MSI Prestige 15 A12UD-093 | |
| Dell XPS 15 9520 RTX 3050 Ti | |
| Asus Zenbook Pro 15 OLED UM535Q | |
| Dell XPS 15 9500 Core i7 4K UHD | |
| 4k q1 t1 read | |
| Dell XPS 15 9520 RTX 3050 Ti | |
| Dell XPS 15 9530 RTX 4070 | |
| Gigabyte Aero 15 OLED XD | |
| Asus Zenbook Pro 15 OLED UM535Q | |
| Dell XPS 15 9500 Core i7 4K UHD | |
| MSI Prestige 15 A12UD-093 | |
| 4k q1 t1 write | |
| MSI Prestige 15 A12UD-093 | |
| Dell XPS 15 9520 RTX 3050 Ti | |
| Dell XPS 15 9530 RTX 4070 | |
| Gigabyte Aero 15 OLED XD | |
| Asus Zenbook Pro 15 OLED UM535Q | |
| Dell XPS 15 9500 Core i7 4K UHD | |
| 4k q32 t16 read | |
| Gigabyte Aero 15 OLED XD | |
| MSI Prestige 15 A12UD-093 | |
| Asus Zenbook Pro 15 OLED UM535Q | |
| Dell XPS 15 9520 RTX 3050 Ti | |
| Dell XPS 15 9530 RTX 4070 | |
| Dell XPS 15 9500 Core i7 4K UHD | |
| 4k q32 t16 write | |
| Gigabyte Aero 15 OLED XD | |
| MSI Prestige 15 A12UD-093 | |
| Dell XPS 15 9520 RTX 3050 Ti | |
| Asus Zenbook Pro 15 OLED UM535Q | |
| Dell XPS 15 9530 RTX 4070 | |
| Dell XPS 15 9500 Core i7 4K UHD | |
| AS SSD | |
| Score Total | |
| Gigabyte Aero 15 OLED XD | |
| MSI Prestige 15 A12UD-093 | |
| Dell XPS 15 9530 RTX 4070 | |
| Dell XPS 15 9520 RTX 3050 Ti | |
| Asus Zenbook Pro 15 OLED UM535Q | |
| Dell XPS 15 9500 Core i7 4K UHD | |
| Score Read | |
| Gigabyte Aero 15 OLED XD | |
| MSI Prestige 15 A12UD-093 | |
| Dell XPS 15 9520 RTX 3050 Ti | |
| Asus Zenbook Pro 15 OLED UM535Q | |
| Dell XPS 15 9530 RTX 4070 | |
| Dell XPS 15 9500 Core i7 4K UHD | |
| Score Write | |
| Gigabyte Aero 15 OLED XD | |
| Dell XPS 15 9530 RTX 4070 | |
| MSI Prestige 15 A12UD-093 | |
| Asus Zenbook Pro 15 OLED UM535Q | |
| Dell XPS 15 9520 RTX 3050 Ti | |
| Dell XPS 15 9500 Core i7 4K UHD | |
| Seq Read | |
| Gigabyte Aero 15 OLED XD | |
| Dell XPS 15 9520 RTX 3050 Ti | |
| Dell XPS 15 9530 RTX 4070 | |
| Asus Zenbook Pro 15 OLED UM535Q | |
| MSI Prestige 15 A12UD-093 | |
| Dell XPS 15 9500 Core i7 4K UHD | |
| Seq Write | |
| Gigabyte Aero 15 OLED XD | |
| MSI Prestige 15 A12UD-093 | |
| Dell XPS 15 9530 RTX 4070 | |
| Dell XPS 15 9520 RTX 3050 Ti | |
| Asus Zenbook Pro 15 OLED UM535Q | |
| Dell XPS 15 9500 Core i7 4K UHD | |
| 4K Read | |
| Dell XPS 15 9520 RTX 3050 Ti | |
| Dell XPS 15 9530 RTX 4070 | |
| Gigabyte Aero 15 OLED XD | |
| Dell XPS 15 9500 Core i7 4K UHD | |
| Asus Zenbook Pro 15 OLED UM535Q | |
| MSI Prestige 15 A12UD-093 | |
| 4K Write | |
| Dell XPS 15 9520 RTX 3050 Ti | |
| Dell XPS 15 9530 RTX 4070 | |
| MSI Prestige 15 A12UD-093 | |
| Gigabyte Aero 15 OLED XD | |
| Asus Zenbook Pro 15 OLED UM535Q | |
| Dell XPS 15 9500 Core i7 4K UHD | |
| 4K-64 Read | |
| Gigabyte Aero 15 OLED XD | |
| MSI Prestige 15 A12UD-093 | |
| Dell XPS 15 9520 RTX 3050 Ti | |
| Asus Zenbook Pro 15 OLED UM535Q | |
| Dell XPS 15 9500 Core i7 4K UHD | |
| Dell XPS 15 9530 RTX 4070 | |
| 4K-64 Write | |
| Gigabyte Aero 15 OLED XD | |
| Dell XPS 15 9530 RTX 4070 | |
| MSI Prestige 15 A12UD-093 | |
| Asus Zenbook Pro 15 OLED UM535Q | |
| Dell XPS 15 9520 RTX 3050 Ti | |
| Dell XPS 15 9500 Core i7 4K UHD | |
| Access Time Read | |
| MSI Prestige 15 A12UD-093 | |
| Dell XPS 15 9520 RTX 3050 Ti | |
| Gigabyte Aero 15 OLED XD | |
| Asus Zenbook Pro 15 OLED UM535Q | |
| Dell XPS 15 9500 Core i7 4K UHD | |
| Dell XPS 15 9530 RTX 4070 | |
| Access Time Write | |
| Dell XPS 15 9500 Core i7 4K UHD | |
| Asus Zenbook Pro 15 OLED UM535Q | |
| Dell XPS 15 9530 RTX 4070 | |
| Dell XPS 15 9520 RTX 3050 Ti | |
| Gigabyte Aero 15 OLED XD | |
| MSI Prestige 15 A12UD-093 | |
* ... im mniej tym lepiej
Disk Throttling: DiskSpd Read Loop, Queue Depth 8
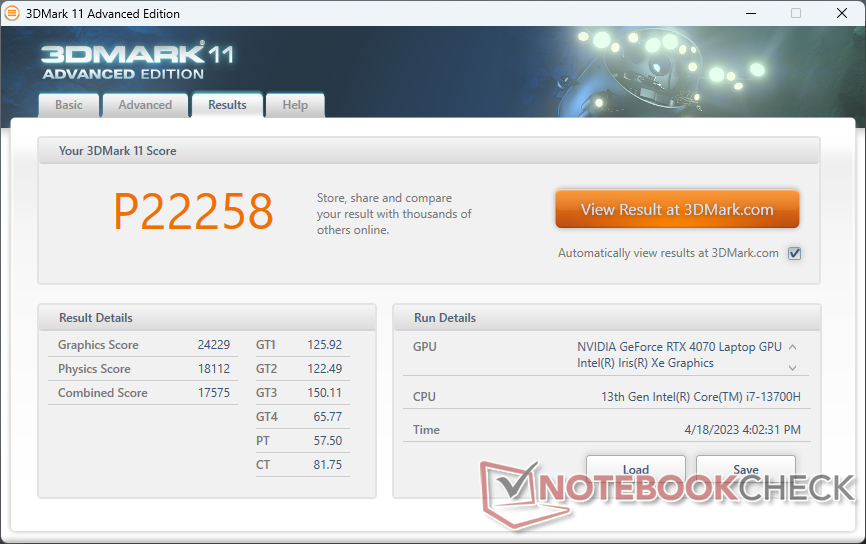
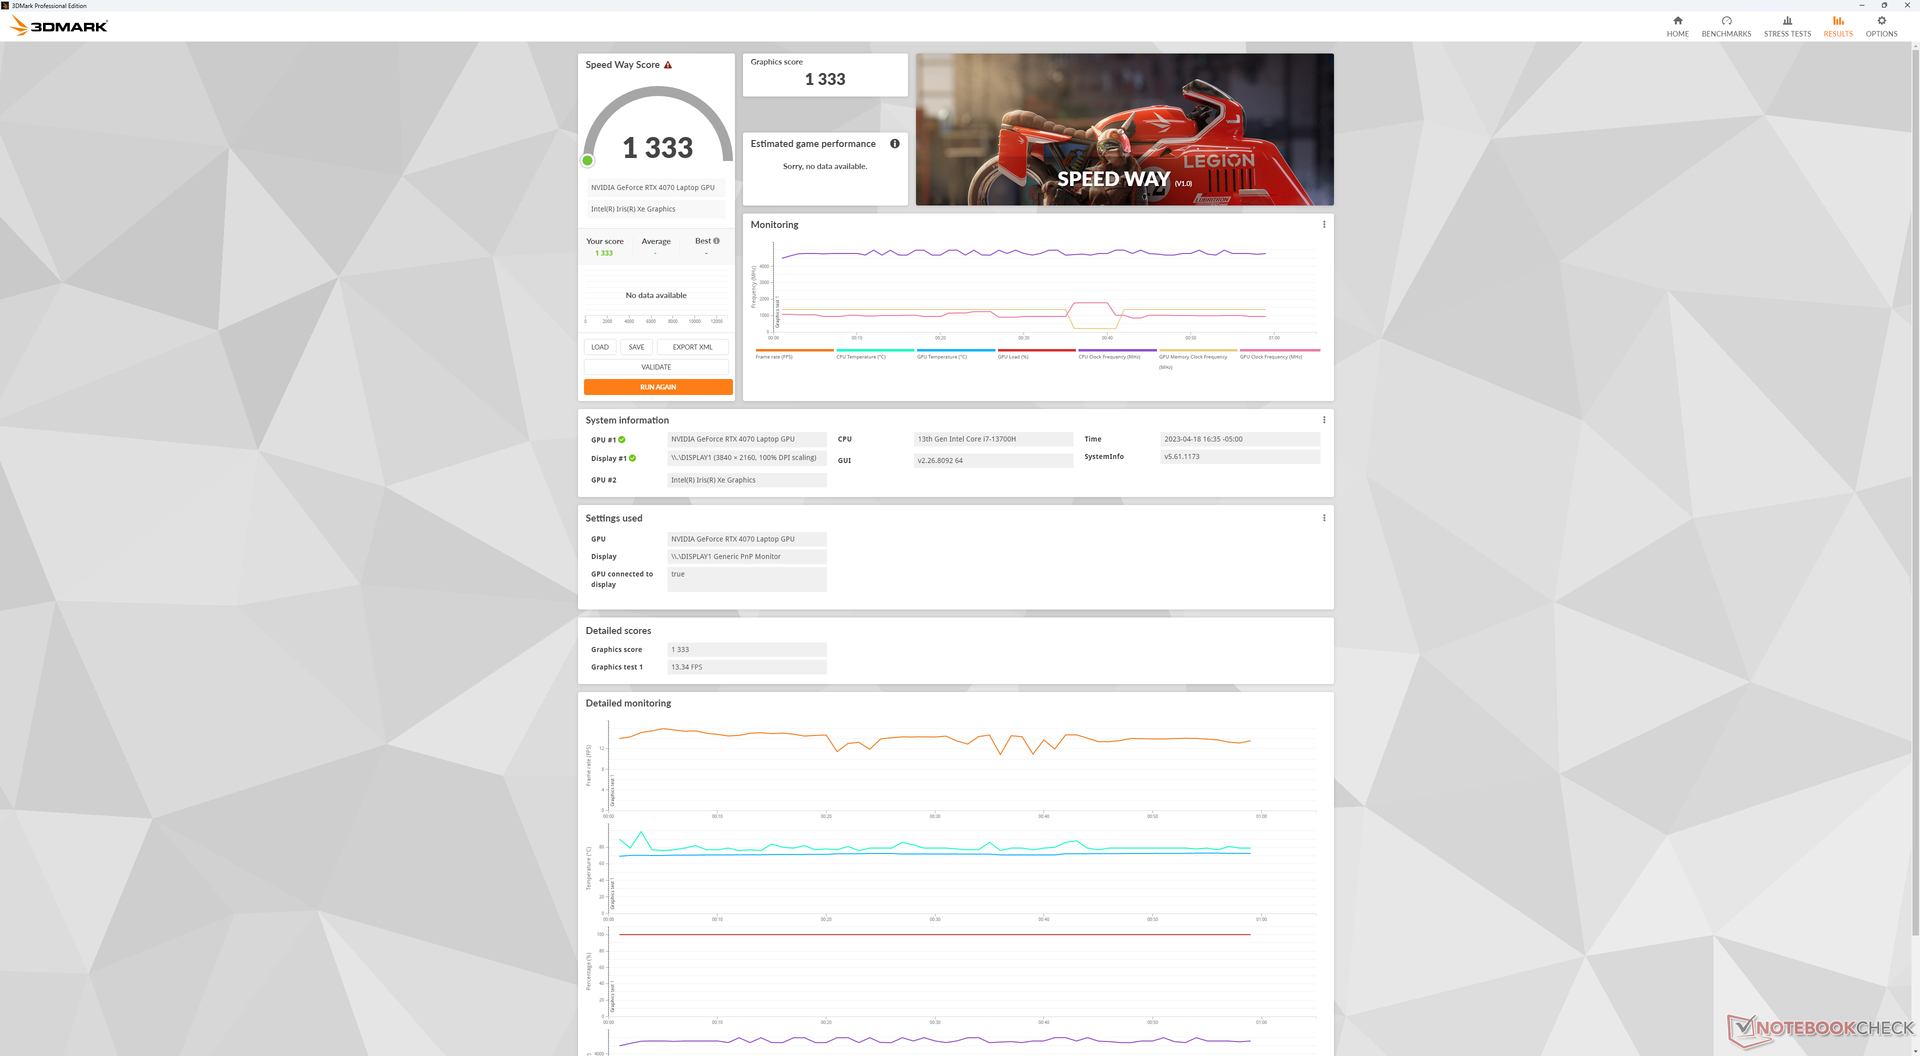
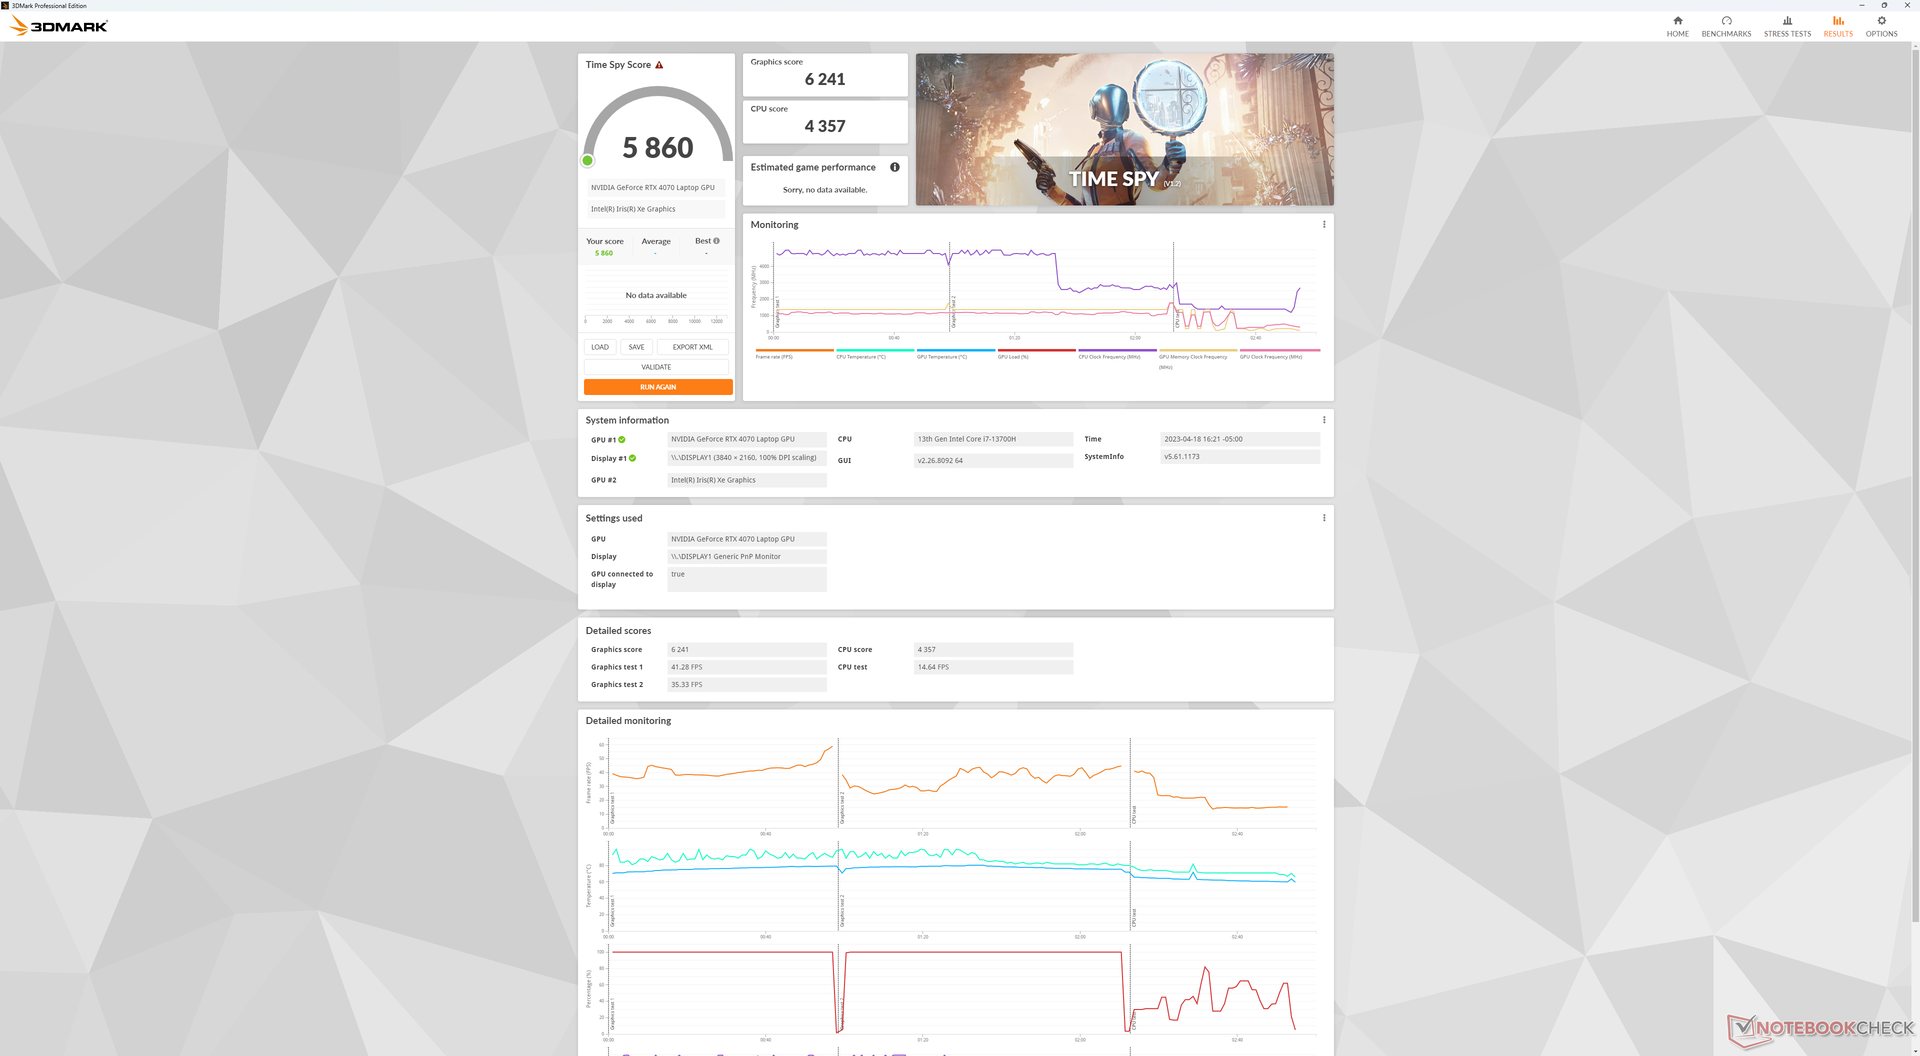
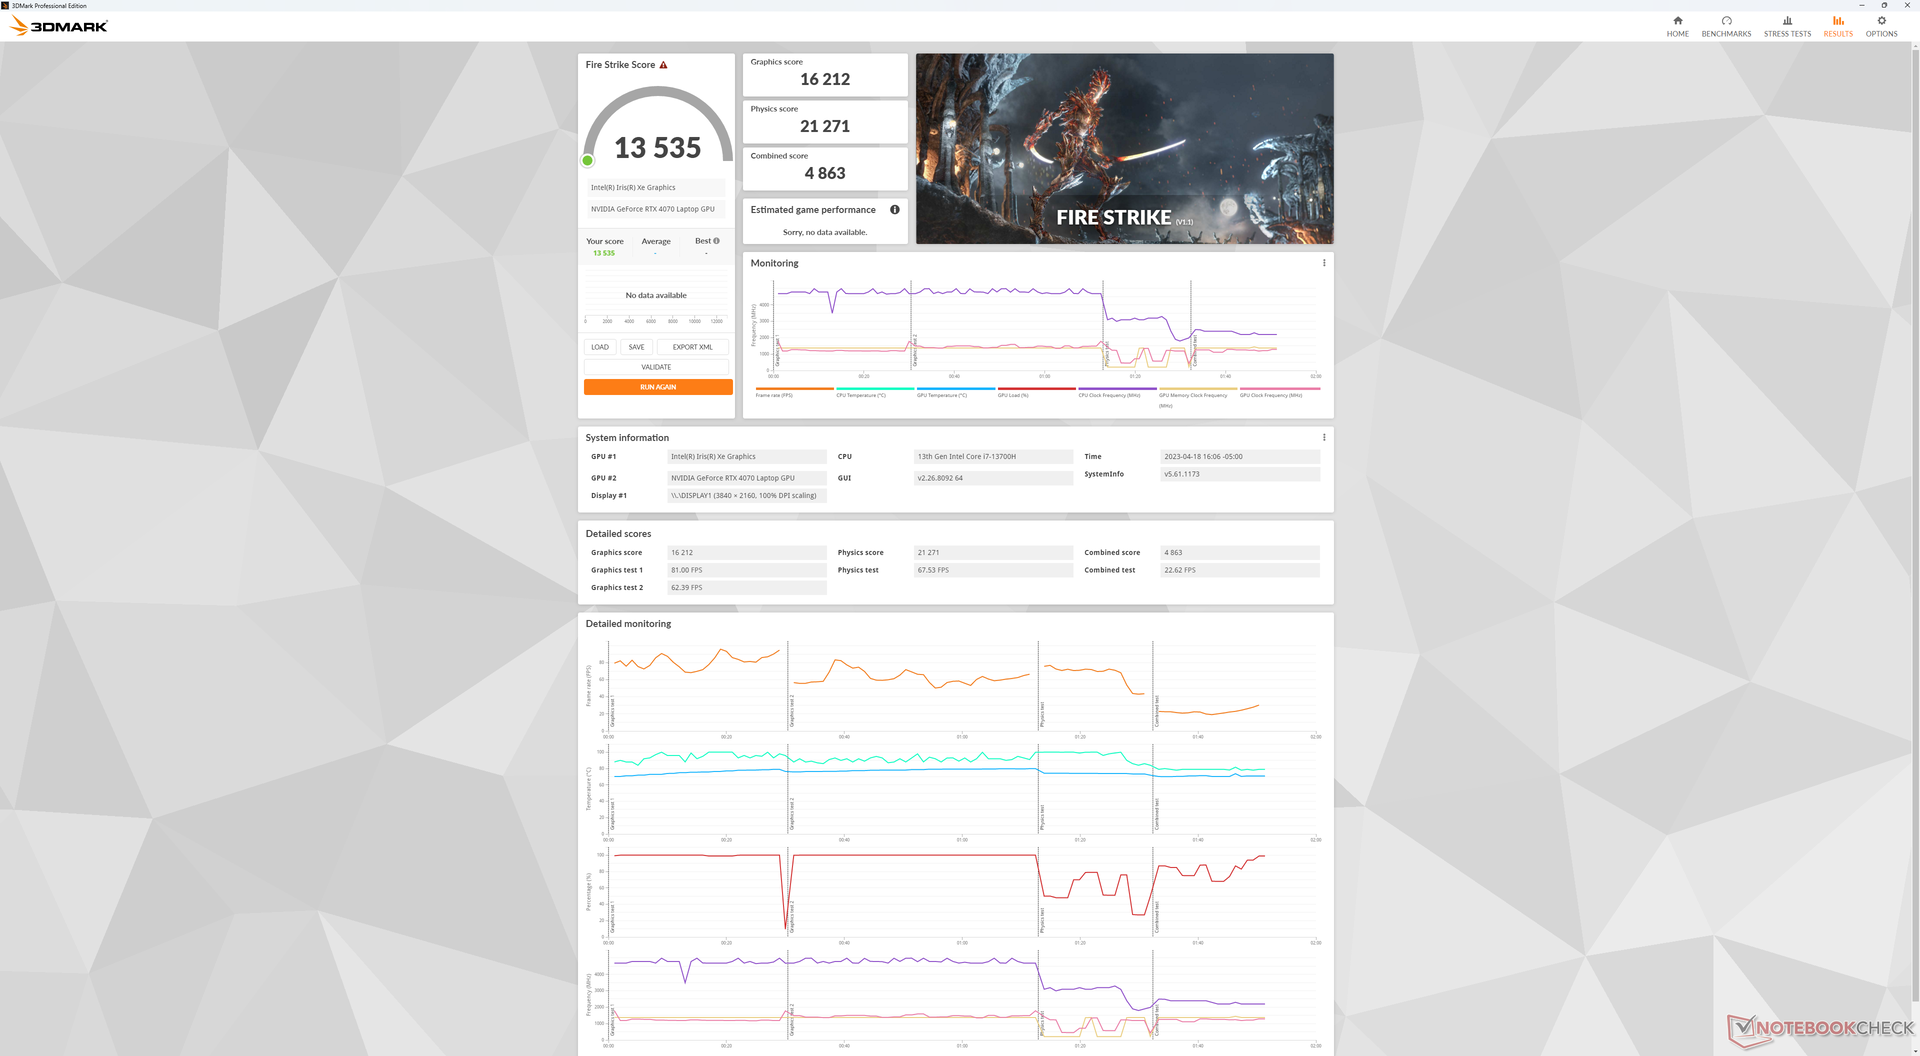
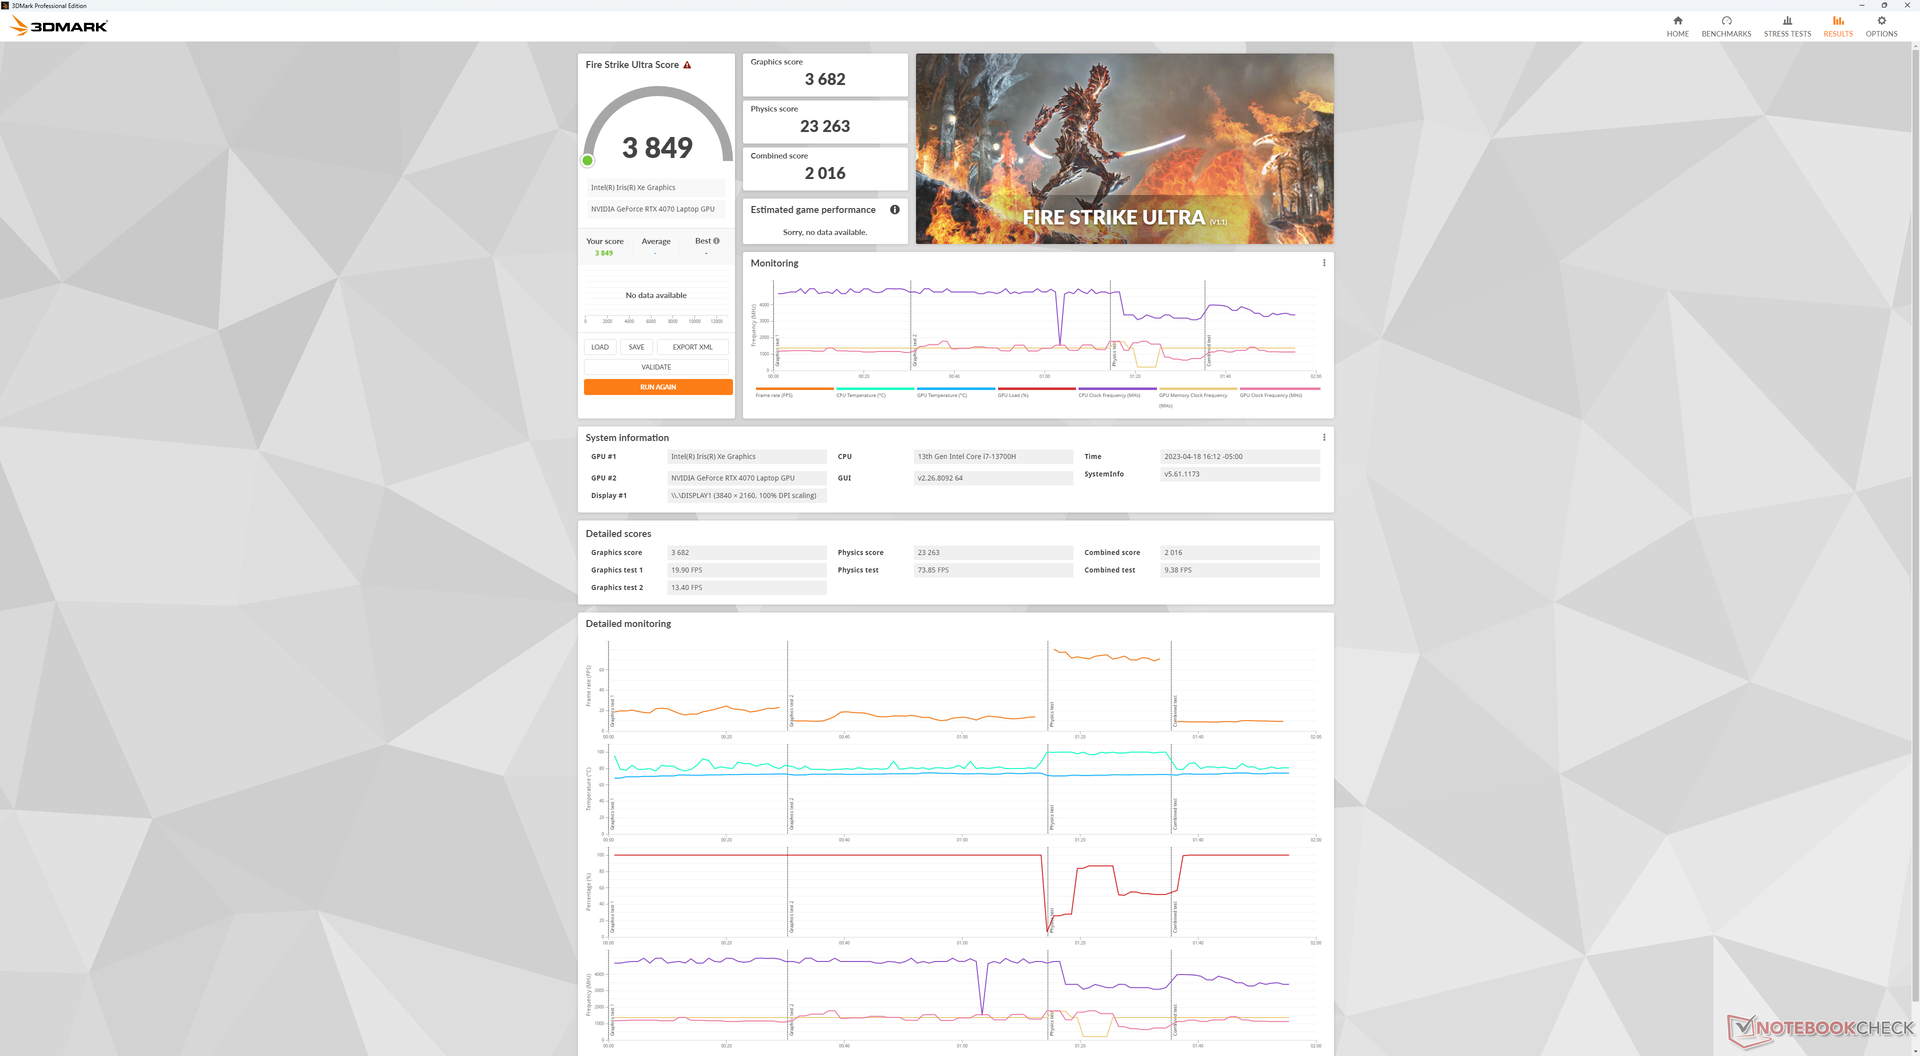
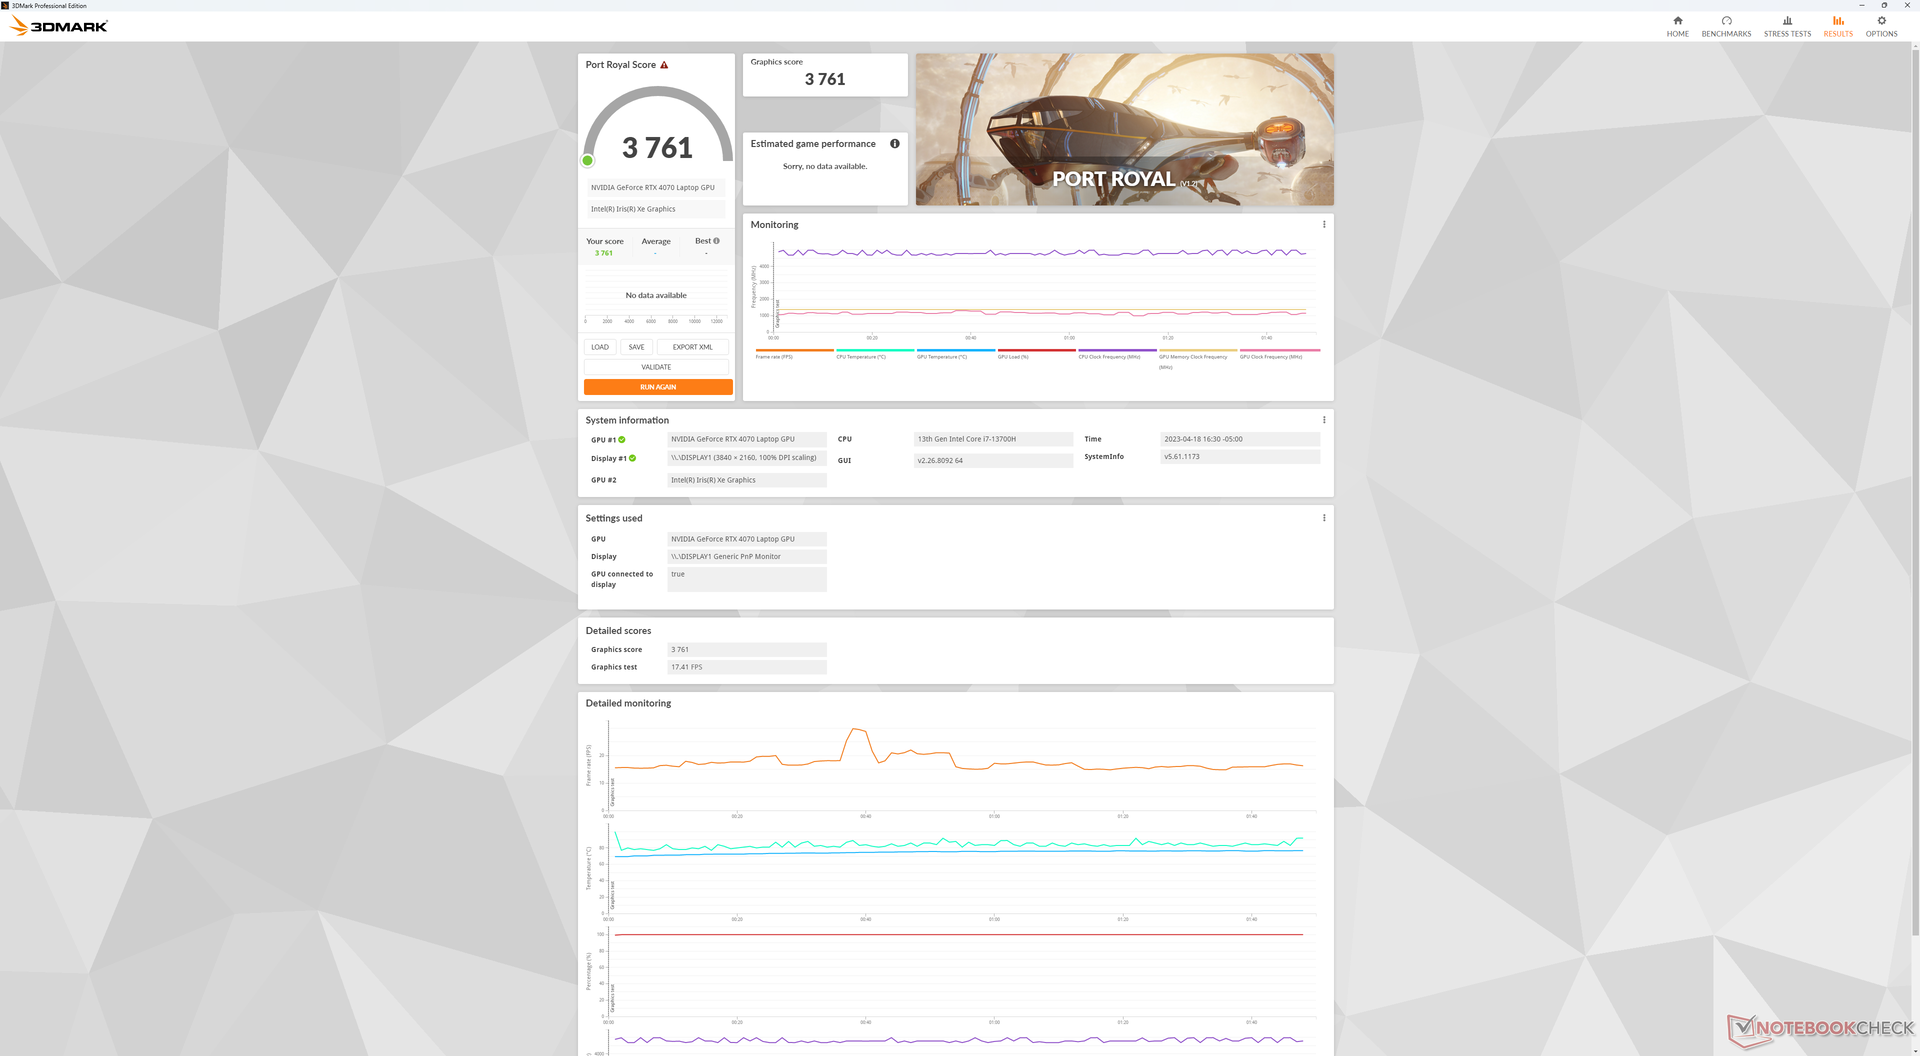
Wydajność układów GPU - połowa TGP równa się połowie mocy
Oczywiście wydajność graficzna powinna być wolniejsza od "przeciętnego" laptopa GeForce RTX 4070 ze względu na niski cel TGP 50 W w XPS 15, ale nie mieliśmy pojęcia o ile. Teraz, gdy mamy w ręku egzemplarz testowy, deficyt może być dość uderzający i wynosi nawet 40 do 50 procent wolniej od średniej naszej bazy danych według benchmarków 3DMark. Jest tak źle, że nawet czteroletni laptop z RTX 2070, taki jak HP Omen 15, może osiągać mniej więcej to samo, co nasz droższy XPS 15 z RTX 4070. Jeśli zamierzasz grać w wiele gier, to XPS 15 staje się słabą propozycją wartości.
Dobra wiadomość jest taka, że wydajność graficzna jest wciąż szybsza niż w przypadku RTX 3050 Ti w ubiegłorocznym XPS 15 9520 o około 30 do 35 procent. Mamy więc do czynienia z odczuwalnym wzrostem w skali roku, mimo że jest to z pewnością jedna z najwolniejszych iteracji mobilnego RTX 4070, jakie widzieliśmy.
Co ciekawe, akceleracja grafiki podczas uruchamiania narzędzi programowych 3D jest znacznie szybsza niż oczekiwano w stosunku do 50 W TGP. Na przykład Blender Classroom z akceleracją CUDA ukończyłby się w zaledwie 46 sekund, co jest tylko o około 25 procent wolniejsze niż w przypadku przeciętnego laptopa z RTX 4070, gdzie typowe są 100 W lub wyższe TGP. Starszy RTX 3050 Ti zająłby w tym samym benchmarku prawie 2,5x dłużej. Twórcy treści skorzystają więc najbardziej wybierając XPS 15 z 2023 roku nad starszymi modelami.
| 3DMark Performance rating - Percent | |
| Asus Zephyrus Duo 16 GX650PY-NM006W | |
| Uniwill GM6PX7X RTX 4070 | |
| Alienware x15 R2 P111F -1! | |
| Przeciętny NVIDIA GeForce RTX 4070 Laptop GPU | |
| Lenovo Legion 5 15IAH7H 82RB -1! | |
| Gigabyte Aero 15 OLED XD -2! | |
| Dell XPS 15 9530 RTX 4070 | |
| MSI Stealth 15M A11SEK -2! | |
| Dell XPS 15 9520 RTX 3050 Ti -2! | |
| Dell XPS 15 9500 Core i7 4K UHD -2! | |
| 3DMark 11 - 1280x720 Performance GPU | |
| Asus Zephyrus Duo 16 GX650PY-NM006W | |
| Uniwill GM6PX7X RTX 4070 | |
| Przeciętny NVIDIA GeForce RTX 4070 Laptop GPU (24229 - 46434, n=67) | |
| Alienware x15 R2 P111F | |
| Lenovo Legion 5 15IAH7H 82RB | |
| Gigabyte Aero 15 OLED XD | |
| Dell XPS 15 9530 RTX 4070 | |
| MSI Stealth 15M A11SEK | |
| Dell XPS 15 9520 RTX 3050 Ti | |
| Dell XPS 15 9500 Core i7 4K UHD | |
| 3DMark 11 Performance | 22258 pkt. | |
| 3DMark Fire Strike Score | 13535 pkt. | |
| 3DMark Time Spy Score | 5860 pkt. | |
Pomoc | ||
* ... im mniej tym lepiej
Wydajność w grach
Pomimo wspomnianej wyżej rozczarowującej wydajności RTX 4070, system nadal może uruchomić dowolny bieżący tytuł na średnio-wysokich ustawieniach w 1080p i 60 FPS. Jednak w wyższych ustawieniach procesor graficzny zaczyna się męczyć. Wymagające tytuły, takie jak Cyberpunk 2077 czy Returnal , spadłyby do poziomu 40 FPS, jeśli ustawienia byłyby wyższe niż średnie, co skutkowałoby zauważalnym rozrywaniem ekranu bez pomocy G-Sync. Większość gier, poza niewymagającymi grami wieloosobowymi, jak DOTA 2, ledwo działa w natywnej rozdzielczości 3,5K.
Co więcej, wydajność podczas gry może być niestabilna. Liczba klatek na sekundę w stanie spoczynku Witcher 3 okresowo spadała z 50 FPS do 40 FPS, po czym bez powodu wracała do 50 FPS. Takie zachowanie sugeruje słabe priorytetyzowanie działań w tle.
Inną niefortunną wadą jest to, że liczba klatek na sekundę na bardzo niskich ustawieniach może być czasem wolniejsza niż na wyższych. Zaobserwowano to podczas uruchamiania gier Cyberpunk 2077 i Returnal na niskich ustawieniach 1080p, gdzie liczba klatek na sekundę była stale niższa niż na średnich ustawieniach 1080p, nawet po powtórzeniu testów. Takie zachowanie sugeruje ograniczenie zasilacza i w konsekwencji walkę o moc pomiędzy CPU i GPU, gdy oba te układy są obciążone.
| Performance rating - Percent | |
| Asus Zephyrus Duo 16 GX650PY-NM006W | |
| Uniwill GM6PX7X RTX 4070 | |
| Alienware x15 R2 P111F -1! | |
| Gigabyte Aero 15 OLED XD | |
| Dell XPS 15 9530 RTX 4070 | |
| Dell XPS 15 9500 Core i7 4K UHD -3! | |
| MSI Stealth 15M A11SEK | |
| Dell XPS 15 9520 RTX 3050 Ti | |
| The Witcher 3 - 1920x1080 Ultra Graphics & Postprocessing (HBAO+) | |
| Asus Zephyrus Duo 16 GX650PY-NM006W | |
| Uniwill GM6PX7X RTX 4070 | |
| Alienware x15 R2 P111F | |
| Gigabyte Aero 15 OLED XD | |
| Dell XPS 15 9530 RTX 4070 | |
| MSI Stealth 15M A11SEK | |
| Dell XPS 15 9500 Core i7 4K UHD | |
| Dell XPS 15 9520 RTX 3050 Ti | |
| GTA V - 1920x1080 Highest AA:4xMSAA + FX AF:16x | |
| Asus Zephyrus Duo 16 GX650PY-NM006W | |
| Uniwill GM6PX7X RTX 4070 | |
| Gigabyte Aero 15 OLED XD | |
| MSI Stealth 15M A11SEK | |
| Dell XPS 15 9530 RTX 4070 | |
| Dell XPS 15 9520 RTX 3050 Ti | |
| Final Fantasy XV Benchmark - 1920x1080 High Quality | |
| Asus Zephyrus Duo 16 GX650PY-NM006W | |
| Uniwill GM6PX7X RTX 4070 | |
| Alienware x15 R2 P111F | |
| Gigabyte Aero 15 OLED XD | |
| Dell XPS 15 9530 RTX 4070 | |
| MSI Stealth 15M A11SEK | |
| Dell XPS 15 9520 RTX 3050 Ti | |
| Strange Brigade - 1920x1080 ultra AA:ultra AF:16 | |
| Asus Zephyrus Duo 16 GX650PY-NM006W | |
| Uniwill GM6PX7X RTX 4070 | |
| Alienware x15 R2 P111F | |
| Gigabyte Aero 15 OLED XD | |
| Dell XPS 15 9530 RTX 4070 | |
| MSI Stealth 15M A11SEK | |
| Dell XPS 15 9520 RTX 3050 Ti | |
| Dota 2 Reborn - 1920x1080 ultra (3/3) best looking | |
| Asus Zephyrus Duo 16 GX650PY-NM006W | |
| Uniwill GM6PX7X RTX 4070 | |
| Alienware x15 R2 P111F | |
| Dell XPS 15 9530 RTX 4070 | |
| Gigabyte Aero 15 OLED XD | |
| Gigabyte Aero 15 OLED XD | |
| Dell XPS 15 9500 Core i7 4K UHD | |
| MSI Stealth 15M A11SEK | |
| Dell XPS 15 9520 RTX 3050 Ti | |
| X-Plane 11.11 - 1920x1080 high (fps_test=3) | |
| Uniwill GM6PX7X RTX 4070 | |
| Asus Zephyrus Duo 16 GX650PY-NM006W | |
| Alienware x15 R2 P111F | |
| Dell XPS 15 9520 RTX 3050 Ti | |
| Dell XPS 15 9530 RTX 4070 | |
| Gigabyte Aero 15 OLED XD | |
| Gigabyte Aero 15 OLED XD | |
| MSI Stealth 15M A11SEK | |
| Dell XPS 15 9500 Core i7 4K UHD | |
| The Witcher 3 | |
| 1024x768 Low Graphics & Postprocessing | |
| Uniwill GM6PX7X RTX 4070 | |
| Przeciętny NVIDIA GeForce RTX 4070 Laptop GPU (314 - 617, n=26) | |
| Alienware x15 R2 P111F | |
| Dell XPS 15 9530 RTX 4070 | |
| Gigabyte Aero 15 OLED XD | |
| MSI Stealth 15M A11SEK | |
| Dell XPS 15 9520 RTX 3050 Ti | |
| Dell XPS 15 9500 Core i7 4K UHD | |
| 1366x768 Medium Graphics & Postprocessing | |
| Uniwill GM6PX7X RTX 4070 | |
| Przeciętny NVIDIA GeForce RTX 4070 Laptop GPU (123.3 - 449, n=27) | |
| Alienware x15 R2 P111F | |
| Gigabyte Aero 15 OLED XD | |
| Dell XPS 15 9530 RTX 4070 | |
| MSI Stealth 15M A11SEK | |
| Dell XPS 15 9520 RTX 3050 Ti | |
| Dell XPS 15 9500 Core i7 4K UHD | |
| 1920x1080 High Graphics & Postprocessing (Nvidia HairWorks Off) | |
| Asus Zephyrus Duo 16 GX650PY-NM006W | |
| Uniwill GM6PX7X RTX 4070 | |
| Alienware x15 R2 P111F | |
| Przeciętny NVIDIA GeForce RTX 4070 Laptop GPU (123.9 - 268, n=41) | |
| Gigabyte Aero 15 OLED XD | |
| Dell XPS 15 9530 RTX 4070 | |
| MSI Stealth 15M A11SEK | |
| Dell XPS 15 9500 Core i7 4K UHD | |
| Dell XPS 15 9520 RTX 3050 Ti | |
| 1920x1080 Ultra Graphics & Postprocessing (HBAO+) | |
| Asus Zephyrus Duo 16 GX650PY-NM006W | |
| Uniwill GM6PX7X RTX 4070 | |
| Alienware x15 R2 P111F | |
| Przeciętny NVIDIA GeForce RTX 4070 Laptop GPU (69.8 - 133.7, n=57) | |
| Gigabyte Aero 15 OLED XD | |
| Dell XPS 15 9530 RTX 4070 | |
| MSI Stealth 15M A11SEK | |
| Dell XPS 15 9500 Core i7 4K UHD | |
| Dell XPS 15 9520 RTX 3050 Ti | |
| 3840x2160 High Graphics & Postprocessing (Nvidia HairWorks Off) | |
| Uniwill GM6PX7X RTX 4070 | |
| Przeciętny NVIDIA GeForce RTX 4070 Laptop GPU (26.5 - 83.5, n=16) | |
| Gigabyte Aero 15 OLED XD | |
| Dell XPS 15 9530 RTX 4070 | |
| Dota 2 Reborn | |
| 1280x720 min (0/3) fastest | |
| Asus Zephyrus Duo 16 GX650PY-NM006W | |
| Uniwill GM6PX7X RTX 4070 | |
| Dell XPS 15 9530 RTX 4070 | |
| Przeciętny NVIDIA GeForce RTX 4070 Laptop GPU (89.8 - 253, n=63) | |
| Dell XPS 15 9520 RTX 3050 Ti | |
| Alienware x15 R2 P111F | |
| Gigabyte Aero 15 OLED XD | |
| Gigabyte Aero 15 OLED XD | |
| Dell XPS 15 9500 Core i7 4K UHD | |
| MSI Stealth 15M A11SEK | |
| 1366x768 med (1/3) | |
| Asus Zephyrus Duo 16 GX650PY-NM006W | |
| Uniwill GM6PX7X RTX 4070 | |
| Przeciętny NVIDIA GeForce RTX 4070 Laptop GPU (89.6 - 217, n=64) | |
| Dell XPS 15 9520 RTX 3050 Ti | |
| Dell XPS 15 9530 RTX 4070 | |
| Alienware x15 R2 P111F | |
| Gigabyte Aero 15 OLED XD | |
| Gigabyte Aero 15 OLED XD | |
| Dell XPS 15 9500 Core i7 4K UHD | |
| MSI Stealth 15M A11SEK | |
| 1920x1080 high (2/3) | |
| Asus Zephyrus Duo 16 GX650PY-NM006W | |
| Uniwill GM6PX7X RTX 4070 | |
| Przeciętny NVIDIA GeForce RTX 4070 Laptop GPU (88.2 - 210, n=67) | |
| Alienware x15 R2 P111F | |
| Dell XPS 15 9530 RTX 4070 | |
| Gigabyte Aero 15 OLED XD | |
| Gigabyte Aero 15 OLED XD | |
| Dell XPS 15 9500 Core i7 4K UHD | |
| MSI Stealth 15M A11SEK | |
| Dell XPS 15 9520 RTX 3050 Ti | |
| 1920x1080 ultra (3/3) best looking | |
| Asus Zephyrus Duo 16 GX650PY-NM006W | |
| Uniwill GM6PX7X RTX 4070 | |
| Przeciętny NVIDIA GeForce RTX 4070 Laptop GPU (89.7 - 191.2, n=67) | |
| Alienware x15 R2 P111F | |
| Dell XPS 15 9530 RTX 4070 | |
| Gigabyte Aero 15 OLED XD | |
| Gigabyte Aero 15 OLED XD | |
| Dell XPS 15 9500 Core i7 4K UHD | |
| MSI Stealth 15M A11SEK | |
| Dell XPS 15 9520 RTX 3050 Ti | |
| 3840x2160 ultra (3/3) best looking | |
| Uniwill GM6PX7X RTX 4070 | |
| Przeciętny NVIDIA GeForce RTX 4070 Laptop GPU (88.4 - 153.3, n=26) | |
| Gigabyte Aero 15 OLED XD | |
| Gigabyte Aero 15 OLED XD | |
| Dell XPS 15 9530 RTX 4070 | |
| Dell XPS 15 9500 Core i7 4K UHD | |
| Dell XPS 15 9520 RTX 3050 Ti | |
| X-Plane 11.11 | |
| 1280x720 low (fps_test=1) | |
| Uniwill GM6PX7X RTX 4070 | |
| Asus Zephyrus Duo 16 GX650PY-NM006W | |
| Przeciętny NVIDIA GeForce RTX 4070 Laptop GPU (80.6 - 218, n=66) | |
| Alienware x15 R2 P111F | |
| Dell XPS 15 9520 RTX 3050 Ti | |
| Dell XPS 15 9530 RTX 4070 | |
| Gigabyte Aero 15 OLED XD | |
| Gigabyte Aero 15 OLED XD | |
| Dell XPS 15 9500 Core i7 4K UHD | |
| MSI Stealth 15M A11SEK | |
| 1920x1080 med (fps_test=2) | |
| Uniwill GM6PX7X RTX 4070 | |
| Asus Zephyrus Duo 16 GX650PY-NM006W | |
| Alienware x15 R2 P111F | |
| Przeciętny NVIDIA GeForce RTX 4070 Laptop GPU (74.7 - 191.1, n=67) | |
| Dell XPS 15 9520 RTX 3050 Ti | |
| Gigabyte Aero 15 OLED XD | |
| Gigabyte Aero 15 OLED XD | |
| Dell XPS 15 9530 RTX 4070 | |
| MSI Stealth 15M A11SEK | |
| Dell XPS 15 9500 Core i7 4K UHD | |
| 1920x1080 high (fps_test=3) | |
| Uniwill GM6PX7X RTX 4070 | |
| Asus Zephyrus Duo 16 GX650PY-NM006W | |
| Alienware x15 R2 P111F | |
| Przeciętny NVIDIA GeForce RTX 4070 Laptop GPU (52.1 - 147.9, n=69) | |
| Dell XPS 15 9520 RTX 3050 Ti | |
| Dell XPS 15 9530 RTX 4070 | |
| Gigabyte Aero 15 OLED XD | |
| Gigabyte Aero 15 OLED XD | |
| MSI Stealth 15M A11SEK | |
| Dell XPS 15 9500 Core i7 4K UHD | |
| 3840x2160 high (fps_test=3) | |
| Uniwill GM6PX7X RTX 4070 | |
| Przeciętny NVIDIA GeForce RTX 4070 Laptop GPU (63.4 - 125.8, n=26) | |
| Dell XPS 15 9520 RTX 3050 Ti | |
| Dell XPS 15 9530 RTX 4070 | |
| Gigabyte Aero 15 OLED XD | |
| Gigabyte Aero 15 OLED XD | |
| Dell XPS 15 9500 Core i7 4K UHD | |
| Returnal | |
| 1920x1080 Low Preset | |
| Przeciętny NVIDIA GeForce RTX 4070 Laptop GPU (65 - 119, n=11) | |
| Dell XPS 15 9530 RTX 4070 | |
| 1920x1080 Medium Preset | |
| Przeciętny NVIDIA GeForce RTX 4070 Laptop GPU (69 - 117, n=12) | |
| Dell XPS 15 9530 RTX 4070 | |
| 1920x1080 High Preset | |
| Przeciętny NVIDIA GeForce RTX 4070 Laptop GPU (64 - 106, n=12) | |
| Dell XPS 15 9530 RTX 4070 | |
| 1920x1080 Epic Preset | |
| Przeciętny NVIDIA GeForce RTX 4070 Laptop GPU (54 - 90, n=12) | |
| Dell XPS 15 9530 RTX 4070 | |
| 2560x1440 Epic Preset | |
| Przeciętny NVIDIA GeForce RTX 4070 Laptop GPU (39 - 66, n=12) | |
| Dell XPS 15 9530 RTX 4070 | |
| 3840x2160 Epic Preset | |
| Przeciętny NVIDIA GeForce RTX 4070 Laptop GPU (21 - 39, n=8) | |
| Dell XPS 15 9530 RTX 4070 | |
Witcher 3 FPS Chart
| low | med. | high | ultra | QHD | 4K | |
|---|---|---|---|---|---|---|
| GTA V (2015) | 180 | 168.1 | 134.3 | 63.5 | 52.9 | 53 |
| The Witcher 3 (2015) | 354.2 | 233.3 | 123.9 | 69.8 | 47 | 26.5 |
| Dota 2 Reborn (2015) | 189.5 | 163.1 | 147.6 | 137 | 88.4 | |
| Final Fantasy XV Benchmark (2018) | 108.6 | 84 | 66 | 48.8 | 26.6 | |
| X-Plane 11.11 (2018) | 134.2 | 91.6 | 90.6 | 67.3 | ||
| Strange Brigade (2018) | 334 | 172.1 | 136.6 | 117.7 | 79.9 | 42.7 |
| Cyberpunk 2077 1.6 (2022) | 55.3 | 70 | 57.5 | 48 | 30 | 12.8 |
| Tiny Tina's Wonderlands (2022) | 98.1 | 92.5 | 74.3 | 58.6 | 49.8 | 39.2 |
| F1 22 (2022) | 155.1 | 148.5 | 123.5 | 39.2 | 10.6 | 4.7 |
| Returnal (2023) | 65 | 69 | 64 | 54 | 39 | 21 |
Emisje
System Noise - nie za głośny jak na swój rozmiar
Szum wentylatora podczas przeglądania stron internetowych lub strumieniowania wideo oscyluje wokół 24 dB(A) na tle cichego tła 23 dB(A) i jest prawie niesłyszalny. Przy większym obciążeniu, np. w grach, szum wentylatora wynosi od 40 do 45 dB(A), a więc jest cichszy, niż w przypadkuAsus Zenbook Pro 15 lubGigabyte Aero 15 pod obciążeniem. XPS 15 nie jest generalnie tak głośny jak inne wydajne 15-calowe laptopy multimedialne.
Hałas
| luz |
| 23.1 / 23.1 / 24.2 dB |
| obciążenie |
| 27.1 / 44.6 dB |
 | ||
30 dB cichy 40 dB(A) słyszalny 50 dB(A) irytujący |
||
min: | ||
| Dell XPS 15 9530 RTX 4070 GeForce RTX 4070 Laptop GPU, i7-13700H, SK hynix PC801 HFS001TEJ9X101N | Dell XPS 15 9520 RTX 3050 Ti GeForce RTX 3050 Ti Laptop GPU, i7-12700H, WDC PC SN810 512GB | Dell XPS 15 9500 Core i7 4K UHD GeForce GTX 1650 Ti Mobile, i7-10875H, SK Hynix PC611 512GB | Asus Zenbook Pro 15 OLED UM535Q GeForce RTX 3050 Ti Laptop GPU, R9 5900HX, WDC PC SN730 SDBPNTY-1T00 | MSI Prestige 15 A12UD-093 GeForce RTX 3050 Ti Laptop GPU, i7-1280P, Micron 3400 1TB MTFDKBA1T0TFH | Gigabyte Aero 15 OLED XD GeForce RTX 3070 Laptop GPU, i7-11800H, Samsung PM9A1 MZVL21T0HCLR | |
|---|---|---|---|---|---|---|
| Noise | 0% | -24% | -7% | -22% | -35% | |
| wyłączone / środowisko * (dB) | 23.1 | 22.8 1% | 28.4 -23% | 22.8 1% | 26 -13% | 25 -8% |
| Idle Minimum * (dB) | 23.1 | 22.9 1% | 28.4 -23% | 22.9 1% | 26 -13% | 30 -30% |
| Idle Average * (dB) | 23.1 | 22.9 1% | 28.4 -23% | 22.9 1% | 30.7 -33% | 32 -39% |
| Idle Maximum * (dB) | 24.2 | 22.9 5% | 28.4 -17% | 22.9 5% | 30.7 -27% | 35 -45% |
| Load Average * (dB) | 27.1 | 30.9 -14% | 46 -70% | 33.2 -23% | 41.9 -55% | 44 -62% |
| Witcher 3 ultra * (dB) | 40.1 | 37.8 6% | 42 -5% | 47.3 -18% | 51 -27% | |
| Load Maximum * (dB) | 44.6 | 44.7 -0% | 47.1 -6% | 52.8 -18% | 40.7 9% | 60 -35% |
* ... im mniej tym lepiej
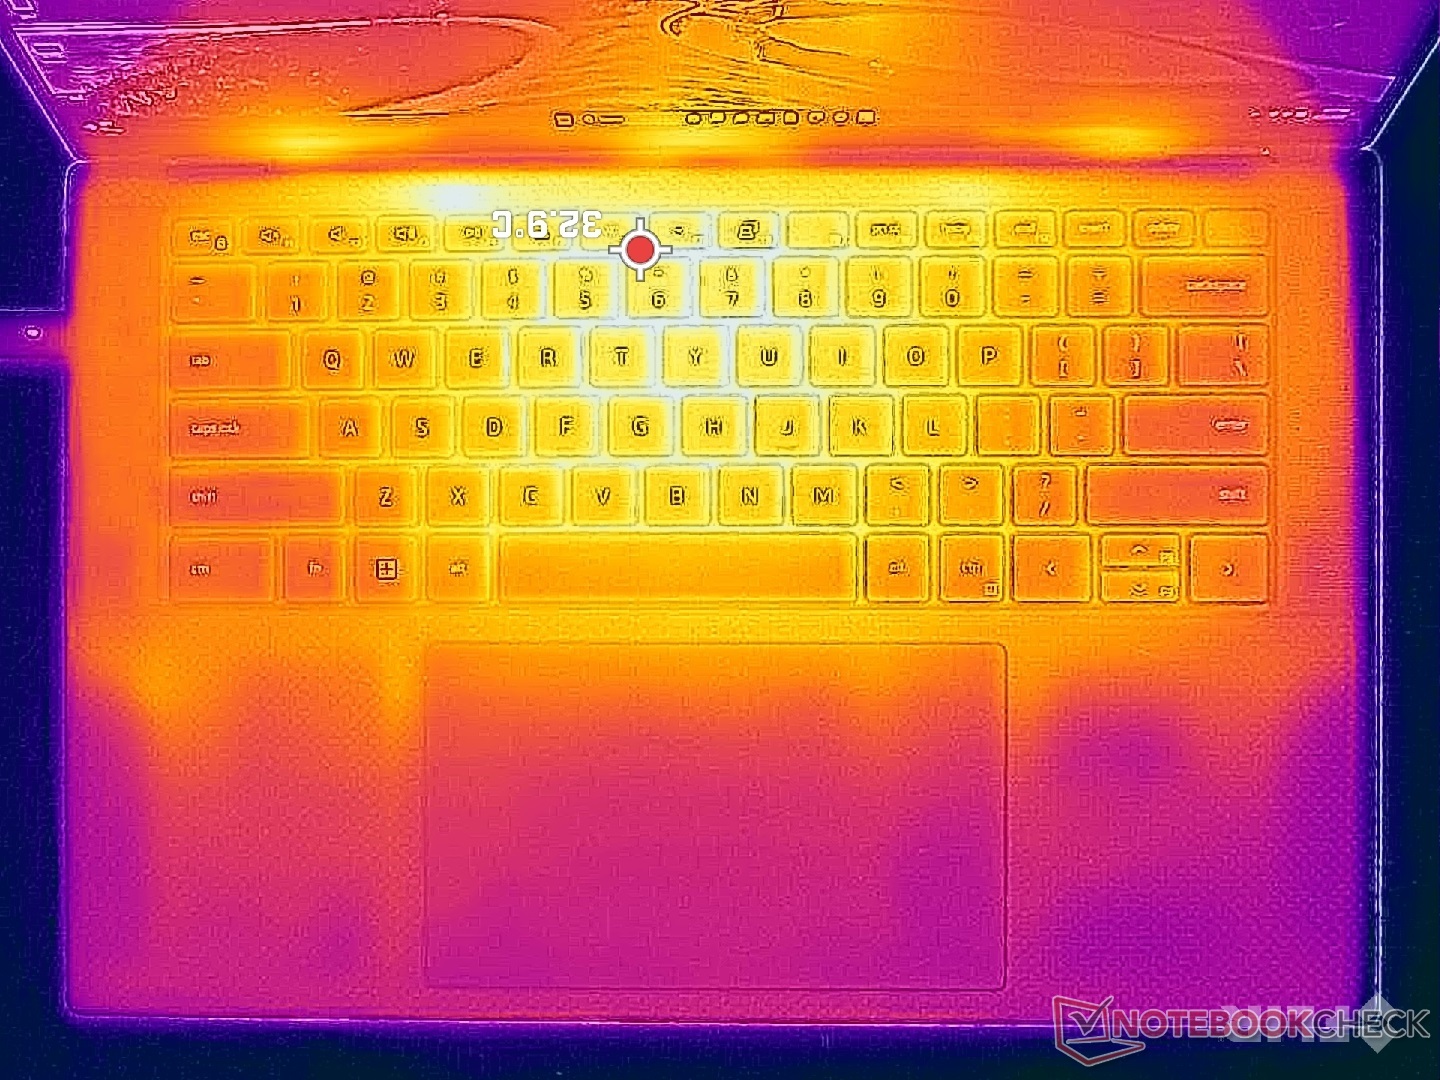
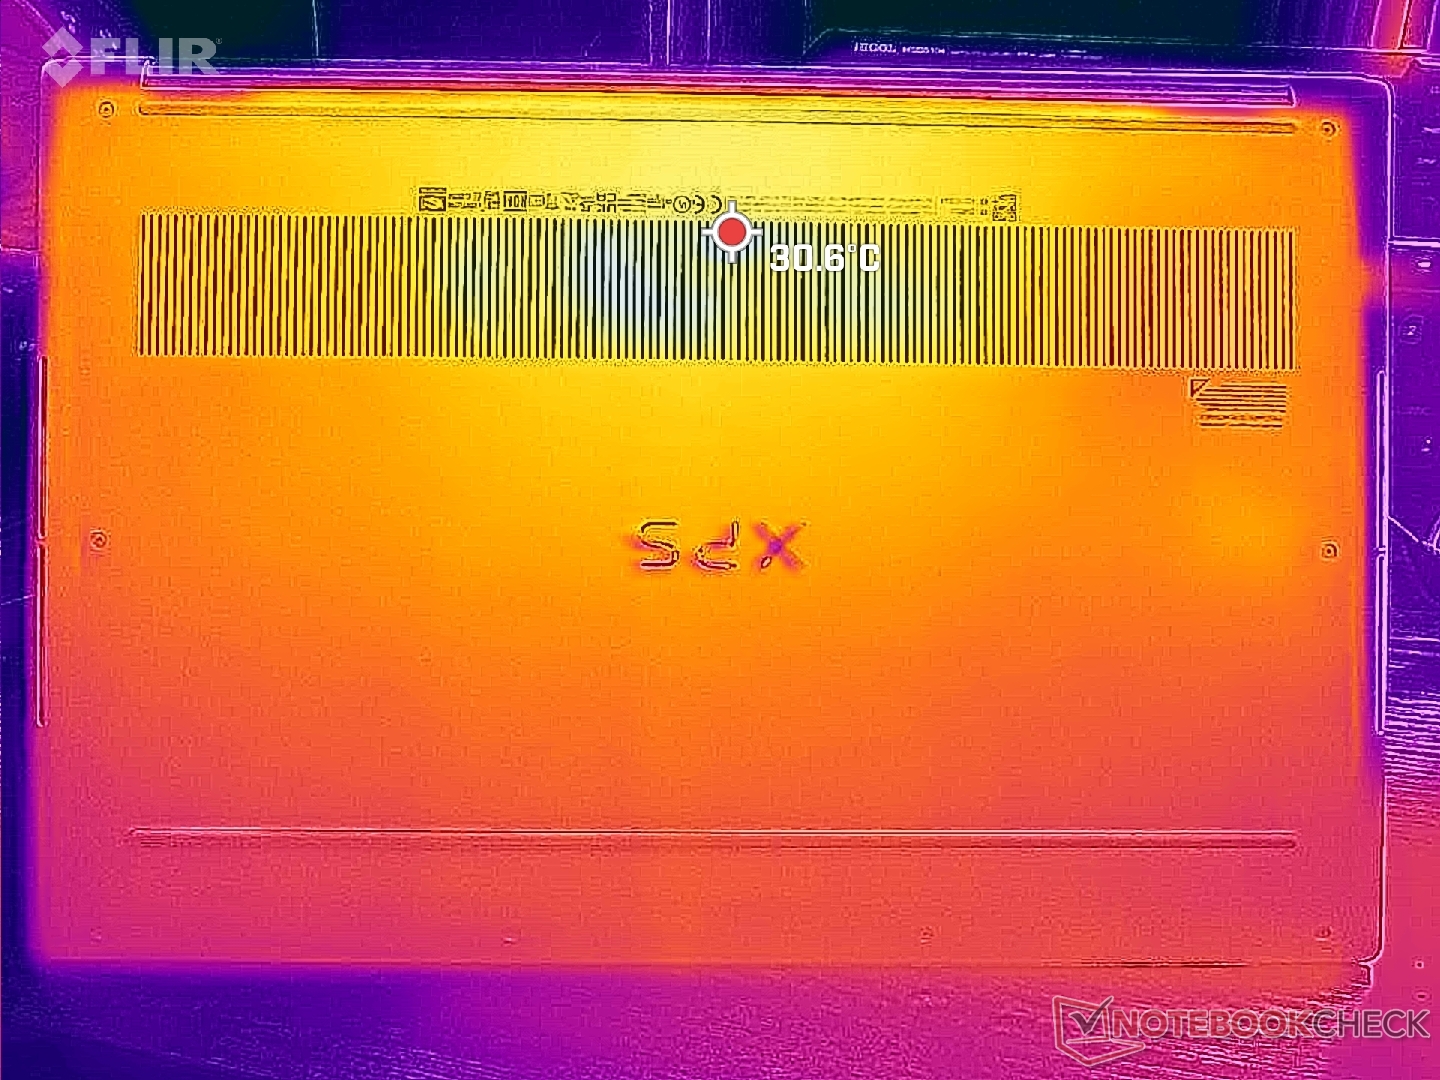
Temperatura
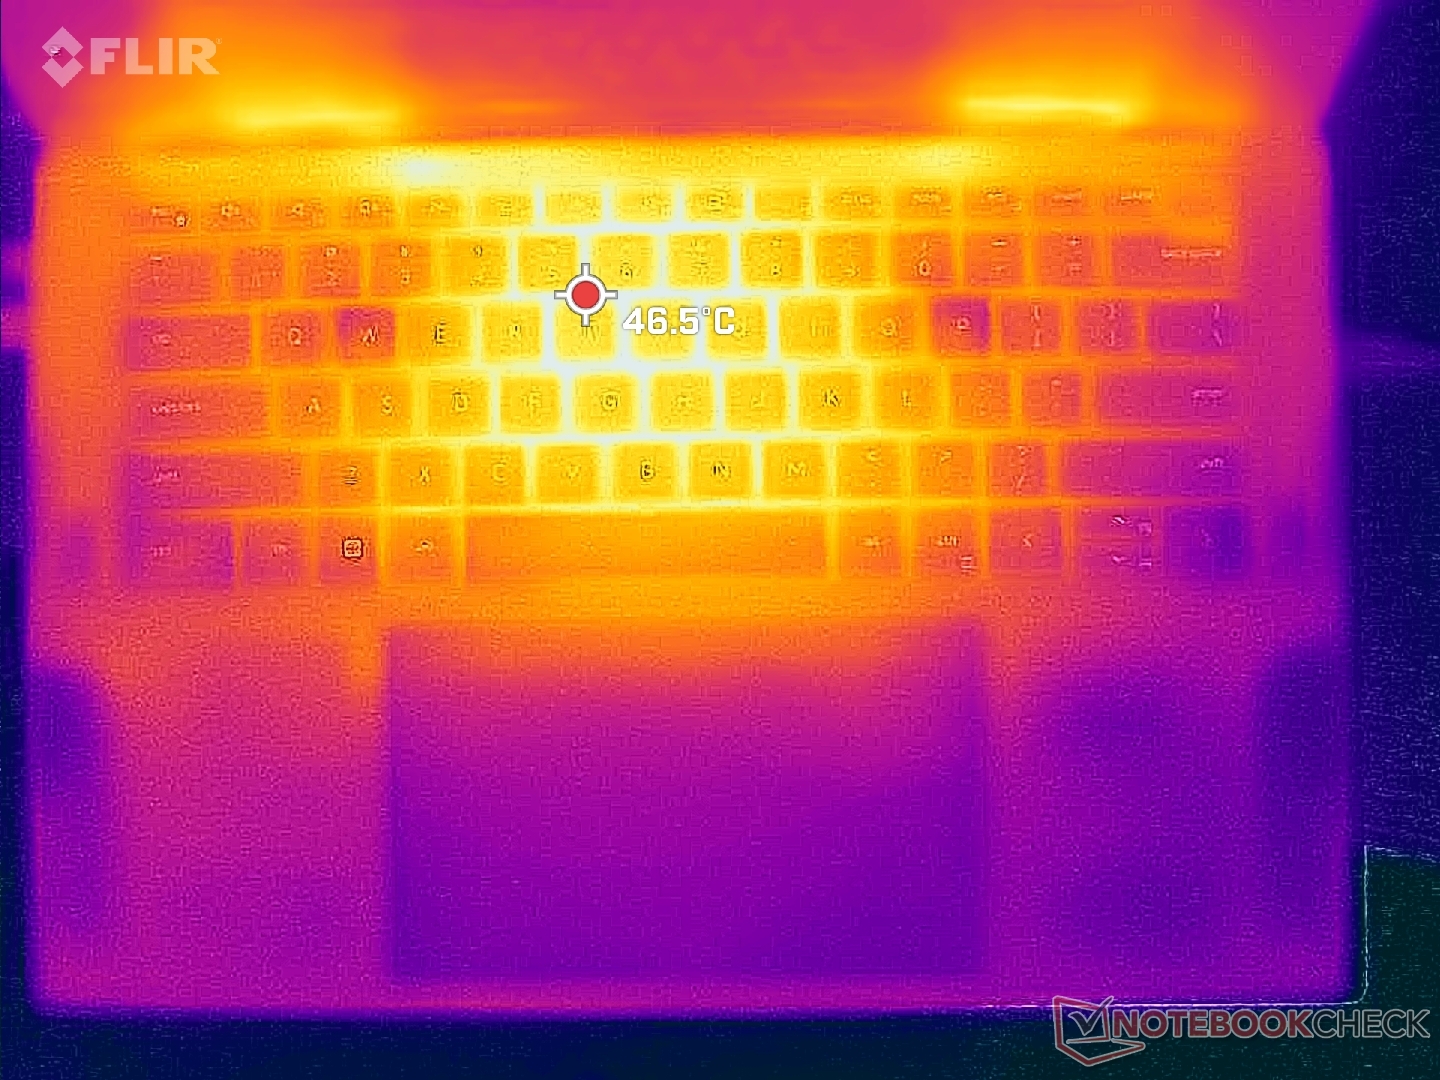
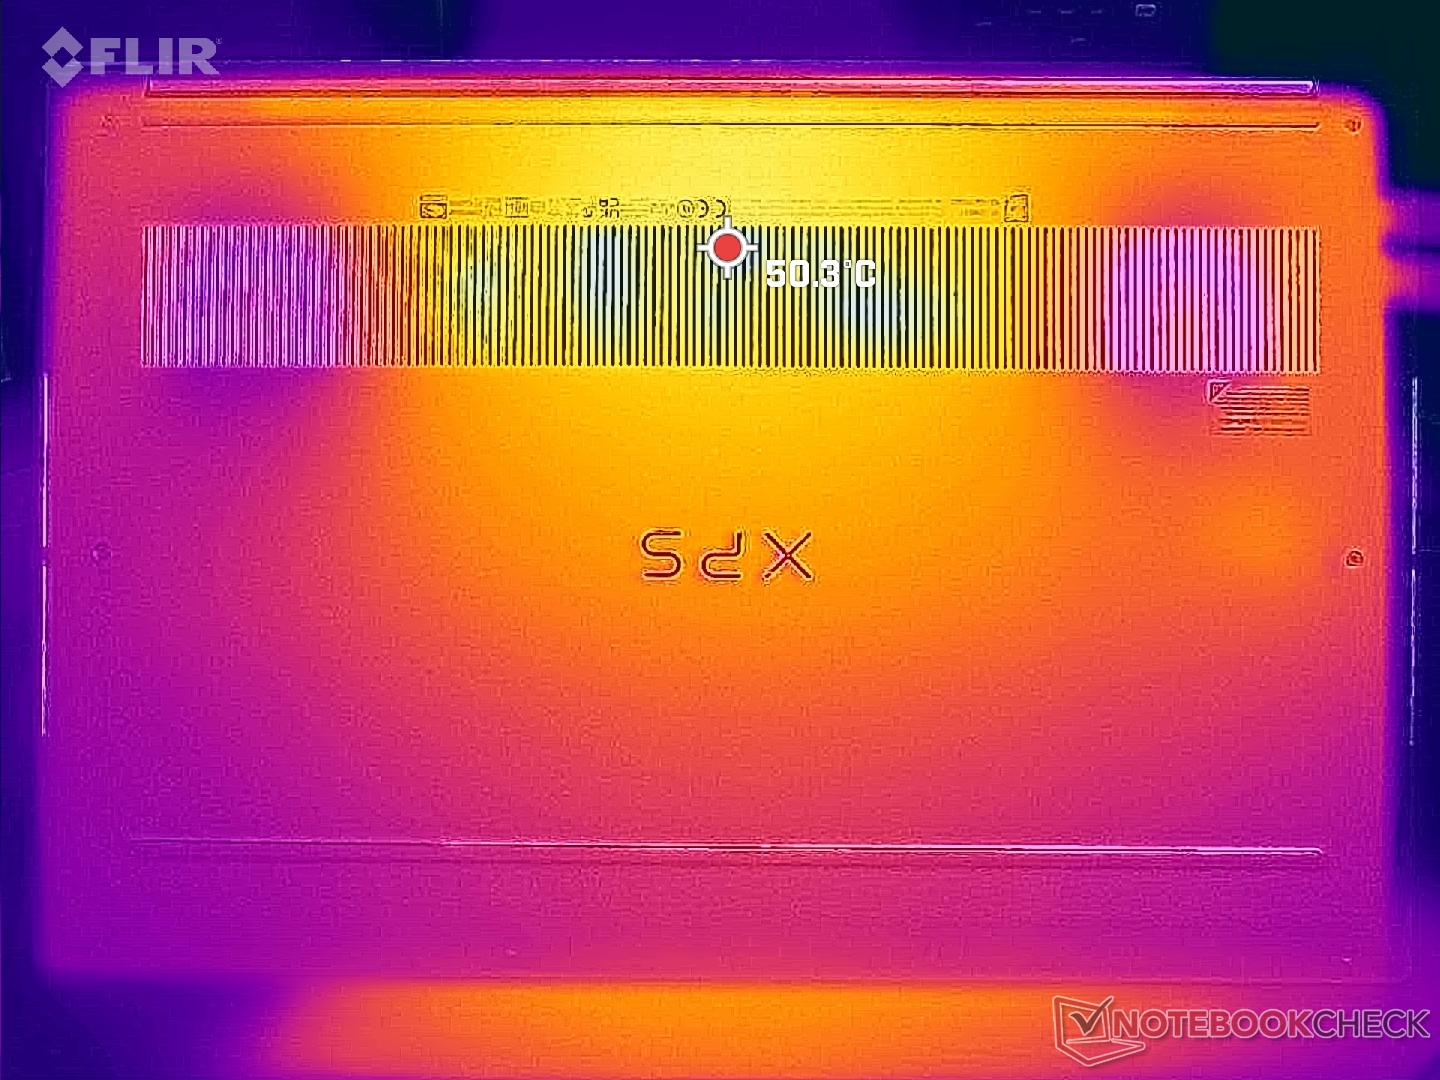
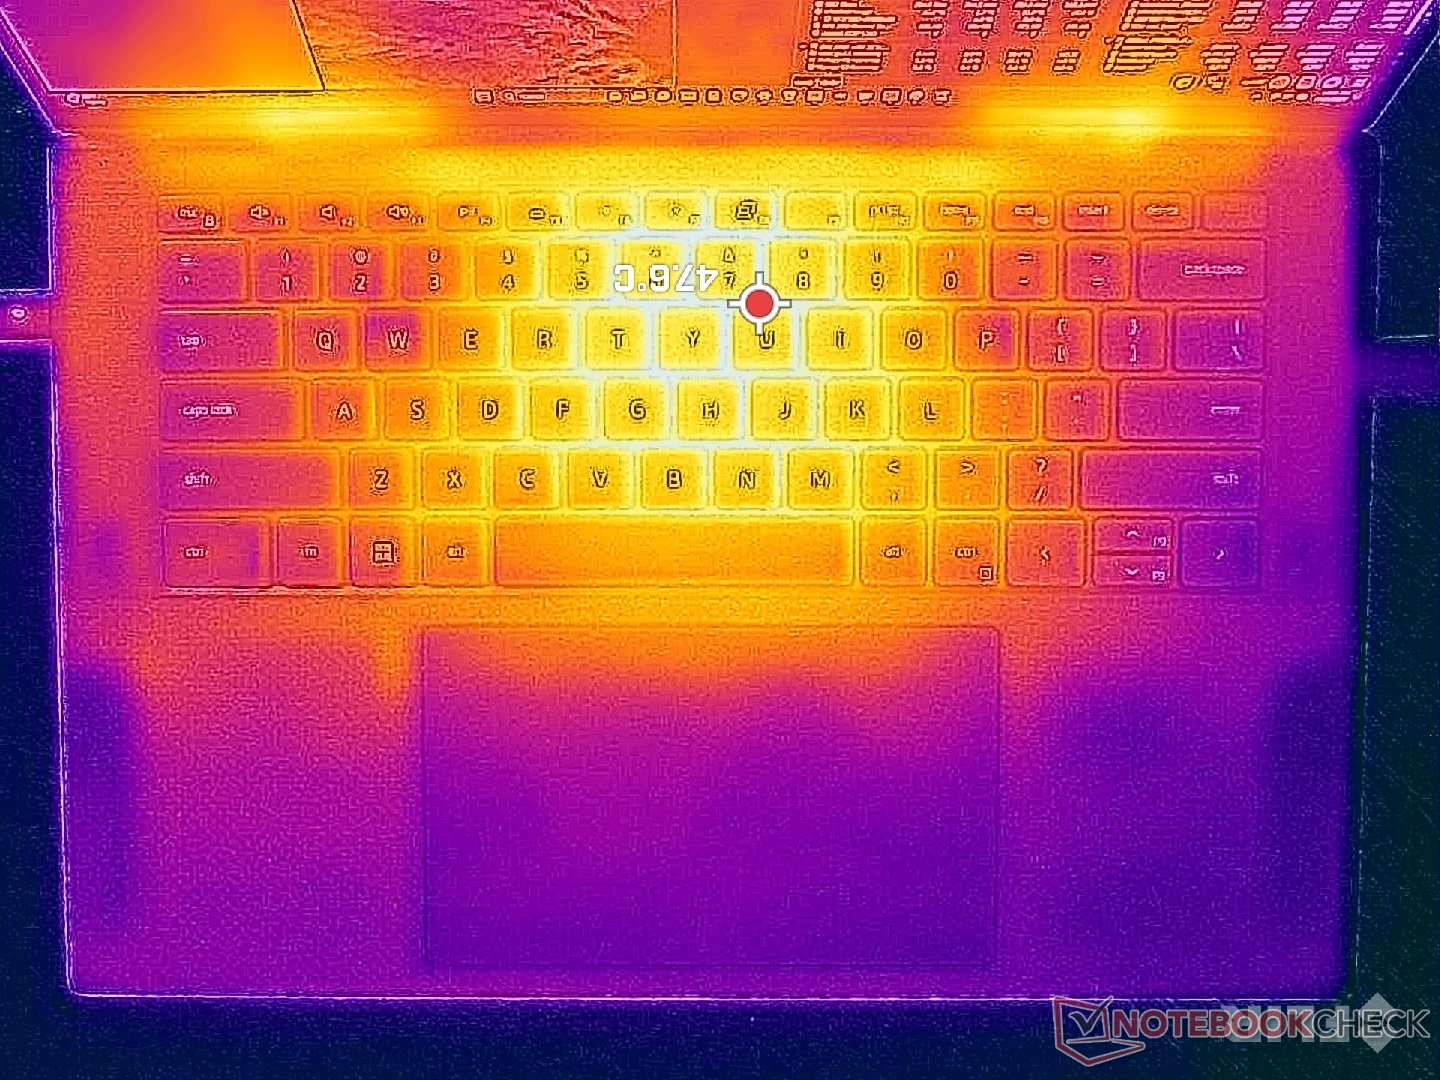
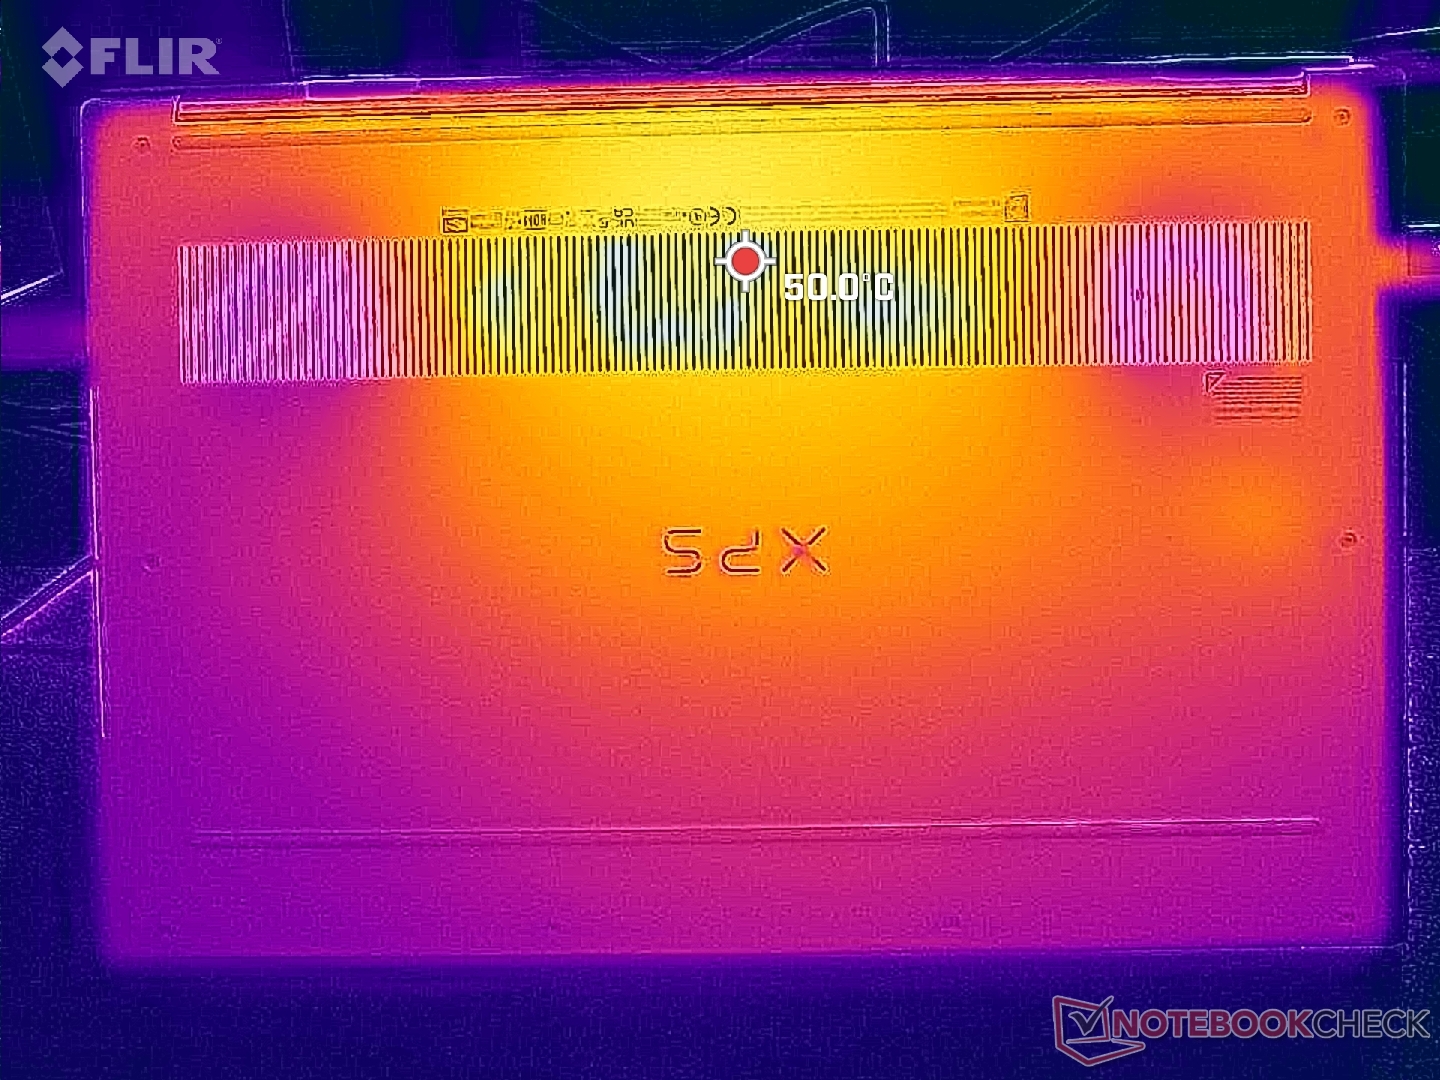
Temperatury powierzchni są stosunkowo ciepłe i wynoszą około 30 stopni Celsjusza nawet w stanie spoczynku na pulpicie, co wynika z dużej gęstości mocy cienkiej obudowy. Nie jest to jednak żadna różnica w porównaniu z zeszłorocznym modelem, gdyż koperta energetyczna pozostała mniej więcej taka sama. W przypadku wymagających obciążeń, takich jak gry, temperatura skóry może być nieprzyjemna i wynosić 45 stopni Celsjusza na spodzie obudowy.
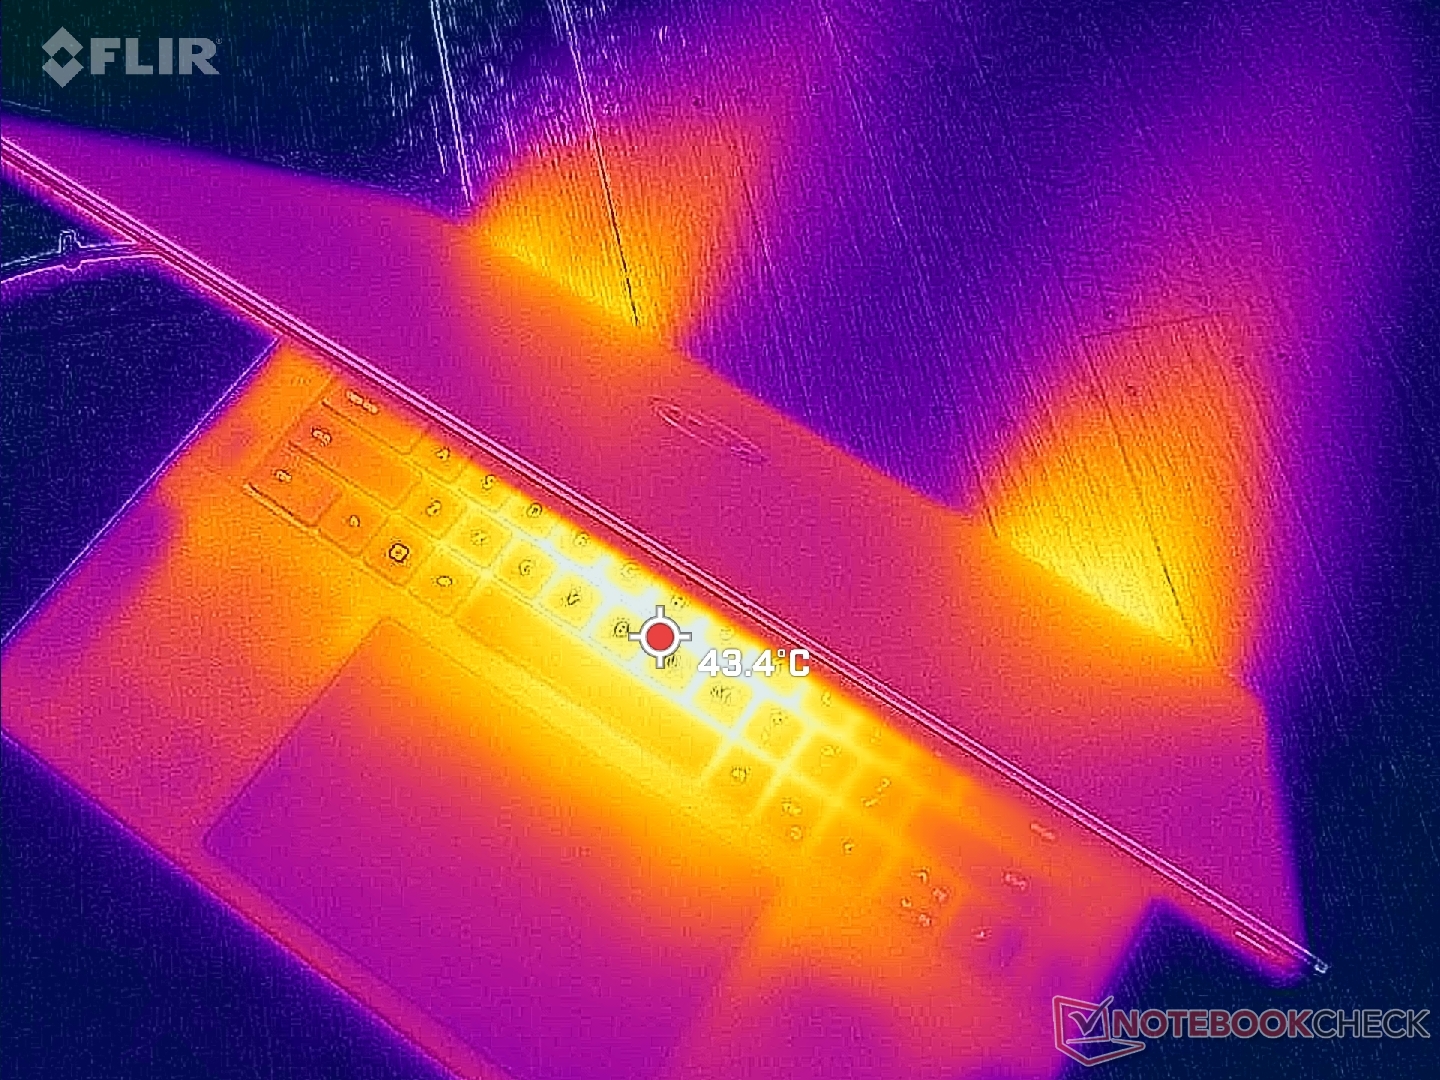
(-) Maksymalna temperatura w górnej części wynosi 45.6 °C / 114 F, w porównaniu do średniej 36.8 °C / 98 F , począwszy od 21 do 71 °C dla klasy Multimedia.
(±) Dno nagrzewa się maksymalnie do 42 °C / 108 F, w porównaniu do średniej 39.1 °C / 102 F
(+) W stanie bezczynności średnia temperatura górnej części wynosi 31.1 °C / 88 F, w porównaniu ze średnią temperaturą urządzenia wynoszącą 31.3 °C / ### class_avg_f### F.
(±) Podczas gry w Wiedźmina 3 średnia temperatura górnej części wynosi 37.2 °C / 99 F, w porównaniu do średniej temperatury urządzenia wynoszącej 31.3 °C / ## #class_avg_f### F.
(+) Podpórki pod nadgarstki i touchpad są chłodniejsze niż temperatura skóry i maksymalnie 30.6 °C / 87.1 F i dlatego są chłodne w dotyku.
(±) Średnia temperatura obszaru podparcia dłoni w podobnych urządzeniach wynosiła 28.7 °C / 83.7 F (-1.9 °C / -3.4 F).
| Dell XPS 15 9530 RTX 4070 Intel Core i7-13700H, NVIDIA GeForce RTX 4070 Laptop GPU | Dell XPS 15 9520 RTX 3050 Ti Intel Core i7-12700H, NVIDIA GeForce RTX 3050 Ti Laptop GPU | Dell XPS 15 9500 Core i7 4K UHD Intel Core i7-10875H, NVIDIA GeForce GTX 1650 Ti Mobile | Asus Zenbook Pro 15 OLED UM535Q AMD Ryzen 9 5900HX, NVIDIA GeForce RTX 3050 Ti Laptop GPU | MSI Prestige 15 A12UD-093 Intel Core i7-1280P, NVIDIA GeForce RTX 3050 Ti Laptop GPU | Gigabyte Aero 15 OLED XD Intel Core i7-11800H, NVIDIA GeForce RTX 3070 Laptop GPU | |
|---|---|---|---|---|---|---|
| Heat | -5% | -2% | -4% | -3% | -9% | |
| Maximum Upper Side * (°C) | 45.6 | 51.4 -13% | 44 4% | 36 21% | 49 -7% | 45 1% |
| Maximum Bottom * (°C) | 42 | 51 -21% | 48.8 -16% | 47.2 -12% | 52.6 -25% | 54 -29% |
| Idle Upper Side * (°C) | 34.4 | 30 13% | 33 4% | 37 -8% | 29.7 14% | 34 1% |
| Idle Bottom * (°C) | 33.2 | 33 1% | 32.4 2% | 39.2 -18% | 30.7 8% | 36 -8% |
* ... im mniej tym lepiej
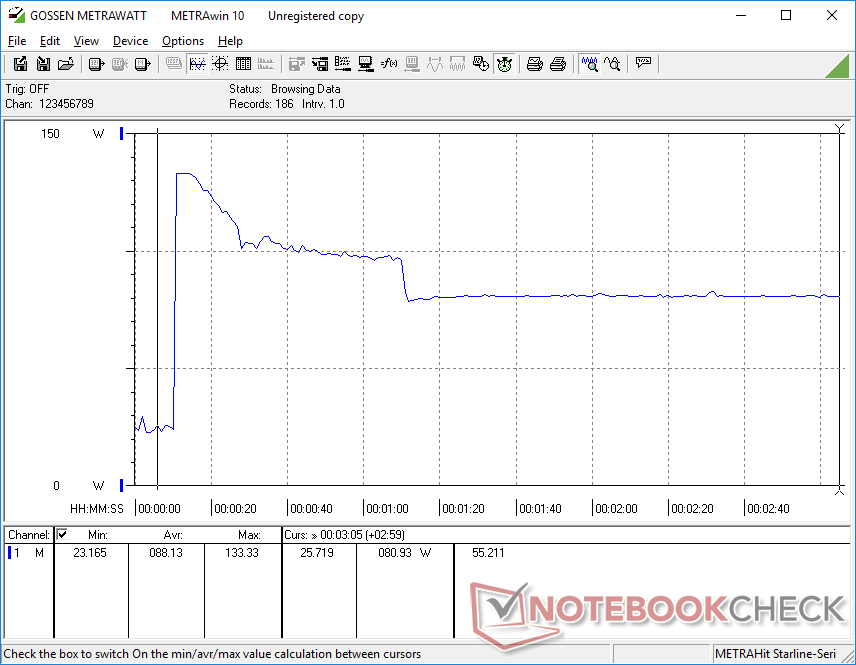
Stress Test - wysoka temperatura procesora
Procesor podniósłby się do 3,7 GHz i 96 W tylko na sekundę lub dwie podczas inicjowania stresu Prime95. Następnie spadał do zaledwie 2,7 GHz i 55 W z powodu bardzo wysokiej temperatury rdzenia, wynoszącej od 88 do 100 C, kiedy procesor jest w pełni obciążony. Dla porównania, powtarzając ten sam test na zasilanym przez AMD Asus Zenbook Pro 15 UM535Q uzyskałby chłodniejszą temperaturę rdzenia, wynoszącą zaledwie 76 C. Wyższa od przeciętnej temperatura rdzenia w systemie Della nie jest zaskakująca, gdyż jest to częsta cecha serii XPS 15. Aktualizacja do konfiguracji z Core i9 może więc przynieść co najwyżej niewielkie korzyści, gdyż nasza konfiguracja z Core i7 zbliża się już do pułapu 100 C.
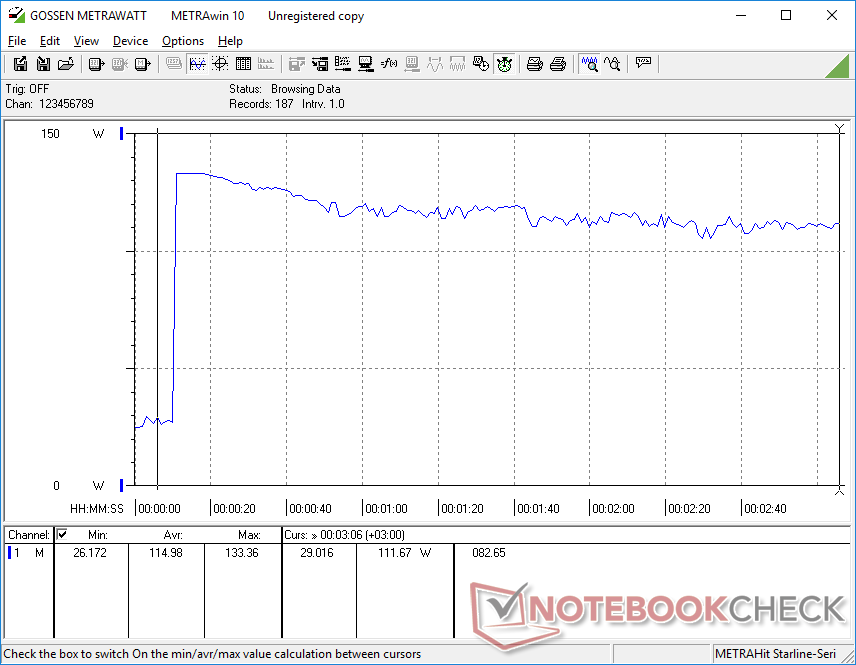
Podczas pracy Witcher 3 w celu odwzorowania typowego obciążenia w grach, GPU ustabilizowało się przy 1590 MHz rdzenia, 1375 MHz pamięci, 70 C i 43 W wobec docelowych 50 W. Powtarzając ten sam test na większymUniwill GM6PX7X IDX z mocniejszym 130 W RTX 4070 dałoby stabilne taktowanie rdzenia, taktowanie pamięci, temperaturę i moc GPU na poziomie odpowiednio 2370 MHz, 2125 MHz, 73 C i 100 W. Różnica w wydajności pomiędzy 50 W a 100+ W RTX 4070 jest w tym przykładzie bardzo wyraźna.
Co zaskakujące, praca na zasilaniu akumulatorowym nie wpływa na wydajność, co jest rzadkością w przypadku każdego laptopa GeForce zasilanego RTX. Test 3DMark 11 na akumulatorze zwróciłby wyniki Physics i Graphic w wysokości odpowiednio 20751 i 24569 pkt. wobec 18112 i 24229 pkt. na zasilaniu sieciowym.
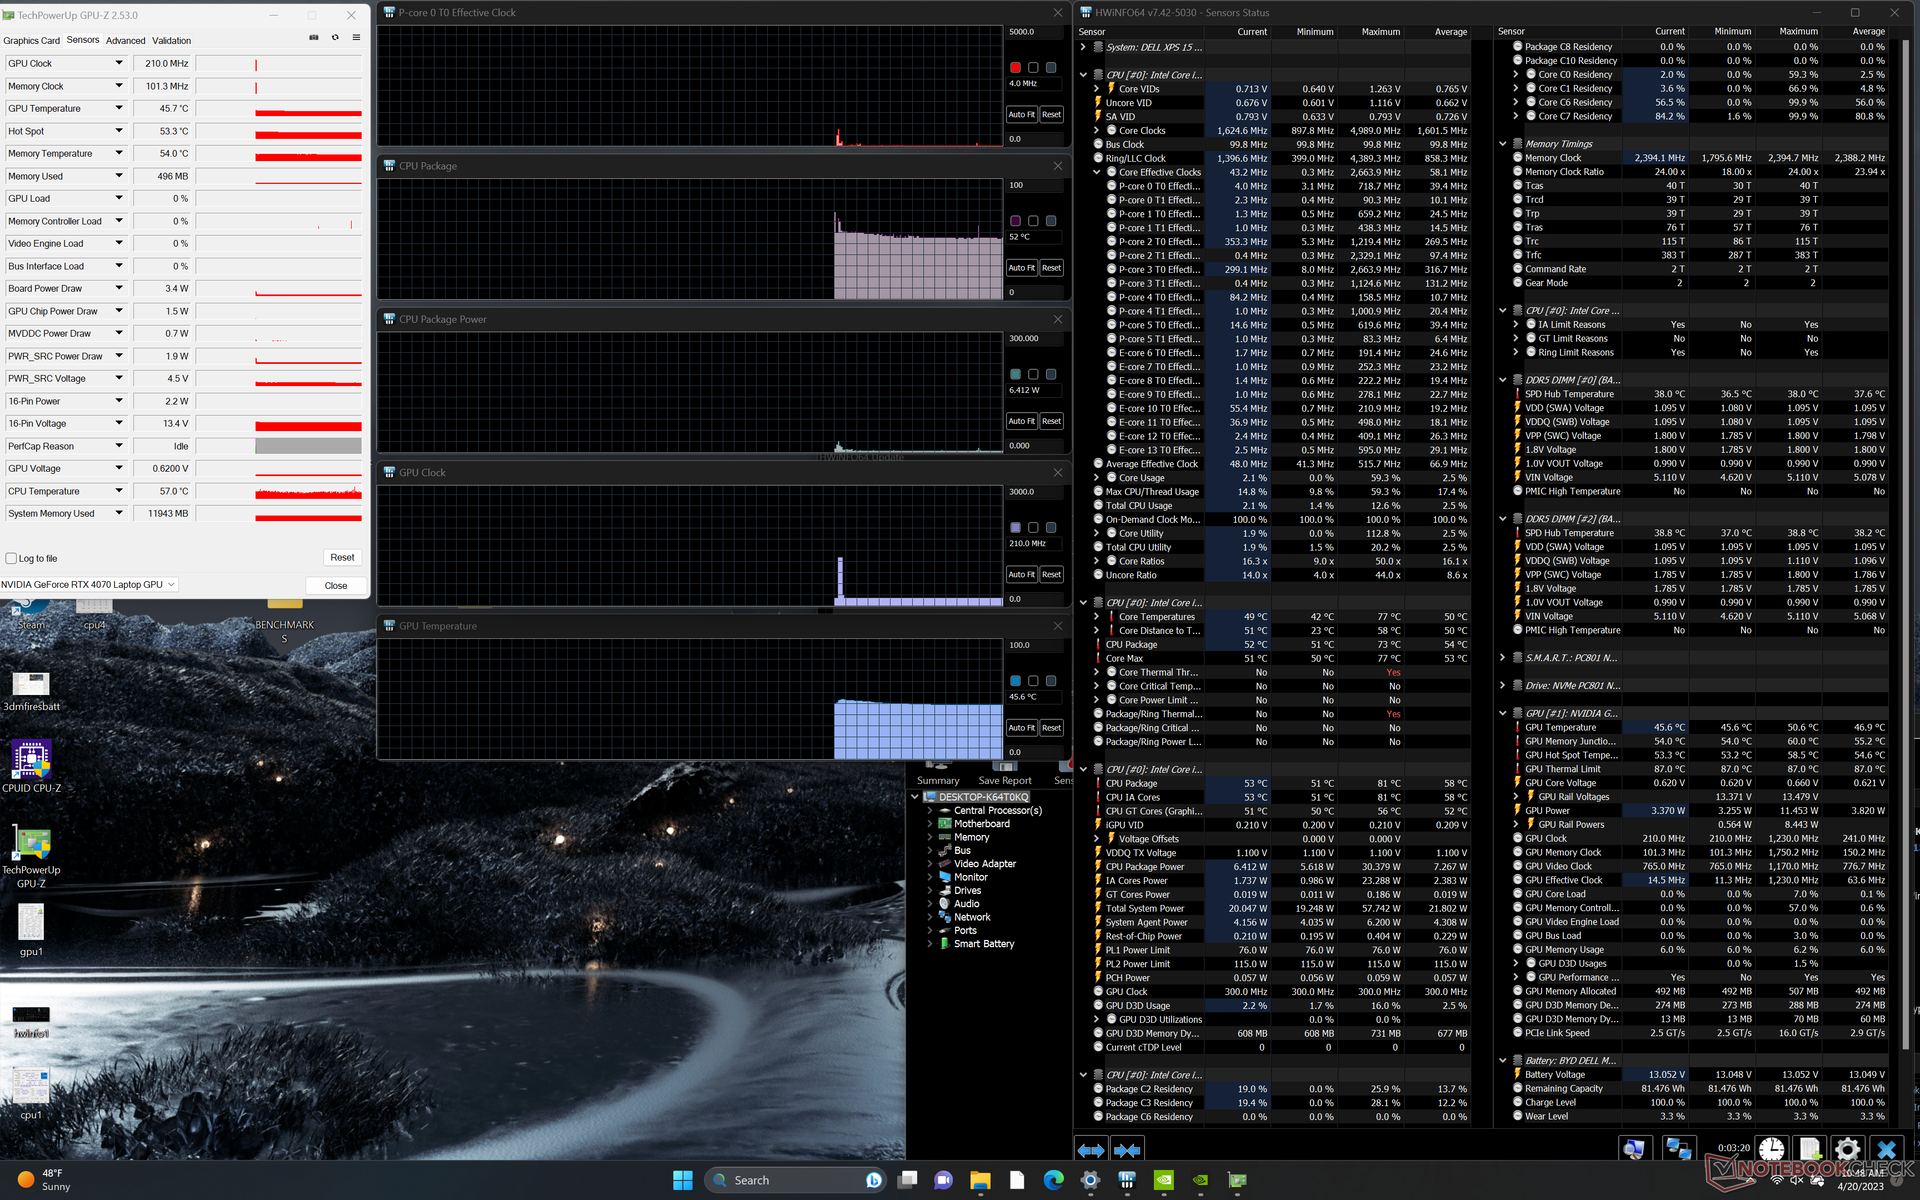
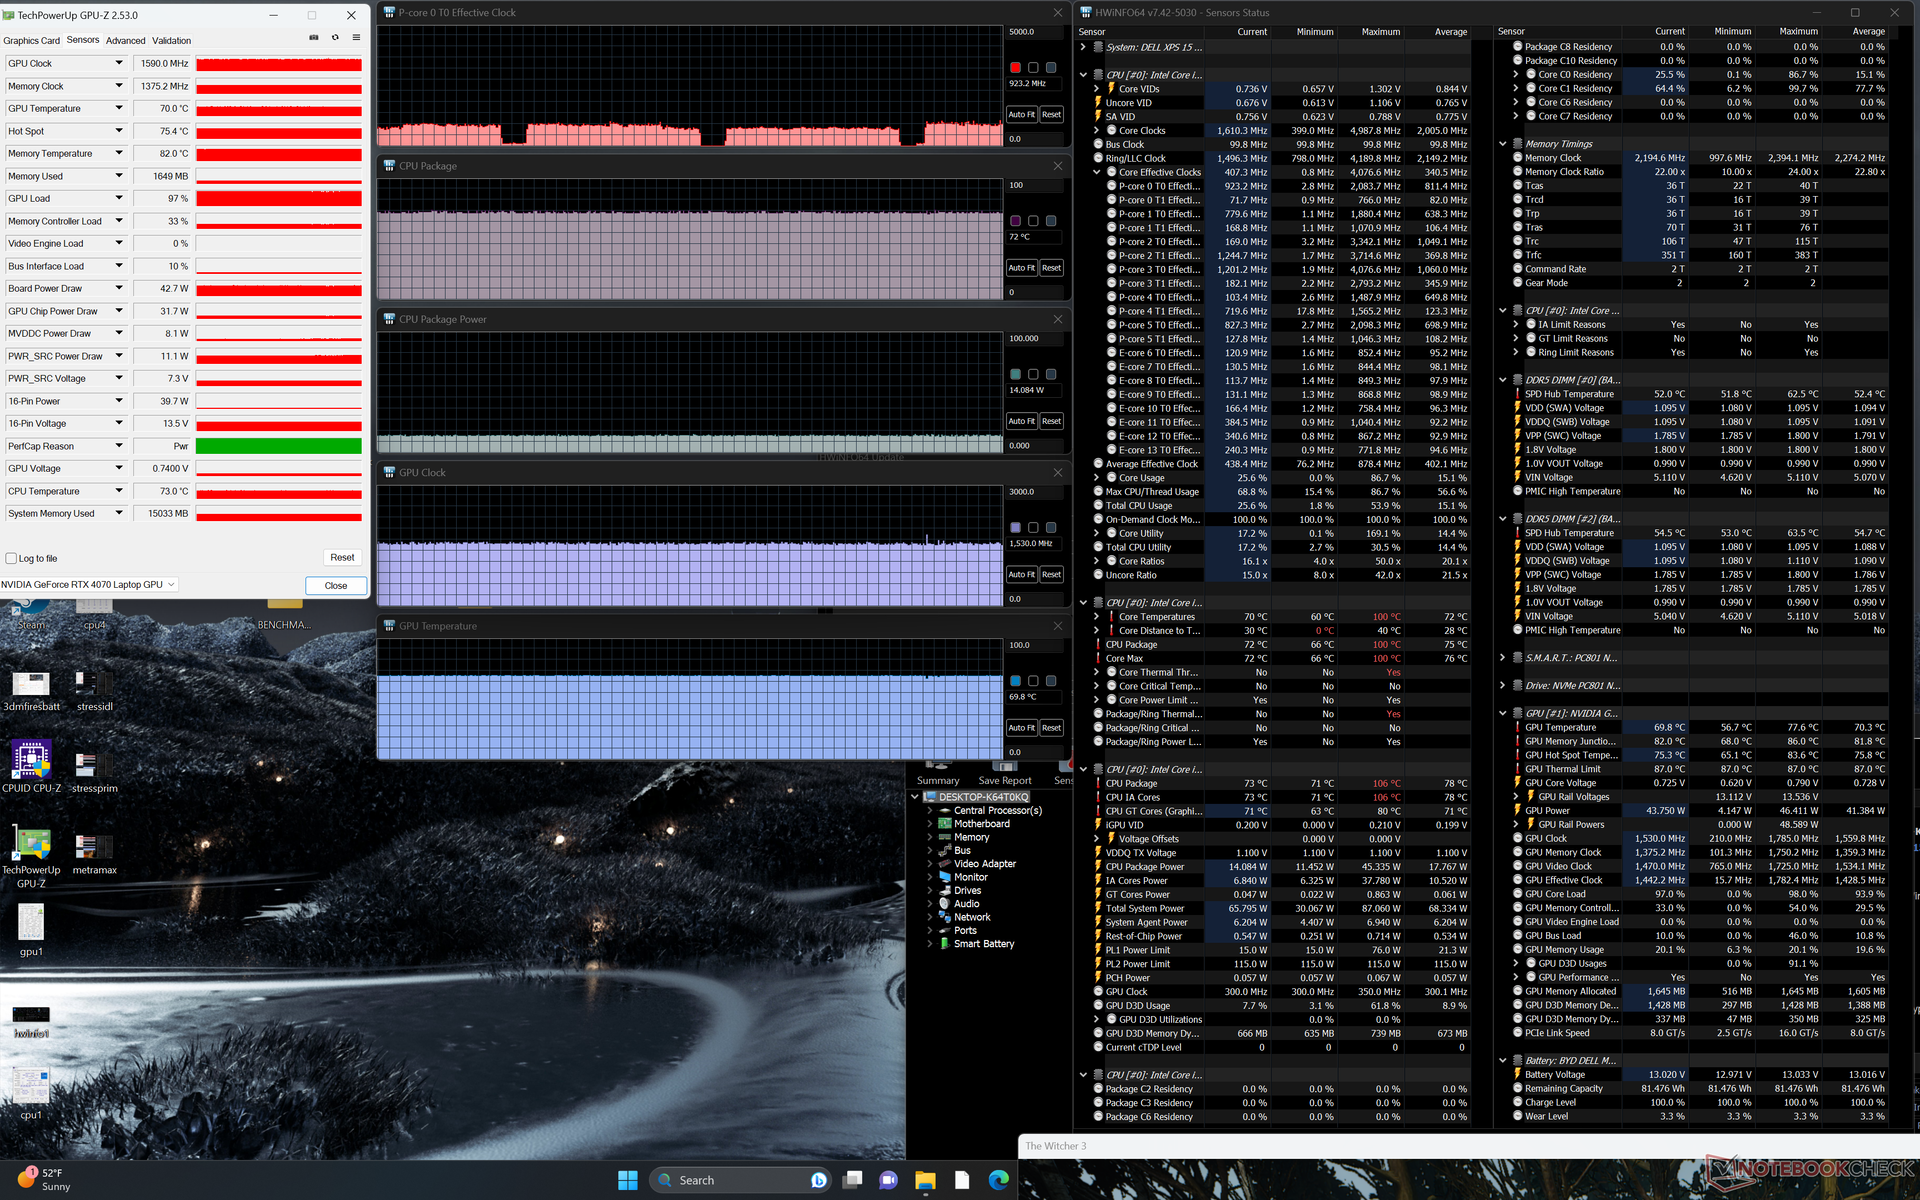
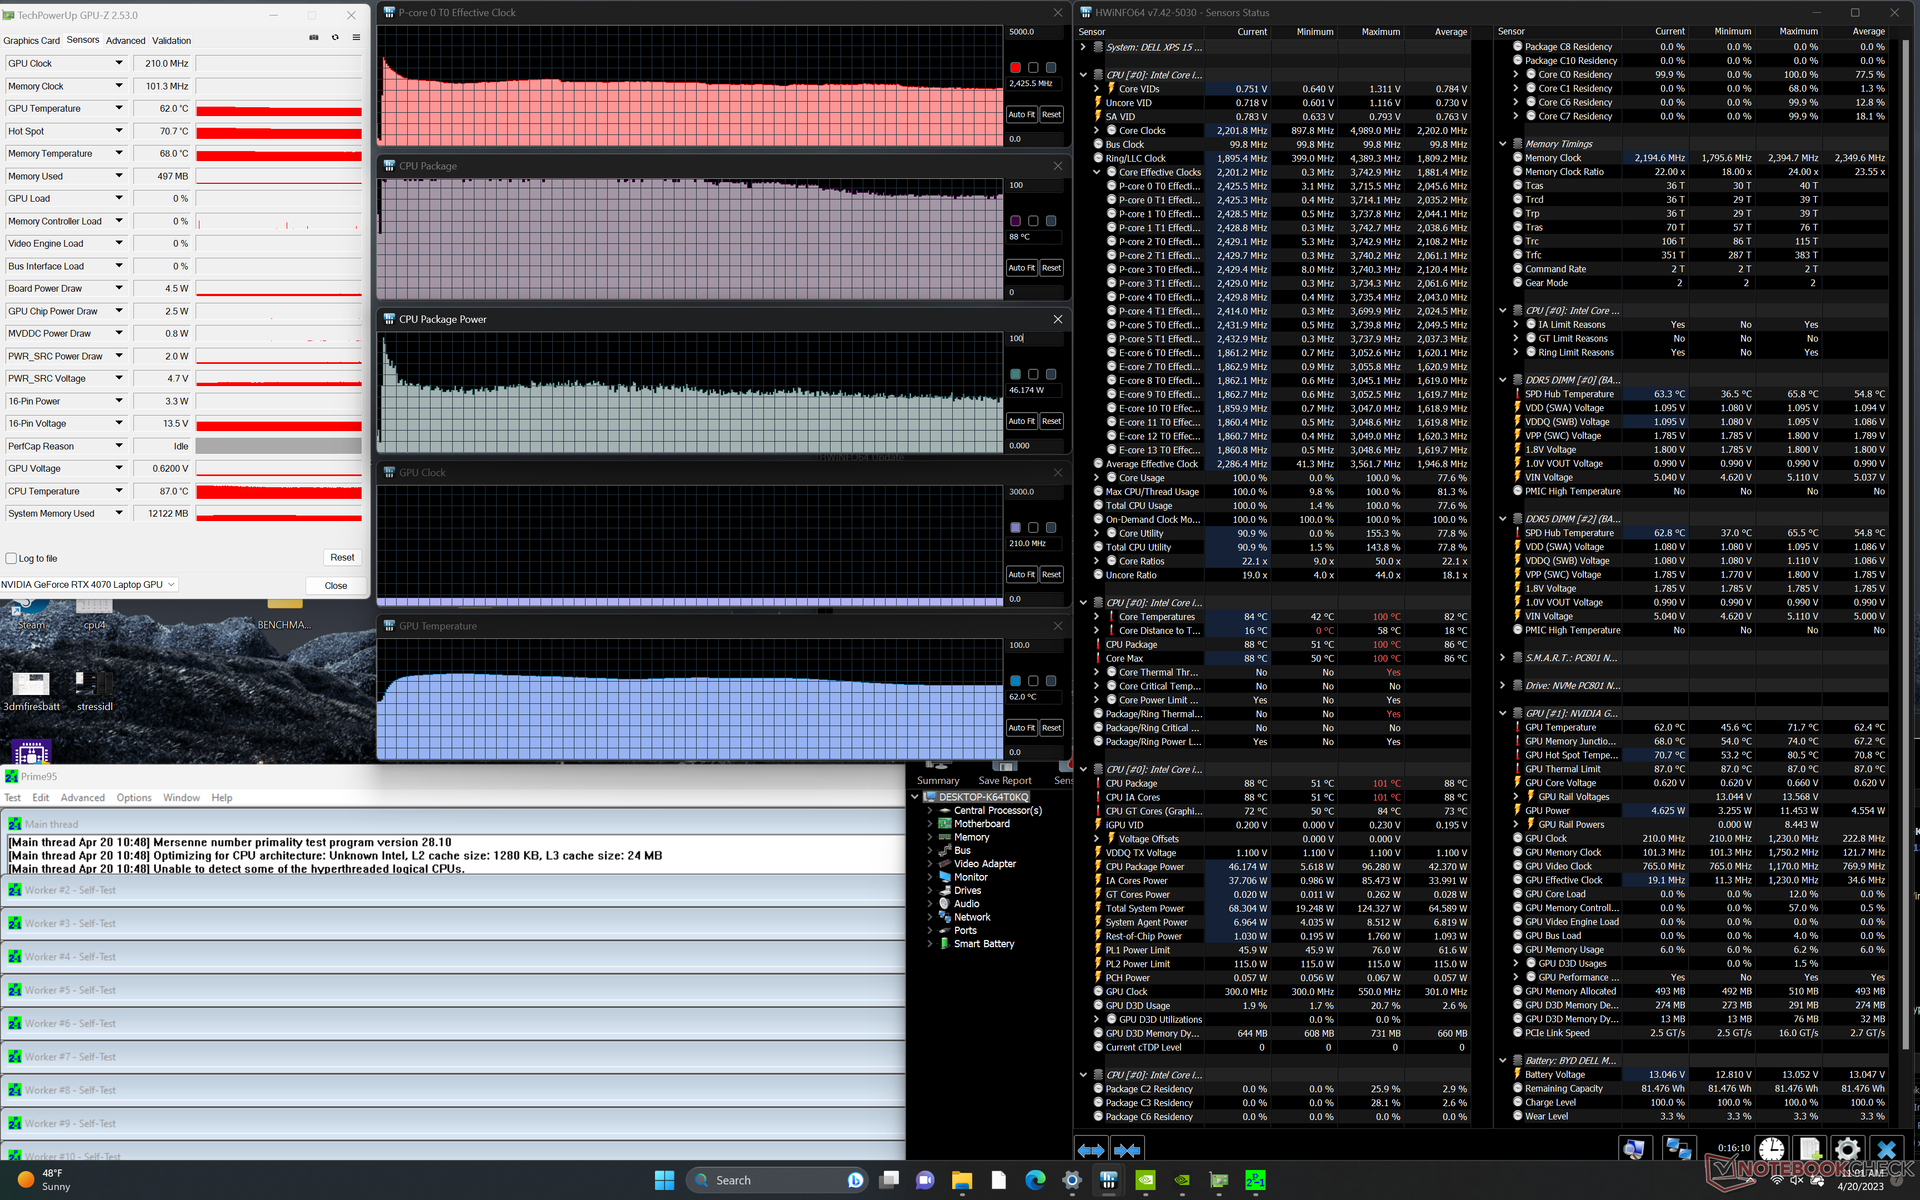
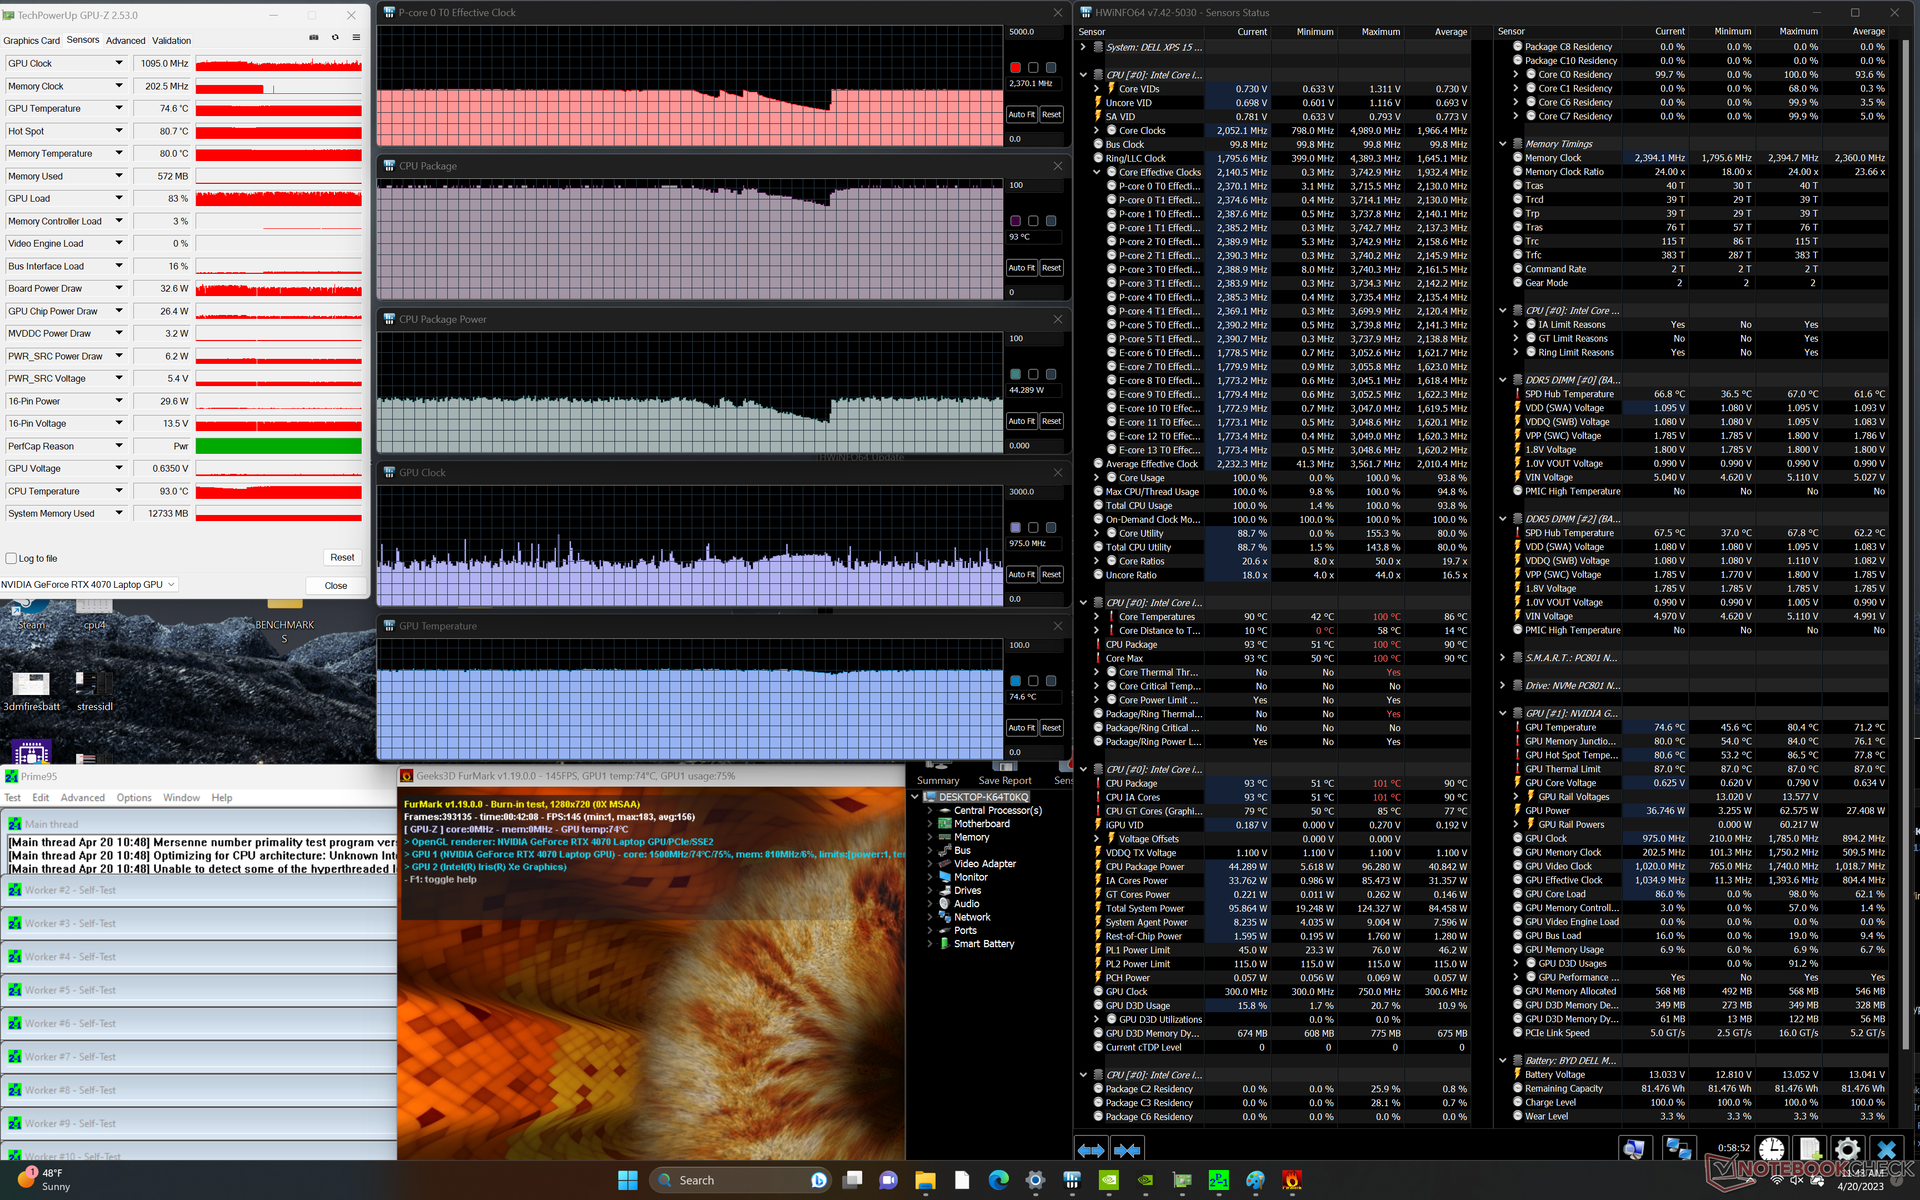
| ZegarCPU (GHz) | Zegar GPU (MHz) | Średnia temperatura CPU (°C) | Średnia temperatura GPU (°C) | |
| System w stanie bezczynności | -- | -- | 52 | 46 |
| Prime95 Stress | 2.4 | -- | 88 | 62 |
| Prime95 + FurMark Stress | 2,4 | ~1095 | 93 | 75 |
| Witcher 3 Stress | ~0,9 | 1590 | 72 | 70 |
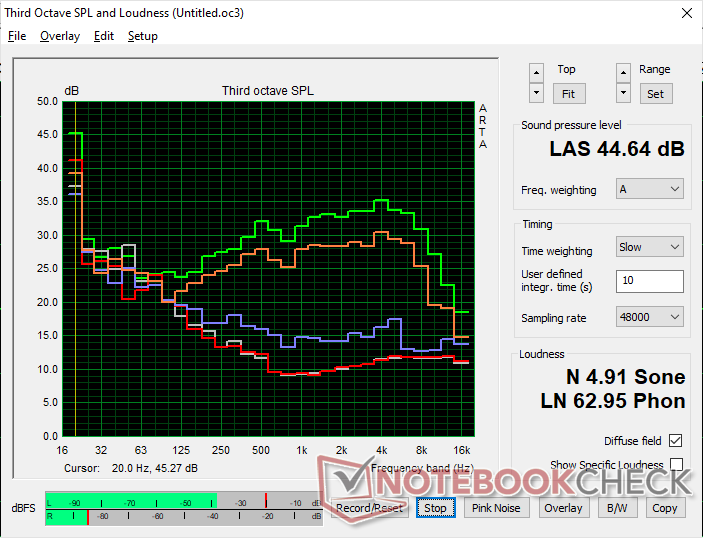
Mówcy
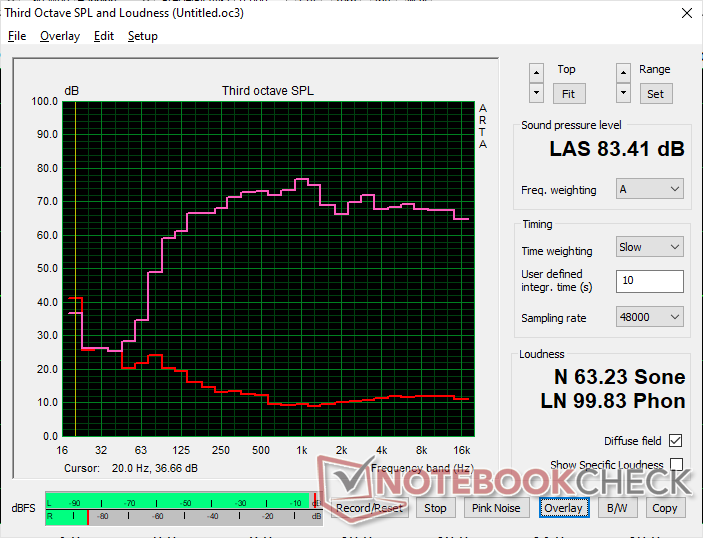
Dell XPS 15 9530 RTX 4070 analiza dźwięku
(+) | głośniki mogą odtwarzać stosunkowo głośno (83.4 dB)
Bas 100 - 315 Hz
(+) | dobry bas - tylko 3.9% od mediany
(+) | bas jest liniowy (6.8% delta do poprzedniej częstotliwości)
Średnie 400 - 2000 Hz
(+) | zbalansowane środki średnie - tylko 4.4% od mediany
(+) | średnie są liniowe (4.1% delta do poprzedniej częstotliwości)
Wysokie 2–16 kHz
(+) | zrównoważone maksima - tylko 1.1% od mediany
(+) | wzloty są liniowe (3.3% delta do poprzedniej częstotliwości)
Ogólnie 100 - 16.000 Hz
(+) | ogólny dźwięk jest liniowy (6.4% różnicy w stosunku do mediany)
W porównaniu do tej samej klasy
» 4% wszystkich testowanych urządzeń w tej klasie było lepszych, 1% podobnych, 95% gorszych
» Najlepszy miał deltę 5%, średnia wynosiła ###średnia###%, najgorsza wynosiła 45%
W porównaniu do wszystkich testowanych urządzeń
» 1% wszystkich testowanych urządzeń było lepszych, 0% podobnych, 99% gorszych
» Najlepszy miał deltę 4%, średnia wynosiła ###średnia###%, najgorsza wynosiła 134%
Apple MacBook Pro 16 2021 M1 Pro analiza dźwięku
(+) | głośniki mogą odtwarzać stosunkowo głośno (84.7 dB)
Bas 100 - 315 Hz
(+) | dobry bas - tylko 3.8% od mediany
(+) | bas jest liniowy (5.2% delta do poprzedniej częstotliwości)
Średnie 400 - 2000 Hz
(+) | zbalansowane środki średnie - tylko 1.3% od mediany
(+) | średnie są liniowe (2.1% delta do poprzedniej częstotliwości)
Wysokie 2–16 kHz
(+) | zrównoważone maksima - tylko 1.9% od mediany
(+) | wzloty są liniowe (2.7% delta do poprzedniej częstotliwości)
Ogólnie 100 - 16.000 Hz
(+) | ogólny dźwięk jest liniowy (4.6% różnicy w stosunku do mediany)
W porównaniu do tej samej klasy
» 0% wszystkich testowanych urządzeń w tej klasie było lepszych, 0% podobnych, 100% gorszych
» Najlepszy miał deltę 5%, średnia wynosiła ###średnia###%, najgorsza wynosiła 45%
W porównaniu do wszystkich testowanych urządzeń
» 0% wszystkich testowanych urządzeń było lepszych, 0% podobnych, 100% gorszych
» Najlepszy miał deltę 4%, średnia wynosiła ###średnia###%, najgorsza wynosiła 134%
Zarządzanie energią - Core H i GeForce RTX na USB-C
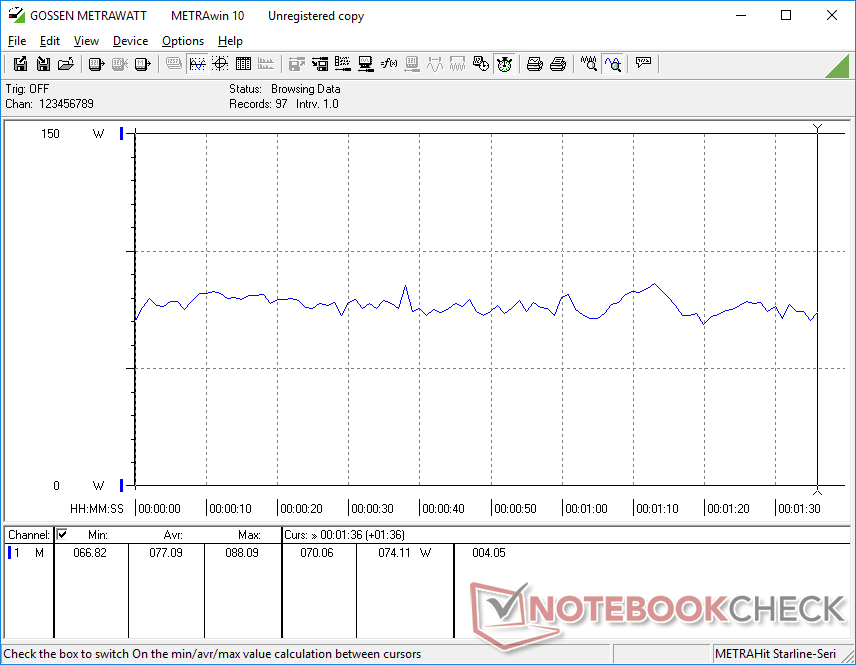
Pobór mocy
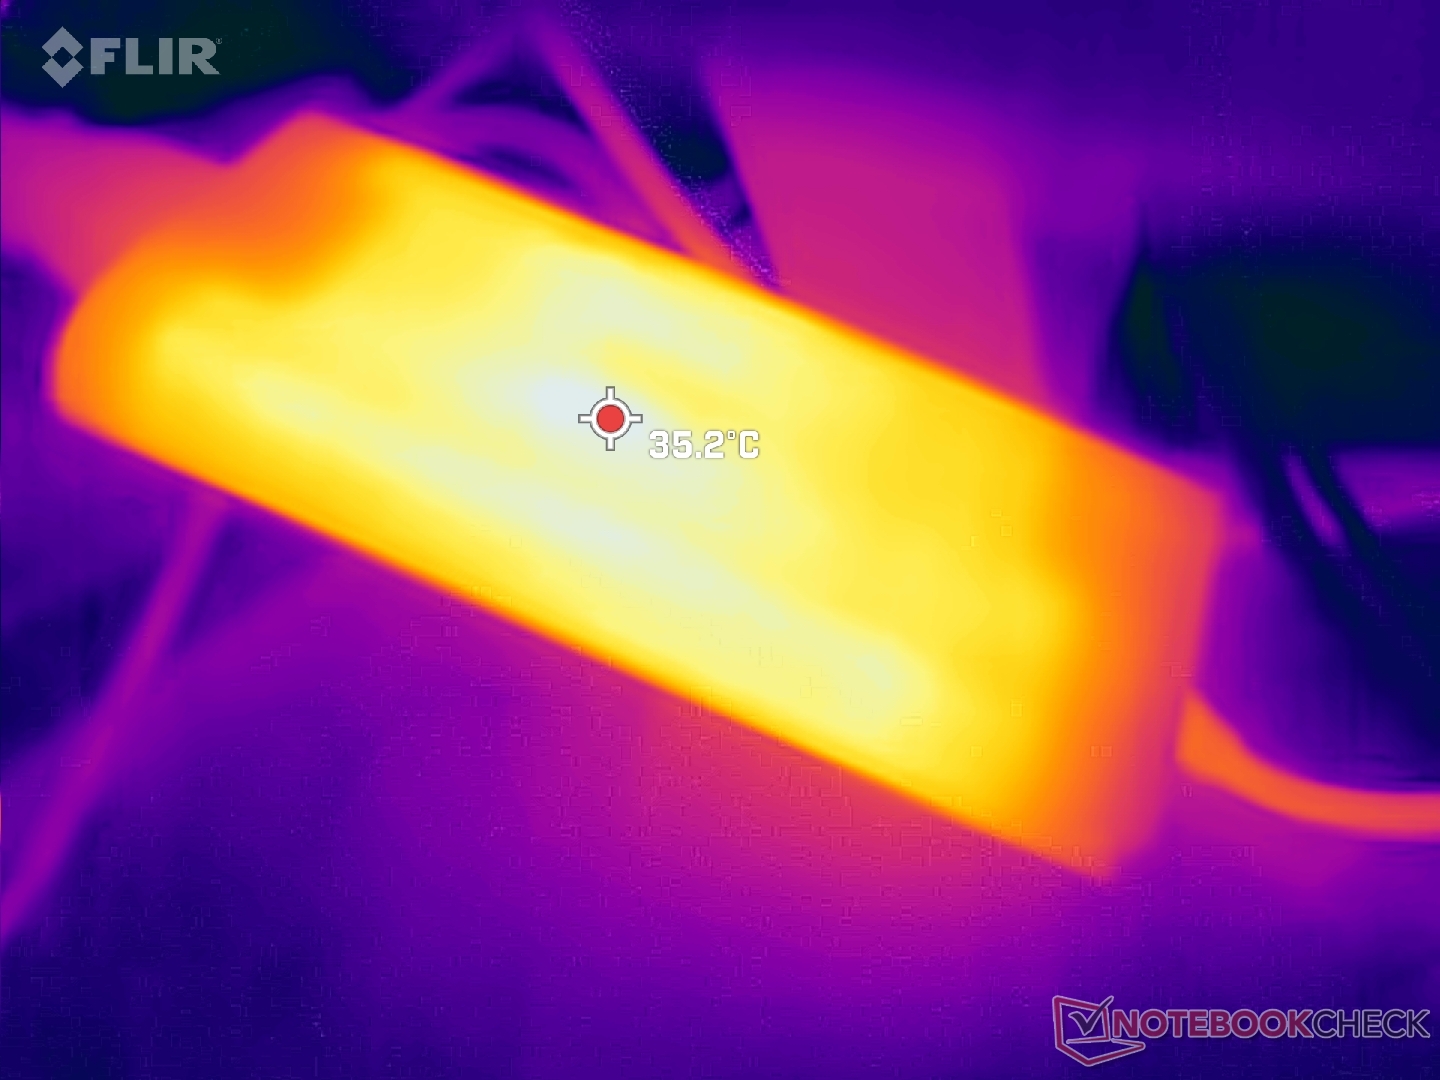
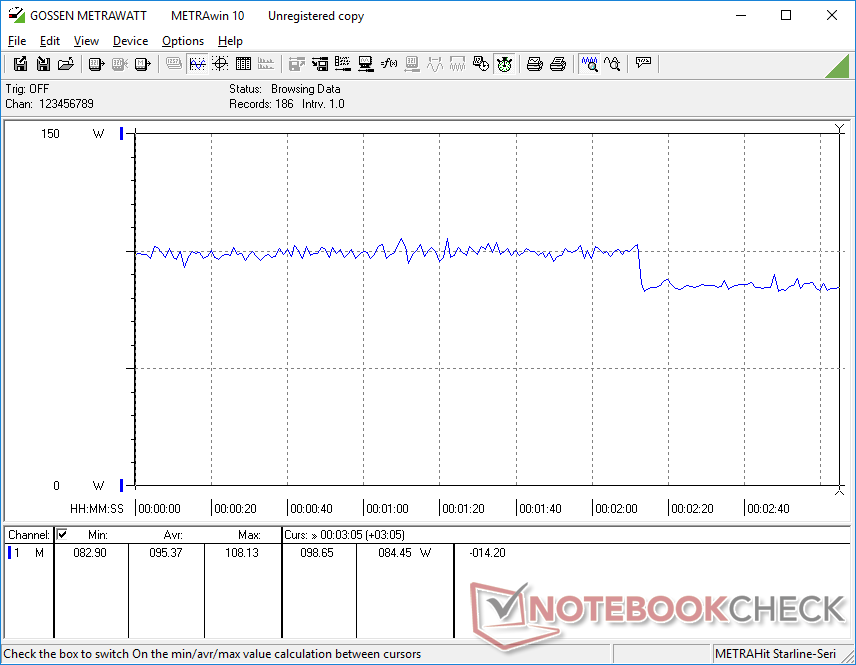
Pobór mocy jest generalnie wyższy w porównaniu z ubiegłorocznym modelem. Na przykład podczas pracy w trybie jałowym na najniższych ustawieniach XPS 15 9530 pobierał około 20 W, podczas gdy w starszym modelu XPS 15 9520 było to zaledwie 5-6 W. W grach zużycie było o około 25 procent wyższe, co oznacza, że dodatkowa wydajność w stosunku do starszego modelu RTX 3050 Ti nie jest całkowicie darmowa.
Z małego i średniego (~14,3 x 6,6 x 2,2 cm) zasilacza sieciowego o mocy 130 W udało nam się odnotować chwilowy maksymalny pobór 133 W. XPS 15 to jeden z pierwszych laptopów wyposażonych zarówno w procesor z serii Core H, jak i kartę graficzną GeForce RTX 4070, który jest zasilany wyłącznie przez USB-C. Ma to oczywiście swoje zalety pod względem przenośności i wszechstronności, ale wydajność i ładowanie mogą ucierpieć ze względu na ograniczoną kopertę mocy. Na przykład ładowanie od pustego do pełnego jest wolniejsze niż zwykle i wynosi około 2,5 godziny, a będzie to jeszcze wolniejsze, jeśli jednocześnie uruchomimy wymagające obciążenia.
Na szczęście bateria nie rozładowuje się powoli podczas grania w gry lub podczas pracy pod dużym obciążeniem, w przeciwieństwie do tego, co zaobserwowaliśmy w starszych modelach starszych modelach XPS 17.
| wyłączony / stan wstrzymania | |
| luz | |
| obciążenie |
|
Legenda:
min: | |
| Dell XPS 15 9530 RTX 4070 i7-13700H, GeForce RTX 4070 Laptop GPU, SK hynix PC801 HFS001TEJ9X101N, OLED, 3456x2160, 15.6" | Dell XPS 15 9520 RTX 3050 Ti i7-12700H, GeForce RTX 3050 Ti Laptop GPU, WDC PC SN810 512GB, OLED, 3456x2160, 15.6" | Dell XPS 15 9500 Core i7 4K UHD i7-10875H, GeForce GTX 1650 Ti Mobile, SK Hynix PC611 512GB, IPS, 3840x2400, 15.6" | Asus Zenbook Pro 15 OLED UM535Q R9 5900HX, GeForce RTX 3050 Ti Laptop GPU, WDC PC SN730 SDBPNTY-1T00, OLED, 1920x1080, 15.6" | MSI Prestige 15 A12UD-093 i7-1280P, GeForce RTX 3050 Ti Laptop GPU, Micron 3400 1TB MTFDKBA1T0TFH, IPS, 3840x2160, 15.6" | Gigabyte Aero 15 OLED XD i7-11800H, GeForce RTX 3070 Laptop GPU, Samsung PM9A1 MZVL21T0HCLR, OLED, 3840x2160, 15.6" | |
|---|---|---|---|---|---|---|
| Power Consumption | 28% | 12% | 34% | 51% | -39% | |
| Idle Minimum * (Watt) | 20 | 5.5 72% | 5.7 71% | 5.5 72% | 5.4 73% | 23 -15% |
| Idle Average * (Watt) | 20.7 | 7.2 65% | 13.5 35% | 7.4 64% | 11.8 43% | 26 -26% |
| Idle Maximum * (Watt) | 22.4 | 16 29% | 19.6 12% | 14.9 33% | 12.7 43% | 34 -52% |
| Load Average * (Watt) | 77.1 | 91.8 -19% | 114.1 -48% | 78.2 -1% | 45.9 40% | 99 -28% |
| Witcher 3 ultra * (Watt) | 95.4 | 74.6 22% | 93 3% | 80.1 16% | 45.7 52% | 163 -71% |
| Load Maximum * (Watt) | 133.4 | 134.7 -1% | 135.2 -1% | 110.9 17% | 63 53% | 190 -42% |
* ... im mniej tym lepiej
Power Consumption Witcher 3 / Stresstest
Power Consumption external Monitor
Czas pracy na baterii - nieco krótszy, ale niezły
Czasy pracy są generalnie krótsze, niż w zeszłorocznym modelu, co nie jest zaskakujące, gdyż procesor Intela 13. generacji i układ graficzny GeForce 40 mają podobną moc obliczeniową, jak ich poprzednicy. Udało nam się zarejestrować 8 godzin rzeczywistego korzystania z sieci WLAN, czyli o 40 minut krócej niż w XPS 15 z 2022 roku. To wciąż dobry wynik, nawet jeśli jest nieco krótszy od konkurencyjnych modeli, takich jak Asus Zenbook Pro 15.
Czas pracy na akumulatorze można wydłużyć, wyświetlając ciemne kolory zamiast białych na konfiguracji OLED, o czym pisaliśmy m.in tutaj. Spodziewamy się, że SKU IPS o niższej rozdzielczości zapewni dłuższe czasy pracy niż to, co odnotowaliśmy tutaj.
| Dell XPS 15 9530 RTX 4070 i7-13700H, GeForce RTX 4070 Laptop GPU, 86 Wh | Dell XPS 15 9520 RTX 3050 Ti i7-12700H, GeForce RTX 3050 Ti Laptop GPU, 86 Wh | Dell XPS 15 9500 Core i7 4K UHD i7-10875H, GeForce GTX 1650 Ti Mobile, 86 Wh | Asus Zenbook Pro 15 OLED UM535Q R9 5900HX, GeForce RTX 3050 Ti Laptop GPU, 96 Wh | MSI Prestige 15 A12UD-093 i7-1280P, GeForce RTX 3050 Ti Laptop GPU, 80 Wh | Gigabyte Aero 15 OLED XD i7-11800H, GeForce RTX 3070 Laptop GPU, 99 Wh | |
|---|---|---|---|---|---|---|
| Czasy pracy | 51% | 49% | 109% | 2% | 6% | |
| Reader / Idle (h) | 11.5 | 14.8 29% | 23 100% | 26.2 128% | ||
| WiFi v1.3 (h) | 8 | 8.8 10% | 9.1 14% | 12.8 60% | 8.9 11% | 8.5 6% |
| Load (h) | 1.5 | 3.2 113% | 2 33% | 3.6 140% | 1.4 -7% | |
| H.264 (h) | 7.1 | |||||
| Witcher 3 ultra (h) | 2.2 |
Za
Przeciw
Werdykt - Poświęcanie wydajności na rzecz cienkości
Core i7-13700H i GeForce RTX 4070 są zazwyczaj zarezerwowane dla większych laptopów do gier, jak np.Asus ROG Strix G18 lubAorus 15X ASF każdy z nich posiada nieporęczne, 200+ W bloki zasilające. Wciśnięcie ich do cieńszych konstrukcji o niskim poborze mocy, takich jak XPS 15, może z pewnością zadziałać, ale wydajność nieuchronnie odbija się na wydajności. W tym przypadku, TGP zostało zredukowane o połowę lub więcej, aby uzyskać słabą wydajność za dolara. Jeśli planujesz używać zarówno edytorów graficznych, jak i gier, to dedykowana maszyna do gier, jak np Alienware x15 z łatwością przewyższy naszego XPS-a 15 o spory margines, nawet jeśli zostanie skonfigurowany z tym samym procesorem i układem graficznym.
Uderzenie w wydajność podczas pracy z edytorami grafiki nie jest tak poważne, jak uderzenie w wydajność w grach w porównaniu z większymi laptopami o wyższych celach TGP. Jest tak głównie dlatego, że nawet 50-watowy RTX 4070 posiada taką samą liczbę rdzeni CUDA do akceleracji, jak wersja 100+-watowa. XPS 15 9530 wyróżnia się więc w tworzeniu treści i tylko sporadycznie w grach. To w końcu laptop z serii Nvidia Studio.
XPS 15 9530 to laptop do tworzenia treści, który warto posiadać, jeśli chce się zrównoważyć wydajność z przenośnością. Nie spodziewaj się jednak, że będzie on działał jak większość innych laptopów z tym samym GPU.
Jest wiele zmian, które chcielibyśmy zobaczyć w przyszłych modelach. Po pierwsze, nowsze opcje wyświetlaczy z częstotliwością odświeżania 90 Hz lub 120 Hz znacznie poprawiłyby wrażenia użytkownika. Po drugie, kamera internetowa 720p jest beznadziejna, gdyż wydaje się być niezmieniona w stosunku do tej sprzed dekady. Po trzecie, zmienione rozwiązanie chłodzenia, potencjalnie z wykorzystaniem ciekłego metalu, mogłoby pomóc zwiększyć wydajność Turbo Boost bez konieczności pogrubiania konstrukcji. I na koniec, problemy z DPC, przeskakiwaniem klatek i spadkami klatek powinny być z pewnością przeanalizowane, zwłaszcza w przypadku flagowego laptopa nastawionego na tworzenie treści. XPS 15 ma wiele zalet, zwłaszcza jeśli cenimy jego przenośność zbliżoną do MacBooka Pro, ale procesory w środku przerastają obudowę i czujemy się przez to nieco ograniczeni.
Cena i dostępność
W chwili pisania tego tekstu XPS 15 9530 nie jest jeszcze szeroko dostępny u sprzedawców. Najlepszą szansą na zdobycie modelu będzie bezpośredni kontakt z firmą Dell. Ceny zaczynają się od 2250 dolarów za podstawową konfigurację do 4700 dolarów w przypadku pełnej konfiguracji z maksymalną ilością pamięci masowej i RAM.
Dell XPS 15 9530 RTX 4070
- 23/04/2023 v7 (old)
Allen Ngo
Przezroczystość
Wyboru urządzeń do recenzji dokonuje nasza redakcja. Próbka testowa została udostępniona autorowi jako pożyczka od producenta lub sprzedawcy detalicznego na potrzeby tej recenzji. Pożyczkodawca nie miał wpływu na tę recenzję, producent nie otrzymał też kopii tej recenzji przed publikacją. Nie było obowiązku publikowania tej recenzji. Jako niezależna firma medialna, Notebookcheck nie podlega władzy producentów, sprzedawców detalicznych ani wydawców.
Tak testuje Notebookcheck
Każdego roku Notebookcheck niezależnie sprawdza setki laptopów i smartfonów, stosując standardowe procedury, aby zapewnić porównywalność wszystkich wyników. Od około 20 lat stale rozwijamy nasze metody badawcze, ustanawiając przy tym standardy branżowe. W naszych laboratoriach testowych doświadczeni technicy i redaktorzy korzystają z wysokiej jakości sprzętu pomiarowego. Testy te obejmują wieloetapowy proces walidacji. Nasz kompleksowy system ocen opiera się na setkach uzasadnionych pomiarów i benchmarków, co pozwala zachować obiektywizm.Price comparison

