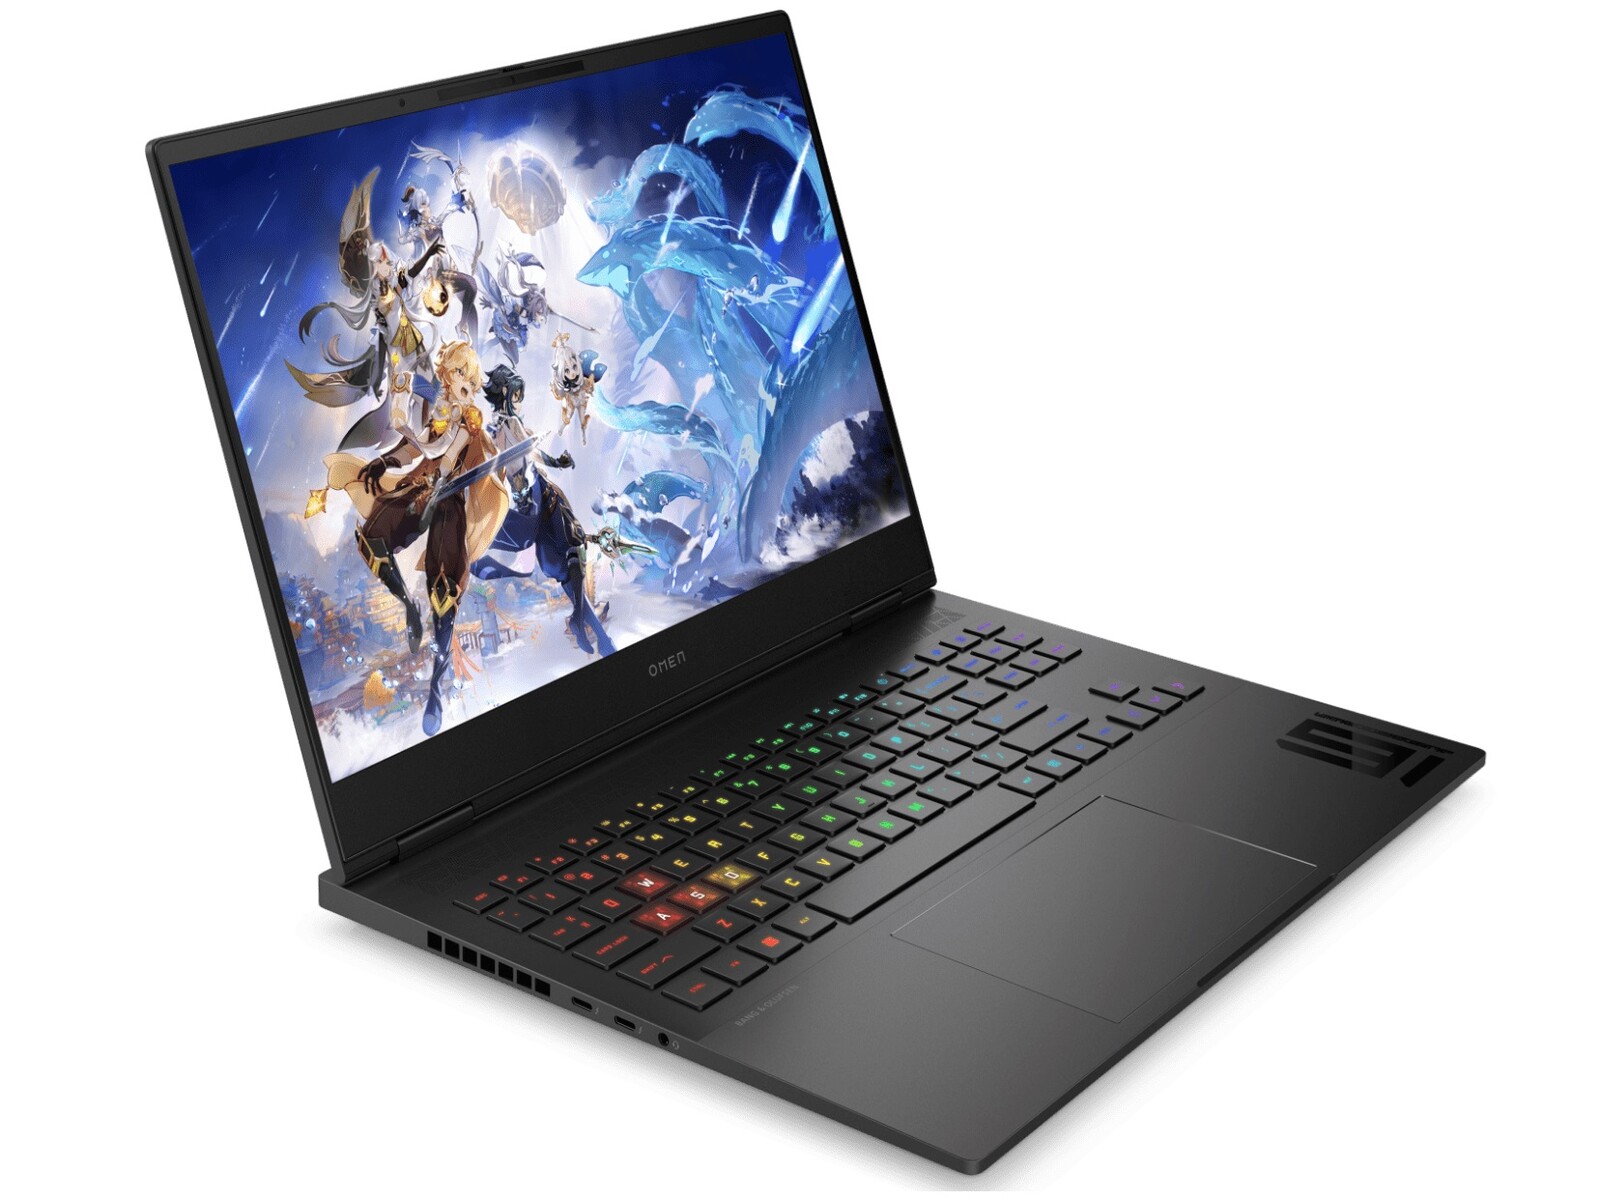
Recenzja laptopa HP Omen Transcend 16 (2024): Maszyna do gier RTX 4070 z wyświetlaczem OLED

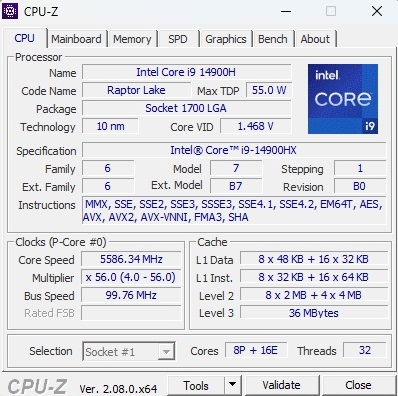
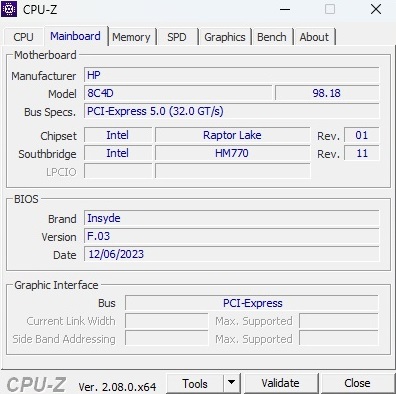
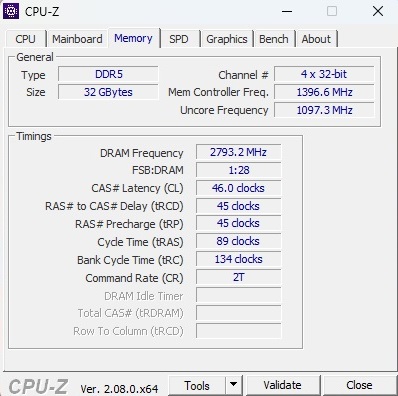
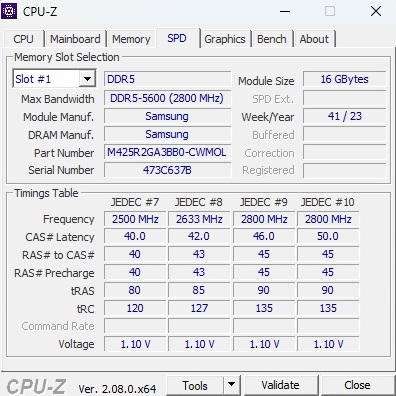
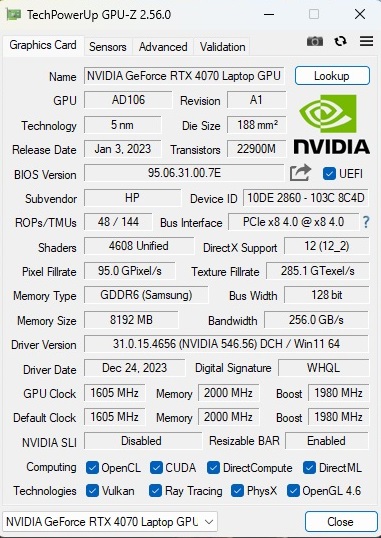
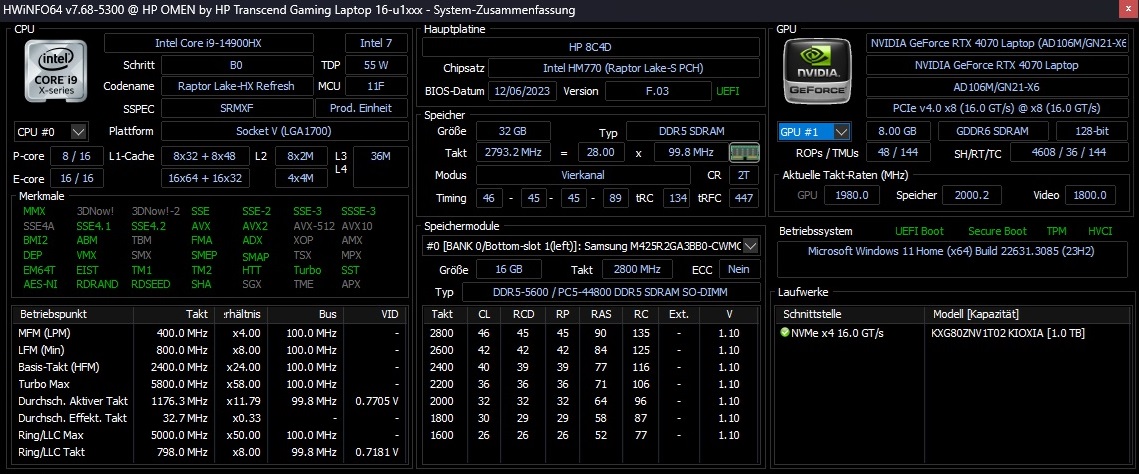
Recenzowany model Omen Transcend 16 - kończący się na u1095ng - można obecnie nabyć za niecałe 3000 USD. Za tę cenę nabywca otrzymuje Core i9-14900HX w połączeniu z kartą graficzną GeForce RTX 4070 która ze względu na dość skromne 8 GB pamięci VRAM należy raczej do kategorii średniej, a nie high-endowej. Do tego dochodzą 32 GB pamięci RAM DDR5-5600 (2x 16 GB SO-DIMM) i dysk SSD M.2 NVMe o pojemności 1 TB. Najważniejszym elementem jest żywy panel OLED, który ma mieć 2560 x 1600 pikseli, 240 Hz, 400 cd/m² i 100% DCI P3. Całość dopełnia system operacyjny Windows 11 Home.
Konkurenta Omen Transcend 16 można znaleźć w postaci innych 16-calowych graczy wyposażonych w GeForce RTX 4070, a także Asus ROG Zephyrus G16 2024 (Ultra 7 155H), Schenker Schenker XMG Core 16 L23 (Ryzen 7 7840HS) i Lenovo Legion Pro 5 16ARX8 (Ryzen 7 7745HX), z których wszystkie pojawiają się w naszej tabeli porównawczej urządzeń.
Ponieważ obudowa jest w większości identyczna z poprzednikiem, który miał Core i9-13900HX (proszę zobaczyć naszą recenzję), pokrótce omówimy tylko obudowę, funkcje i kategorie urządzeń wejściowych.
Potencjalni konkurenci w porównaniu
Ocena | Data | Model | Waga | Wysokość | Rozmiar | Rezolucja | Cena |
|---|---|---|---|---|---|---|---|
| 88.4 % v7 (old) | 02/2024 | HP Omen Transcend 16-u1095ng i9-14900HX, GeForce RTX 4070 Laptop GPU | 2.3 kg | 20 mm | 16.00" | 2560x1600 | |
| 87.9 % v7 (old) | 08/2023 | HP Omen Transcend 16 i9-13900HX, GeForce RTX 4070 Laptop GPU | 2.3 kg | 19.8 mm | 16.00" | 2560x1600 | |
| 92.3 % v7 (old) | 02/2024 | Asus ROG Zephyrus G16 2024 GU605M Ultra 7 155H, GeForce RTX 4070 Laptop GPU | 1.8 kg | 16.4 mm | 16.00" | 2560x1600 | |
| 89.2 % v7 (old) | 10/2023 | Schenker XMG CORE 16 (L23) R7 7840HS, GeForce RTX 4070 Laptop GPU | 2.4 kg | 26.1 mm | 16.00" | 2560x1600 | |
| 88.4 % v7 (old) | 05/2023 | Lenovo Legion Pro 5 16ARX8 R7 7745HX, GeForce RTX 4070 Laptop GPU | 2.5 kg | 26.8 mm | 16.00" | 2560x1600 |
Sprawa
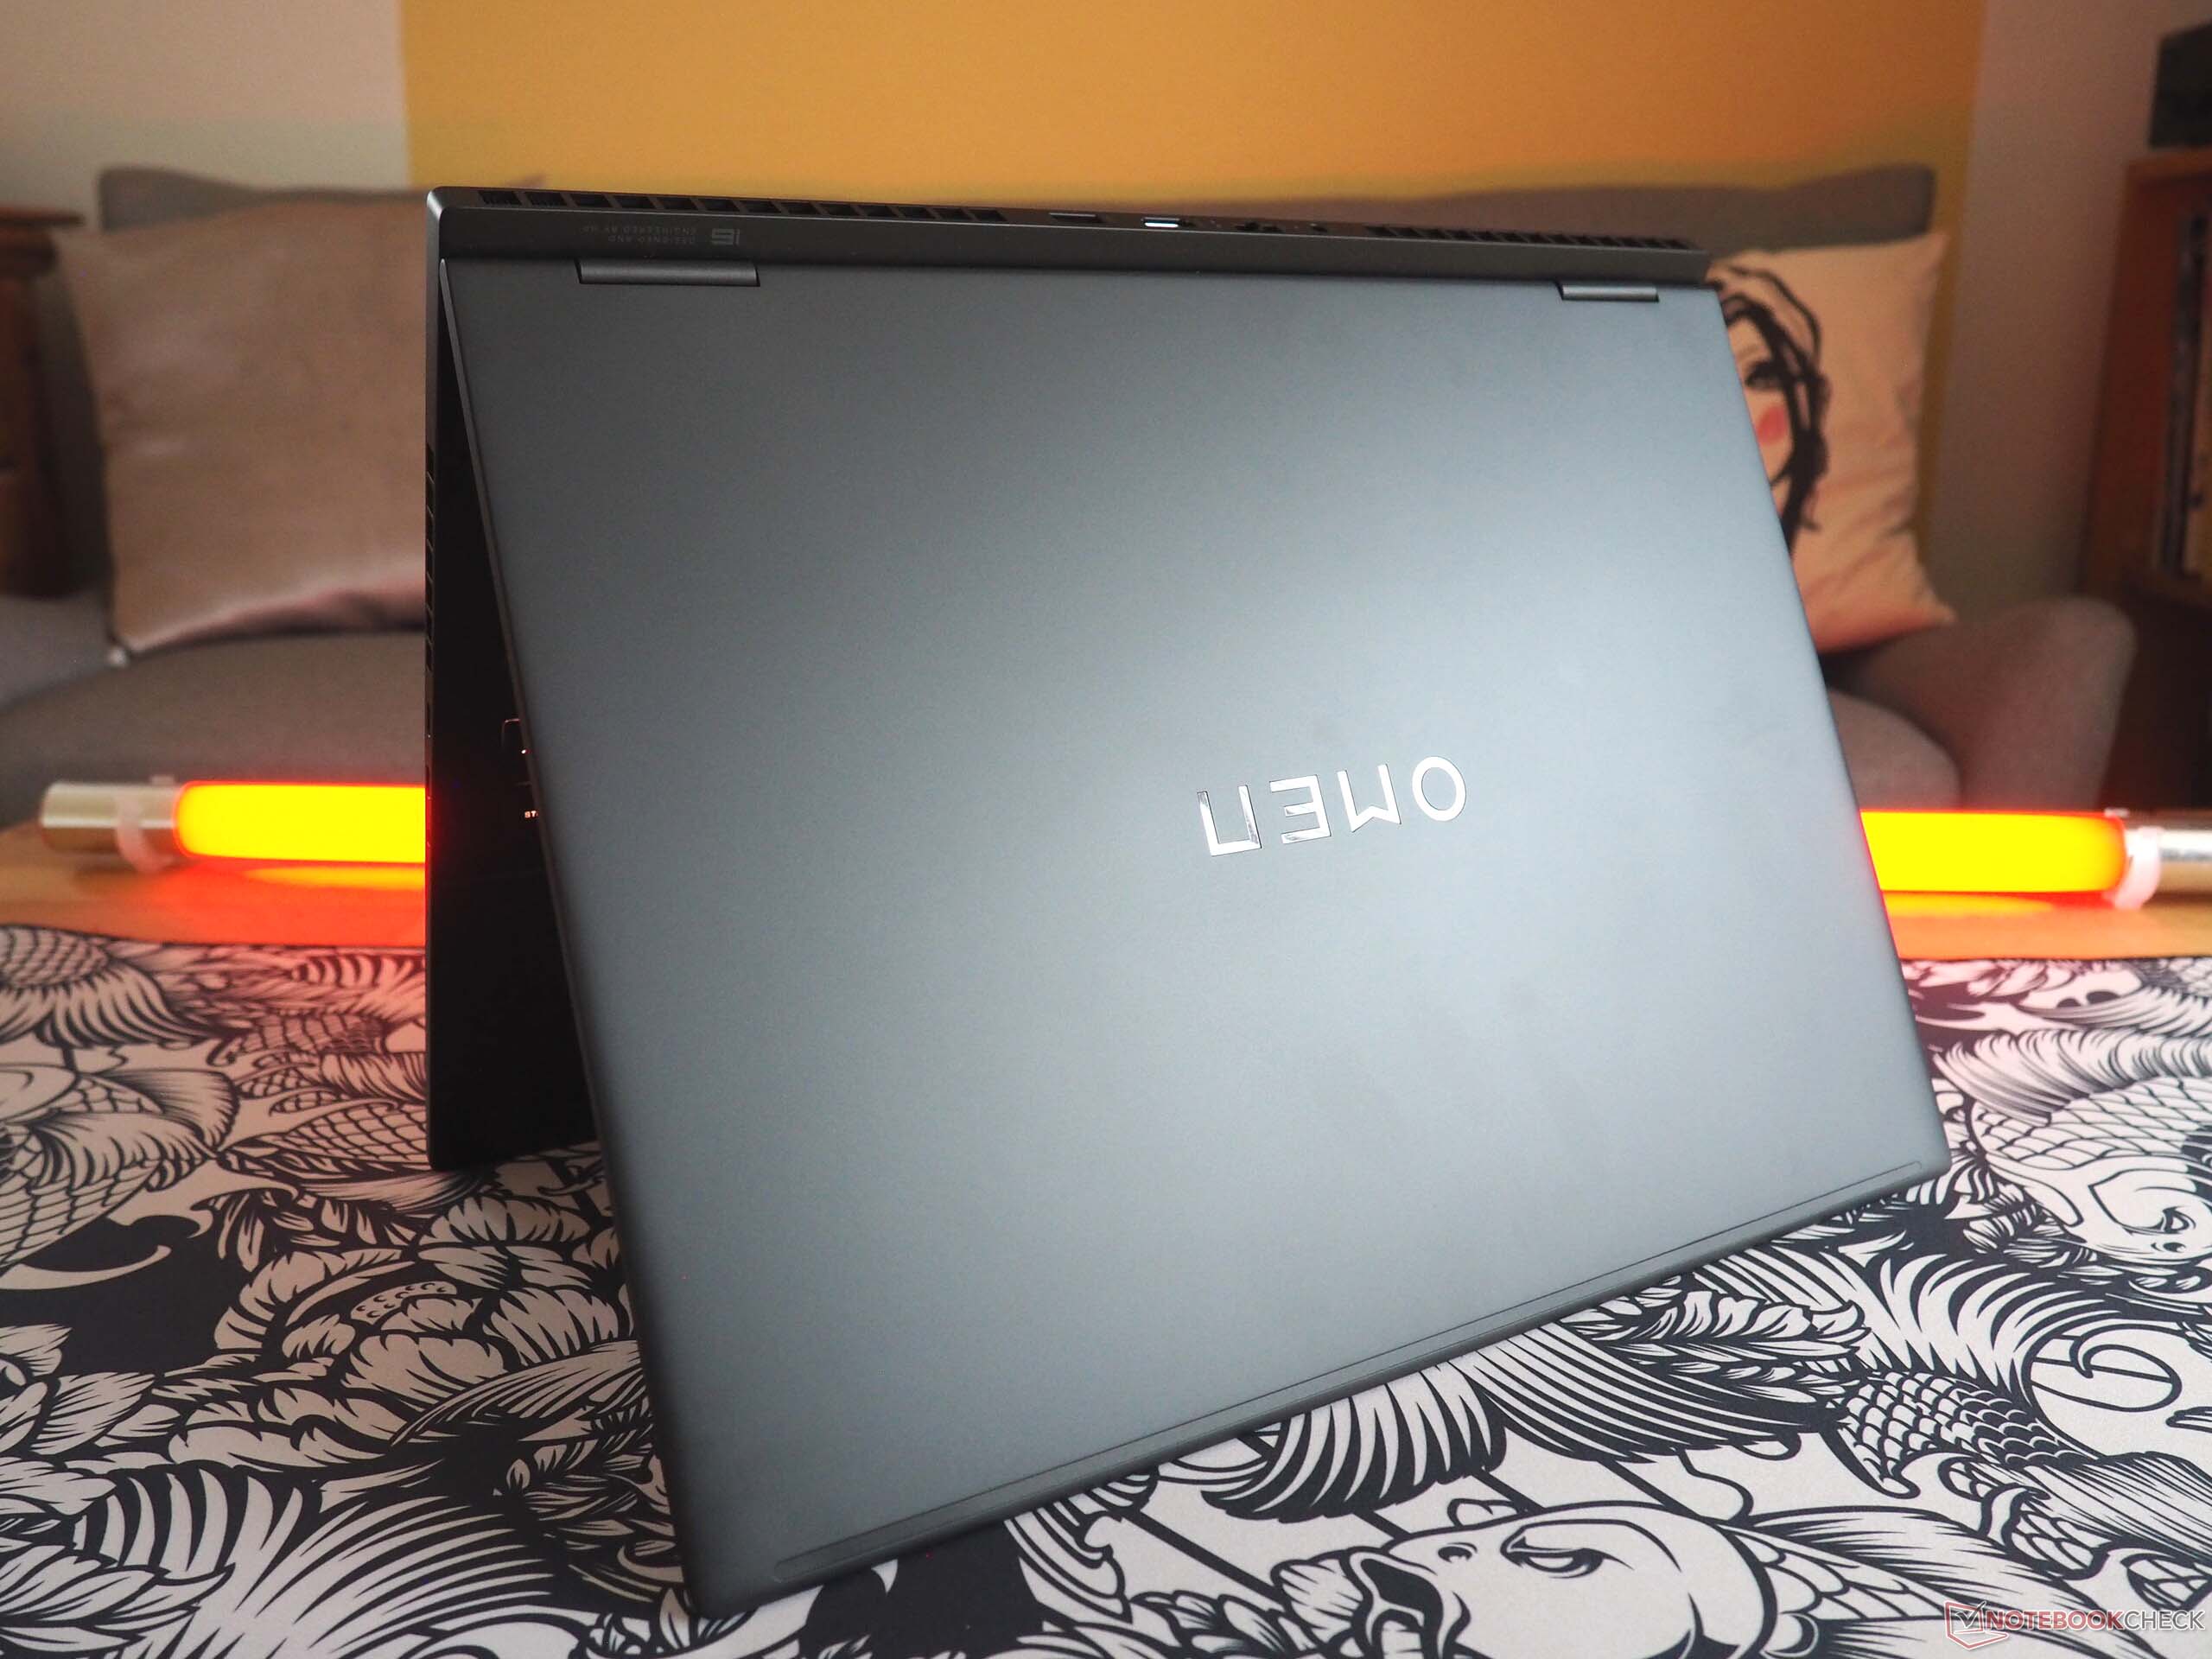
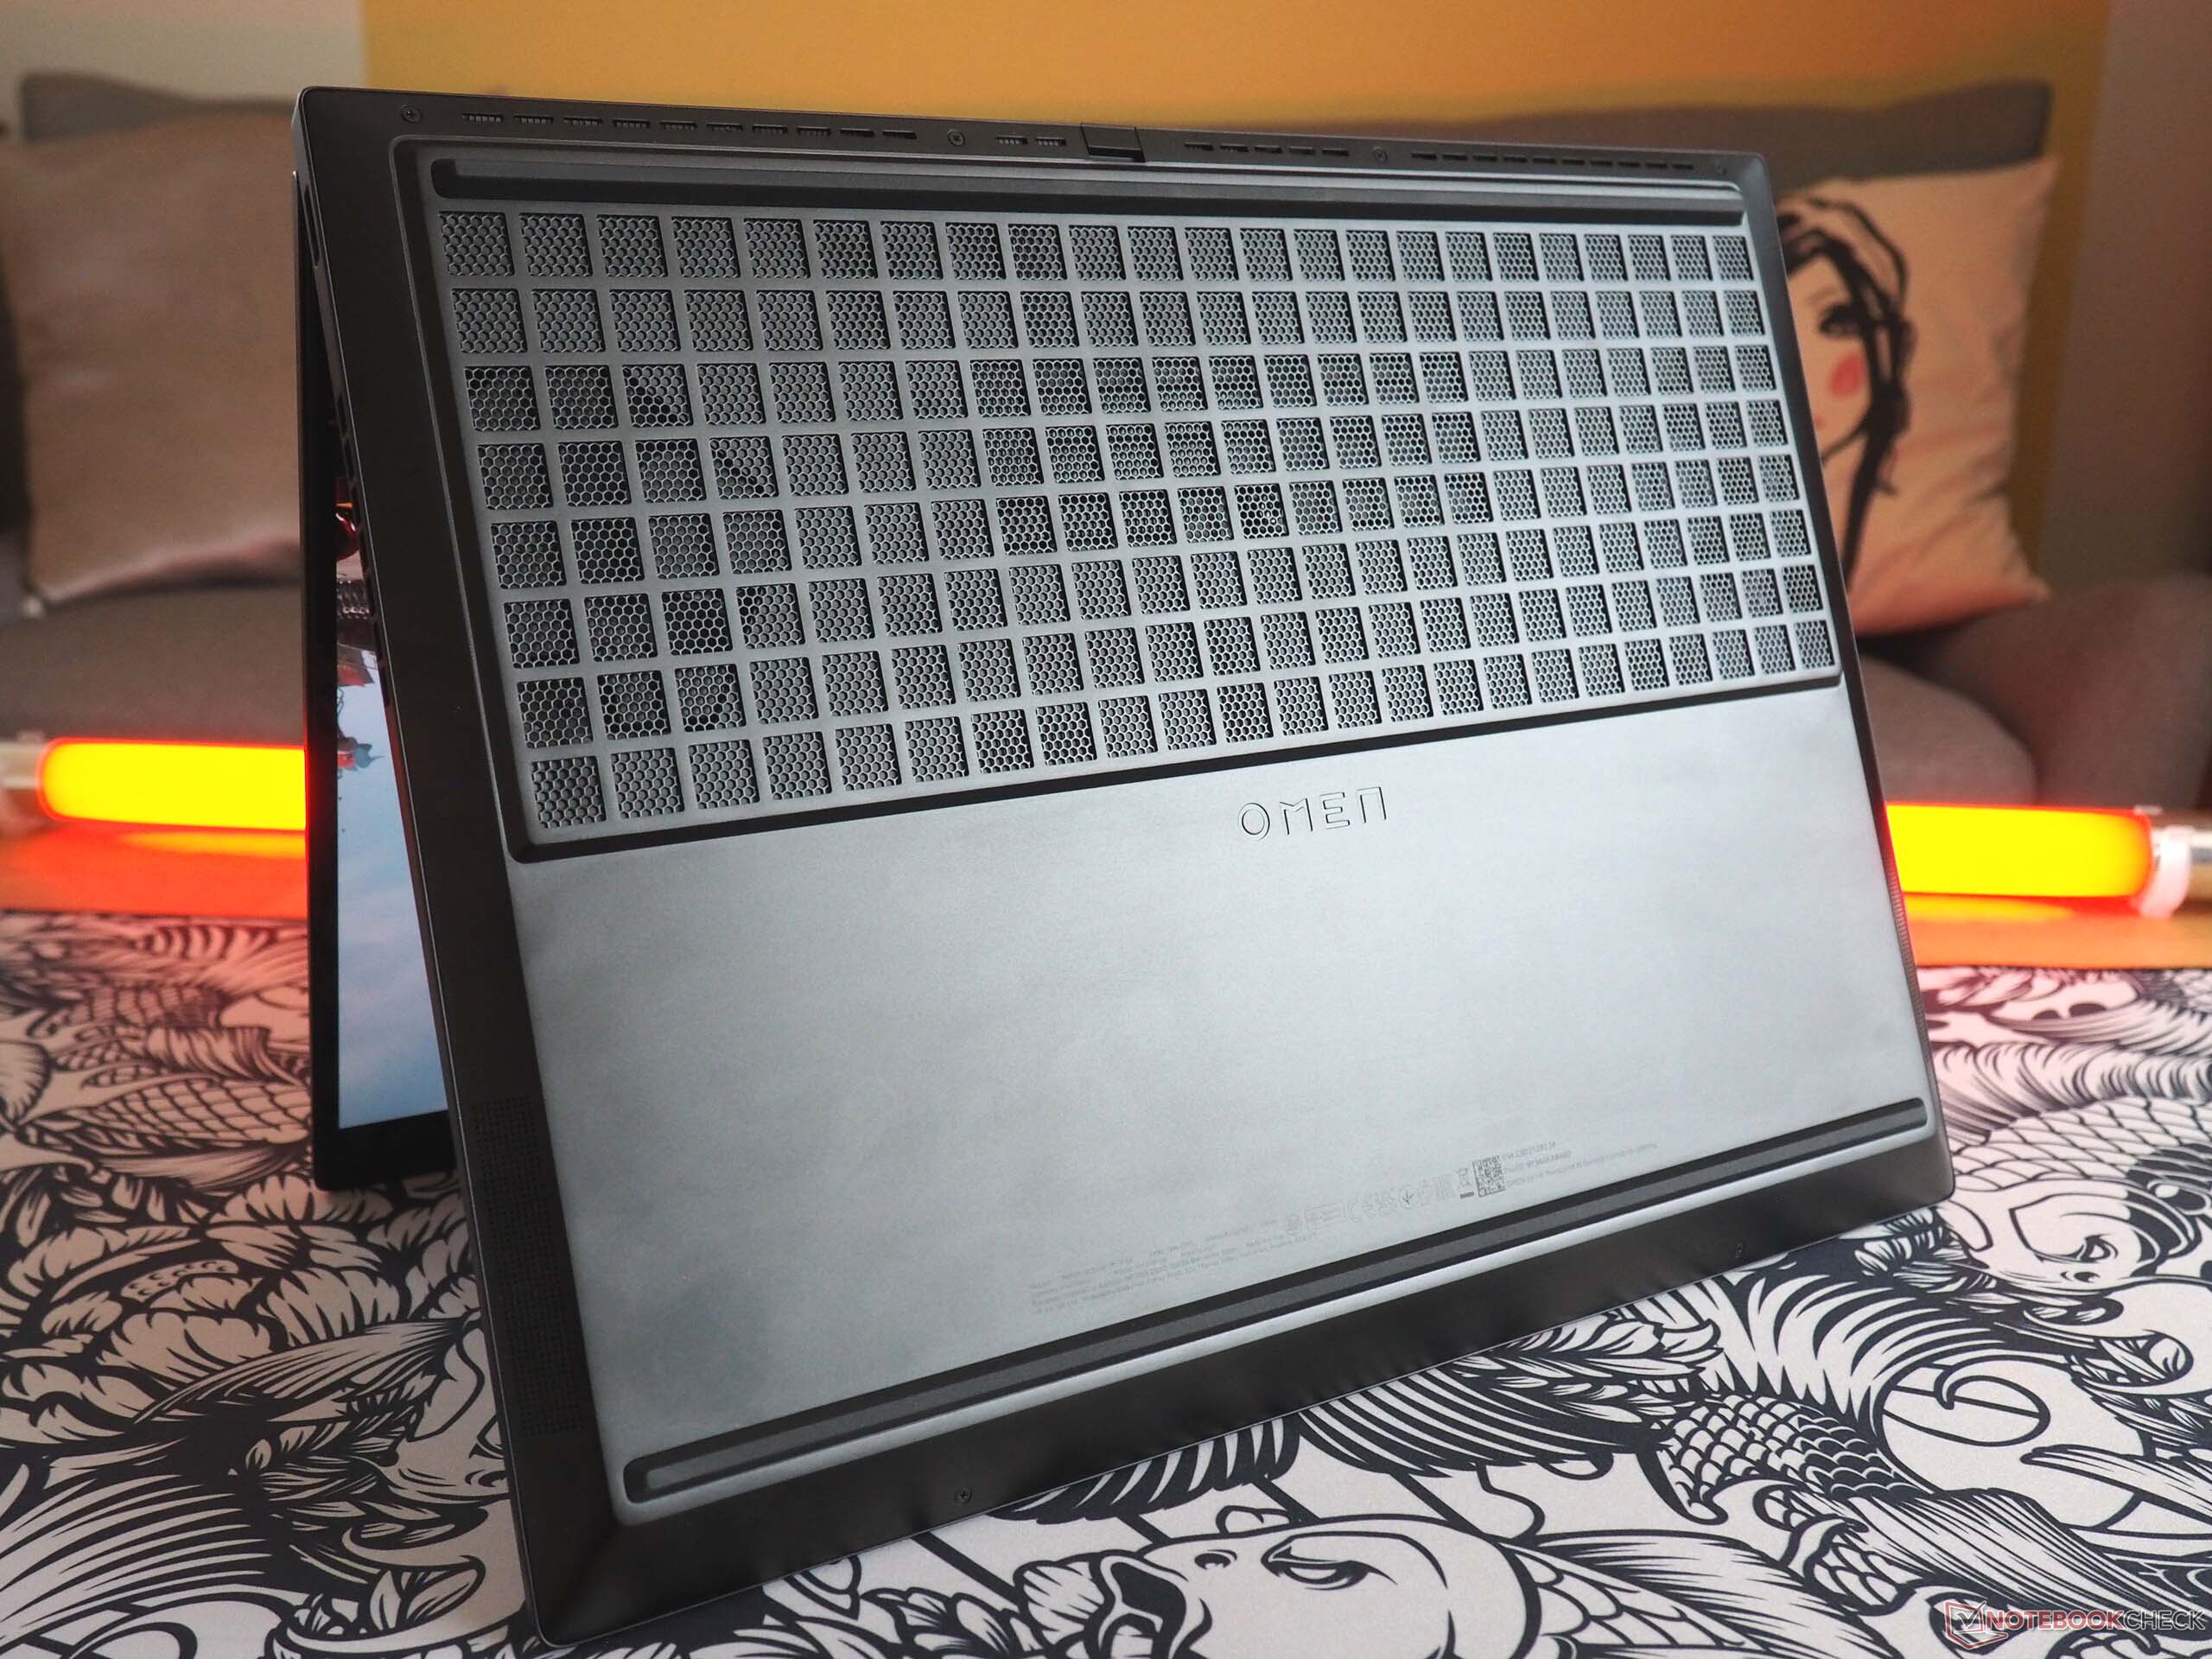
Transcend 16 oferuje przyciągający wzrok design i, z wizualnego punktu widzenia, ma imponująco smukłą sylwetkę (wszystkie konkurencyjne urządzenia są grubsze oprócz Zephyrus G16). Jeśli chodzi o stabilność, jednostka bazowa przynajmniej zapewnia solidną wydajność. Dla kontrastu, pokrywa - podobnie jak w przypadku wielu innych urządzeń - mogłaby mieć lepszą sztywność skrętną. Na pierwszy rzut oka matowa powierzchnia ma wygląd premium, jednak HP użyło głównie plastiku. Pod względem jakości wykonania nie można mieć żadnych zastrzeżeń. Producent zasługuje na pochwałę za duży kąt otwarcia 180°, chociaż zawiasy mogłyby być mocniejsze. Jeśli chodzi o wagę, to przy 2,3 kg urządzenie plasuje się pośrodku stawki, co sprawia, że 16-calowiec nie jest ani szczególnie lekki, ani ciężki.


Cechy
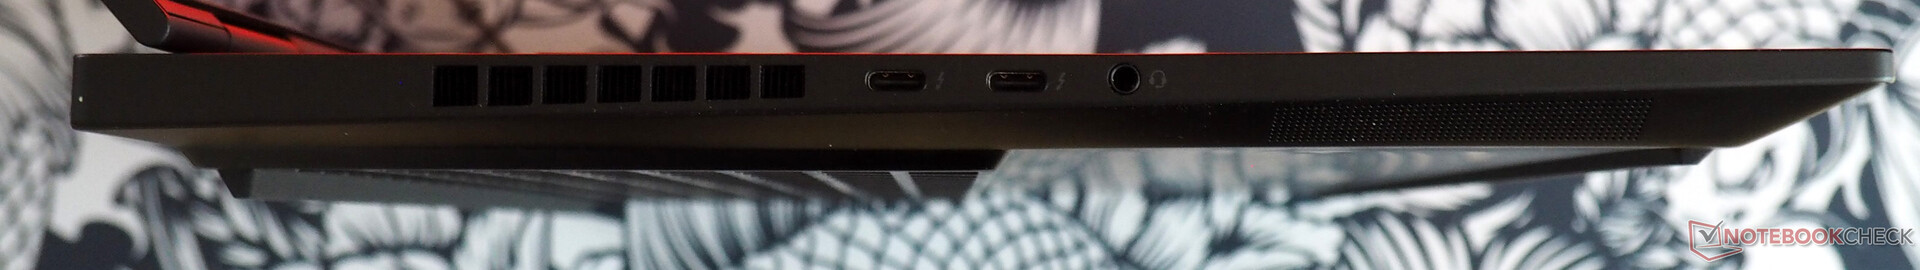
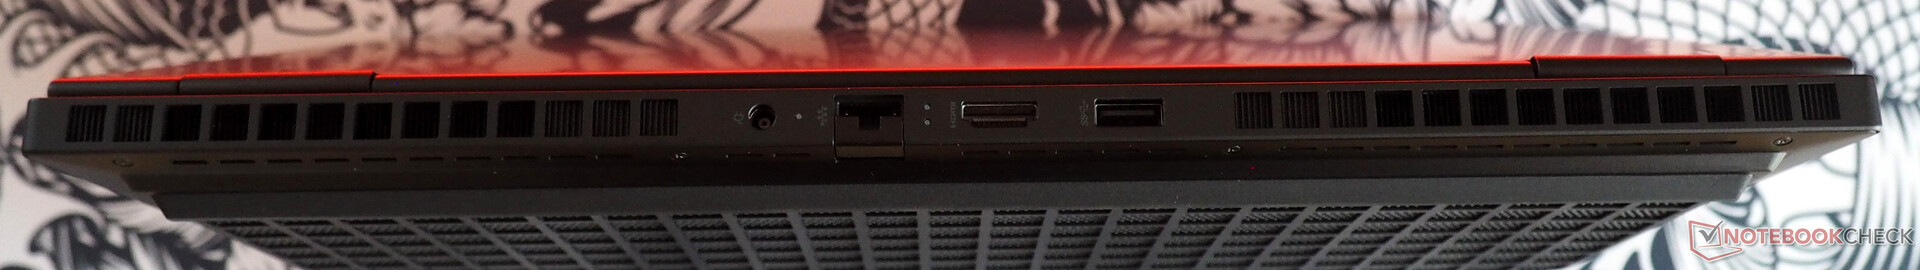
Wybór portów można określić jako bardzo nowoczesny. Podczas gdy z tyłu znajduje się port RJ45 (niestety nie 2,5 Gbit LAN), wyjście HDMI 2.1 i port USB 3.0 (typ A), lewa strona jest domem dla dwóch portów Thunderbolt 4 (w tym Power Delivery) i gniazda audio. Po prawej stronie znajduje się tylko jeden samotny port USB 3.0 (typu A). Kupujący muszą obejść się bez blokady Kensington i czytnika kart.

Komunikacja
Wydajność Wi-Fi jest na wysokim poziomie i przy prędkości wysyłania prawie 1400 Mbit/s i około 1700 Mbit/s, jeśli chodzi o odbieranie danych (odległość 1 m od routera referencyjnego), wydajność jest gdzieś pomiędzy dobrą a bardzo dobrą. W modelu Wi-Fi 6E AX211 firma HP zainstalowała nowoczesny moduł bezprzewodowy Intel.
Kamera internetowa
Mamy mieszane uczucia co do kamery internetowej 2 MP. Ostrość obrazu jest ponadprzeciętna, ale dokładność odwzorowania kolorów pozostawia wiele do życzenia. Dobrym rozwiązaniem jest ręczna migawka zapewniająca prywatność.


Akcesoria
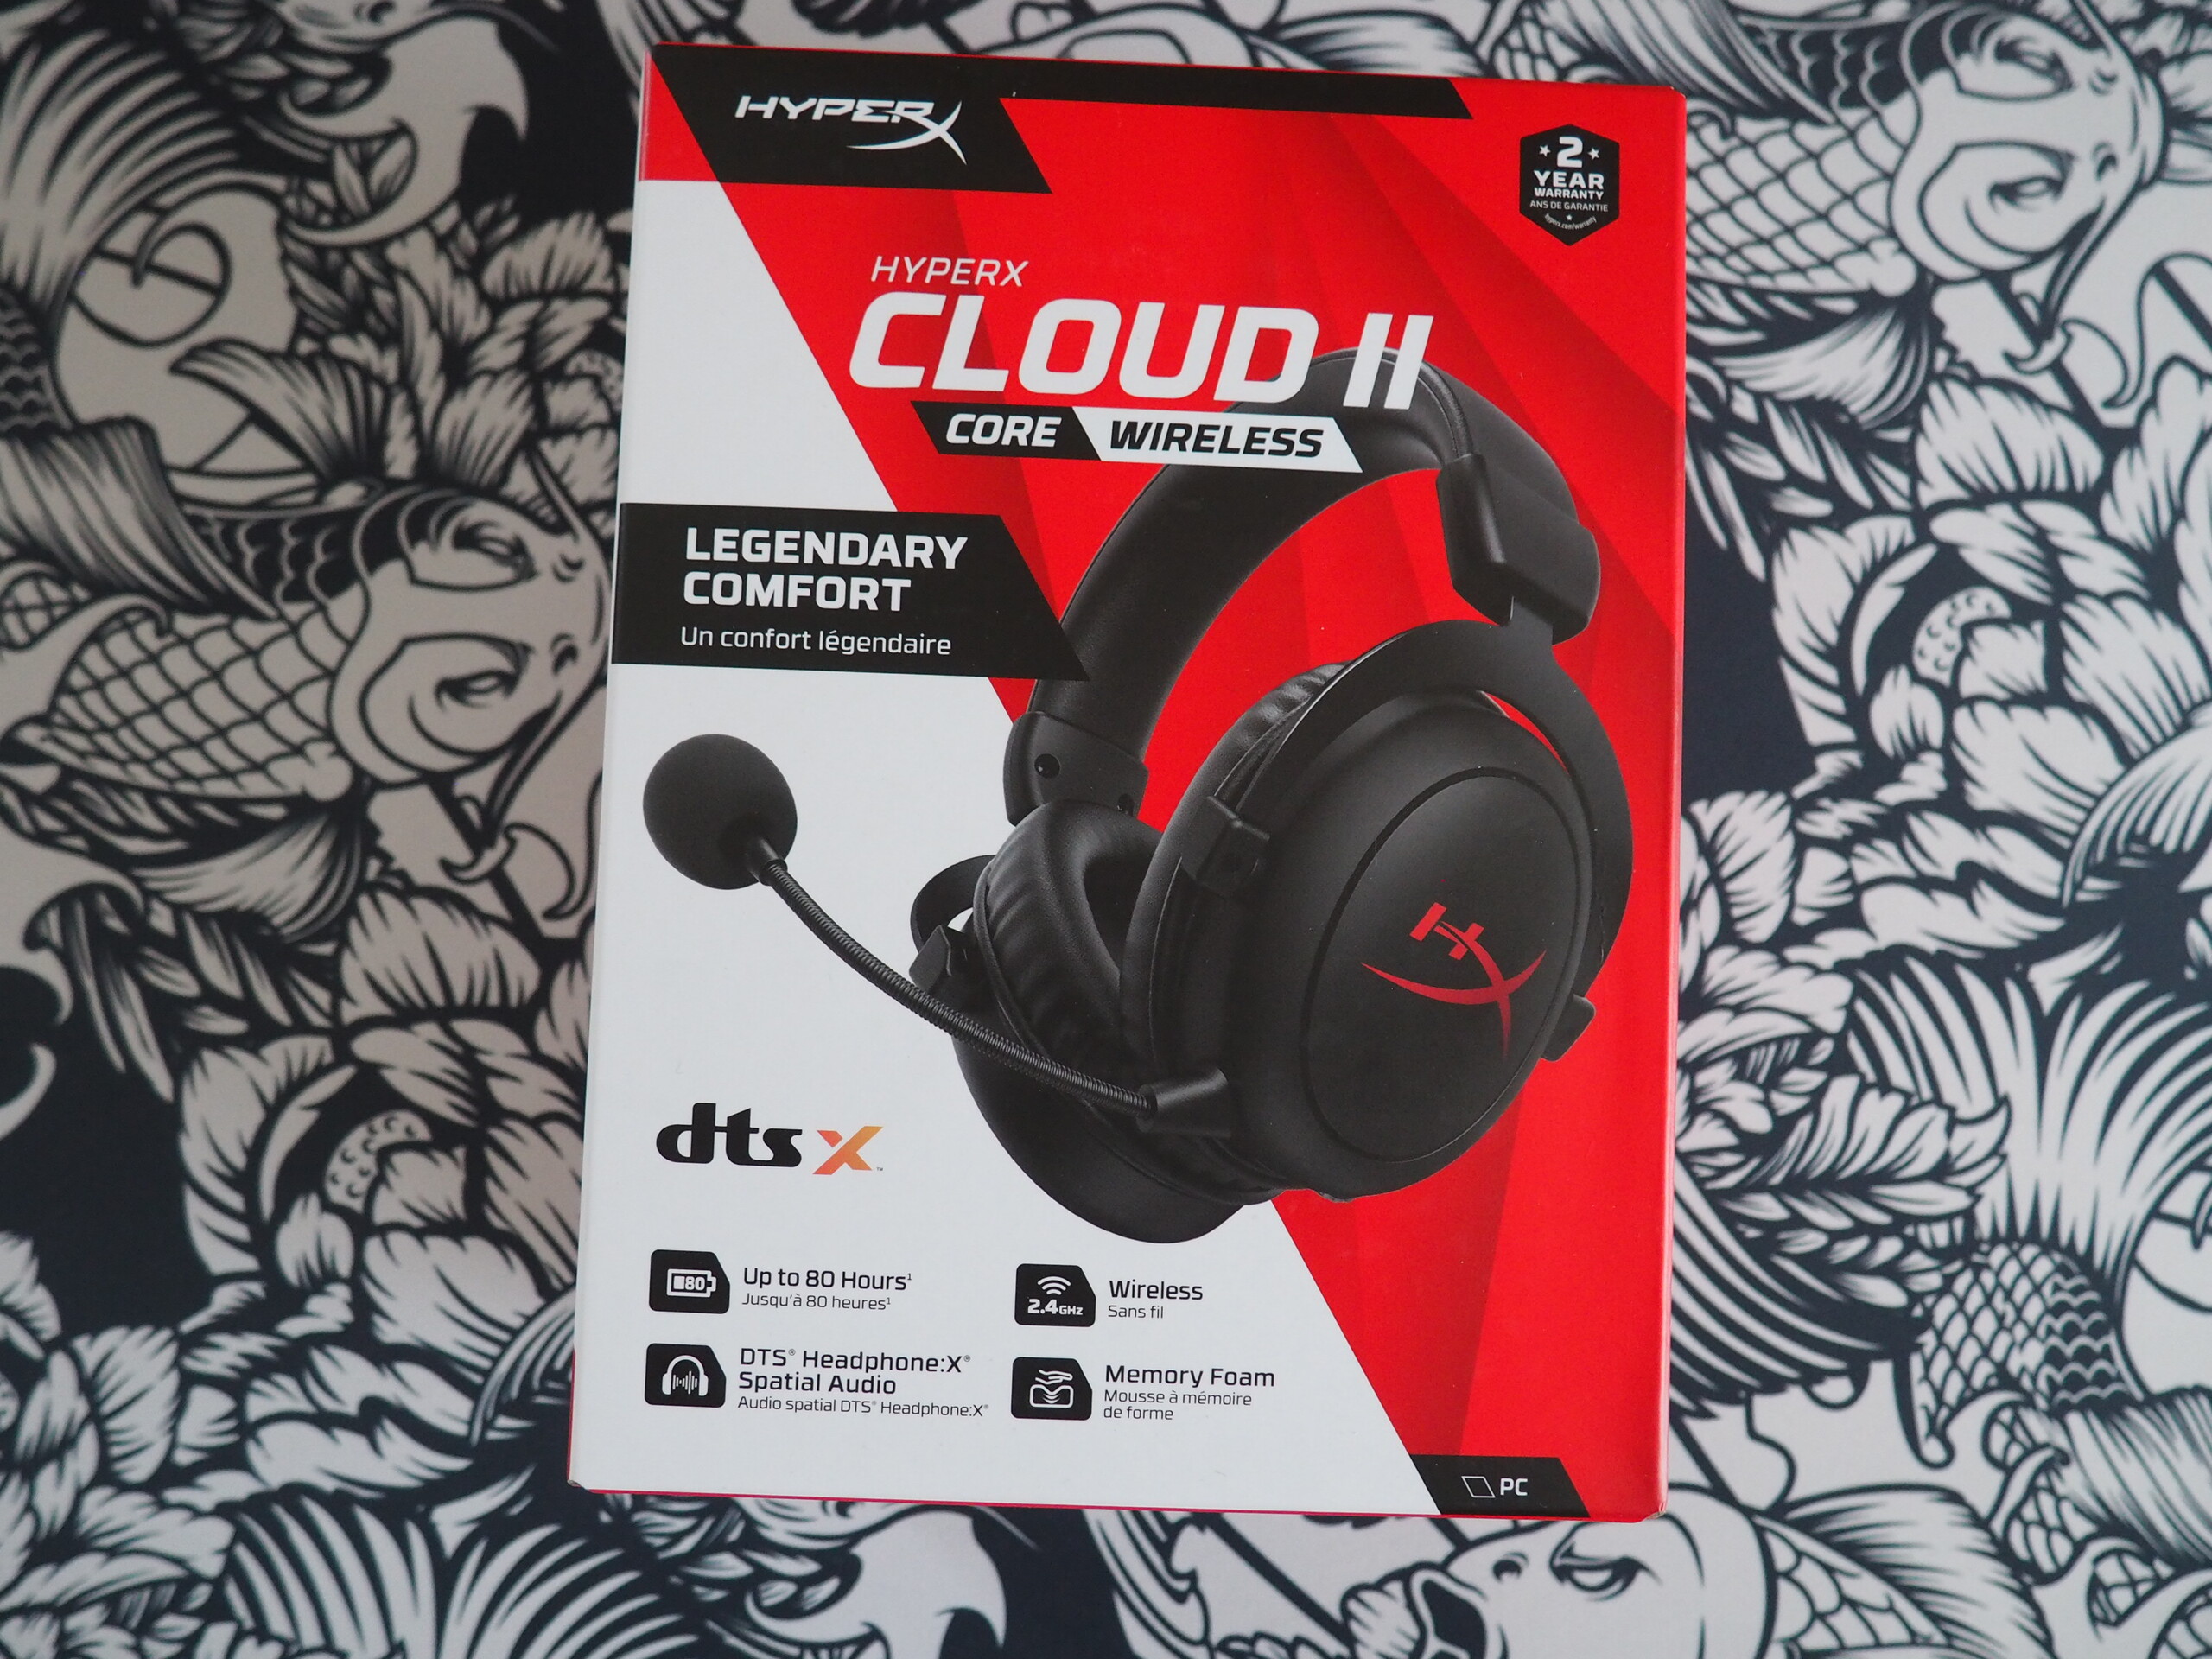
Recenzowane przez nas urządzenie było również wyposażone w bardzo smukły 230-watowy zasilacz, a także zestaw słuchawkowy HyperX (bezprzewodowy Cloud II Core).
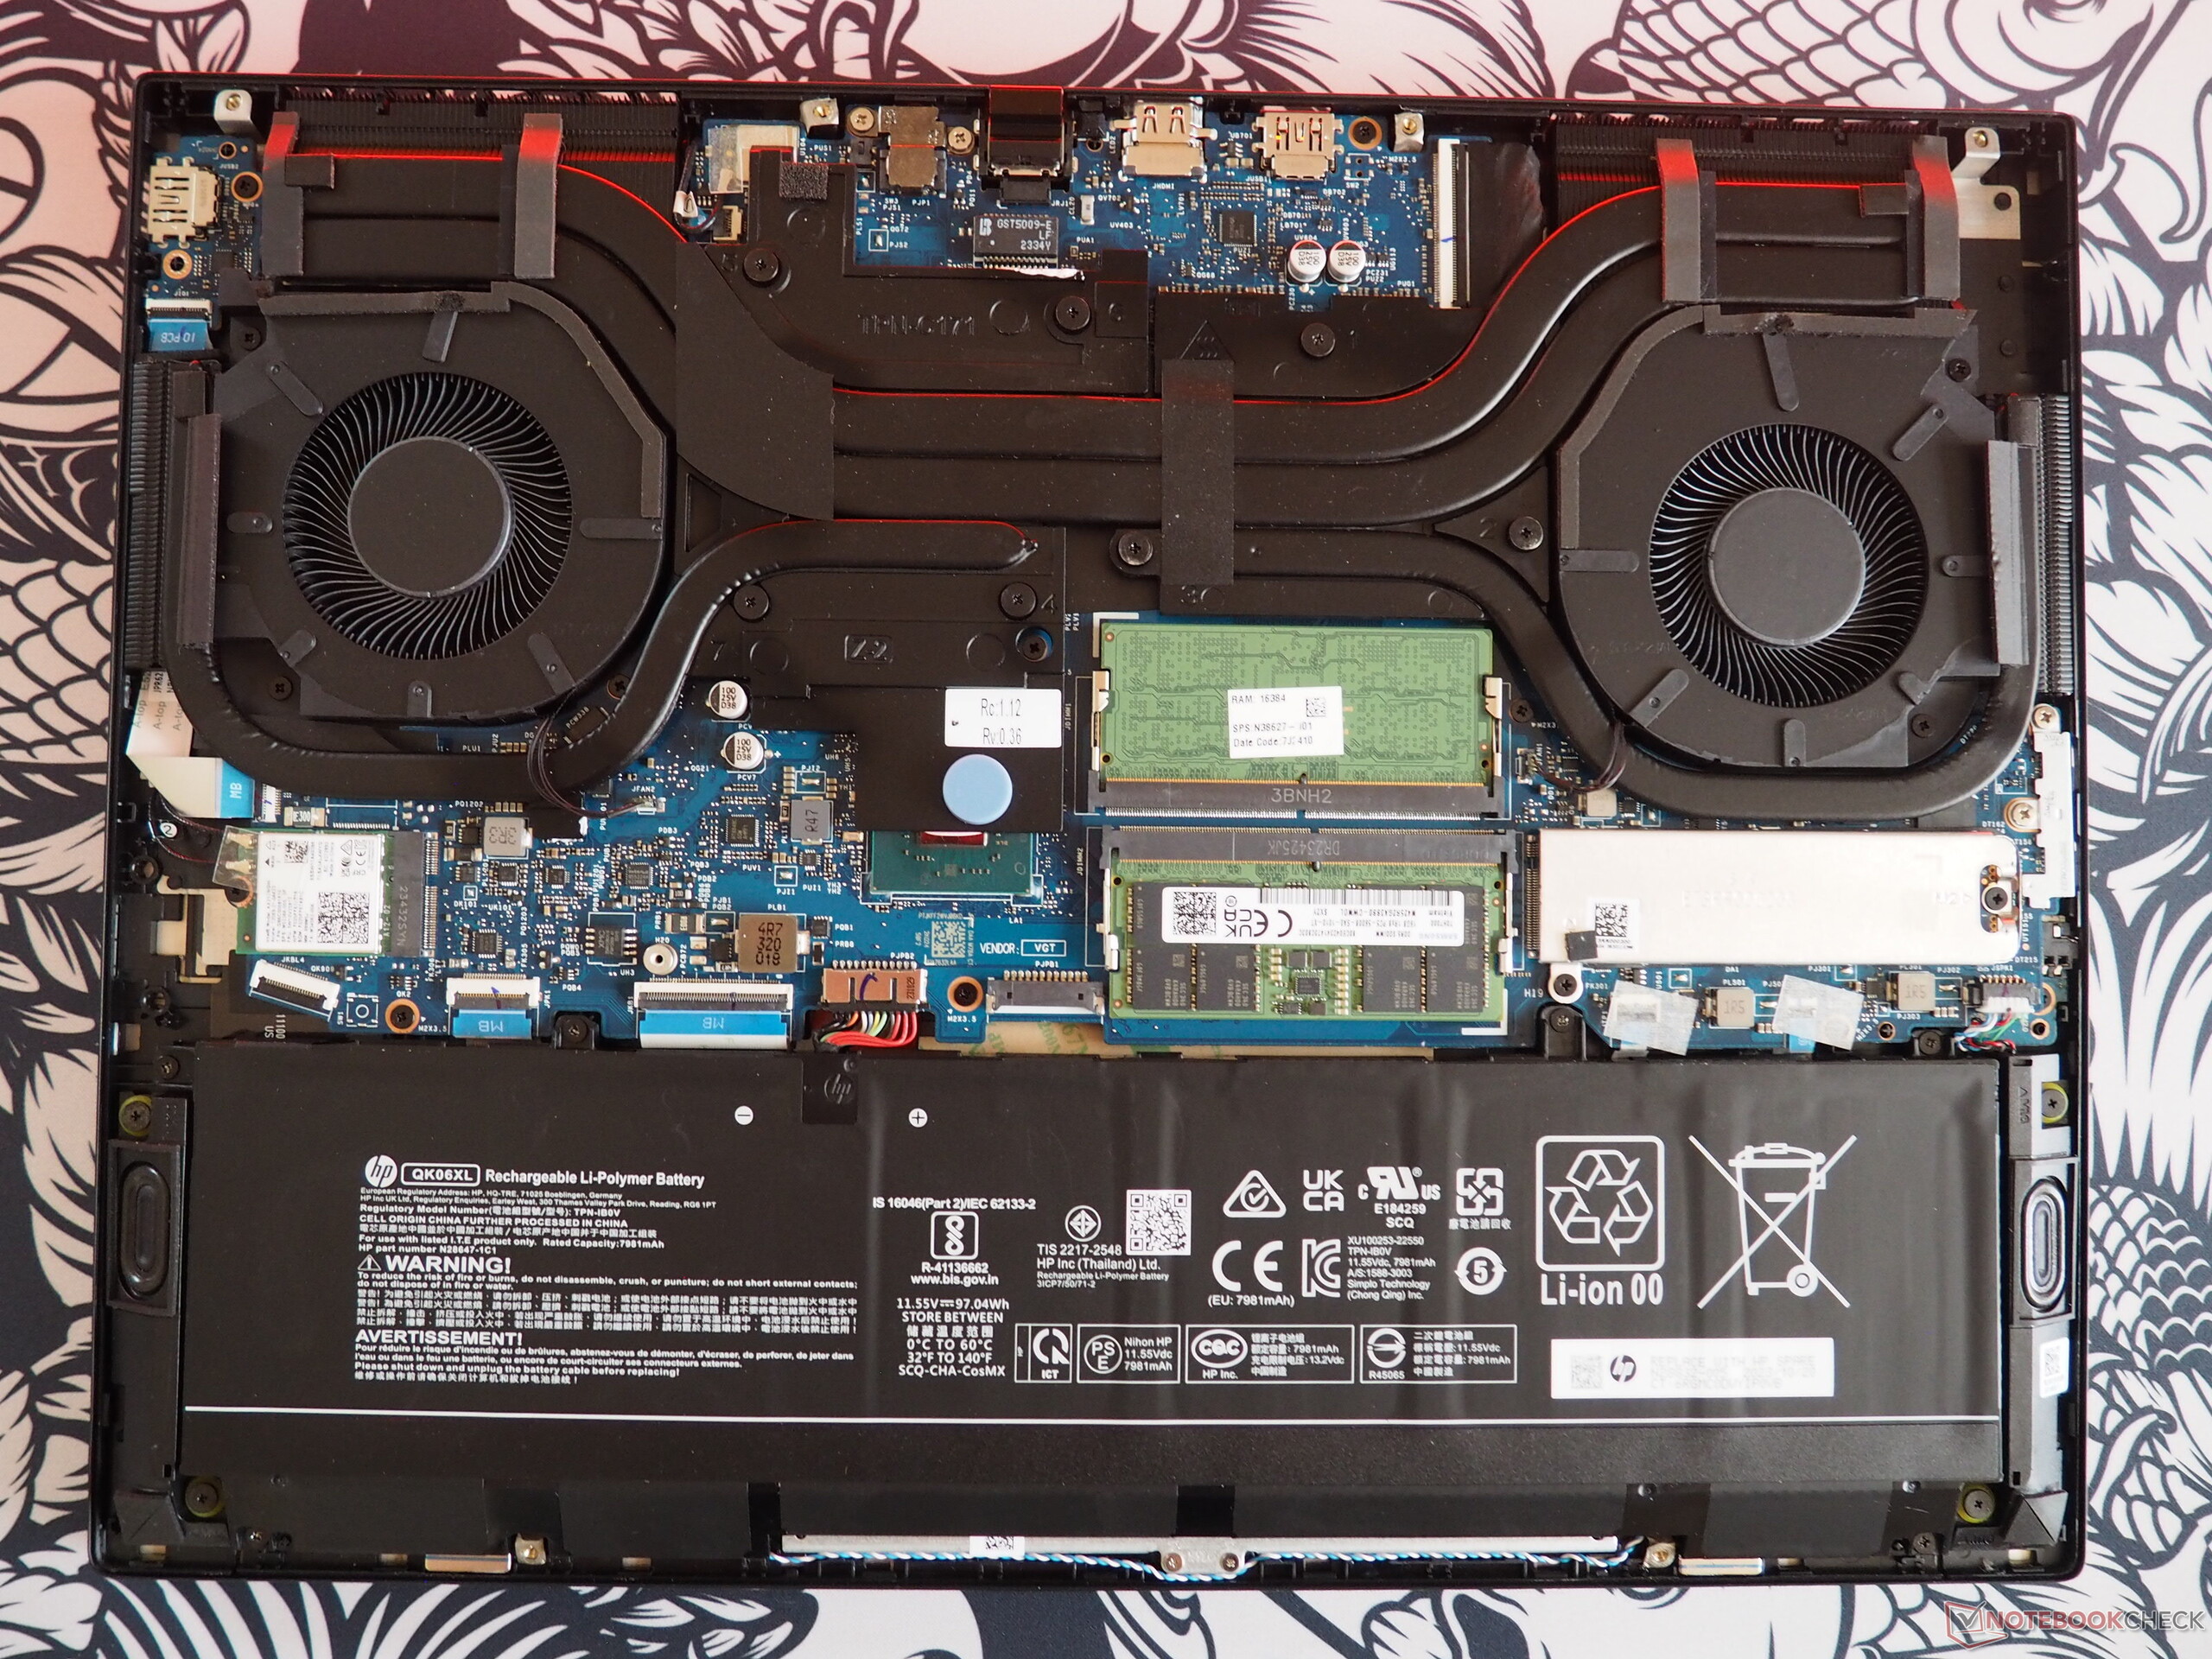
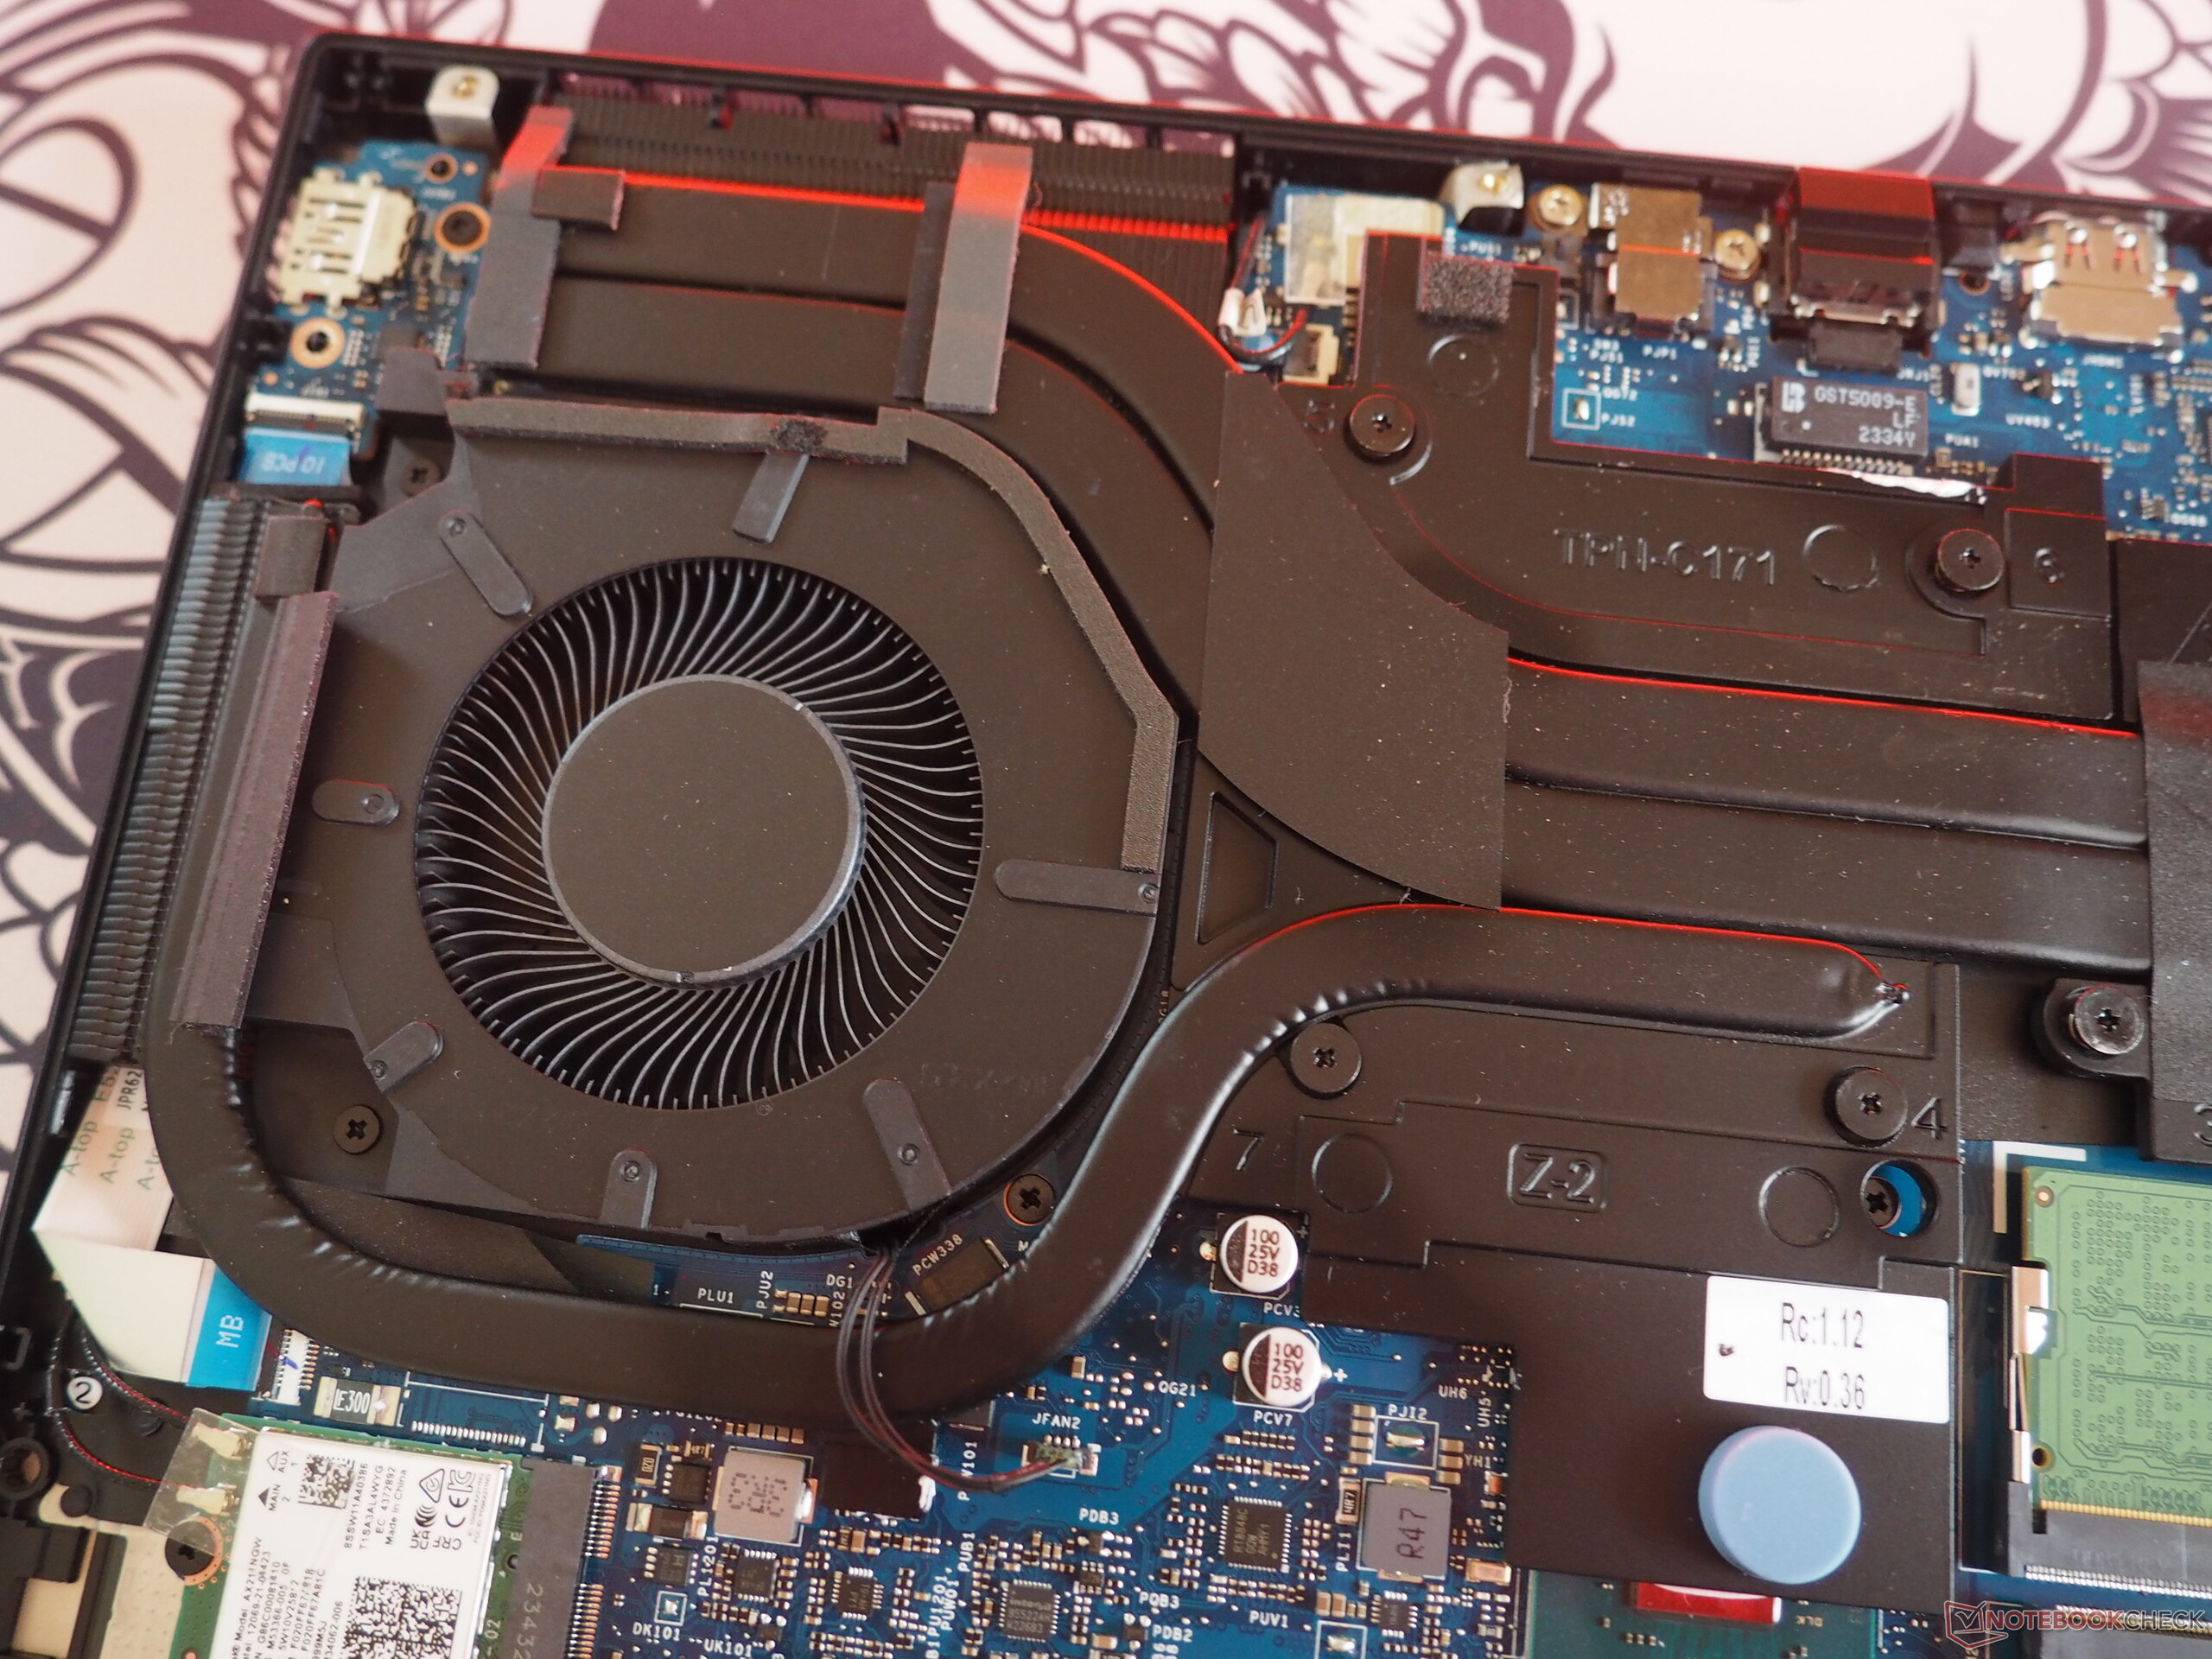
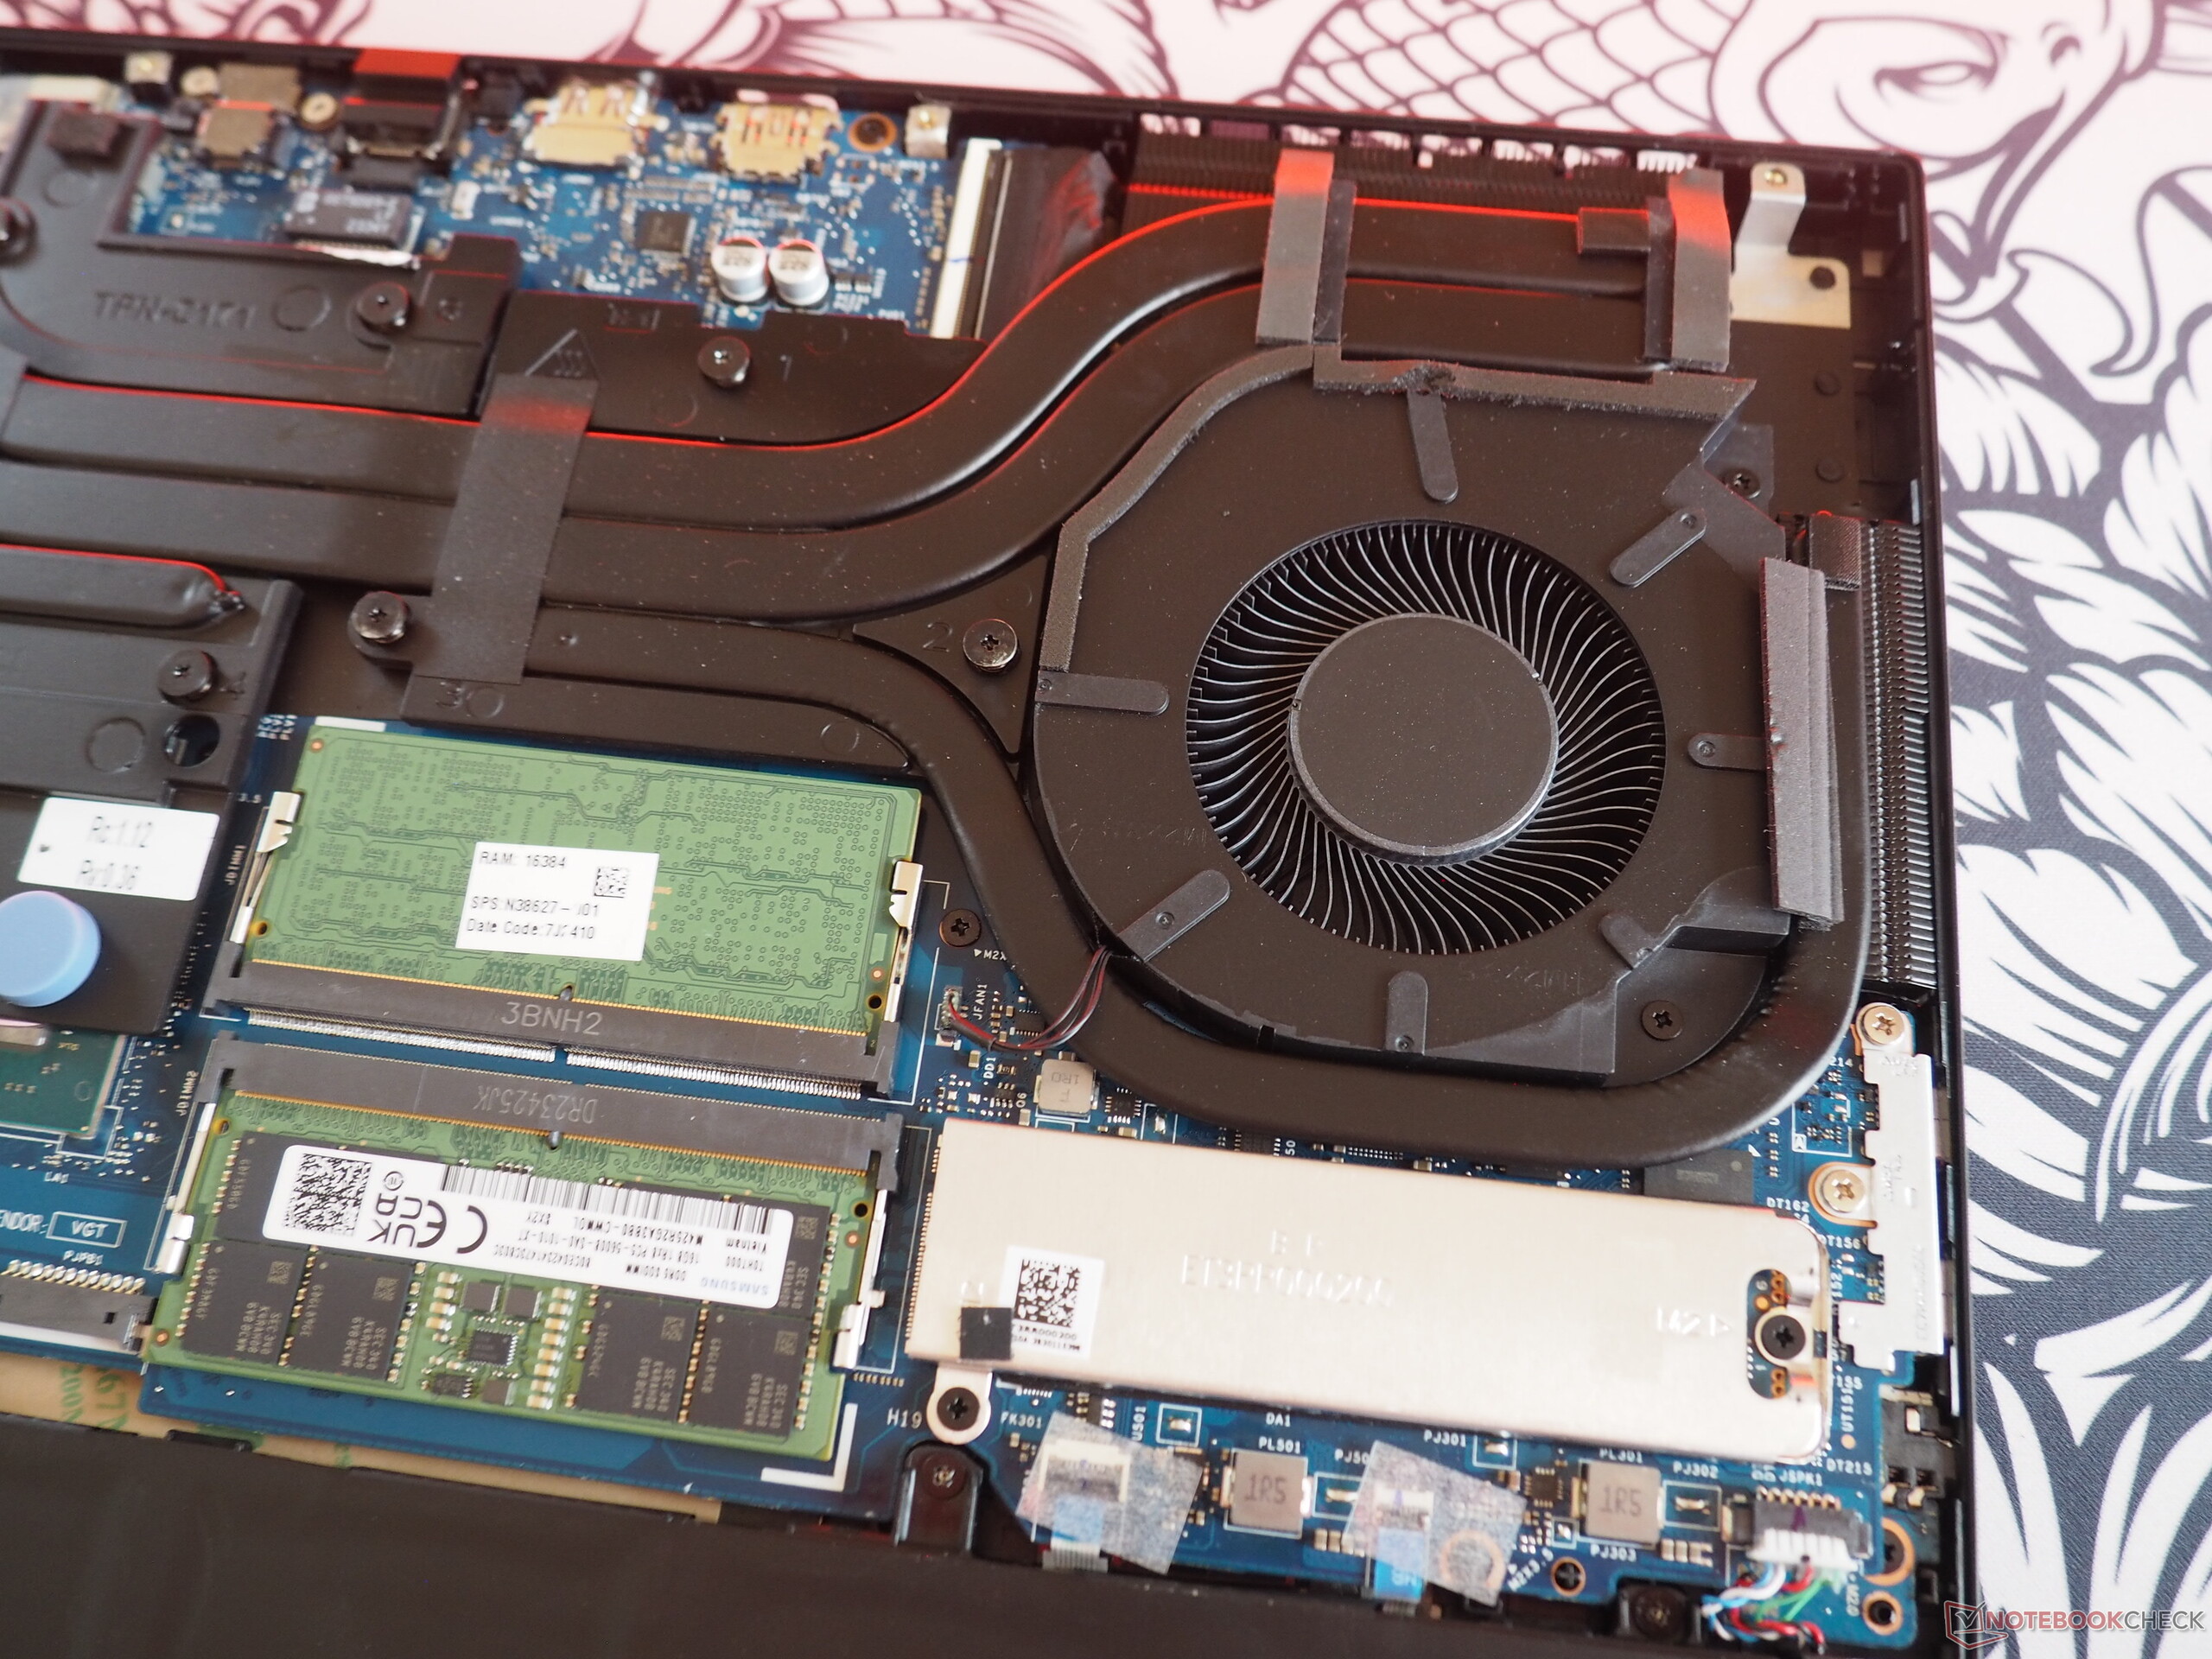
Konserwacja
Jeśli chodzi o konserwację, Omen 16 nie jest szczególnie skomplikowany. Po odkręceniu sześciu małych śrubek z łbem krzyżowym, płytę bazową można podnieść z zakotwiczonej pozycji za pomocą płaskiego narzędzia. Wewnątrz urządzenia wszystkie ważne komponenty są dostępne, czy to banki pamięci RAM, bateria, gniazdo M.2, wentylatory czy moduł bezprzewodowy.
Gwarancja
Gwarancja jest udzielana na 24 miesiące.
Urządzenia wejściowe
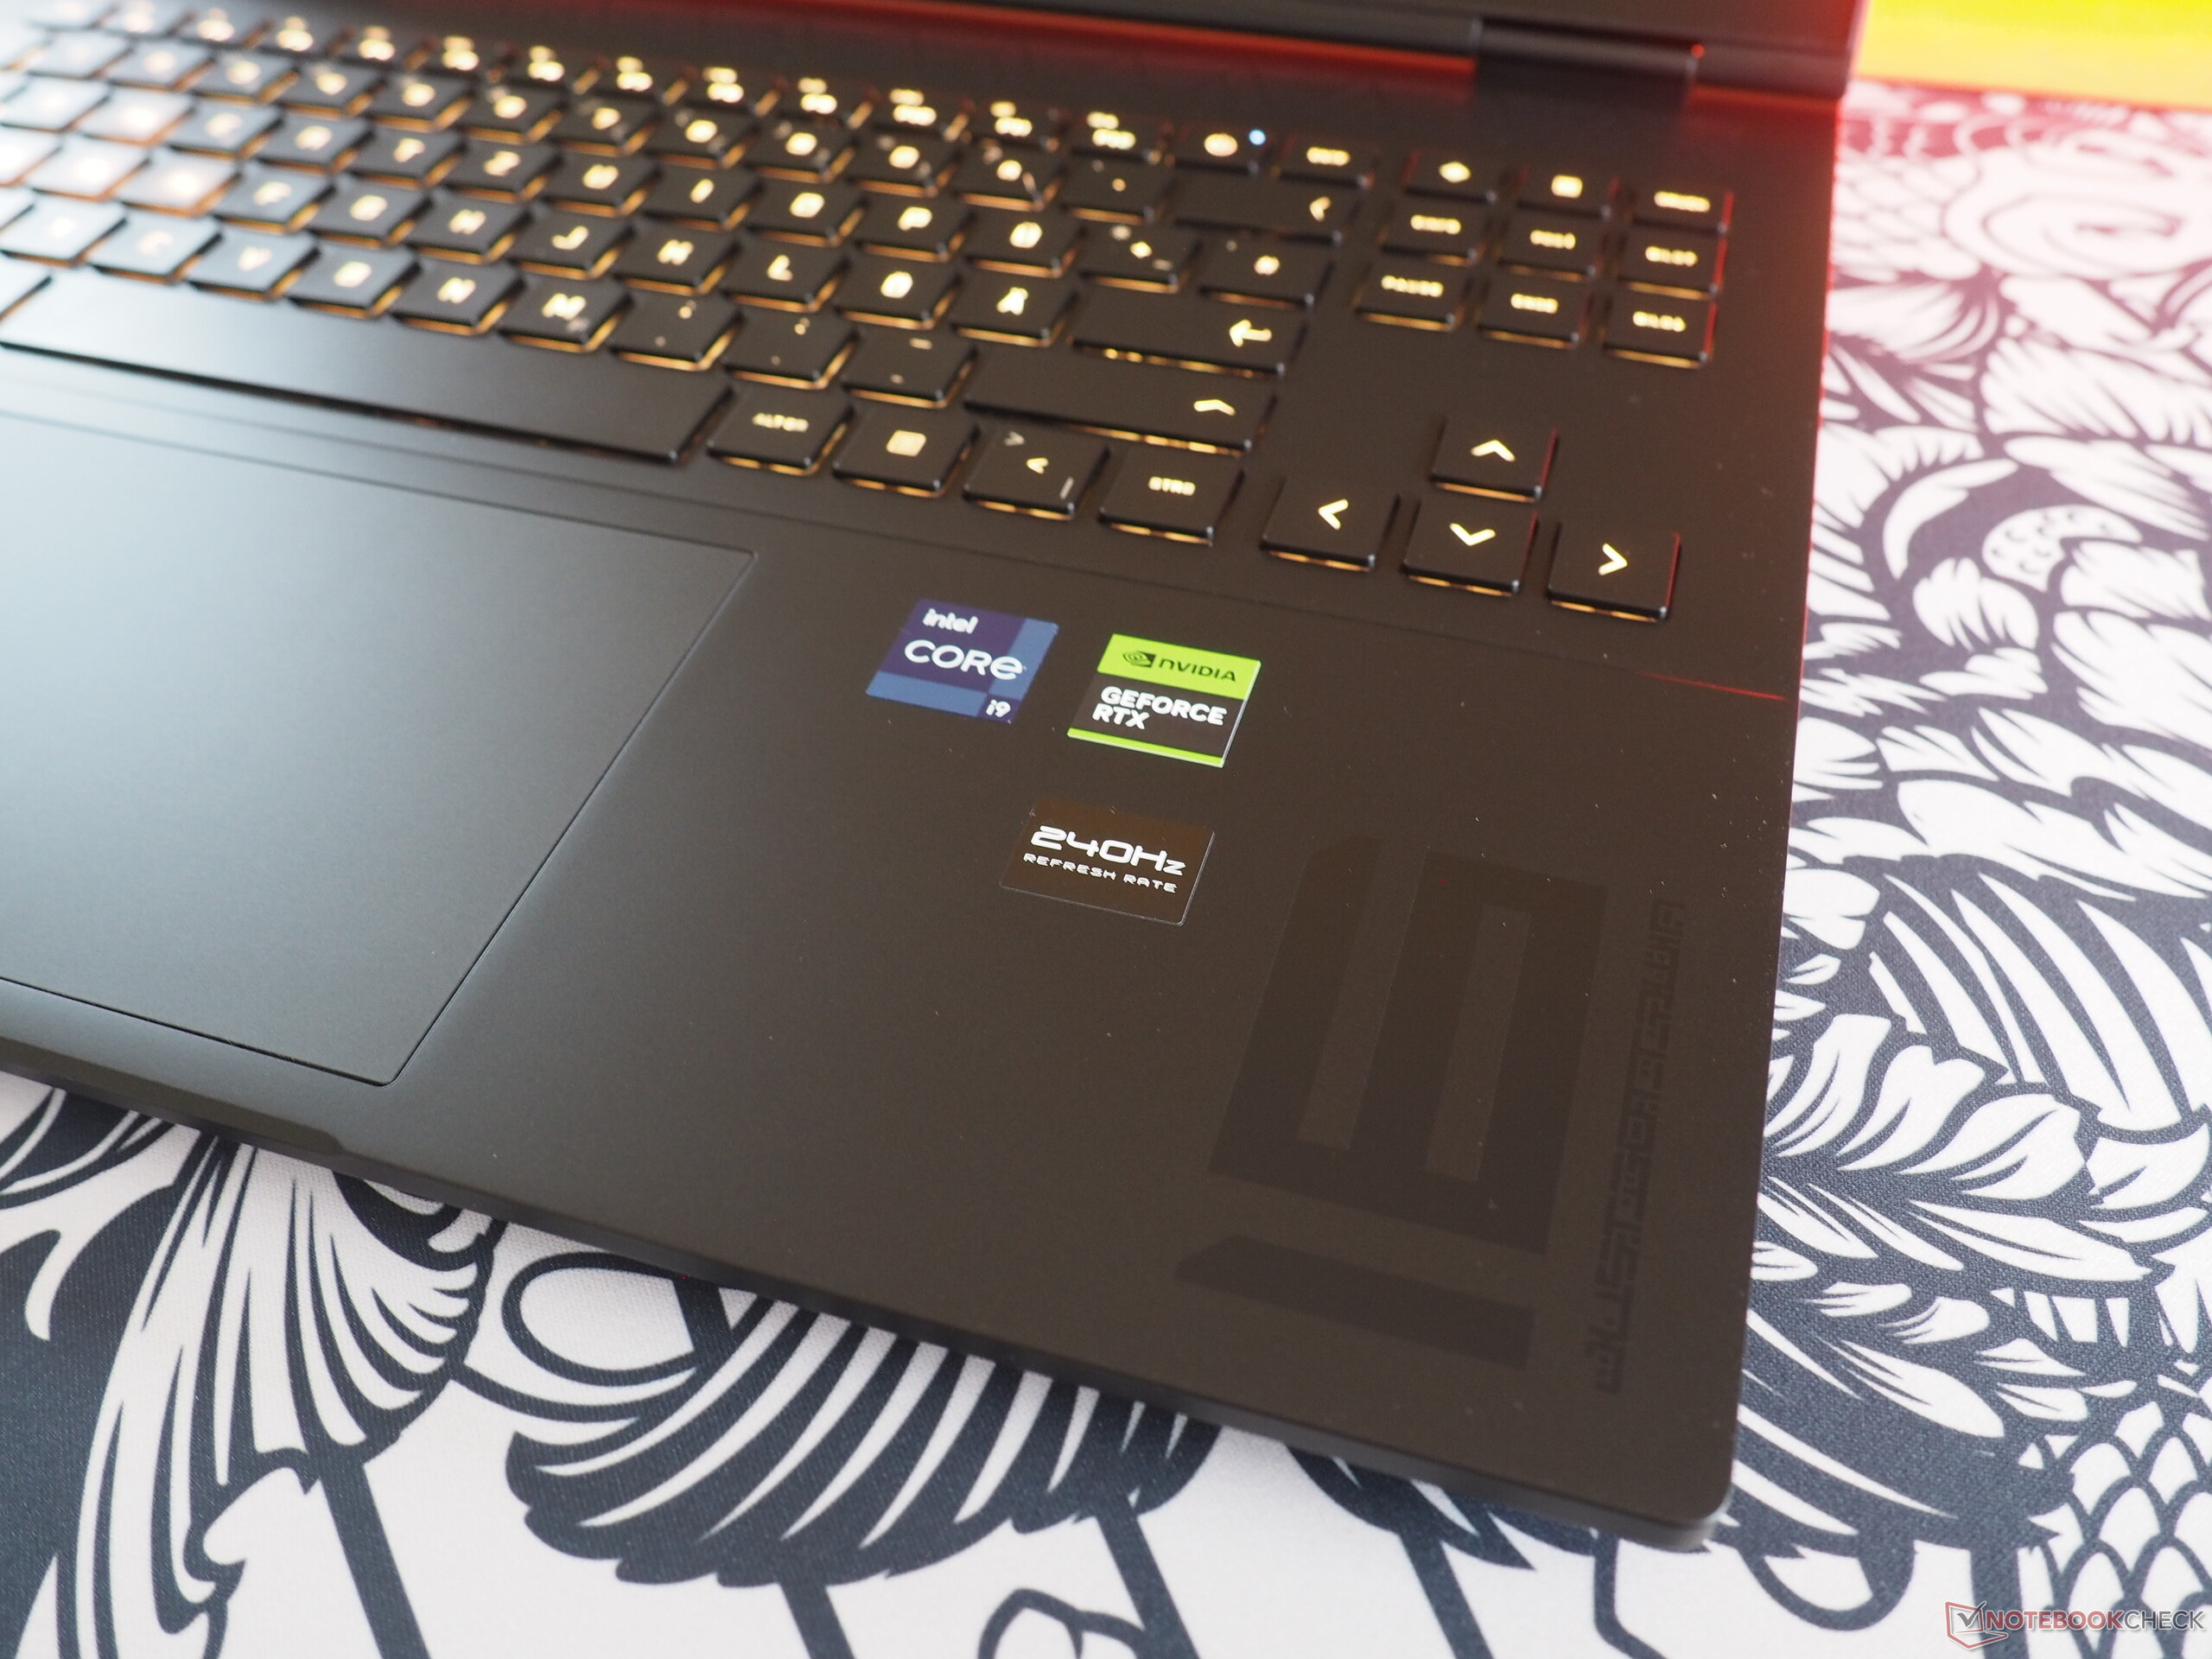
Klawiatura
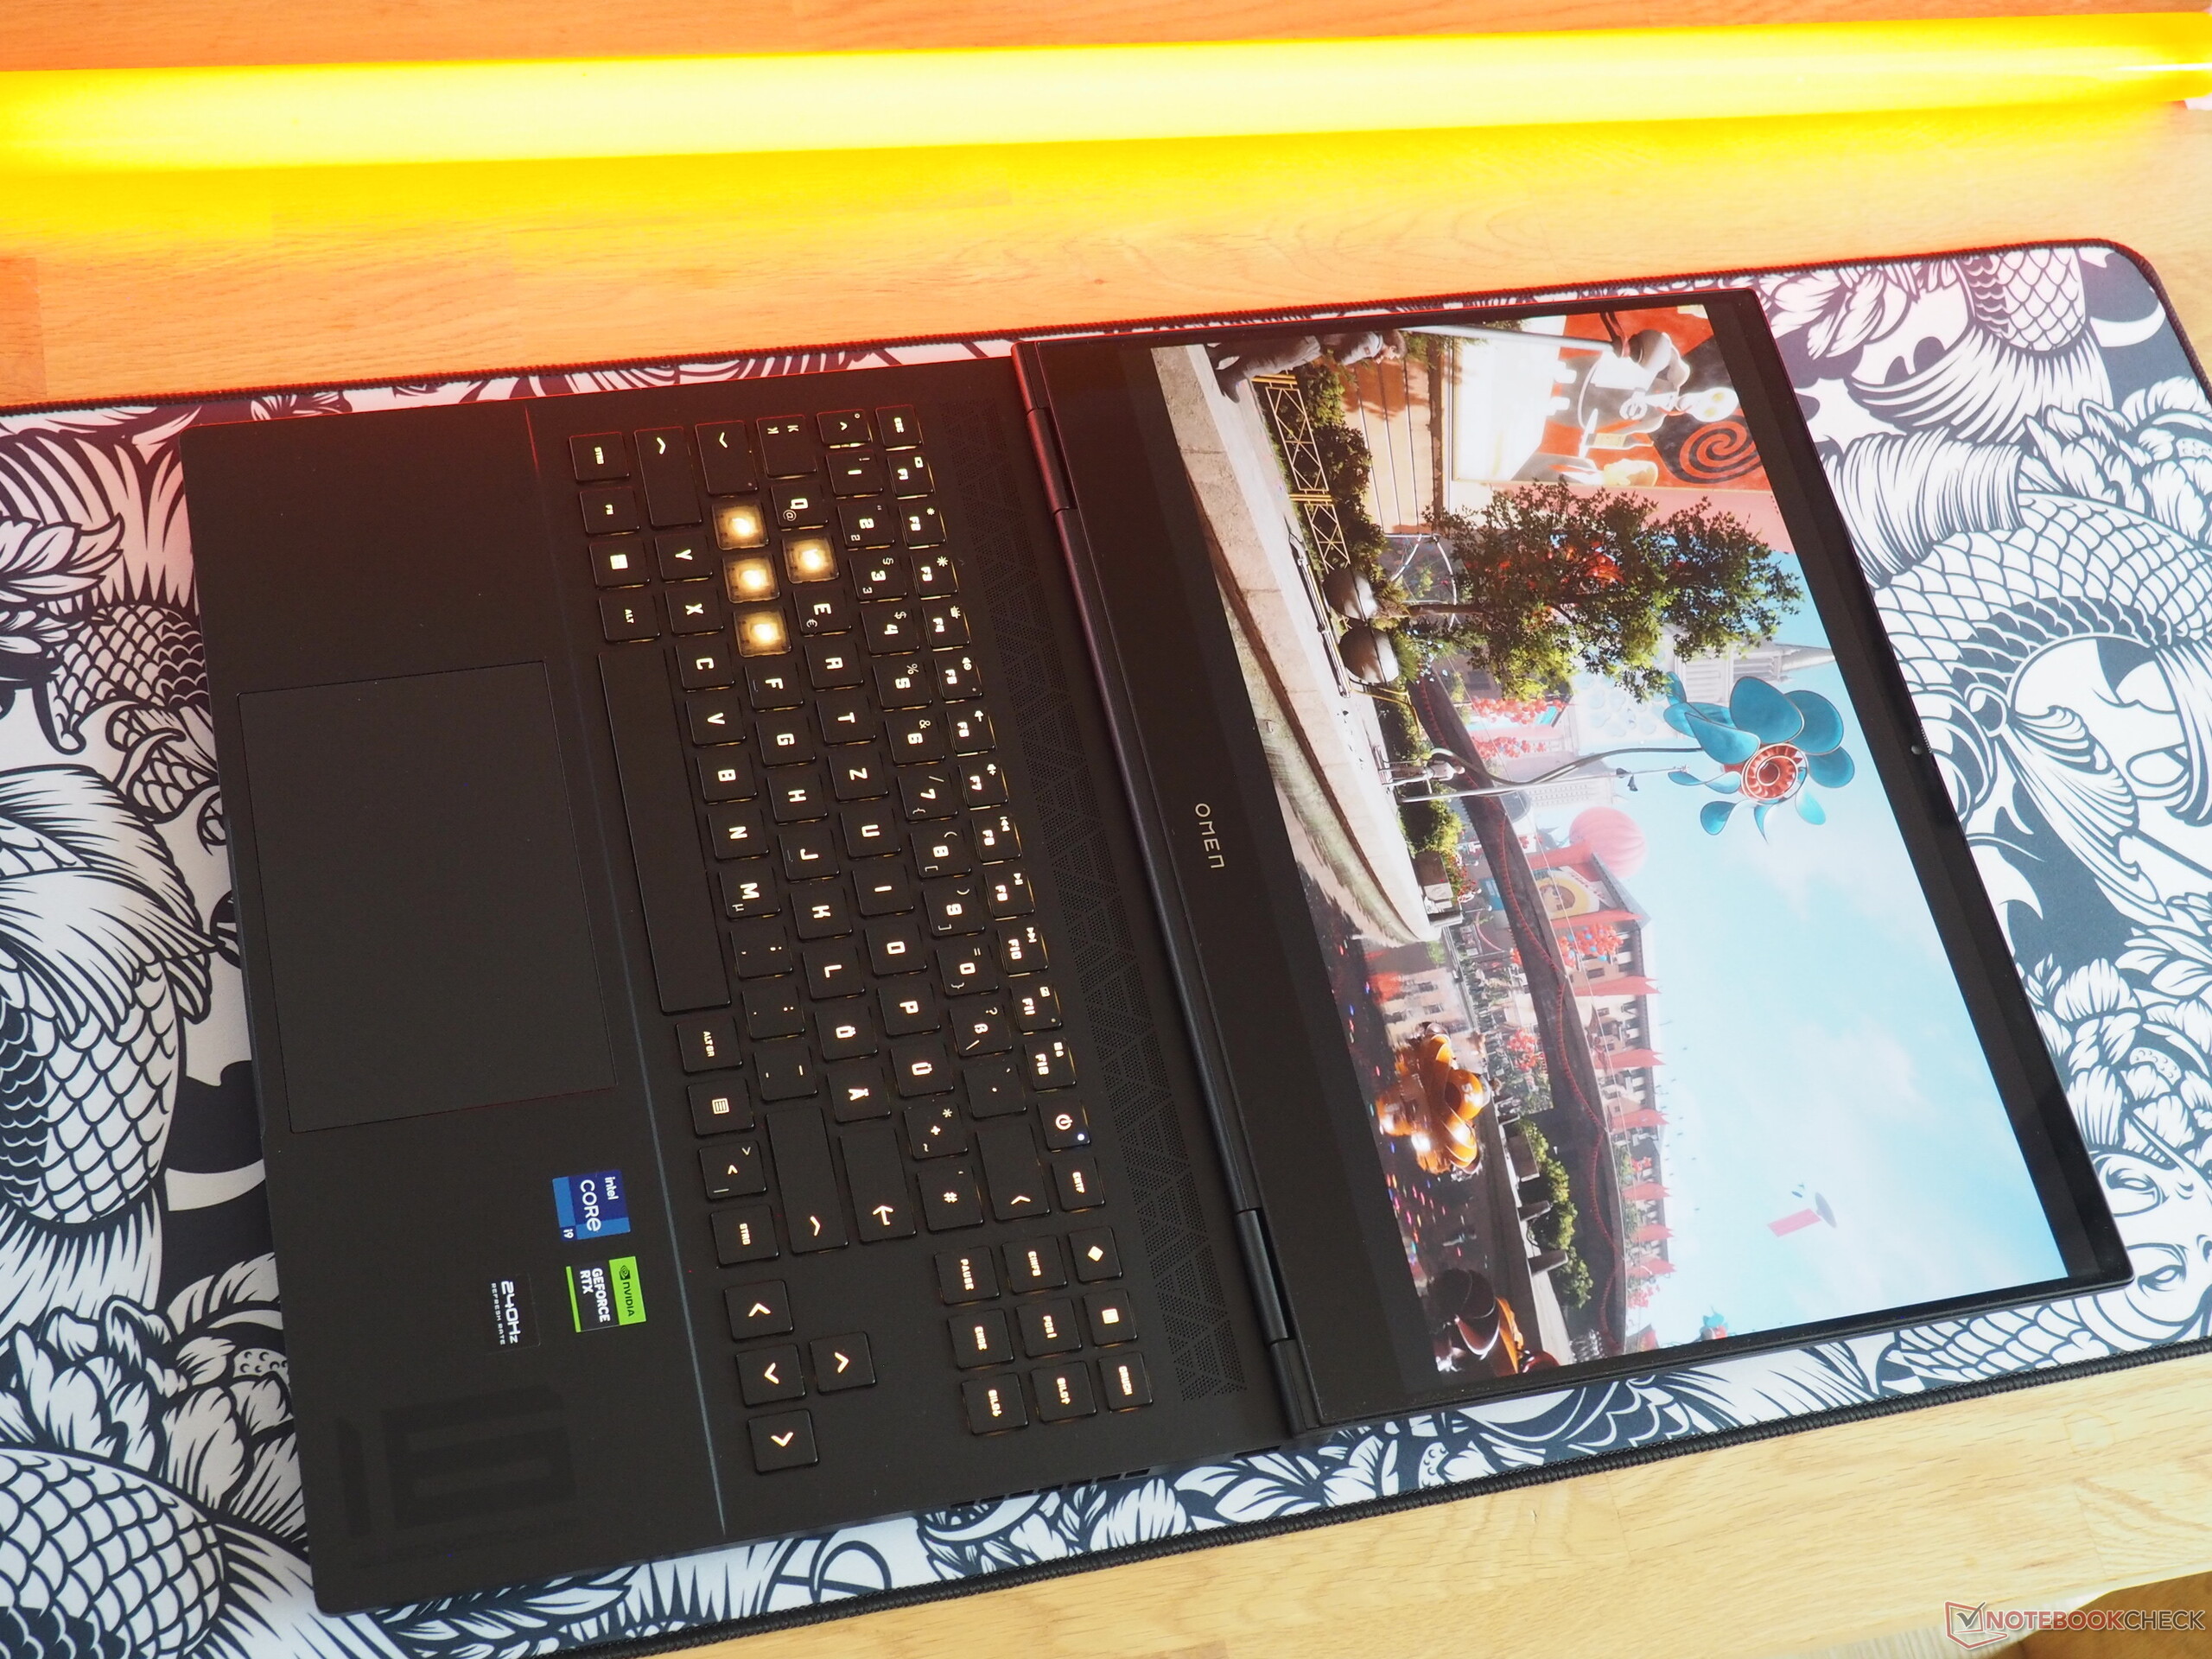
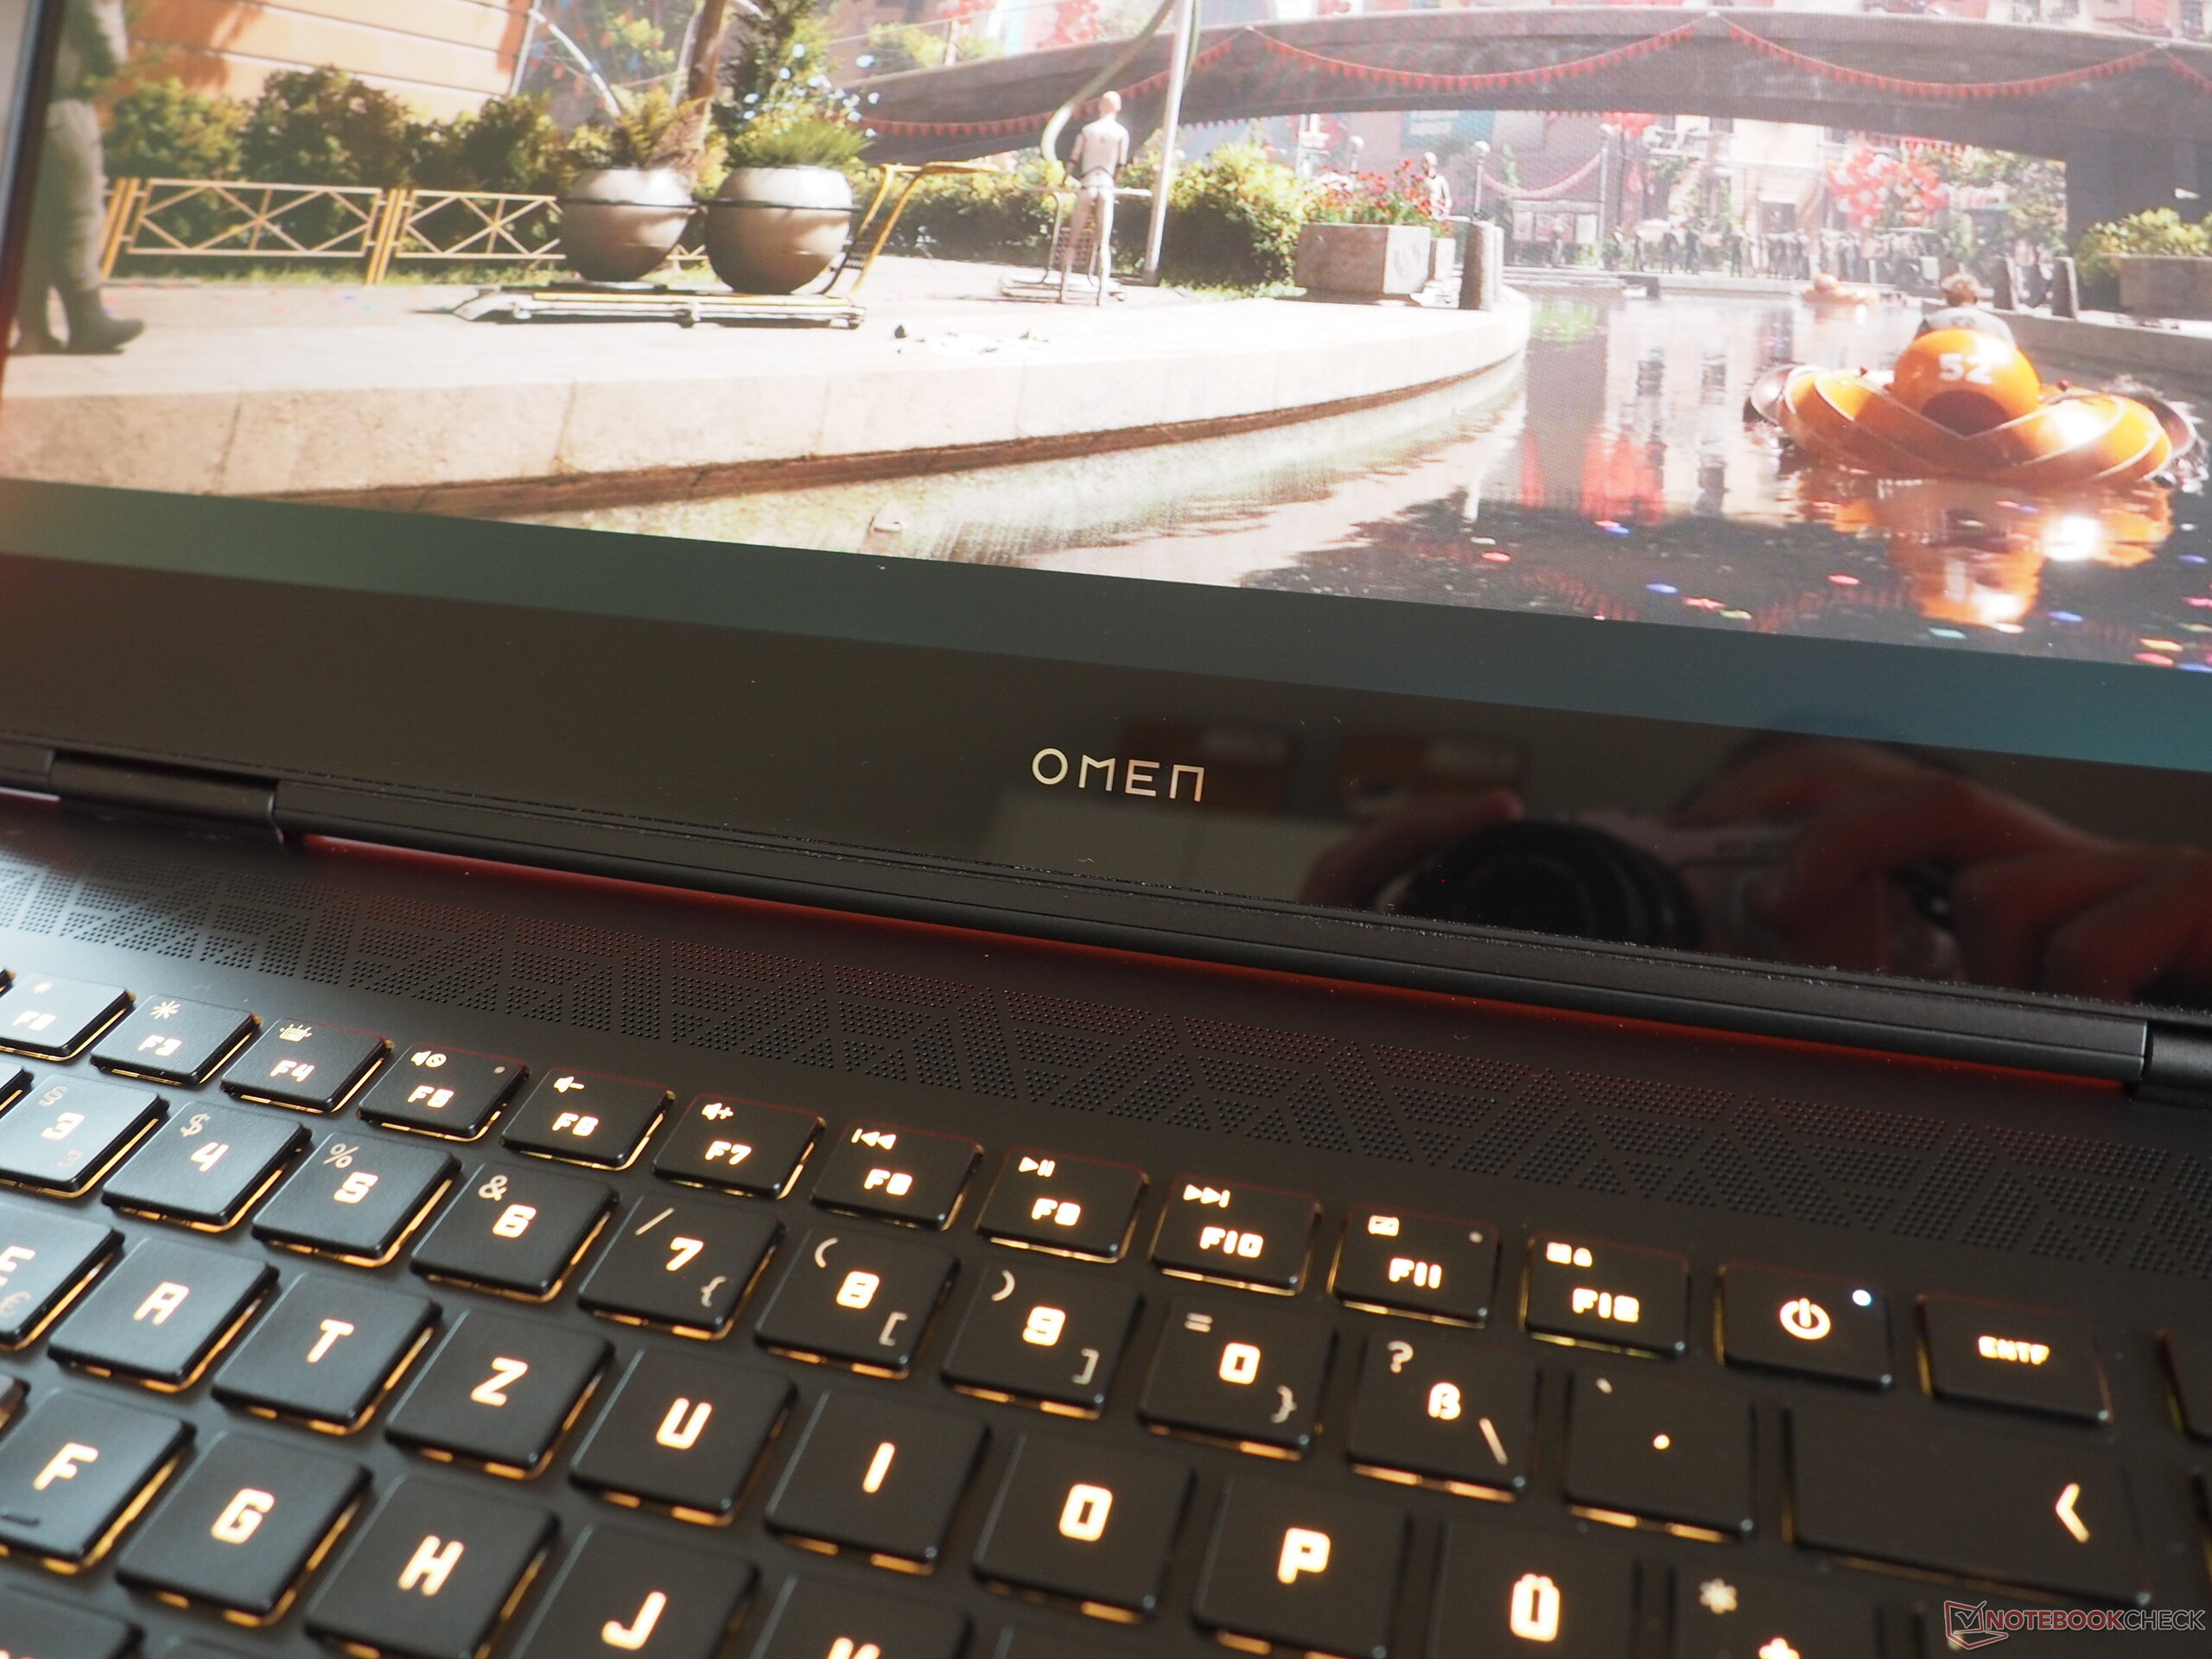
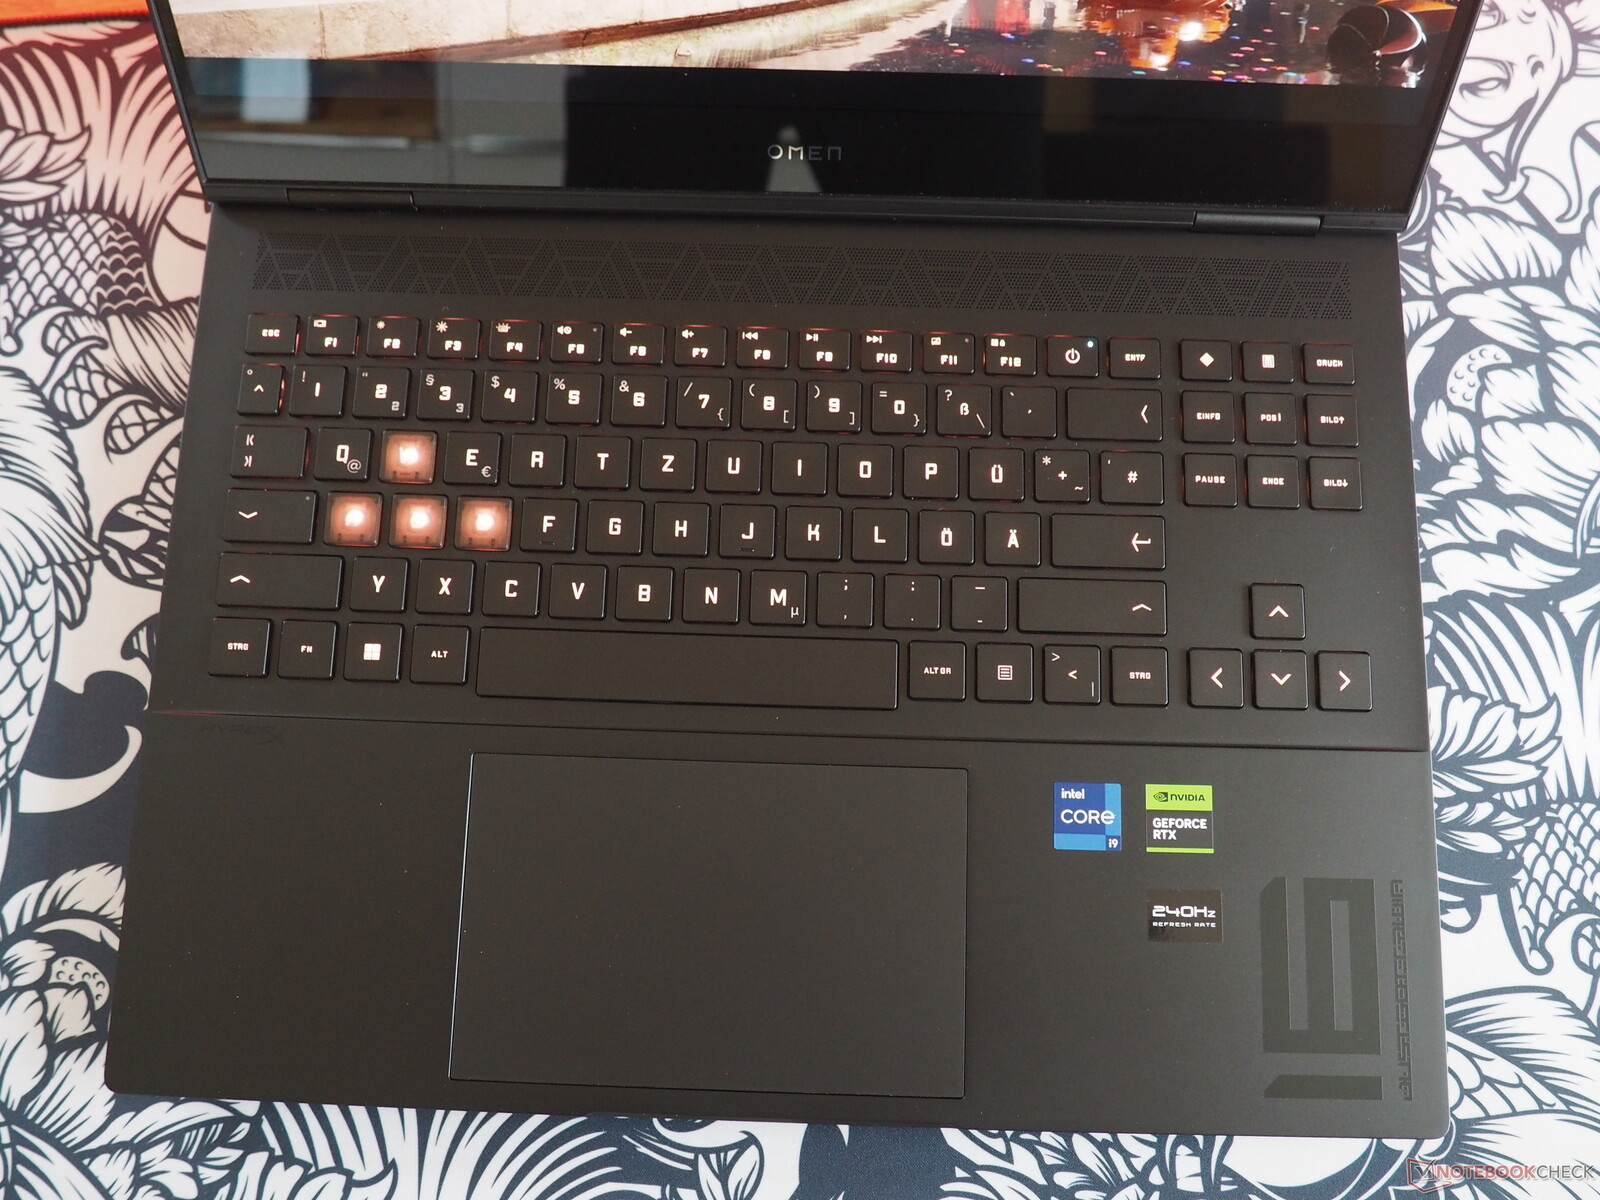
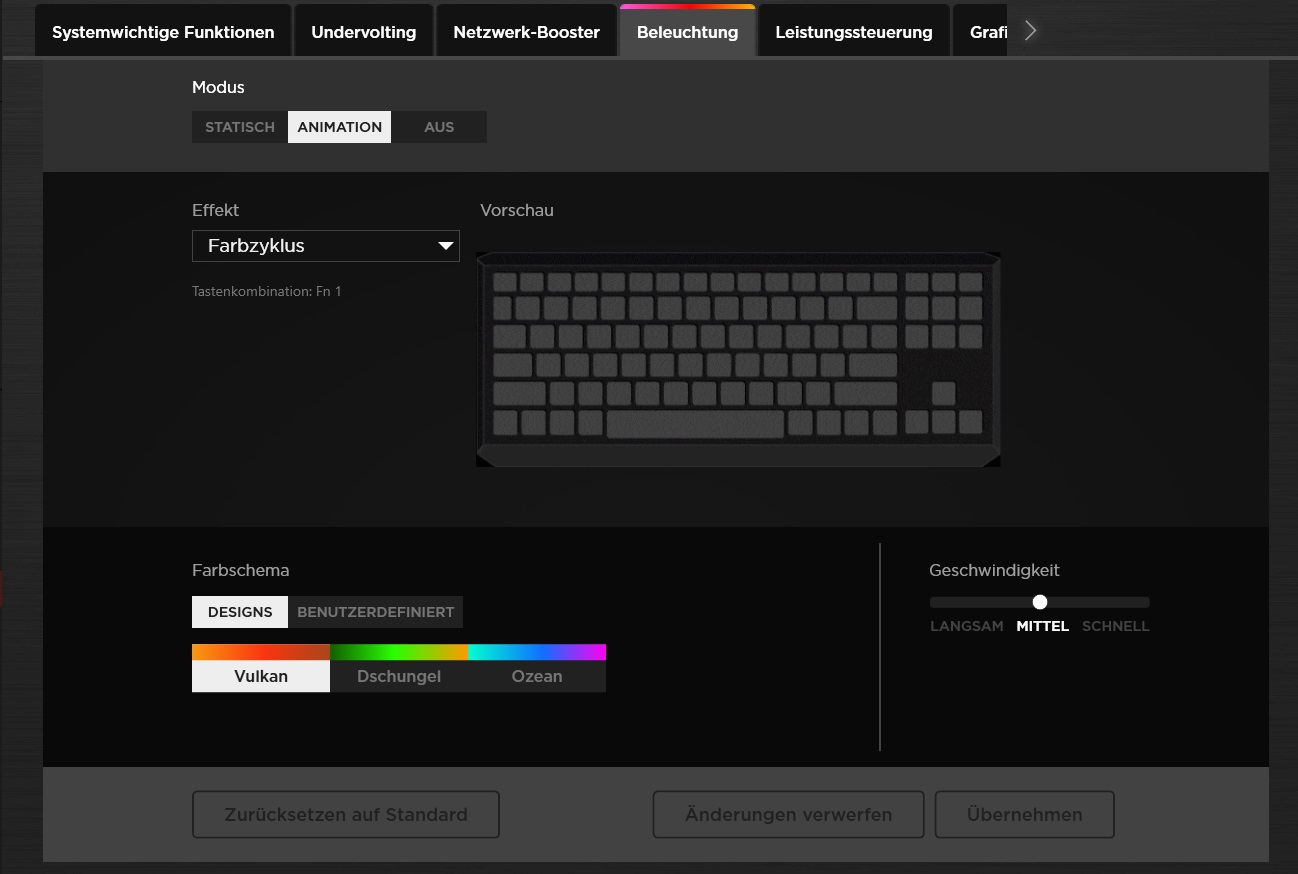
Dzięki przezroczystym klawiszom WASD, HP postawiło na wygląd charakterystyczny dla graczy. Układ jest bardzo unikalny, a nawet wymaga przyzwyczajenia. Producent nie zdecydował się na zainstalowanie klawiatury numerycznej, a zamiast tego dał 16-calowemu urządzeniu oddzielne, dobrze dopasowane klawisze strzałek. Inne decyzje (na przykład umiejscowienie przycisku zasilania) są naprawdę trudne do zrozumienia. Wrażenia z pisania na klawiaturze są mierne i HP musiało użyć mechanicznego modelu, aby uzyskać lepsze sprzężenie zwrotne. Fani podświetlanych klawiszy mogą oczekiwać wielu kolorów.
Panel dotykowy
Przy wymiarach około 13,5 x 8,5 cm, przyjemnie duży touchpad można opisać jako skromny, jeśli chodzi o precyzję, płynność i obszary kliknięć. Podobnie obsługa gestów jest intuicyjna.
Wyświetlacz
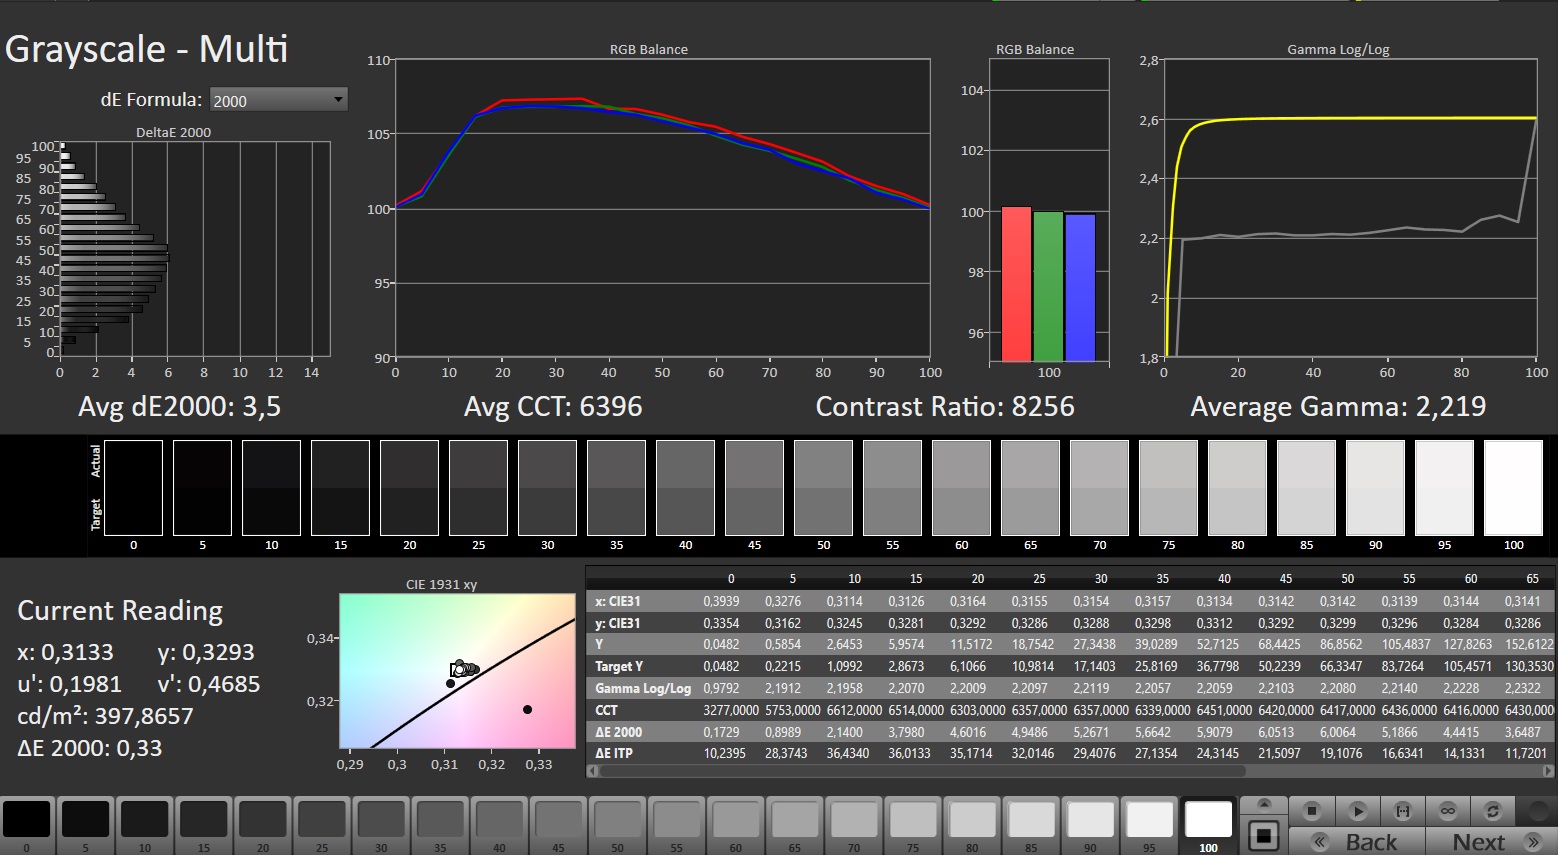
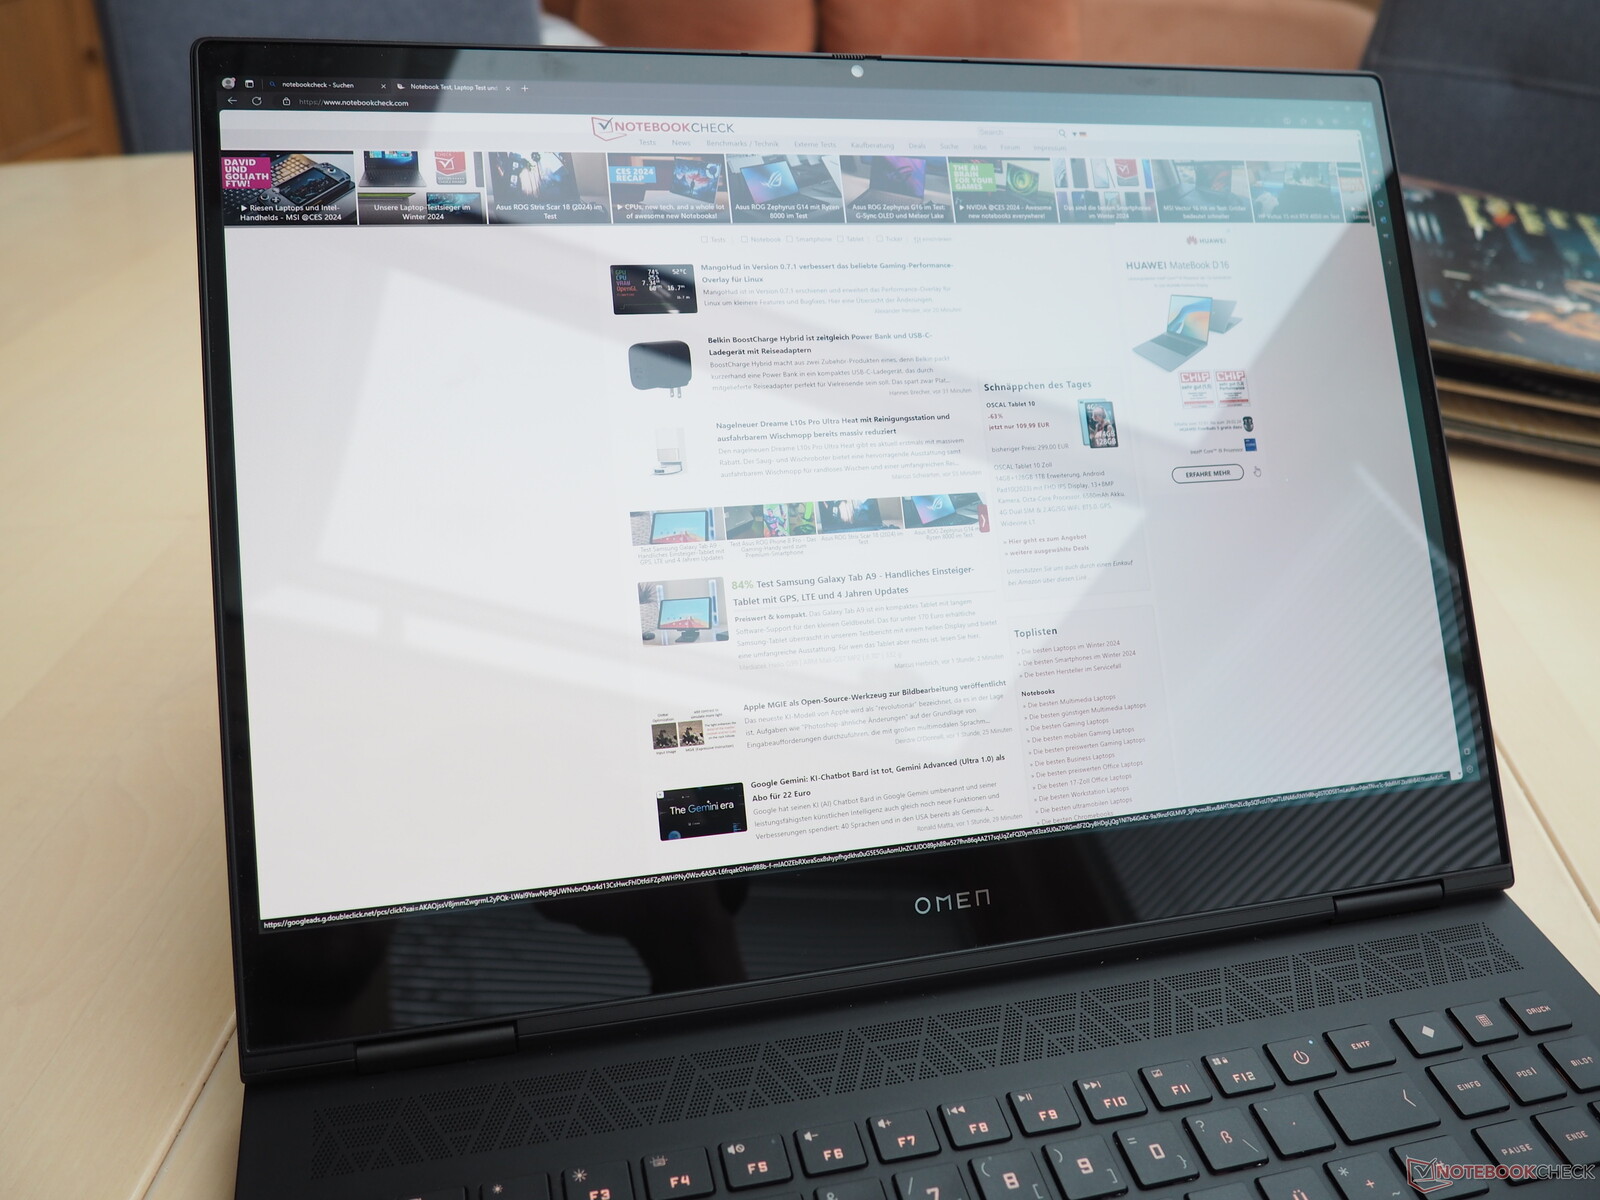
Opinie na temat paneli OLED są różne. Z negatywnych stron, kilka problemów to bardzo odblaskowe powierzchnie (które mogą sprawić, że korzystanie na zewnątrz będzie uciążliwe), migotanie ekranu na każdym poziomie jasności i kwestia potencjalnego wypalenia.
| |||||||||||||||||||||||||
rozświetlenie: 98 %
na akumulatorze: 390 cd/m²
kontrast: 19500:1 (czerń: 0.02 cd/m²)
ΔE ColorChecker Calman: 1.94 | ∀{0.5-29.43 Ø4.71}
calibrated: 4.21
ΔE Greyscale Calman: 1.5 | ∀{0.09-98 Ø4.96}
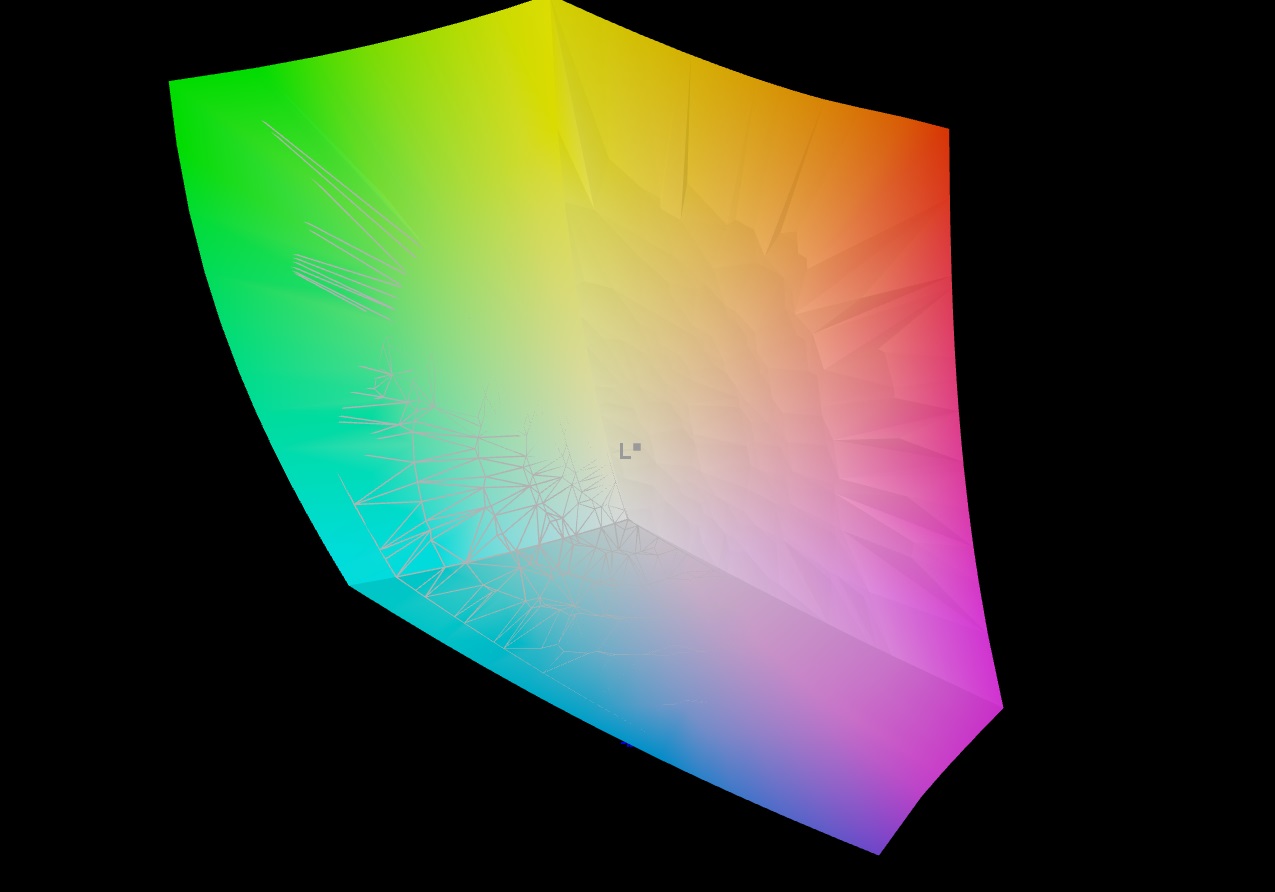
97% AdobeRGB 1998 (Argyll 3D)
100% sRGB (Argyll 3D)
99.8% Display P3 (Argyll 3D)
Gamma: 2.221
CCT: 6395 K
| HP Omen Transcend 16-u1095ng ATNA60DL02-0 (SDC41A4), OLED, 2560x1600, 16" | HP Omen Transcend 16 AUOA3A6, Mini-LED, 2560x1600, 16" | Asus ROG Zephyrus G16 2024 GU605M ATNA60DL01-0, OLED, 2560x1600, 16" | Schenker XMG CORE 16 (L23) BOE0AF0 (), IPS, 2560x1600, 16" | Lenovo Legion Pro 5 16ARX8 CSOT T3 MNG007DA1-Q, IPS, 2560x1600, 16" | |
|---|---|---|---|---|---|
| Display | -4% | 0% | -20% | -18% | |
| Display P3 Coverage (%) | 99.8 | 99.2 -1% | 99.9 0% | 68.3 -32% | 70.4 -29% |
| sRGB Coverage (%) | 100 | 100 0% | 100 0% | 98.6 -1% | 99.6 0% |
| AdobeRGB 1998 Coverage (%) | 97 | 87.6 -10% | 96.9 0% | 69.6 -28% | 72.6 -25% |
| Response Times | -13550% | -18% | -4850% | -3925% | |
| Response Time Grey 50% / Grey 80% * (ms) | 0.2 ? | 26.4 ? -13100% | 0.22 ? -10% | 13.2 ? -6500% | 7 ? -3400% |
| Response Time Black / White * (ms) | 0.2 ? | 28.2 ? -14000% | 0.25 ? -25% | 6.6 ? -3200% | 9.1 ? -4450% |
| PWM Frequency (Hz) | 120 ? | 3506 ? | 960 ? | ||
| Screen | -47% | 0% | -203% | -161% | |
| Brightness middle (cd/m²) | 390 | 791.1 103% | 416 7% | 376 -4% | 355.3 -9% |
| Brightness (cd/m²) | 392 | 800 104% | 418 7% | 358 -9% | 340 -13% |
| Brightness Distribution (%) | 98 | 95 -3% | 96 -2% | 88 -10% | 91 -7% |
| Black Level * (cd/m²) | 0.02 | 0.04 -100% | 0.33 -1550% | 0.32 -1500% | |
| Contrast (:1) | 19500 | 19778 1% | 1139 -94% | 1110 -94% | |
| Colorchecker dE 2000 * | 1.94 | 4.37 -125% | 1.6 18% | 2.74 -41% | 1.13 42% |
| Colorchecker dE 2000 max. * | 4.26 | 10.39 -144% | 2.1 51% | 6.78 -59% | 2.78 35% |
| Colorchecker dE 2000 calibrated * | 4.21 | 1.04 75% | 0.88 79% | 0.32 92% | |
| Greyscale dE 2000 * | 1.5 | 6.5 -333% | 2.7 -80% | 3.57 -138% | 1.4 7% |
| Gamma | 2.221 99% | 2.28 96% | 2.16 102% | 2.4 92% | 2.24 98% |
| CCT | 6395 102% | 6000 108% | 6331 103% | 7246 90% | 6372 102% |
| Całkowita średnia (program / ustawienia) | -4534% /
-1967% | -6% /
-3% | -1691% /
-828% | -1368% /
-668% |
* ... im mniej tym lepiej
W zamian, technologia OLED osiąga dobre wyniki dzięki wspaniałym poziomom czerni (prawie 0,0 cd/m²), co prowadzi do doskonałego współczynnika kontrastu, do którego panele IPS nie są w stanie się zbliżyć. To samo dotyczy stabilności kąta widzenia.
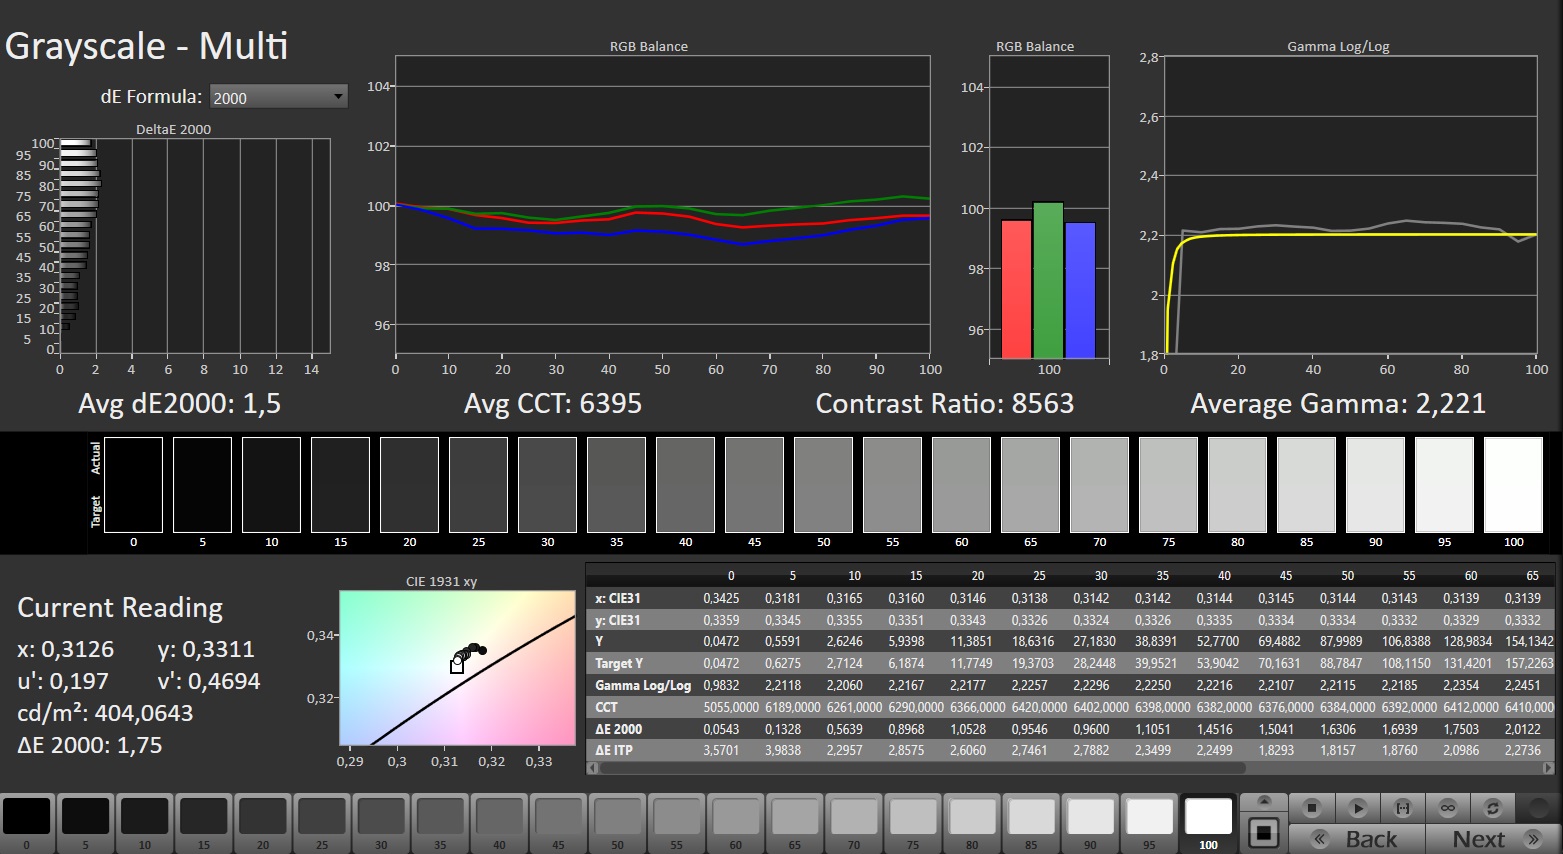
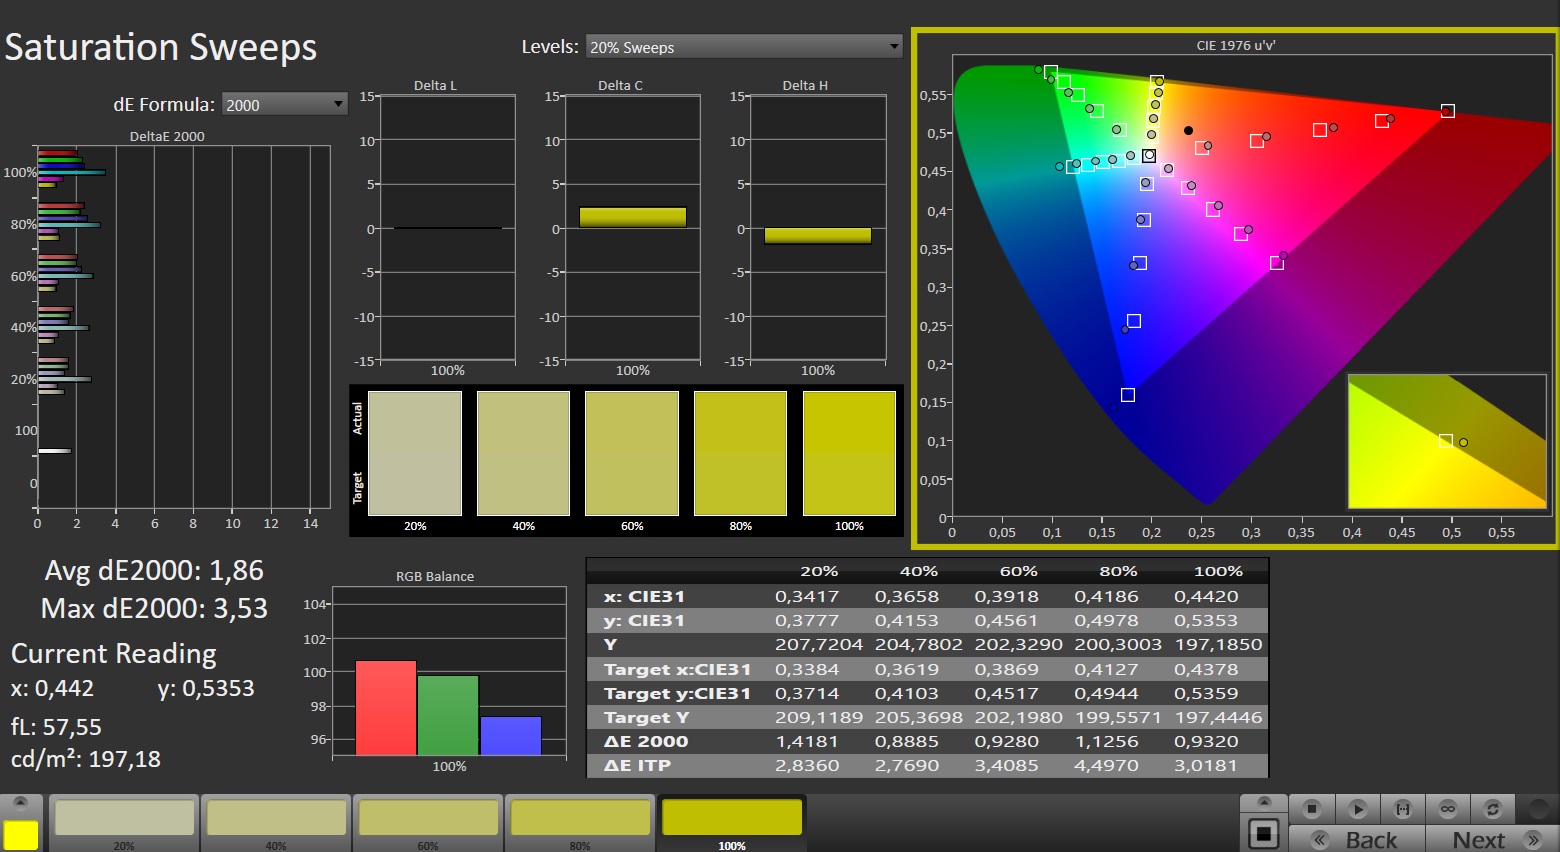
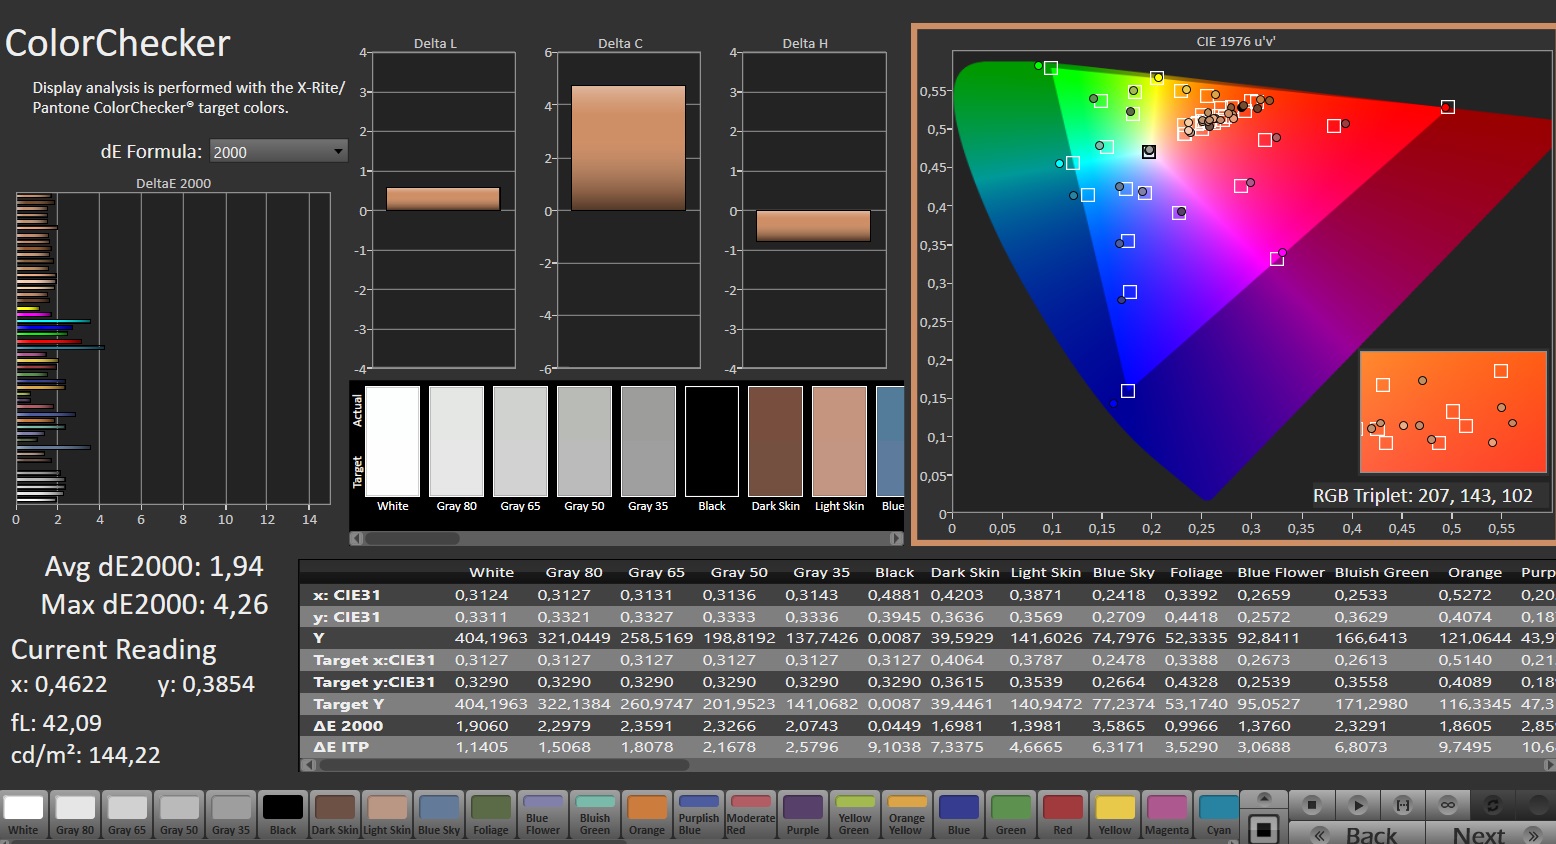
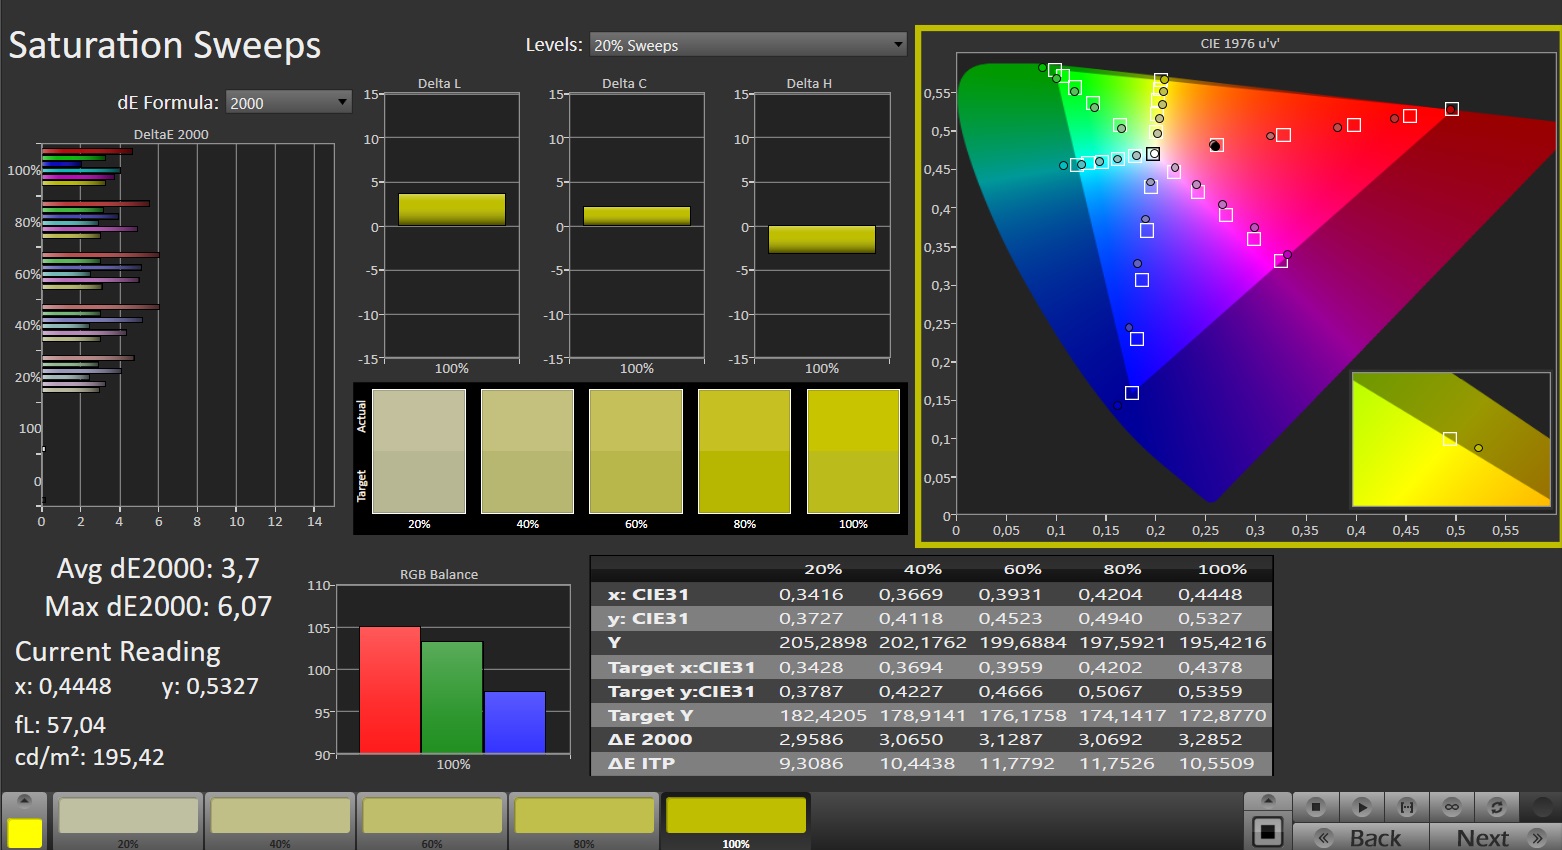
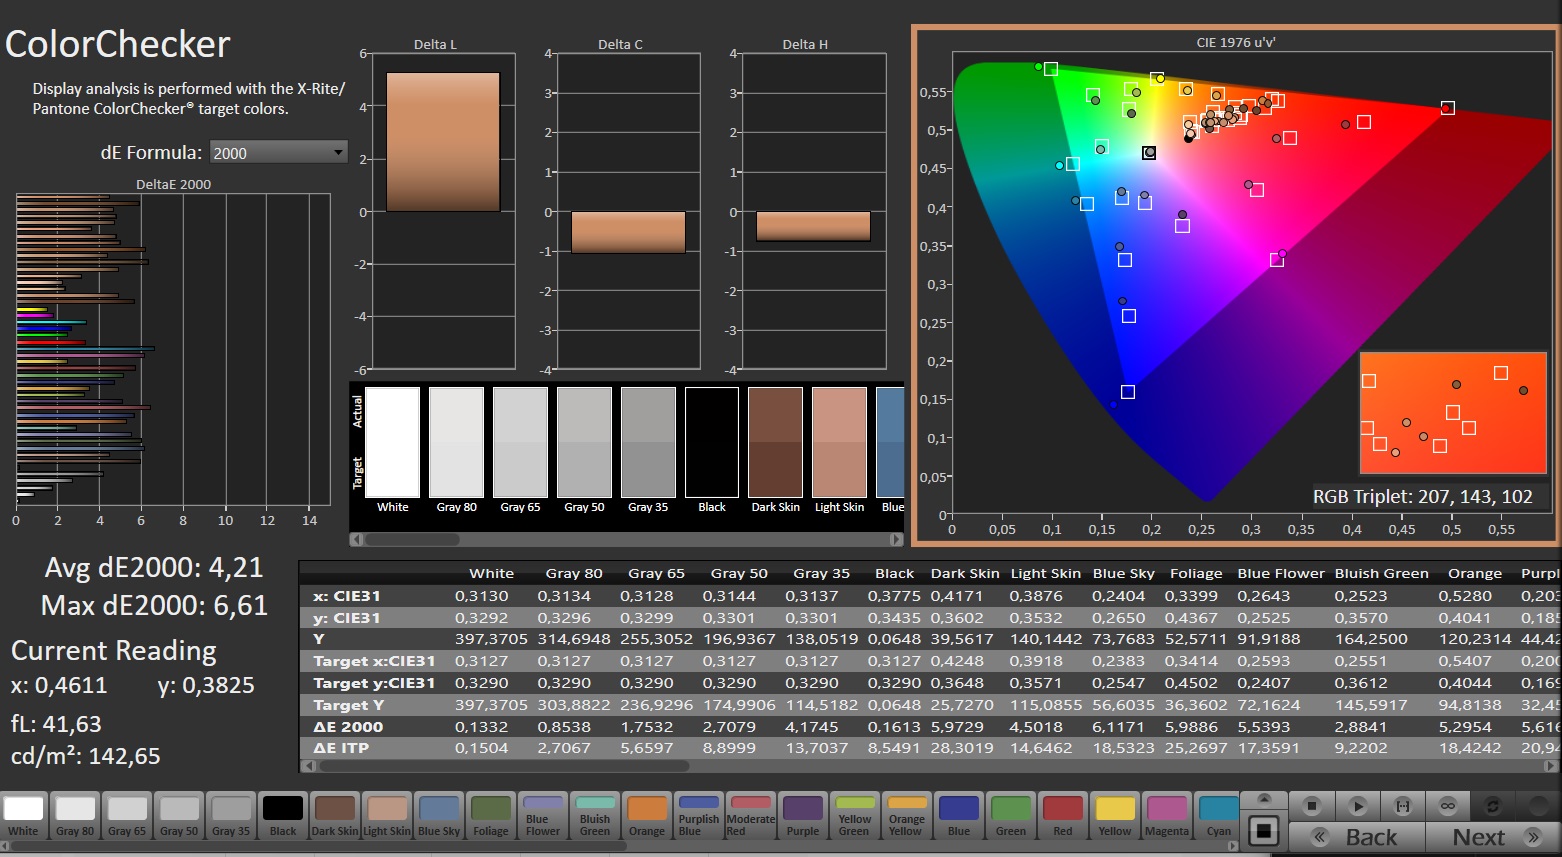
Dodatkową atrakcją jest bogata przestrzeń kolorów: 100% DCI P3 i 97% AdobeRGB nie są czymś oczywistym w świecie gier. Podobnie jest z dokładnością odwzorowania kolorów, która już przed kalibracją była imponująca.


Pochwały należą się również za krótki czas reakcji: Klasyczne panele IPS mogą jedynie pomarzyć o 0,2 ms. Wyświetlacz mini LED poprzednika był znacznie jaśniejszy (800 vs 392 cd/m²), ale też znacznie wolniejszy.

Wyświetl czasy reakcji
| ↔ Czas reakcji od czerni do bieli | ||
|---|---|---|
| 0.2 ms ... wzrost ↗ i spadek ↘ łącznie | ↗ 0.1 ms wzrost | 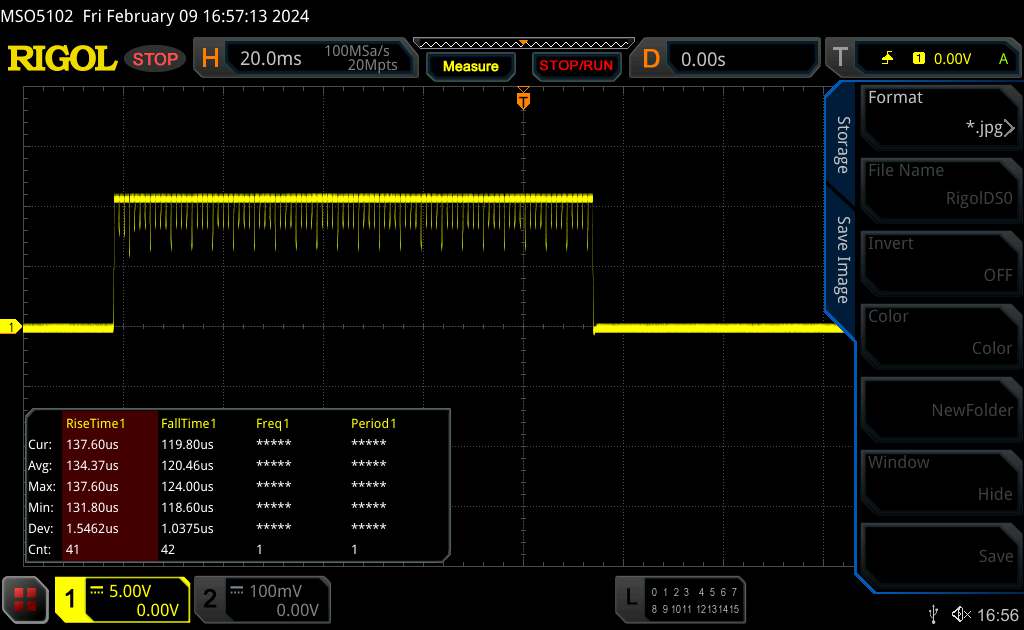 |
| ↘ 0.1 ms upadek | ||
| W naszych testach ekran wykazuje bardzo szybką reakcję i powinien bardzo dobrze nadawać się do szybkich gier. Dla porównania, wszystkie testowane urządzenia wahają się od 0.1 (minimum) do 240 (maksimum) ms. » 0 % wszystkich urządzeń jest lepszych. Oznacza to, że zmierzony czas reakcji jest lepszy od średniej wszystkich testowanych urządzeń (19.8 ms). | ||
| ↔ Czas reakcji 50% szarości do 80% szarości | ||
| 0.2 ms ... wzrost ↗ i spadek ↘ łącznie | ↗ 0.1 ms wzrost | 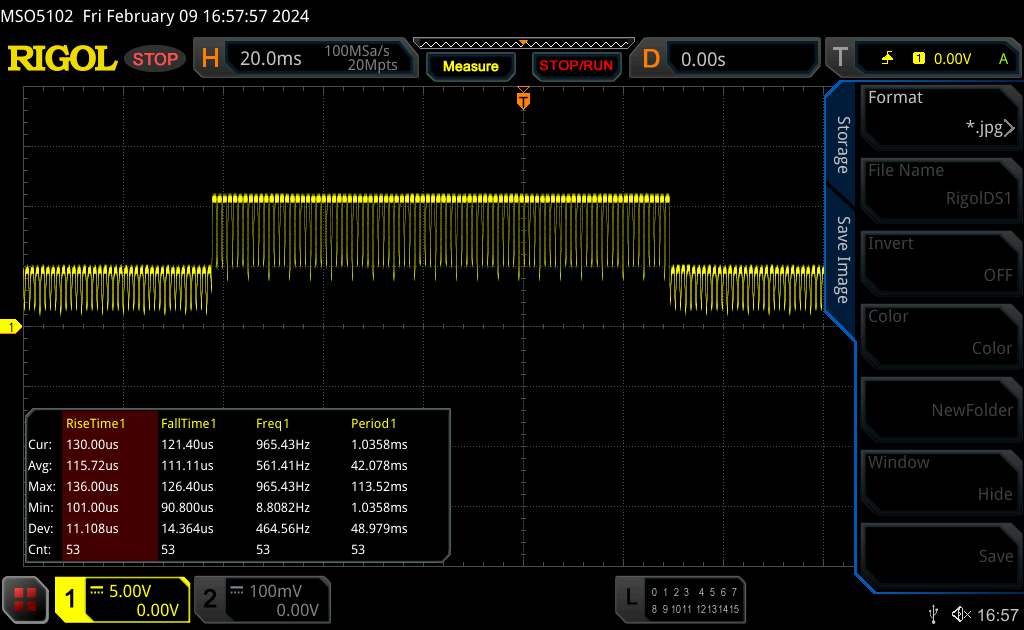 |
| ↘ 0.1 ms upadek | ||
| W naszych testach ekran wykazuje bardzo szybką reakcję i powinien bardzo dobrze nadawać się do szybkich gier. Dla porównania, wszystkie testowane urządzenia wahają się od 0.165 (minimum) do 636 (maksimum) ms. » 0 % wszystkich urządzeń jest lepszych. Oznacza to, że zmierzony czas reakcji jest lepszy od średniej wszystkich testowanych urządzeń (31 ms). | ||
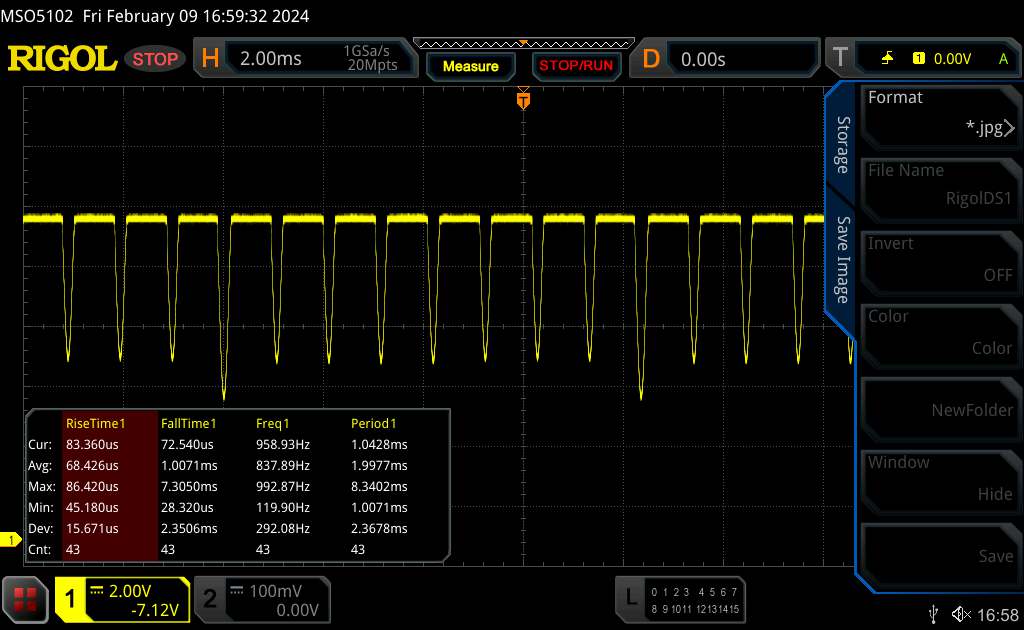
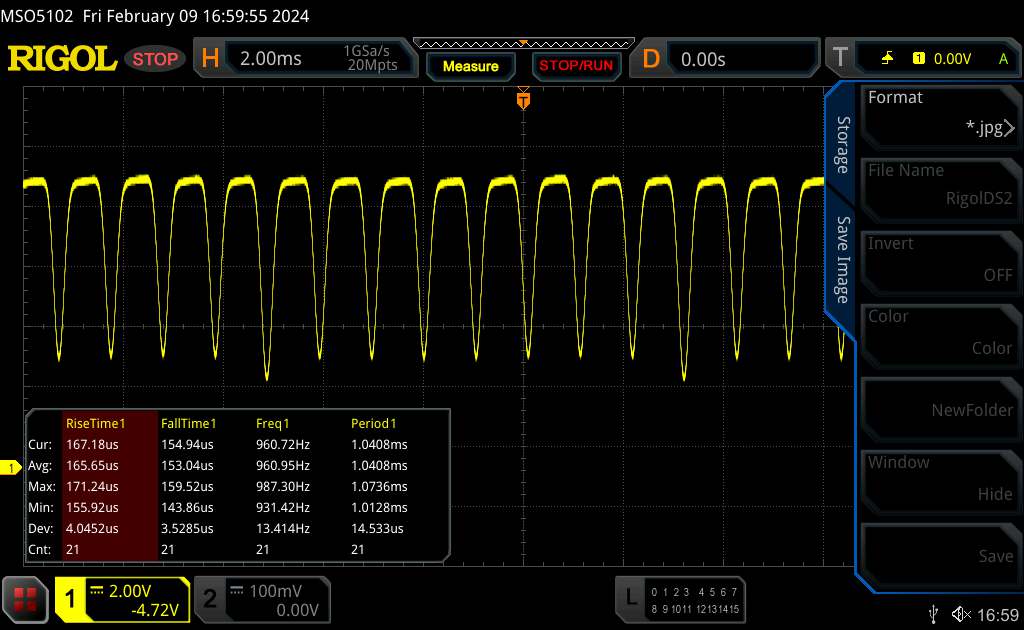
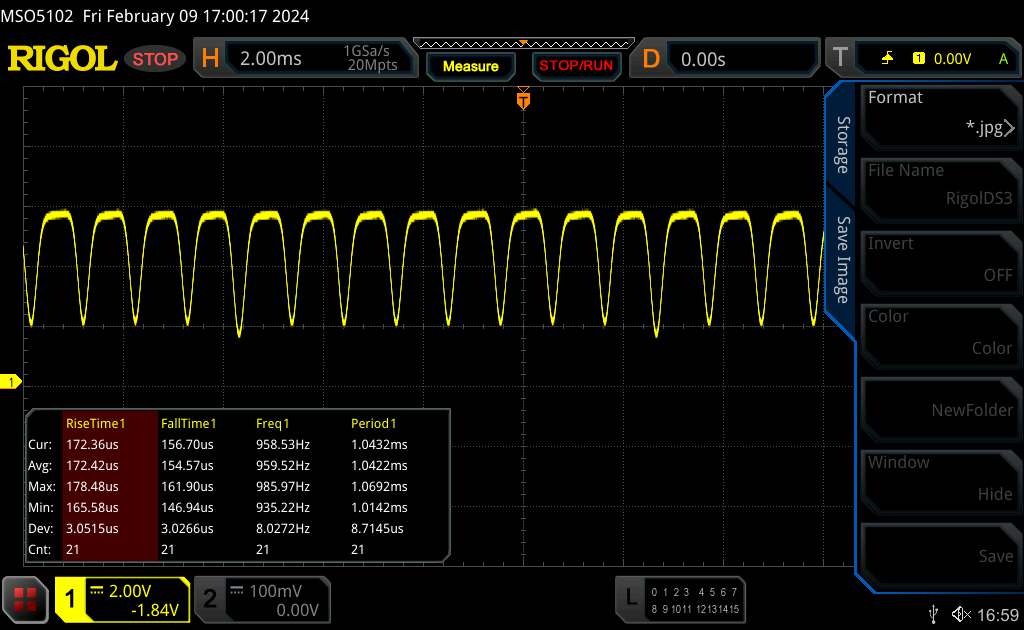
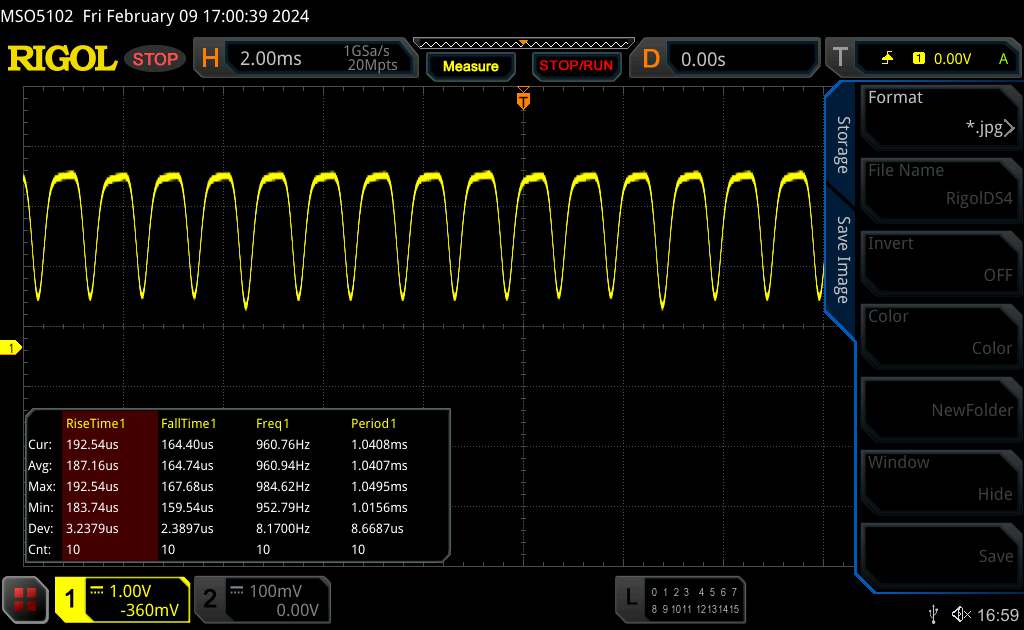
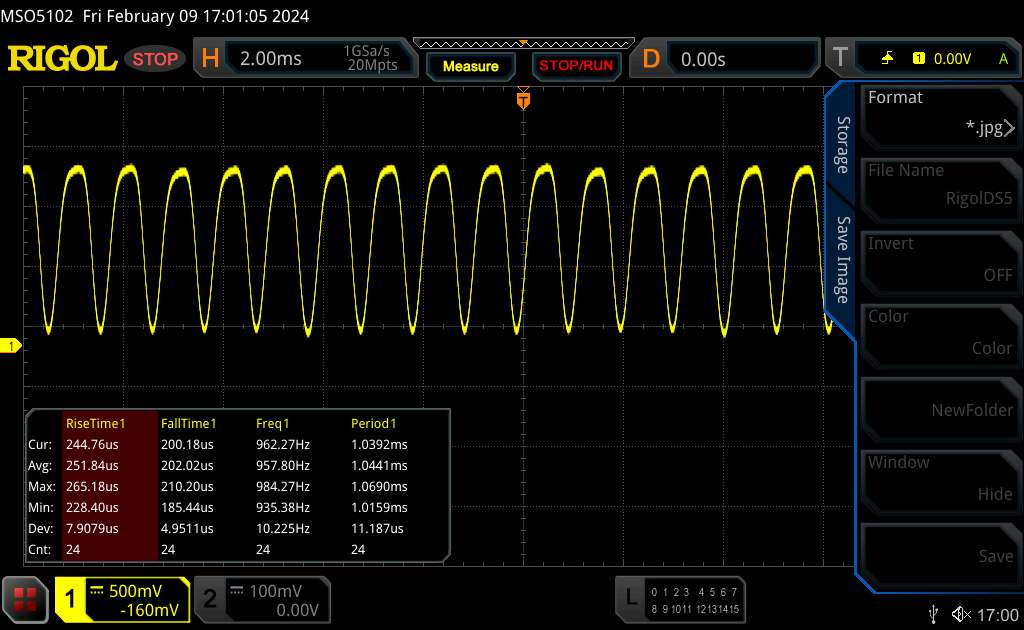
Migotanie ekranu / PWM (modulacja szerokości impulsu)
| Wykryto migotanie ekranu/wykryto PWM | 120 Hz | ≤ 100 % ustawienia jasności | 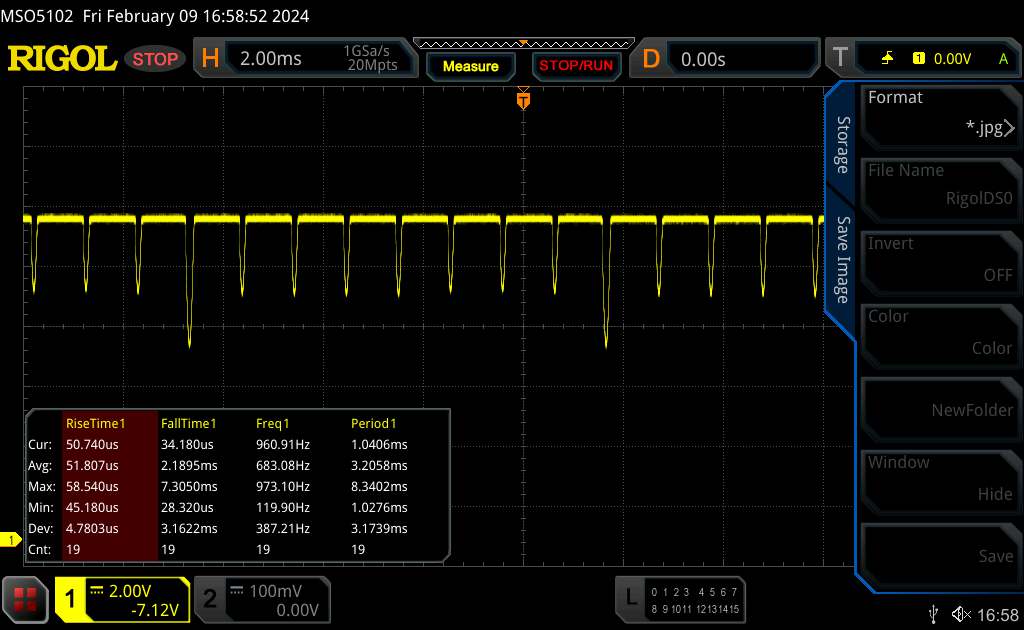 |
Podświetlenie wyświetlacza miga z częstotliwością 120 Hz (najgorszy przypadek, np. przy użyciu PWM) Wykryto migotanie przy ustawieniu jasności 100 % i poniżej. Powyżej tego ustawienia jasności nie powinno być żadnego migotania ani PWM. Częstotliwość 120 Hz jest bardzo niska, więc migotanie może powodować zmęczenie oczu i bóle głowy po dłuższym użytkowaniu. Dla porównania: 52 % wszystkich testowanych urządzeń nie używa PWM do przyciemniania wyświetlacza. Jeśli wykryto PWM, zmierzono średnio 7747 (minimum: 5 - maksimum: 343500) Hz. | |||
Wydajność
Cena Omen Transcend 16 zaczyna się od około 1600 USD. Podstawowy wariant jest wyposażony w procesor Core i7-13700HX, a GeForce RTX 406016 GB pamięci RAM i wyświetlacz IPS o niskiej rozdzielczości. Nasz recenzowany model znajduje się bardziej w górnej części skali cenowej i specyfikacji.
Warunki testu
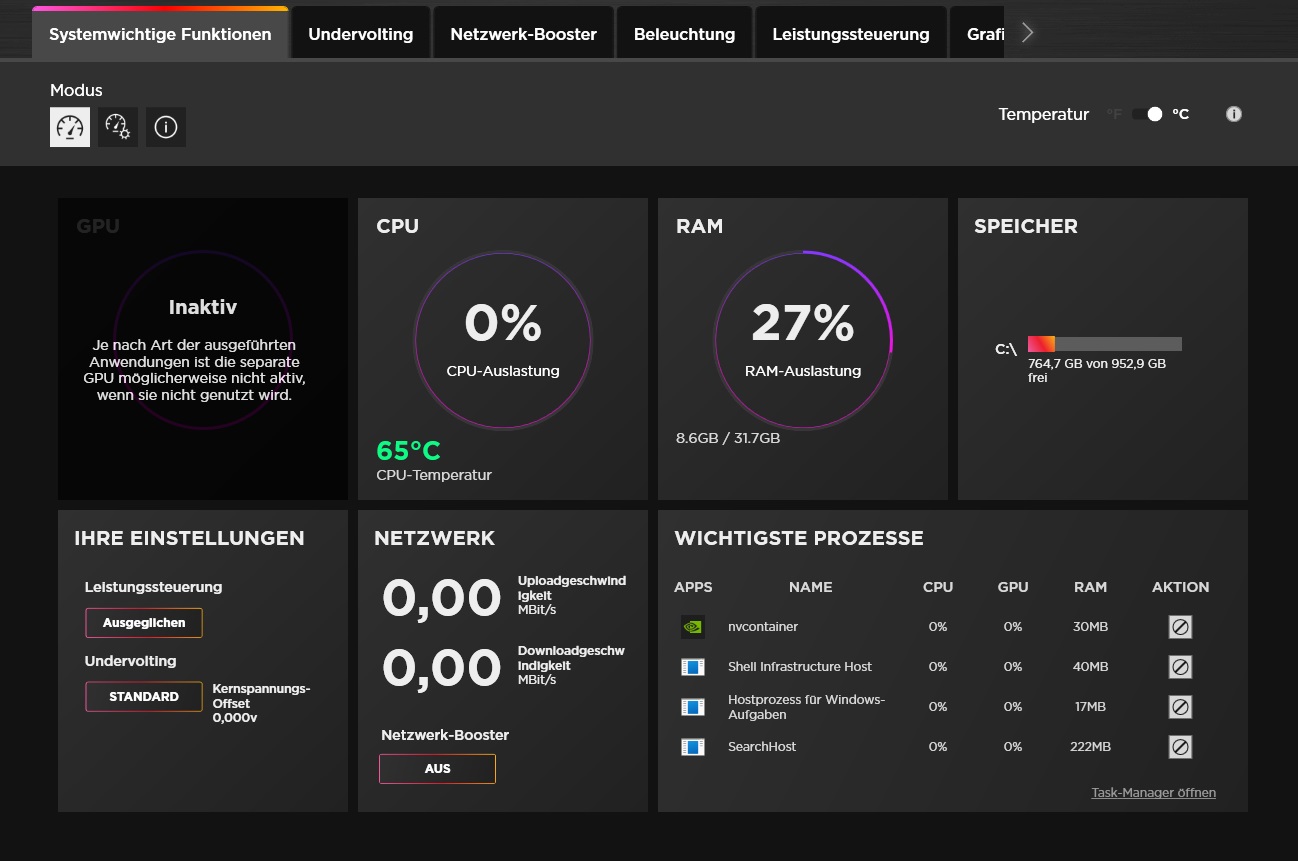
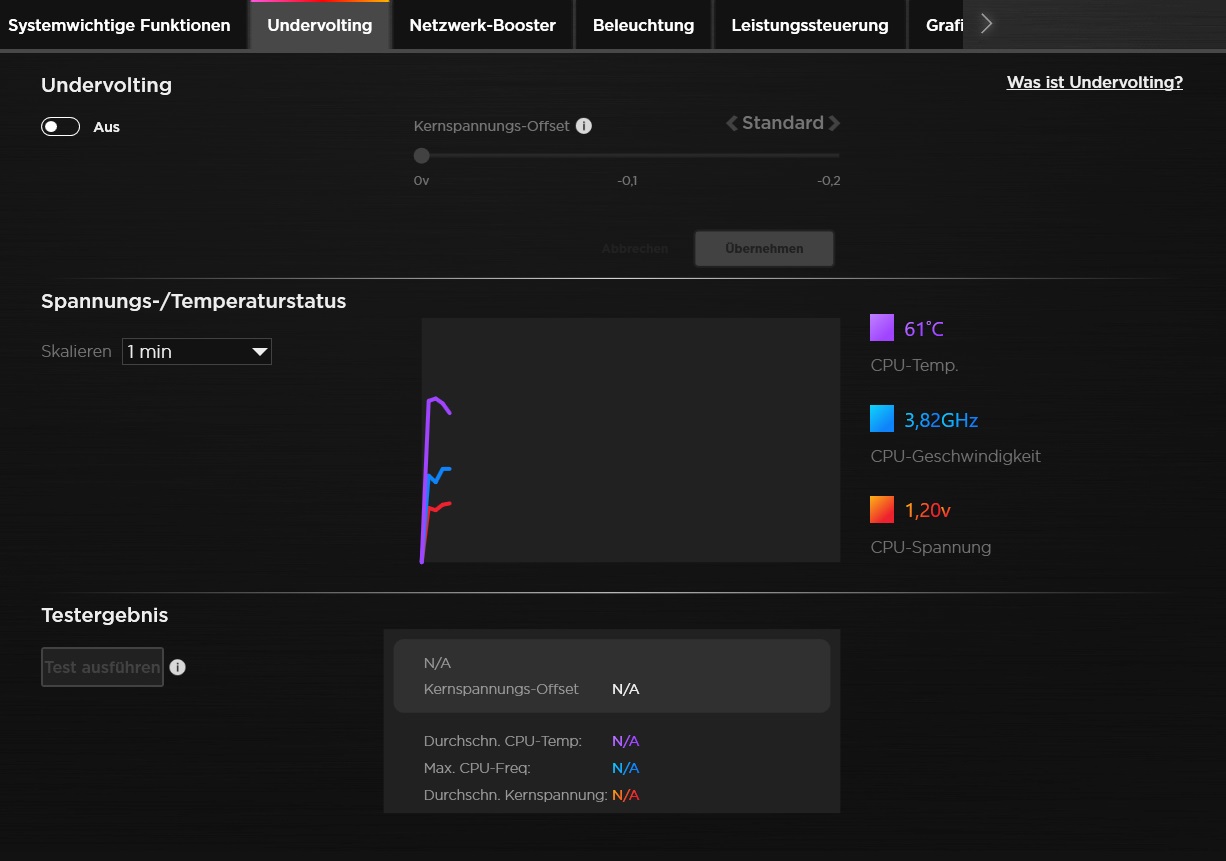
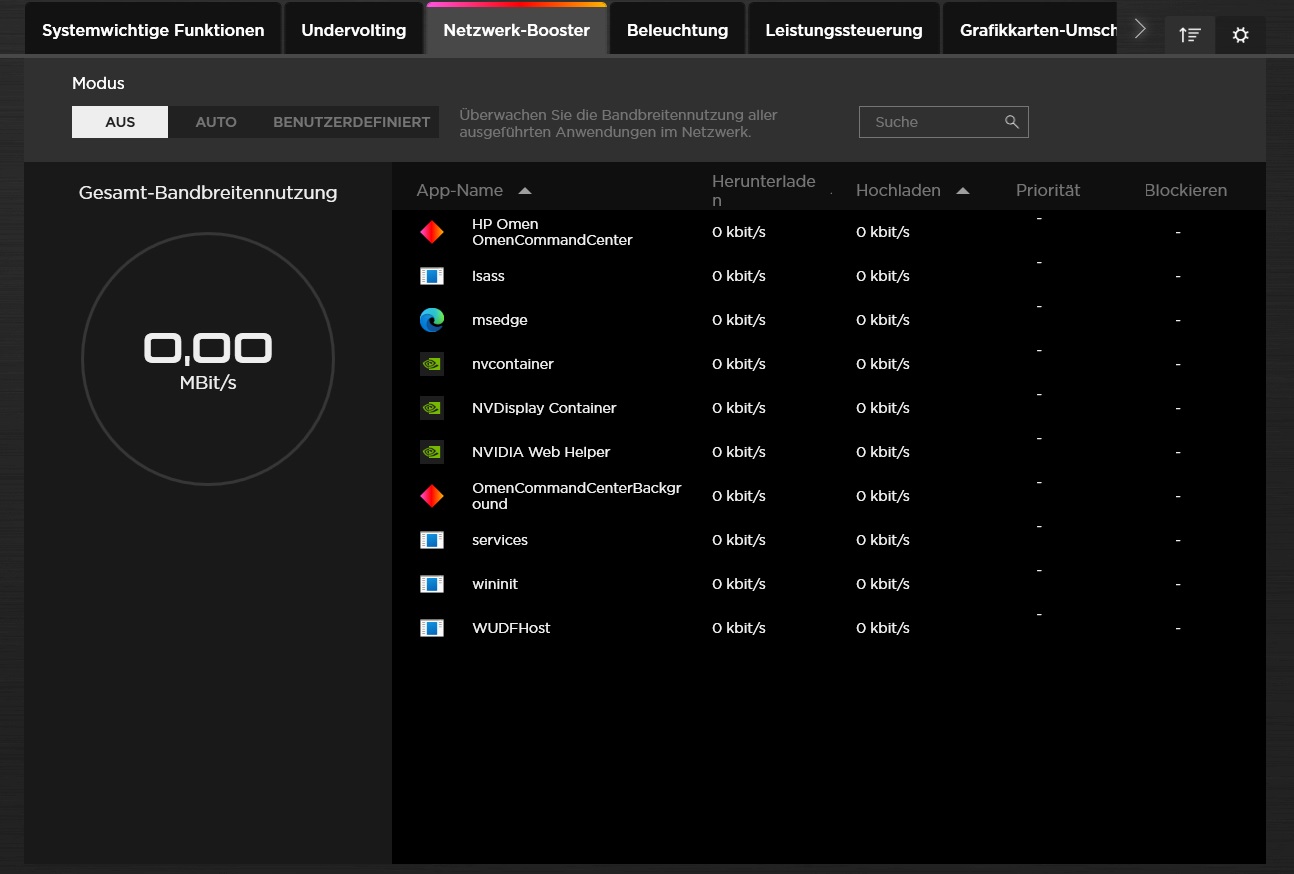
Zarządzanie wydajnością preinstalowanego koncentratora gier jest nieco trudno dostępne. W odpowiednim menu czekają trzy tryby energetyczne i menedżer ciepła. Ponieważ tryb wydajności - analogiczny do większości laptopów do gier - zapewnia zarówno lepszą wydajność, jak i nieproporcjonalną produkcję hałasu, wszystkie pomiary zostały przeprowadzone w trybie zrównoważonym. W związku z tym ustalone wartości można porównać z poprzednikiem tylko w ograniczonym zakresie. Co więcej, automatyczne sterowanie wentylatorem i automatyczne przełączanie grafiki były aktywne.
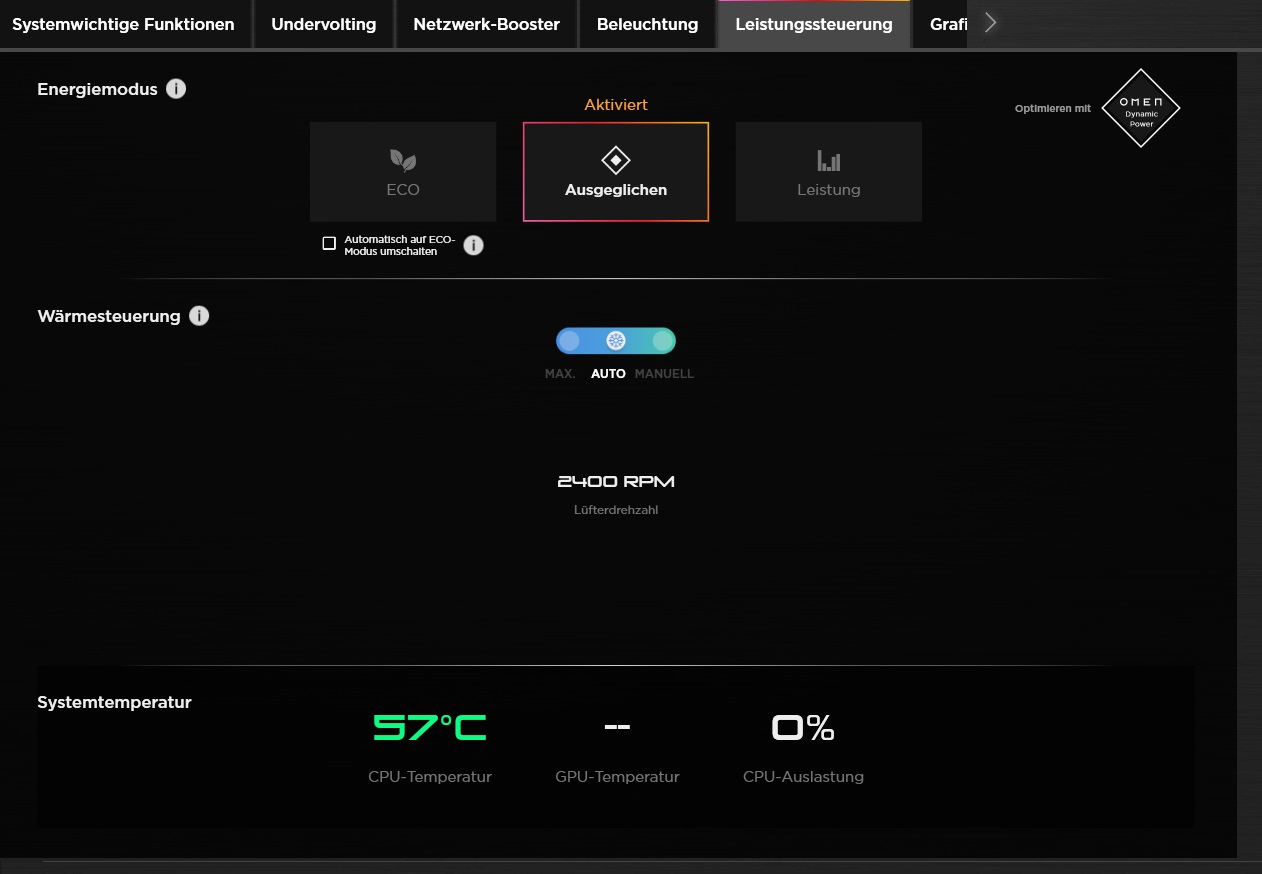

| Witcher 3 (FHD/Ultra) | Eco | Ausgegleichen | Leistung |
| Hałas | 39 dB(A) | 44 dB(A) | 53 dB(A) |
| Wydajność | 60 fps lock | 114 fps | 126 fps |
Procesor
Core i9-14900HX jest niemalże przerośnięty w porównaniu do mocy GPU i grubości obudowy. Wykonany w technologii 10 nm model z serii Raptor Lake oferuje 8 wydajnych rdzeni z hyper threadingiem i 16 wydajnych rdzeni bez HT, co daje łącznie 32 wątki. W trybie zrównoważonym procesor wykorzystuje swój potencjał tylko w ograniczonym zakresie. Najlepszym przykładem jest nasza pętla Cinebench: Choć w kilku pierwszych przebiegach wydajność była relatywnie wysoka, to po krótkim czasie wynik dość gwałtownie spadł (ale potem utrzymywał się na stałym poziomie). Podsumowując, jest on wystarczający do osiągnięcia poziomu Ultra 7 155H (ROG Zephyrus G16) lub Ryzen 7 7840HS (Schenker XMG Core 16).
Cinebench R15 Multi Continuous Test
* ... im mniej tym lepiej
AIDA64: FP32 Ray-Trace | FPU Julia | CPU SHA3 | CPU Queen | FPU SinJulia | FPU Mandel | CPU AES | CPU ZLib | FP64 Ray-Trace | CPU PhotoWorxx
| Performance rating | |
| Średnia w klasie Gaming | |
| Przeciętny Intel Core i9-14900HX | |
| HP Omen Transcend 16 | |
| Lenovo Legion Pro 5 16ARX8 | |
| Schenker XMG CORE 16 (L23) | |
| HP Omen Transcend 16-u1095ng | |
| Asus ROG Zephyrus G16 2024 GU605M | |
| AIDA64 / FP32 Ray-Trace | |
| Średnia w klasie Gaming (10227 - 85542, n=105, ostatnie 2 lata) | |
| Lenovo Legion Pro 5 16ARX8 | |
| Schenker XMG CORE 16 (L23) | |
| Przeciętny Intel Core i9-14900HX (13098 - 33474, n=36) | |
| HP Omen Transcend 16 | |
| HP Omen Transcend 16-u1095ng | |
| Asus ROG Zephyrus G16 2024 GU605M | |
| AIDA64 / FPU Julia | |
| Średnia w klasie Gaming (51376 - 238426, n=105, ostatnie 2 lata) | |
| Przeciętny Intel Core i9-14900HX (67573 - 166040, n=36) | |
| Lenovo Legion Pro 5 16ARX8 | |
| Schenker XMG CORE 16 (L23) | |
| HP Omen Transcend 16 | |
| HP Omen Transcend 16-u1095ng | |
| Asus ROG Zephyrus G16 2024 GU605M | |
| AIDA64 / CPU SHA3 | |
| Średnia w klasie Gaming (2180 - 10115, n=105, ostatnie 2 lata) | |
| Przeciętny Intel Core i9-14900HX (3589 - 7979, n=36) | |
| HP Omen Transcend 16 | |
| Lenovo Legion Pro 5 16ARX8 | |
| Schenker XMG CORE 16 (L23) | |
| HP Omen Transcend 16-u1095ng | |
| Asus ROG Zephyrus G16 2024 GU605M | |
| AIDA64 / CPU Queen | |
| Przeciętny Intel Core i9-14900HX (118405 - 148966, n=36) | |
| Lenovo Legion Pro 5 16ARX8 | |
| HP Omen Transcend 16 | |
| HP Omen Transcend 16-u1095ng | |
| Średnia w klasie Gaming (49785 - 173351, n=90, ostatnie 2 lata) | |
| Schenker XMG CORE 16 (L23) | |
| Asus ROG Zephyrus G16 2024 GU605M | |
| AIDA64 / FPU SinJulia | |
| Lenovo Legion Pro 5 16ARX8 | |
| Przeciętny Intel Core i9-14900HX (10475 - 18517, n=36) | |
| Schenker XMG CORE 16 (L23) | |
| Średnia w klasie Gaming (4424 - 33636, n=105, ostatnie 2 lata) | |
| HP Omen Transcend 16 | |
| HP Omen Transcend 16-u1095ng | |
| Asus ROG Zephyrus G16 2024 GU605M | |
| AIDA64 / FPU Mandel | |
| Średnia w klasie Gaming (25115 - 128721, n=105, ostatnie 2 lata) | |
| Lenovo Legion Pro 5 16ARX8 | |
| Schenker XMG CORE 16 (L23) | |
| Przeciętny Intel Core i9-14900HX (32543 - 83662, n=36) | |
| HP Omen Transcend 16 | |
| HP Omen Transcend 16-u1095ng | |
| Asus ROG Zephyrus G16 2024 GU605M | |
| AIDA64 / CPU AES | |
| Przeciętny Intel Core i9-14900HX (86964 - 241777, n=36) | |
| HP Omen Transcend 16 | |
| Średnia w klasie Gaming (39258 - 247074, n=105, ostatnie 2 lata) | |
| Schenker XMG CORE 16 (L23) | |
| HP Omen Transcend 16-u1095ng | |
| Asus ROG Zephyrus G16 2024 GU605M | |
| Lenovo Legion Pro 5 16ARX8 | |
| AIDA64 / CPU ZLib | |
| Przeciętny Intel Core i9-14900HX (1054 - 2292, n=36) | |
| HP Omen Transcend 16 | |
| Średnia w klasie Gaming (574 - 2531, n=105, ostatnie 2 lata) | |
| HP Omen Transcend 16-u1095ng | |
| Lenovo Legion Pro 5 16ARX8 | |
| Asus ROG Zephyrus G16 2024 GU605M | |
| Schenker XMG CORE 16 (L23) | |
| AIDA64 / FP64 Ray-Trace | |
| Średnia w klasie Gaming (5509 - 45446, n=105, ostatnie 2 lata) | |
| Lenovo Legion Pro 5 16ARX8 | |
| Schenker XMG CORE 16 (L23) | |
| Przeciętny Intel Core i9-14900HX (6809 - 18349, n=36) | |
| HP Omen Transcend 16 | |
| HP Omen Transcend 16-u1095ng | |
| Asus ROG Zephyrus G16 2024 GU605M | |
| AIDA64 / CPU PhotoWorxx | |
| HP Omen Transcend 16 | |
| HP Omen Transcend 16-u1095ng | |
| Asus ROG Zephyrus G16 2024 GU605M | |
| Przeciętny Intel Core i9-14900HX (23903 - 54702, n=36) | |
| Średnia w klasie Gaming (12271 - 89891, n=105, ostatnie 2 lata) | |
| Schenker XMG CORE 16 (L23) | |
| Lenovo Legion Pro 5 16ARX8 | |
Wydajność systemu
Wydajność systemu jest dobra, ale nie należy do czołówki. Jeśli chodzi o szybkość pamięci RAM, Transcend zajmuje drugie miejsce w polu porównawczym.
CrossMark: Overall | Productivity | Creativity | Responsiveness
WebXPRT 3: Overall
WebXPRT 4: Overall
Mozilla Kraken 1.1: Total
| PCMark 10 / Score | |
| Średnia w klasie Gaming (5828 - 12414, n=93, ostatnie 2 lata) | |
| Lenovo Legion Pro 5 16ARX8 | |
| Przeciętny Intel Core i9-14900HX, NVIDIA GeForce RTX 4070 Laptop GPU (7768 - 8550, n=8) | |
| Schenker XMG CORE 16 (L23) | |
| HP Omen Transcend 16 | |
| HP Omen Transcend 16-u1095ng | |
| Asus ROG Zephyrus G16 2024 GU605M | |
| PCMark 10 / Essentials | |
| HP Omen Transcend 16 | |
| Lenovo Legion Pro 5 16ARX8 | |
| Schenker XMG CORE 16 (L23) | |
| Przeciętny Intel Core i9-14900HX, NVIDIA GeForce RTX 4070 Laptop GPU (10104 - 11815, n=8) | |
| Średnia w klasie Gaming (8810 - 11935, n=97, ostatnie 2 lata) | |
| HP Omen Transcend 16-u1095ng | |
| Asus ROG Zephyrus G16 2024 GU605M | |
| PCMark 10 / Productivity | |
| Średnia w klasie Gaming (6845 - 25323, n=95, ostatnie 2 lata) | |
| Schenker XMG CORE 16 (L23) | |
| Przeciętny Intel Core i9-14900HX, NVIDIA GeForce RTX 4070 Laptop GPU (9577 - 11103, n=8) | |
| HP Omen Transcend 16-u1095ng | |
| Lenovo Legion Pro 5 16ARX8 | |
| HP Omen Transcend 16 | |
| Asus ROG Zephyrus G16 2024 GU605M | |
| PCMark 10 / Digital Content Creation | |
| Średnia w klasie Gaming (7602 - 19954, n=95, ostatnie 2 lata) | |
| HP Omen Transcend 16 | |
| Lenovo Legion Pro 5 16ARX8 | |
| Przeciętny Intel Core i9-14900HX, NVIDIA GeForce RTX 4070 Laptop GPU (12114 - 14827, n=8) | |
| Schenker XMG CORE 16 (L23) | |
| HP Omen Transcend 16-u1095ng | |
| Asus ROG Zephyrus G16 2024 GU605M | |
| CrossMark / Overall | |
| Przeciętny Intel Core i9-14900HX, NVIDIA GeForce RTX 4070 Laptop GPU (2002 - 2312, n=7) | |
| Lenovo Legion Pro 5 16ARX8 | |
| Średnia w klasie Gaming (1366 - 2409, n=94, ostatnie 2 lata) | |
| HP Omen Transcend 16 | |
| Asus ROG Zephyrus G16 2024 GU605M | |
| Schenker XMG CORE 16 (L23) | |
| CrossMark / Productivity | |
| Przeciętny Intel Core i9-14900HX, NVIDIA GeForce RTX 4070 Laptop GPU (1827 - 2191, n=7) | |
| Lenovo Legion Pro 5 16ARX8 | |
| Średnia w klasie Gaming (1386 - 2254, n=94, ostatnie 2 lata) | |
| HP Omen Transcend 16 | |
| Schenker XMG CORE 16 (L23) | |
| Asus ROG Zephyrus G16 2024 GU605M | |
| CrossMark / Creativity | |
| Przeciętny Intel Core i9-14900HX, NVIDIA GeForce RTX 4070 Laptop GPU (2258 - 2458, n=7) | |
| HP Omen Transcend 16 | |
| Średnia w klasie Gaming (1343 - 2786, n=94, ostatnie 2 lata) | |
| Lenovo Legion Pro 5 16ARX8 | |
| Asus ROG Zephyrus G16 2024 GU605M | |
| Schenker XMG CORE 16 (L23) | |
| CrossMark / Responsiveness | |
| Przeciętny Intel Core i9-14900HX, NVIDIA GeForce RTX 4070 Laptop GPU (1734 - 2330, n=7) | |
| Lenovo Legion Pro 5 16ARX8 | |
| Średnia w klasie Gaming (1226 - 2334, n=94, ostatnie 2 lata) | |
| HP Omen Transcend 16 | |
| Schenker XMG CORE 16 (L23) | |
| Asus ROG Zephyrus G16 2024 GU605M | |
| WebXPRT 3 / Overall | |
| Lenovo Legion Pro 5 16ARX8 | |
| HP Omen Transcend 16-u1095ng | |
| HP Omen Transcend 16 | |
| Przeciętny Intel Core i9-14900HX, NVIDIA GeForce RTX 4070 Laptop GPU (269 - 342, n=8) | |
| Średnia w klasie Gaming (220 - 532, n=98, ostatnie 2 lata) | |
| Schenker XMG CORE 16 (L23) | |
| Asus ROG Zephyrus G16 2024 GU605M | |
| WebXPRT 4 / Overall | |
| HP Omen Transcend 16 | |
| Przeciętny Intel Core i9-14900HX, NVIDIA GeForce RTX 4070 Laptop GPU (291 - 304, n=6) | |
| Średnia w klasie Gaming (165 - 354, n=98, ostatnie 2 lata) | |
| Lenovo Legion Pro 5 16ARX8 | |
| Asus ROG Zephyrus G16 2024 GU605M | |
| Mozilla Kraken 1.1 / Total | |
| Asus ROG Zephyrus G16 2024 GU605M | |
| Schenker XMG CORE 16 (L23) | |
| Lenovo Legion Pro 5 16ARX8 | |
| Średnia w klasie Gaming (391 - 590, n=100, ostatnie 2 lata) | |
| HP Omen Transcend 16 | |
| Przeciętny Intel Core i9-14900HX, NVIDIA GeForce RTX 4070 Laptop GPU (431 - 469, n=8) | |
| HP Omen Transcend 16-u1095ng | |
* ... im mniej tym lepiej
| PCMark 10 Score | 7866 pkt. | |
Pomoc | ||
| AIDA64 / Memory Copy | |
| Asus ROG Zephyrus G16 2024 GU605M | |
| HP Omen Transcend 16-u1095ng | |
| HP Omen Transcend 16 | |
| Przeciętny Intel Core i9-14900HX (38028 - 83392, n=36) | |
| Średnia w klasie Gaming (21750 - 129946, n=105, ostatnie 2 lata) | |
| Schenker XMG CORE 16 (L23) | |
| Lenovo Legion Pro 5 16ARX8 | |
| AIDA64 / Memory Read | |
| Asus ROG Zephyrus G16 2024 GU605M | |
| HP Omen Transcend 16-u1095ng | |
| HP Omen Transcend 16 | |
| Przeciętny Intel Core i9-14900HX (43306 - 87568, n=36) | |
| Średnia w klasie Gaming (22956 - 118858, n=105, ostatnie 2 lata) | |
| Schenker XMG CORE 16 (L23) | |
| Lenovo Legion Pro 5 16ARX8 | |
| AIDA64 / Memory Write | |
| Schenker XMG CORE 16 (L23) | |
| HP Omen Transcend 16-u1095ng | |
| Średnia w klasie Gaming (22297 - 135096, n=105, ostatnie 2 lata) | |
| HP Omen Transcend 16 | |
| Asus ROG Zephyrus G16 2024 GU605M | |
| Przeciętny Intel Core i9-14900HX (37146 - 80589, n=36) | |
| Lenovo Legion Pro 5 16ARX8 | |
| AIDA64 / Memory Latency | |
| Asus ROG Zephyrus G16 2024 GU605M | |
| Średnia w klasie Gaming (75.3 - 259, n=105, ostatnie 2 lata) | |
| Schenker XMG CORE 16 (L23) | |
| HP Omen Transcend 16 | |
| Lenovo Legion Pro 5 16ARX8 | |
| HP Omen Transcend 16-u1095ng | |
| Przeciętny Intel Core i9-14900HX (76.1 - 105, n=36) | |
* ... im mniej tym lepiej
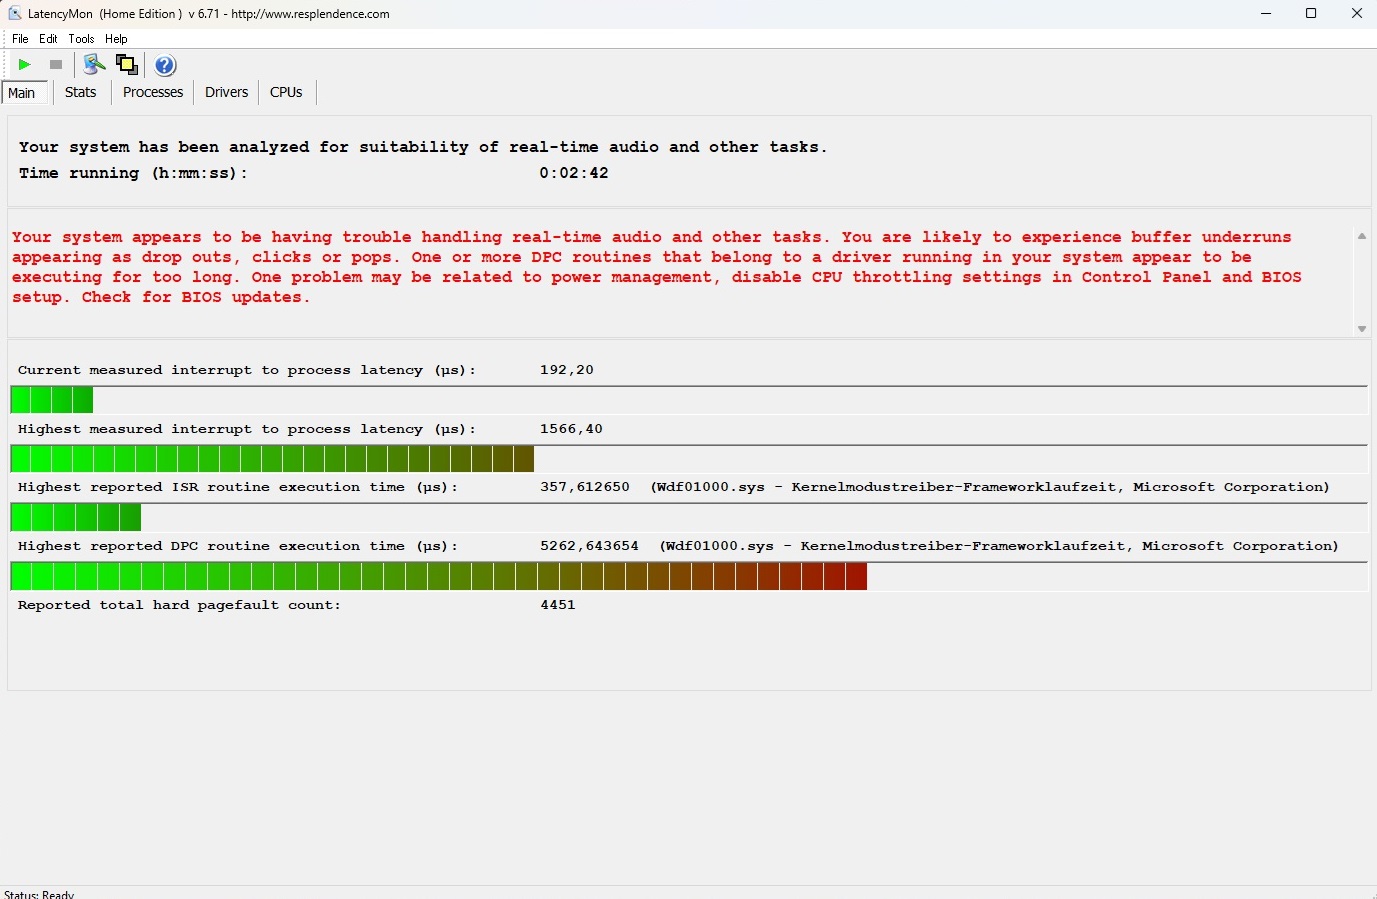
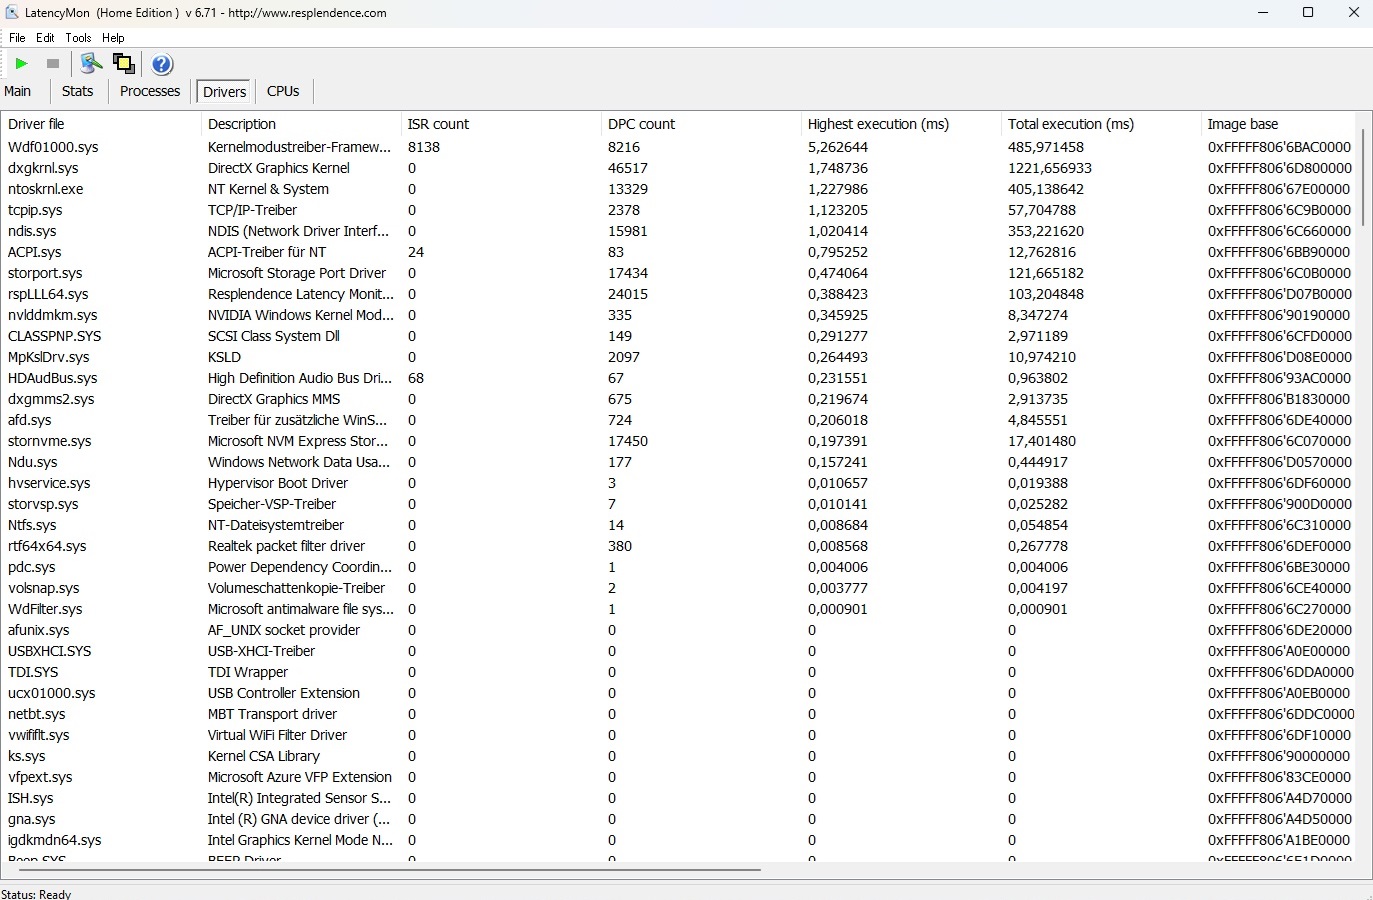
Opóźnienia DPC
Podobnie jak w przypadku poprzednika, nowy Omen 16 również musi zmagać się z relatywnie wysokimi opóźnieniami, co może prowadzić do problemów w niektórych scenariuszach zastosowań (na przykład przetwarzanie audio i wideo w czasie rzeczywistym).
| DPC Latencies / LatencyMon - interrupt to process latency (max), Web, Youtube, Prime95 | |
| Asus ROG Zephyrus G16 2024 GU605M | |
| HP Omen Transcend 16-u1095ng | |
| HP Omen Transcend 16 | |
| Schenker XMG CORE 16 (L23) | |
| Lenovo Legion Pro 5 16ARX8 | |
* ... im mniej tym lepiej
Pamięć masowa
W porównaniu do wydajności procesora, nie zaobserwowaliśmy żadnych spadków wydajności dysku SSD. Zainstalowany dysk Kioxia jest nieco wolniejszy niż dysk SK hynix znaleziony w starym Transcend, ale mimo to zapewnia wystarczająco wysokie prędkości. Szkoda tylko, że 16-calowa obudowa ma tylko jedno gniazdo M.2, co oznacza, że wbudowany dysk SSD będzie musiał zostać wymieniony, aby rozszerzyć pamięć masową.

* ... im mniej tym lepiej
Continuous Performance Read: DiskSpd Read Loop, Queue Depth 8
Karta graficzna
Karta GeForce RTX 4070 jest oparta na architekturze Ada Lovelace i pod względem wydajności plasuje się bliżej RTX 4060 niż RTX 4080. Pomimo hojnego 130-watowego TGP, Omen 16 poruszał się po naszym kursie testowym w sposób nieco poniżej średniej, chociaż różnica w stosunku do konkurencji jest czasami bardzo niewielka. Przyszłościowe zabezpieczenie RTX 4070 jest raczej słabe ze względu na małą ilość pamięci VRAM. W niektórych grach 8 GB może już stać się czynnikiem ograniczającym. Naszym zdaniem Nvidia powinna była dać GPU co najmniej 12 GB, zwłaszcza że laptopy tego typu nie są tanie.
| 3DMark 11 Performance | 32528 pkt. | |
| 3DMark Cloud Gate Standard Score | 53528 pkt. | |
| 3DMark Fire Strike Score | 23683 pkt. | |
| 3DMark Time Spy Score | 11682 pkt. | |
Pomoc | ||
* ... im mniej tym lepiej
Wydajność w grach
Transcend 16 jest wystarczająco szybki, aby móc grać w prawie wszystkie gry w natywnej rozdzielczości 2560 x 1600 i przy wysokich lub maksymalnych ustawieniach. Problemy pojawiają się tylko w bardzo wymagających lub słabo zoptymalizowanych grach, takich jak Enshrouded. W przypadku monitorów 4K zalecamy co najmniej RTX 4080.
| The Witcher 3 - 1920x1080 Ultra Graphics & Postprocessing (HBAO+) | |
| Średnia w klasie Gaming (104.7 - 240, n=6, ostatnie 2 lata) | |
| Schenker XMG CORE 16 (L23) | |
| Lenovo Legion Pro 5 16ARX8 | |
| HP Omen Transcend 16-u1095ng | |
| Przeciętny NVIDIA GeForce RTX 4070 Laptop GPU (69.8 - 133.7, n=57) | |
| HP Omen Transcend 16 | |
| Asus ROG Zephyrus G16 2024 GU605M | |
| Final Fantasy XV Benchmark - 1920x1080 High Quality | |
| Średnia w klasie Gaming (41 - 215, n=95, ostatnie 2 lata) | |
| Schenker XMG CORE 16 (L23) | |
| Lenovo Legion Pro 5 16ARX8 | |
| Przeciętny NVIDIA GeForce RTX 4070 Laptop GPU (41 - 131.9, n=65) | |
| HP Omen Transcend 16-u1095ng | |
| Asus ROG Zephyrus G16 2024 GU605M | |
| Enshrouded - 2560x1440 Max. Quality AA:FX | |
| HP Omen Transcend 16-u1095ng | |
| Przeciętny NVIDIA GeForce RTX 4070 Laptop GPU (38.9 - 42.3, n=2) | |
| XMG Pro 15 E23 | |
| Palworld - 2560x1440 Epic Preset AA:TSR | |
| XMG Pro 15 E23 | |
| Przeciętny NVIDIA GeForce RTX 4070 Laptop GPU (69.1 - 81.3, n=2) | |
| HP Omen Transcend 16-u1095ng | |
| Prince of Persia The Lost Crown - 2560x1440 Ultra Preset AA:SM | |
| Średnia w klasie Gaming (352 - 357, n=4, ostatnie 2 lata) | |
| XMG Pro 15 E23 | |
| Przeciętny NVIDIA GeForce RTX 4070 Laptop GPU (325 - 354, n=2) | |
| HP Omen Transcend 16-u1095ng | |
| Ready or Not - 2560x1440 Epic Preset | |
| XMG Pro 15 E23 | |
| Przeciętny NVIDIA GeForce RTX 4070 Laptop GPU (84.8 - 95.6, n=2) | |
| HP Omen Transcend 16-u1095ng | |
| The Finals - 2560x1440 Epic Preset | |
| XMG Pro 15 E23 | |
| Przeciętny NVIDIA GeForce RTX 4070 Laptop GPU (82.8 - 94.6, n=3) | |
| HP Omen Transcend 16-u1095ng | |
| Średnia w klasie Gaming (n=1ostatnie 2 lata) | |
Użyliśmy gry fabularnej, The Witcher 3 (FHD/Ultra), aby sprawdzić, jak wydajność 3D radzi sobie w dłuższym okresie czasu i nawet po około godzinie liczba klatek na sekundę pozostała bardzo stabilna.
Witcher 3 FPS diagram
| low | med. | high | ultra | QHD | |
|---|---|---|---|---|---|
| GTA V (2015) | 181.2 | 175.3 | 115.8 | ||
| The Witcher 3 (2015) | 114 | ||||
| Dota 2 Reborn (2015) | 202 | 178.9 | 167 | 154.1 | |
| Final Fantasy XV Benchmark (2018) | 147.5 | 108.3 | |||
| X-Plane 11.11 (2018) | 166.6 | 141.7 | 114.9 | ||
| Strange Brigade (2018) | 272 | 220 | 194.2 | ||
| The Finals (2023) | 168 | 130.2 | 82.8 | ||
| Ready or Not (2023) | 194.2 | 134 | 84.8 | ||
| Prince of Persia The Lost Crown (2024) | 358 | 358 | 325 | ||
| Palworld (2024) | 102.2 | 96.6 | 69.1 | ||
| Enshrouded (2024) | 66.6 | 56.5 | 42.3 | ||
| Helldivers 2 (2024) | 91.5 | 91.1 | 69.2 |
Emisje
Emisja hałasu
Jeśli ograniczymy się do korzystania z trybu zbalansowanego, 16-calowe urządzenie nie będzie zbyt głośne. Szum 3D na poziomie od 44 do 47 dB(A) jest słyszalny, ale nie irytujący (to ostatnie dotyczyłoby trybu wydajnościowego z nagraniem 50+ dB). W trybie bezczynności wentylatory są stale aktywne i pracują na słyszalnym poziomie od 29 do 31 dB(A), co nie jest do końca optymalne.
Hałas
| luz |
| 29 / 30 / 31 dB |
| obciążenie |
| 45 / 47 dB |
 | ||
30 dB cichy 40 dB(A) słyszalny 50 dB(A) irytujący |
||
min: | ||
| HP Omen Transcend 16-u1095ng i9-14900HX, GeForce RTX 4070 Laptop GPU | HP Omen Transcend 16 i9-13900HX, GeForce RTX 4070 Laptop GPU | Asus ROG Zephyrus G16 2024 GU605M Ultra 7 155H, GeForce RTX 4070 Laptop GPU | Schenker XMG CORE 16 (L23) R7 7840HS, GeForce RTX 4070 Laptop GPU | Lenovo Legion Pro 5 16ARX8 R7 7745HX, GeForce RTX 4070 Laptop GPU | |
|---|---|---|---|---|---|
| Noise | -4% | 7% | 5% | 10% | |
| wyłączone / środowisko * (dB) | 24 | 22.9 5% | 23.9 -0% | 23 4% | 23.2 3% |
| Idle Minimum * (dB) | 29 | 29.1 -0% | 23.9 18% | 23 21% | 23.2 20% |
| Idle Average * (dB) | 30 | 29.1 3% | 27.8 7% | 28.48 5% | 23.2 23% |
| Idle Maximum * (dB) | 31 | 29.1 6% | 30.1 3% | 28.48 8% | 26.2 15% |
| Load Average * (dB) | 45 | 45.7 -2% | 34.2 24% | 30 33% | 31.4 30% |
| Witcher 3 ultra * (dB) | 44 | 54.3 -23% | 46.4 -5% | 54.12 -23% | 48.4 -10% |
| Load Maximum * (dB) | 47 | 54.3 -16% | 46.4 1% | 54.12 -15% | 53.8 -14% |
* ... im mniej tym lepiej
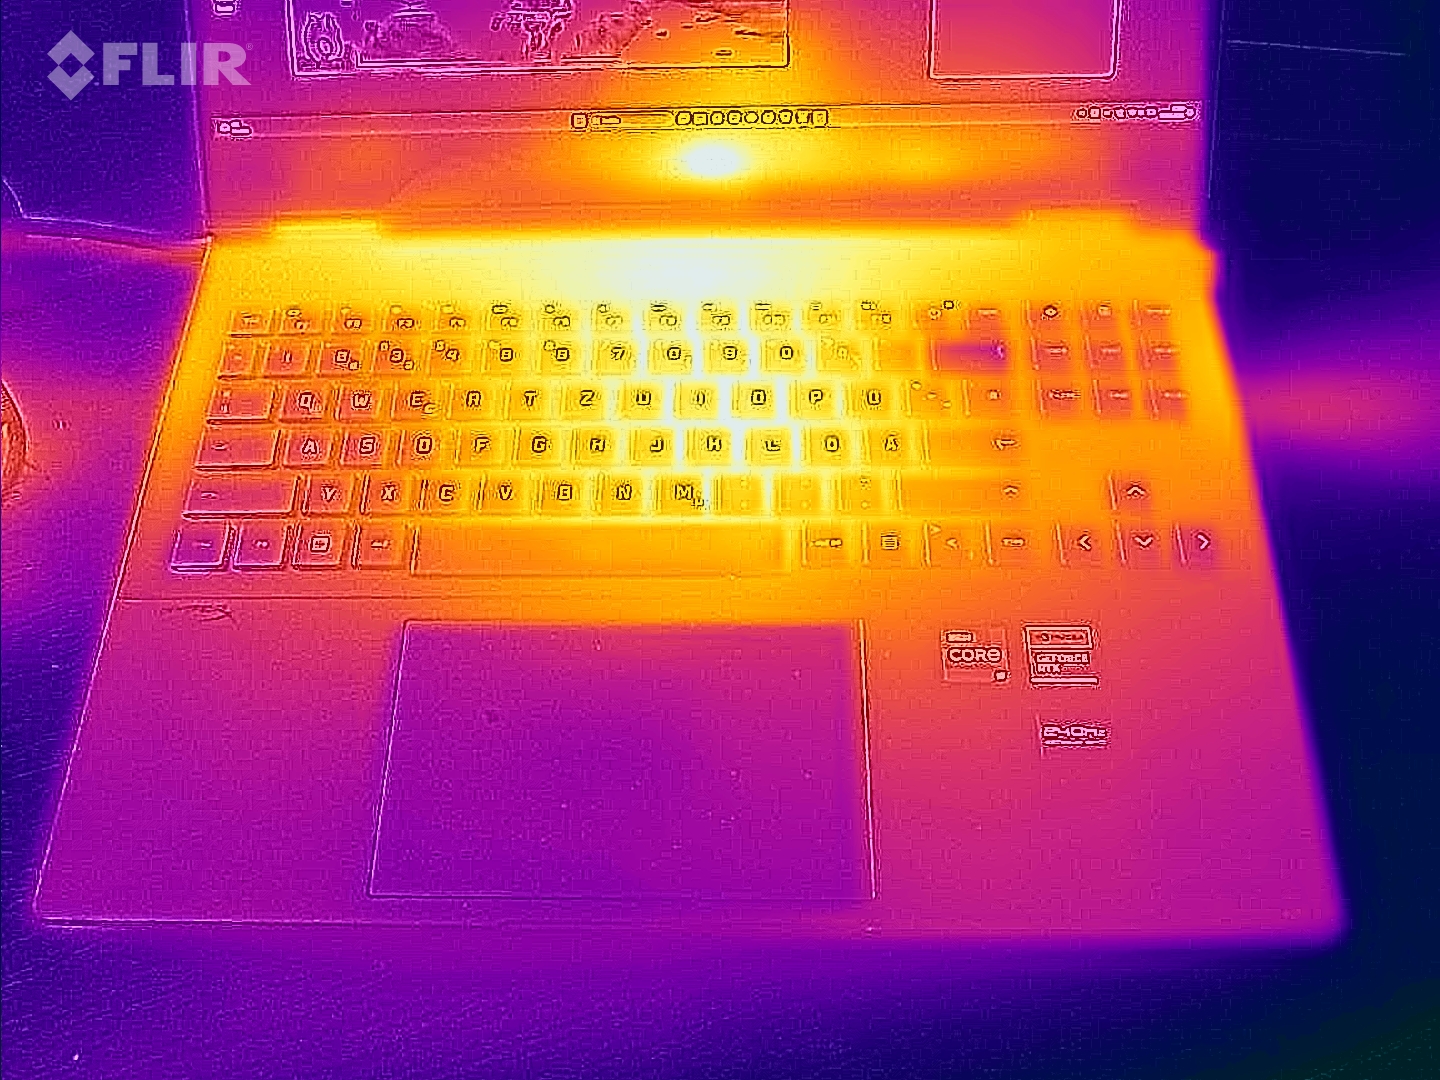
Temperatura
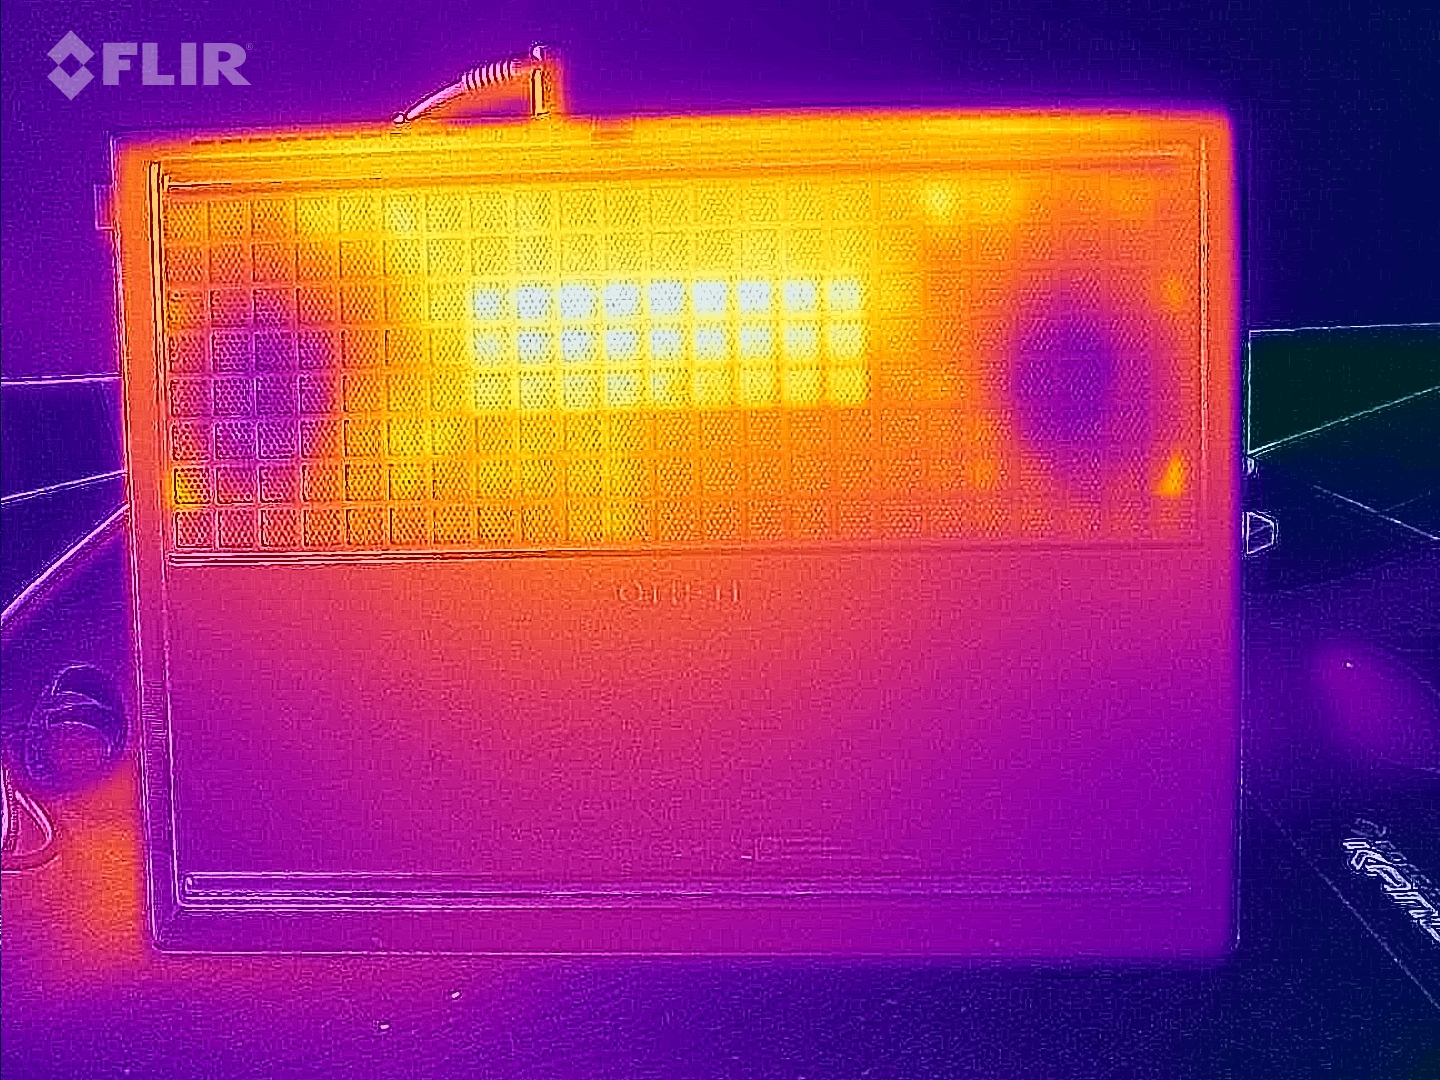
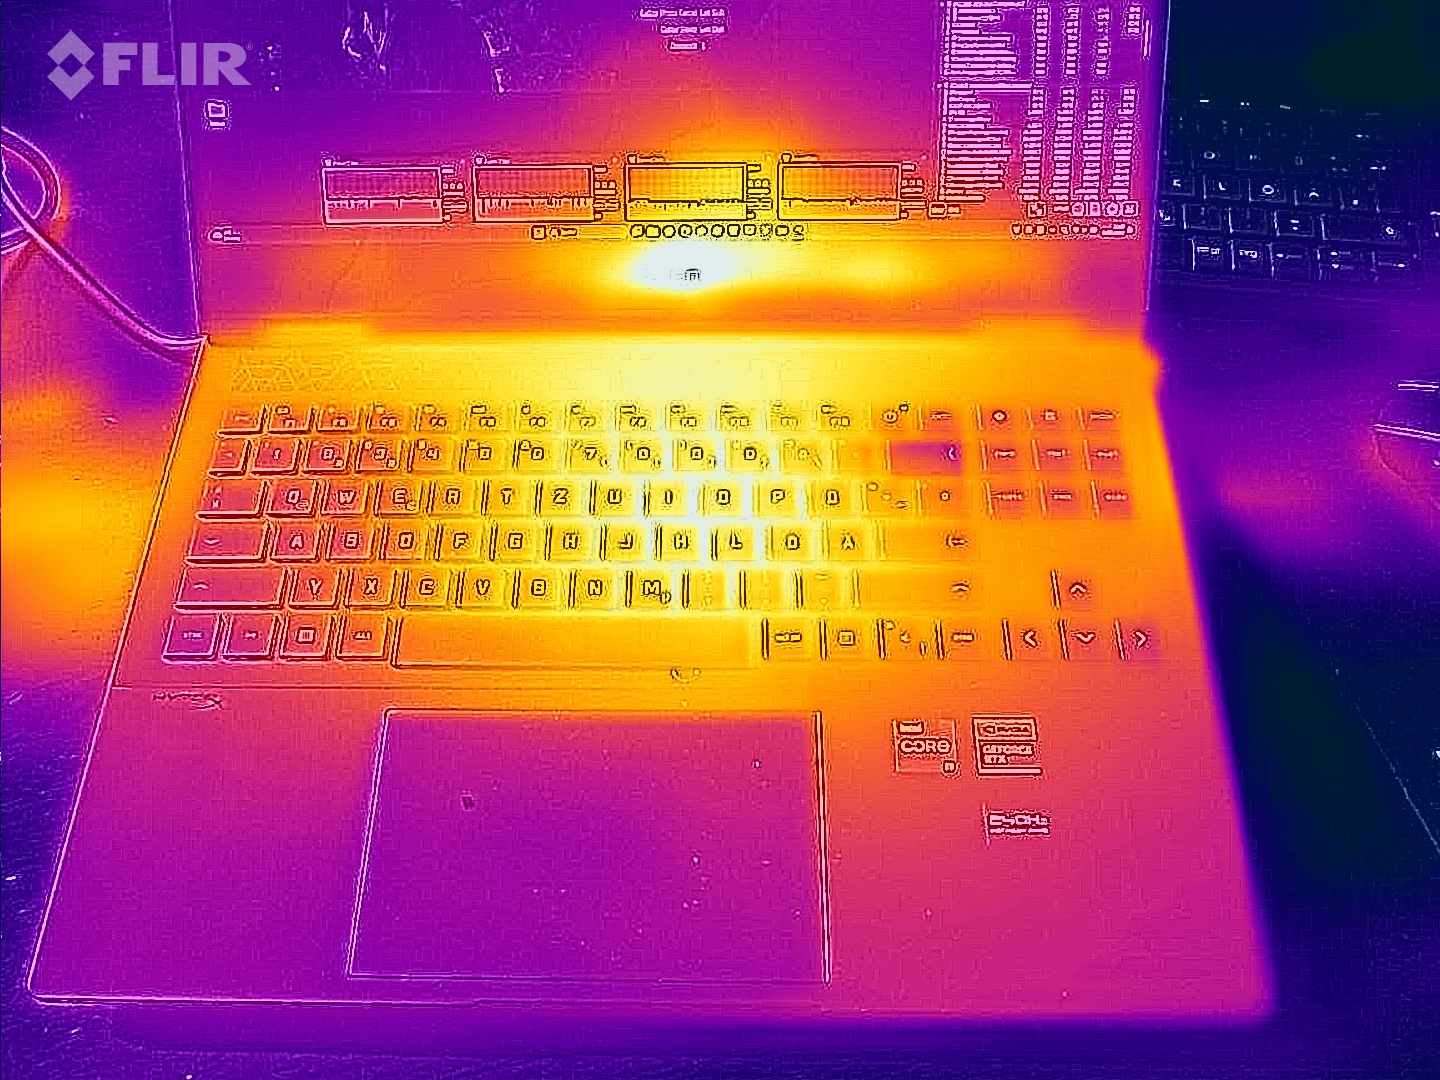
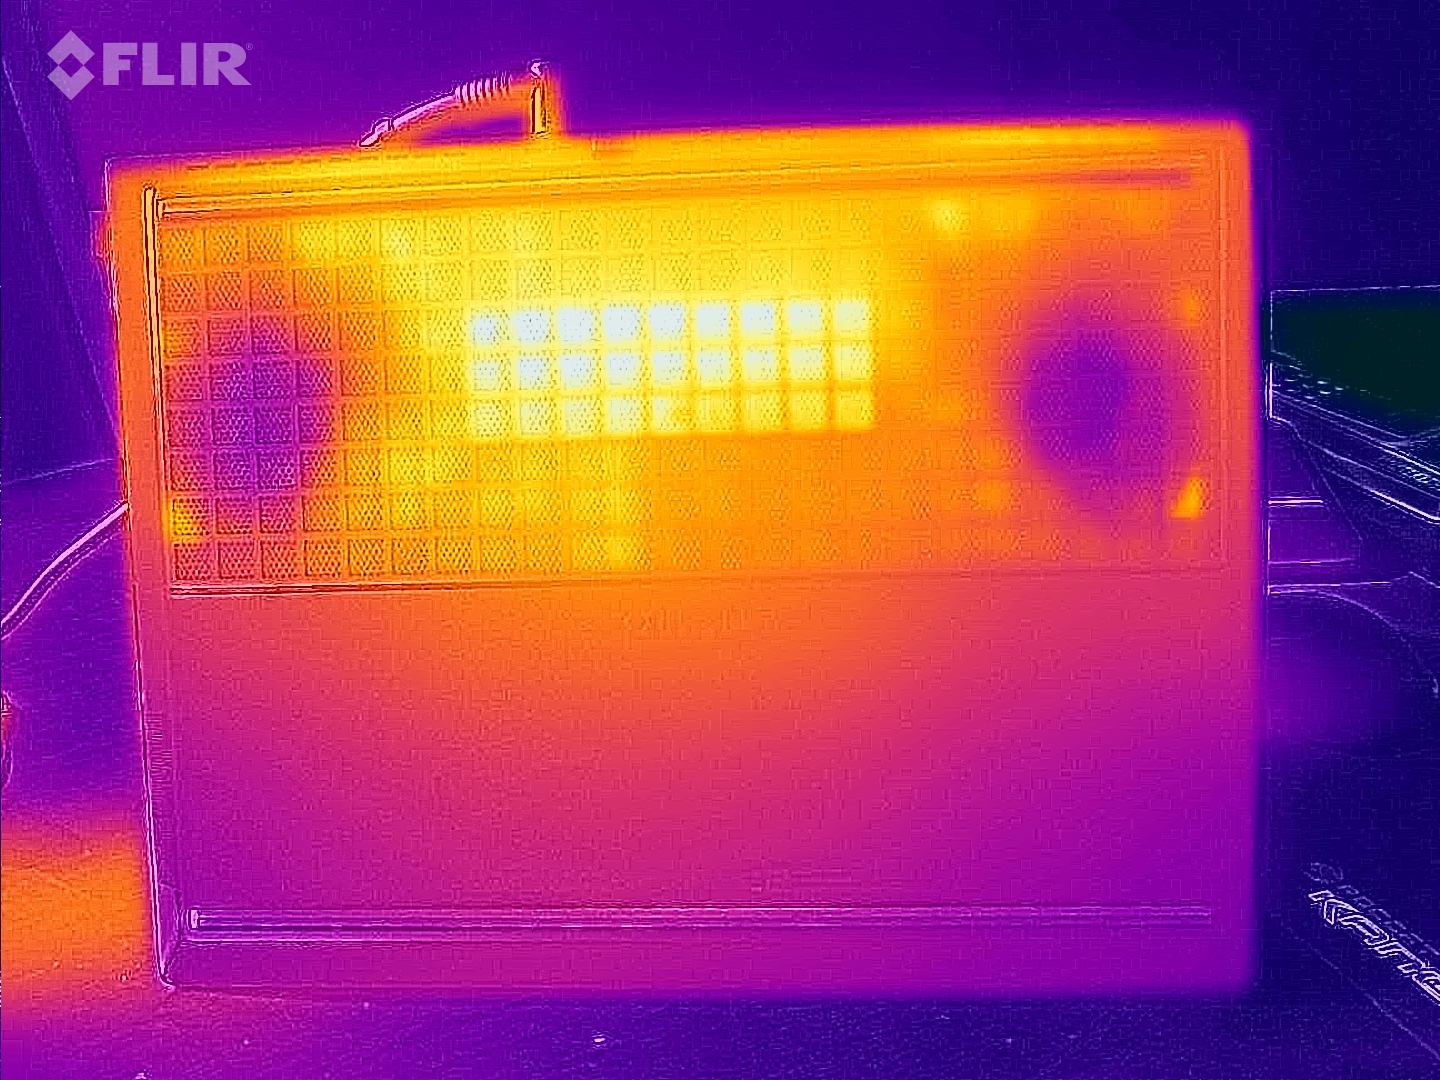
Podczas gdy temperatury na wierzchu laptopa plasują się w środku stawki, podstawa obudowy robi się cieplejsza od konkurencji pod obciążeniem. Maksymalnie 63 °C (podczas grania) uniemożliwi użytkownikom korzystanie z urządzenia umieszczonego na kolanach. W trybie bezczynności sytuacja jest znacznie bardziej komfortowa, a obudowa pozostaje przyjemnie chłodna przy maksymalnie 30 °C.
(-) Maksymalna temperatura w górnej części wynosi 49 °C / 120 F, w porównaniu do średniej 40.4 °C / 105 F , począwszy od 21.2 do 68.8 °C dla klasy Gaming.
(-) Dno nagrzewa się maksymalnie do 63 °C / 145 F, w porównaniu do średniej 43.2 °C / 110 F
(+) W stanie bezczynności średnia temperatura górnej części wynosi 26.6 °C / 80 F, w porównaniu ze średnią temperaturą urządzenia wynoszącą 33.9 °C / ### class_avg_f### F.
(-) Podczas gry w Wiedźmina 3 średnia temperatura górnej części wynosi 40.3 °C / 105 F, w porównaniu do średniej temperatury urządzenia wynoszącej 33.9 °C / ## #class_avg_f### F.
(+) Podparcia dłoni i touchpad osiągają maksymalną temperaturę skóry (35 °C / 95 F) i dlatego nie są gorące.
(-) Średnia temperatura obszaru podparcia dłoni w podobnych urządzeniach wynosiła 28.8 °C / 83.8 F (-6.2 °C / -11.2 F).
| HP Omen Transcend 16-u1095ng i9-14900HX, GeForce RTX 4070 Laptop GPU | HP Omen Transcend 16 i9-13900HX, GeForce RTX 4070 Laptop GPU | Asus ROG Zephyrus G16 2024 GU605M Ultra 7 155H, GeForce RTX 4070 Laptop GPU | Schenker XMG CORE 16 (L23) R7 7840HS, GeForce RTX 4070 Laptop GPU | Lenovo Legion Pro 5 16ARX8 R7 7745HX, GeForce RTX 4070 Laptop GPU | |
|---|---|---|---|---|---|
| Heat | 5% | 6% | 4% | 12% | |
| Maximum Upper Side * (°C) | 49 | 47.4 3% | 50.3 -3% | 46 6% | 41.8 15% |
| Maximum Bottom * (°C) | 63 | 54.4 14% | 48 24% | 44 30% | 41.4 34% |
| Idle Upper Side * (°C) | 30 | 28.4 5% | 28.8 4% | 32 -7% | 29 3% |
| Idle Bottom * (°C) | 29 | 29.2 -1% | 29.8 -3% | 33 -14% | 30.4 -5% |
* ... im mniej tym lepiej
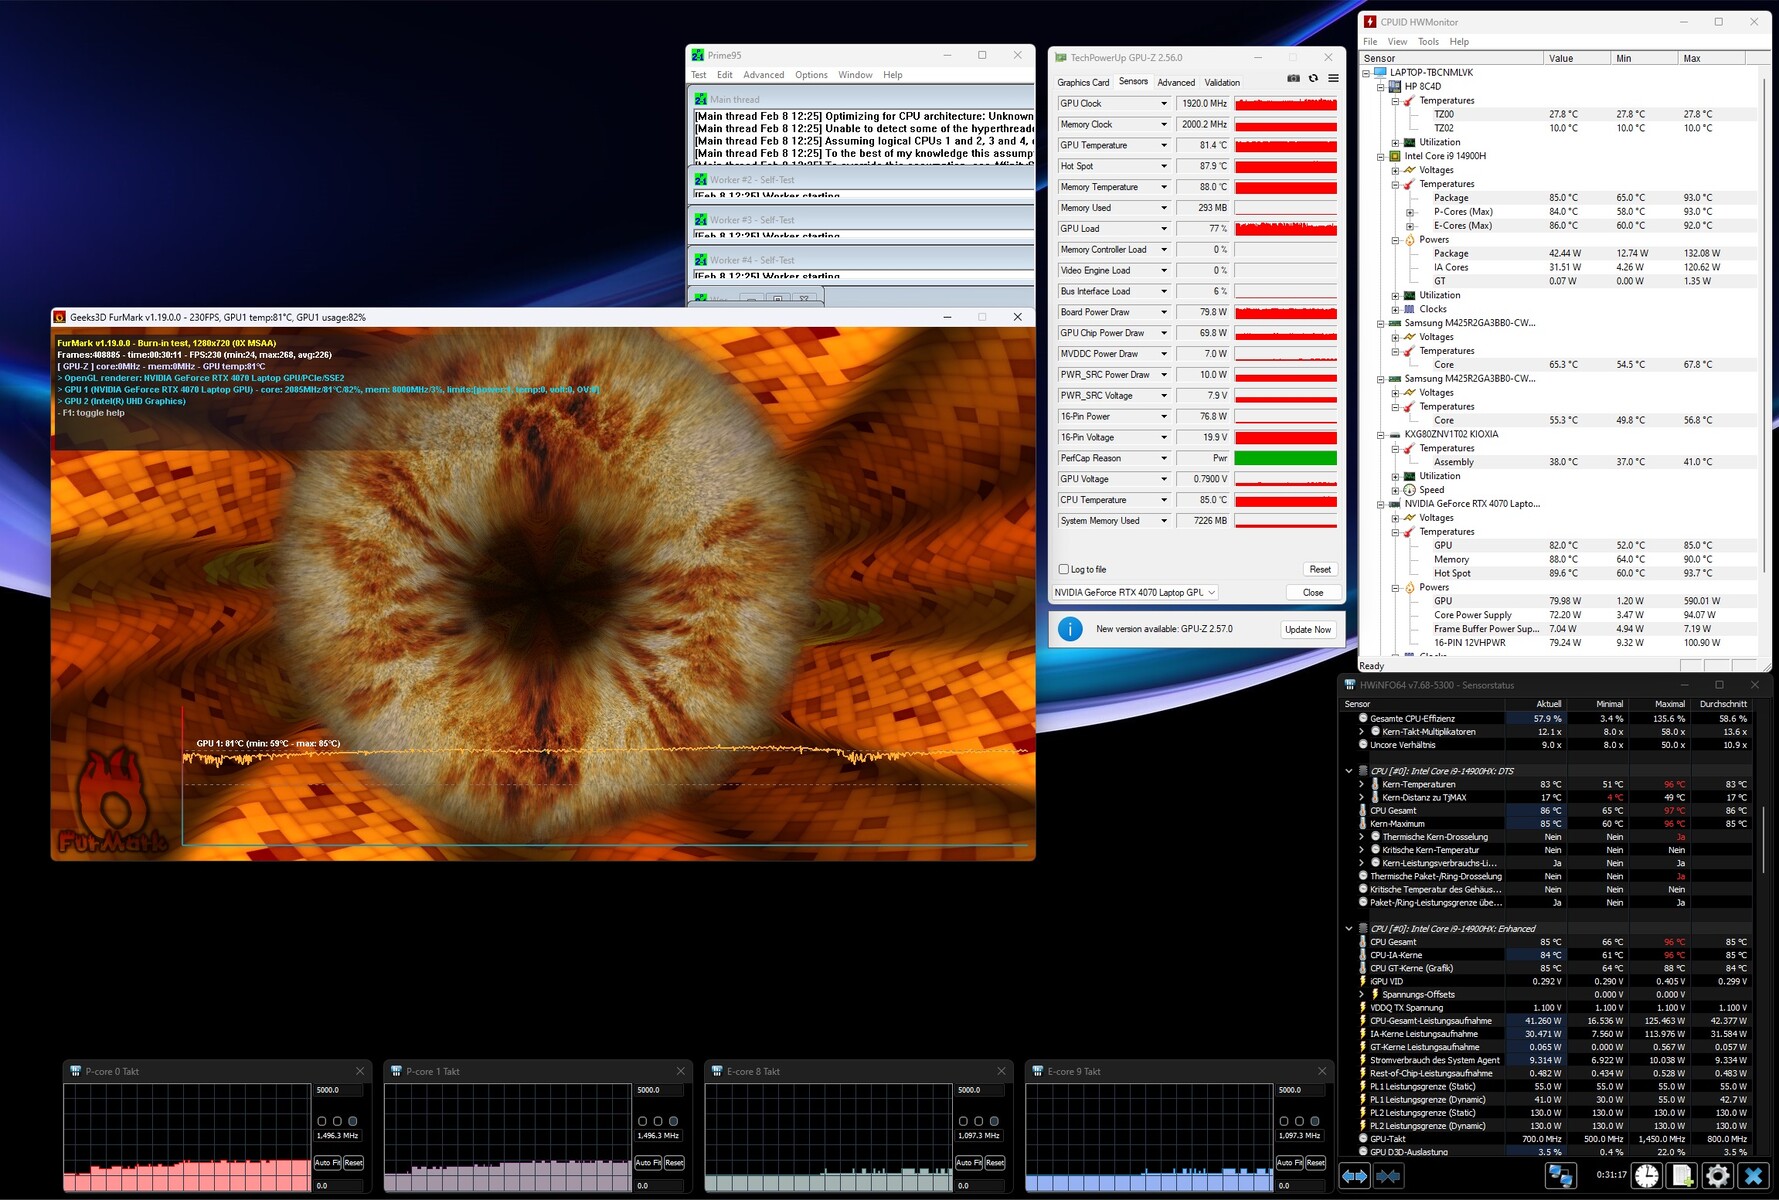
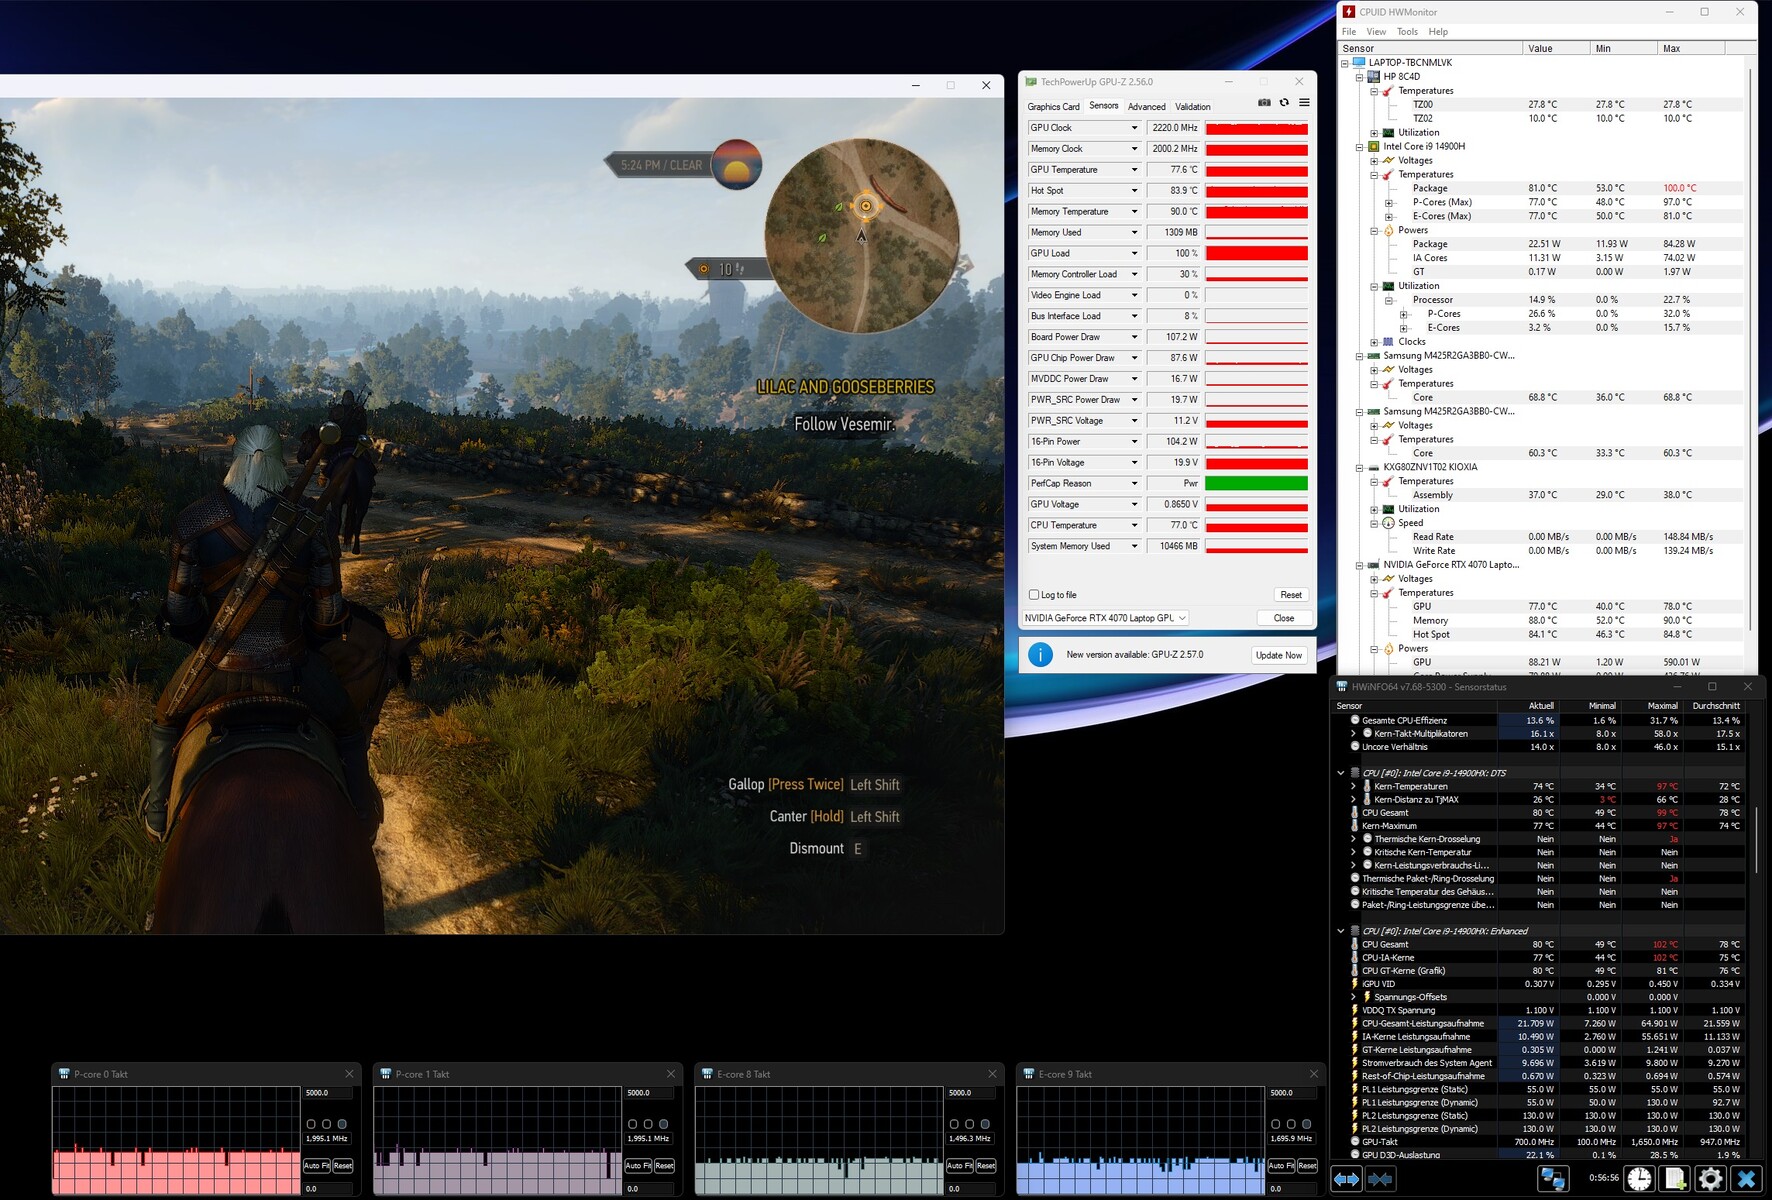
Test warunków skrajnych
W teście obciążeniowym przy użyciu narzędzi Furmark i Prime95, po 60 minutach, procesor osiągnął około 85 °C, podczas gdy GPU 81 °C (hotspot 88 °C) - obie wartości były stosunkowo wysokie, ale nieszkodliwe.
Głośniki
Jakość dźwięku jest nieco lepsza niż ogólna średnia laptopów do gier, chociaż, jak to często bywa, basy walczą i mogłyby być mocniejsze i bardziej precyzyjne. Maksymalna głośność na poziomie 82 dB(A) jest więcej niż przyzwoita.
HP Omen Transcend 16-u1095ng analiza dźwięku
(+) | głośniki mogą odtwarzać stosunkowo głośno (82 dB)
Bas 100 - 315 Hz
(-) | prawie brak basu - średnio 21.9% niższa od mediany
(±) | liniowość basu jest średnia (11% delta do poprzedniej częstotliwości)
Średnie 400 - 2000 Hz
(+) | zbalansowane środki średnie - tylko 3.2% od mediany
(+) | średnie są liniowe (5.3% delta do poprzedniej częstotliwości)
Wysokie 2–16 kHz
(+) | zrównoważone maksima - tylko 1.4% od mediany
(+) | wzloty są liniowe (5.2% delta do poprzedniej częstotliwości)
Ogólnie 100 - 16.000 Hz
(+) | ogólny dźwięk jest liniowy (14.5% różnicy w stosunku do mediany)
W porównaniu do tej samej klasy
» 27% wszystkich testowanych urządzeń w tej klasie było lepszych, 7% podobnych, 66% gorszych
» Najlepszy miał deltę 6%, średnia wynosiła ###średnia###%, najgorsza wynosiła 132%
W porównaniu do wszystkich testowanych urządzeń
» 18% wszystkich testowanych urządzeń było lepszych, 4% podobnych, 77% gorszych
» Najlepszy miał deltę 4%, średnia wynosiła ###średnia###%, najgorsza wynosiła 134%
Asus ROG Zephyrus G16 2024 GU605M analiza dźwięku
(+) | głośniki mogą odtwarzać stosunkowo głośno (83.3 dB)
Bas 100 - 315 Hz
(+) | dobry bas - tylko 3.8% od mediany
(±) | liniowość basu jest średnia (8.1% delta do poprzedniej częstotliwości)
Średnie 400 - 2000 Hz
(+) | zbalansowane środki średnie - tylko 3.5% od mediany
(+) | średnie są liniowe (2.4% delta do poprzedniej częstotliwości)
Wysokie 2–16 kHz
(+) | zrównoważone maksima - tylko 2.2% od mediany
(+) | wzloty są liniowe (3.7% delta do poprzedniej częstotliwości)
Ogólnie 100 - 16.000 Hz
(+) | ogólny dźwięk jest liniowy (7.3% różnicy w stosunku do mediany)
W porównaniu do tej samej klasy
» 1% wszystkich testowanych urządzeń w tej klasie było lepszych, 0% podobnych, 99% gorszych
» Najlepszy miał deltę 6%, średnia wynosiła ###średnia###%, najgorsza wynosiła 132%
W porównaniu do wszystkich testowanych urządzeń
» 1% wszystkich testowanych urządzeń było lepszych, 0% podobnych, 99% gorszych
» Najlepszy miał deltę 4%, średnia wynosiła ###średnia###%, najgorsza wynosiła 134%
Zarządzanie energią
Zużycie energii
Zapotrzebowanie na energię jest podobne do standardowych wartości w tej kategorii wydajności. zużycie od 10 do 32 W w stanie spoczynku i od 128 do 242 W pod obciążeniem nie jest ani szczególnie wysokie, ani niskie.
| wyłączony / stan wstrzymania | |
| luz | |
| obciążenie |
|
Legenda:
min: | |
| HP Omen Transcend 16-u1095ng i9-14900HX, GeForce RTX 4070 Laptop GPU | HP Omen Transcend 16 i9-13900HX, GeForce RTX 4070 Laptop GPU | Asus ROG Zephyrus G16 2024 GU605M Ultra 7 155H, GeForce RTX 4070 Laptop GPU | Schenker XMG CORE 16 (L23) R7 7840HS, GeForce RTX 4070 Laptop GPU | Lenovo Legion Pro 5 16ARX8 R7 7745HX, GeForce RTX 4070 Laptop GPU | Średnia w klasie Gaming | |
|---|---|---|---|---|---|---|
| Power Consumption | -42% | 33% | 12% | 1% | -1% | |
| Idle Minimum * (Watt) | 10 | 19.2 -92% | 8.3 17% | 11 -10% | 8.1 19% | 13 ? -30% |
| Idle Average * (Watt) | 18 | 22.7 -26% | 12.5 31% | 15.2 16% | 15.9 12% | 18.7 ? -4% |
| Idle Maximum * (Watt) | 32 | 55.4 -73% | 12.8 60% | 16 50% | 37.2 -16% | 24.3 ? 24% |
| Load Average * (Watt) | 128 | 128.4 -0% | 71.3 44% | 64 50% | 90.9 29% | 110.2 ? 14% |
| Witcher 3 ultra * (Watt) | 148.4 | 206 -39% | 127.5 14% | 179 -21% | 189.6 -28% | |
| Load Maximum * (Watt) | 242 | 292 -21% | 169.1 30% | 280 -16% | 263.5 -9% | 258 ? -7% |
* ... im mniej tym lepiej
Power consumption Witcher 3 / stress test
Power consumption with an external monitor
Żywotność baterii
Jeśli chodzi o zapotrzebowanie na energię w trybie bateryjnym, HP ma jeszcze trochę do zrobienia. Pomimo potężnej baterii o pojemności 97 Wh, 16-calowa maszyna zdołała wytrzymać zaledwie 5 godzin w naszym teście Wi-Fi przy zmniejszonej jasności 150 cd/m². Dla porównania: ROG Zyphrus G16 poradził sobie z ponad 7 godzinami, a XMG Core 16 wytrzymał nawet ponad 8 godzin.
| HP Omen Transcend 16-u1095ng i9-14900HX, GeForce RTX 4070 Laptop GPU, 97 Wh | HP Omen Transcend 16 i9-13900HX, GeForce RTX 4070 Laptop GPU, 97 Wh | Asus ROG Zephyrus G16 2024 GU605M Ultra 7 155H, GeForce RTX 4070 Laptop GPU, 90 Wh | Schenker XMG CORE 16 (L23) R7 7840HS, GeForce RTX 4070 Laptop GPU, 99 Wh | Lenovo Legion Pro 5 16ARX8 R7 7745HX, GeForce RTX 4070 Laptop GPU, 80 Wh | Średnia w klasie Gaming | |
|---|---|---|---|---|---|---|
| Czasy pracy | -14% | 49% | 71% | -18% | 45% | |
| WiFi v1.3 (h) | 4.9 | 4.2 -14% | 7.3 49% | 8.4 71% | 4 -18% | 7.11 ? 45% |
| Reader / Idle (h) | 6.3 | 6.5 | 8.71 ? | |||
| Load (h) | 1.2 | 1.2 | 2.4 | 1 | 1.502 ? | |
| H.264 (h) | 11.2 | 10.2 | 8.64 ? |
Za
Przeciw
Werdykt
Przede wszystkim Omen Transcend 16-u1095ng stara się przyciągnąć potencjalnych klientów doskonałym wyświetlaczem OLED, który przemawia zarówno do graczy, jak i twórców.
Jeśli są Państwo w stanie poradzić sobie z bardzo odblaskowym ekranem i nie mają problemu z migotaniem, otrzymają Państwo kolorowy wyświetlacz z doskonałym współczynnikiem kontrastu i świetnym czasem reakcji, a także doskonałymi poziomami czerni i kątami widzenia.
Są pewne minusy za emisję i szybkość. Podczas gdy 16-calowa maszyna staje się nieprzyjemnie głośna w trybie wydajności, wydajność trybu zrównoważonego wydaje się nieco poniżej średniej. Poza tym Omen Transcend 16 jest podobny do innych laptopów do gier pod względem jakości obudowy, urządzeń wejściowych i wyboru portów.
Ogólnie rzecz biorąc, całkowity wynik jest porównywalny z wynikiem XMG Core 16 L23 lub Legion Pro 5 16ARX8. Każdy, kto szuka wyjątkowo lekkiego i kompaktowego urządzenia w kategorii 16 cali, powinien przyjrzeć się nowemu ROG Zeyphrus G16.
Cena i dostępność
W momencie pisania naszej recenzji, HP Omen Transcend 16-u1095ng z procesorem Core i9-14900HX i kartą graficzną GeForce RTX 4070 jest obecnie niedostępny w sklepie internetowym HP, Amazon lub Best Buy.
HP Omen Transcend 16-u1095ng
- 12/02/2024 v7 (old)
Florian Glaser
Przezroczystość
Wyboru urządzeń do recenzji dokonuje nasza redakcja. Próbka testowa została udostępniona autorowi jako pożyczka od producenta lub sprzedawcy detalicznego na potrzeby tej recenzji. Pożyczkodawca nie miał wpływu na tę recenzję, producent nie otrzymał też kopii tej recenzji przed publikacją. Nie było obowiązku publikowania tej recenzji. Jako niezależna firma medialna, Notebookcheck nie podlega władzy producentów, sprzedawców detalicznych ani wydawców.
Tak testuje Notebookcheck
Każdego roku Notebookcheck niezależnie sprawdza setki laptopów i smartfonów, stosując standardowe procedury, aby zapewnić porównywalność wszystkich wyników. Od około 20 lat stale rozwijamy nasze metody badawcze, ustanawiając przy tym standardy branżowe. W naszych laboratoriach testowych doświadczeni technicy i redaktorzy korzystają z wysokiej jakości sprzętu pomiarowego. Testy te obejmują wieloetapowy proces walidacji. Nasz kompleksowy system ocen opiera się na setkach uzasadnionych pomiarów i benchmarków, co pozwala zachować obiektywizm.Price comparison

