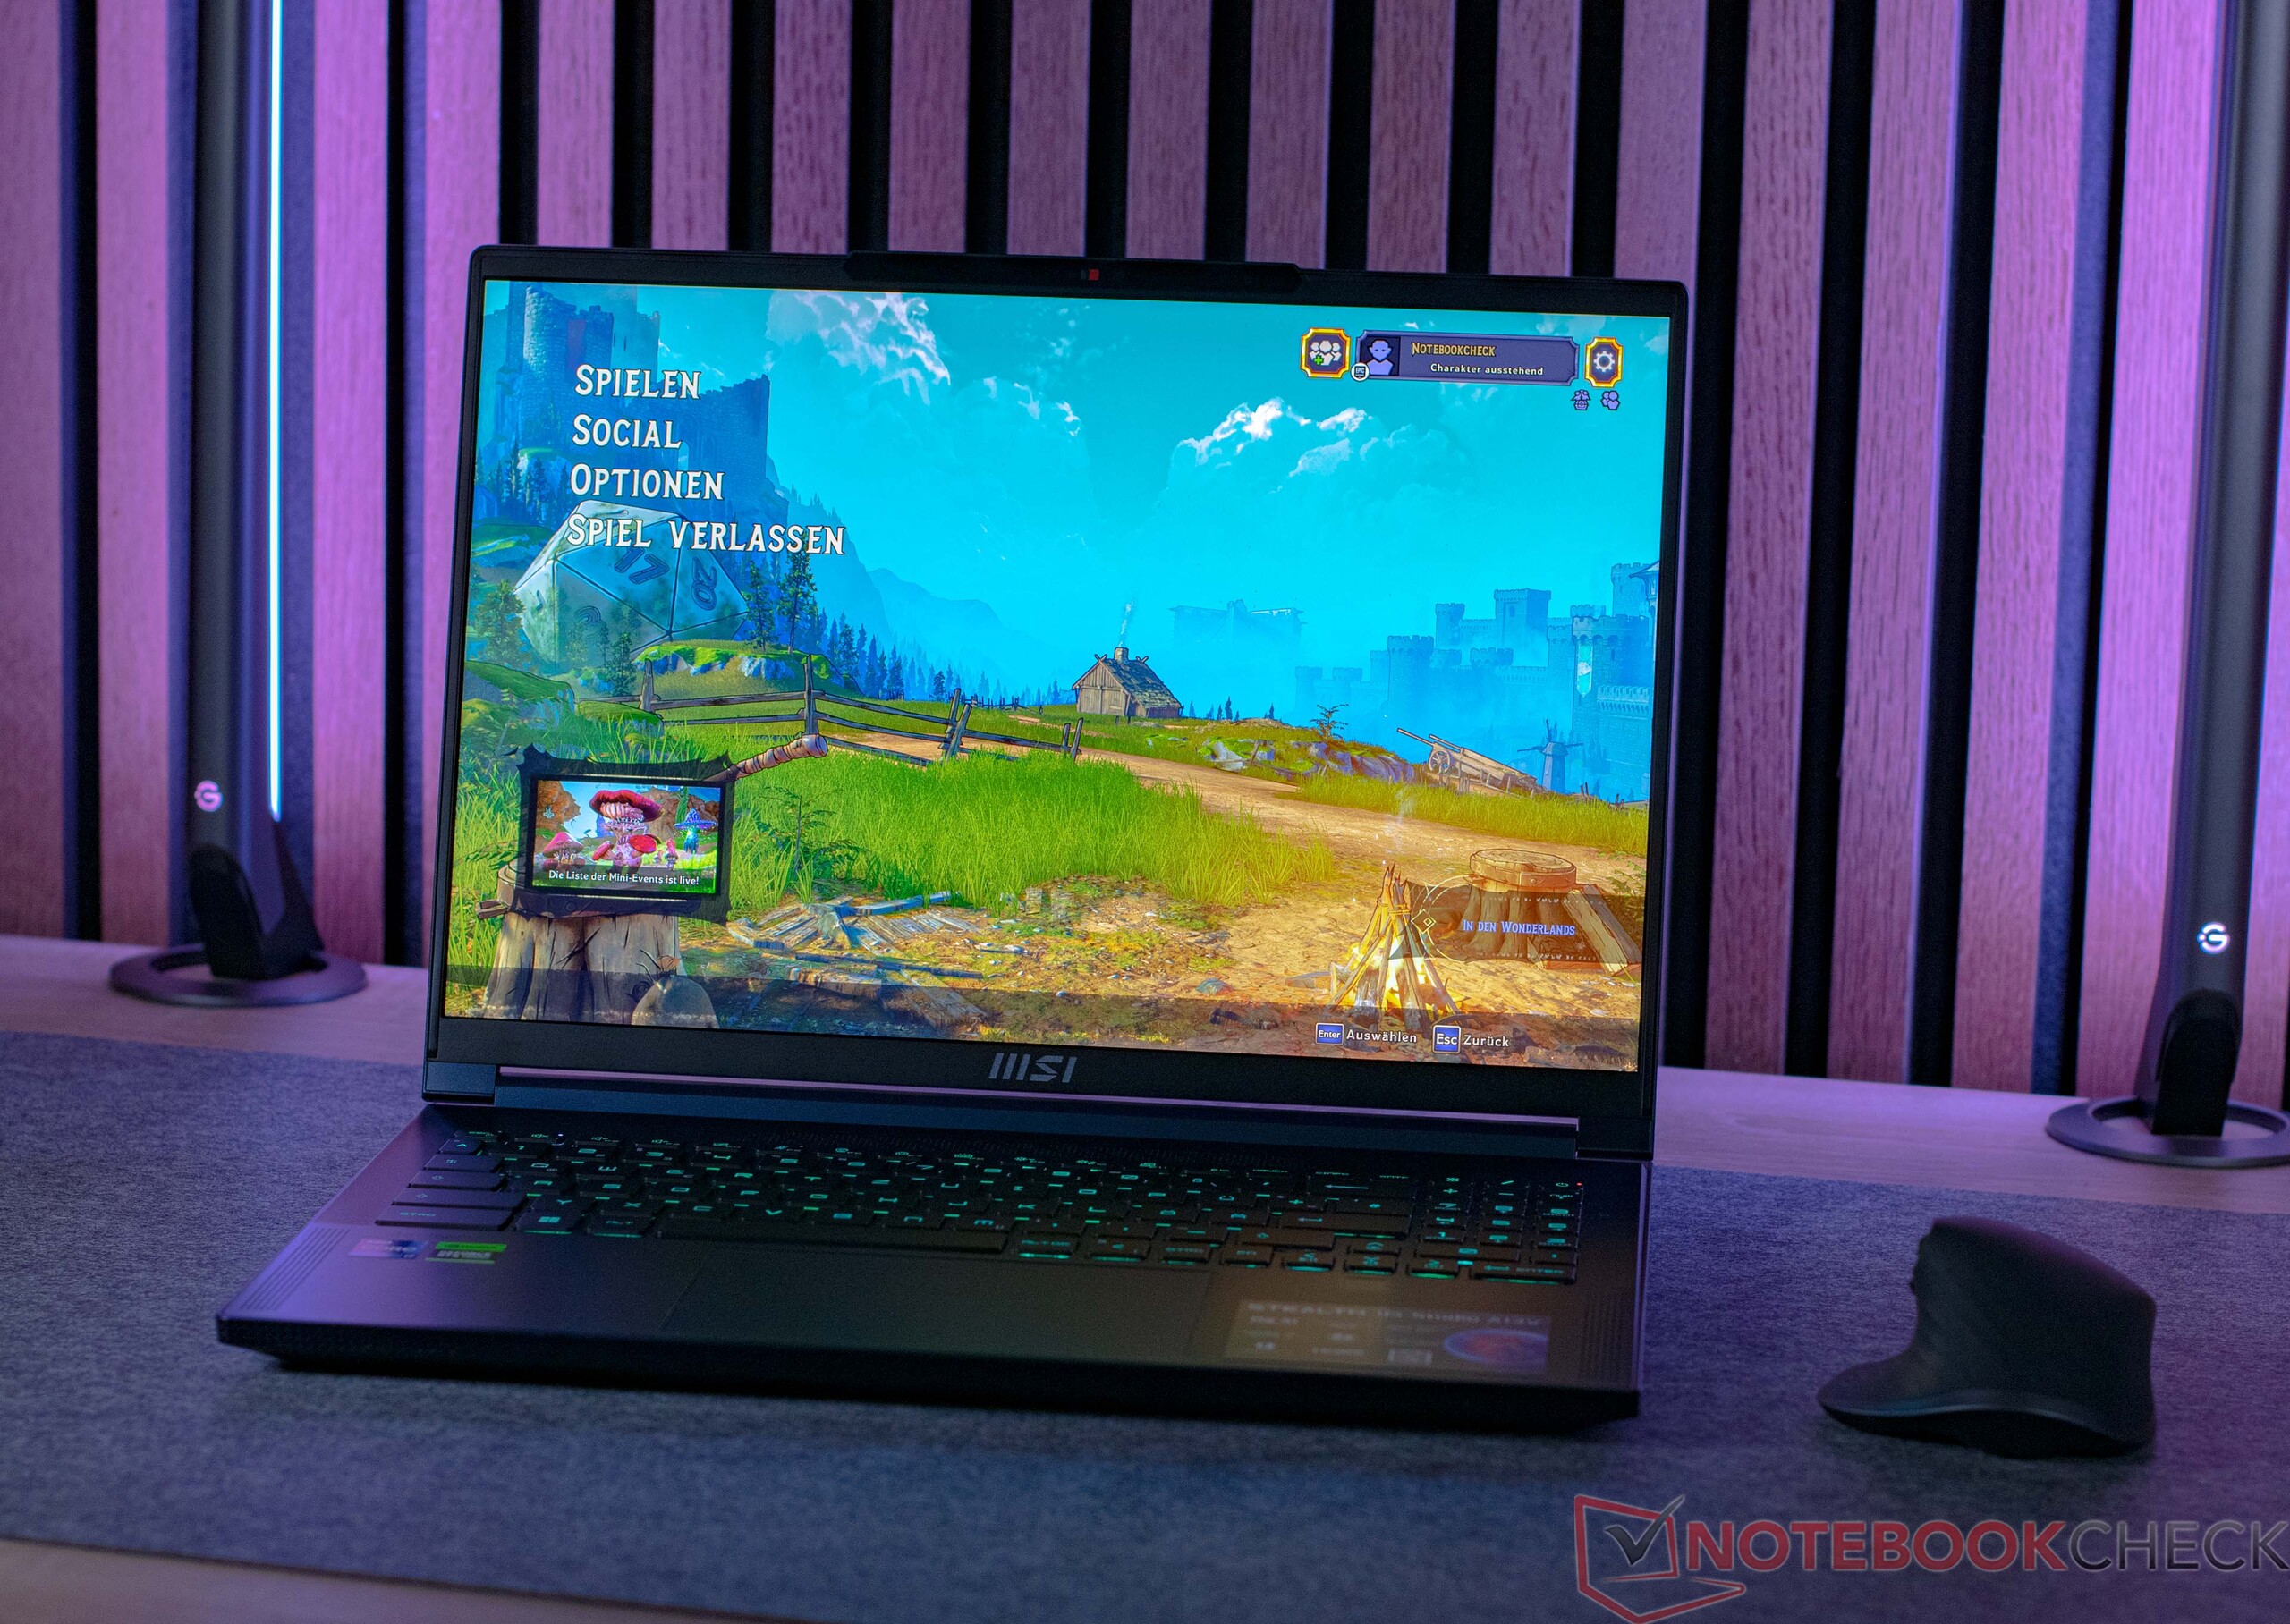
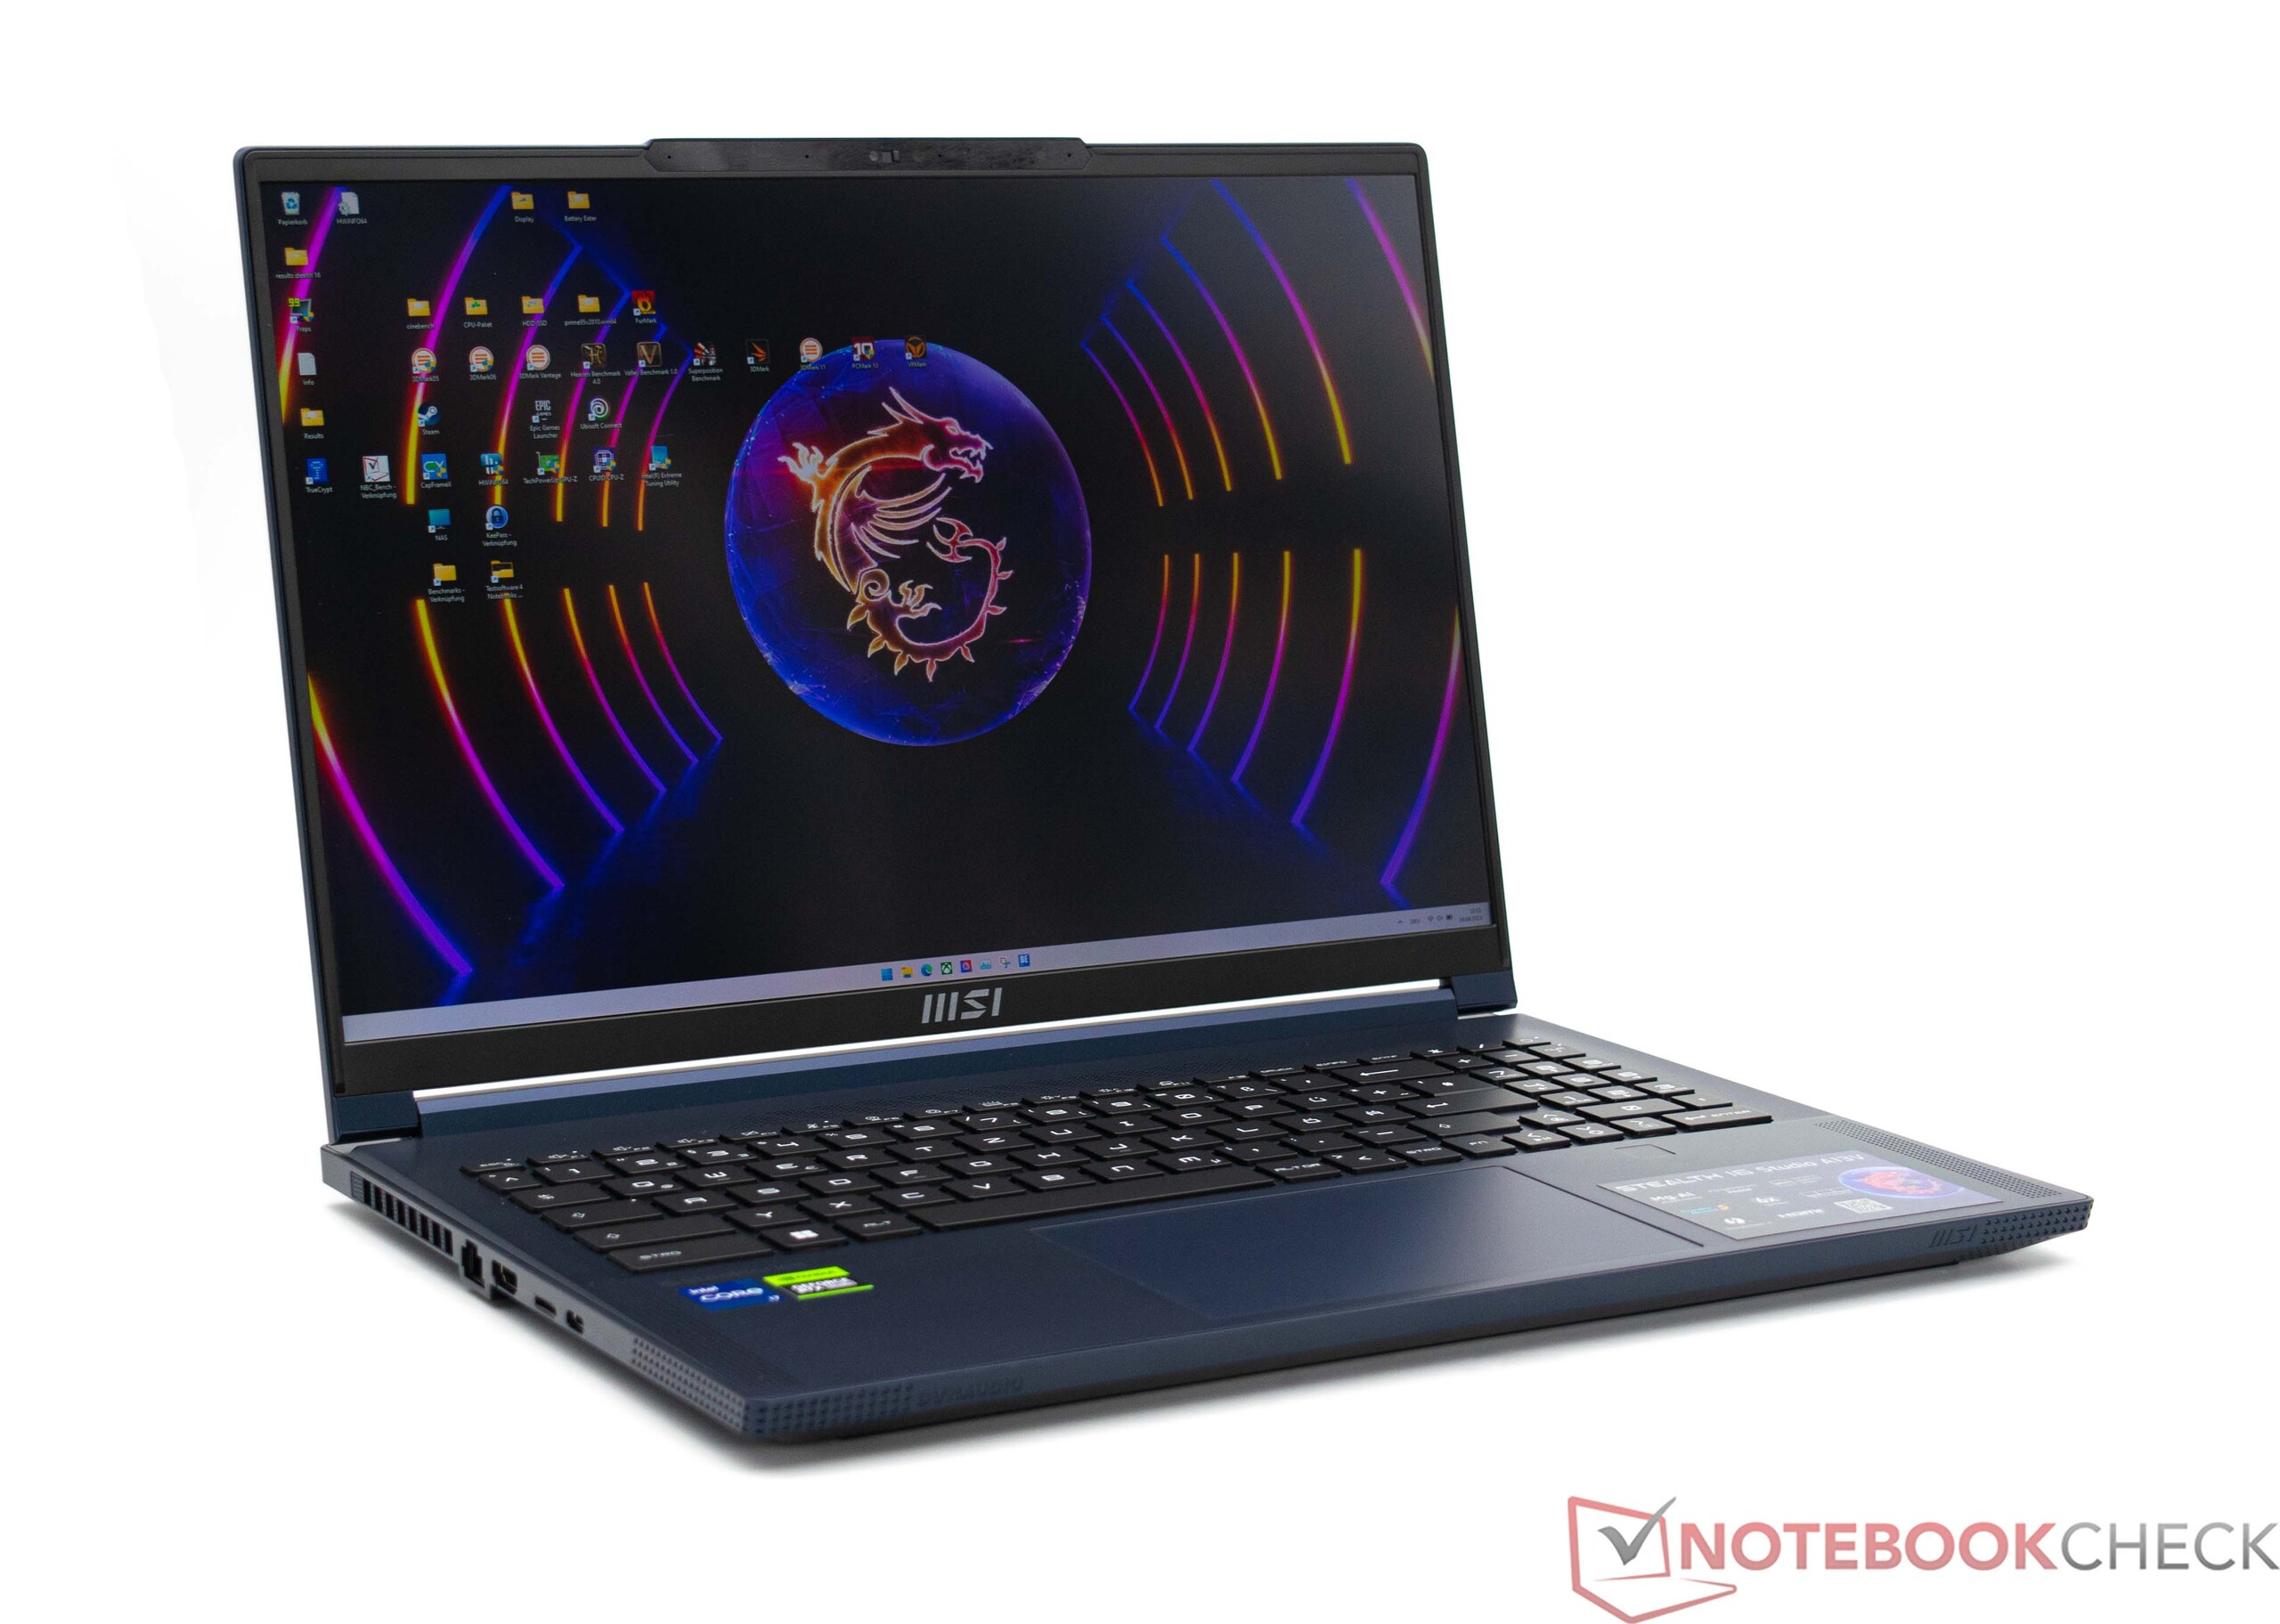
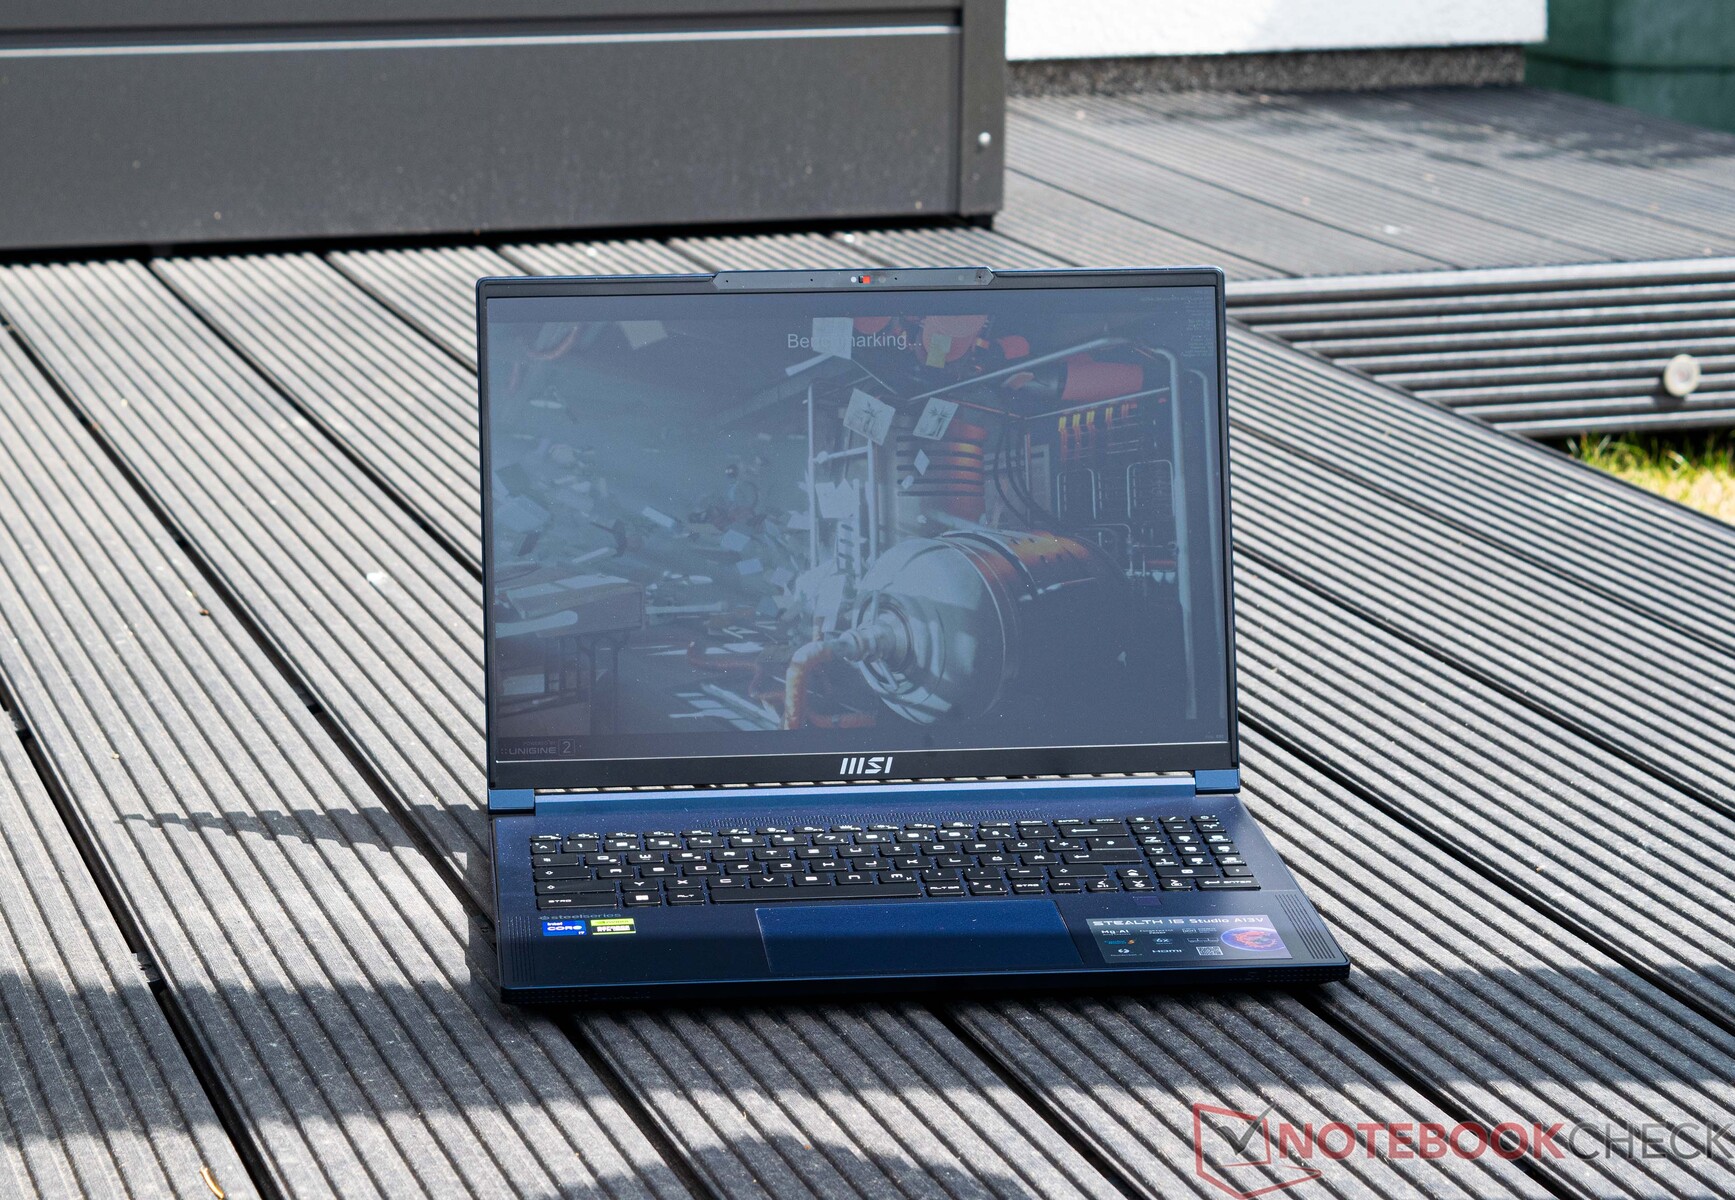
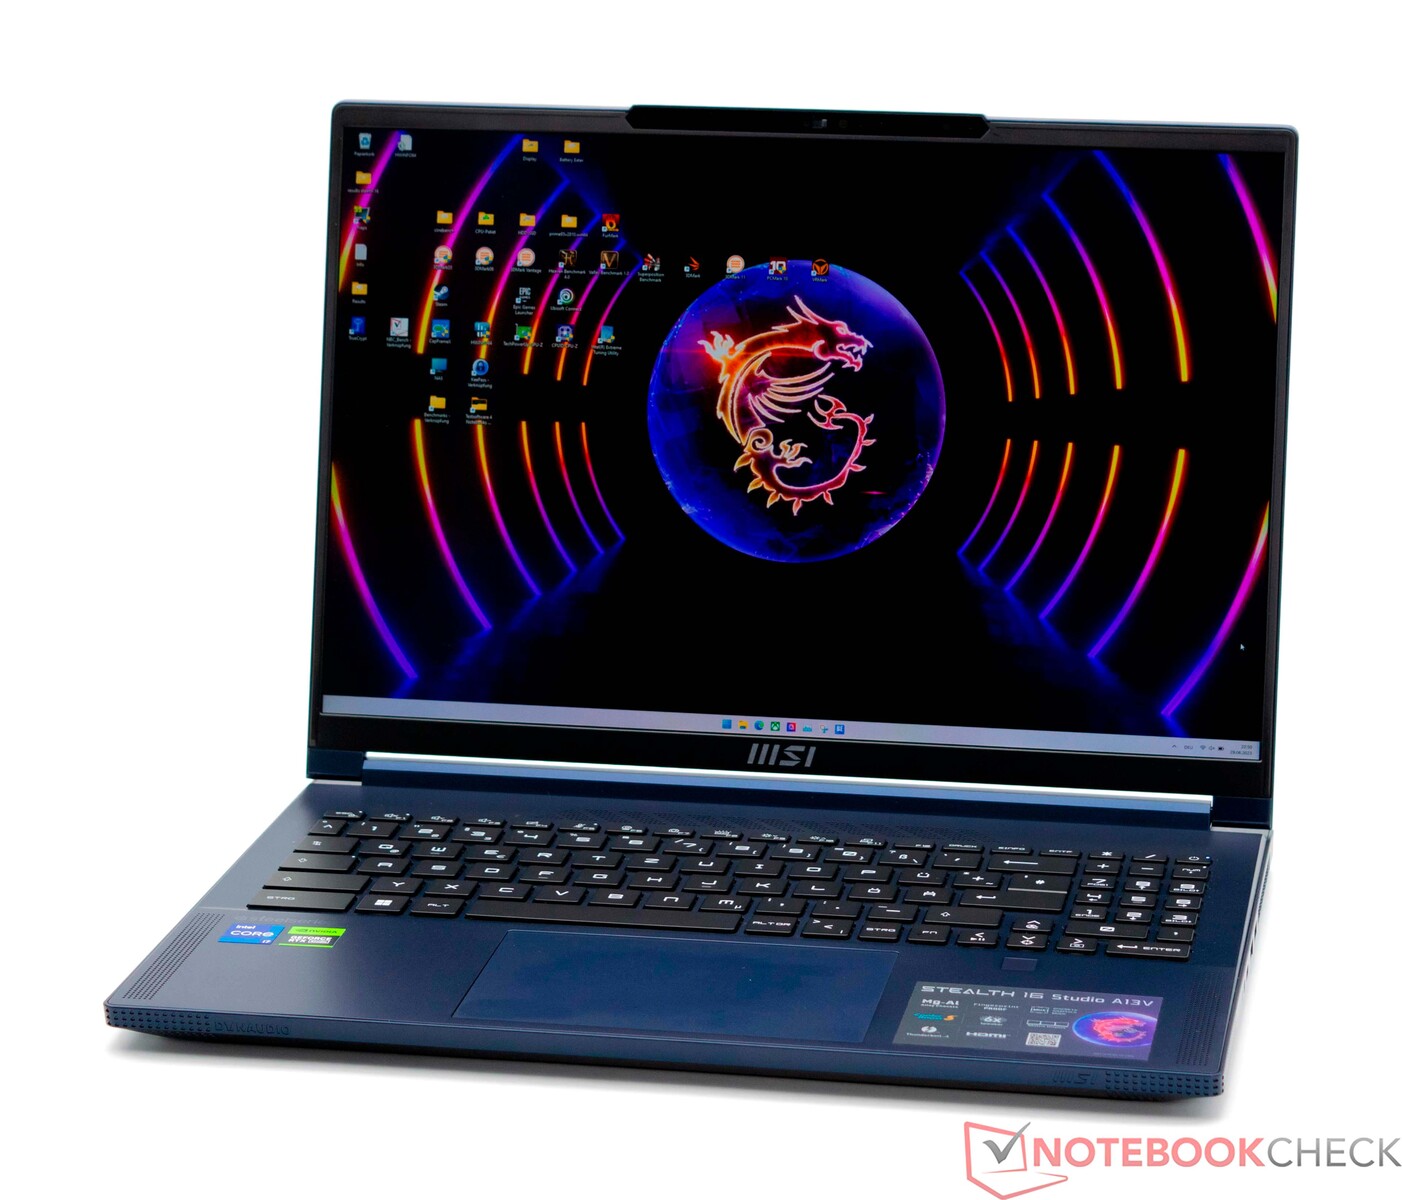
Recenzja laptopa MSI Stealth 16 Studio: Niezwykle lekkie, 16-calowe urządzenie z Core i7 i RTX 4070 dla graczy i twórców
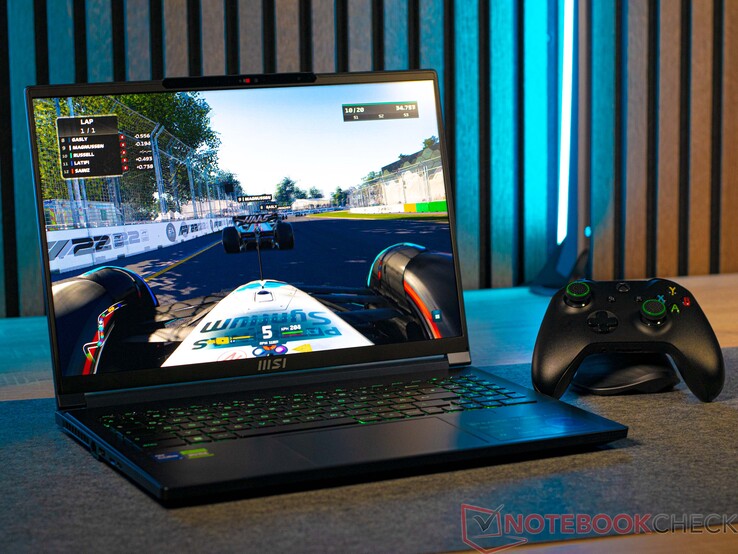
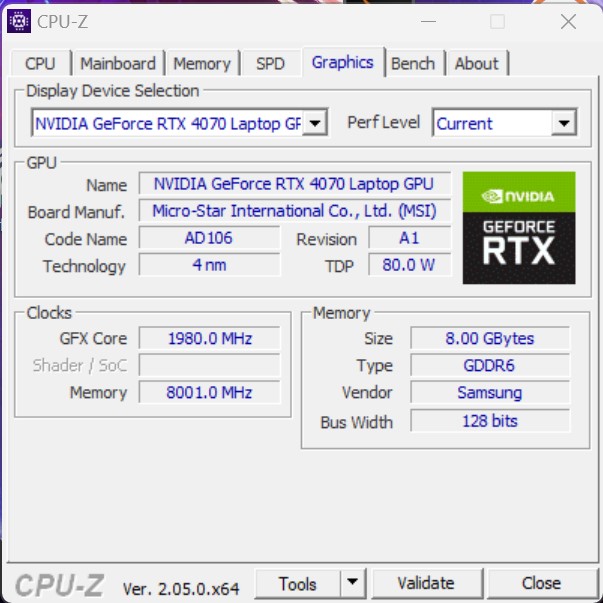
Nowy MSI Stealth 16 Studio A13VG bazuje na procesorze Procesor Intel Raptor Lake H i aktualny mobilny procesor graficzny Nvidia. Jeśli chodzi o szczegóły, nasze urządzenie testowe maIntel Core i7-13700Hsparowany zNvidia GeForce RTX 4070 laptop GPU. Jednak wizualnie MSI Stealth 16 Studio A13VG jest bardzo stonowany i udaje mu się stąpać po linii między potężnym laptopem biznesowym a laptopem do gier. Zasadniczo postrzegamy to urządzenie jako doskonałą podstawę dla twórców, którzy mogliby wykorzystać mocne strony MSI Stealth 16 Studio A13VG ze względu na jego potężne komponenty i dobrą przenośność.
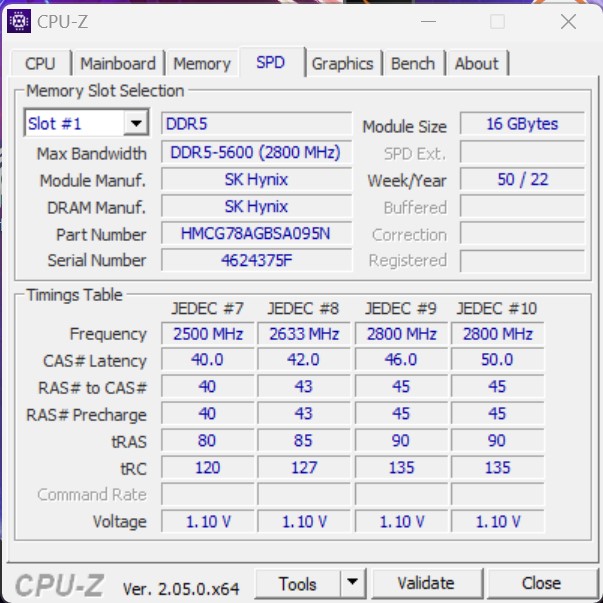
Pod względem ceny MSI Stealth 16 Studio A13VG plasuje się jednak w segmencie high-end. Ale oprócz wspomnianych już komponentów, jest 32 GB pamięci RAM DDR5 i dysk SSD o pojemności 2 TB. Nie można też zapomnieć o 16-calowym wyświetlaczu QHD+. Dzięki częstotliwości odświeżania 240 Hz jest on skierowany wprost do społeczności graczy.
W tej recenzji MSI Stealth 16 Studio A13VG będzie musiał sprawdzić się w porównaniu z obecnymi 16-calowymi laptopami. Więcej szczegółów znajduje się w poniższej tabeli.
Potencjalni konkurenci w porównaniu
Ocena | Data | Model | Waga | Wysokość | Rozmiar | Rezolucja | Cena |
|---|---|---|---|---|---|---|---|
| 88.8 % v7 (old) | 07/2023 | MSI Stealth 16 Studio A13VG i7-13700H, GeForce RTX 4070 Laptop GPU | 2 kg | 19.95 mm | 16.00" | 2560x1600 | |
| 89.7 % v7 (old) | 06/2023 | Asus ROG Flow X16 GV601V i9-13900H, GeForce RTX 4060 Laptop GPU | 2.1 kg | 19.4 mm | 16.00" | 2560x1600 | |
| 89 % v7 (old) | 04/2023 | Medion Erazer Major X20 i9-13900HX, GeForce RTX 4070 Laptop GPU | 2.4 kg | 29 mm | 16.00" | 2560x1600 | |
| 88.1 % v7 (old) | 06/2023 | Acer Nitro 16 AN16-41 R7 7735HS, GeForce RTX 4070 Laptop GPU | 2.7 kg | 27.9 mm | 16.00" | 2560x1600 | |
| 86.6 % v7 (old) | 12/2022 | Corsair Voyager a1600 R9 6900HS, Radeon RX 6800M | 2.4 kg | 19.9 mm | 16.00" | 2560x1600 | |
| 86.2 % v7 (old) | 03/2023 | Gigabyte AERO 16 OLED BSF i9-13900H, GeForce RTX 4070 Laptop GPU | 2.1 kg | 18 mm | 16.00" | 3840x2400 |
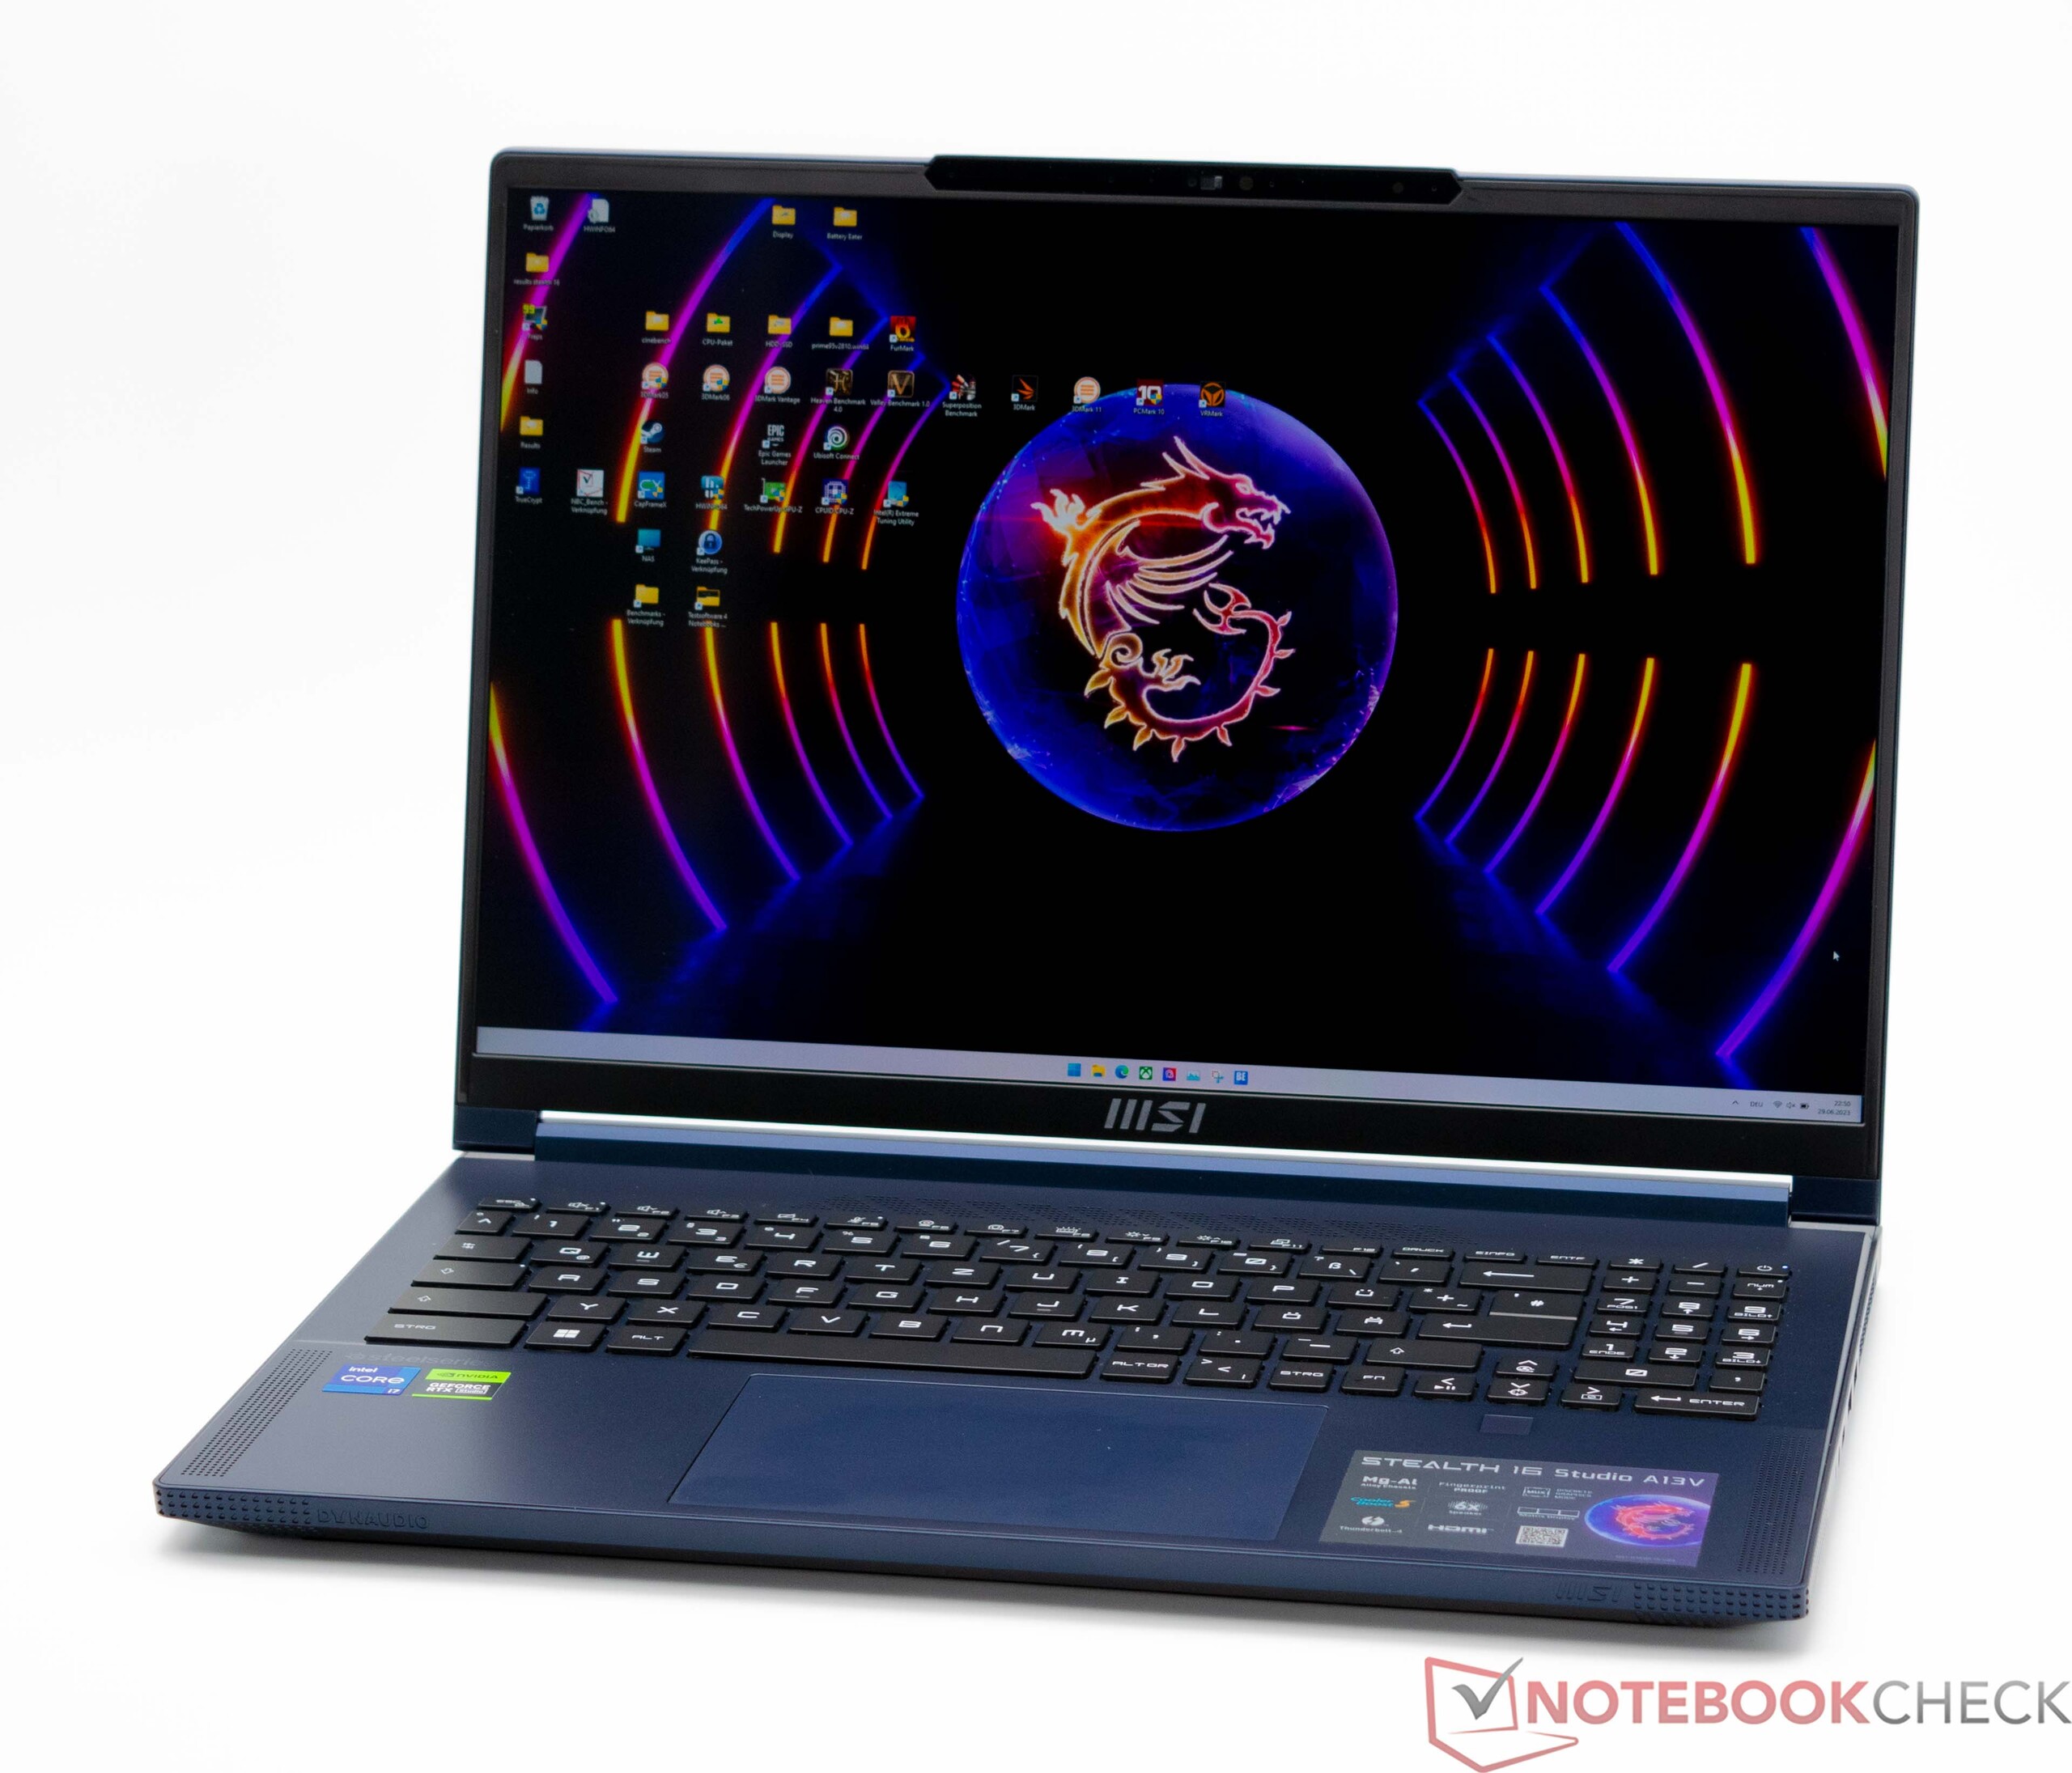
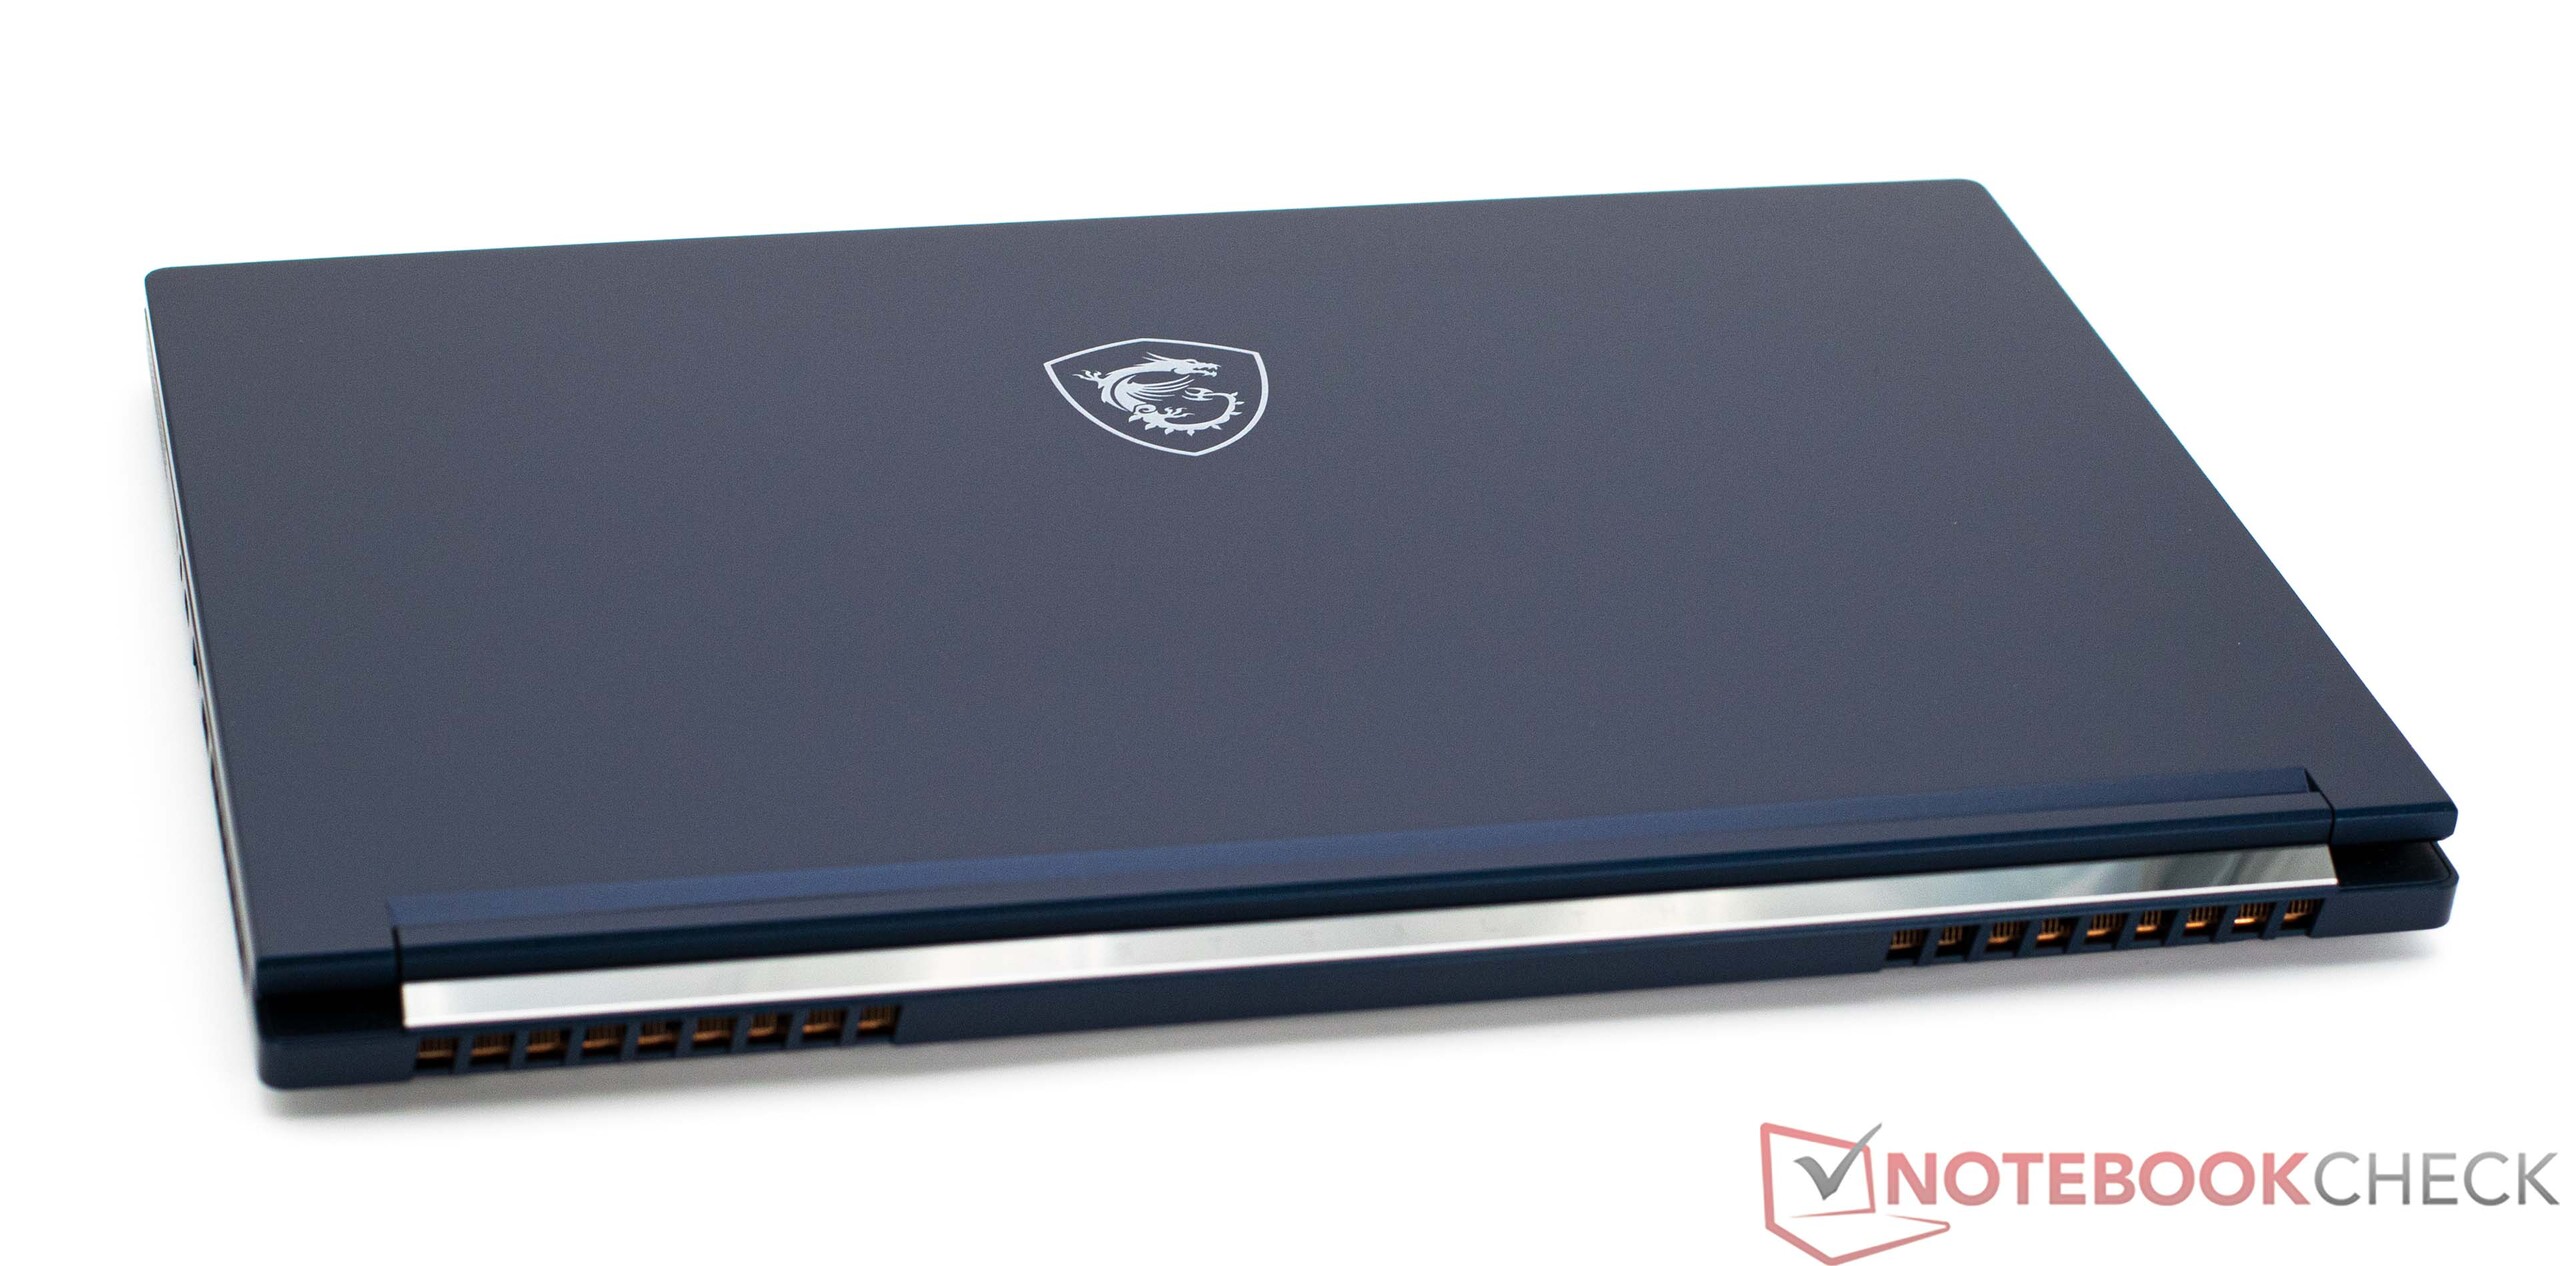
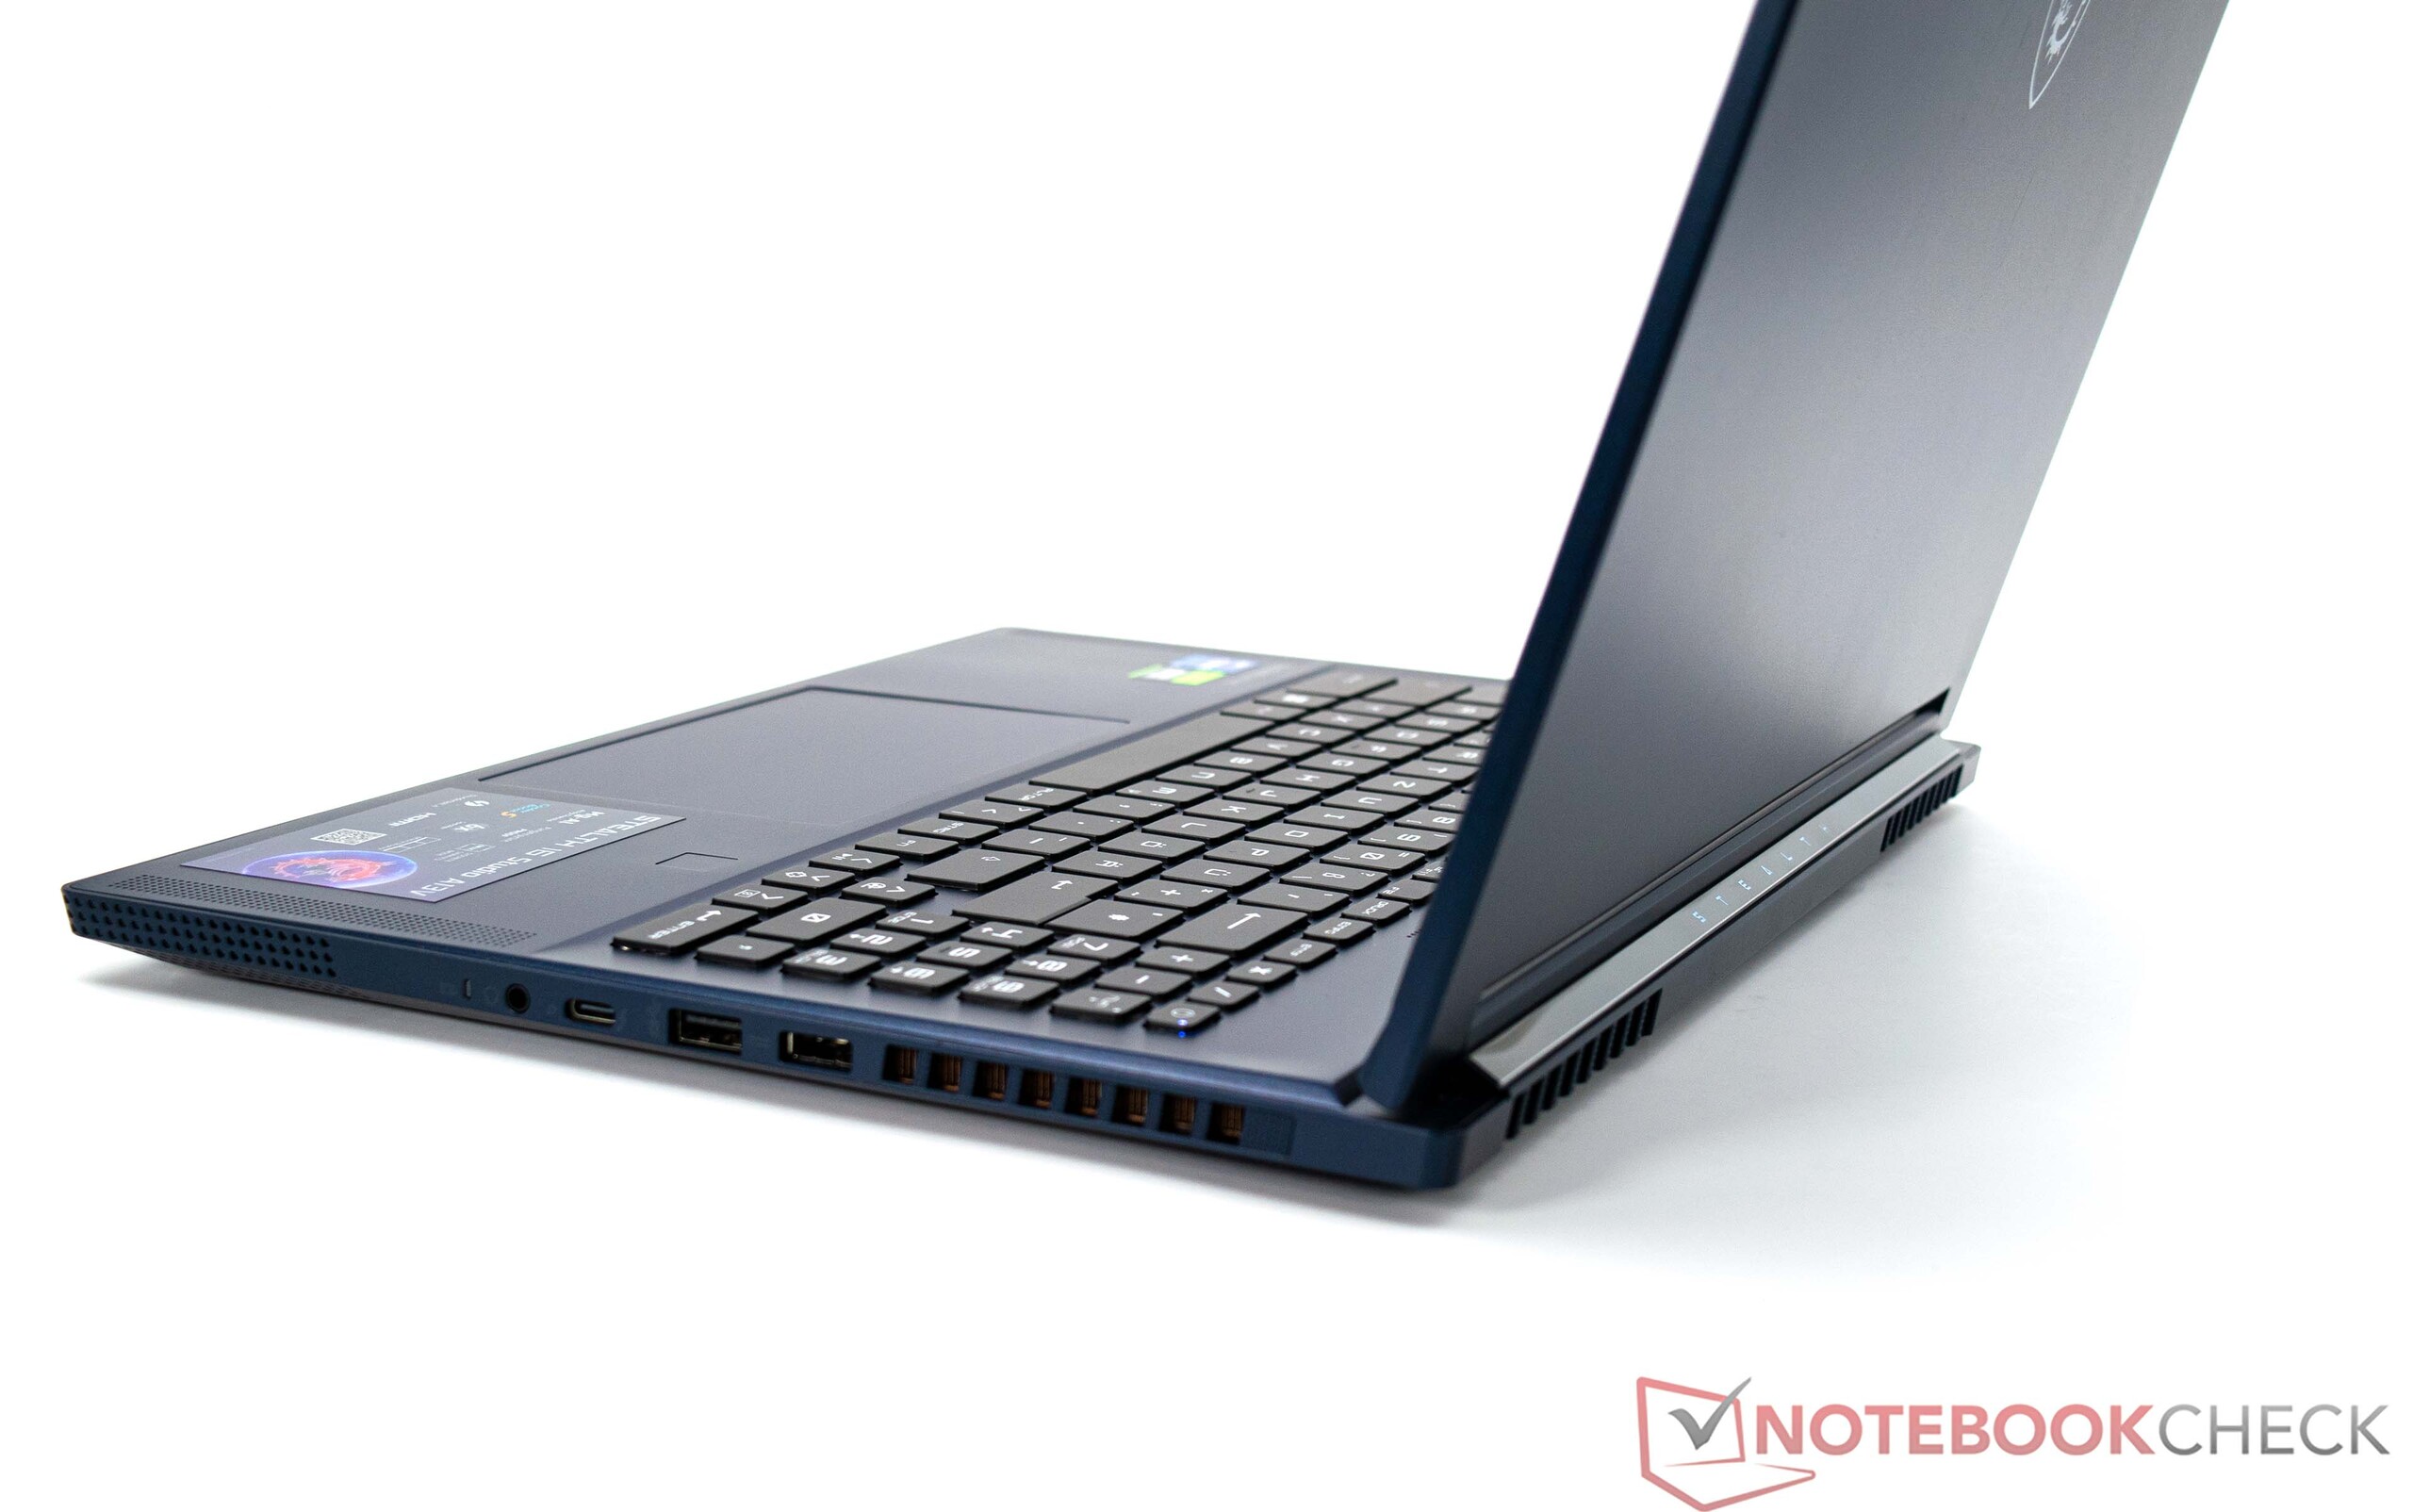
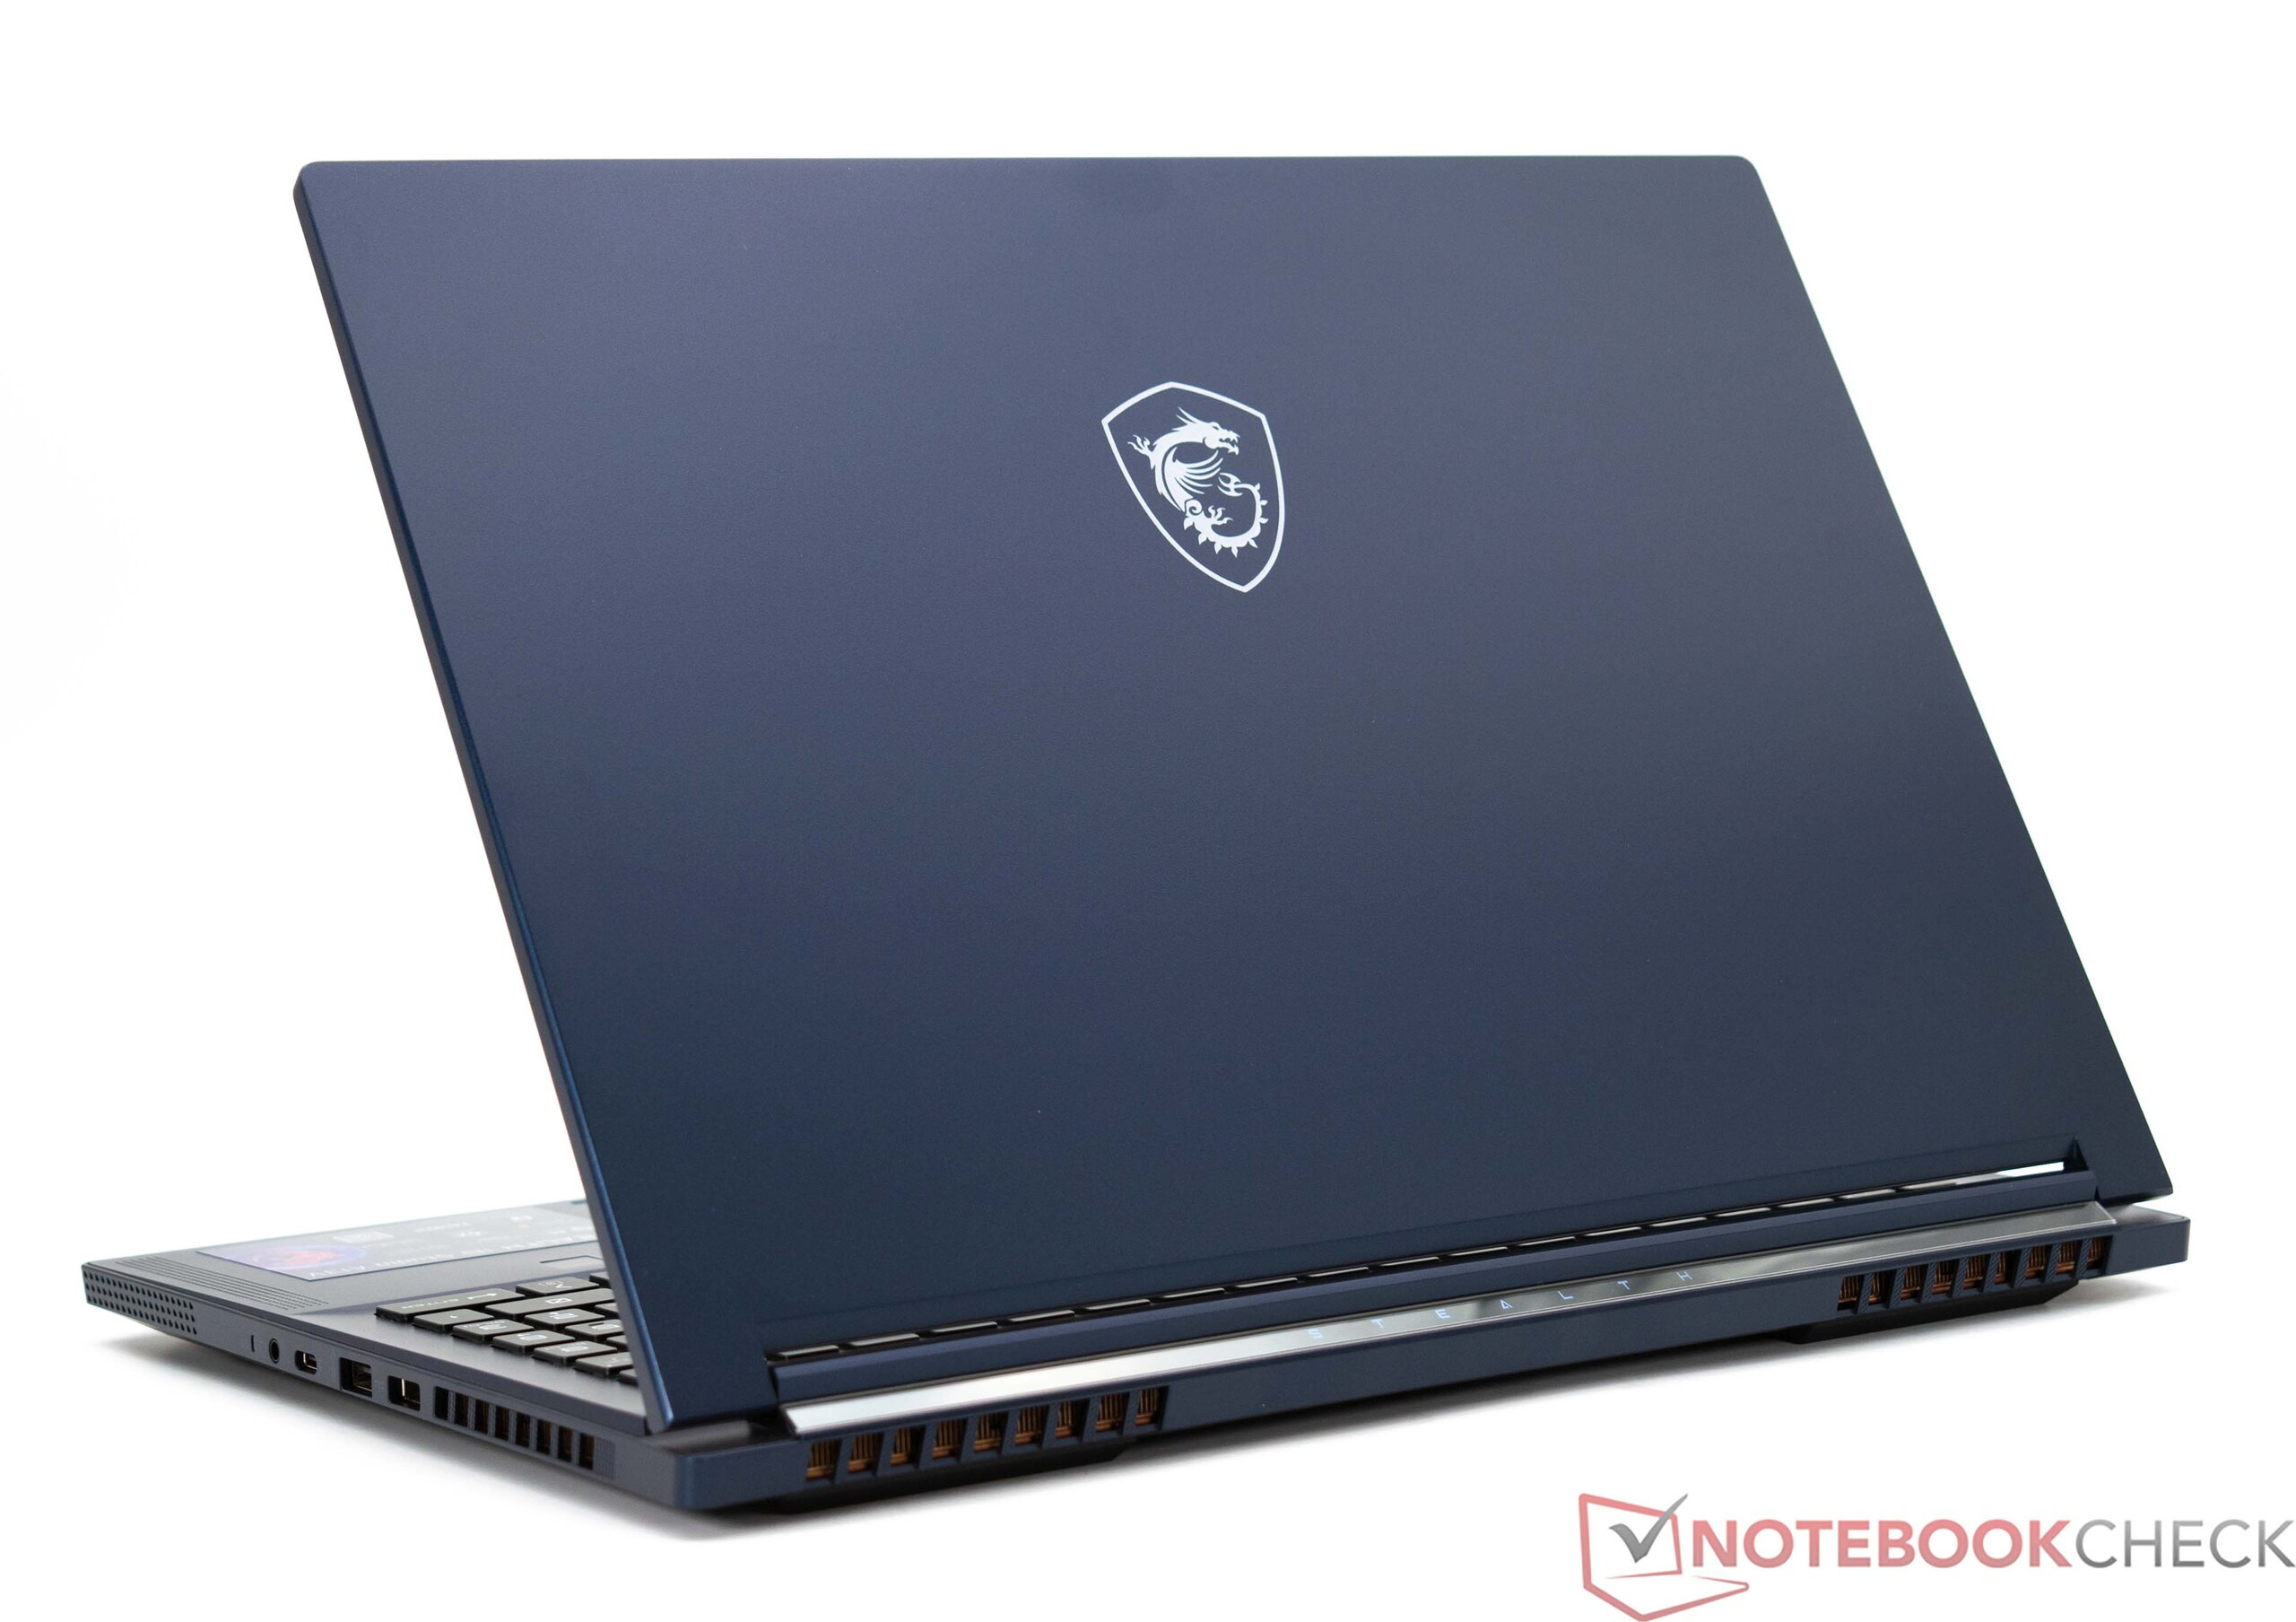
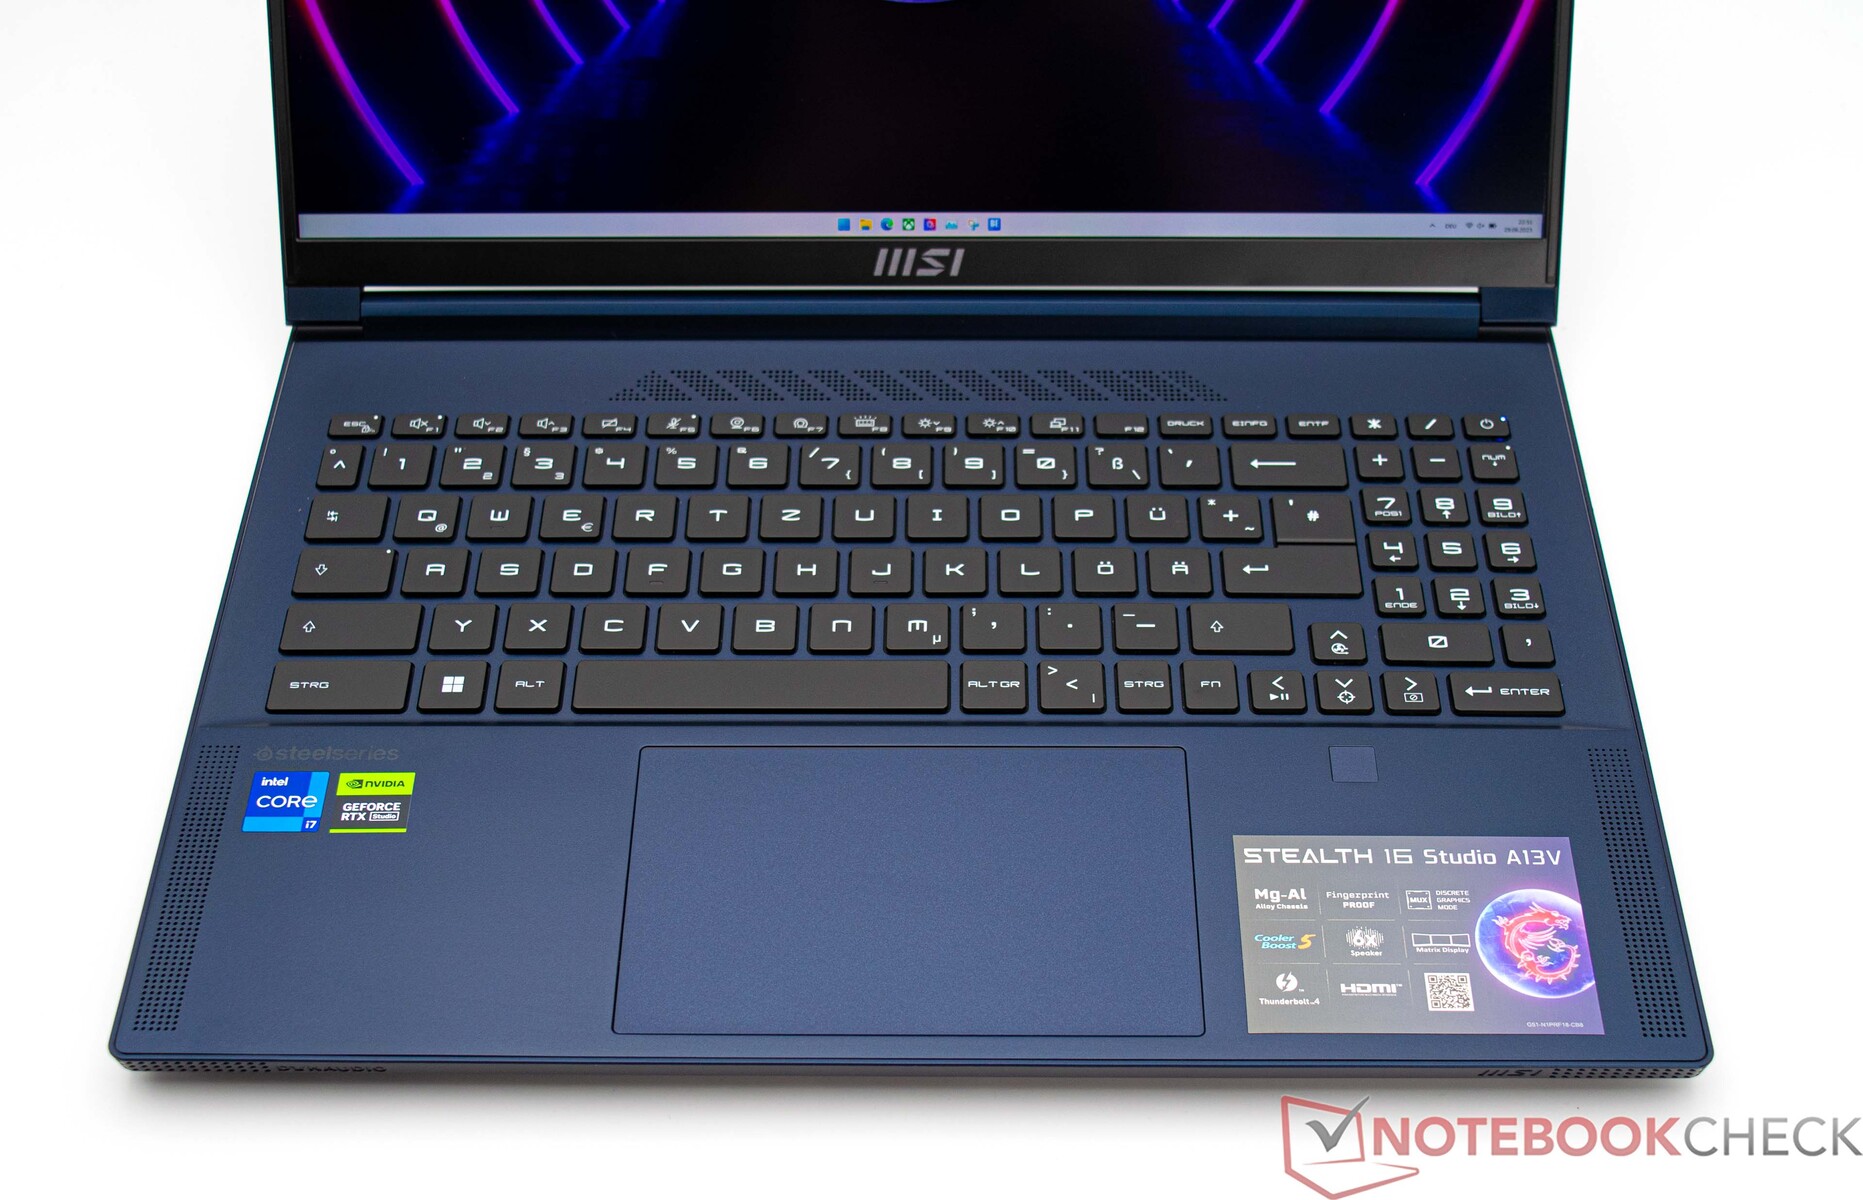
Obudowa - aluminium i magnez zapewniają wytrzymałość
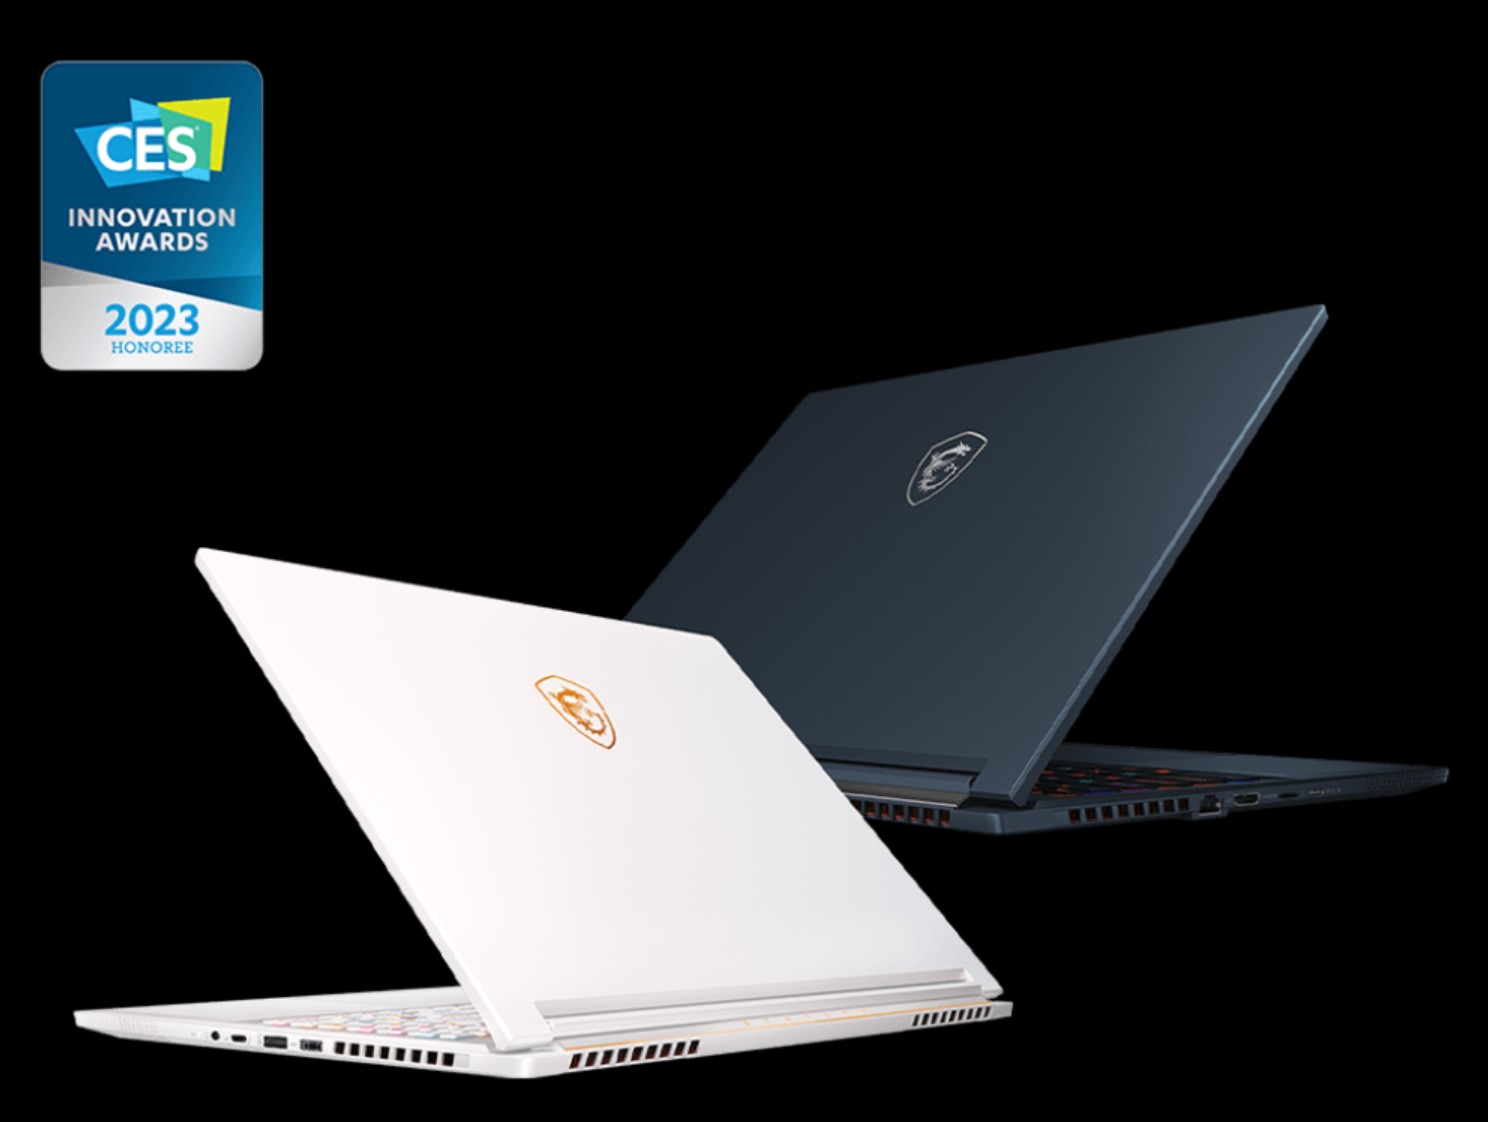
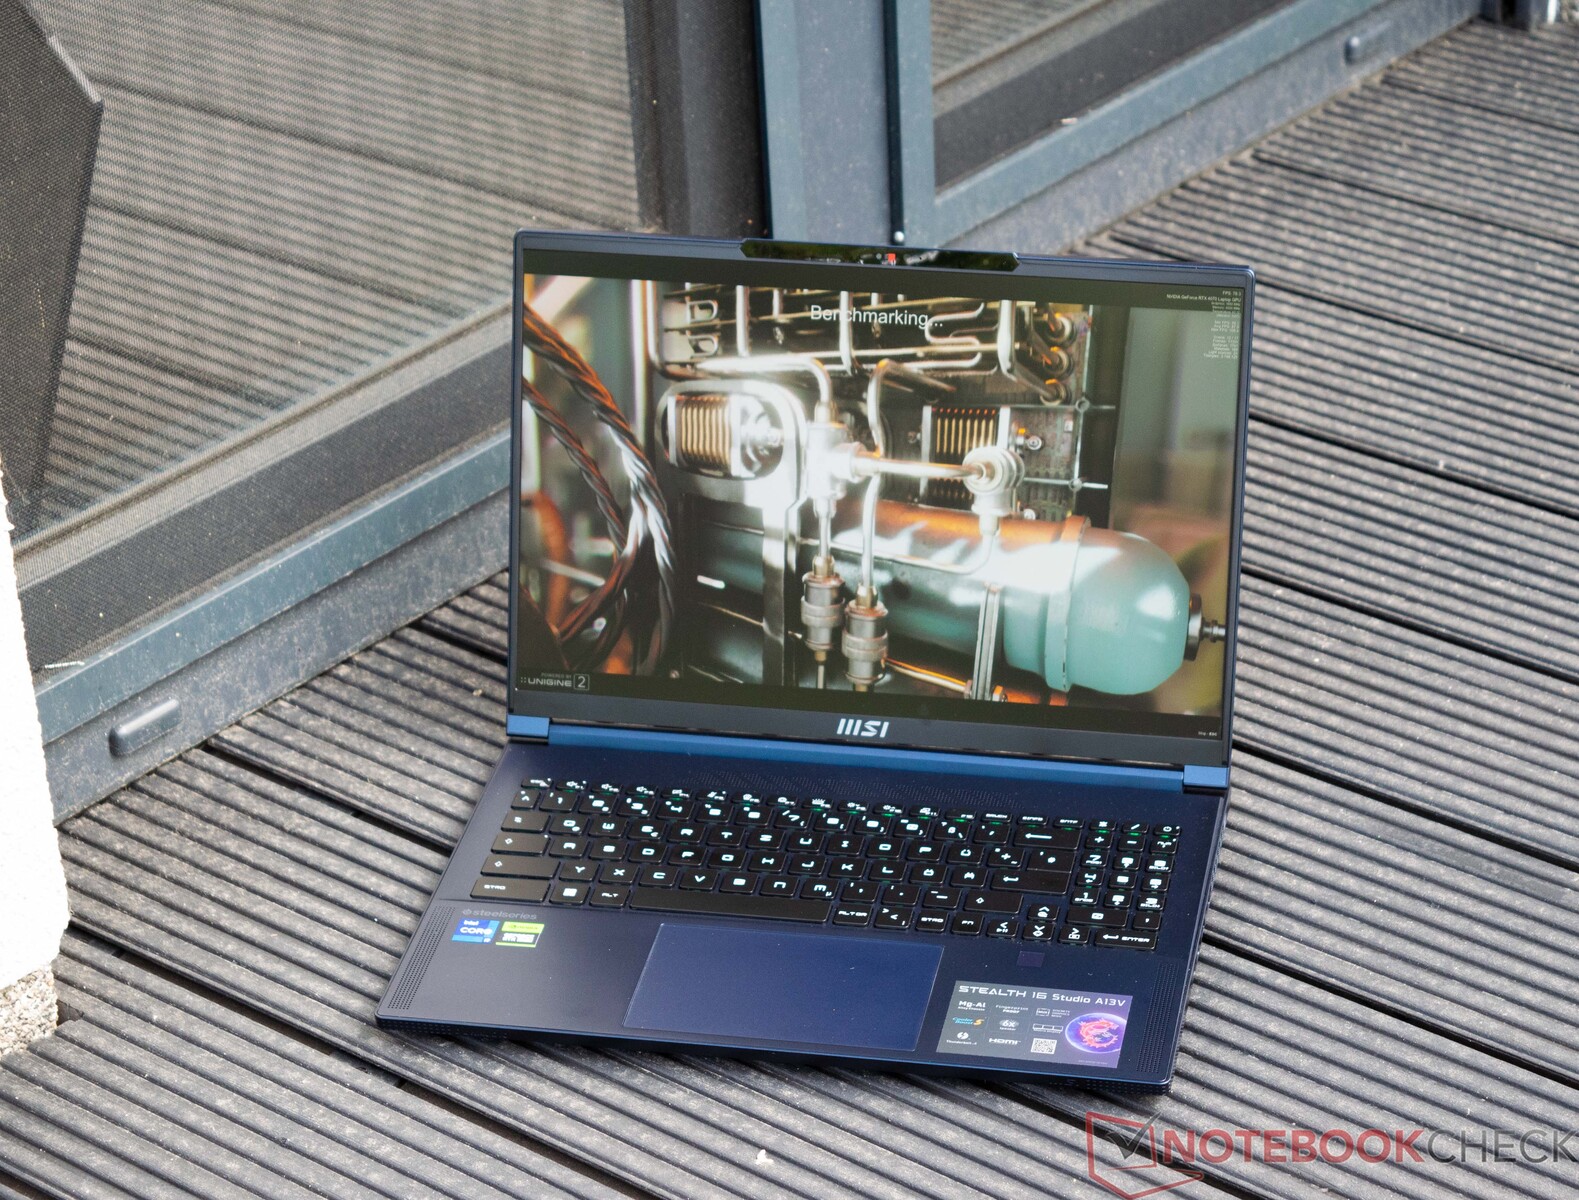
W MSI Stealth 16 Studio A13VG zastosowano głównie materiały wysokiej jakości. Mieszanka aluminium i magnezu nadaje urządzeniu nie tylko finezji i dobrej stabilności, ale jednocześnie zmniejsza jego wagę. Zastosowanie selektywnego nacisku powoduje jedynie minimalne ugięcie podstawy, ale tylko przy zastosowaniu umiarkowanego nacisku. Z drugiej strony, pokrywa obudowy może być lekko skręcona, choć nie wydaje się to być wyjątkowo negatywnym aspektem w MSI Stealth 16 Studio A13VG. Zawiasy wykonują dobrą robotę i pomagają zapobiegać kołysaniu się pokrywy w przód iw tył. Niemniej jednak, urządzenie można otworzyć jedną ręką. Z punktu widzenia wzornictwa laptop jest stonowany i nie ma zbyt wielu podświetleń RGB. Z tyłu tylko napis "Stealth" jest subtelnie podświetlony. Nasze recenzowane urządzenie jest niebieskie, ale alternatywnie MSI Stealth 16 Studio jest również dostępny w całości w kolorze białym.
Jeśli chodzi o powierzchnię laptopa, wszystkie urządzenia zajmują mniej więcej tyle samo miejsca. Z kolei pod względem wagi, MSI Stealth 16 Studio A13VG należy do najlżejszych kandydatów w naszym porównaniu, z urządzeniem ważącym nieco ponad 2 kilogramy. Zasilacz waży 576 gramów.
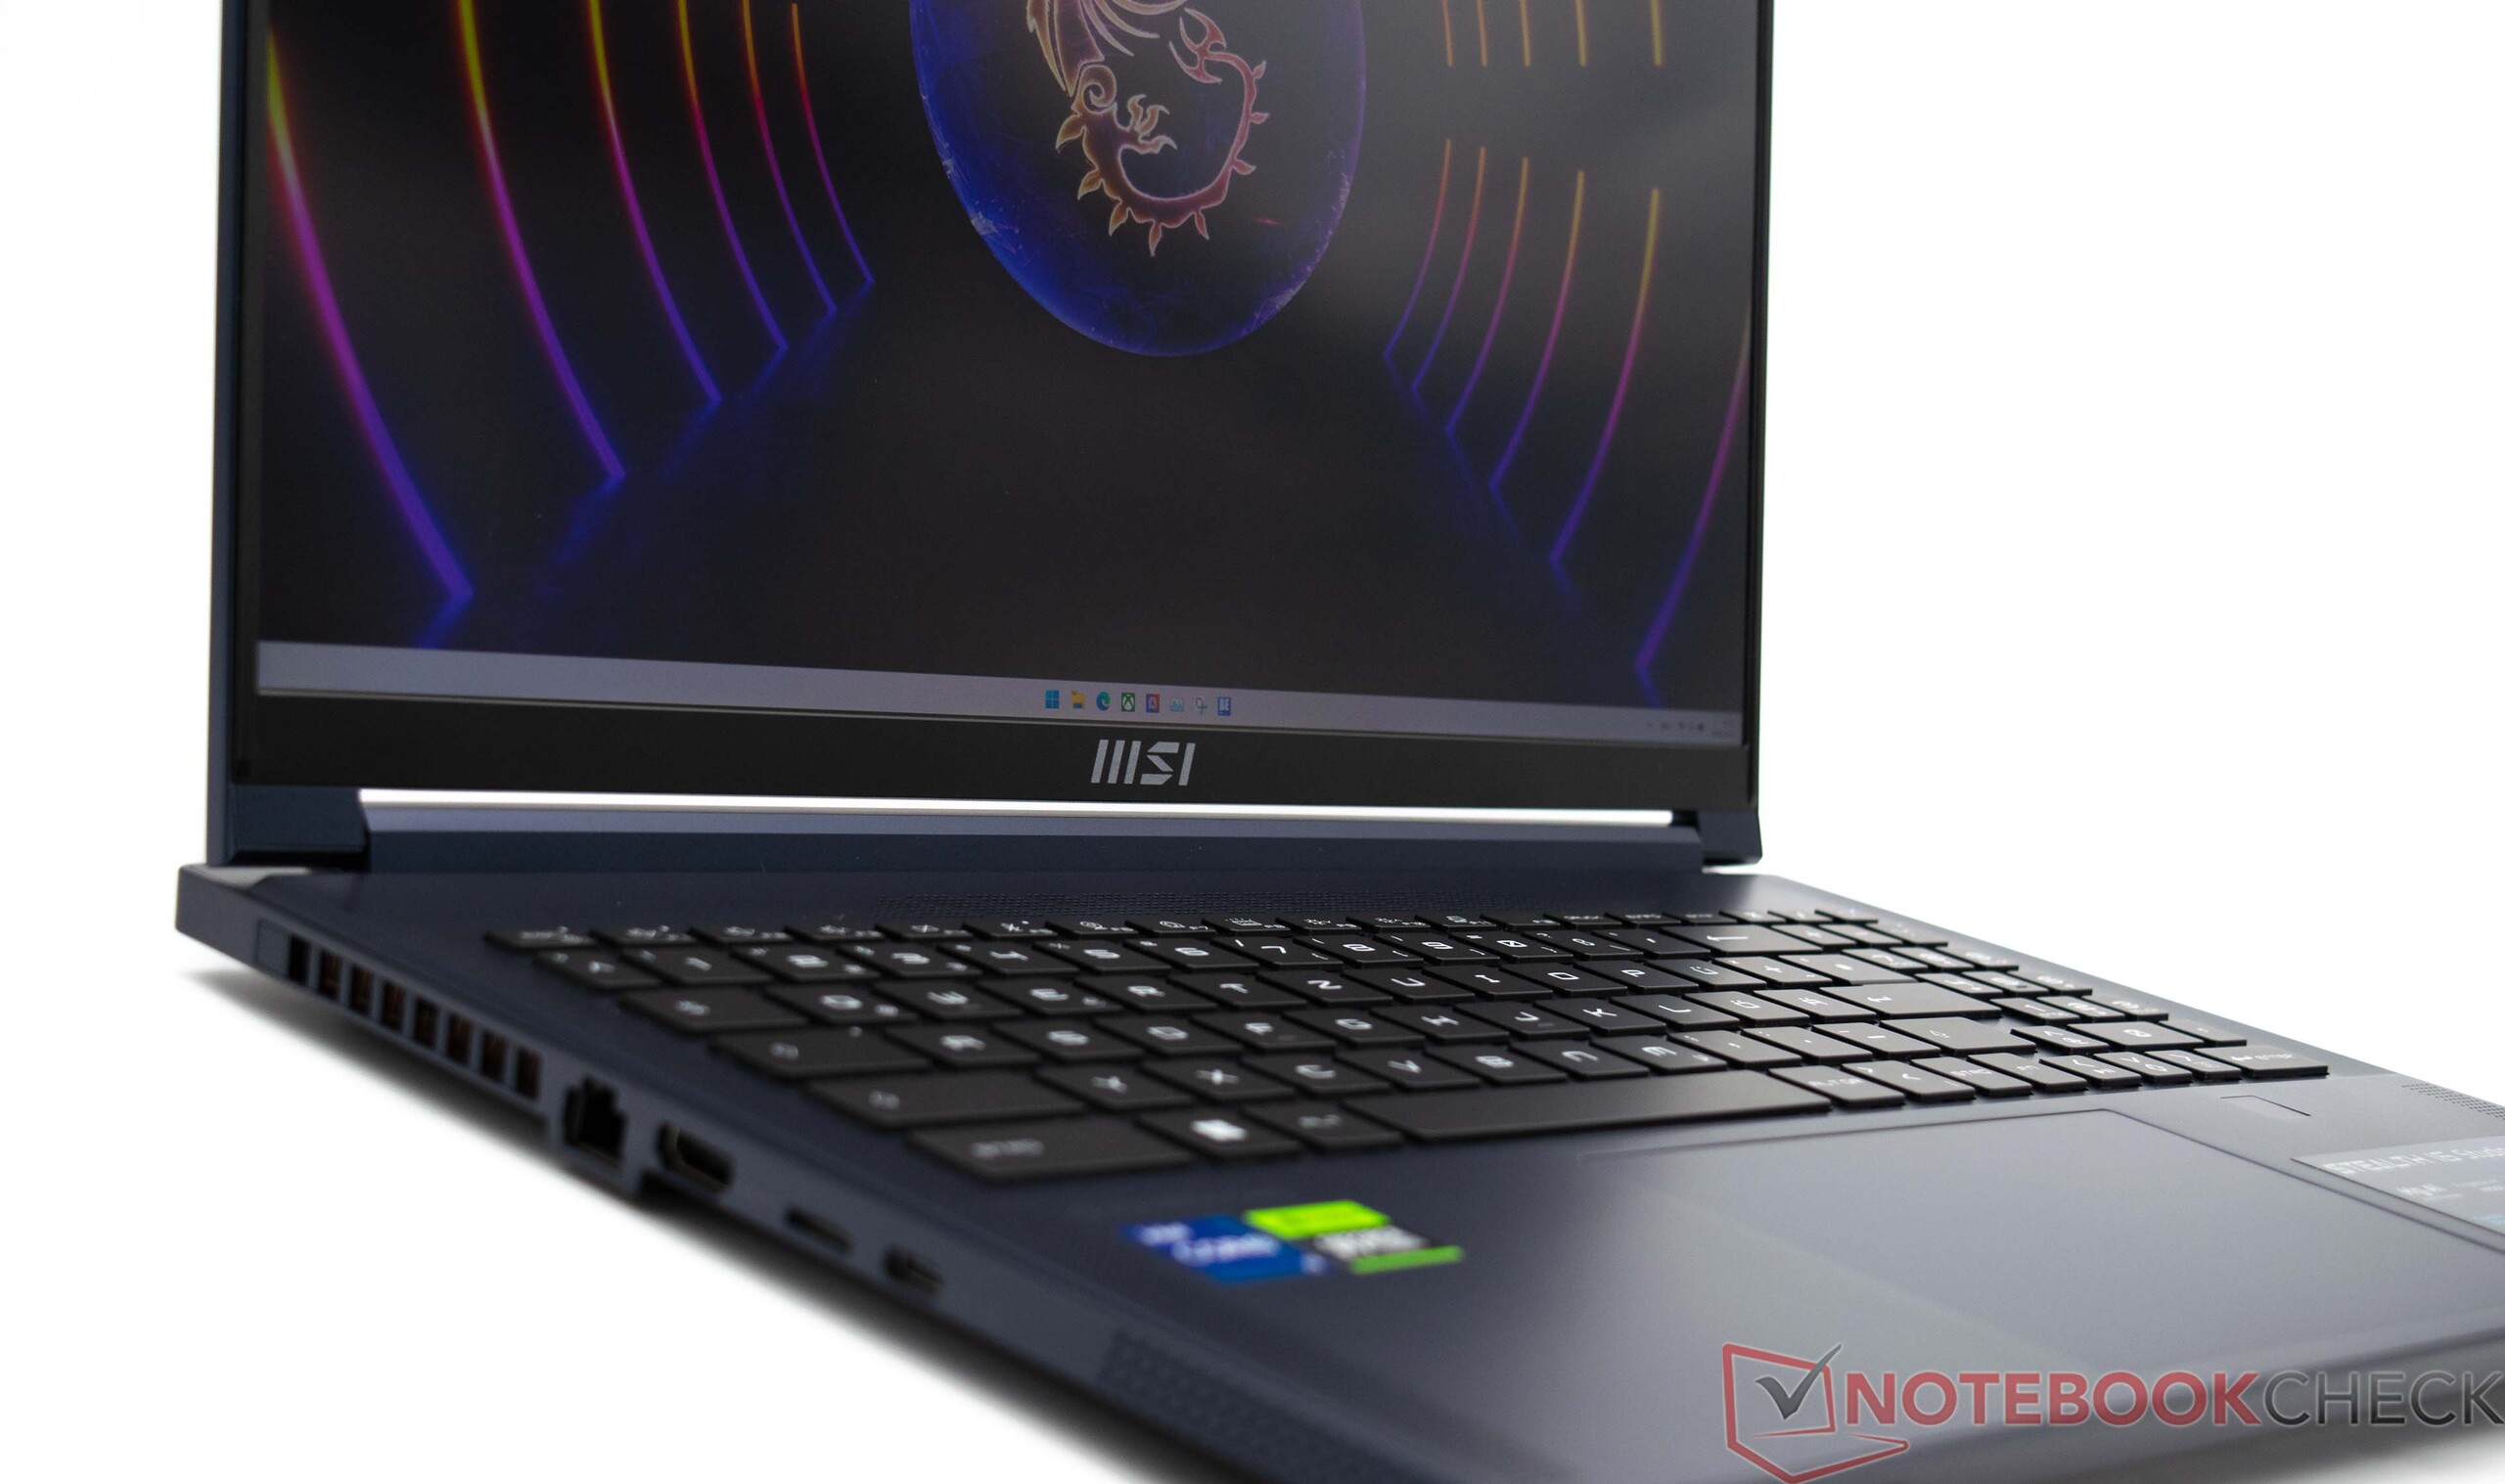
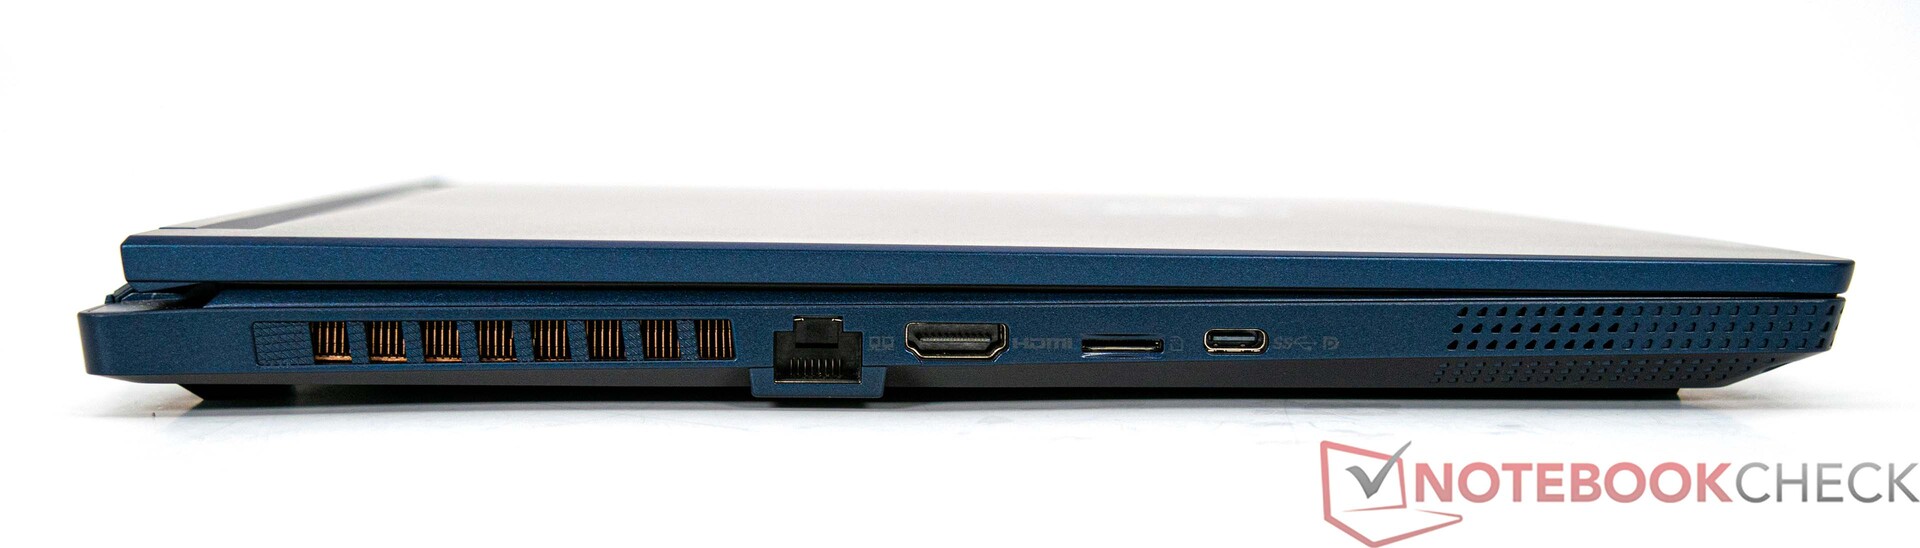
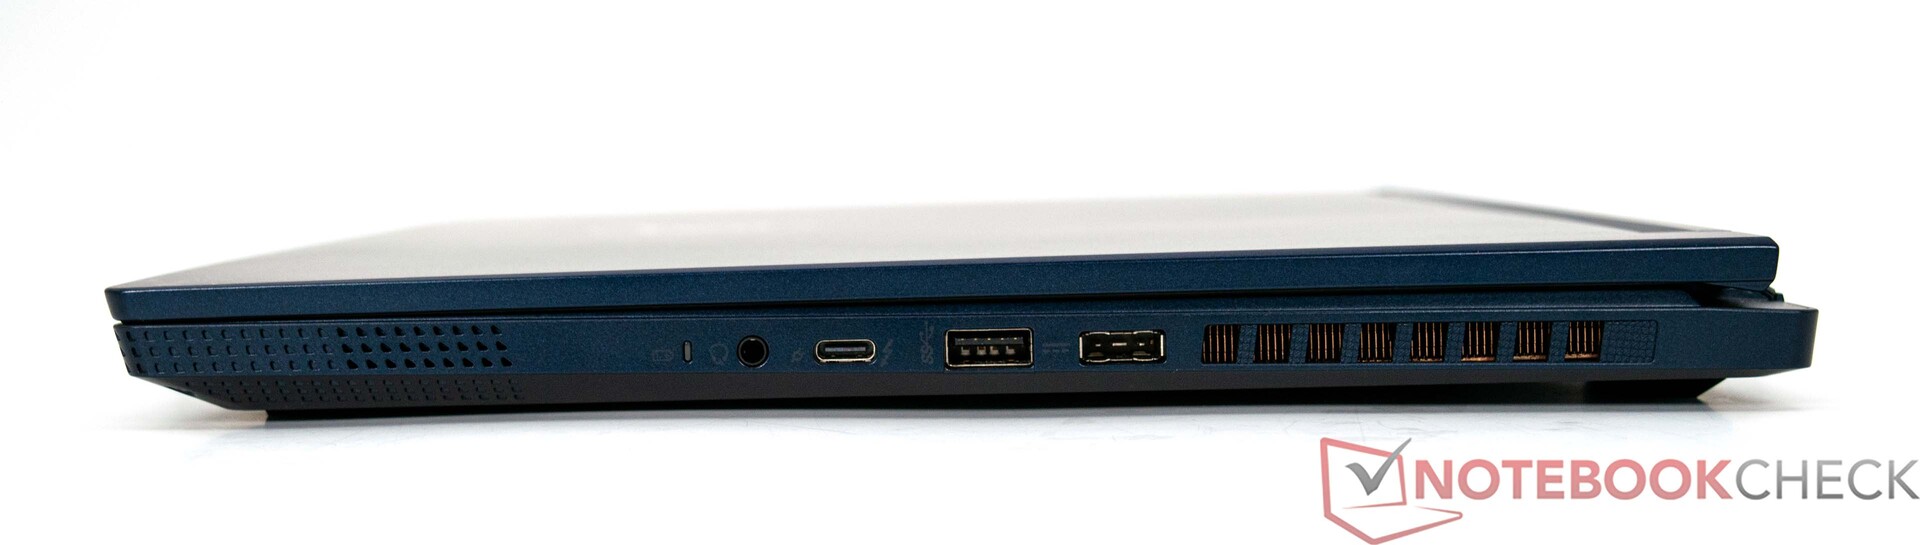
Funkcje - uporządkowane i z Thunderbolt 4
Niestety, MSI Stealth 16 Studio A13VG nie jest wyposażona w szczególnie dużą liczbę portów. Jednak dostarczone interfejsy powinny być wystarczające dla większości użytkowników w codziennych sytuacjach. W zestawie znajduje się przynajmniej nowoczesny port Thunderbolt 4 z funkcją Power Delivery (PD). Użytkownicy są jednak ograniczeni tylko do jednego portu USB-A. Zewnętrzne monitory można podłączyć do laptopa przez HDMI lub USB-C, co oznacza, że jednocześnie można korzystać z trzech wyświetlaczy.
Czytnik kart SD
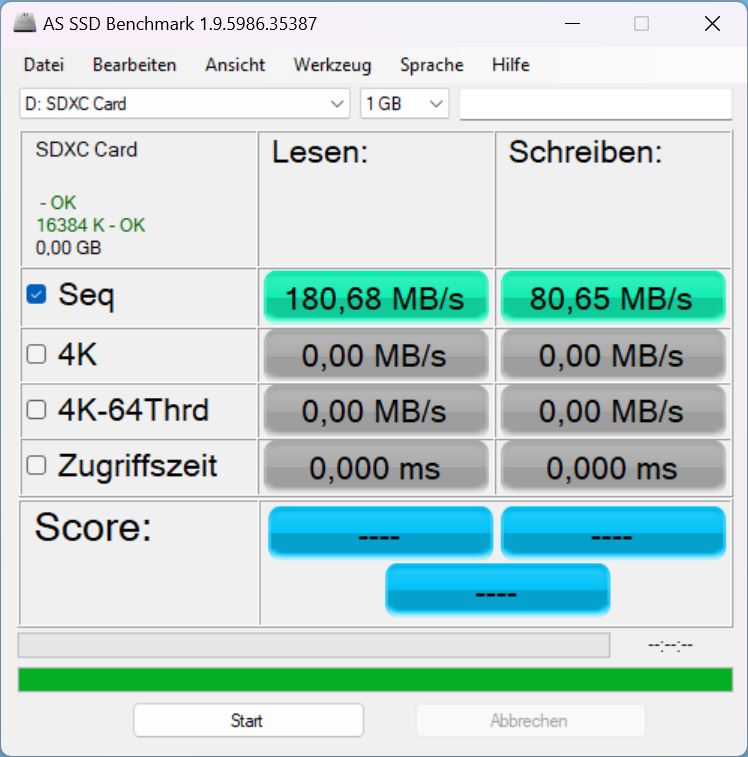
MSI Stealth 16 Studio A13VG jest wyposażony w czytnik kart pamięci, który może obsługiwać karty pamięci microSD. Czytnik obsługuje szybki standard UHS-II. W naszych testach odnotowaliśmy doskonałe wyniki przy użyciu naszej karty referencyjnej, AV PRO microSD 128 GB V60. Jednak konkurencja ze strony Asusa i Gigabyte również robi wrażenie i osiąga jeszcze lepsze wyniki w obszarze sekwencyjnego zapisu danych.
| SD Card Reader | |
| average JPG Copy Test (av. of 3 runs) | |
| Gigabyte AERO 16 OLED BSF | |
| MSI Stealth 16 Studio A13VG | |
| Średnia w klasie Gaming (20.9 - 210, n=54, ostatnie 2 lata) | |
| Asus ROG Flow X16 GV601V | |
| Corsair Voyager a1600 (AV Pro SD microSD 128 GB V60) | |
| Acer Nitro 16 AN16-41 (AV Pro SD microSD 128 GB V60) | |
| Medion Erazer Major X20 (AV PRO microSD 128 GB V60) | |
| maximum AS SSD Seq Read Test (1GB) | |
| Asus ROG Flow X16 GV601V | |
| Gigabyte AERO 16 OLED BSF | |
| MSI Stealth 16 Studio A13VG | |
| Średnia w klasie Gaming (25.5 - 261, n=51, ostatnie 2 lata) | |
| Corsair Voyager a1600 (AV Pro SD microSD 128 GB V60) | |
| Medion Erazer Major X20 (AV PRO microSD 128 GB V60) | |
| Acer Nitro 16 AN16-41 (AV Pro SD microSD 128 GB V60) | |
Komunikacja
Zasadniczo zainstalowany moduł Wi-Fi działa przyzwoicie. W porównaniu do swoich konkurentów, MSI Stealth 16 Studio A13VG nie może się całkiem wykazać, chociaż nasze urządzenie testowe nie ma nic do ukrycia pod względem wydajności, którą tutaj zademonstrowało. W tym celu wykorzystaliśmy nasz router testowy Asus ROG Rapture GT-AXE11000. Alternatywnie, MSI Stealth 16 Studio A13VG oferuje również port Ethernet. Możliwe są prędkości transferu do 2,5 GBit/s.
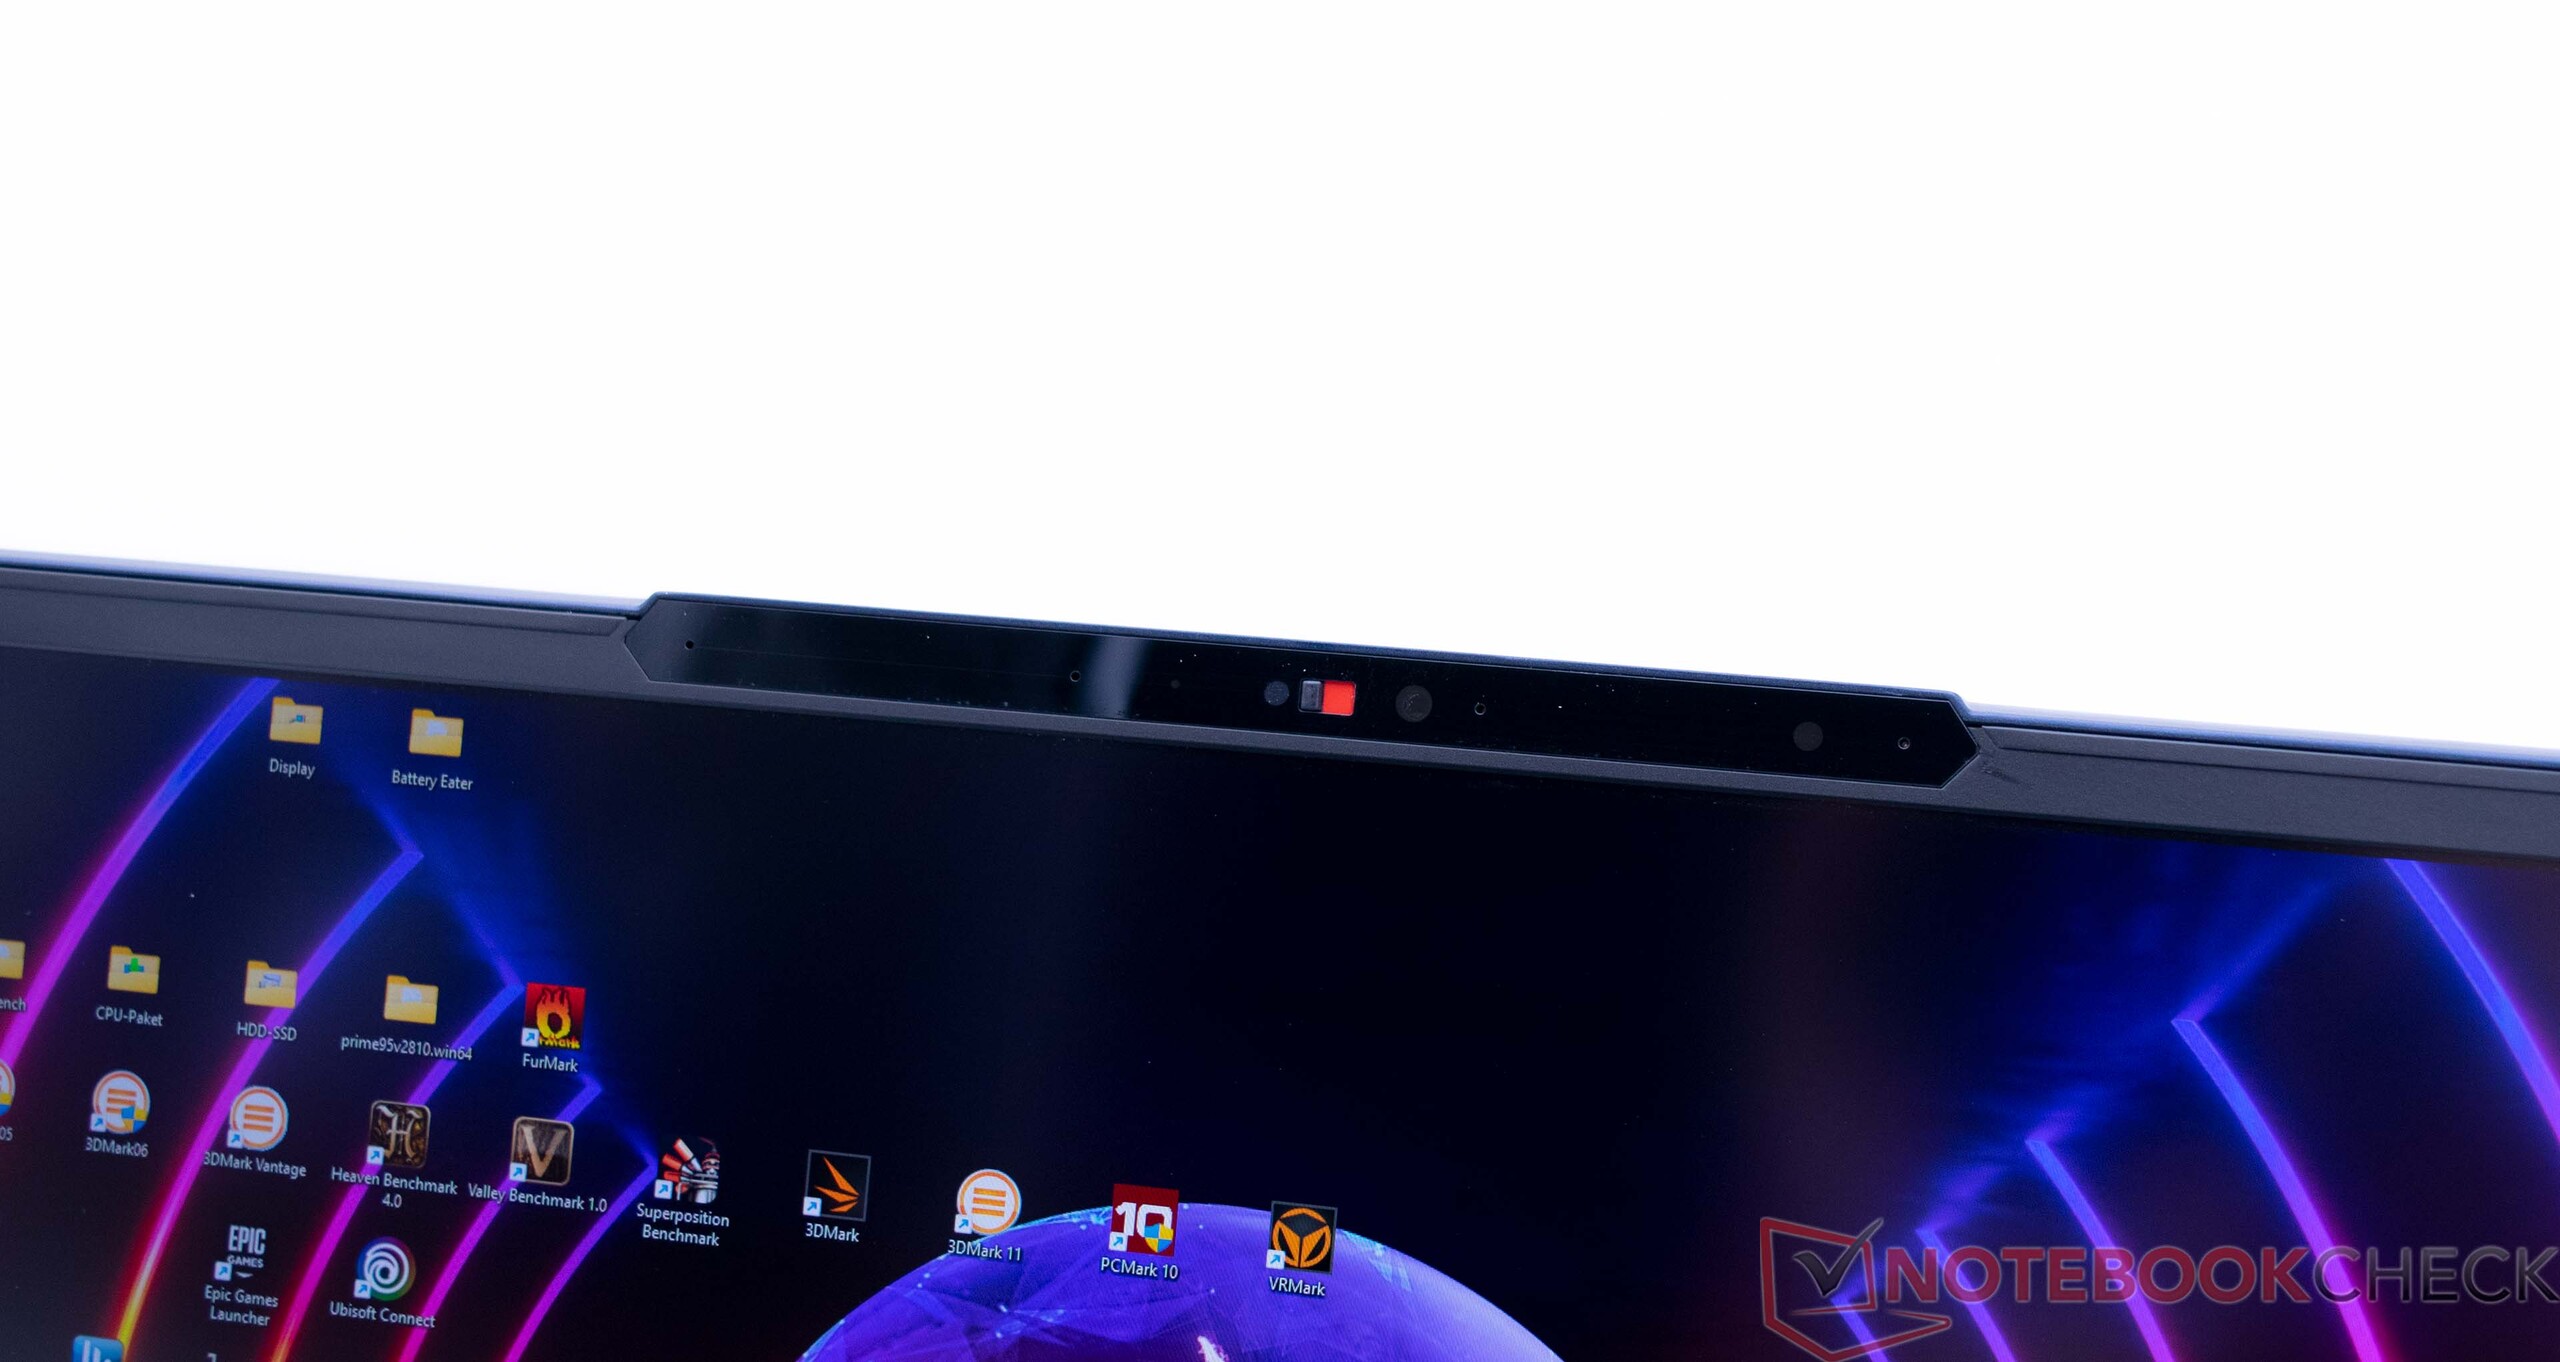
Kamera internetowa
MSI Stealth 16 Studio A13VG jest wyposażony w kamerę internetową FHD, która nadaje się do prostych połączeń wideo. Kilka punktów zostało odjętych ze względu na niską dokładność odwzorowania kolorów.


Bezpieczeństwo
Zintegrowany czujnik linii papilarnych w MSI Stealth 16 Studio A13VG dobrze spełnia swoje zadanie i zapewnia nieskomplikowane uwierzytelnianie systemu.
Akcesoria
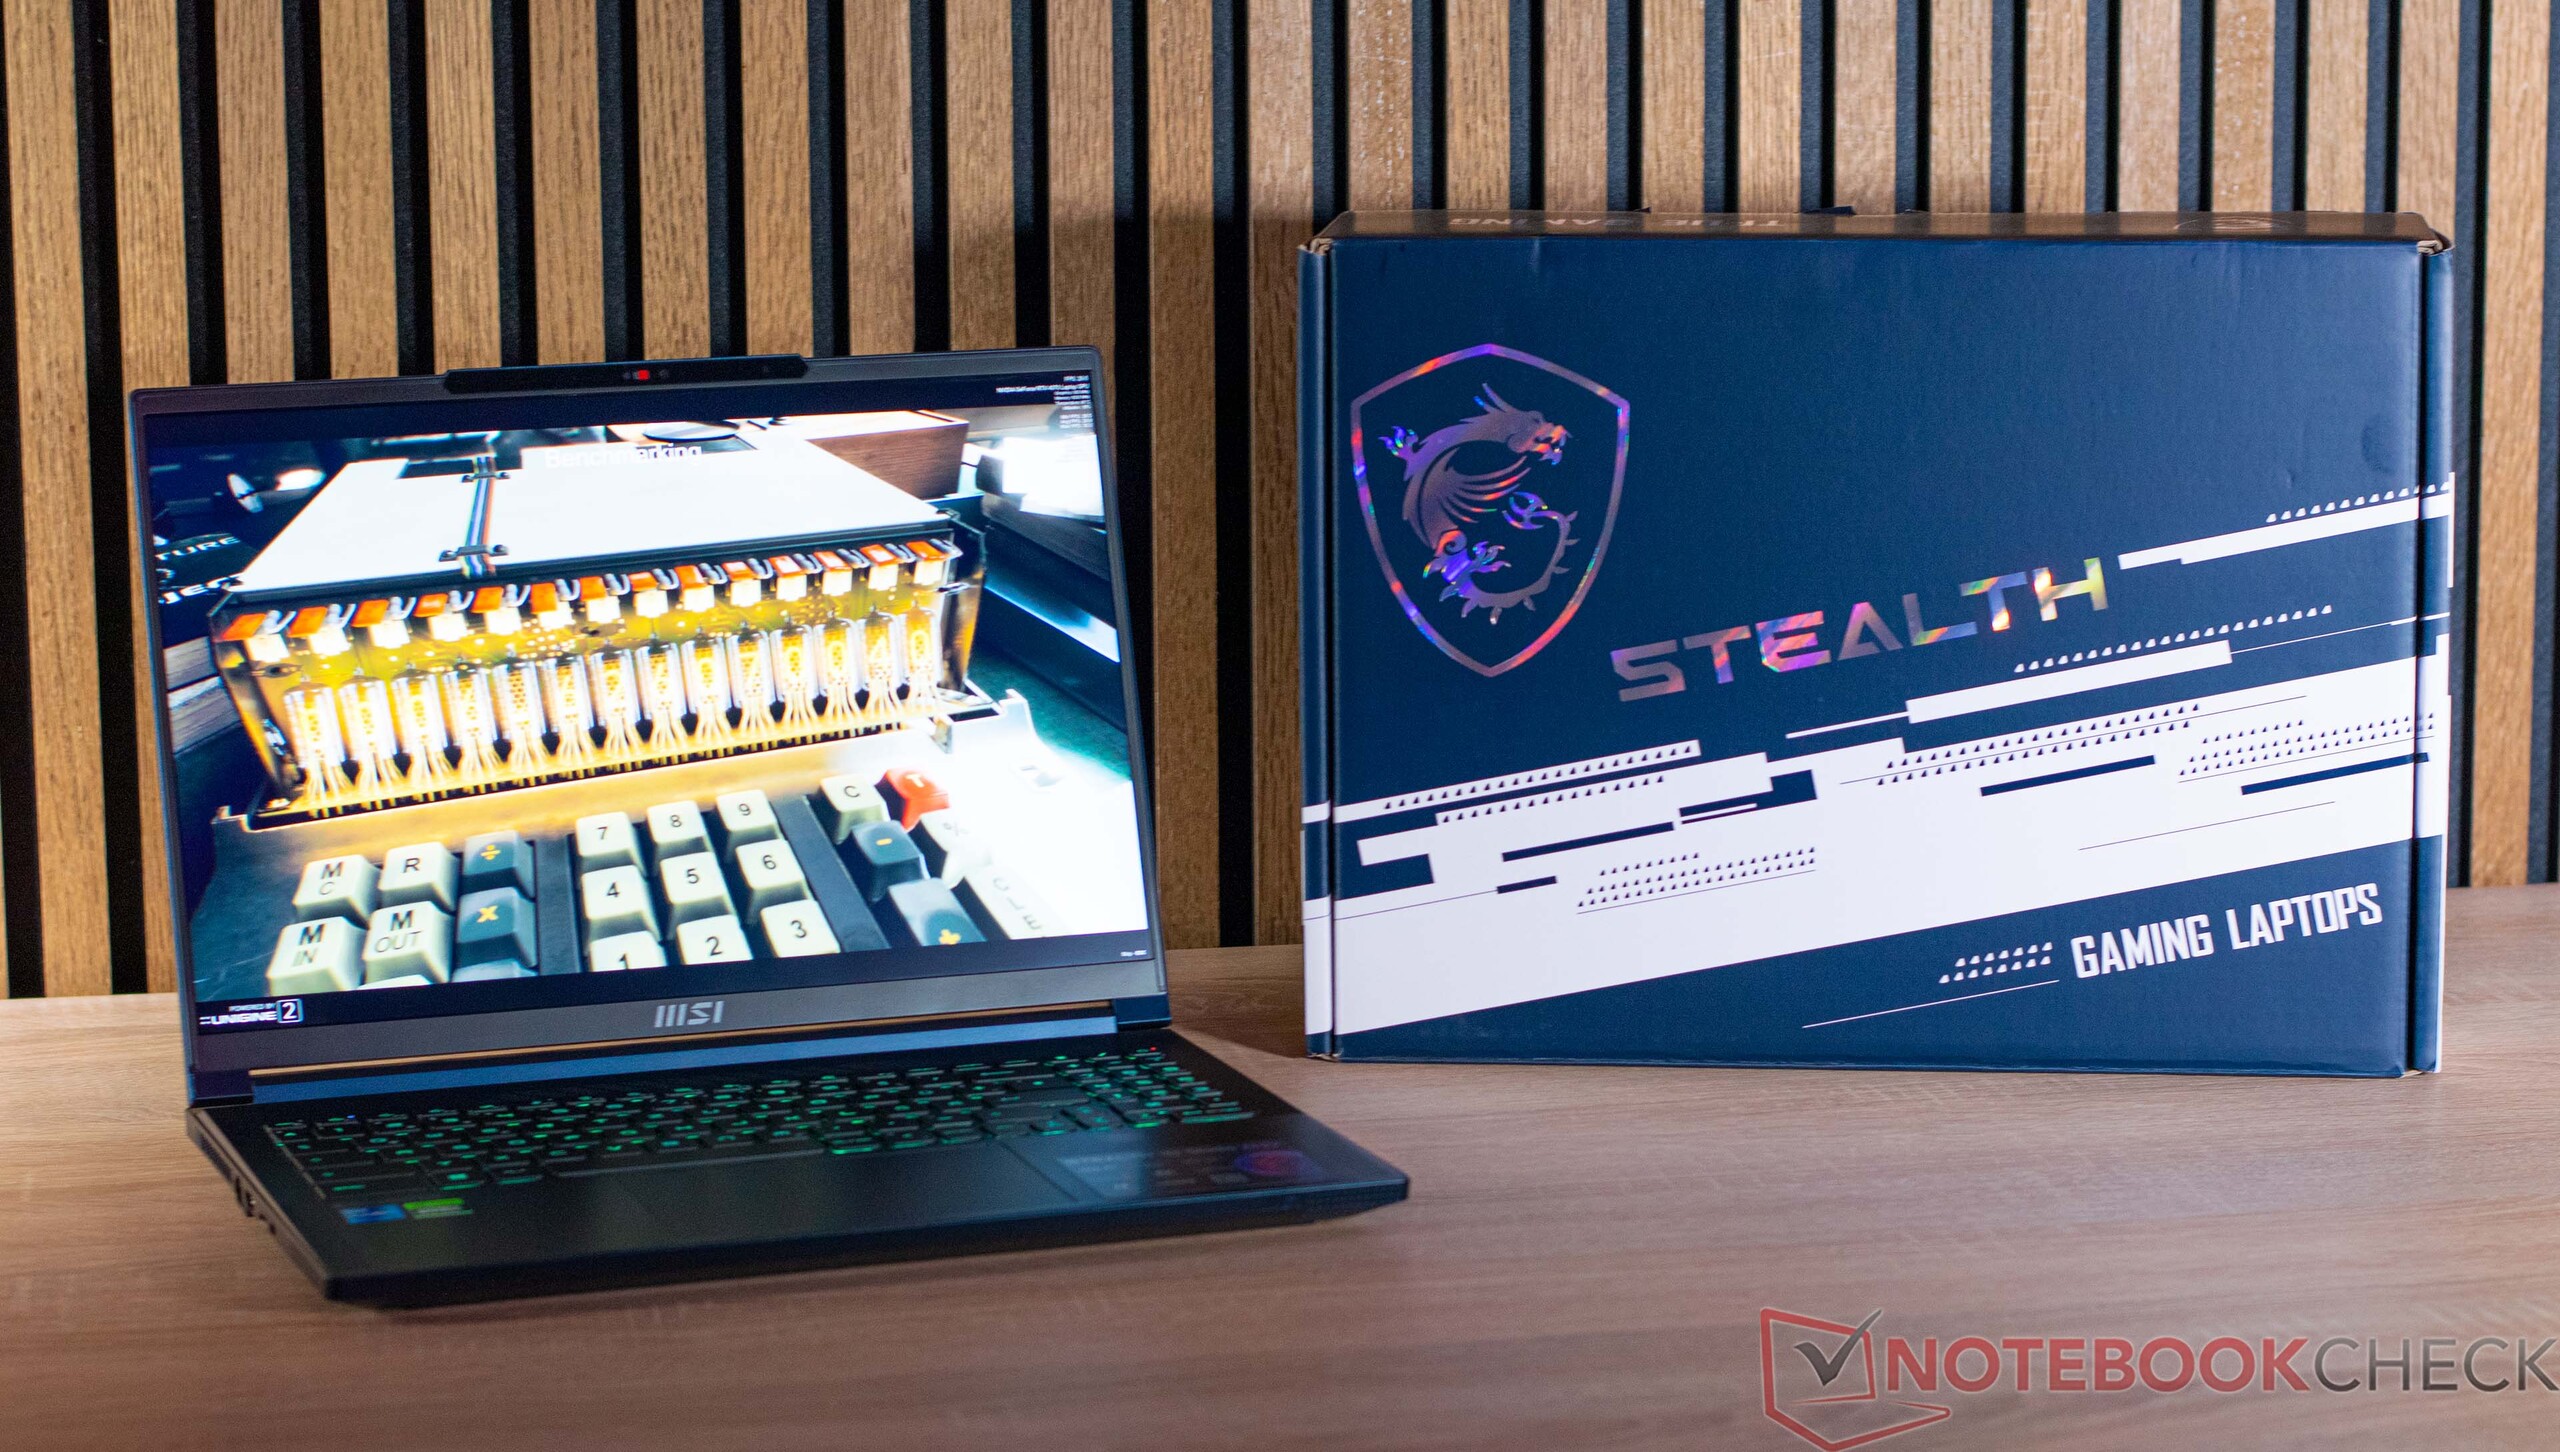
W pudełku, oprócz samego urządzenia, znajduje się również 240-watowy zasilacz, a także obowiązkowa dokumentacja.
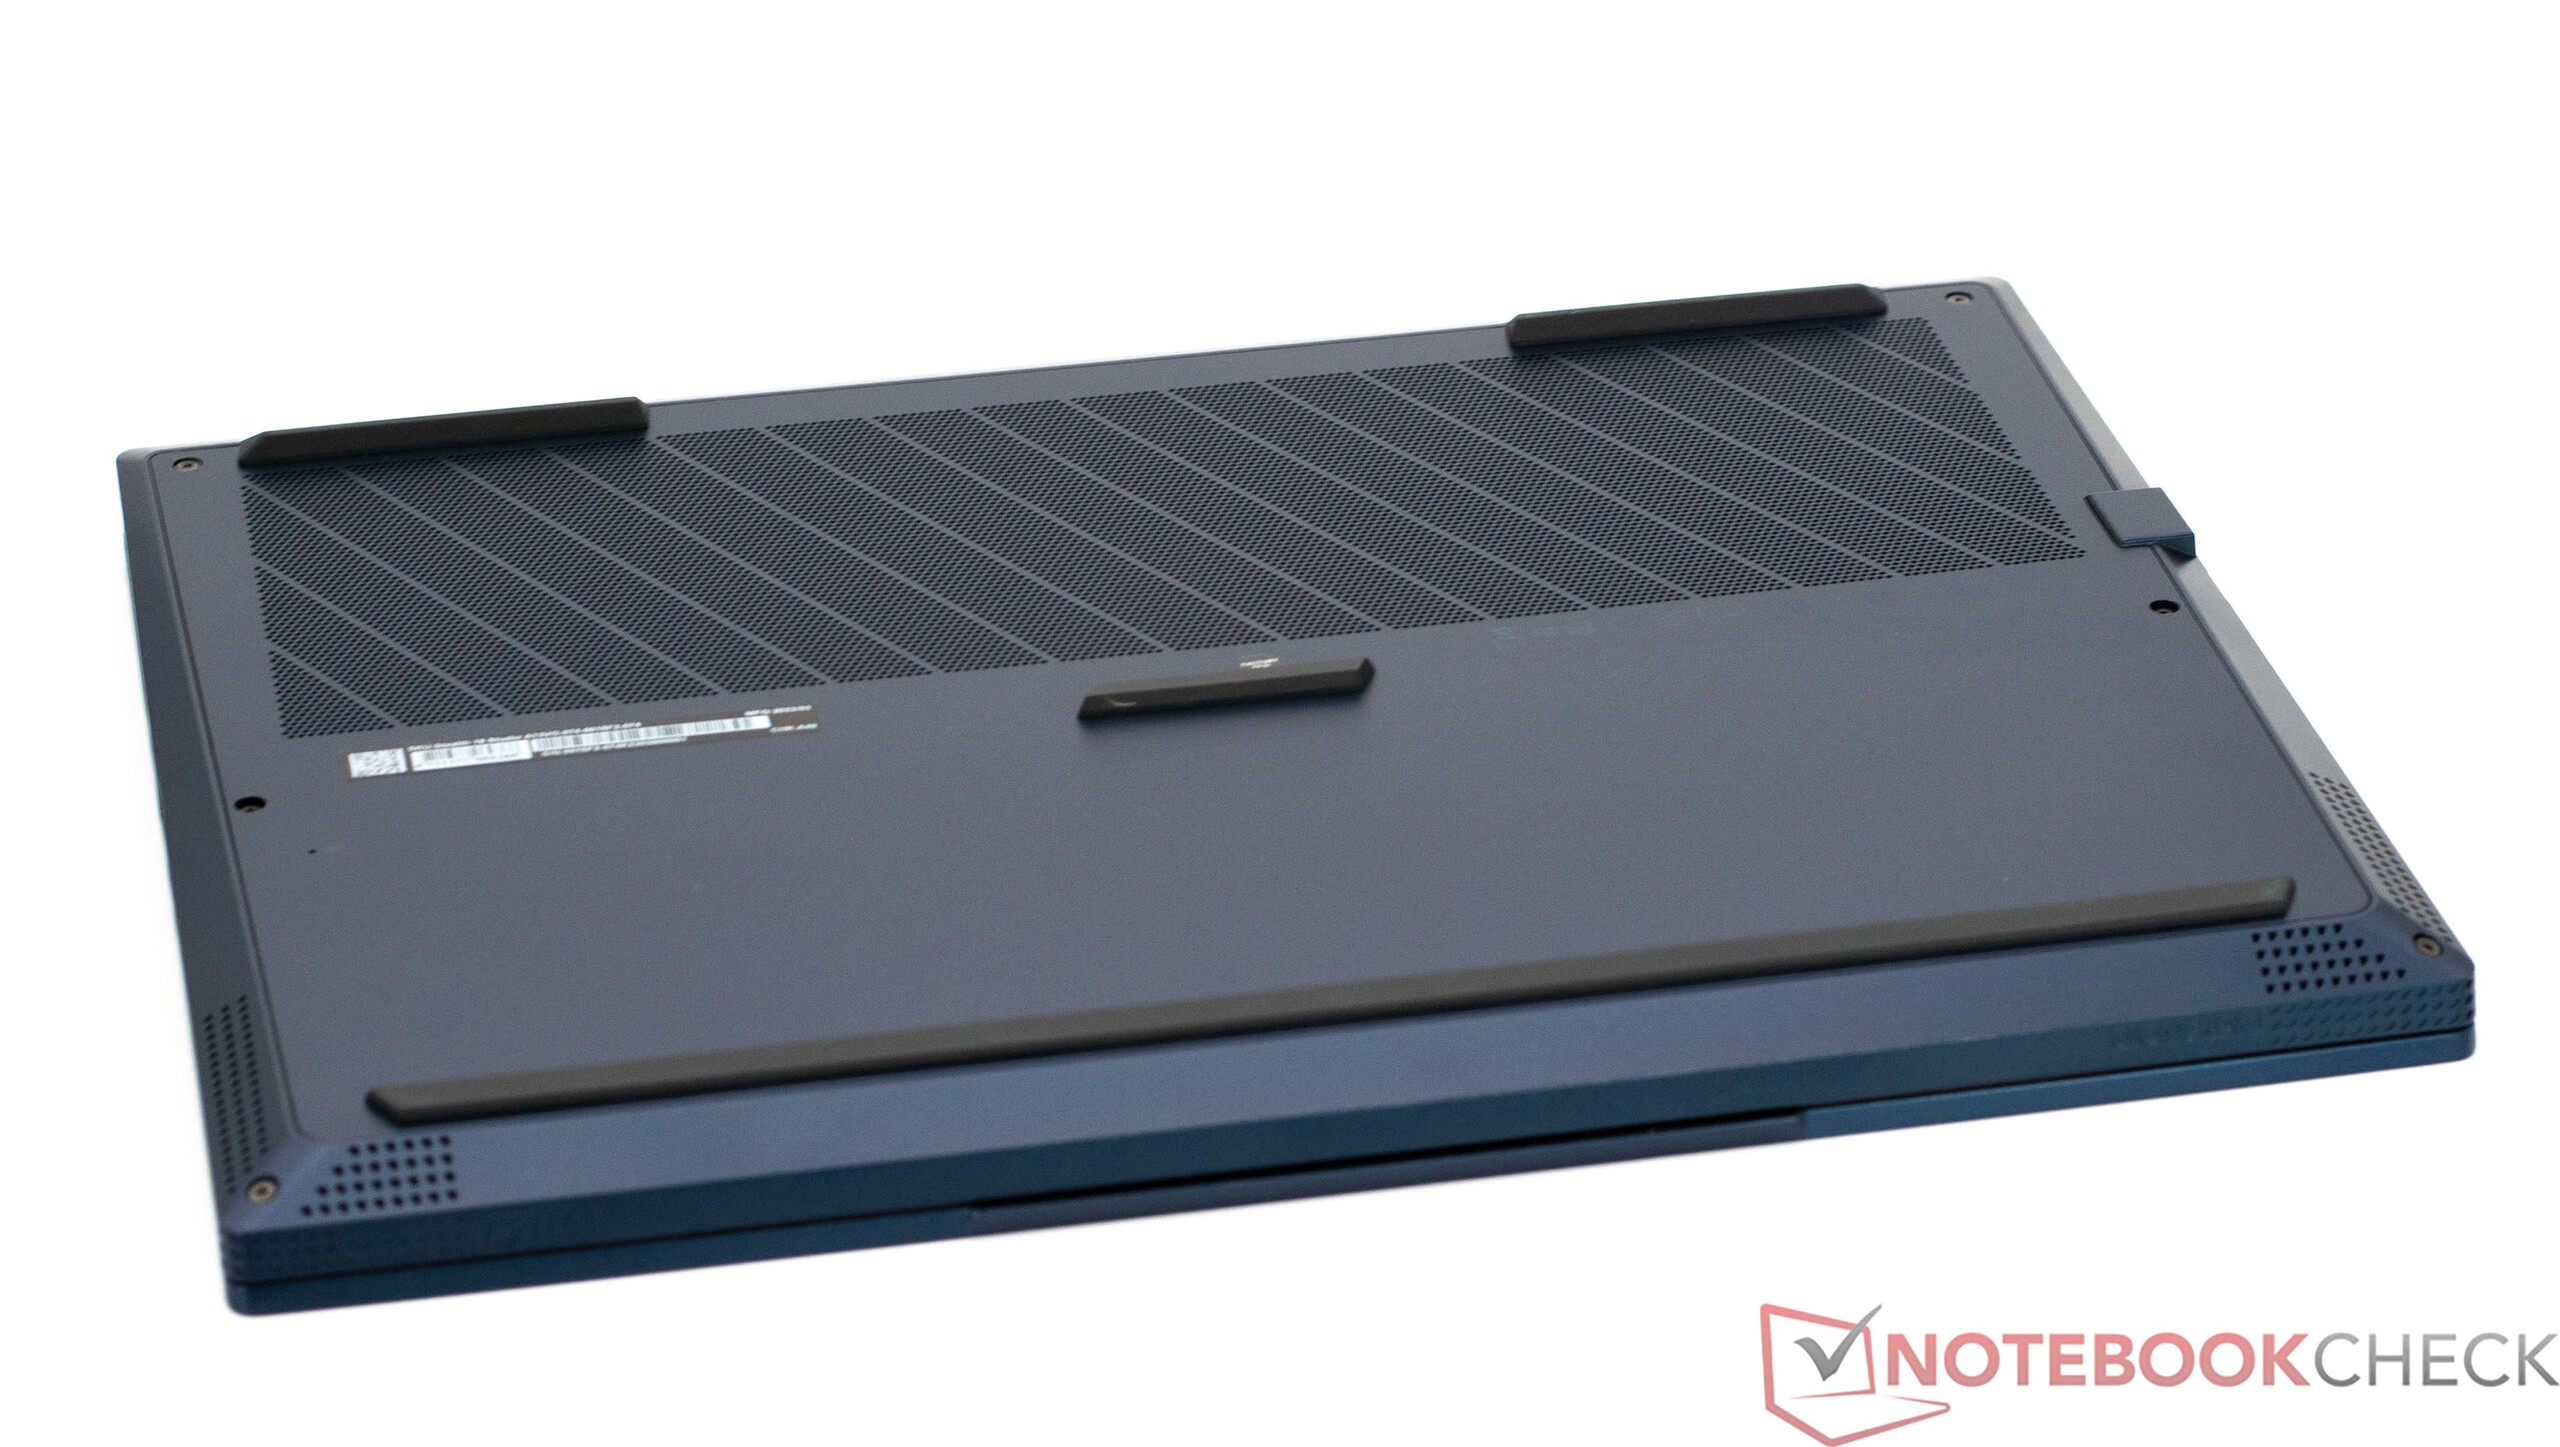
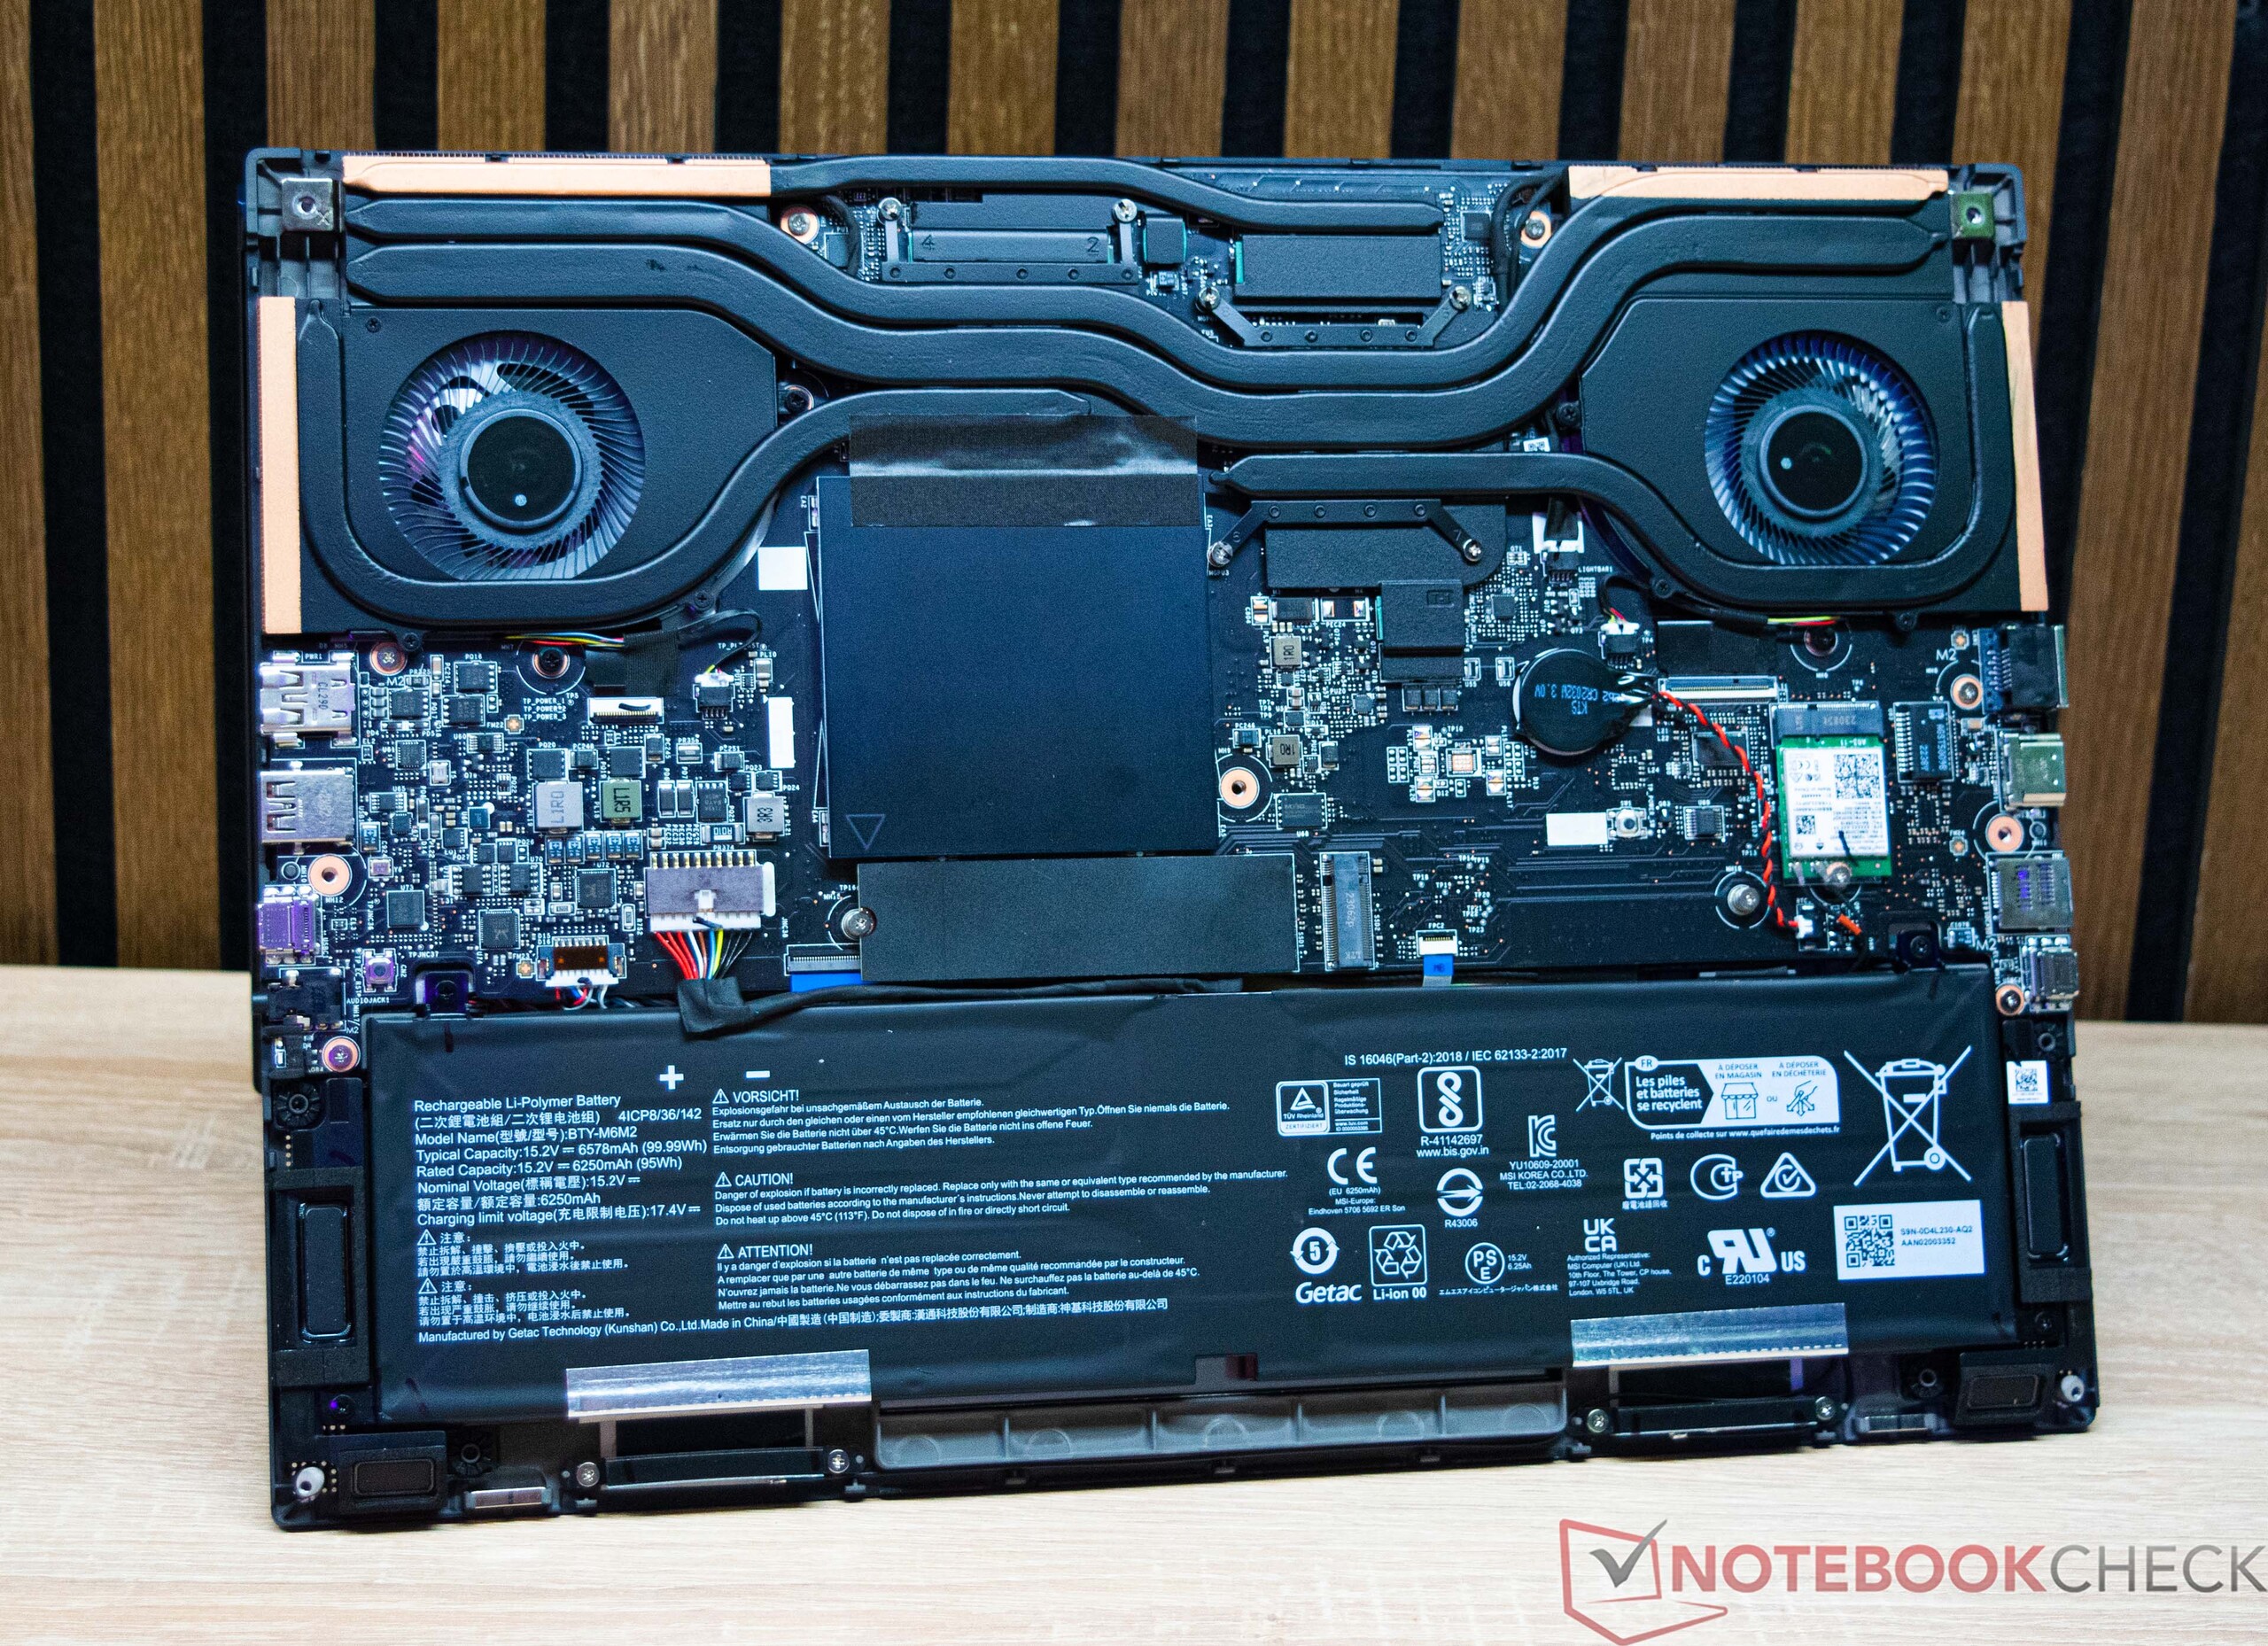
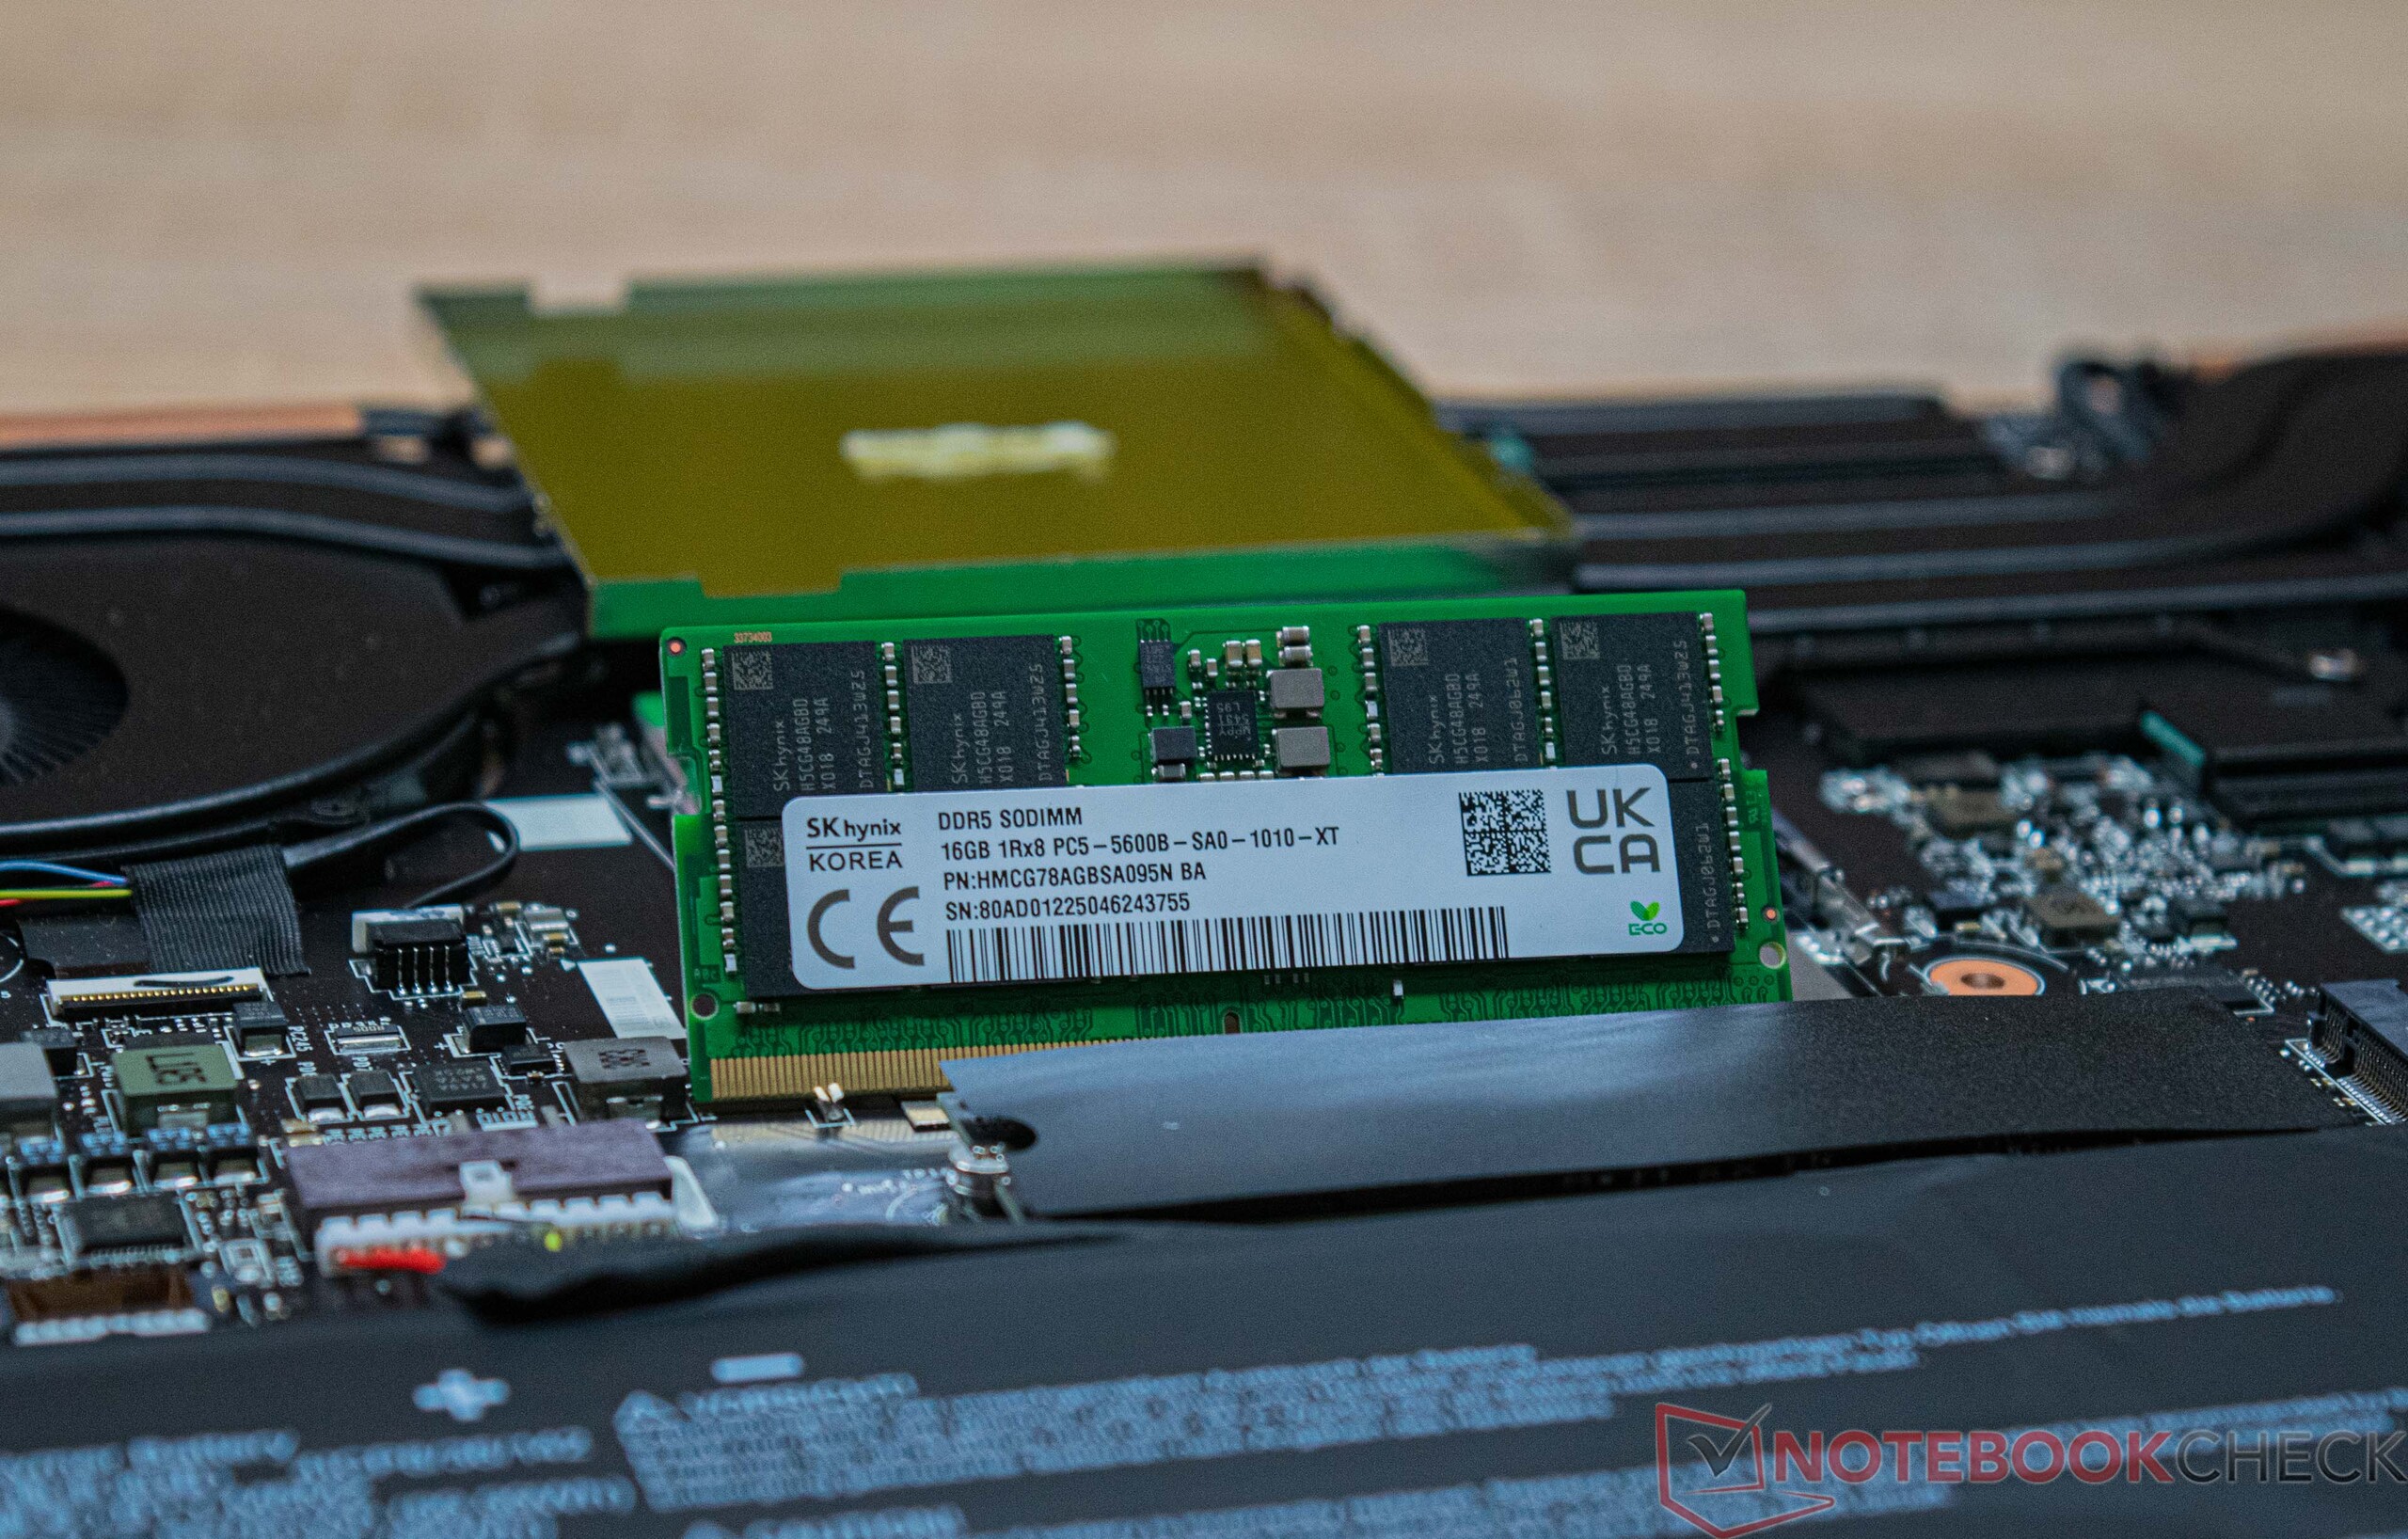
Konserwacja
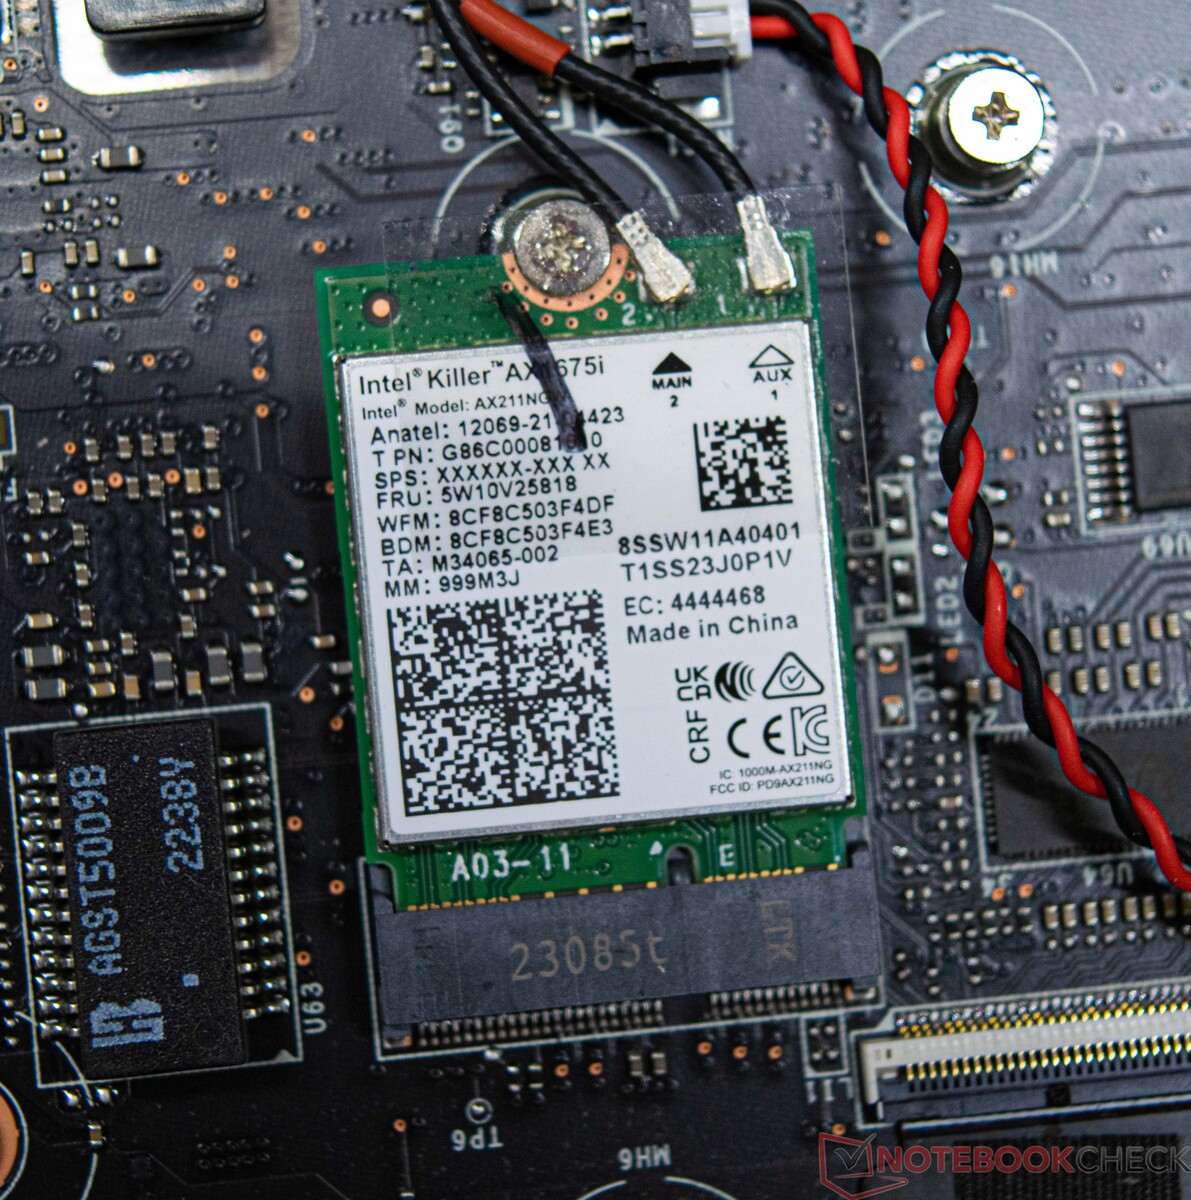
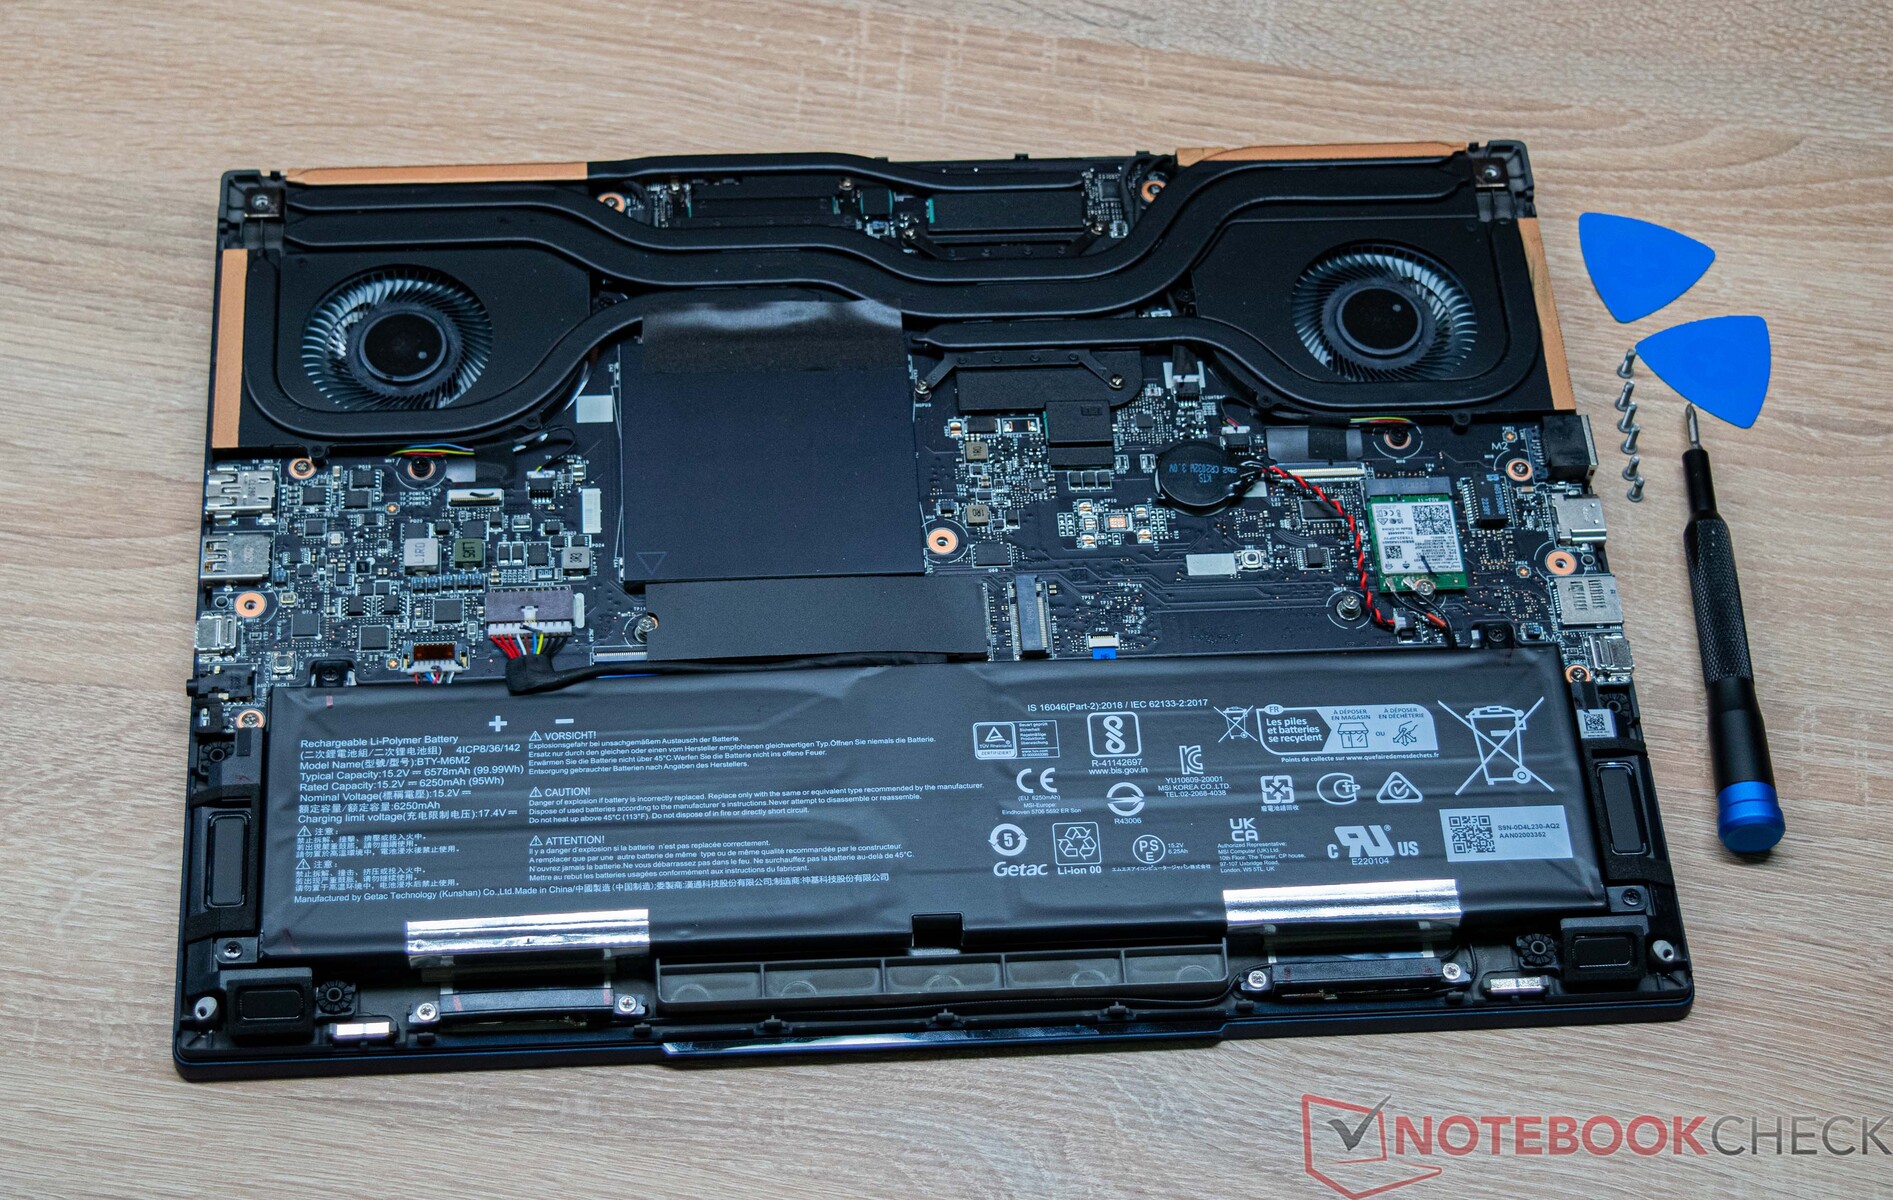
Możliwe jest podjęcie prac konserwacyjnych na MSI Stealth 16 Studio A13VG. Jednak w tym celu należy zdemontować płytę podstawy, która jest zabezpieczona kilkoma śrubami. Po odkręceniu śrub płyta podstawy pozostaje bezpiecznie przymocowana do podstawy. Jednak przy użyciu odpowiednich narzędzi byliśmy w stanie usunąć płytę podstawy. Niemniej jednak zaleca się ostrożność, aby uniknąć uszkodzeń. Zasadniczo komponenty takie jak pamięć RAM lub pamięć masowa mogą być wymieniane lub rozszerzane, ponieważ dostępne jest dodatkowe gniazdo M.2 2280. Podobnie, Wi-Fi nie jest stałe i również można je zamienić lub wymienić.
Gwarancja
MSI Stealth 16 Studio A13VG objęty jest 24-miesięczną gwarancją, która obejmuje usługę odbioru i zwrotu.
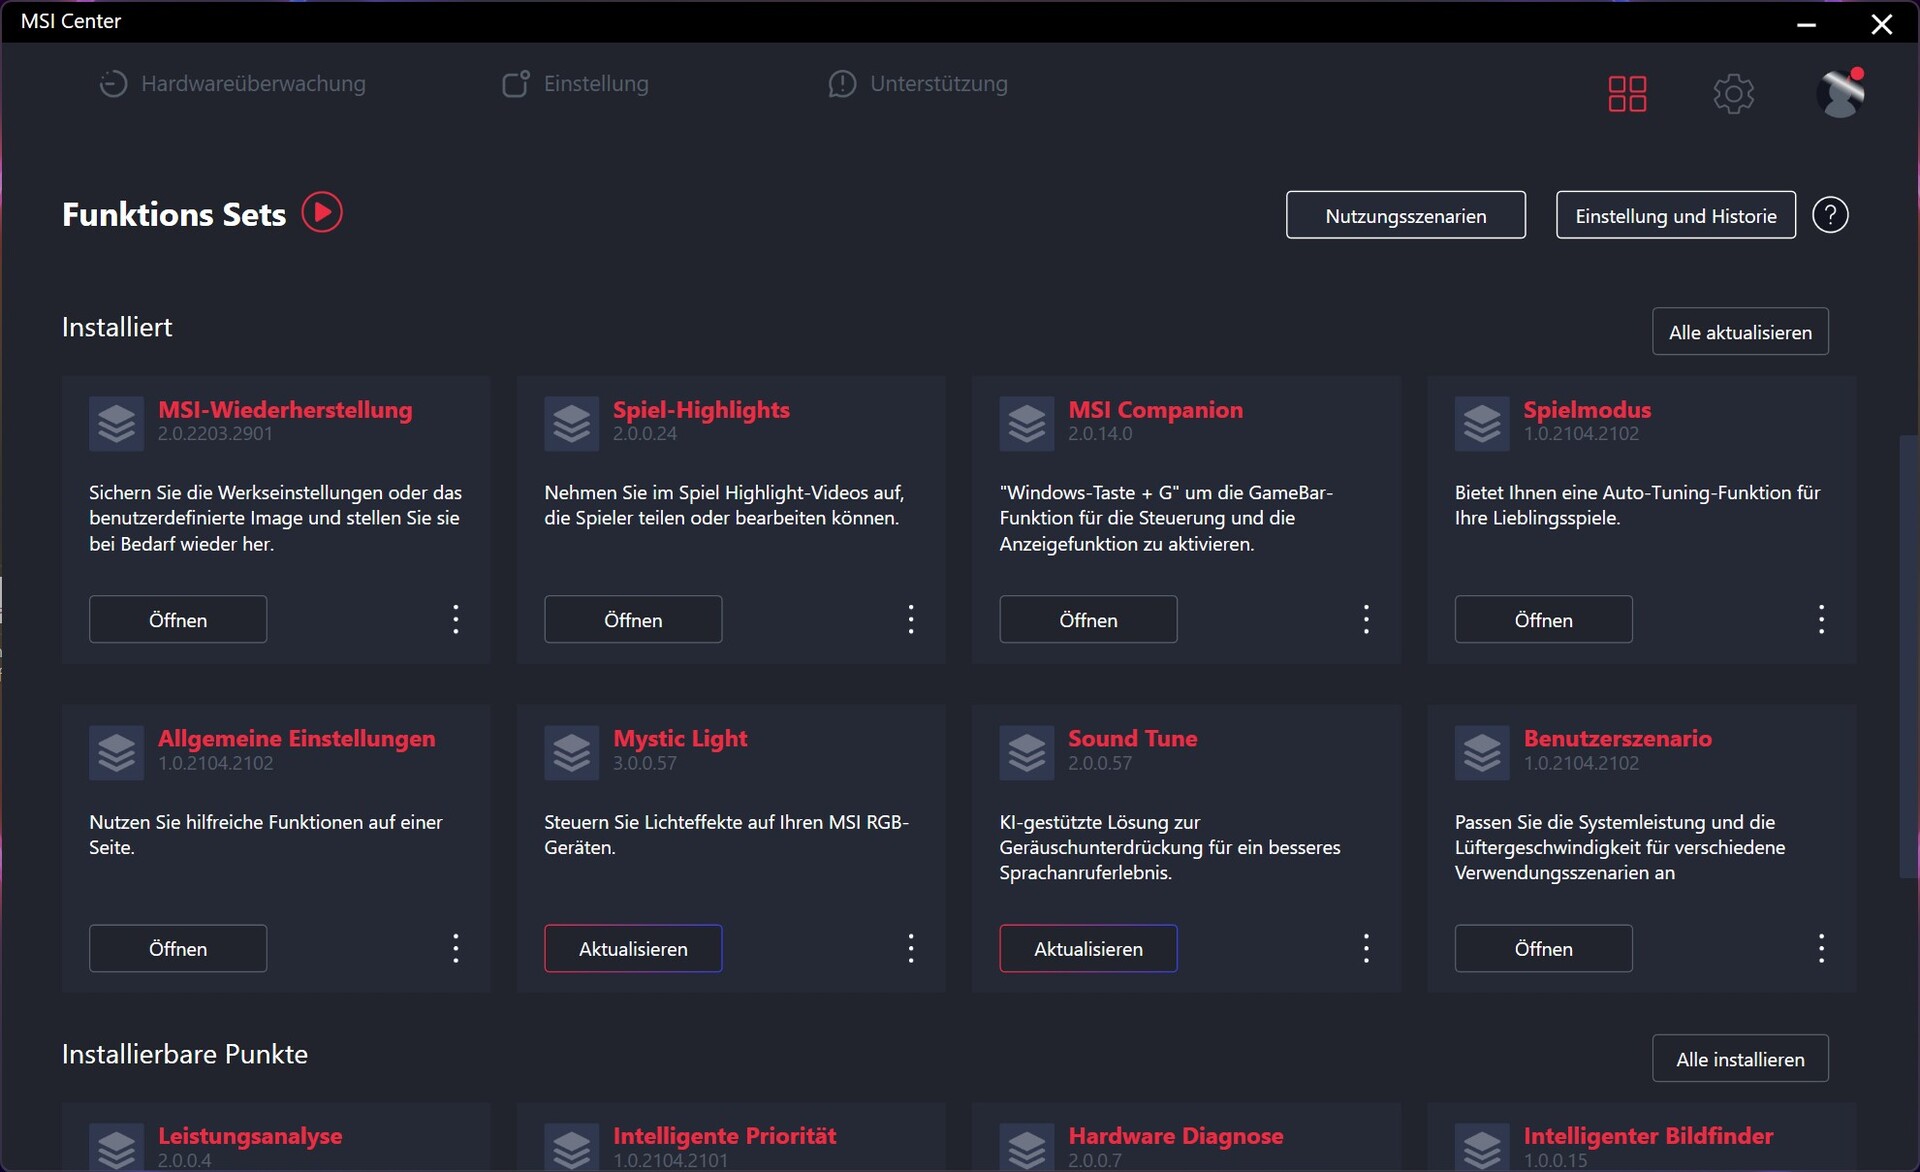
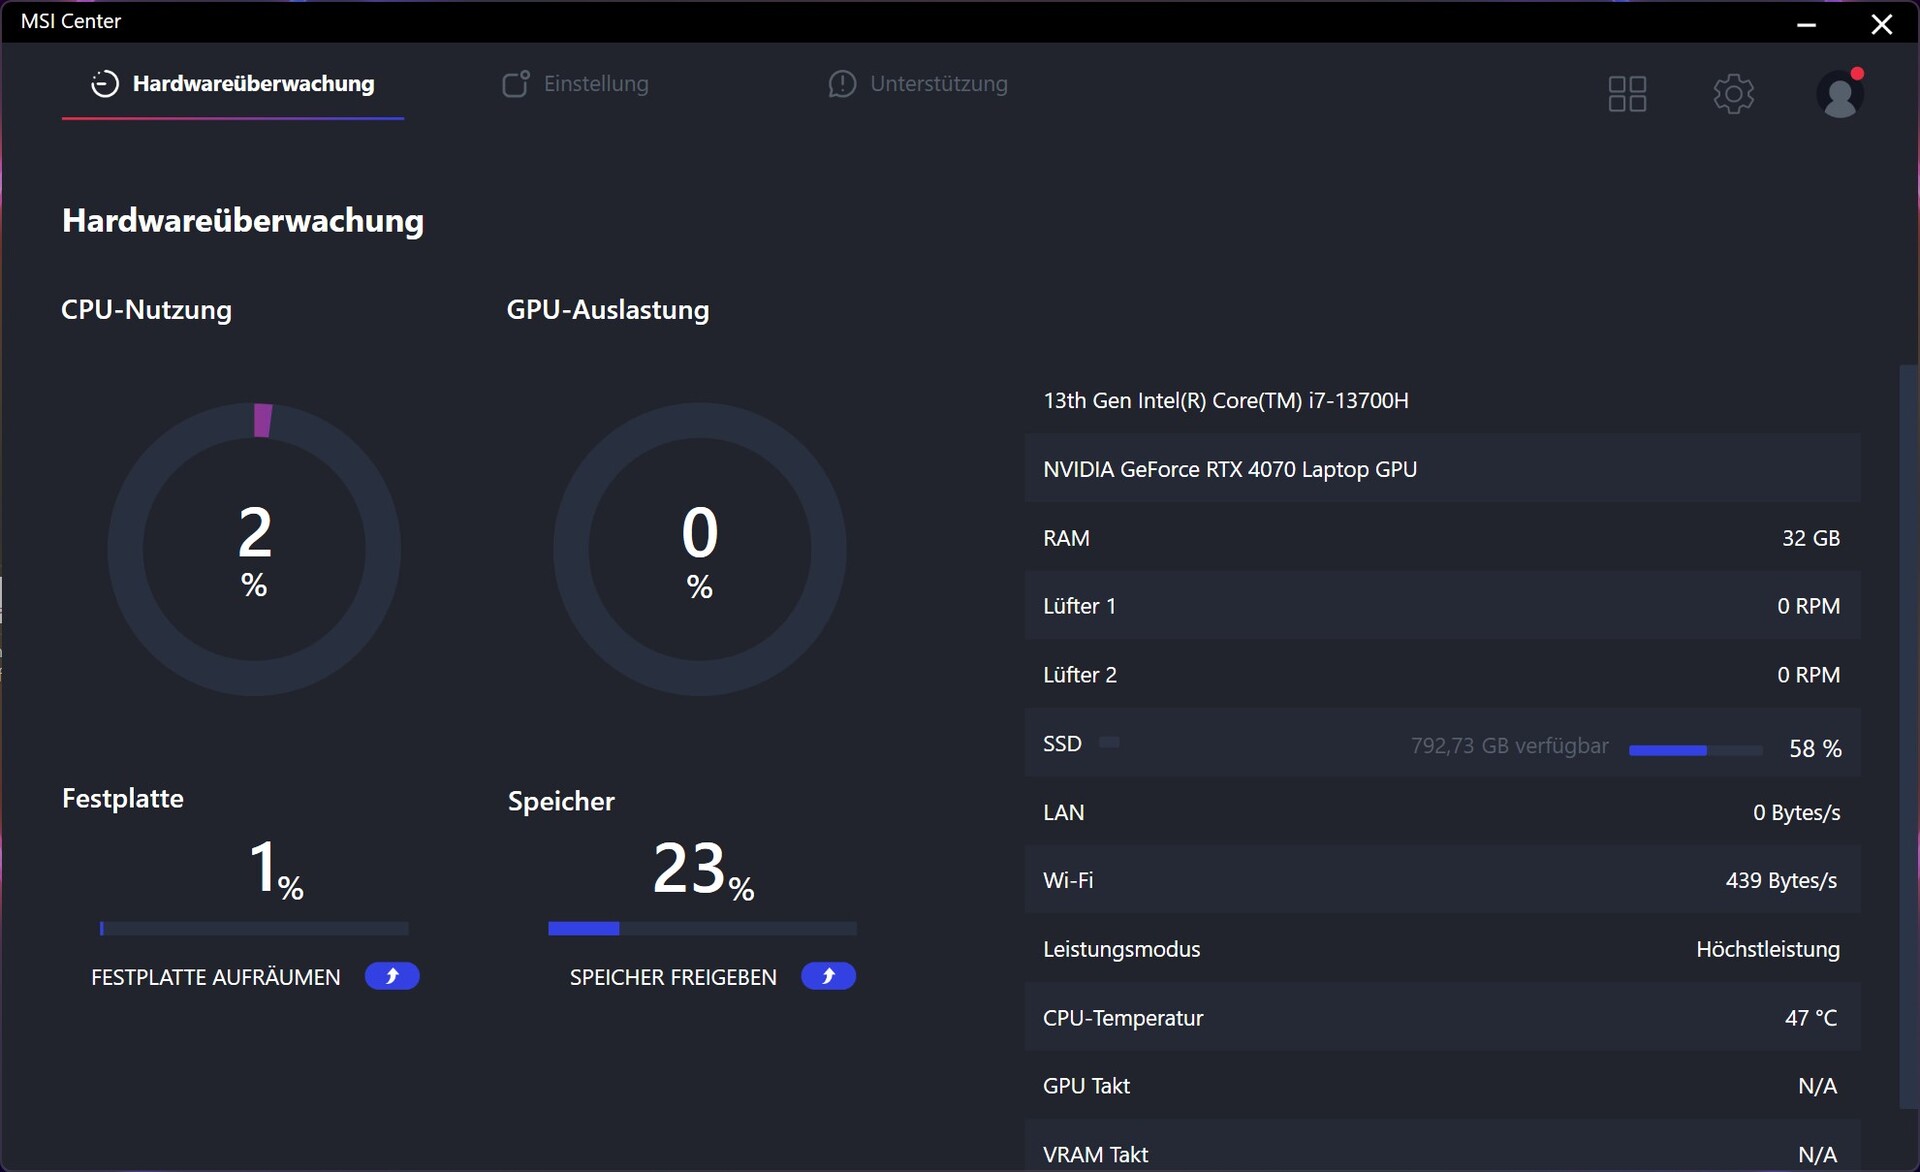
Oprogramowanie - MSI Center jest Twoim głównym biurem
Wraz z MSI Center producent przygotował odpowiednie narzędzie do kontrolowania i monitorowania MSI Stealth 16 Studio A13VG. W testach nie napotkaliśmy żadnych problemów z korzystaniem z MSI Center. Korzystanie z niego pozwala użytkownikowi regulować wydajność laptopa, co między innymi ma duży wpływ na ilość szumów w tle. Istnieją również wyraźne różnice, również z punktu widzenia wydajności, ze względu na różne limity mocy w różnych trybach.
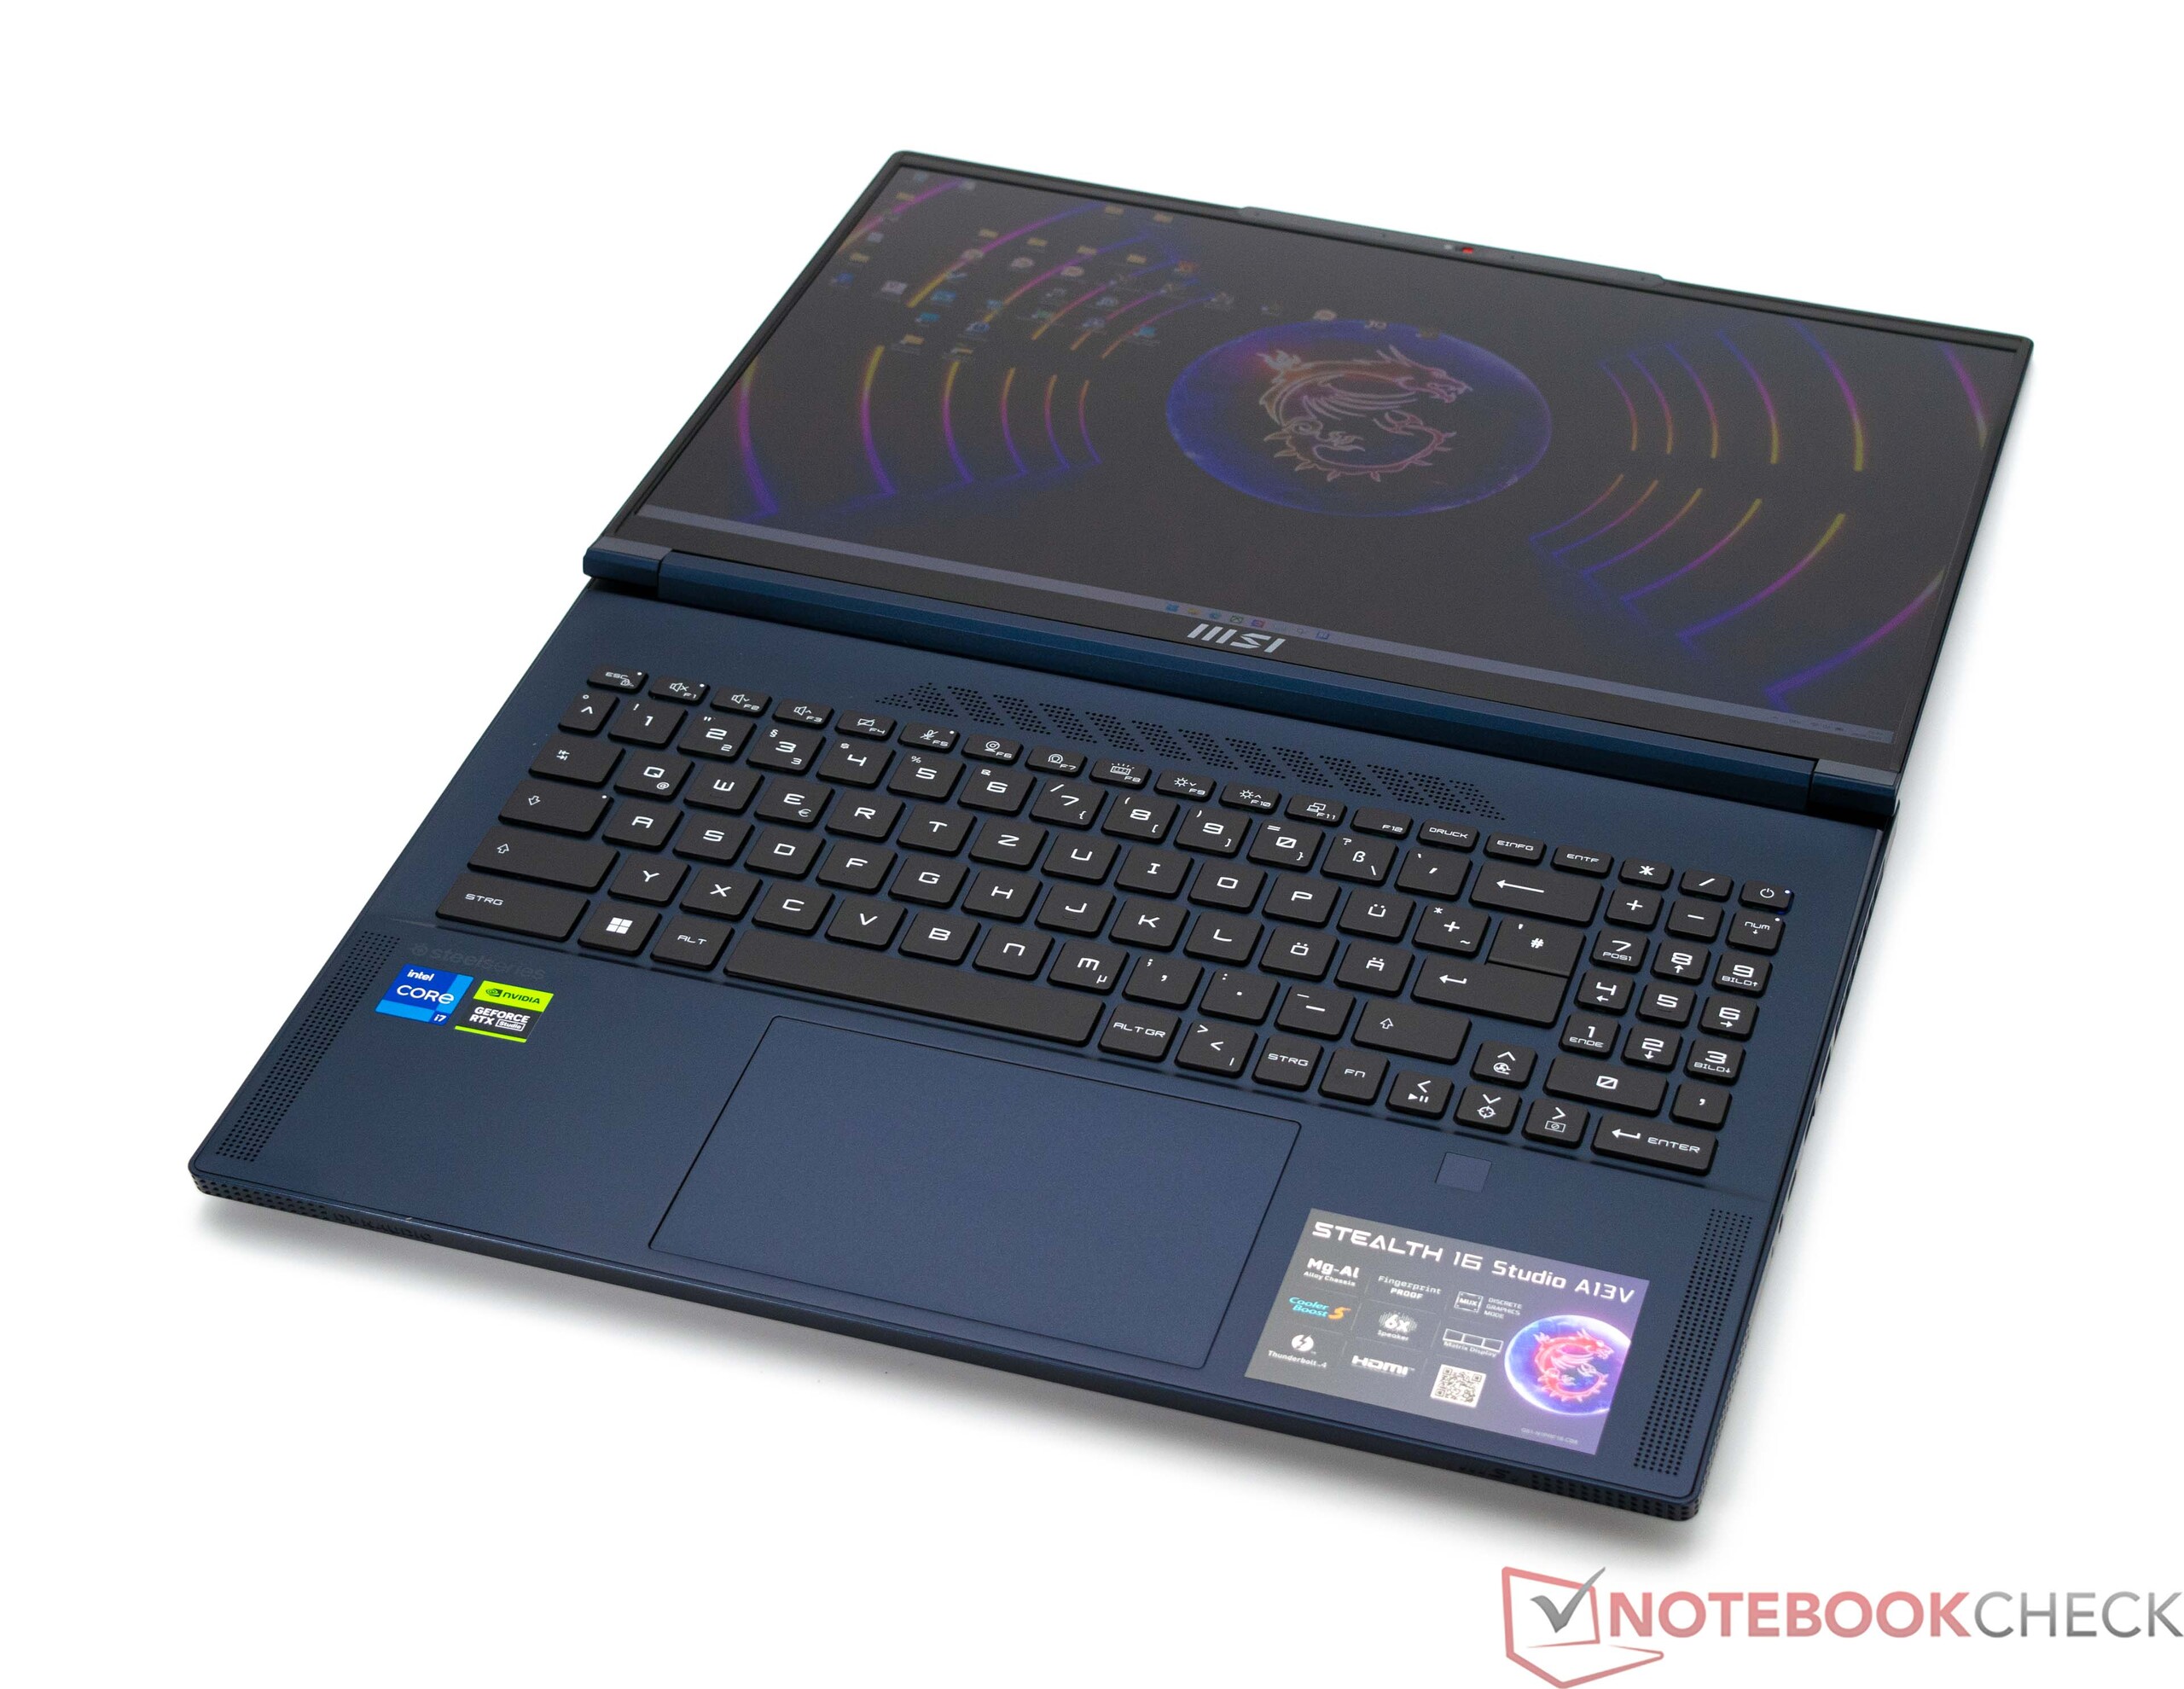
Urządzenia wejściowe - znajoma konstrukcja i przyjemne w codziennym użytkowaniu
Klawiatura
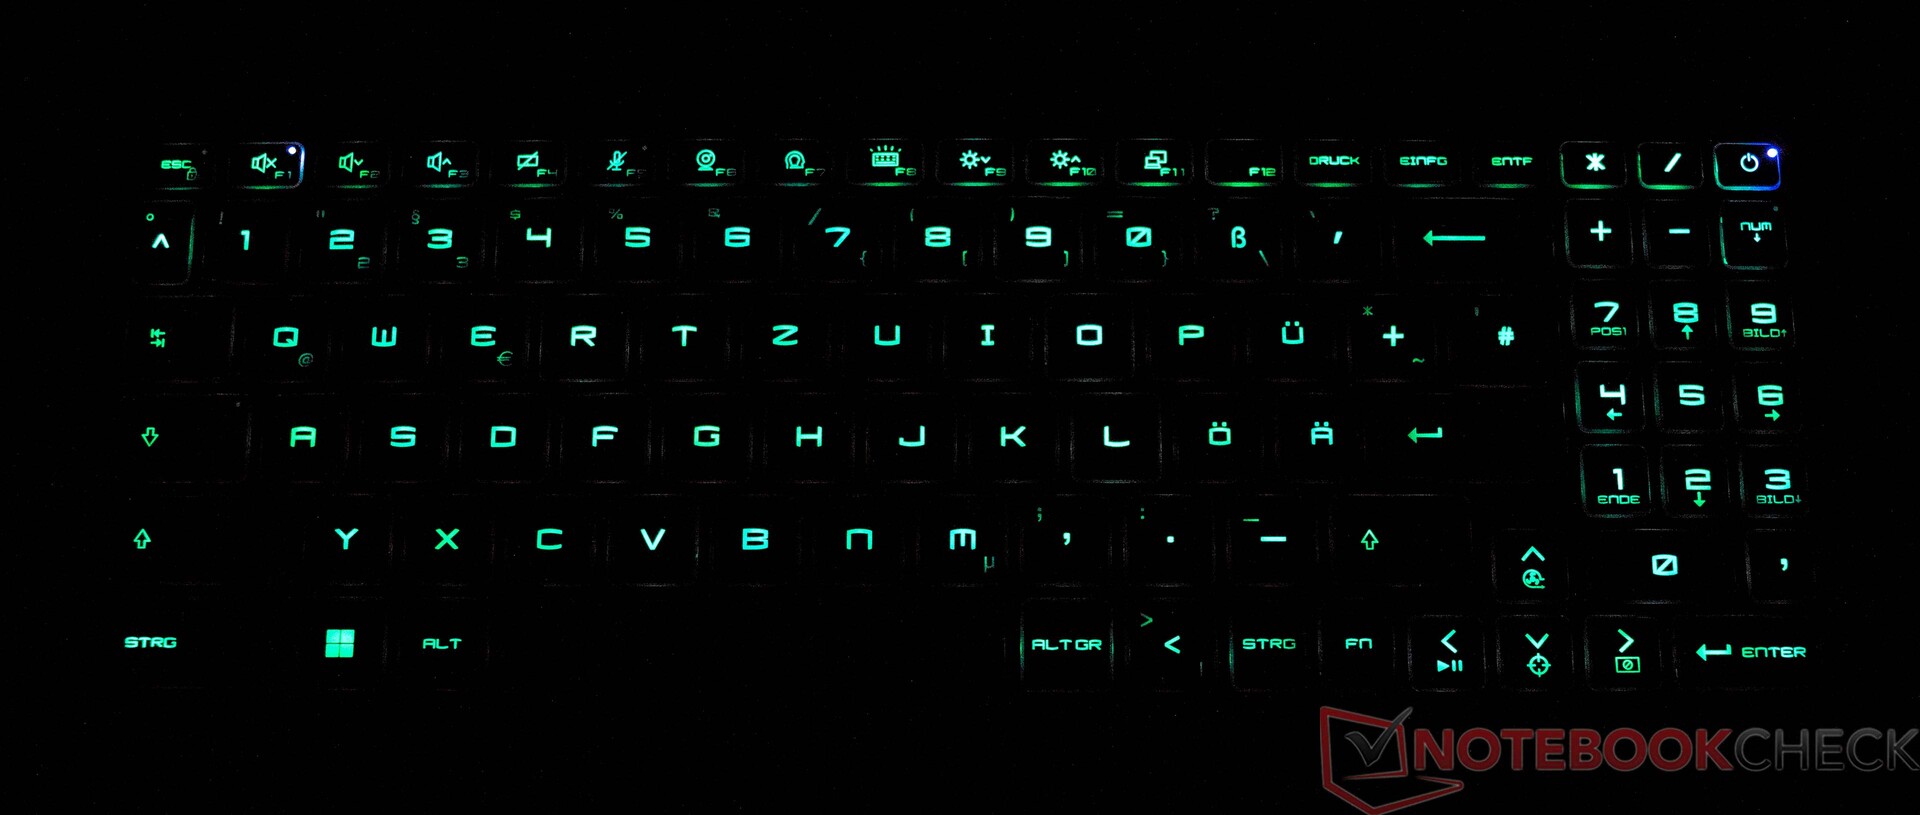
We współpracy ze SteelSeries, MSI Stealth 16 Studio A13VG został wyposażony w 6-wierszową klawiaturę typu chiclet, w tym klawiaturę numeryczną. Napisy są typowe dla MSI, choć gładkie klawisze zapewniają znacznie wyciszony stukot. Skok klawiszy jest bardzo krótki, a punkt nacisku wyraźnie zdefiniowany. W związku z tym nie należy spodziewać się gniewnych spojrzeń podczas szybkiego pisania w biurze, ponieważ hałas w tle jest bardzo stłumiony. Podświetlenie można zmienić na jeden z trzech różnych poziomów jasności za pomocą kombinacji klawiszy. Zauważalne jest to, że MSI zdecydowało się nie umieszczać klawisza Fn po lewej stronie. Jednak korzystając z MSI Center, możliwe jest obejście tego problemu poprzez zamianę przypisania klawisza Windows z klawiszem Fn po prawej stronie. Pozwala to użytkownikowi wybrać własne optymalne ustawienie.
Touchpad
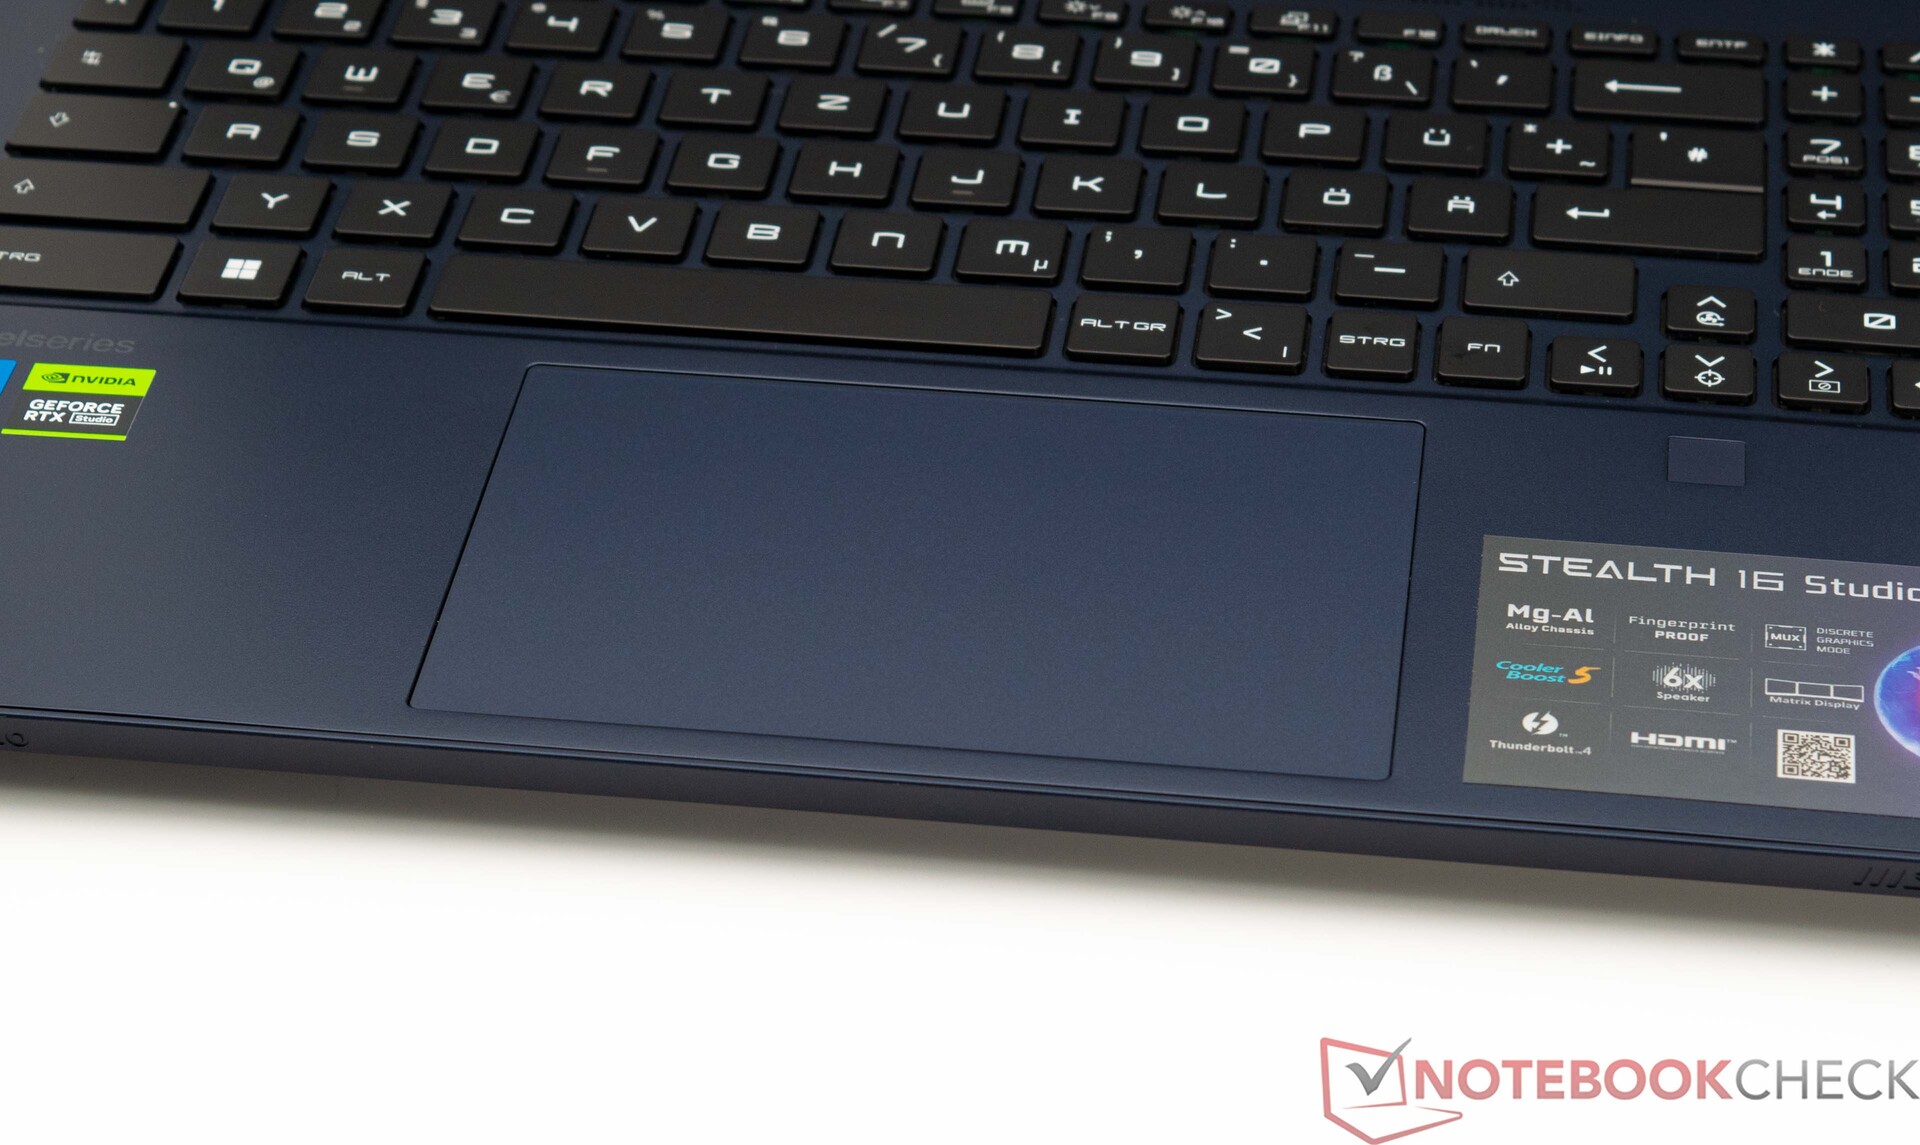
Alternatywą dla myszy jest touchpad z obsługą wielodotyku. Jego wymiary to 13,1 x 8,2 cm, co jest wspaniałym wynikiem. Pod względem wzornictwa touchpad idealnie pasuje do górnej powierzchni podstawy. Powierzchnia ta jest zauważalnie gładsza w dotyku niż podpórka pod nadgarstki. Zapewnia to optymalne właściwości ślizgowe. Touchpad jest responsywny i bardzo precyzyjny, nawet przy krawędziach. Podkładka oferuje krótki skok podczas wprowadzania danych i pomaga zapewnić użytkownikowi wyraźny punkt nacisku i wyraźne informacje zwrotne.
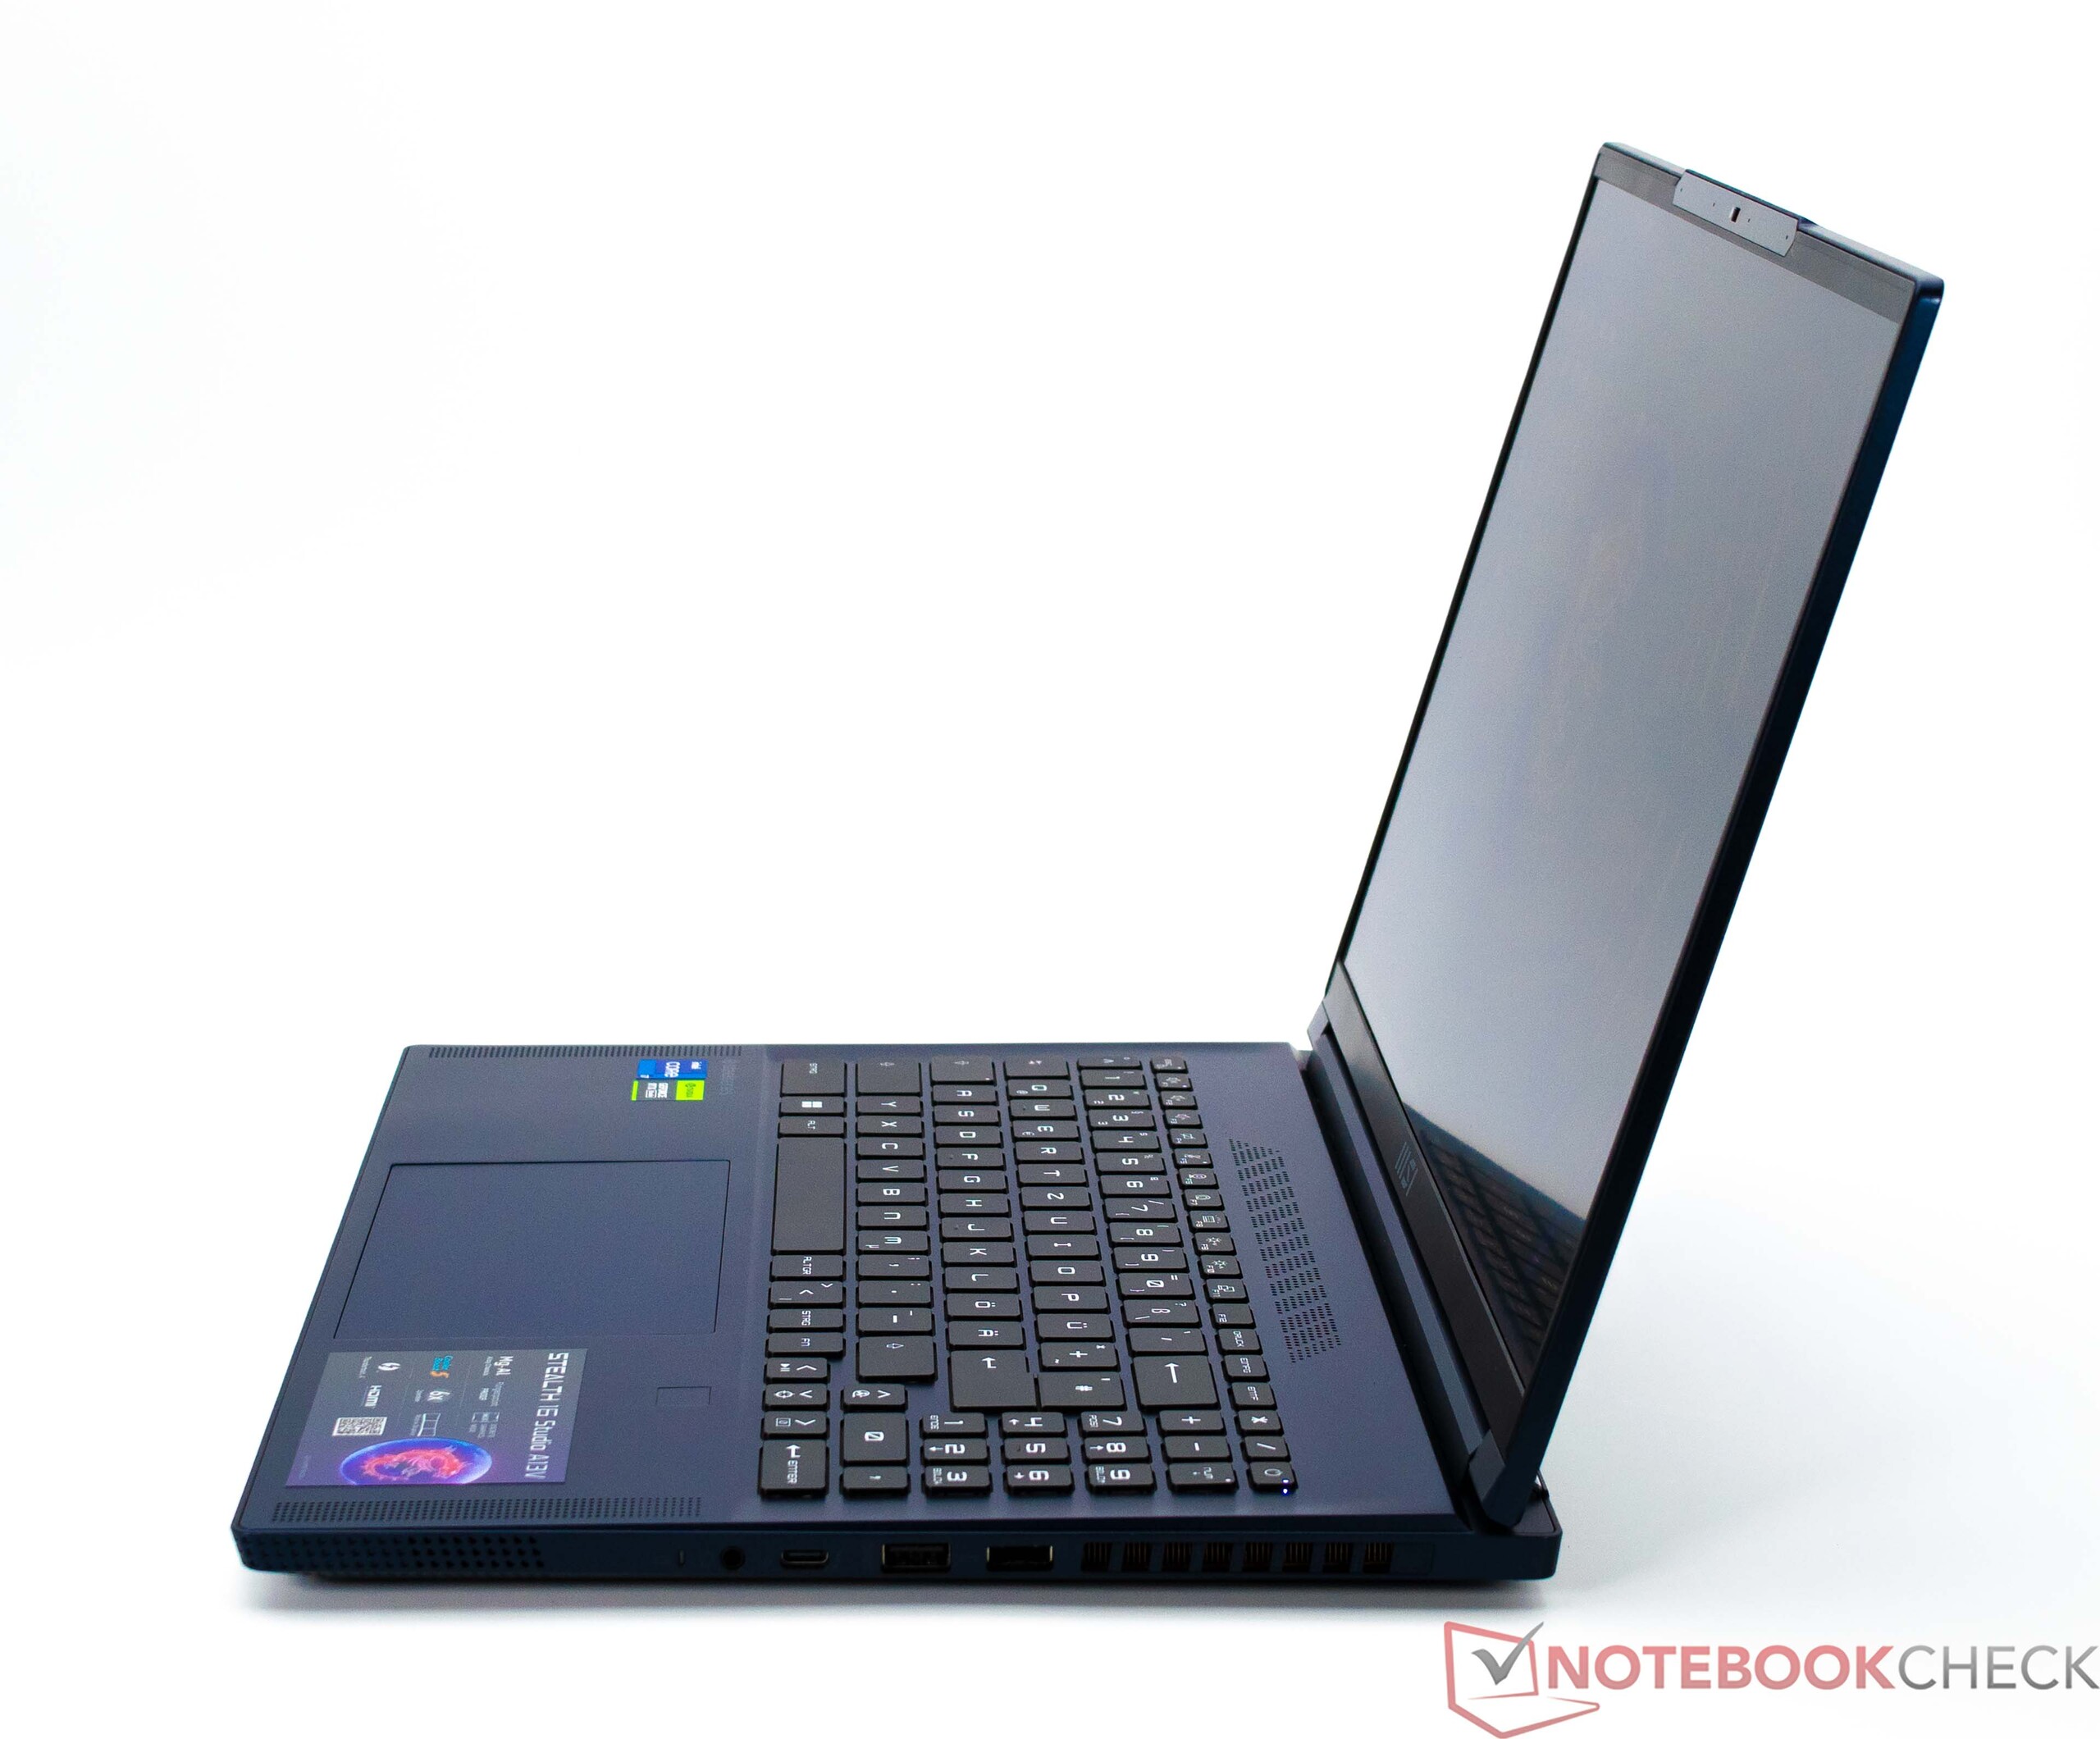
Wyświetlacz - 240 Hz w przyjaznych dla użytkownika proporcjach 16:10
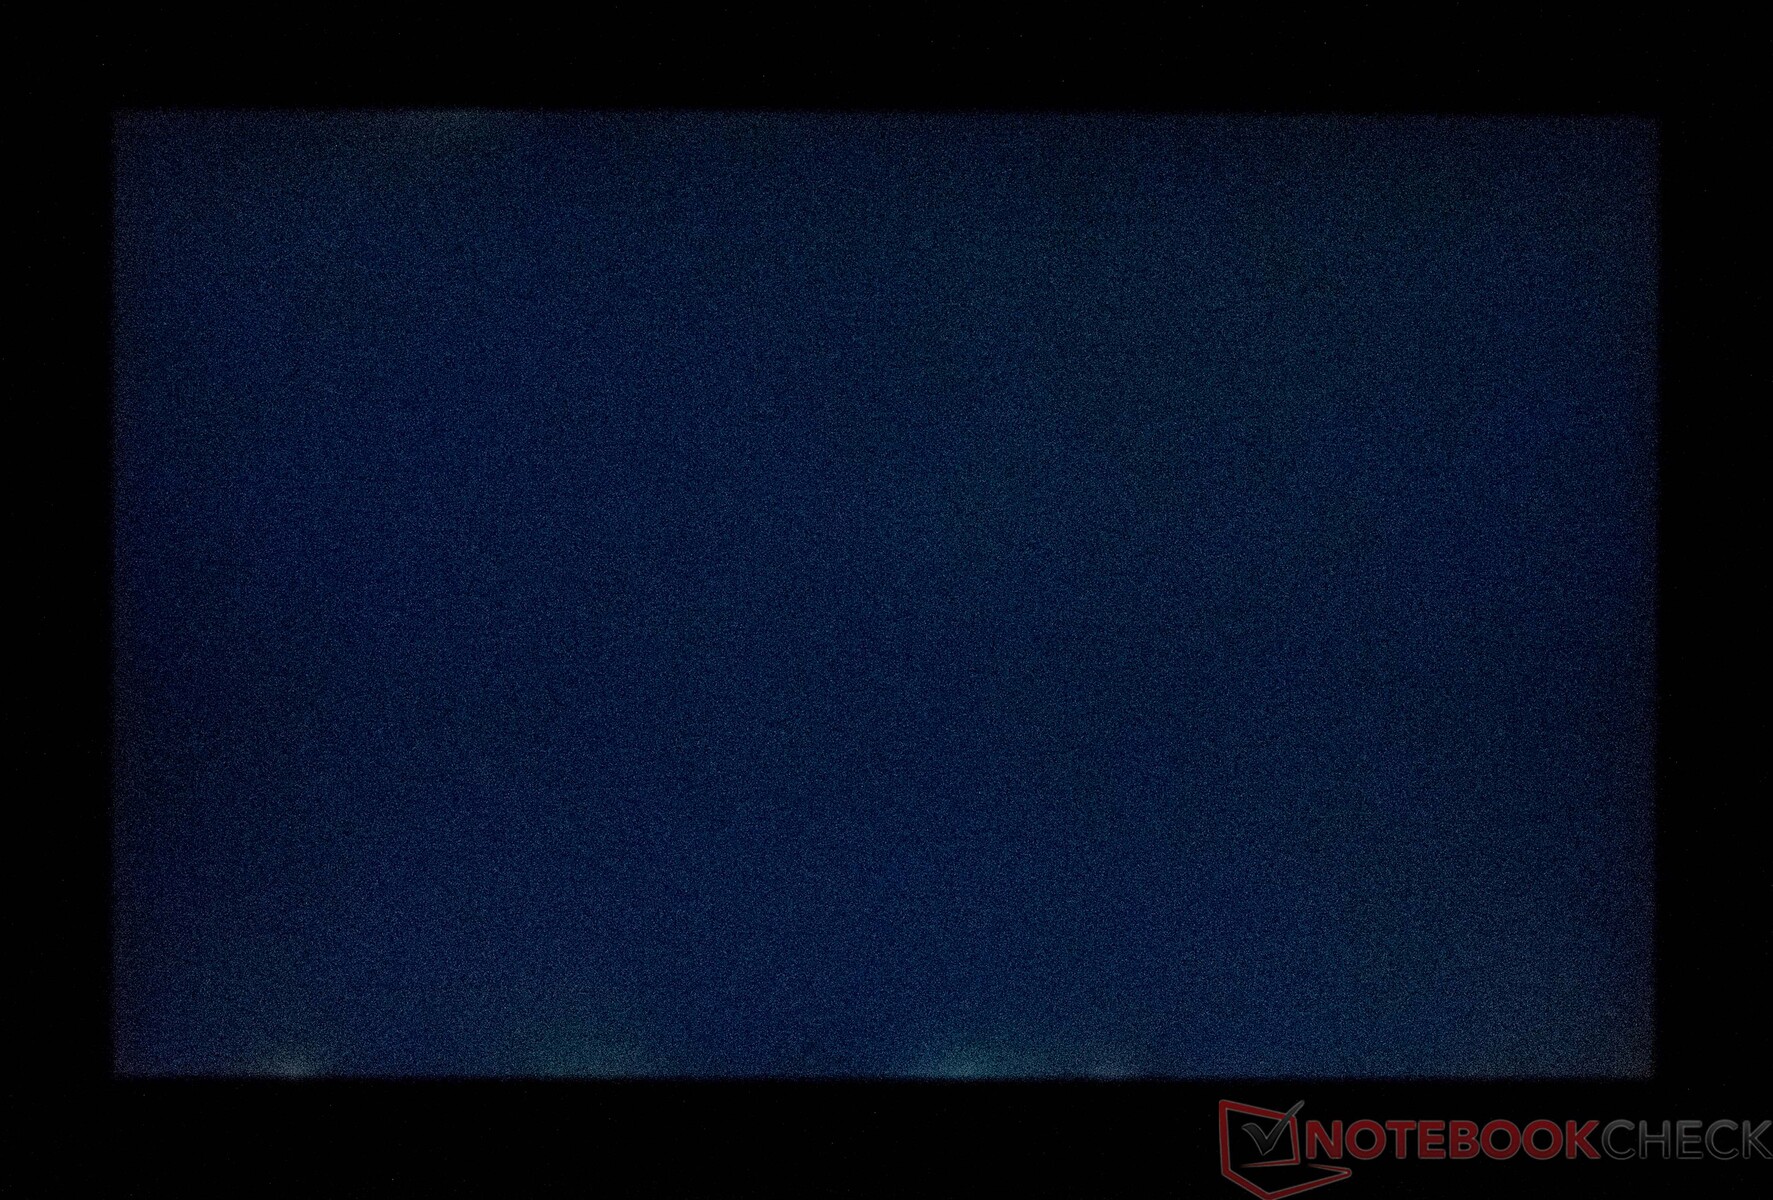
MSI Stealth 16 Studio A13VG jest wyposażony w dobry 16-calowy panel QHD+, a jego częstotliwość odświeżania 240 Hz powinna spełnić życzenia większości graczy. Zmierzyliśmy średnią jasność wyświetlacza na poziomie 424 cd/m². Oznacza to, że wyświetlacz jest stosunkowo jasny, a nawet udaje mu się być lepszym niż większość konkurencji. Tylko Acer Nitro 16 i Asus ROG Flow X16 oferują jaśniejsze wyświetlacze. Nasze urządzenie testowe musiało walczyć z lekkim krwawieniem ekranu i jest to coś, co musieliśmy wziąć pod uwagę przy przyznawaniu naszej oceny wyświetlacza. Natomiast nie wykryto PWM, co może zapobiec oznakom zmęczenia podczas dłuższego użytkowania.
Alternatywne opcje wyświetlania, takie jak panel 4K, nie są przeznaczone dla MSI Stealth 16 Studio A13VG.
| |||||||||||||||||||||||||
rozświetlenie: 88 %
na akumulatorze: 428 cd/m²
kontrast: 1146:1 (czerń: 0.37 cd/m²)
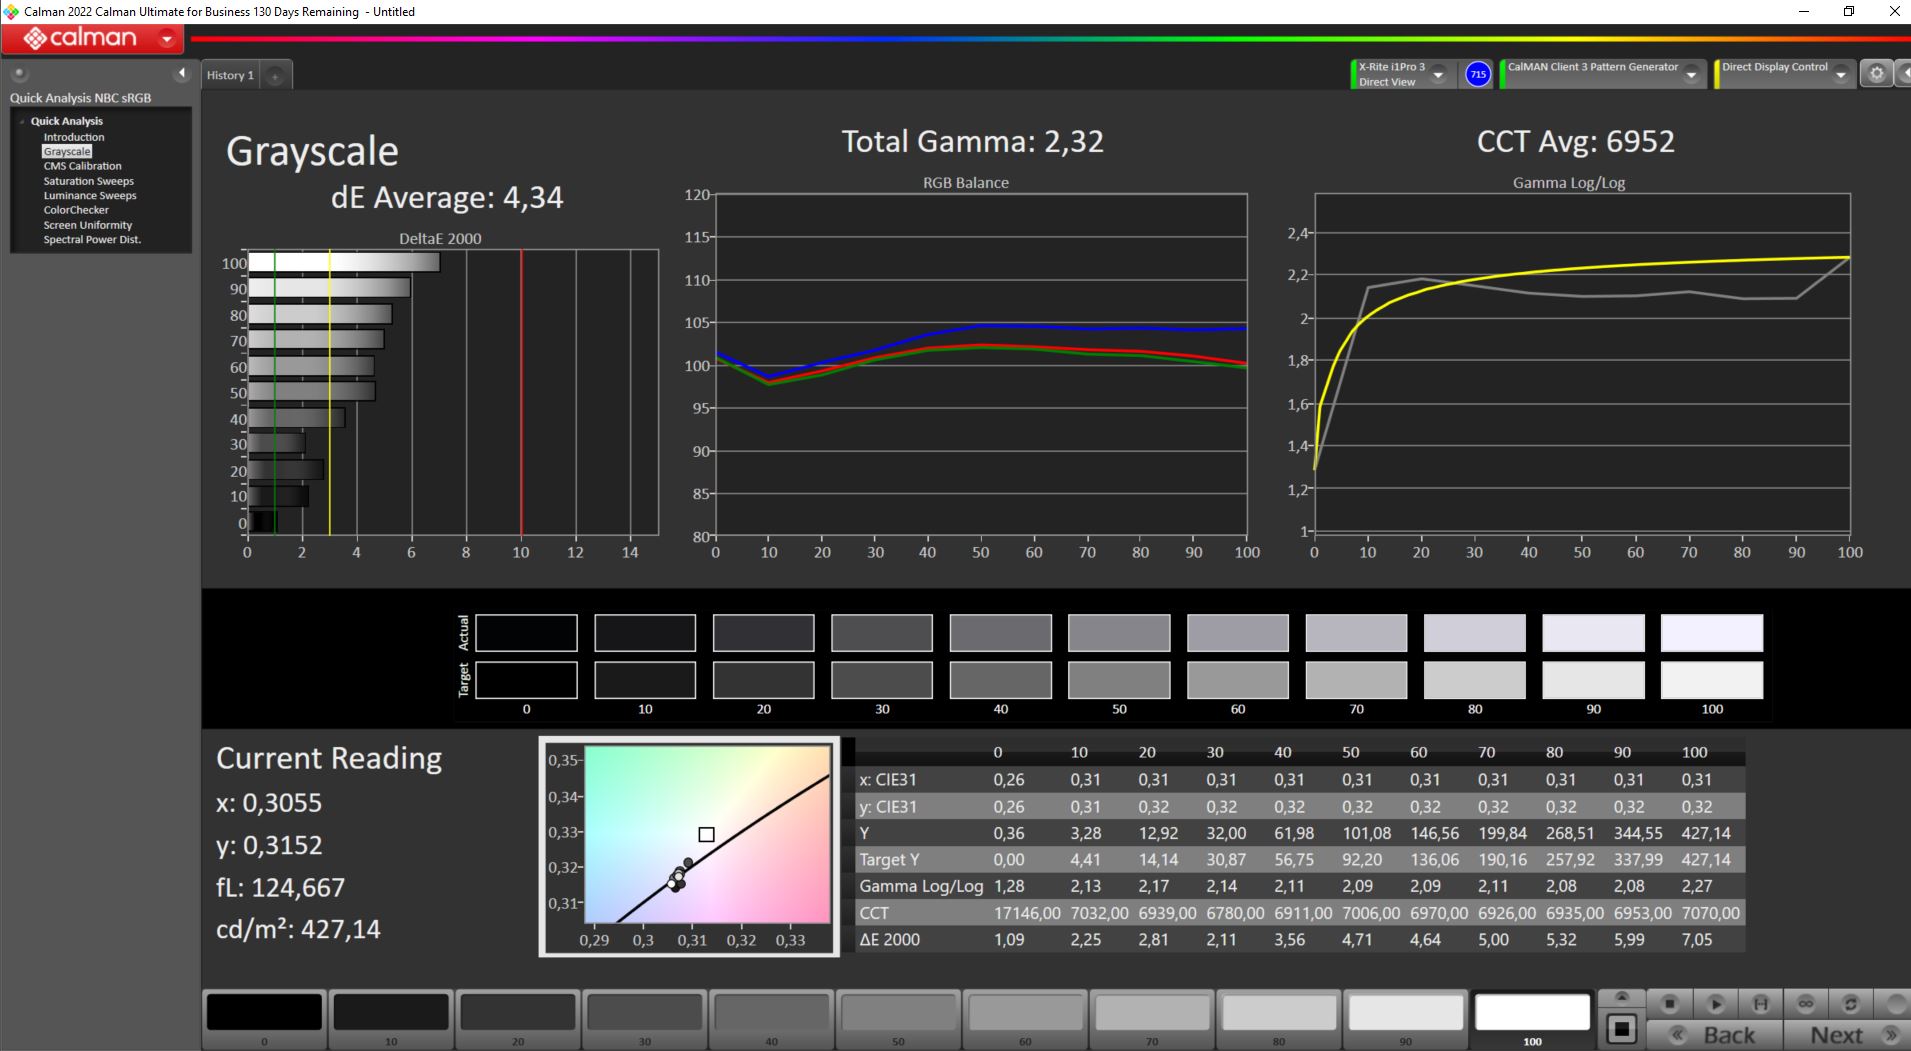
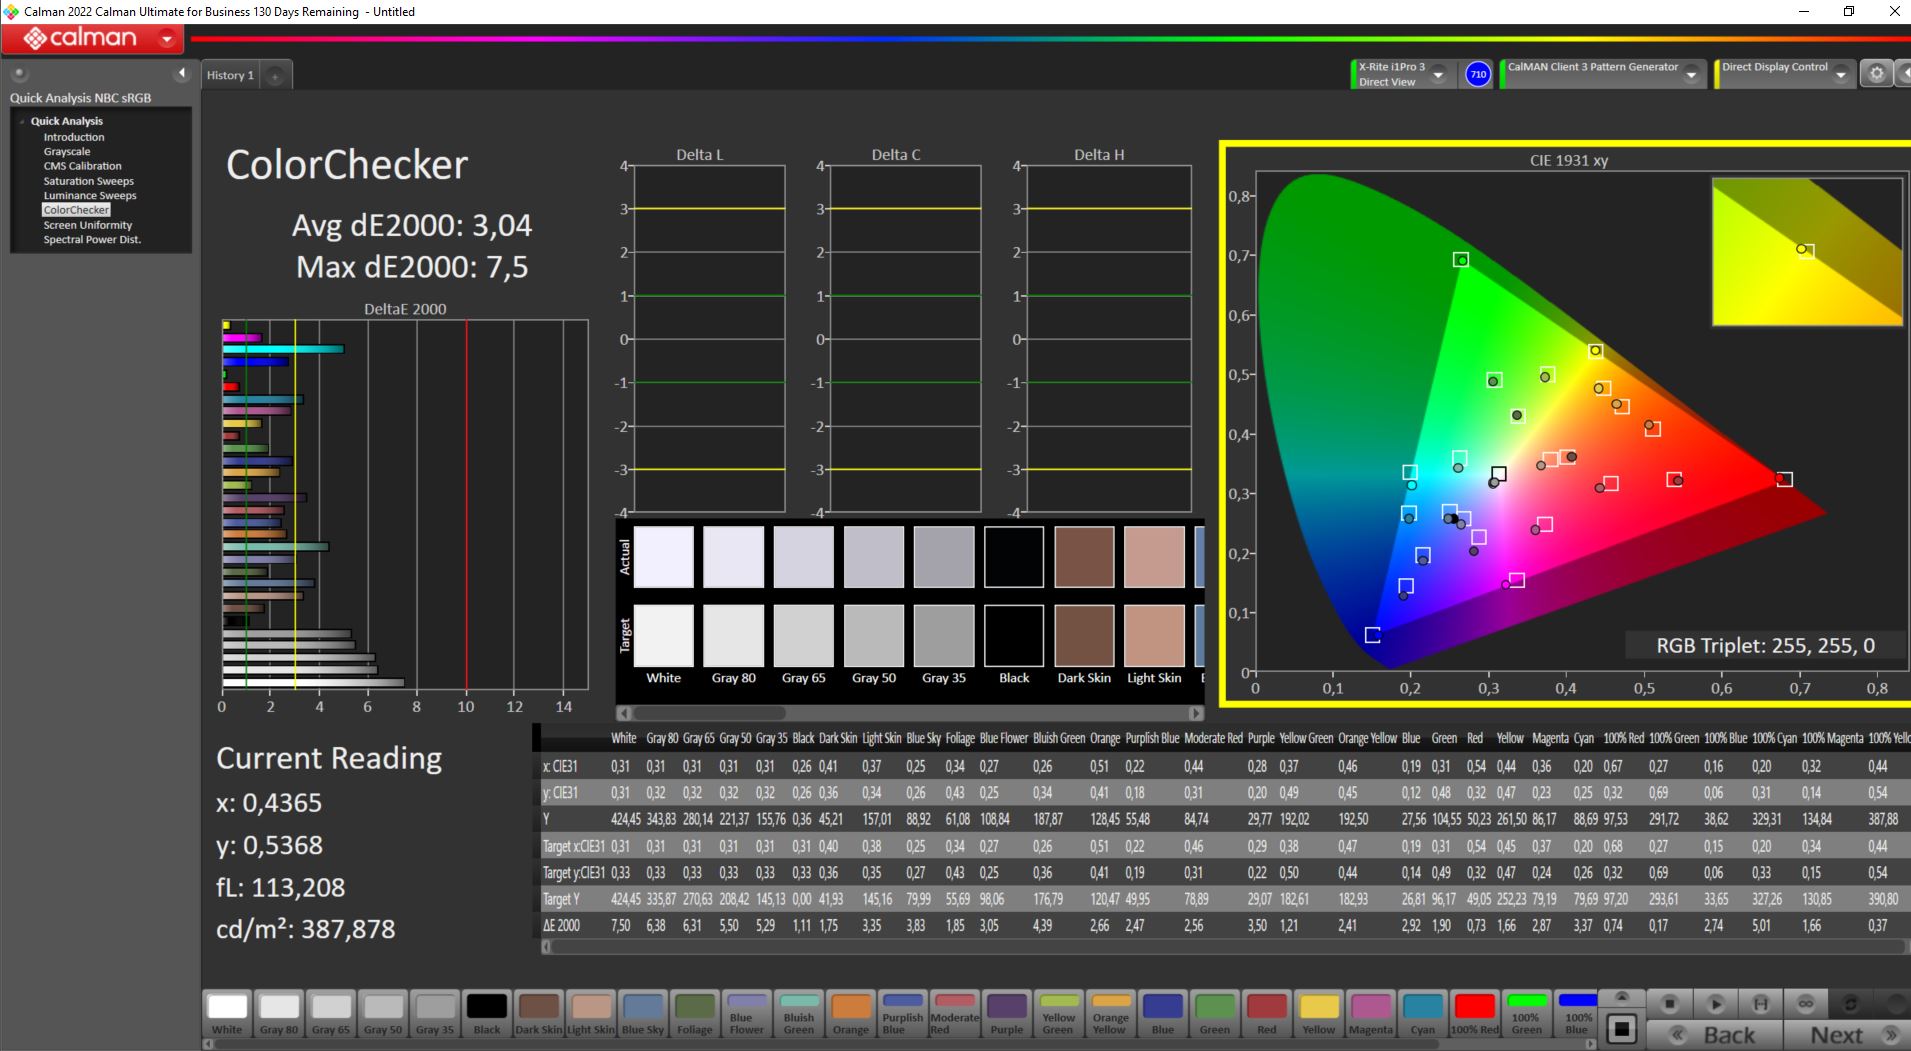
ΔE ColorChecker Calman: 3.04 | ∀{0.5-29.43 Ø4.71}
calibrated: 3.04
ΔE Greyscale Calman: 4.34 | ∀{0.09-98 Ø4.96}
84.8% AdobeRGB 1998 (Argyll 3D)
99.7% sRGB (Argyll 3D)
96.4% Display P3 (Argyll 3D)
Gamma: 2.32
CCT: 6952 K
| MSI Stealth 16 Studio A13VG AUO26A9, IPS, 2560x1600, 16" | Asus ROG Flow X16 GV601V TMX1603 (TL160ADMP03-0), IPS, 2560x1600, 16" | Medion Erazer Major X20 BOE CQ NE160QDM-NZ1, IPS, 2560x1600, 16" | Acer Nitro 16 AN16-41 BOE CQ NE16QDM-NY1, IPS, 2560x1600, 16" | Corsair Voyager a1600 BOE0A3B, IPS, 2560x1600, 16" | Gigabyte AERO 16 OLED BSF Samsung SDC4191 (ATNA60YV09-0, OLED, 3840x2400, 16" | |
|---|---|---|---|---|---|---|
| Display | 0% | -15% | -16% | -16% | 6% | |
| Display P3 Coverage (%) | 96.4 | 96.61 0% | 69.4 -28% | 67.9 -30% | 68.7 -29% | 99.9 4% |
| sRGB Coverage (%) | 99.7 | 99.92 0% | 98 -2% | 99.1 -1% | 98.2 -2% | 100 0% |
| AdobeRGB 1998 Coverage (%) | 84.8 | 84.63 0% | 70.9 -16% | 69.9 -18% | 70.1 -17% | 96.4 14% |
| Response Times | -11% | -114% | -70% | -137% | 60% | |
| Response Time Grey 50% / Grey 80% * (ms) | 4.4 ? | 3.8 ? 14% | 13.1 ? -198% | 11 ? -150% | 13 ? -195% | 2 ? 55% |
| Response Time Black / White * (ms) | 5.6 ? | 7.6 ? -36% | 7.3 ? -30% | 5 ? 11% | 10 ? -79% | 1.98 ? 65% |
| PWM Frequency (Hz) | 60 | |||||
| Screen | 21% | 16% | 25% | 6% | 144% | |
| Brightness middle (cd/m²) | 424 | 486 15% | 374 -12% | 520 23% | 355 -16% | 389.97 -8% |
| Brightness (cd/m²) | 411 | 469 14% | 357 -13% | 494 20% | 340 -17% | 395 -4% |
| Brightness Distribution (%) | 88 | 91 3% | 92 5% | 91 3% | 91 3% | 97 10% |
| Black Level * (cd/m²) | 0.37 | 0.39 -5% | 0.33 11% | 0.39 -5% | 0.53 -43% | 0.03 92% |
| Contrast (:1) | 1146 | 1246 9% | 1133 -1% | 1333 16% | 670 -42% | 12999 1034% |
| Colorchecker dE 2000 * | 3.04 | 2.27 25% | 2.43 20% | 1.94 36% | 2.43 20% | 2 34% |
| Colorchecker dE 2000 max. * | 7.5 | 5.73 24% | 3.97 47% | 5.62 25% | 4.31 43% | 4.1 45% |
| Colorchecker dE 2000 calibrated * | 3.04 | 0.6 80% | 1.4 54% | 0.74 76% | 1.14 63% | 1.68 45% |
| Greyscale dE 2000 * | 4.34 | 3.36 23% | 3.1 29% | 2.94 32% | 2.62 40% | 2.23 49% |
| Gamma | 2.32 95% | 2.46 89% | 2.191 100% | 2.37 93% | 2.28 96% | 2.41 91% |
| CCT | 6952 93% | 6625 98% | 6194 105% | 6443 101% | 6909 94% | 6323 103% |
| Całkowita średnia (program / ustawienia) | 3% /
12% | -38% /
-10% | -20% /
3% | -49% /
-19% | 70% /
103% |
* ... im mniej tym lepiej
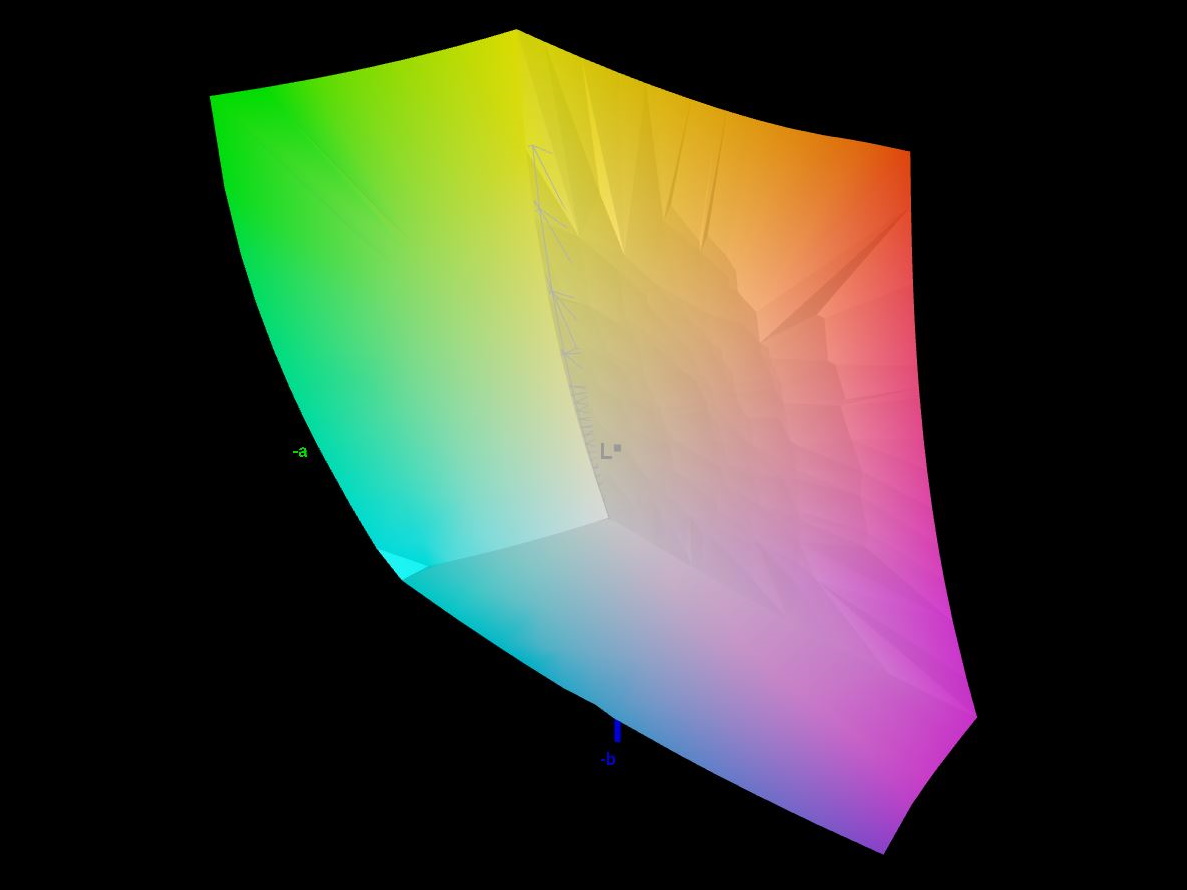
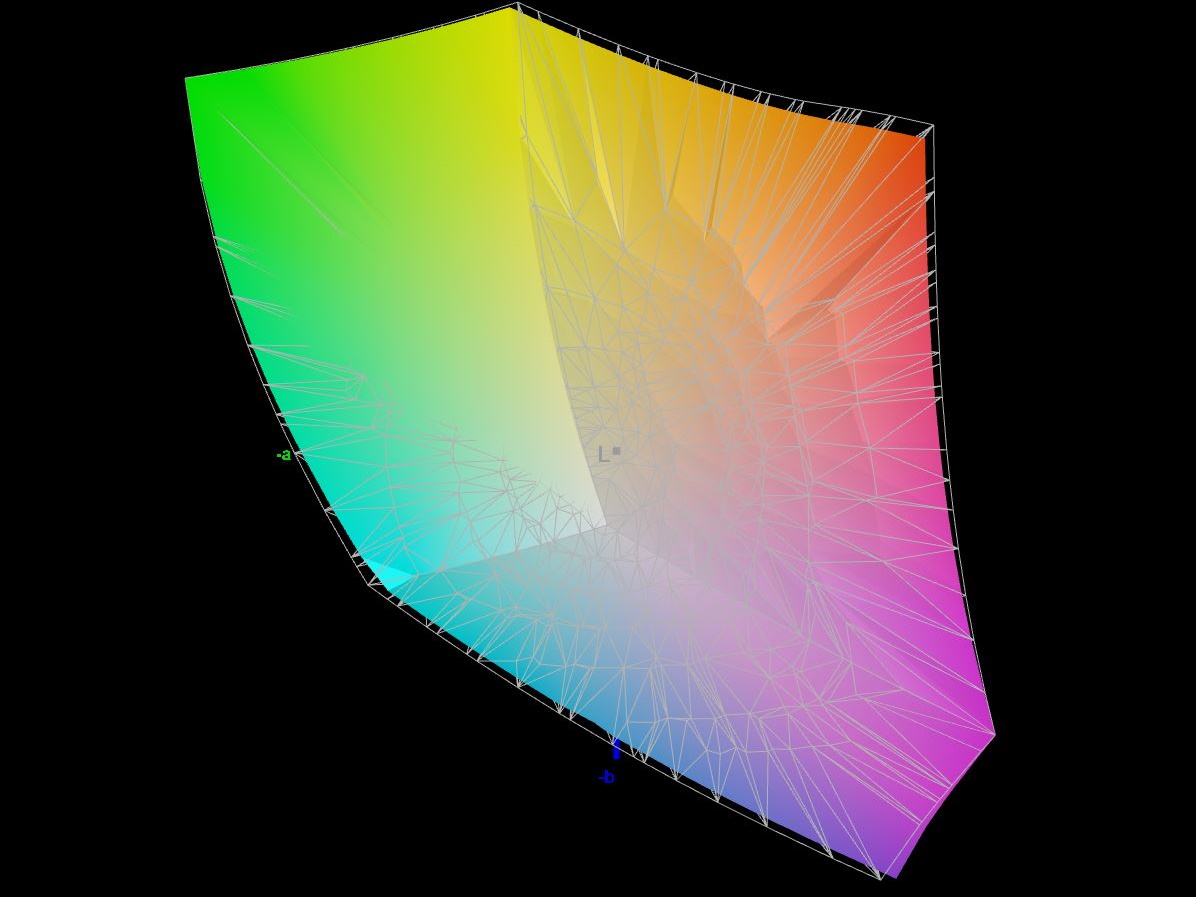
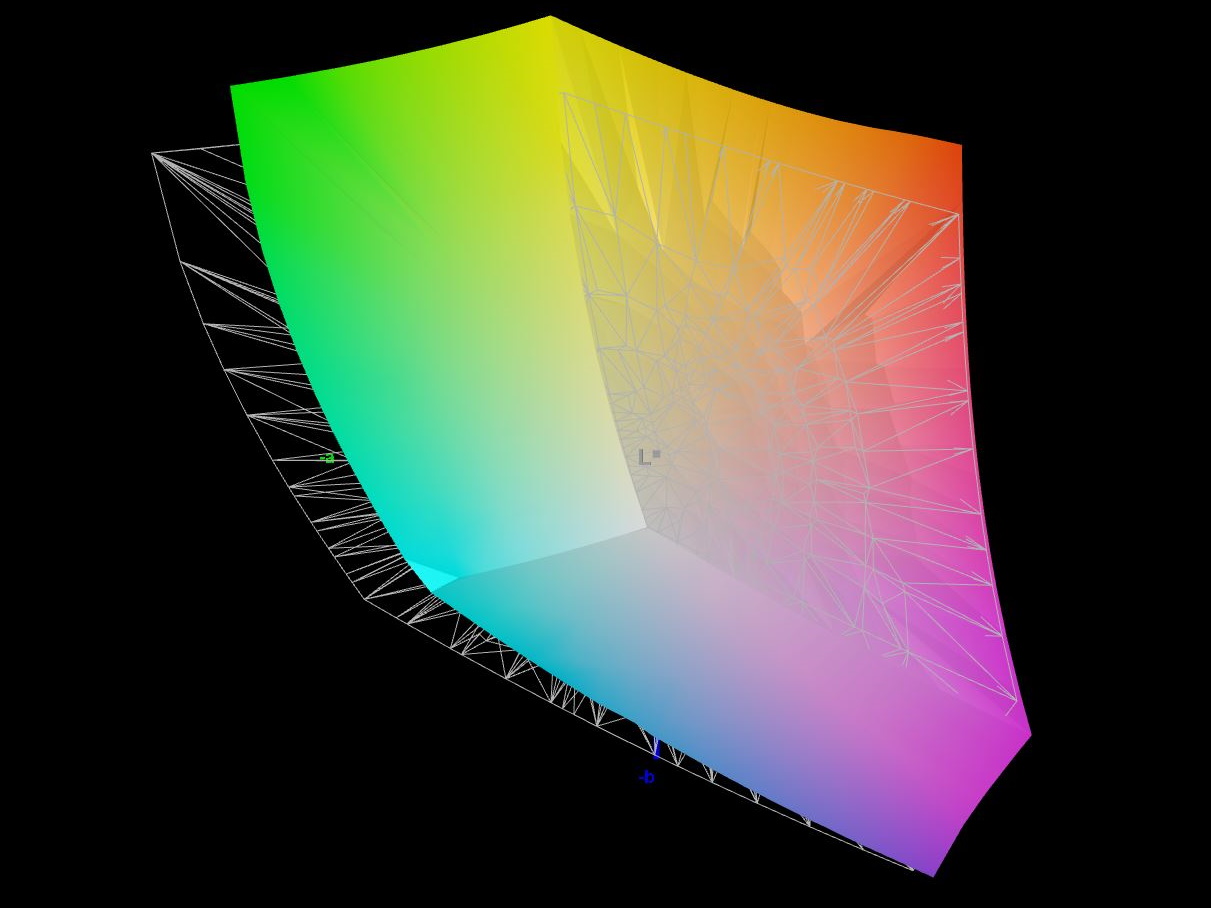
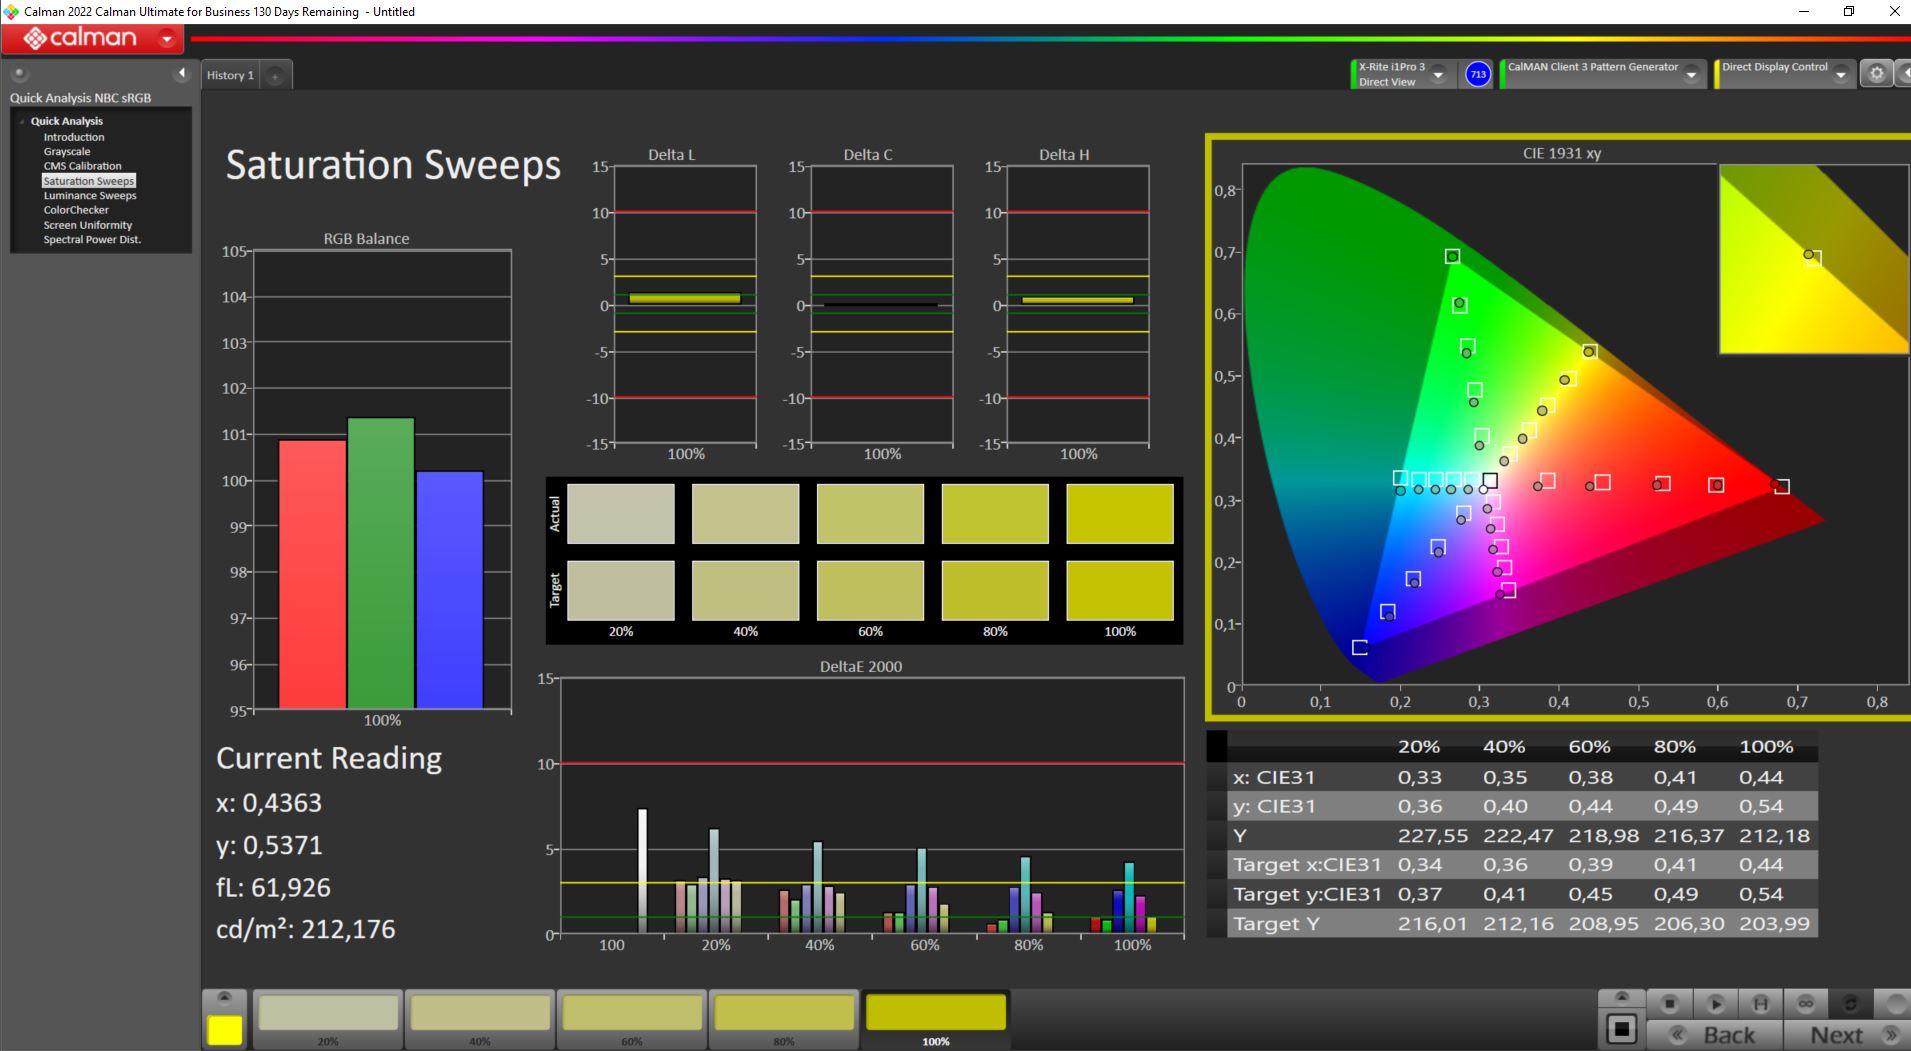
Nasze pomiary wykazały dobre pokrycie przestrzeni kolorów w przestrzeni kolorów sRGB, która została pokryta w prawie 100 procentach. Ponadto, jeśli chodzi o przestrzeń kolorów P3, zobaczyliśmy wspaniały wynik ponad 96 procent, chociaż rozszerzoną przestrzeń kolorów AdobeRGB można odtworzyć tylko w 84,8 procentach. Dzięki tym liczbom IPS osiąga dobre wyniki i przegrywa tylko zGigabyte AERO 16z panelem OLED. Niemniej jednak jest oczywiste, że ten laptop może być używany do półprofesjonalnej edycji zdjęć lub wideo.
Subiektywnie, jakość obrazu na wbudowanym wyświetlaczu jest doskonała. Matowa powierzchnia zapobiega odbiciom, a widoczna ziarnistość jest również nieobecna. Podsumowując, po wyjęciu z pudełka zmierzone wartości kolorów DeltaE-2000 są stosunkowo bliskie docelowej wartości <3. Konkurencja udowadnia jednak, że lepsze jest możliwe. Typowe dla IPS, zaobserwowaliśmy lekki, ale niezbyt wyraźny niebieski odcień w MSI Stealth 16 Studio A13VG.
Nasza ręczna kalibracja nie przyniosła żadnej poprawy. Zamierzamy również dostarczyć profil ICC dla tego wyświetlacza.
Wyświetl czasy reakcji
| ↔ Czas reakcji od czerni do bieli | ||
|---|---|---|
| 5.6 ms ... wzrost ↗ i spadek ↘ łącznie | ↗ 2.2 ms wzrost | 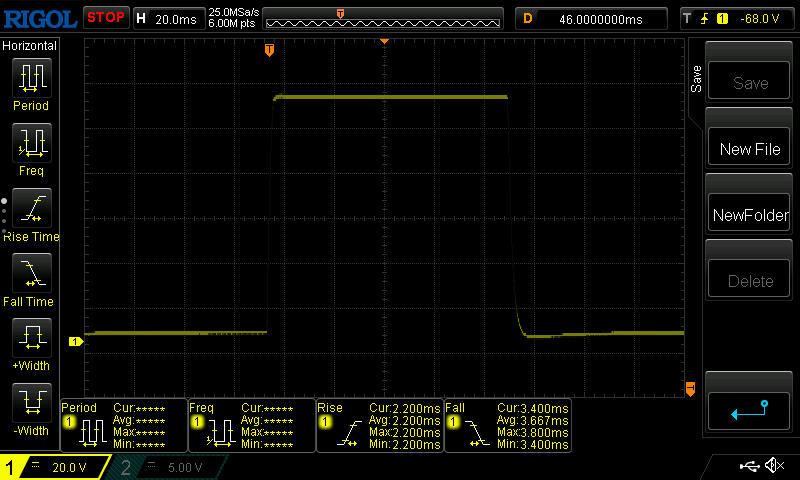 |
| ↘ 3.4 ms upadek | ||
| W naszych testach ekran wykazuje bardzo szybką reakcję i powinien bardzo dobrze nadawać się do szybkich gier. Dla porównania, wszystkie testowane urządzenia wahają się od 0.1 (minimum) do 240 (maksimum) ms. » 18 % wszystkich urządzeń jest lepszych. Oznacza to, że zmierzony czas reakcji jest lepszy od średniej wszystkich testowanych urządzeń (19.8 ms). | ||
| ↔ Czas reakcji 50% szarości do 80% szarości | ||
| 4.4 ms ... wzrost ↗ i spadek ↘ łącznie | ↗ 2.2 ms wzrost | 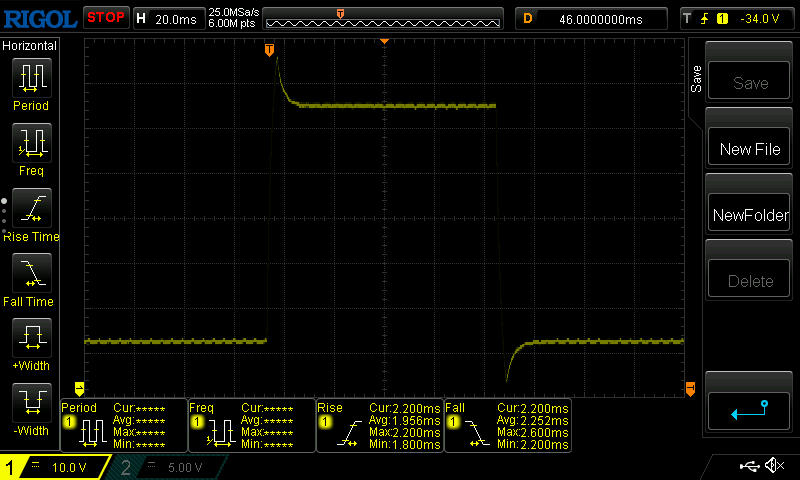 |
| ↘ 2.2 ms upadek | ||
| W naszych testach ekran wykazuje bardzo szybką reakcję i powinien bardzo dobrze nadawać się do szybkich gier. Dla porównania, wszystkie testowane urządzenia wahają się od 0.165 (minimum) do 636 (maksimum) ms. » 16 % wszystkich urządzeń jest lepszych. Oznacza to, że zmierzony czas reakcji jest lepszy od średniej wszystkich testowanych urządzeń (31 ms). | ||
Migotanie ekranu / PWM (modulacja szerokości impulsu)
| Migotanie ekranu/nie wykryto PWM | 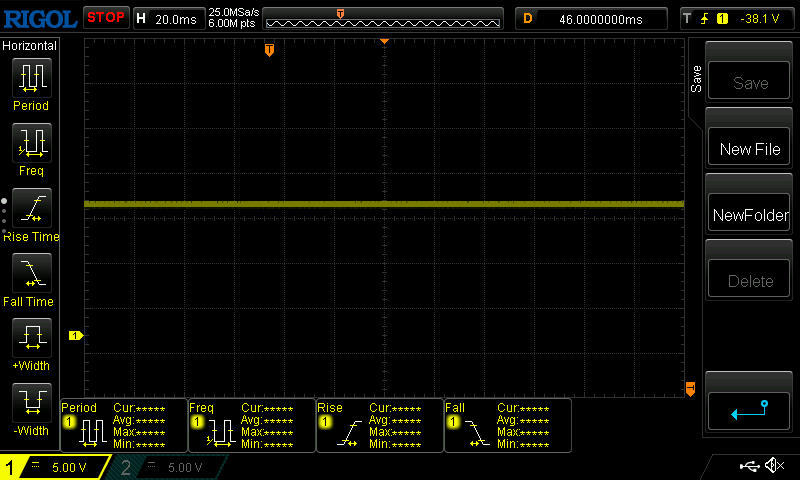 | ||
Dla porównania: 52 % wszystkich testowanych urządzeń nie używa PWM do przyciemniania wyświetlacza. Jeśli wykryto PWM, zmierzono średnio 7747 (minimum: 5 - maksimum: 343500) Hz. | |||
Stosunkowo dobra jasność wyświetlacza jest wystarczająca do użytku na zewnątrz. Użytkownicy powinni jednak preferować miejsca w cieniu. Dzięki matowej powierzchni wyświetlacza nie występują irytujące odbicia.
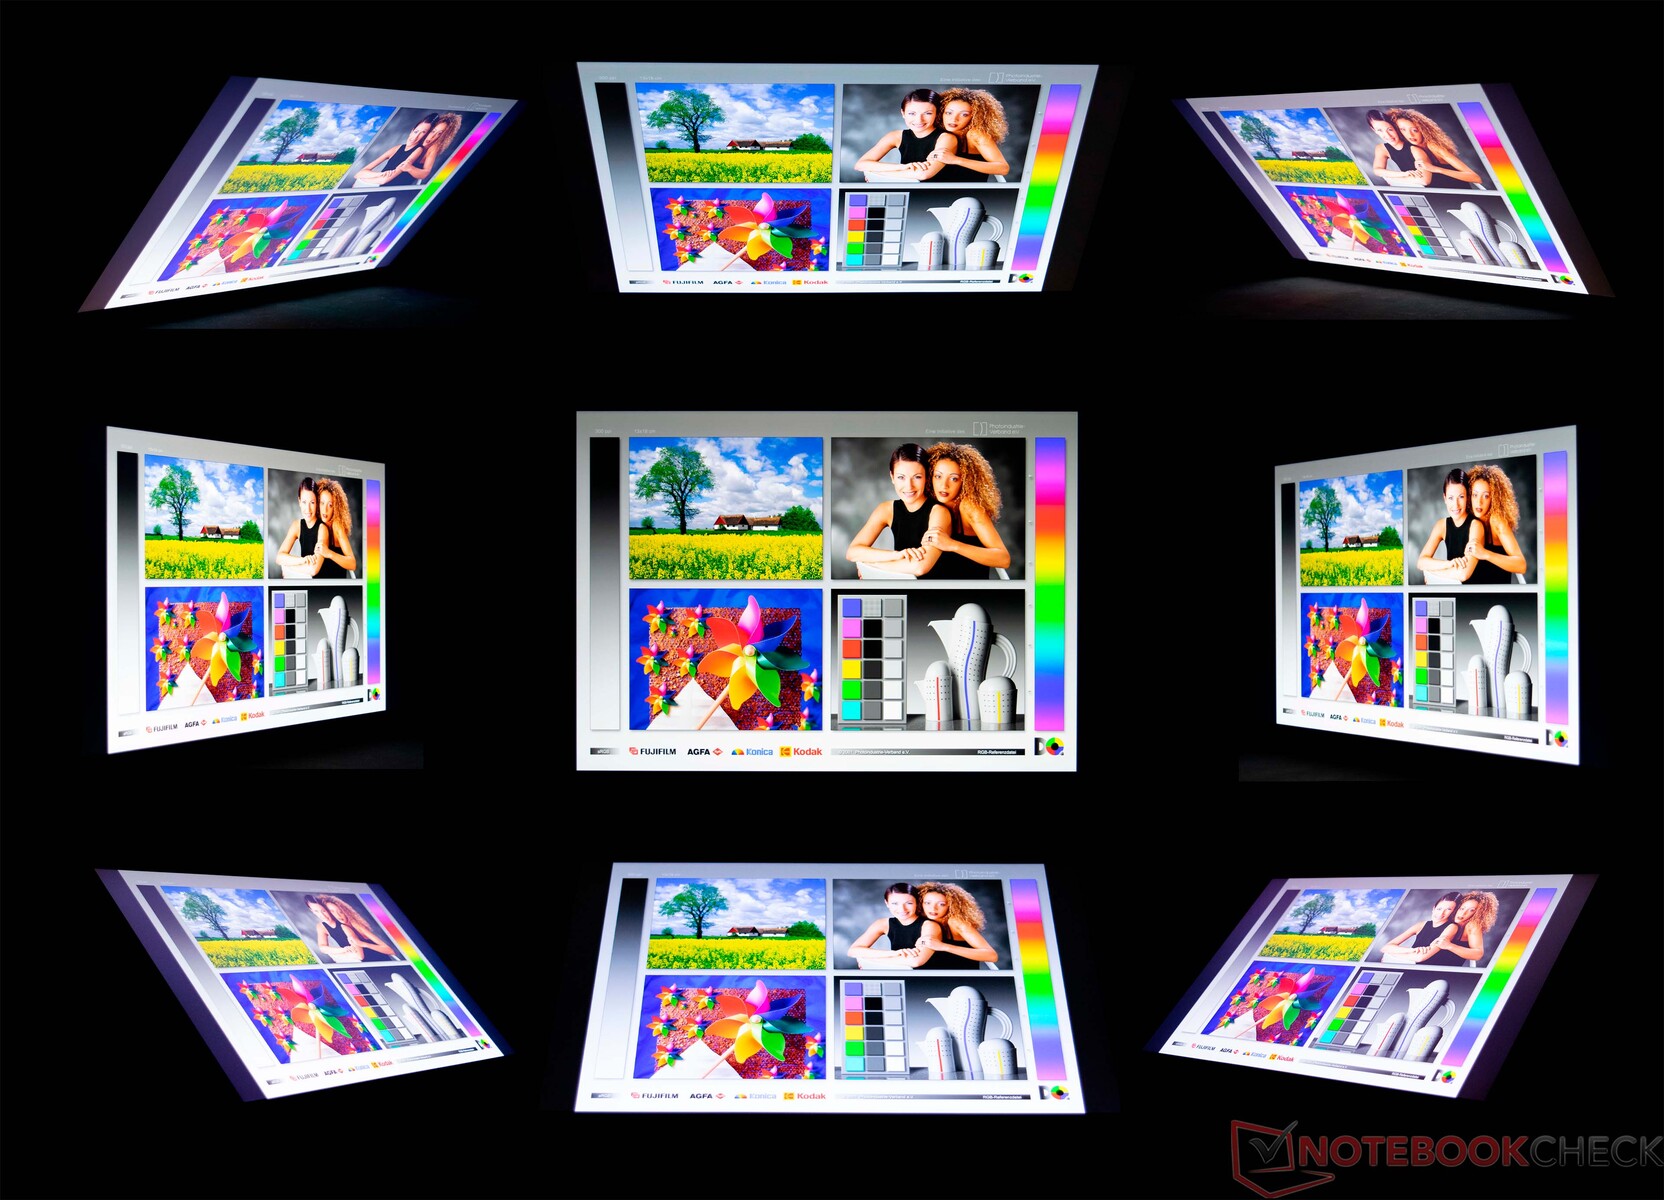
Podczas normalnego użytkowania wbudowany panel IPS jest wspaniałym wyświetlaczem. Jak widać na zdjęciach w czterech rogach, zmiany kolorów są widoczne tylko podczas oglądania zarówno pod szerokim, jak i stromym kątem.
Wydajność - moc 14 rdzeni - Intel Core i7-13700H
MSI Stealth 16 Studio A13VG, który bazuje na procesorzeIntel Core i7-13700H iNvidia GeForce RTX 4070 laptop GPUoferuje poziom mocy, co oznacza, że dobrze sprawdza się jako potężny laptop do gier. Jednak granie nie jest jedyną główną zdolnością urządzenia, ponieważ wspaniały wyświetlacz i elegancki wygląd sprawiają, że jest to również zachęcająca perspektywa dla twórców. Alternatywę dla naszego recenzowanego modelu można znaleźć w postaci MSI Stealth 16 Studio A13V, który jest również wyposażony wNvidia GeForce RTX 4060 laptop GPU.
Warunki testowe
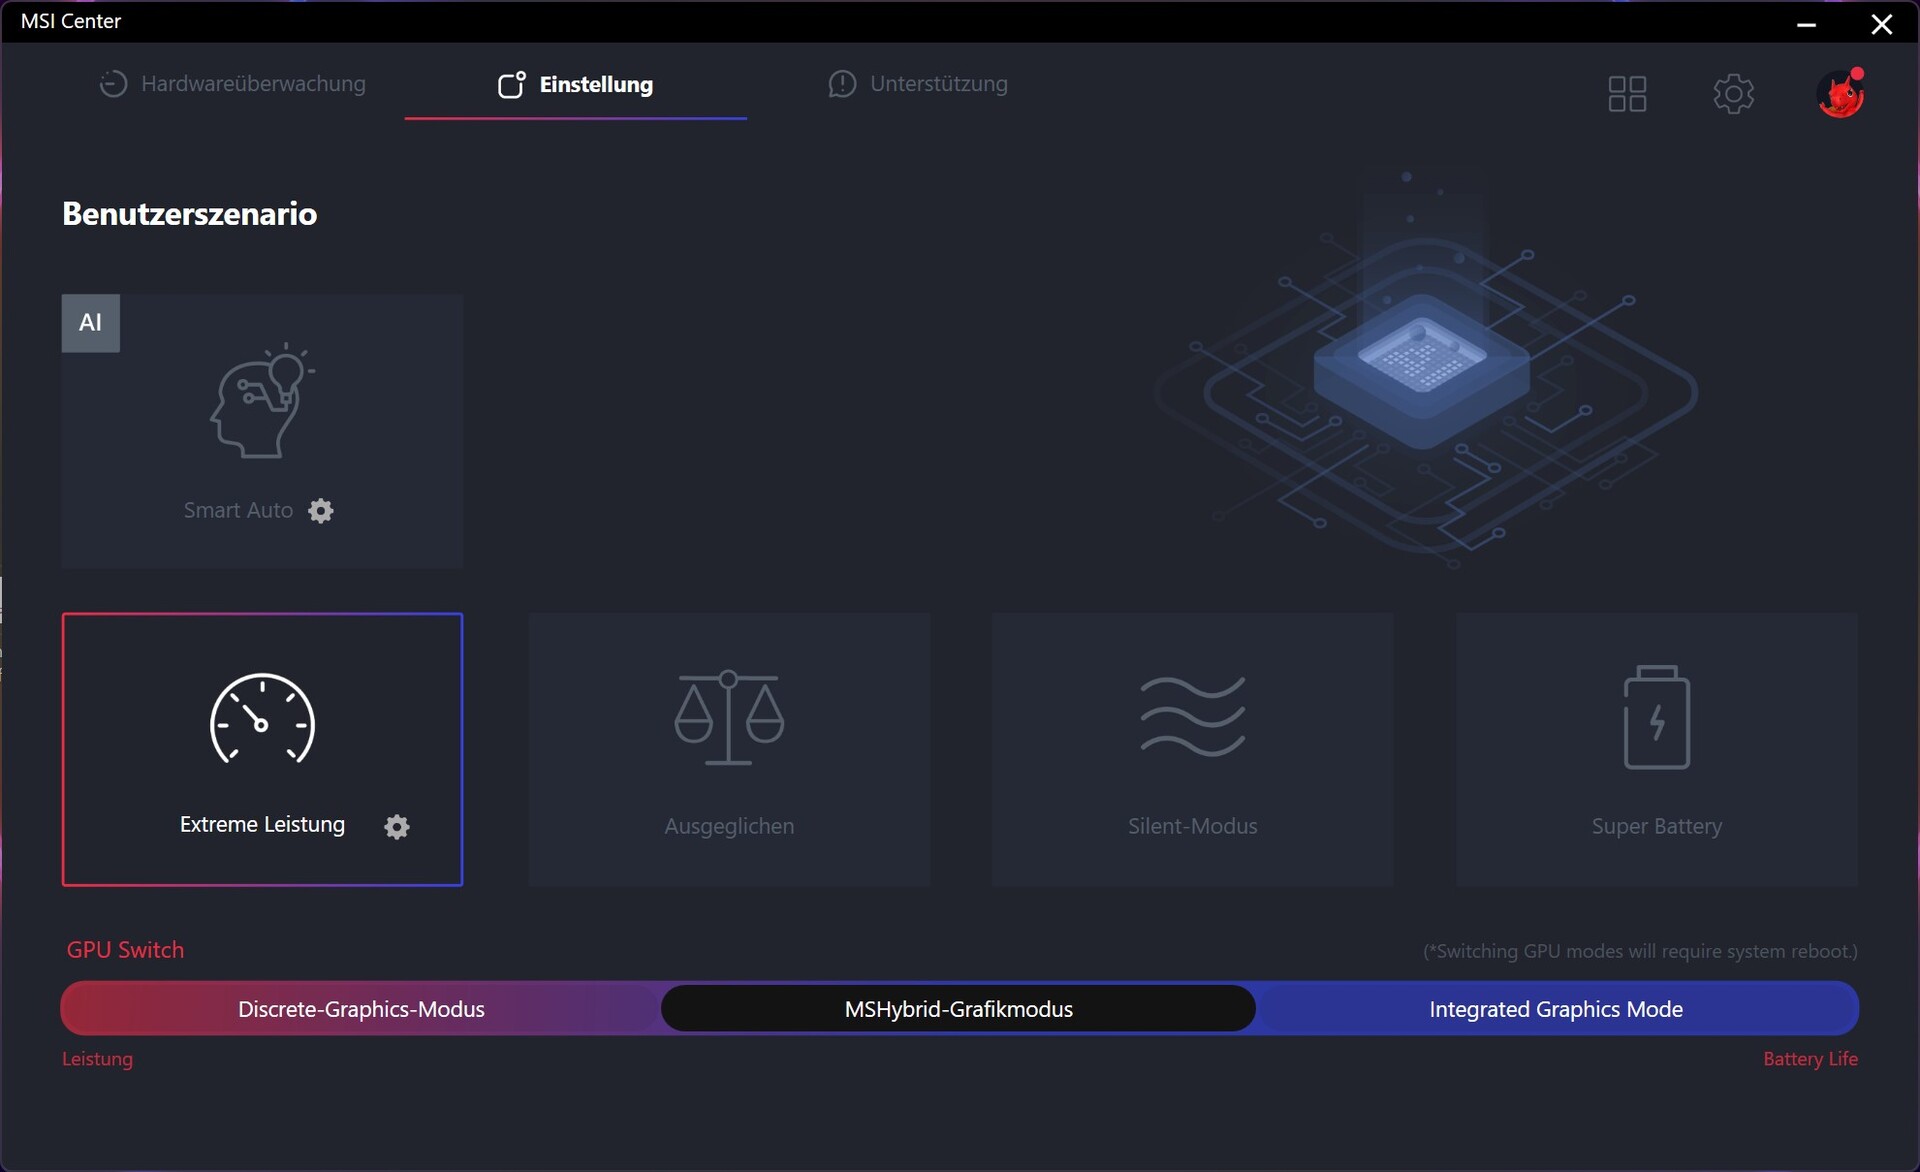
Różne profile wydajności, które wpływają na CPU i GPU, można wybrać za pomocą MSI Center. O ile nie zaznaczono inaczej, testy wydajności zostały przeprowadzone przy użyciu profilu Extreme Performance
. Ponadto dokonaliśmy odchyleń w pomiarach energii i głośności zgodnie z naszymi kryteriami testowymi.
| Tryb | Moc procesora PL1 | Moc procesora PL2 | Moc GPU |
|---|---|---|---|
| Super bateria | 15 W | 15 W | 80 W |
| Tryb cichy | 25 W | 45 W | 80 W |
| Zrównoważony | 45 W | 45 W | 80 W |
| Ekstremalna wydajność | 115 W | 160 W | 105 W |
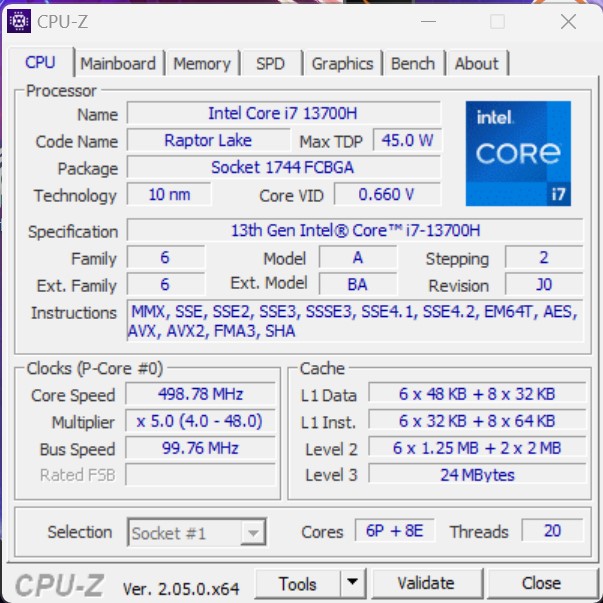
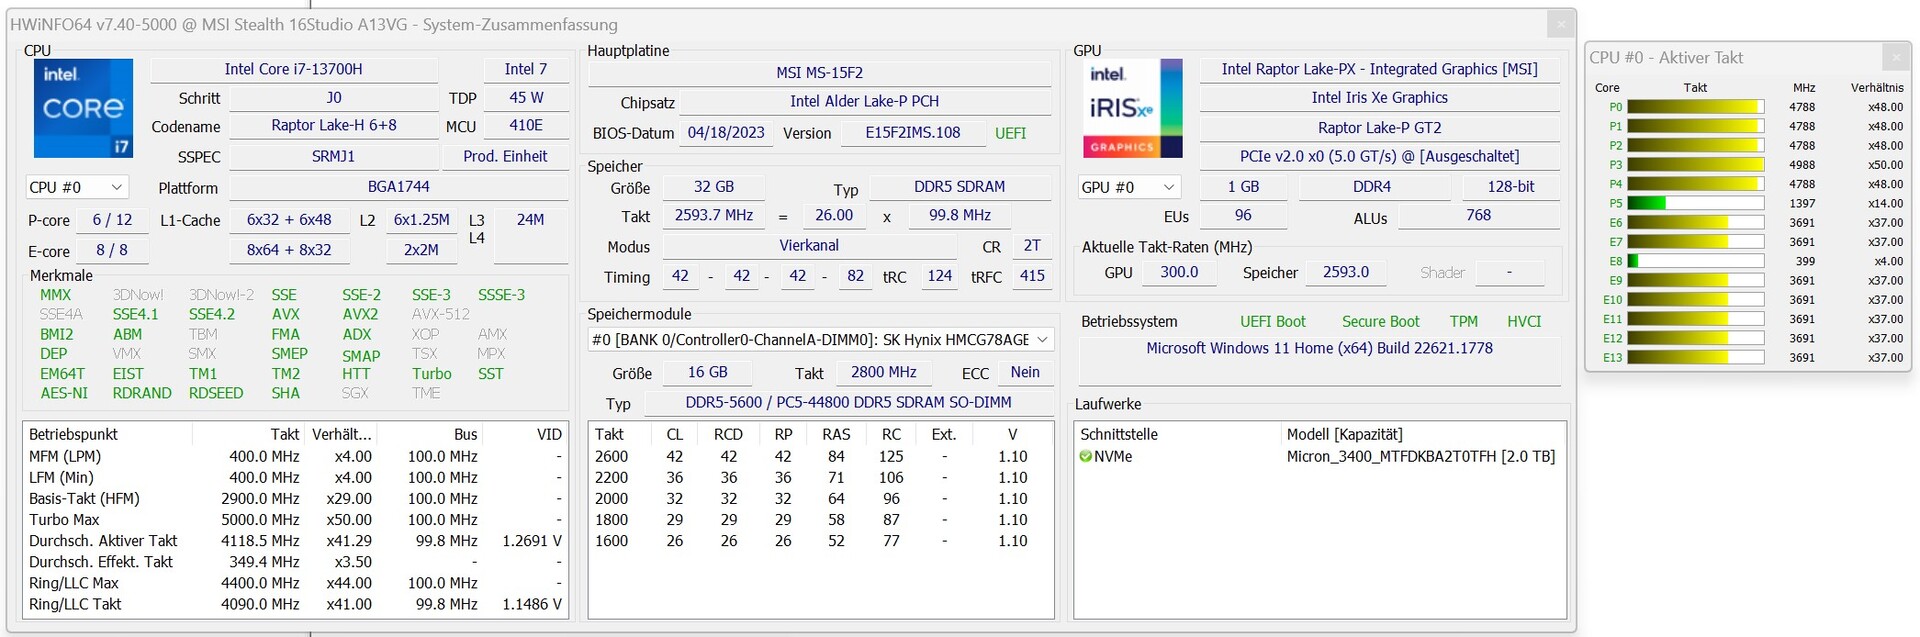
Procesor
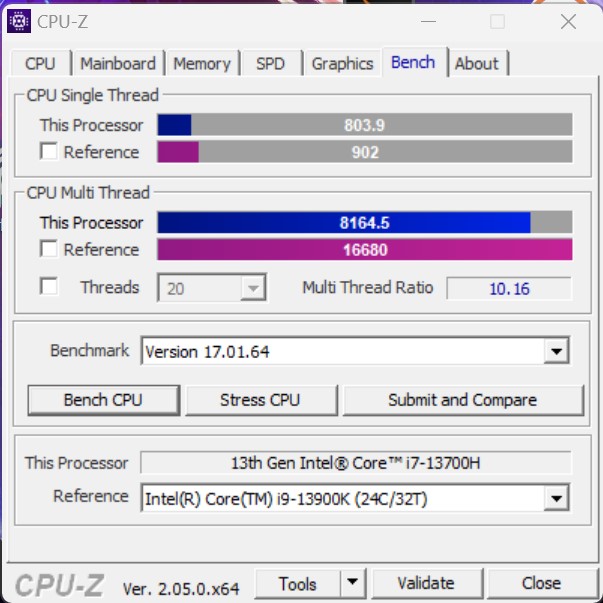
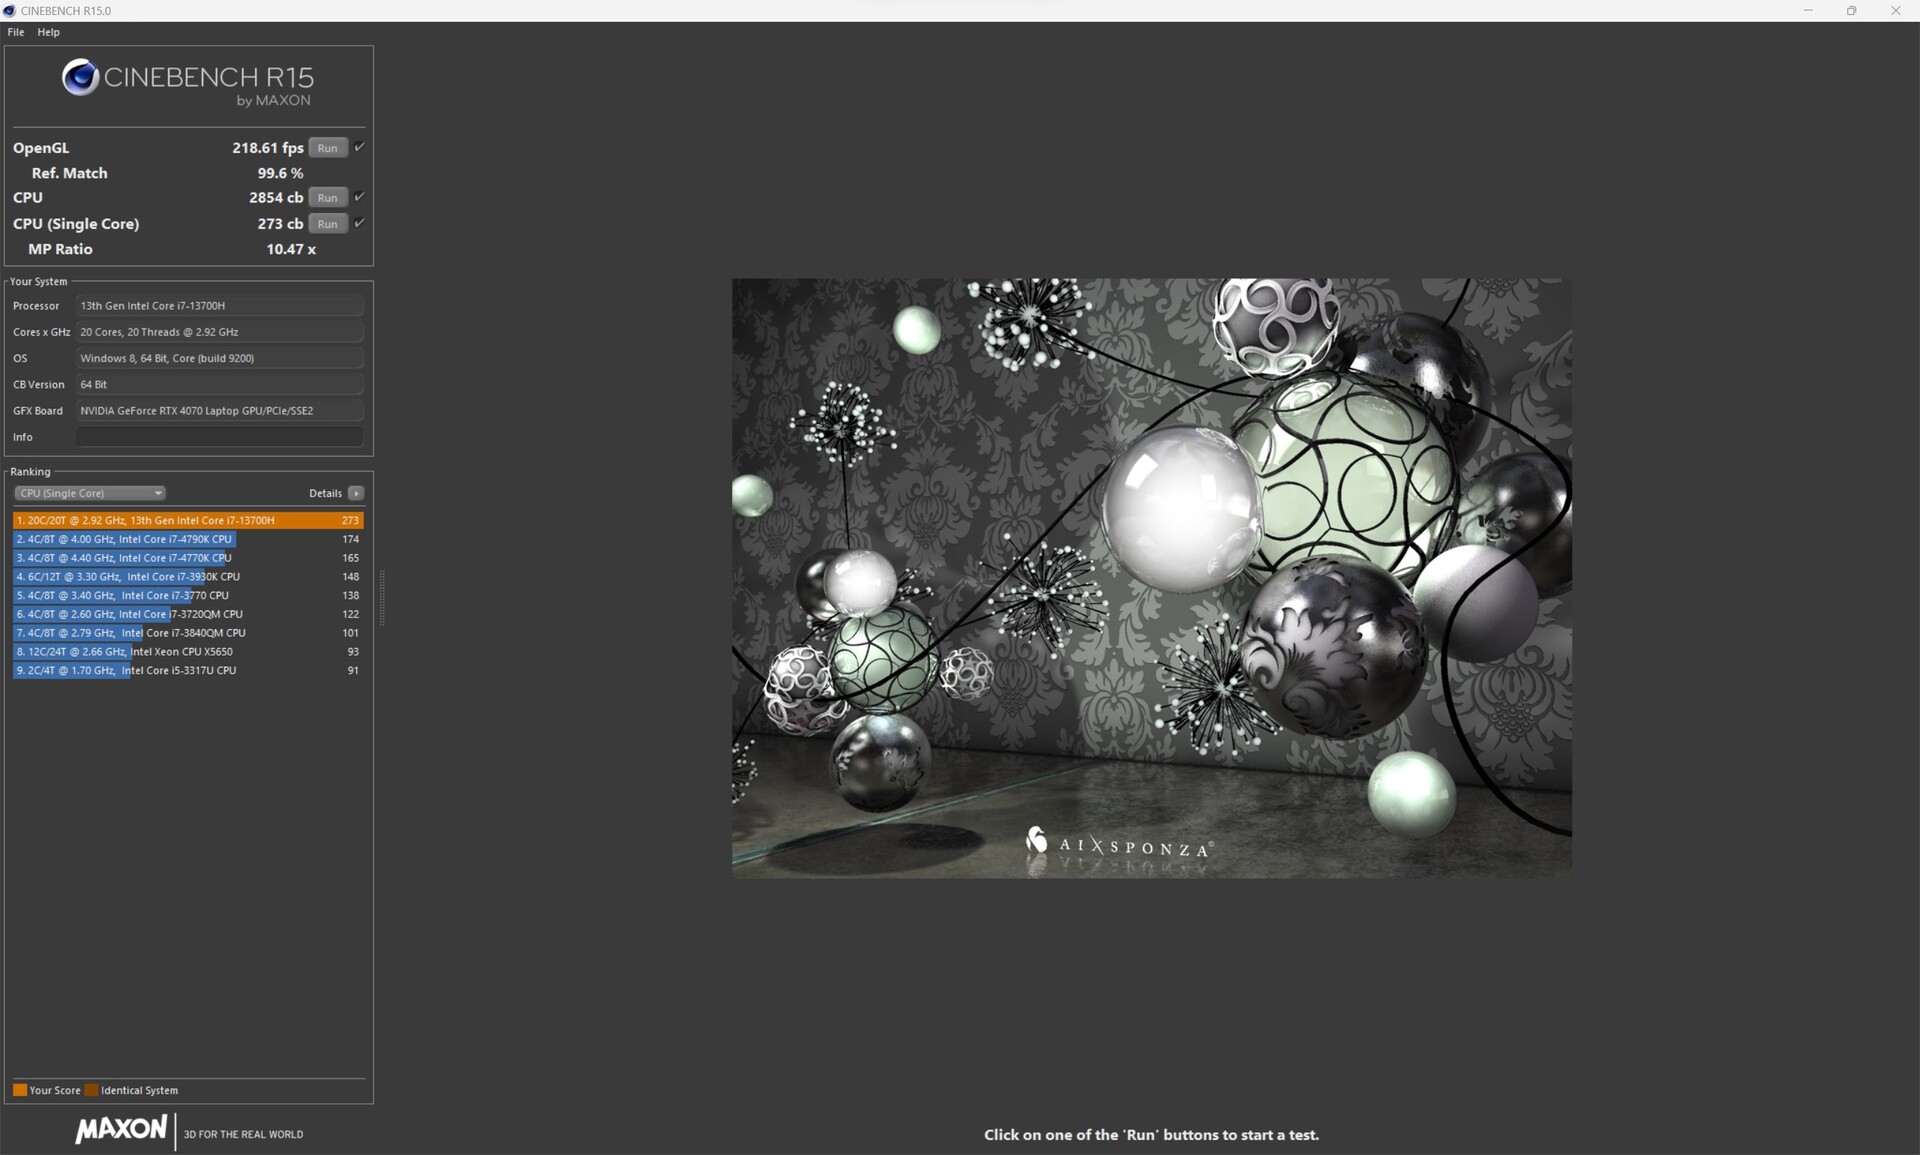
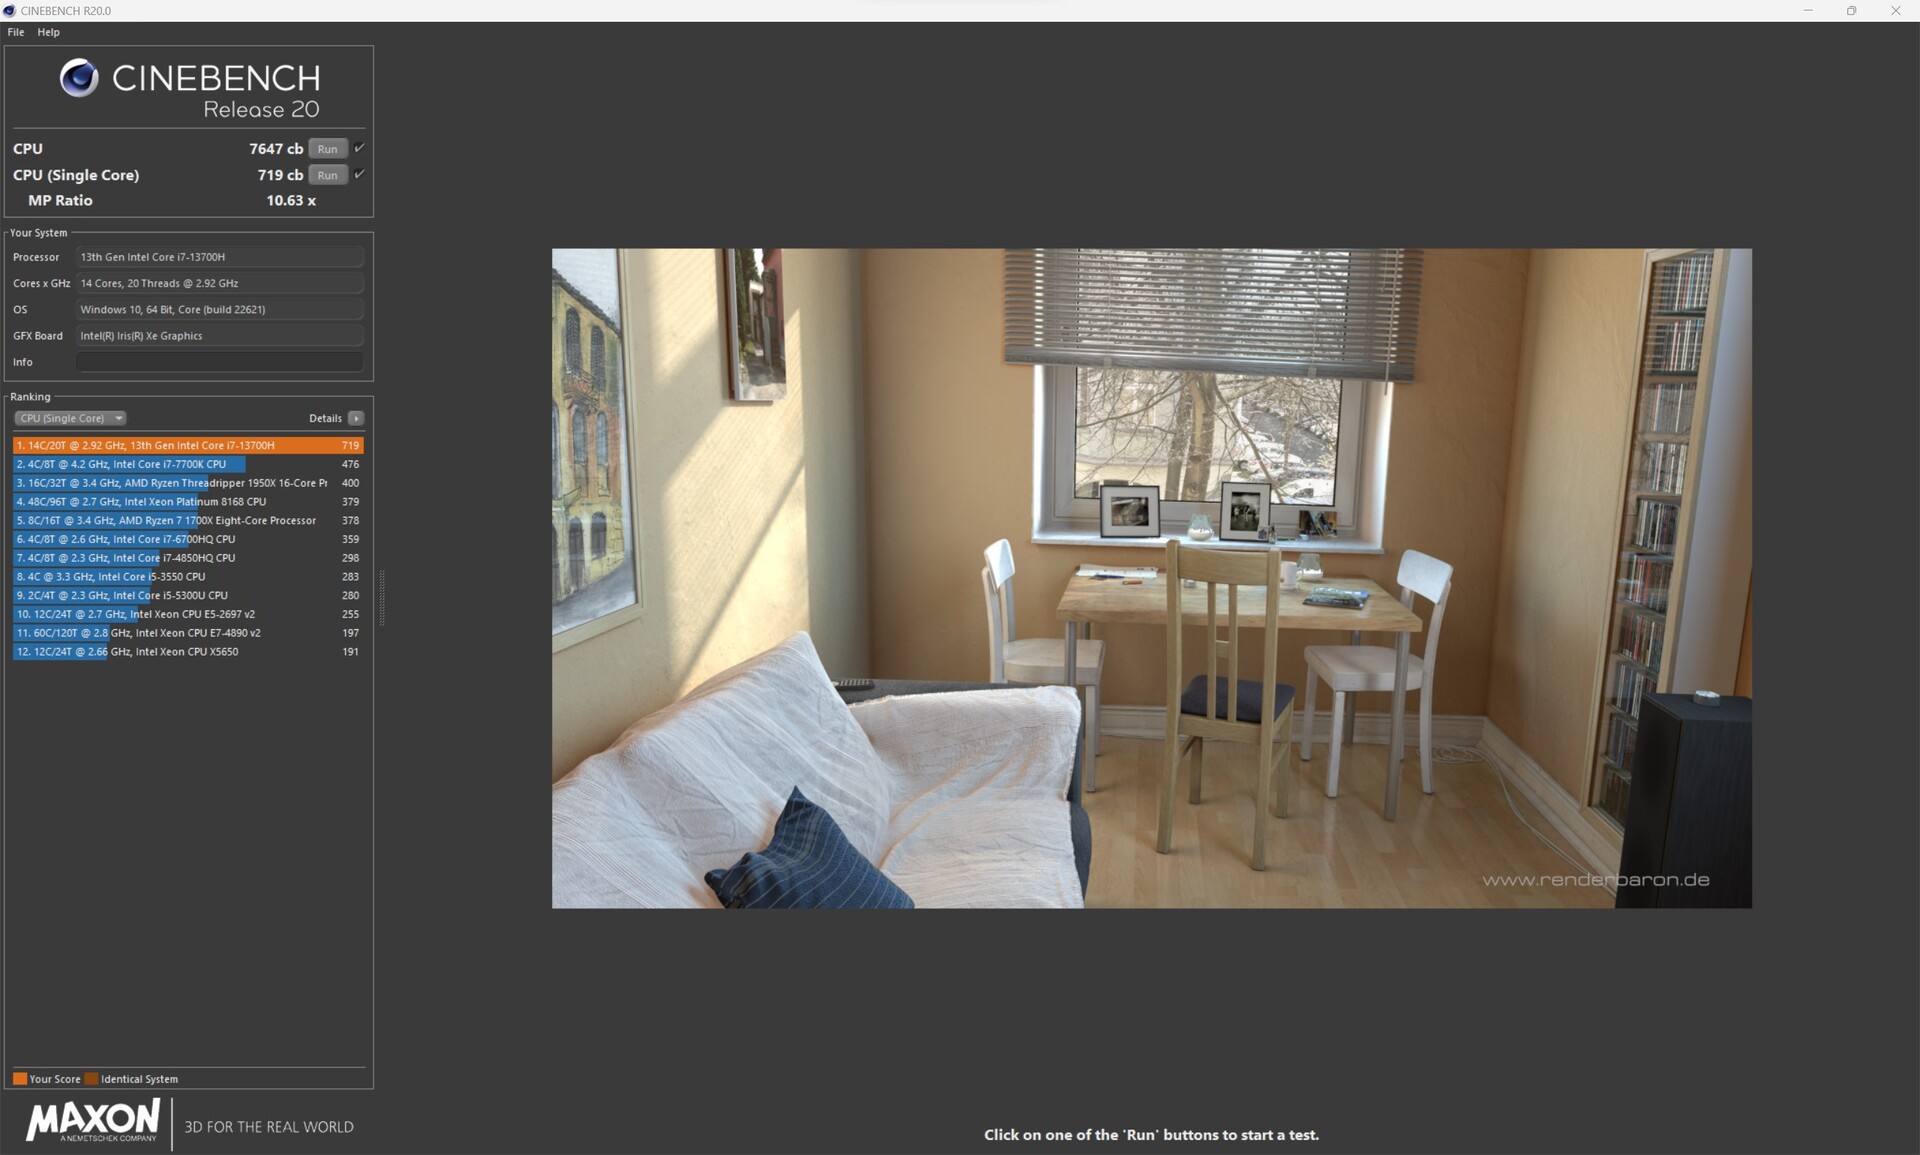
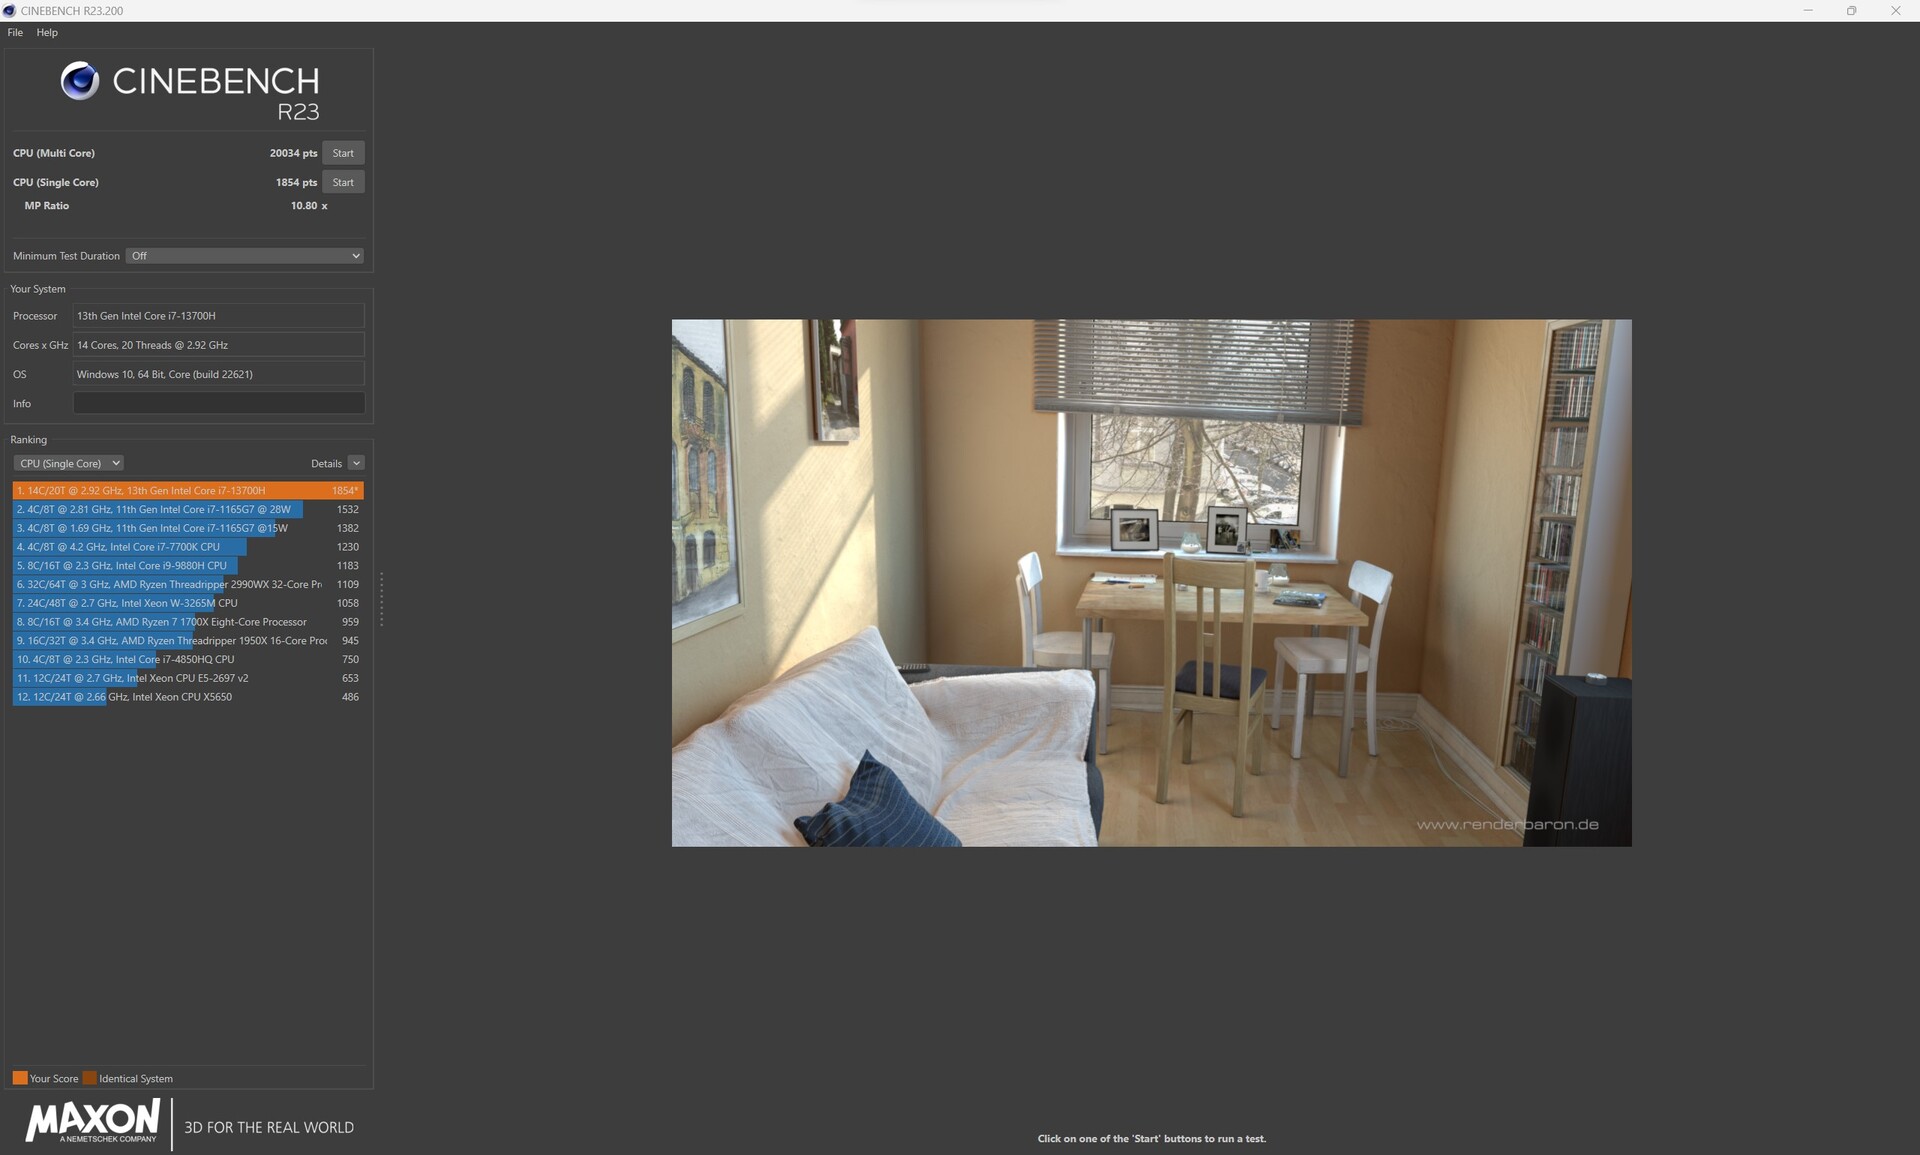
Procesor Intel Core-i7-13700H (Raptor Lake) składa się z ośmiu rdzeni wydajnościowych (bez hiperwątkowości, od 1,8 do 3,7 GHz) i sześciu rdzeni wydajnościowych (hiperwątkowość, od 2,4 do 5,0 GHz). Łącznie daje to 20 logicznych rdzeni CPU. Oparty na Core i7-13700H, MSI Stealth 16 Studio A13VG osiąga dobrą wydajność, która wyprzedza naszą wcześniej udokumentowaną wydajność z Intel Core i7-13700H. Nawet Gigabyte AERO 16, który jest wyposażony w Intel Core i9-13900H, musi ustąpić miejsca naszemu testowemu egzemplarzowi. Medion Erazer Major X20 jest niekwestionowanym liderem stawki. Jednak w porównaniu do Intel Core i9-13900HX, MSI Stealth 16 Studio A13VG jest o około 30 procent mniej wydajny.
Test w pętli Cinebench R15 pokazuje, że na początku doładowanie procesora było stosunkowo dobrze utrzymane, ale po 11. uruchomieniu SoC nie jest w stanie zapewnić pełnej mocy. Odnotowaliśmy spadek wydajności o około 15 procent w porównaniu do pierwszego uruchomienia.
Cinebench R15 Multi Continuous Test
Cinebench R23: Multi Core | Single Core
Cinebench R20: CPU (Multi Core) | CPU (Single Core)
Cinebench R15: CPU Multi 64Bit | CPU Single 64Bit
Blender: v2.79 BMW27 CPU
7-Zip 18.03: 7z b 4 | 7z b 4 -mmt1
Geekbench 5.5: Multi-Core | Single-Core
HWBOT x265 Benchmark v2.2: 4k Preset
LibreOffice : 20 Documents To PDF
R Benchmark 2.5: Overall mean
| CPU Performance rating | |
| Medion Erazer Major X20 | |
| Średnia w klasie Gaming | |
| Asus ROG Flow X16 GV601V | |
| MSI Stealth 16 Studio A13VG | |
| Gigabyte AERO 16 OLED BSF | |
| Przeciętny Intel Core i7-13700H | |
| Acer Nitro 16 AN16-41 | |
| Corsair Voyager a1600 | |
| Cinebench R23 / Multi Core | |
| Medion Erazer Major X20 | |
| Średnia w klasie Gaming (10488 - 42661, n=107, ostatnie 2 lata) | |
| MSI Stealth 16 Studio A13VG | |
| Asus ROG Flow X16 GV601V | |
| Gigabyte AERO 16 OLED BSF | |
| Przeciętny Intel Core i7-13700H (5890 - 20034, n=29) | |
| Acer Nitro 16 AN16-41 | |
| Corsair Voyager a1600 | |
| Cinebench R23 / Single Core | |
| Medion Erazer Major X20 | |
| Asus ROG Flow X16 GV601V | |
| Średnia w klasie Gaming (1166 - 2415, n=107, ostatnie 2 lata) | |
| MSI Stealth 16 Studio A13VG | |
| Przeciętny Intel Core i7-13700H (1323 - 1914, n=29) | |
| Gigabyte AERO 16 OLED BSF | |
| Corsair Voyager a1600 | |
| Acer Nitro 16 AN16-41 | |
| Cinebench R20 / CPU (Multi Core) | |
| Medion Erazer Major X20 | |
| Średnia w klasie Gaming (4029 - 16433, n=106, ostatnie 2 lata) | |
| MSI Stealth 16 Studio A13VG | |
| Asus ROG Flow X16 GV601V | |
| Gigabyte AERO 16 OLED BSF | |
| Przeciętny Intel Core i7-13700H (2322 - 7674, n=29) | |
| Acer Nitro 16 AN16-41 | |
| Corsair Voyager a1600 | |
| Cinebench R20 / CPU (Single Core) | |
| Średnia w klasie Gaming (442 - 913, n=106, ostatnie 2 lata) | |
| Medion Erazer Major X20 | |
| Asus ROG Flow X16 GV601V | |
| MSI Stealth 16 Studio A13VG | |
| Przeciętny Intel Core i7-13700H (508 - 741, n=29) | |
| Gigabyte AERO 16 OLED BSF | |
| Acer Nitro 16 AN16-41 | |
| Corsair Voyager a1600 | |
| Cinebench R15 / CPU Multi 64Bit | |
| Medion Erazer Major X20 | |
| Średnia w klasie Gaming (1578 - 6330, n=105, ostatnie 2 lata) | |
| Asus ROG Flow X16 GV601V | |
| Gigabyte AERO 16 OLED BSF | |
| MSI Stealth 16 Studio A13VG | |
| Przeciętny Intel Core i7-13700H (905 - 2982, n=29) | |
| Acer Nitro 16 AN16-41 | |
| Corsair Voyager a1600 | |
| Cinebench R15 / CPU Single 64Bit | |
| Medion Erazer Major X20 | |
| Średnia w klasie Gaming (188.8 - 350, n=106, ostatnie 2 lata) | |
| Asus ROG Flow X16 GV601V | |
| MSI Stealth 16 Studio A13VG | |
| Przeciętny Intel Core i7-13700H (213 - 278, n=29) | |
| Acer Nitro 16 AN16-41 | |
| Corsair Voyager a1600 | |
| Gigabyte AERO 16 OLED BSF | |
| Blender / v2.79 BMW27 CPU | |
| Przeciętny Intel Core i7-13700H (169 - 555, n=29) | |
| Corsair Voyager a1600 | |
| Acer Nitro 16 AN16-41 | |
| Asus ROG Flow X16 GV601V | |
| Gigabyte AERO 16 OLED BSF | |
| MSI Stealth 16 Studio A13VG | |
| Średnia w klasie Gaming (79 - 330, n=104, ostatnie 2 lata) | |
| Medion Erazer Major X20 | |
| 7-Zip 18.03 / 7z b 4 | |
| Medion Erazer Major X20 | |
| Średnia w klasie Gaming (33491 - 148086, n=105, ostatnie 2 lata) | |
| MSI Stealth 16 Studio A13VG | |
| Gigabyte AERO 16 OLED BSF | |
| Asus ROG Flow X16 GV601V | |
| Corsair Voyager a1600 | |
| Acer Nitro 16 AN16-41 | |
| Przeciętny Intel Core i7-13700H (27322 - 76344, n=29) | |
| 7-Zip 18.03 / 7z b 4 -mmt1 | |
| Medion Erazer Major X20 | |
| Średnia w klasie Gaming (4199 - 7436, n=105, ostatnie 2 lata) | |
| Asus ROG Flow X16 GV601V | |
| MSI Stealth 16 Studio A13VG | |
| Przeciętny Intel Core i7-13700H (4825 - 6238, n=29) | |
| Corsair Voyager a1600 | |
| Acer Nitro 16 AN16-41 | |
| Gigabyte AERO 16 OLED BSF | |
| Geekbench 5.5 / Multi-Core | |
| Medion Erazer Major X20 | |
| Średnia w klasie Gaming (6460 - 28263, n=105, ostatnie 2 lata) | |
| Asus ROG Flow X16 GV601V | |
| Gigabyte AERO 16 OLED BSF | |
| MSI Stealth 16 Studio A13VG | |
| Przeciętny Intel Core i7-13700H (6165 - 14215, n=29) | |
| Corsair Voyager a1600 | |
| Acer Nitro 16 AN16-41 | |
| Geekbench 5.5 / Single-Core | |
| Średnia w klasie Gaming (986 - 2474, n=105, ostatnie 2 lata) | |
| Medion Erazer Major X20 | |
| Asus ROG Flow X16 GV601V | |
| MSI Stealth 16 Studio A13VG | |
| Przeciętny Intel Core i7-13700H (1362 - 1919, n=29) | |
| Gigabyte AERO 16 OLED BSF | |
| Acer Nitro 16 AN16-41 | |
| Corsair Voyager a1600 | |
| HWBOT x265 Benchmark v2.2 / 4k Preset | |
| Medion Erazer Major X20 | |
| Średnia w klasie Gaming (11.5 - 44.4, n=105, ostatnie 2 lata) | |
| Asus ROG Flow X16 GV601V | |
| Gigabyte AERO 16 OLED BSF | |
| MSI Stealth 16 Studio A13VG | |
| Acer Nitro 16 AN16-41 | |
| Corsair Voyager a1600 | |
| Przeciętny Intel Core i7-13700H (6.72 - 21.2, n=29) | |
| LibreOffice / 20 Documents To PDF | |
| Gigabyte AERO 16 OLED BSF | |
| Corsair Voyager a1600 | |
| MSI Stealth 16 Studio A13VG | |
| Acer Nitro 16 AN16-41 | |
| Średnia w klasie Gaming (33.2 - 88.8, n=105, ostatnie 2 lata) | |
| Przeciętny Intel Core i7-13700H (31.3 - 62.4, n=29) | |
| Medion Erazer Major X20 | |
| Asus ROG Flow X16 GV601V | |
| R Benchmark 2.5 / Overall mean | |
| Acer Nitro 16 AN16-41 | |
| Gigabyte AERO 16 OLED BSF | |
| Corsair Voyager a1600 | |
| Przeciętny Intel Core i7-13700H (0.4308 - 0.607, n=29) | |
| MSI Stealth 16 Studio A13VG | |
| Średnia w klasie Gaming (0.3439 - 0.759, n=106, ostatnie 2 lata) | |
| Asus ROG Flow X16 GV601V | |
| Medion Erazer Major X20 | |
* ... im mniej tym lepiej
AIDA64: FP32 Ray-Trace | FPU Julia | CPU SHA3 | CPU Queen | FPU SinJulia | FPU Mandel | CPU AES | CPU ZLib | FP64 Ray-Trace | CPU PhotoWorxx
| Performance rating | |
| Średnia w klasie Gaming | |
| Medion Erazer Major X20 | |
| Gigabyte AERO 16 OLED BSF | |
| Corsair Voyager a1600 | |
| MSI Stealth 16 Studio A13VG | |
| Asus ROG Flow X16 GV601V | |
| Acer Nitro 16 AN16-41 | |
| Przeciętny Intel Core i7-13700H | |
| AIDA64 / FP32 Ray-Trace | |
| Średnia w klasie Gaming (10227 - 85542, n=105, ostatnie 2 lata) | |
| Medion Erazer Major X20 | |
| Gigabyte AERO 16 OLED BSF | |
| MSI Stealth 16 Studio A13VG | |
| Acer Nitro 16 AN16-41 | |
| Corsair Voyager a1600 | |
| Przeciętny Intel Core i7-13700H (4986 - 18908, n=29) | |
| Asus ROG Flow X16 GV601V | |
| AIDA64 / FPU Julia | |
| Średnia w klasie Gaming (51376 - 238426, n=105, ostatnie 2 lata) | |
| Medion Erazer Major X20 | |
| Acer Nitro 16 AN16-41 | |
| Corsair Voyager a1600 | |
| Gigabyte AERO 16 OLED BSF | |
| Asus ROG Flow X16 GV601V | |
| MSI Stealth 16 Studio A13VG | |
| Przeciętny Intel Core i7-13700H (25360 - 92359, n=29) | |
| AIDA64 / CPU SHA3 | |
| Średnia w klasie Gaming (2180 - 10115, n=105, ostatnie 2 lata) | |
| Medion Erazer Major X20 | |
| Asus ROG Flow X16 GV601V | |
| Gigabyte AERO 16 OLED BSF | |
| MSI Stealth 16 Studio A13VG | |
| Acer Nitro 16 AN16-41 | |
| Corsair Voyager a1600 | |
| Przeciętny Intel Core i7-13700H (1339 - 4224, n=29) | |
| AIDA64 / CPU Queen | |
| Medion Erazer Major X20 | |
| Średnia w klasie Gaming (49785 - 173351, n=90, ostatnie 2 lata) | |
| Asus ROG Flow X16 GV601V | |
| Acer Nitro 16 AN16-41 | |
| MSI Stealth 16 Studio A13VG | |
| Corsair Voyager a1600 | |
| Przeciętny Intel Core i7-13700H (59324 - 107159, n=29) | |
| Gigabyte AERO 16 OLED BSF | |
| AIDA64 / FPU SinJulia | |
| Medion Erazer Major X20 | |
| Średnia w klasie Gaming (4424 - 33636, n=105, ostatnie 2 lata) | |
| Acer Nitro 16 AN16-41 | |
| Corsair Voyager a1600 | |
| Asus ROG Flow X16 GV601V | |
| MSI Stealth 16 Studio A13VG | |
| Gigabyte AERO 16 OLED BSF | |
| Przeciętny Intel Core i7-13700H (4800 - 11050, n=29) | |
| AIDA64 / FPU Mandel | |
| Średnia w klasie Gaming (25115 - 128721, n=105, ostatnie 2 lata) | |
| Medion Erazer Major X20 | |
| Acer Nitro 16 AN16-41 | |
| Corsair Voyager a1600 | |
| Gigabyte AERO 16 OLED BSF | |
| MSI Stealth 16 Studio A13VG | |
| Asus ROG Flow X16 GV601V | |
| Przeciętny Intel Core i7-13700H (12321 - 45118, n=29) | |
| AIDA64 / CPU AES | |
| Gigabyte AERO 16 OLED BSF | |
| Corsair Voyager a1600 | |
| Medion Erazer Major X20 | |
| Średnia w klasie Gaming (39258 - 247074, n=105, ostatnie 2 lata) | |
| Asus ROG Flow X16 GV601V | |
| MSI Stealth 16 Studio A13VG | |
| Przeciętny Intel Core i7-13700H (28769 - 151254, n=29) | |
| Acer Nitro 16 AN16-41 | |
| AIDA64 / CPU ZLib | |
| Medion Erazer Major X20 | |
| Średnia w klasie Gaming (574 - 2531, n=105, ostatnie 2 lata) | |
| Asus ROG Flow X16 GV601V | |
| Gigabyte AERO 16 OLED BSF | |
| MSI Stealth 16 Studio A13VG | |
| Przeciętny Intel Core i7-13700H (389 - 1215, n=29) | |
| Acer Nitro 16 AN16-41 | |
| Corsair Voyager a1600 | |
| AIDA64 / FP64 Ray-Trace | |
| Średnia w klasie Gaming (5509 - 45446, n=105, ostatnie 2 lata) | |
| Medion Erazer Major X20 | |
| Gigabyte AERO 16 OLED BSF | |
| Asus ROG Flow X16 GV601V | |
| MSI Stealth 16 Studio A13VG | |
| Acer Nitro 16 AN16-41 | |
| Corsair Voyager a1600 | |
| Przeciętny Intel Core i7-13700H (2540 - 10135, n=29) | |
| AIDA64 / CPU PhotoWorxx | |
| MSI Stealth 16 Studio A13VG | |
| Średnia w klasie Gaming (12271 - 89891, n=105, ostatnie 2 lata) | |
| Gigabyte AERO 16 OLED BSF | |
| Medion Erazer Major X20 | |
| Przeciętny Intel Core i7-13700H (12872 - 52727, n=29) | |
| Asus ROG Flow X16 GV601V | |
| Corsair Voyager a1600 | |
| Acer Nitro 16 AN16-41 | |
Wydajność systemu
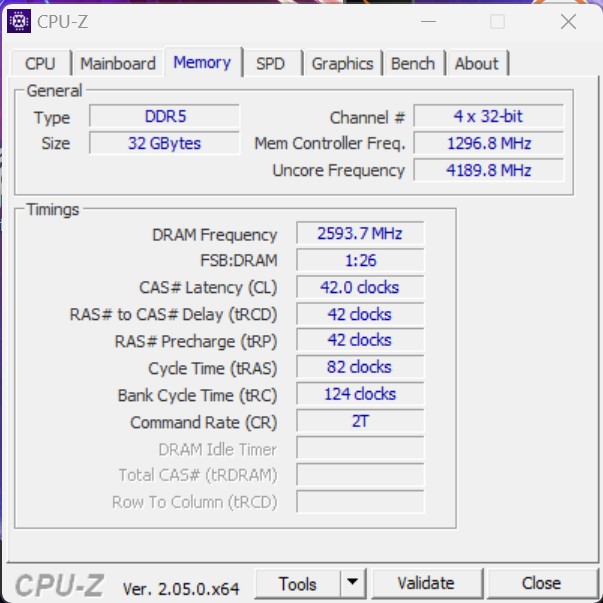
pod względem wydajności systemu, MSI Stealth 16 Studio A13VG zapewnił sobie miejsce w połowie tabeli w naszych testach porównawczych. Przy odpowiednio sześciu i dziewięciu procentach, różnica do pierwszego miejsca jest stosunkowo niewielka. Jednak wydajność systemu jest doskonała i jest powyżej średniej dla laptopów do gier wydanych w ciągu ostatnich dwóch lat. Jeśli chodzi o testy porównawcze AIDA64, MSI Stealth 16 Studio A13VG zapewnia niezmiennie bezbłędne wyniki dzięki szybkiej pamięci RAM DDR5, a nasze recenzowane urządzenie zdołało nawet zająć pierwsze miejsce.
CrossMark: Overall | Productivity | Creativity | Responsiveness
| PCMark 10 / Score | |
| Średnia w klasie Gaming (5828 - 12414, n=93, ostatnie 2 lata) | |
| Gigabyte AERO 16 OLED BSF | |
| Asus ROG Flow X16 GV601V | |
| Medion Erazer Major X20 | |
| Przeciętny Intel Core i7-13700H, NVIDIA GeForce RTX 4070 Laptop GPU (7158 - 7956, n=8) | |
| MSI Stealth 16 Studio A13VG | |
| Acer Nitro 16 AN16-41 | |
| Corsair Voyager a1600 | |
| PCMark 10 / Essentials | |
| Medion Erazer Major X20 | |
| Asus ROG Flow X16 GV601V | |
| Gigabyte AERO 16 OLED BSF | |
| Przeciętny Intel Core i7-13700H, NVIDIA GeForce RTX 4070 Laptop GPU (10252 - 11449, n=8) | |
| Średnia w klasie Gaming (8810 - 11935, n=97, ostatnie 2 lata) | |
| Acer Nitro 16 AN16-41 | |
| MSI Stealth 16 Studio A13VG | |
| Corsair Voyager a1600 | |
| PCMark 10 / Productivity | |
| Średnia w klasie Gaming (6845 - 25323, n=95, ostatnie 2 lata) | |
| Asus ROG Flow X16 GV601V | |
| Medion Erazer Major X20 | |
| Przeciętny Intel Core i7-13700H, NVIDIA GeForce RTX 4070 Laptop GPU (8501 - 10769, n=8) | |
| MSI Stealth 16 Studio A13VG | |
| Gigabyte AERO 16 OLED BSF | |
| Acer Nitro 16 AN16-41 | |
| Corsair Voyager a1600 | |
| PCMark 10 / Digital Content Creation | |
| Średnia w klasie Gaming (7602 - 19954, n=95, ostatnie 2 lata) | |
| Gigabyte AERO 16 OLED BSF | |
| Corsair Voyager a1600 | |
| Asus ROG Flow X16 GV601V | |
| Przeciętny Intel Core i7-13700H, NVIDIA GeForce RTX 4070 Laptop GPU (10358 - 12908, n=8) | |
| MSI Stealth 16 Studio A13VG | |
| Acer Nitro 16 AN16-41 | |
| Medion Erazer Major X20 | |
| CrossMark / Overall | |
| Średnia w klasie Gaming (1366 - 2409, n=94, ostatnie 2 lata) | |
| Asus ROG Flow X16 GV601V | |
| Przeciętny Intel Core i7-13700H, NVIDIA GeForce RTX 4070 Laptop GPU (1768 - 2073, n=6) | |
| Gigabyte AERO 16 OLED BSF | |
| Medion Erazer Major X20 | |
| MSI Stealth 16 Studio A13VG | |
| Acer Nitro 16 AN16-41 | |
| Corsair Voyager a1600 | |
| CrossMark / Productivity | |
| Asus ROG Flow X16 GV601V | |
| Średnia w klasie Gaming (1386 - 2254, n=94, ostatnie 2 lata) | |
| Przeciętny Intel Core i7-13700H, NVIDIA GeForce RTX 4070 Laptop GPU (1645 - 2006, n=6) | |
| Gigabyte AERO 16 OLED BSF | |
| MSI Stealth 16 Studio A13VG | |
| Medion Erazer Major X20 | |
| Acer Nitro 16 AN16-41 | |
| Corsair Voyager a1600 | |
| CrossMark / Creativity | |
| Średnia w klasie Gaming (1343 - 2786, n=94, ostatnie 2 lata) | |
| Asus ROG Flow X16 GV601V | |
| Medion Erazer Major X20 | |
| Przeciętny Intel Core i7-13700H, NVIDIA GeForce RTX 4070 Laptop GPU (1936 - 2137, n=6) | |
| Gigabyte AERO 16 OLED BSF | |
| MSI Stealth 16 Studio A13VG | |
| Acer Nitro 16 AN16-41 | |
| Corsair Voyager a1600 | |
| CrossMark / Responsiveness | |
| Gigabyte AERO 16 OLED BSF | |
| Przeciętny Intel Core i7-13700H, NVIDIA GeForce RTX 4070 Laptop GPU (1451 - 2202, n=6) | |
| Średnia w klasie Gaming (1226 - 2334, n=94, ostatnie 2 lata) | |
| Asus ROG Flow X16 GV601V | |
| MSI Stealth 16 Studio A13VG | |
| Medion Erazer Major X20 | |
| Acer Nitro 16 AN16-41 | |
| Corsair Voyager a1600 | |
| PCMark 10 Score | 7329 pkt. | |
Pomoc | ||
| AIDA64 / Memory Copy | |
| Średnia w klasie Gaming (21750 - 129946, n=105, ostatnie 2 lata) | |
| MSI Stealth 16 Studio A13VG | |
| Medion Erazer Major X20 | |
| Gigabyte AERO 16 OLED BSF | |
| Przeciętny Intel Core i7-13700H (24334 - 78081, n=29) | |
| Asus ROG Flow X16 GV601V | |
| Corsair Voyager a1600 | |
| Acer Nitro 16 AN16-41 | |
| AIDA64 / Memory Read | |
| Średnia w klasie Gaming (22956 - 118858, n=105, ostatnie 2 lata) | |
| Medion Erazer Major X20 | |
| MSI Stealth 16 Studio A13VG | |
| Gigabyte AERO 16 OLED BSF | |
| Asus ROG Flow X16 GV601V | |
| Przeciętny Intel Core i7-13700H (23681 - 79656, n=29) | |
| Corsair Voyager a1600 | |
| Acer Nitro 16 AN16-41 | |
| AIDA64 / Memory Write | |
| Średnia w klasie Gaming (22297 - 135096, n=105, ostatnie 2 lata) | |
| MSI Stealth 16 Studio A13VG | |
| Gigabyte AERO 16 OLED BSF | |
| Przeciętny Intel Core i7-13700H (22986 - 99898, n=29) | |
| Medion Erazer Major X20 | |
| Asus ROG Flow X16 GV601V | |
| Corsair Voyager a1600 | |
| Acer Nitro 16 AN16-41 | |
| AIDA64 / Memory Latency | |
| Średnia w klasie Gaming (75.3 - 259, n=105, ostatnie 2 lata) | |
| Corsair Voyager a1600 | |
| Gigabyte AERO 16 OLED BSF | |
| Przeciętny Intel Core i7-13700H (82.4 - 136.8, n=29) | |
| Acer Nitro 16 AN16-41 | |
| Asus ROG Flow X16 GV601V | |
| Medion Erazer Major X20 | |
| MSI Stealth 16 Studio A13VG | |
* ... im mniej tym lepiej
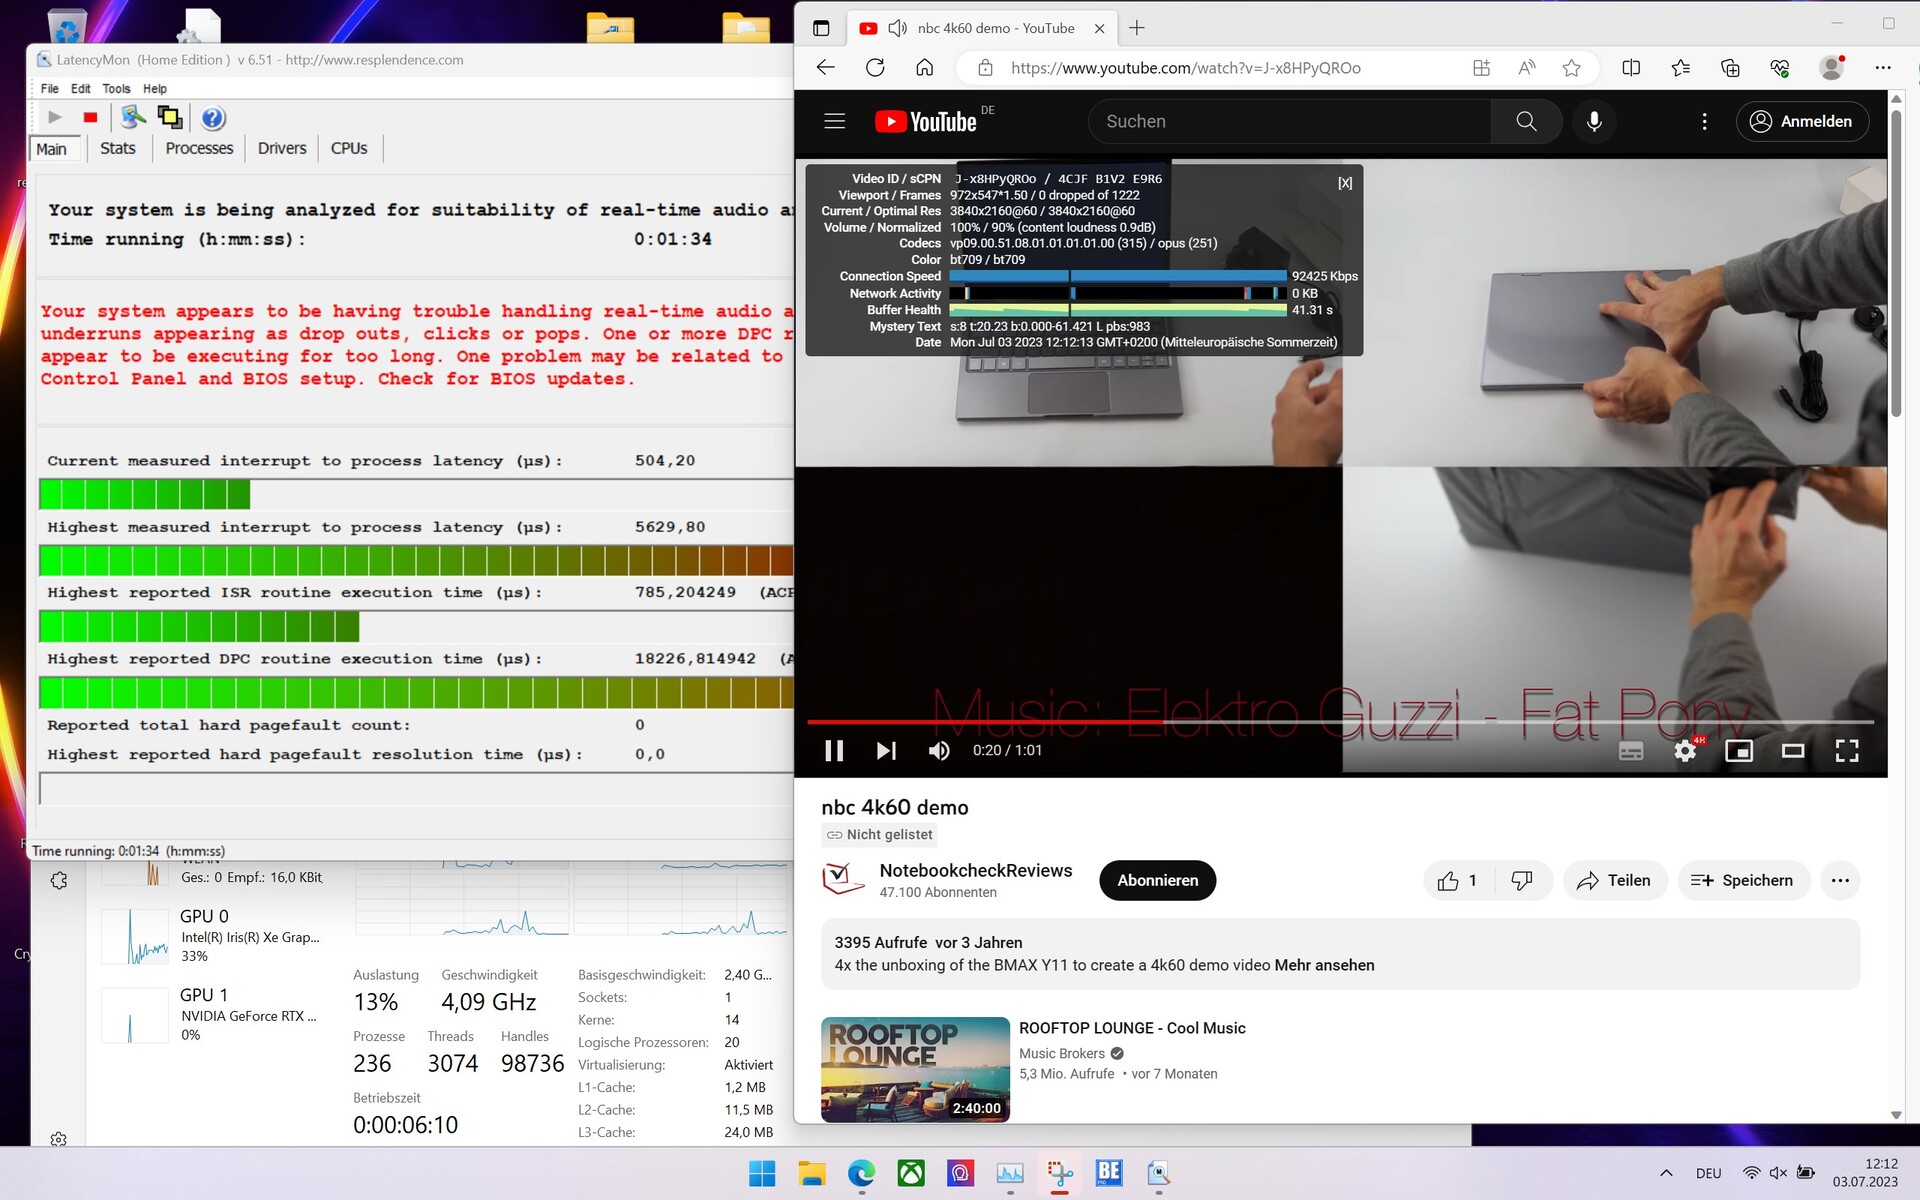
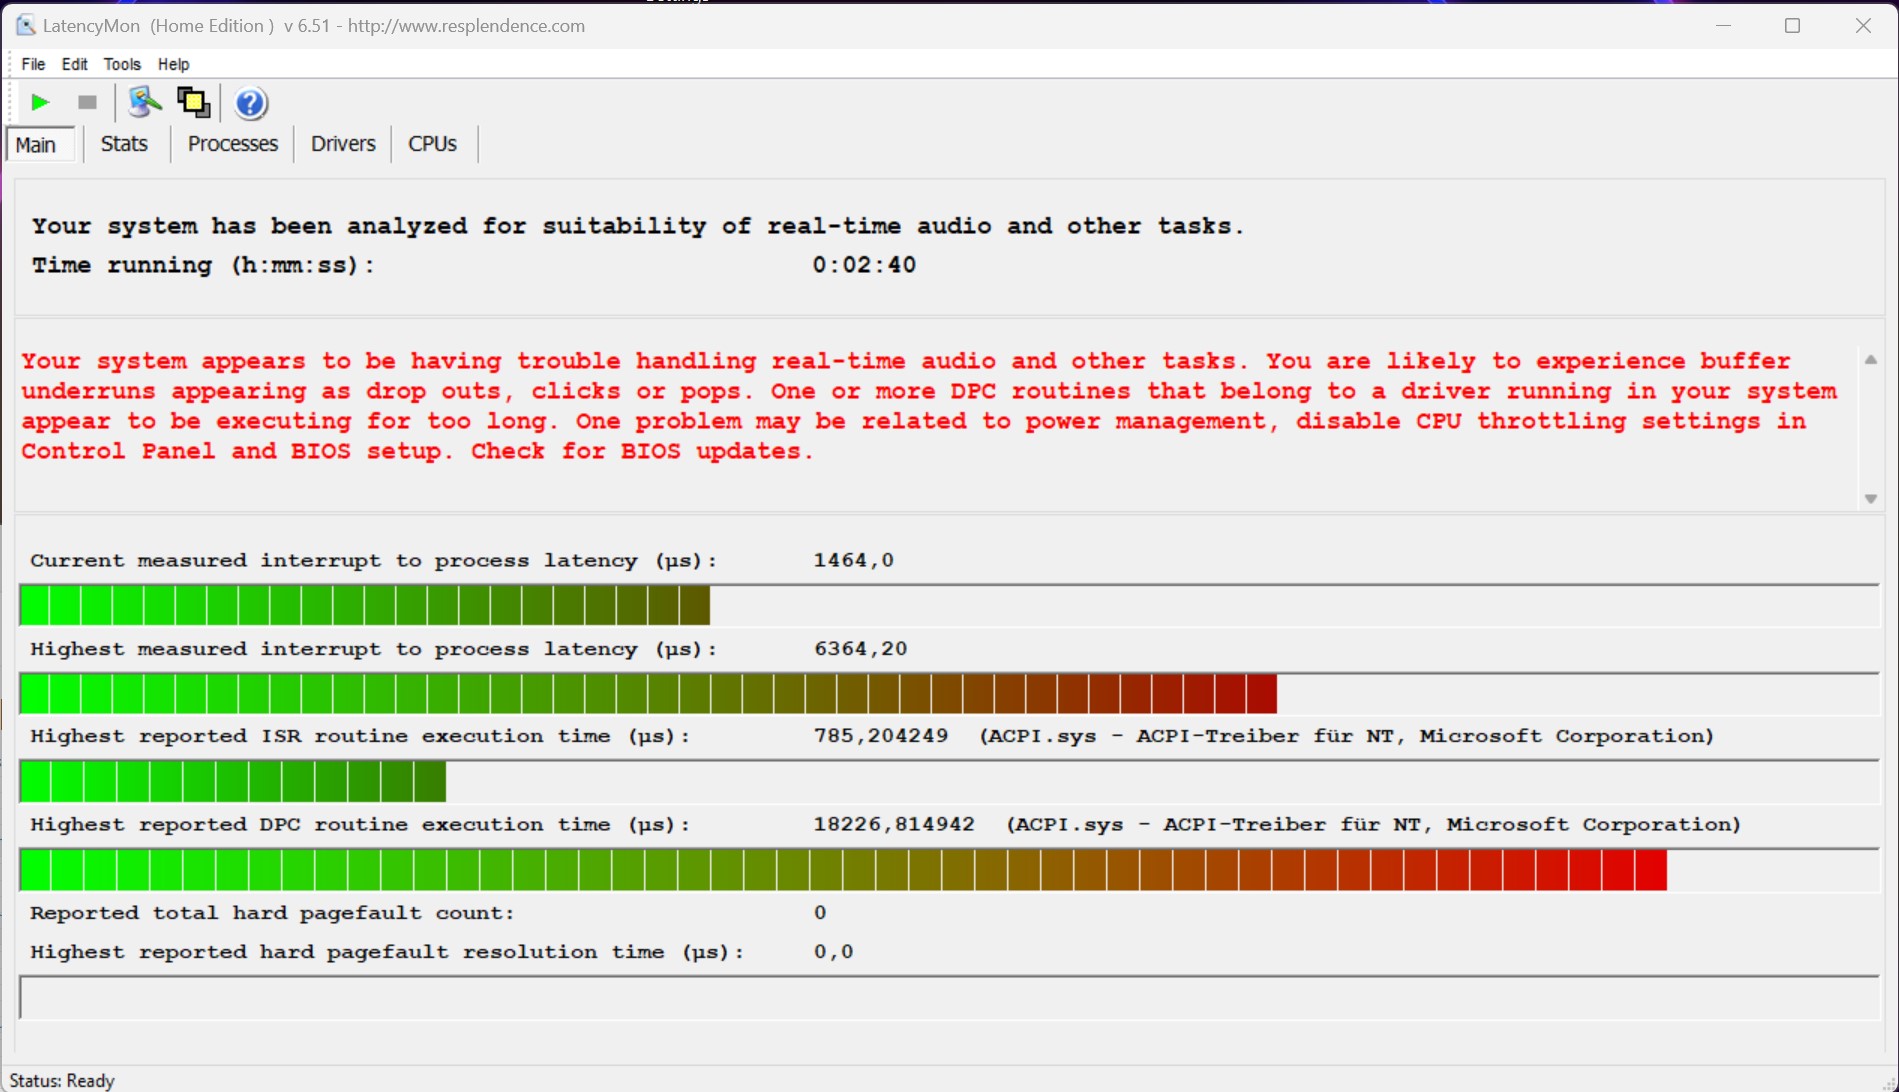
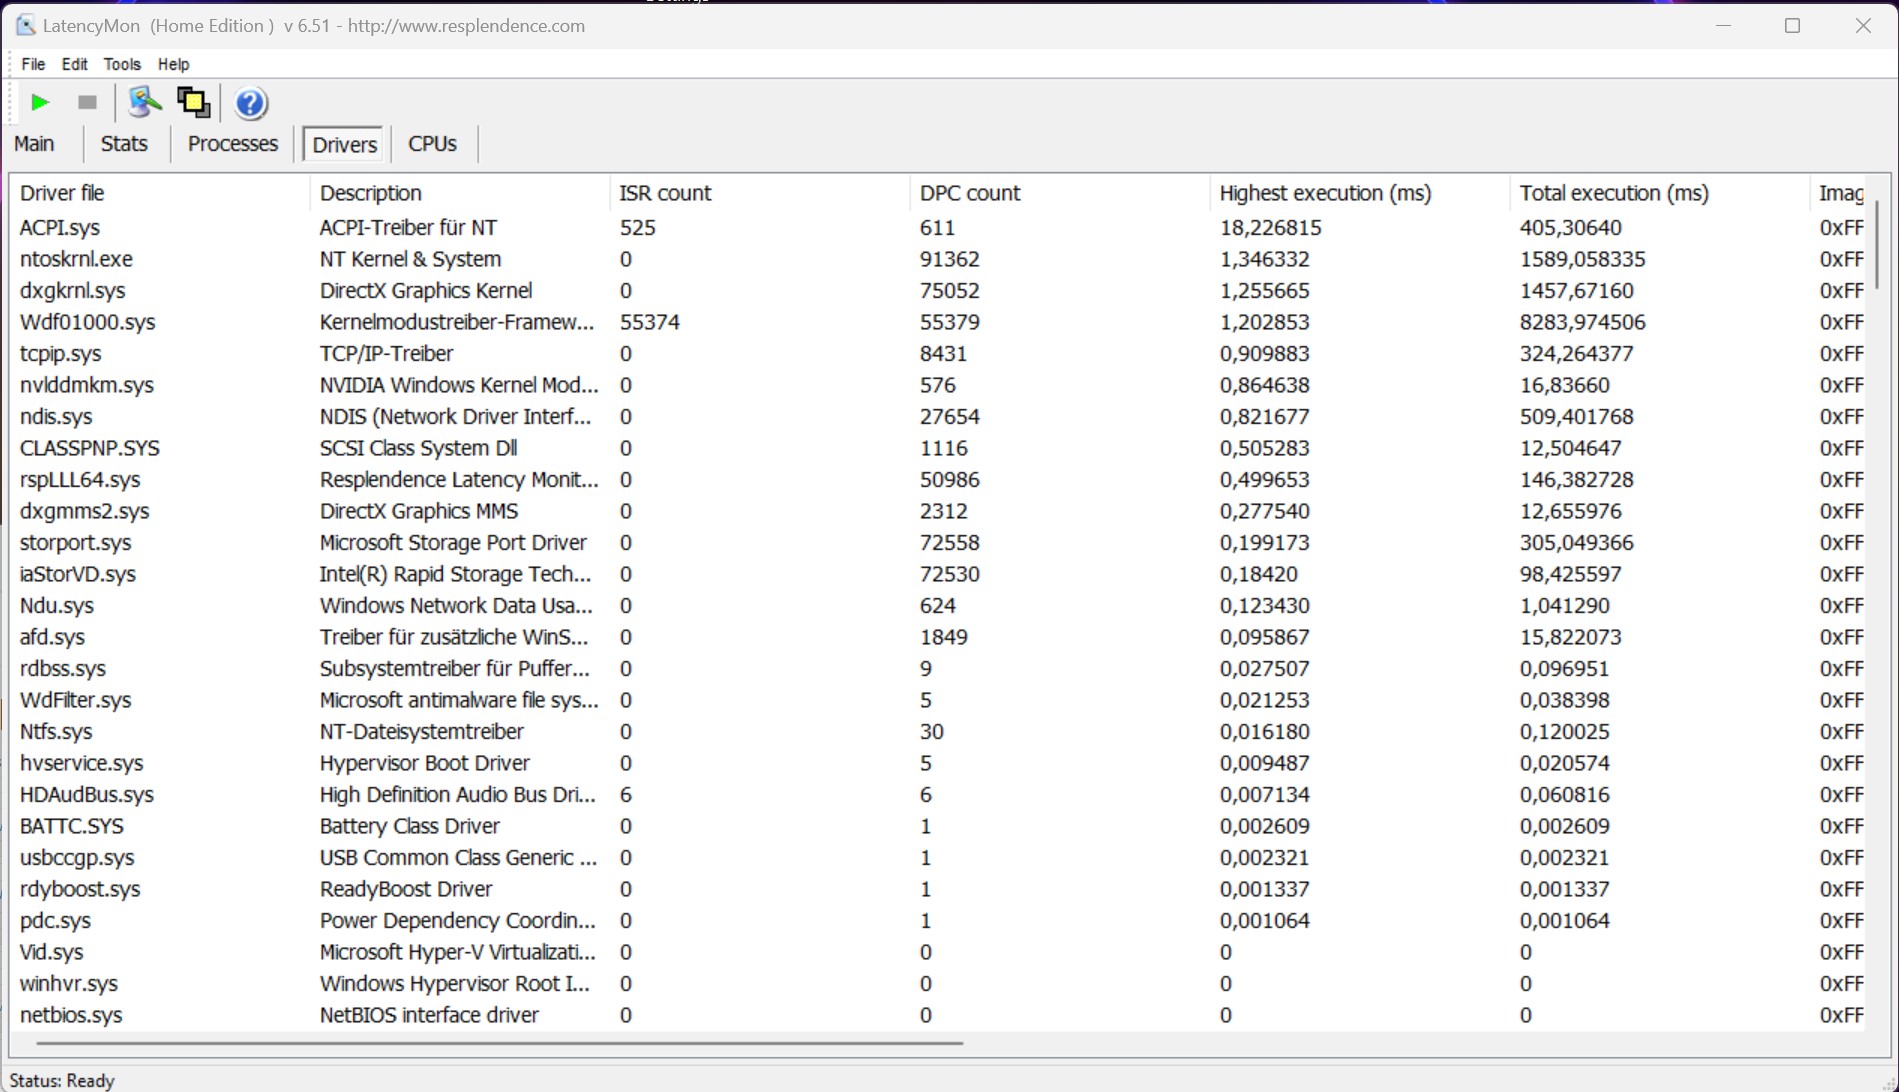
Opóźnienia DPC
Standardowy test MSI Stealth 16 Studio A13VG Latency Monitor (surfowanie po Internecie, odtwarzanie wideo 4K, wysokie obciążenie Prime95) zwrócił ekstremalne wartości. Przyszłe aktualizacje oprogramowania powinny, miejmy nadzieję, zapewnić poprawę, tak aby system można było uznać za w pełni odpowiedni do przetwarzania wideo i audio w czasie rzeczywistym. Warto jednak wspomnieć, że podczas odtwarzania wideo 4K nie wykryto żadnych pominiętych klatek.
| DPC Latencies / LatencyMon - interrupt to process latency (max), Web, Youtube, Prime95 | |
| MSI Stealth 16 Studio A13VG | |
| Medion Erazer Major X20 | |
| Acer Nitro 16 AN16-41 | |
| Asus ROG Flow X16 GV601V | |
| Gigabyte AERO 16 OLED BSF | |
| Corsair Voyager a1600 | |
* ... im mniej tym lepiej
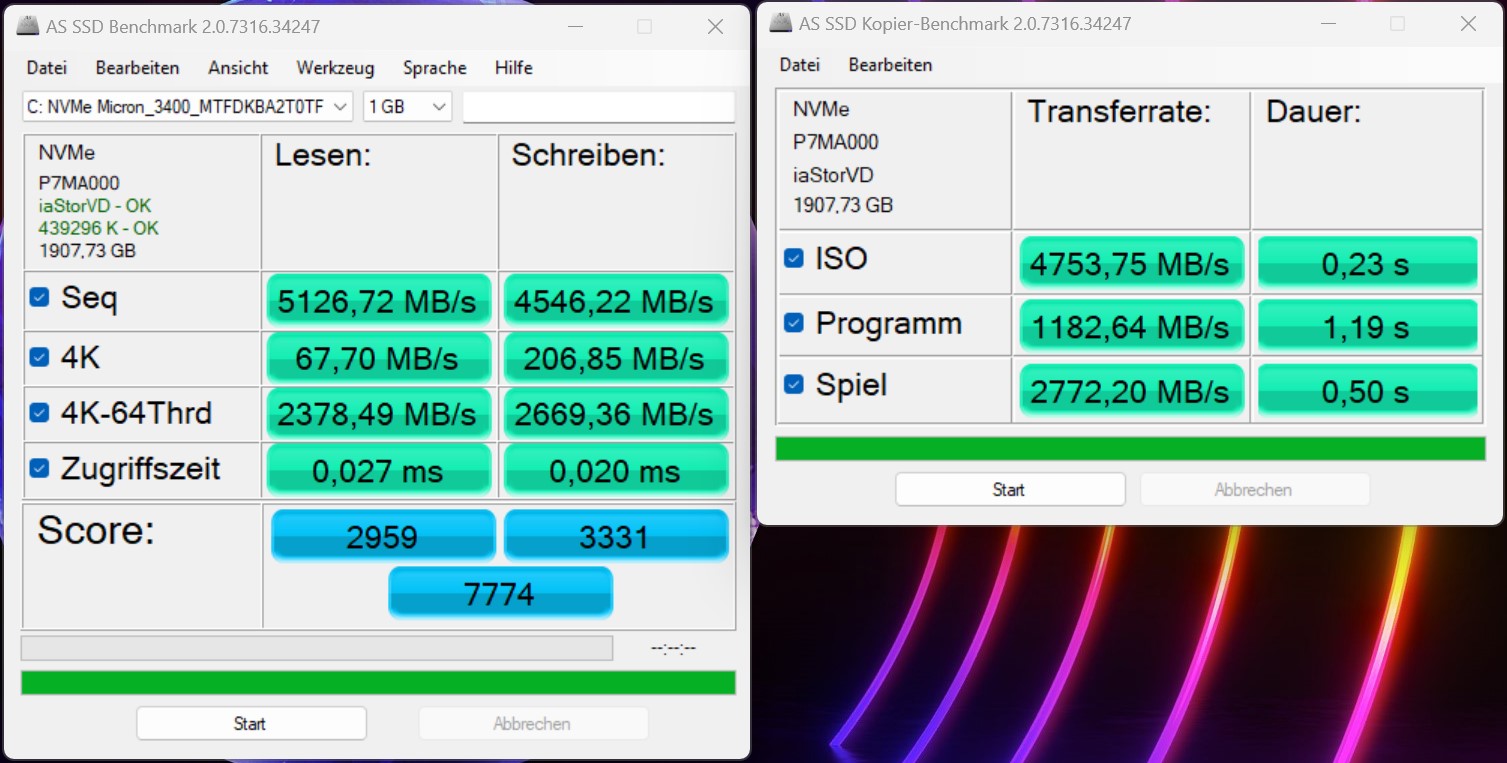
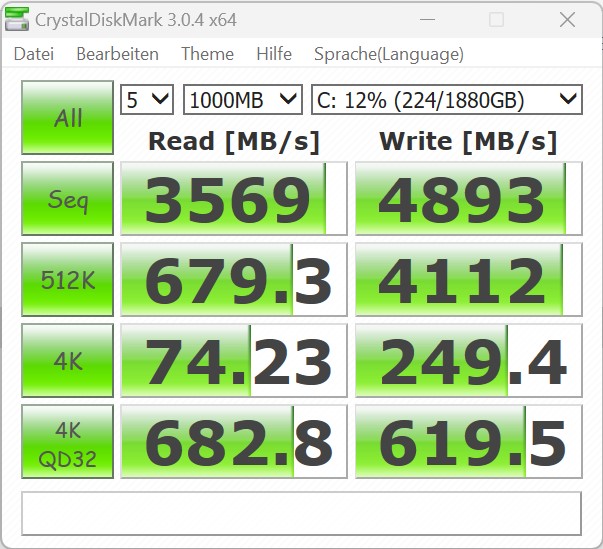
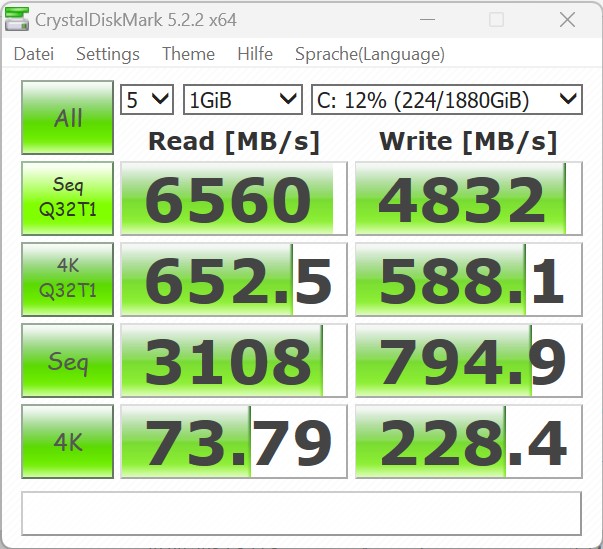
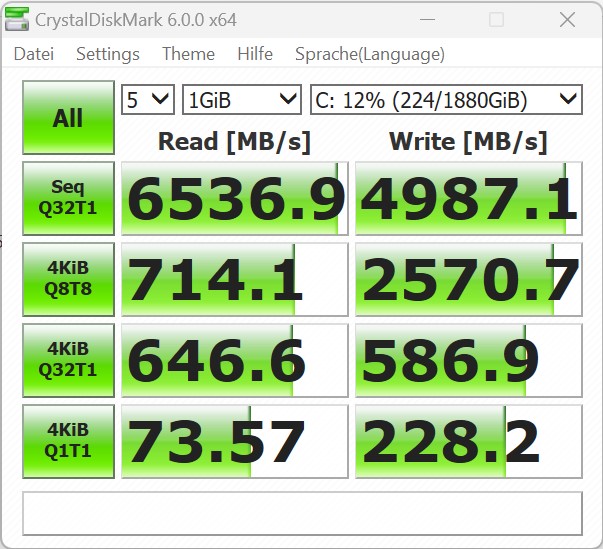
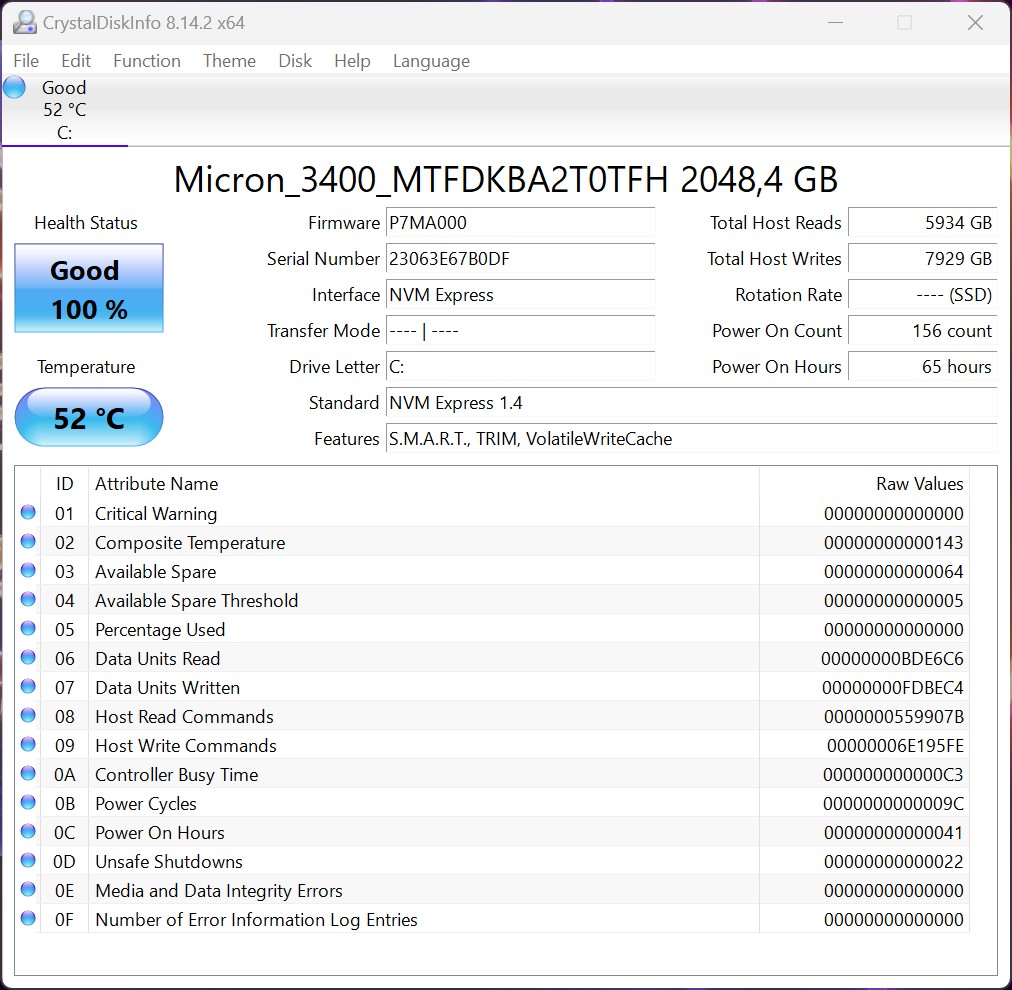
Pamięć masowa
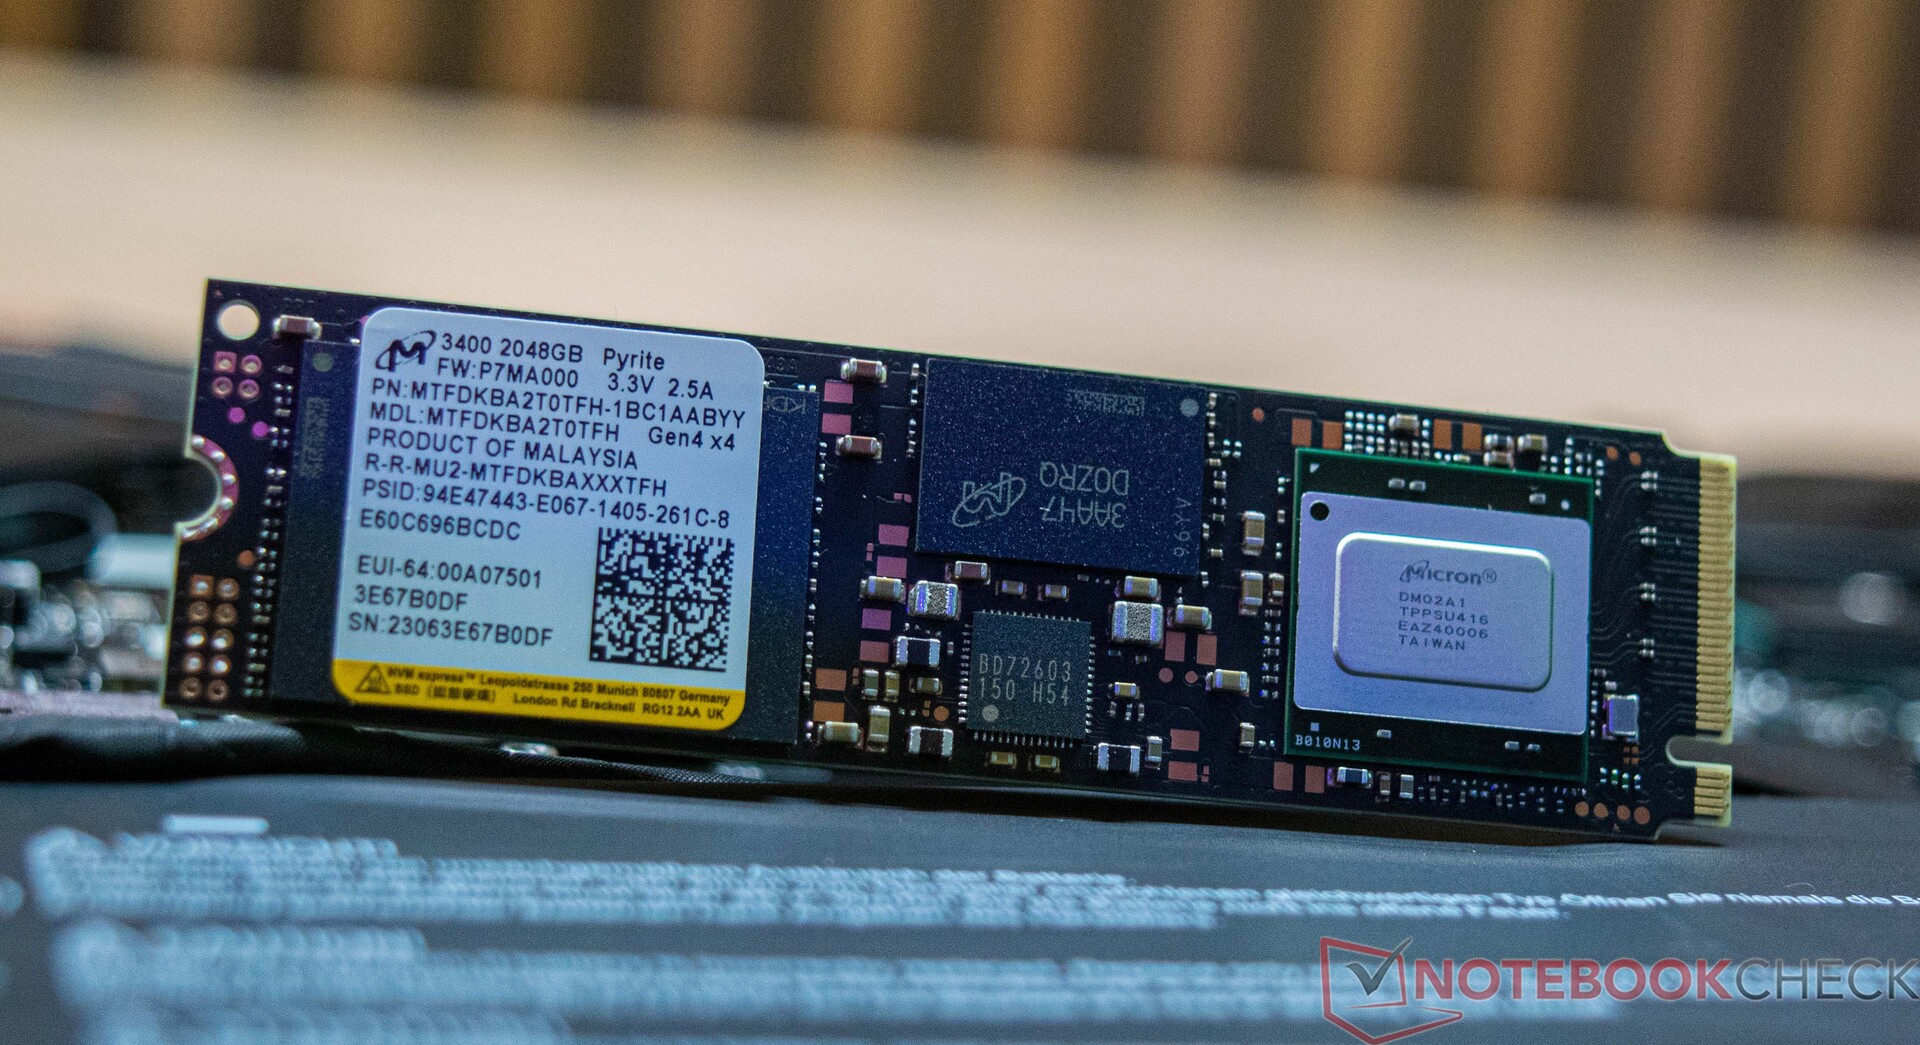
Pamięć masowa MSI Stealth 16 Studio A13VG ma postać dysku SSD firmy Micron. Zainstalowany model o pojemności 2 TB oferuje mnóstwo przestrzeni dyskowej, co stanowi podstawę jego przeznaczenia. W testach dysk SSD zapewnił doskonałe wartości dzięki połączeniu PCIe. Po raz kolejny pomogło to naszemu recenzowanemu urządzeniu zająć pierwsze miejsce. MSI Stealth 16 Studio A13VG miał jednak ciągłe problemy z odczytem i zapisem na i z dysku SSD, a wydajność odczytu znacznie spadła już po krótkim okresie ciągłego obciążenia. DyskAcer Nitro 16był jedynym urządzeniem, na którym zaobserwowaliśmy podobnie duży spadek wydajności. MSI Stealth 16 Studio A13VG może pomieścić łącznie dwa dyski SSD.
Aby uzyskać więcej porównań i testów porównawczych, zapoznaj się z naszą tabelą porównawczą

* ... im mniej tym lepiej
Continuous Performance Read: DiskSpd Read Loop, Queue Depth 8
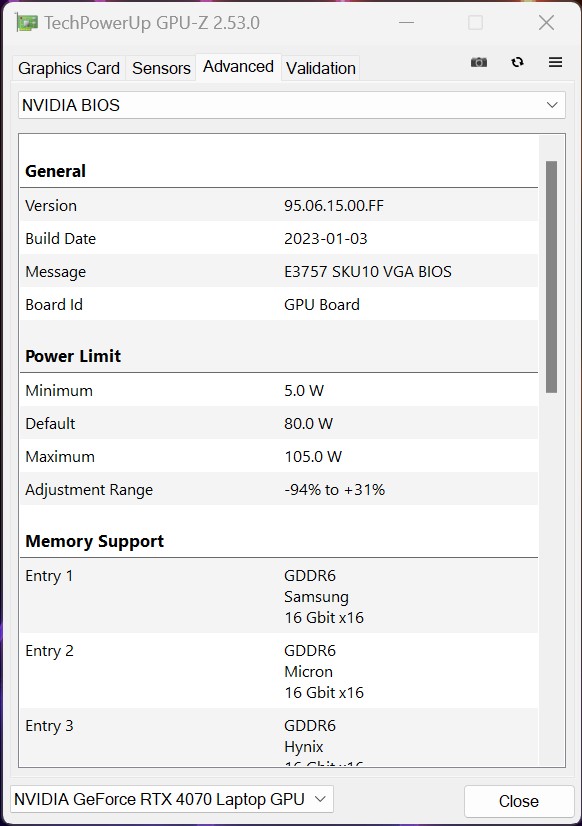
Karta graficzna
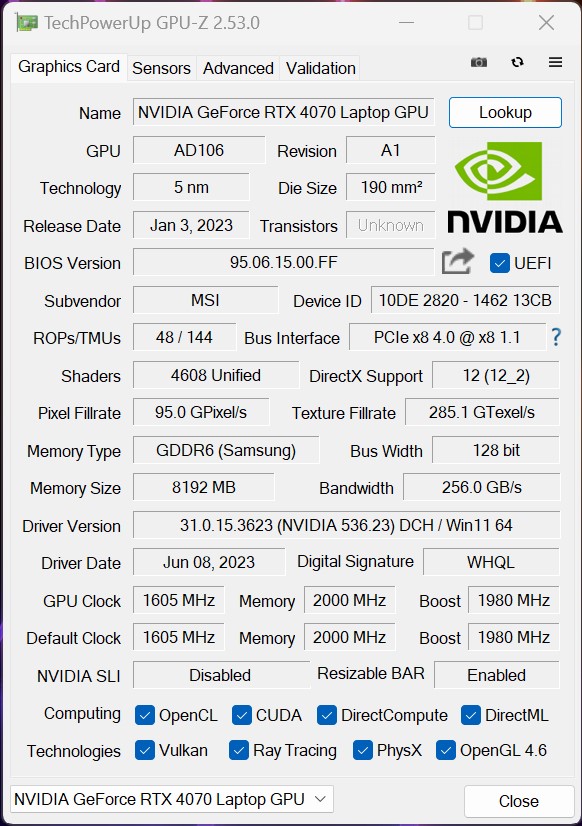
MSI Stealth 16 Studio A13VG bazuje na układzie graficznymNvidia GeForce RTX 4070 laptop GPUktóry ma dostępne TGP do 105 watów. Oznacza to, że karcie graficznej nie przyznano maksymalnego możliwego TGP do 115 watów. Jednak w naszym porównaniu widzieliśmy, że nasza próbka testowa zapewnia dobrą wydajność 3D w testach syntetycznych, a jej ocena wydajności 3DMark była prawie wystarczająca, aby zapewnić sobie pierwsze miejsce.
Dodatkowe testy porównawcze GPU Nvidia GeForce RTX 4070 dla laptopów można znaleźć tutaj.
| 3DMark 05 Standard | 53254 pkt. | |
| 3DMark 06 Standard Score | 63808 pkt. | |
| 3DMark Vantage P Result | 94245 pkt. | |
| 3DMark 11 Performance | 34960 pkt. | |
| 3DMark Ice Storm Standard Score | 94921 pkt. | |
| 3DMark Cloud Gate Standard Score | 63781 pkt. | |
| 3DMark Fire Strike Score | 26244 pkt. | |
| 3DMark Fire Strike Extreme Score | 13736 pkt. | |
| 3DMark Time Spy Score | 11980 pkt. | |
Pomoc | ||
* ... im mniej tym lepiej
Wydajność w grach
Karta graficzna Procesor graficzny do laptopów Nvidia GeForce RTX 4070jest wystarczająco szybki, aby móc płynnie grać w wiele gier i wyświetlać je w natywnej rozdzielczości. Nasze testy wykazały, że Medion Erazer Major X20 zapewnia lepszą wydajność graficzną z tą samą kartą graficzną. W porównaniu do Gigabyte AERO 16, MSI Stealth 16 Studio A13VG wykazywał niemal identyczny poziom wydajności. Co więcej, zauważyliśmy również, że AcerNitro 16który jest również wyposażony wNvidia GeForce RTX 4070 laptop GPUjest wyraźnie gorszy. Nie chcielibyśmy jednak być pozbawieni korzyści płynących z architektury Ada Lovelace, która znajduje się również w mobilnych procesorach graficznych. Oznacza to, że można korzystać z takich funkcji jak DLSS 3 i Frame Generation, o ile same gry obsługują tę technologię. Może to czasami prowadzić do znacznego wzrostu liczby klatek na sekundę.
| Performance rating - Percent | |
| Średnia w klasie Gaming | |
| Medion Erazer Major X20 | |
| Gigabyte AERO 16 OLED BSF | |
| MSI Stealth 16 Studio A13VG | |
| Asus ROG Flow X16 GV601V | |
| Acer Nitro 16 AN16-41 | |
| Corsair Voyager a1600 | |
| The Witcher 3 - 1920x1080 Ultra Graphics & Postprocessing (HBAO+) | |
| Średnia w klasie Gaming (104.7 - 240, n=6, ostatnie 2 lata) | |
| Medion Erazer Major X20 | |
| MSI Stealth 16 Studio A13VG | |
| Gigabyte AERO 16 OLED BSF | |
| Acer Nitro 16 AN16-41 | |
| Corsair Voyager a1600 | |
| Asus ROG Flow X16 GV601V | |
| GTA V - 1920x1080 Highest AA:4xMSAA + FX AF:16x | |
| Średnia w klasie Gaming (48.3 - 186.9, n=93, ostatnie 2 lata) | |
| Medion Erazer Major X20 | |
| Gigabyte AERO 16 OLED BSF | |
| MSI Stealth 16 Studio A13VG | |
| Asus ROG Flow X16 GV601V | |
| Acer Nitro 16 AN16-41 | |
| Corsair Voyager a1600 | |
| Final Fantasy XV Benchmark - 1920x1080 High Quality | |
| Średnia w klasie Gaming (41 - 215, n=95, ostatnie 2 lata) | |
| Medion Erazer Major X20 | |
| Gigabyte AERO 16 OLED BSF | |
| MSI Stealth 16 Studio A13VG | |
| Acer Nitro 16 AN16-41 | |
| Asus ROG Flow X16 GV601V | |
| Corsair Voyager a1600 | |
| Strange Brigade - 1920x1080 ultra AA:ultra AF:16 | |
| Średnia w klasie Gaming (76.3 - 456, n=86, ostatnie 2 lata) | |
| Medion Erazer Major X20 | |
| Corsair Voyager a1600 | |
| Gigabyte AERO 16 OLED BSF | |
| MSI Stealth 16 Studio A13VG | |
| Acer Nitro 16 AN16-41 | |
| Asus ROG Flow X16 GV601V | |
| Dota 2 Reborn - 1920x1080 ultra (3/3) best looking | |
| Medion Erazer Major X20 | |
| MSI Stealth 16 Studio A13VG | |
| Średnia w klasie Gaming (84.8 - 248, n=107, ostatnie 2 lata) | |
| Asus ROG Flow X16 GV601V | |
| Gigabyte AERO 16 OLED BSF | |
| Corsair Voyager a1600 | |
| Acer Nitro 16 AN16-41 | |
Aby sprawdzić, jak stabilna jest liczba klatek na sekundę w dłuższych okresach czasu, uruchomiliśmy grę The Witcher 3 na około 60 minut w rozdzielczości Full HD i maksymalnych ustawieniach wstępnych. Podczas tego procesu postać w grze nie była poruszana. Wykres pokazuje względnie stałą liczbę klatek na sekundę.
Witcher 3 FPS diagram
| low | med. | high | ultra | QHD | |
|---|---|---|---|---|---|
| GTA V (2015) | 187 | 184.7 | 180.3 | 119.7 | 92.8 |
| The Witcher 3 (2015) | 452.3 | 390.5 | 226.7 | 119 | |
| Dota 2 Reborn (2015) | 189.6 | 169 | 160.5 | 154.7 | |
| Final Fantasy XV Benchmark (2018) | 202 | 154.2 | 115 | 83.8 | |
| X-Plane 11.11 (2018) | 158.5 | 142.4 | 110.2 | ||
| Far Cry 5 (2018) | 190 | 157 | 150 | 143 | 113 |
| Strange Brigade (2018) | 470 | 286 | 230 | 200 | 132 |
| Shadow of the Tomb Raider (2018) | 206 | 163.4 | 158.1 | 145.9 | 104 |
| Far Cry New Dawn (2019) | 165 | 140 | 135 | 120 | 105 |
| Metro Exodus (2019) | 221 | 141.3 | 109.8 | 87.2 | 69.1 |
| Borderlands 3 (2019) | 175.9 | 145.9 | 119.7 | 98.6 | 71.5 |
| F1 2020 (2020) | 331 | 276 | 235 | 183 | 142.6 |
| F1 2021 (2021) | 378 | 300 | 238 | 139.5 | 108.5 |
| Far Cry 6 (2021) | 168.8 | 143 | 126.5 | 114.5 | 86.7 |
| God of War (2022) | 143.1 | 119.5 | 95.6 | 68.8 | 58.5 |
| GRID Legends (2022) | 182.9 | 164.1 | 150.1 | 131.7 | 112.1 |
| Tiny Tina's Wonderlands (2022) | 230 | 190.1 | 130.3 | 101.7 | 70.5 |
| F1 22 (2022) | 256 | 246 | 183.4 | 76.7 | 49.7 |
| Uncharted Legacy of Thieves Collection (2022) | 94 | 92.4 | 86.2 | 82.7 | 61.2 |
| High On Life (2023) | 220 | 178.7 | 134.1 | 110.6 | 66.9 |
| Dead Space Remake (2023) | 102.8 | 98.2 | 86.7 | 86.5 | 56.5 |
| Returnal (2023) | 115 | 111 | 102 | 88 | 63 |
| Company of Heroes 3 (2023) | 211.8 | 191.4 | 156.5 | 153.9 | 114.8 |
| Resident Evil 4 Remake (2023) | 160.1 | 123.4 | 113.1 | 82.4 | 61.3 |
| The Last of Us (2023) | 114.4 | 96.5 | 85.5 | 75 | 43.9 |
| Star Wars Jedi Survivor (2023) | 92.1 | 80.6 | 75.6 | 71.1 | 47 |
| Diablo 4 (2023) | 255 | 233 | 208 | 177.8 | 105.4 |
| F1 23 (2023) | 230 | 232 | 189 | 71 | 45 |
Emisje - Dobra żywotność baterii, ale wysokie temperatury
Emisja hałasu
MSI Stealth 16 Studio A13VG jest cichy podczas pracy na biegu jałowym i w codziennym użytkowaniu biurowym, pracując z pakietem Office i wykonując zadania internetowe. Zmierzyliśmy tylko nieco poniżej 35 dB(A) przy średnim obciążeniu, gdzie słychać było cichy, ale słyszalny warkot. Pod obciążeniem może być bardzo głośno, z maksymalnymi wartościami testu obciążeniowego wynoszącymi 51,5 dB(A). Przy 62 dB(A), Acer Nitro 16 AN16-41 pokazuje, że można uzyskać znacznie głośniejszy dźwięk.
Zasadniczo MSI Stealth 16 Studio A13VG pozwala również na prawie bezgłośną pracę. Aby to osiągnąć, musisz wybrać profile energetyczne trybu "Silent" lub "Super Battery", z których oba można wybrać w MSI Center.
Możesz także przejąć kontrolę nad wentylatorem za pośrednictwem MSI Center. Oprócz predefiniowanych profili, można tworzyć własne krzywe wentylatora.
Hałas
| luz |
| 24 / 24 / 24 dB |
| obciążenie |
| 34.81 / 51.57 dB |
 | ||
30 dB cichy 40 dB(A) słyszalny 50 dB(A) irytujący |
||
min: | ||
| MSI Stealth 16 Studio A13VG GeForce RTX 4070 Laptop GPU, i7-13700H, Micron 3400 2TB MTFDKBA2T0TFH | Asus ROG Flow X16 GV601V GeForce RTX 4060 Laptop GPU, i9-13900H, WD PC SN560 SDDPNQE-1T00 | Medion Erazer Major X20 GeForce RTX 4070 Laptop GPU, i9-13900HX, Phison E18-1TB-PHISON-SSD-B47R | Acer Nitro 16 AN16-41 GeForce RTX 4070 Laptop GPU, R7 7735HS, Samsung PM9A1 MZVL21T0HCLR | Corsair Voyager a1600 Radeon RX 6800M, R9 6900HS, Samsung PM9A1 MZVL22T0HBLB | Gigabyte AERO 16 OLED BSF GeForce RTX 4070 Laptop GPU, i9-13900H, Gigabyte AG470S1TB-SI B10 | |
|---|---|---|---|---|---|---|
| Noise | -3% | -18% | -8% | -23% | -15% | |
| wyłączone / środowisko * (dB) | 24 | 24 -0% | 24 -0% | 25.7 -7% | 29.9 -25% | 23 4% |
| Idle Minimum * (dB) | 24 | 24 -0% | 25 -4% | 25.7 -7% | 30.5 -27% | 23 4% |
| Idle Average * (dB) | 24 | 24 -0% | 29 -21% | 25.7 -7% | 30.6 -28% | 23 4% |
| Idle Maximum * (dB) | 24 | 24 -0% | 31 -29% | 26.3 -10% | 30.7 -28% | 33.64 -40% |
| Load Average * (dB) | 34.81 | 36.71 -5% | 50 -44% | 33.9 3% | 44.5 -28% | 51.49 -48% |
| Witcher 3 ultra * (dB) | 44.05 | 50.92 -16% | 53 -20% | 55.27 -25% | ||
| Load Maximum * (dB) | 51.57 | 50.92 1% | 57 -11% | 62 -20% | 51.1 1% | 55.24 -7% |
* ... im mniej tym lepiej
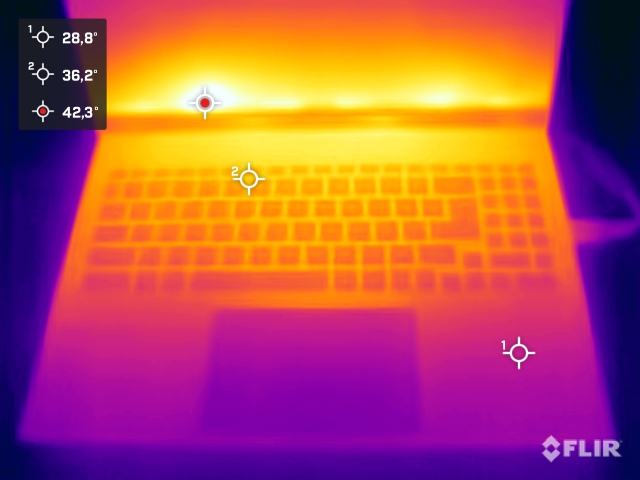
Temperatura
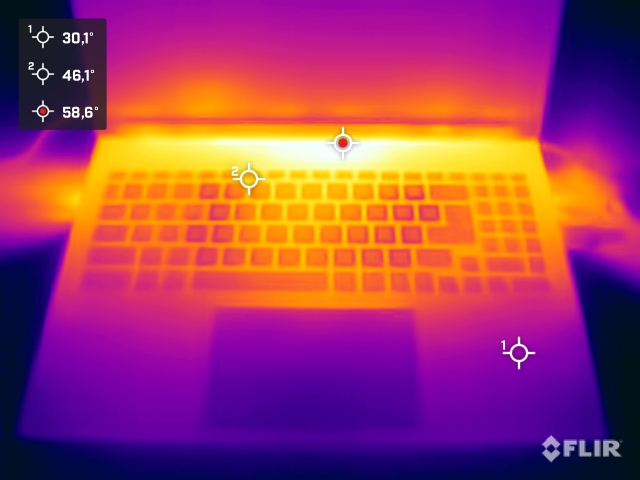
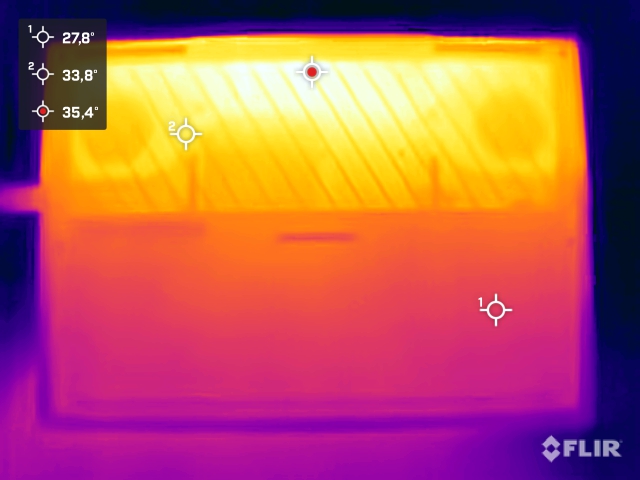
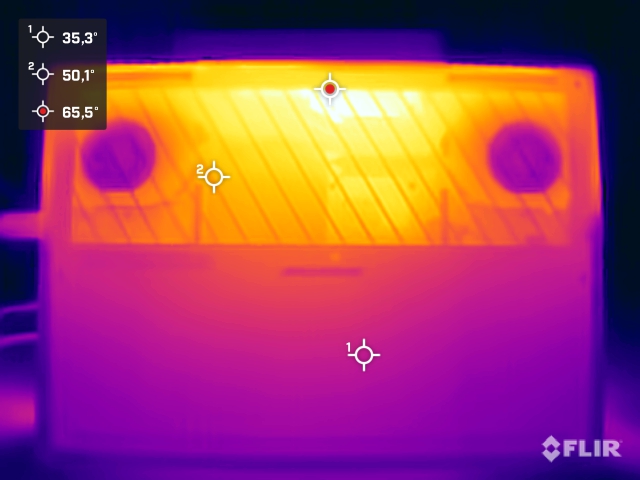
W teście obciążeniowym odnotowaliśmy wysokie temperatury obudowy pod obciążeniem, a także podczas grania. Przy ponad 60 °C, temperatury są wyższe zarówno na górnej, jak i dolnej stronie laptopa niż u jego odpowiedników. W rezultacie korzystanie z urządzenia na kolanach pod obciążeniem może być niewygodne.
(-) Maksymalna temperatura w górnej części wynosi 60 °C / 140 F, w porównaniu do średniej 40.4 °C / 105 F , począwszy od 21.2 do 68.8 °C dla klasy Gaming.
(-) Dno nagrzewa się maksymalnie do 61 °C / 142 F, w porównaniu do średniej 43.2 °C / 110 F
(±) W stanie bezczynności średnia temperatura górnej części wynosi 33.2 °C / 92 F, w porównaniu ze średnią temperaturą urządzenia wynoszącą 33.9 °C / ### class_avg_f### F.
(-) Podczas gry w Wiedźmina 3 średnia temperatura górnej części wynosi 44.7 °C / 112 F, w porównaniu do średniej temperatury urządzenia wynoszącej 33.9 °C / ## #class_avg_f### F.
(±) Podpórki pod nadgarstki i touchpad mogą się bardzo nagrzać w dotyku, maksymalnie do 36 °C / 96.8 F.
(-) Średnia temperatura obszaru podparcia dłoni w podobnych urządzeniach wynosiła 28.8 °C / 83.8 F (-7.2 °C / -13 F).
| MSI Stealth 16 Studio A13VG Intel Core i7-13700H, NVIDIA GeForce RTX 4070 Laptop GPU | Asus ROG Flow X16 GV601V Intel Core i9-13900H, NVIDIA GeForce RTX 4060 Laptop GPU | Medion Erazer Major X20 Intel Core i9-13900HX, NVIDIA GeForce RTX 4070 Laptop GPU | Acer Nitro 16 AN16-41 AMD Ryzen 7 7735HS, NVIDIA GeForce RTX 4070 Laptop GPU | Corsair Voyager a1600 AMD Ryzen 9 6900HS, AMD Radeon RX 6800M | Gigabyte AERO 16 OLED BSF Intel Core i9-13900H, NVIDIA GeForce RTX 4070 Laptop GPU | |
|---|---|---|---|---|---|---|
| Heat | 19% | 11% | 18% | 11% | 34% | |
| Maximum Upper Side * (°C) | 60 | 46 23% | 46 23% | 41.5 31% | 50.7 15% | 41 32% |
| Maximum Bottom * (°C) | 61 | 41 33% | 49 20% | 51.8 15% | 54.2 11% | 47 23% |
| Idle Upper Side * (°C) | 38.2 | 36 6% | 37 3% | 31.6 17% | 35.8 6% | 23 40% |
| Idle Bottom * (°C) | 37.7 | 33 12% | 38 -1% | 34.5 8% | 33 12% | 23 39% |
* ... im mniej tym lepiej
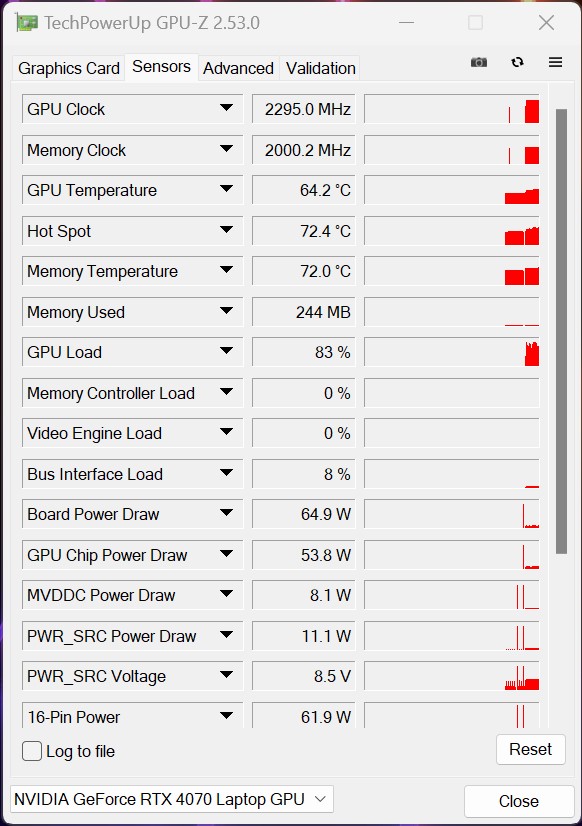
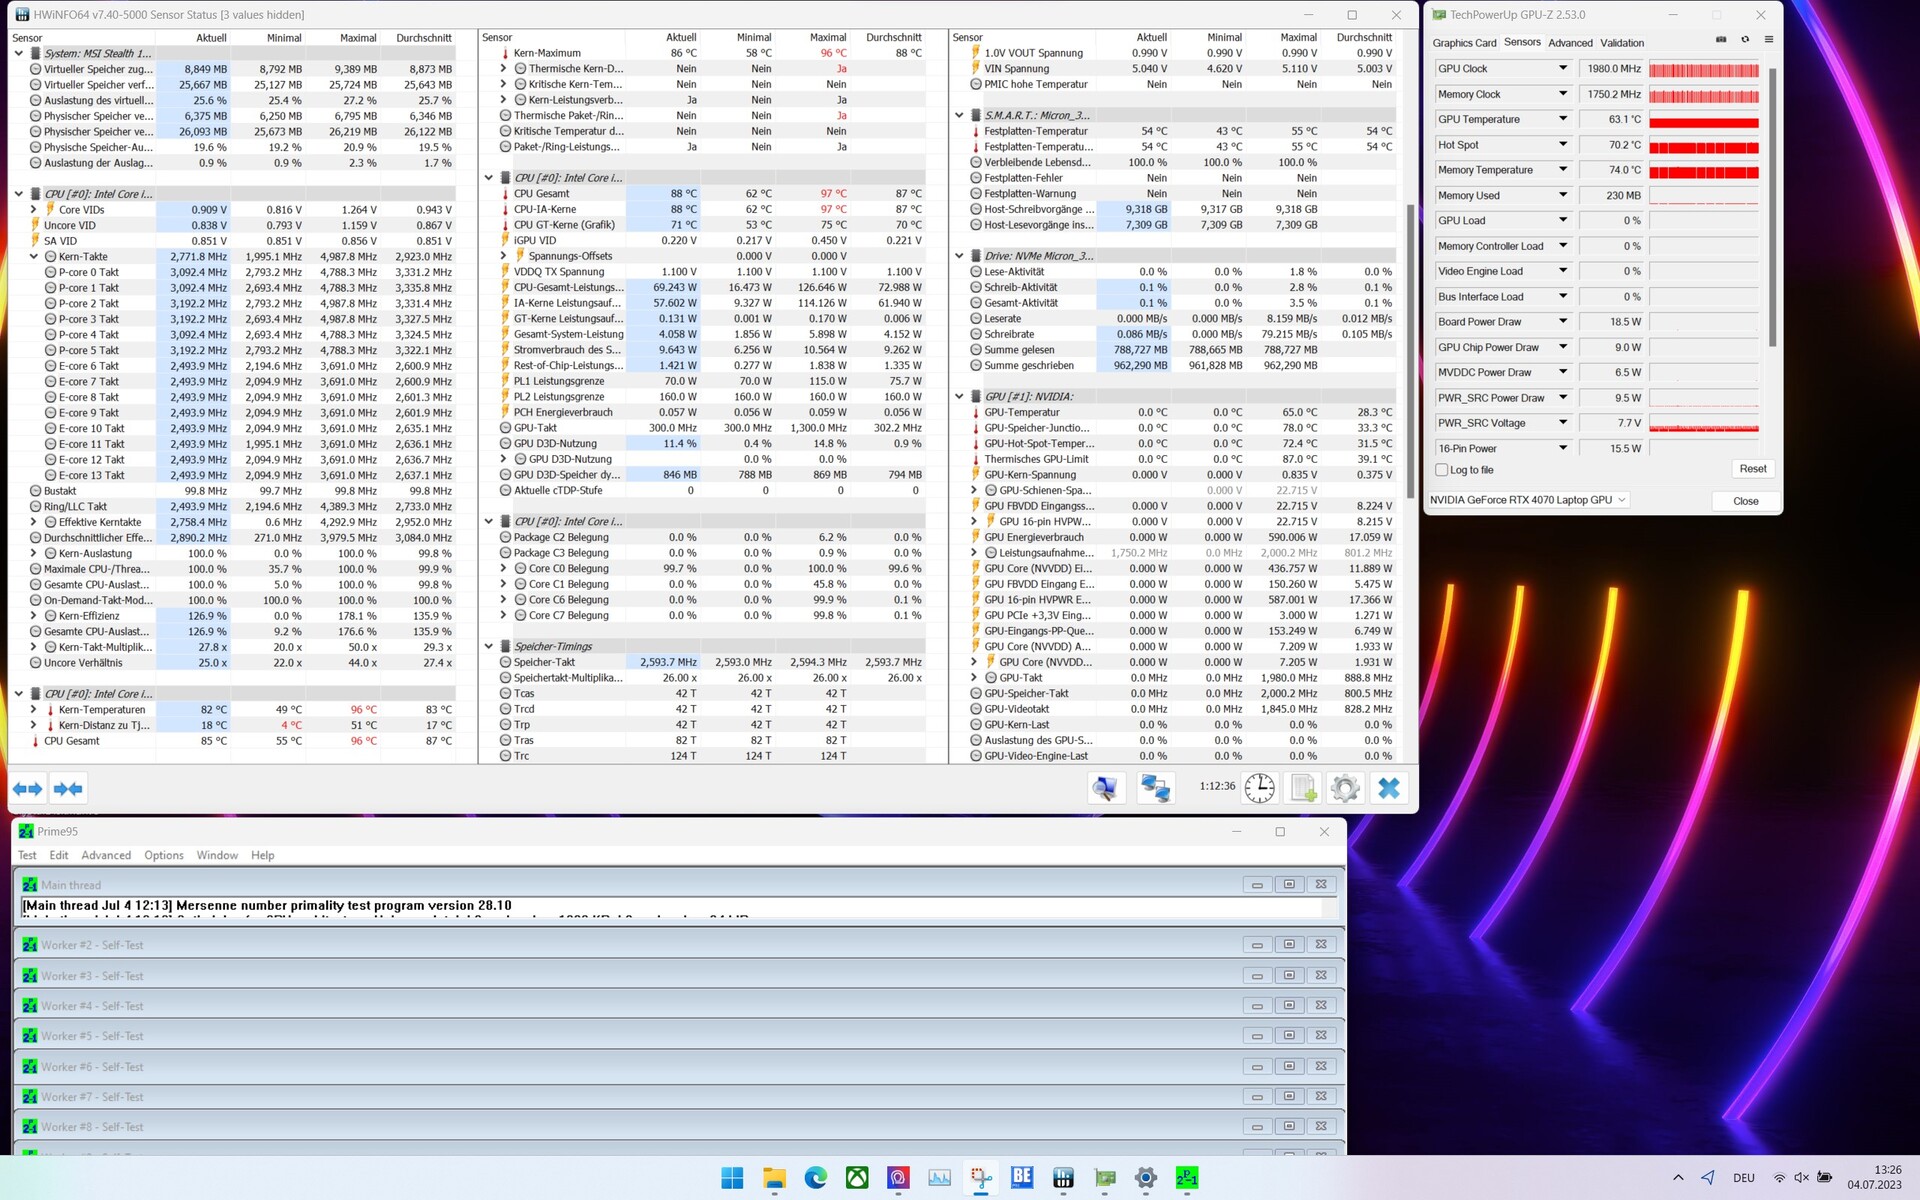
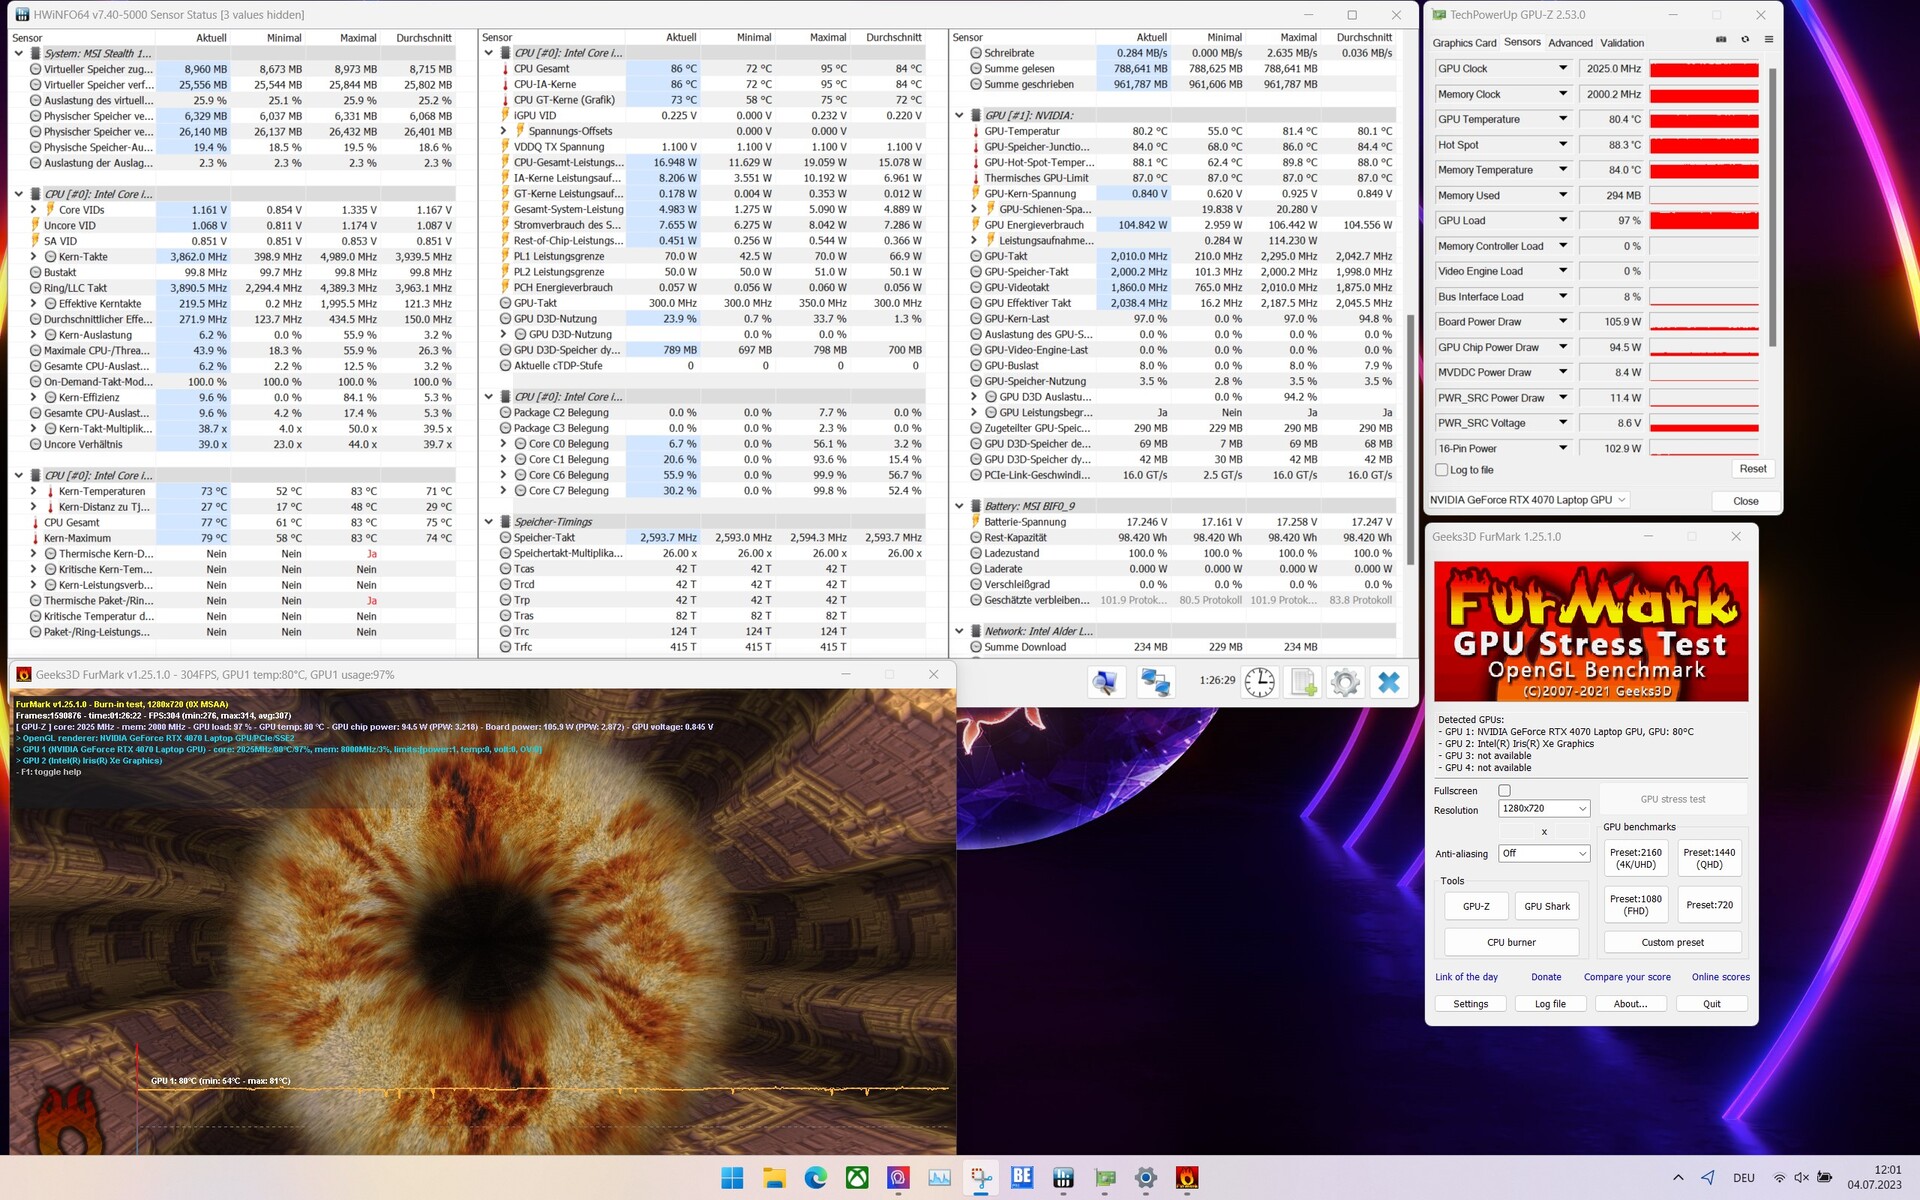
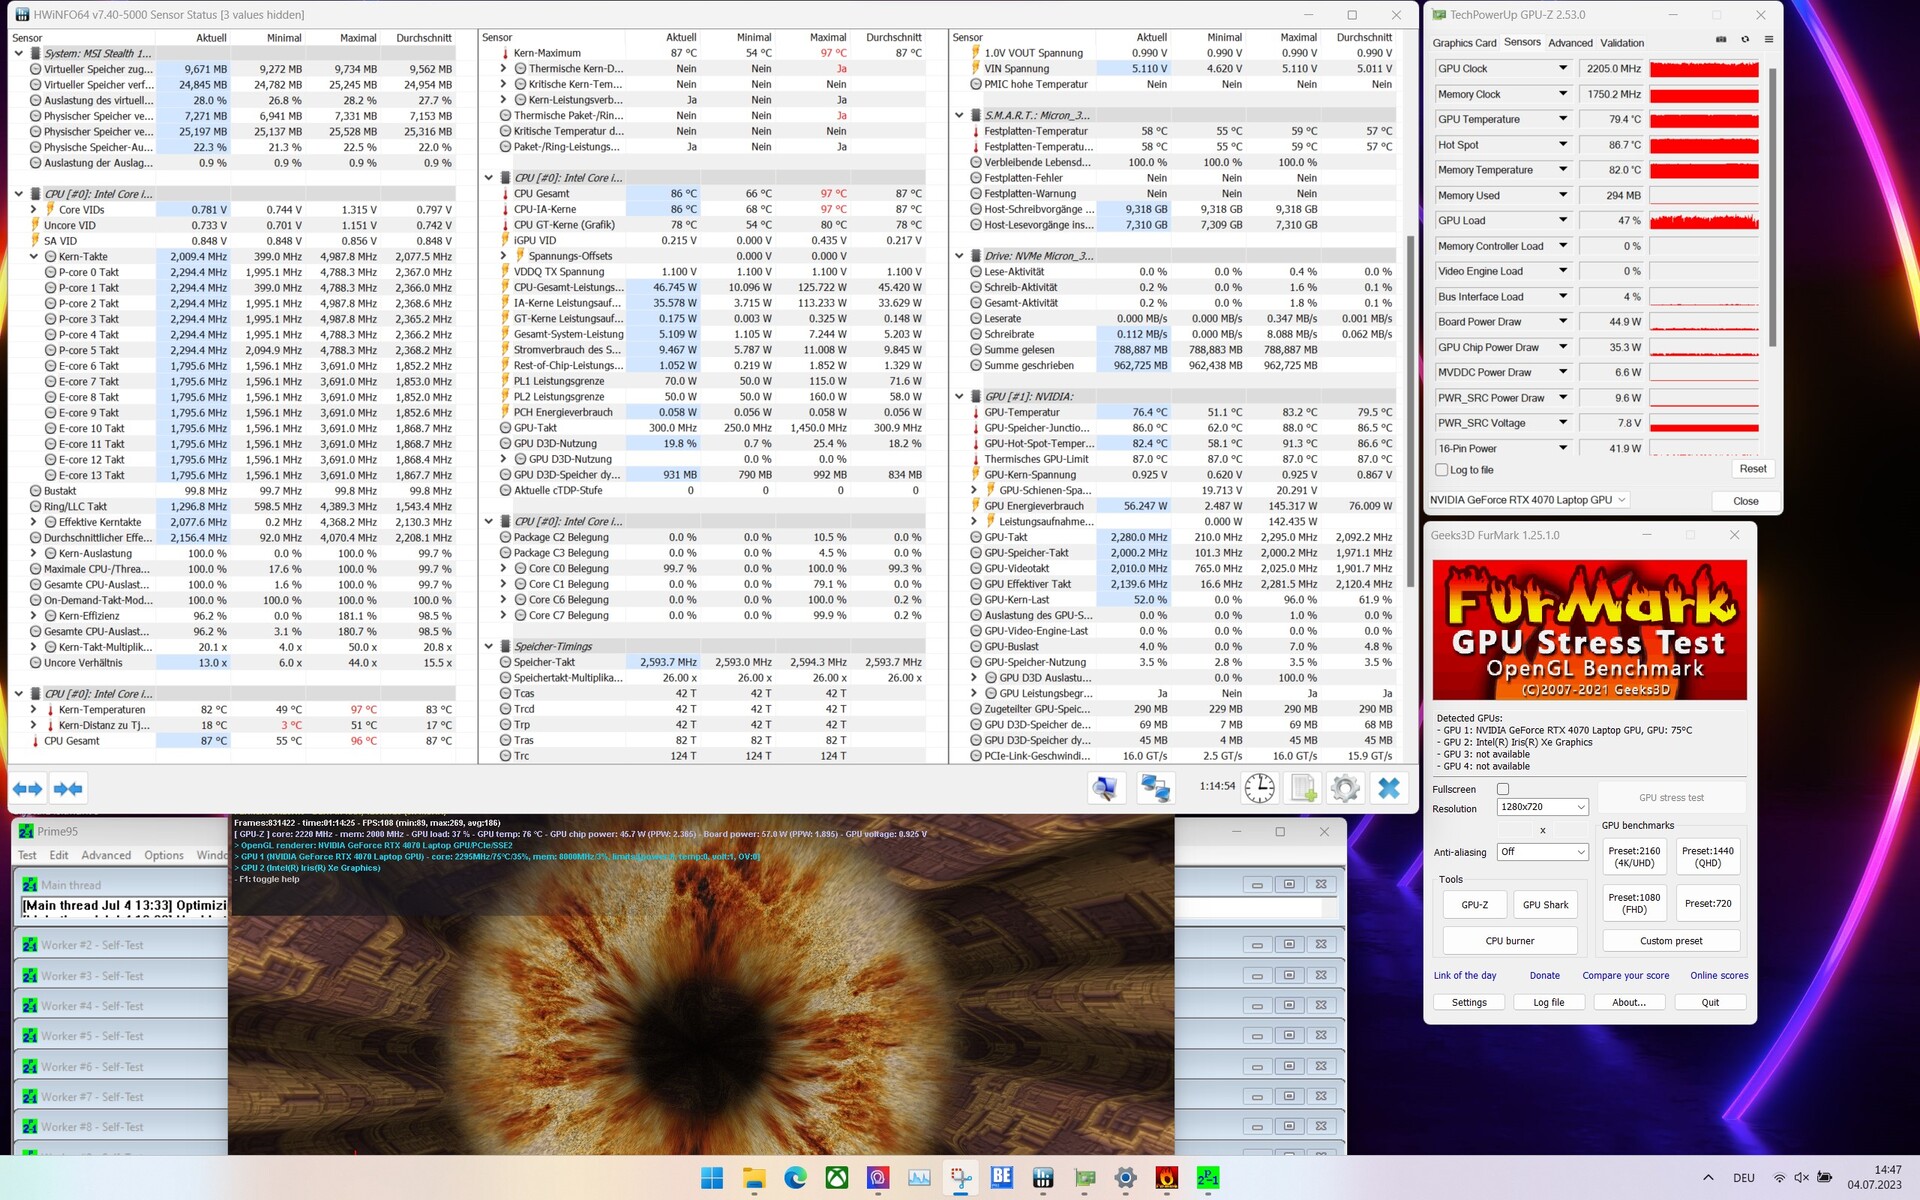
Test warunków skrajnych
Do symulacji testu warunków skrajnych wykorzystaliśmy Prime95 i FurMark w trybie ciągłym. Reprezentuje on ekstremalny scenariusz i służy do sprawdzenia stabilności systemu pod pełnym obciążeniem. Jeśli chodzi o procesor, najwyższą zaobserwowaną wartością było 97 °C, które zostało osiągnięte na samym początku. Po dłuższym czasie temperatura procesora ustabilizowała się na poziomie około 87 °C. Jeśli chodzi o kartę graficzną, odnotowaliśmy maksymalną wartość gorącego punktu wynoszącą 91 °C. Przy średniej wynoszącej około 80 °C, zaobserwowaliśmy znacznie niższe temperatury pod obciążeniem. Oznacza to, że limit termiczny karty graficznej (87 °C) nie został osiągnięty.
Głośniki
System dźwiękowy MSI Stealth 16 Studio A13VG opiera się na sześciu głośnikach, które zapewniają dobre wrażenia dźwiękowe. Odtwarzanie do maksymalnej głośności jest czyste i wolne od zakłóceń, ale nie może zastąpić zewnętrznego systemu.
MSI Stealth 16 Studio A13VG analiza dźwięku
(+) | głośniki mogą odtwarzać stosunkowo głośno (85.48 dB)
Bas 100 - 315 Hz
(±) | zredukowany bas - średnio 9% niższy od mediany
(±) | liniowość basu jest średnia (8.7% delta do poprzedniej częstotliwości)
Średnie 400 - 2000 Hz
(+) | zbalansowane środki średnie - tylko 4.6% od mediany
(+) | średnie są liniowe (5.4% delta do poprzedniej częstotliwości)
Wysokie 2–16 kHz
(+) | zrównoważone maksima - tylko 2.7% od mediany
(+) | wzloty są liniowe (5.1% delta do poprzedniej częstotliwości)
Ogólnie 100 - 16.000 Hz
(+) | ogólny dźwięk jest liniowy (9.3% różnicy w stosunku do mediany)
W porównaniu do tej samej klasy
» 3% wszystkich testowanych urządzeń w tej klasie było lepszych, 2% podobnych, 95% gorszych
» Najlepszy miał deltę 6%, średnia wynosiła ###średnia###%, najgorsza wynosiła 132%
W porównaniu do wszystkich testowanych urządzeń
» 3% wszystkich testowanych urządzeń było lepszych, 1% podobnych, 96% gorszych
» Najlepszy miał deltę 4%, średnia wynosiła ###średnia###%, najgorsza wynosiła 134%
Asus ROG Flow X16 GV601V analiza dźwięku
(±) | głośność głośnika jest średnia, ale dobra (77.38 dB)
Bas 100 - 315 Hz
(±) | zredukowany bas - średnio 9.6% niższy od mediany
(±) | liniowość basu jest średnia (9.2% delta do poprzedniej częstotliwości)
Średnie 400 - 2000 Hz
(+) | zbalansowane środki średnie - tylko 4.7% od mediany
(±) | liniowość środka jest średnia (7.5% delta do poprzedniej częstotliwości)
Wysokie 2–16 kHz
(+) | zrównoważone maksima - tylko 2.2% od mediany
(+) | wzloty są liniowe (6.1% delta do poprzedniej częstotliwości)
Ogólnie 100 - 16.000 Hz
(+) | ogólny dźwięk jest liniowy (12% różnicy w stosunku do mediany)
W porównaniu do tej samej klasy
» 12% wszystkich testowanych urządzeń w tej klasie było lepszych, 4% podobnych, 84% gorszych
» Najlepszy miał deltę 6%, średnia wynosiła ###średnia###%, najgorsza wynosiła 132%
W porównaniu do wszystkich testowanych urządzeń
» 9% wszystkich testowanych urządzeń było lepszych, 2% podobnych, 88% gorszych
» Najlepszy miał deltę 4%, średnia wynosiła ###średnia###%, najgorsza wynosiła 134%
Zarządzanie energią - większa bateria i umiarkowane zapotrzebowanie na energię
Zużycie energii
MSI Stealth 16 Studio A13VG nie wykazał żadnych nieprawidłowości pod względem poboru mocy. Zarejestrowane wartości w trybie bezczynności są faktycznie bardzo dobre, chociaż konkurencji czasami udaje się osiągnąć lepsze wyniki. Jednak minimalnie wyższy pobór mocy jest bardzo niski. Pod obciążeniem zaobserwowaliśmy normalne wartości, które można by skojarzyć z tym podstawowym sprzętem. Przy 240 watach, zasilacz jest dobrze dobrany i nie jest przytłoczony maksymalną mocą 228 watów.
| wyłączony / stan wstrzymania | |
| luz | |
| obciążenie |
|
Legenda:
min: | |
| MSI Stealth 16 Studio A13VG i7-13700H, GeForce RTX 4070 Laptop GPU, Micron 3400 2TB MTFDKBA2T0TFH, IPS, 2560x1600, 16" | Asus ROG Flow X16 GV601V i9-13900H, GeForce RTX 4060 Laptop GPU, WD PC SN560 SDDPNQE-1T00, IPS, 2560x1600, 16" | Medion Erazer Major X20 i9-13900HX, GeForce RTX 4070 Laptop GPU, Phison E18-1TB-PHISON-SSD-B47R, IPS, 2560x1600, 16" | Acer Nitro 16 AN16-41 R7 7735HS, GeForce RTX 4070 Laptop GPU, Samsung PM9A1 MZVL21T0HCLR, IPS, 2560x1600, 16" | Corsair Voyager a1600 R9 6900HS, Radeon RX 6800M, Samsung PM9A1 MZVL22T0HBLB, IPS, 2560x1600, 16" | Gigabyte AERO 16 OLED BSF i9-13900H, GeForce RTX 4070 Laptop GPU, Gigabyte AG470S1TB-SI B10, OLED, 3840x2400, 16" | Przeciętny NVIDIA GeForce RTX 4070 Laptop GPU | Średnia w klasie Gaming | |
|---|---|---|---|---|---|---|---|---|
| Power Consumption | 3% | -25% | -10% | -38% | -0% | -11% | -17% | |
| Idle Minimum * (Watt) | 11 | 9.6 13% | 12 -9% | 11.6 -5% | 16.9 -54% | 11.8 -7% | 13.2 ? -20% | 13 ? -18% |
| Idle Average * (Watt) | 18 | 16 11% | 16 11% | 15.6 13% | 20.3 -13% | 16.1 11% | 18.2 ? -1% | 18.7 ? -4% |
| Idle Maximum * (Watt) | 19 | 16.9 11% | 26 -37% | 16.5 13% | 22.2 -17% | 17 11% | 24.6 ? -29% | 24.3 ? -28% |
| Load Average * (Watt) | 91 | 104 -14% | 115 -26% | 155 -70% | 133.4 -47% | 100.6 -11% | 97 ? -7% | 110.2 ? -21% |
| Witcher 3 ultra * (Watt) | 130 | 142 -9% | 191.6 -47% | 154.8 -19% | 206 -58% | 158 -22% | ||
| Load Maximum * (Watt) | 228 | 214 6% | 319 -40% | 205 10% | 192 16% | 221 ? 3% | 258 ? -13% |
* ... im mniej tym lepiej
Power consumption Witcher 3 / stress test
Power consumption with an external monitor
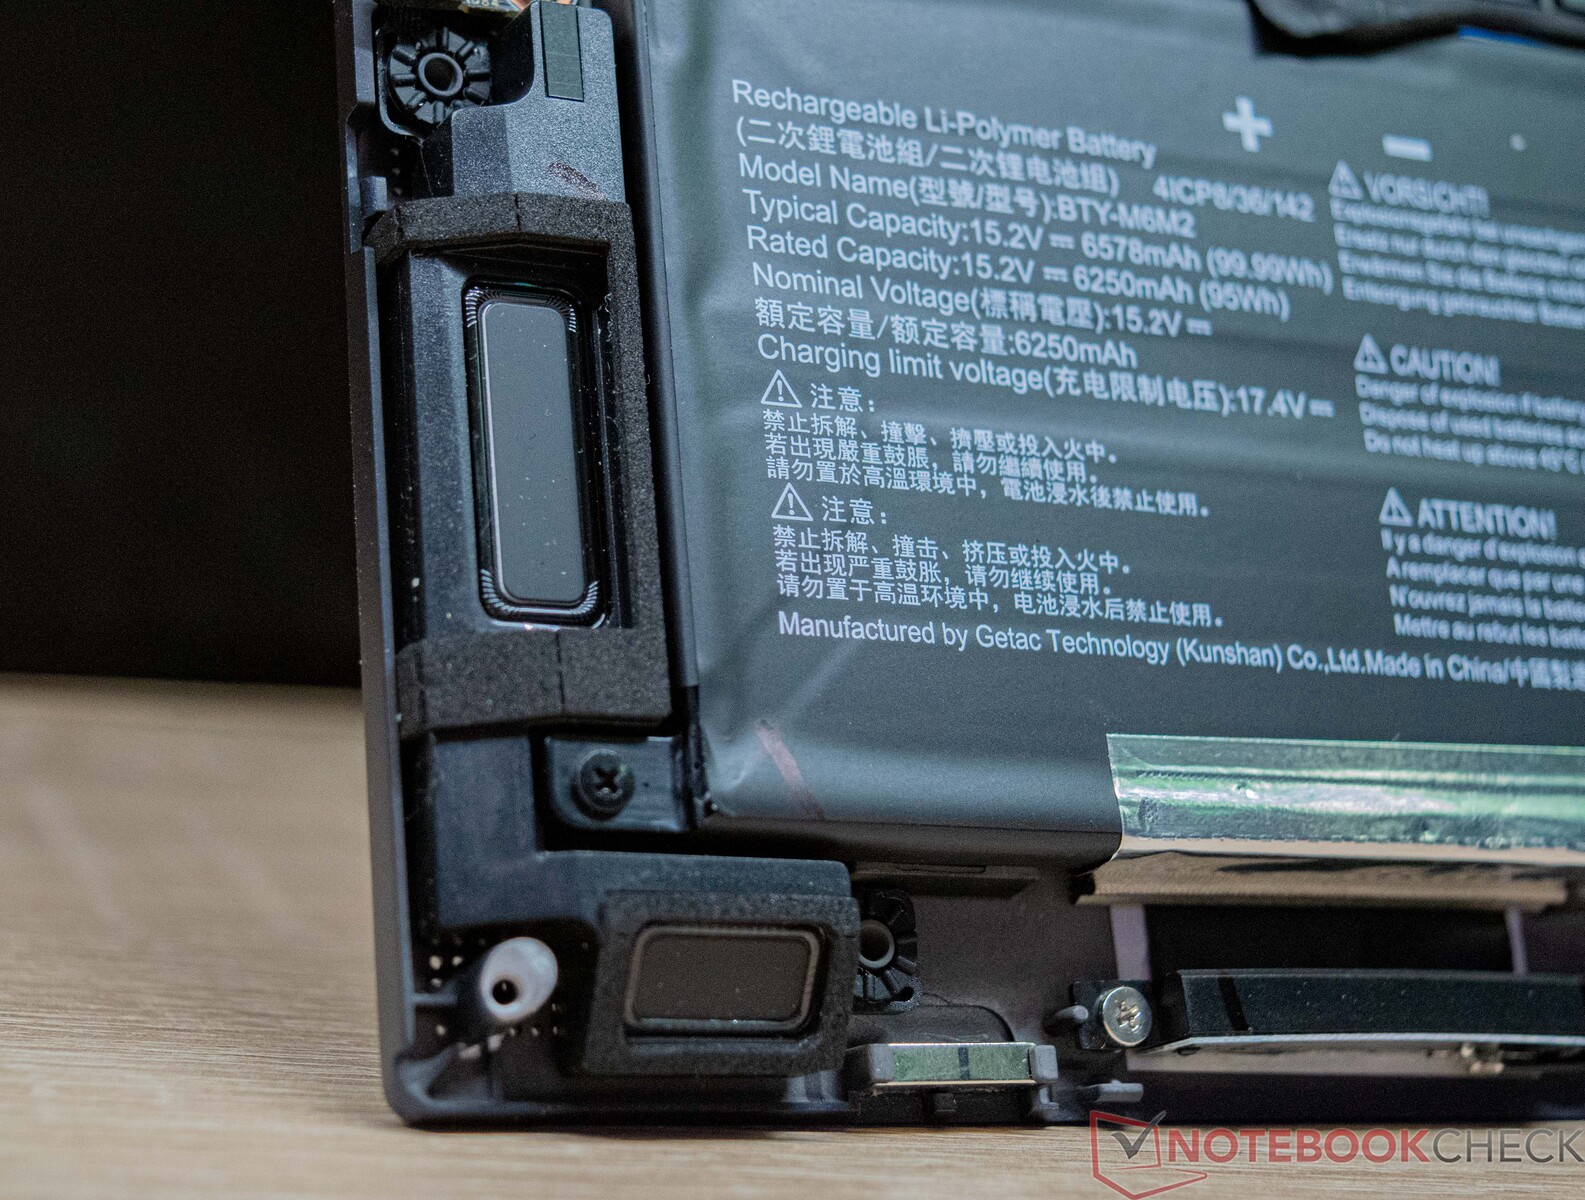
Żywotność baterii
Das MSI Stealth 16 Studio A13VG posiada baterię o pojemności 99 Wh, co jest maksymalnym rozmiarem, jaki może przyjąć laptop. Ze względu na jej pojemność, nasz egzemplarz testowy zdołał wytrzymać odpowiednio 7 godzin 46 minut i 7 godzin 42 minuty w naszej pętli testowej Wi-Fi (przy użyciu skryptu do załadowania strony internetowej) i teście wideo krótkiego filmu Big Buck Bunny (kodowanie H.264, FHD). Oznacza to, że MSI Stealth 16 Studio A13VG zapewnia doskonały czas pracy na baterii jak na laptop do gier. Podczas obu testów jasność wyświetlacza była ustawiona na 150 cd/m². W naszym przypadku oznaczało to zmniejszenie jasności do 37 procent.
Pełne naładowanie baterii trwa dokładnie trzy godziny. Jednak po mniej więcej połowie tego czasu bateria jest naładowana w 70 procentach.

| MSI Stealth 16 Studio A13VG i7-13700H, GeForce RTX 4070 Laptop GPU, 99.9 Wh | Asus ROG Flow X16 GV601V i9-13900H, GeForce RTX 4060 Laptop GPU, 90 Wh | Medion Erazer Major X20 i9-13900HX, GeForce RTX 4070 Laptop GPU, 62.3 Wh | Acer Nitro 16 AN16-41 R7 7735HS, GeForce RTX 4070 Laptop GPU, 90 Wh | Corsair Voyager a1600 R9 6900HS, Radeon RX 6800M, 99 Wh | Gigabyte AERO 16 OLED BSF i9-13900H, GeForce RTX 4070 Laptop GPU, 88 Wh | Średnia w klasie Gaming | |
|---|---|---|---|---|---|---|---|
| Czasy pracy | -7% | -44% | 8% | -24% | -7% | -14% | |
| Reader / Idle (h) | 11 | 5.8 -47% | 12.2 11% | 7 -36% | 8.71 ? -21% | ||
| H.264 (h) | 7.7 | 8.9 16% | 4.2 -45% | 10.2 32% | 6 -22% | 7.4 -4% | 8.64 ? 12% |
| WiFi v1.3 (h) | 7.8 | 7.9 1% | 3.9 -50% | 9 15% | 5.8 -26% | 7.5 -4% | 7.11 ? -9% |
| Load (h) | 2.4 | 1.5 -37% | 1.6 -33% | 1.8 -25% | 2.1 -12% | 2.1 -12% | 1.502 ? -37% |
Za
Przeciw
Werdykt - laptop klasy premium dla twórców
Pod względem wbudowanego procesora i układu graficznego, MSI Stealth 16 Studio A13VG jest laptopem gamingowym na wskroś. Z czysto wizualnego punktu widzenia, MSI Stealth 16 Studio A13VG prezentuje się jako gustowny laptop biznesowy z gamingowymi ambicjami. W ten sposób urządzenie zaspokaja szeroki zakres potrzeb, aby przemówić do wielu użytkowników. Laptop skierowany jest do twórców, którzy stawiają na wydajność systemu na wysokim poziomie. Wydajność procesora Intel Core i7-13700H w połączeniu z procesorem graficznym Nvidia-GeForce RTX 4070 jest niezmiennie dobra. Wyświetlacz również musi spełniać niezbędne wymagania i jest to coś, z czym sobie radzi dzięki wysokiemu pokryciu przestrzeni kolorów.
Byliśmy również pod wrażeniem reszty specyfikacji - 32 GB pamięci RAM DDR5 i łącznie 2 TB pamięci masowej SSD to doskonała podstawa, która gwarantuje, że laptop nie będzie wymagał aktualizacji w najbliższym czasie. 16-calowy wyświetlacz oferuje rozdzielczość QHD+, proporcje 16:10, a częstotliwość odświeżania 240 Hz potwierdza jego gamingowe referencje.
MSI Stealth 16 Studio A13VG to jednocześnie bardzo wydajny i bardzo lekki laptop dla twórców treści i graczy.
Z drugiej strony, ograniczenia dźwięku pojawiają się w postaci głośności, która jest jednak typowa dla laptopa do gier. Wybór portów również oceniamy dość krytycznie, ponieważ tylko jeden port USB-A jest po prostu niewystarczający dla tej klasy urządzeń. Niemniej jednak istnieje nowoczesny port Thunderbolt 4, który pozwala na użyteczną rozbudowę laptopa. Implementacja czytnika kart jest dobra i pod względem wydajności nie ma co ukrywać.
Jeśli chodzi o mobilność, MSI Stealth 16 Studio A13VG wypada dobrze, ponieważ zarówno niska waga, jak i dobry czas pracy na baterii są ponadprzeciętne. Wiele ustawień można wprowadzić za pośrednictwem MSI Center, a przy odpowiednich ustawieniach urządzenie działa nawet prawie bezgłośnie.
Jednak pod względem cenowym MSI Stealth 16 Studio A13VG ma trudny czas z obecną ceną wywoławczą około 2549 USD. Aby znaleźć tańszą alternatywę, warto spojrzeć na Medion Erazer Major X20który jest wyposażony w kartę graficznąNvidia GeForce RTX 4070 laptop GPUi również zapewnia doskonałą wydajność.
Cena i dostępność
MSI Stealth 16 Studio A13VG z dyskiem SSD o pojemności 1 TB i 64 GB pamięci RAM jest obecnie dostępny w sklepie BestBuy w cenie 2 549,99 USD.
MSI Stealth 16 Studio A13VG
- 28/11/2023 v7 (old)
Sebastian Bade
Przezroczystość
Wyboru urządzeń do recenzji dokonuje nasza redakcja. Próbka testowa została udostępniona autorowi jako pożyczka od producenta lub sprzedawcy detalicznego na potrzeby tej recenzji. Pożyczkodawca nie miał wpływu na tę recenzję, producent nie otrzymał też kopii tej recenzji przed publikacją. Nie było obowiązku publikowania tej recenzji. Jako niezależna firma medialna, Notebookcheck nie podlega władzy producentów, sprzedawców detalicznych ani wydawców.
Tak testuje Notebookcheck
Każdego roku Notebookcheck niezależnie sprawdza setki laptopów i smartfonów, stosując standardowe procedury, aby zapewnić porównywalność wszystkich wyników. Od około 20 lat stale rozwijamy nasze metody badawcze, ustanawiając przy tym standardy branżowe. W naszych laboratoriach testowych doświadczeni technicy i redaktorzy korzystają z wysokiej jakości sprzętu pomiarowego. Testy te obejmują wieloetapowy proces walidacji. Nasz kompleksowy system ocen opiera się na setkach uzasadnionych pomiarów i benchmarków, co pozwala zachować obiektywizm.Price comparison

