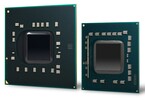
Intel Graphics Media Accelerator (GMA) 4500MHD
Ceny notebooków z Intel GMA 4500MHD
GMA Rodzina
| |||||||||||||||||||||||||
Nazwa robocza | Montevina | ||||||||||||||||||||||||
Architektura | Gen. 4.5 | ||||||||||||||||||||||||
Potoki | 10 - ZJC | ||||||||||||||||||||||||
Zegar rdzenia | 533 MHz | ||||||||||||||||||||||||
Pamięć współdzielona | tak | ||||||||||||||||||||||||
API | DirectX 10, Shader 4.0 | ||||||||||||||||||||||||
Technologia | 65 nm | ||||||||||||||||||||||||
Technologie | Enhanced Intel Clear Video Technology, HD Video Decoder (VC/VC2/MPEG2), HDMI z HDCP, Display Refresh Rate Switching Technology, Render Standby | ||||||||||||||||||||||||
Data premiery | 01.10.2008 | ||||||||||||||||||||||||
Witryna producenta | www.intel.com |
Testy
3DMark - 3DMark Cloud Gate Score
178 Points (0%)
Model | CPU | GPU | RAM | Wartość |
---|---|---|---|---|
Asus UL50VF | SU7300 | Graphics Media Accelerator (GMA) 4500MHD | 4 GB | 178 |
Intel Graphics Media Accelerator (GMA) 4500MHD
178
330 85%
793 346%
887 398%
1161 552%
1182 564%
1197 572%
1386 679%
1452 716%
1454 717%
...
61459 34428%
max:
87173 48874%
0%
100%
3DMark - 3DMark Cloud Gate Graphics
145 Points (0%)
Model | CPU | GPU | RAM | Wartość |
---|---|---|---|---|
Asus UL50VF | SU7300 | Graphics Media Accelerator (GMA) 4500MHD | 4 GB | 145 |
Intel Graphics Media Accelerator (GMA) 4500MHD
145
1091 652%
1230 748%
1405 869%
1491 928%
1593 999%
1805 1145%
1851 1177%
1865 1186%
1908 1216%
...
172972 119191%
max:
259707 179008%
0%
100%
3DMark - 3DMark Ice Storm Graphics
6958 Points (1%)
Model | CPU | GPU | RAM | Wartość |
---|---|---|---|---|
Asus UL50VF | SU7300 | Graphics Media Accelerator (GMA) 4500MHD | 4 GB | 6958 |
Intel Graphics Media Accelerator (GMA) 4500MHD
6958
12199 75%
13747 98%
14498 108%
Qualcomm Adreno 690
14652 111%
15391 121%
16078 131%
18517 166%
18760 170%
19393 179%
...
595673 8461%
max:
664588 9451%
0%
100%
3DMark 2001SE - 3DMark 2001 - Standard
min: 3511 avg: 5100 median: 5089.5 (5%) max: 7180 Points
ATI Mobility 128 M3
415 -92%
...
4243 -17%
4279 -16%
4300 -16%
4319 -15%
4501 -12%
4654 -9%
4764 -7%
4859 -5%
5000 -2%
Intel Graphics Media Accelerator (GMA) 4500MHD
5100
5400 6%
5500 8%
5565 9%
5858 15%
6640 30%
6645 30%
6800 33%
6838 34%
7012 37%
...
69346 1260%
max:
NVIDIA GeForce GTX 1050 (Desktop)
96234 1787%
0%
100%
3DMark 03 - 3DMark 03 - Standard
min: 1402 avg: 2020 median: 1894 (1%) max: 3050 Points
50 -98%
...
1410 -30%
1520 -25%
1618 -20%
1673 -17%
1676 -17%
1835 -9%
1900 -6%
1926 -5%
1976 -2%
Intel Graphics Media Accelerator (GMA) 4500MHD
2020
2097 4%
2157 7%
2284 13%
2457 22%
2500 24%
2500 24%
2501 24%
2611 29%
2700 34%
...
181125 8867%
0%
100%
3DMark 05 - 3DMark 05 - Standard
min: 739 avg: 1224 median: 1218 (1%) max: 1710 Points
133.4 -89%
...
900 -26%
900 -26%
905 -26%
983 -20%
987 -19%
988 -19%
994 -19%
1089 -11%
1200 -2%
Intel Graphics Media Accelerator (GMA) 4500MHD
1224
1250 2%
1333 9%
1448 18%
1450 18%
1500 23%
1613 32%
1684 38%
1693 38%
1760 44%
...
68064 5461%
max:
87172 7022%
0%
100%
3DMark 06
min: 706 avg: 793 median: 722 (1%) max: 950 pkt.
Model | CPU | GPU | RAM | Wartość | |
---|---|---|---|---|---|
3DMark 06 - Score Unknown Settings | |||||
Acer TravelMate 8471-944G32Mn (3DMark 06 - Score Unknown Settings) | SU9400 | Graphics Media Accelerator (GMA) 4500MHD 533 MHz | 4 GB | 706 | |
Asus UL30A-QX050V (3DMark 06 - Score Unknown Settings) | SU7300 | Graphics Media Accelerator (GMA) 4500MHD | 4 GB | 722 | |
(3DMark 06 - Score Unknown Settings) | T9400 | Graphics Media Accelerator (GMA) 4500MHD | 950 |
57 -93%
...
560 -29%
590 -26%
660 -17%
674 -15%
680 -14%
690 -13%
696 -12%
709 -11%
735 -7%
Intel Graphics Media Accelerator (GMA) 4500MHD
793
808 2%
860 8%
896 13%
913 15%
1064 34%
1085 37%
1088 37%
1116 41%
1118 41%
...
Intel Iris Xe Graphics G7 96EUs
24558 2997%
0%
100%
3DMark 06
min: 483 avg: 676 median: 623 (1%) max: 998 Points
Model | CPU | GPU | RAM | Wartość | |
---|---|---|---|---|---|
3DMark 06 - Standard 1280x1024 | |||||
Dell Vostro V13 (3DMark 06 - Standard 1280x1024) | SU3500 | Graphics Media Accelerator (GMA) 4500MHD 475 MHz | 2 GB | 483 | |
Acer Aspire One 752 (3DMark 06 - Standard 1280x1024) | 743 | Graphics Media Accelerator (GMA) 4500MHD | 2 GB | 485 | |
Dell Inspiron 11z (3DMark 06 - Standard 1280x1024) | SU4100 | Graphics Media Accelerator (GMA) 4500MHD 475 MHz | 2 GB | 489 | |
Fujitsu LifeBook P3110 (3DMark 06 - Standard 1280x1024) | SU4100 | Graphics Media Accelerator (GMA) 4500MHD 533 MHz | 4 GB | 525 | |
HP EliteBook 2530p (3DMark 06 - Standard 1280x1024) | SL9400 | Graphics Media Accelerator (GMA) 4500MHD | 2 GB | 534 | |
Toshiba Satellite T110-10R (3DMark 06 - Standard 1280x1024) | SU2700 | Graphics Media Accelerator (GMA) 4500MHD 533 MHz | 3 GB | 549 | |
Panasonic Toughbook CF-W8 (3DMark 06 - Standard 1280x1024) | SU9400 | Graphics Media Accelerator (GMA) 4500MHD | 2 GB | 559 | |
Lenovo IdeaPad U350 (3DMark 06 - Standard 1280x1024) | SU2700 | Graphics Media Accelerator (GMA) 4500MHD 475 MHz 0.1 GB | 3 GB | 561 | |
Acer Aspire 3810T (3DMark 06 - Standard 1280x1024) | SU3500 | Graphics Media Accelerator (GMA) 4500MHD | 4 GB | 582 | |
Dell Latitude XT2 (3DMark 06 - Standard 1280x1024) | SU9400 | Graphics Media Accelerator (GMA) 4500MHD 475 MHz | 2 GB | 593 | |
MSI X-Slim X340 (3DMark 06 - Standard 1280x1024) | SU3500 | Graphics Media Accelerator (GMA) 4500MHD | 2 GB | 618 | |
Acer TravelMate 8371 (3DMark 06 - Standard 1280x1024) | SU9400 | Graphics Media Accelerator (GMA) 4500MHD 475 MHz | 4 GB | 620 | |
Samsung E251 T4200 Esilo (3DMark 06 - Standard 1280x1024) | T4200 | Graphics Media Accelerator (GMA) 4500MHD | 4 GB | 621 | |
HP 620 WT092EA (3DMark 06 - Standard 1280x1024) | T4500 | Graphics Media Accelerator (GMA) 4500MHD | 2 GB | 622 | |
Dell Adamo XPS (3DMark 06 - Standard 1280x1024) | SU9400 | Graphics Media Accelerator (GMA) 4500MHD 475 MHz | 4 GB | 624 | |
Samsung R530-JA09DE (3DMark 06 - Standard 1280x1024) | T4500 | Graphics Media Accelerator (GMA) 4500MHD | 3 GB | 667 | |
HP Compaq 6730b (3DMark 06 - Standard 1280x1024) | P8600 | Graphics Media Accelerator (GMA) 4500MHD ? / 533 MHz 0.3 GB | 2 GB | 679 | |
Asus N20A (3DMark 06 - Standard 1280x1024) | T5850 | Graphics Media Accelerator (GMA) 4500MHD | 3 GB | 682 | |
HP EliteBook 6930p (3DMark 06 - Standard 1280x1024) | T9400 | Graphics Media Accelerator (GMA) 4500MHD | 2 GB | 702 | |
Asus UL30A-QX050V (3DMark 06 - Standard 1280x1024) | SU7300 | Graphics Media Accelerator (GMA) 4500MHD | 4 GB | 722 | |
Dell Vostro 1520 (Core 2 Duo T6570, GMA 4500MHD, 3GB RAM) (3DMark 06 - Standard 1280x1024) | T6570 | Graphics Media Accelerator (GMA) 4500MHD 475 MHz | 3 GB | 738 | |
Sony Vaio VPC-Y11S1ES (3DMark 06 - Standard 1280x1024) | SU7300 | Graphics Media Accelerator (GMA) 4500MHD | 4 GB | 801 | |
Dell Inspiron 1545 (3DMark 06 - Standard 1280x1024) | T4200 | Graphics Media Accelerator (GMA) 4500MHD | 4 GB | 841 | |
Acer Aspire 8935G (3DMark 06 - Standard 1280x1024) | Q9000 | Graphics Media Accelerator (GMA) 4500MHD | 4 GB | 849 | |
(3DMark 06 - Standard 1280x1024) | T9400 | Graphics Media Accelerator (GMA) 4500MHD 475 / 475 MHz | 910 | ||
Fujitsu-Siemens Esprimo Mobile U9210 (3DMark 06 - Standard 1280x1024) | T9400 | Graphics Media Accelerator (GMA) 4500MHD | 2 GB | 940 | |
Fujitsu Lifebook A1130 (3DMark 06 - Standard 1280x1024) | T6600 | Graphics Media Accelerator (GMA) 4500MHD | 4 GB | 945 | |
Lenovo ThinkPad T400s (3DMark 06 - Standard 1280x1024) | SP9600 | Graphics Media Accelerator (GMA) 4500MHD 475 MHz | 4 GB | 998 |
68 -90%
...
280.5 -59%
327.5 -52%
387.5 -43%
422 -38%
424 -37%
444.9 -34%
445 -34%
594 -12%
600 -11%
Intel Graphics Media Accelerator (GMA) 4500MHD
676
725 7%
912 35%
959 42%
965 43%
1033 53%
1093 62%
1215 80%
1250 85%
1311 94%
...
64183 9395%
max:
74741 10956%
0%
100%
3DMark 06
min: 561 avg: 860 median: 921 (1%) max: 973 Points
Model | CPU | GPU | RAM | Wartość | |
---|---|---|---|---|---|
3DMark 06 - Standard 1280x800 | |||||
Toshiba Portégé A600-13Y (3DMark 06 - Standard 1280x800) | SU9300 | Graphics Media Accelerator (GMA) 4500MHD 475 MHz 0.1 GB | 2 GB | 561 | |
Samsung X360 (3DMark 06 - Standard 1280x800) | SU9300 | Graphics Media Accelerator (GMA) 4500MHD 475 MHz | 4 GB | 678 | |
Asus N20A (3DMark 06 - Standard 1280x800) | T5850 | Graphics Media Accelerator (GMA) 4500MHD | 3 GB | 744 | |
HP EliteBook 6930p (3DMark 06 - Standard 1280x800) | P8600 | Graphics Media Accelerator (GMA) 4500MHD | 2 GB | 771 | |
Lenovo ThinkPad X301 (3DMark 06 - Standard 1280x800) | SU9400 | Graphics Media Accelerator (GMA) 4500MHD | 3 GB | 834 | |
HP Compaq 2230s (3DMark 06 - Standard 1280x800) | P7370 | Graphics Media Accelerator (GMA) 4500MHD | 3 GB | 873 | |
Fujitsu-Siemens Amilo Si3655 (3DMark 06 - Standard 1280x800) | T9400 | Graphics Media Accelerator (GMA) 4500MHD 475 MHz 0 GB | 4 GB | 905 | |
Lenovo ThinkPad SL300 (3DMark 06 - Standard 1280x800) | P8600 | Graphics Media Accelerator (GMA) 4500MHD 475 MHz | 2 GB | 937 | |
Aristo Slim S100 (3DMark 06 - Standard 1280x800) | P8400 | Graphics Media Accelerator (GMA) 4500MHD | 4 GB | 943 | |
HawkForce Mobile.ForceM13.S1 (3DMark 06 - Standard 1280x800) | T6400 | Graphics Media Accelerator (GMA) 4500MHD 533 MHz | 2 GB | 951 | |
Dell Vostro 1320 (3DMark 06 - Standard 1280x800) | T6570 | Graphics Media Accelerator (GMA) 4500MHD | 4 GB | 952 | |
Toshiba Satellite Pro S300 (3DMark 06 - Standard 1280x800) | P8600 | Graphics Media Accelerator (GMA) 4500MHD | 3 GB | 959 | |
Dell Latitude E4300 (3DMark 06 - Standard 1280x800) | SP9400 | Graphics Media Accelerator (GMA) 4500MHD | 2 GB | 960 | |
Dell Latitude E5500 (3DMark 06 - Standard 1280x800) | T7250 | Graphics Media Accelerator (GMA) 4500MHD 475 MHz | 2 GB | 973 |
128 -85%
...
145 -83%
214 -75%
235 -73%
255 -70%
305 -65%
362.5 -58%
413.8 -52%
488.4 -43%
492 -43%
Intel Graphics Media Accelerator (GMA) 4500MHD
860
976 13%
1115 30%
1165 35%
1418 65%
1447 68%
1461 70%
1508 75%
1572 83%
1774 106%
...
13729 1496%
0%
100%
3DMark 06
min: 551 avg: 750 median: 696 (1%) max: 1030 Points
148 -80%
315 -58%
488.3 -35%
700 -7%
Intel Graphics Media Accelerator (GMA) 4500MHD
750
1075 43%
1181 57%
1342 79%
1610 115%
1617 116%
1678 124%
1682 124%
1883 151%
1961 161%
...
21792 2806%
0%
100%
3DMark 06
min: 533 avg: 609 median: 609 (1%) max: 685 Points
Model | CPU | GPU | RAM | Wartość | |
---|---|---|---|---|---|
3DMark 06 - Standard 1024x768 | |||||
(3DMark 06 - Standard 1024x768) | 723 | Graphics Media Accelerator (GMA) 4500MHD | 2 GB | 533 | |
HP ProBook 4310s (3DMark 06 - Standard 1024x768) | T3000 | Graphics Media Accelerator (GMA) 4500MHD | 1 GB | 685 |
88 -86%
132.6 -78%
149 -76%
291 -52%
528 -13%
Intel Graphics Media Accelerator (GMA) 4500MHD
609
725 19%
773 27%
1328 118%
1383 127%
1406 131%
1960 222%
2110 246%
2220 265%
2360 288%
...
NVIDIA GeForce GTX 1650 Mobile
42416 6865%
0%
100%
SPEC Viewperf 10.0 - SPEC Viewperf 10.0 - 3dsmax
min: 2.5 avg: 2.6 median: 2.6 (5%) max: 2.76 pkt.
Model | CPU | GPU | RAM | Wartość |
---|---|---|---|---|
Asus N20A | T5850 | Graphics Media Accelerator (GMA) 4500MHD | 3 GB | 2.5 |
Dell Vostro 1520 (Core 2 Duo T6570, GMA 4500MHD, 3GB RAM) | T6570 | Graphics Media Accelerator (GMA) 4500MHD 475 MHz | 3 GB | 2.76 |
0.8 -70%
Intel Graphics Media Accelerator (GMA) 4500MHD
2.63
5.75 119%
5.92 125%
6.555 149%
6.73 156%
7.44 183%
7.785 196%
9.87 275%
10.03 281%
10.23 289%
...
48.21 1733%
0%
100%
SPEC Viewperf 10.0 - SPEC Viewperf 10.0 - Catia
1.3 pkt. (3%)
Model | CPU | GPU | RAM | Wartość |
---|---|---|---|---|
Dell Vostro 1520 (Core 2 Duo T6570, GMA 4500MHD, 3GB RAM) | T6570 | Graphics Media Accelerator (GMA) 4500MHD 475 MHz | 3 GB | 1.33 |
Intel Graphics Media Accelerator (GMA) 4500MHD
1.33
5.65 325%
5.74 332%
5.74 332%
6.115 360%
6.16 363%
7.795 486%
9.92 646%
10.72 706%
11.31 750%
...
47.59 3478%
0%
100%
SPEC Viewperf 10.0 - SPEC Viewperf 10.0 - EnSight
min: 1.04 avg: 1.1 median: 1.1 (2%) max: 1.17 pkt.
Model | CPU | GPU | RAM | Wartość |
---|---|---|---|---|
Asus N20A | T5850 | Graphics Media Accelerator (GMA) 4500MHD | 3 GB | 1.04 |
Dell Vostro 1520 (Core 2 Duo T6570, GMA 4500MHD, 3GB RAM) | T6570 | Graphics Media Accelerator (GMA) 4500MHD 475 MHz | 3 GB | 1.17 |
0.4 -64%
Intel Graphics Media Accelerator (GMA) 4500MHD
1.105
6.44 483%
8.36 657%
10.67 866%
11.67 956%
11.9 977%
11.96 982%
11.99 985%
13.47 1119%
14.13 1179%
...
47.37 4187%
0%
100%
SPEC Viewperf 10.0 - SPEC Viewperf 10.0 - Maya
min: 4.02 avg: 4.5 median: 4.5 (2%) max: 5.05 pkt.
Model | CPU | GPU | RAM | Wartość |
---|---|---|---|---|
Asus N20A | T5850 | Graphics Media Accelerator (GMA) 4500MHD | 3 GB | 4.02 |
Dell Vostro 1520 (Core 2 Duo T6570, GMA 4500MHD, 3GB RAM) | T6570 | Graphics Media Accelerator (GMA) 4500MHD 475 MHz | 3 GB | 5.05 |
1.4 -69%
Intel Graphics Media Accelerator (GMA) 4500MHD
4.535
12.62 178%
16.91 273%
17.43 284%
17.93 295%
19.03 320%
19.27 325%
20.39 350%
20.55 353%
20.78 358%
...
186.6 4015%
0%
100%
SPEC Viewperf 10.0 - SPEC Viewperf 10.0 - Pro/Engeneer
min: 1.26 avg: 1.3 median: 1.3 (3%) max: 1.33 pkt.
Model | CPU | GPU | RAM | Wartość |
---|---|---|---|---|
Asus N20A | T5850 | Graphics Media Accelerator (GMA) 4500MHD | 3 GB | 1.26 |
Dell Vostro 1520 (Core 2 Duo T6570, GMA 4500MHD, 3GB RAM) | T6570 | Graphics Media Accelerator (GMA) 4500MHD 475 MHz | 3 GB | 1.33 |
0.5 -61%
Intel Graphics Media Accelerator (GMA) 4500MHD
1.295
5.995 363%
7.38 470%
7.52 481%
7.76 499%
7.825 504%
7.9 510%
8.55 560%
10 672%
10.32 697%
...
51.1 3846%
0%
100%
SPEC Viewperf 10.0 - SPEC Viewperf 10.0 - SolidWorks
min: 2.14 avg: 2.2 median: 2.2 (3%) max: 2.3 pkt.
Model | CPU | GPU | RAM | Wartość |
---|---|---|---|---|
Asus N20A | T5850 | Graphics Media Accelerator (GMA) 4500MHD | 3 GB | 2.14 |
Dell Vostro 1520 (Core 2 Duo T6570, GMA 4500MHD, 3GB RAM) | T6570 | Graphics Media Accelerator (GMA) 4500MHD 475 MHz | 3 GB | 2.3 |
0.8 -64%
Intel Graphics Media Accelerator (GMA) 4500MHD
2.22
6.61 198%
8.05 263%
8.32 275%
9.06 308%
10.55 375%
11.04 397%
12.27 453%
13.58 512%
14.06 533%
...
67.5 2941%
0%
100%
SPEC Viewperf 10.0 - SPEC Viewperf 10.0 - UGS Teamcenter
min: 0.29 avg: 0.3 median: 0.3 (1%) max: 0.3 pkt.
Model | CPU | GPU | RAM | Wartość |
---|---|---|---|---|
Asus N20A | T5850 | Graphics Media Accelerator (GMA) 4500MHD | 3 GB | 0.29 |
Dell Vostro 1520 (Core 2 Duo T6570, GMA 4500MHD, 3GB RAM) | T6570 | Graphics Media Accelerator (GMA) 4500MHD 475 MHz | 3 GB | 0.3 |
0.1 -66%
Intel Graphics Media Accelerator (GMA) 4500MHD
0.295
1.12 280%
1.42 381%
1.72 483%
2.78 842%
2.84 863%
3.055 936%
3.11 954%
3.15 968%
3.35 1036%
...
38.52 12958%
0%
100%
SPEC Viewperf 10.0 - SPEC Viewperf 10.0 - UGS NX
min: 0.28 avg: 0.3 median: 0.3 (1%) max: 0.3 pkt.
Model | CPU | GPU | RAM | Wartość |
---|---|---|---|---|
Asus N20A | T5850 | Graphics Media Accelerator (GMA) 4500MHD | 3 GB | 0.28 |
Dell Vostro 1520 (Core 2 Duo T6570, GMA 4500MHD, 3GB RAM) | T6570 | Graphics Media Accelerator (GMA) 4500MHD 475 MHz | 3 GB | 0.3 |
Intel Graphics Media Accelerator (GMA) 4500MHD
0.29
0.9 210%
1.03 255%
1.98 583%
3.79 1207%
4 1279%
4.04 1293%
4.89 1586%
4.98 1617%
5.09 1655%
...
48.9 16762%
0%
100%
Windows 7 Experience Index - Win7 Gaming graphics
min: 3 avg: 3.3 median: 3.3 (42%) max: 4 Points
Model | CPU | GPU | RAM | Wartość |
---|---|---|---|---|
Fujitsu LifeBook P3110 | SU4100 | Graphics Media Accelerator (GMA) 4500MHD 533 MHz | 4 GB | 3 |
Dell Vostro V13 | SU3500 | Graphics Media Accelerator (GMA) 4500MHD 475 MHz | 2 GB | 3.2 |
Dell Adamo XPS | SU9400 | Graphics Media Accelerator (GMA) 4500MHD 475 MHz | 4 GB | 3.2 |
Acer Aspire One 752 | 743 | Graphics Media Accelerator (GMA) 4500MHD | 2 GB | 3.2 |
Toshiba Satellite T110-10R | SU2700 | Graphics Media Accelerator (GMA) 4500MHD 533 MHz | 3 GB | 3.3 |
HP 620 WT092EA | T4500 | Graphics Media Accelerator (GMA) 4500MHD | 2 GB | 3.3 |
Samsung R530-JA09DE | T4500 | Graphics Media Accelerator (GMA) 4500MHD | 3 GB | 3.3 |
HP ProBook 5310m | SP9300 | Graphics Media Accelerator (GMA) 4500MHD | 2 GB | 3.4 |
Lenovo ThinkPad SL510 | T6670 | Graphics Media Accelerator (GMA) 4500MHD | 3 GB | 3.4 |
Fujitsu Lifebook A1130 | T6600 | Graphics Media Accelerator (GMA) 4500MHD | 4 GB | 3.4 |
Sony Vaio VPC-Y11S1ES | SU7300 | Graphics Media Accelerator (GMA) 4500MHD | 4 GB | 3.4 |
Asus K50IJ-SX | T4300 | Graphics Media Accelerator (GMA) 4500MHD 475 MHz | 4 GB | 4 |
2.36 -29%
2.997 -10%
3.2 -4%
3.3 -1%
Intel Graphics Media Accelerator (GMA) 4500MHD
3.342
3.4 2%
3.4 2%
4.383 31%
4.5 35%
4.75 42%
4.825 44%
4.863 46%
4.933 48%
5 50%
...
7.9 136%
0%
100%
Windows 7 Experience Index - Win7 Graphics
min: 3.2 avg: 3.5 median: 3.5 (44%) max: 4.1 Points
Model | CPU | GPU | RAM | Wartość |
---|---|---|---|---|
Fujitsu LifeBook P3110 | SU4100 | Graphics Media Accelerator (GMA) 4500MHD 533 MHz | 4 GB | 3.2 |
Dell Vostro V13 | SU3500 | Graphics Media Accelerator (GMA) 4500MHD 475 MHz | 2 GB | 3.2 |
Dell Adamo XPS | SU9400 | Graphics Media Accelerator (GMA) 4500MHD 475 MHz | 4 GB | 3.2 |
Acer Aspire One 752 | 743 | Graphics Media Accelerator (GMA) 4500MHD | 2 GB | 3.2 |
HP 620 WT092EA | T4500 | Graphics Media Accelerator (GMA) 4500MHD | 2 GB | 3.4 |
Samsung R530-JA09DE | T4500 | Graphics Media Accelerator (GMA) 4500MHD | 3 GB | 3.4 |
Lenovo ThinkPad SL510 | T6670 | Graphics Media Accelerator (GMA) 4500MHD | 3 GB | 3.5 |
Toshiba Satellite T110-10R | SU2700 | Graphics Media Accelerator (GMA) 4500MHD 533 MHz | 3 GB | 3.5 |
Asus K50IJ-SX | T4300 | Graphics Media Accelerator (GMA) 4500MHD 475 MHz | 4 GB | 3.6 |
HP ProBook 5310m | SP9300 | Graphics Media Accelerator (GMA) 4500MHD | 2 GB | 3.8 |
Fujitsu Lifebook A1130 | T6600 | Graphics Media Accelerator (GMA) 4500MHD | 4 GB | 4.1 |
Sony Vaio VPC-Y11S1ES | SU7300 | Graphics Media Accelerator (GMA) 4500MHD | 4 GB | 4.1 |
3.1 -12%
...
2.995 -15%
3.1 -12%
3.275 -7%
3.4 -3%
3.517 0%
Intel Graphics Media Accelerator (GMA) 4500MHD
3.517
3.533 0%
3.55 1%
3.7 5%
3.733 6%
4 14%
4.033 15%
4.083 16%
4.133 18%
4.158 18%
...
7.9 125%
0%
100%
Windows Vista Experience Index - Windows Vista Leistungsindex - Grafik (Spiele)
min: 3.3 avg: 3.6 median: 3.5 (51%) max: 4 Points
2.5 -30%
2.6 -27%
2.7 -24%
3.1 -13%
3.3 -7%
3.42 -4%
3.5 -1%
Intel Graphics Media Accelerator (GMA) 4500MHD
3.552
3.8 7%
3.8 7%
3.8 7%
3.9 10%
4.45 25%
4.6 30%
4.65 31%
4.7 32%
4.7 32%
...
6.8 91%
0%
100%
Windows Vista Experience Index - Windows Vista Leistungsindex - Grafik
min: 3.1 avg: 3.6 median: 3.4 (50%) max: 5 Points
2.9 -20%
3 -17%
3.2 -12%
3.3 -9%
3.34 -8%
3.4 -6%
3.4 -6%
3.45 -5%
3.5 -3%
Intel Graphics Media Accelerator (GMA) 4500MHD
3.617
3.8 5%
4 11%
4.1 13%
4.2 16%
4.4 22%
4.533 25%
4.667 29%
4.767 32%
4.8 33%
...
6.8 88%
0%
100%
Cinebench R10 - Cinebench R10 Shading (32bit)
min: 516 avg: 800 median: 773 (1%) max: 1227 pkt.
29 -96%
...
Qualcomm Adreno 685
373 -53%
442 -45%
Qualcomm Adreno 690
558 -30%
618 -23%
647 -19%
669 -16%
680 -15%
687 -14%
763 -5%
Intel Graphics Media Accelerator (GMA) 4500MHD
800
805 1%
867 8%
972 22%
1041 30%
1174 47%
1338 67%
1342 68%
1369 71%
1443 80%
...
24367 2946%
0%
100%
Cinebench R11.5 - Cinebench R11.5 OpenGL 64 Bit
1 fps (0%)
Model | CPU | GPU | RAM | Wartość |
---|---|---|---|---|
HP 620 WT092EA | T4500 | Graphics Media Accelerator (GMA) 4500MHD | 2 GB | 1.01 |
Intel Graphics Media Accelerator (GMA) 4500MHD
1.01
1.05 4%
1.225 21%
2.01 99%
2.591 157%
3.517 248%
3.55 251%
3.78 274%
3.99 295%
3.99 295%
...
212.8 20969%
max:
Nvidia RTX A2000
303.9 29989%
0%
100%
Cinebench R15 OpenGL 64 Bit +
Cinebench R15 - Cinebench R15 OpenGL 64 Bit
0.8 fps (0%)
Model | CPU | GPU | RAM | Wartość |
---|---|---|---|---|
Asus UL50VF | SU7300 | Graphics Media Accelerator (GMA) 4500MHD | 4 GB | 0.82 |
Intel Graphics Media Accelerator (GMA) 4500MHD
0.82
5.045 515%
5.45 565%
6.767 725%
7.53 818%
9.55 1065%
10.33 1160%
10.73 1209%
11 1241%
11 1241%
...
369 44900%
max:
Nvidia RTX A2000
371.8 45241%
0%
100%
Cinebench R15 - Cinebench R15 OpenGL Ref. Match 64 Bit
98.8 % (99%)
Model | CPU | GPU | RAM | Wartość |
---|---|---|---|---|
Asus UL50VF | SU7300 | Graphics Media Accelerator (GMA) 4500MHD | 4 GB | 98.8 |
32.55 -67%
...
Intel Iris Plus Graphics 655
98.1 -1%
98.1 -1%
AMD Radeon RX 6600M
98.1 -1%
98.1 -1%
98.1 -1%
98.2 -1%
98.5 0%
98.6 0%
98.6 0%
Intel Graphics Media Accelerator (GMA) 4500MHD
98.8
98.8 0%
AMD Radeon Pro Vega 20
98.8 0%
98.8 0%
98.8 0%
98.8 0%
NVIDIA RTX A3000 Laptop GPU
99 0%
99.1 0%
99.3 1%
Apple M2 10-Core GPU
99.5 1%
...
NVIDIA T1200 Laptop GPU
99.6 1%
0%
100%
- Zakres wyników testów referencyjnych dla tej karty graficznej
- Średnia wartość wyników testów referencyjnych dla tej karty graficzne
* Smaller numbers mean a higher performance
- Średnia wartość wyników testów referencyjnych dla tej karty graficzne
* Smaller numbers mean a higher performance
Testy gier
Zamieszczone niżej wyniki pochodzą z testów zrecenzowanych laptopów. Należy pamiętać, że osiągi poszczególnych konfiguracji zależą od zastosowanej pamięci własnej karty (VRAM), zegarów karty (mogą być różne), procesora, ustawień systemu, sterowników i wersji systemu operacyjnego. Tym samym uzyskane wyniki nie muszą być reprezentatywne dla wszystkich laptopów wyposażonych w daną kartę graficzną. By uzyskać szczegółowe informacje o wynikach testów, należy kliknąć na podaną wartość liczbową (fps, czyli kl/s).
League of Legends
2019low 1280x720
20.6
[X] Asus UL50VF
Intel Core 2 Duo SU7300 @1.7GHz
Graphics Media Accelerator (GMA) 4500MHD
min: 15 fps, max: 27 fps
fps
+ Porównaj
- Ukryj porównanieIntel Core 2 Duo SU7300 @1.7GHz
Graphics Media Accelerator (GMA) 4500MHD
min: 15 fps, max: 27 fps
Intel Graphics Media Accelerator (GMA) 4500MHD
20.6
23.6 15%
28.2 37%
37 80%
42.5 106%
49.8 142%
52.4 154%
74.9 264%
79 283%
85.2 314%
...
216.6 951%
max:
NVIDIA GeForce GTX 1070 Ti (Desktop)
271 1216%
0%
100%
» Niegrywalna na większości testowanych laptopów.
F1 2013
2013low 1024x768
0 (!)
[X] Asus UL50VF
Intel Core 2 Duo SU7300 1.3GHz
Graphics Media Accelerator (GMA) 4500MHD
Problem during benchmarking occured: severe graphical problems
fps
+ Porównaj
- Ukryj porównanieIntel Core 2 Duo SU7300 1.3GHz
Graphics Media Accelerator (GMA) 4500MHD
Problem during benchmarking occured: severe graphical problems
...
Intel Graphics Media Accelerator (GMA) 4500MHD
0
...
max:
NVIDIA GeForce GTX 660 Ti
0%
100%
Fifa 14
2013low 1024x768
7.35 -62%
Intel Graphics Media Accelerator (GMA) 4500MHD
19.5
28.5 46%
28.6 47%
29.1 49%
30 54%
90.8 366%
91.4 369%
94 382%
95.2 388%
102.8 427%
...
489.3 2409%
max:
NVIDIA GeForce GTX 660 Ti
752 3756%
0%
100%
med. 1366x768
5 -68%
Intel Graphics Media Accelerator (GMA) 4500MHD
15.6
20.99 35%
22.8 46%
48.8 213%
51.2 228%
52 233%
53.2 241%
54.4 249%
57.7 270%
59.2 279%
...
373.8 2296%
max:
NVIDIA GeForce GTX 660 Ti
554 3451%
0%
100%
high 1366x768
14.2 -11%
Intel Graphics Media Accelerator (GMA) 4500MHD
16
16.8 5%
24 50%
32 100%
32.35 102%
33.3 108%
37 131%
37.2 133%
42.3 164%
45.2 183%
...
349.2 2083%
max:
NVIDIA GeForce GTX 660 Ti
546 3313%
0%
100%
» Niegrywalna na większości testowanych laptopów.
low 1024x768
6.04 -54%
6.567 -49%
12.3 -5%
Intel Graphics Media Accelerator (GMA) 4500MHD
13
16.7 28%
19.65 51%
21.8 68%
22.1 70%
23.9 84%
24.45 88%
24.83 91%
24.85 91%
24.9 92%
...
119.8 822%
max:
AMD Radeon R7 370
120 823%
0%
100%
med. 1366x768
6.4 -9%
Intel Graphics Media Accelerator (GMA) 4500MHD
7
10.1 44%
11.6 66%
13.25 89%
15 114%
15.75 125%
16.35 134%
16.5 136%
16.85 141%
18.45 164%
...
119.9 1613%
max:
AMD Radeon R7 370
120 1614%
0%
100%
» Niegrywalna na większości testowanych laptopów.
low 1024x768
25.6 -11%
Intel Graphics Media Accelerator (GMA) 4500MHD
28.7
39.2 37%
43 50%
46 60%
50.3 75%
54.7 91%
64.4 124%
64.6 125%
71.5 149%
71.6 149%
...
753 2524%
0%
100%
med. 1366x768
Intel Graphics Media Accelerator (GMA) 4500MHD
4.5
10.1 124%
13.03 190%
15 233%
Intel UHD Graphics (Jasper Lake 32 EU)
15.3 240%
15.4 242%
16.3 262%
16.9 276%
18.5 311%
21.65 381%
...
346.2 7593%
0%
100%
» Niegrywalna na większości testowanych laptopów.
Dead Space 3
2013low 1024x768
Intel Graphics Media Accelerator (GMA) 4500MHD
7
19.3 176%
19.35 176%
21.1 201%
28.6 309%
30 329%
30 329%
30.4 334%
32.2 360%
32.3 361%
...
458 6443%
0%
100%
» Niegrywalna na większości testowanych laptopów.
Dishonored
2012low 1024x768
Intel Graphics Media Accelerator (GMA) 4500MHD
5
11.5 130%
13.05 161%
13.4 168%
13.8 176%
15 200%
15 200%
15.2 204%
16.2 224%
17.6 252%
...
130 2500%
0%
100%
» Niegrywalna na większości testowanych laptopów.
World of Tanks v8
2012low 1024x768
Intel Graphics Media Accelerator (GMA) 4500MHD
10.9
23 111%
36 230%
42.6 291%
44.4 307%
47.6 337%
48.3 343%
49.7 356%
49.8 357%
51.7 374%
...
124 1038%
0%
100%
» Niegrywalna na większości testowanych laptopów.
Fifa 13
2012low 1024x768
4.6 -84%
6.7 -76%
8 -71%
16 -43%
16.6 -41%
26.33 -6%
Intel Graphics Media Accelerator (GMA) 4500MHD
28
36.6 31%
38.9 39%
41 46%
43.4 55%
50 79%
57.5 105%
58.7 110%
65.1 133%
66 136%
...
650 2221%
0%
100%
med. 1366x768
13 -19%
Intel Graphics Media Accelerator (GMA) 4500MHD
16
25.9 62%
27.1 69%
30 88%
32.2 101%
35.68 123%
41 156%
41.83 161%
43.5 172%
44 175%
...
465.5 2809%
0%
100%
high 1366x768
Intel Graphics Media Accelerator (GMA) 4500MHD
15
19.61 31%
20.38 36%
22 47%
22.55 50%
27.11 81%
28.9 93%
30.5 103%
33.5 123%
34 127%
...
420.8 2705%
max:
NVIDIA GeForce GTX 680
425 2733%
0%
100%
» Niegrywalna na większości testowanych laptopów.
low 1024x768
Intel Graphics Media Accelerator (GMA) 4500MHD
19.3
24.3 26%
41.1 113%
42 118%
48 149%
48.4 151%
53.5 177%
57.1 196%
61.7 220%
65 237%
...
174 802%
0%
100%
med. 1366x768
Intel Graphics Media Accelerator (GMA) 4500MHD
11.4
12.6 11%
26.4 132%
34.4 202%
35.35 210%
39.4 246%
42 268%
45.4 298%
46 304%
47.1 313%
...
125 996%
0%
100%
» Niegrywalna na większości testowanych laptopów.
Counter-Strike: GO
2012low 1024x768
10.5 -35%
12.2 -25%
15.3 -6%
Intel Graphics Media Accelerator (GMA) 4500MHD
16.2
17.4 7%
19.3 19%
21.1 30%
25.6 58%
26.9 66%
27.9 72%
28.87 78%
29.7 83%
35.4 119%
...
316 1851%
0%
100%
med. 1366x768
Intel Graphics Media Accelerator (GMA) 4500MHD
9
11.5 28%
14 56%
14.3 59%
19.2 113%
19.5 117%
19.8 120%
21.7 141%
21.9 143%
21.95 144%
...
296.3 3192%
0%
100%
high 1366x768
6.8 (!)
[X] Asus UL50VF
Intel Core 2 Duo SU7300 @1.7GHz
Graphics Media Accelerator (GMA) 4500MHD
Problem during benchmarking occured: no Antialiasing
fps
+ Porównaj
- Ukryj porównanieIntel Core 2 Duo SU7300 @1.7GHz
Graphics Media Accelerator (GMA) 4500MHD
Problem during benchmarking occured: no Antialiasing
Intel Graphics Media Accelerator (GMA) 4500MHD
6.8
10.4 53%
11.9 75%
16.65 145%
16.7 146%
16.75 146%
17.8 162%
18.8 176%
18.9 178%
19.3 184%
...
261.9 3751%
0%
100%
» Niegrywalna na większości testowanych laptopów.
Dirt Showdown
2012low 1024x768
9 (!)
[X] Asus UL50VF
Intel Core 2 Duo SU7300 @1.7GHz
Graphics Media Accelerator (GMA) 4500MHD
Problem during benchmarking occured: small graphical problems
fps
+ Porównaj
- Ukryj porównanieIntel Core 2 Duo SU7300 @1.7GHz
Graphics Media Accelerator (GMA) 4500MHD
Problem during benchmarking occured: small graphical problems
Intel Graphics Media Accelerator (GMA) 4500MHD
9
15.9 77%
16.5 83%
19.9 121%
25 178%
27 200%
27.3 203%
27.7 208%
28 211%
29.2 224%
...
123.1 1268%
0%
100%
» Niegrywalna na większości testowanych laptopów.
Diablo III
2012low 1024x768
-1 (!)
[X] Asus UL50VF
Intel Core 2 Duo SU7300 @1.7GHz
Graphics Media Accelerator (GMA) 4500MHD
Problem during benchmarking occured: game wont start
fps
+ Porównaj
- Ukryj porównanieIntel Core 2 Duo SU7300 @1.7GHz
Graphics Media Accelerator (GMA) 4500MHD
Problem during benchmarking occured: game wont start
10.3 -1130%
...
Intel Graphics Media Accelerator (GMA) 4500MHD
-1
10.3 -1130%
14.93 -1593%
15.82 -1682%
17.35 -1835%
18.3 -1930%
18.93 -1993%
20 -2100%
22.5 -2350%
22.8 -2380%
...
340.8 -34180%
0%
100%
» Niegrywalna na większości testowanych laptopów.
Mass Effect 3
2012low 1280x720
Intel Graphics Media Accelerator (GMA) 4500MHD
7
10.45 49%
11.4 63%
11.75 68%
11.9 70%
15.2 117%
17.5 150%
18 157%
18.4 163%
18.7 167%
...
60.2 760%
0%
100%
» Niegrywalna na większości testowanych laptopów.
Alan Wake
2012low 1024x768
-1 (!)
[X] Asus UL50VF
Intel Core 2 Duo SU7300 @1.7GHz
Graphics Media Accelerator (GMA) 4500MHD
Problem during benchmarking occured: game wont start Multisampling not supported
fps
+ Porównaj
- Ukryj porównanieIntel Core 2 Duo SU7300 @1.7GHz
Graphics Media Accelerator (GMA) 4500MHD
Problem during benchmarking occured: game wont start Multisampling not supported
5.8 -680%
...
Intel Graphics Media Accelerator (GMA) 4500MHD
-1
5.7 -670%
5.8 -680%
8.4 -940%
9 -1000%
10 -1100%
11.2 -1220%
11.8 -1280%
12.2 -1320%
13.14 -1414%
...
152.6 -15360%
0%
100%
» Niegrywalna na większości testowanych laptopów.
Anno 2070
2011low 1024x768
3.9 -32%
Intel Graphics Media Accelerator (GMA) 4500MHD
5.7
13 128%
16.65 192%
16.84 195%
17.3 204%
18 216%
20.2 254%
20.68 263%
21.13 271%
23.15 306%
...
270.3 4642%
max:
AMD Radeon HD 7870
311.8 5370%
0%
100%
» Niegrywalna na większości testowanych laptopów.
low 1024x768
Intel Graphics Media Accelerator (GMA) 4500MHD
17
35.8 111%
37 118%
44.6 162%
48.3 184%
57 235%
64 276%
68.7 304%
70.9 317%
79.6 368%
...
264.4 1455%
max:
ATI Radeon HD 5850
294.6 1633%
0%
100%
med. 1366x768
Intel Graphics Media Accelerator (GMA) 4500MHD
7
20 186%
23.8 240%
25 257%
26 271%
30.1 330%
31.9 356%
34.4 391%
35.25 404%
36.7 424%
...
188.1 2587%
0%
100%
» Niegrywalna na większości testowanych laptopów.
Fifa 12
2011low 800x600
17 -43%
18 -40%
29.5 -2%
29.7 -1%
Intel Graphics Media Accelerator (GMA) 4500MHD
30
33.2 11%
63.1 110%
63.4 111%
64.4 115%
79.9 166%
85.8 186%
86.3 188%
88.5 195%
94.8 216%
...
520 1633%
max:
NVIDIA GeForce GTX 590
575 1817%
0%
100%
med. 1024x768
11.1 -35%
12.9 -24%
Intel Graphics Media Accelerator (GMA) 4500MHD
17
18.4 8%
20.12 18%
30.2 78%
39.75 134%
47.6 180%
48.64 186%
49 188%
49.01 188%
51.3 202%
...
393.5 2215%
max:
NVIDIA GeForce GTX 470
438 2476%
0%
100%
high 1360x768
5.6 -60%
Intel Graphics Media Accelerator (GMA) 4500MHD
14
15.7 12%
21.2 51%
23.12 65%
27.57 97%
29.3 109%
32.41 132%
33 136%
34.2 144%
35.04 150%
...
347.4 2381%
max:
NVIDIA GeForce GTX 580
380 2614%
0%
100%
» Niegrywalna na większości testowanych laptopów.
low 1024x768
Intel Graphics Media Accelerator (GMA) 4500MHD
11
18 64%
18.4 67%
19.7 79%
20.43 86%
20.5 86%
21 91%
21.75 98%
22.9 108%
23.78 116%
...
264 2300%
0%
100%
» Niegrywalna na większości testowanych laptopów.
Dirt 3
2011low 800x600
8 -46%
14.5 -3%
Intel Graphics Media Accelerator (GMA) 4500MHD
14.9
15.9 7%
24.77 66%
25 68%
28.1 89%
29.4 97%
30.5 105%
32 115%
40.1 169%
41.1 176%
...
299.7 1911%
0%
100%
med. 1024x768
6 -53%
12.5 -2%
12.6 -2%
Intel Graphics Media Accelerator (GMA) 4500MHD
12.8
12.85 0%
13.1 2%
14.3 12%
14.7 15%
16.5 29%
16.8 31%
17 33%
21.03 64%
21.4 67%
...
202.7 1484%
0%
100%
» Niegrywalna na większości testowanych laptopów.
Crysis 2
2011low 800x600
Intel Graphics Media Accelerator (GMA) 4500MHD
6
18 200%
22 267%
22.5 275%
24.9 315%
27.4 357%
29.7 395%
30 400%
30 400%
31.95 433%
...
347.8 5697%
0%
100%
med. 1024x768
Intel Graphics Media Accelerator (GMA) 4500MHD
5
15 200%
15.3 206%
16.9 238%
18.4 268%
18.9 278%
20.2 304%
20.4 308%
20.65 313%
23.5 370%
...
239 4680%
0%
100%
high 1366x768
Intel Graphics Media Accelerator (GMA) 4500MHD
3
11.1 270%
12.5 317%
13.1 337%
14.6 387%
14.75 392%
14.9 397%
16.1 437%
17.7 490%
17.72 491%
...
162.5 5317%
0%
100%
» Niegrywalna na większości testowanych laptopów.
low 1024x768
Intel Graphics Media Accelerator (GMA) 4500MHD
11
18 64%
18.8 71%
26.2 138%
31.7 188%
32.7 197%
40.5 268%
41.35 276%
43.2 293%
44.6 305%
...
303 2655%
max:
NVIDIA GeForce GTX 470
426.6 3778%
0%
100%
» Niegrywalna na większości testowanych laptopów.
low 800x600
6.1 -32%
Intel Graphics Media Accelerator (GMA) 4500MHD
9
25.67 185%
26 189%
28 211%
29 222%
31 244%
31 244%
31.6 251%
32 256%
35 289%
...
167.5 1761%
0%
100%
» Niegrywalna na większości testowanych laptopów.
Fifa 11
2010low 800x600
3 -93%
38 -12%
Intel Graphics Media Accelerator (GMA) 4500MHD
43
50.6 18%
53.6 25%
59 37%
68.5 59%
100.1 133%
104 142%
121.5 183%
129.5 201%
130.5 203%
...
659 1433%
0%
100%
med. 1024x768
Intel Graphics Media Accelerator (GMA) 4500MHD
23
29.07 26%
39.9 73%
43.9 91%
55.4 141%
62.2 170%
65 183%
66 187%
69.5 202%
71.5 211%
...
426.6 1755%
0%
100%
high 1360x768
Intel Graphics Media Accelerator (GMA) 4500MHD
18
20 11%
21.13 17%
21.8 21%
29.8 66%
32.36 80%
33.3 85%
36.6 103%
36.8 104%
37 106%
...
347.7 1832%
0%
100%
» Na wszystkich testowanych laptopach grywalna przy ustawieniach low.
StarCraft 2
2010low 1024x768
3.5 -68%
Intel Graphics Media Accelerator (GMA) 4500MHD
11
12.5 14%
23.98 118%
25.3 130%
27.1 146%
34.5 214%
35 218%
36.87 235%
37 236%
38 245%
...
539 4800%
0%
100%
med. 1360x768
Intel Graphics Media Accelerator (GMA) 4500MHD
4
7 75%
8 100%
8.8 120%
9.6 140%
10.01 150%
12 200%
12.4 210%
13 225%
14 250%
...
224.1 5503%
0%
100%
» Niegrywalna na większości testowanych laptopów.
low 1024x768
6.1
[X] Asus UL50VF
Intel Core 2 Duo SU7300 @1.7GHz
Graphics Media Accelerator (GMA) 4500MHD
min: 1.9 fps, max: 14.7 fps
fps
+ Porównaj
- Ukryj porównanieIntel Core 2 Duo SU7300 @1.7GHz
Graphics Media Accelerator (GMA) 4500MHD
min: 1.9 fps, max: 14.7 fps
Intel Graphics Media Accelerator (GMA) 4500MHD
6.14
18.75 205%
26.4 330%
37.03 503%
39 535%
55 796%
57 828%
64 942%
71 1056%
78.8 1183%
...
124 1920%
max:
NVIDIA GeForce GTX 680
137 2131%
0%
100%
» Niegrywalna na większości testowanych laptopów.
low 1024x768
6.7 -16%
Intel Graphics Media Accelerator (GMA) 4500MHD
8
8.8 10%
9 13%
10.6 33%
12 50%
12.8 60%
17.7 121%
20.16 152%
21.2 165%
22.1 176%
...
200 2400%
0%
100%
» Niegrywalna na większości testowanych laptopów.
CoD Modern Warfare 2
2009low 800x600
12.36 -23%
Intel Graphics Media Accelerator (GMA) 4500MHD
16
26 63%
28.63 79%
48.3 202%
50 213%
56 250%
57.8 261%
58.4 265%
58.7 267%
60.9 281%
...
361.4 2159%
0%
100%
» Niegrywalna na większości testowanych laptopów.
low 800x600
Intel Graphics Media Accelerator (GMA) 4500MHD
8
13.14 64%
15 88%
15.4 93%
20.1 151%
21 163%
21.6 170%
23.15 189%
25.03 213%
25.78 222%
...
189.3 2266%
0%
100%
» Niegrywalna na większości testowanych laptopów.
low 800x600
6.5 -58%
13.1 -15%
Intel Graphics Media Accelerator (GMA) 4500MHD
15.5
17.7 14%
18.1 17%
23.93 54%
31.3 102%
31.5 103%
33.8 118%
35.8 131%
36.03 132%
37.6 143%
...
202.6 1207%
0%
100%
high 1360x768
Intel Graphics Media Accelerator (GMA) 4500MHD
4.5
10.2 127%
12.7 182%
13.3 196%
13.63 203%
17.5 289%
17.8 296%
17.8 296%
17.8 296%
18.8 318%
...
143.7 3093%
0%
100%
» Niegrywalna na większości testowanych laptopów.
low 800x600
23.1 -2410%
...
Intel Graphics Media Accelerator (GMA) 4500MHD
-1
23.1 -2410%
24 -2500%
27.5 -2850%
30 -3100%
30.29 -3129%
31.3 -3230%
31.6 -3260%
31.93 -3293%
32 -3300%
...
141.9 -14290%
0%
100%
» Niegrywalna na większości testowanych laptopów.
low 800x600
19.35 -2035%
...
Intel Graphics Media Accelerator (GMA) 4500MHD
-1
19.15 -2015%
19.35 -2035%
26.33 -2733%
27.1 -2810%
28.9 -2990%
30 -3100%
30.13 -3113%
31.57 -3257%
32.5 -3350%
...
234.9 -23590%
0%
100%
» Niegrywalna na większości testowanych laptopów.
low 1024x768
Intel Graphics Media Accelerator (GMA) 4500MHD
7
22 214%
22.3 219%
22.95 228%
23.48 235%
26.12 273%
31.25 346%
32 357%
37.94 442%
48 586%
...
329 4600%
0%
100%
» Niegrywalna na większości testowanych laptopów.
low 800x600
5.3 -86%
33.98 -11%
Intel Graphics Media Accelerator (GMA) 4500MHD
38
40.9 8%
60 58%
63 66%
69.9 84%
78.1 106%
89.5 136%
92.1 142%
94 147%
103 171%
...
723 1803%
0%
100%
med. 1024x768
11.39 -29%
14.5 -9%
Intel Graphics Media Accelerator (GMA) 4500MHD
16
18 13%
19 19%
23.83 49%
24 50%
24.65 54%
27 69%
28.5 78%
31.8 99%
32.68 104%
...
295 1744%
0%
100%
high 1280x1024
2 -78%
Intel Graphics Media Accelerator (GMA) 4500MHD
9
12.2 36%
13 44%
13.2 47%
14 56%
17 89%
17.27 92%
20.5 128%
21 133%
21 133%
...
187 1978%
0%
100%
» Na większości testowanych laptopów grywalna przy ustawieniach low.
low 800x600
22.2 -11%
Intel Graphics Media Accelerator (GMA) 4500MHD
25
27.9 12%
37 48%
45 80%
54.8 119%
70.6 182%
71.7 187%
72 188%
73 192%
73.7 195%
...
283.8 1035%
0%
100%
med. 1024x768
Intel Graphics Media Accelerator (GMA) 4500MHD
11
12 9%
13 18%
20 82%
21 91%
25.05 128%
27 145%
29.7 170%
32.37 194%
33 200%
...
202.4 1740%
0%
100%
» Niegrywalna na większości testowanych laptopów.
low 800x600
15.28 -1628%
...
Intel Graphics Media Accelerator (GMA) 4500MHD
-1
15.28 -1628%
20.66 -2166%
26 -2700%
29.8 -3080%
30.83 -3183%
31 -3200%
36 -3700%
38.11 -3911%
39.12 -4012%
...
65.5 -6650%
0%
100%
» Niegrywalna na większości testowanych laptopów.
low 640x480
2 -94%
2.6 -92%
6 -81%
14.3 -56%
25.16 -22%
26.7 -18%
28.98 -11%
Intel Graphics Media Accelerator (GMA) 4500MHD
32.4
34.8 7%
36.5 13%
45 39%
53 64%
60 85%
60.1 85%
64 98%
68 110%
78 141%
...
250.2 672%
0%
100%
» Niegrywalna na większości testowanych laptopów.
low 640x480
Intel Graphics Media Accelerator (GMA) 4500MHD
11.5
18.8 63%
25.7 123%
28.6 149%
33 187%
36 213%
38.45 234%
43.29 276%
49 326%
50.5 339%
...
199.7 1637%
0%
100%
high 1024x768
Intel Graphics Media Accelerator (GMA) 4500MHD
3.4
6.4 88%
7 106%
10.1 197%
11.9 250%
13 282%
16 371%
17.5 415%
17.9 426%
18 429%
...
141.4 4059%
0%
100%
» Niegrywalna na większości testowanych laptopów.
low 800x600
Intel Graphics Media Accelerator (GMA) 4500MHD
0.8
15 1775%
22 2650%
30 3650%
45 5525%
47 5775%
47 5775%
48 5900%
48 5900%
50 6150%
...
105 13025%
max:
ATI Radeon HD 5670
127 15775%
0%
100%
» Niegrywalna na większości testowanych laptopów.
low 640x480
12.6 -79%
...
12.45 -79%
12.6 -79%
29.7 -51%
30.7 -49%
41.9 -30%
45.5 -24%
48.6 -19%
55 -9%
59.8 -1%
Intel Graphics Media Accelerator (GMA) 4500MHD
60.2
60.8 1%
70.8 18%
72.1 20%
74.3 23%
76.8 28%
77.6 29%
89 48%
90 50%
92.1 53%
...
373 520%
0%
100%
high 1024x768
2 -77%
3.1 -65%
3.15 -64%
7.9 -10%
Intel Graphics Media Accelerator (GMA) 4500MHD
8.74
10.9 25%
11.7 34%
12 37%
12.4 42%
12.7 45%
14.3 64%
18.5 112%
18.9 116%
19.6 124%
...
133 1422%
0%
100%
» Na wszystkich testowanych laptopach grywalna przy ustawieniach low.
low 800x600
24.39 -6%
Intel Graphics Media Accelerator (GMA) 4500MHD
26
37.65 45%
39.55 52%
46.7 80%
51.8 99%
52.7 103%
69.5 167%
73.3 182%
74 185%
80 208%
...
357.4 1275%
0%
100%
med. 1024x768
Intel Graphics Media Accelerator (GMA) 4500MHD
8.4
14.6 74%
22.5 168%
27 221%
27 221%
27.1 223%
30 257%
30.2 260%
30.6 264%
31 269%
...
244 2805%
0%
100%
» Niegrywalna na większości testowanych laptopów.
low 1024x768
Intel Graphics Media Accelerator (GMA) 4500MHD
14
18.95 35%
20.3 45%
22.9 64%
24.4 74%
27 93%
29.44 110%
31.97 128%
32.2 130%
34.3 145%
...
83.9 499%
0%
100%
» Niegrywalna na większości testowanych laptopów.
low 1024x768
Intel Graphics Media Accelerator (GMA) 4500MHD
9.8
15.27 56%
17 73%
18.7 91%
18.95 93%
20.5 109%
23 135%
23.87 144%
24.13 146%