Recenzja laptopa Razer Blade 18: Mniejszy niż wiele 17-calowych laptopów do gier
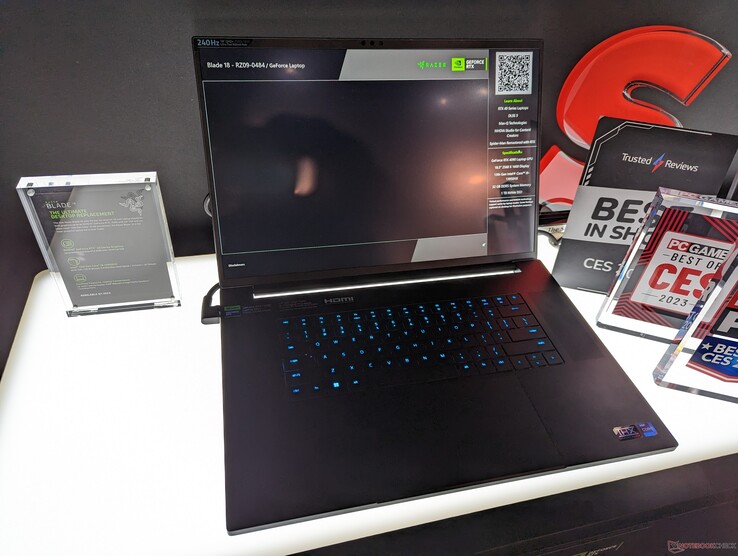
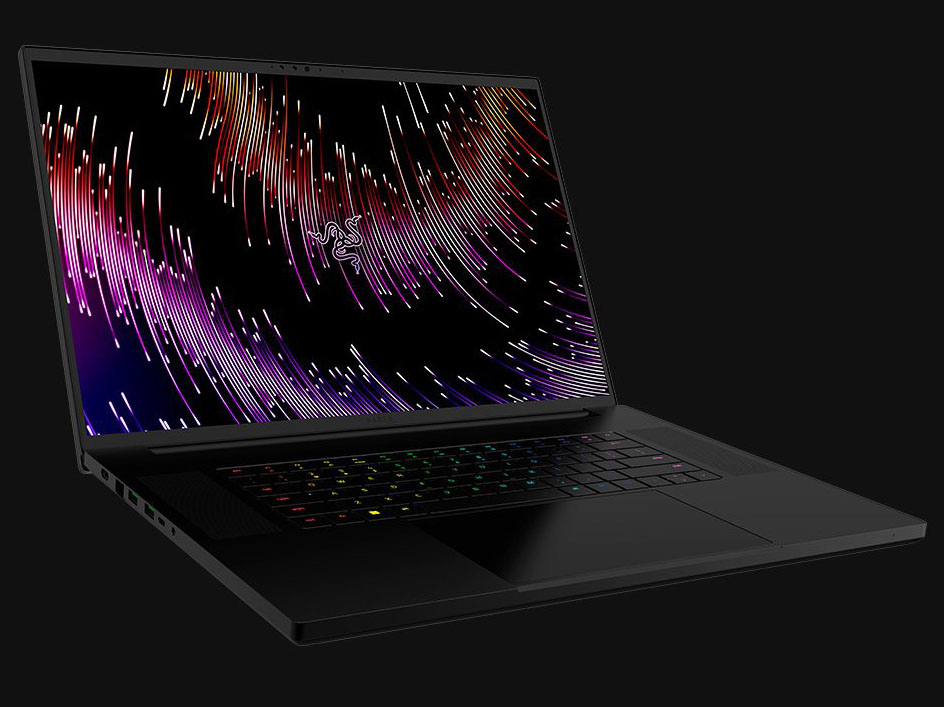
Odsłonięty na CES 2023, Blade 18 oferuje największy rozmiar ekranu jak dotąd w laptopie Blade, przy jednoczesnym zachowaniu znajomej konstrukcji obudowy Razera. Premiera modelu zbiega się z premierą mobilnej serii Intel Core 13. generacji oraz mobilnej serii Nvidia GeForce 40 Ada Lovelace, podobnie jak w przypadku ostatniego Blade 16.
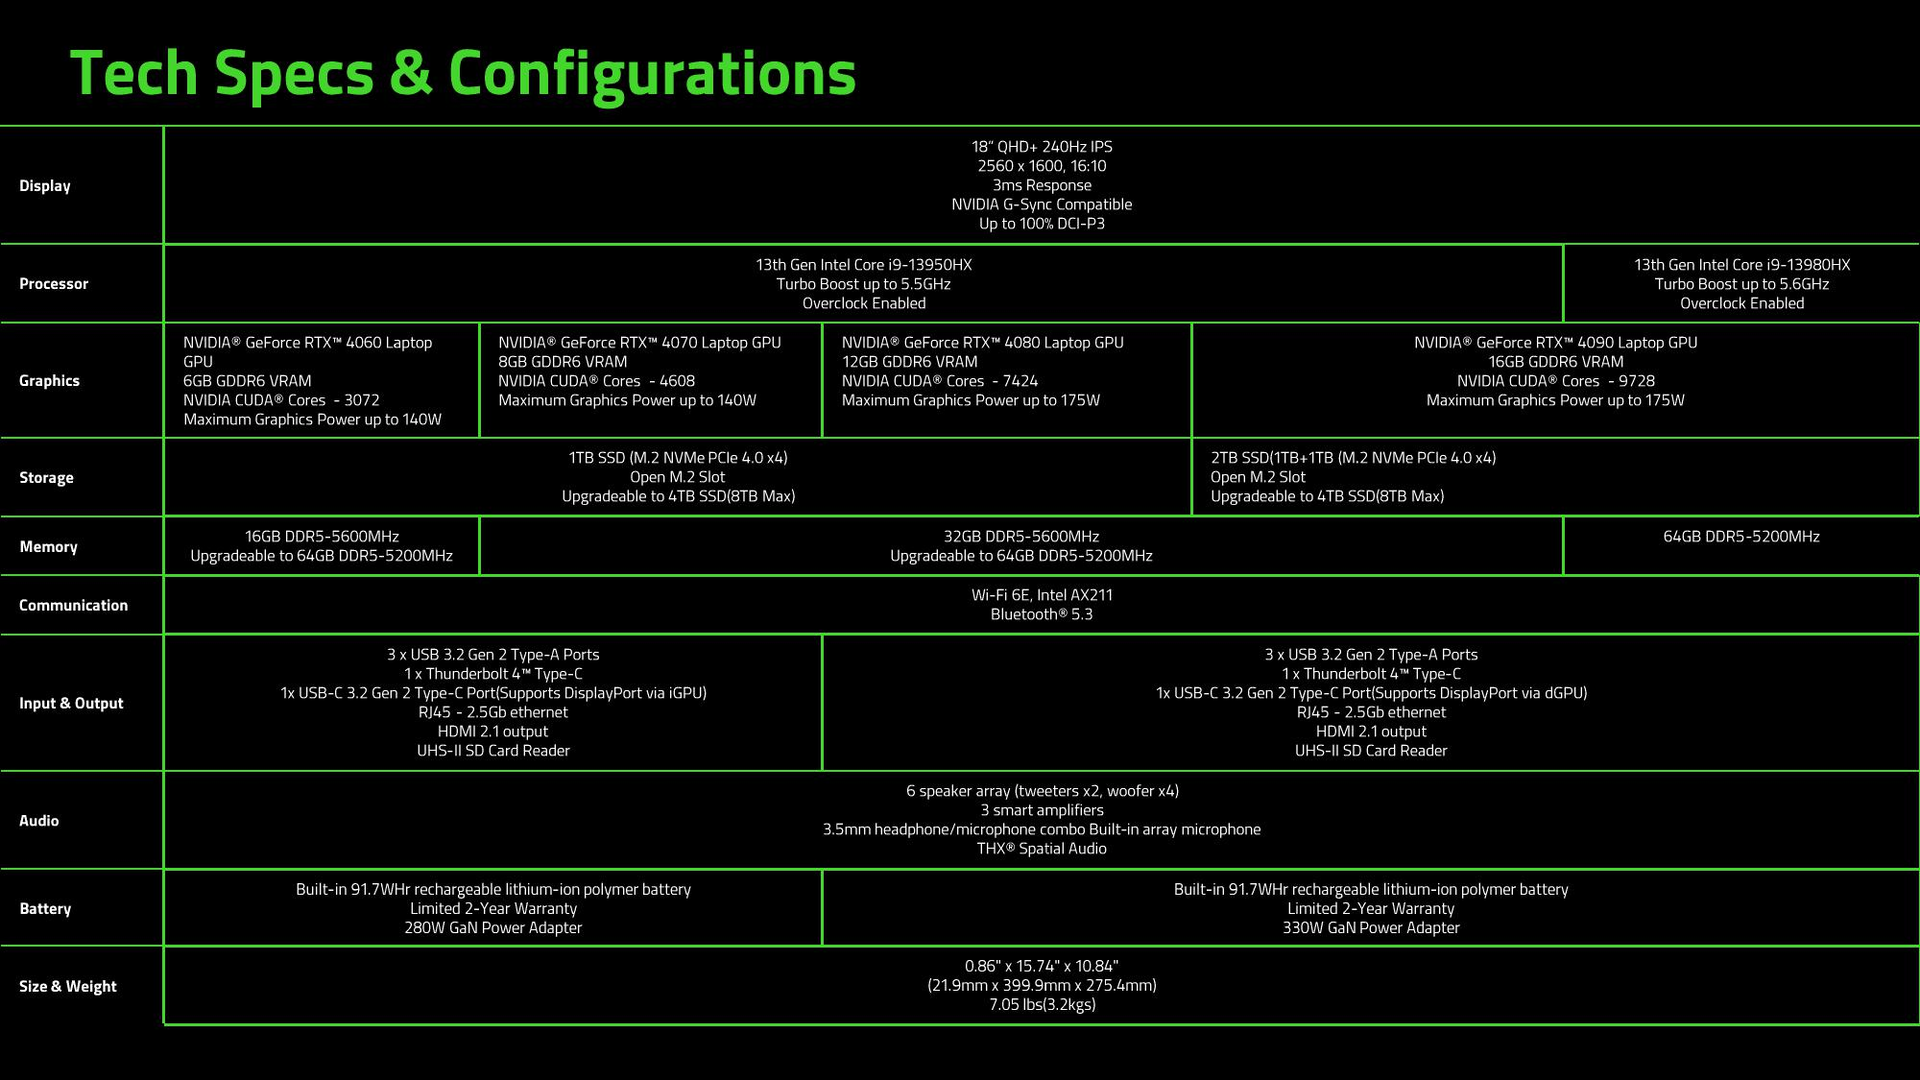
Konfiguracje obejmują procesor Core i9-13950HX i 140 W GeForce RTX 4060 GPU do Core i9-13980HX i 175 W RTX 4090. Wszystkie konfiguracje są wyposażone w ten sam panel IPS 16:10 QHD+ 240 Hz. Nasz konkretny egzemplarz recenzencki to środkowa konfiguracja sportowa z 140 W RTX 4070 w cenie około 3200 USD.
laptopy 18-calowe są rzadkością, a godnym uwagi przykładem jest 6-letni MSI GT83 Titan. Asus i Dell mają wprowadzić na rynek odpowiednio ROG Strix Scar 18 i Alienware m18, aby bezpośrednio konkurować z Razer Blade 18.
Więcej recenzji Razera:
Potencjalni konkurenci w porównaniu
Ocena | Data | Model | Waga | Wysokość | Rozmiar | Rezolucja | Cena |
|---|---|---|---|---|---|---|---|
| 91.4 % v7 (old) | 02/2023 | Razer Blade 18 RTX 4070 i9-13950HX, GeForce RTX 4070 Laptop GPU | 3 kg | 21.9 mm | 18.00" | 2560x1600 | |
| 89.9 % v7 (old) | Razer Blade 17 Early 2022 i9-12900H, GeForce RTX 3080 Ti Laptop GPU | 2.8 kg | 19.9 mm | 17.30" | 3840x2160 | ||
| 89 % v7 (old) | 02/2023 | MSI Titan GT77 HX 13VI i9-13950HX, GeForce RTX 4090 Laptop GPU | 3.5 kg | 23 mm | 17.30" | 3840x2160 | |
| 83.3 % v7 (old) | 01/2023 | Gigabyte G7 KE i5-12500H, GeForce RTX 3060 Laptop GPU | 2.6 kg | 25 mm | 17.30" | 1920x1080 | |
| 86.1 % v7 (old) | 01/2023 | Alienware m17 R5 (R9 6900HX, RX 6850M XT) R9 6900HX, Radeon RX 6850M XT | 3.4 kg | 26.7 mm | 17.00" | 3840x2160 | |
| 86.9 % v7 (old) | 11/2022 | Asus ROG Strix Scar 17 SE G733CX-LL014W i9-12950HX, GeForce RTX 3080 Ti Laptop GPU | 2.9 kg | 28.3 mm | 17.30" | 2560x1440 |
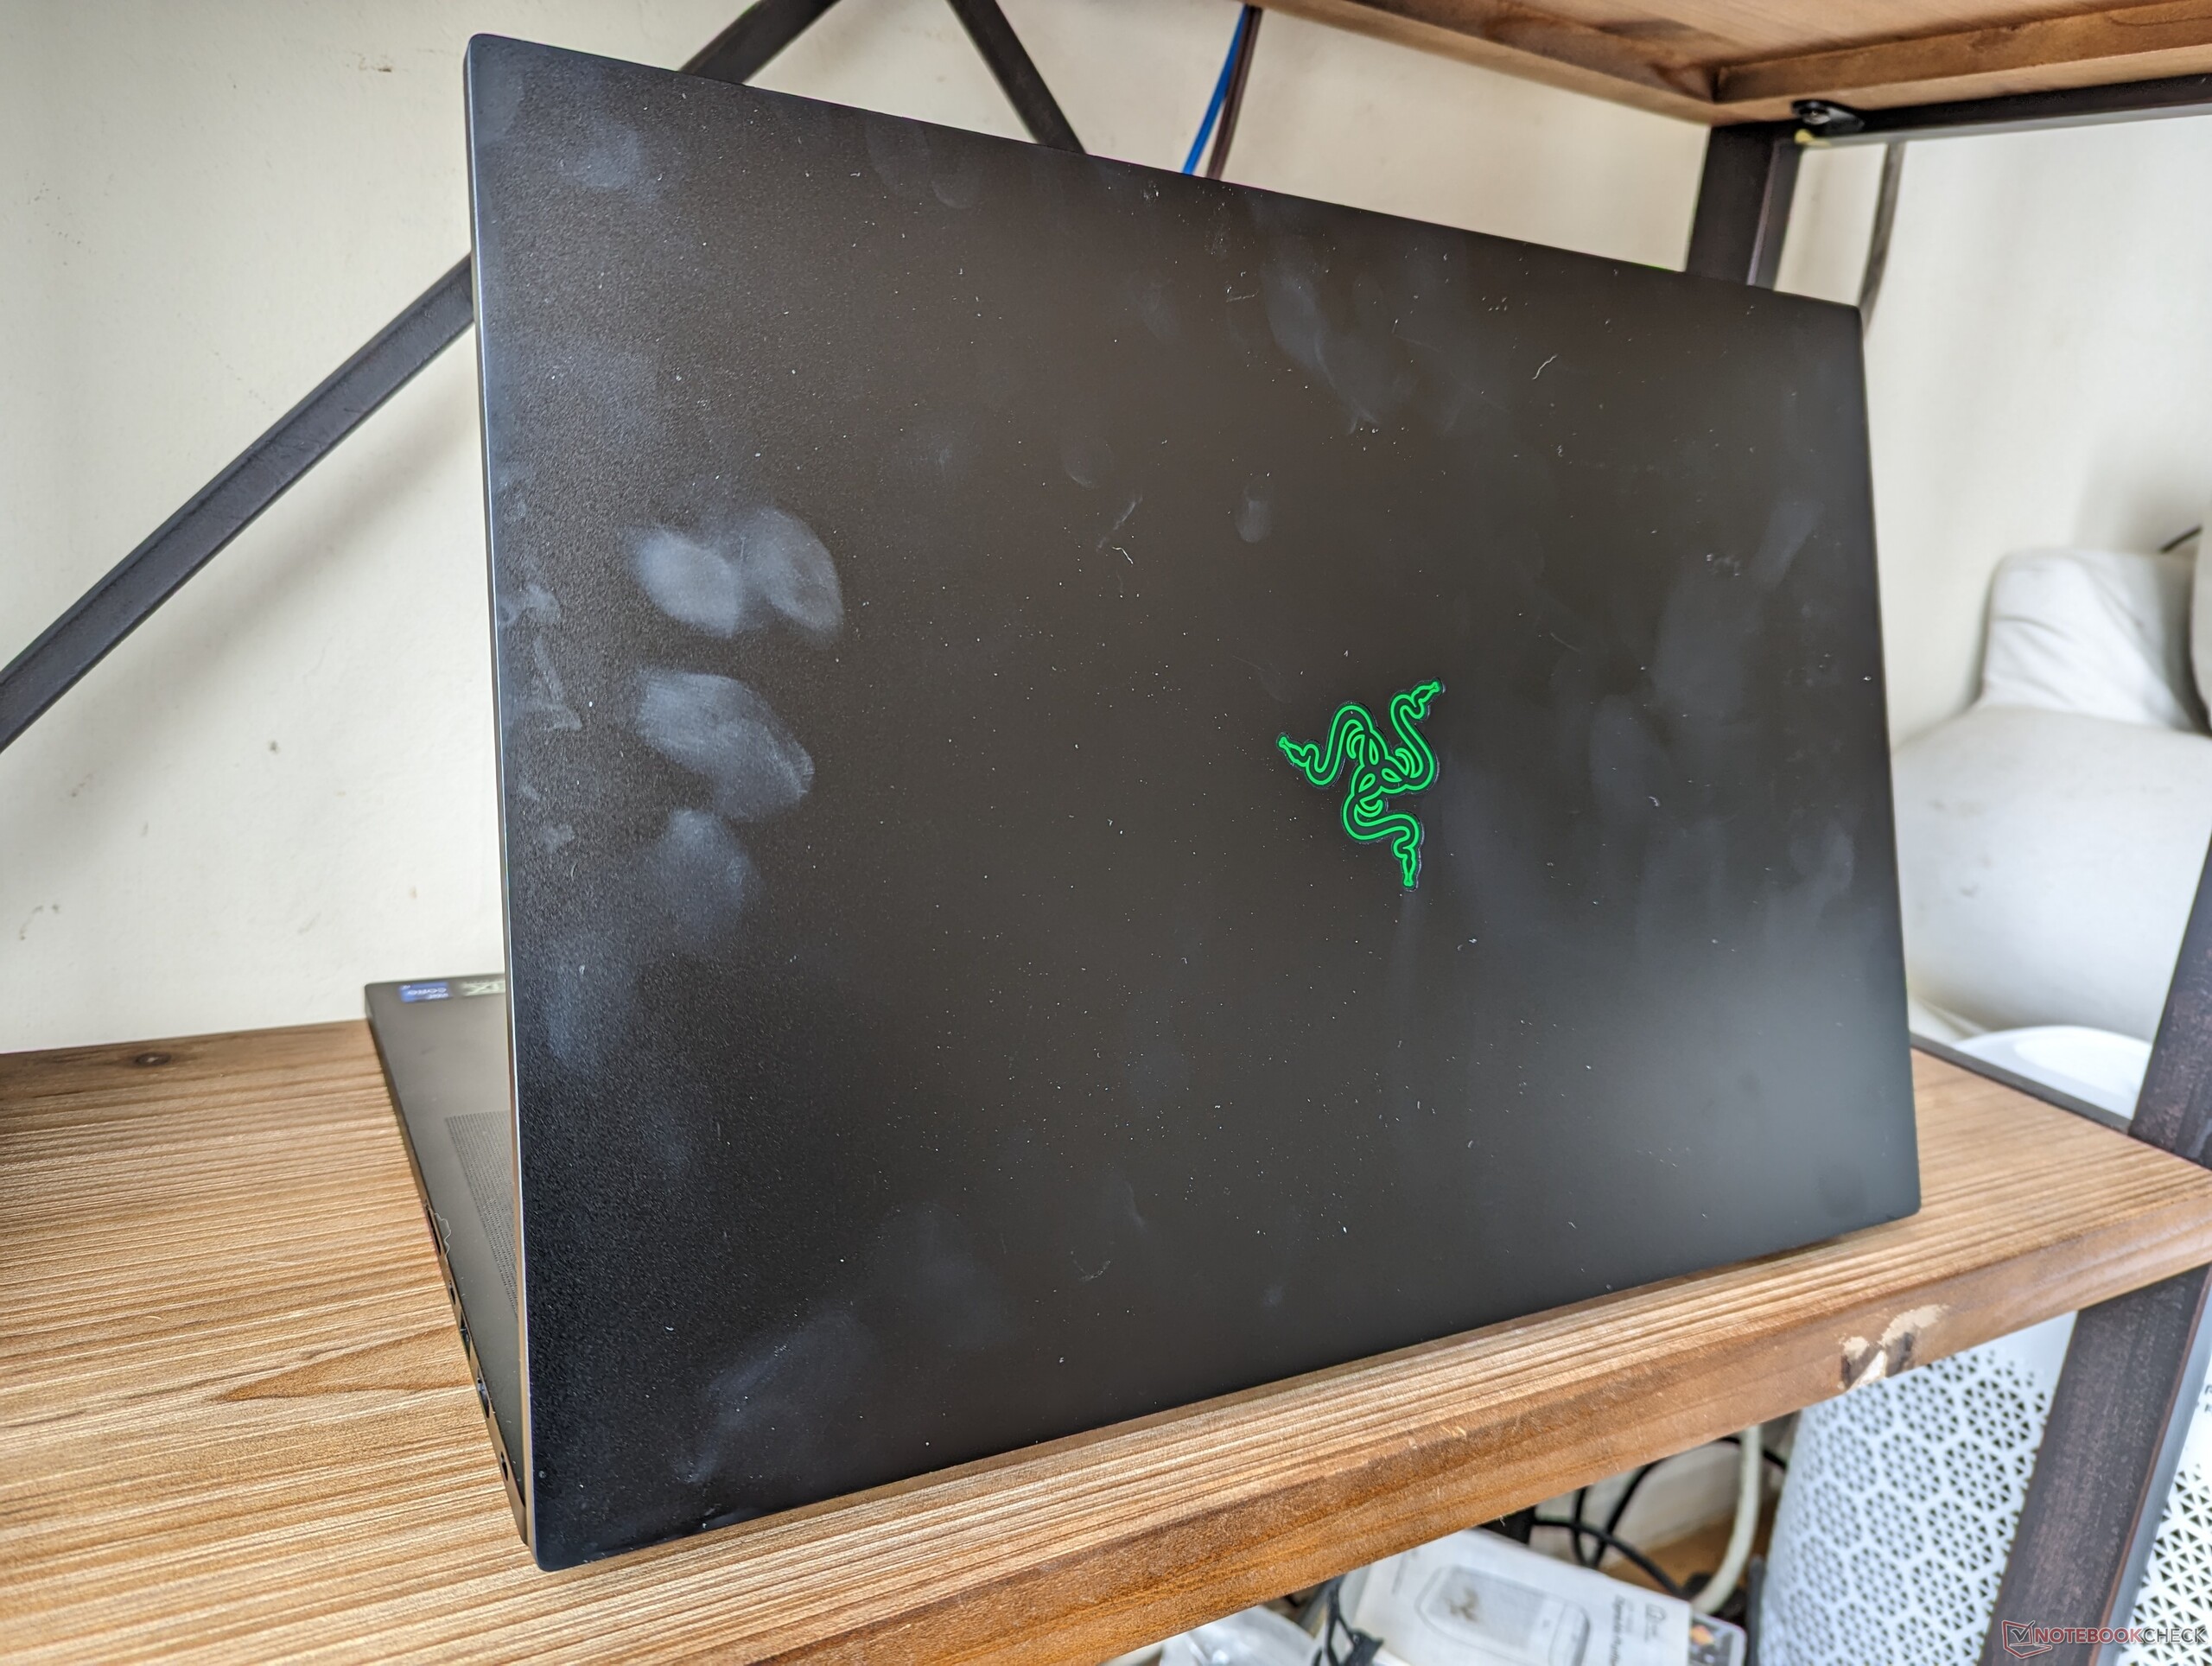
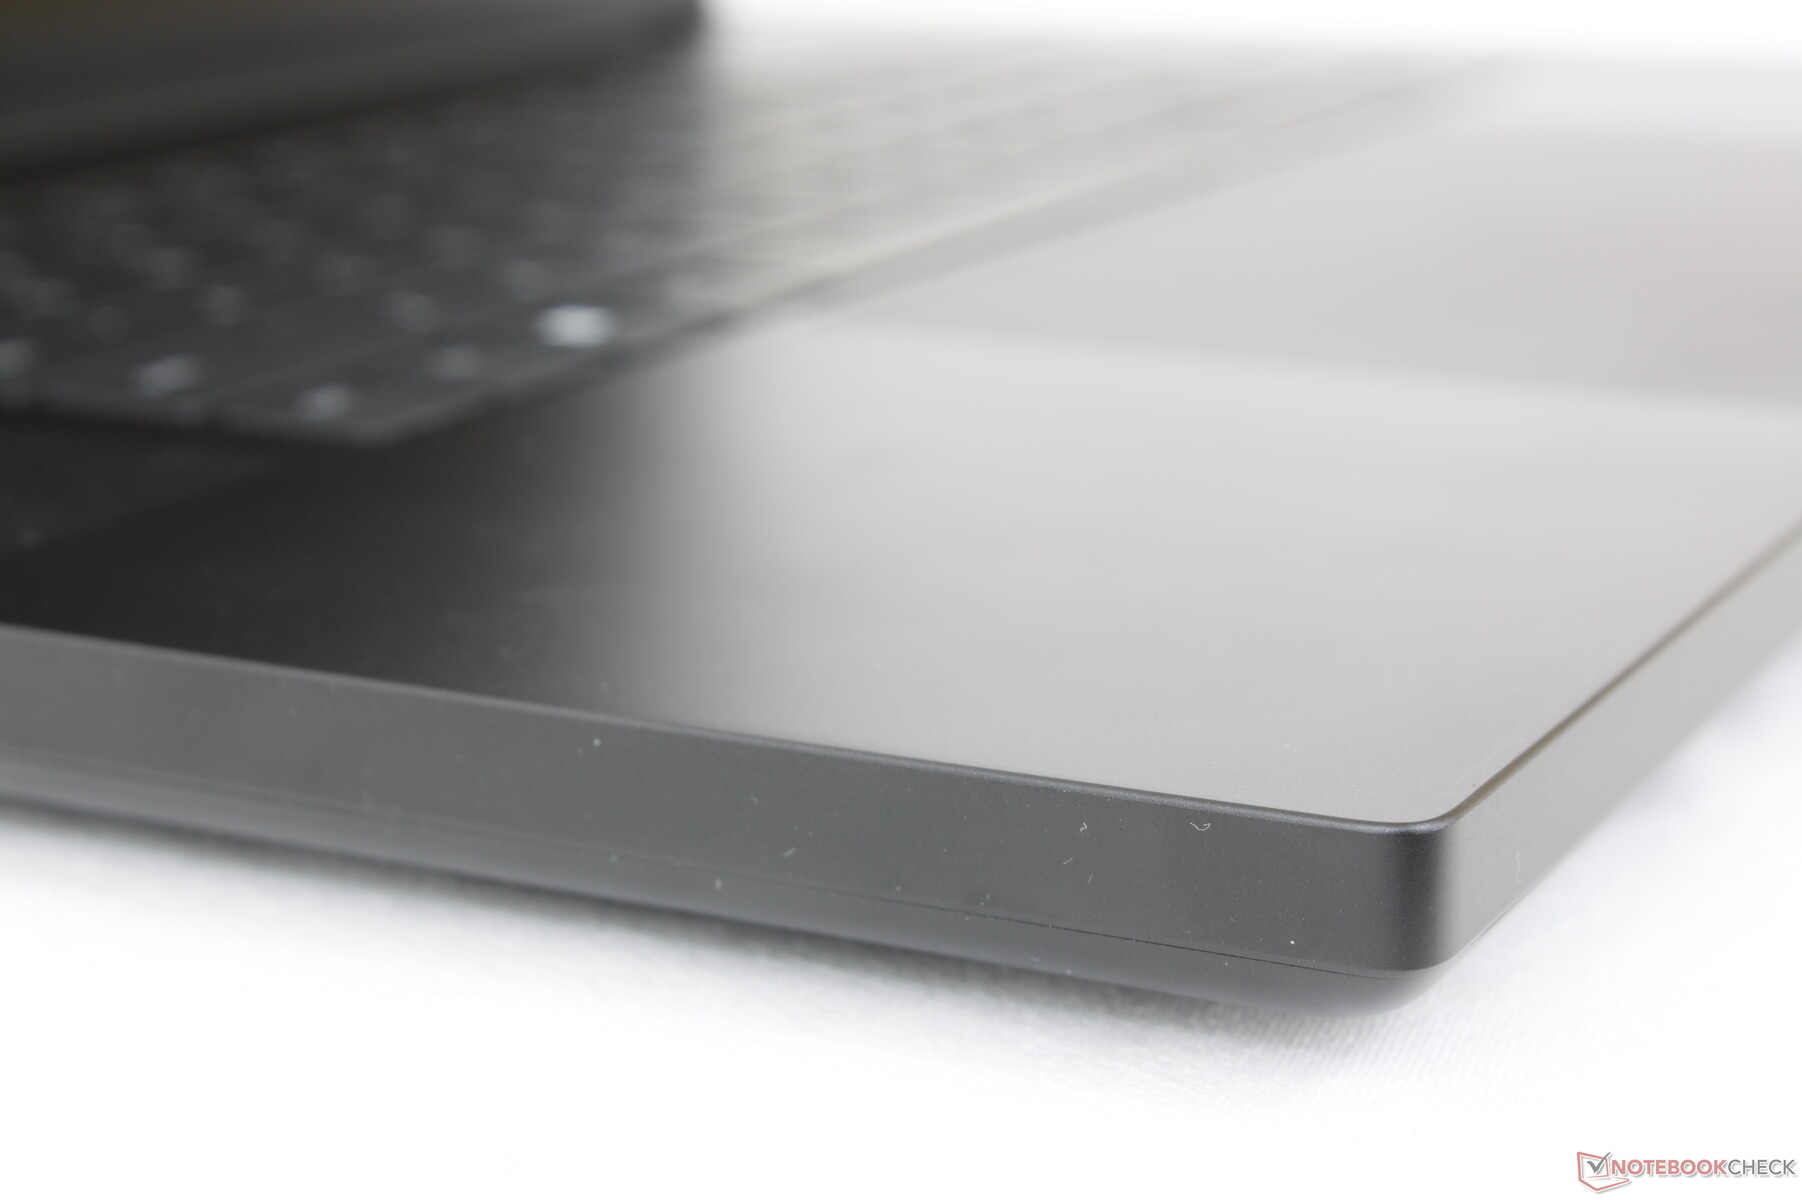
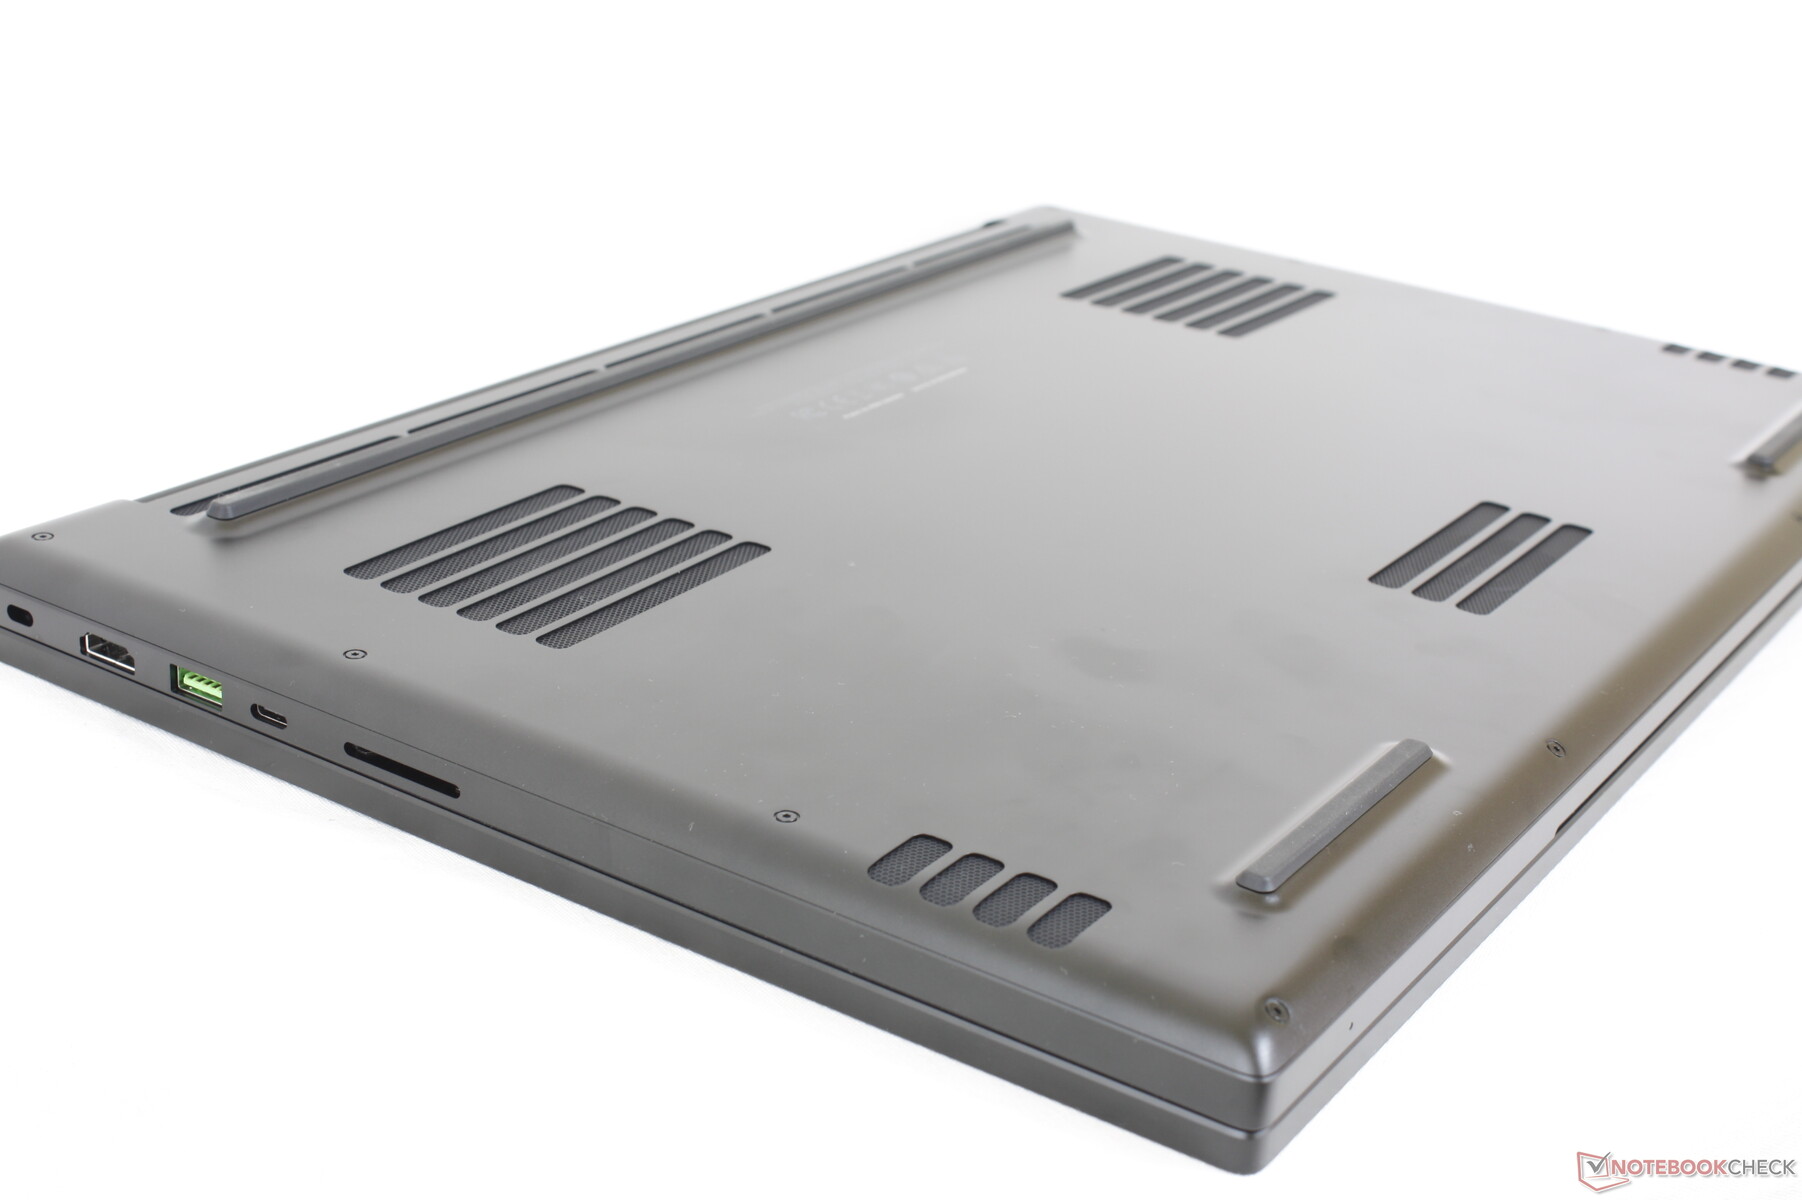
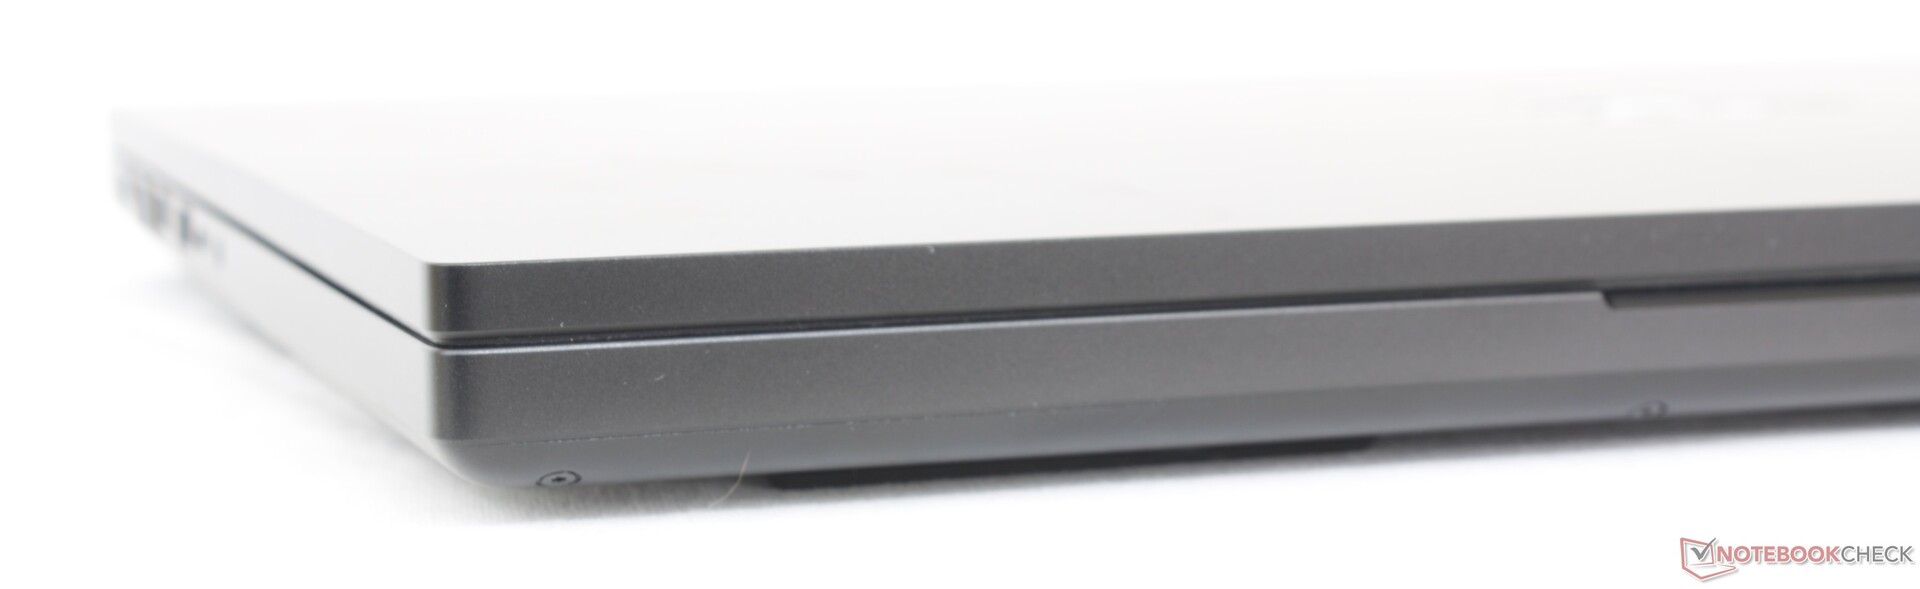
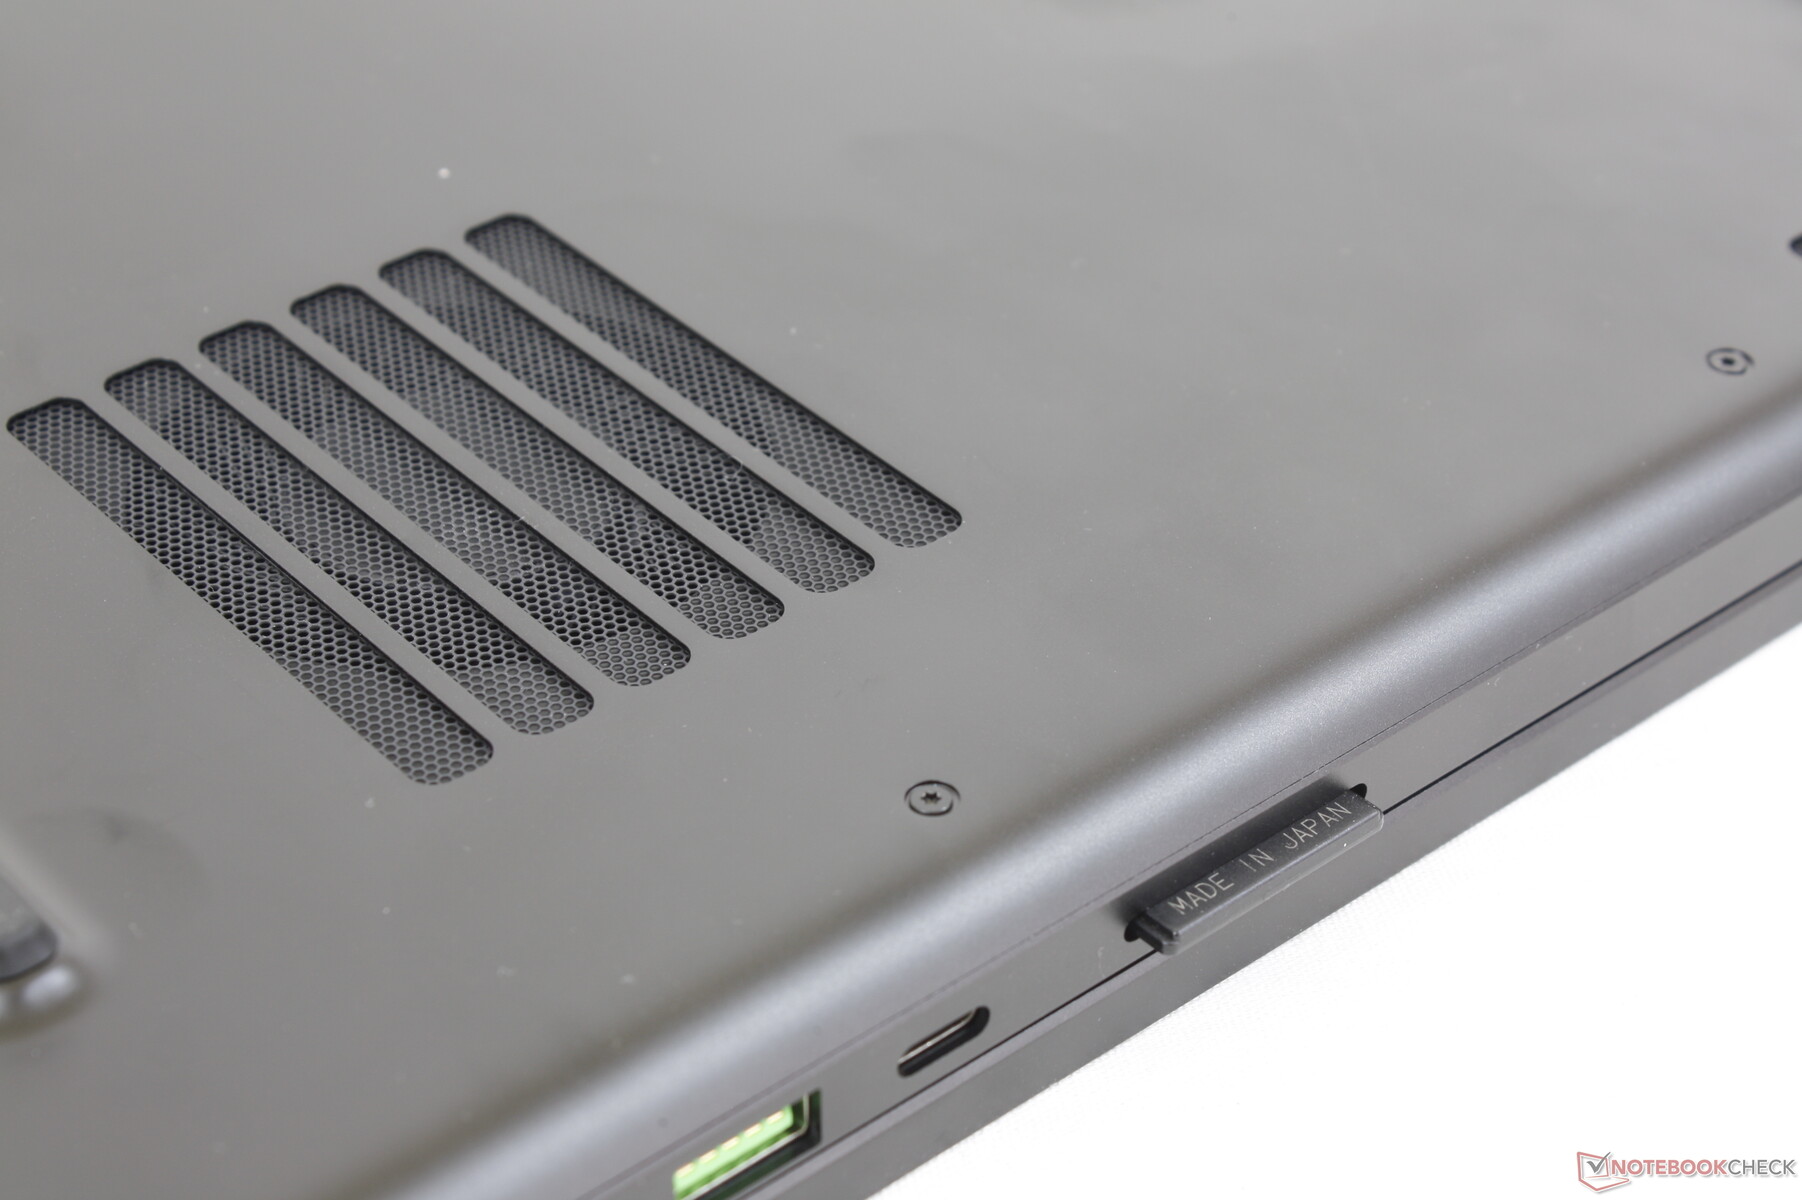
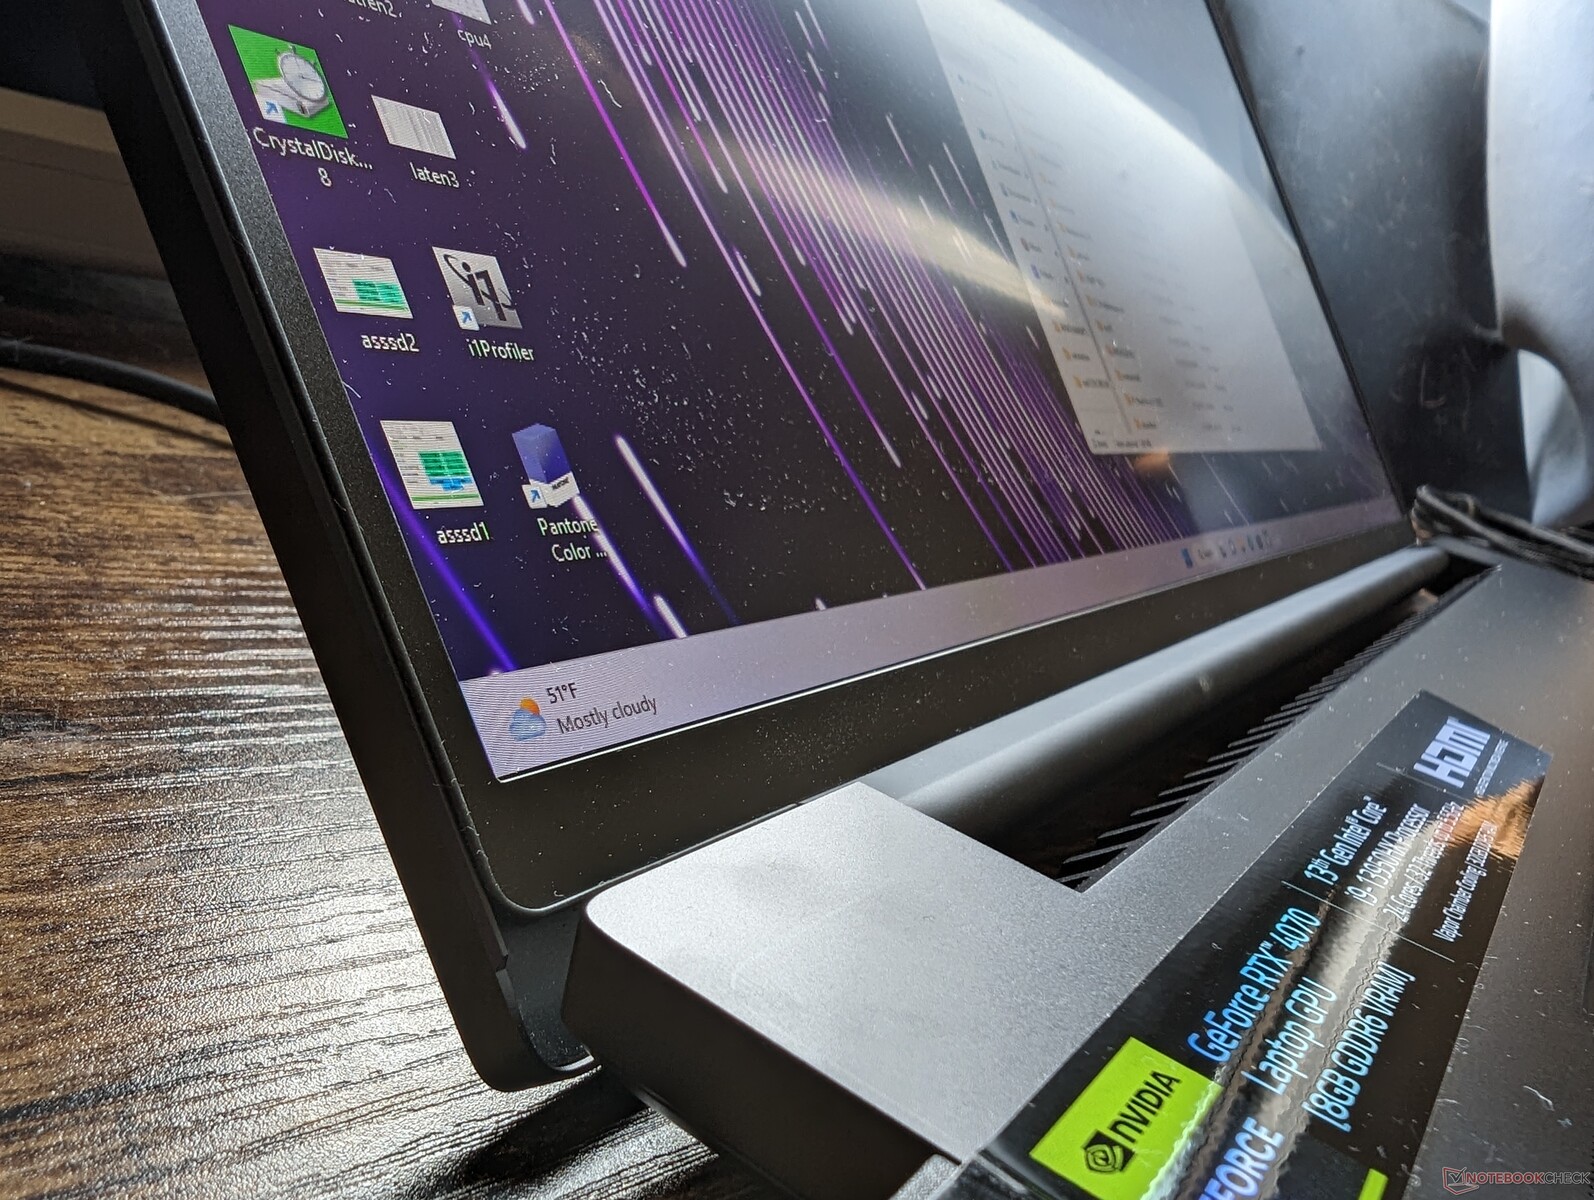
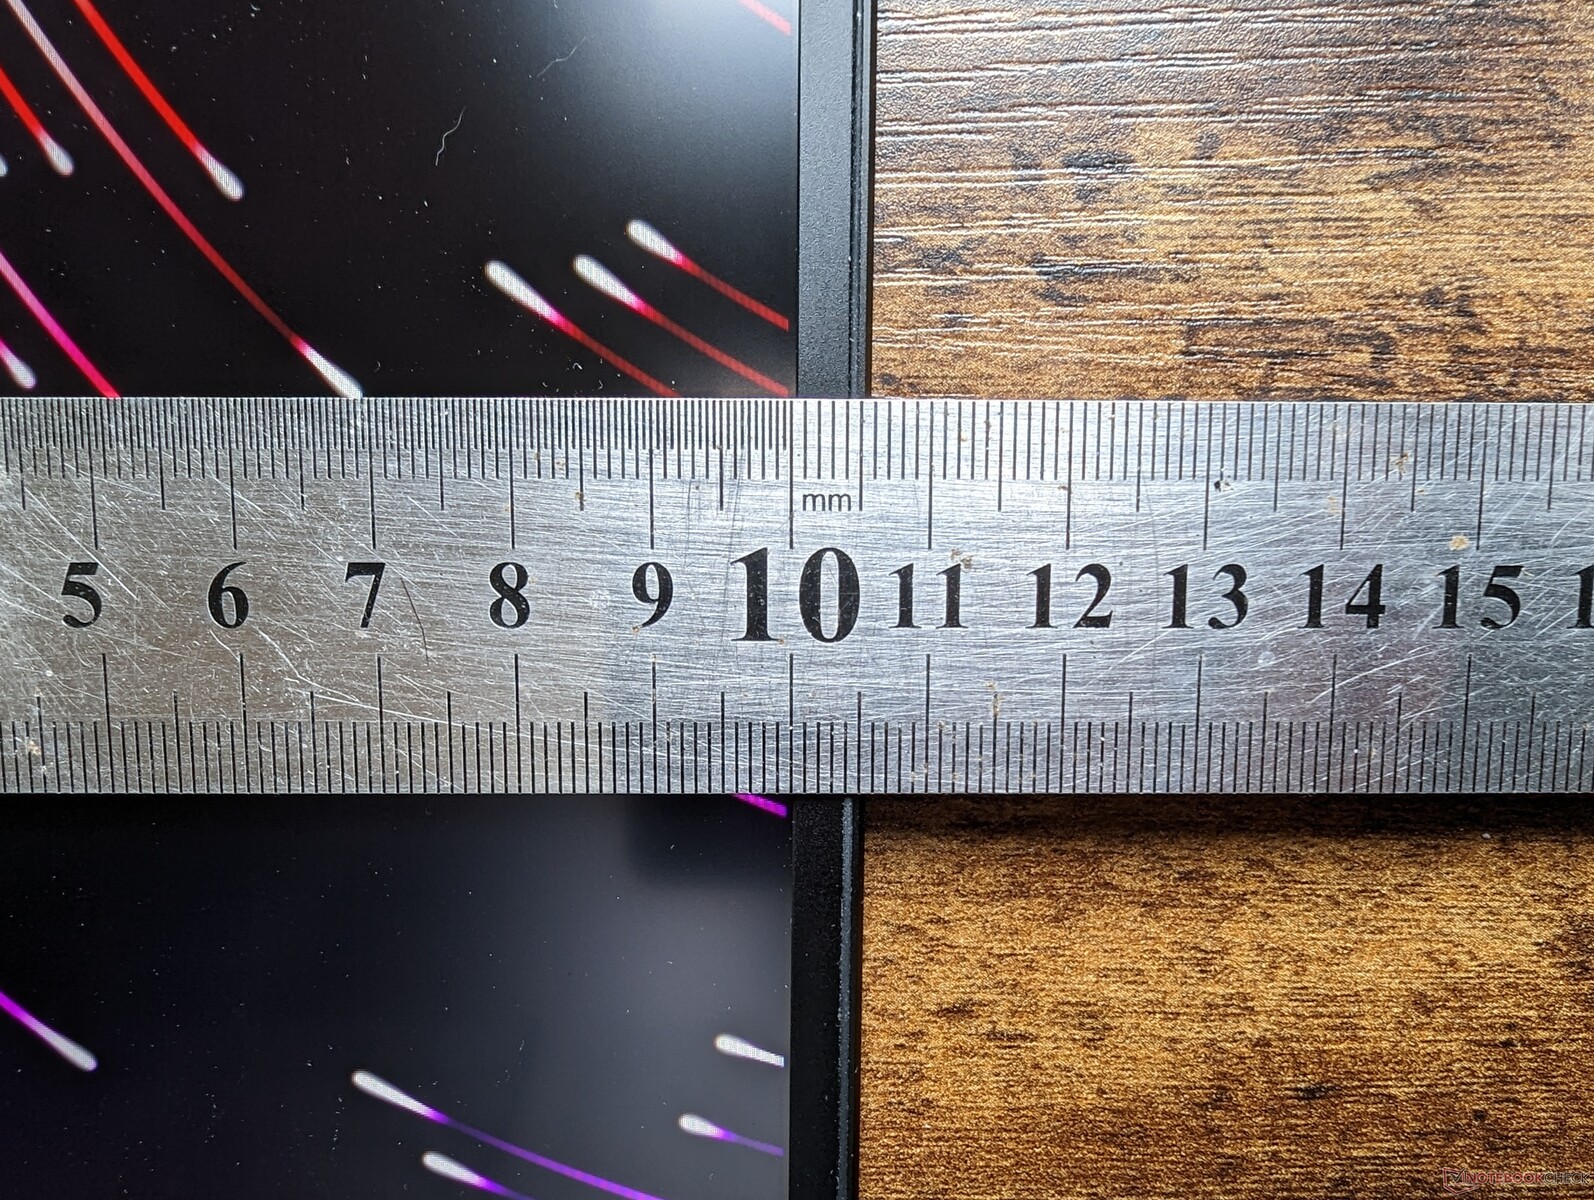
Case - ledwo większy od Blade 17
Blade 18 może i ma nowy rozmiar ekranu, ale nie kryje żadnych nowych niespodzianek w kwestii konstrukcji obudowy. Model ten wygląda i czuje się jak np Blade 17 od góry do dołu. Największa różnica wizualna dotyczy znacznie mniejszej ramki podbródka w Blade 18 w porównaniu do Blade 17, co zapewnia wyższy współczynnik ekranu do ciała.
Większa, 18-calowa obudowa na szczęście nie wpływa na sztywność obudowy. Zarówno podstawa, jak i pokrywa są równie solidne jak w Blade 17, co daje wrażenie obcowania z MacBookiem Pro. Zwłaszcza zawiasy trzymają się dobrze mimo dużego ekranu, ale ich maksymalny kąt jest wciąż znacznie mniejszy niż pełne 180 stopni. Najsłabszym punktem laptopa jest chyba sam środek zewnętrznej pokrywy, gdzie powierzchnia łatwiej się odkształca pod wpływem nacisku.
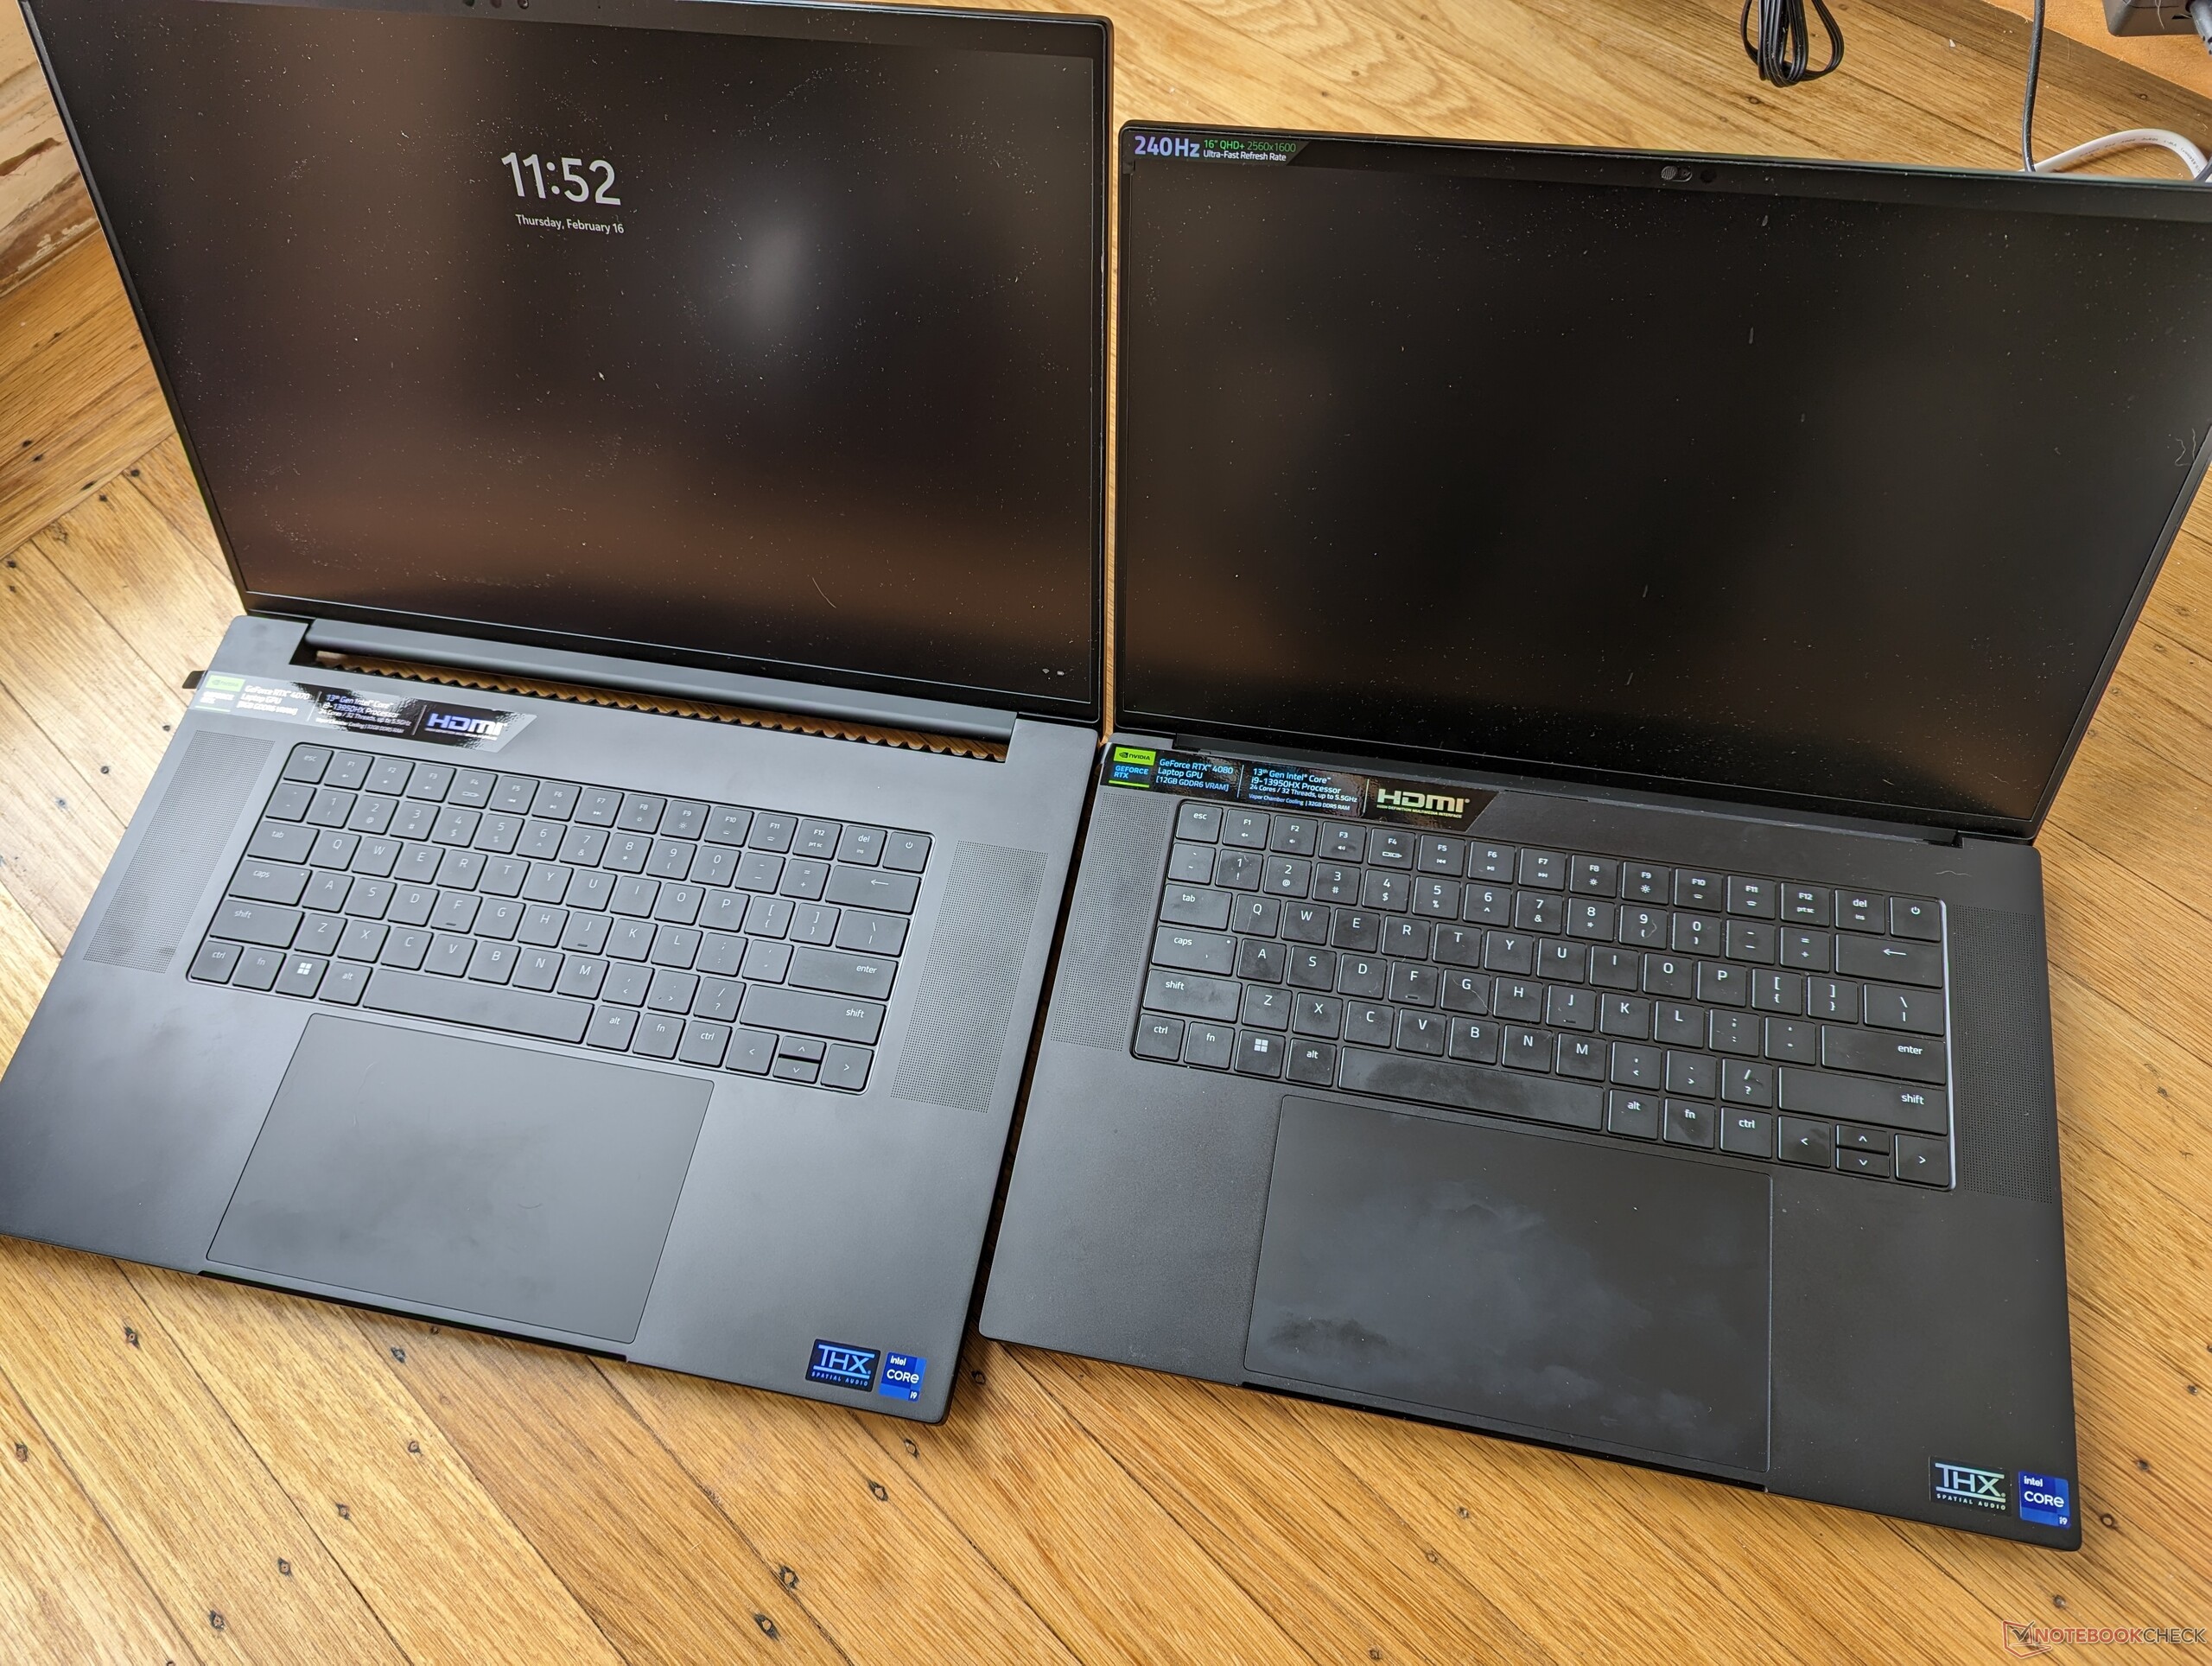
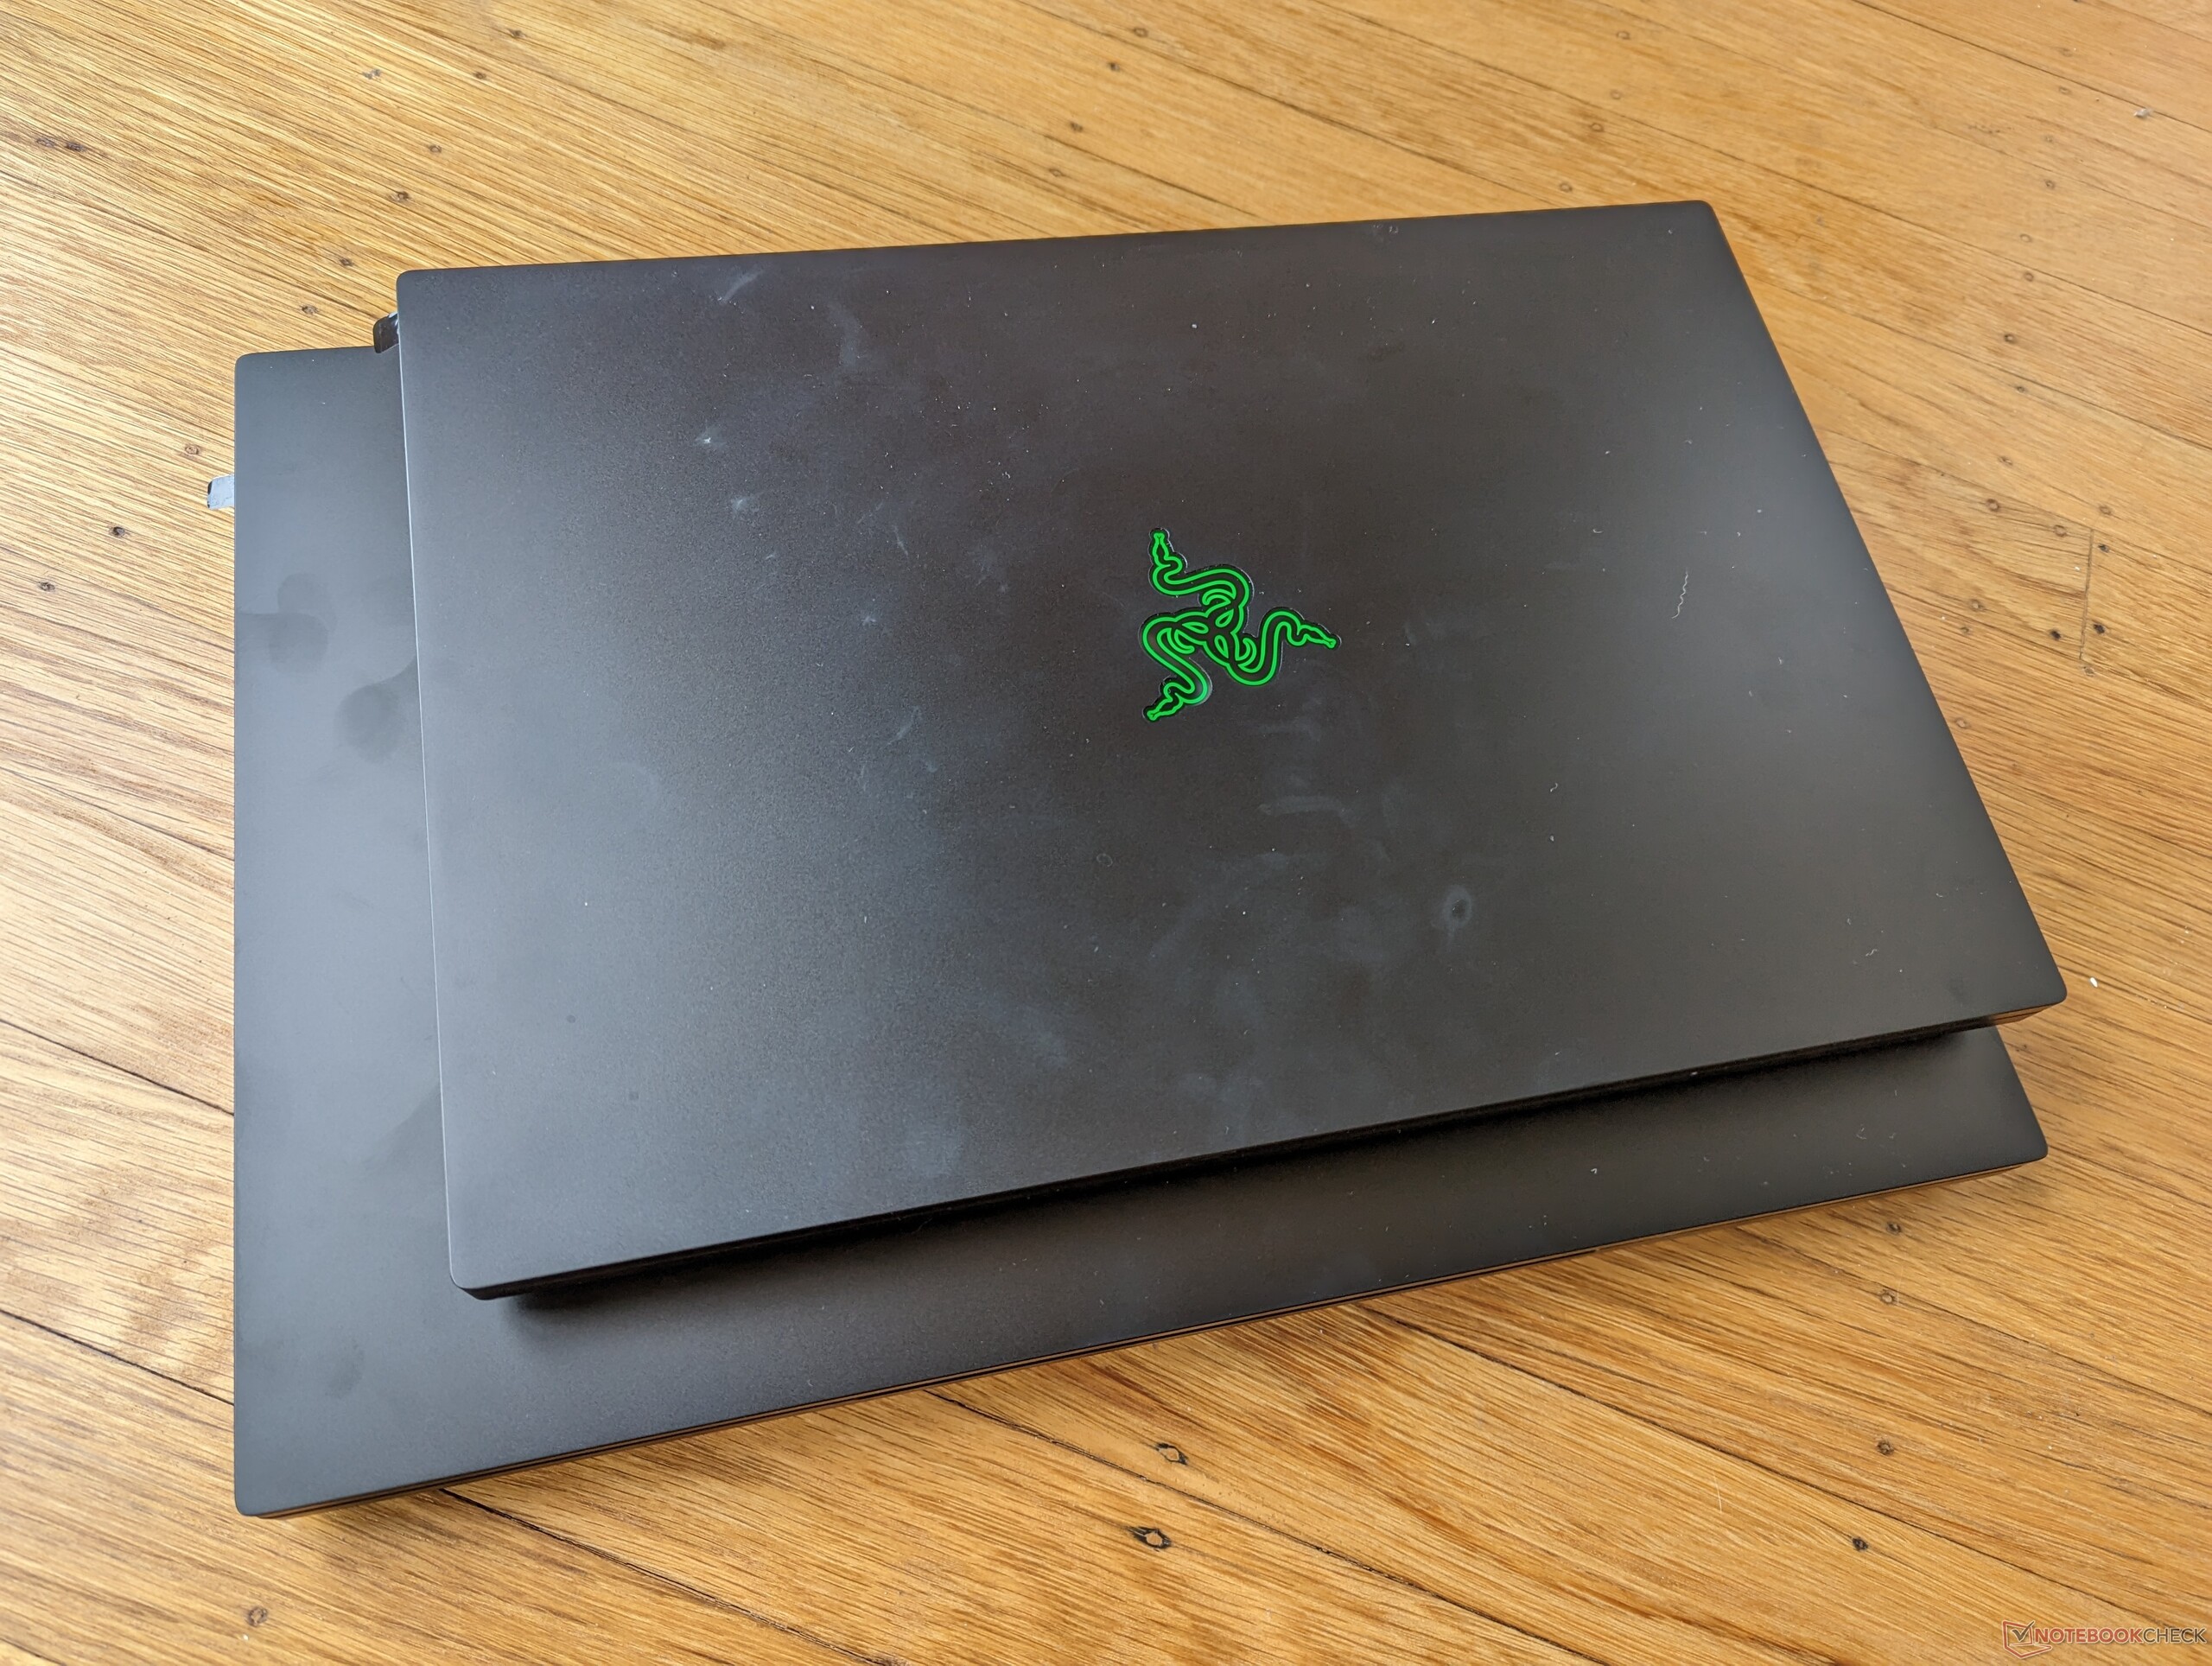
Razer z dumą podkreśla, że Blade 18 jest tylko o 18 procent większy objętościowo i o 7 procent cięższy od Blade 17 z 2022 roku, pomimo różnic w wielkości ich ekranów. Tym samym nowy 18-calowy model nie sprawia wrażenia tak nieporęcznego, jak można by się początkowo spodziewać. W rzeczywistości niektóre 17,3-calowe laptopy do gier są większe lub nawet cięższe od Blade 18, w tym m.in.Asus ROG Strix Scar 17 SE lub Alienware m17 R5.
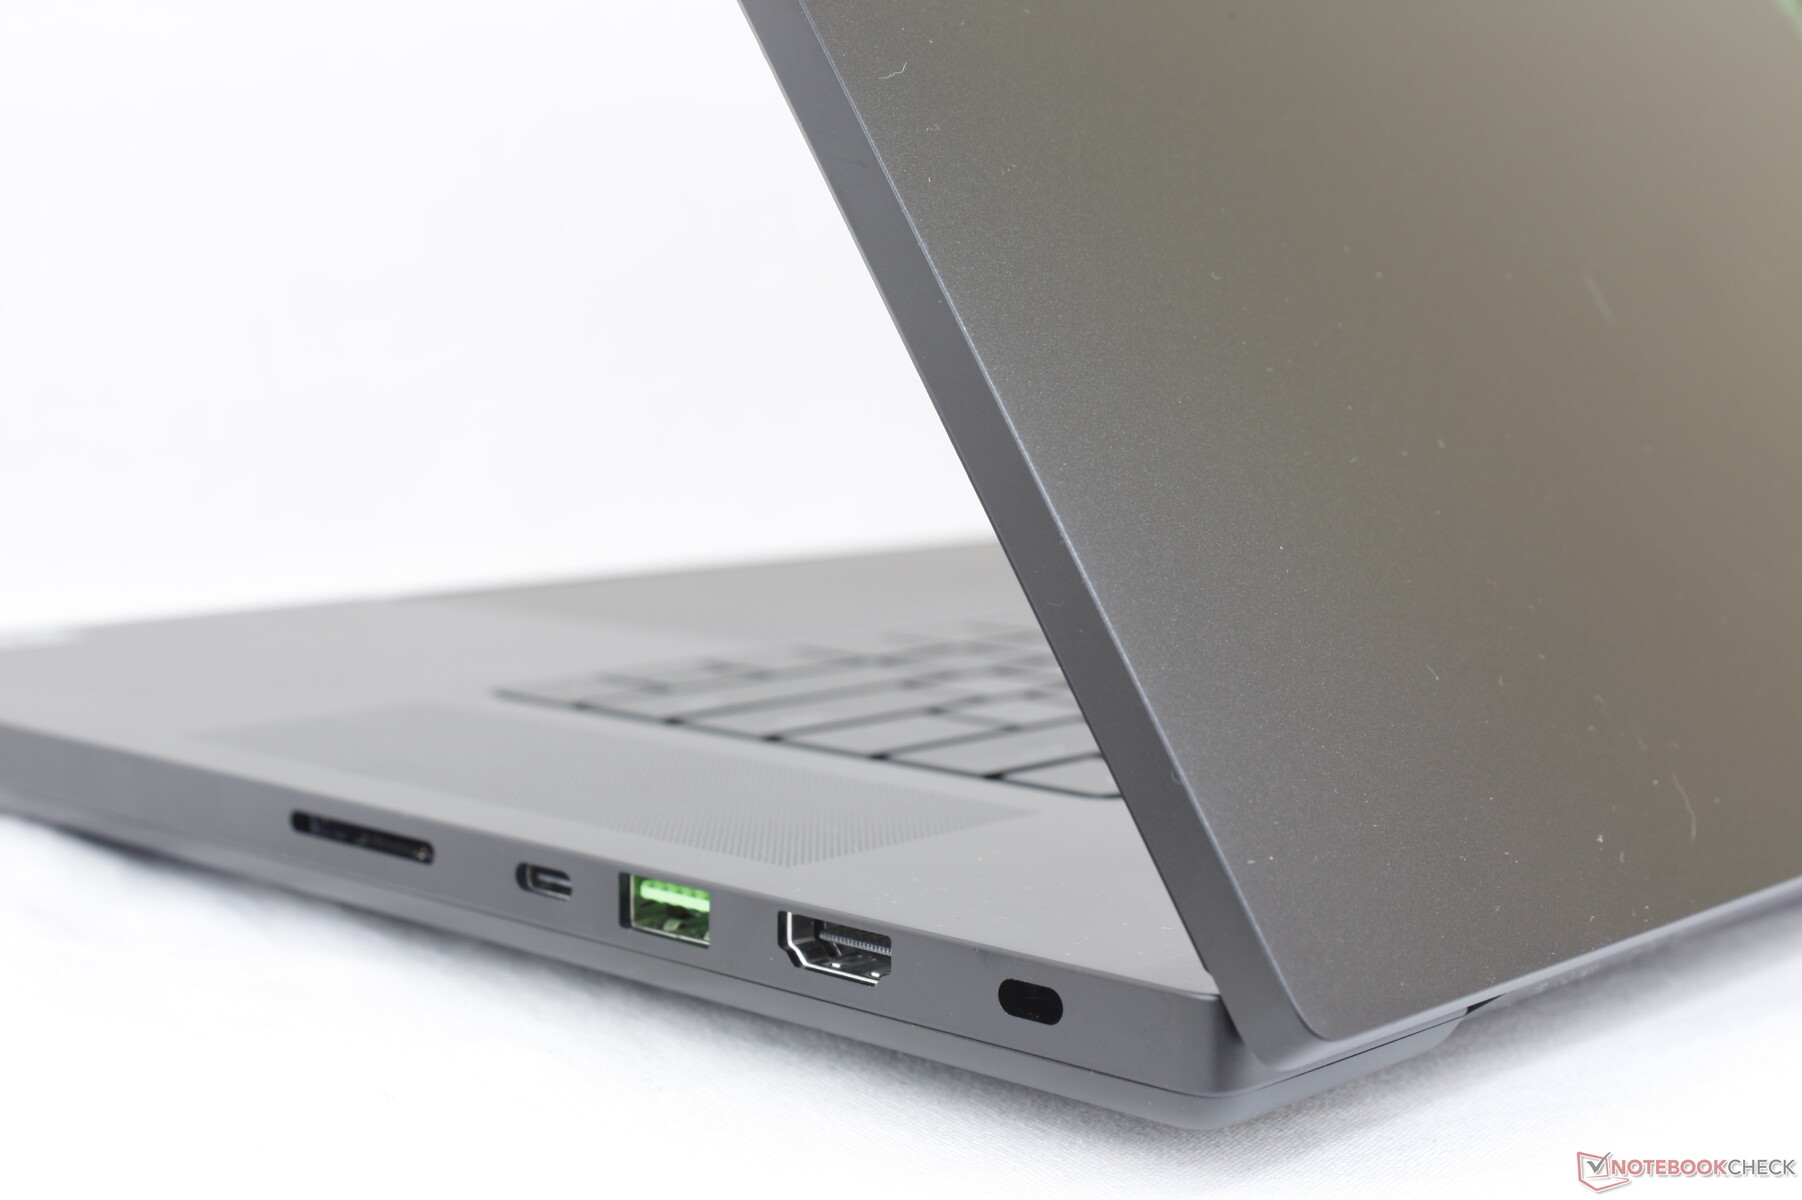
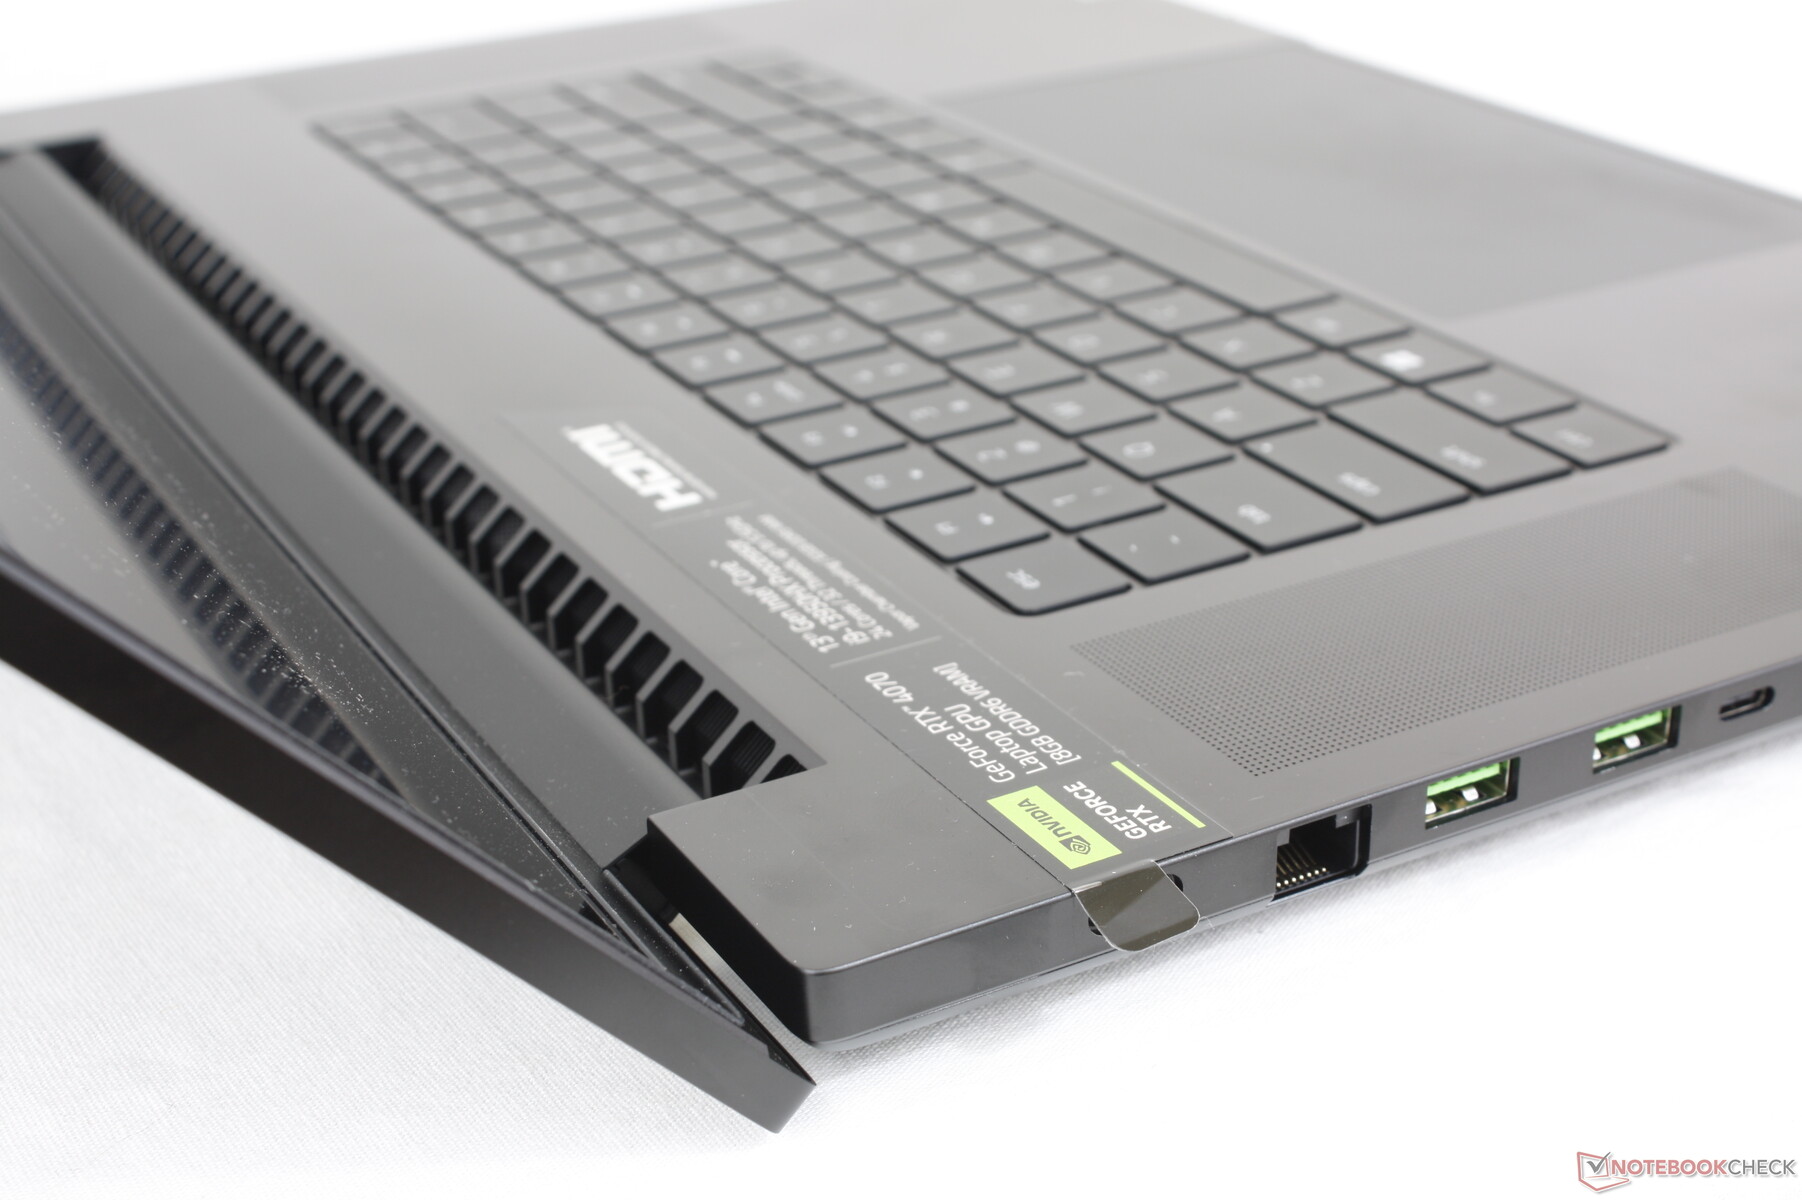
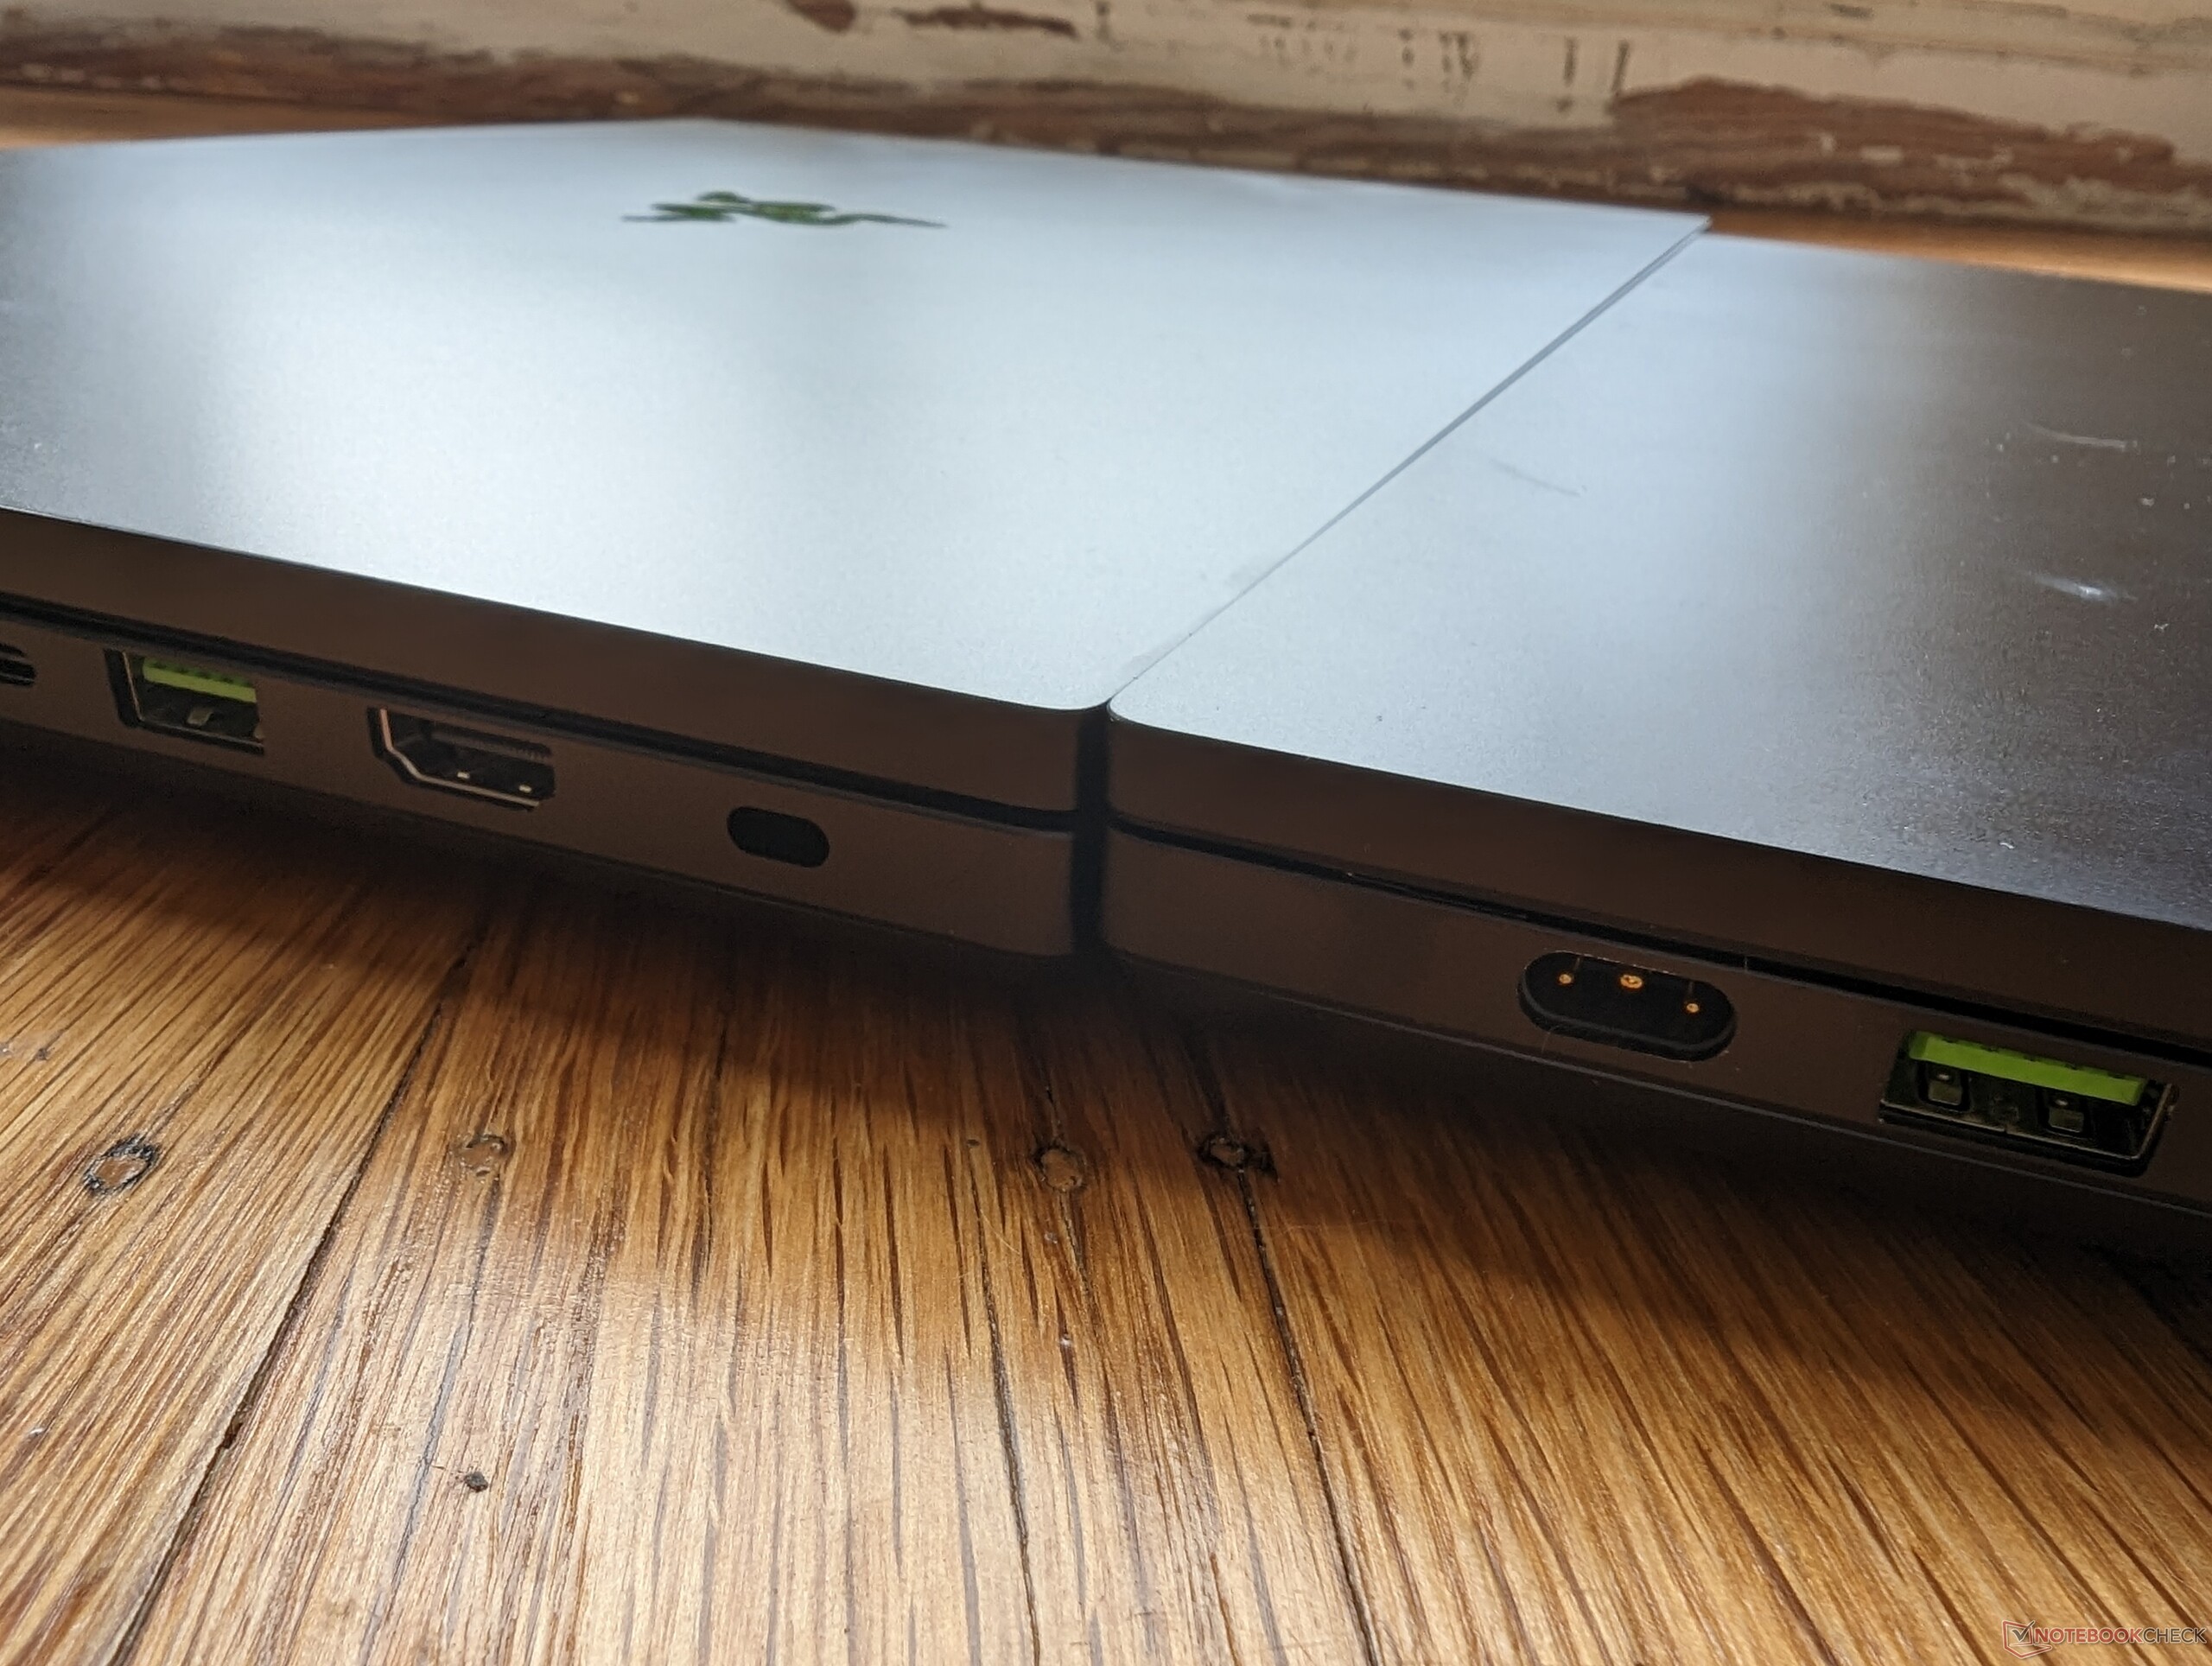
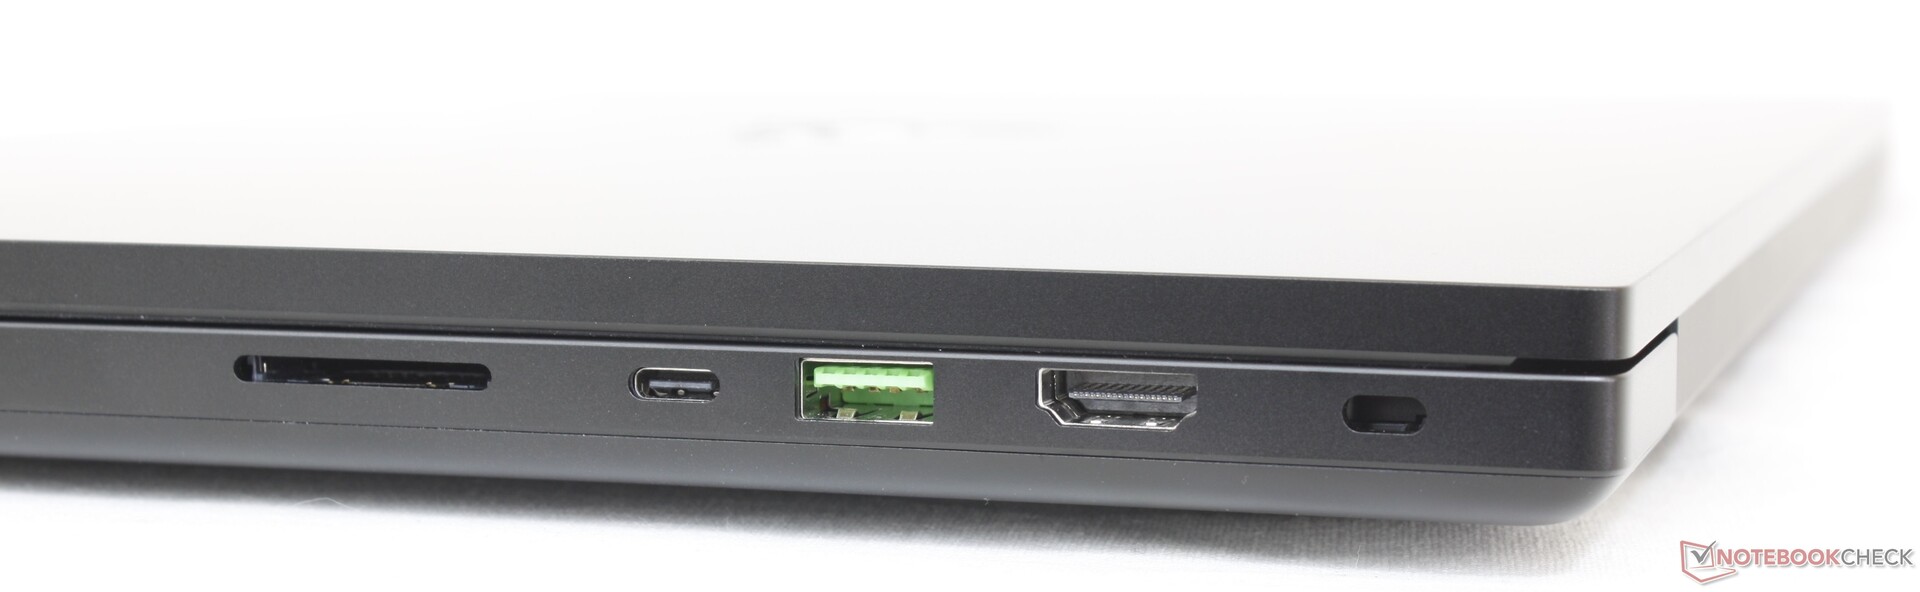
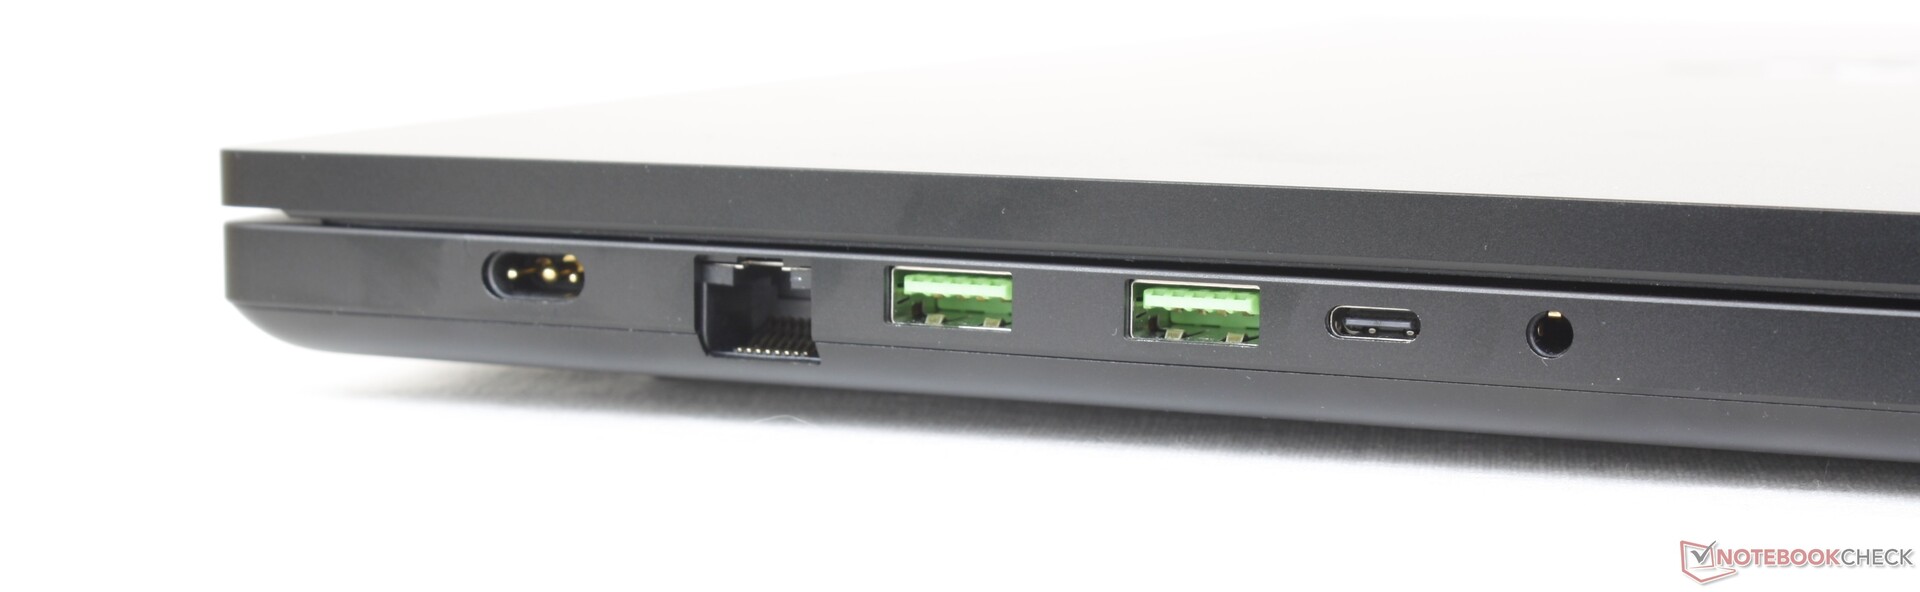
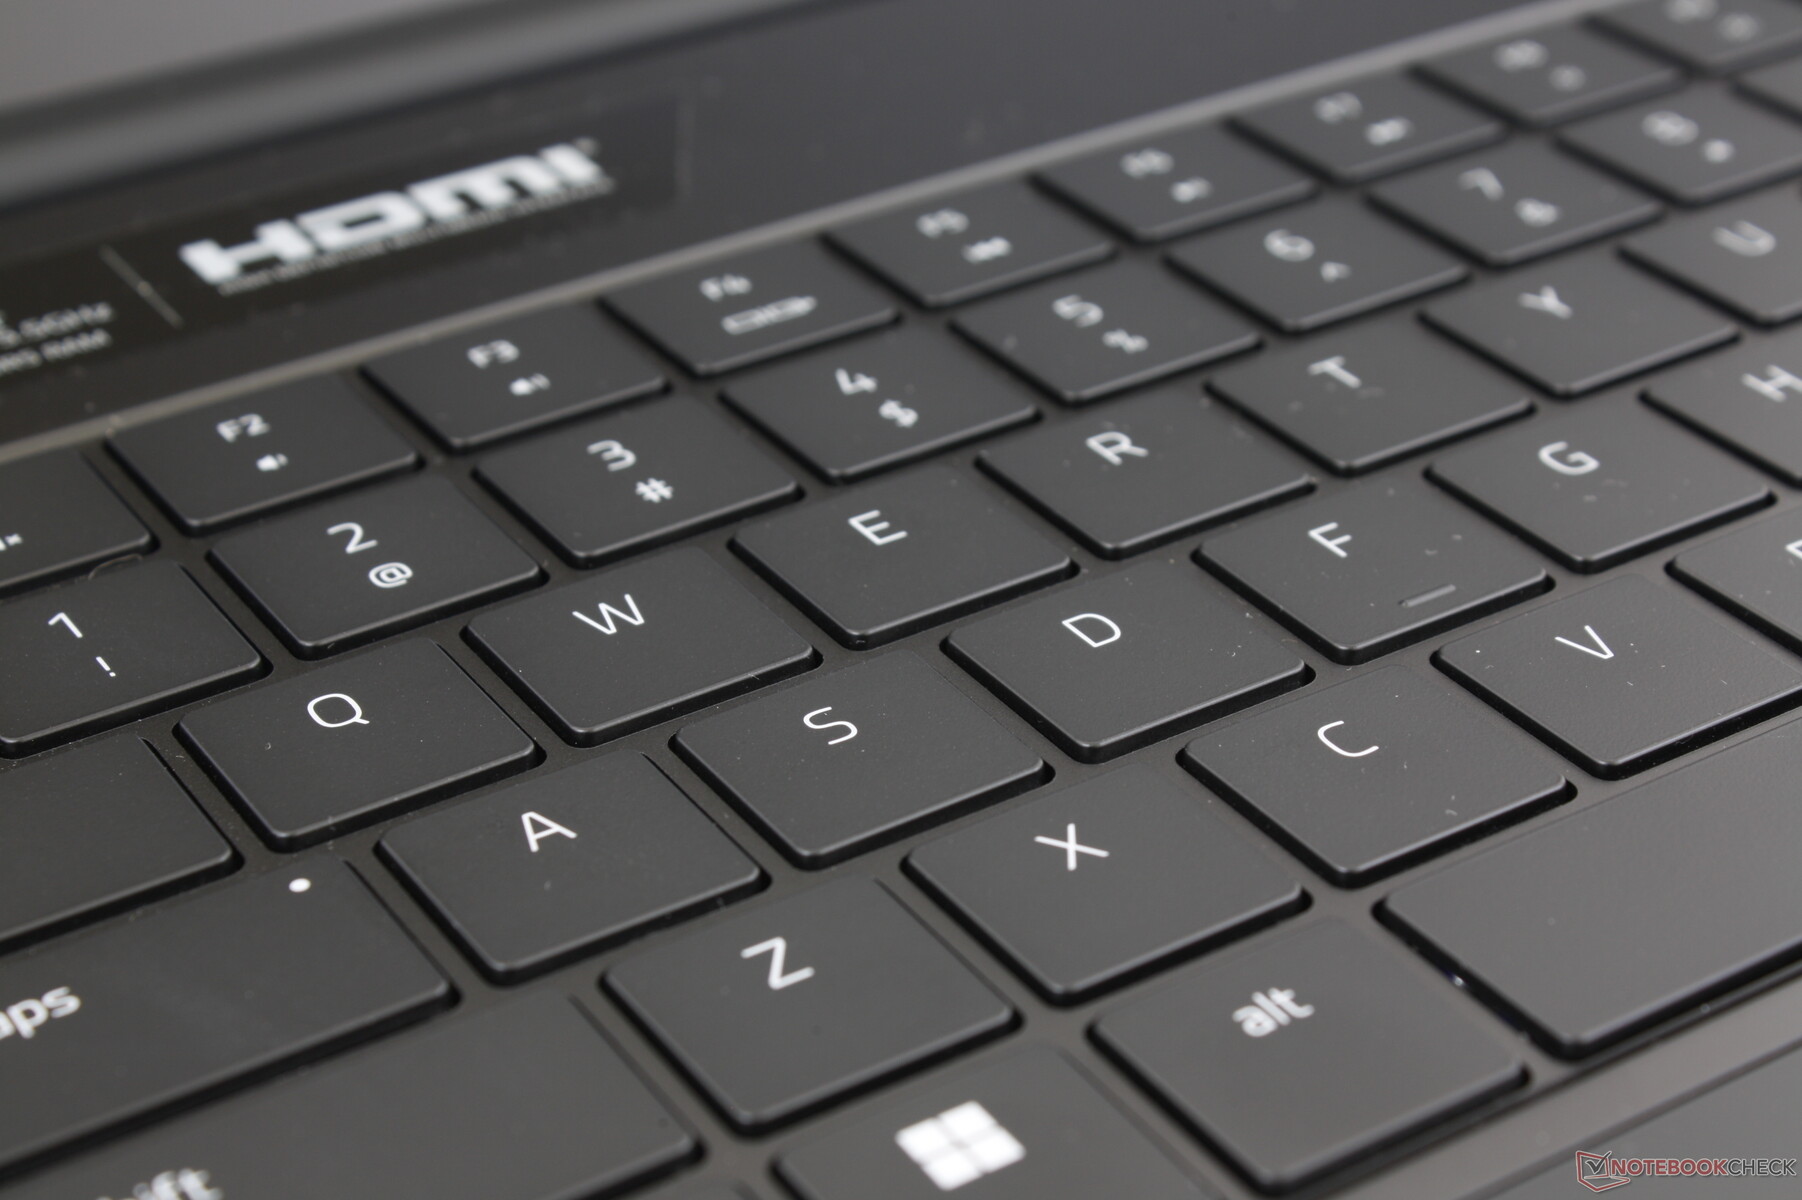
Łączność - to, co zwykle
Nowy model odziedziczył wszystkie porty z modelu Blade 17, zapewniając zdrowy wybór opcji łączności. Mimo to, chcielibyśmy zobaczyć trochę więcej, aby lepiej odróżnić Blade 18 od jego mniejszego rodzeństwa. Na przykład, port HDMI dodałby więcej wszechstronności do przestronnego, 18-calowego ekranu.
Należy pamiętać, że tylko jeden z dwóch portów USB-C jest kompatybilny z urządzeniami Thunderbolt.

Czytnik kart SD
Jesteśmy w stanie przenieść 1 GB zdjęć z naszej testowej karty UHS-II na pulpit w zaledwie 5 sekund, w porównaniu do ~13 sekund w przypadkuMSI Titan GT77.
| SD Card Reader | |
| average JPG Copy Test (av. of 3 runs) | |
| Razer Blade 18 RTX 4070 (Angelibird AV Pro V60) | |
| Razer Blade 17 Early 2022 (AV PRO microSD 128 GB V60) | |
| Razer Blade 16 Early 2023 (AV PRO microSD 128 GB V60) | |
| MSI Titan GT77 HX 13VI (Angelibird AV Pro V60) | |
| maximum AS SSD Seq Read Test (1GB) | |
| Razer Blade 18 RTX 4070 (Angelibird AV Pro V60) | |
| Razer Blade 16 Early 2023 (AV PRO microSD 128 GB V60) | |
| Gigabyte G7 KE (AV PRO microSD 128 GB V60) | |
| MSI Titan GT77 HX 13VI (Angelibird AV Pro V60) | |
Komunikacja
Intel AX211 jest standardem dla Wi-Fi 6E i Bluetooth 5.3, natomiast Blade 17 jest wyposażony w Killer AX1690i. Killer AX1690i jest pochodną Intel AX211 przeznaczoną dla graczy, więc użytkownicy nie powinni zauważyć znaczących różnic w wydajności pomiędzy nimi.
| Networking | |
| iperf3 transmit AXE11000 6GHz | |
| Asus ROG Strix Scar 17 SE G733CX-LL014W | |
| Razer Blade 18 RTX 4070 | |
| iperf3 receive AXE11000 6GHz | |
| Asus ROG Strix Scar 17 SE G733CX-LL014W | |
| Razer Blade 18 RTX 4070 | |
| iperf3 receive AXE11000 | |
| Razer Blade 17 Early 2022 | |
| Gigabyte G7 KE | |
| MSI Titan GT77 HX 13VI | |
| Razer Blade 18 RTX 4070 | |
| Alienware m17 R5 (R9 6900HX, RX 6850M XT) | |
| iperf3 transmit AXE11000 | |
| Gigabyte G7 KE | |
| MSI Titan GT77 HX 13VI | |
| Razer Blade 18 RTX 4070 | |
| Alienware m17 R5 (R9 6900HX, RX 6850M XT) | |
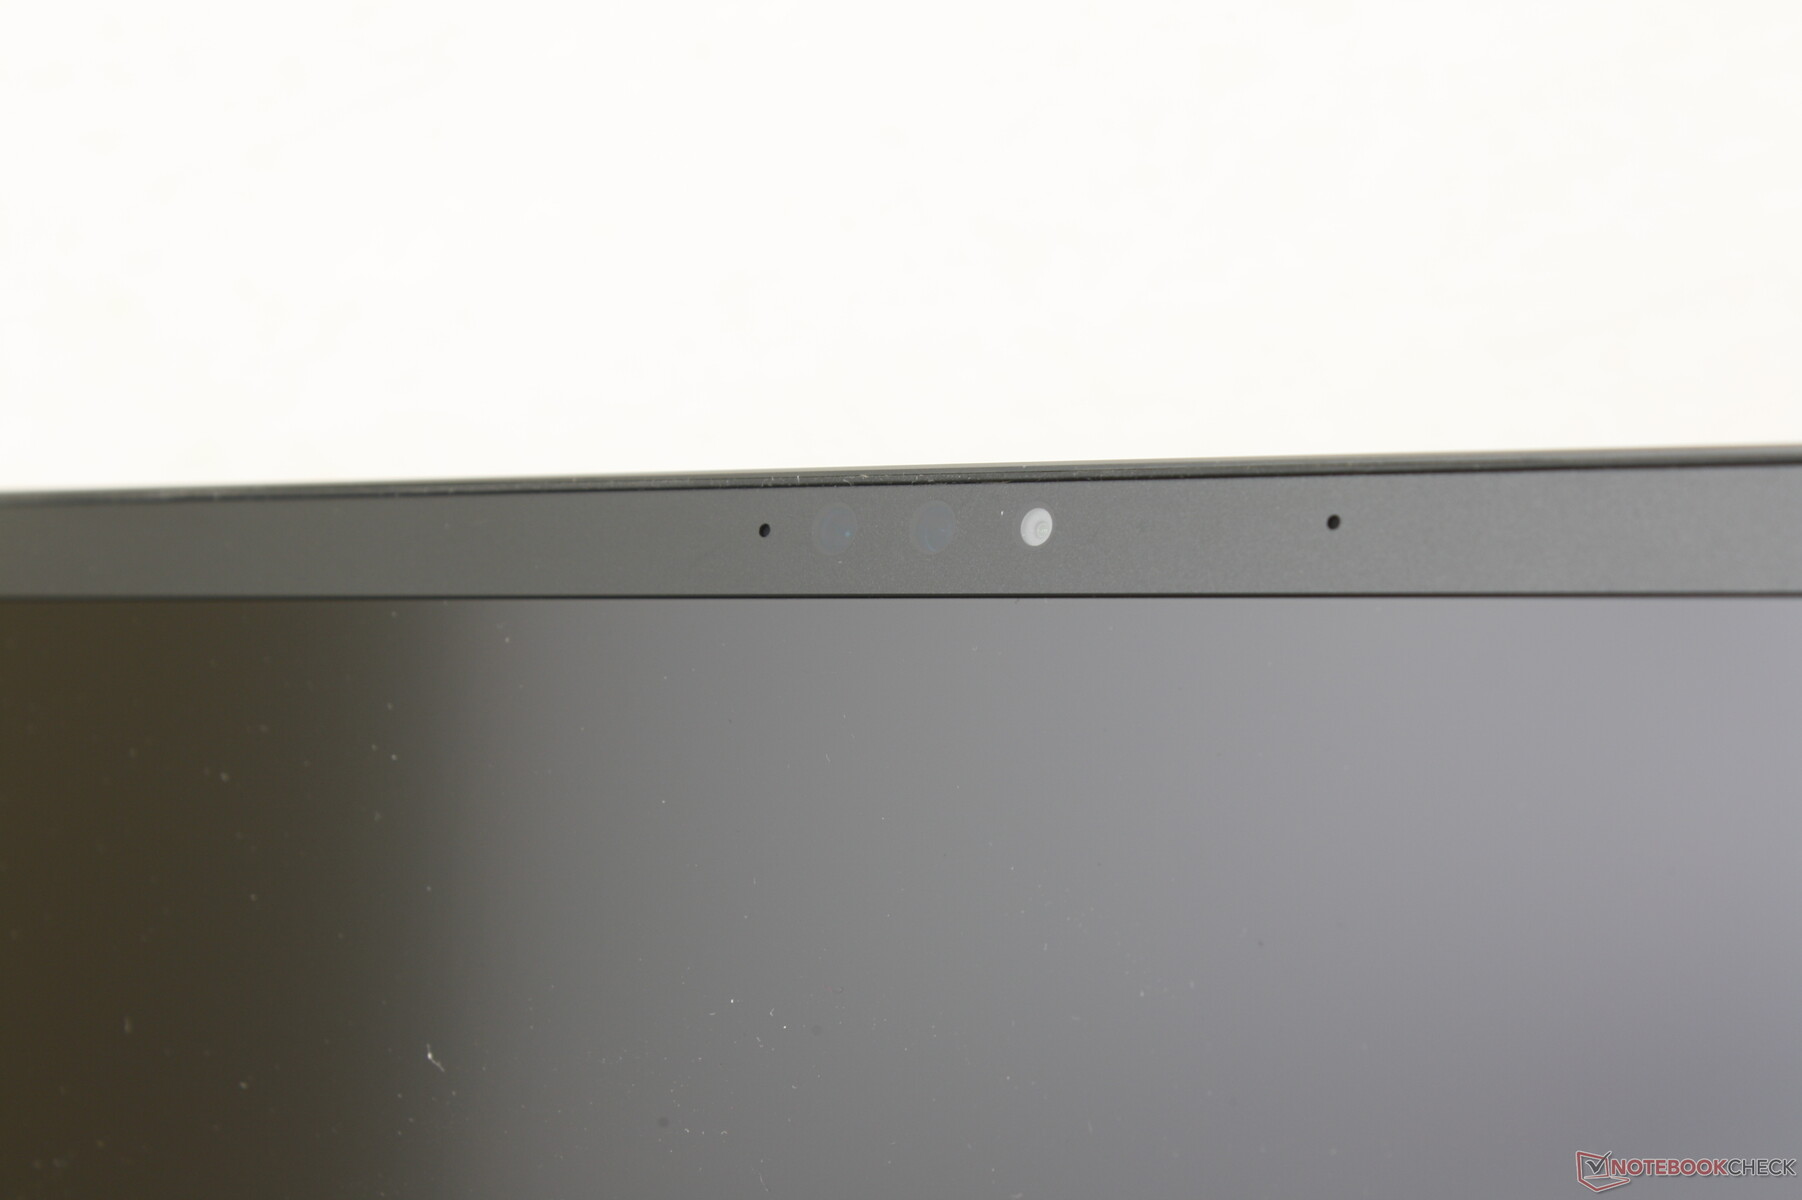
Kamera internetowa - teraz o rozdzielczości 5 MP
Razer podniósł kamerkę internetową z 2 MP w Blade 17 do 5 MP w Blade 18. Spodziewamy się, że producent zacznie aktualizować swoje mniejsze modele Blade z tym samym 5 MP sensorem w pewnym momencie w najbliższej przyszłości. Zdjęcia są ostrzejsze dzięki 5 MP sensorowi, a kolory nie zmieniły się zbytnio. Podczerwień jest standardem dla wsparcia Windows Hello.
Co dziwne, nie ma fizycznej migawki prywatności kamery internetowej, mimo że Blade 16 zawiera jedną. Nie ma nawet cyfrowego wyłącznika lub klawisza skrótu.


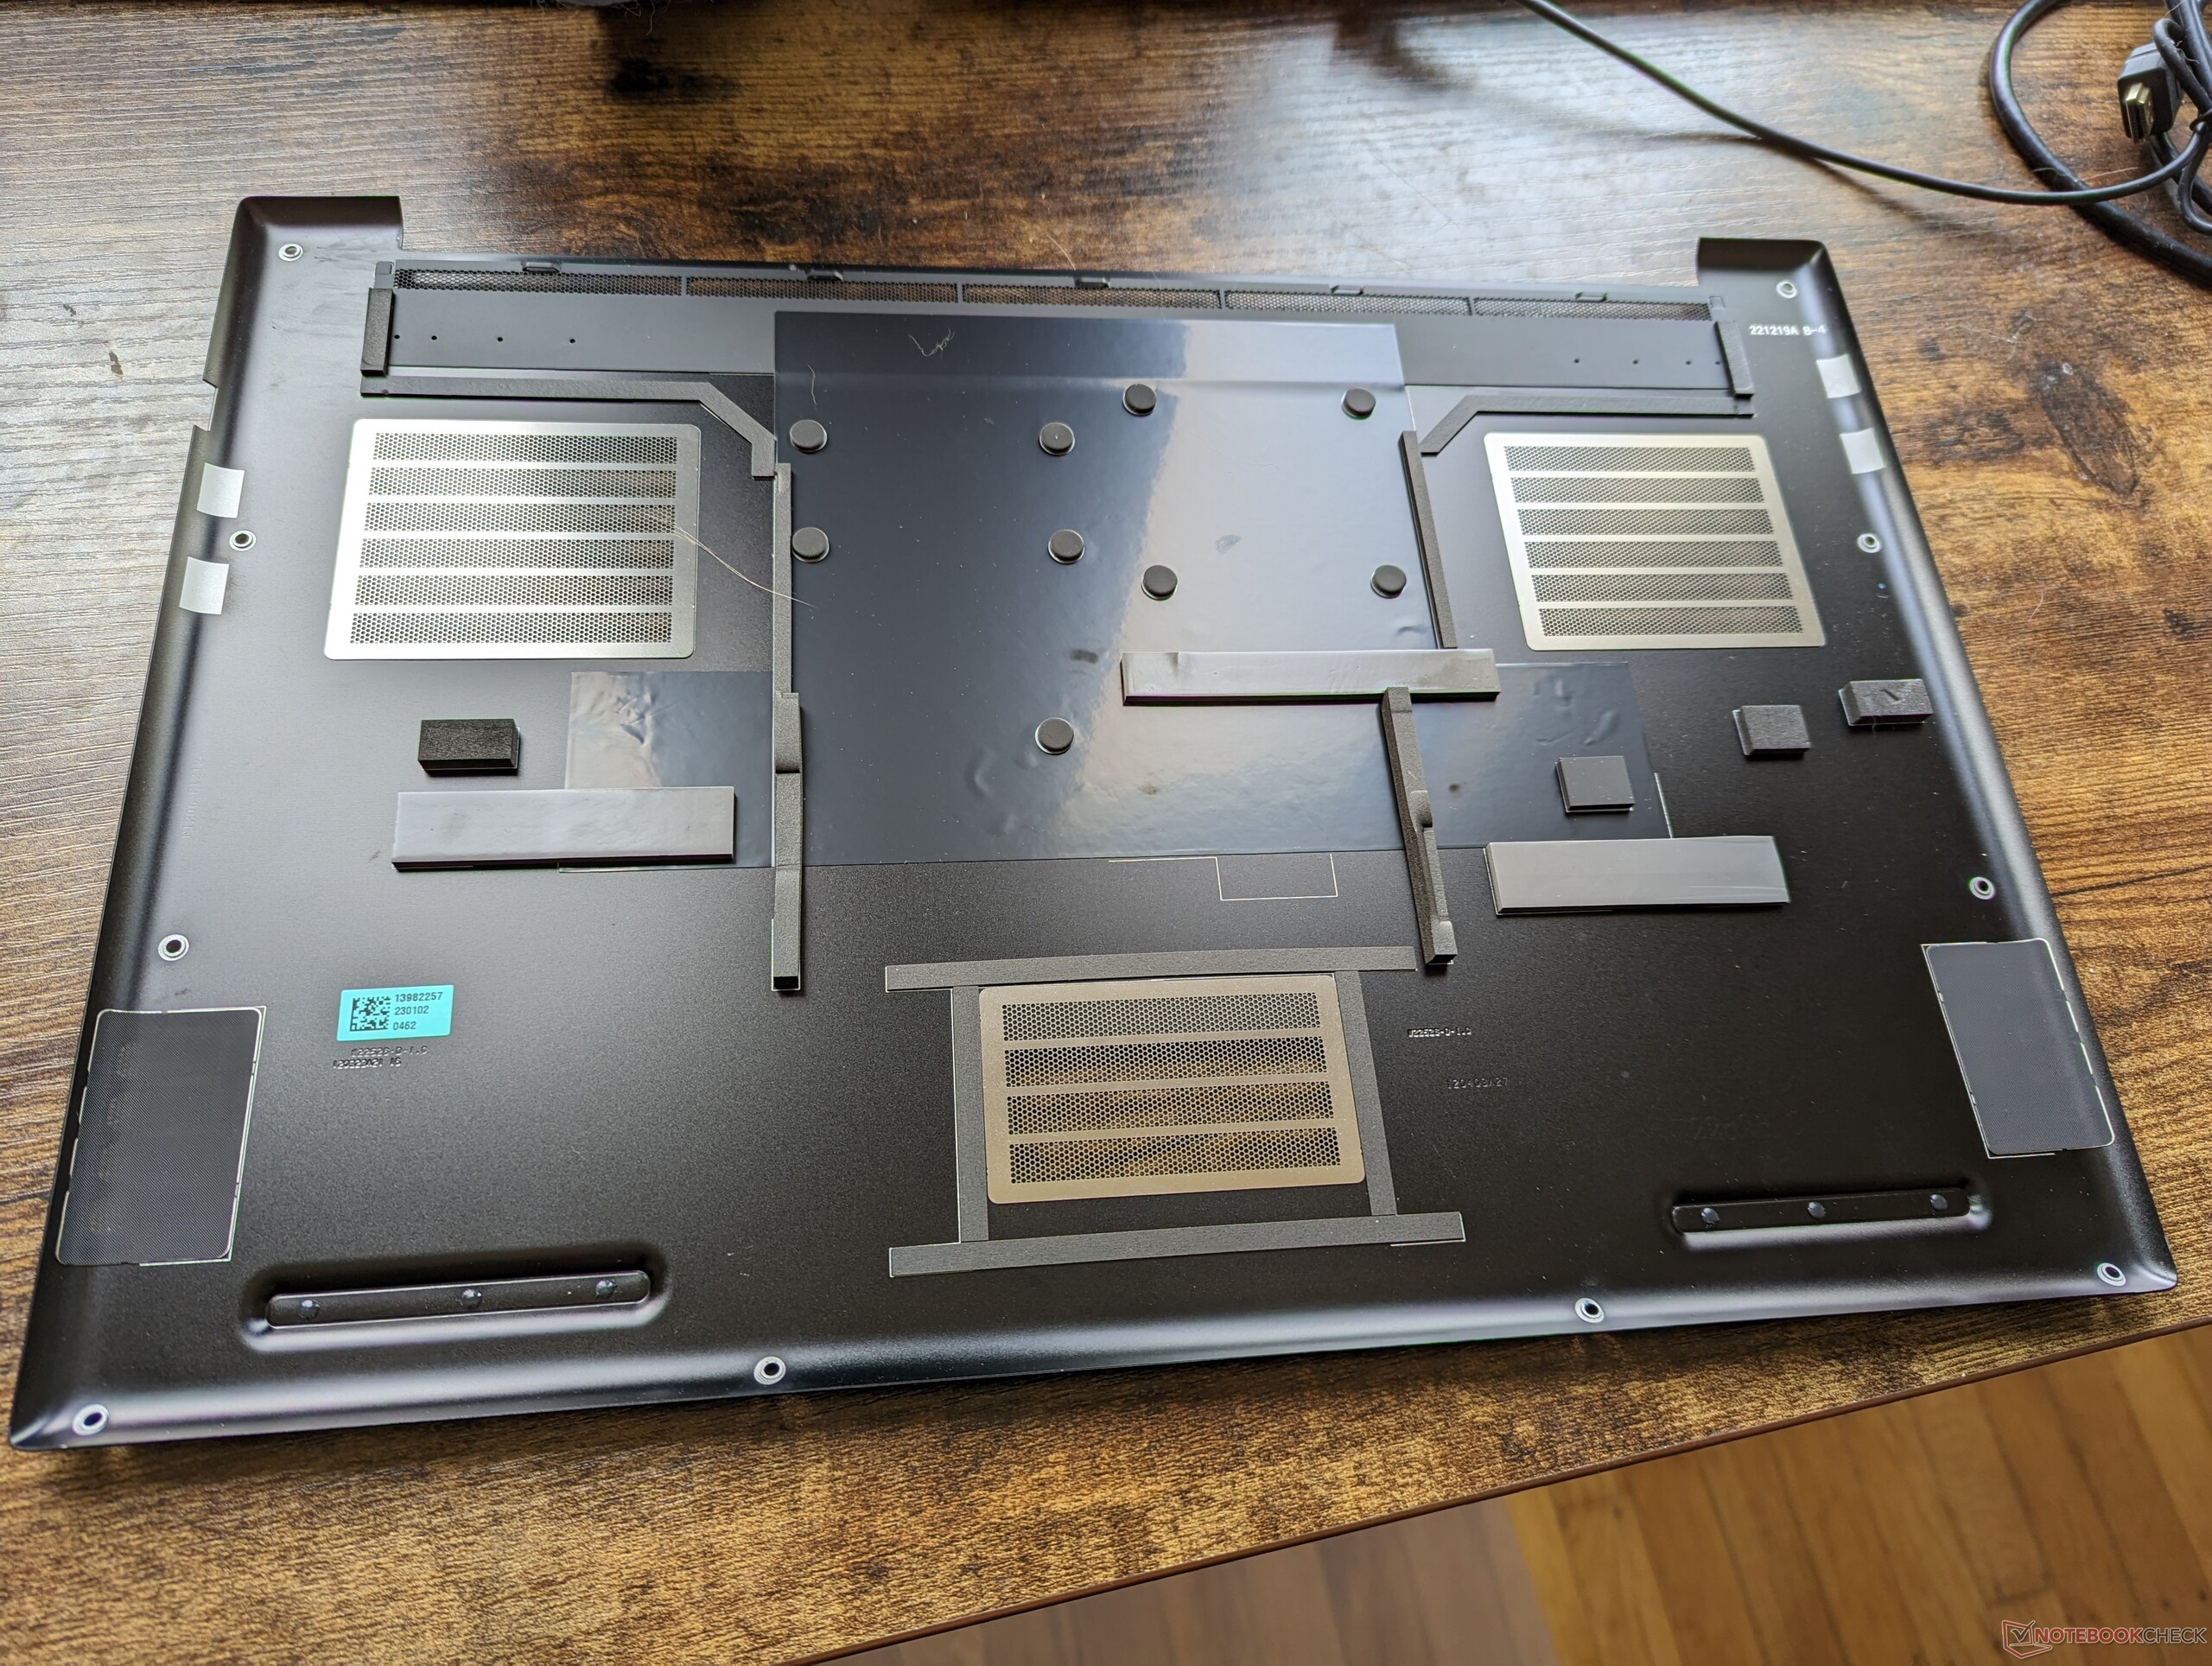
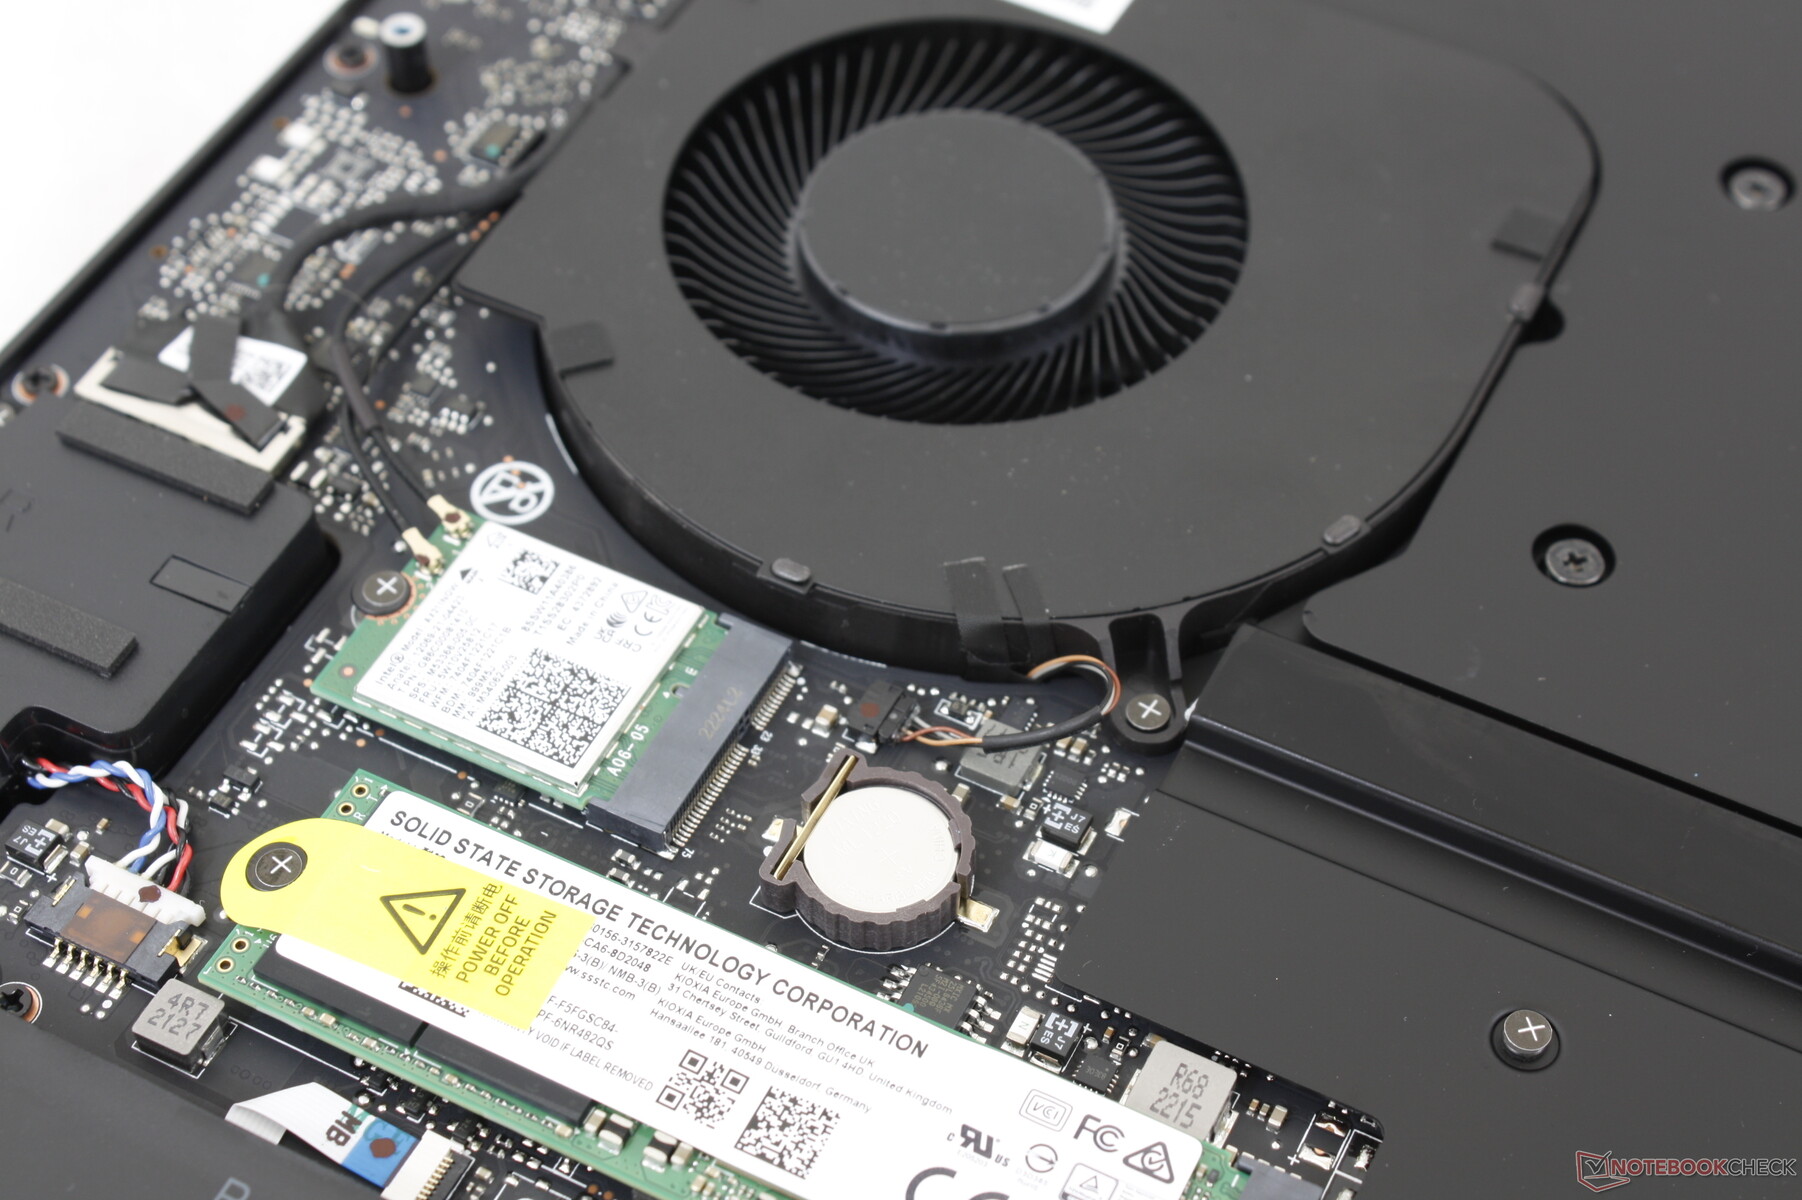
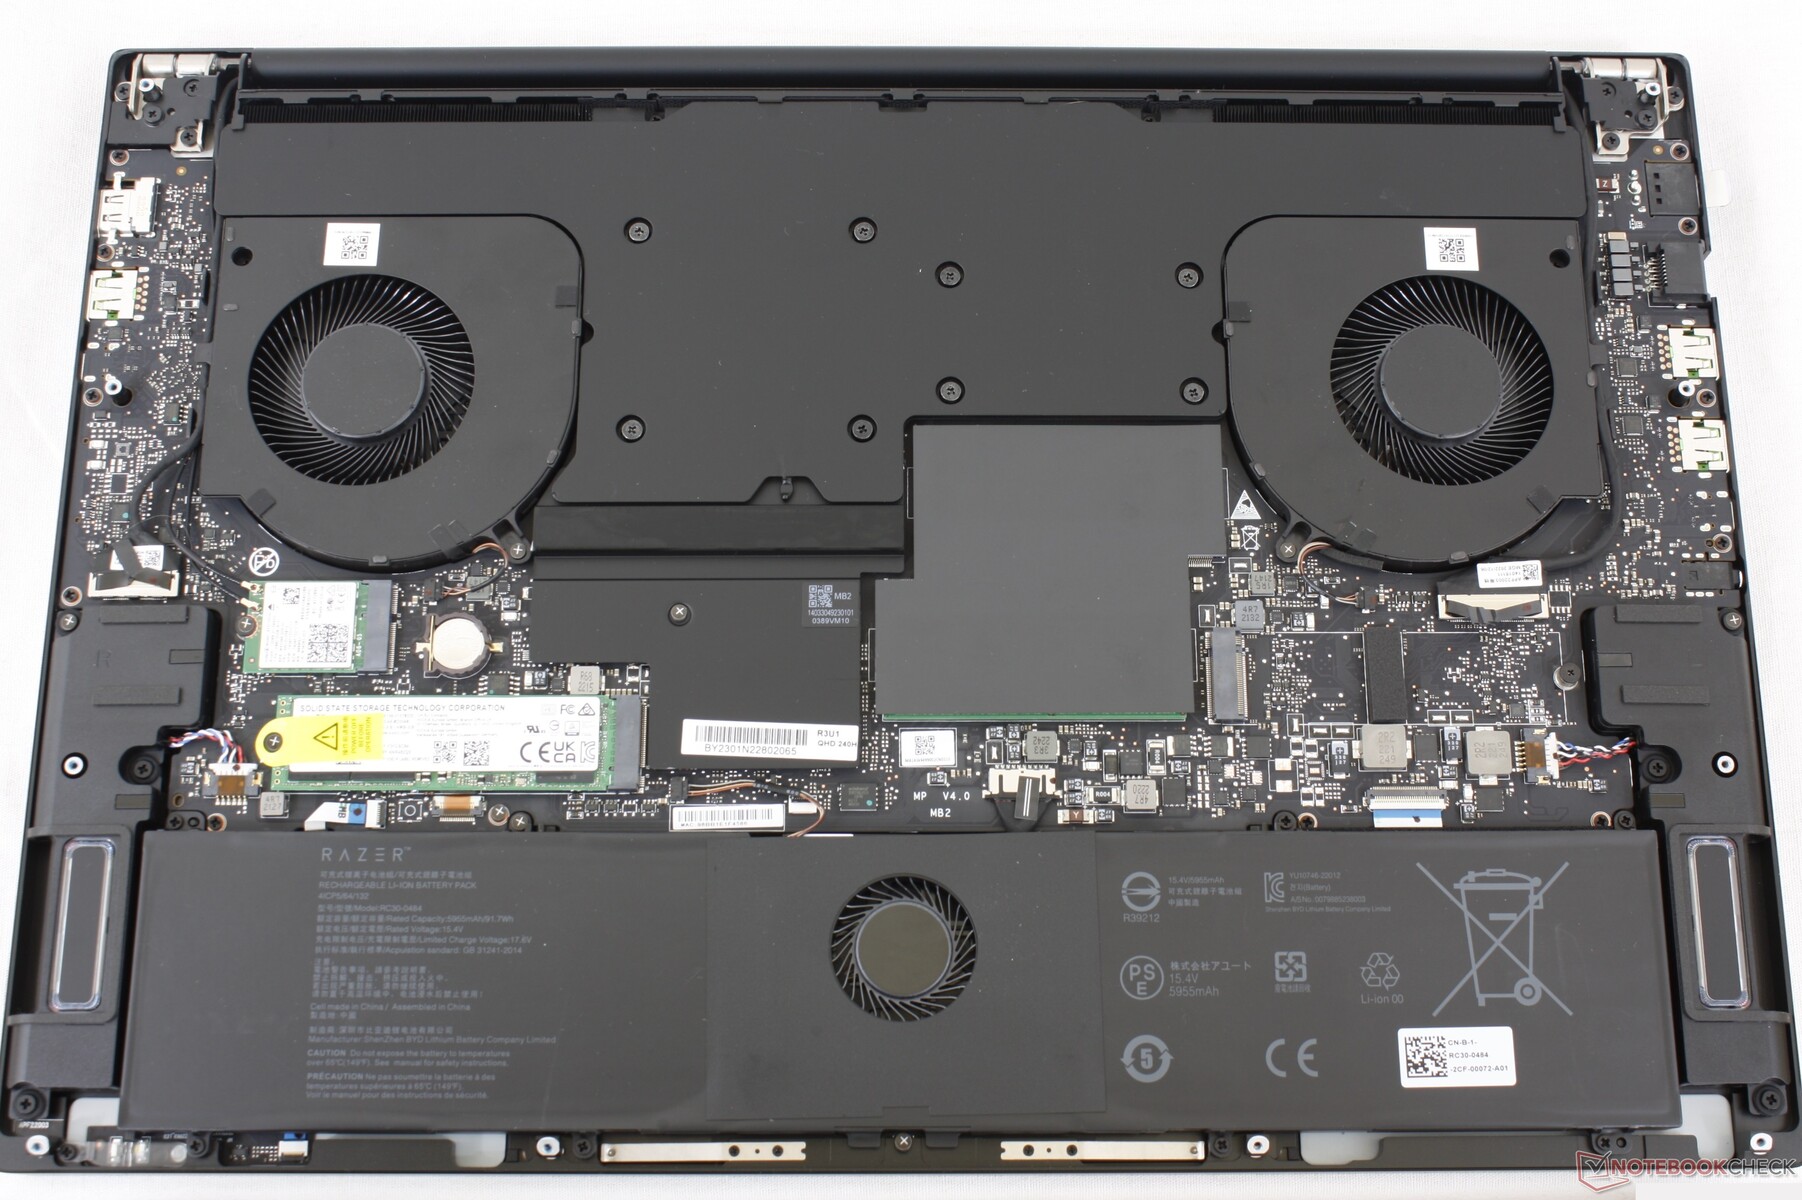
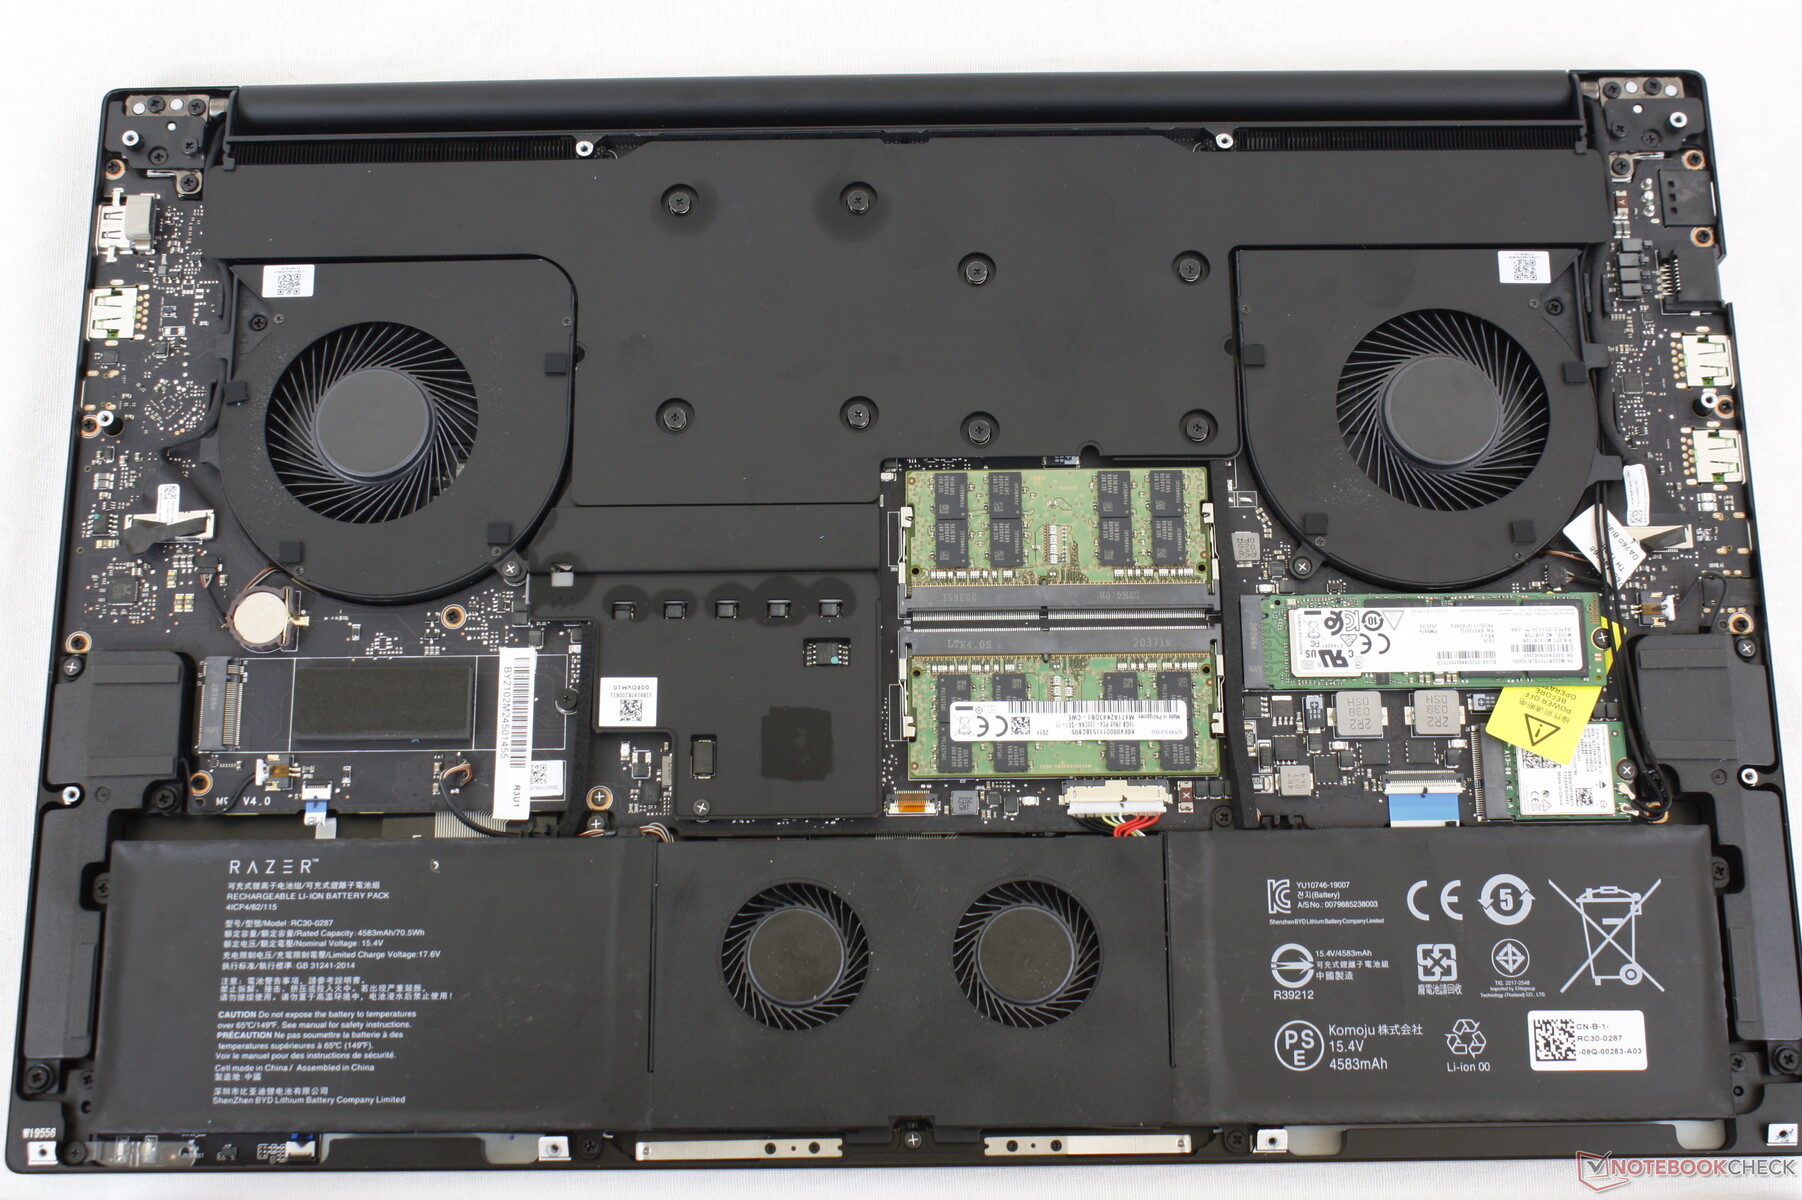
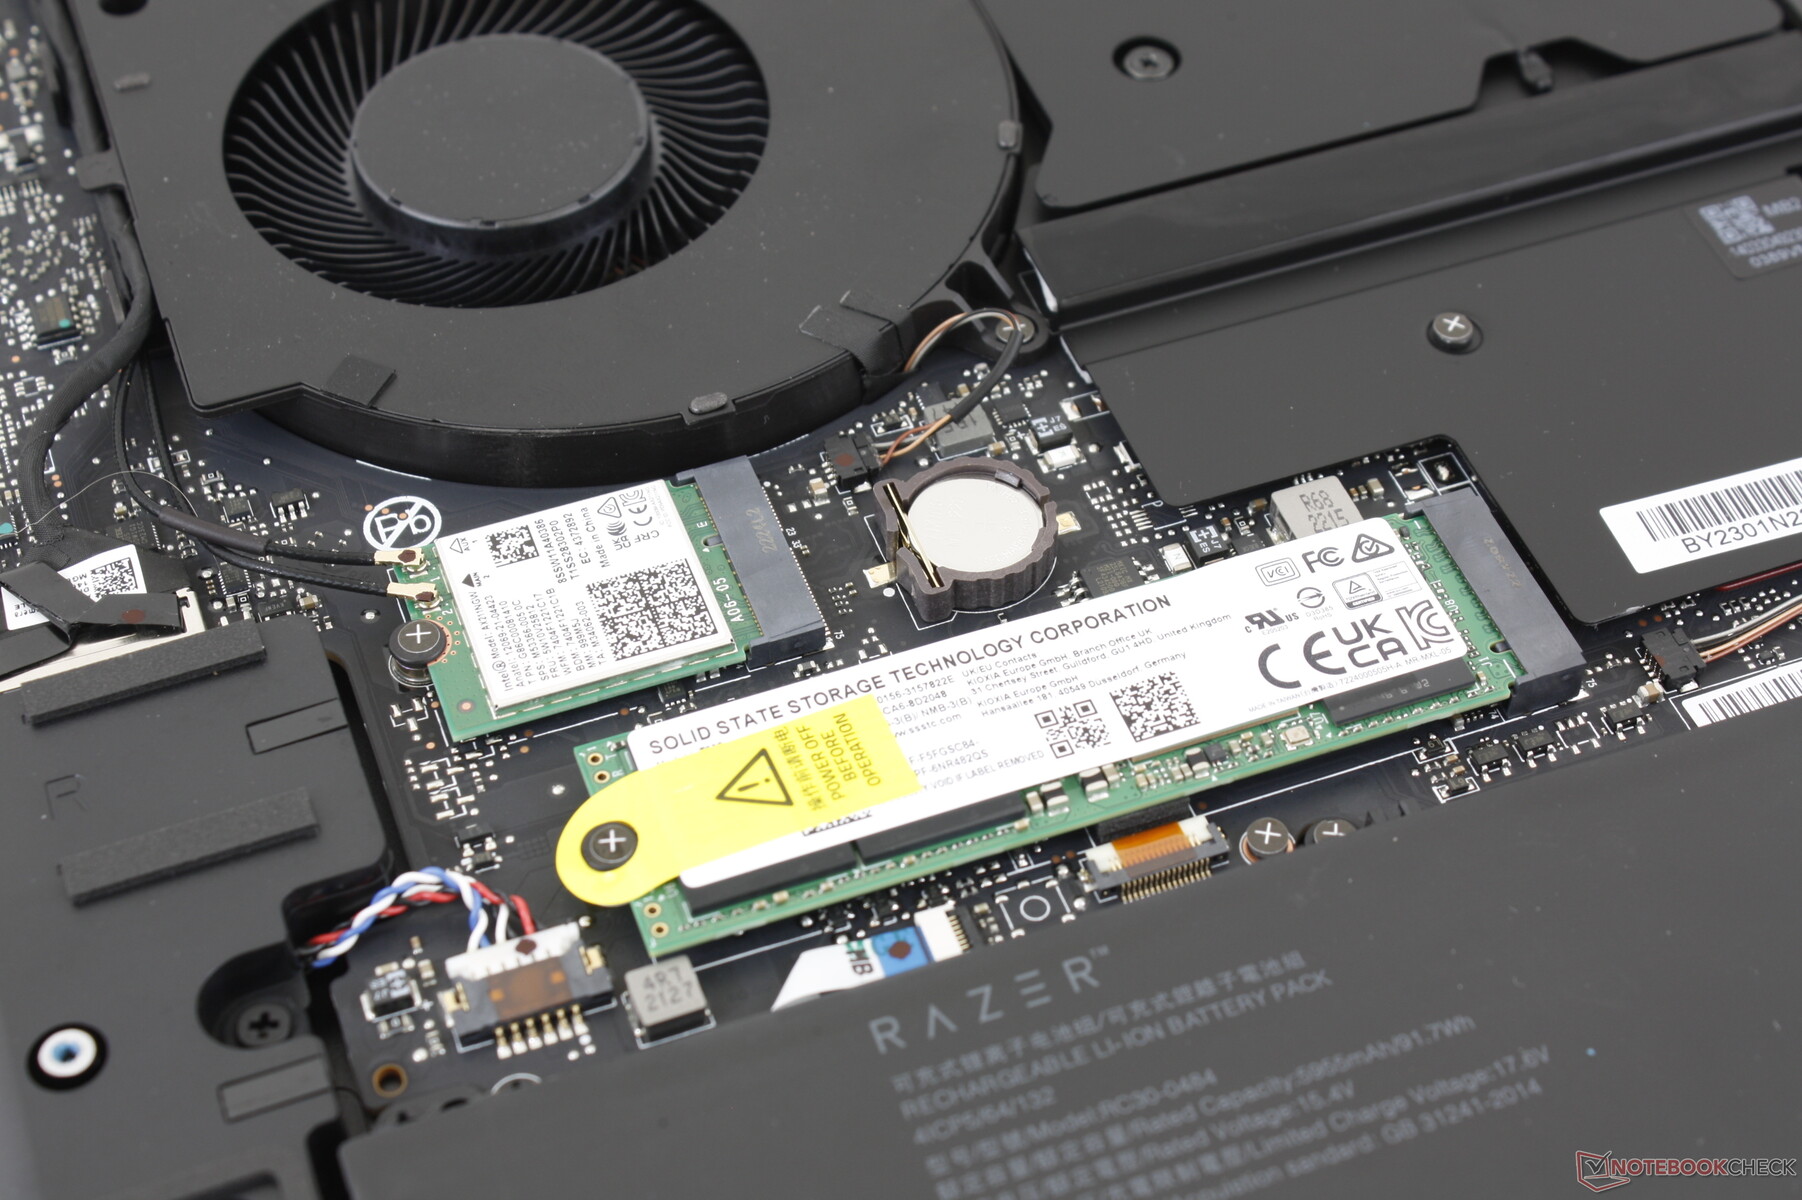
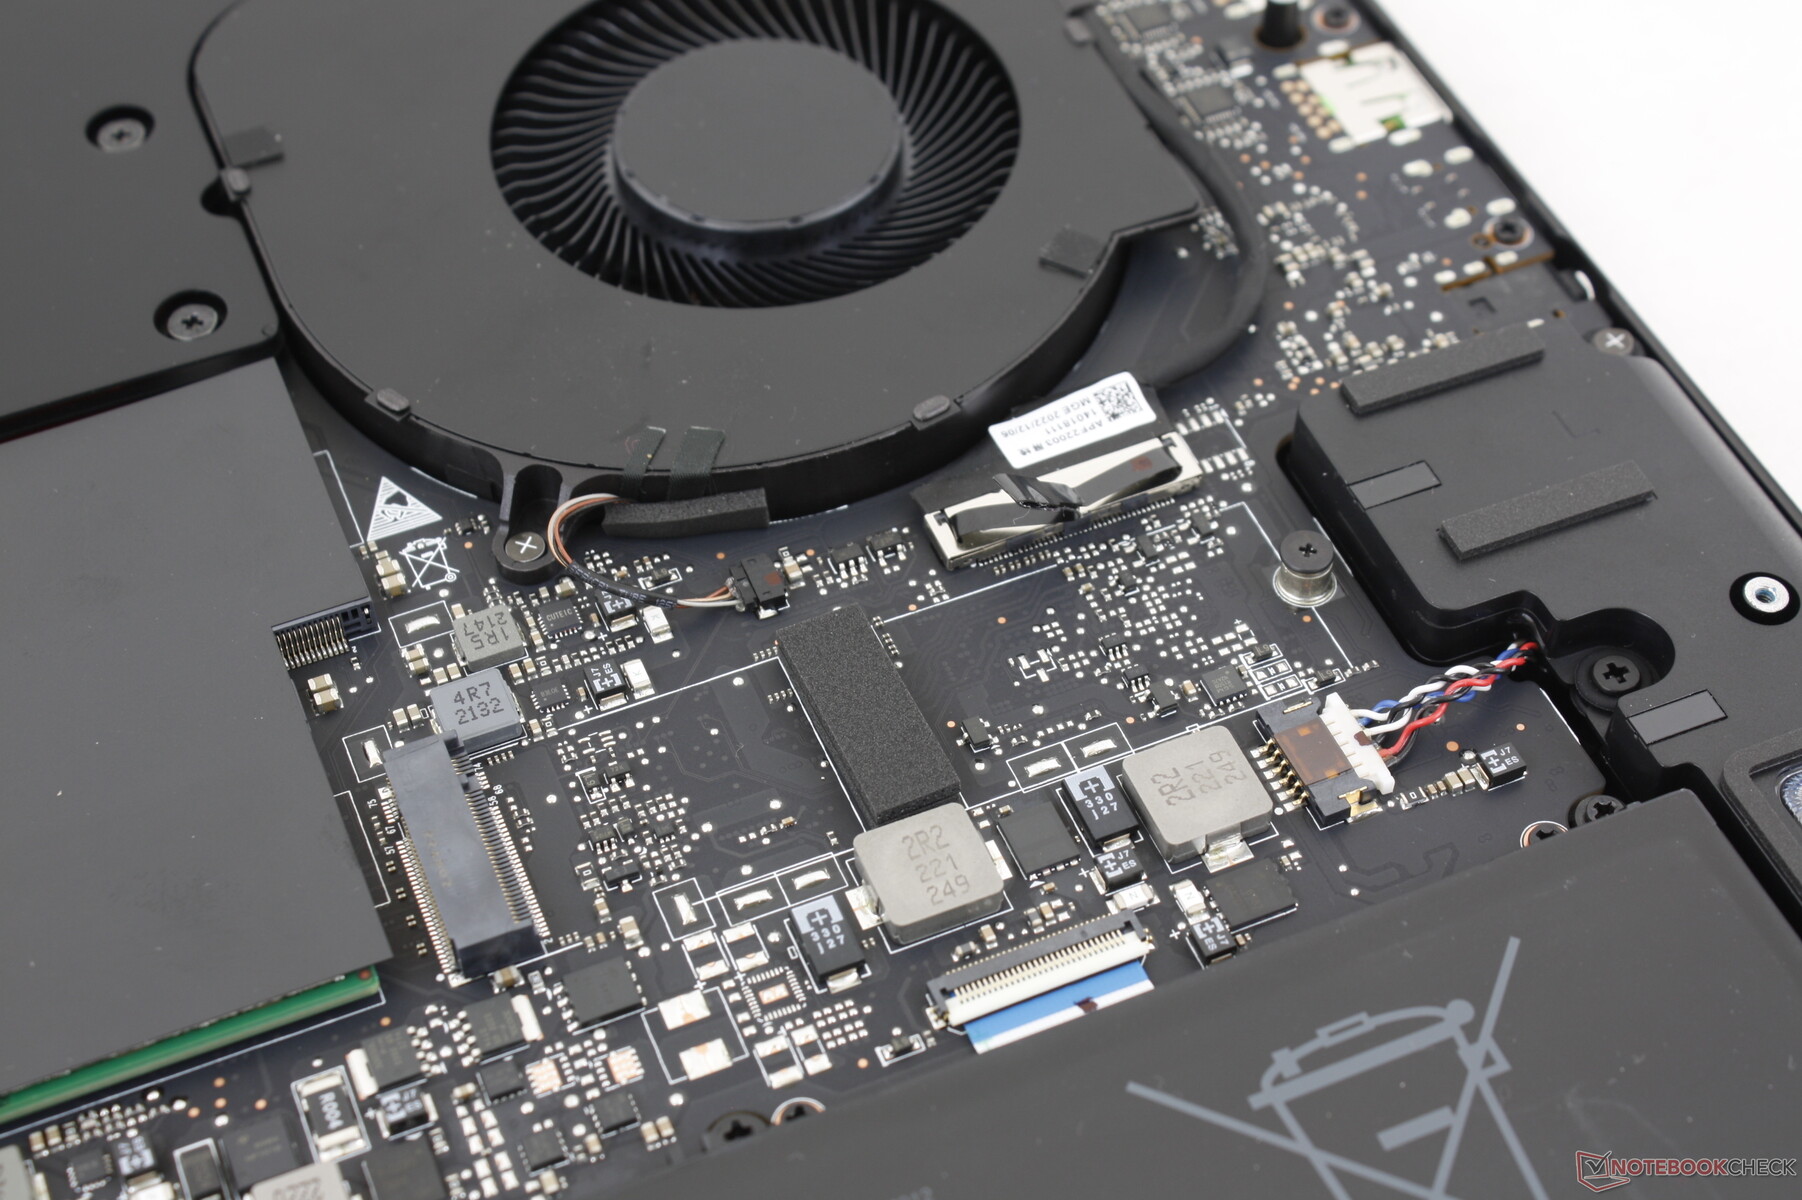
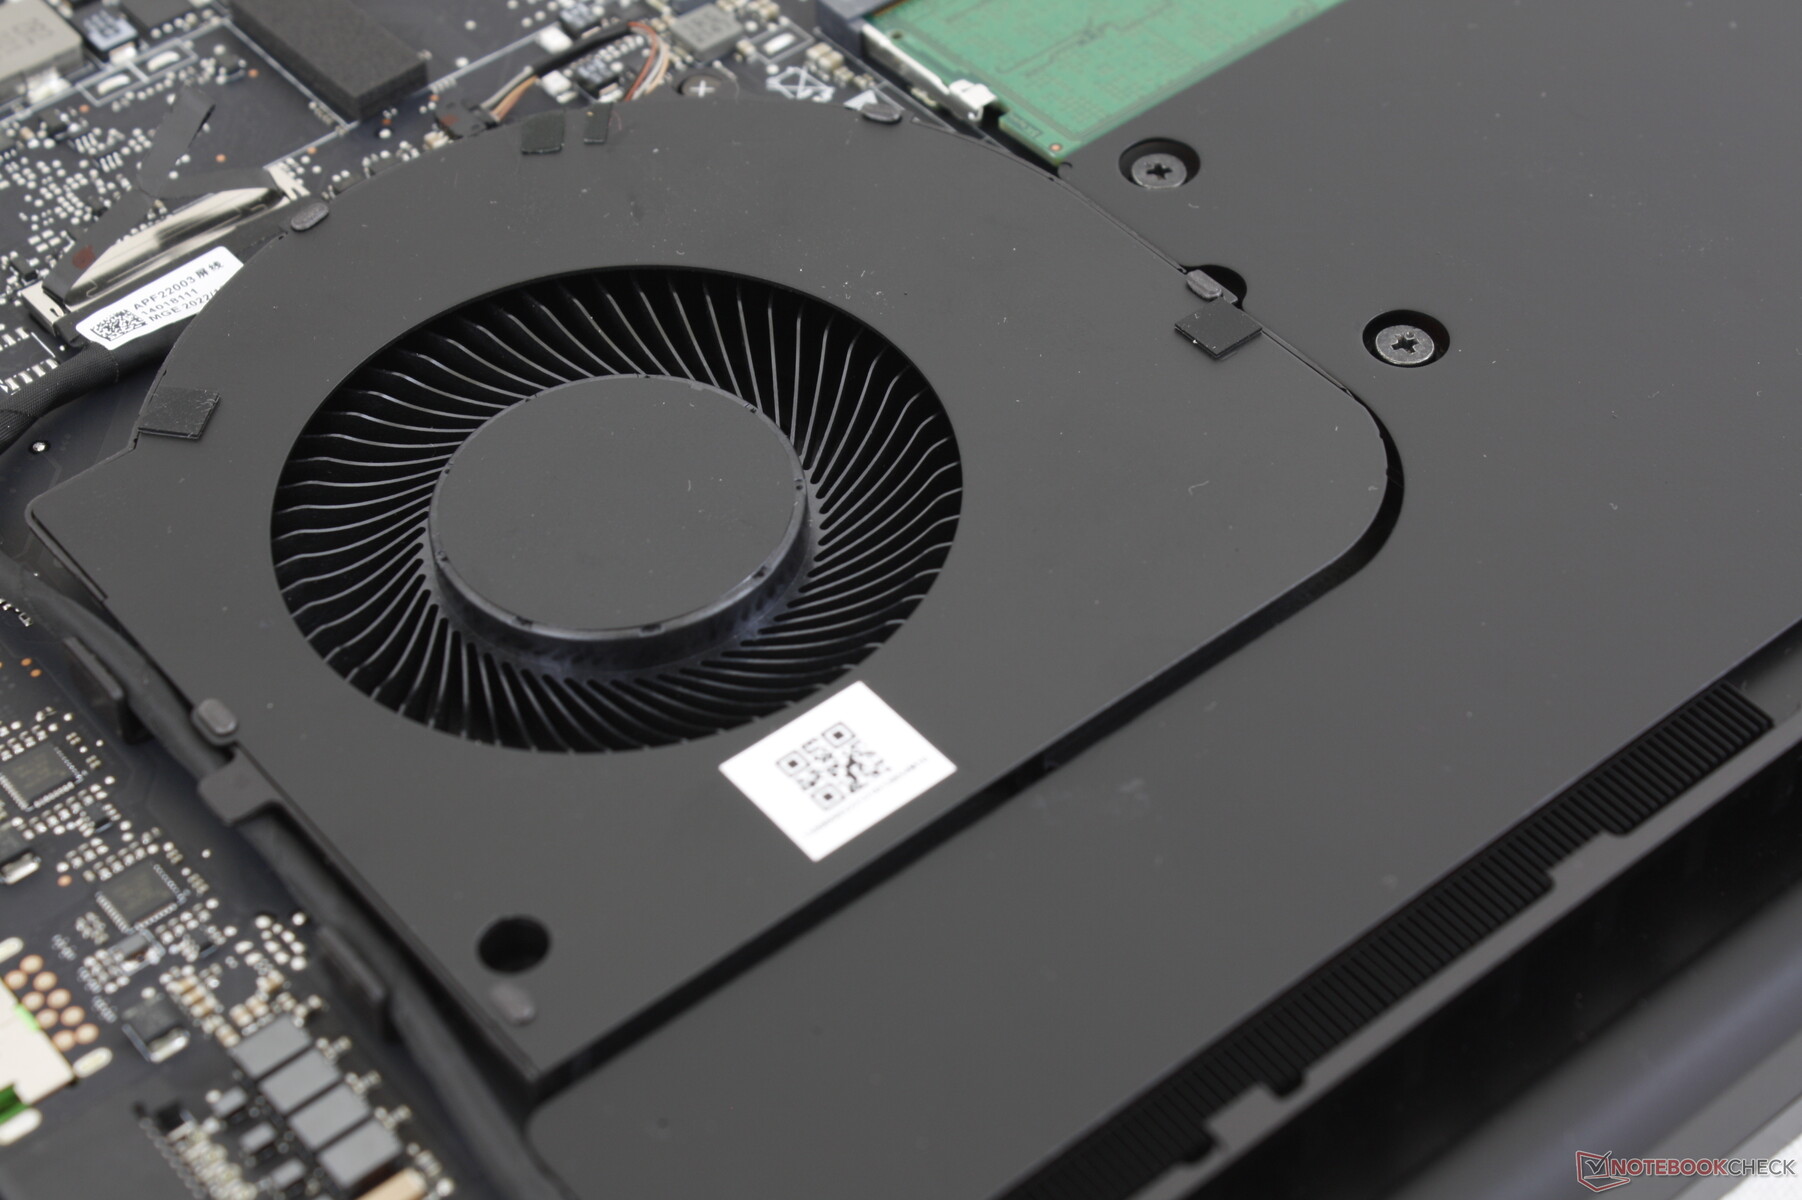
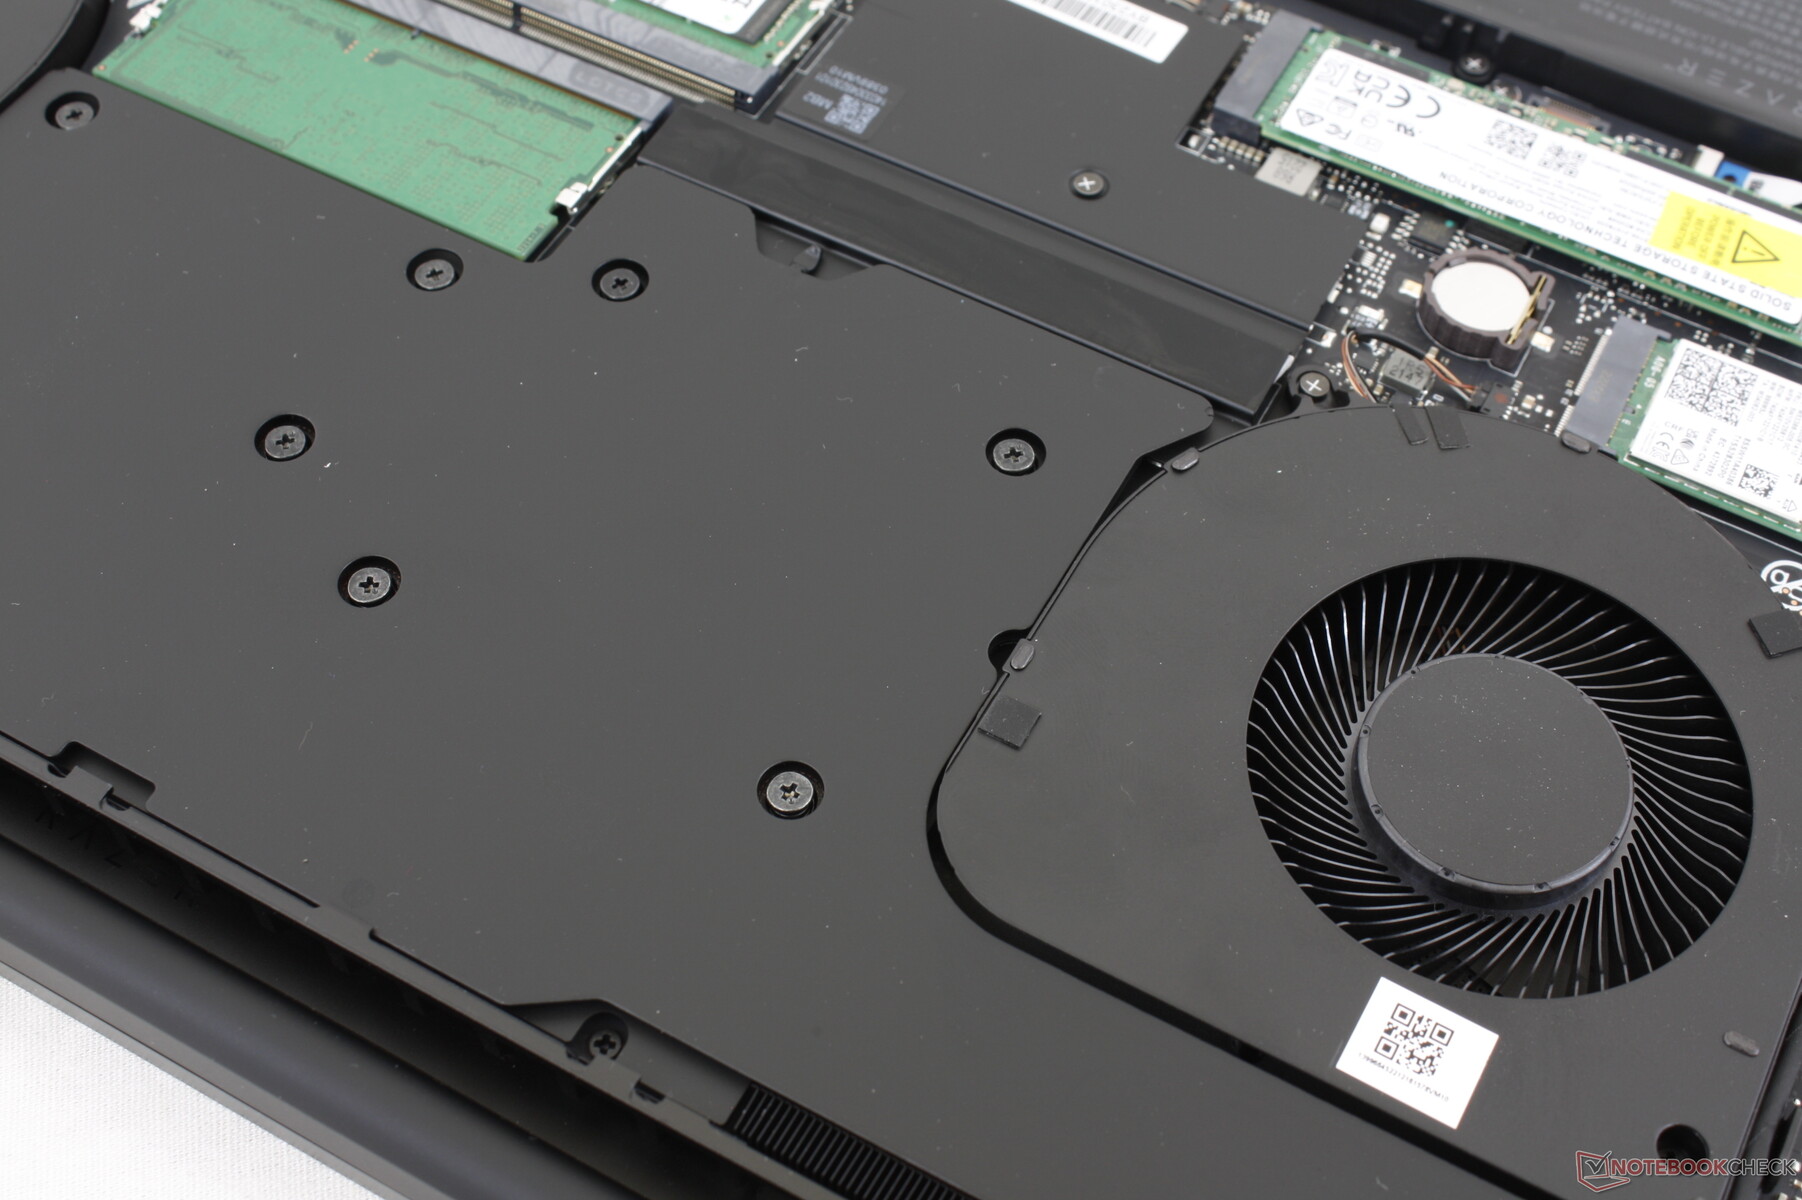
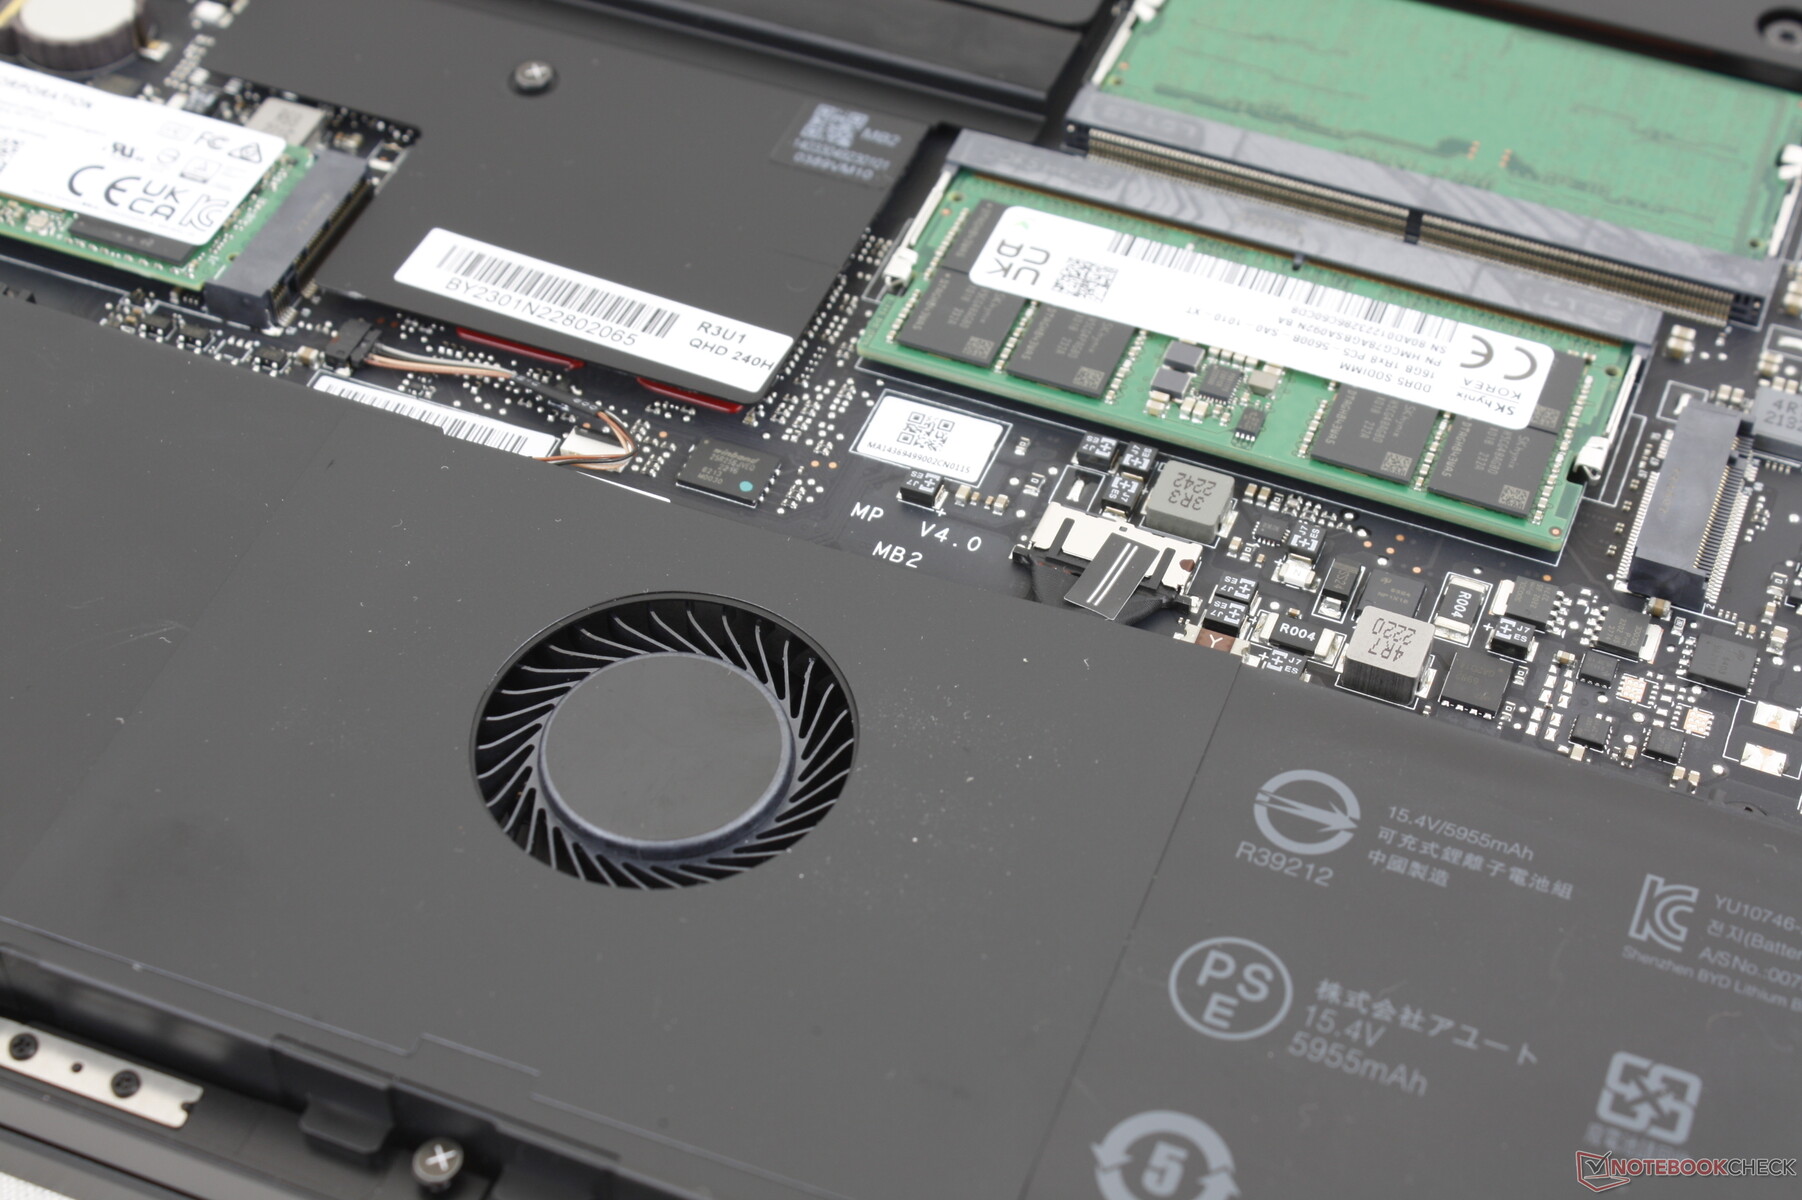
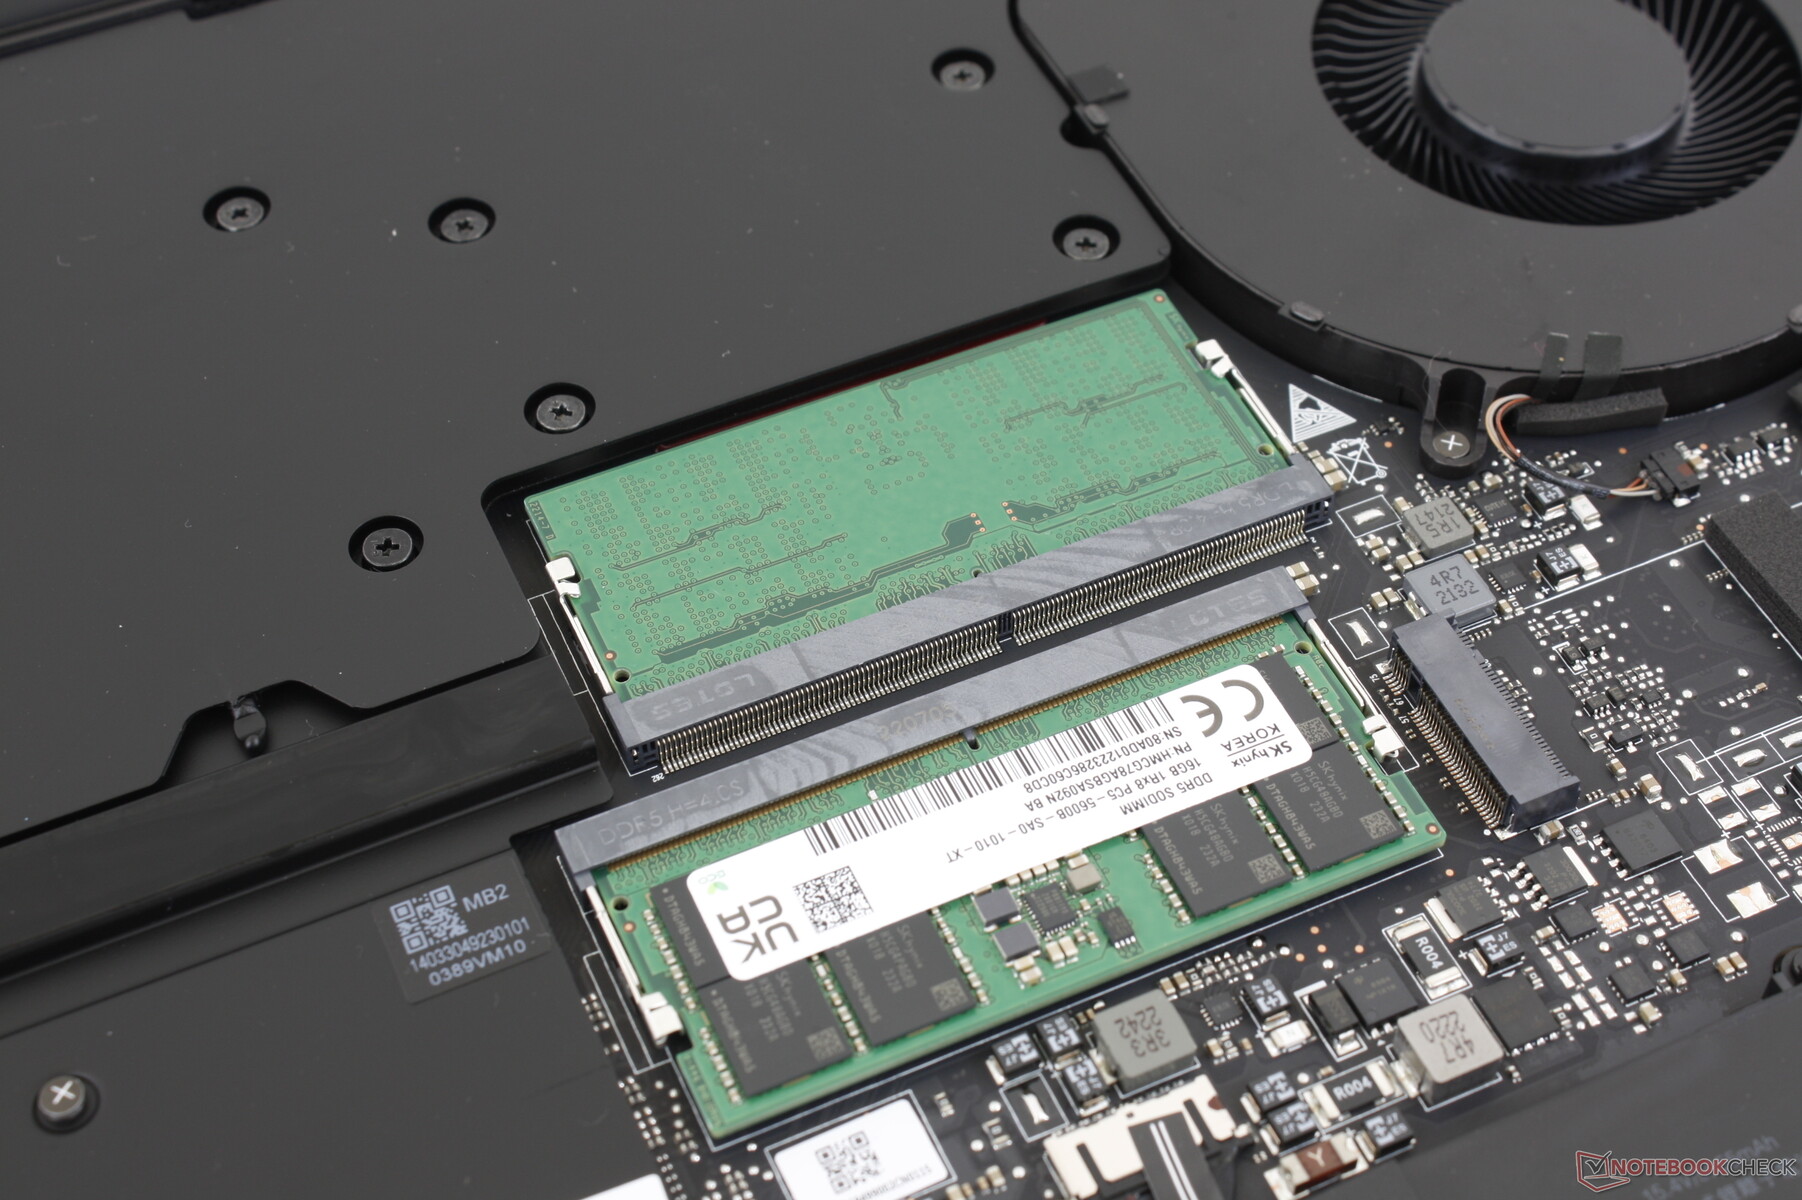
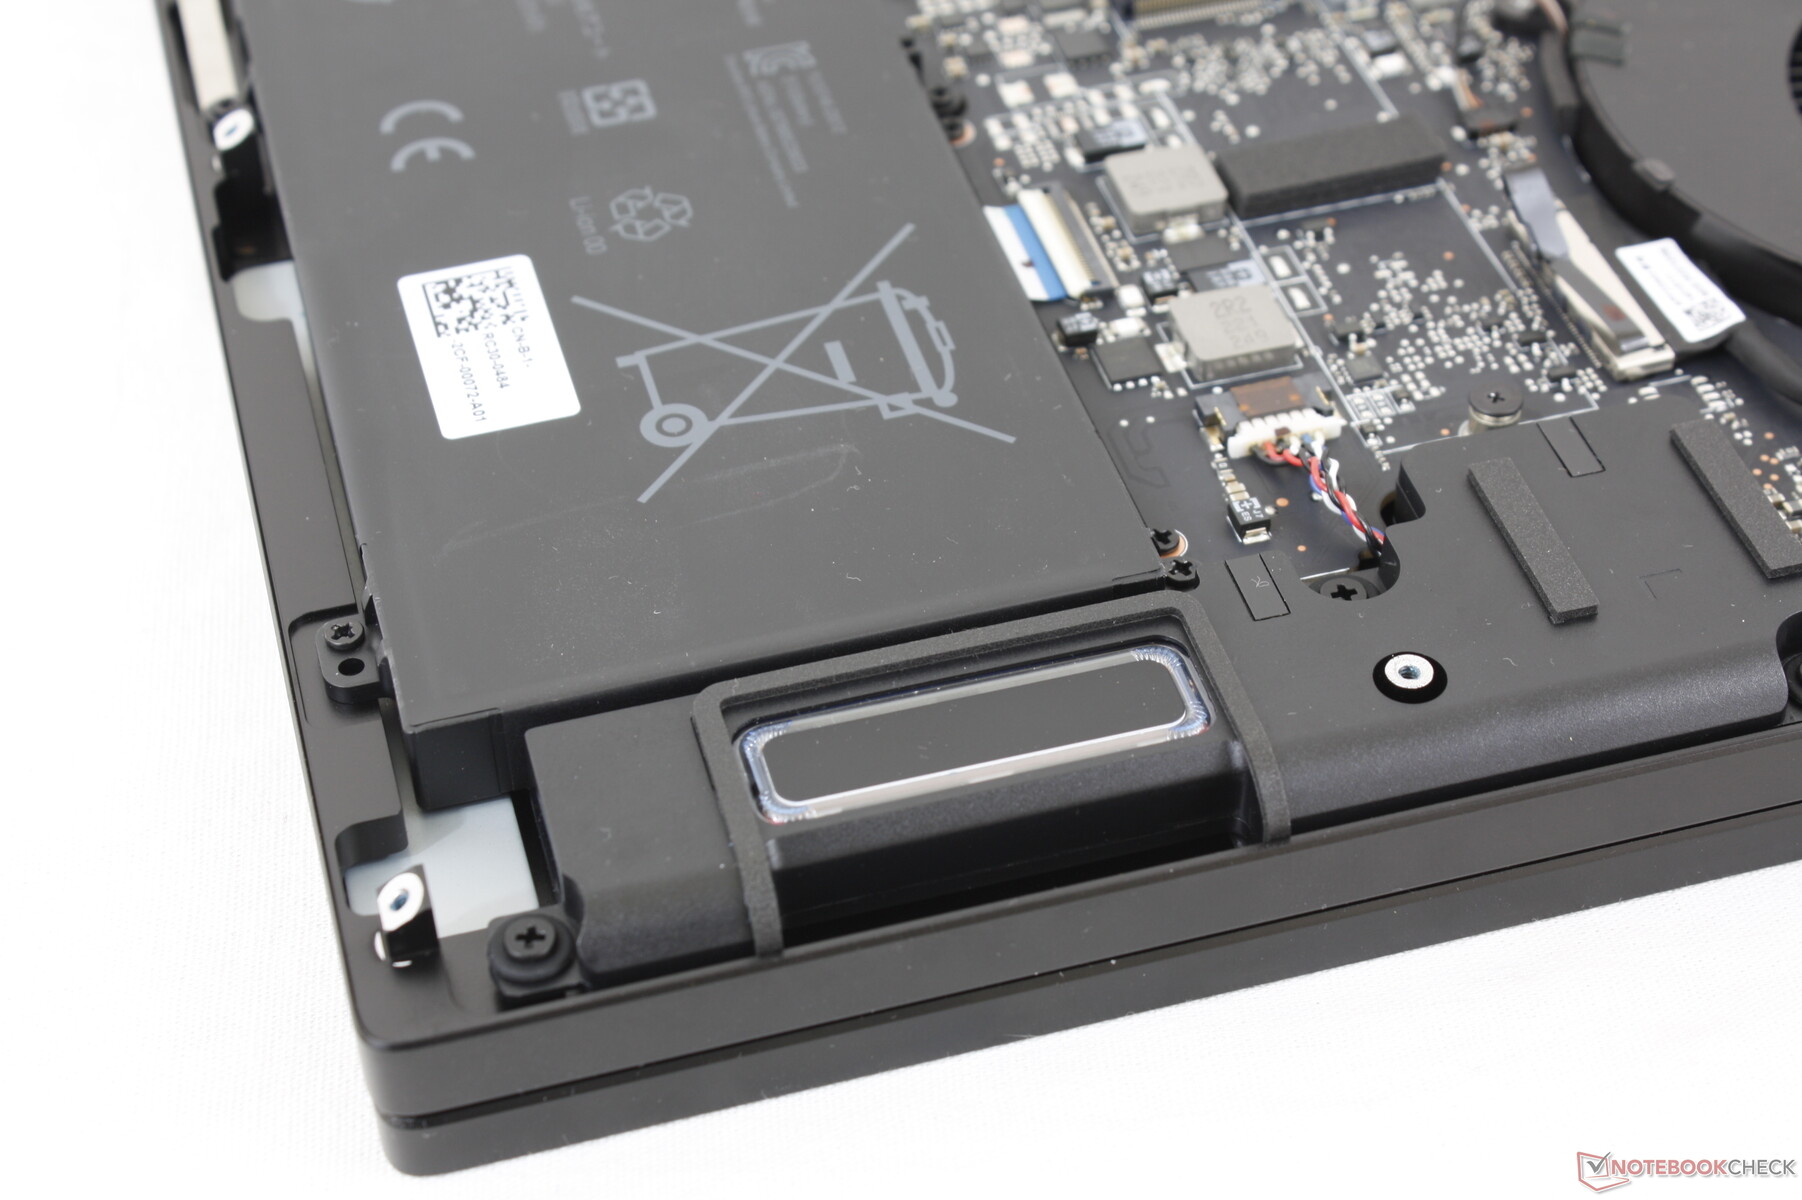
Konserwacja
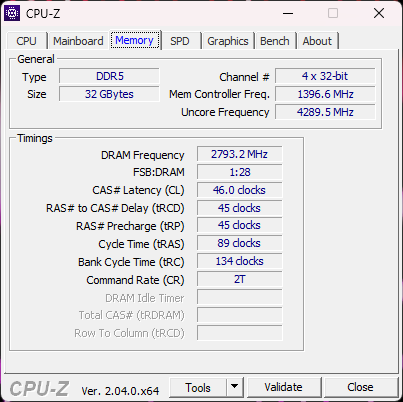
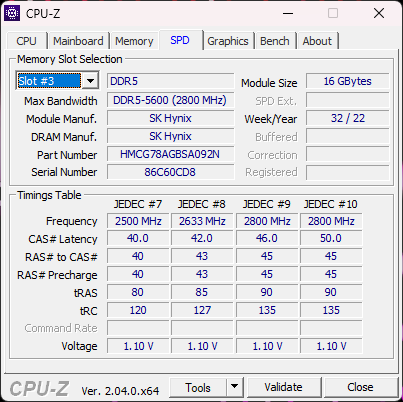
Dolny panel jest zabezpieczony dziesięcioma śrubami T5 Torx, co ułatwia serwisowanie. Użytkownicy mają bezpośredni dostęp do dwóch gniazd M.2 2280 SSD, dwóch gniazd SODIMM dla maksymalnie 32 GB DDR5-5600 lub 64 GB DDR5-5200 oraz wymiennego modułu WLAN. Co najważniejsze, obecna konstrukcja Blade 18 zawiera dodatkowy wentylator bezpośrednio pod clickpadem, podobnie jak w starszych konstrukcjach Blade 17.
Akcesoria i gwarancja
W opakowaniu detalicznym nie ma żadnych dodatków. W przypadku zakupu w USA obowiązuje roczna ograniczona gwarancja producenta, natomiast wewnętrzna bateria objęta jest osobną dwuletnią gwarancją.
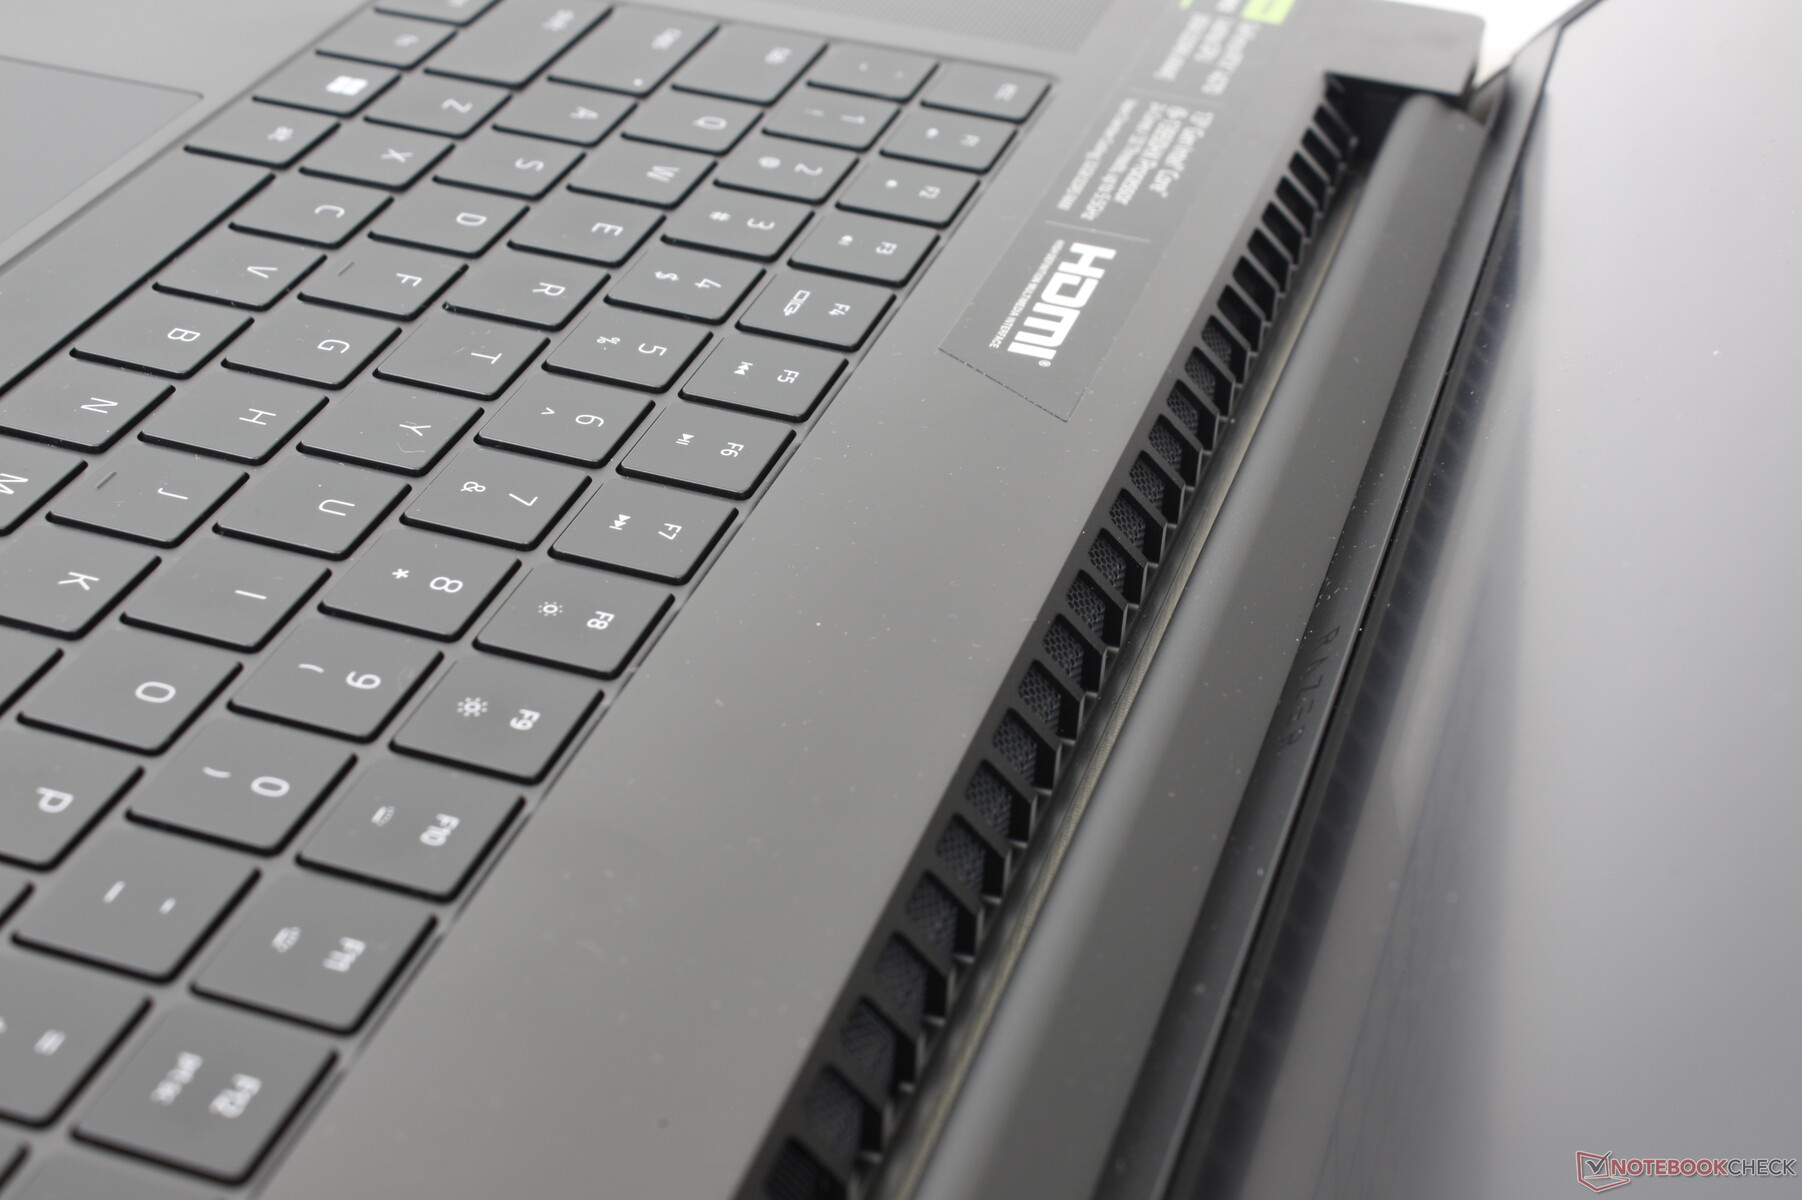
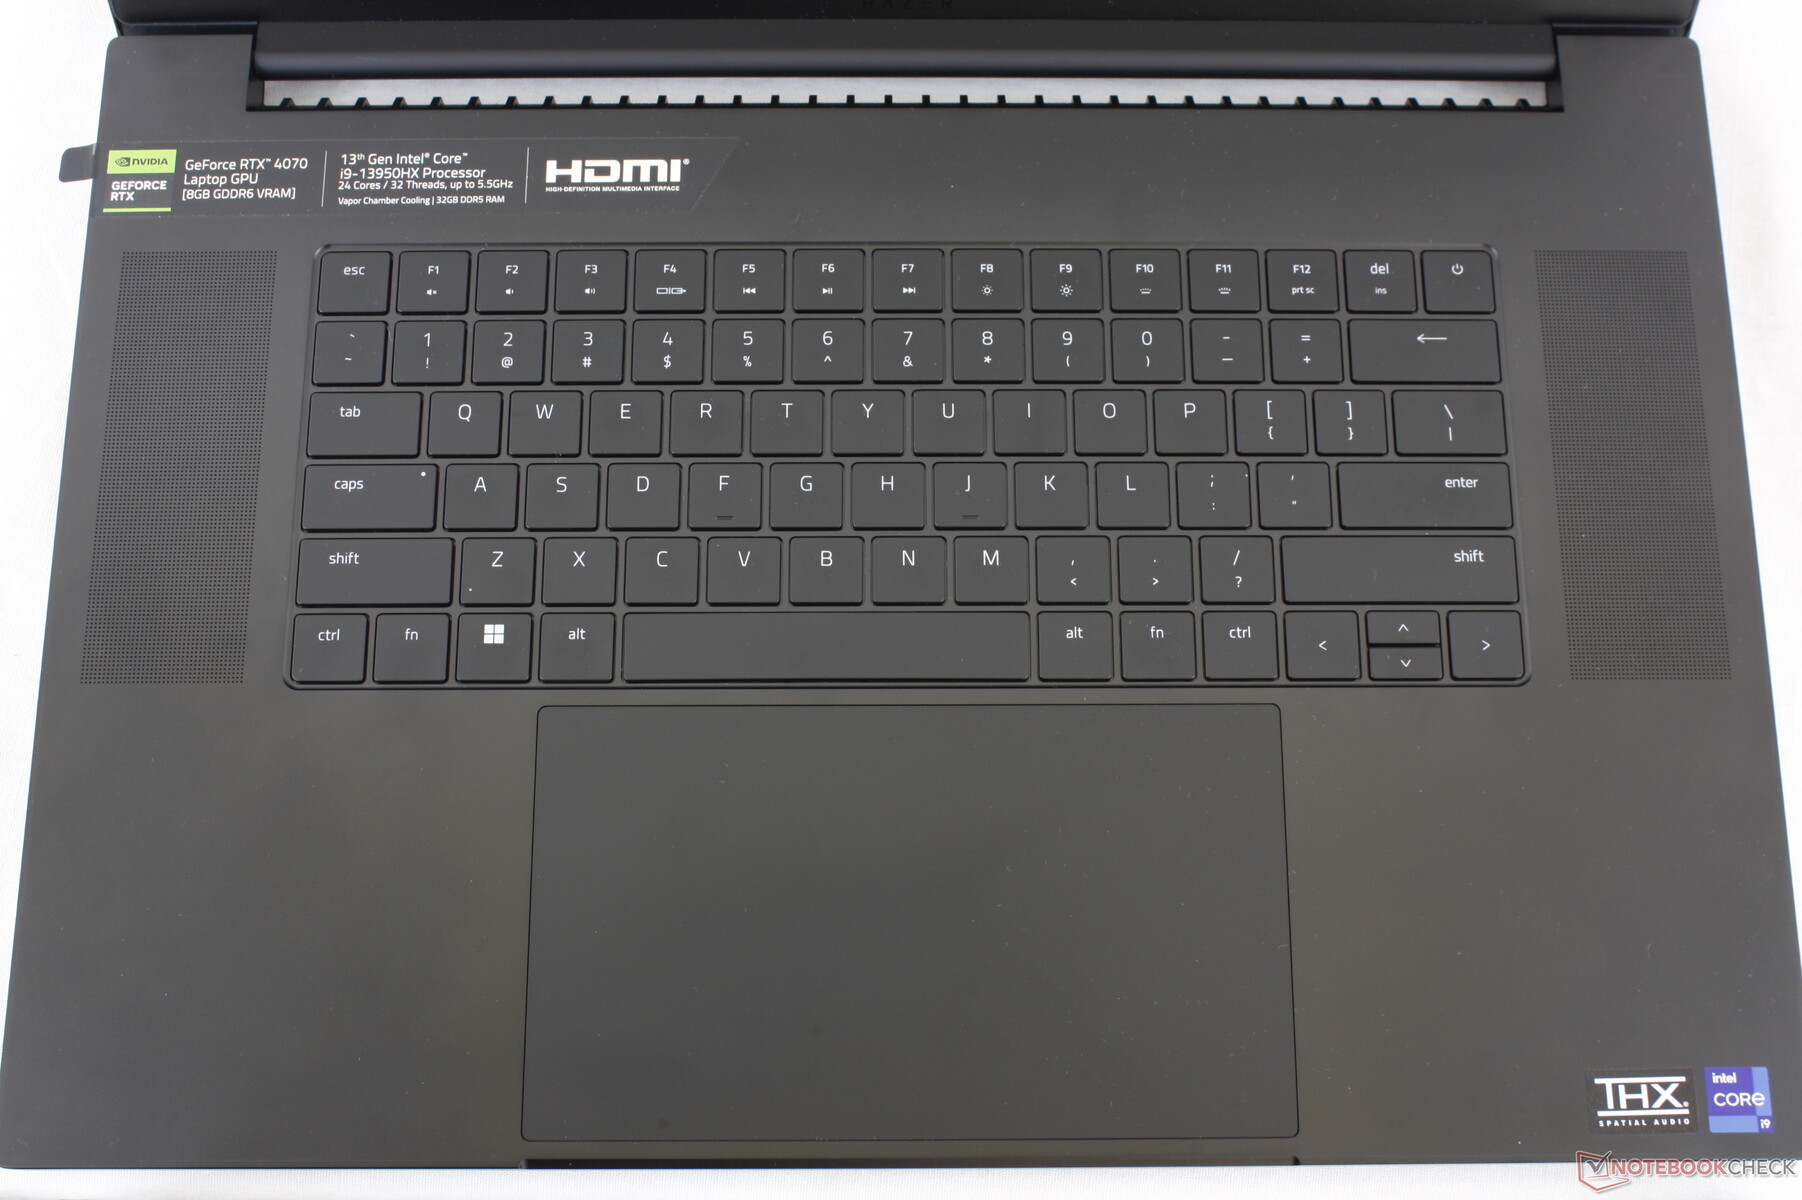
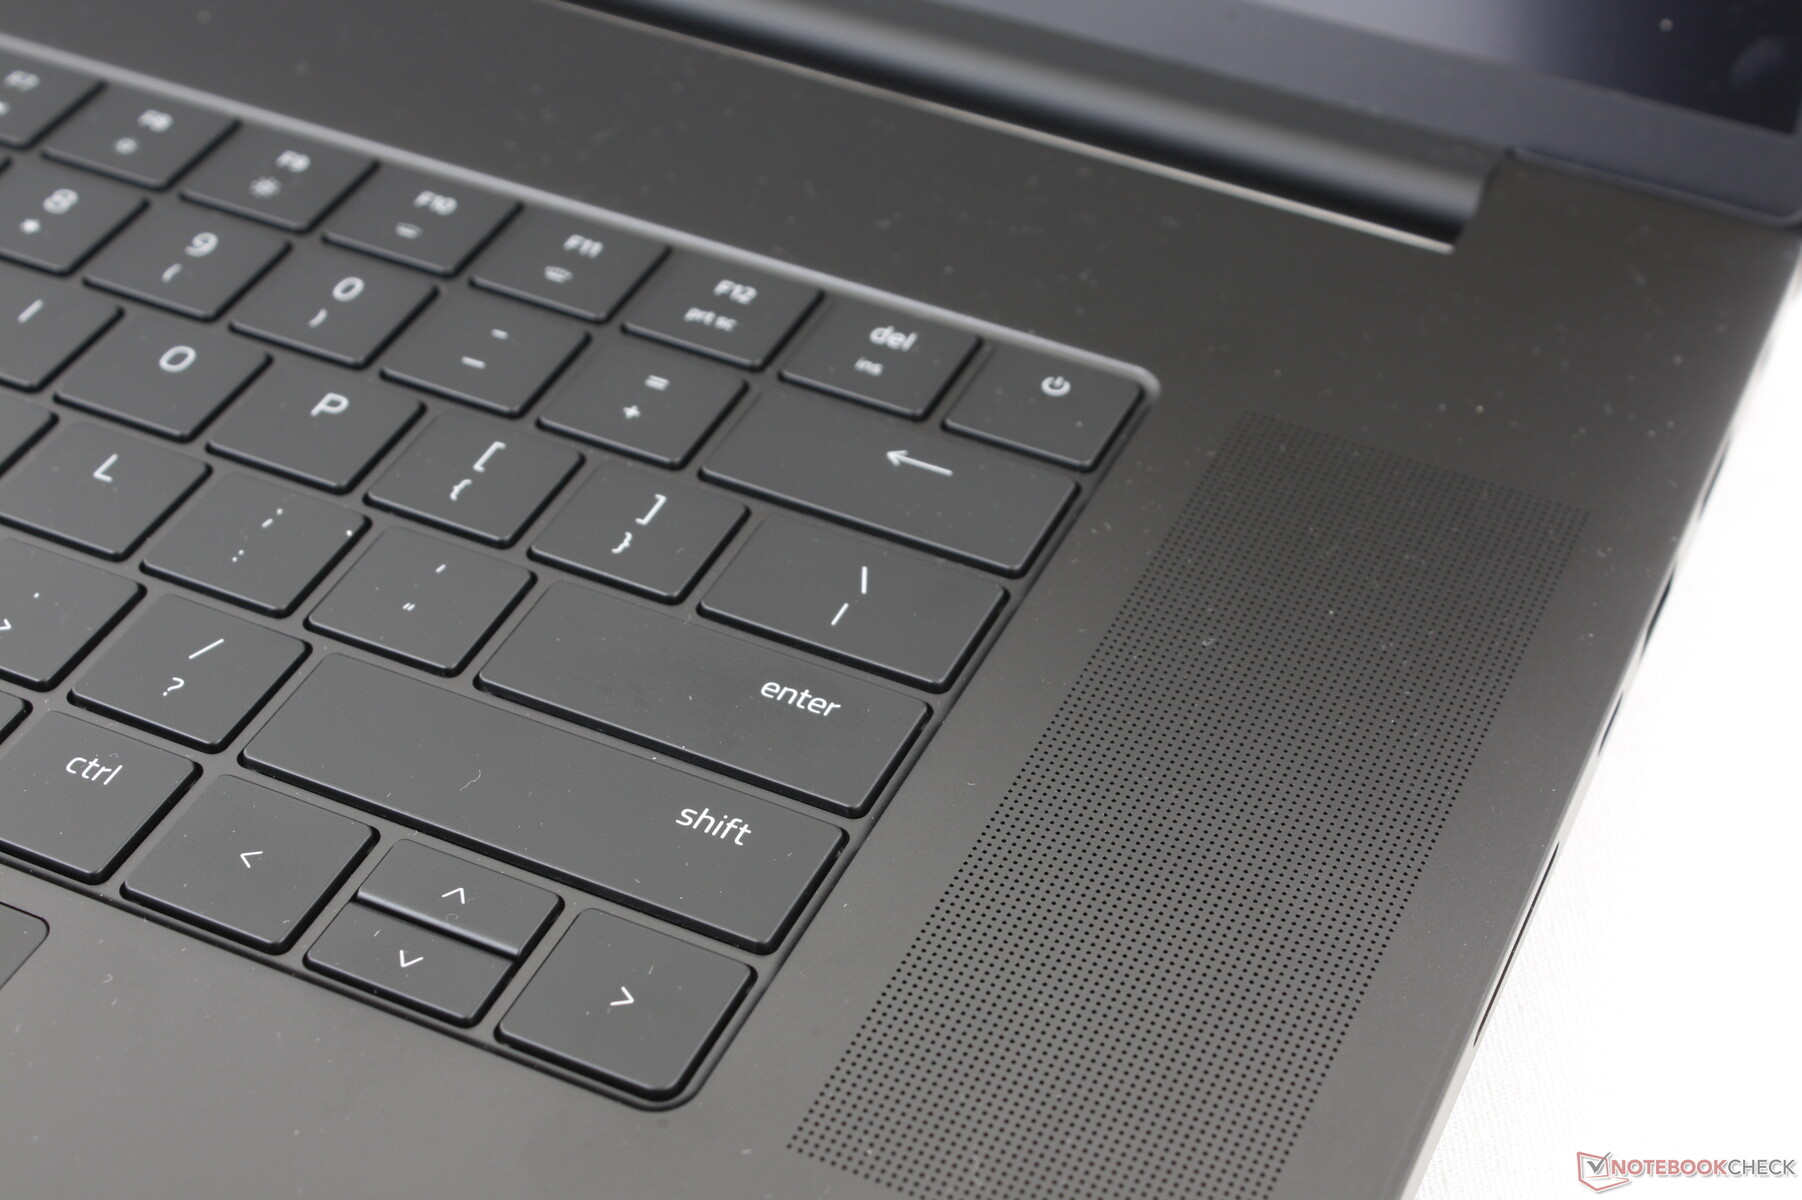
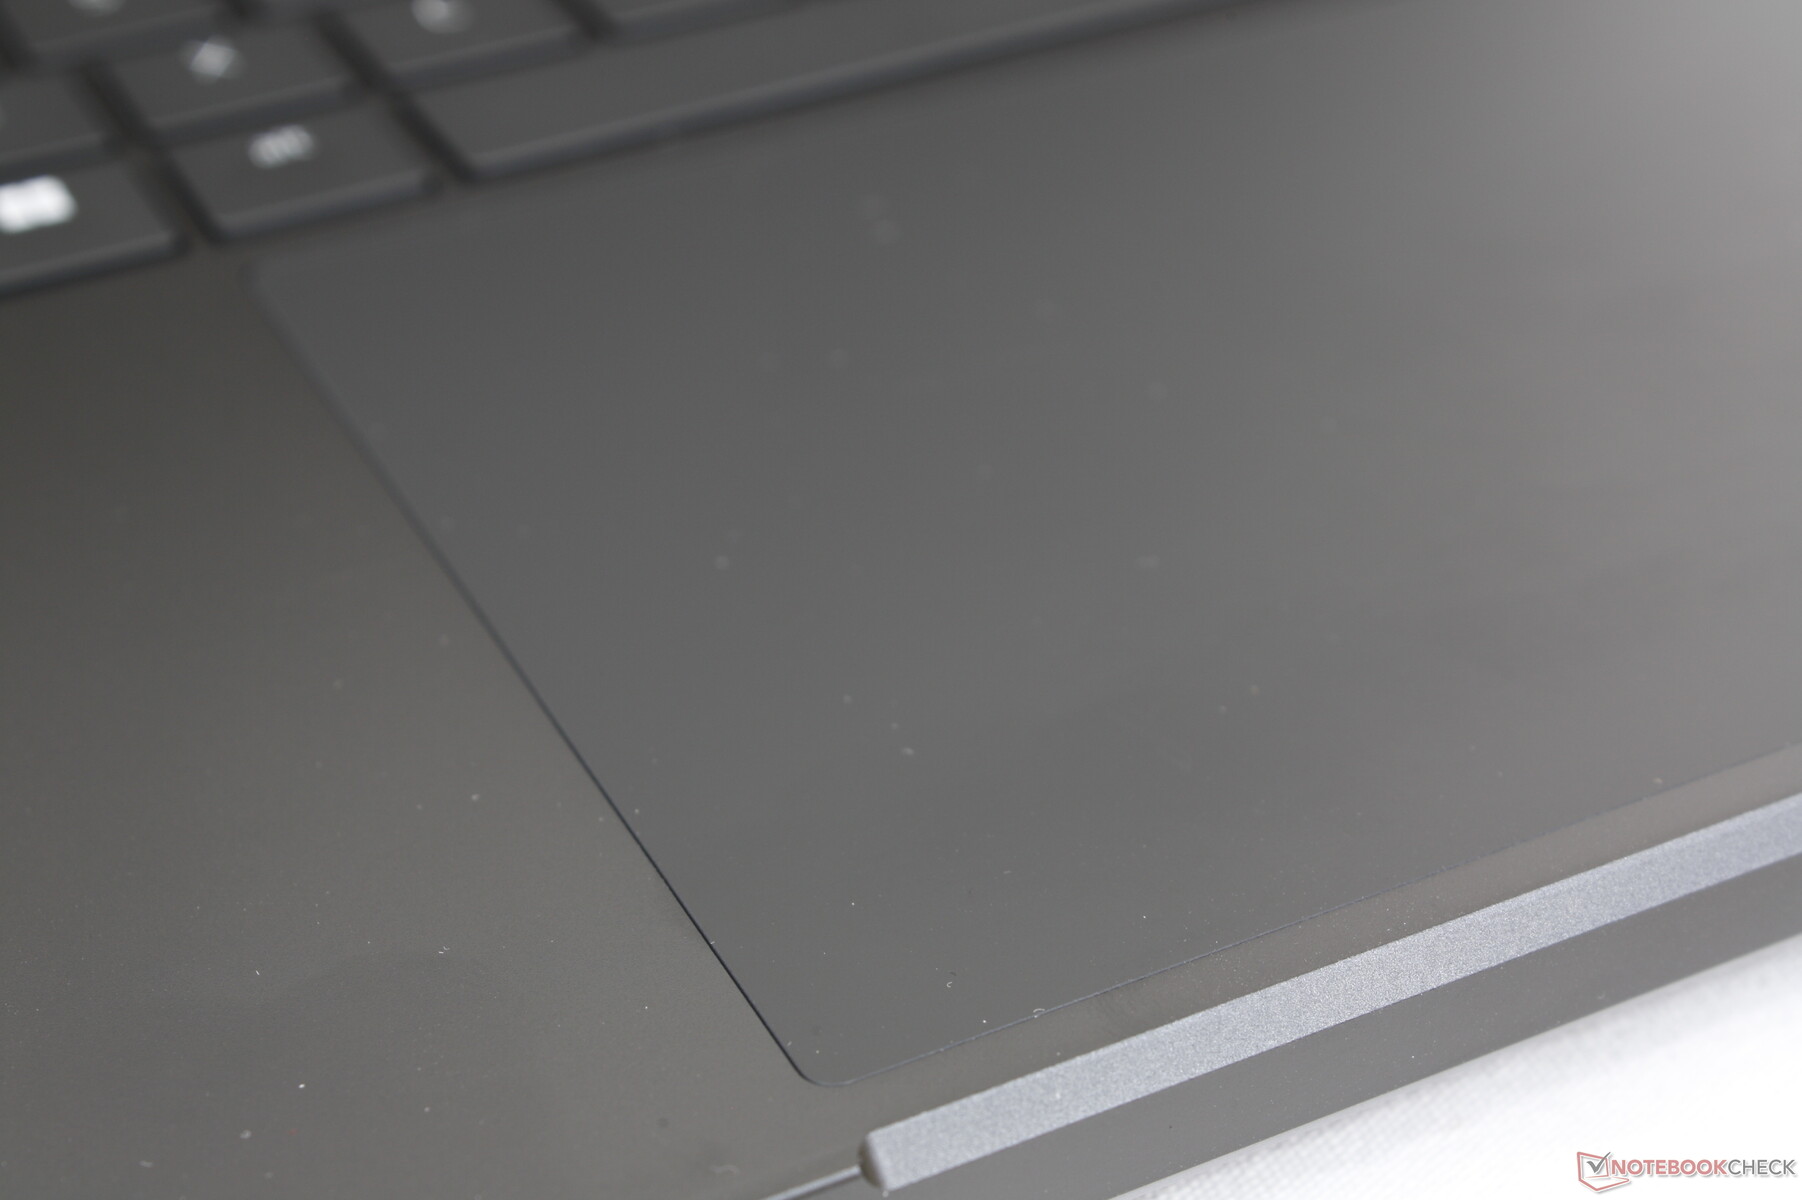
Urządzenia wejściowe - identyczne jak w Blade 16
Klawiatura i Touchpad
Zarówno klawiatura, jak i clickpad są takie same jak w Blade 16, mimo różnic w wielkości ekranu obu modeli. Nawet wymiary clickpada (17 x 9,7 cm) i klawiatury nie uległy zmianie, a więc nasze nasze dotychczasowe uwagi dotyczące wrażeń z pisania na Blade 16 odnoszą się tutaj do Blade 18. Szkoda, że Razer nie wykorzystał dodatkowej powierzchni na większe klawisze strzałek lub potencjalny numpad.
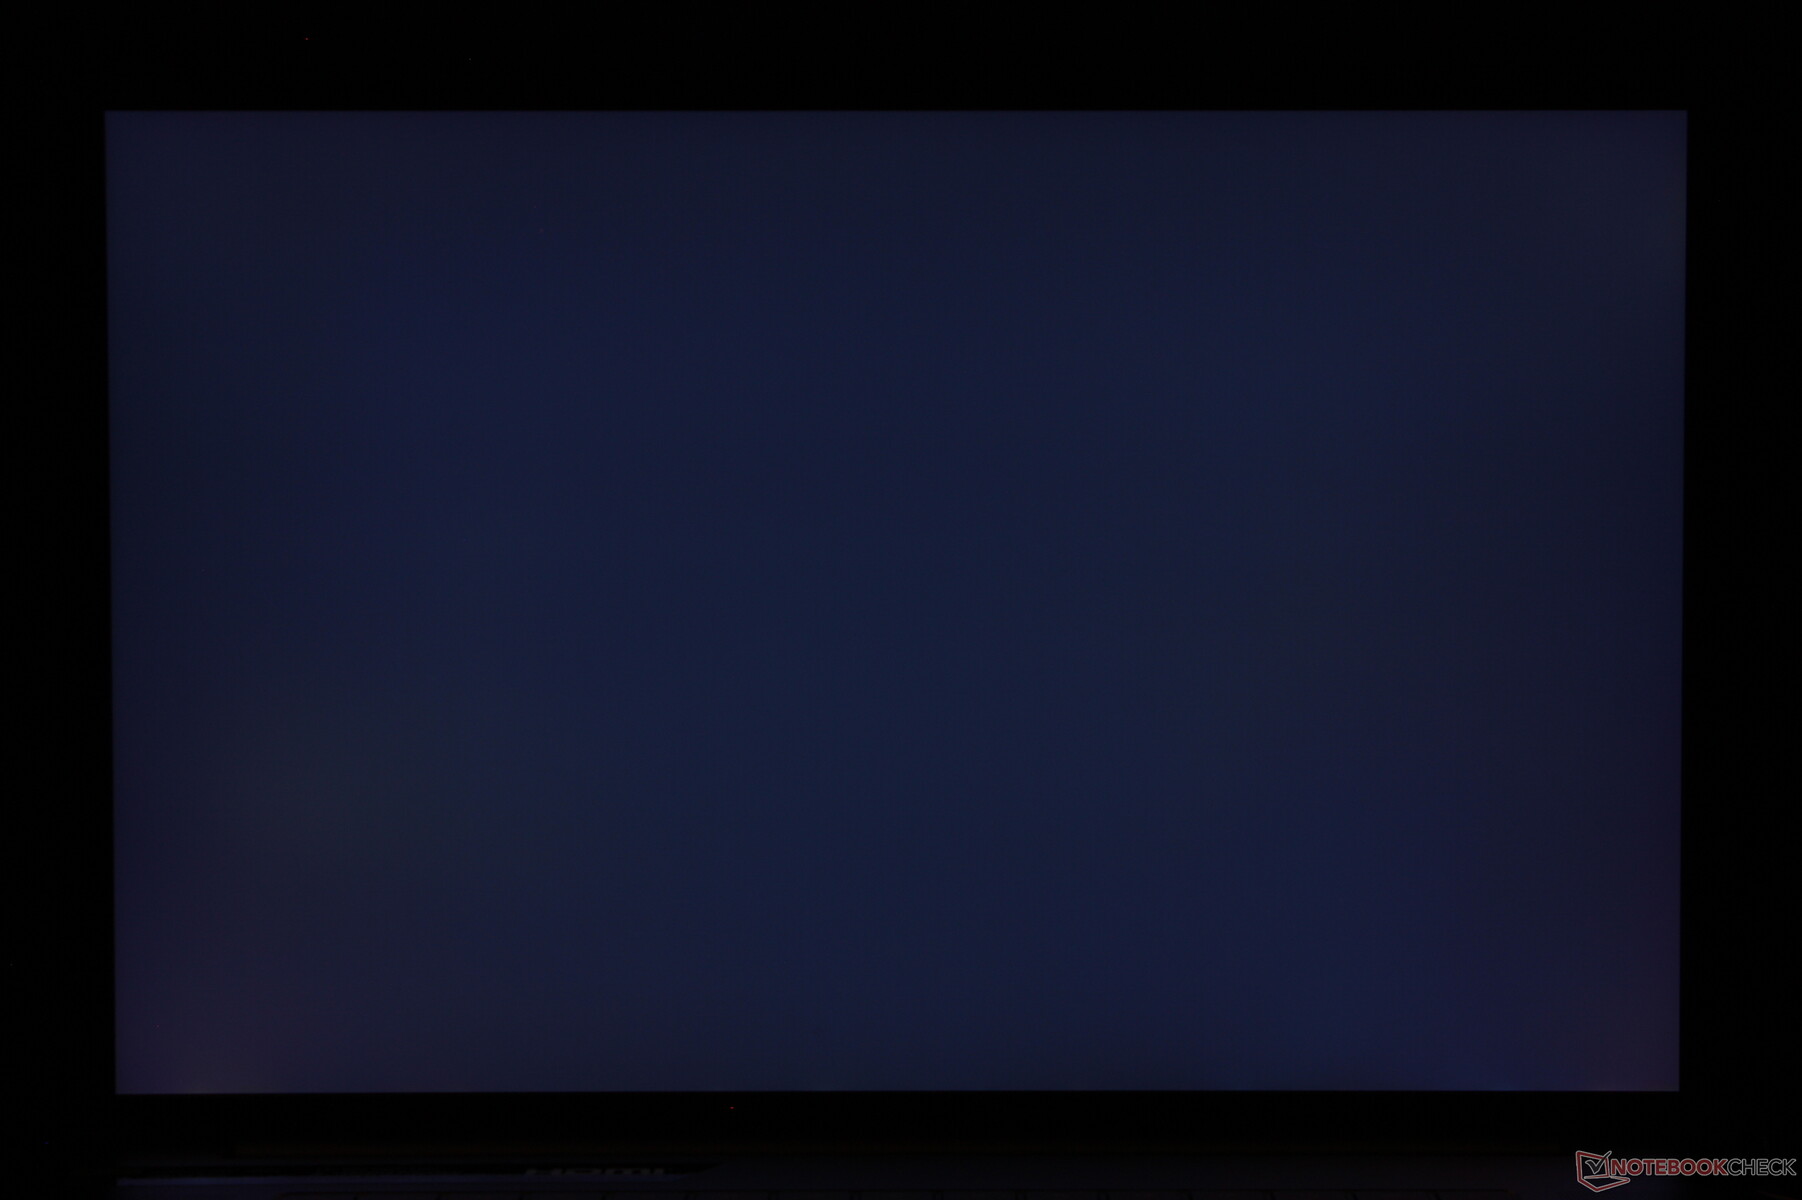
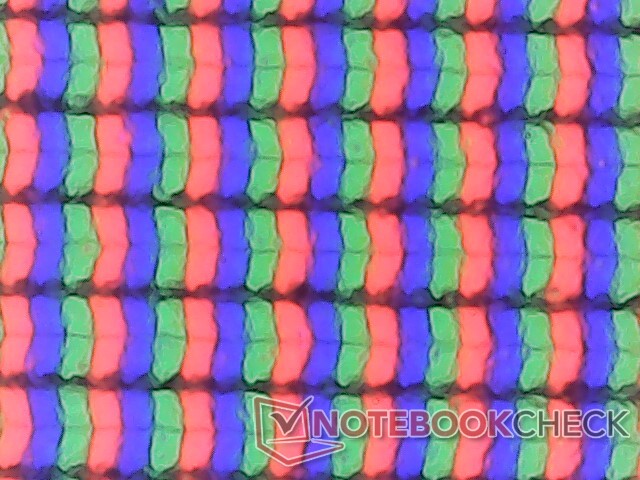
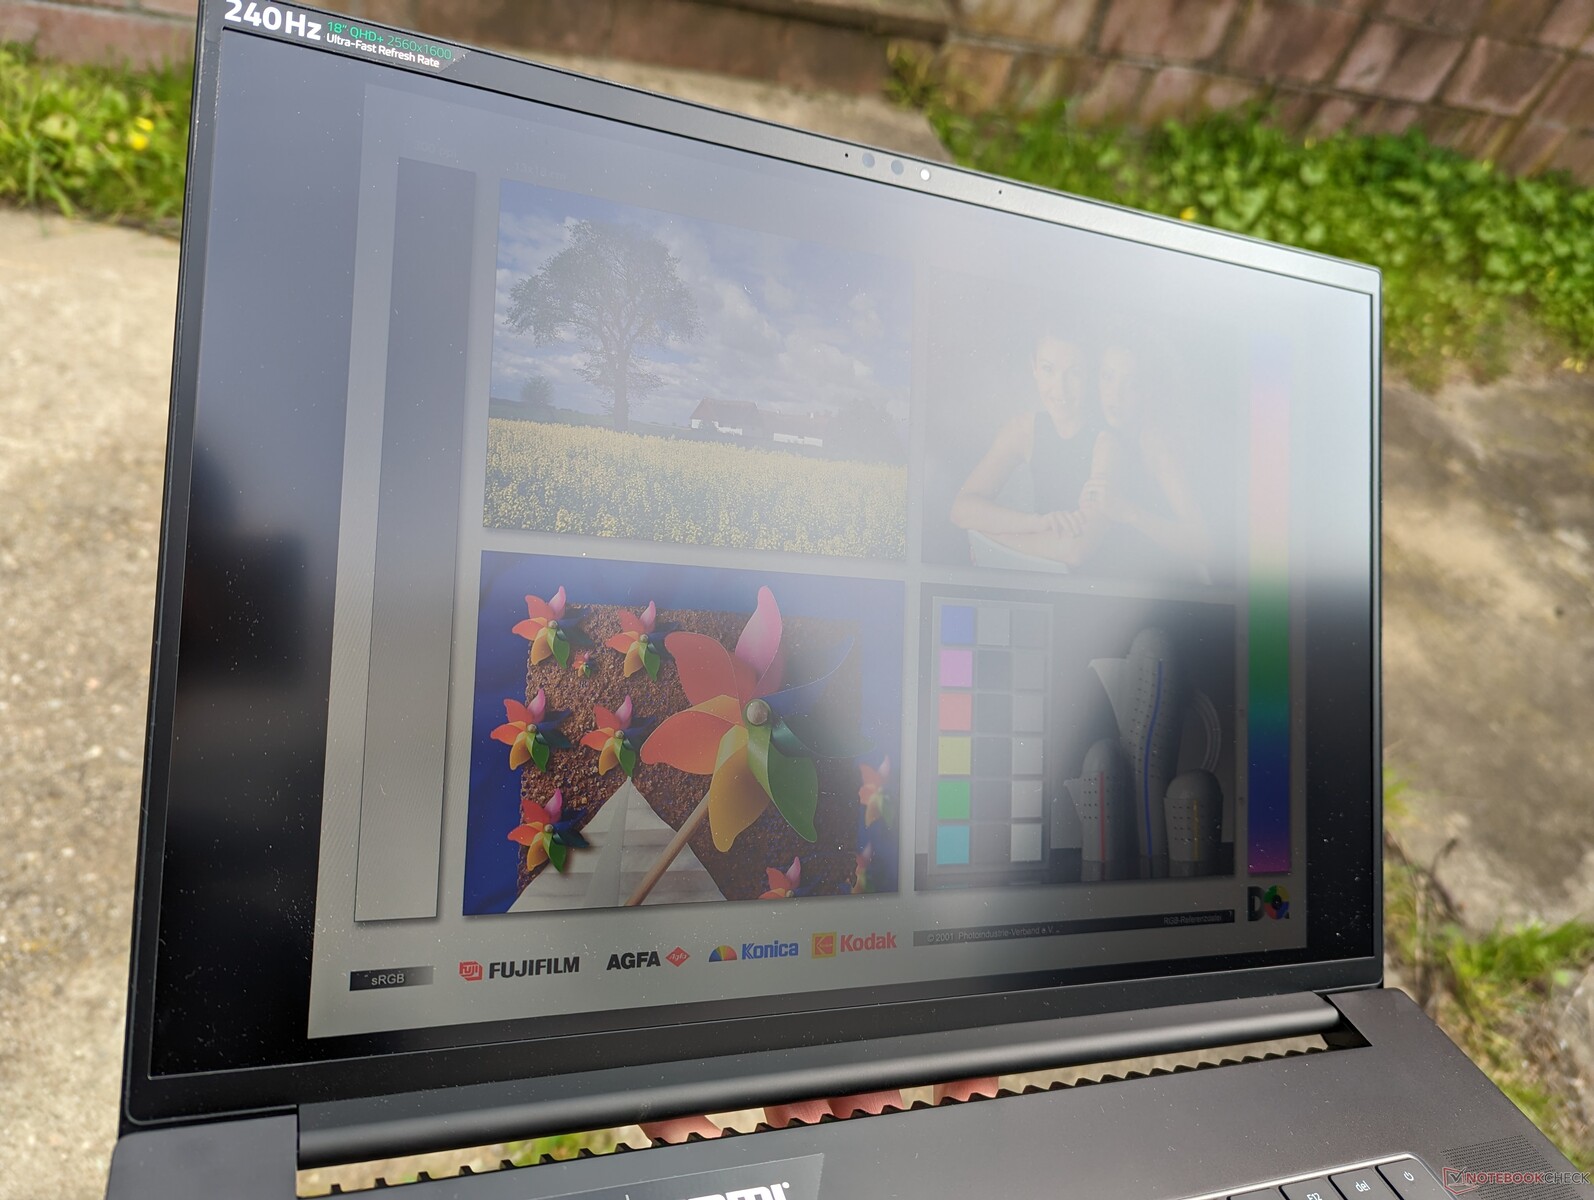
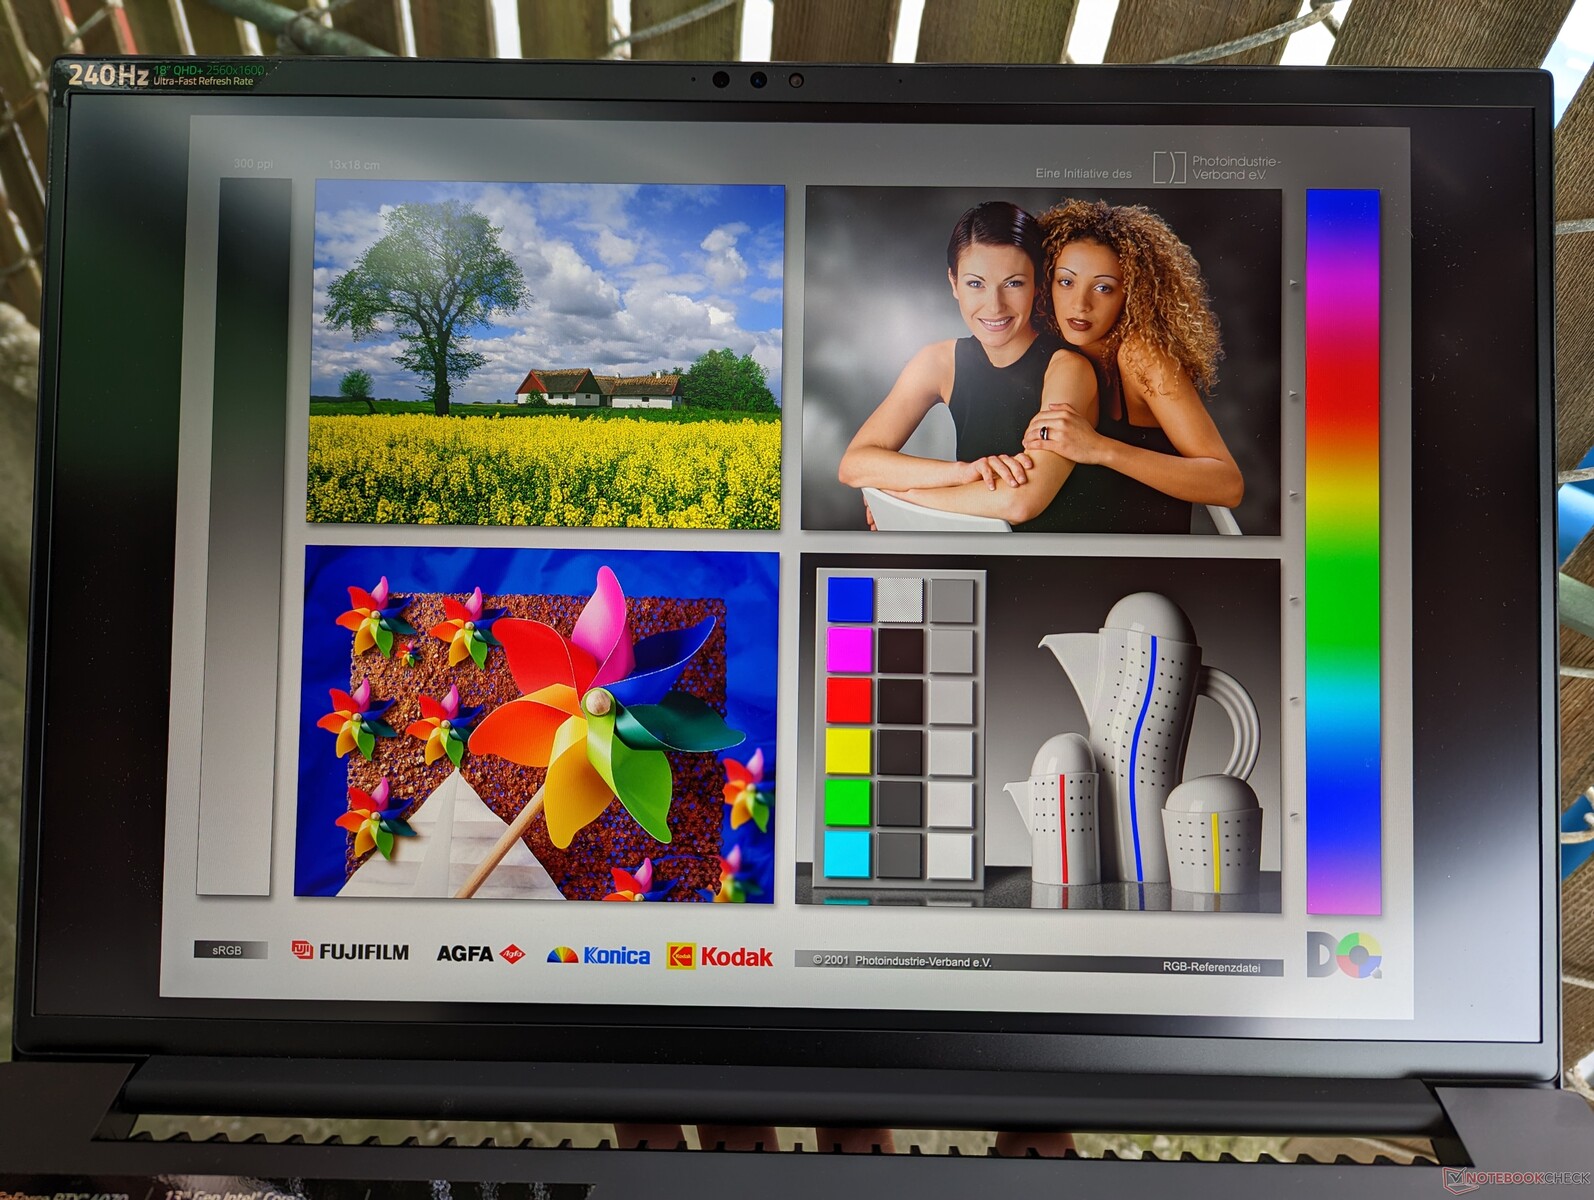
Wyświetlacz - bardzo przestronny
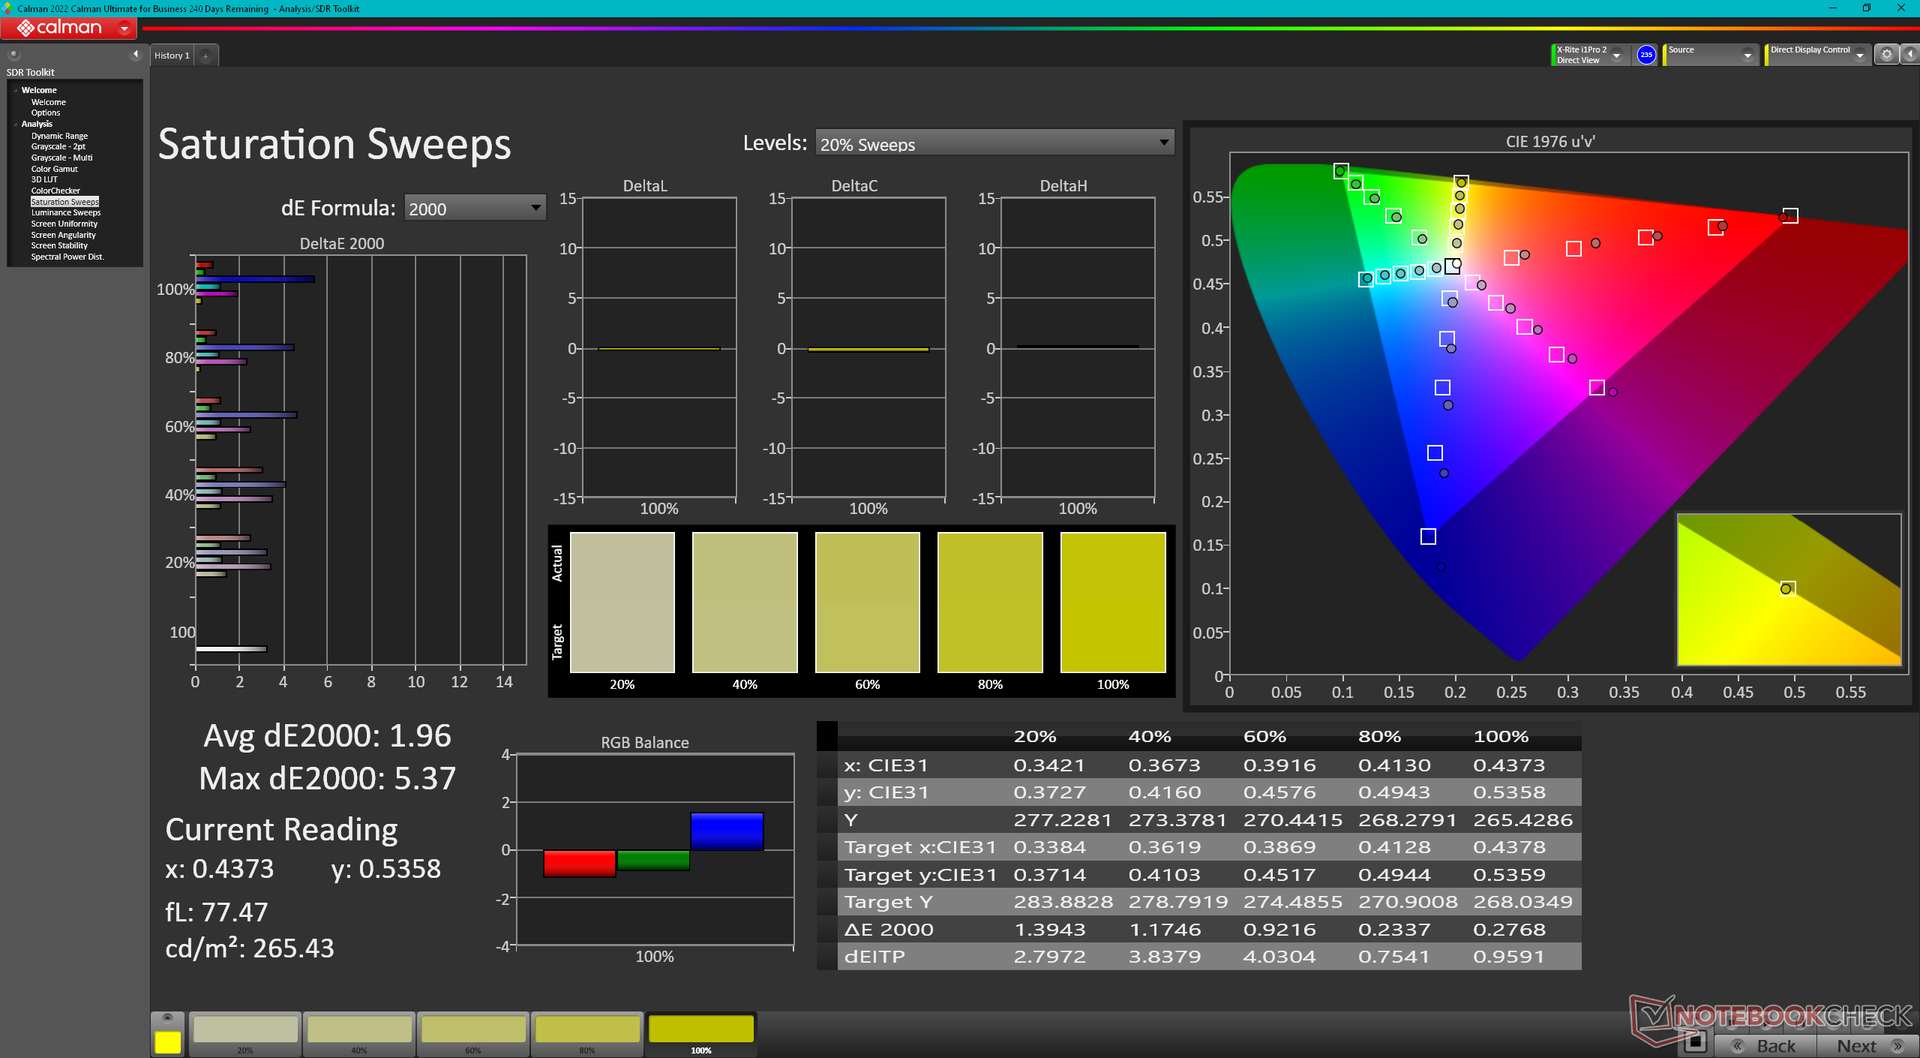
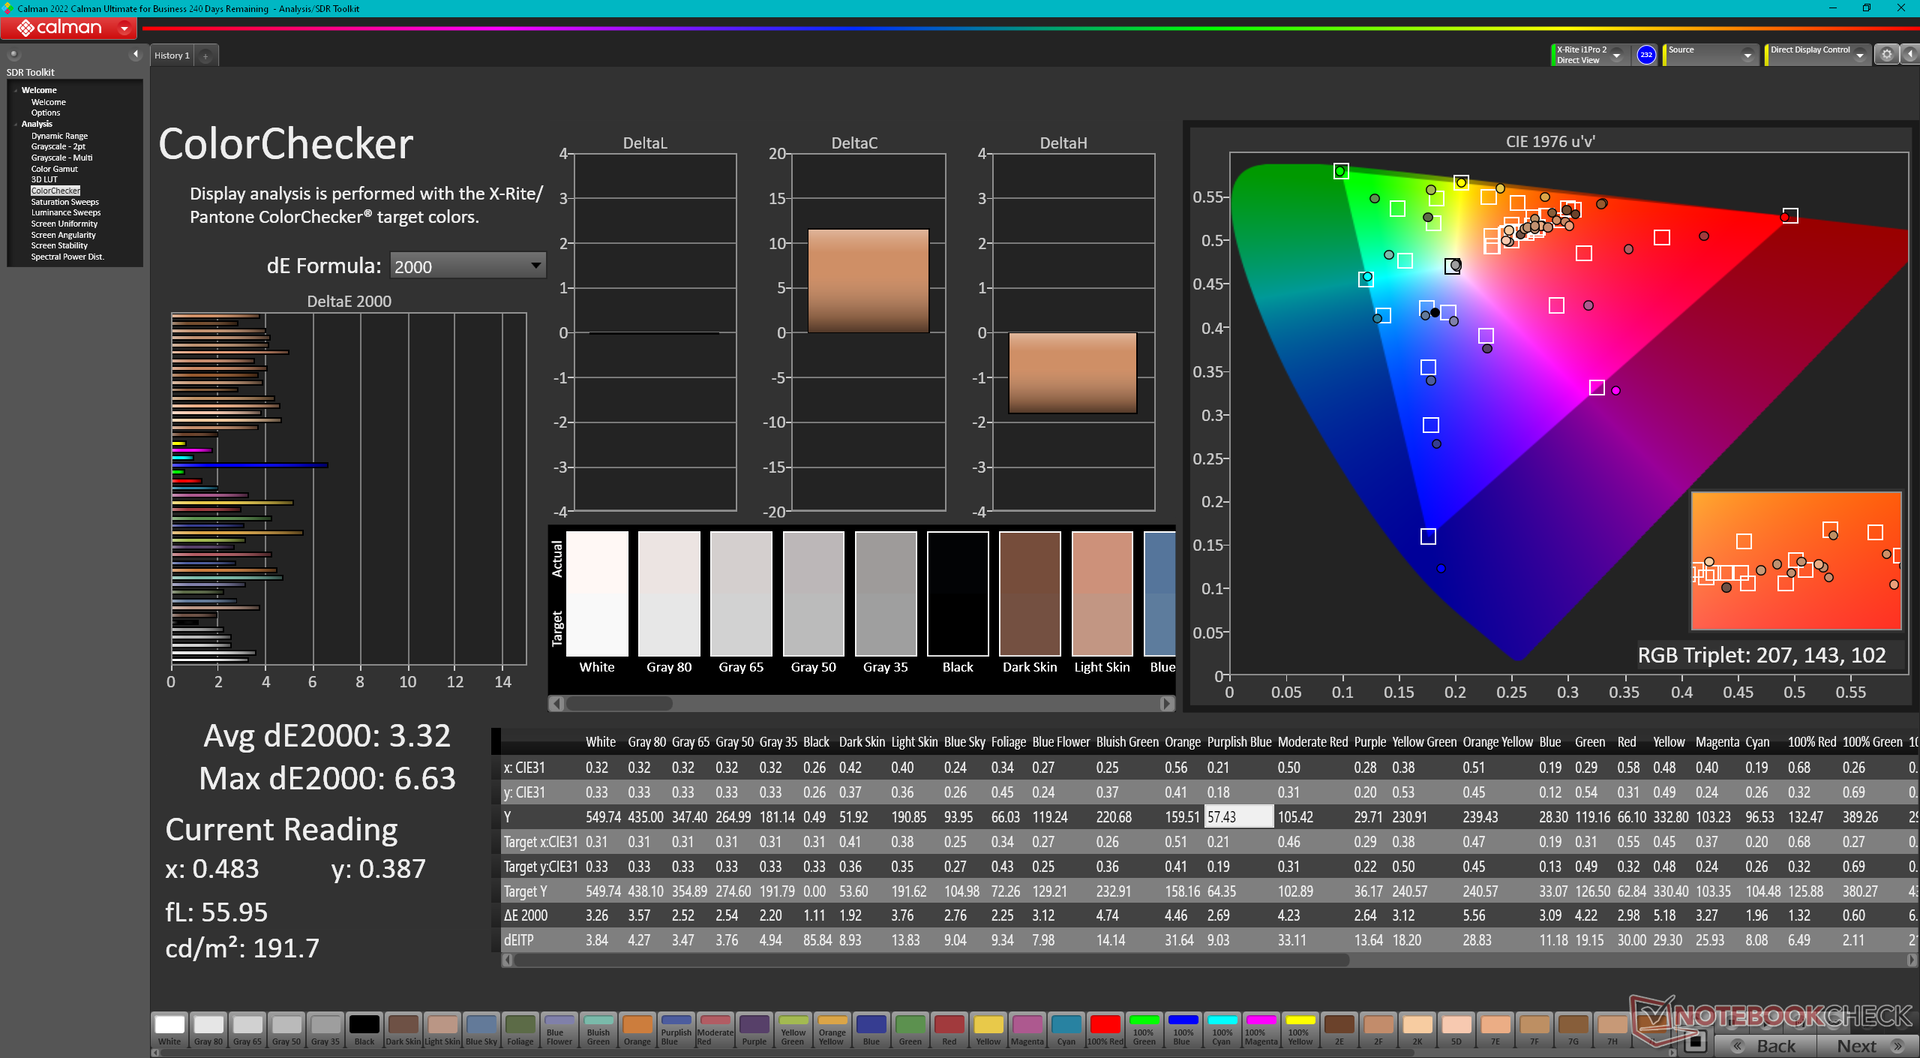
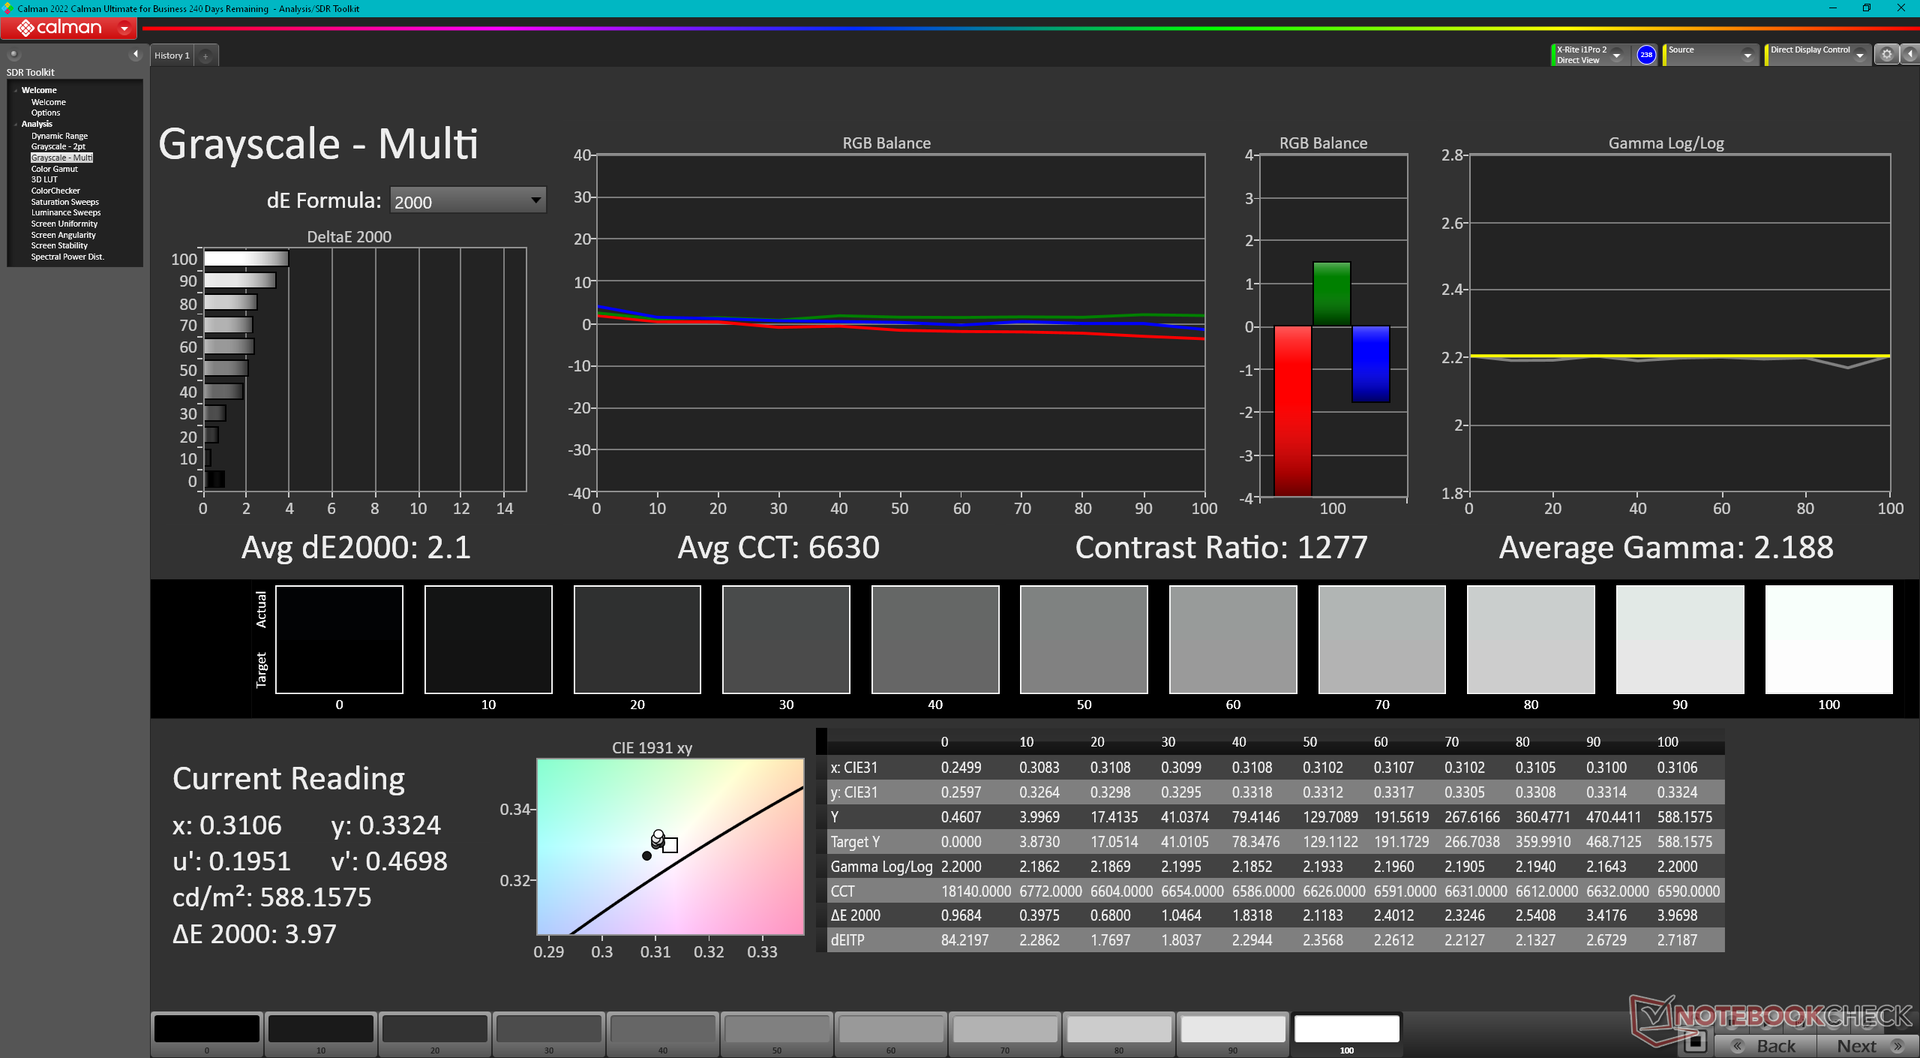
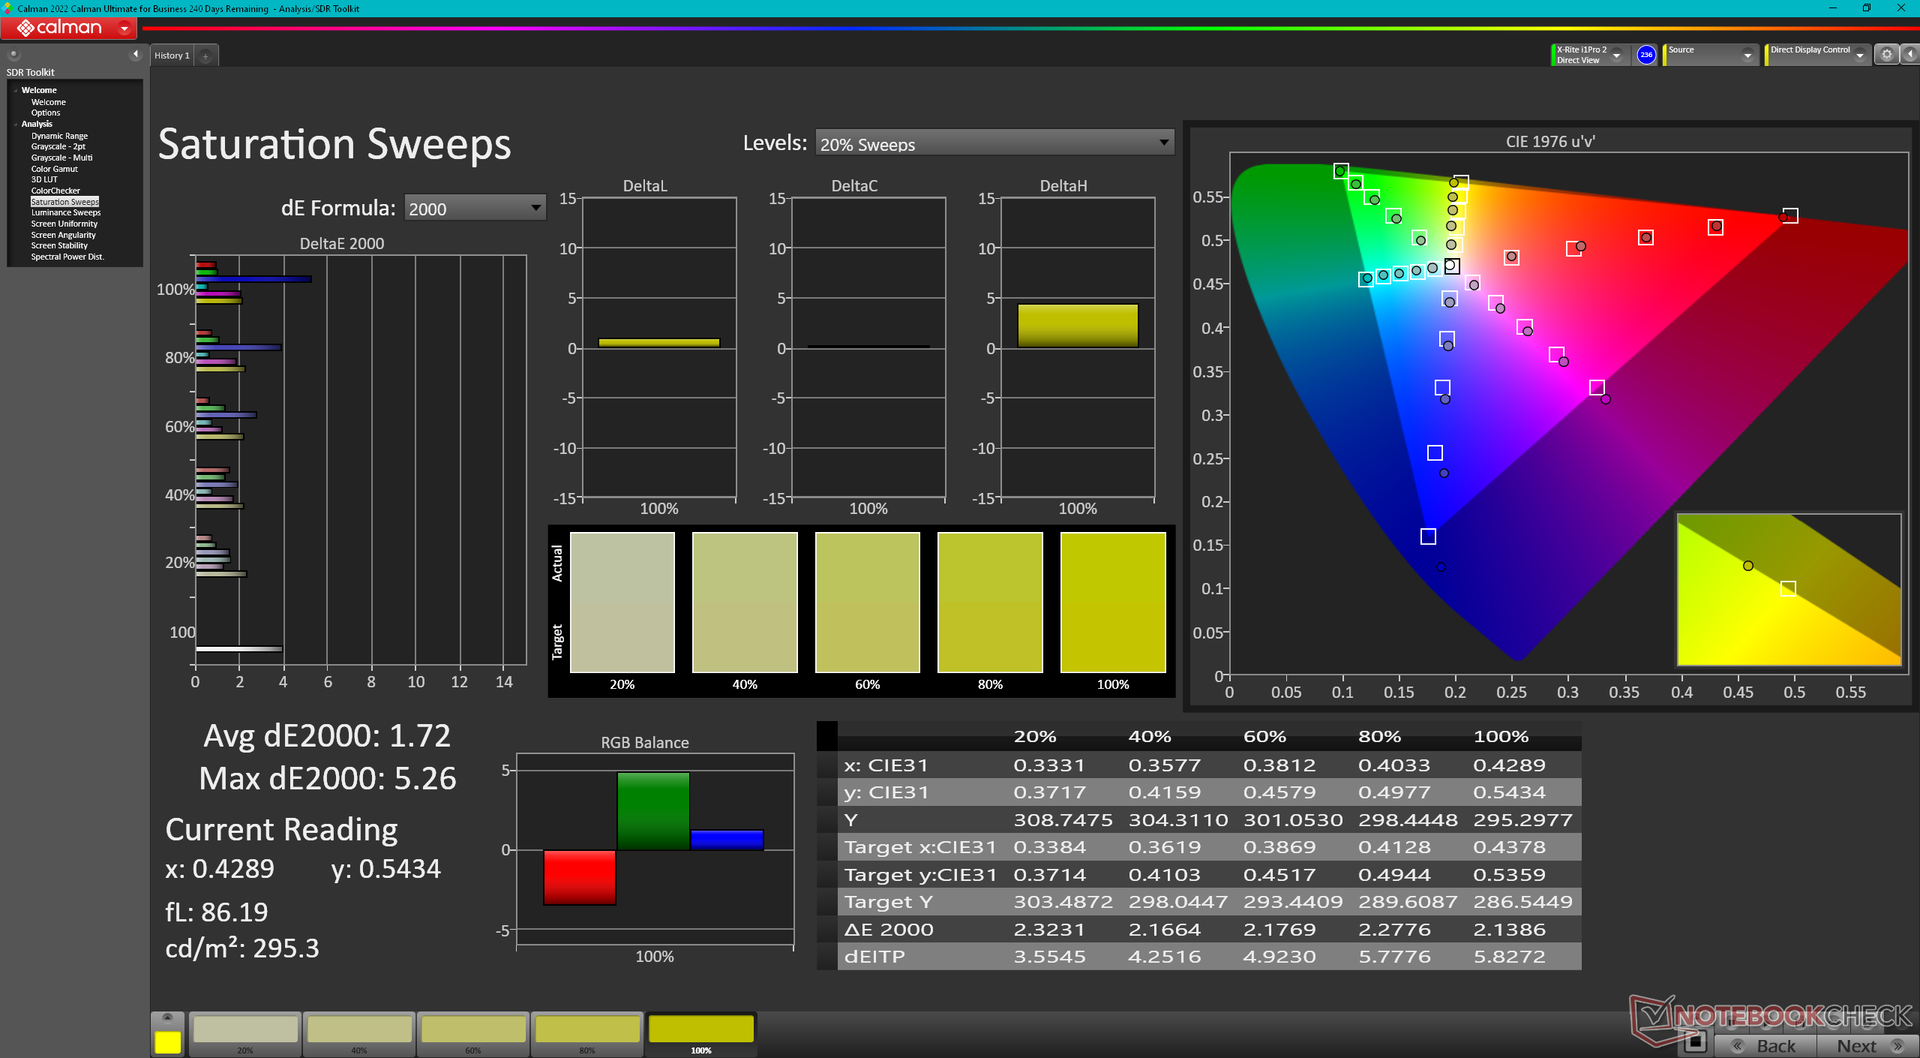
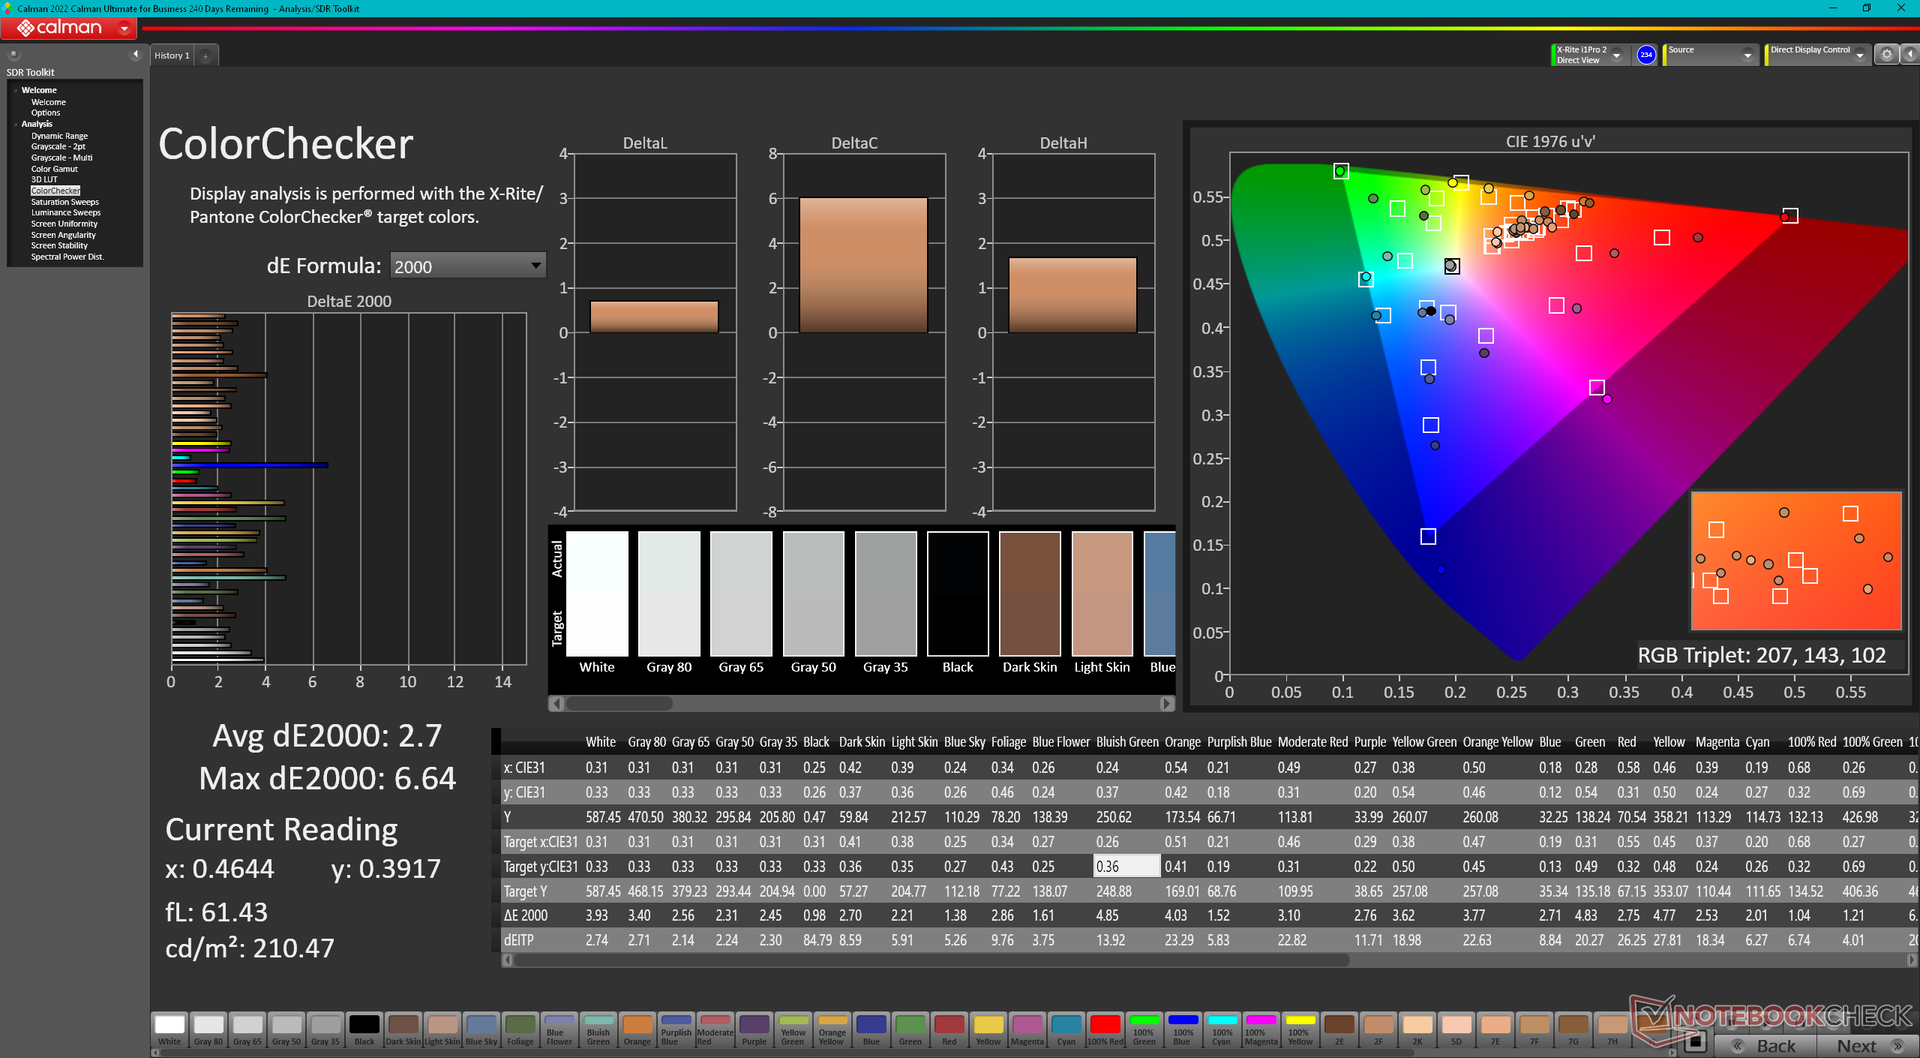
Blade 18 nie posiada drugiego panelu w momencie premiery, prawdopodobnie z powodu ograniczonych dostaw. W rzeczywistości, 18,0-calowy Asus ROG Strix Scar 18 prawdopodobnie wykorzysta ten sam AU Optronics B180QAN01.0 IPS panel jak na Blade 18. Z tym, że jest to nadal wysokiej jakości panel z typowymi cechami wspólnymi dla high-endowych laptopów do gier, w tym szybką 240 Hz natywną częstotliwością odświeżania, szybkim 3 ms czasem reakcji, pełnym pokryciem kolorów DCI-P3, 500-nitową jasnością i kalibracją fabryczną. Nasze niezależne pomiary z użyciem kolorymetru i oscyloskopu firmy X-Rite potwierdziły te zapewnienia.
Niestety, w naszym testowym egzemplarzu wyświetlacz od czasu do czasu migotał pomiędzy różnymi poziomami jasności, pozornie bez powodu. Migotanie nie jest związane z modulacją szerokości impulsu, ponieważ panel nie wykorzystuje PWM do kontroli jasności. Jest to prawdopodobnie wada ekranu, ale nie możemy jeszcze potwierdzić, czy jest to problem programowy czy sprzętowy. Podobno, niektórzy konsumenci którzy już zakupili Blade 18, również doświadczają podobnych problemów z migotaniem. Ta sekcja zostanie zaktualizowana, gdy tylko otrzymamy oficjalne słowo od Razera.
| |||||||||||||||||||||||||
rozświetlenie: 89 %
na akumulatorze: 549.6 cd/m²
kontrast: 1037:1 (czerń: 0.53 cd/m²)
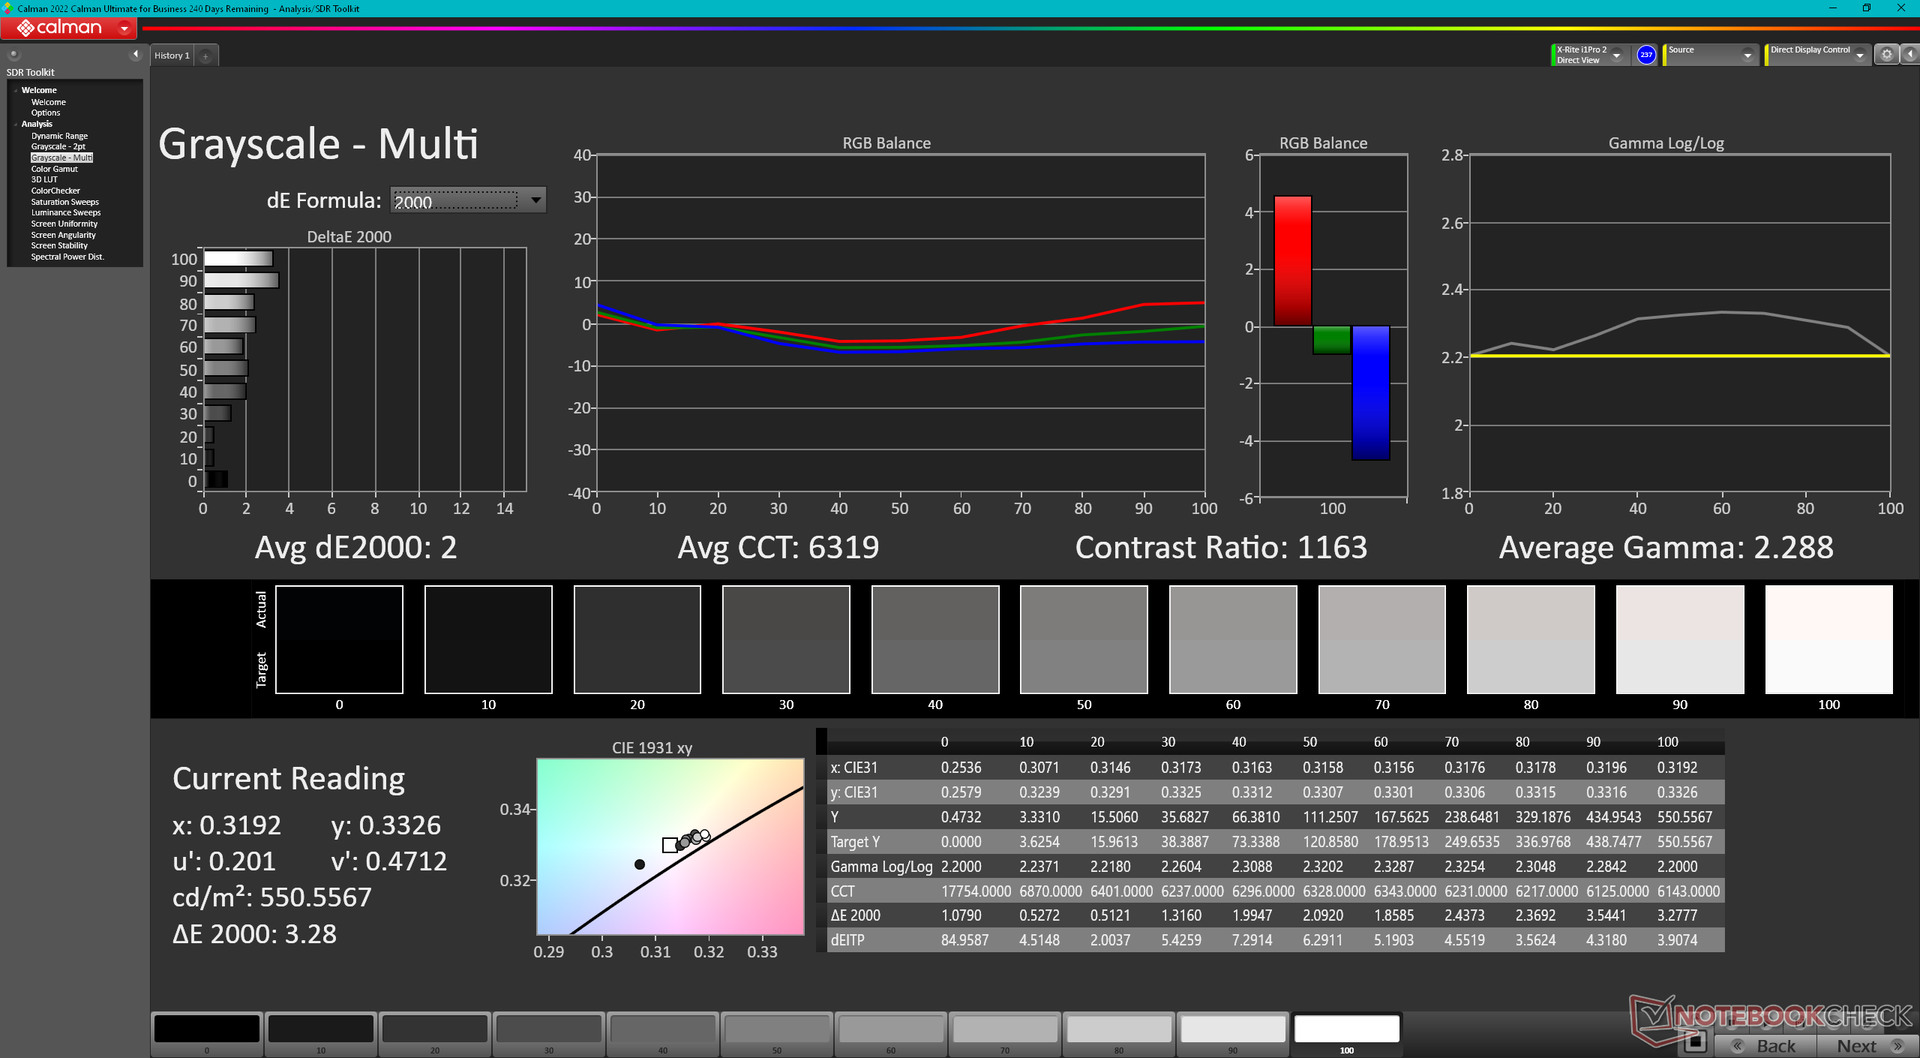
ΔE ColorChecker Calman: 3.32 | ∀{0.5-29.43 Ø4.73}
calibrated: 2.7
ΔE Greyscale Calman: 2 | ∀{0.09-98 Ø4.97}
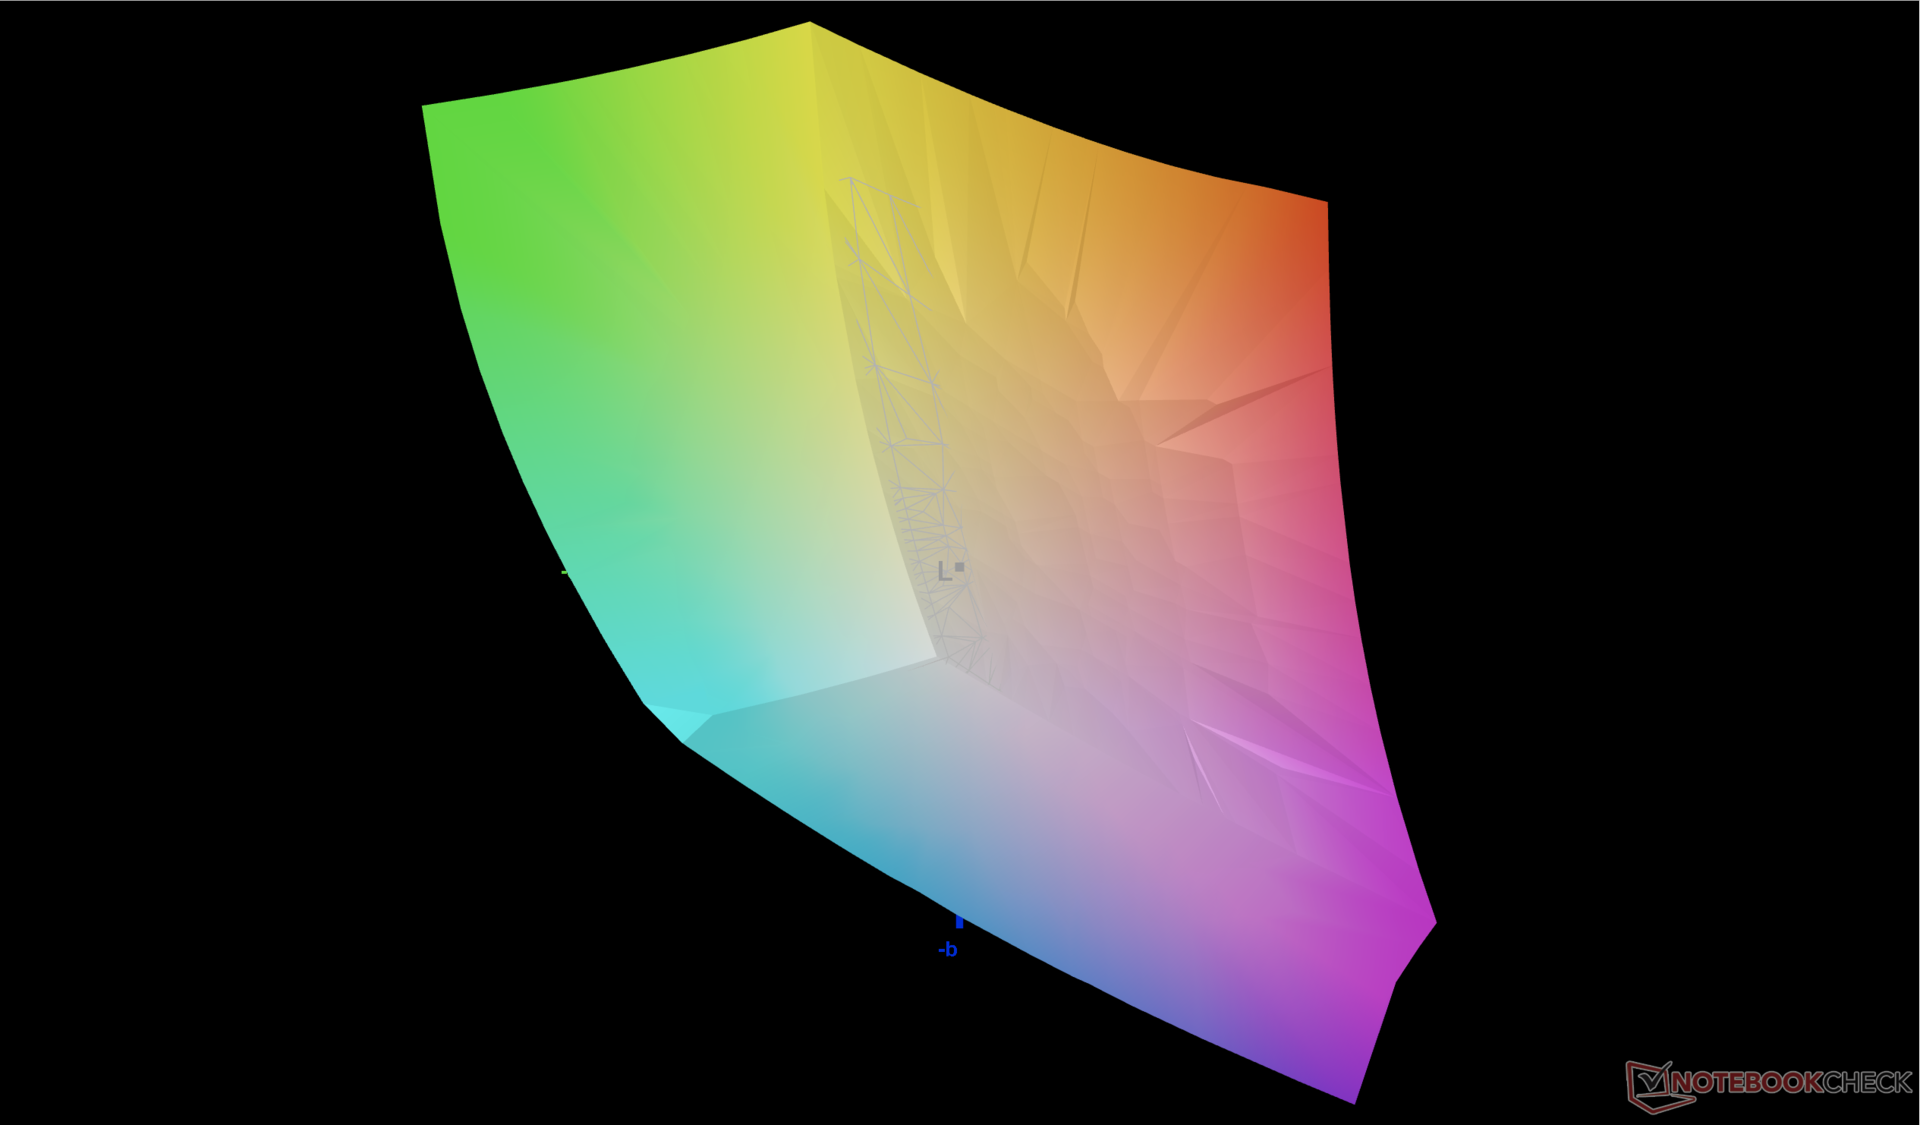
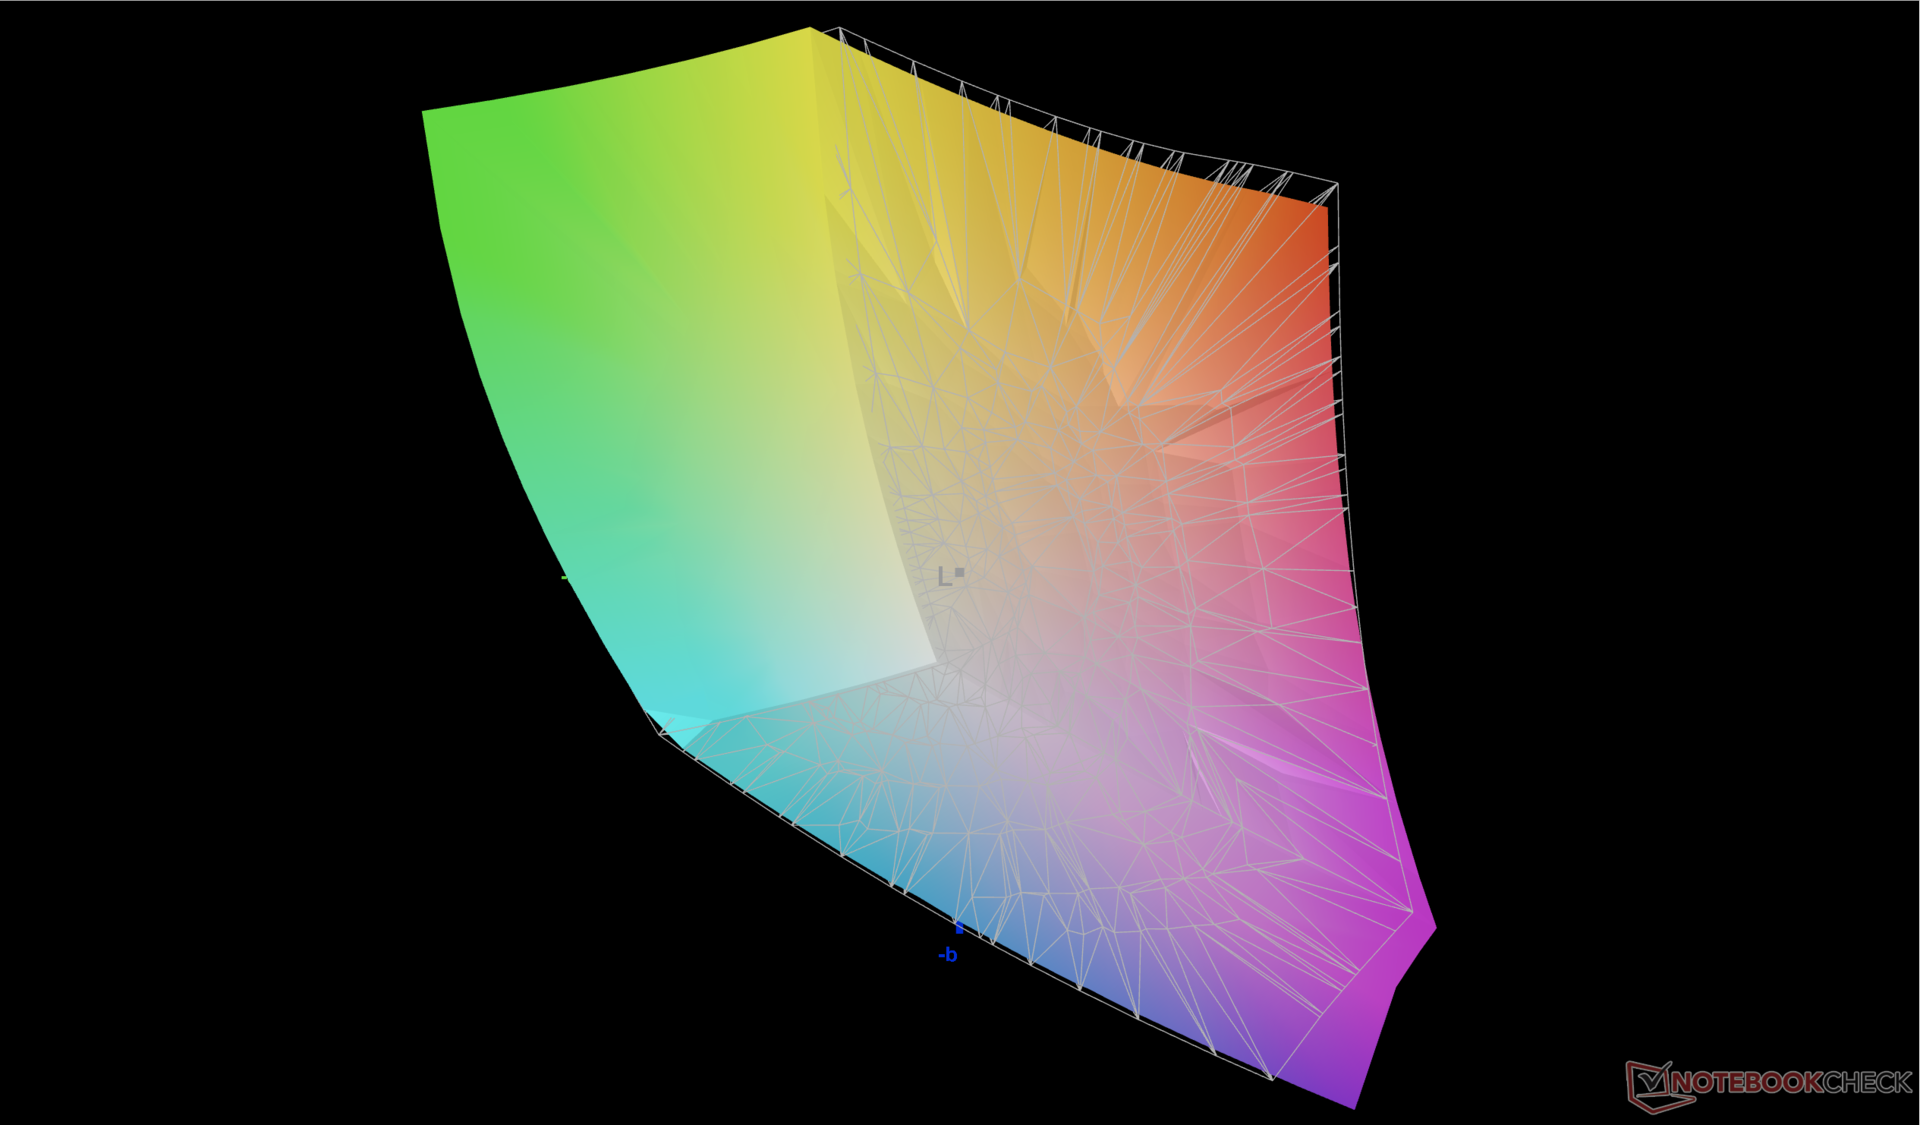
85.3% AdobeRGB 1998 (Argyll 3D)
99.8% sRGB (Argyll 3D)
96.9% Display P3 (Argyll 3D)
Gamma: 2.29
CCT: 6319 K
| Razer Blade 18 RTX 4070 AU Optronics B180QAN01.0, IPS, 2560x1600, 18" | Razer Blade 17 Early 2022 AU Optronics B173ZAN06.9, IPS, 3840x2160, 17.3" | MSI Titan GT77 HX 13VI B173ZAN06.C, Mini-LED, 3840x2160, 17.3" | Gigabyte G7 KE AU Optronics B173HAN05.1, IPS, 1920x1080, 17.3" | Alienware m17 R5 (R9 6900HX, RX 6850M XT) AU Optronics AUODBA3, IPS, 3840x2160, 17" | Asus ROG Strix Scar 17 SE G733CX-LL014W NE173QHM-NZ2, IPS, 2560x1440, 17.3" | |
|---|---|---|---|---|---|---|
| Display | 2% | 2% | -14% | 1% | -0% | |
| Display P3 Coverage (%) | 96.9 | 99.4 3% | 94.9 -2% | 70.4 -27% | 97.2 0% | 97.1 0% |
| sRGB Coverage (%) | 99.8 | 100 0% | 99.9 0% | 99.8 0% | 99.6 0% | 99.9 0% |
| AdobeRGB 1998 Coverage (%) | 85.3 | 87.3 2% | 92.4 8% | 71.7 -16% | 88.4 4% | 84.8 -1% |
| Response Times | -25% | -524% | -12% | -168% | -31% | |
| Response Time Grey 50% / Grey 80% * (ms) | 4.2 ? | 7.5 ? -79% | 38.4 ? -814% | 5 ? -19% | 16.4 ? -290% | 5.7 ? -36% |
| Response Time Black / White * (ms) | 8 ? | 5.6 ? 30% | 26.6 ? -233% | 8.3 ? -4% | 11.6 ? -45% | 10.1 ? -26% |
| PWM Frequency (Hz) | 2380 ? | |||||
| Screen | 24% | 64905% | 19% | -40% | 16% | |
| Brightness middle (cd/m²) | 549.6 | 503 -8% | 606 10% | 307 -44% | 484 -12% | 320 -42% |
| Brightness (cd/m²) | 524 | 486 -7% | 602 15% | 301 -43% | 449 -14% | 303 -42% |
| Brightness Distribution (%) | 89 | 84 -6% | 93 4% | 93 4% | 87 -2% | 87 -2% |
| Black Level * (cd/m²) | 0.53 | 0.44 17% | 0.0001 100% | 0.2 62% | 0.55 -4% | 0.3 43% |
| Contrast (:1) | 1037 | 1143 10% | 6060000 584278% | 1535 48% | 880 -15% | 1067 3% |
| Colorchecker dE 2000 * | 3.32 | 1.08 67% | 4.8 -45% | 1.32 60% | 4.8 -45% | 1.1 67% |
| Colorchecker dE 2000 max. * | 6.63 | 4.54 32% | 8.2 -24% | 4.6 31% | 7.48 -13% | 2.7 59% |
| Colorchecker dE 2000 calibrated * | 2.7 | 0.6 78% | 1.8 33% | 1.03 62% | 4.74 -76% | |
| Greyscale dE 2000 * | 2 | 1.3 35% | 6.5 -225% | 2.1 -5% | 5.5 -175% | 1.1 45% |
| Gamma | 2.29 96% | 2.151 102% | 2.63 84% | 2.247 98% | 2.42 91% | 2.13 103% |
| CCT | 6319 103% | 6541 99% | 6596 99% | 6815 95% | 6148 106% | 6599 98% |
| Całkowita średnia (program / ustawienia) | 0% /
12% | 21461% /
41650% | -2% /
8% | -69% /
-49% | -5% /
5% |
* ... im mniej tym lepiej
Średnie wartości deltaE w skali szarości i kolorze wynoszą odpowiednio 2,0 i 3,32, ponieważ panel jest fabrycznie skalibrowany względem standardu P3. Próba samodzielnej kalibracji panelu nie poprawiłaby kolorów w znaczącym stopniu. Niebieski wydaje się być jednak reprezentowany bardziej niedokładnie niż inne kolory podstawowe i drugorzędne.
Wyświetl czasy reakcji
| ↔ Czas reakcji od czerni do bieli | ||
|---|---|---|
| 8 ms ... wzrost ↗ i spadek ↘ łącznie | ↗ 3.8 ms wzrost | 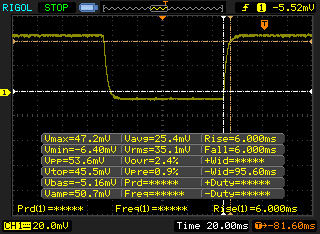 |
| ↘ 4.2 ms upadek | ||
| W naszych testach ekran wykazuje szybki czas reakcji i powinien nadawać się do gier. Dla porównania, wszystkie testowane urządzenia wahają się od 0.1 (minimum) do 240 (maksimum) ms. » 22 % wszystkich urządzeń jest lepszych. Oznacza to, że zmierzony czas reakcji jest lepszy od średniej wszystkich testowanych urządzeń (19.9 ms). | ||
| ↔ Czas reakcji 50% szarości do 80% szarości | ||
| 4.2 ms ... wzrost ↗ i spadek ↘ łącznie | ↗ 2.1 ms wzrost | 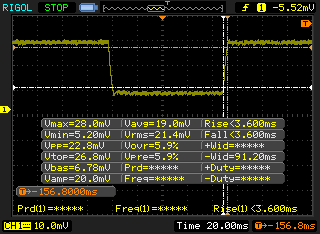 |
| ↘ 2.1 ms upadek | ||
| W naszych testach ekran wykazuje bardzo szybką reakcję i powinien bardzo dobrze nadawać się do szybkich gier. Dla porównania, wszystkie testowane urządzenia wahają się od 0.165 (minimum) do 636 (maksimum) ms. » 16 % wszystkich urządzeń jest lepszych. Oznacza to, że zmierzony czas reakcji jest lepszy od średniej wszystkich testowanych urządzeń (31.1 ms). | ||
Migotanie ekranu / PWM (modulacja szerokości impulsu)
| Migotanie ekranu/nie wykryto PWM | 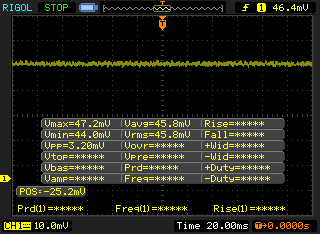 | ||
Dla porównania: 52 % wszystkich testowanych urządzeń nie używa PWM do przyciemniania wyświetlacza. Jeśli wykryto PWM, zmierzono średnio 7798 (minimum: 5 - maksimum: 343500) Hz. | |||
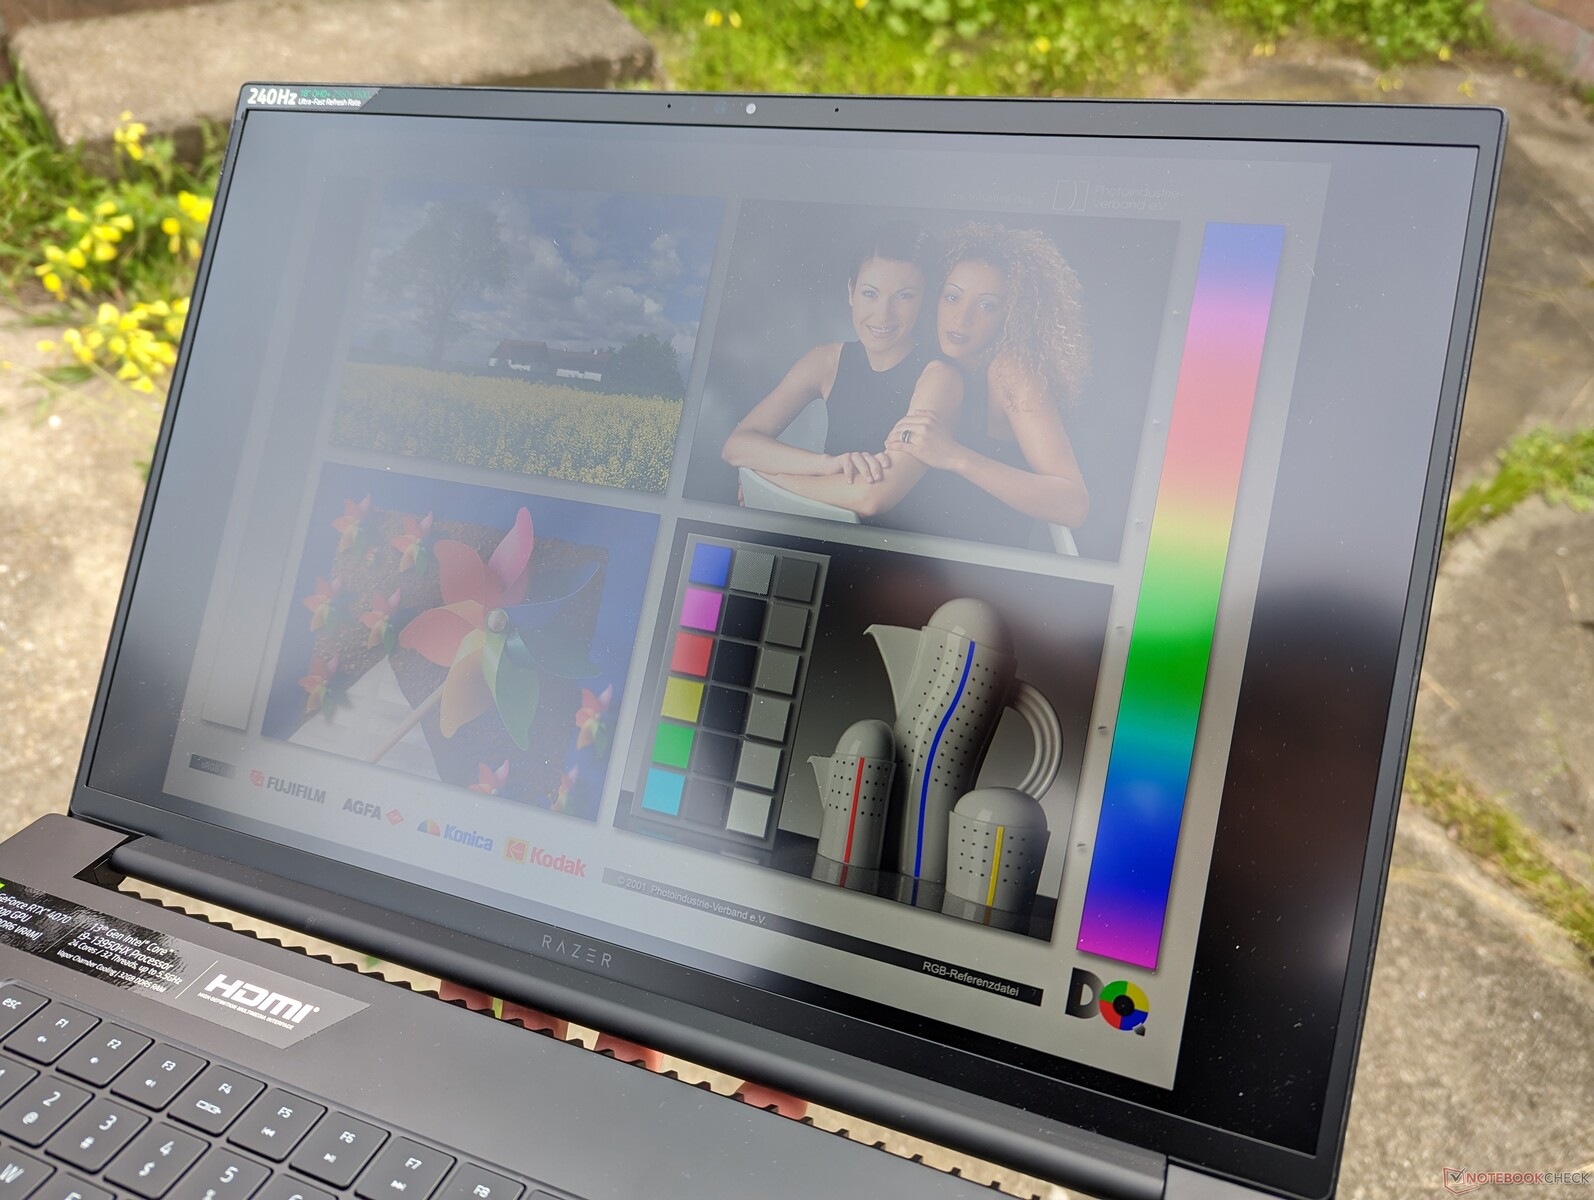
Widoczność na zewnątrz jest podobna do Blade 17, ponieważ ich wyświetlacze mają maksymalne natężenie 500 nitów. Cień jest zawsze zalecany, aby uzyskać optymalne kolory i zmniejszyć odblaski tak bardzo, jak to możliwe.
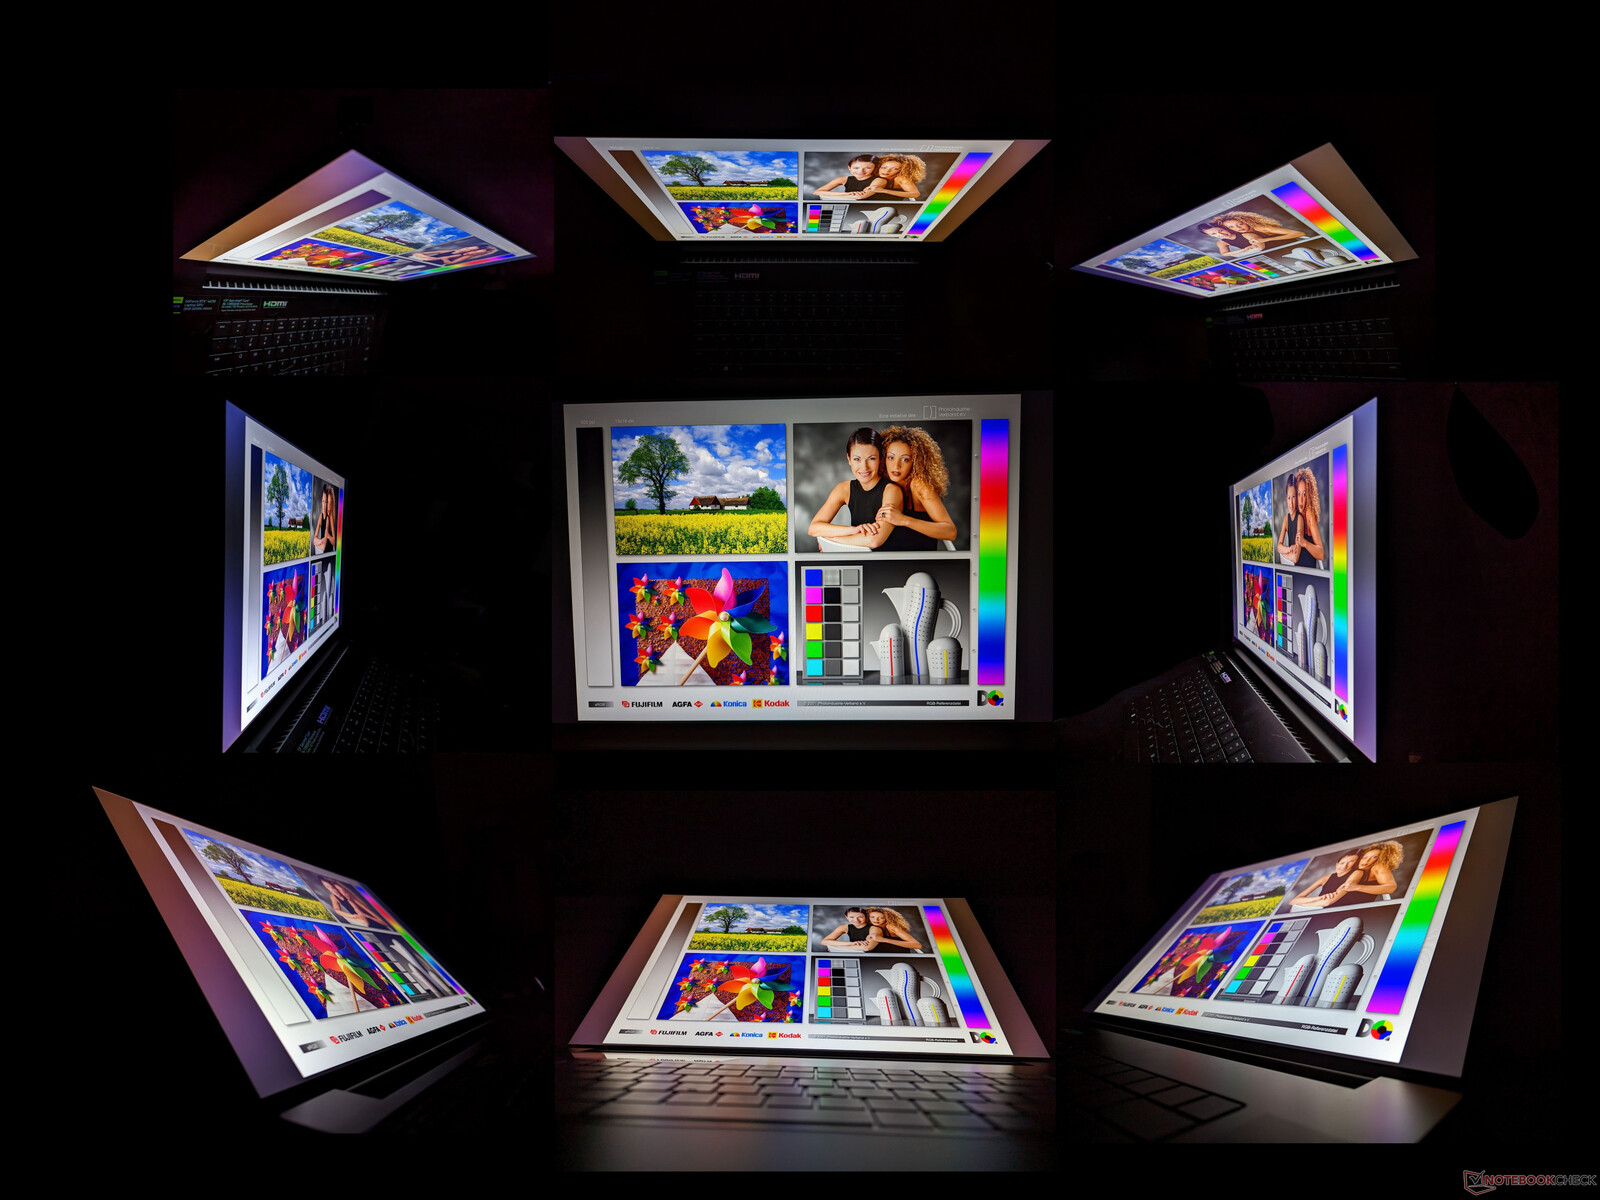
Kąty widzenia są szerokie, jak można się spodziewać po panelu IPS. Kolory i kontrast zmieniają się tylko przy oglądaniu pod ekstremalnymi kątami.
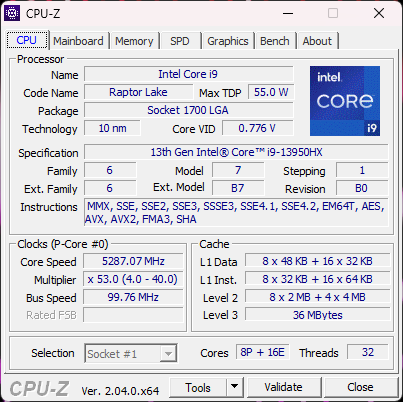
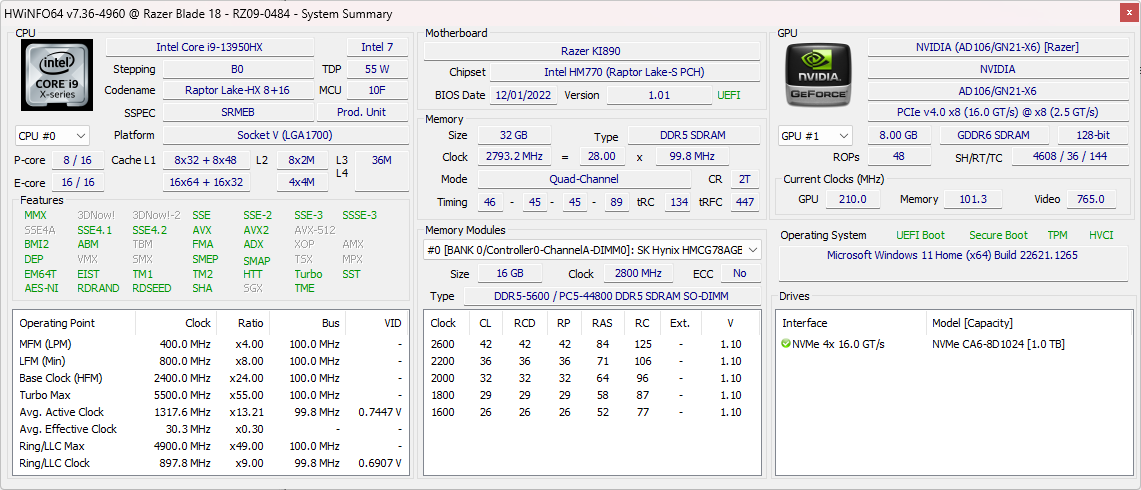
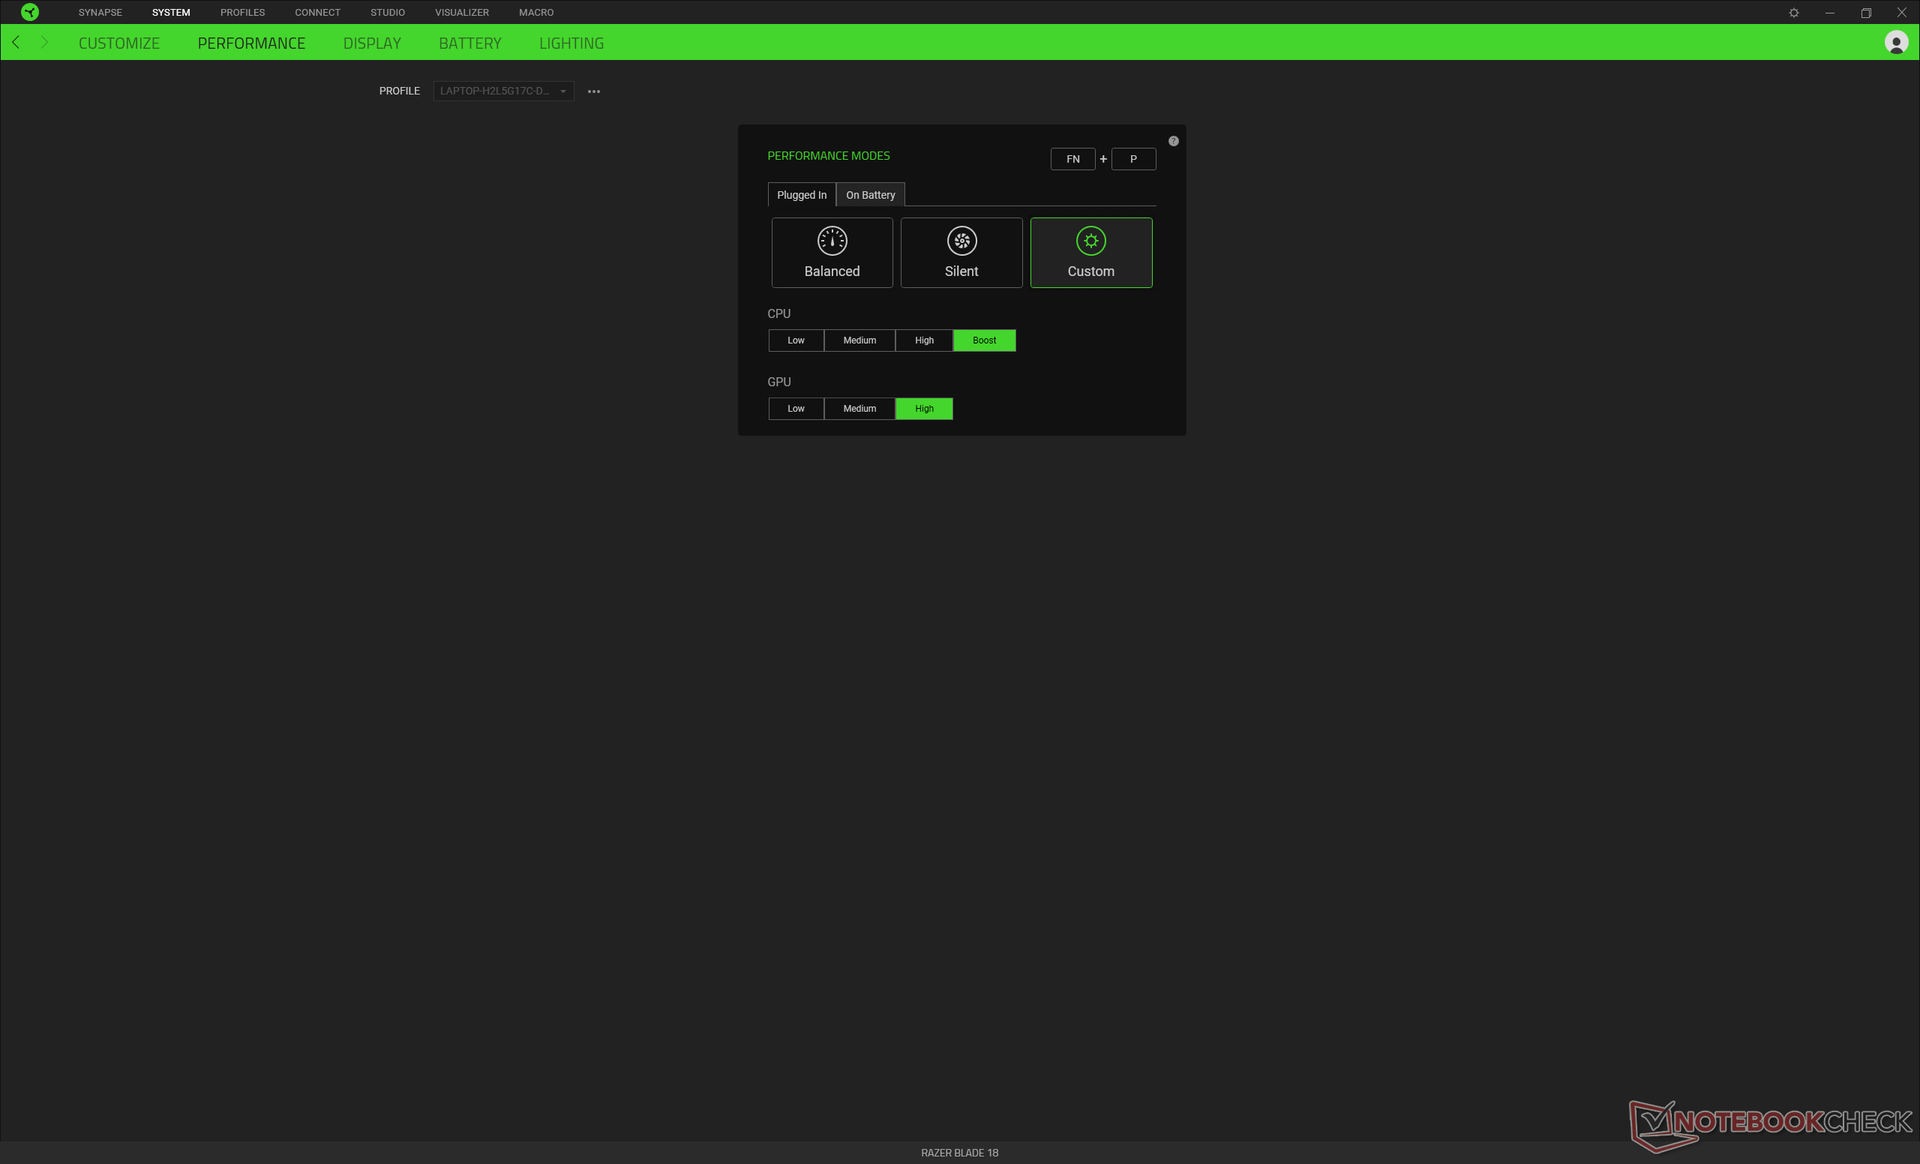
Wydajność - Intel Raptor Lake + Nvidia Ada Lovelace
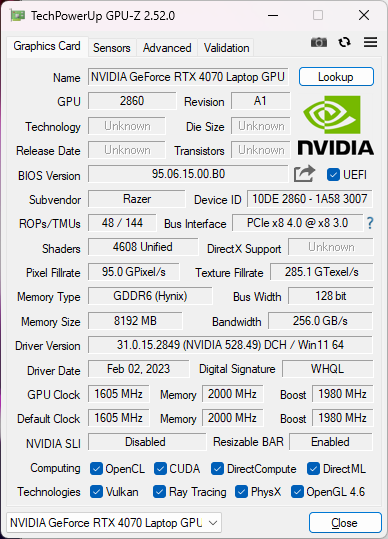
Warunki badania
Ustawiliśmy nasze urządzenie w trybie Performance poprzez Windows, a CPU i GPU odpowiednio na Boost i High, poprzez oprogramowanie Razer Synapse, jak widać poniżej. Zaleca się, aby użytkownicy zapoznali się z oprogramowaniem Synapse, ponieważ jest to centrum regulacji wszelkich efektów świetlnych RGB, profili wydajności, makr i innych funkcji pomocniczych. Niestety, oprogramowanie nie zawsze jest niezawodne, ponieważ czasami przestaje reagować lub nie uruchamia się w ogóle, jeśli nie ma połączenia z Internetem.
Blade 18 nie obsługuje MUX ani Advanced Optimus, tak jak Blade 16. Nasz egzemplarz nie obsługuje również G-Sync, pomimo tego, co reklamuje Razer. Skontaktowaliśmy się z Razerem w sprawie braku G-Sync i zaktualizujemy tę sekcję, gdy będzie to stosowne.

Procesor
Wydajność procesora nie odbiega o kilka punktów procentowych od Blade 16 lub GT77 wyposażonych w ten sam procesor Core i9-13950HX procesor. Nie wydaje się więc, by tutejszy procesor cierpiał na jakieś większe problemy z throttlingiem. Wydajność wielowątkowa jest o około 45% szybsza od poprzedniej generacjiCore i9-12950HX i jest na równi z desktopowym Core i9-12900K. Skok wydajności między generacjami jest w tym względzie znaczący.
Wyniki naszych zwykłych testów w pętli CineBench R15 xT nie zostały uwzględnione poniżej, gdyż są one niezwykle niskie i niereprezentatywne dla wydajności procesora. Uruchomienie CineBench R15 aktywuje zarówno CPU jak i dGPU, więc wydajność procesora może być czasem ograniczona przez dGPU. Problem ten można zaobserwować także w kilku innych laptopach. CineBench R23 to benchmark czysto procesorowy, który nie aktywuje dGPU, więc te wyniki są podane poniżej.
Cinebench R23 Multi Loop
Cinebench R23: Multi Core | Single Core
Cinebench R20: CPU (Multi Core) | CPU (Single Core)
Cinebench R15: CPU Multi 64Bit | CPU Single 64Bit
Blender: v2.79 BMW27 CPU
7-Zip 18.03: 7z b 4 | 7z b 4 -mmt1
Geekbench 5.5: Multi-Core | Single-Core
HWBOT x265 Benchmark v2.2: 4k Preset
LibreOffice : 20 Documents To PDF
R Benchmark 2.5: Overall mean
| CPU Performance rating | |
| MSI Titan GT77 HX 13VI | |
| Razer Blade 18 RTX 4070 | |
| Przeciętny Intel Core i9-13950HX | |
| Intel Core i9-12900K | |
| Razer Blade 16 Early 2023 | |
| Asus ROG Strix Scar 17 SE G733CX-LL014W | |
| MSI Pulse GL76 12UGK | |
| Razer Blade 17 RTX 3080 Ti | |
| Gigabyte G7 KE | |
| Razer Blade 17 Early 2022 | |
| Alienware m17 R5 (R9 6900HX, RX 6850M XT) | |
| Acer Nitro 5 AN515-46-R1A1 | |
| Asus Strix Scar 17 G733QSA-XS99 | |
| Alienware x17 RTX 3080 P48E -2! | |
| Cinebench R23 / Multi Core | |
| MSI Titan GT77 HX 13VI | |
| Przeciętny Intel Core i9-13950HX (24560 - 33277, n=7) | |
| Razer Blade 18 RTX 4070 | |
| Intel Core i9-12900K | |
| Razer Blade 16 Early 2023 | |
| Asus ROG Strix Scar 17 SE G733CX-LL014W | |
| MSI Pulse GL76 12UGK | |
| Razer Blade 17 RTX 3080 Ti | |
| Gigabyte G7 KE | |
| Alienware x17 RTX 3080 P48E | |
| Alienware m17 R5 (R9 6900HX, RX 6850M XT) | |
| Acer Nitro 5 AN515-46-R1A1 | |
| Asus Strix Scar 17 G733QSA-XS99 | |
| Razer Blade 17 Early 2022 | |
| Cinebench R23 / Single Core | |
| MSI Titan GT77 HX 13VI | |
| Razer Blade 18 RTX 4070 | |
| Przeciętny Intel Core i9-13950HX (1952 - 2113, n=7) | |
| Razer Blade 16 Early 2023 | |
| Intel Core i9-12900K | |
| Razer Blade 17 Early 2022 | |
| Asus ROG Strix Scar 17 SE G733CX-LL014W | |
| Razer Blade 17 RTX 3080 Ti | |
| MSI Pulse GL76 12UGK | |
| Gigabyte G7 KE | |
| Alienware m17 R5 (R9 6900HX, RX 6850M XT) | |
| Acer Nitro 5 AN515-46-R1A1 | |
| Alienware x17 RTX 3080 P48E | |
| Asus Strix Scar 17 G733QSA-XS99 | |
| Cinebench R20 / CPU (Multi Core) | |
| MSI Titan GT77 HX 13VI | |
| Przeciętny Intel Core i9-13950HX (8697 - 12648, n=7) | |
| Razer Blade 18 RTX 4070 | |
| Intel Core i9-12900K | |
| Razer Blade 16 Early 2023 | |
| Asus ROG Strix Scar 17 SE G733CX-LL014W | |
| MSI Pulse GL76 12UGK | |
| Razer Blade 17 RTX 3080 Ti | |
| Alienware x17 RTX 3080 P48E | |
| Gigabyte G7 KE | |
| Acer Nitro 5 AN515-46-R1A1 | |
| Alienware m17 R5 (R9 6900HX, RX 6850M XT) | |
| Asus Strix Scar 17 G733QSA-XS99 | |
| Razer Blade 17 Early 2022 | |
| Cinebench R20 / CPU (Single Core) | |
| MSI Titan GT77 HX 13VI | |
| Razer Blade 18 RTX 4070 | |
| Przeciętny Intel Core i9-13950HX (742 - 816, n=7) | |
| Intel Core i9-12900K | |
| Razer Blade 16 Early 2023 | |
| Asus ROG Strix Scar 17 SE G733CX-LL014W | |
| Razer Blade 17 RTX 3080 Ti | |
| Razer Blade 17 Early 2022 | |
| MSI Pulse GL76 12UGK | |
| Gigabyte G7 KE | |
| Alienware m17 R5 (R9 6900HX, RX 6850M XT) | |
| Acer Nitro 5 AN515-46-R1A1 | |
| Alienware x17 RTX 3080 P48E | |
| Asus Strix Scar 17 G733QSA-XS99 | |
| Cinebench R15 / CPU Multi 64Bit | |
| MSI Titan GT77 HX 13VI | |
| Przeciętny Intel Core i9-13950HX (3625 - 5227, n=7) | |
| Razer Blade 16 Early 2023 | |
| Razer Blade 18 RTX 4070 | |
| Intel Core i9-12900K | |
| Asus ROG Strix Scar 17 SE G733CX-LL014W | |
| MSI Pulse GL76 12UGK | |
| Alienware m17 R5 (R9 6900HX, RX 6850M XT) | |
| Asus Strix Scar 17 G733QSA-XS99 | |
| Razer Blade 17 RTX 3080 Ti | |
| Acer Nitro 5 AN515-46-R1A1 | |
| Gigabyte G7 KE | |
| Alienware x17 RTX 3080 P48E | |
| Razer Blade 17 Early 2022 | |
| Cinebench R15 / CPU Single 64Bit | |
| MSI Titan GT77 HX 13VI | |
| Razer Blade 18 RTX 4070 | |
| Przeciętny Intel Core i9-13950HX (274 - 303, n=7) | |
| Intel Core i9-12900K | |
| Asus ROG Strix Scar 17 SE G733CX-LL014W | |
| Razer Blade 16 Early 2023 | |
| Razer Blade 17 RTX 3080 Ti | |
| Razer Blade 17 Early 2022 | |
| MSI Pulse GL76 12UGK | |
| Alienware m17 R5 (R9 6900HX, RX 6850M XT) | |
| Gigabyte G7 KE | |
| Acer Nitro 5 AN515-46-R1A1 | |
| Asus Strix Scar 17 G733QSA-XS99 | |
| Alienware x17 RTX 3080 P48E | |
| Blender / v2.79 BMW27 CPU | |
| Razer Blade 17 Early 2022 | |
| Acer Nitro 5 AN515-46-R1A1 | |
| Asus Strix Scar 17 G733QSA-XS99 | |
| Gigabyte G7 KE | |
| Razer Blade 17 RTX 3080 Ti | |
| Alienware m17 R5 (R9 6900HX, RX 6850M XT) | |
| Alienware x17 RTX 3080 P48E | |
| MSI Pulse GL76 12UGK | |
| Asus ROG Strix Scar 17 SE G733CX-LL014W | |
| Intel Core i9-12900K | |
| Razer Blade 16 Early 2023 | |
| Przeciętny Intel Core i9-13950HX (100 - 137, n=7) | |
| Razer Blade 18 RTX 4070 | |
| MSI Titan GT77 HX 13VI | |
| 7-Zip 18.03 / 7z b 4 | |
| MSI Titan GT77 HX 13VI | |
| Razer Blade 18 RTX 4070 | |
| Przeciętny Intel Core i9-13950HX (99351 - 127295, n=7) | |
| Razer Blade 16 Early 2023 | |
| Intel Core i9-12900K | |
| Asus ROG Strix Scar 17 SE G733CX-LL014W | |
| MSI Pulse GL76 12UGK | |
| Razer Blade 17 RTX 3080 Ti | |
| Asus Strix Scar 17 G733QSA-XS99 | |
| Alienware m17 R5 (R9 6900HX, RX 6850M XT) | |
| Acer Nitro 5 AN515-46-R1A1 | |
| Alienware x17 RTX 3080 P48E | |
| Gigabyte G7 KE | |
| Razer Blade 17 Early 2022 | |
| 7-Zip 18.03 / 7z b 4 -mmt1 | |
| MSI Titan GT77 HX 13VI | |
| Razer Blade 18 RTX 4070 | |
| Przeciętny Intel Core i9-13950HX (6445 - 7064, n=7) | |
| Intel Core i9-12900K | |
| Razer Blade 16 Early 2023 | |
| Asus ROG Strix Scar 17 SE G733CX-LL014W | |
| Razer Blade 17 Early 2022 | |
| Razer Blade 17 RTX 3080 Ti | |
| Asus Strix Scar 17 G733QSA-XS99 | |
| Alienware m17 R5 (R9 6900HX, RX 6850M XT) | |
| Acer Nitro 5 AN515-46-R1A1 | |
| MSI Pulse GL76 12UGK | |
| Gigabyte G7 KE | |
| Alienware x17 RTX 3080 P48E | |
| Geekbench 5.5 / Multi-Core | |
| MSI Titan GT77 HX 13VI | |
| Razer Blade 18 RTX 4070 | |
| Przeciętny Intel Core i9-13950HX (16776 - 21853, n=7) | |
| Razer Blade 16 Early 2023 | |
| Intel Core i9-12900K | |
| Asus ROG Strix Scar 17 SE G733CX-LL014W | |
| Razer Blade 17 RTX 3080 Ti | |
| MSI Pulse GL76 12UGK | |
| Gigabyte G7 KE | |
| Alienware m17 R5 (R9 6900HX, RX 6850M XT) | |
| Razer Blade 17 Early 2022 | |
| Acer Nitro 5 AN515-46-R1A1 | |
| Asus Strix Scar 17 G733QSA-XS99 | |
| Geekbench 5.5 / Single-Core | |
| MSI Titan GT77 HX 13VI | |
| Intel Core i9-12900K | |
| Razer Blade 18 RTX 4070 | |
| Przeciętny Intel Core i9-13950HX (1805 - 2097, n=7) | |
| Asus ROG Strix Scar 17 SE G733CX-LL014W | |
| Razer Blade 16 Early 2023 | |
| Razer Blade 17 Early 2022 | |
| Razer Blade 17 RTX 3080 Ti | |
| Gigabyte G7 KE | |
| MSI Pulse GL76 12UGK | |
| Alienware m17 R5 (R9 6900HX, RX 6850M XT) | |
| Acer Nitro 5 AN515-46-R1A1 | |
| Asus Strix Scar 17 G733QSA-XS99 | |
| HWBOT x265 Benchmark v2.2 / 4k Preset | |
| MSI Titan GT77 HX 13VI | |
| Razer Blade 18 RTX 4070 | |
| Przeciętny Intel Core i9-13950HX (26 - 34.5, n=7) | |
| Intel Core i9-12900K | |
| Razer Blade 16 Early 2023 | |
| Asus ROG Strix Scar 17 SE G733CX-LL014W | |
| MSI Pulse GL76 12UGK | |
| Alienware x17 RTX 3080 P48E | |
| Asus Strix Scar 17 G733QSA-XS99 | |
| Razer Blade 17 RTX 3080 Ti | |
| Alienware m17 R5 (R9 6900HX, RX 6850M XT) | |
| Acer Nitro 5 AN515-46-R1A1 | |
| Gigabyte G7 KE | |
| Razer Blade 17 Early 2022 | |
| LibreOffice / 20 Documents To PDF | |
| Alienware m17 R5 (R9 6900HX, RX 6850M XT) | |
| Acer Nitro 5 AN515-46-R1A1 | |
| Razer Blade 16 Early 2023 | |
| Alienware x17 RTX 3080 P48E | |
| MSI Titan GT77 HX 13VI | |
| Razer Blade 17 RTX 3080 Ti | |
| Asus Strix Scar 17 G733QSA-XS99 | |
| MSI Pulse GL76 12UGK | |
| Gigabyte G7 KE | |
| Przeciętny Intel Core i9-13950HX (32.8 - 52.1, n=7) | |
| Razer Blade 18 RTX 4070 | |
| Intel Core i9-12900K | |
| Razer Blade 17 Early 2022 | |
| Asus ROG Strix Scar 17 SE G733CX-LL014W | |
| R Benchmark 2.5 / Overall mean | |
| Alienware x17 RTX 3080 P48E | |
| Asus Strix Scar 17 G733QSA-XS99 | |
| Acer Nitro 5 AN515-46-R1A1 | |
| Alienware m17 R5 (R9 6900HX, RX 6850M XT) | |
| Gigabyte G7 KE | |
| MSI Pulse GL76 12UGK | |
| Razer Blade 17 RTX 3080 Ti | |
| Razer Blade 17 Early 2022 | |
| Asus ROG Strix Scar 17 SE G733CX-LL014W | |
| Intel Core i9-12900K | |
| Razer Blade 16 Early 2023 | |
| MSI Titan GT77 HX 13VI | |
| Przeciętny Intel Core i9-13950HX (0.3823 - 0.4121, n=7) | |
| Razer Blade 18 RTX 4070 | |
Cinebench R23: Multi Core | Single Core
Cinebench R20: CPU (Multi Core) | CPU (Single Core)
Cinebench R15: CPU Multi 64Bit | CPU Single 64Bit
Blender: v2.79 BMW27 CPU
7-Zip 18.03: 7z b 4 | 7z b 4 -mmt1
Geekbench 5.5: Multi-Core | Single-Core
HWBOT x265 Benchmark v2.2: 4k Preset
LibreOffice : 20 Documents To PDF
R Benchmark 2.5: Overall mean
* ... im mniej tym lepiej
AIDA64: FP32 Ray-Trace | FPU Julia | CPU SHA3 | CPU Queen | FPU SinJulia | FPU Mandel | CPU AES | CPU ZLib | FP64 Ray-Trace | CPU PhotoWorxx
| Performance rating | |
| MSI Titan GT77 HX 13VI | |
| Razer Blade 18 RTX 4070 | |
| Przeciętny Intel Core i9-13950HX | |
| Asus ROG Strix Scar 17 SE G733CX-LL014W | |
| Alienware m17 R5 (R9 6900HX, RX 6850M XT) | |
| Gigabyte G7 KE | |
| Razer Blade 17 Early 2022 | |
| AIDA64 / FP32 Ray-Trace | |
| MSI Titan GT77 HX 13VI | |
| Razer Blade 18 RTX 4070 | |
| Przeciętny Intel Core i9-13950HX (17993 - 28957, n=9) | |
| Asus ROG Strix Scar 17 SE G733CX-LL014W | |
| Alienware m17 R5 (R9 6900HX, RX 6850M XT) | |
| Gigabyte G7 KE | |
| Razer Blade 17 Early 2022 | |
| AIDA64 / FPU Julia | |
| MSI Titan GT77 HX 13VI | |
| Razer Blade 18 RTX 4070 | |
| Przeciętny Intel Core i9-13950HX (89362 - 144303, n=9) | |
| Alienware m17 R5 (R9 6900HX, RX 6850M XT) | |
| Asus ROG Strix Scar 17 SE G733CX-LL014W | |
| Gigabyte G7 KE | |
| Razer Blade 17 Early 2022 | |
| AIDA64 / CPU SHA3 | |
| MSI Titan GT77 HX 13VI | |
| Razer Blade 18 RTX 4070 | |
| Przeciętny Intel Core i9-13950HX (4518 - 7093, n=9) | |
| Asus ROG Strix Scar 17 SE G733CX-LL014W | |
| Alienware m17 R5 (R9 6900HX, RX 6850M XT) | |
| Gigabyte G7 KE | |
| Razer Blade 17 Early 2022 | |
| AIDA64 / CPU Queen | |
| MSI Titan GT77 HX 13VI | |
| Razer Blade 18 RTX 4070 | |
| Przeciętny Intel Core i9-13950HX (131931 - 140103, n=8) | |
| Alienware m17 R5 (R9 6900HX, RX 6850M XT) | |
| Asus ROG Strix Scar 17 SE G733CX-LL014W | |
| Razer Blade 17 Early 2022 | |
| Gigabyte G7 KE | |
| AIDA64 / FPU SinJulia | |
| MSI Titan GT77 HX 13VI | |
| Razer Blade 18 RTX 4070 | |
| Przeciętny Intel Core i9-13950HX (12318 - 17057, n=9) | |
| Alienware m17 R5 (R9 6900HX, RX 6850M XT) | |
| Asus ROG Strix Scar 17 SE G733CX-LL014W | |
| Gigabyte G7 KE | |
| Razer Blade 17 Early 2022 | |
| AIDA64 / FPU Mandel | |
| MSI Titan GT77 HX 13VI | |
| Razer Blade 18 RTX 4070 | |
| Przeciętny Intel Core i9-13950HX (44372 - 71038, n=9) | |
| Alienware m17 R5 (R9 6900HX, RX 6850M XT) | |
| Asus ROG Strix Scar 17 SE G733CX-LL014W | |
| Gigabyte G7 KE | |
| Razer Blade 17 Early 2022 | |
| AIDA64 / CPU AES | |
| Asus ROG Strix Scar 17 SE G733CX-LL014W | |
| Przeciętny Intel Core i9-13950HX (99981 - 204491, n=9) | |
| MSI Titan GT77 HX 13VI | |
| Razer Blade 18 RTX 4070 | |
| Gigabyte G7 KE | |
| Alienware m17 R5 (R9 6900HX, RX 6850M XT) | |
| Razer Blade 17 Early 2022 | |
| AIDA64 / CPU ZLib | |
| MSI Titan GT77 HX 13VI | |
| Razer Blade 18 RTX 4070 | |
| Przeciętny Intel Core i9-13950HX (1263 - 2069, n=9) | |
| Asus ROG Strix Scar 17 SE G733CX-LL014W | |
| Gigabyte G7 KE | |
| Alienware m17 R5 (R9 6900HX, RX 6850M XT) | |
| Razer Blade 17 Early 2022 | |
| AIDA64 / FP64 Ray-Trace | |
| MSI Titan GT77 HX 13VI | |
| Razer Blade 18 RTX 4070 | |
| Przeciętny Intel Core i9-13950HX (9649 - 15573, n=9) | |
| Asus ROG Strix Scar 17 SE G733CX-LL014W | |
| Alienware m17 R5 (R9 6900HX, RX 6850M XT) | |
| Gigabyte G7 KE | |
| Razer Blade 17 Early 2022 | |
| AIDA64 / CPU PhotoWorxx | |
| Razer Blade 18 RTX 4070 | |
| Przeciętny Intel Core i9-13950HX (40233 - 50864, n=9) | |
| Asus ROG Strix Scar 17 SE G733CX-LL014W | |
| MSI Titan GT77 HX 13VI | |
| Razer Blade 17 Early 2022 | |
| Alienware m17 R5 (R9 6900HX, RX 6850M XT) | |
| Gigabyte G7 KE | |
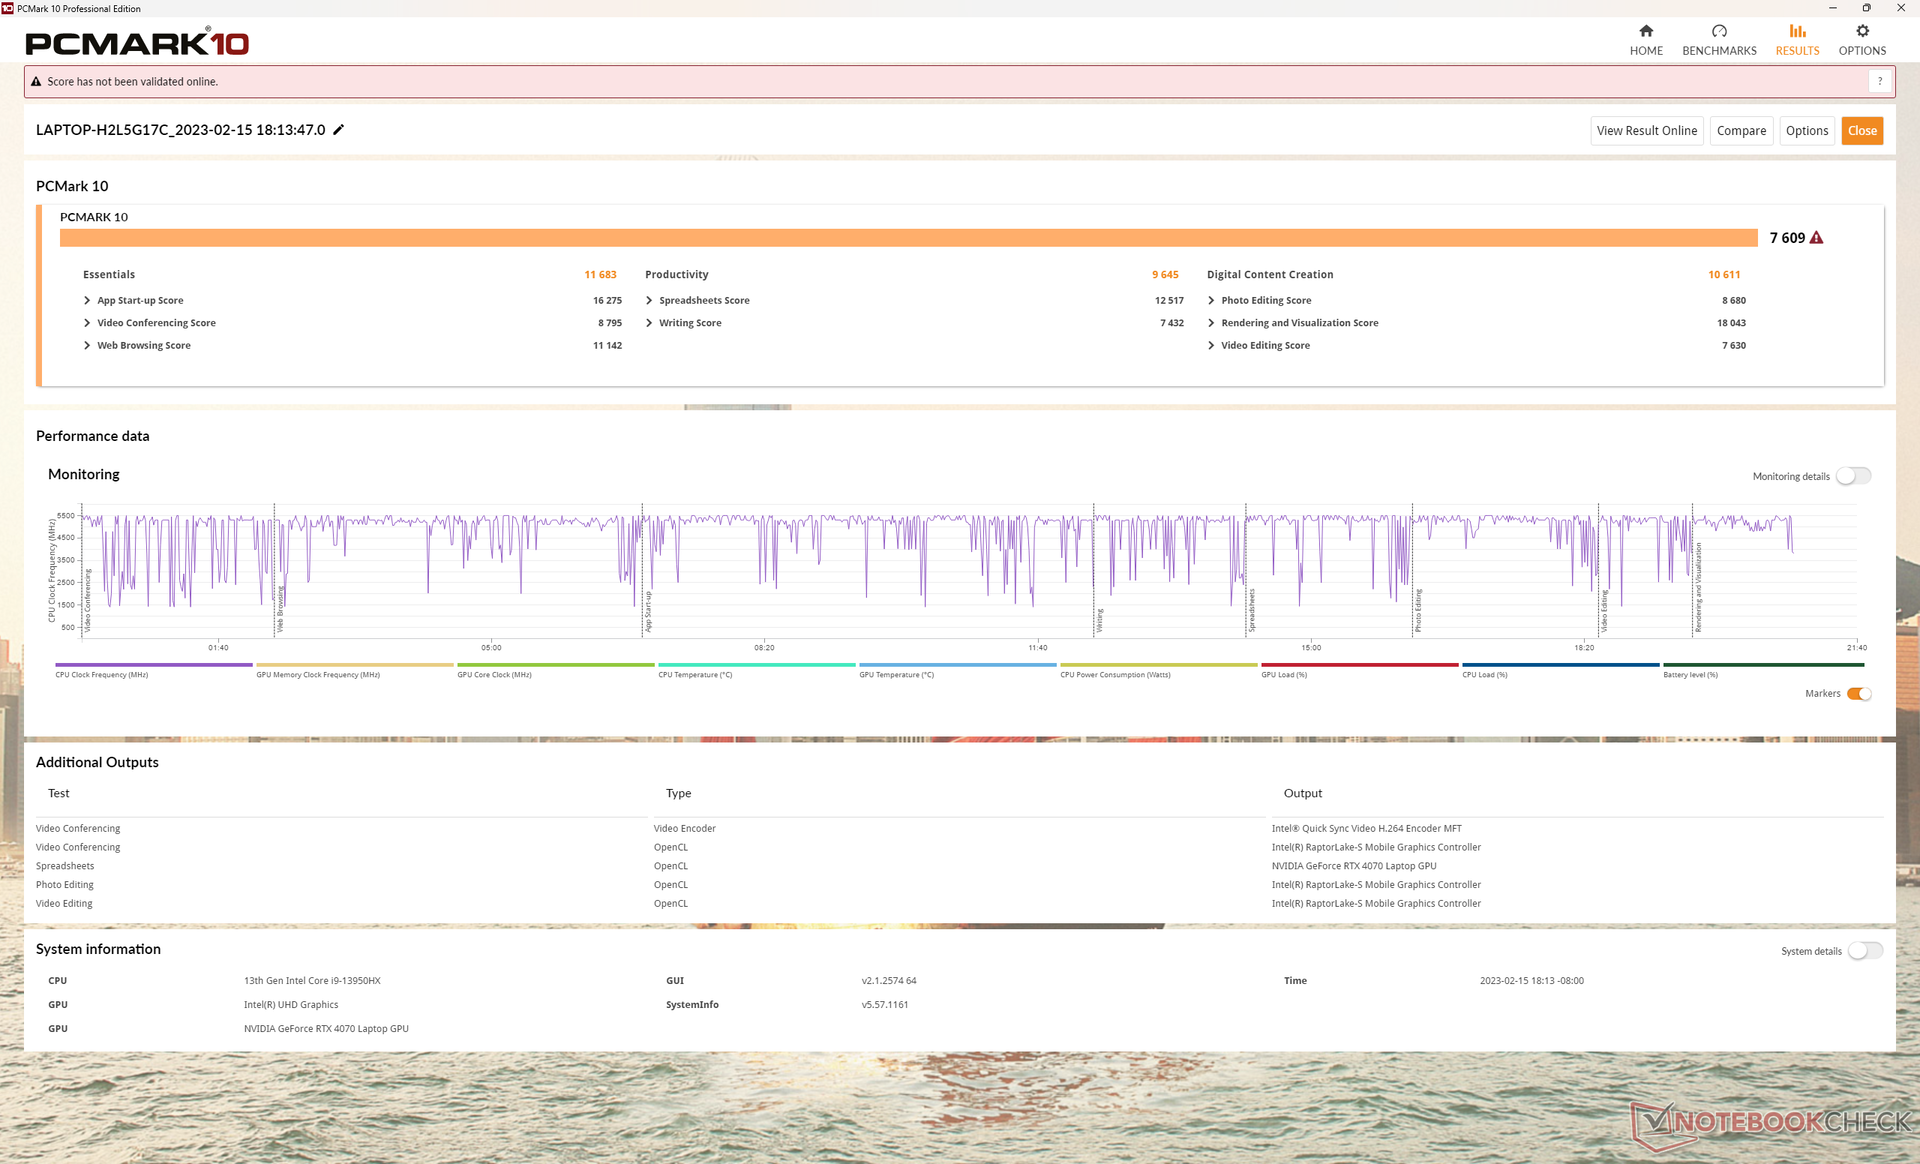
Wydajność systemu
Wyniki PCMark 10 są konsekwentnie wyższe niż na 2022 Blade 17 nawet jeśli marginesy są niewielkie. Na stronie Blade 16 i MSI GT77 uzyskały lepsze wyniki, ponieważ posiadają szybsze układy graficzne RTX 4080 i 4090.
CrossMark: Overall | Productivity | Creativity | Responsiveness
| PCMark 10 / Score | |
| MSI Titan GT77 HX 13VI | |
| Razer Blade 18 RTX 4070 | |
| Przeciętny Intel Core i9-13950HX, NVIDIA GeForce RTX 4070 Laptop GPU (n=1) | |
| Alienware m17 R5 (R9 6900HX, RX 6850M XT) | |
| Asus ROG Strix Scar 17 SE G733CX-LL014W | |
| Razer Blade 17 Early 2022 | |
| Gigabyte G7 KE | |
| PCMark 10 / Essentials | |
| MSI Titan GT77 HX 13VI | |
| Razer Blade 18 RTX 4070 | |
| Przeciętny Intel Core i9-13950HX, NVIDIA GeForce RTX 4070 Laptop GPU (n=1) | |
| Asus ROG Strix Scar 17 SE G733CX-LL014W | |
| Gigabyte G7 KE | |
| Razer Blade 17 Early 2022 | |
| Alienware m17 R5 (R9 6900HX, RX 6850M XT) | |
| PCMark 10 / Productivity | |
| Asus ROG Strix Scar 17 SE G733CX-LL014W | |
| MSI Titan GT77 HX 13VI | |
| Razer Blade 18 RTX 4070 | |
| Przeciętny Intel Core i9-13950HX, NVIDIA GeForce RTX 4070 Laptop GPU (n=1) | |
| Razer Blade 17 Early 2022 | |
| Alienware m17 R5 (R9 6900HX, RX 6850M XT) | |
| Gigabyte G7 KE | |
| PCMark 10 / Digital Content Creation | |
| MSI Titan GT77 HX 13VI | |
| Alienware m17 R5 (R9 6900HX, RX 6850M XT) | |
| Razer Blade 18 RTX 4070 | |
| Przeciętny Intel Core i9-13950HX, NVIDIA GeForce RTX 4070 Laptop GPU (n=1) | |
| Razer Blade 17 Early 2022 | |
| Asus ROG Strix Scar 17 SE G733CX-LL014W | |
| Gigabyte G7 KE | |
| CrossMark / Overall | |
| MSI Titan GT77 HX 13VI | |
| Razer Blade 18 RTX 4070 | |
| Przeciętny Intel Core i9-13950HX, NVIDIA GeForce RTX 4070 Laptop GPU (n=1) | |
| Asus ROG Strix Scar 17 SE G733CX-LL014W | |
| Gigabyte G7 KE | |
| Razer Blade 17 Early 2022 | |
| Alienware m17 R5 (R9 6900HX, RX 6850M XT) | |
| CrossMark / Productivity | |
| MSI Titan GT77 HX 13VI | |
| Razer Blade 18 RTX 4070 | |
| Przeciętny Intel Core i9-13950HX, NVIDIA GeForce RTX 4070 Laptop GPU (n=1) | |
| Asus ROG Strix Scar 17 SE G733CX-LL014W | |
| Gigabyte G7 KE | |
| Razer Blade 17 Early 2022 | |
| Alienware m17 R5 (R9 6900HX, RX 6850M XT) | |
| CrossMark / Creativity | |
| MSI Titan GT77 HX 13VI | |
| Razer Blade 18 RTX 4070 | |
| Przeciętny Intel Core i9-13950HX, NVIDIA GeForce RTX 4070 Laptop GPU (n=1) | |
| Asus ROG Strix Scar 17 SE G733CX-LL014W | |
| Razer Blade 17 Early 2022 | |
| Gigabyte G7 KE | |
| Alienware m17 R5 (R9 6900HX, RX 6850M XT) | |
| CrossMark / Responsiveness | |
| Gigabyte G7 KE | |
| Asus ROG Strix Scar 17 SE G733CX-LL014W | |
| Razer Blade 18 RTX 4070 | |
| Przeciętny Intel Core i9-13950HX, NVIDIA GeForce RTX 4070 Laptop GPU (n=1) | |
| MSI Titan GT77 HX 13VI | |
| Razer Blade 17 Early 2022 | |
| Alienware m17 R5 (R9 6900HX, RX 6850M XT) | |
| PCMark 10 Score | 7609 pkt. | |
Pomoc | ||
| AIDA64 / Memory Copy | |
| Razer Blade 18 RTX 4070 | |
| Przeciętny Intel Core i9-13950HX (61938 - 78813, n=9) | |
| MSI Titan GT77 HX 13VI | |
| Asus ROG Strix Scar 17 SE G733CX-LL014W | |
| Razer Blade 17 Early 2022 | |
| Alienware m17 R5 (R9 6900HX, RX 6850M XT) | |
| Gigabyte G7 KE | |
| AIDA64 / Memory Read | |
| Razer Blade 18 RTX 4070 | |
| Przeciętny Intel Core i9-13950HX (62368 - 86831, n=9) | |
| Asus ROG Strix Scar 17 SE G733CX-LL014W | |
| MSI Titan GT77 HX 13VI | |
| Razer Blade 17 Early 2022 | |
| Alienware m17 R5 (R9 6900HX, RX 6850M XT) | |
| Gigabyte G7 KE | |
| AIDA64 / Memory Write | |
| Razer Blade 18 RTX 4070 | |
| Przeciętny Intel Core i9-13950HX (59501 - 80441, n=9) | |
| Asus ROG Strix Scar 17 SE G733CX-LL014W | |
| MSI Titan GT77 HX 13VI | |
| Razer Blade 17 Early 2022 | |
| Alienware m17 R5 (R9 6900HX, RX 6850M XT) | |
| Gigabyte G7 KE | |
| AIDA64 / Memory Latency | |
| Alienware m17 R5 (R9 6900HX, RX 6850M XT) | |
| MSI Titan GT77 HX 13VI | |
| Gigabyte G7 KE | |
| Przeciętny Intel Core i9-13950HX (84.4 - 99.5, n=9) | |
| Asus ROG Strix Scar 17 SE G733CX-LL014W | |
| Razer Blade 18 RTX 4070 | |
* ... im mniej tym lepiej
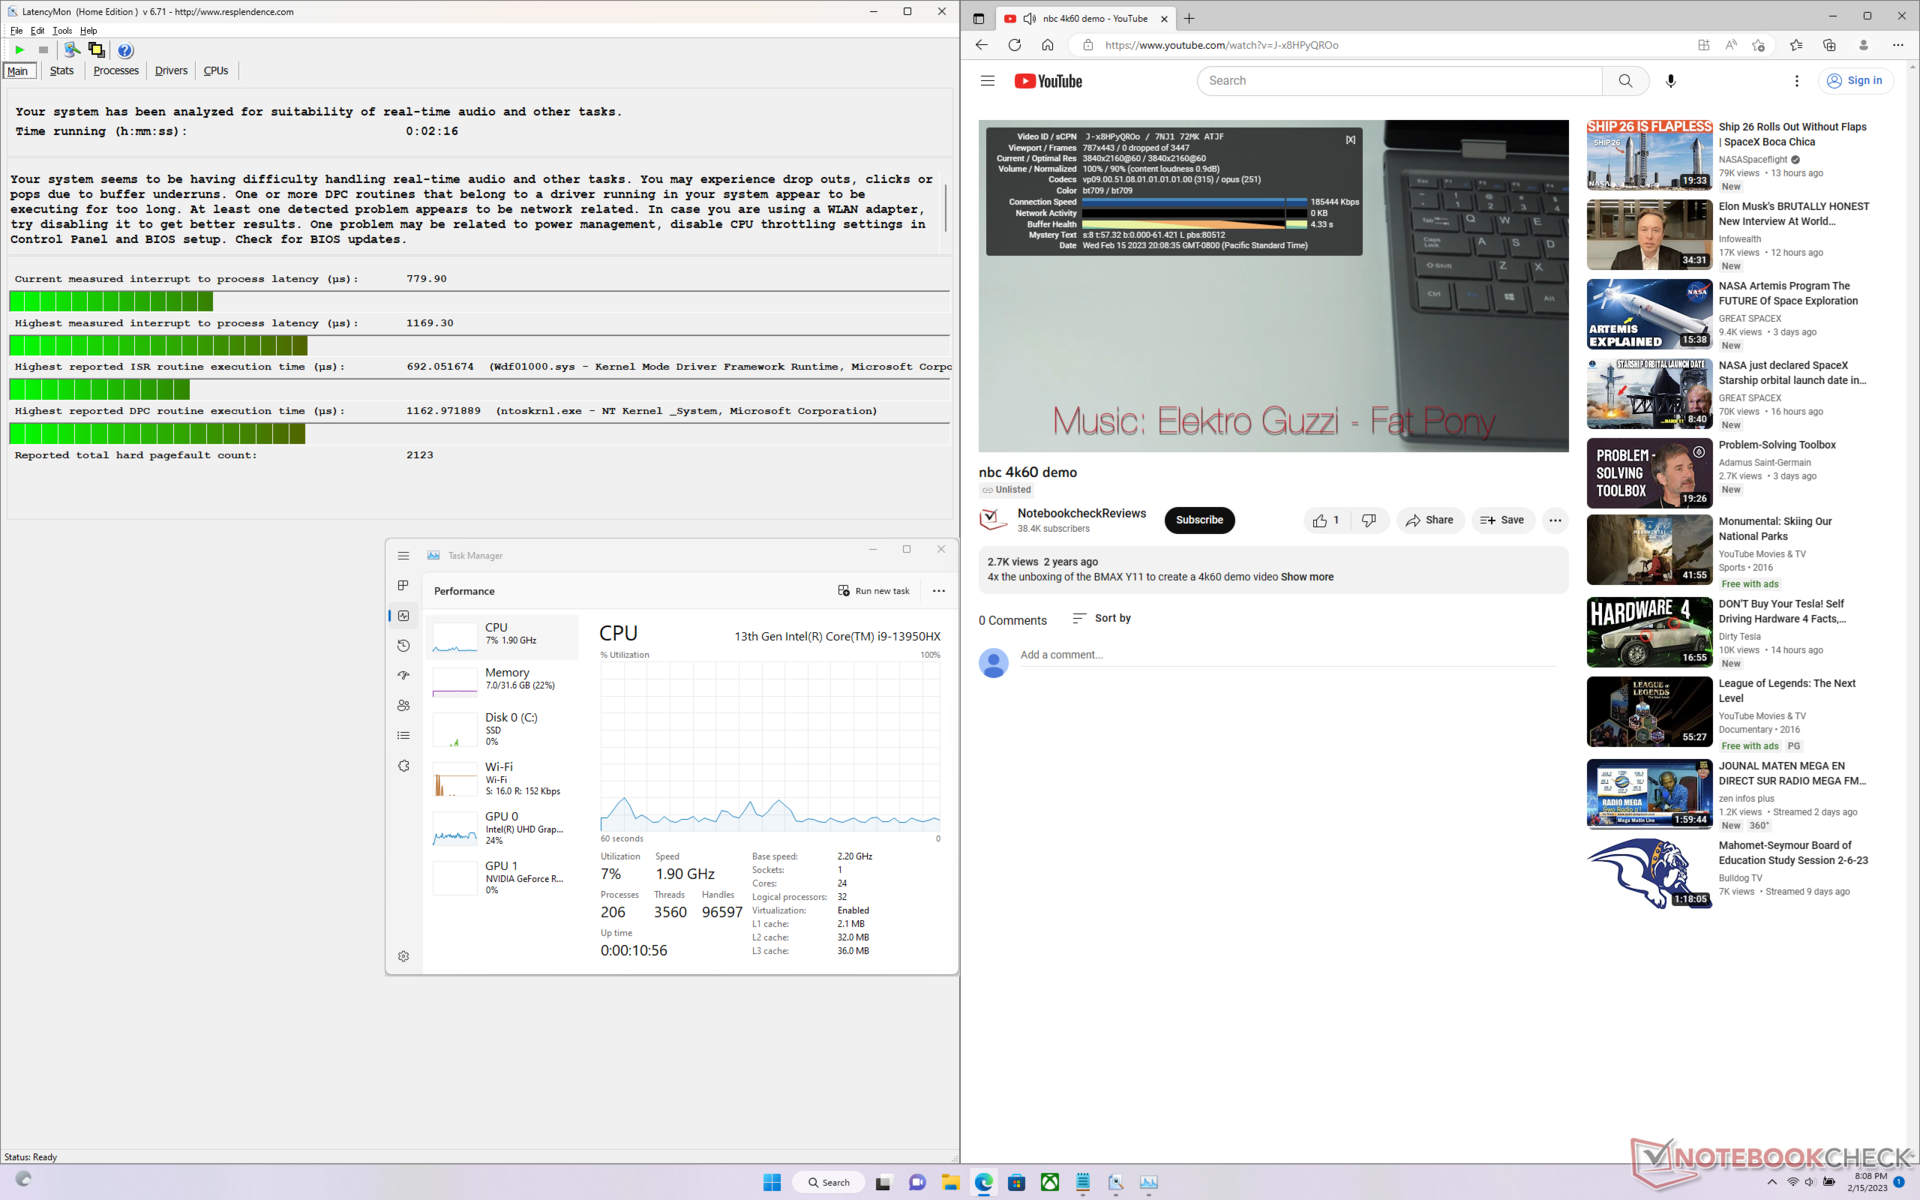
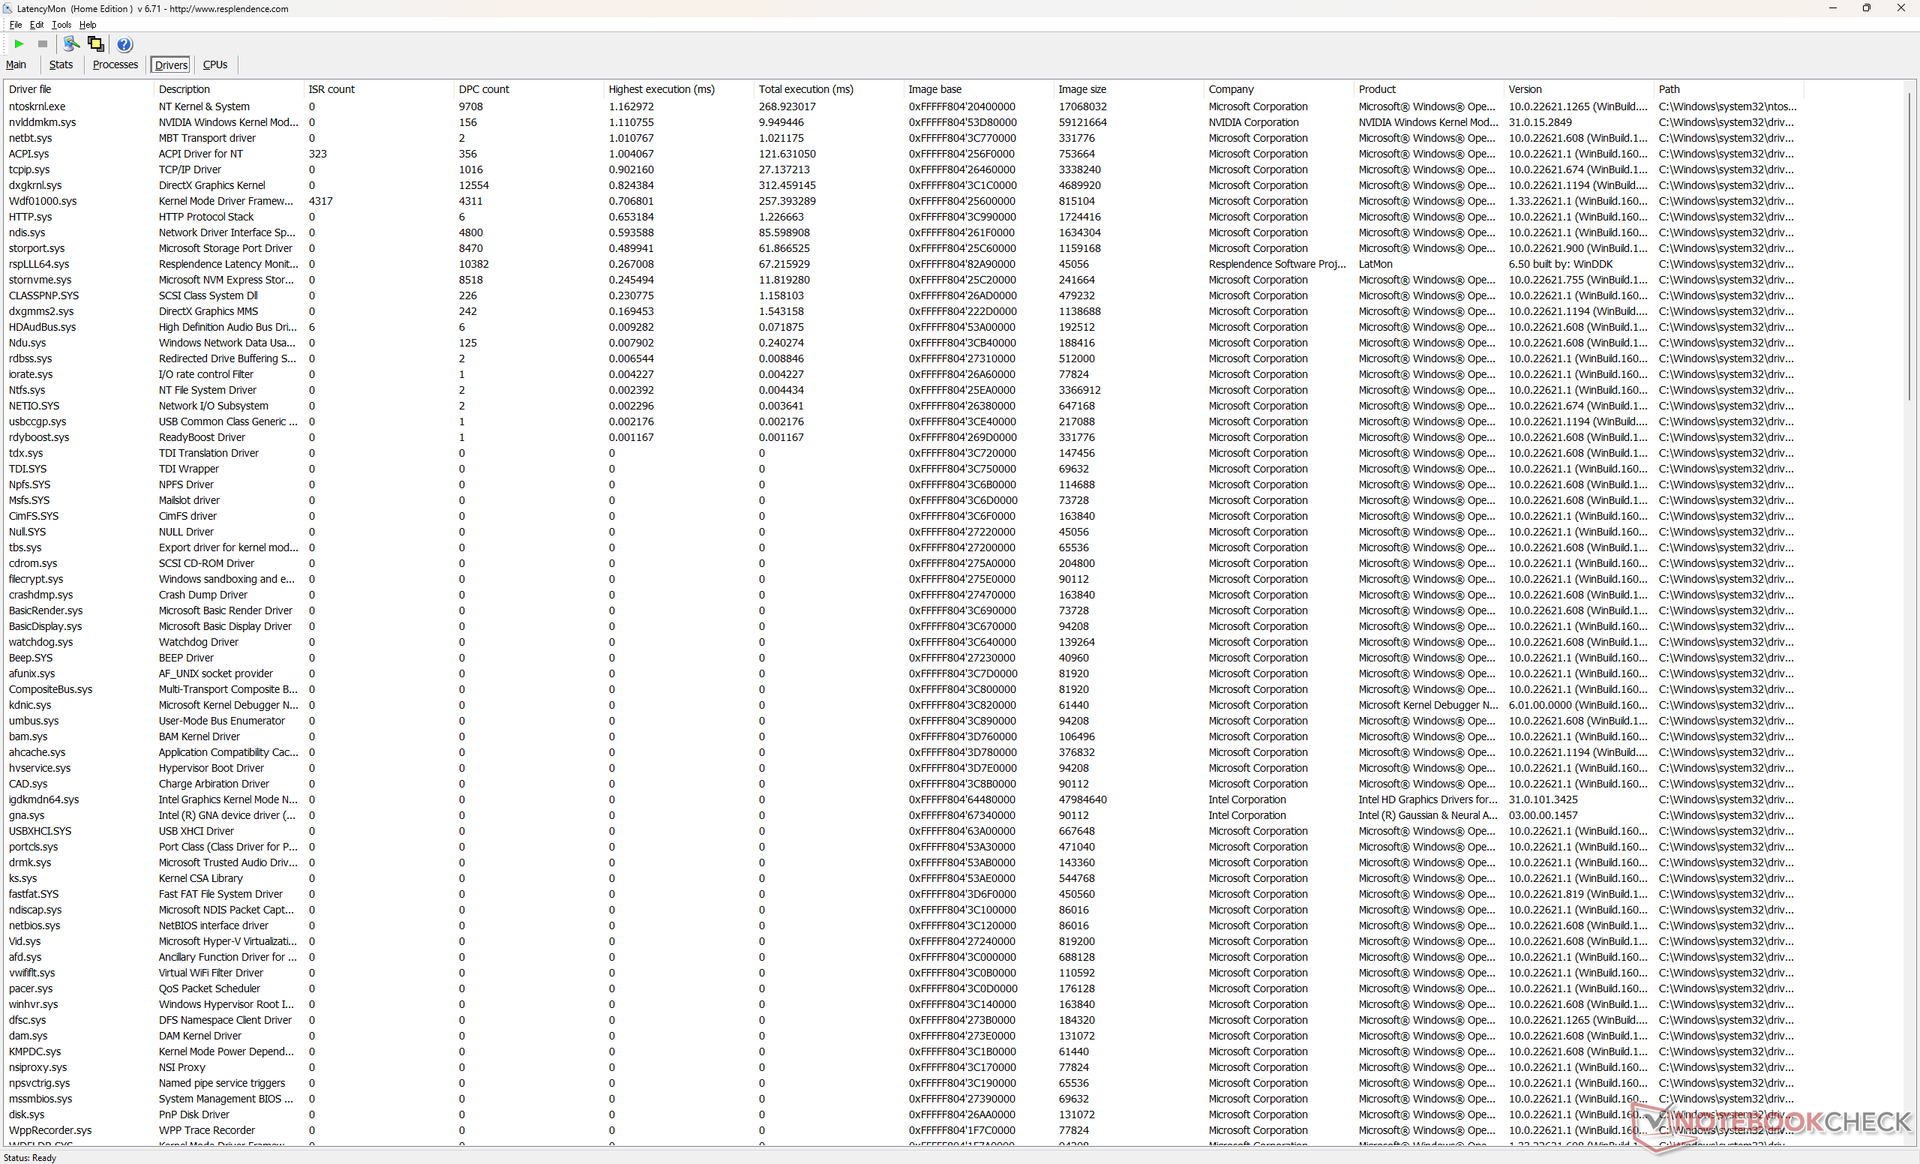
Opóźnienie DPC
LatencyMon ujawnia niewielkie problemy z DPC podczas otwierania wielu kart przeglądarki na naszej stronie głównej. odtwarzanie wideo 4K przy 60 FPS jest poza tym bez zarzutu, z niskim wykorzystaniem CPU i GPU.
| DPC Latencies / LatencyMon - interrupt to process latency (max), Web, Youtube, Prime95 | |
| MSI Titan GT77 HX 13VI | |
| Asus ROG Strix Scar 17 SE G733CX-LL014W | |
| Gigabyte G7 KE | |
| Alienware m17 R5 (R9 6900HX, RX 6850M XT) | |
| Razer Blade 18 RTX 4070 | |
| Razer Blade 17 Early 2022 | |
* ... im mniej tym lepiej
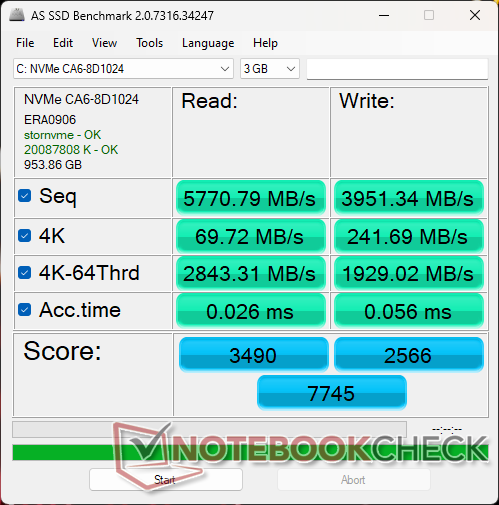
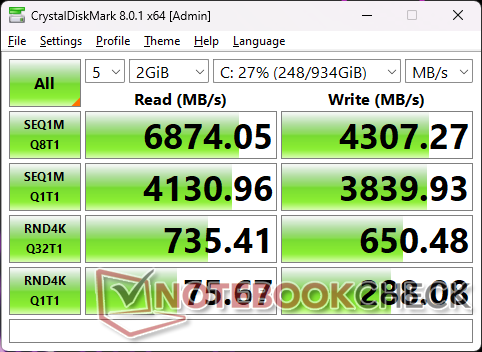
Urządzenia pamięci masowej - do dwóch dysków SSD
Nasze urządzenie testowe jest dostarczane z tym samym 1 TB SSSTC CA6-8D1024 PCIe4 x4 NVMe SSD, który znajduje się w Alienware m17 R5. Szybkość transferu jest porównywalna z popularnym Samsungiem PM9A1, ze stabilnym odczytem sekwencyjnym i zapisem zbliżającym się do 6900 MB/s i 4300 MB/s, odpowiednio. Razer dołącza podkładkę termiczną dla każdego z dwóch slotów SSD, aby odprowadzić ciepło na metalowy panel dolny.

| Drive Performance rating - Percent | |
| Asus ROG Strix Scar 17 SE G733CX-LL014W | |
| Gigabyte G7 KE | |
| Razer Blade 17 Early 2022 | |
| MSI Titan GT77 HX 13VI | |
| Razer Blade 18 RTX 4070 | |
| Alienware m17 R5 (R9 6900HX, RX 6850M XT) | |
* ... im mniej tym lepiej
Disk Throttling: DiskSpd Read Loop, Queue Depth 8
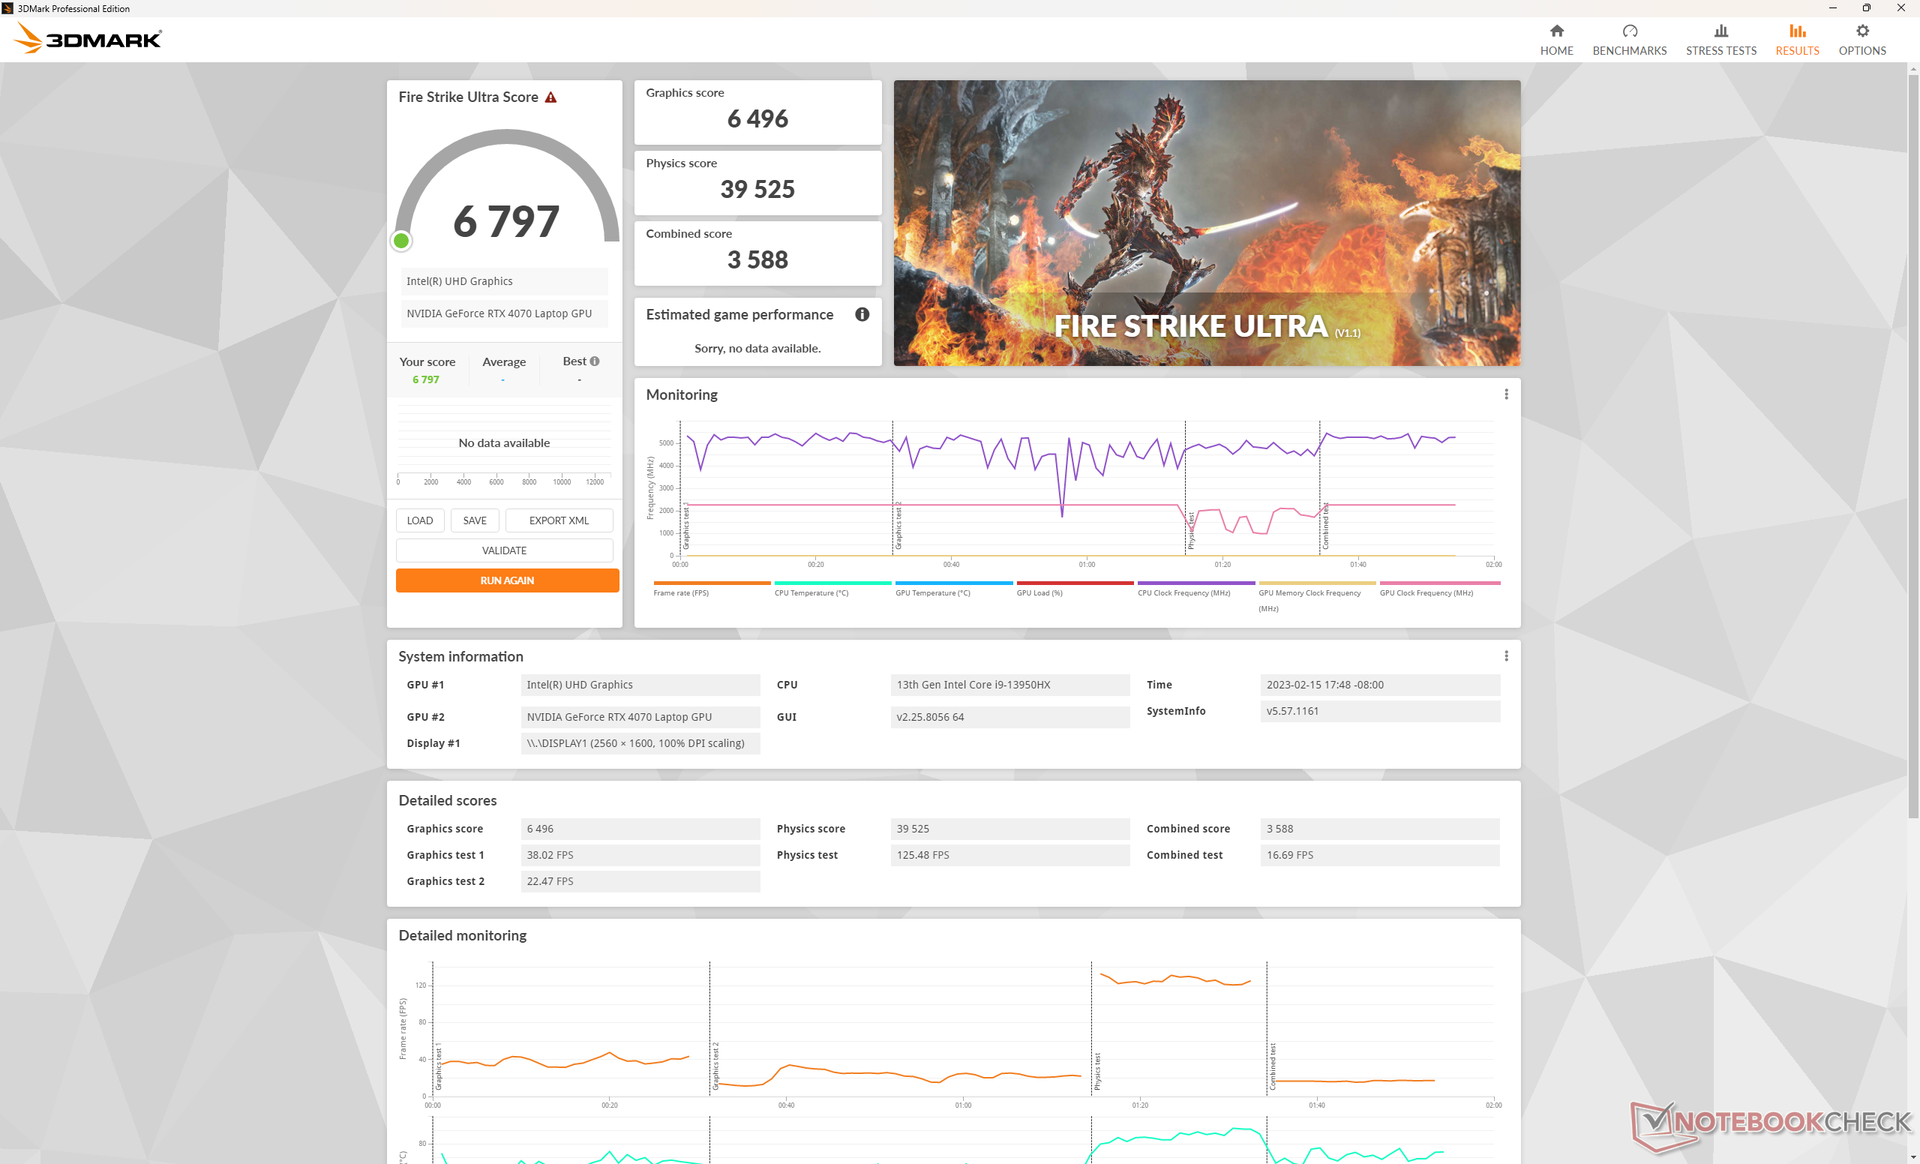
Wydajność układu GPU - podobna wydajność jak w przypadku komputera stacjonarnego GeForce RTX 3070
140 Wmobilna GeForce RTX 4070 plasuje się wygodnie pomiędzy mobilnym RTX 3080 amobilnym RTX 3080 Ti pod względem surowej wydajności. Jest tylko o 10 do 20 procent szybsza od wychodzącego z rynku mobilny RTX 3070co jednak jest nieco rozczarowujące, jeśli weźmiemy pod uwagę, że mobilny RTX 4080 jest o 40 do 50 procent szybszy od mobilny RTX 3080. Oznacza to, że różnica w wydajności między mobilnym RTX 4070 i mobilnym RTX 4080 jest bardziej znacząca w 40 do 60 procent.
W porównaniu do procesorów graficznych dla komputerów stacjonarnych, mobilny RTX 4070 jest o około 5 do 10 procent wolniejszy od desktopowego RTX 3070 który pojawił się na rynku trzy lata temu.
Dużą zaletą procesorów graficznych GeForce 40 jest ich obsługa generowania klatek lub DLSS 3. Niestety, nasz egzemplarz testowy Blade 18 RTX 4070 wykazywał problemy podczas uruchamiania obsługiwanych gier z włączonym DLSS 3 na zewnętrznym monitorze HDMI lub USB-C 4K. Liczba klatek na sekundę spadała do poziomu <30 FPS we wszystkich testowanych tytułach bez żadnego powodu, podczas gdy Blade 16 RTX 4080 nie miał takich problemów. Co dziwne, gra DLSS 3 działała doskonale na wewnętrznym monitorze Blade 18. Skontaktowaliśmy się z Razerem w celu znalezienia potencjalnego rozwiązania i zaktualizujemy tę sekcję, gdy będzie to możliwe. Na razie jednak będziesz chciał grać w gry na wewnętrznym wyświetlaczu, jeśli DLSS 3 jest włączone.
Dodatkowe gry zostaną poddane testom porównawczym w nadchodzących dniach.
| 3DMark Performance rating - Percent | |
| KFA2 GeForce RTX 4080 SG | |
| KFA2 GeForce RTX 4070 Ti SG | |
| MSI Titan GT77 HX 13VI | |
| Razer Blade 16 Early 2023 | |
| MSI GeForce RTX 3070 Gaming X Trio -1! | |
| Alienware m17 R5 (R9 6900HX, RX 6850M XT) -3! | |
| Razer Blade 17 Early 2022 -1! | |
| Alienware x17 RTX 3080 P48E -1! | |
| Przeciętny NVIDIA GeForce RTX 4070 Laptop GPU | |
| Razer Blade 18 RTX 4070 | |
| MSI Pulse GL76 12UGK | |
| Gigabyte G7 KE | |
| MSI GL75 10SFR -1! | |
| 3DMark 11 - 1280x720 Performance GPU | |
| KFA2 GeForce RTX 4080 SG | |
| KFA2 GeForce RTX 4070 Ti SG | |
| MSI Titan GT77 HX 13VI | |
| Razer Blade 16 Early 2023 | |
| Razer Blade 17 Early 2022 | |
| Alienware x17 RTX 3080 P48E | |
| Alienware m17 R5 (R9 6900HX, RX 6850M XT) | |
| MSI GeForce RTX 3070 Gaming X Trio | |
| Przeciętny NVIDIA GeForce RTX 4070 Laptop GPU (24229 - 46434, n=67) | |
| Razer Blade 18 RTX 4070 | |
| MSI Pulse GL76 12UGK | |
| Gigabyte G7 KE | |
| MSI GL75 10SFR | |
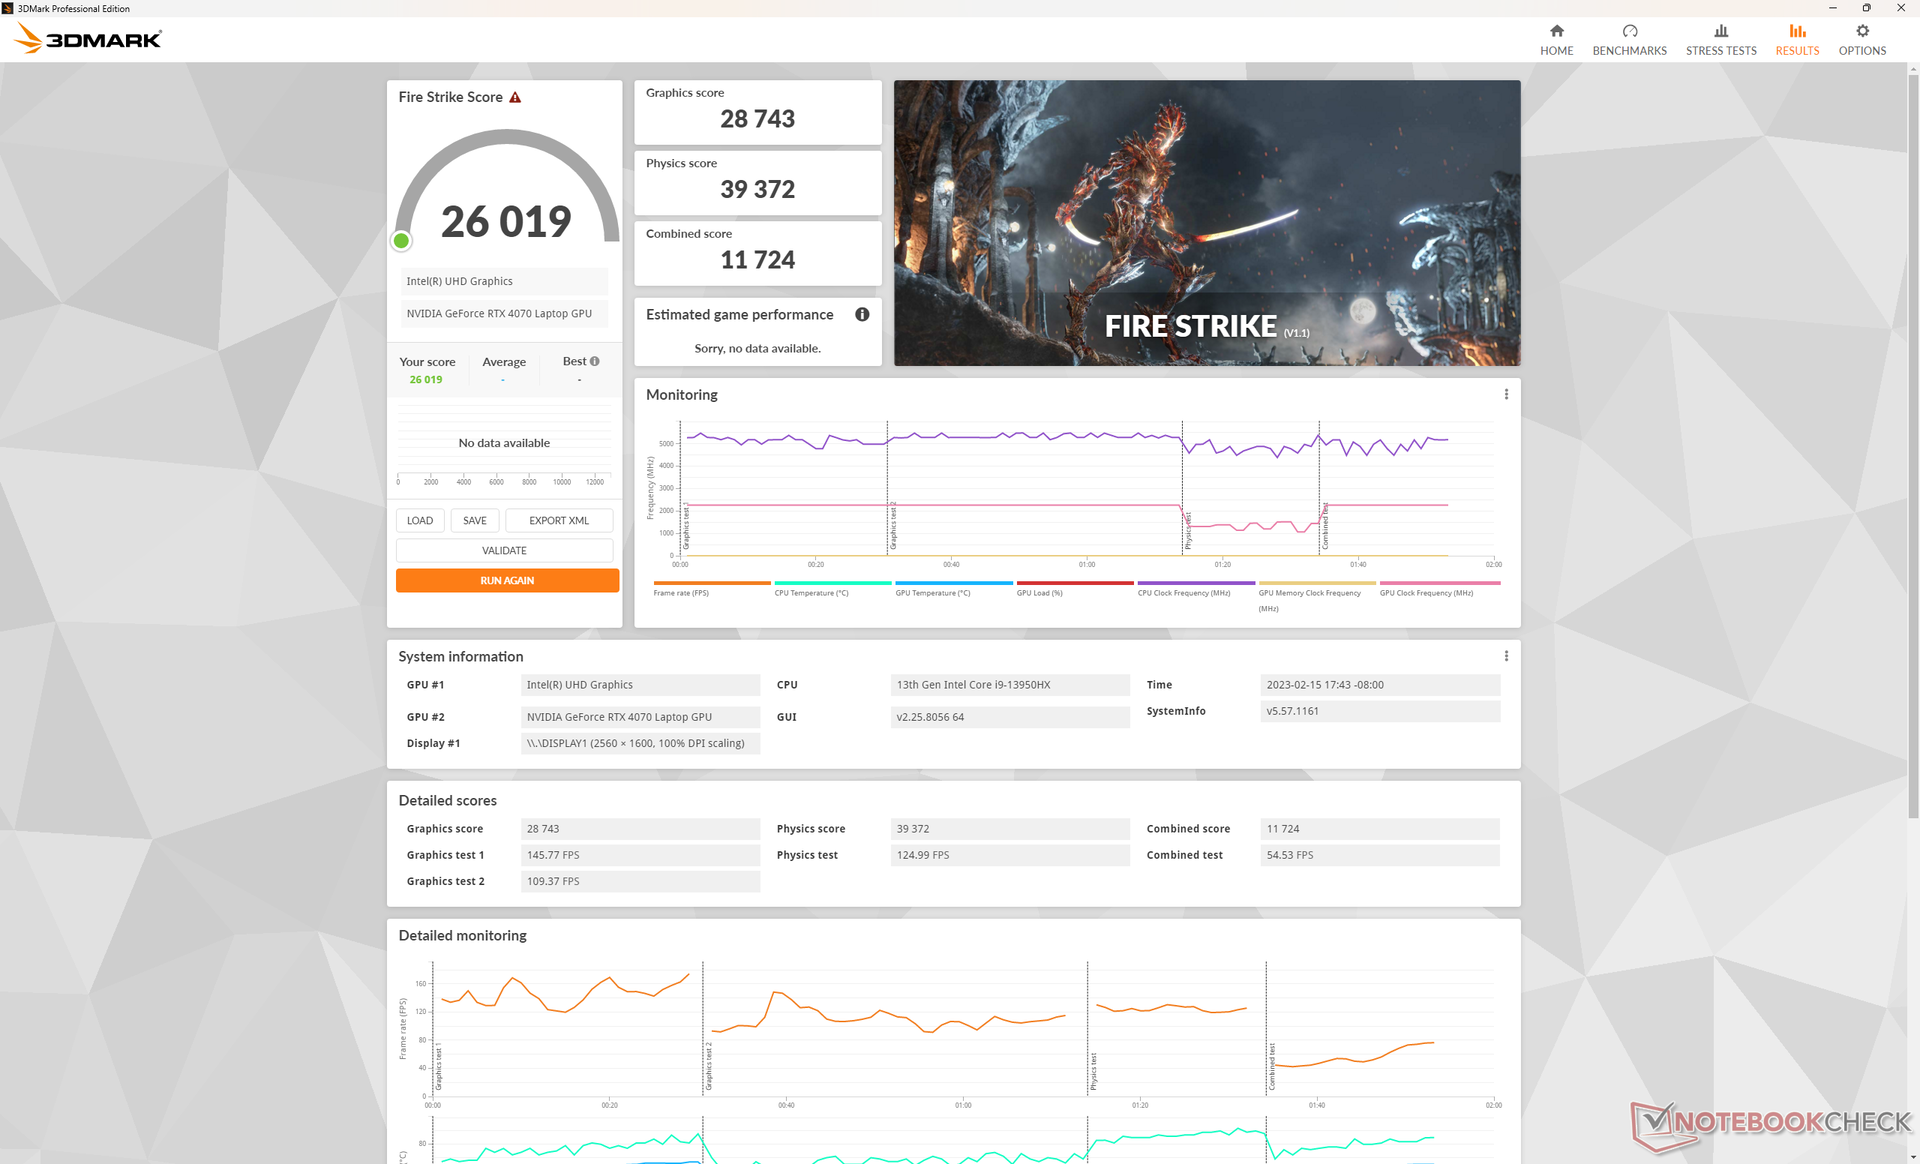
| 3DMark 11 Performance | 34754 pkt. | |
| 3DMark Fire Strike Score | 26019 pkt. | |
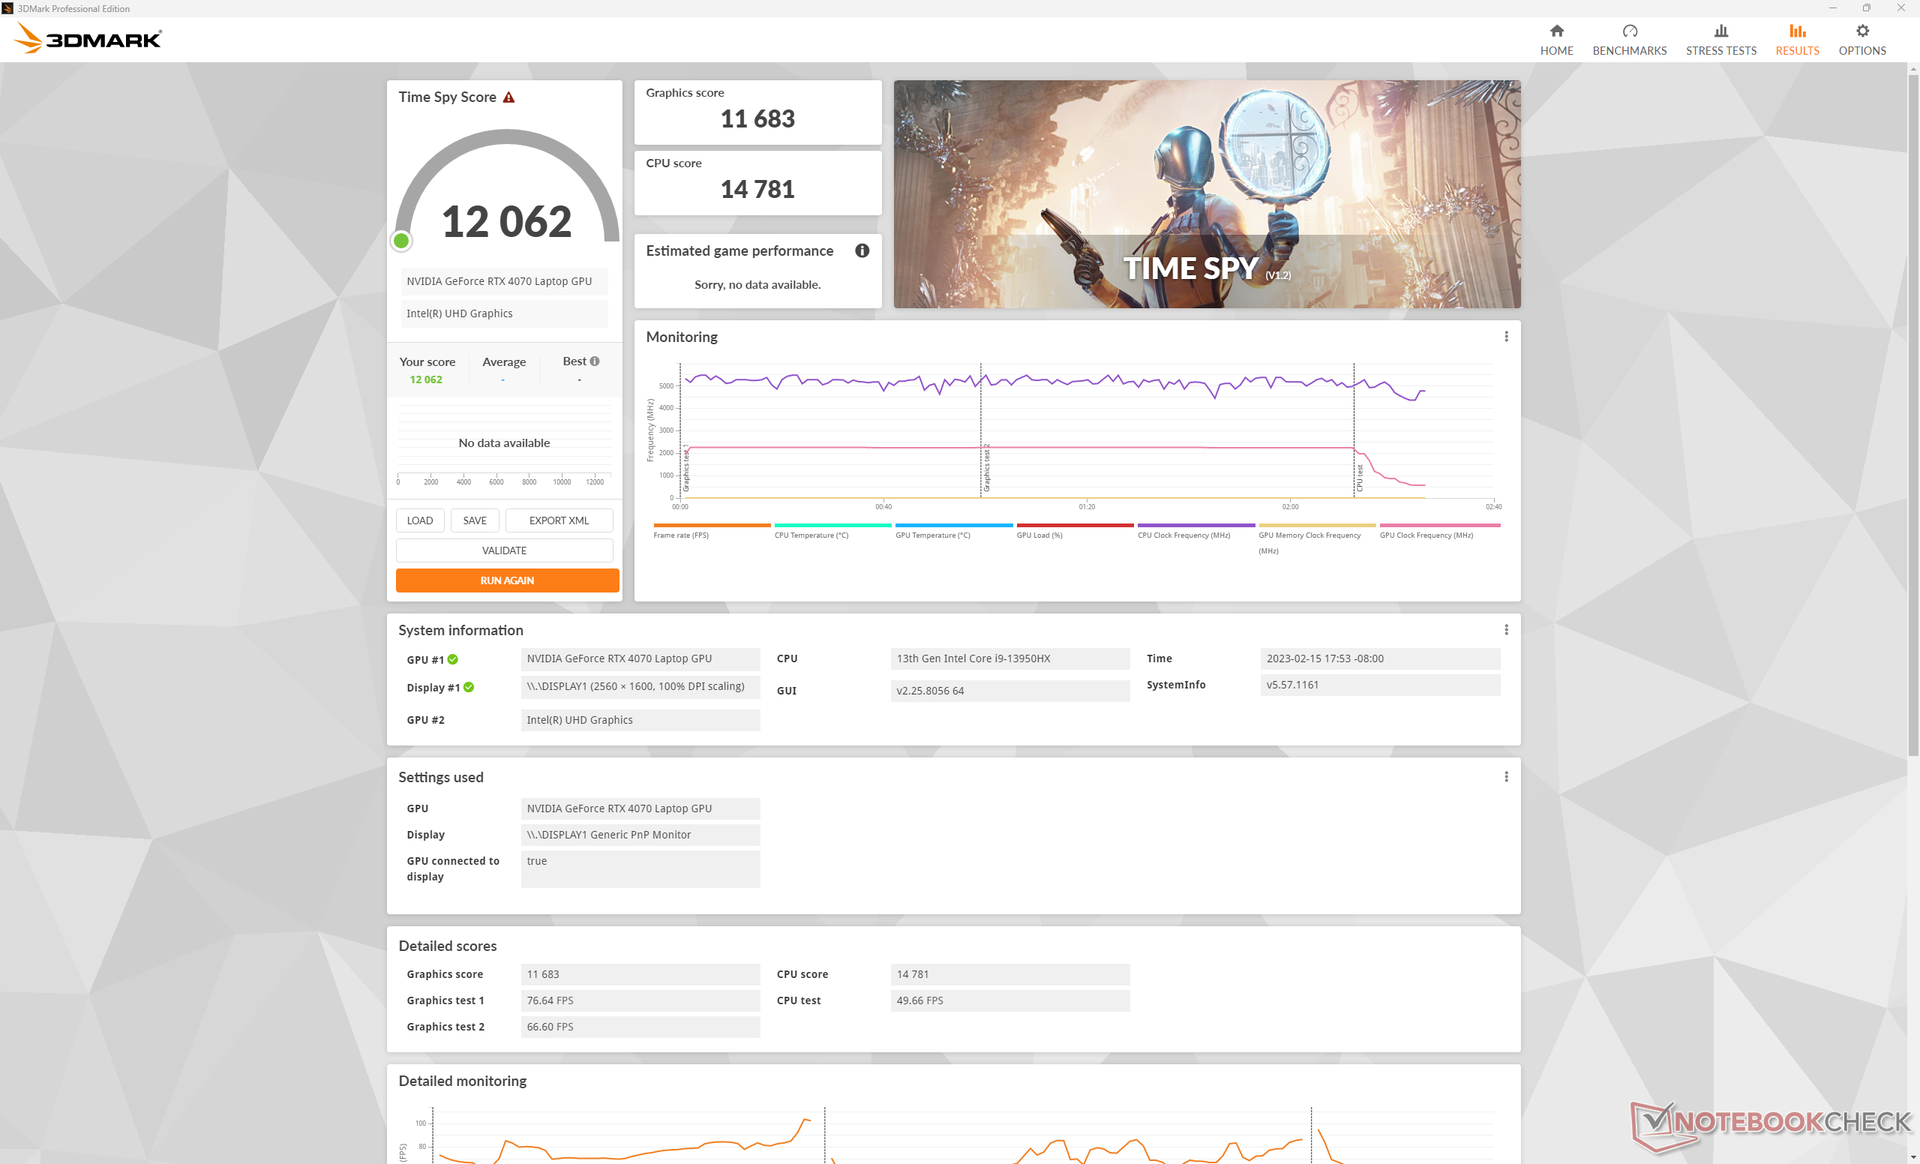
| 3DMark Time Spy Score | 12062 pkt. | |
Pomoc | ||
* ... im mniej tym lepiej
Praca na biegu jałowym Witcher 3 przez godzinę przywróci stabilną liczbę klatek na sekundę bez powtarzających się spadków wydajności, co sugeruje brak przerywania pracy aplikacji w tle lub poważnego dławienia.
Witcher 3 FPS Chart
| low | med. | high | ultra | QHD | 4K | |
|---|---|---|---|---|---|---|
| GTA V (2015) | 186.1 | 184.7 | 181.6 | 121.4 | 87.6 | 88.5 |
| The Witcher 3 (2015) | 617 | 405.9 | 240.9 | 113.9 | 72.5 | |
| Dota 2 Reborn (2015) | 225 | 200 | 191 | 178.6 | 145.5 | |
| Final Fantasy XV Benchmark (2018) | 231 | 166.9 | 115.2 | 82 | 46.6 | |
| X-Plane 11.11 (2018) | 203 | 178.9 | 137.9 | 117.7 | ||
| Strange Brigade (2018) | 464 | 315 | 243 | 208 | 136.7 | 71.9 |
| Metro Exodus (2019) | 208.9 | 139.8 | 109.7 | 86.8 | 69 | 44 |
| Borderlands 3 (2019) | 258.5 | 200.1 | 131.8 | 100.3 | 68.7 | 35.7 |
| Hitman 3 (2021) | 294.3 | 234 | 208.4 | 197.4 | 129.9 | 68.5 |
| Cyberpunk 2077 1.6 (2022) | 147.8 | 125.7 | 111.5 | 92.1 | 54 | 23.3 |
Emisje
Hałas systemu - cicho, gdy nie grasz
Wewnętrzne wentylatory są ciche podczas pracy przy niewymagających obciążeniach, takich jak strumieniowe przesyłanie wideo czy przeglądanie stron internetowych. Szum wentylatorów wynosi zazwyczaj nieco poniżej 27 dB(A) na tle cichego tła 23,5 dB(A) i jest praktycznie niesłyszalny w większości warunków. Jest to ciszej niż można było się spodziewać, biorąc pod uwagę rozmiar i moc drzemiącą w drewnie.
Przy większych obciążeniach, takich jak gry, obroty wentylatora wzrastają powoli, ale stale, zanim ustabilizują się na poziomie 48 dB(A). Przy 100-procentowym obciążeniu hałas wentylatora może osiągnąć nawet 54 dB(A). Niski poziom 50 dB(A) jest typowy dla większości laptopów do gier, m.in GT77 czy Blade 17 firmy Razer. Blade 18 jest w grach mniej więcej tak samo głośny jak jego mniejsze rodzeństwo, mimo różnic w wielkości.
Hałas
| luz |
| 23.8 / 23.8 / 26.8 dB |
| obciążenie |
| 37.3 / 53.5 dB |
 | ||
30 dB cichy 40 dB(A) słyszalny 50 dB(A) irytujący |
||
min: | ||
| Razer Blade 18 RTX 4070 GeForce RTX 4070 Laptop GPU, i9-13950HX, SSSTC CA6-8D1024 | Razer Blade 17 Early 2022 GeForce RTX 3080 Ti Laptop GPU, i9-12900H, Samsung PM9A1 MZVL21T0HCLR | MSI Titan GT77 HX 13VI GeForce RTX 4090 Laptop GPU, i9-13950HX, Samsung PM9A1 MZVL22T0HBLB | Gigabyte G7 KE GeForce RTX 3060 Laptop GPU, i5-12500H, Gigabyte AG470S1TB-SI B10 | Alienware m17 R5 (R9 6900HX, RX 6850M XT) Radeon RX 6850M XT, R9 6900HX, SSSTC CA6-8D1024 | Asus ROG Strix Scar 17 SE G733CX-LL014W GeForce RTX 3080 Ti Laptop GPU, i9-12950HX, Samsung PM9A1 MZVL22T0HBLB | |
|---|---|---|---|---|---|---|
| Noise | -12% | -17% | -26% | 0% | 5% | |
| wyłączone / środowisko * (dB) | 23.5 | 26 -11% | 24.6 -5% | 27 -15% | 23 2% | 23.9 -2% |
| Idle Minimum * (dB) | 23.8 | 26 -9% | 29.2 -23% | 27 -13% | 23 3% | 23.9 -0% |
| Idle Average * (dB) | 23.8 | 27 -13% | 29.2 -23% | 35 -47% | 28.11 -18% | 23.9 -0% |
| Idle Maximum * (dB) | 26.8 | 32 -19% | 29.2 -9% | 38 -42% | 28.11 -5% | 23.9 11% |
| Load Average * (dB) | 37.3 | 50 -34% | 50.7 -36% | 52 -39% | 30.62 18% | 34.3 8% |
| Witcher 3 ultra * (dB) | 48 | 51 -6% | 53.3 -11% | 56 -17% | 49.75 -4% | |
| Load Maximum * (dB) | 53.5 | 51 5% | 61 -14% | 59 -10% | 50.17 6% | 45.9 14% |
* ... im mniej tym lepiej
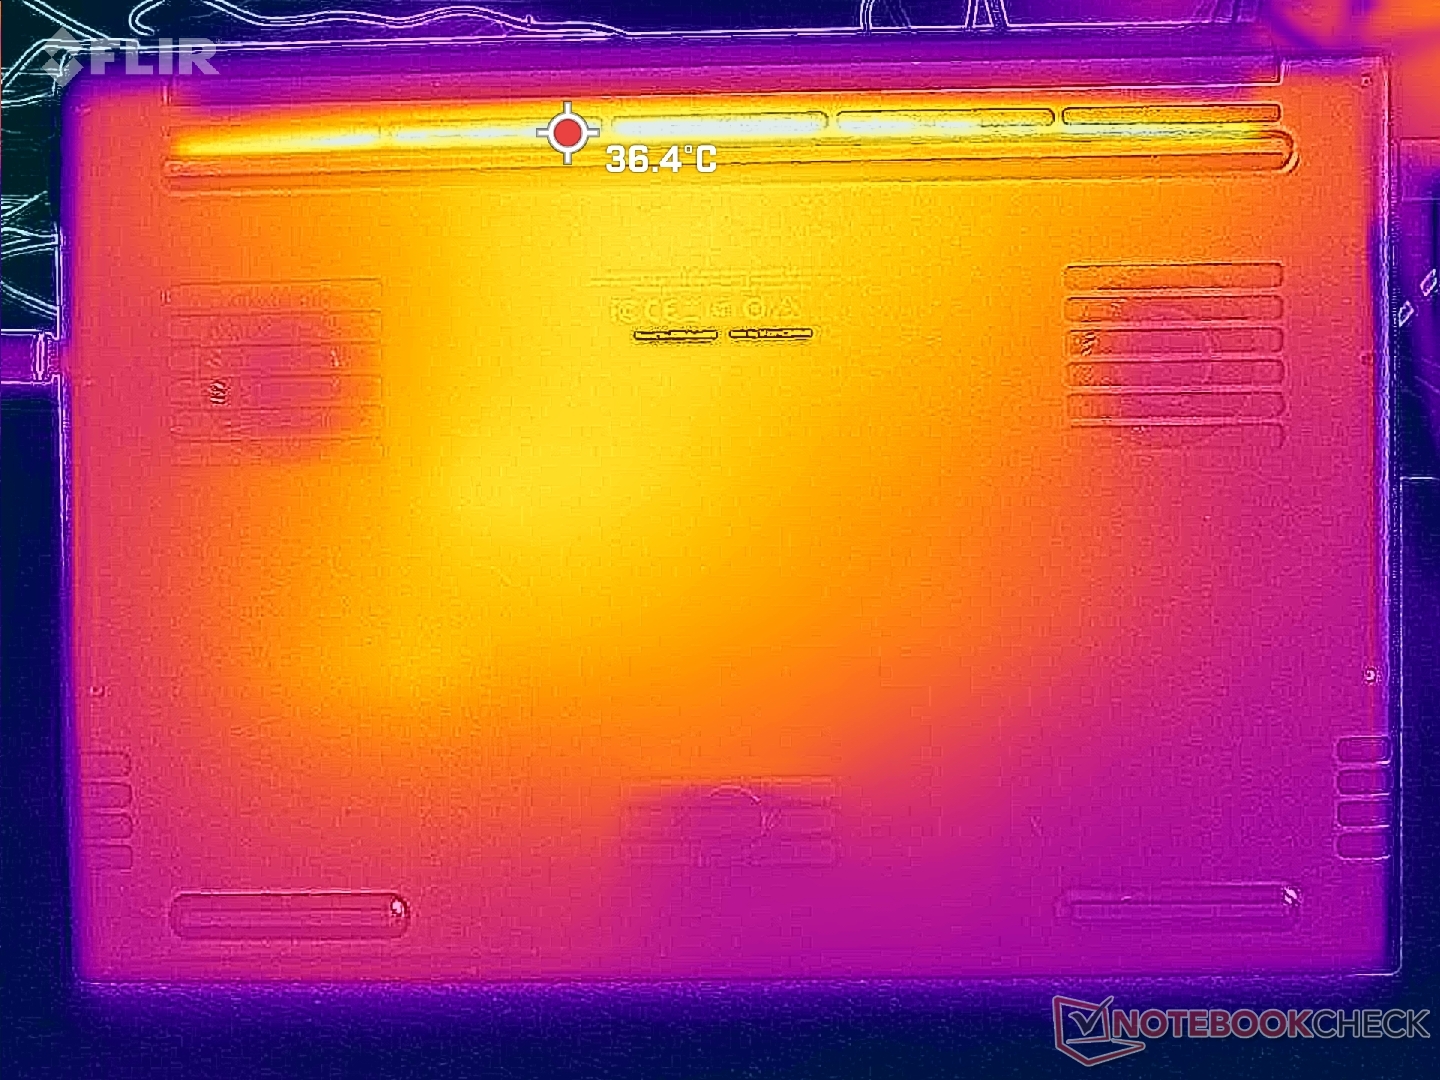
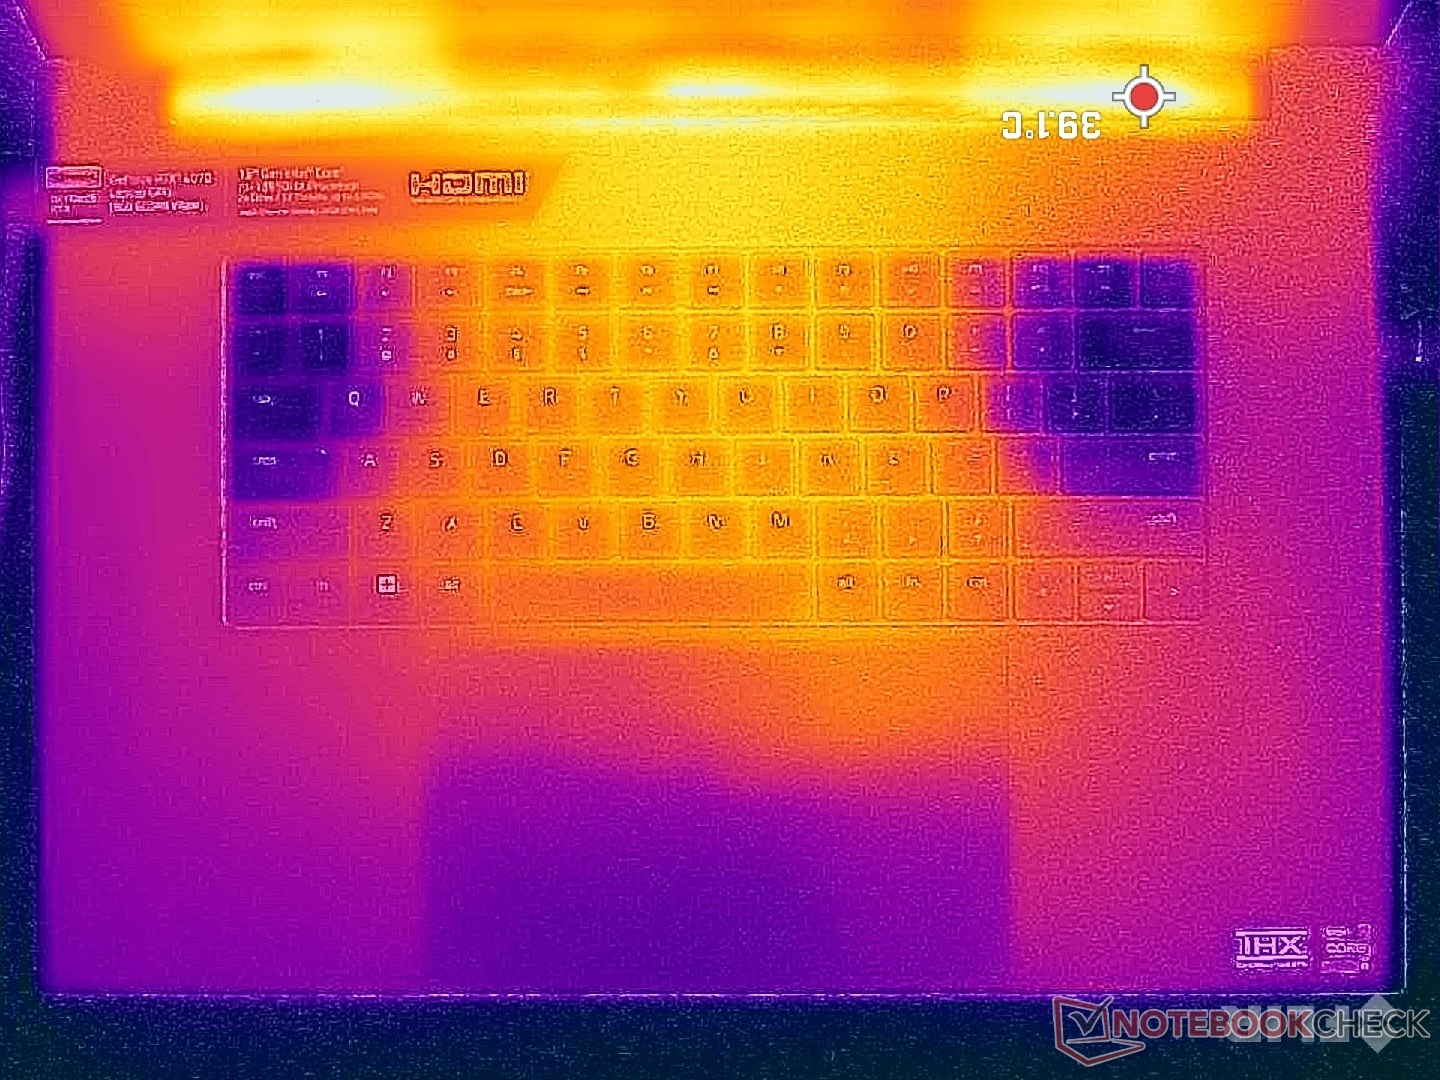
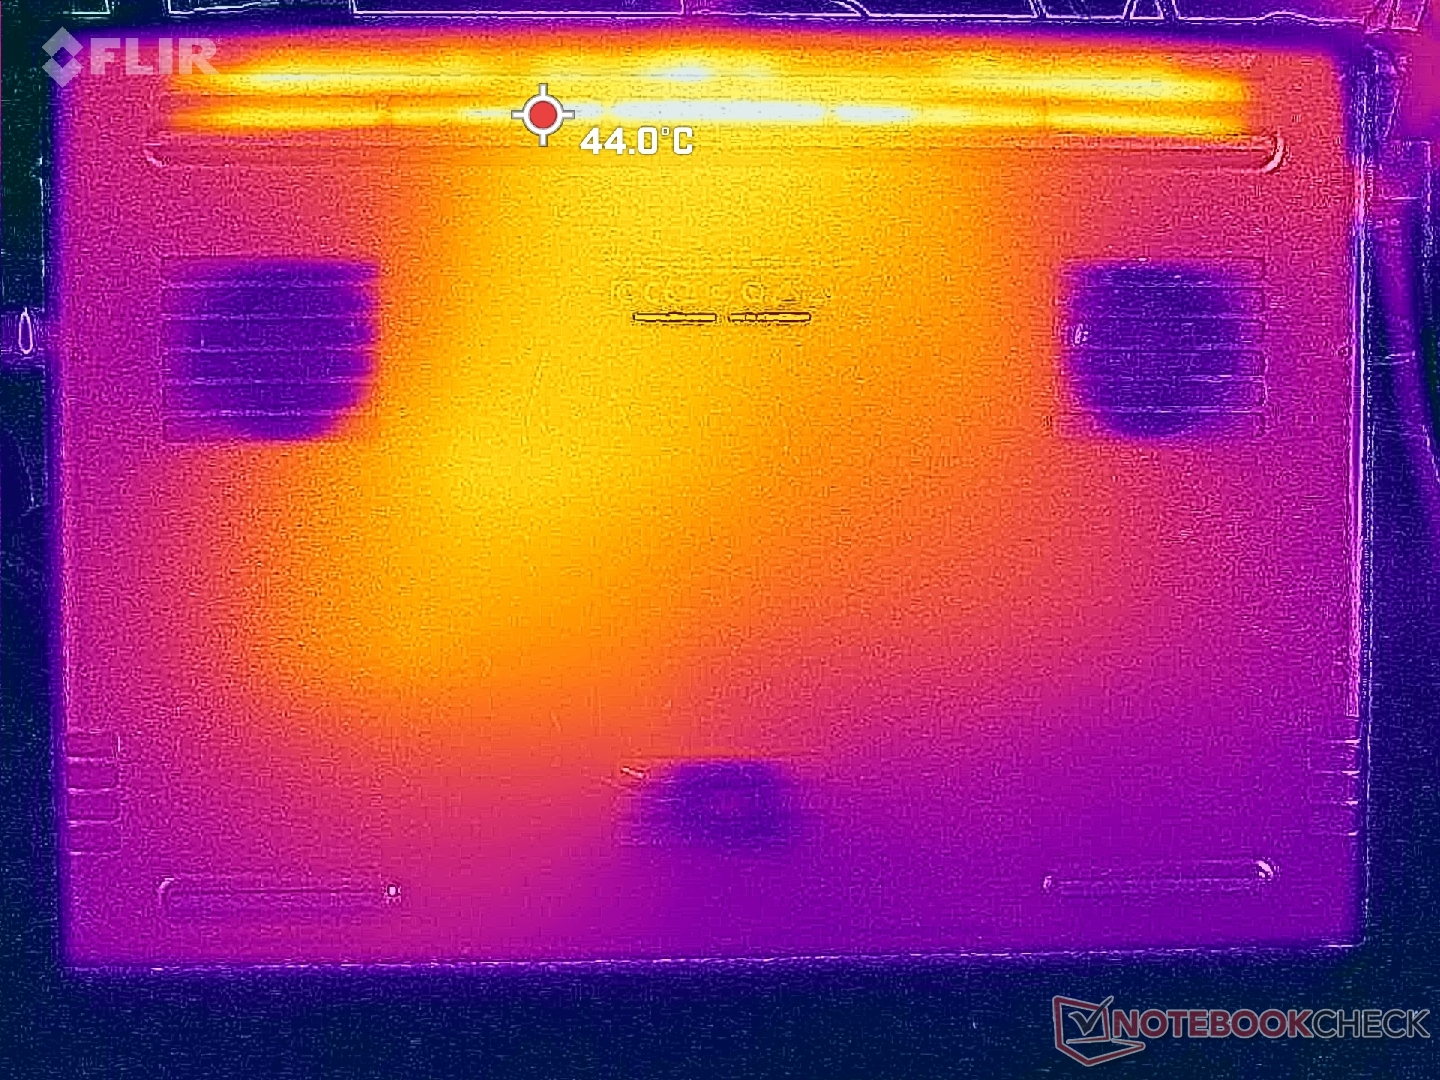
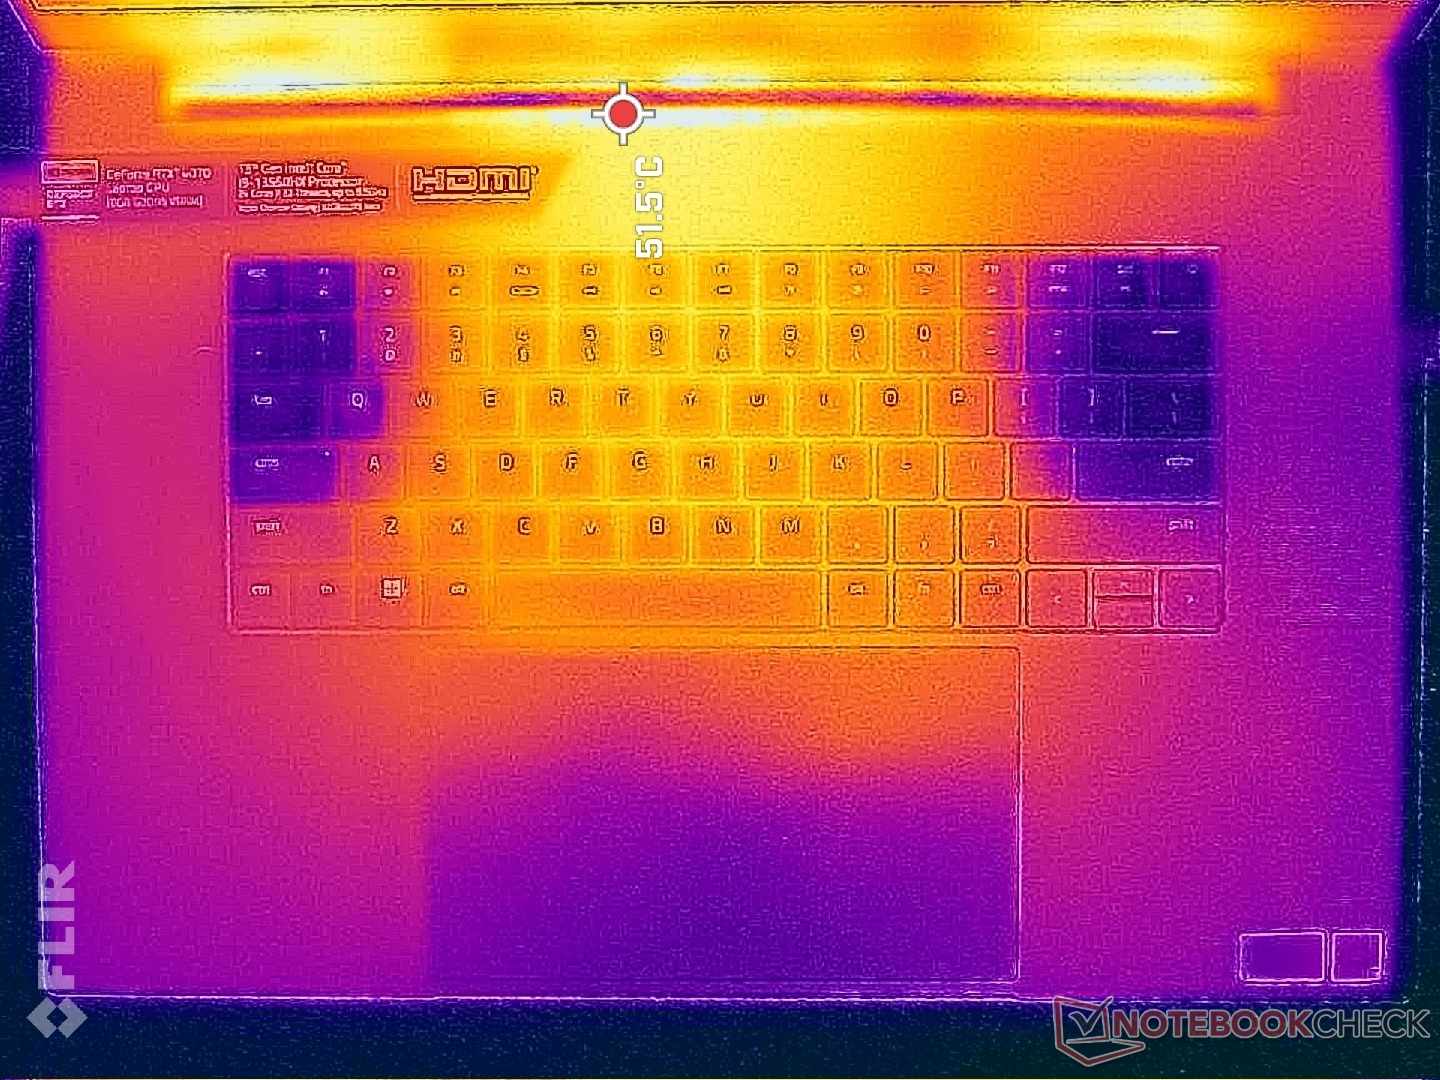
Temperatura
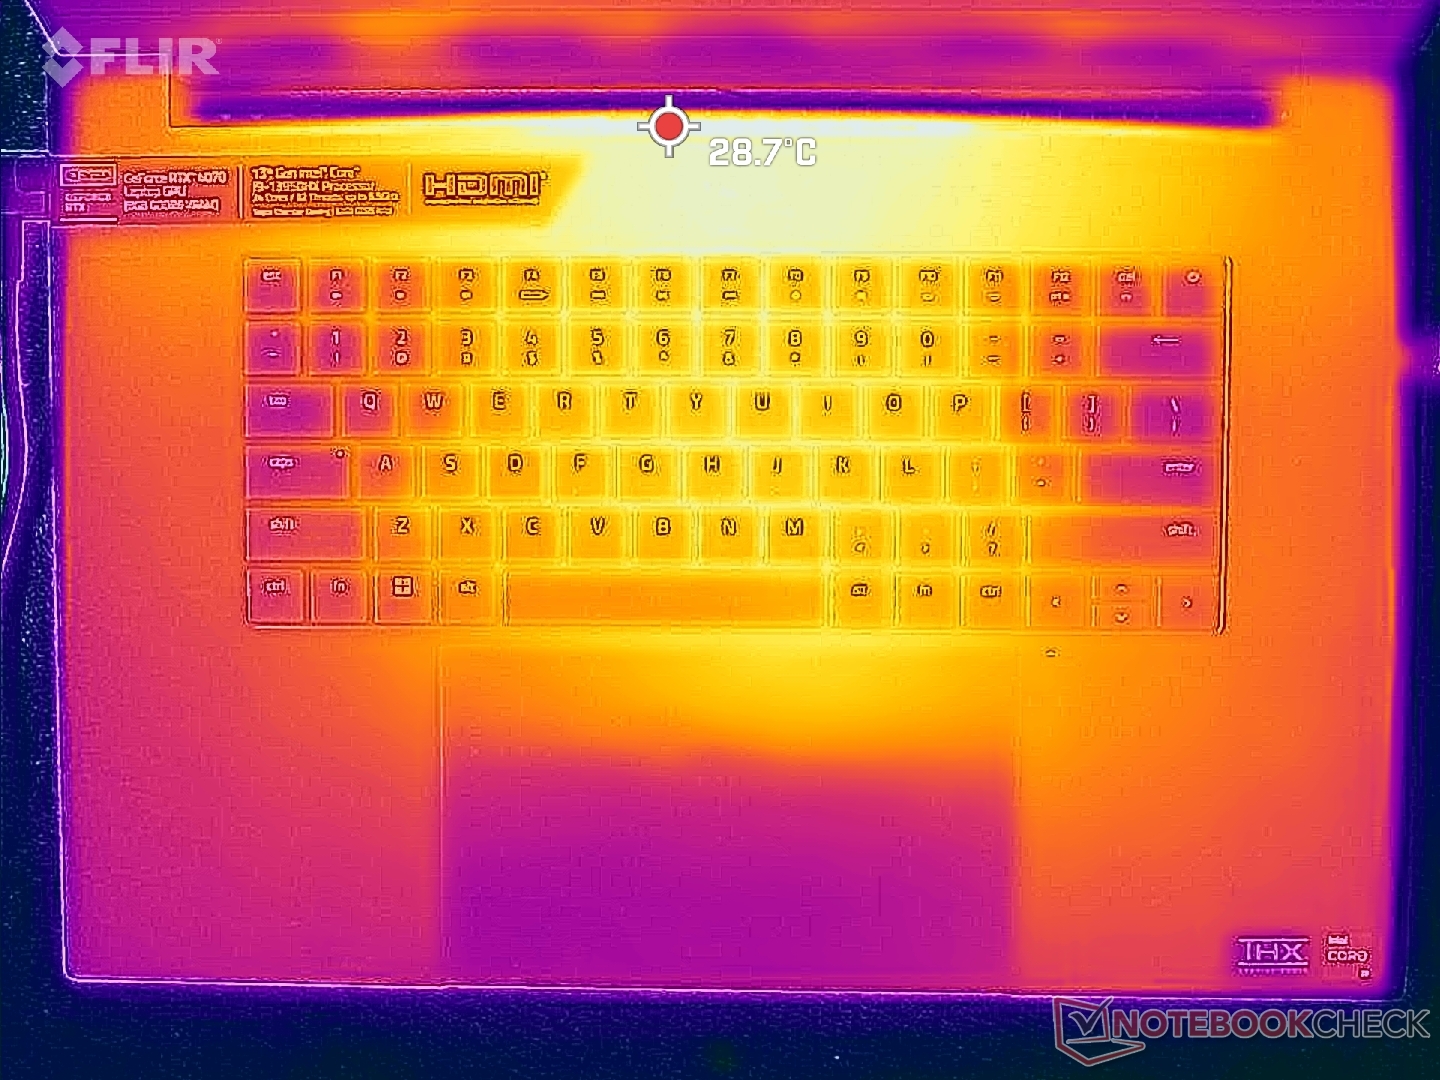
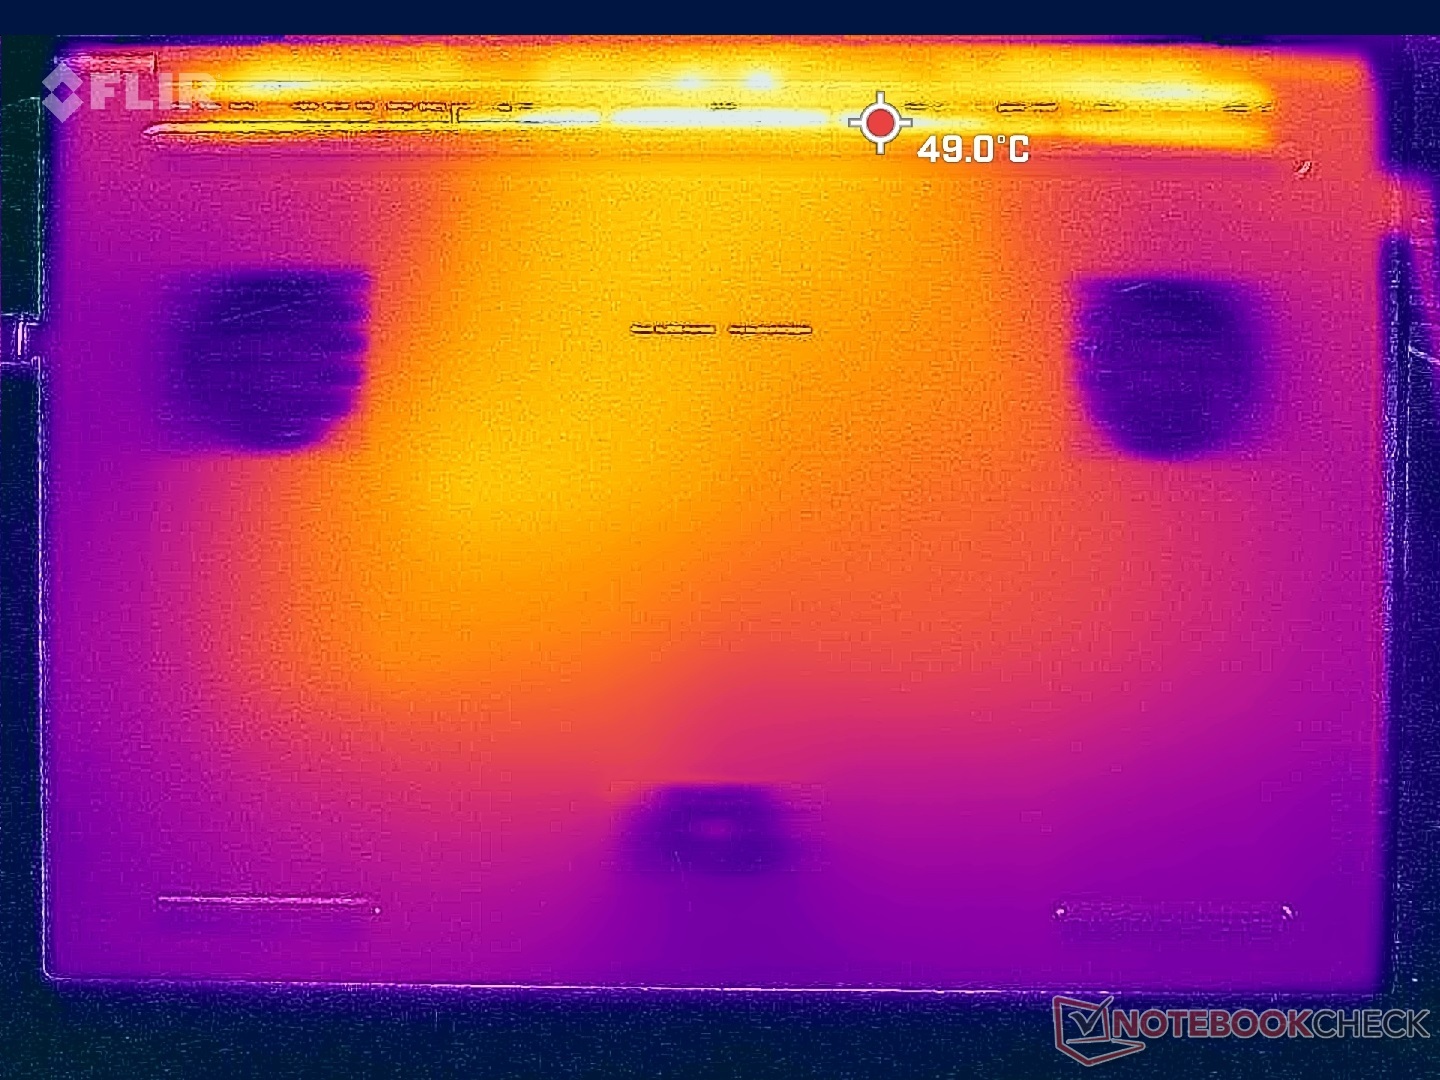
Temperatury powierzchni są stosunkowo chłodne jak na laptop do gier, prawdopodobnie ze względu na duży, 18-calowy współczynnik kształtu, chłodnicę z komorą parową z potrójnymi wentylatorami oraz 140 W GPU TGP. Szybsze konfiguracje RTX 4080 lub 4090 będą prawdopodobnie działać cieplej niż to, co tutaj zanotowaliśmy, ponieważ każda z nich ma wyższy pułap 175 W.
Gorące miejsca podczas pracy Witcher 3 osiągają zaledwie 36 C na górze i 33 C na dole, w porównaniu do 50-57 C w modelu Alienware m17 R5 Alienware m17 R5. Blade 18 z RTX 4070 jest jednym z najchłodniejszych laptopów do gier, jakie testowaliśmy do tej pory, i jest jasne, że obudowa została zbudowana do obsługi potężniejszych opcji niż nasza konfiguracja RTX 4070.
Temperatury powierzchni na biegu jałowym są nieco cieplejsze niż oczekiwaliśmy, ponieważ wentylatory mają tendencję do bezczynności podczas niskiego obciążenia. Blade 18 nigdy nie staje się nieprzyjemny dla skóry, o ile tylna krawędź jest dobrze wentylowana.
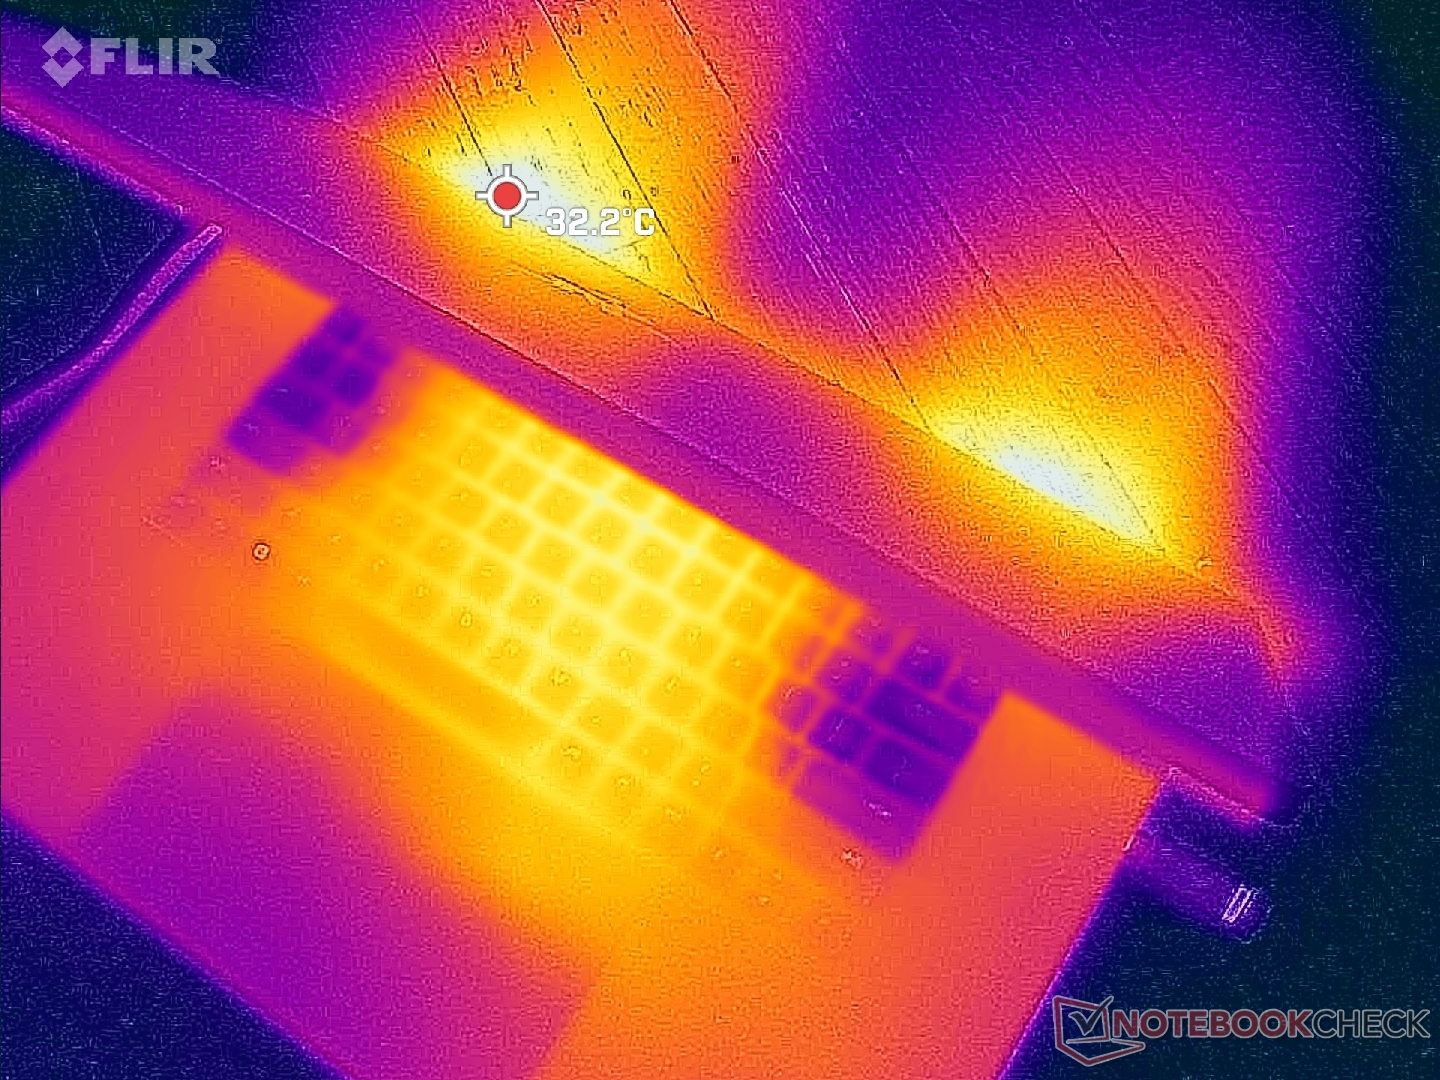
(+) Maksymalna temperatura w górnej części wynosi 39.2 °C / 103 F, w porównaniu do średniej 40.4 °C / 105 F , począwszy od 21.2 do 68.8 °C dla klasy Gaming.
(+) Dno nagrzewa się maksymalnie do 35.6 °C / 96 F, w porównaniu do średniej 43.2 °C / 110 F
(+) W stanie bezczynności średnia temperatura górnej części wynosi 28.1 °C / 83 F, w porównaniu ze średnią temperaturą urządzenia wynoszącą 33.9 °C / ### class_avg_f### F.
(+) Podczas gry w Wiedźmina 3 średnia temperatura górnej części wynosi 28.9 °C / 84 F, w porównaniu do średniej temperatury urządzenia wynoszącej 33.9 °C / ## #class_avg_f### F.
(+) Podpórki pod nadgarstki i touchpad są chłodniejsze niż temperatura skóry i maksymalnie 26 °C / 78.8 F i dlatego są chłodne w dotyku.
(+) Średnia temperatura obszaru podparcia dłoni w podobnych urządzeniach wynosiła 28.8 °C / 83.8 F (+2.8 °C / 5 F).
| Razer Blade 18 RTX 4070 Intel Core i9-13950HX, NVIDIA GeForce RTX 4070 Laptop GPU | Razer Blade 17 Early 2022 Intel Core i9-12900H, NVIDIA GeForce RTX 3080 Ti Laptop GPU | MSI Titan GT77 HX 13VI Intel Core i9-13950HX, NVIDIA GeForce RTX 4090 Laptop GPU | Gigabyte G7 KE Intel Core i5-12500H, NVIDIA GeForce RTX 3060 Laptop GPU | Alienware m17 R5 (R9 6900HX, RX 6850M XT) AMD Ryzen 9 6900HX, AMD Radeon RX 6850M XT | Asus ROG Strix Scar 17 SE G733CX-LL014W Intel Core i9-12950HX, NVIDIA GeForce RTX 3080 Ti Laptop GPU | |
|---|---|---|---|---|---|---|
| Heat | -28% | 2% | -17% | -18% | -18% | |
| Maximum Upper Side * (°C) | 39.2 | 50 -28% | 40.6 -4% | 52 -33% | 53 -35% | 48.8 -24% |
| Maximum Bottom * (°C) | 35.6 | 56 -57% | 41.1 -15% | 54 -52% | 56 -57% | 52.4 -47% |
| Idle Upper Side * (°C) | 31.8 | 36 -13% | 26.2 18% | 28 12% | 30 6% | 30.4 4% |
| Idle Bottom * (°C) | 33.2 | 38 -14% | 30.3 9% | 32 4% | 29 13% | 34.1 -3% |
* ... im mniej tym lepiej
Stress Test
Po uruchomieniu Prime95 w celu obciążenia CPU częstotliwość taktowania i pobór mocy na płycie wzrosły odpowiednio do 3,8 GHz i 140 W, po czym spadły do 3,1 GHz i zakresu 110-120 W około 70 sekund później. Temperatura rdzenia ustabilizowała się na poziomie 87 C w porównaniu z 82 C w Blade 16 wyposażonym w ten sam procesor.
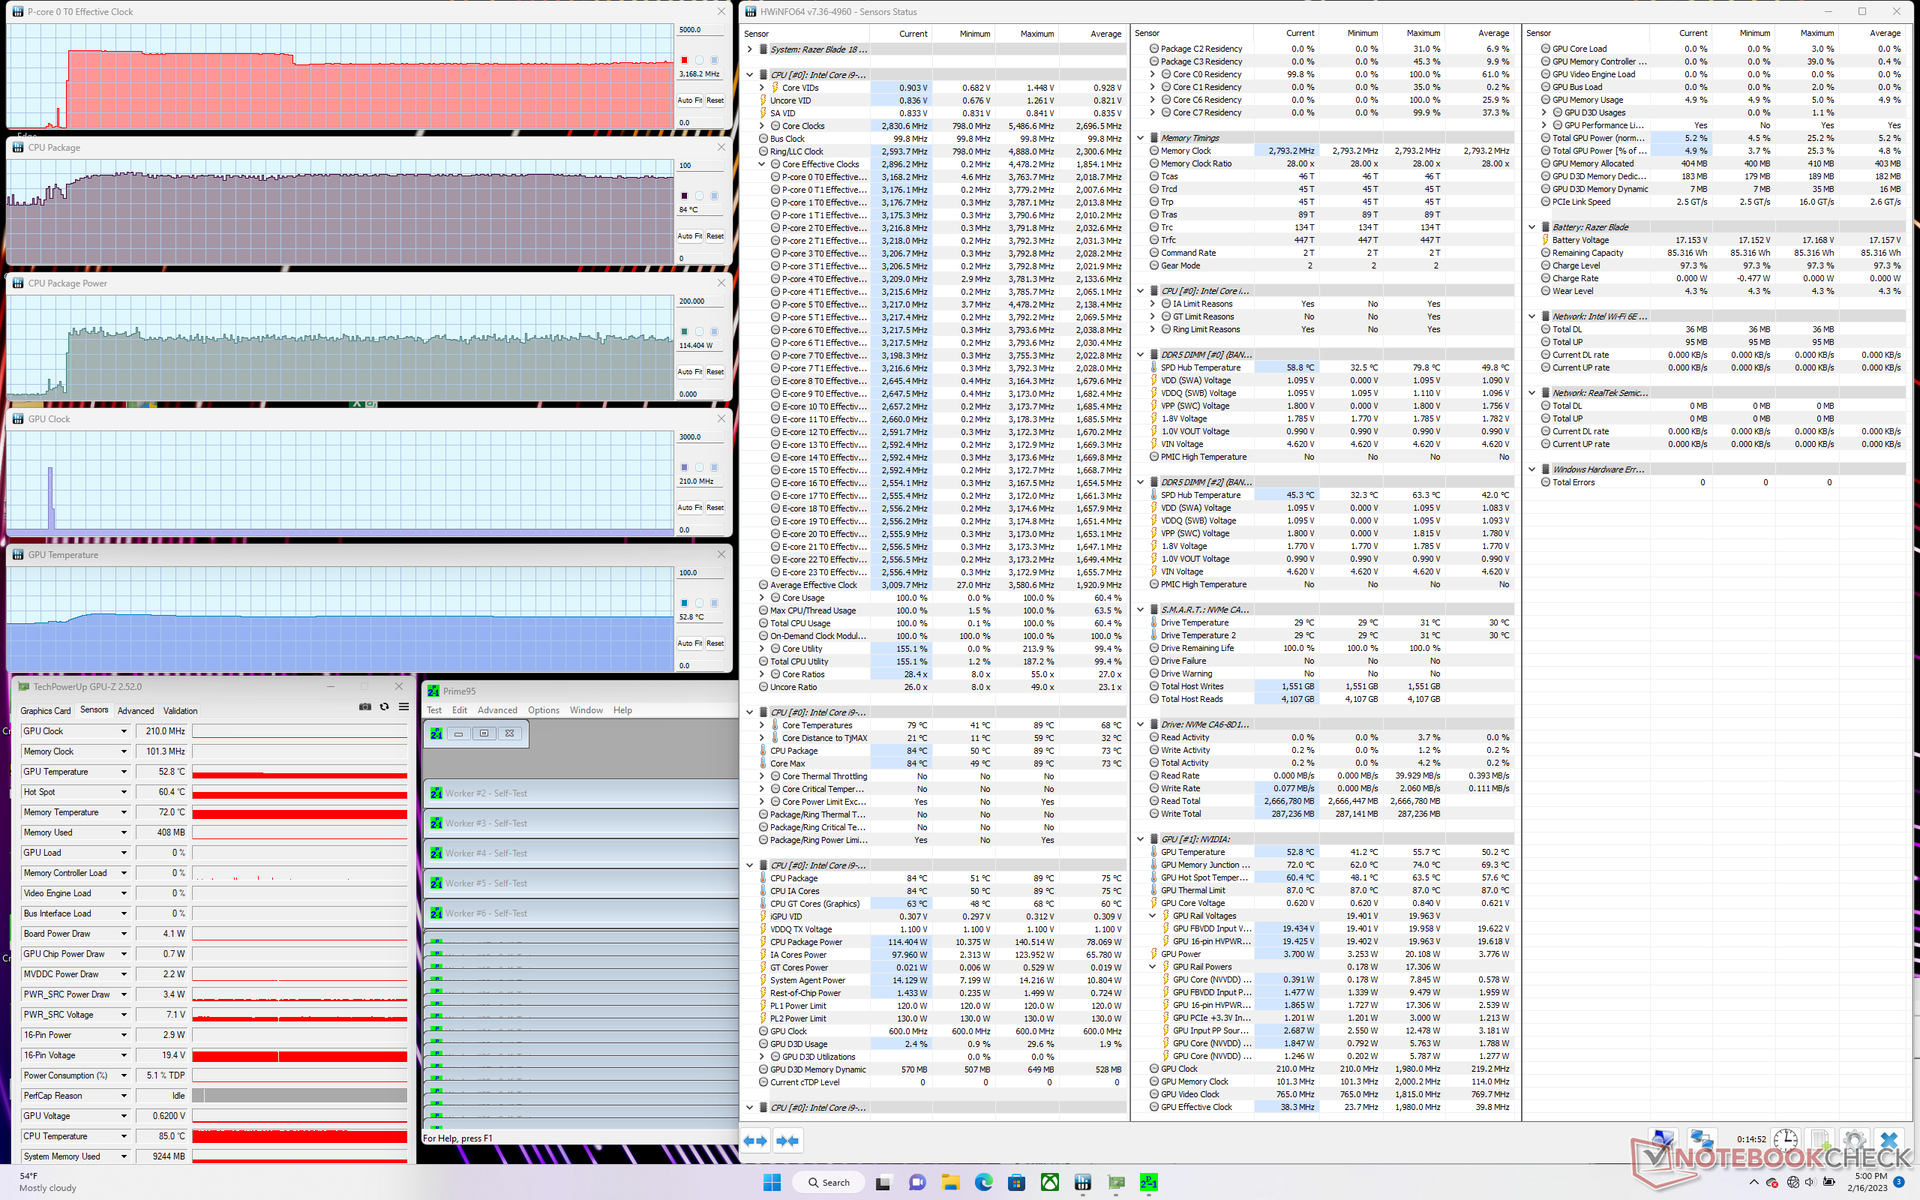
Częstotliwość taktowania GPU, temperatura i pobór mocy na płycie głównej ustabilizowały się odpowiednio na poziomie 2265 MHz, 64 C i 80-90 W podczas pracy Witcher 3. Sam procesor graficzny jest przystosowany do pracy z mocą 140 W, więc pobór mocy w granicach 80 W jest znacznie niższy od oczekiwanego, nawet w trybie Performance. Jesteśmy w stanie osiągnąć szczytowy poziom 100 W dla GPU tylko podczas uruchamiania bardziej wymagającej gry, takiej jak Cyberpunk 2077. Dla porównania, GPU RTX 4080 w Blade 16 ustabilizowałby się na poziomie około 160 W, podczas gdy jego docelowy TGP wynosił 175 W Witcher 3 test.
Praca na zasilaniu akumulatorowym ogranicza wydajność. Test 3DMark 11 na akumulatorze przyniósłby wyniki w dziedzinie fizyki i grafiki na poziomie odpowiednio 10336 i 18043 punktów, w porównaniu do 25874 i 39733 punktów na zasilaniu sieciowym.
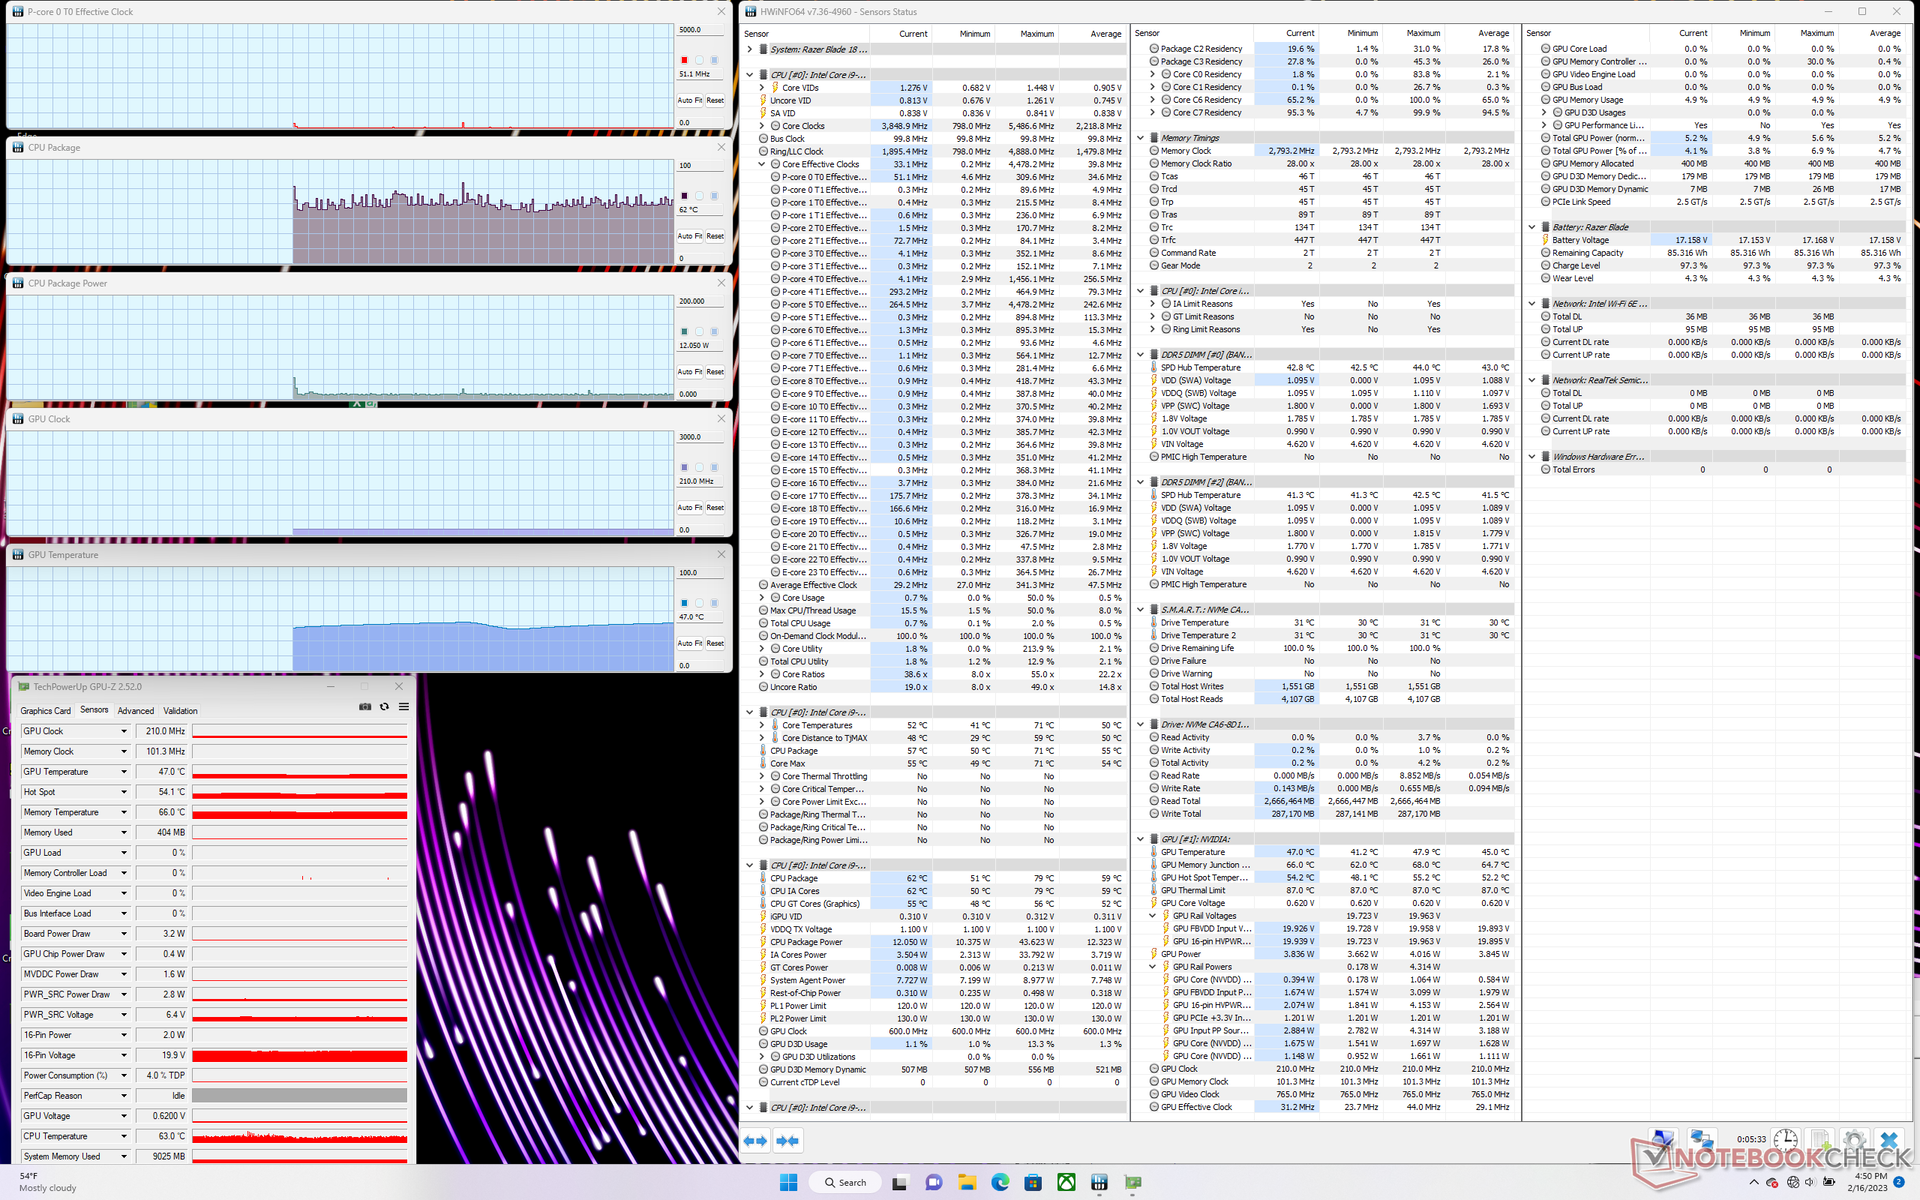
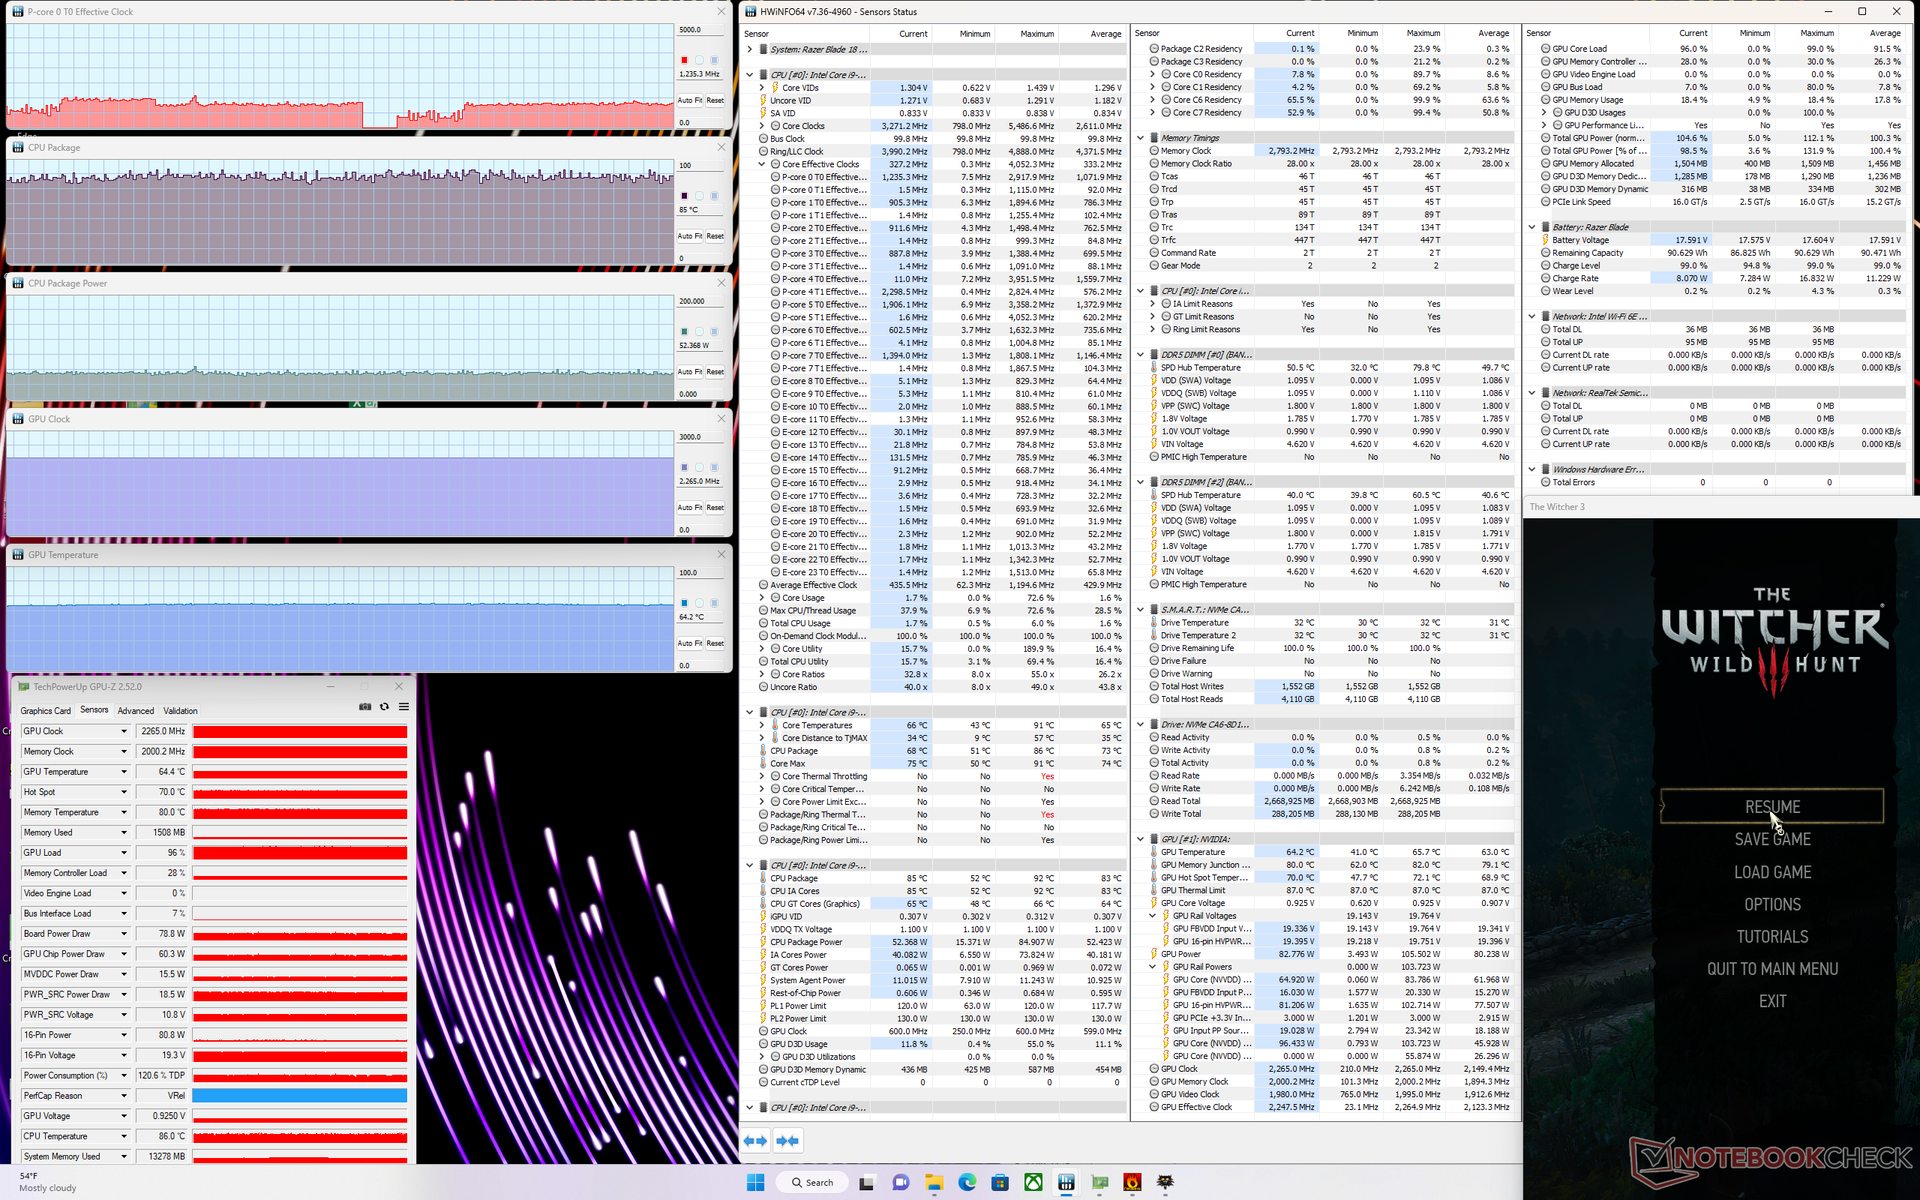
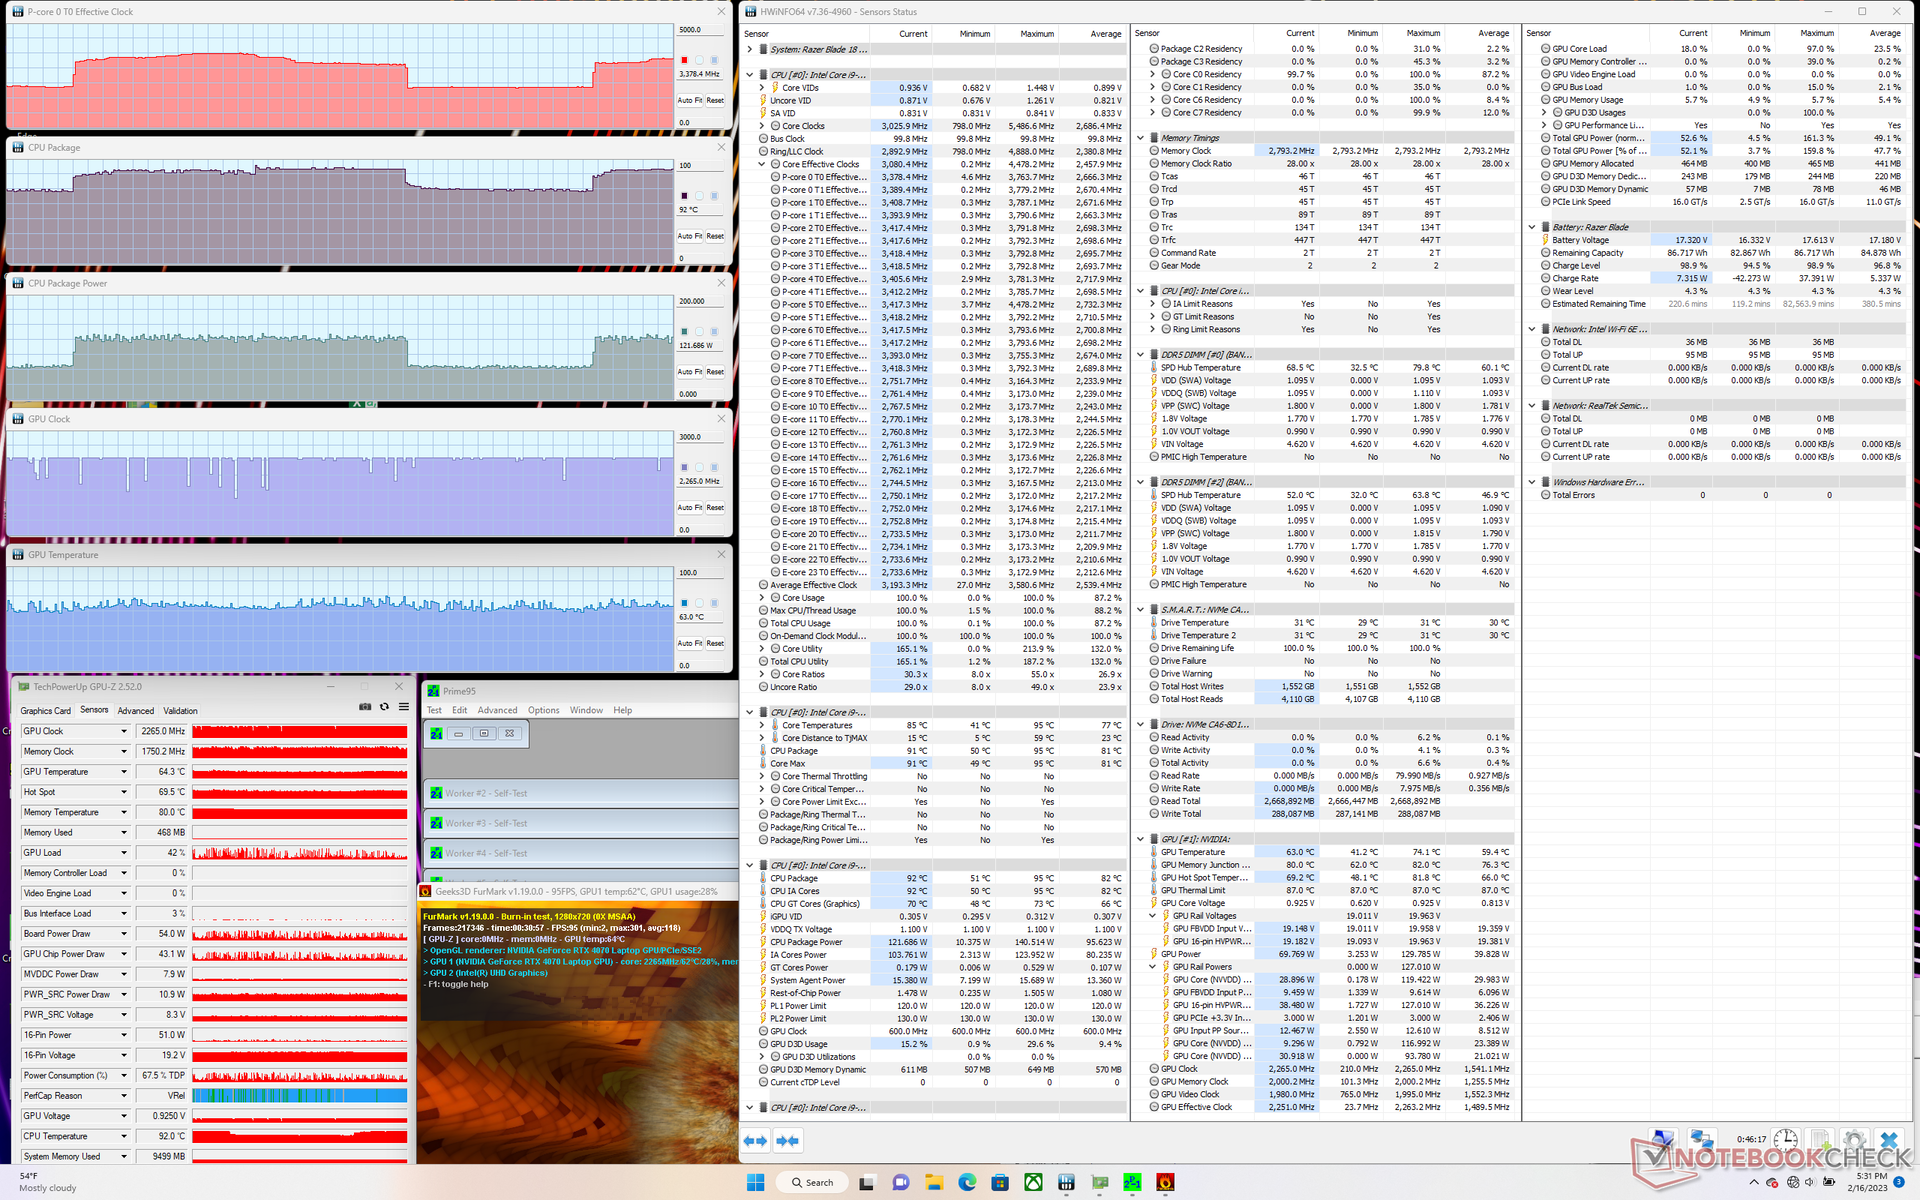
| ZegarCPU (GHz) | Zegar GPU (MHz) | Średnia temperatura CPU (°C) | Średnia temperatura GPU (°C) | |
| System w stanie bezczynności | -- | -- | 62 | 47 |
| Prime95 Stress | 3.2 | -- | 84 | 53 |
| Prime95 + FurMark Stress | 2.0 - 3.7 | 2265 | 70 - 91 | 63 |
| Witcher 3 Stress | ~1,2 | 2265 | 85 | 64 |
Mówcy
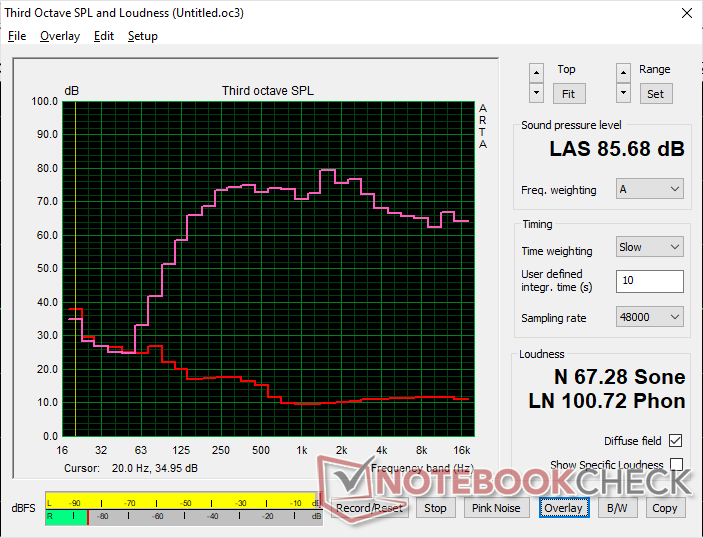
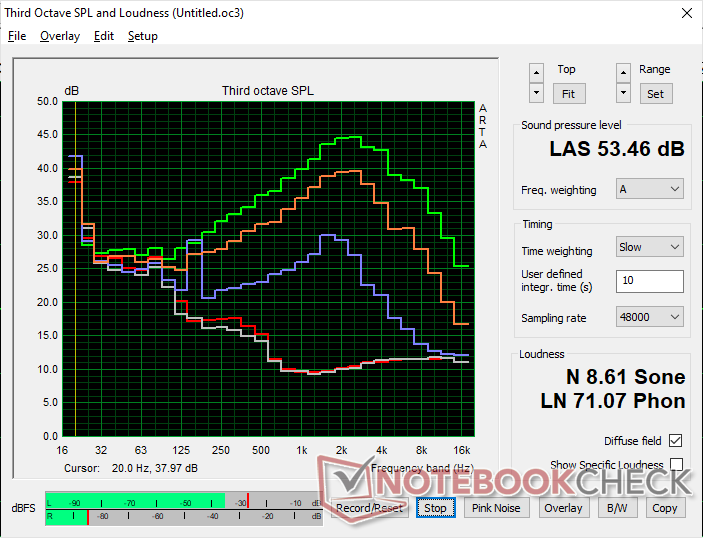
Razer Blade 18 RTX 4070 analiza dźwięku
(+) | głośniki mogą odtwarzać stosunkowo głośno (85.7 dB)
Bas 100 - 315 Hz
(±) | zredukowany bas - średnio 7.5% niższy od mediany
(±) | liniowość basu jest średnia (9.2% delta do poprzedniej częstotliwości)
Średnie 400 - 2000 Hz
(+) | zbalansowane środki średnie - tylko 3.5% od mediany
(+) | średnie są liniowe (4.1% delta do poprzedniej częstotliwości)
Wysokie 2–16 kHz
(+) | zrównoważone maksima - tylko 4.8% od mediany
(+) | wzloty są liniowe (3.8% delta do poprzedniej częstotliwości)
Ogólnie 100 - 16.000 Hz
(+) | ogólny dźwięk jest liniowy (9.2% różnicy w stosunku do mediany)
W porównaniu do tej samej klasy
» 3% wszystkich testowanych urządzeń w tej klasie było lepszych, 1% podobnych, 95% gorszych
» Najlepszy miał deltę 6%, średnia wynosiła ###średnia###%, najgorsza wynosiła 132%
W porównaniu do wszystkich testowanych urządzeń
» 3% wszystkich testowanych urządzeń było lepszych, 1% podobnych, 96% gorszych
» Najlepszy miał deltę 4%, średnia wynosiła ###średnia###%, najgorsza wynosiła 134%
Apple MacBook Pro 16 2021 M1 Pro analiza dźwięku
(+) | głośniki mogą odtwarzać stosunkowo głośno (84.7 dB)
Bas 100 - 315 Hz
(+) | dobry bas - tylko 3.8% od mediany
(+) | bas jest liniowy (5.2% delta do poprzedniej częstotliwości)
Średnie 400 - 2000 Hz
(+) | zbalansowane środki średnie - tylko 1.3% od mediany
(+) | średnie są liniowe (2.1% delta do poprzedniej częstotliwości)
Wysokie 2–16 kHz
(+) | zrównoważone maksima - tylko 1.9% od mediany
(+) | wzloty są liniowe (2.7% delta do poprzedniej częstotliwości)
Ogólnie 100 - 16.000 Hz
(+) | ogólny dźwięk jest liniowy (4.6% różnicy w stosunku do mediany)
W porównaniu do tej samej klasy
» 0% wszystkich testowanych urządzeń w tej klasie było lepszych, 0% podobnych, 100% gorszych
» Najlepszy miał deltę 5%, średnia wynosiła ###średnia###%, najgorsza wynosiła 45%
W porównaniu do wszystkich testowanych urządzeń
» 0% wszystkich testowanych urządzeń było lepszych, 0% podobnych, 100% gorszych
» Najlepszy miał deltę 4%, średnia wynosiła ###średnia###%, najgorsza wynosiła 134%
Zarządzanie energią - duży wyświetlacz, duże zapotrzebowanie na energię
Pobór mocy
Pobór mocy w stanie spoczynku na pulpicie wynosi od 24 do 48 W w zależności od ustawienia jasności i profilu zasilania. W rzeczywistości różnica między minimalnymi a maksymalnymi ustawieniami jasności wynosi aż 10 W. Zakres ten jest zauważalnie wyższy, niż w przypadku większości innych mniejszych laptopów, co może tłumaczyć niespotykane wyniki dotyczące czasu pracy na akumulatorze w następnej sekcji.
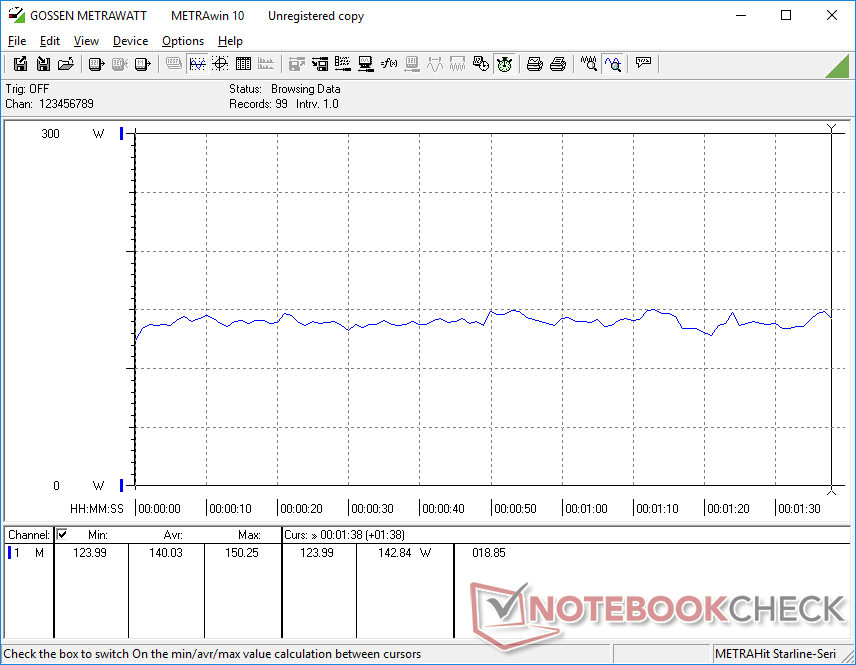
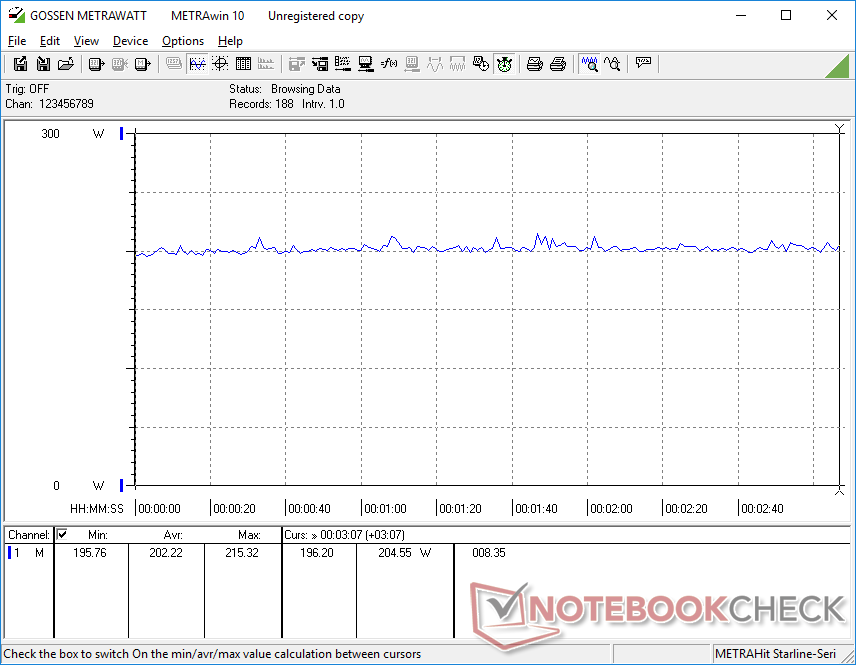
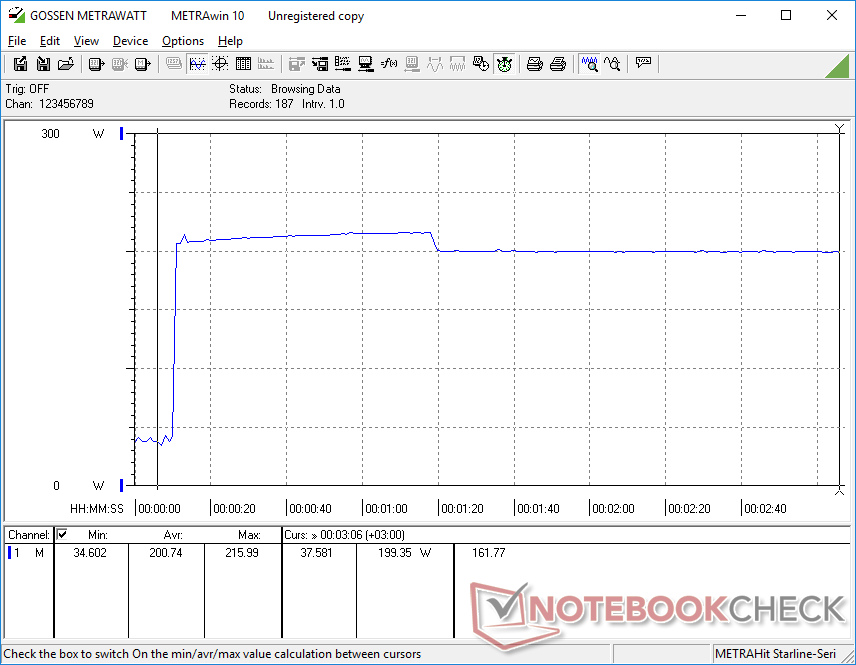
Podczas pracy Witcher 3 w celu odwzorowania typowych obciążeń w grach system wymagałby średnio 202 W w porównaniu z 229 W lub 225 W w Blade 17 napędzanym RTX 3080 Ti- lubAsus ROG Strix Scar 17 SE, odpowiednio. Tak więc nasz 18-calowy system z RTX 4070 pobiera około 10 procent mniej energii, oferując jednocześnie niemal taką samą wydajność graficzną jak mobilny RTX 3080 Ti ostatniej generacji. Aktualizacja do konfiguracji z RTX 4080 lub RTX 4090 będzie prawdopodobnie pobierać około 40 W do 50 W więcej mocy, podobnie jak to zaobserwowaliśmy na Blade 16.
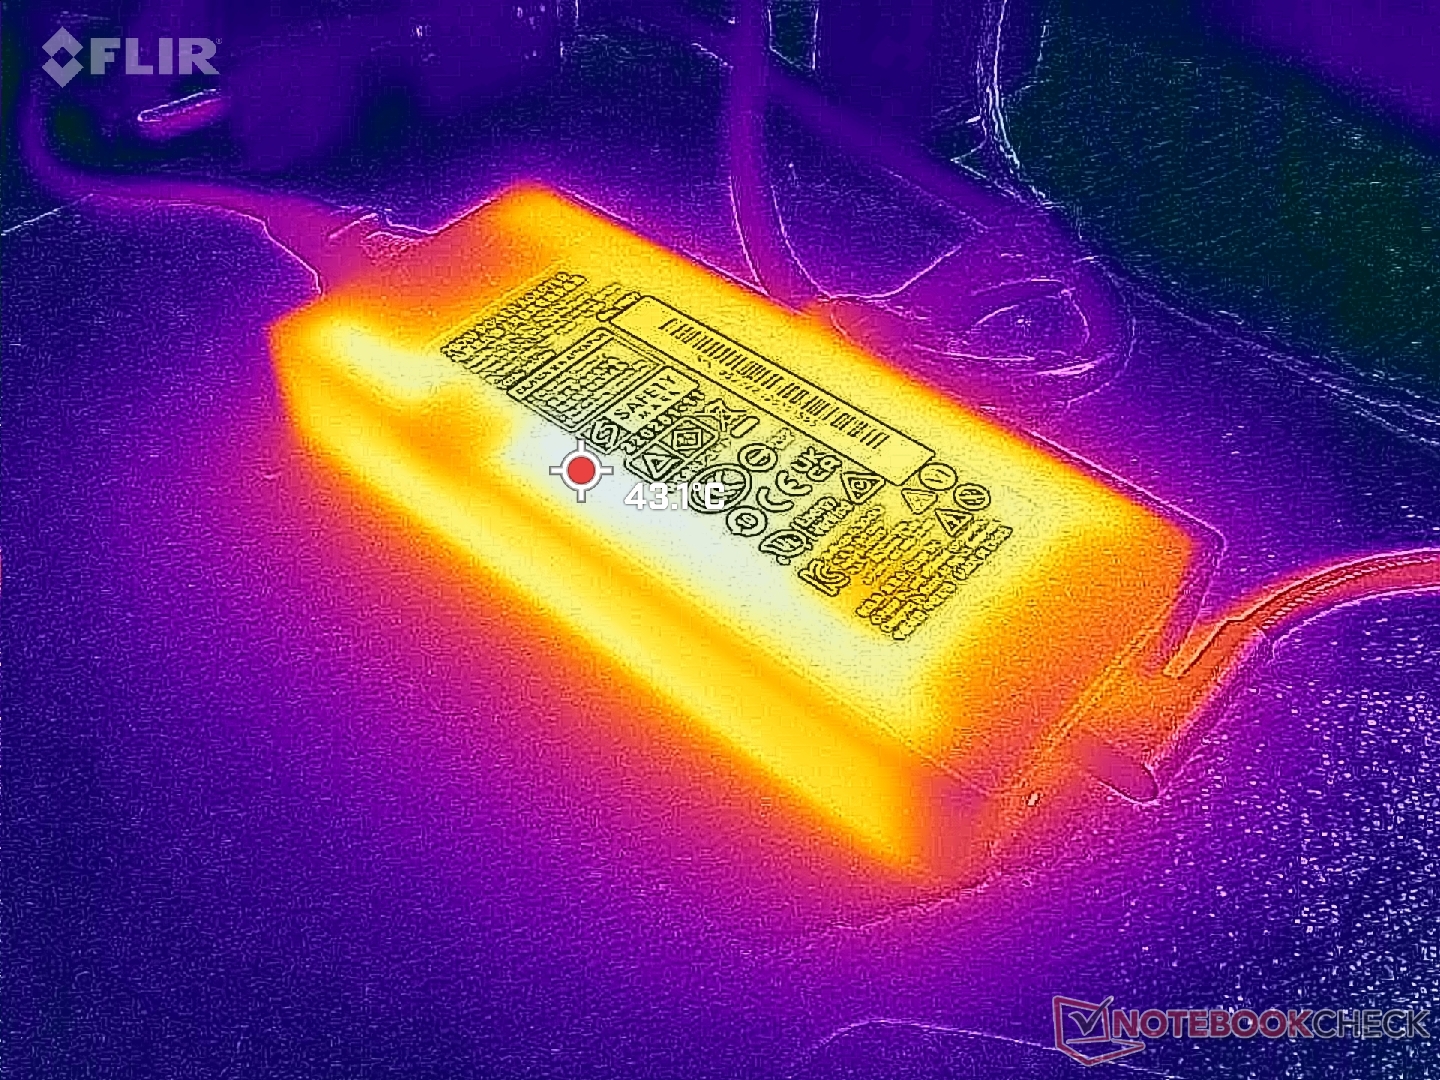
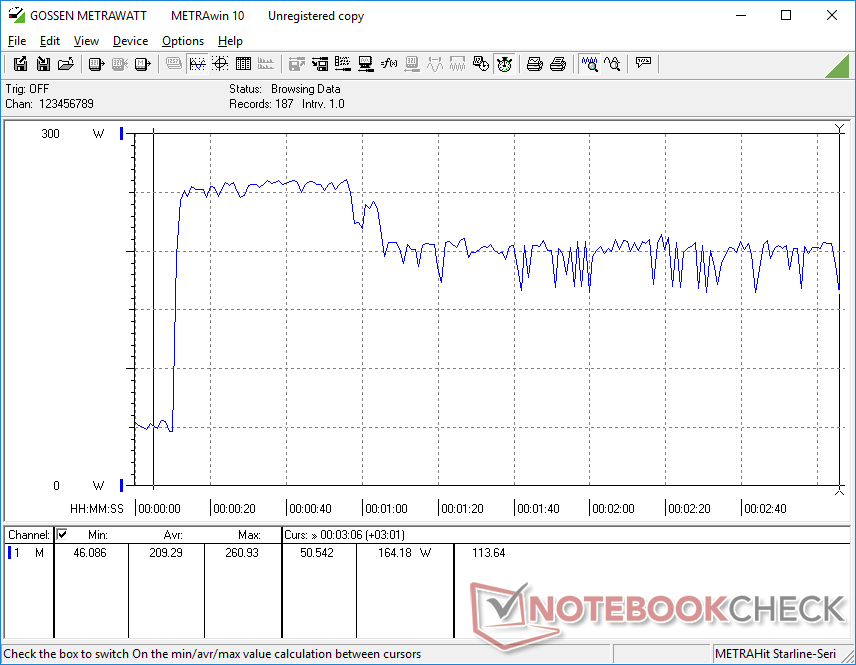
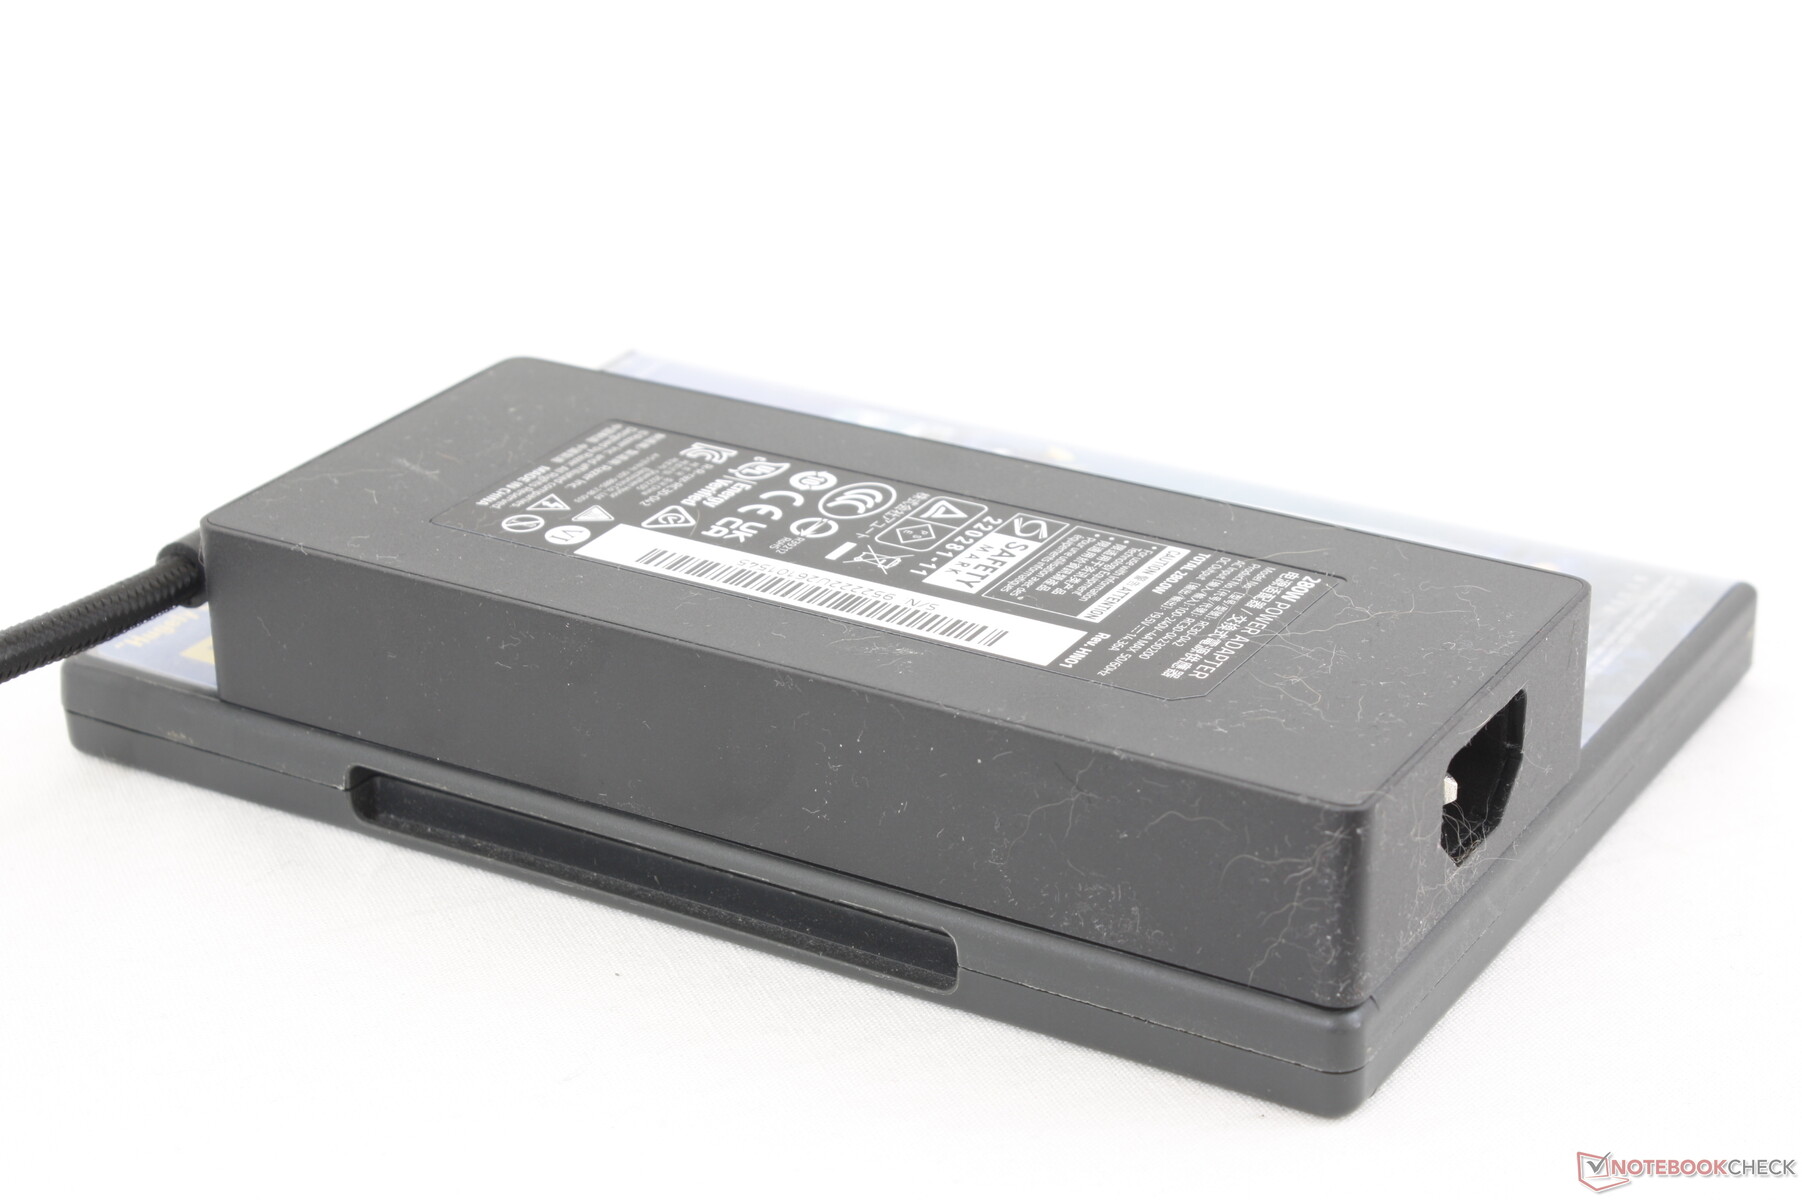
Jesteśmy w stanie zarejestrować chwilowy maksymalny pobór 261 W z małego-średniego (~16,3 x 7 x 2,5 cm) zasilacza GaN AC 280 W podczas jednoczesnego uruchomienia Prime95 i FurMark. Należy pamiętać, że w zależności od konfiguracji dostępne są dwa różne adaptery AC: mniejszy 280 W adapter dla modeli RTX 4060 i 4070 oraz większy 330 W adapter dla modeli RTX 4080 i 4090.
| wyłączony / stan wstrzymania | |
| luz | |
| obciążenie |
|
Legenda:
min: | |
| Razer Blade 18 RTX 4070 i9-13950HX, GeForce RTX 4070 Laptop GPU, SSSTC CA6-8D1024, IPS, 2560x1600, 18" | Razer Blade 17 Early 2022 i9-12900H, GeForce RTX 3080 Ti Laptop GPU, Samsung PM9A1 MZVL21T0HCLR, IPS, 3840x2160, 17.3" | MSI Titan GT77 HX 13VI i9-13950HX, GeForce RTX 4090 Laptop GPU, Samsung PM9A1 MZVL22T0HBLB, Mini-LED, 3840x2160, 17.3" | Gigabyte G7 KE i5-12500H, GeForce RTX 3060 Laptop GPU, Gigabyte AG470S1TB-SI B10, IPS, 1920x1080, 17.3" | Alienware m17 R5 (R9 6900HX, RX 6850M XT) R9 6900HX, Radeon RX 6850M XT, SSSTC CA6-8D1024, IPS, 3840x2160, 17" | Asus ROG Strix Scar 17 SE G733CX-LL014W i9-12950HX, GeForce RTX 3080 Ti Laptop GPU, Samsung PM9A1 MZVL22T0HBLB, IPS, 2560x1440, 17.3" | |
|---|---|---|---|---|---|---|
| Power Consumption | 17% | 8% | 32% | 31% | 9% | |
| Idle Minimum * (Watt) | 24.5 | 17 31% | 14 43% | 15 39% | 13 47% | 19.3 21% |
| Idle Average * (Watt) | 34.1 | 23 33% | 21.6 37% | 17 50% | 16.5 52% | 26.5 22% |
| Idle Maximum * (Watt) | 47.7 | 34 29% | 24.8 48% | 24 50% | 17 64% | 27.1 43% |
| Load Average * (Watt) | 140 | 120 14% | 122.5 12% | 111 21% | 93 34% | 141 -1% |
| Witcher 3 ultra * (Watt) | 202 | 229 -13% | 265 -31% | 174.1 14% | 239 -18% | 225 -11% |
| Load Maximum * (Watt) | 261 | 243 7% | 418 -60% | 208 20% | 251 4% | 307.9 -18% |
* ... im mniej tym lepiej
Power Consumption Witcher 3 / Stresstest
Power Consumption external Monitor
Czas pracy na baterii
To nie przypadek, że największy model Blade posiada również największą pojemność baterii w rodzinie - 91,7 Wh. Czas pracy na baterii niekoniecznie jest jednak dłuższy, a w wielu scenariuszach może być nawet krótszy. Na zrównoważonym profilu zasilania jesteśmy w stanie przeglądać strony internetowe przez 4 godziny przed koniecznością ładowania, co jest wynikiem o prawie całą godzinę krótszym niż w przypadku zeszłorocznego Blade'a 15. Zmniejszenie częstotliwości odświeżania ekranu do 60 Hz zamiast 240 Hz może tylko nieznacznie wydłużyć czas pracy na baterii.
Ładowanie od pustego do pełnego trwa około 90 minut. Użytkownicy mogą również ładować system przez USB-C, choć w wolniejszym tempie.
| Razer Blade 18 RTX 4070 i9-13950HX, GeForce RTX 4070 Laptop GPU, 91.7 Wh | Razer Blade 17 Early 2022 i9-12900H, GeForce RTX 3080 Ti Laptop GPU, 82 Wh | MSI Titan GT77 HX 13VI i9-13950HX, GeForce RTX 4090 Laptop GPU, 99.9 Wh | Gigabyte G7 KE i5-12500H, GeForce RTX 3060 Laptop GPU, 54 Wh | Alienware m17 R5 (R9 6900HX, RX 6850M XT) R9 6900HX, Radeon RX 6850M XT, 97 Wh | Asus ROG Strix Scar 17 SE G733CX-LL014W i9-12950HX, GeForce RTX 3080 Ti Laptop GPU, 90 Wh | |
|---|---|---|---|---|---|---|
| Czasy pracy | 9% | 21% | 11% | 29% | 5% | |
| Reader / Idle (h) | 7 | 7.1 1% | 7.1 1% | |||
| WiFi v1.3 (h) | 4 | 3.8 -5% | 5.3 33% | 5.3 33% | 4.8 20% | 4.2 5% |
| Load (h) | 1.3 | 1.7 31% | 1.4 8% | 1.3 0% | 1.8 38% | |
| H.264 (h) | 4.8 | 6 | 2.2 | 4.9 |
Za
Przeciw
Werdykt - Kocham sprzęt, nienawidzę błędów
Odeszliśmy pod wrażeniem Blade 16ale tego samego nie można powiedzieć o Blade 18. Nasz egzemplarz wykazywał poważne problemy, w tym błędne działanie DLSS 3 na zewnętrznym monitorze, brak obsługi G-Sync, gdy G-Sync jest rzekomo dołączony, oraz potencjalnie wadliwy, migoczący wyświetlacz. Rozważaliśmy wstrzymanie się z recenzją do czasu rozwiązania tych problemów, ale Blade 18 jest już wysyłany do klientów, więc uznaliśmy za stosowne poinformować o tym naszych czytelników, którzy mogą być na rynku. Ta strona zostanie zaktualizowana z ostateczną oceną w miejscu, gdy będziemy mieli odpowiednie rozwiązanie od producenta.
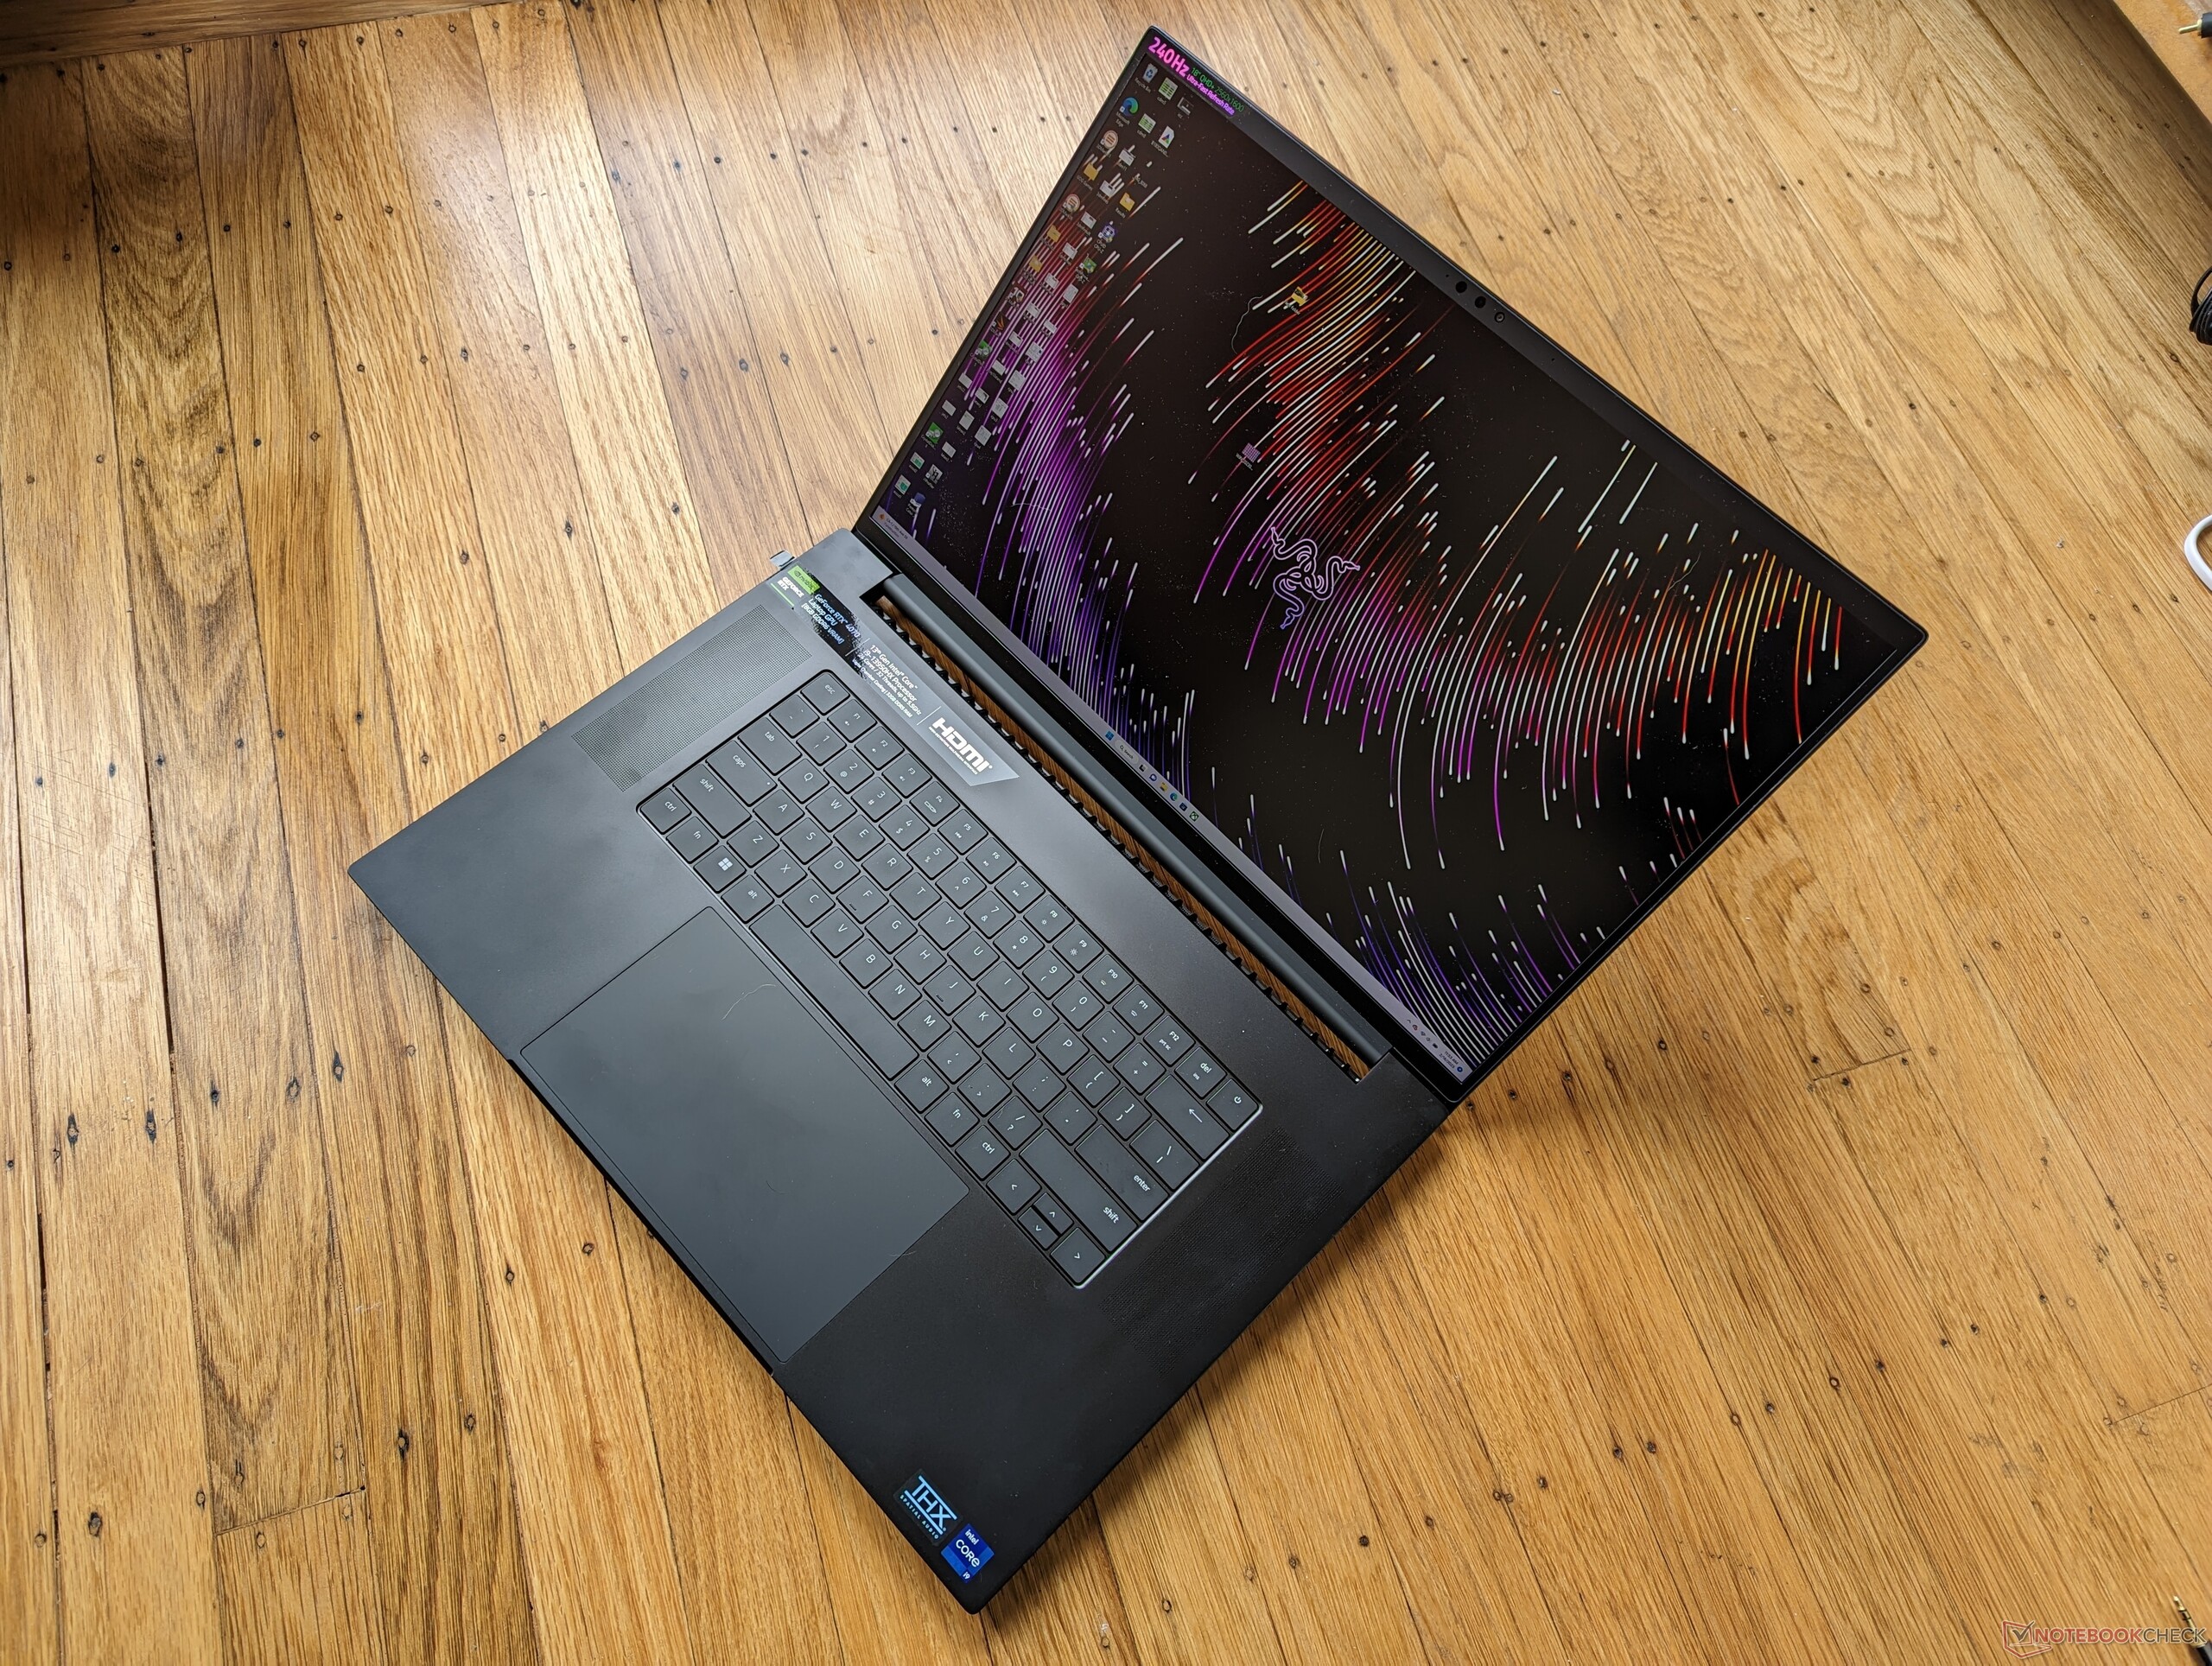
Blade 18 pokazuje potencjał, aby być kolejnym doskonałym dodatkiem do rodziny Blade, jeśli spojrzeć poza powyższe kwestie. 18-calowy wyświetlacz jest przepiękny i masywny w stosunku do powierzchni i wagi. Fakt, że system nie jest dużo większy lub cięższy niż Blade 17
powinien sprawić, że będzie on bardzo atrakcyjny dla użytkowników, którzy już rozważają Blade 17 lub inny 17-calowy laptop do gier. Jego stosunkowo niewielki zasilacz GaN AC dodatkowo podkreśla przenośną, hybrydową naturę Blade 18.</p>Blade 18 może na początku wydawać się ogromny, ale tak naprawdę nie jest dużo większy od istniejącego Blade 17. Jego duży ekran i wysoki współczynnik screen-to-body ratio robią wrażenie.
Jeśli chodzi o mobilny RTX 4070, jego wydajność może być niezadowalająca w zależności od gry. Tytuły, które obsługują DLSS 3, działają jak masło na mobilnym RTX 4070. W przeciwnym razie spodziewaj się wydajności zbliżonej do zeszłorocznego mobilnego RTX 3080 lub desktopowego RTX 3070. Na szczęście lista tytułów wspierających DLSS 3 stale się powiększa.
To ogólnie mocny start dla 18-calowej serii Blade'ów, któremu towarzyszą pewne problemy związane z premierą. Nadchodzące Asus ROG Strix Scar 18 i Dell Alienware m18 mogą oznaczać kłopoty dla Blade 18, jeśli pewne kluczowe problemy nie zostaną rozwiązane.
Cena i dostępność
Przezroczystość
Wyboru urządzeń do recenzji dokonuje nasza redakcja. Próbka testowa została udostępniona autorowi jako pożyczka od producenta lub sprzedawcy detalicznego na potrzeby tej recenzji. Pożyczkodawca nie miał wpływu na tę recenzję, producent nie otrzymał też kopii tej recenzji przed publikacją. Nie było obowiązku publikowania tej recenzji. Jako niezależna firma medialna, Notebookcheck nie podlega władzy producentów, sprzedawców detalicznych ani wydawców.
Tak testuje Notebookcheck
Każdego roku Notebookcheck niezależnie sprawdza setki laptopów i smartfonów, stosując standardowe procedury, aby zapewnić porównywalność wszystkich wyników. Od około 20 lat stale rozwijamy nasze metody badawcze, ustanawiając przy tym standardy branżowe. W naszych laboratoriach testowych doświadczeni technicy i redaktorzy korzystają z wysokiej jakości sprzętu pomiarowego. Testy te obejmują wieloetapowy proces walidacji. Nasz kompleksowy system ocen opiera się na setkach uzasadnionych pomiarów i benchmarków, co pozwala zachować obiektywizm.Price comparison

