Recenzja Aorus 15X ASF: Gamingowy laptop z mocą i wytrzymałością RTX 4070
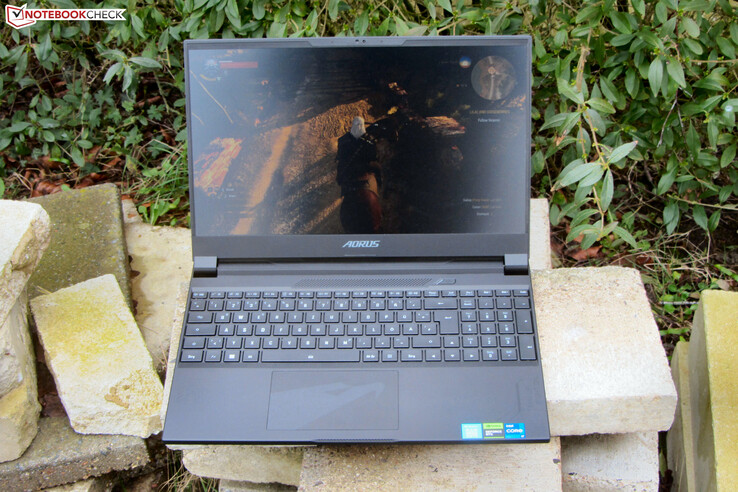
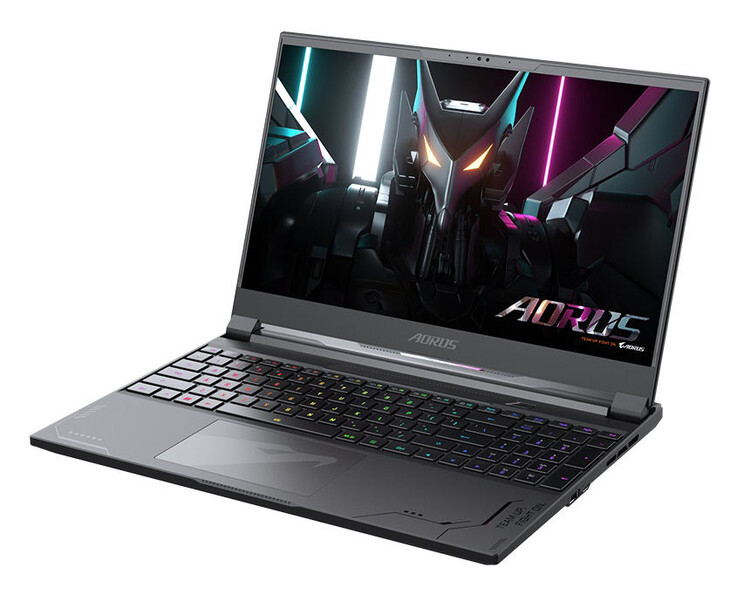
Aorus 15X - średniej klasy laptop dla graczy - jest napędzany przez procesor Raptor Lake Core i7 oraz kartę graficzną RTX 4070. Łączny pakiet sprzedaje się za około 2 099 dolarów. Jego konkurentami są takie urządzenia jak np Razer Blade 15 OLED (początek 2022), np., Asus ROG Strix G17 G713PI, theMSI Katana 17 B13VFKoraz.Acer Predator Helios 300.
Potencjalni konkurenci w porównaniu
Ocena | Data | Model | Waga | Wysokość | Rozmiar | Rezolucja | Cena |
|---|---|---|---|---|---|---|---|
| 86.2 % v7 (old) | 04/2023 | Aorus 15X ASF i7-13700HX, GeForce RTX 4070 Laptop GPU | 2.3 kg | 19.7 mm | 15.60" | 2560x1440 | |
| 89.9 % v7 (old) | 03/2023 | Razer Blade 15 OLED (Early 2022) i9-12900H, GeForce RTX 3070 Ti Laptop GPU | 2 kg | 16.99 mm | 15.60" | 2560x1440 | |
| 82.1 % v7 (old) | 02/2023 | MSI Katana 17 B13VFK i7-13620H, GeForce RTX 4060 Laptop GPU | 2.8 kg | 25.2 mm | 17.30" | 1920x1080 | |
| 88.4 % v7 (old) | 04/2023 | Asus ROG Strix G17 G713PI R9 7945HX, GeForce RTX 4070 Laptop GPU | 2.8 kg | 30.7 mm | 17.30" | 2560x1440 | |
| 86.5 % v7 (old) | 11/2022 | Acer Predator Helios 300 (i7-12700H, RTX 3070 Ti) i7-12700H, GeForce RTX 3070 Ti Laptop GPU | 3 kg | 27.65 mm | 17.30" | 2560x1440 |
Obudowa - Gigabyte wykorzystuje mieszankę materiałów
Tylko tylna część pokrywy wykonana jest z matowego, czarnego metalu - jednostka bazowa wykonana jest z plastiku. Gigabyte nie dodał żadnych wymyślnych wizualnych upiększeń poza wzorem, który jest wytrawiony na gładkiej powierzchni obudowy. Pasek LED (RGB, konfigurowalny) z tyłu jednostki bazowej oraz podświetlane klawisze (RGB) dodają urządzeniu kolorów.
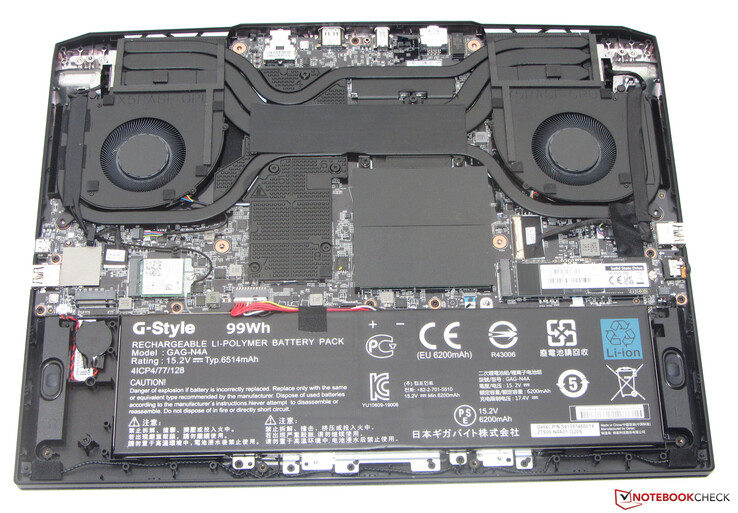
Obudowa jest złożona bez zarzutu - nie ma żadnych naddatków materiału, a wymiary szczelin są prawidłowe. Jednostka bazowa może być tylko lekko skręcona, pokrywa bardziej. Wszystko to jednak pozostaje w normalnym zakresie. Do akumulatora (przykręconego - nie przyklejonego) i reszty wnętrz laptopa można się dostać po zdjęciu spodniej powłoki. Zawiasy trzymają wieko solidnie, a maksymalny kąt otwarcia wynosi około 130 stopni. Możliwe jest otwarcie wieka jedną ręką.
Model 15X można umieścić dość mocno w środkowym przedziale wszystkich laptopów 15,6-calowych: Nie jest ani kompaktowy, ani szczególnie masywny. To samo można powiedzieć o jego wadze.
Łączność - komputer Aorus posiada złącze Thunderbolt 4
15X posiada dwa porty USB-A (USB 3.2 Gen 2) i jeden port USB-C (Thunderbolt 4). Ten ostatni obsługuje Power Delivery i może wyprowadzać sygnał DisplayPort. To, wraz z portem HDMI (2.1) i dedykowanym Mini DisplayPort (1.4), daje trzy wyjścia wideo. Komputer nie posiada czytnika kart SD.
Dwa dedykowane wyjścia wideo, jak również port ethernetowy, znajdziemy z tyłu urządzenia. Oznacza to, że kable nie będą przeszkadzać podczas korzystania z laptopa.
Komunikacja
W optymalnych warunkach (brak dodatkowych urządzeń WLAN w pobliżu, niewielka odległość między laptopem a komputerem serwerowym) szybkość transferu WLAN w laptopie jest dobra, pozostaje jednak nieco poniżej średniej, biorąc pod uwagę to, co umożliwia ten układ Wi-Fi (Intel AX211; Wi-Fi 6E). Połączenie z siecią przewodową jest możliwe dzięki układowi Gigabit Ethernet (RTL8125; 2,5 Gbit) firmy Realtek.
Kamera internetowa
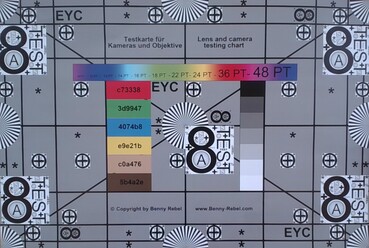
Kamera internetowa urządzenia (2,1 MP, maks. 1 920 x 1 080 pikseli) nie posiada osłony, jednak jej jakość jest dość standardowa. Zmaga się ona nieco z dokładnością kolorów: jej odchylenie kolorów wynoszące 11 oznacza, że mieści się ona w niedopuszczalnym zakresie (pożądane: DeltaE poniżej 3).
Akcesoria
Obok zwykłych dokumentów (skróconej instrukcji obsługi i informacji o gwarancji) laptop nie ma w zestawie żadnych dodatkowych akcesoriów.
Konserwacja
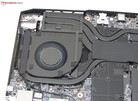
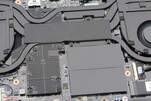
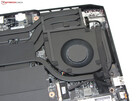
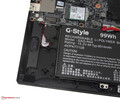
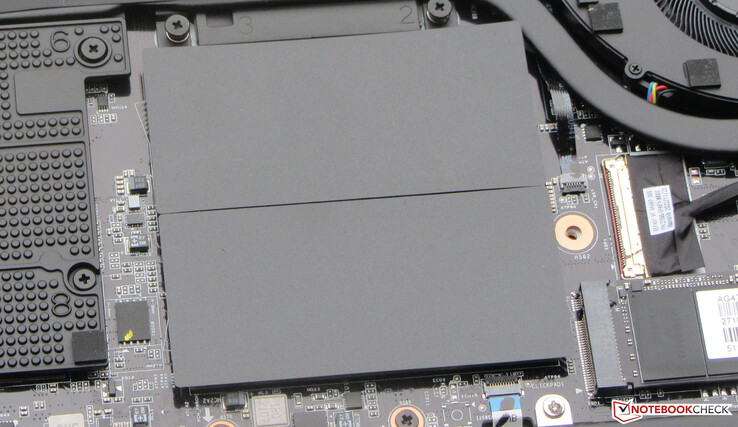
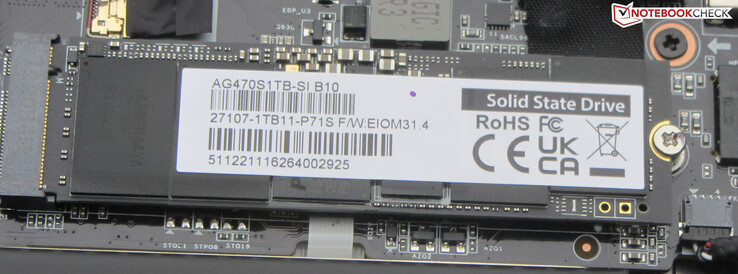
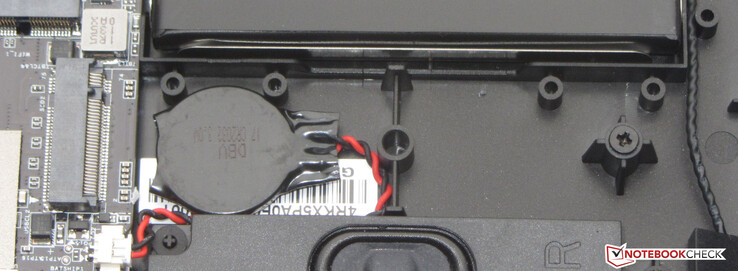
Po odkręceniu wszystkich śrubek ze spodu urządzenia można zdjąć spodnią powłokę przy pomocy płaskiej szpatułki lub noża do palet. Następnie można uzyskać dostęp do gniazd pamięci RAM (oba używane), dysku SSD (PCIe 4), drugiego gniazda M.2 2280 (PCIe 4), baterii BIOS-u, modułu WLAN, wentylatorów, głośników i akumulatora.
Gwarancja
15,6-calowy laptop Gigabyte objęty jest dwuletnią gwarancją. Przedłużenie gwarancji nie jest dostępne.
Urządzenia wejściowe - laptop gamingowy z indywidualnie podświetlanymi klawiszami
Klawiatura
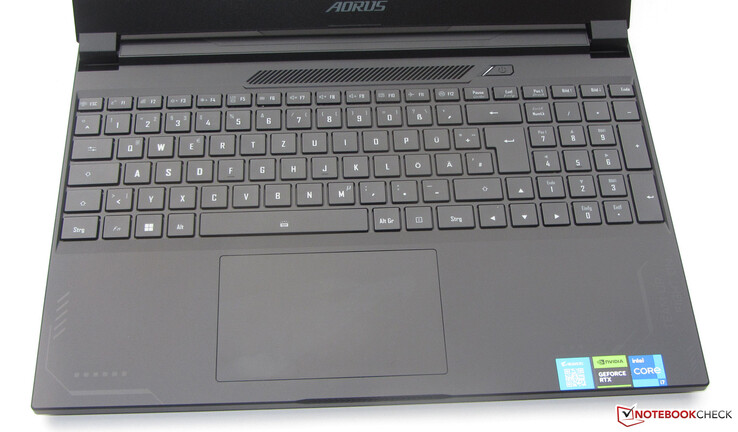
Gładkie klawisze klawiatury Chiclet mają średni poziom podniesienia i wyraźny punkt nacisku. Każdy klawisz jest podświetlany indywidualnie (trzy poziomy jasności). Negatywy: Funkcje dodatkowe klawiszy nie łapią żadnego światła, przez co są mało czytelne. Podczas pisania, klawisze mają jedynie niewielki luz - nie powinno to jednak być zbyt dokuczliwe. Podsumowując, Gigabyte wyposażył to urządzenie w dobrą klawiaturę do codziennego użytku.
Touchpad
Wyświetlacz - panel QHD o częstotliwości 240 Hz
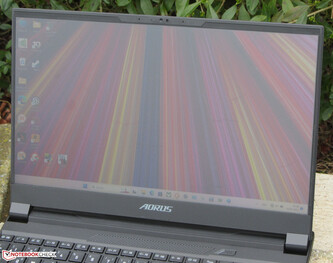
Gigabyte'a 15X wyposażono w szybko reagujący panel w formacie 16:9 o częstotliwości 240 Hz, który nie cierpi na migotanie PWM na żadnym poziomie jasności. Poziomy jasności i kontrastu na matowym 15,6-calowym wyświetlaczu (2 560 x 1 440 pikseli) mieszczą się w akceptowalnym zakresie (> 300 cd/m² i 1 000:1).
W porównaniu z konkurencją, Blade 15 wyróżnia się dzięki panelowi OLED.
| |||||||||||||||||||||||||
rozświetlenie: 90 %
na akumulatorze: 316 cd/m²
kontrast: 1129:1 (czerń: 0.28 cd/m²)
ΔE ColorChecker Calman: 1.54 | ∀{0.5-29.43 Ø4.77}
calibrated: 1.21
ΔE Greyscale Calman: 1.3 | ∀{0.09-98 Ø5}
70.5% AdobeRGB 1998 (Argyll 3D)
98.2% sRGB (Argyll 3D)
69.3% Display P3 (Argyll 3D)
Gamma: 2.307
CCT: 6456 K
| Aorus 15X ASF BOE CQ NE156QHM-NZ1, IPS, 2560x1440, 15.6" | Razer Blade 15 OLED (Early 2022) Samsung ATNA562P02-0, OLED, 2560x1440, 15.6" | MSI Katana 17 B13VFK B173HAN04.9, IPS LED, 1920x1080, 17.3" | Asus ROG Strix G17 G713PI BOE0B69, IPS, 2560x1440, 17.3" | Acer Predator Helios 300 (i7-12700H, RTX 3070 Ti) BOE0A1A, IPS, 2560x1440, 17.3" | |
|---|---|---|---|---|---|
| Display | 25% | -40% | 22% | 21% | |
| Display P3 Coverage (%) | 69.3 | 97.6 41% | 40.8 -41% | 98.3 42% | 96.8 40% |
| sRGB Coverage (%) | 98.2 | 99.4 1% | 61 -38% | 100 2% | 99.9 2% |
| AdobeRGB 1998 Coverage (%) | 70.5 | 94 33% | 42.2 -40% | 85.9 22% | 84.8 20% |
| Response Times | 82% | -172% | 33% | -26% | |
| Response Time Grey 50% / Grey 80% * (ms) | 12.4 ? | 2 ? 84% | 33 ? -166% | 5.3 ? 57% | 16.4 ? -32% |
| Response Time Black / White * (ms) | 9.4 ? | 2 ? 79% | 26 ? -177% | 8.6 ? 9% | 11.2 ? -19% |
| PWM Frequency (Hz) | 500 ? | ||||
| Screen | 109% | -135% | -4% | -60% | |
| Brightness middle (cd/m²) | 316 | 383 21% | 267 -16% | 327 3% | 366 16% |
| Brightness (cd/m²) | 301 | 384 28% | 256 -15% | 320 6% | 340 13% |
| Brightness Distribution (%) | 90 | 99 10% | 93 3% | 89 -1% | 85 -6% |
| Black Level * (cd/m²) | 0.28 | 0.03 89% | 0.21 25% | 0.38 -36% | 0.31 -11% |
| Contrast (:1) | 1129 | 12767 1031% | 1271 13% | 861 -24% | 1181 5% |
| Colorchecker dE 2000 * | 1.54 | 1.89 -23% | 4.7 -205% | 1.01 34% | 3.56 -131% |
| Colorchecker dE 2000 max. * | 2.46 | 3.76 -53% | 20.4 -729% | 4.01 -63% | 5.66 -130% |
| Colorchecker dE 2000 calibrated * | 1.21 | 2.67 -121% | 4.5 -272% | 0.41 66% | 3.31 -174% |
| Greyscale dE 2000 * | 1.3 | 1.26 3% | 1.5 -15% | 1.6 -23% | 2.84 -118% |
| Gamma | 2.307 95% | 2.41 91% | 2.12 104% | 2.168 101% | 2.29 96% |
| CCT | 6456 101% | 6386 102% | 6552 99% | 6659 98% | 6835 95% |
| Całkowita średnia (program / ustawienia) | 72% /
87% | -116% /
-120% | 17% /
7% | -22% /
-38% |
* ... im mniej tym lepiej
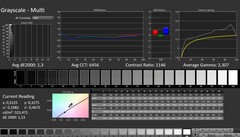
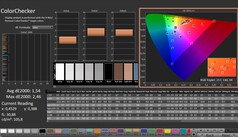
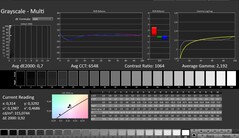
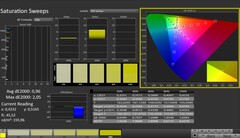
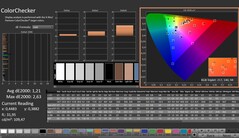
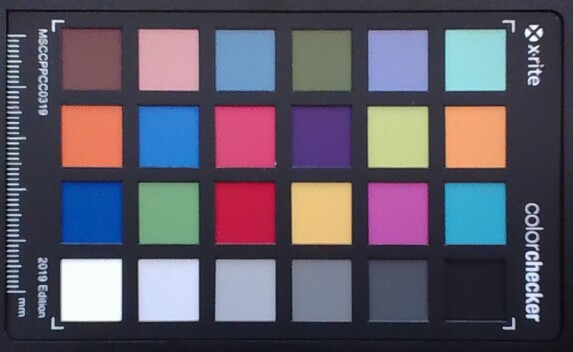
Prosto po wyjęciu z pudełka wyświetlacz wykazuje już świetne odwzorowanie kolorów: Z odchyleniem 1,54 mieści się w akceptowalnym zakresie (DeltaE < 3). Kalibracja obniża tę liczbę do 1,21 i pomaga w bardziej równomiernym wyświetlaniu odcieni szarości.
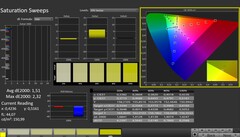
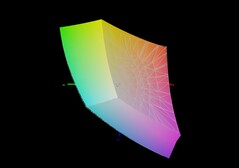
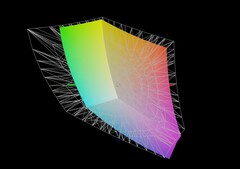
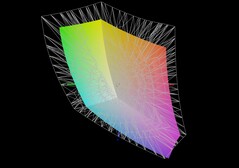
Wyświetlacz potrafi odwzorować prawie całą przestrzeń kolorów sRGB - ale nie przestrzenie kolorów AdobeRGB i DCI-P3. Oznacza to, że większość konkurentów radzi sobie z tym nieco lepiej.
Wyświetl czasy reakcji
| ↔ Czas reakcji od czerni do bieli | ||
|---|---|---|
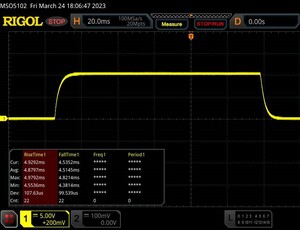
| 9.4 ms ... wzrost ↗ i spadek ↘ łącznie | ↗ 4.9 ms wzrost | |
| ↘ 4.5 ms upadek | ||
| W naszych testach ekran wykazuje szybki czas reakcji i powinien nadawać się do gier. Dla porównania, wszystkie testowane urządzenia wahają się od 0.1 (minimum) do 240 (maksimum) ms. » 25 % wszystkich urządzeń jest lepszych. Oznacza to, że zmierzony czas reakcji jest lepszy od średniej wszystkich testowanych urządzeń (20.2 ms). | ||
| ↔ Czas reakcji 50% szarości do 80% szarości | ||
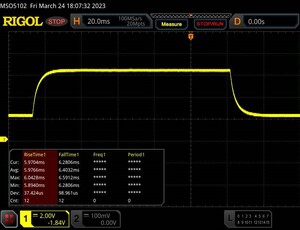
| 12.4 ms ... wzrost ↗ i spadek ↘ łącznie | ↗ 6 ms wzrost | |
| ↘ 6.4 ms upadek | ||
| W naszych testach ekran wykazuje dobry współczynnik reakcji, ale może być zbyt wolny dla graczy rywalizujących ze sobą. Dla porównania, wszystkie testowane urządzenia wahają się od 0.165 (minimum) do 636 (maksimum) ms. » 25 % wszystkich urządzeń jest lepszych. Oznacza to, że zmierzony czas reakcji jest lepszy od średniej wszystkich testowanych urządzeń (31.6 ms). | ||
Migotanie ekranu / PWM (modulacja szerokości impulsu)
| Migotanie ekranu/nie wykryto PWM | |||
Dla porównania: 53 % wszystkich testowanych urządzeń nie używa PWM do przyciemniania wyświetlacza. Jeśli wykryto PWM, zmierzono średnio 8077 (minimum: 5 - maksimum: 343500) Hz. | |||
Wydajność
Aorus 15X jest klasyfikowany jako wydajny laptop do gier - ale nie ogranicza się tylko do tej dziedziny. Jego dobra wydajność jest możliwa dzięki Raptor Lake i Adzie Lovelace. Prezentowane urządzenie testowe można nabyć za około 2 099 dolarów.
Warunki badania
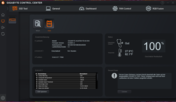
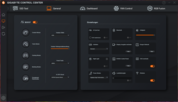
Centrum sterowania komputera (Gigabyte Control Center) posiada wszystkie typowe tryby wydajności (patrz tabela) oraz nadrzędną funkcję AI boost, z której skorzystaliśmy. Oznaczało to, że centrum sterowania wybierało najlepiej dopasowany profil - "tryb gry" i "tryb kreatora" dla benchmarków oraz "energooszczędny tryb bezczynności" dla testów akumulatora.
"Tryb Turbo" może w pewnych przypadkach zapewnić nieco lepszą wydajność - ale ma to swoją cenę: Wentylatory stale pracują z pełną mocą. Najcichsze poziomy pracy - bliskie całkowitej ciszy - można osiągnąć za pomocą "trybu spotkania". Tutaj wydajność jednowątkowa, która jest ważniejsza w codziennym użytkowaniu, kurczy się w mniejszym stopniu niż wydajność wielowątkowa. Na obniżonych ustawieniach możliwe byłoby nawet granie w gry.
| Tryb kreatora | Tryb turbo | Tryb gier | Tryb spotkań | Tryb oszczędzania energii w stanie spoczynku | |
|---|---|---|---|---|---|
| Limit mocy 1 | 70 watów | 70 watów | 55 watów | 15 watów | 15 watów |
| Limit mocy 2 | 157 watów | 157 watów | 157 watów | 30 watów | 30 watów |
Procesor
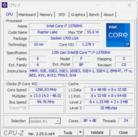
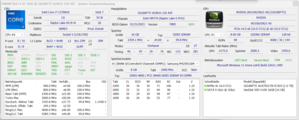
JegoCore-i7-13700HX (procesor Raptor Lake) składa się z 8 rdzeni wydajnościowych (bez hiperwątkowości, 1,5 do 3,7 GHz) i 8 rdzeni wydajnościowych (hiperwątkowość, 2,1 do 5 GHz). W sumie daje to 24 logistyczne rdzenie CPU. Benchmarki zapewniają wyniki na równi z wyznaczoną przez CPU średnią.
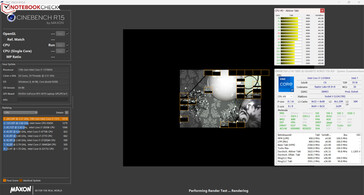
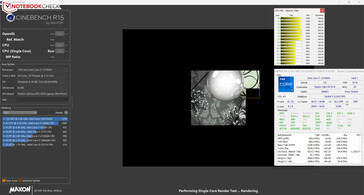
Testy CPU w benchmarku Cinebench R15 były przeprowadzane z wysokimi (wielowątkowymi) lub wysokimi do maksymalnych (jednowątkowych) częstotliwościami taktowania podczas podłączenia do sieci zasilającej. Przy wykorzystaniu akumulatora te tempa spadły - wyraźnie bardziej pod obciążeniem jednowątkowym, niż wielowątkowym.
Pokazał to test pętli CB15: Turbo procesora było wykorzystywane, a ciągłe obciążenie wielowątkowe powodowało nieznaczny spadek częstotliwości taktowania od pierwszego do trzeciego przebiegu.
Cinebench R15 Multi Loop test
* ... im mniej tym lepiej
AIDA64: FP32 Ray-Trace | FPU Julia | CPU SHA3 | CPU Queen | FPU SinJulia | FPU Mandel | CPU AES | CPU ZLib | FP64 Ray-Trace | CPU PhotoWorxx
| Performance rating | |
| Asus ROG Strix G17 G713PI | |
| Średnia w klasie Gaming | |
| Przeciętny Intel Core i7-13700HX | |
| Aorus 15X ASF | |
| Acer Predator Helios 300 (i7-12700H, RTX 3070 Ti) | |
| Razer Blade 15 OLED (Early 2022) | |
| MSI Katana 17 B13VFK | |
| AIDA64 / FP32 Ray-Trace | |
| Asus ROG Strix G17 G713PI | |
| Średnia w klasie Gaming (7192 - 85542, n=140, ostatnie 2 lata) | |
| Przeciętny Intel Core i7-13700HX (14261 - 21999, n=11) | |
| Acer Predator Helios 300 (i7-12700H, RTX 3070 Ti) | |
| Aorus 15X ASF | |
| MSI Katana 17 B13VFK | |
| Razer Blade 15 OLED (Early 2022) | |
| AIDA64 / FPU Julia | |
| Asus ROG Strix G17 G713PI | |
| Średnia w klasie Gaming (35040 - 238426, n=140, ostatnie 2 lata) | |
| Przeciętny Intel Core i7-13700HX (74636 - 109364, n=11) | |
| Acer Predator Helios 300 (i7-12700H, RTX 3070 Ti) | |
| Aorus 15X ASF | |
| Razer Blade 15 OLED (Early 2022) | |
| MSI Katana 17 B13VFK | |
| AIDA64 / CPU SHA3 | |
| Asus ROG Strix G17 G713PI | |
| Średnia w klasie Gaming (1728 - 9817, n=140, ostatnie 2 lata) | |
| Przeciętny Intel Core i7-13700HX (3359 - 5053, n=11) | |
| Acer Predator Helios 300 (i7-12700H, RTX 3070 Ti) | |
| Aorus 15X ASF | |
| Razer Blade 15 OLED (Early 2022) | |
| MSI Katana 17 B13VFK | |
| AIDA64 / CPU Queen | |
| Asus ROG Strix G17 G713PI | |
| Średnia w klasie Gaming (49785 - 173351, n=140, ostatnie 2 lata) | |
| Aorus 15X ASF | |
| Przeciętny Intel Core i7-13700HX (86532 - 114717, n=11) | |
| Razer Blade 15 OLED (Early 2022) | |
| Acer Predator Helios 300 (i7-12700H, RTX 3070 Ti) | |
| MSI Katana 17 B13VFK | |
| AIDA64 / FPU SinJulia | |
| Asus ROG Strix G17 G713PI | |
| Średnia w klasie Gaming (4424 - 33636, n=140, ostatnie 2 lata) | |
| Przeciętny Intel Core i7-13700HX (9290 - 13519, n=11) | |
| Aorus 15X ASF | |
| Acer Predator Helios 300 (i7-12700H, RTX 3070 Ti) | |
| Razer Blade 15 OLED (Early 2022) | |
| MSI Katana 17 B13VFK | |
| AIDA64 / FPU Mandel | |
| Asus ROG Strix G17 G713PI | |
| Średnia w klasie Gaming (17585 - 128721, n=140, ostatnie 2 lata) | |
| Przeciętny Intel Core i7-13700HX (35751 - 53484, n=11) | |
| Acer Predator Helios 300 (i7-12700H, RTX 3070 Ti) | |
| Aorus 15X ASF | |
| Razer Blade 15 OLED (Early 2022) | |
| MSI Katana 17 B13VFK | |
| AIDA64 / CPU AES | |
| Asus ROG Strix G17 G713PI | |
| Aorus 15X ASF | |
| Przeciętny Intel Core i7-13700HX (67846 - 182575, n=11) | |
| Średnia w klasie Gaming (19065 - 247074, n=140, ostatnie 2 lata) | |
| Razer Blade 15 OLED (Early 2022) | |
| Acer Predator Helios 300 (i7-12700H, RTX 3070 Ti) | |
| MSI Katana 17 B13VFK | |
| AIDA64 / CPU ZLib | |
| Asus ROG Strix G17 G713PI | |
| Średnia w klasie Gaming (373 - 2531, n=140, ostatnie 2 lata) | |
| Przeciętny Intel Core i7-13700HX (981 - 1451, n=11) | |
| Acer Predator Helios 300 (i7-12700H, RTX 3070 Ti) | |
| Aorus 15X ASF | |
| Razer Blade 15 OLED (Early 2022) | |
| MSI Katana 17 B13VFK | |
| AIDA64 / FP64 Ray-Trace | |
| Asus ROG Strix G17 G713PI | |
| Średnia w klasie Gaming (3856 - 45446, n=140, ostatnie 2 lata) | |
| Przeciętny Intel Core i7-13700HX (7728 - 11837, n=11) | |
| Acer Predator Helios 300 (i7-12700H, RTX 3070 Ti) | |
| Aorus 15X ASF | |
| MSI Katana 17 B13VFK | |
| Razer Blade 15 OLED (Early 2022) | |
| AIDA64 / CPU PhotoWorxx | |
| Średnia w klasie Gaming (10805 - 62916, n=140, ostatnie 2 lata) | |
| Acer Predator Helios 300 (i7-12700H, RTX 3070 Ti) | |
| Aorus 15X ASF | |
| Przeciętny Intel Core i7-13700HX (19678 - 42415, n=11) | |
| Razer Blade 15 OLED (Early 2022) | |
| Razer Blade 15 OLED (Early 2022) | |
| MSI Katana 17 B13VFK | |
| Asus ROG Strix G17 G713PI | |
Wydajność systemu
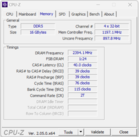
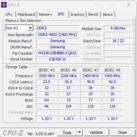
Arkusz specyfikacji już zdradza: użytkownicy 15X nie muszą się martwić o brak wydajności. Płynnie działający system jest dobrze przygotowany do wymagających zadań, takich jak renderowanie czy gry - potwierdzają to dobre wyniki PCMark. Prędkości transferu pamięci RAM nie wykazują niczego nadzwyczajnego i są na normalnym poziomie dla pamięci RAM DDR5-4800.
CrossMark: Overall | Productivity | Creativity | Responsiveness
| PCMark 10 / Score | |
| Średnia w klasie Gaming (5776 - 10060, n=120, ostatnie 2 lata) | |
| Acer Predator Helios 300 (i7-12700H, RTX 3070 Ti) | |
| Przeciętny Intel Core i7-13700HX, NVIDIA GeForce RTX 4070 Laptop GPU (7178 - 8486, n=4) | |
| Asus ROG Strix G17 G713PI | |
| Razer Blade 15 OLED (Early 2022) | |
| Aorus 15X ASF | |
| MSI Katana 17 B13VFK | |
| PCMark 10 / Essentials | |
| Asus ROG Strix G17 G713PI | |
| MSI Katana 17 B13VFK | |
| Średnia w klasie Gaming (8810 - 12600, n=124, ostatnie 2 lata) | |
| Aorus 15X ASF | |
| Acer Predator Helios 300 (i7-12700H, RTX 3070 Ti) | |
| Przeciętny Intel Core i7-13700HX, NVIDIA GeForce RTX 4070 Laptop GPU (9679 - 11652, n=4) | |
| Razer Blade 15 OLED (Early 2022) | |
| PCMark 10 / Productivity | |
| Asus ROG Strix G17 G713PI | |
| Razer Blade 15 OLED (Early 2022) | |
| Średnia w klasie Gaming (6662 - 16716, n=120, ostatnie 2 lata) | |
| Acer Predator Helios 300 (i7-12700H, RTX 3070 Ti) | |
| Przeciętny Intel Core i7-13700HX, NVIDIA GeForce RTX 4070 Laptop GPU (9236 - 10517, n=4) | |
| Aorus 15X ASF | |
| MSI Katana 17 B13VFK | |
| PCMark 10 / Digital Content Creation | |
| Średnia w klasie Gaming (7440 - 19351, n=120, ostatnie 2 lata) | |
| Acer Predator Helios 300 (i7-12700H, RTX 3070 Ti) | |
| Przeciętny Intel Core i7-13700HX, NVIDIA GeForce RTX 4070 Laptop GPU (9731 - 13534, n=4) | |
| Razer Blade 15 OLED (Early 2022) | |
| MSI Katana 17 B13VFK | |
| Aorus 15X ASF | |
| Asus ROG Strix G17 G713PI | |
| CrossMark / Overall | |
| Aorus 15X ASF | |
| Asus ROG Strix G17 G713PI | |
| Średnia w klasie Gaming (1247 - 2344, n=116, ostatnie 2 lata) | |
| Przeciętny Intel Core i7-13700HX, NVIDIA GeForce RTX 4070 Laptop GPU (1756 - 2065, n=3) | |
| Acer Predator Helios 300 (i7-12700H, RTX 3070 Ti) | |
| MSI Katana 17 B13VFK | |
| Razer Blade 15 OLED (Early 2022) | |
| CrossMark / Productivity | |
| Aorus 15X ASF | |
| Asus ROG Strix G17 G713PI | |
| Średnia w klasie Gaming (1299 - 2211, n=116, ostatnie 2 lata) | |
| Przeciętny Intel Core i7-13700HX, NVIDIA GeForce RTX 4070 Laptop GPU (1731 - 1960, n=3) | |
| Acer Predator Helios 300 (i7-12700H, RTX 3070 Ti) | |
| MSI Katana 17 B13VFK | |
| Razer Blade 15 OLED (Early 2022) | |
| CrossMark / Creativity | |
| Asus ROG Strix G17 G713PI | |
| Średnia w klasie Gaming (1275 - 2729, n=116, ostatnie 2 lata) | |
| Aorus 15X ASF | |
| Acer Predator Helios 300 (i7-12700H, RTX 3070 Ti) | |
| Przeciętny Intel Core i7-13700HX, NVIDIA GeForce RTX 4070 Laptop GPU (1797 - 2193, n=3) | |
| MSI Katana 17 B13VFK | |
| Razer Blade 15 OLED (Early 2022) | |
| CrossMark / Responsiveness | |
| Aorus 15X ASF | |
| Przeciętny Intel Core i7-13700HX, NVIDIA GeForce RTX 4070 Laptop GPU (1708 - 2016, n=3) | |
| MSI Katana 17 B13VFK | |
| Acer Predator Helios 300 (i7-12700H, RTX 3070 Ti) | |
| Średnia w klasie Gaming (1030 - 2330, n=116, ostatnie 2 lata) | |
| Asus ROG Strix G17 G713PI | |
| Razer Blade 15 OLED (Early 2022) | |
| PCMark 8 Home Score Accelerated v2 | 4764 pkt. | |
| PCMark 8 Work Score Accelerated v2 | 5976 pkt. | |
| PCMark 10 Score | 7178 pkt. | |
Pomoc | ||
| AIDA64 / Memory Copy | |
| Średnia w klasie Gaming (21750 - 108104, n=140, ostatnie 2 lata) | |
| Aorus 15X ASF | |
| Acer Predator Helios 300 (i7-12700H, RTX 3070 Ti) | |
| Razer Blade 15 OLED (Early 2022) | |
| Przeciętny Intel Core i7-13700HX (36125 - 63990, n=11) | |
| MSI Katana 17 B13VFK | |
| Asus ROG Strix G17 G713PI | |
| AIDA64 / Memory Read | |
| Średnia w klasie Gaming (22956 - 104349, n=140, ostatnie 2 lata) | |
| Aorus 15X ASF | |
| MSI Katana 17 B13VFK | |
| Razer Blade 15 OLED (Early 2022) | |
| Przeciętny Intel Core i7-13700HX (36510 - 69729, n=11) | |
| Asus ROG Strix G17 G713PI | |
| Acer Predator Helios 300 (i7-12700H, RTX 3070 Ti) | |
| AIDA64 / Memory Write | |
| Średnia w klasie Gaming (22297 - 133486, n=140, ostatnie 2 lata) | |
| Przeciętny Intel Core i7-13700HX (33598 - 85675, n=11) | |
| Asus ROG Strix G17 G713PI | |
| Razer Blade 15 OLED (Early 2022) | |
| Acer Predator Helios 300 (i7-12700H, RTX 3070 Ti) | |
| Aorus 15X ASF | |
| MSI Katana 17 B13VFK | |
| AIDA64 / Memory Latency | |
| Średnia w klasie Gaming (59.5 - 259, n=140, ostatnie 2 lata) | |
| MSI Katana 17 B13VFK | |
| Razer Blade 15 OLED (Early 2022) | |
| Acer Predator Helios 300 (i7-12700H, RTX 3070 Ti) | |
| Przeciętny Intel Core i7-13700HX (81.5 - 97.9, n=11) | |
| Asus ROG Strix G17 G713PI | |
| Aorus 15X ASF | |
* ... im mniej tym lepiej
Opóźnienie DPC
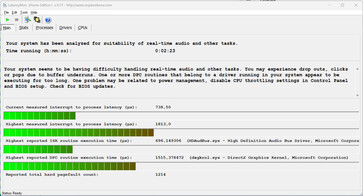
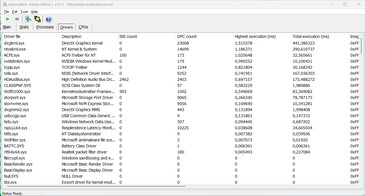
Standardowy test monitora latencji (przeglądanie stron internetowych, odtwarzanie filmów 4k, wysokie obciążenie Prime95) ujawnił kilka nieprawidłowości. System ten nie wydaje się być odpowiedni do edycji wideo i audio w czasie rzeczywistym. Przyszłe aktualizacje oprogramowania mogą przynieść pewne usprawnienia - ale mogą też ewentualnie pogorszyć ten problem.
| DPC Latencies / LatencyMon - interrupt to process latency (max), Web, Youtube, Prime95 | |
| MSI Katana 17 B13VFK | |
| Aorus 15X ASF | |
| Acer Predator Helios 300 (i7-12700H, RTX 3070 Ti) | |
| Asus ROG Strix G17 G713PI | |
| Razer Blade 15 OLED (Early 2022) | |
* ... im mniej tym lepiej
Urządzenia pamięci masowej
W 15X znalazło się miejsce na dwa dyski SSD PCIe-4 w formacie M.2-2280 - w zestawie z laptopem jest jednak tylko jeden. Zainstalowany model PCIe-4 (1 TB) od Gigabyte'a zapewnia bardzo dobre transfery. Aczkolwiek: w późniejszym przebiegu pętli DiskSpd można było zaobserwować sporadyczne spadki wydajności - prawdopodobnie z powodu throttlingu termicznego.
* ... im mniej tym lepiej
Reading continuous performance: DiskSpd Read Loop, Queue Depth 8
Karta graficzna
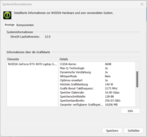
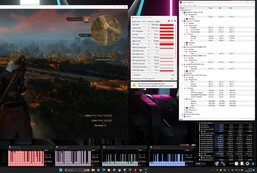
Aorus opiera się na.GeForce-RTX-4070 gPU w laptopie i przyznaje mu maksymalne możliwe TGP w wysokości 140 W (115 W + 25 W Dynamic Boost) - nie jest to w pełni wykorzystane wg Witcher 3 testu. GPU posiada 4 608 shaderów, magistralę o szerokości 128 bitów i szybką pamięć GDDR6 (8 192 MB).
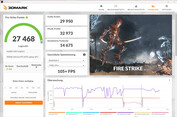
Wyniki benchmarku były wyższe od poprzedniej średniej RTX 4070. Tryb dGPU nie doprowadził do żadnej poprawy. Przełączanie między dGPU a Optimusem nie wymagało restartu - wspierany jest Advanced Optimus.
| 3DMark 06 Standard Score | 55615 pkt. | |
| 3DMark 11 Performance | 34985 pkt. | |
| 3DMark Cloud Gate Standard Score | 65819 pkt. | |
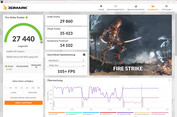
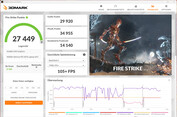
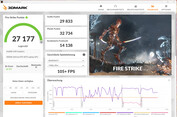
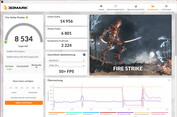
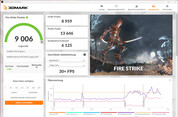
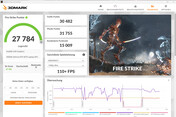
| 3DMark Fire Strike Score | 27468 pkt. | |
| 3DMark Time Spy Score | 12421 pkt. | |
Pomoc | ||
* ... im mniej tym lepiej
Wydajność w grach
Laptop jest przeznaczony do gier w rozdzielczości QHD na ustawieniach wysokich do maksymalnych. Wyższe rozdzielczości byłyby możliwe przy użyciu odpowiedniego monitora - ewentualnie przy obniżonych ustawieniach. Liczba klatek na sekundę w testowanych przez nas grach była na równi z ustaloną średnią RTX 4070. Tryb dGPU zwiększył nieco liczbę klatek na sekundę w niektórych grach.
| The Witcher 3 - 1920x1080 Ultra Graphics & Postprocessing (HBAO+) | |
| Średnia w klasie Gaming (18.4 - 240, n=49, ostatnie 2 lata) | |
| Asus ROG Strix G17 G713PI | |
| Acer Predator Helios 300 (i7-12700H, RTX 3070 Ti) | |
| Aorus 15X ASF | |
| Przeciętny NVIDIA GeForce RTX 4070 Laptop GPU (69.8 - 133.7, n=57) | |
| MSI Katana 17 B13VFK | |
| Razer Blade 15 OLED (Early 2022) | |
Aby sprawdzić, czy liczba klatek na sekundę pozostała niezmienna podczas dłuższego użytkowania, uruchomiliśmy grę The Witcher 3 przez około 60 minut w rozdzielczości Full HD przy użyciu maksymalnych ustawień jakości. Postać w grze nie była poruszana. Spadek liczby klatek na sekundę nie został zauważony.
Witcher 3 FPS diagram
| low | med. | high | ultra | QHD | |
|---|---|---|---|---|---|
| GTA V (2015) | 185.1 | 185.9 | 180.2 | 117.8 | 88.8 |
| The Witcher 3 (2015) | 484.7 | 366.3 | 228.3 | 117 | |
| Dota 2 Reborn (2015) | 191.9 | 181.1 | 161.1 | 149.4 | |
| Final Fantasy XV Benchmark (2018) | 208 | 167.2 | 117.5 | 83.7 | |
| X-Plane 11.11 (2018) | 164.9 | 145.5 | 117.1 | ||
| Far Cry 5 (2018) | 183 | 157 | 151 | 141 | 111 |
| Strange Brigade (2018) | 537 | 300 | 235 | 201 | 133.2 |
| Flight Simulator 2020 (2020) | 158.8 | 117.2 | 82.5 | 64.8 | 50.1 |
| F1 22 (2022) | 256 | 251 | 193.7 | 78.7 | 52.2 |
| FIFA 23 (2022) | 166.2 | ||||
| Uncharted Legacy of Thieves Collection (2022) | 92.7 | 89.4 | 84.4 | 82.1 | 61 |
| The Callisto Protocol (2022) | 155.6 | 127.5 | 121.8 | 79.7 | 58.4 |
| Need for Speed Unbound (2022) | 118.1 | 112.1 | 101 | 89.1 | 77.7 |
| High On Life (2023) | 236 | 185.9 | 141.6 | 114 | 68.5 |
| Dead Space Remake (2023) | 100.9 | 95.7 | 85.3 | 82.4 | 53.1 |
| Returnal (2023) | 119 | 117 | 106 | 90 | 66 |
| Atomic Heart (2023) | 199.8 | 158.3 | 96.4 | 79 | 58.9 |
| Company of Heroes 3 (2023) | 228.9 | 205.1 | 159.7 | 157.5 | 115.1 |
| Sons of the Forest (2023) | 98.3 | 86.8 | 83.3 | 82.3 | 69.5 |
| Resident Evil 4 Remake (2023) | 185.9 | 133.5 | 120.8 | 86.7 | 61.5 |
| The Last of Us (2023) | 73.1 | 60.9 | 56.9 | 56 | 53.3 |
Wydajność w grach przy zmniejszonej głośności
W pewnym stopniu 15X może spełnić życzenia użytkowników, którzy nie chcą zbyt głośnego laptopa do gier. Profil energetyczny "tryb spotkania" zapewnia ogólnie niższą głośność pracy przy zmniejszonej mocy obliczeniowej. Ta ostatnia jest jeszcze wystarczająca do gier na średnich i częściowo wysokich ustawieniach. Test Witcher 3 test przeprowadzono przy średniej liczbie klatek na sekundę 69 FPS, a TGP GPU wyniosło około 67 W.
| HD niski | FHD niski | FHD średni | FHD wysoki | FHD ultra | |
|---|---|---|---|---|---|
| GTA V | - | 73,7 fps | 68,2 fps | 50,3 fps | 27,2 fps |
| Dota 2 Reborn | 87,1 fps | - | - | 61,8 fps | 52,7 fps |
| Final Fantasy XV Benchmark | 56,7 fps | - | 49 fps | 40,7 fps | - |
| X-Plane 11.11 | 59,5 fps | - | 52,2 fps | 45,6 fps | - |
| Strange Brigade | 123.8 fps | - | 96.4 fps | 92.3 fps | 88.8 fps |
Emisja - Aorus ASF może pracować cicho
Emisja hałasu
Dwa wentylatory pracują zazwyczaj na niskich obrotach przy braku obciążenia i w codziennym użytkowaniu (biuro, Internet). Nie jest jednak wykluczone, że się rozkręcą - możliwe jest osiągnięcie poziomu do 38 dB(A). Pod obciążeniem zrobiło się bardzo głośno, a maksymalne wartości to 58 dB(A) (stress test) i 54 dB(A) (Witcher 3 test).
Aorus 15X jest zdolny do cichej do praktycznie bezgłośnej pracy. Wymaga to zastosowania profili energetycznych "tryb spotkania" lub "energooszczędny tryb bezczynności". Późniejsza obniżona wydajność komputera jest nadal więcej niż wystarczająca do codziennego użytku, a nawet pozwala na granie w gry na obniżonych ustawieniach.
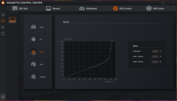
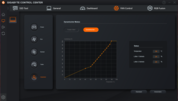
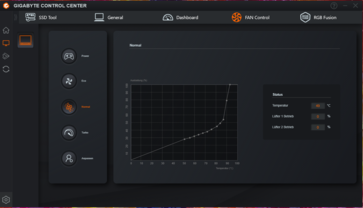
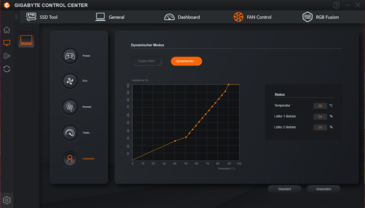
Centrum sterowania Gigabyte'a pozwala na kontrolę wentylatora. Dostępne są różne profile wentylatorów, można też stworzyć indywidualną krzywą wentylatora.
Hałas
| luz |
| 28 / 29 / 36 dB |
| obciążenie |
| 50 / 58 dB |
 | ||
30 dB cichy 40 dB(A) słyszalny 50 dB(A) irytujący |
||
min: | ||
| Aorus 15X ASF i7-13700HX, GeForce RTX 4070 Laptop GPU | Razer Blade 15 OLED (Early 2022) i9-12900H, GeForce RTX 3070 Ti Laptop GPU | MSI Katana 17 B13VFK i7-13620H, GeForce RTX 4060 Laptop GPU | Asus ROG Strix G17 G713PI R9 7945HX, GeForce RTX 4070 Laptop GPU | Acer Predator Helios 300 (i7-12700H, RTX 3070 Ti) i7-12700H, GeForce RTX 3070 Ti Laptop GPU | |
|---|---|---|---|---|---|
| Noise | 11% | 2% | 9% | 2% | |
| wyłączone / środowisko * (dB) | 25 | 26 -4% | 24.5 2% | 25 -0% | 23 8% |
| Idle Minimum * (dB) | 28 | 28 -0% | 24.5 12% | 26 7% | 23 18% |
| Idle Average * (dB) | 29 | 28 3% | 24.5 16% | 29 -0% | 25.92 11% |
| Idle Maximum * (dB) | 36 | 28 22% | 40 -11% | 30 17% | 40.67 -13% |
| Load Average * (dB) | 50 | 38.5 23% | 48.3 3% | 46 8% | 42.7 15% |
| Witcher 3 ultra * (dB) | 54 | 56 -4% | 46 15% | 62.48 -16% | |
| Load Maximum * (dB) | 58 | 43.9 24% | 59.1 -2% | 47 19% | 62.67 -8% |
* ... im mniej tym lepiej
Temperatura
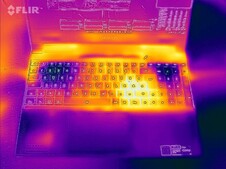
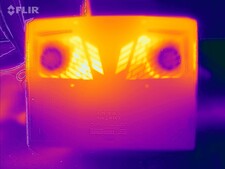
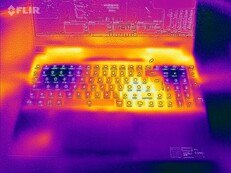
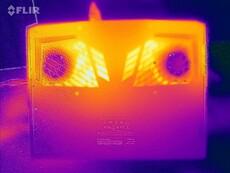
W codziennym użytkowaniu (biuro, Internet) temperatury obudowy pozostawały w granicach zielonej strefy. Pod obciążeniem (stress test, Witcher 3 test) laptop nagrzewał się zauważalnie, ale nie nadmiernie. Temperatury procesora nie są powodem do niepokoju.
(±) Maksymalna temperatura w górnej części wynosi 42 °C / 108 F, w porównaniu do średniej 40.4 °C / 105 F , począwszy od 21.2 do 68.8 °C dla klasy Gaming.
(-) Dno nagrzewa się maksymalnie do 51 °C / 124 F, w porównaniu do średniej 43.3 °C / 110 F
(+) W stanie bezczynności średnia temperatura górnej części wynosi 25.7 °C / 78 F, w porównaniu ze średnią temperaturą urządzenia wynoszącą 33.9 °C / ### class_avg_f### F.
(±) Podczas gry w Wiedźmina 3 średnia temperatura górnej części wynosi 34.2 °C / 94 F, w porównaniu do średniej temperatury urządzenia wynoszącej 33.9 °C / ## #class_avg_f### F.
(+) Podpórki pod nadgarstki i touchpad są chłodniejsze niż temperatura skóry i maksymalnie 28 °C / 82.4 F i dlatego są chłodne w dotyku.
(±) Średnia temperatura obszaru podparcia dłoni w podobnych urządzeniach wynosiła 28.8 °C / 83.8 F (+0.8 °C / 1.4 F).
| Aorus 15X ASF Intel Core i7-13700HX, NVIDIA GeForce RTX 4070 Laptop GPU | Razer Blade 15 OLED (Early 2022) Intel Core i9-12900H, NVIDIA GeForce RTX 3070 Ti Laptop GPU | MSI Katana 17 B13VFK Intel Core i7-13620H, NVIDIA GeForce RTX 4060 Laptop GPU | Asus ROG Strix G17 G713PI AMD Ryzen 9 7945HX, NVIDIA GeForce RTX 4070 Laptop GPU | Acer Predator Helios 300 (i7-12700H, RTX 3070 Ti) Intel Core i7-12700H, NVIDIA GeForce RTX 3070 Ti Laptop GPU | |
|---|---|---|---|---|---|
| Heat | -18% | -10% | -8% | -6% | |
| Maximum Upper Side * (°C) | 42 | 49.5 -18% | 41.6 1% | 42 -0% | 35 17% |
| Maximum Bottom * (°C) | 51 | 47.5 7% | 43.1 15% | 41 20% | 53 -4% |
| Idle Upper Side * (°C) | 27 | 33.4 -24% | 32 -19% | 33 -22% | 29 -7% |
| Idle Bottom * (°C) | 26 | 35 -35% | 35.8 -38% | 34 -31% | 34 -31% |
* ... im mniej tym lepiej
Test na stres
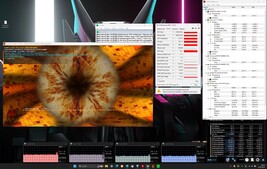
Test obciążeniowy (Prime95 i Furmark w ciągłym użyciu) symuluje ekstremalny scenariusz, by sprawdzić, jak stabilny jest system pod maksymalnym obciążeniem.
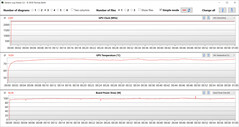
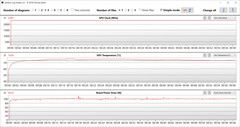
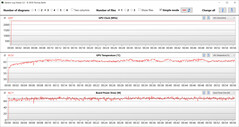
Procesor (P: 2,7 do 2,8 GHz, E: 2,1 do 2,2 GHz) rozpoczął test ze średnim taktowaniem. Po krótkim czasie częstotliwości taktowania spadły do około 2-2,5 GHz (rdzenie P) i 1,8-1,9 GHz (rdzenie E). Częstotliwość taktowania GPU spadła z 2,4 GHz do 2,1 GHz.
Mówcy
Głośniki stereo wytwarzają przyzwoity dźwięk, ale prawie nie ma basów. Dla lepszych wrażeń dźwiękowych zalecane są słuchawki lub głośniki zewnętrzne.
Aorus 15X ASF analiza dźwięku
(+) | głośniki mogą odtwarzać stosunkowo głośno (83 dB)
Bas 100 - 315 Hz
(-) | prawie brak basu - średnio 27.3% niższa od mediany
(-) | bas nie jest liniowy (15.1% delta do poprzedniej częstotliwości)
Średnie 400 - 2000 Hz
(±) | wyższe średnie - średnio 5.8% wyższe niż mediana
(+) | średnie są liniowe (4.8% delta do poprzedniej częstotliwości)
Wysokie 2–16 kHz
(+) | zrównoważone maksima - tylko 3.1% od mediany
(+) | wzloty są liniowe (6.3% delta do poprzedniej częstotliwości)
Ogólnie 100 - 16.000 Hz
(±) | liniowość ogólnego dźwięku jest średnia (20.1% różnicy w stosunku do mediany)
W porównaniu do tej samej klasy
» 71% wszystkich testowanych urządzeń w tej klasie było lepszych, 6% podobnych, 23% gorszych
» Najlepszy miał deltę 6%, średnia wynosiła ###średnia###%, najgorsza wynosiła 132%
W porównaniu do wszystkich testowanych urządzeń
» 51% wszystkich testowanych urządzeń było lepszych, 8% podobnych, 41% gorszych
» Najlepszy miał deltę 4%, średnia wynosiła ###średnia###%, najgorsza wynosiła 134%
Asus ROG Strix G17 G713PI analiza dźwięku
(±) | głośność głośnika jest średnia, ale dobra (81 dB)
Bas 100 - 315 Hz
(+) | dobry bas - tylko 4.6% od mediany
(+) | bas jest liniowy (6.5% delta do poprzedniej częstotliwości)
Średnie 400 - 2000 Hz
(+) | zbalansowane środki średnie - tylko 3.1% od mediany
(+) | średnie są liniowe (5.9% delta do poprzedniej częstotliwości)
Wysokie 2–16 kHz
(+) | zrównoważone maksima - tylko 3.5% od mediany
(+) | wzloty są liniowe (6.8% delta do poprzedniej częstotliwości)
Ogólnie 100 - 16.000 Hz
(+) | ogólny dźwięk jest liniowy (9.5% różnicy w stosunku do mediany)
W porównaniu do tej samej klasy
» 3% wszystkich testowanych urządzeń w tej klasie było lepszych, 1% podobnych, 95% gorszych
» Najlepszy miał deltę 6%, średnia wynosiła ###średnia###%, najgorsza wynosiła 132%
W porównaniu do wszystkich testowanych urządzeń
» 3% wszystkich testowanych urządzeń było lepszych, 1% podobnych, 96% gorszych
» Najlepszy miał deltę 4%, średnia wynosiła ###średnia###%, najgorsza wynosiła 134%
Zarządzanie energią - komputerowi Aorus nie brakuje wytrzymałości
Pobór mocy
Laptop Gigabyte nie wykazał żadnych nieprawidłowości w zakresie zużycia energii. Wskaźniki te były na normalnym poziomie dla zainstalowanego sprzętu. Na stronie Witcher 3 testy i stress test były uruchamiane przy względnie stałym poborze mocy. Złącze zasilania (280 W) ma wystarczającą wielkość.
| wyłączony / stan wstrzymania | |
| luz | |
| obciążenie |
|
Legenda:
min: | |
| Aorus 15X ASF i7-13700HX, GeForce RTX 4070 Laptop GPU | Razer Blade 15 OLED (Early 2022) i9-12900H, GeForce RTX 3070 Ti Laptop GPU | MSI Katana 17 B13VFK i7-13620H, GeForce RTX 4060 Laptop GPU | Asus ROG Strix G17 G713PI R9 7945HX, GeForce RTX 4070 Laptop GPU | Acer Predator Helios 300 (i7-12700H, RTX 3070 Ti) i7-12700H, GeForce RTX 3070 Ti Laptop GPU | Przeciętny NVIDIA GeForce RTX 4070 Laptop GPU | Średnia w klasie Gaming | |
|---|---|---|---|---|---|---|---|
| Power Consumption | -57% | 15% | -14% | -19% | -2% | -11% | |
| Idle Minimum * (Watt) | 11 | 31.6 -187% | 12.2 -11% | 15 -36% | 15 -36% | 13.2 ? -20% | 13.6 ? -24% |
| Idle Average * (Watt) | 16 | 33.3 -108% | 14.9 7% | 20 -25% | 20 -25% | 18.2 ? -14% | 19.4 ? -21% |
| Idle Maximum * (Watt) | 24 | 38.6 -61% | 15.8 34% | 29 -21% | 22.3 7% | 24.6 ? -3% | 25.8 ? -8% |
| Load Average * (Watt) | 104 | 149 -43% | 85.22 18% | 121 -16% | 133 -28% | 97 ? 7% | 110.6 ? -6% |
| Witcher 3 ultra * (Watt) | 185.4 | 149.6 19% | 151.1 19% | 179.8 3% | 231 -25% | ||
| Load Maximum * (Watt) | 272 | 160 41% | 212.8 22% | 246 10% | 290 -7% | 221 ? 19% | 260 ? 4% |
* ... im mniej tym lepiej
Power consumption Witcher 3 / stress test
Power consumption with external monitor
Runtimes
W teście WLAN (wywoływanie stron internetowych przez skrypt) i teście wideo (krótki film Big Buck Bunny (kodowanie H.264, FHD) w pętli) 15,6-calowe urządzenie osiągnęło odpowiednio 8:09 h i 7:52 h. Podczas obu testów funkcje energooszczędne notebooka były wyłączone, a jasność wyświetlacza ustawiona na około 150 cd/m². W teście wideo wyłączone były również moduły łączności bezprzewodowej.
Aorus 15 uzyskał ogólnie dobre czasy pracy na akumulatorze - nie tylko jak na laptop do gier. Biorąc pod uwagę ogromną pojemność akumulatora (99 Wh), takie wskaźniki nie są zaskakujące. Niemniej jednak laptop Gigabyte'a wyprzedza go także pod względem watogodzin.
| Aorus 15X ASF i7-13700HX, GeForce RTX 4070 Laptop GPU, 99 Wh | Razer Blade 15 OLED (Early 2022) i9-12900H, GeForce RTX 3070 Ti Laptop GPU, 80 Wh | MSI Katana 17 B13VFK i7-13620H, GeForce RTX 4060 Laptop GPU, 53.5 Wh | Asus ROG Strix G17 G713PI R9 7945HX, GeForce RTX 4070 Laptop GPU, 90 Wh | Acer Predator Helios 300 (i7-12700H, RTX 3070 Ti) i7-12700H, GeForce RTX 3070 Ti Laptop GPU, 90 Wh | Średnia w klasie Gaming | |
|---|---|---|---|---|---|---|
| Czasy pracy | -26% | -58% | -54% | -21% | -15% | |
| Reader / Idle (h) | 11.3 | 6.7 -41% | 9.24 ? -18% | |||
| H.264 (h) | 7.9 | 5.9 -25% | 2.8 -65% | 5.9 -25% | 8.13 ? 3% | |
| WiFi v1.3 (h) | 8.2 | 4.6 -44% | 2.9 -65% | 4.3 -48% | 6 -27% | 6.74 ? -18% |
| Load (h) | 2 | 2.1 5% | 1 -50% | 1 -50% | 1.8 -10% | 1.449 ? -28% |
| Witcher 3 ultra (h) | 1.1 | 0.958 ? |
Za
Przeciw
Werdykt - dobrze dopracowany laptop do gier
Choć Aorus 15X został zaprojektowany z myślą o grach w rozdzielczości QHD na wysokich do maksymalnych ustawieniach, to dobrze radzi sobie także w innych wymagających dziedzinach, takich jak edycja i renderowanie wideo. Na stronie .Core i7-13700HX orazGeForce RTX 4070 laptopa zapewniają niezbędną moc obliczeniową. Superszybki dysk PCIe-4-SSD (1 TB) zapewnia krótkie czasy ładowania.
Mocny, wytrzymały, cichy w razie potrzeby - Aorus 15X ASF potrafi sprostać wielu wymaganiom stawianym nowoczesnemu laptopowi do gier.
CPU i GPU pracują z niezmiennie wysokimi częstotliwościami taktowania. Hałas i rozwój ciepła są na zwykłym wysokim poziomie. Możliwa jest jednak cicha do całkowicie bezgłośnej praca - przy znacznie zmniejszonej mocy obliczeniowej. Mimo to nadal spełniałoby to wymagania użytkowników w codziennym użytkowaniu i umożliwiało granie na obniżonych ustawieniach.
Matowy ekran QHD (15,6 cala, IPS, 240 Hz) nie wymaga krytyki. Port Thunderbolt 4 otwiera opcje rozbudowy (rozwiązanie dokujące, zewnętrzne GPU). Można go też wykorzystać do zasilania laptopa przez zasilacz USB-C (minimum 65 W) - wspierane jest Power Delivery. Czasy pracy na akumulatorze na poziomie około 8 godzin dopełniają całości.
Na stronieRazer Blade 15 OLED może okazać się realną alternatywą dla tego urządzenia. Oferuje mniejszą moc obliczeniową niż laptop Aorus, ale zdobywa dodatkowe punkty dzięki bardziej kompaktowym wymiarom, niższej wadze i wysokokontrastowemu, wiernemu kolorowi ekranowi OLED.
Cena i dostępność
Aorus 15X ASF można kupić w konfiguracji, którą testowaliśmy za 2 099 dolarów na Amazon.
Aorus 15X ASF
- 05/04/2023 v7 (old)
Sascha Mölck
Przezroczystość
Wyboru urządzeń do recenzji dokonuje nasza redakcja. Próbka testowa została udostępniona autorowi jako pożyczka od producenta lub sprzedawcy detalicznego na potrzeby tej recenzji. Pożyczkodawca nie miał wpływu na tę recenzję, producent nie otrzymał też kopii tej recenzji przed publikacją. Nie było obowiązku publikowania tej recenzji. Jako niezależna firma medialna, Notebookcheck nie podlega władzy producentów, sprzedawców detalicznych ani wydawców.
Tak testuje Notebookcheck
Każdego roku Notebookcheck niezależnie sprawdza setki laptopów i smartfonów, stosując standardowe procedury, aby zapewnić porównywalność wszystkich wyników. Od około 20 lat stale rozwijamy nasze metody badawcze, ustanawiając przy tym standardy branżowe. W naszych laboratoriach testowych doświadczeni technicy i redaktorzy korzystają z wysokiej jakości sprzętu pomiarowego. Testy te obejmują wieloetapowy proces walidacji. Nasz kompleksowy system ocen opiera się na setkach uzasadnionych pomiarów i benchmarków, co pozwala zachować obiektywizm.

