Debiut wydajnościowy Core i7-13700HX: Recenzja laptopa Uniwill GM6PX7X IDX

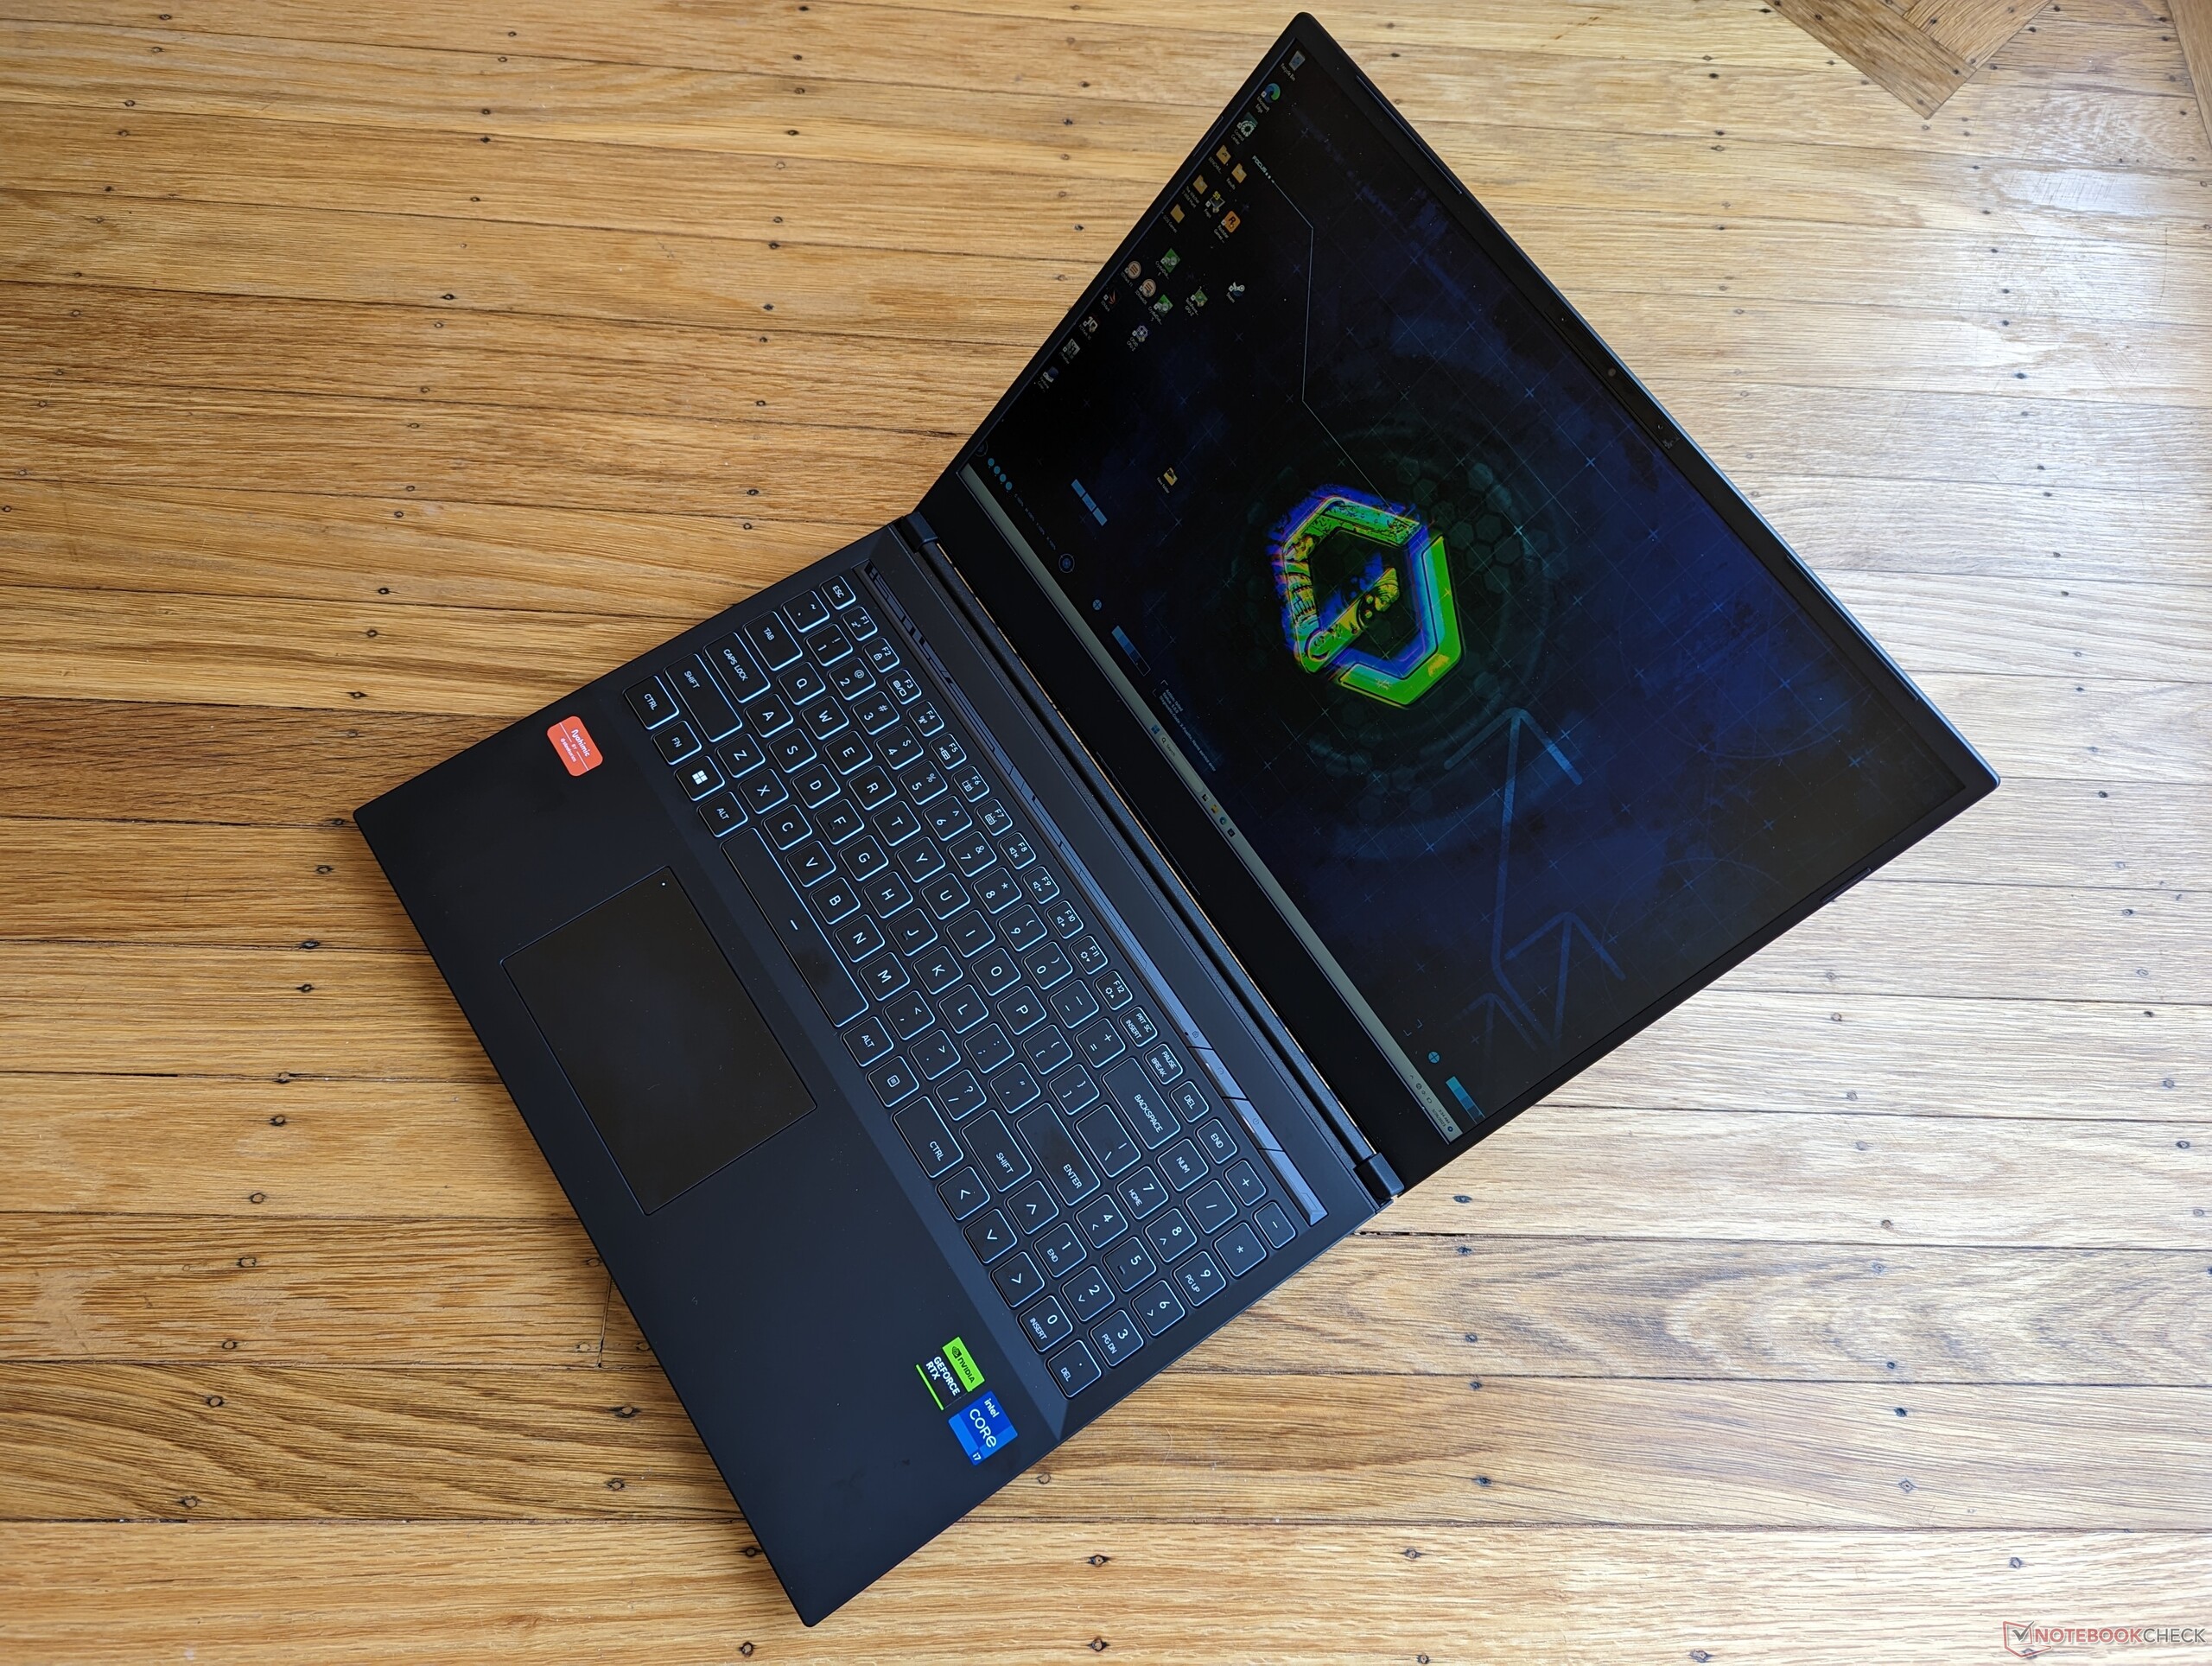
Uniwill GM6PX7X to 16-calowa konstrukcja białego laptopa gamingowego znana na niektórych rynkach jako Schenker XMG Neo 16 E23. Jest to nowszy model ujawniony na targach CES 2023 obok mobilnej serii 13 gen Raptor Lake-H i mobilnej serii Ada Lovelace GeForce RTX 40.
Podobnie jak większość innych modeli Uniwill lub Schenker, GM6PX7X jest wysoce konfigurowalny z opcjami CPU do Core i9-13900HX i opcjami GPU od mobilnego GeForce RTX 4060 do 4090. Nasz egzemplarz recenzencki to konfiguracja klasy średniej wyposażona w procesor Core i7-13700HX i kartę RTX 4070.
Więcej informacji na temat obudowy można znaleźć w naszej pełnej recenzji Schenker XMG Neo 16 E23 z RTX 4090, a także w naszym Uniwill GM6PX7X z RTX 4070. Jest jednak między nimi kilka fizycznych różnic, na które zwrócimy uwagę poniżej.
Więcej recenzji Uniwill/Schenker:
Potencjalni konkurenci w porównaniu
Ocena | Data | Model | Waga | Wysokość | Rozmiar | Rezolucja | Cena |
|---|---|---|---|---|---|---|---|
| 88.2 % v7 (old) | 03/2023 | Uniwill GM6PX7X RTX 4070 i7-13700HX, GeForce RTX 4070 Laptop GPU | 2.2 kg | 22 mm | 16.00" | 2560x1600 | |
| 87.7 % v7 (old) | Schenker XMG Neo 16 E23 i9-13900HX, GeForce RTX 4090 Laptop GPU | 2.5 kg | 29.9 mm | 16.00" | 2560x1600 | ||
| 88.4 % v7 (old) | 03/2023 | Asus ROG Strix G16 G614JZ i9-13980HX, GeForce RTX 4080 Laptop GPU | 2.4 kg | 30.4 mm | 16.00" | 2560x1600 | |
| 89.4 % v7 (old) | 02/2023 | Lenovo Legion Pro 7 16IRX8H i9-13900HX, GeForce RTX 4080 Laptop GPU | 2.7 kg | 26 mm | 16.00" | 2560x1600 | |
| 86.2 % v7 (old) | 03/2023 | Gigabyte AERO 16 OLED BSF i9-13900H, GeForce RTX 4070 Laptop GPU | 2.1 kg | 18 mm | 16.00" | 3840x2400 | |
| 91.2 % v7 (old) | 02/2023 | Razer Blade 16 Early 2023 i9-13950HX, GeForce RTX 4080 Laptop GPU | 2.4 kg | 21.99 mm | 16.00" | 2560x1600 |
Sprawa
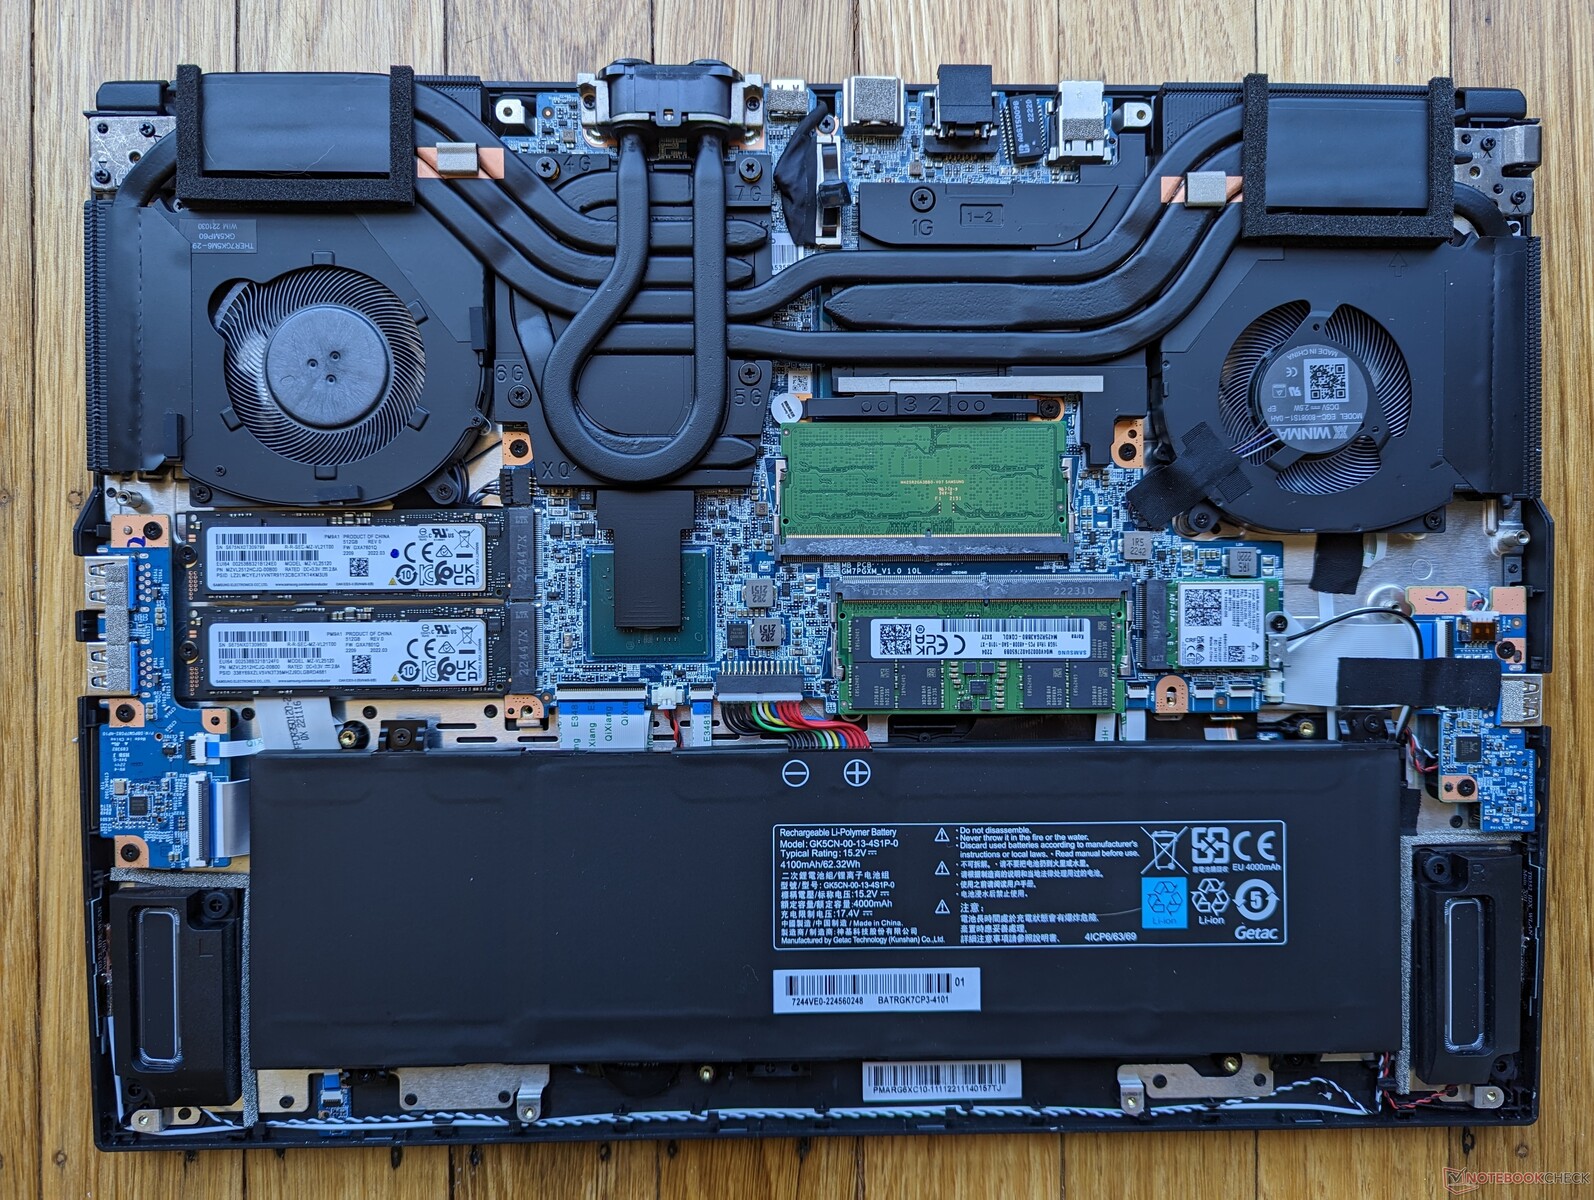
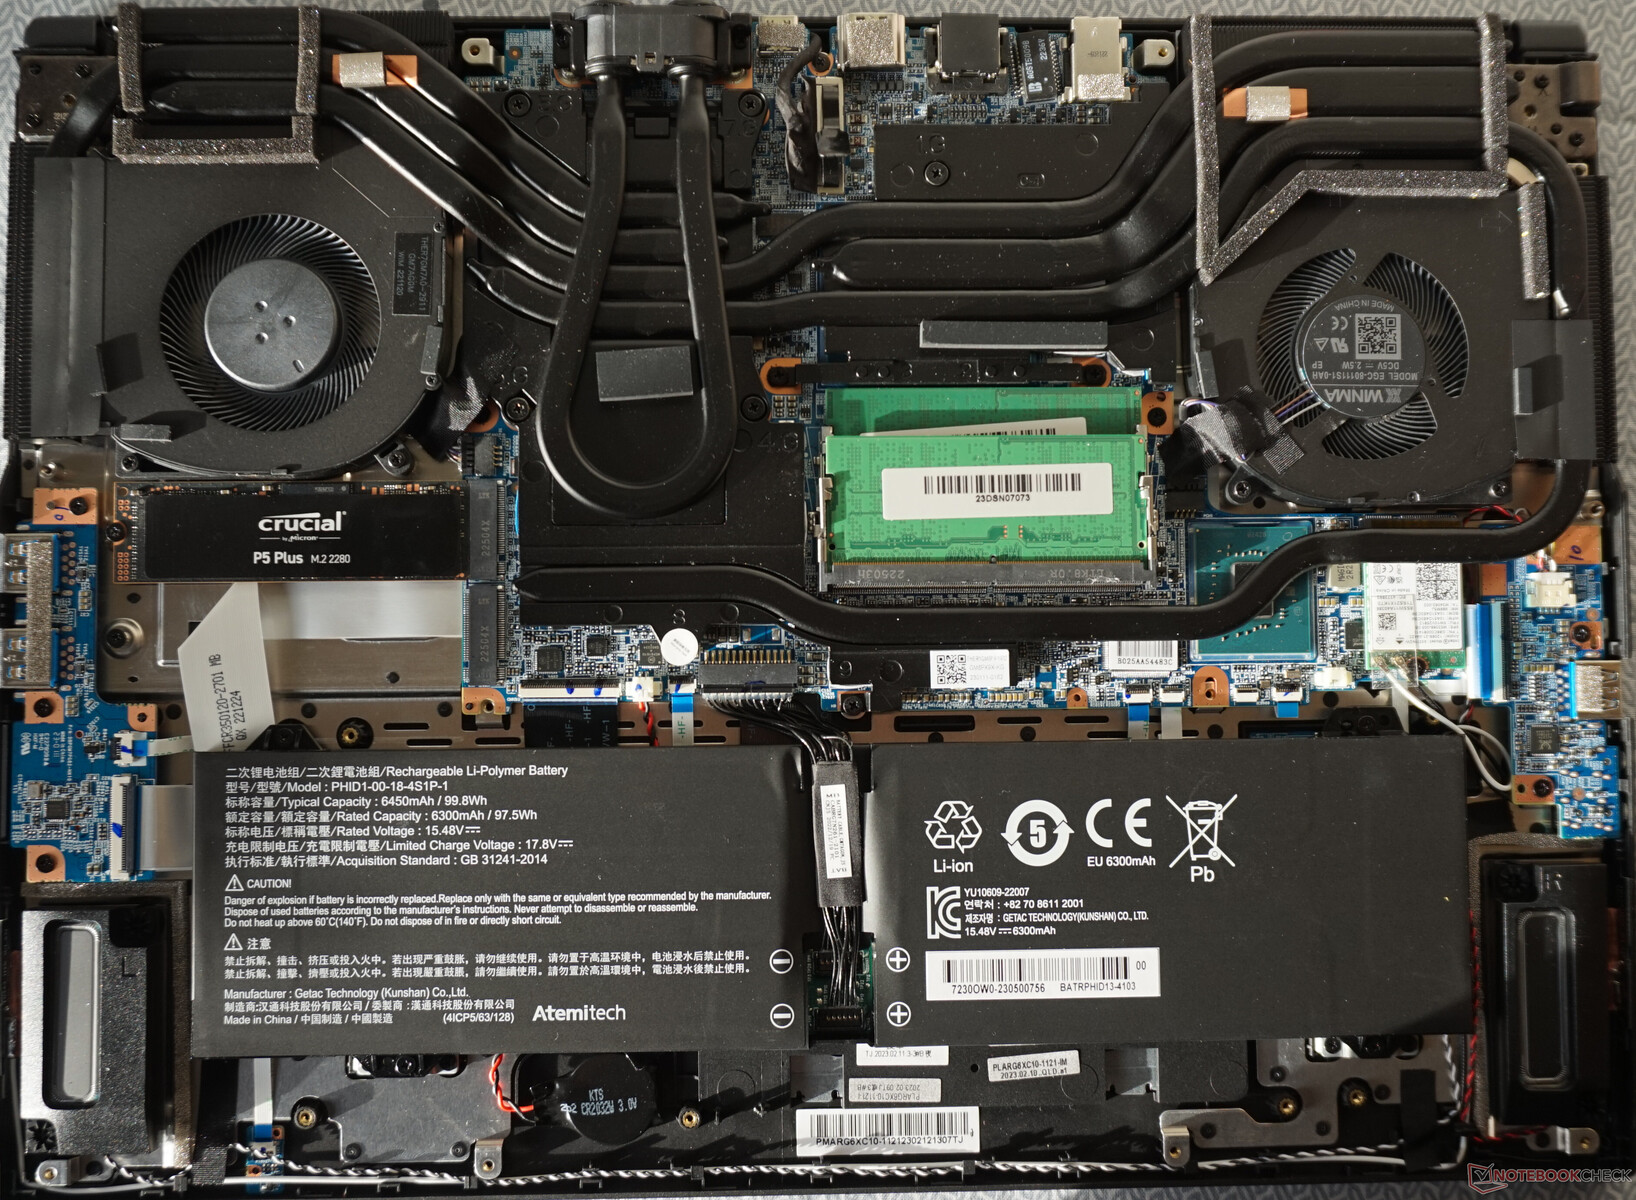
Istnieją dwie wersje obudowy Schenker XMG Neo 16: jedna cieńsza konstrukcja dla wszystkich konfiguracji RTX 4060 i 4070 oraz jedna grubsza dla wszystkich konfiguracji RTX 4080 i 4090. Mobilne procesory graficzne RTX 4080/4090 są bardziej wymagające pod względem mocy niż mobilne RTX 4060/4070, dlatego wymagają większego rozmiaru obudowy. Główne różnice pomiędzy obiema wersjami obejmują:
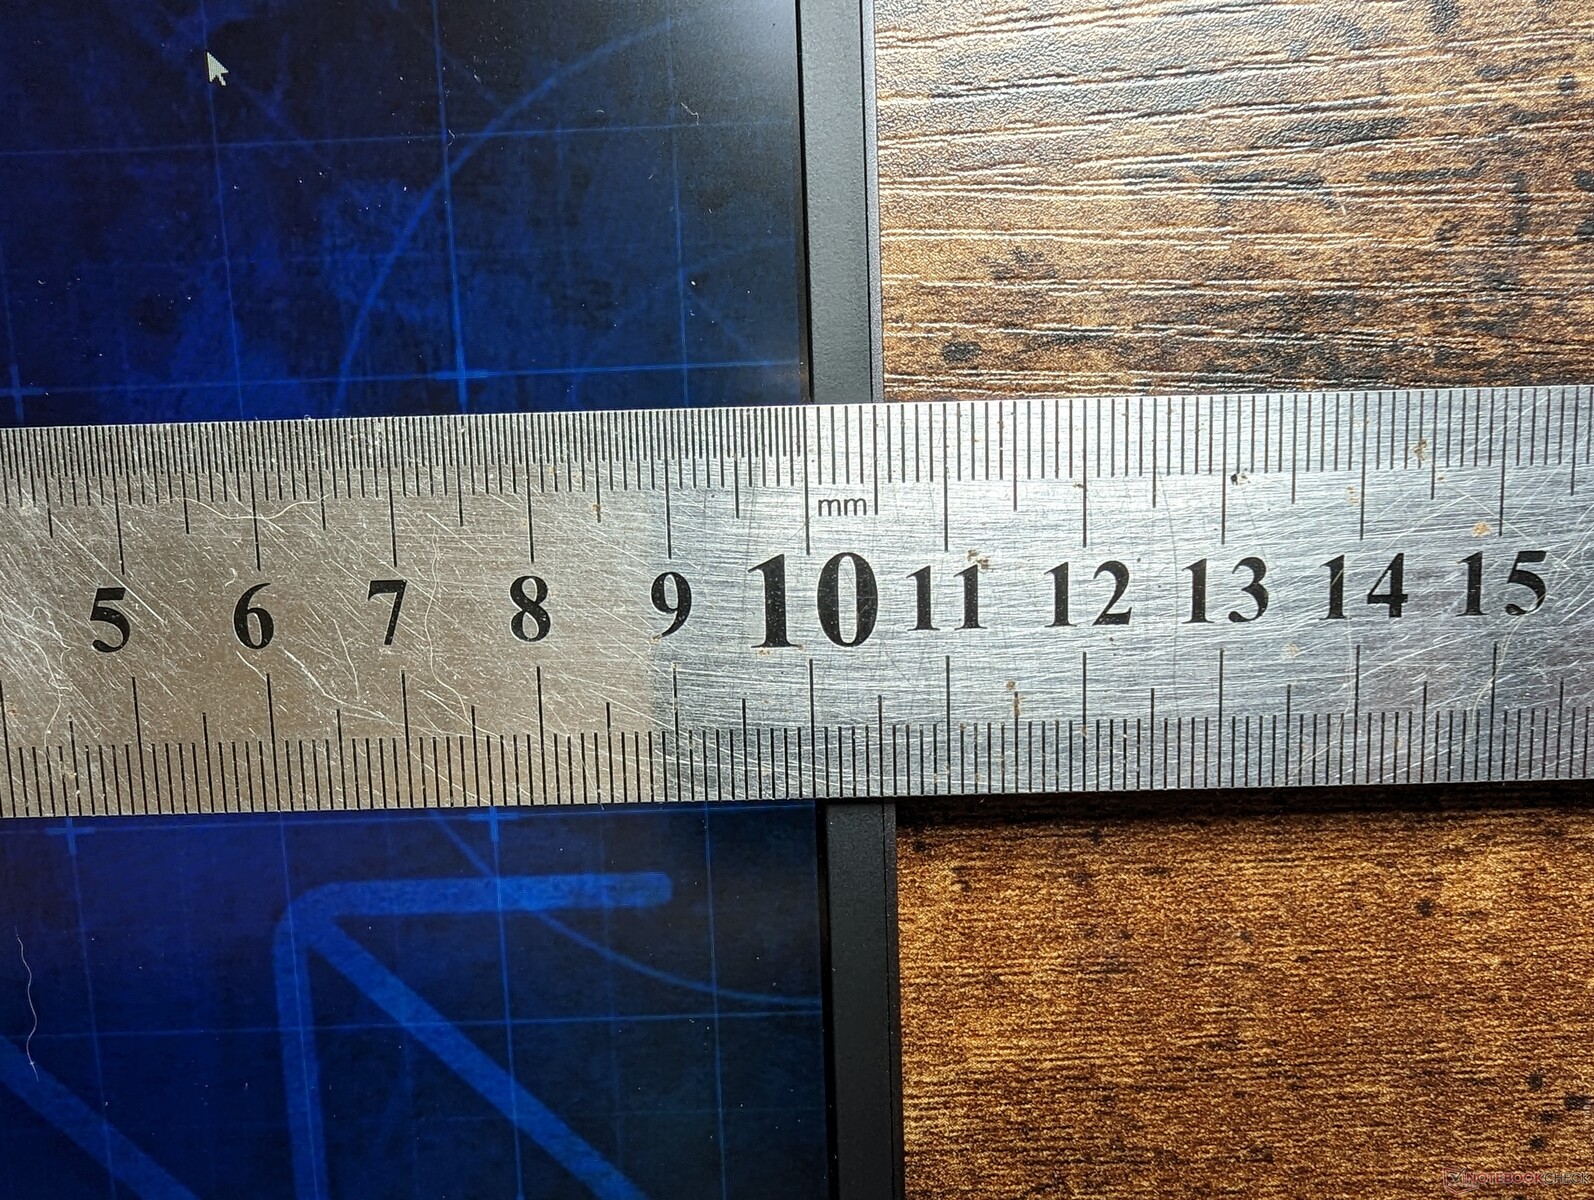
- Grubość: 22 mm vs. 26,1 mm
- Waga: 2,2 kg vs. 2,5 kg
- Pojemność akumulatora: 62 Wh vs. 99 Wh
- Kamera internetowa: 1 MP vs. 2 MP
- Zasilacz sieciowy: 280 W vs. 330 W
Obie wersje mają takie same klawiatury (membranowa lub mechaniczna Cherry MX), gładzik, porty, wyświetlacz i materiały, z których wykonano obudowę.
Czytnik kart SD
| SD Card Reader | |
| average JPG Copy Test (av. of 3 runs) | |
| Gigabyte AERO 16 OLED BSF | |
| Razer Blade 16 Early 2023 (AV PRO microSD 128 GB V60) | |
| Schenker XMG Neo 16 E23 (AV PRO microSD 128 GB V60) | |
| Uniwill GM6PX7X RTX 4070 (AV PRO microSD 128 GB V60) | |
| maximum AS SSD Seq Read Test (1GB) | |
| Razer Blade 16 Early 2023 (AV PRO microSD 128 GB V60) | |
| Gigabyte AERO 16 OLED BSF | |
| Uniwill GM6PX7X RTX 4070 (AV PRO microSD 128 GB V60) | |
| Schenker XMG Neo 16 E23 (AV PRO microSD 128 GB V60) | |
Komunikacja
| Networking | |
| iperf3 transmit AXE11000 | |
| Schenker XMG Neo 16 E23 | |
| Lenovo Legion Pro 7 16IRX8H | |
| Asus ROG Strix G16 G614JZ | |
| Razer Blade 16 Early 2023 | |
| Uniwill GM6PX7X RTX 4070 | |
| iperf3 receive AXE11000 | |
| Schenker XMG Neo 16 E23 | |
| Lenovo Legion Pro 7 16IRX8H | |
| Asus ROG Strix G16 G614JZ | |
| Razer Blade 16 Early 2023 | |
| Uniwill GM6PX7X RTX 4070 | |
| iperf3 transmit AXE11000 6GHz | |
| Gigabyte AERO 16 OLED BSF | |
| Razer Blade 16 Early 2023 | |
| iperf3 receive AXE11000 6GHz | |
| Gigabyte AERO 16 OLED BSF | |
| Razer Blade 16 Early 2023 | |
Kamera internetowa


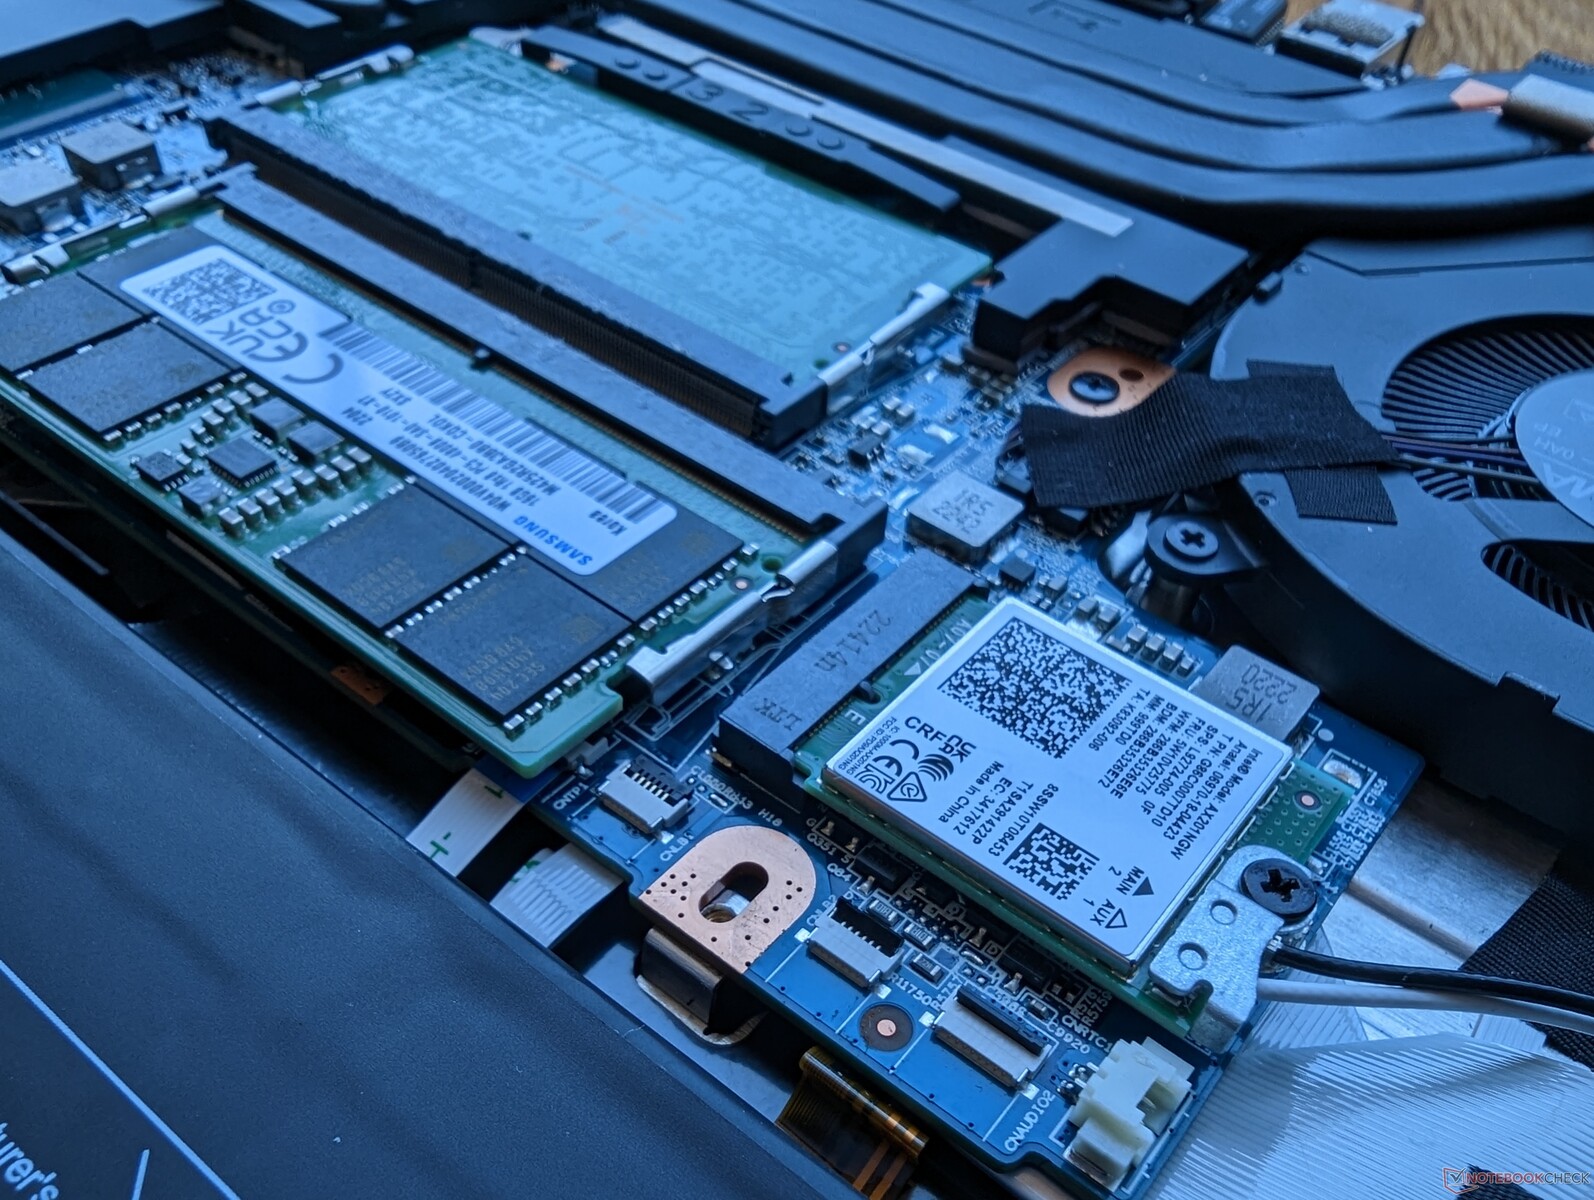
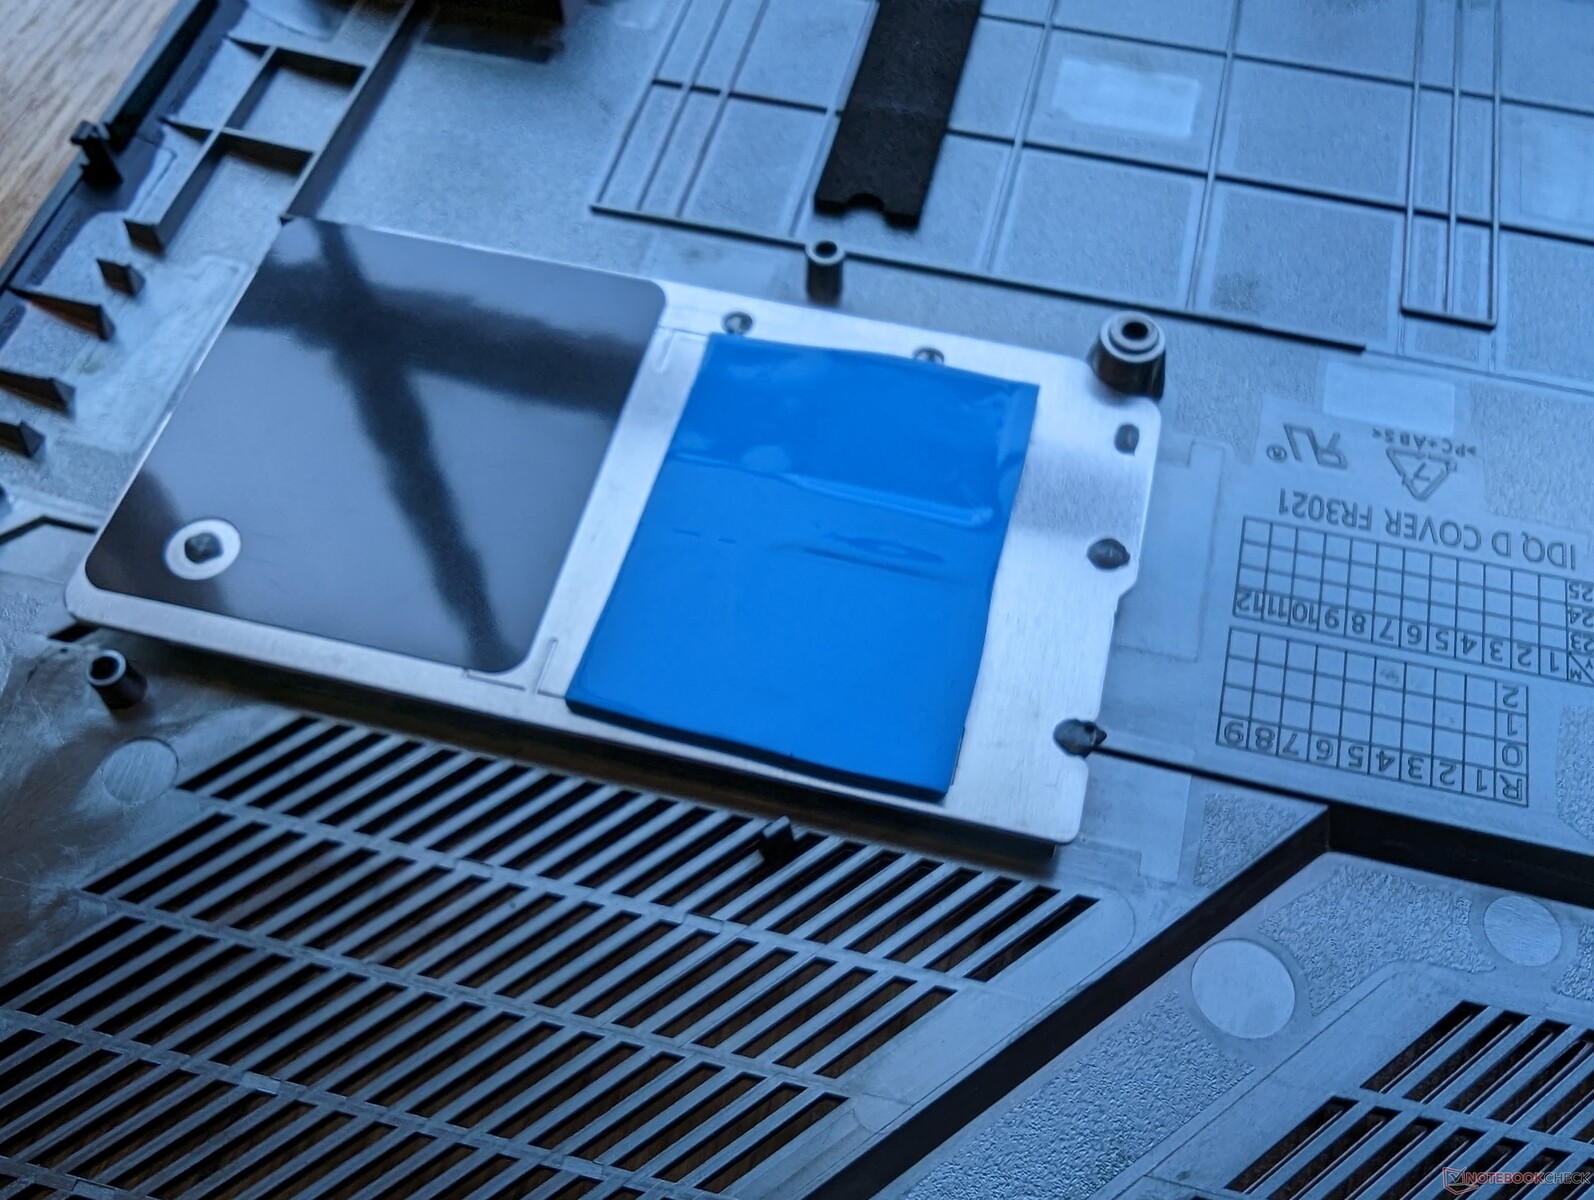
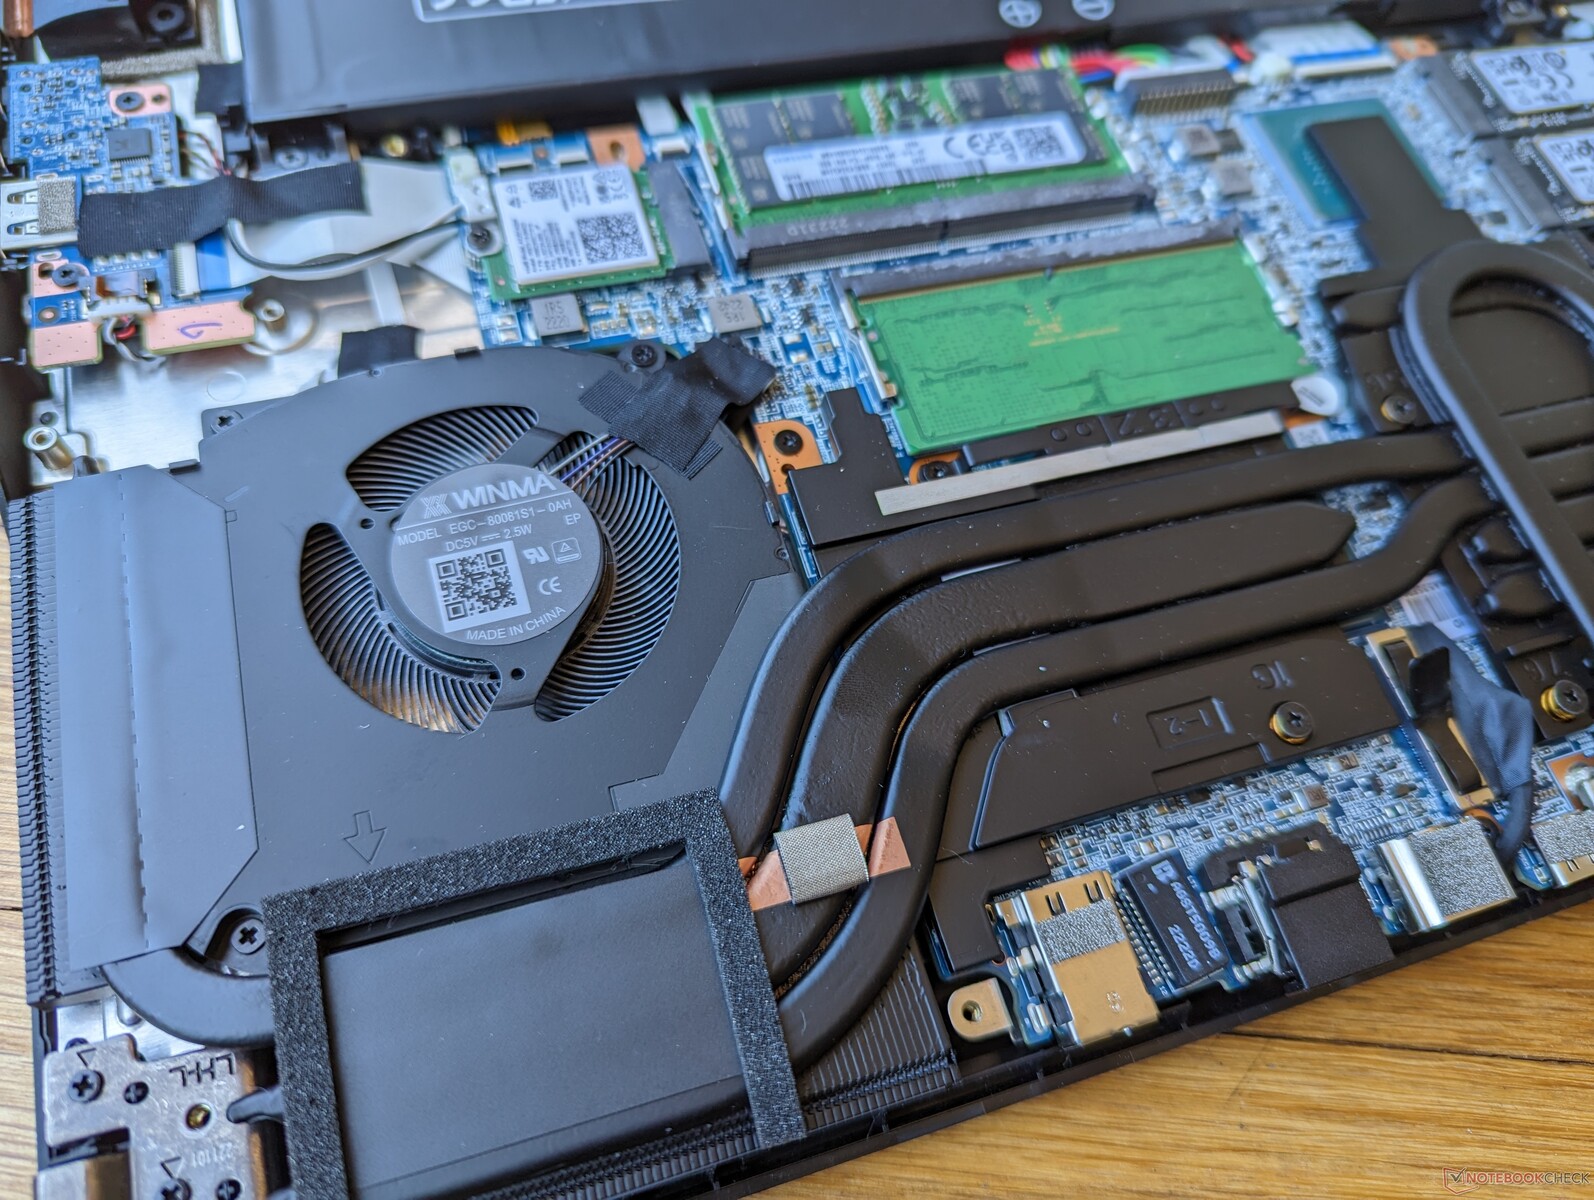
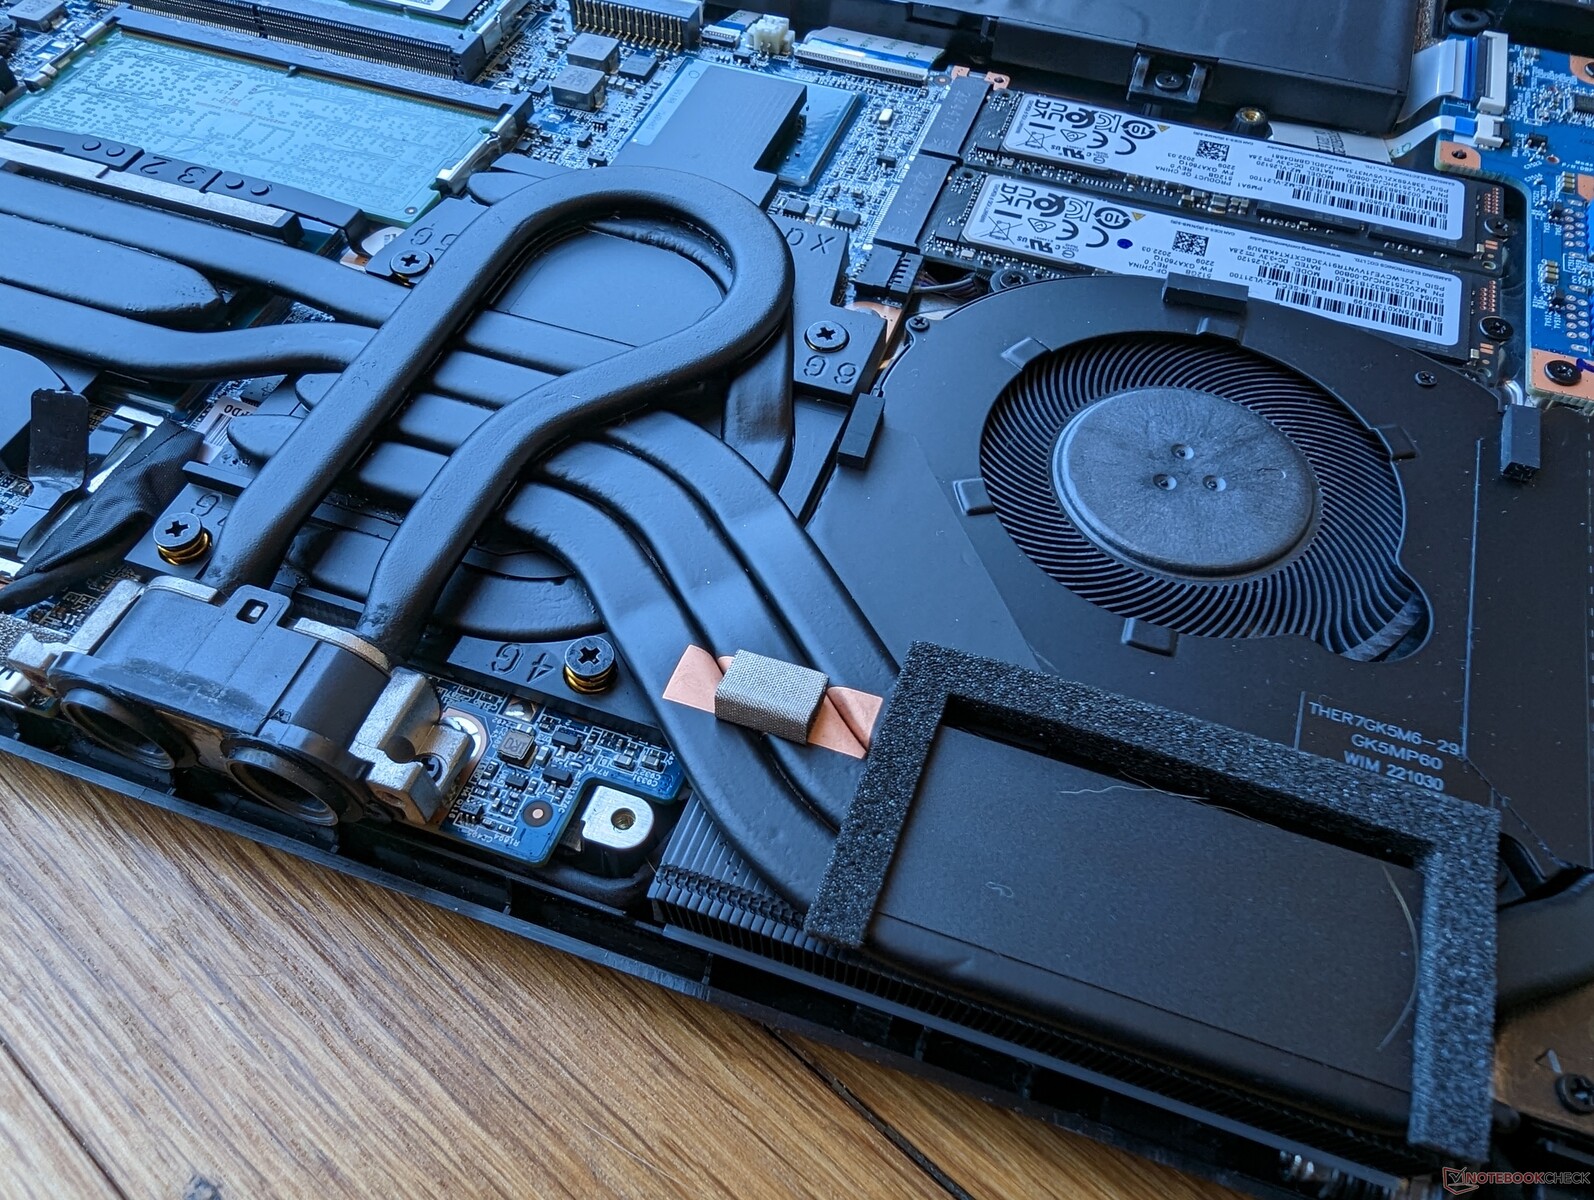
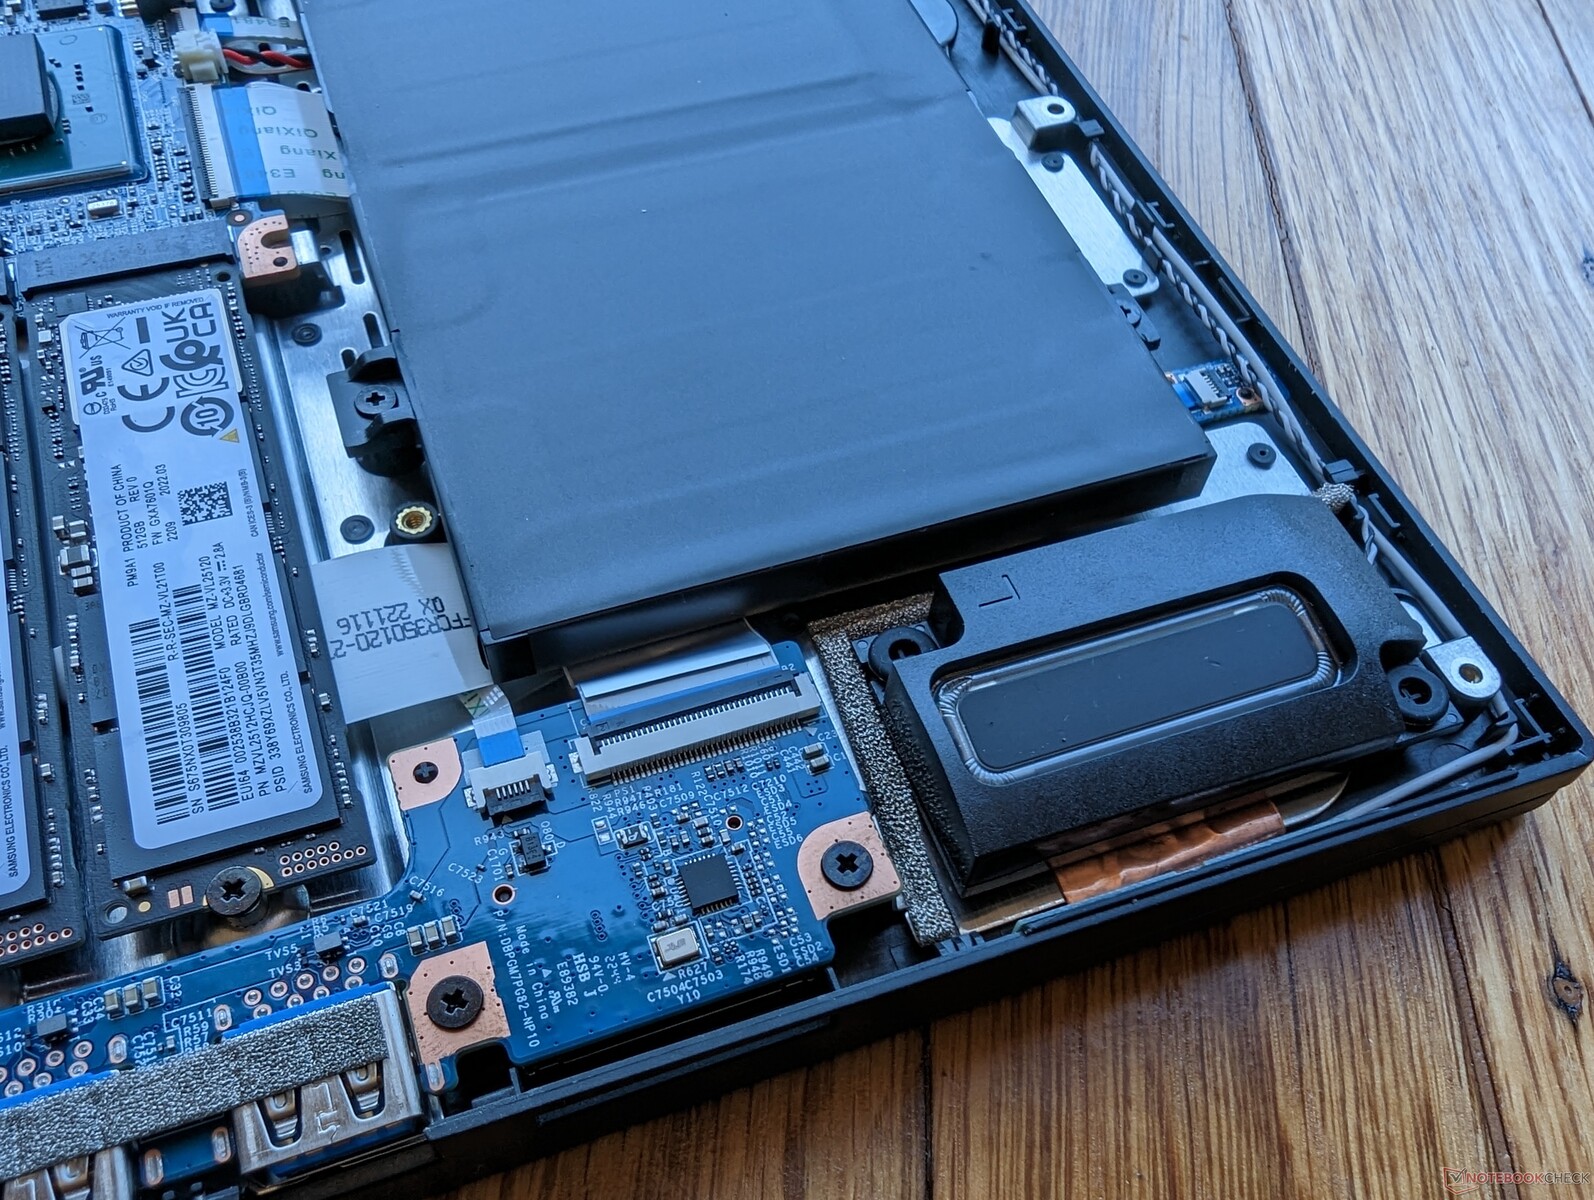
Konserwacja
Wyświetl
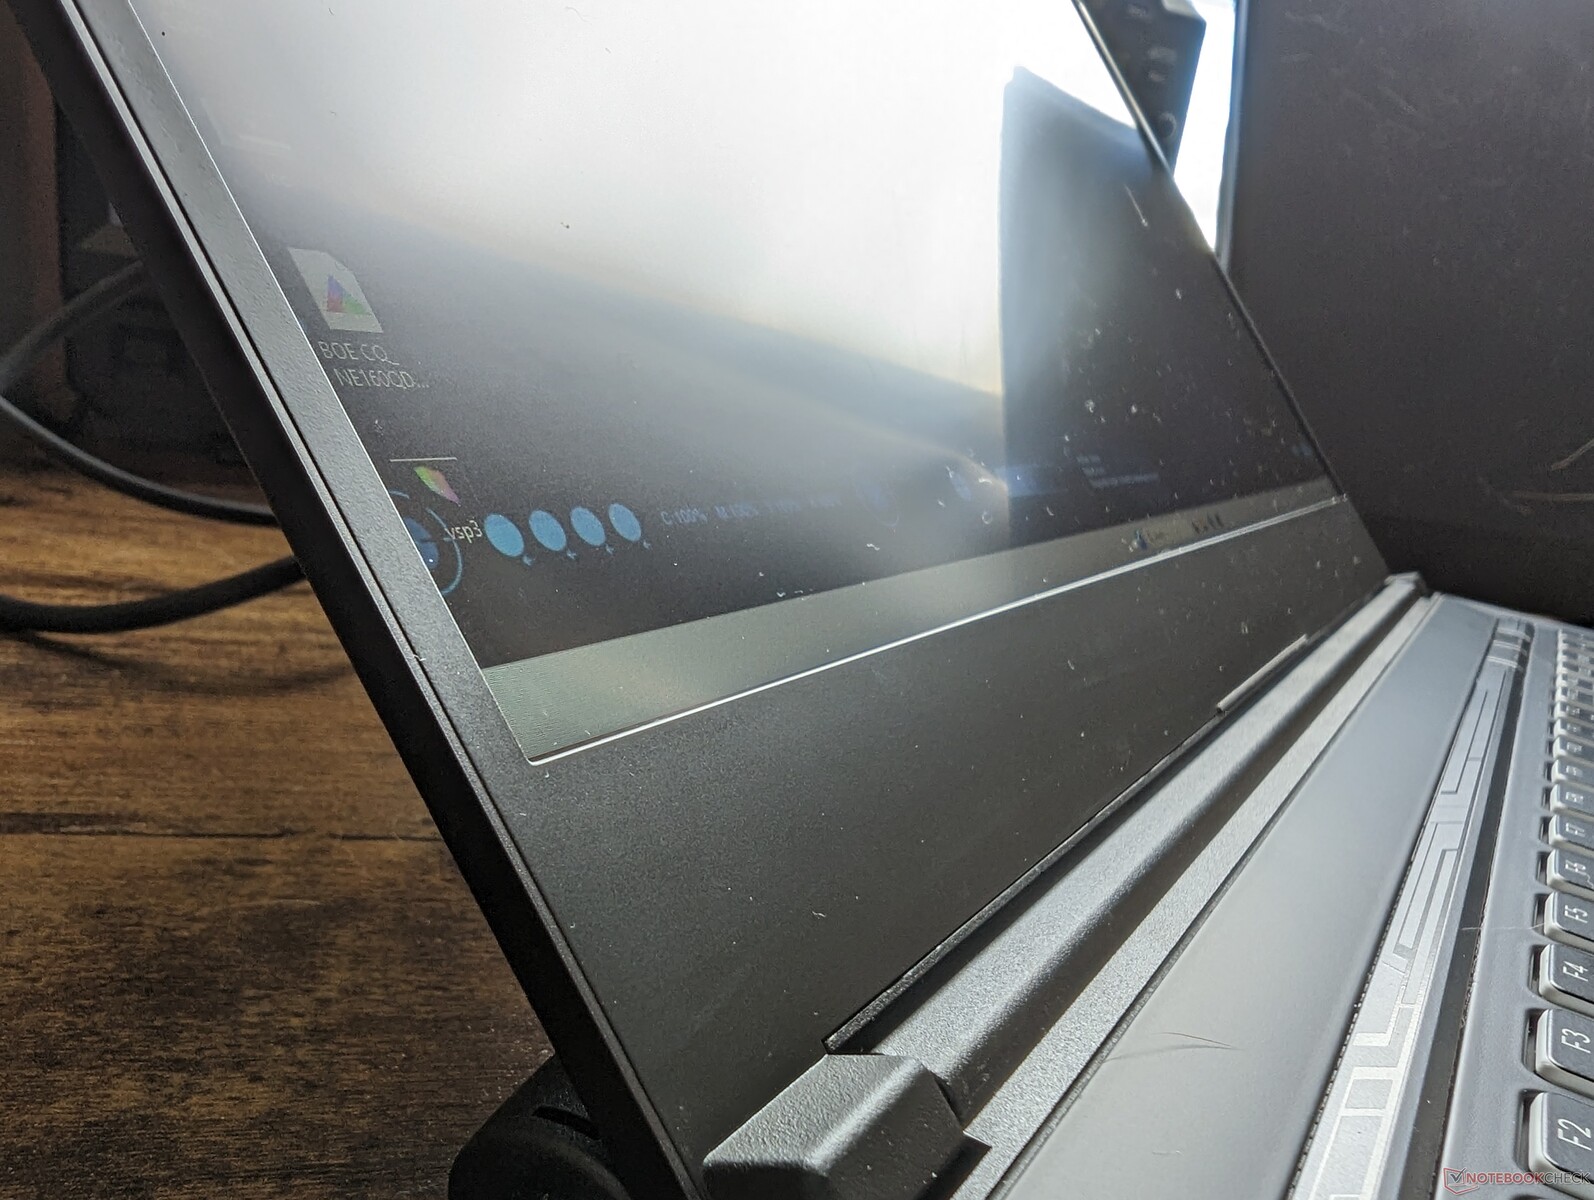
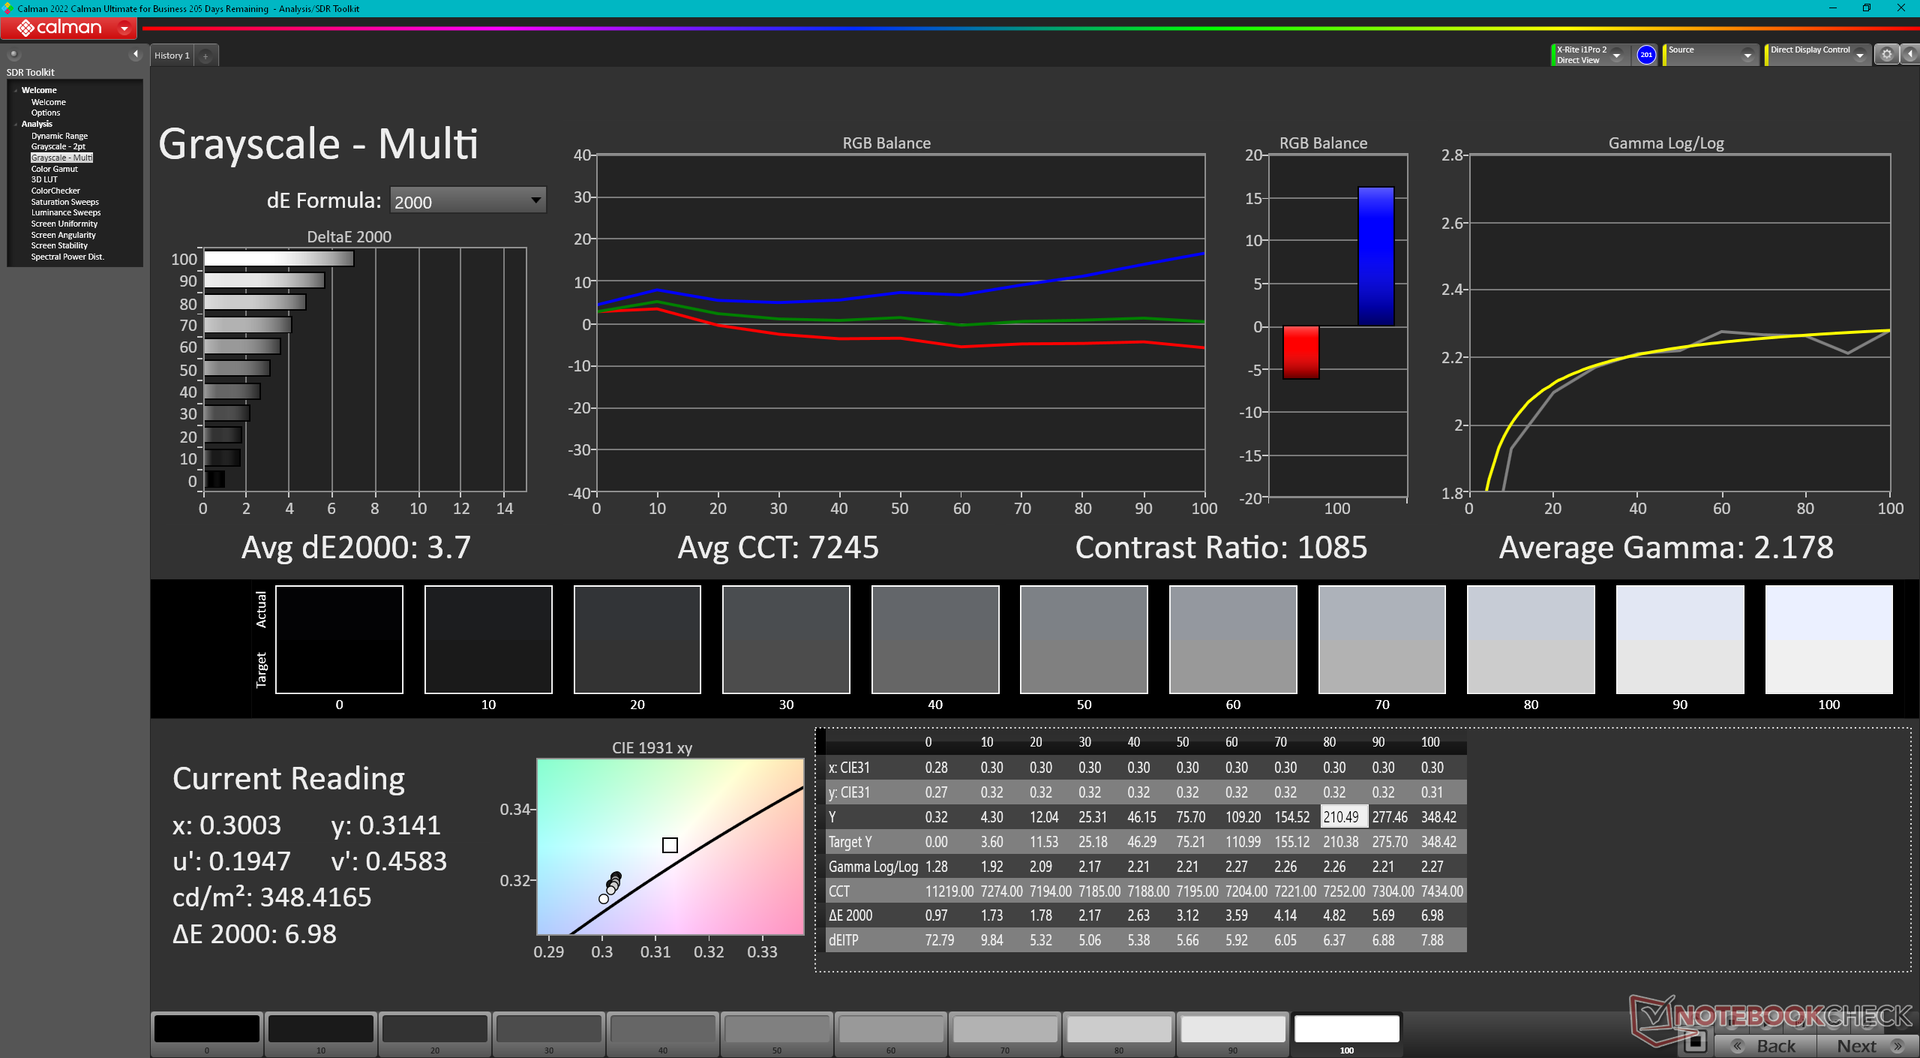
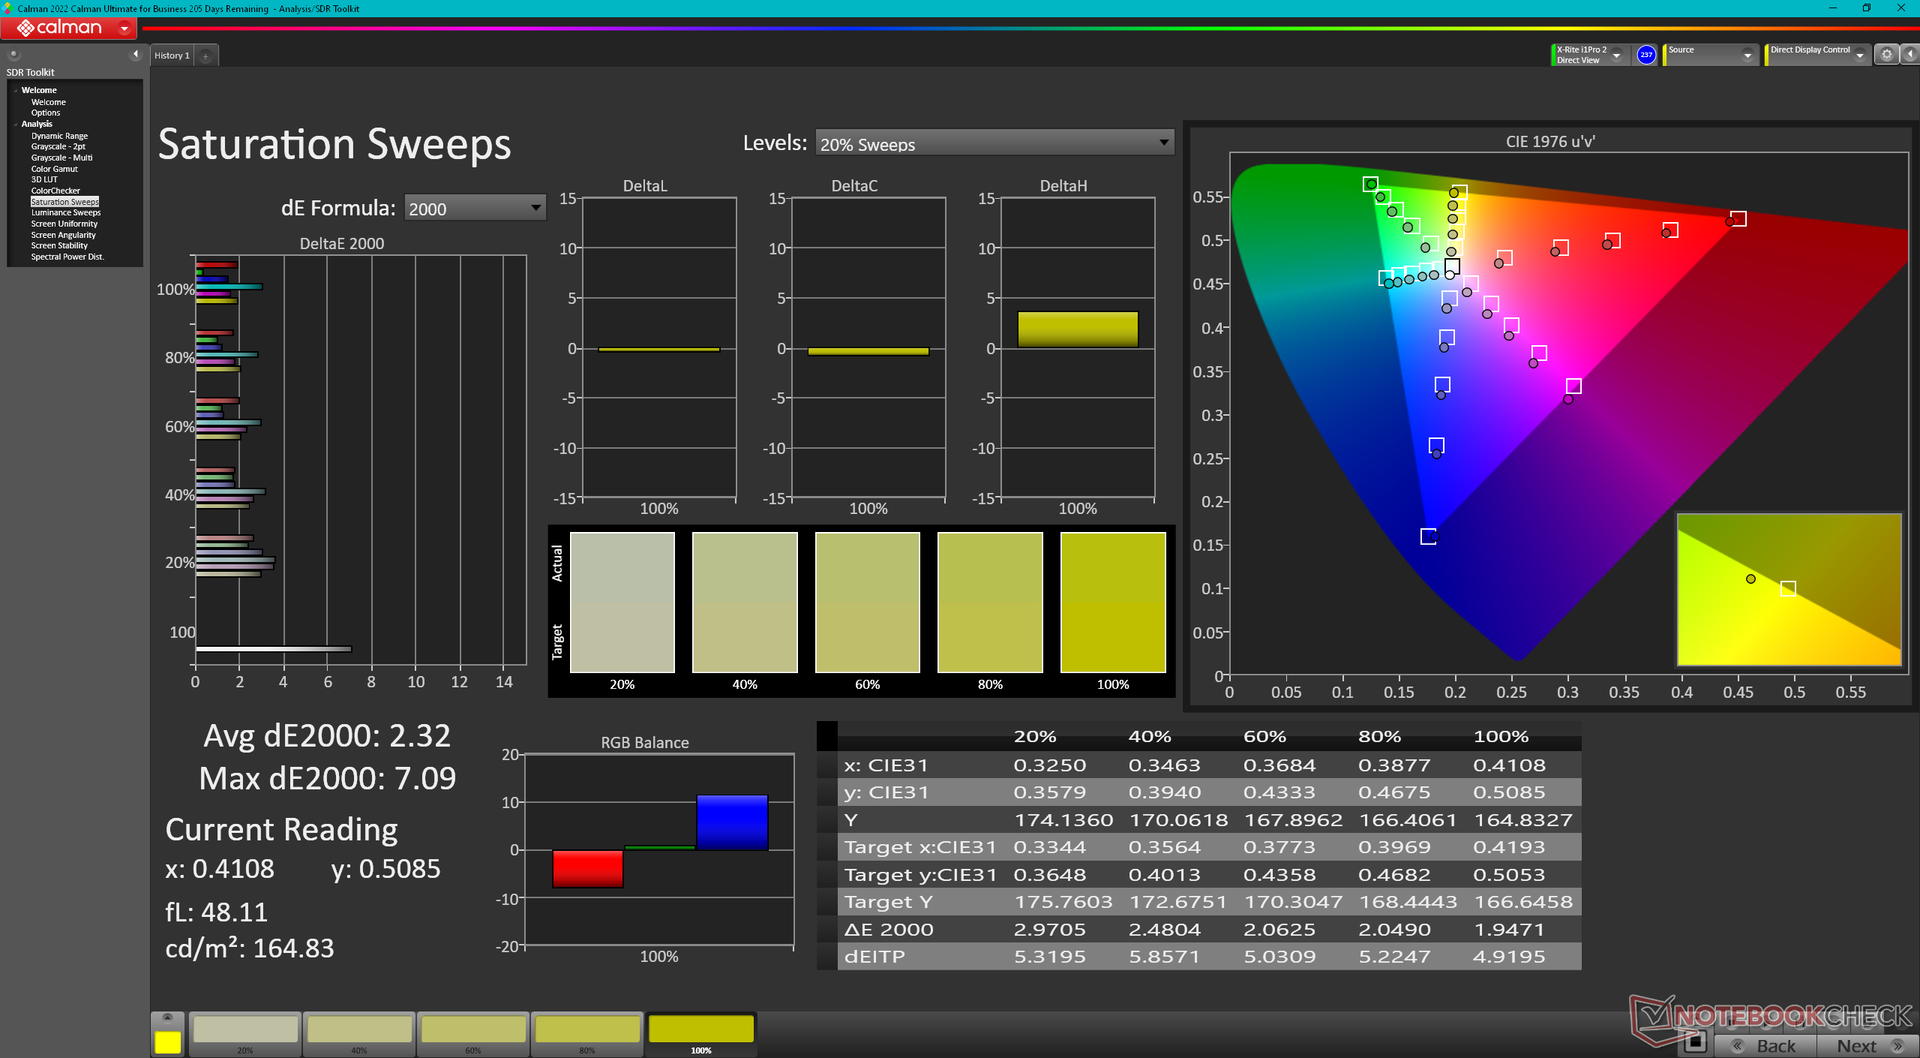
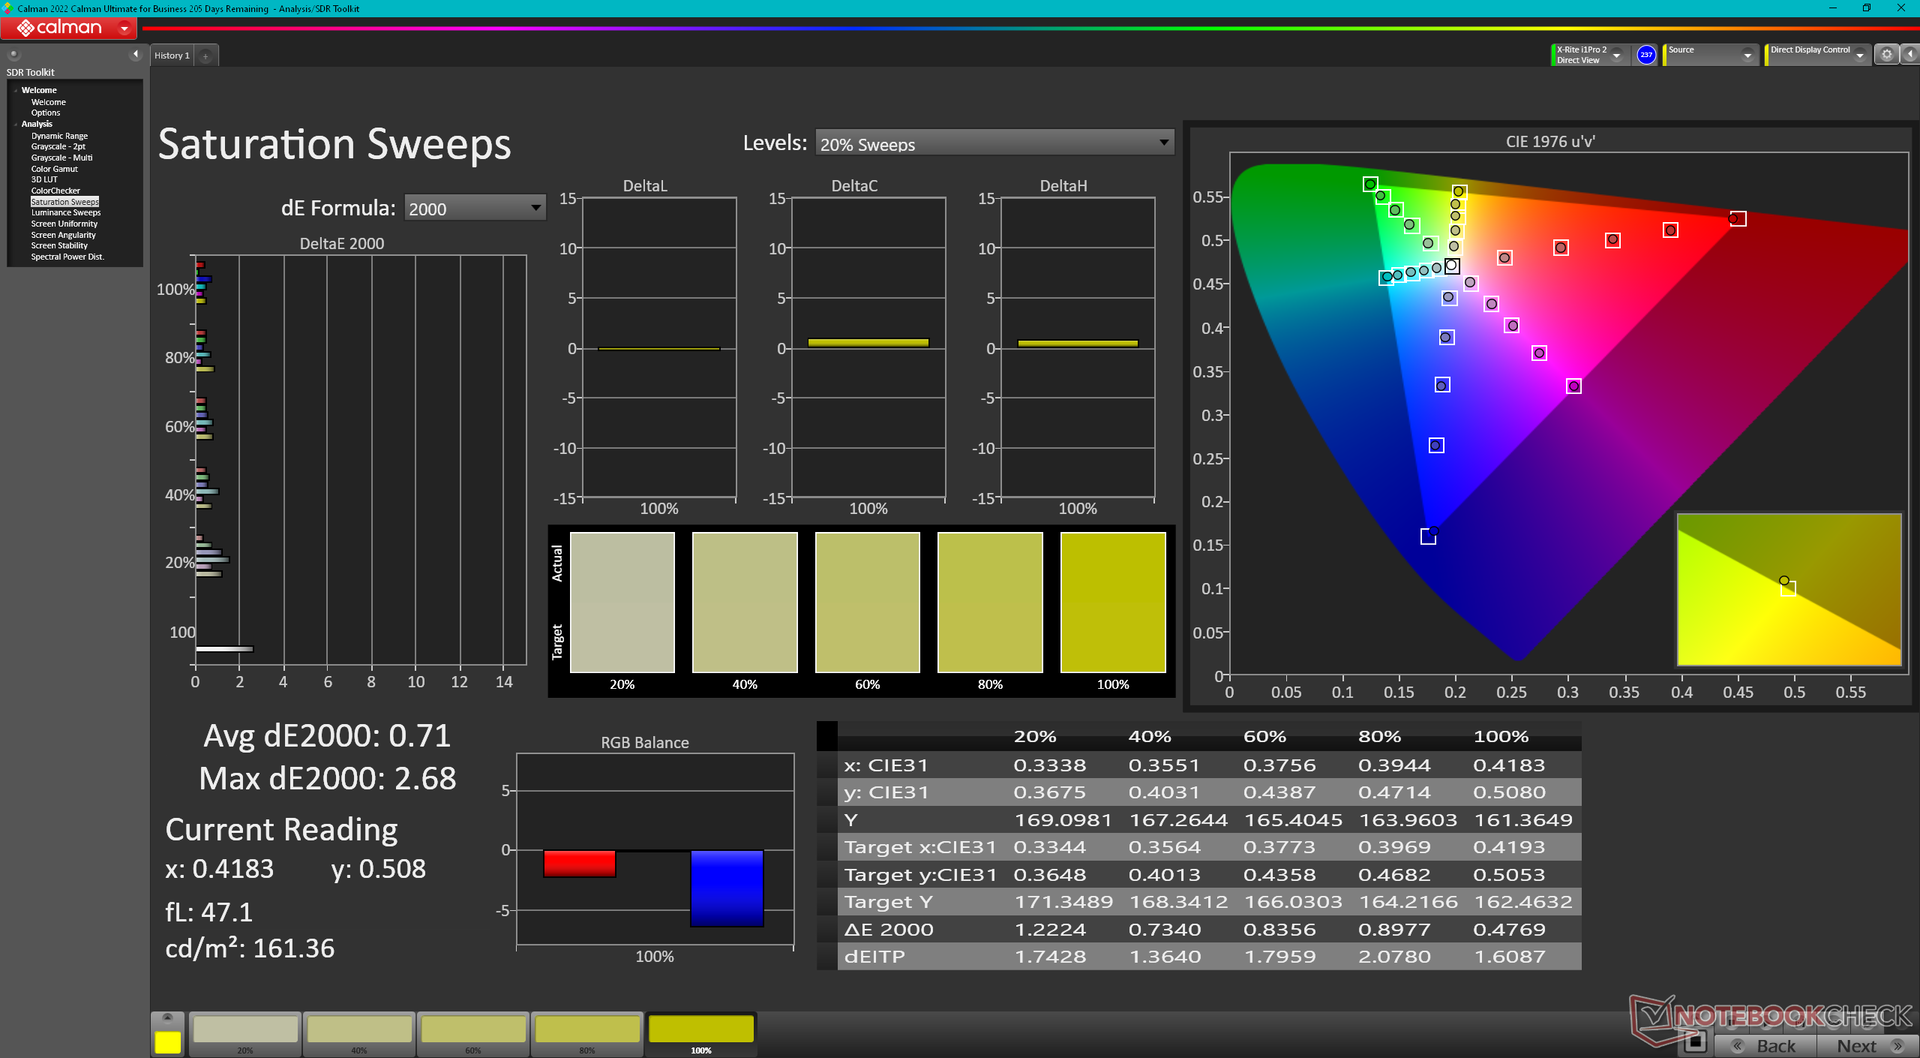
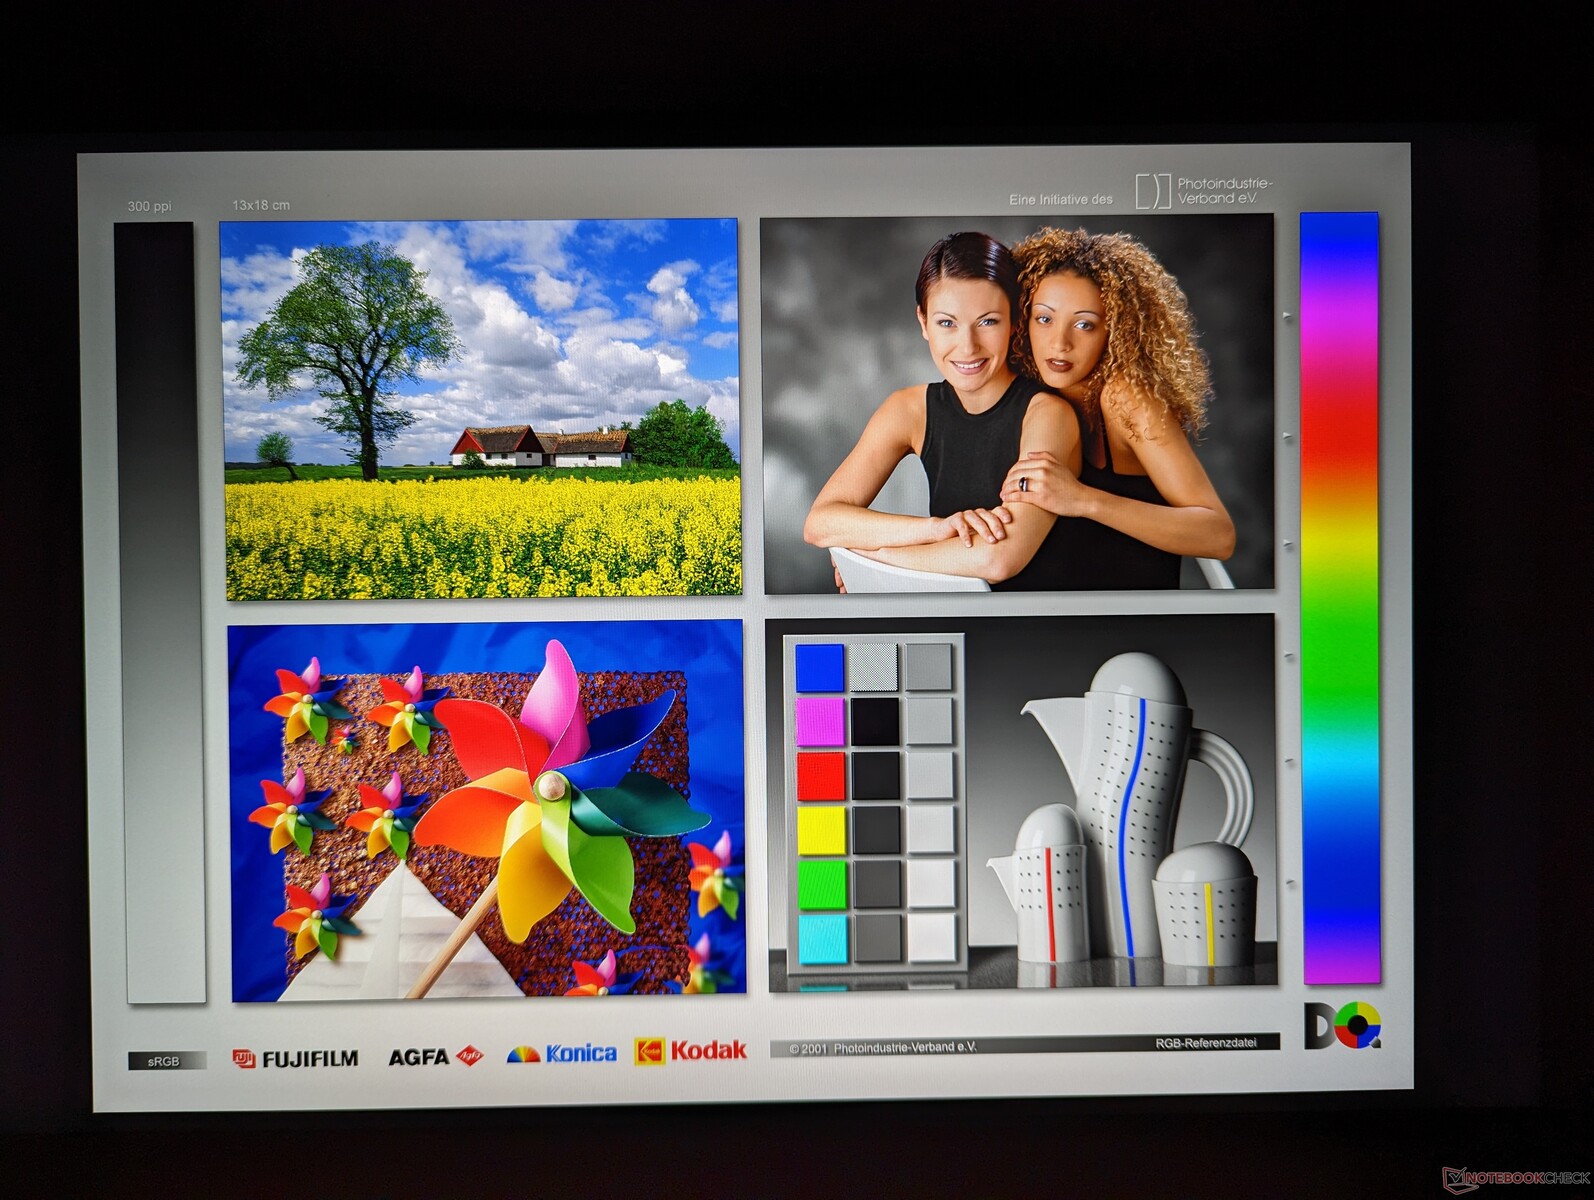
Nie ma opcji drugiego wyświetlacza dla tej konkretnej konstrukcji obudowy, więc nasz Uniwill wykorzystuje ten sam panel BOE NE160QDM-NZ1 IPS, który można znaleźć w Schenker Neo 16 napędzanym RTX 4090. Panel ten jest godny uwagi ze względu na szybką częstotliwość odświeżania 240 Hz i >95% pokrycie palety sRGB. Niemniej jednak konkurencyjne laptopy, jak np.Asus ROG Strix G16 lubGigabyte AERO 16 OLED oferują jeszcze głębsze kolory i szybsze czasy reakcji, które docenią hardcorowi gracze czy edytorzy grafiki.


| |||||||||||||||||||||||||
rozświetlenie: 89 %
na akumulatorze: 338.6 cd/m²
kontrast: 1058:1 (czerń: 0.32 cd/m²)
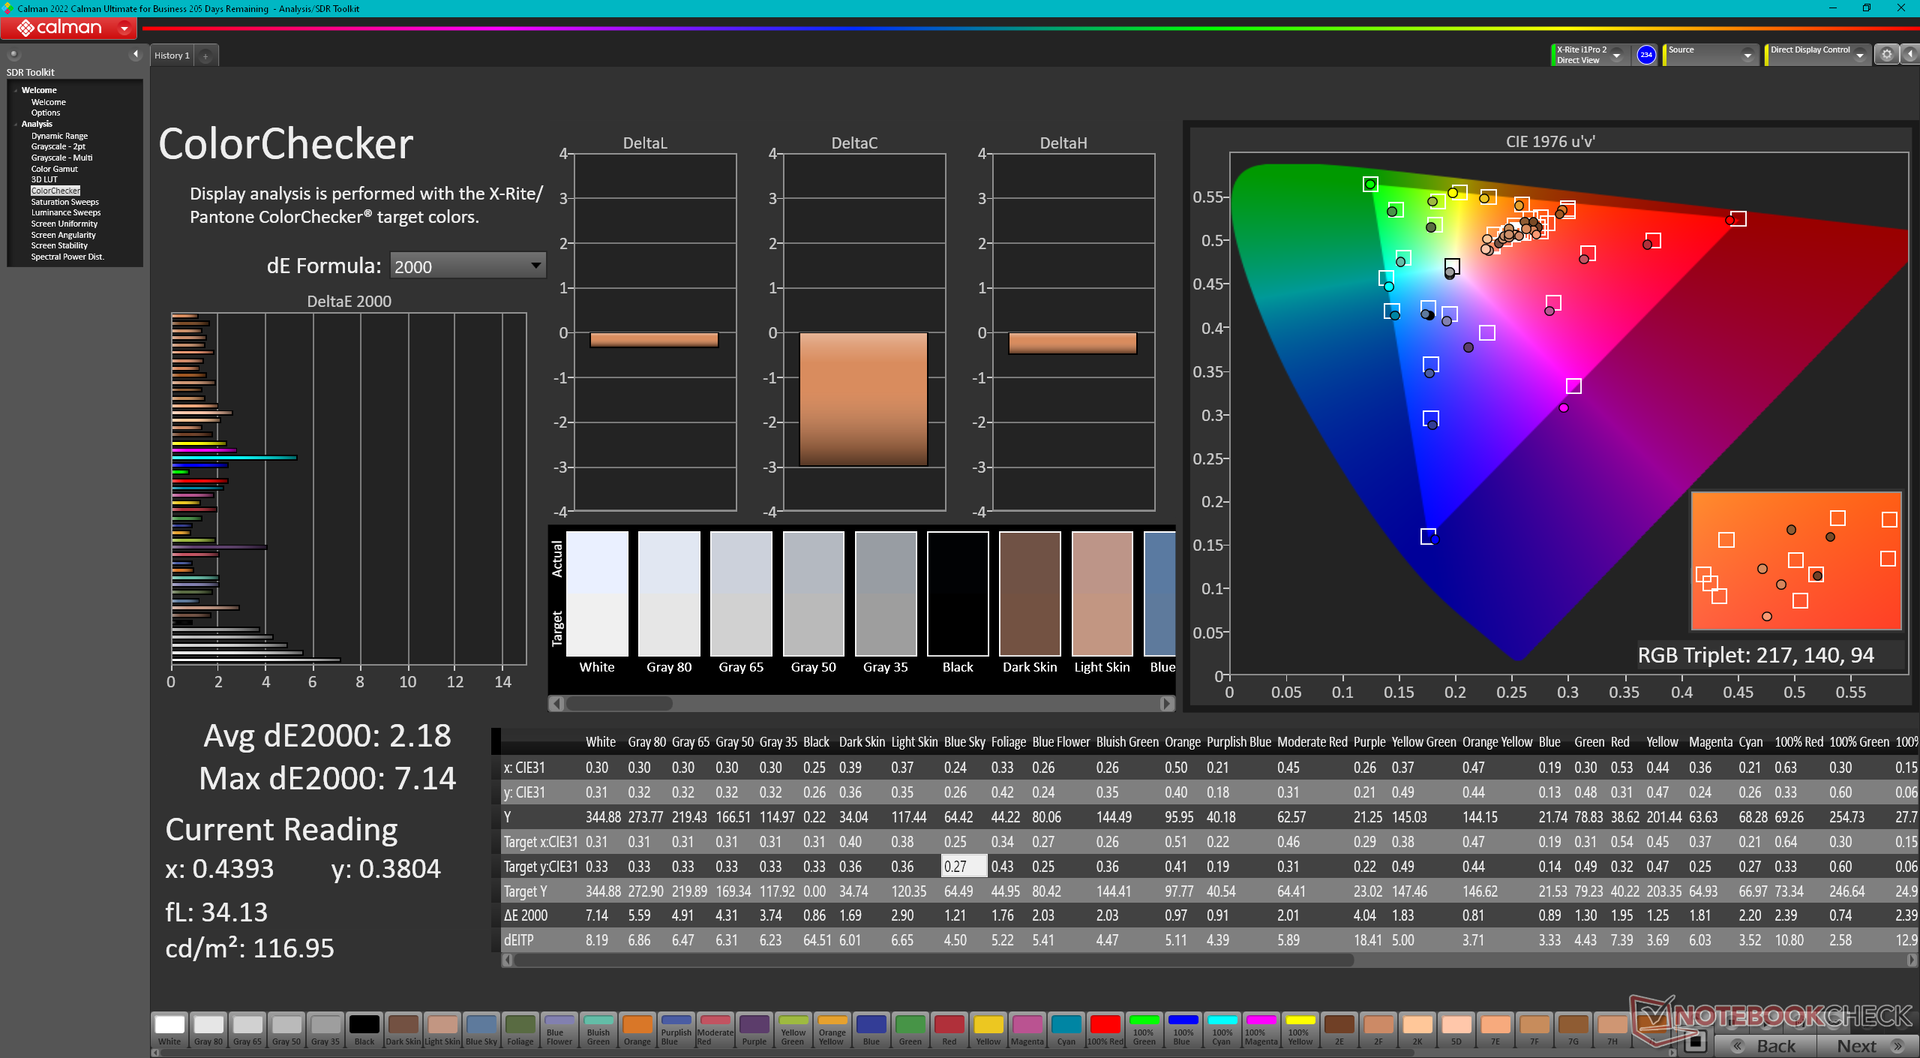
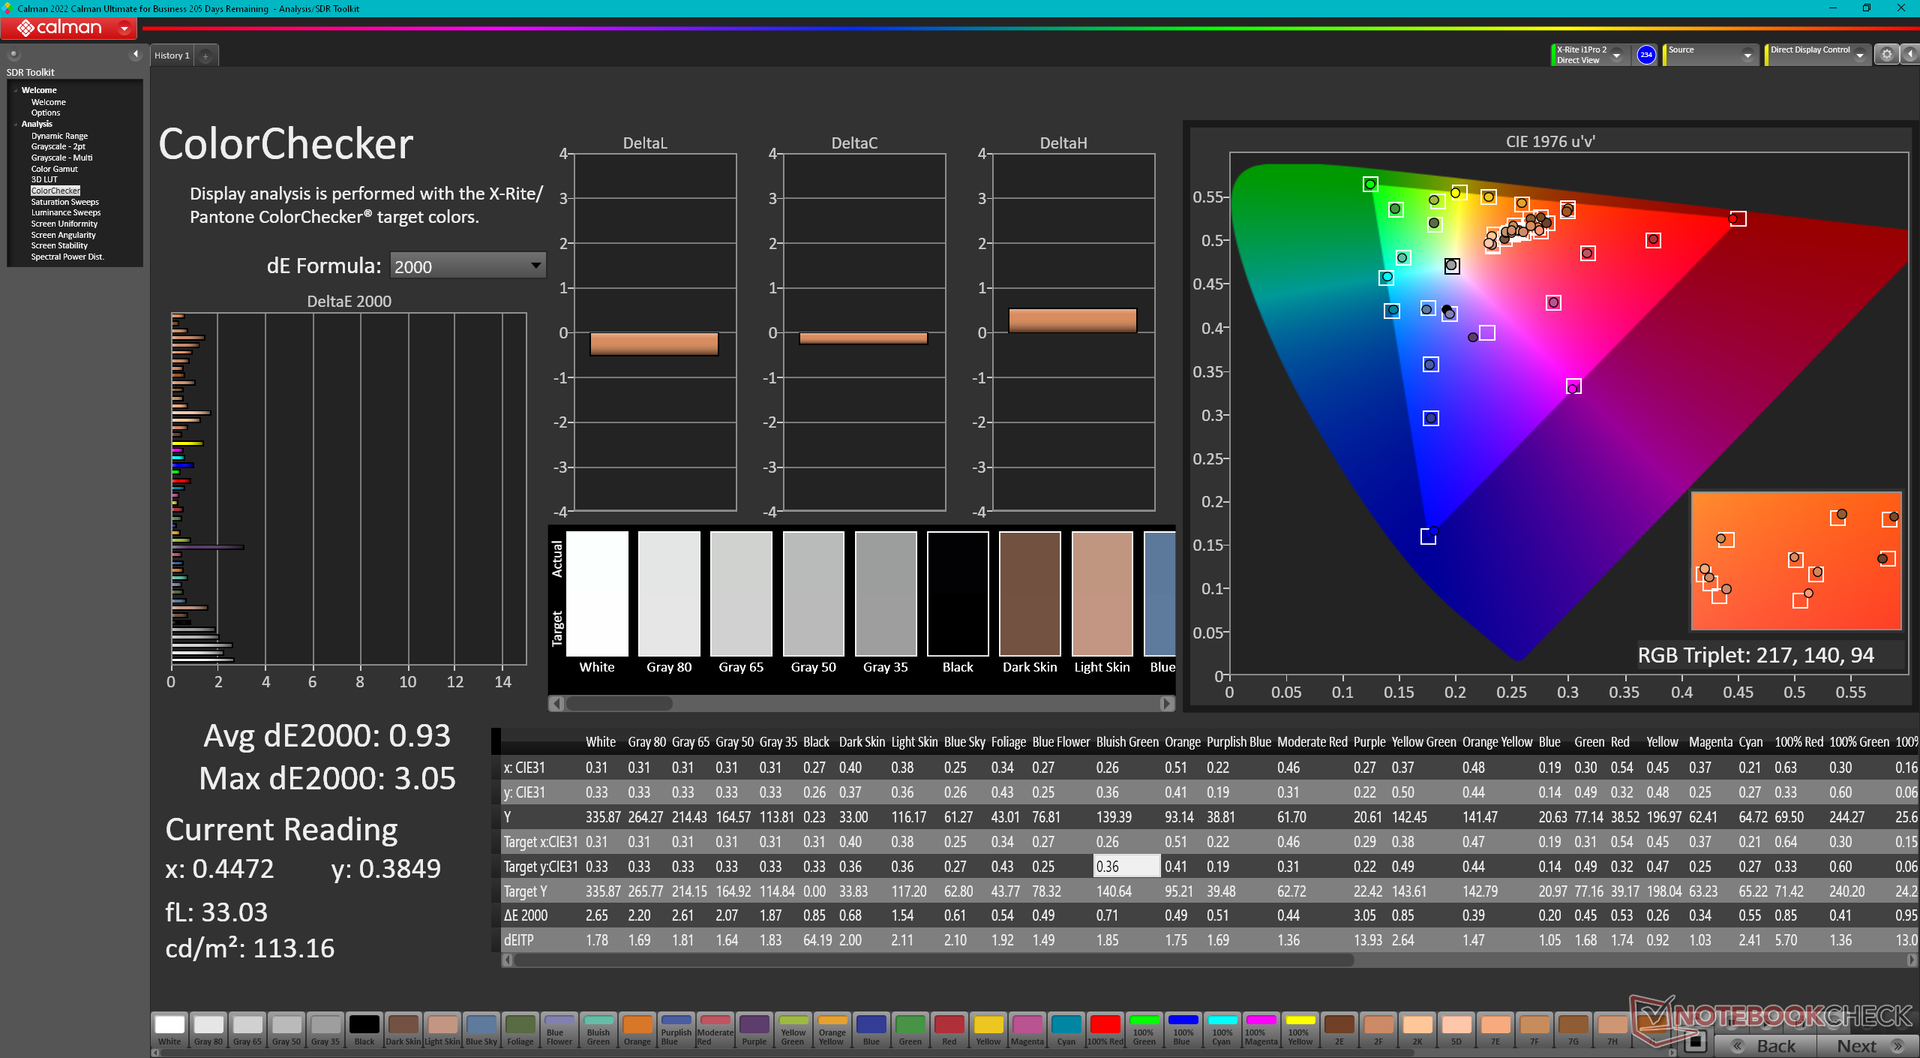
ΔE ColorChecker Calman: 2.18 | ∀{0.5-29.43 Ø4.72}
calibrated: 0.93
ΔE Greyscale Calman: 3.7 | ∀{0.09-98 Ø4.97}
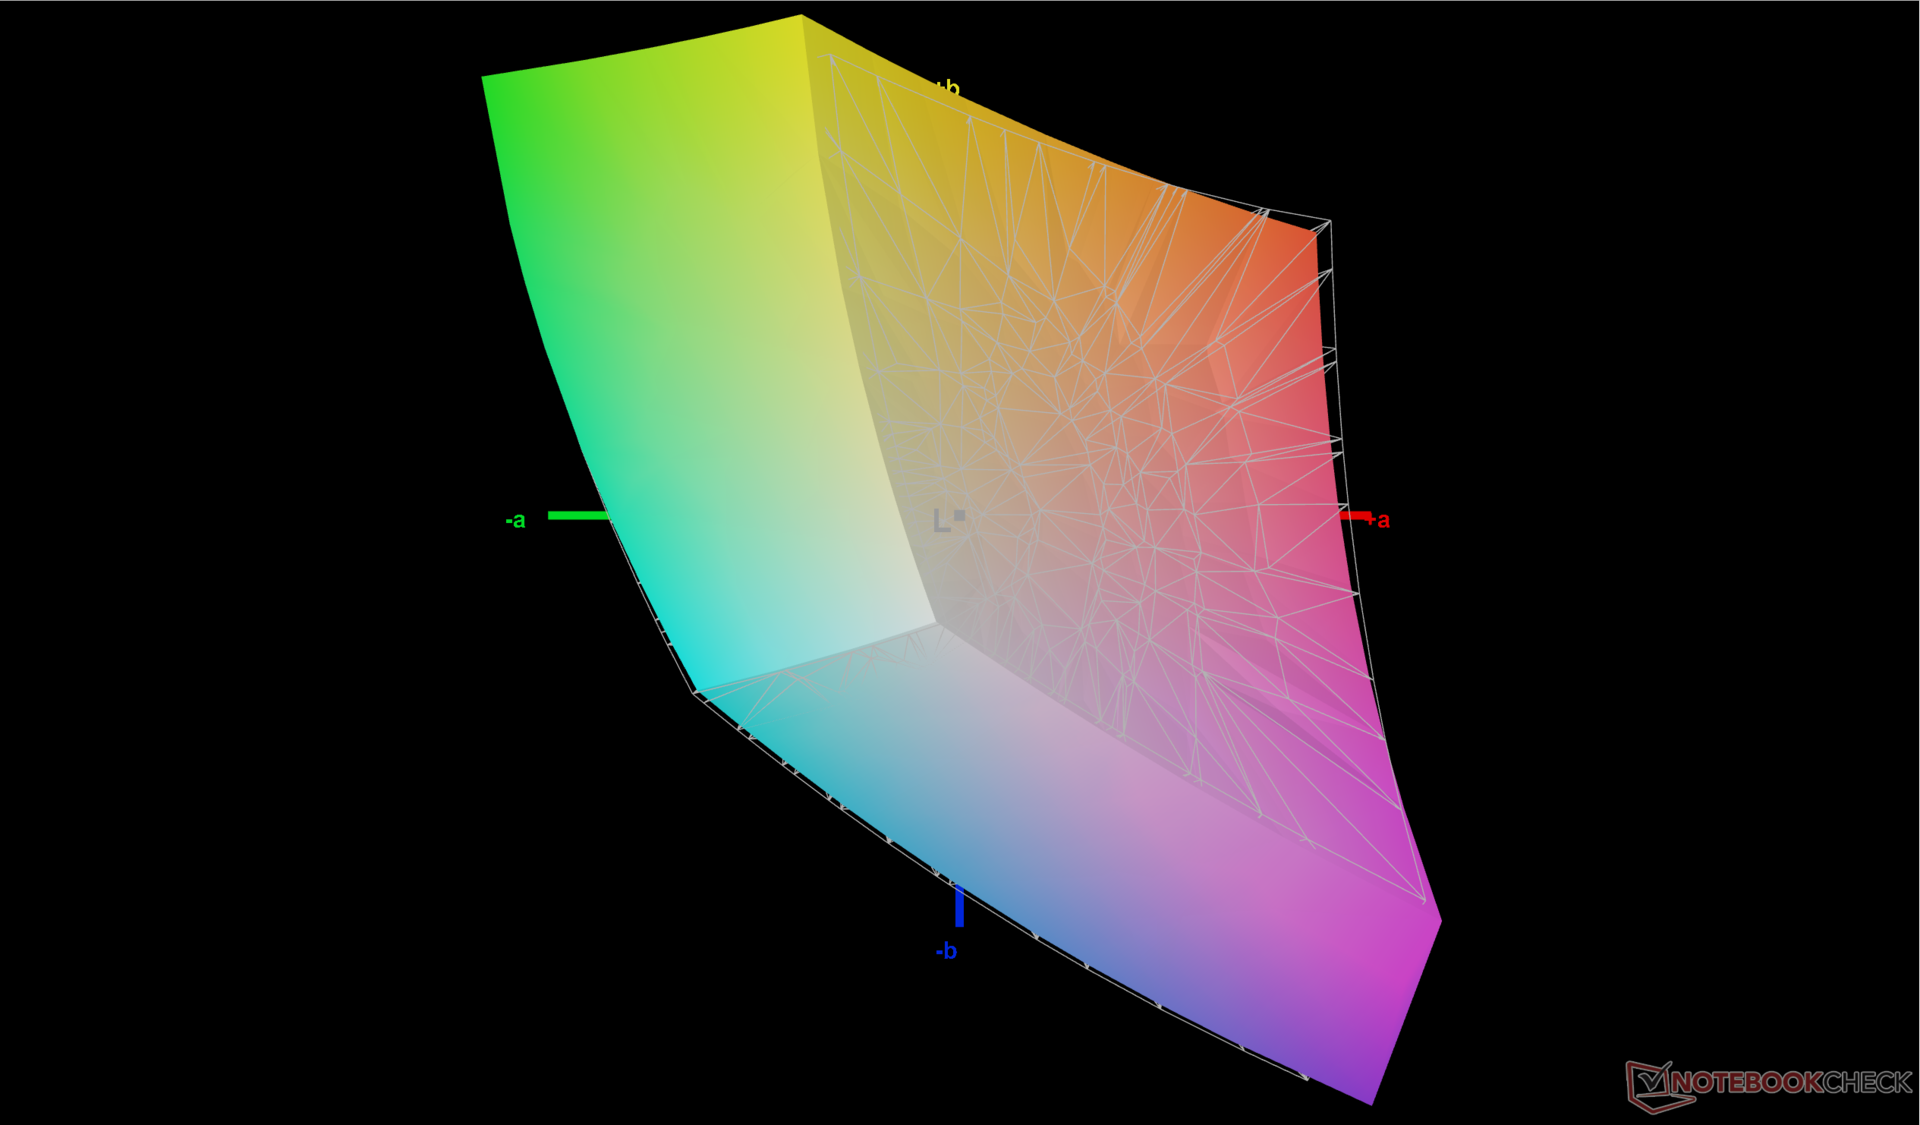
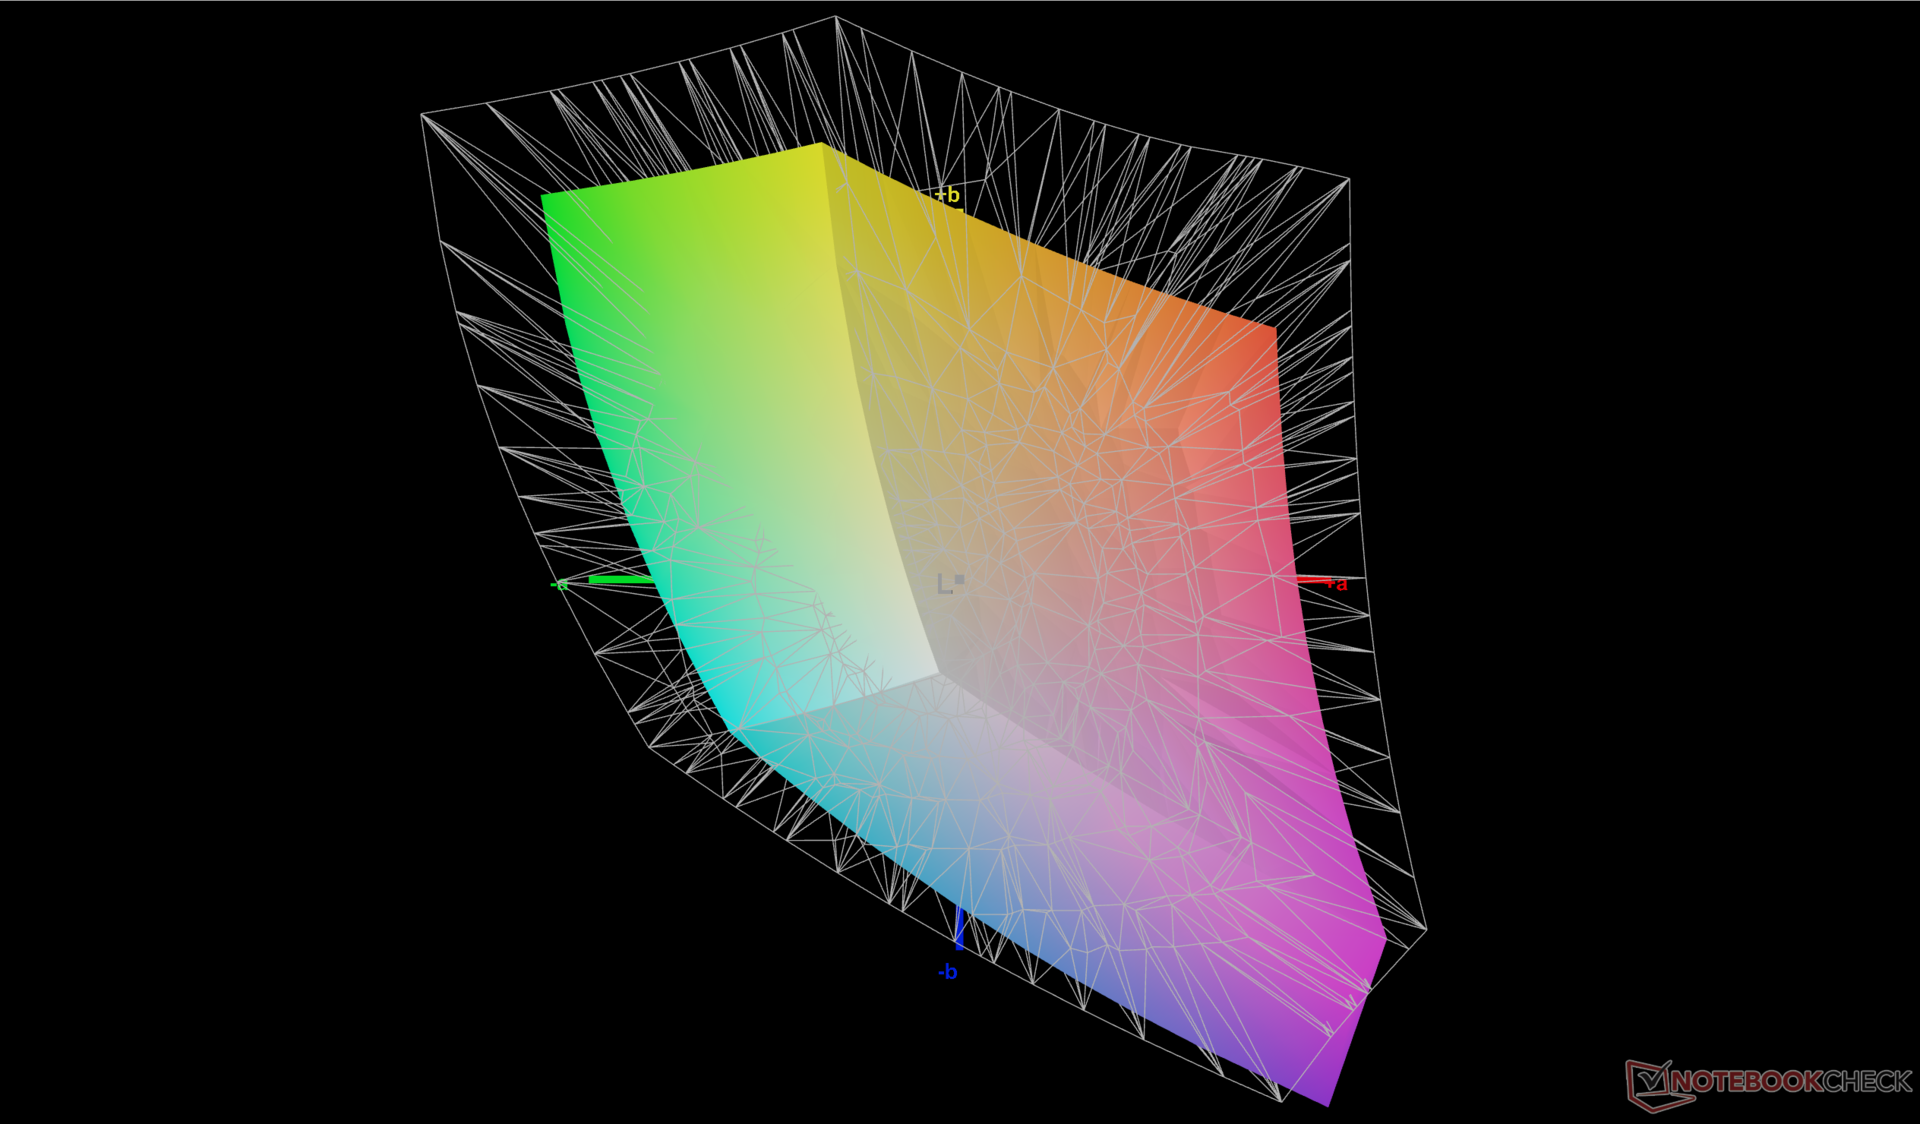
68.6% AdobeRGB 1998 (Argyll 3D)
96.4% sRGB (Argyll 3D)
67.5% Display P3 (Argyll 3D)
Gamma: 2.18
CCT: 7245 K
| Uniwill GM6PX7X RTX 4070 BOE CQ NE160QDM-NZ1, IPS, 2560x1600, 16" | Schenker XMG Neo 16 E23 BOE0AF0 NE160QDM-NZ1, IPS, 2560x1600, 16" | Asus ROG Strix G16 G614JZ TL160ADMP03-0, IPS, 2560x1600, 16" | Lenovo Legion Pro 7 16IRX8H MNG007DA2-3 (CSO1628), IPS, 2560x1600, 16" | Gigabyte AERO 16 OLED BSF Samsung SDC4191 (ATNA60YV09-0, OLED, 3840x2400, 16" | Razer Blade 16 Early 2023 CSOT T3 MNG007DA4-1, IPS, 2560x1600, 16" | |
|---|---|---|---|---|---|---|
| Display | 0% | 24% | 3% | 31% | 27% | |
| Display P3 Coverage (%) | 67.5 | 67.3 0% | 97 44% | 69.1 2% | 99.9 48% | 98.5 46% |
| sRGB Coverage (%) | 96.4 | 96.7 0% | 99.9 4% | 99.7 3% | 100 4% | 100 4% |
| AdobeRGB 1998 Coverage (%) | 68.6 | 68.9 0% | 84.9 24% | 71.2 4% | 96.4 41% | 89.7 31% |
| Response Times | -2% | 47% | 21% | 82% | 13% | |
| Response Time Grey 50% / Grey 80% * (ms) | 12.6 ? | 14.5 ? -15% | 5.1 ? 60% | 12.3 ? 2% | 2 ? 84% | 6.6 ? 48% |
| Response Time Black / White * (ms) | 9.8 ? | 8.6 ? 12% | 6.6 ? 33% | 5.9 ? 40% | 1.98 ? 80% | 12 ? -22% |
| PWM Frequency (Hz) | 60 | |||||
| Screen | 9% | 16% | 33% | 142% | 8% | |
| Brightness middle (cd/m²) | 338.6 | 372 10% | 470 39% | 511 51% | 389.97 15% | 456.8 35% |
| Brightness (cd/m²) | 328 | 349 6% | 459 40% | 469 43% | 395 20% | 437 33% |
| Brightness Distribution (%) | 89 | 88 -1% | 93 4% | 86 -3% | 97 9% | 83 -7% |
| Black Level * (cd/m²) | 0.32 | 0.32 -0% | 0.42 -31% | 0.4 -25% | 0.03 91% | 0.35 -9% |
| Contrast (:1) | 1058 | 1163 10% | 1119 6% | 1278 21% | 12999 1129% | 1305 23% |
| Colorchecker dE 2000 * | 2.18 | 2.06 6% | 1.86 15% | 0.95 56% | 2 8% | 3.7 -70% |
| Colorchecker dE 2000 max. * | 7.14 | 3 58% | 3.87 46% | 2.07 71% | 4.1 43% | 6.42 10% |
| Colorchecker dE 2000 calibrated * | 0.93 | 1.5 -61% | 0.93 -0% | 0.91 2% | 1.68 -81% | 0.66 29% |
| Greyscale dE 2000 * | 3.7 | 1.9 49% | 2.7 27% | 0.6 84% | 2.23 40% | 2.6 30% |
| Gamma | 2.18 101% | 2.312 95% | 2.246 98% | 2.176 101% | 2.41 91% | 2.3 96% |
| CCT | 7245 90% | 6747 96% | 6711 97% | 6545 99% | 6323 103% | 6108 106% |
| Całkowita średnia (program / ustawienia) | 2% /
5% | 29% /
22% | 19% /
25% | 85% /
109% | 16% /
13% |
* ... im mniej tym lepiej
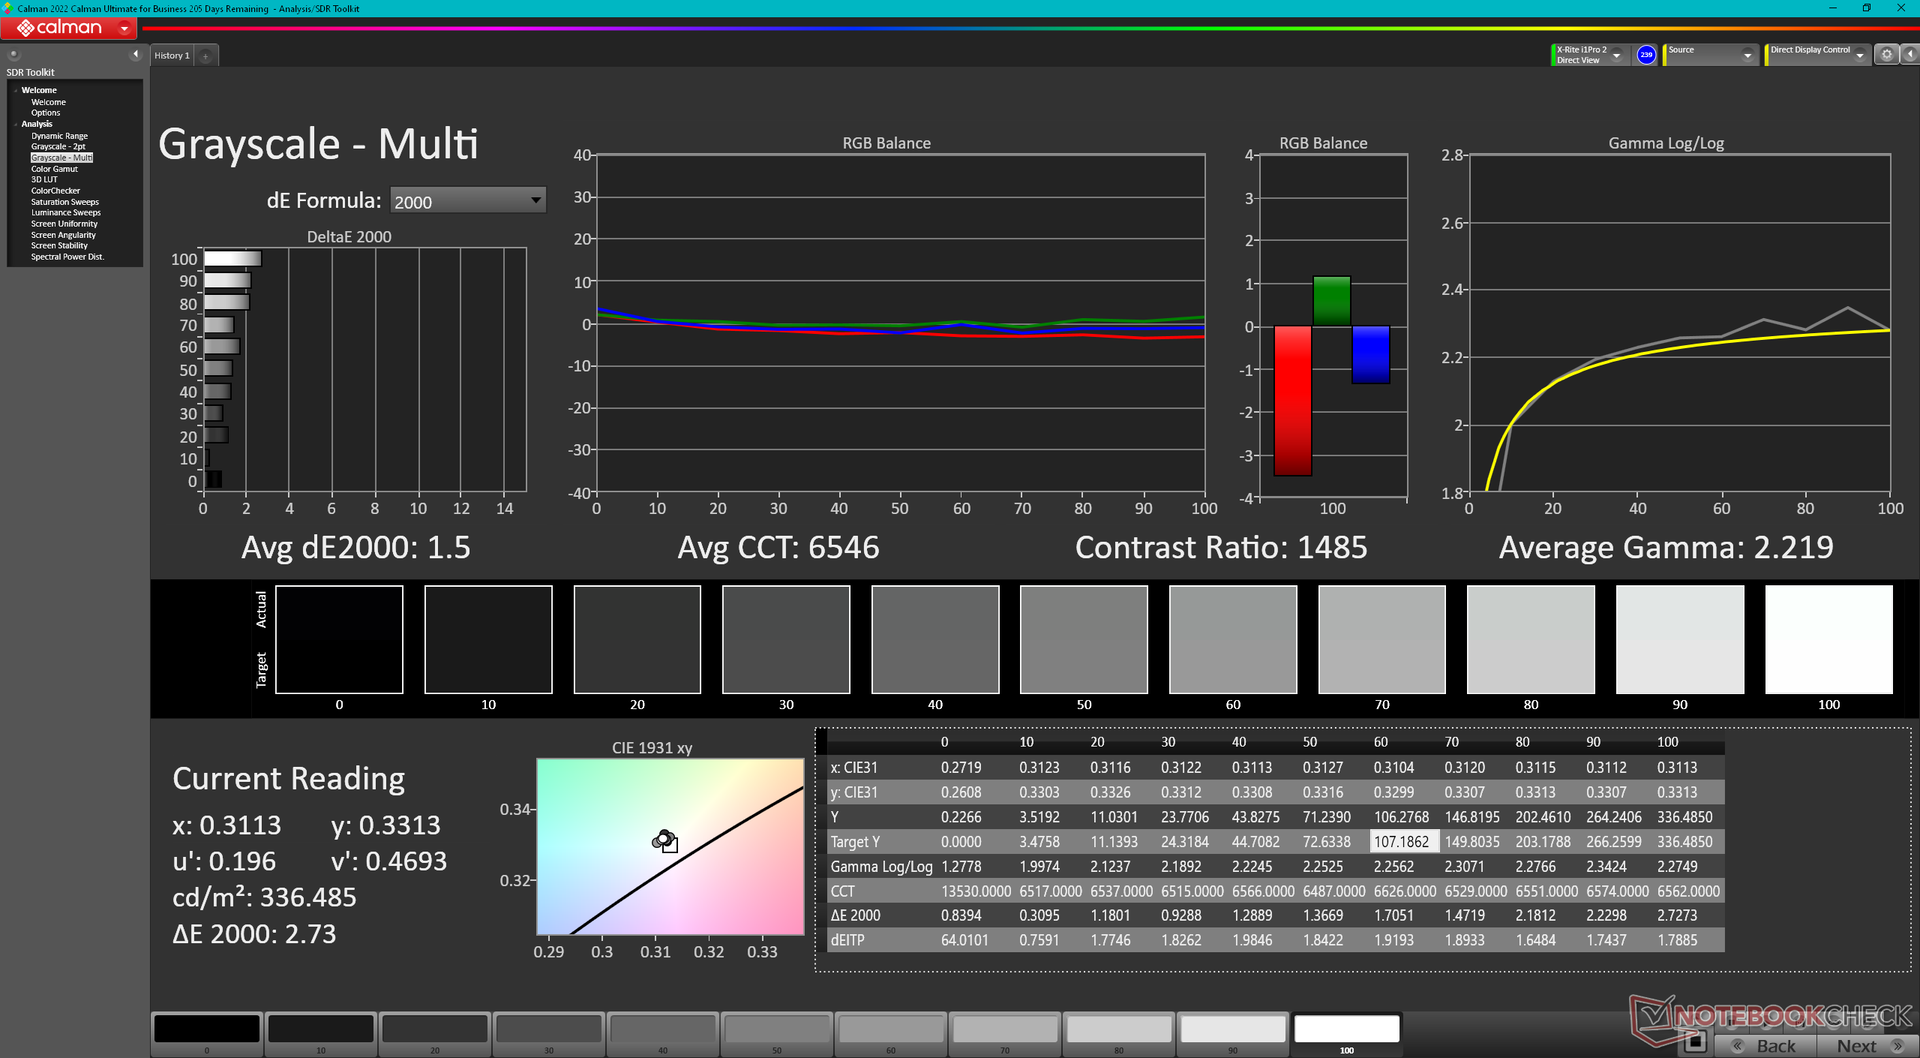
Wyświetlacz jest przyzwoicie skalibrowany po wyjęciu z pudełka, a średnie wartości deltaE w skali szarości i kolorze wynoszą odpowiednio 3,7 i 2,18. Temperatura barwowa jest jednak nieco chłodna, ale nasza własna kalibracja X-Rite rozwiązuje ten problem. Użytkownicy mogą zastosować nasz skalibrowany profil ICM powyżej, aby uzyskać dokładniejsze kolory z Uniwill.
Wyświetl czasy reakcji
| ↔ Czas reakcji od czerni do bieli | ||
|---|---|---|
| 9.8 ms ... wzrost ↗ i spadek ↘ łącznie | ↗ 5.1 ms wzrost | 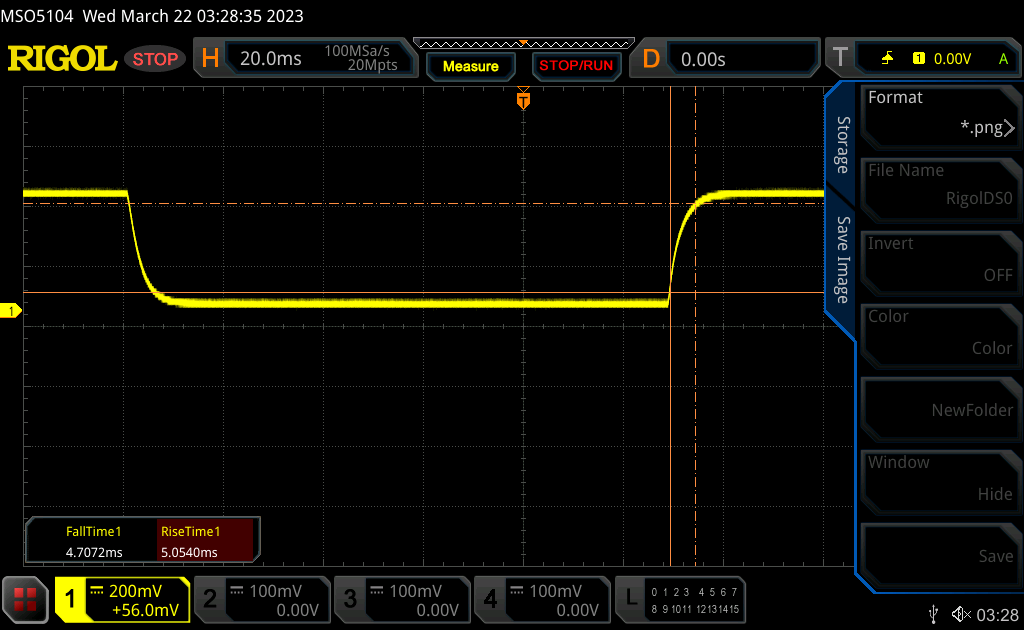 |
| ↘ 4.7 ms upadek | ||
| W naszych testach ekran wykazuje szybki czas reakcji i powinien nadawać się do gier. Dla porównania, wszystkie testowane urządzenia wahają się od 0.1 (minimum) do 240 (maksimum) ms. » 27 % wszystkich urządzeń jest lepszych. Oznacza to, że zmierzony czas reakcji jest lepszy od średniej wszystkich testowanych urządzeń (19.9 ms). | ||
| ↔ Czas reakcji 50% szarości do 80% szarości | ||
| 12.6 ms ... wzrost ↗ i spadek ↘ łącznie | ↗ 6.3 ms wzrost | 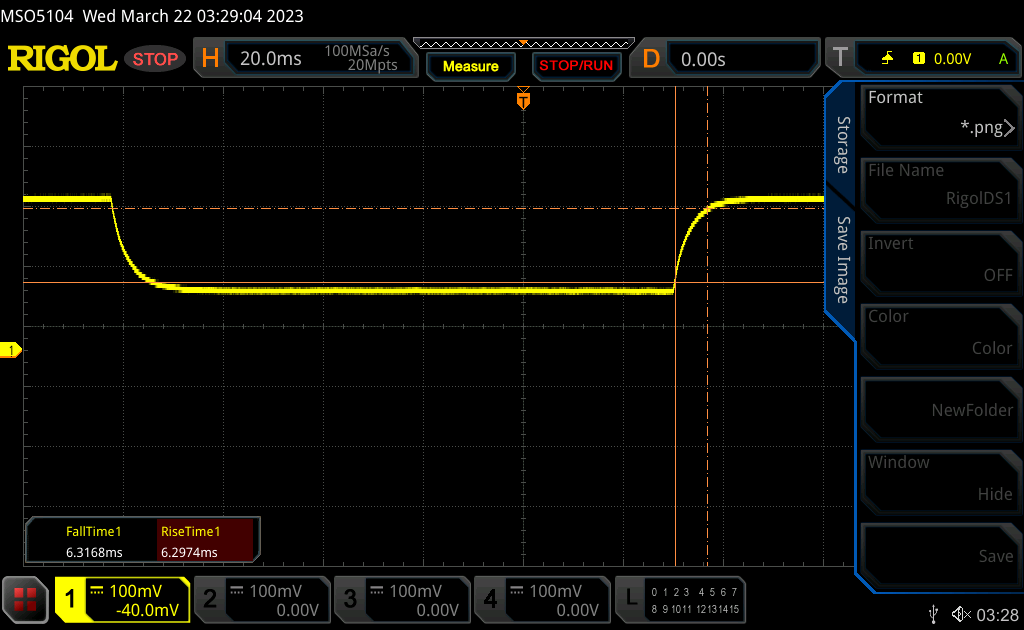 |
| ↘ 6.3 ms upadek | ||
| W naszych testach ekran wykazuje dobry współczynnik reakcji, ale może być zbyt wolny dla graczy rywalizujących ze sobą. Dla porównania, wszystkie testowane urządzenia wahają się od 0.165 (minimum) do 636 (maksimum) ms. » 26 % wszystkich urządzeń jest lepszych. Oznacza to, że zmierzony czas reakcji jest lepszy od średniej wszystkich testowanych urządzeń (31.1 ms). | ||
Migotanie ekranu / PWM (modulacja szerokości impulsu)
| Migotanie ekranu/nie wykryto PWM | 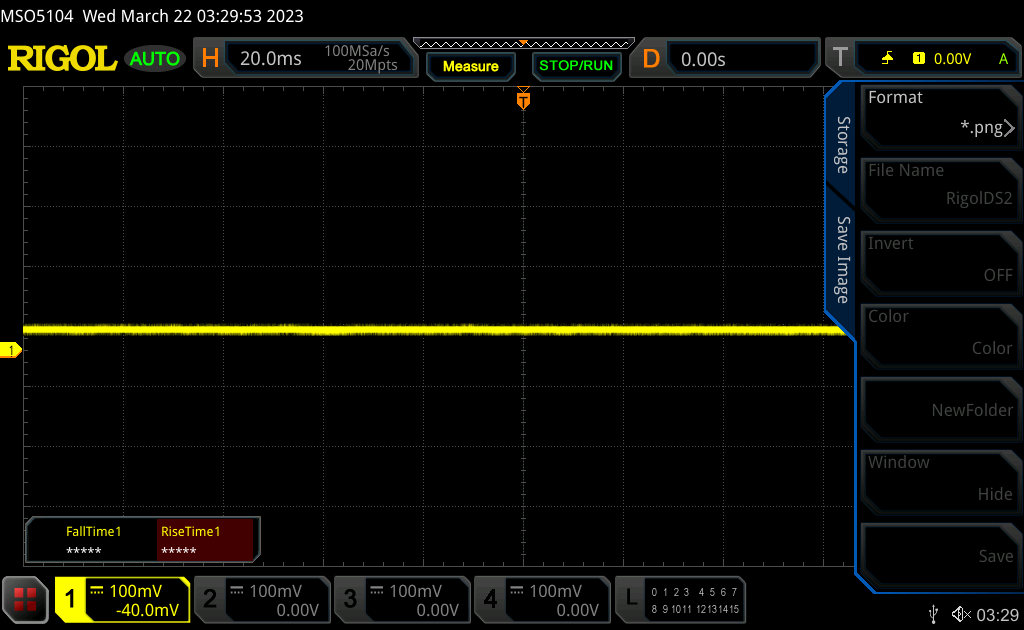 | ||
Dla porównania: 52 % wszystkich testowanych urządzeń nie używa PWM do przyciemniania wyświetlacza. Jeśli wykryto PWM, zmierzono średnio 7784 (minimum: 5 - maksimum: 343500) Hz. | |||

Wydajność
Warunki badania
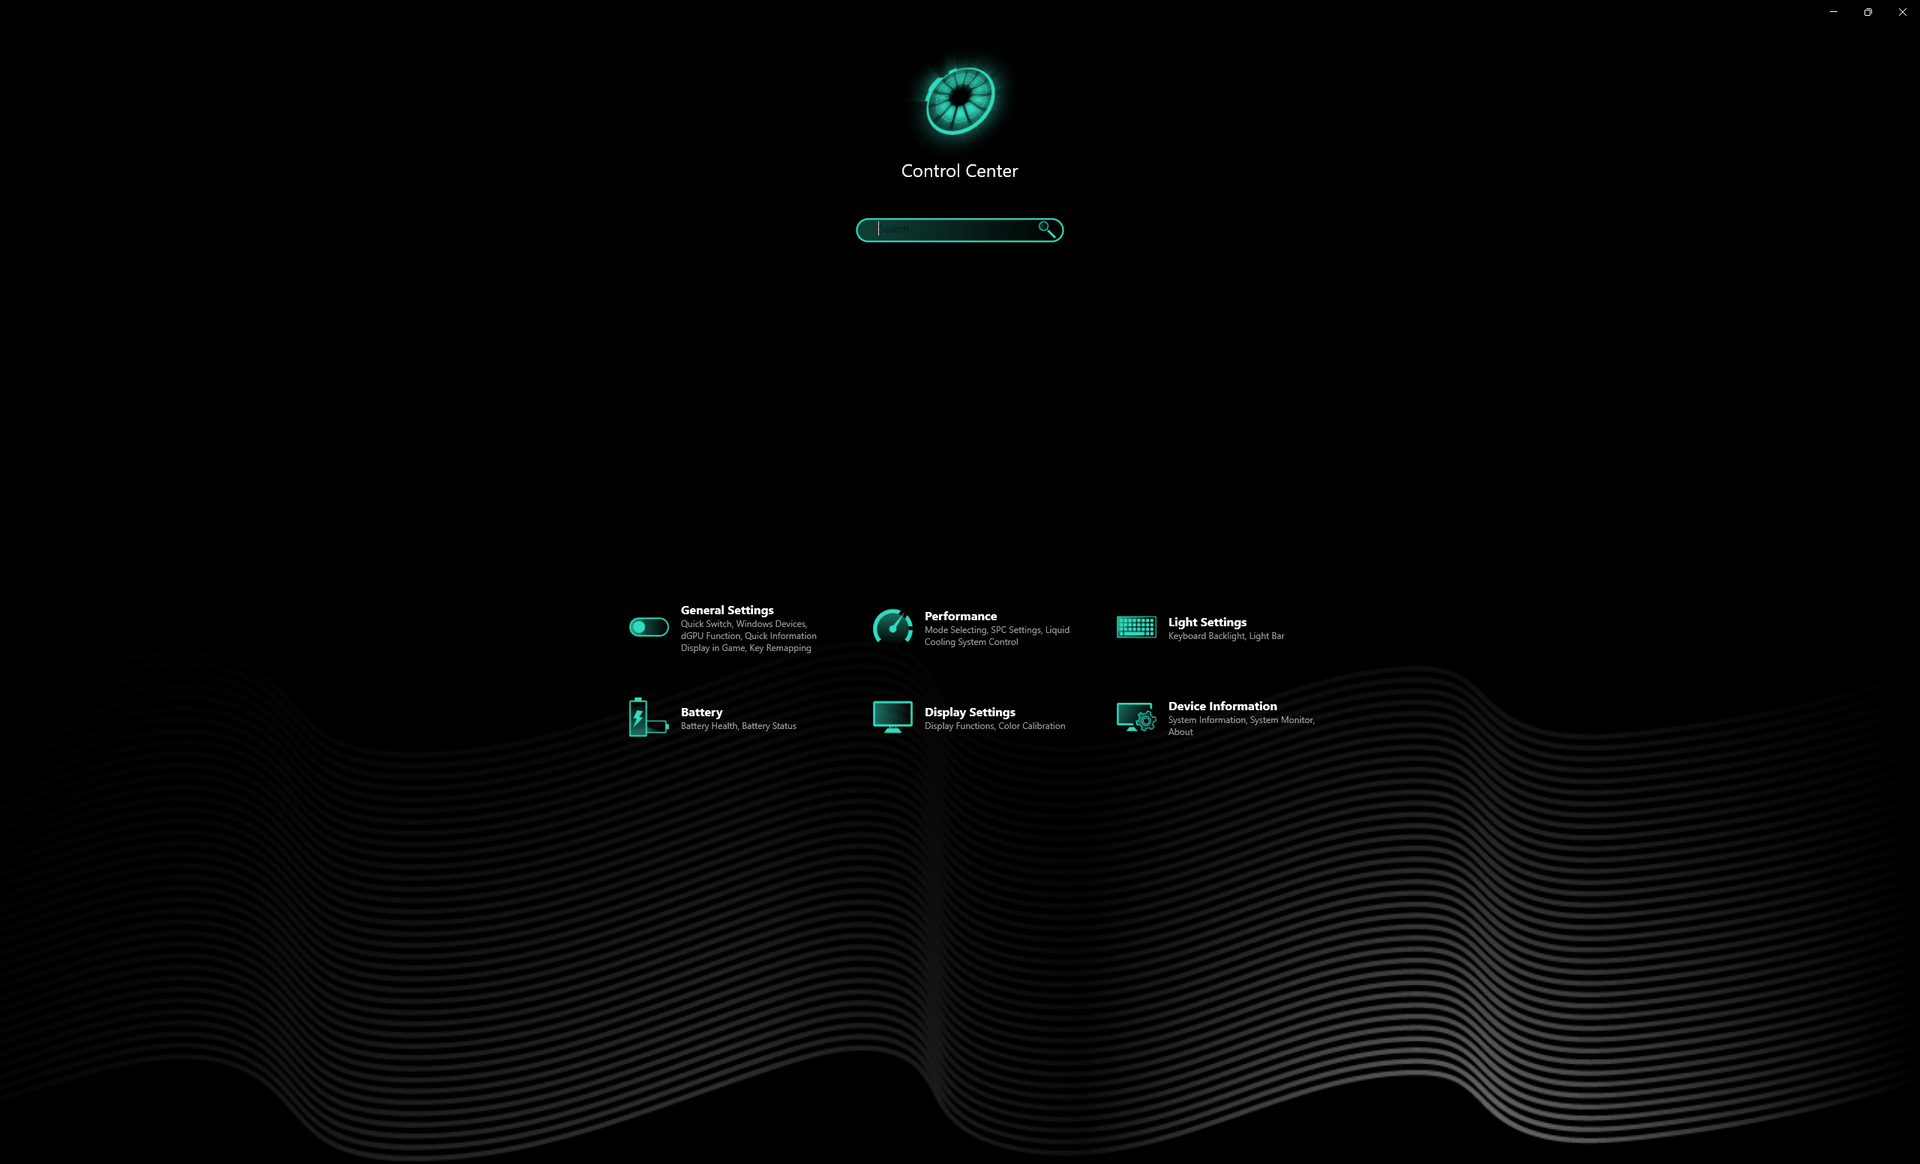
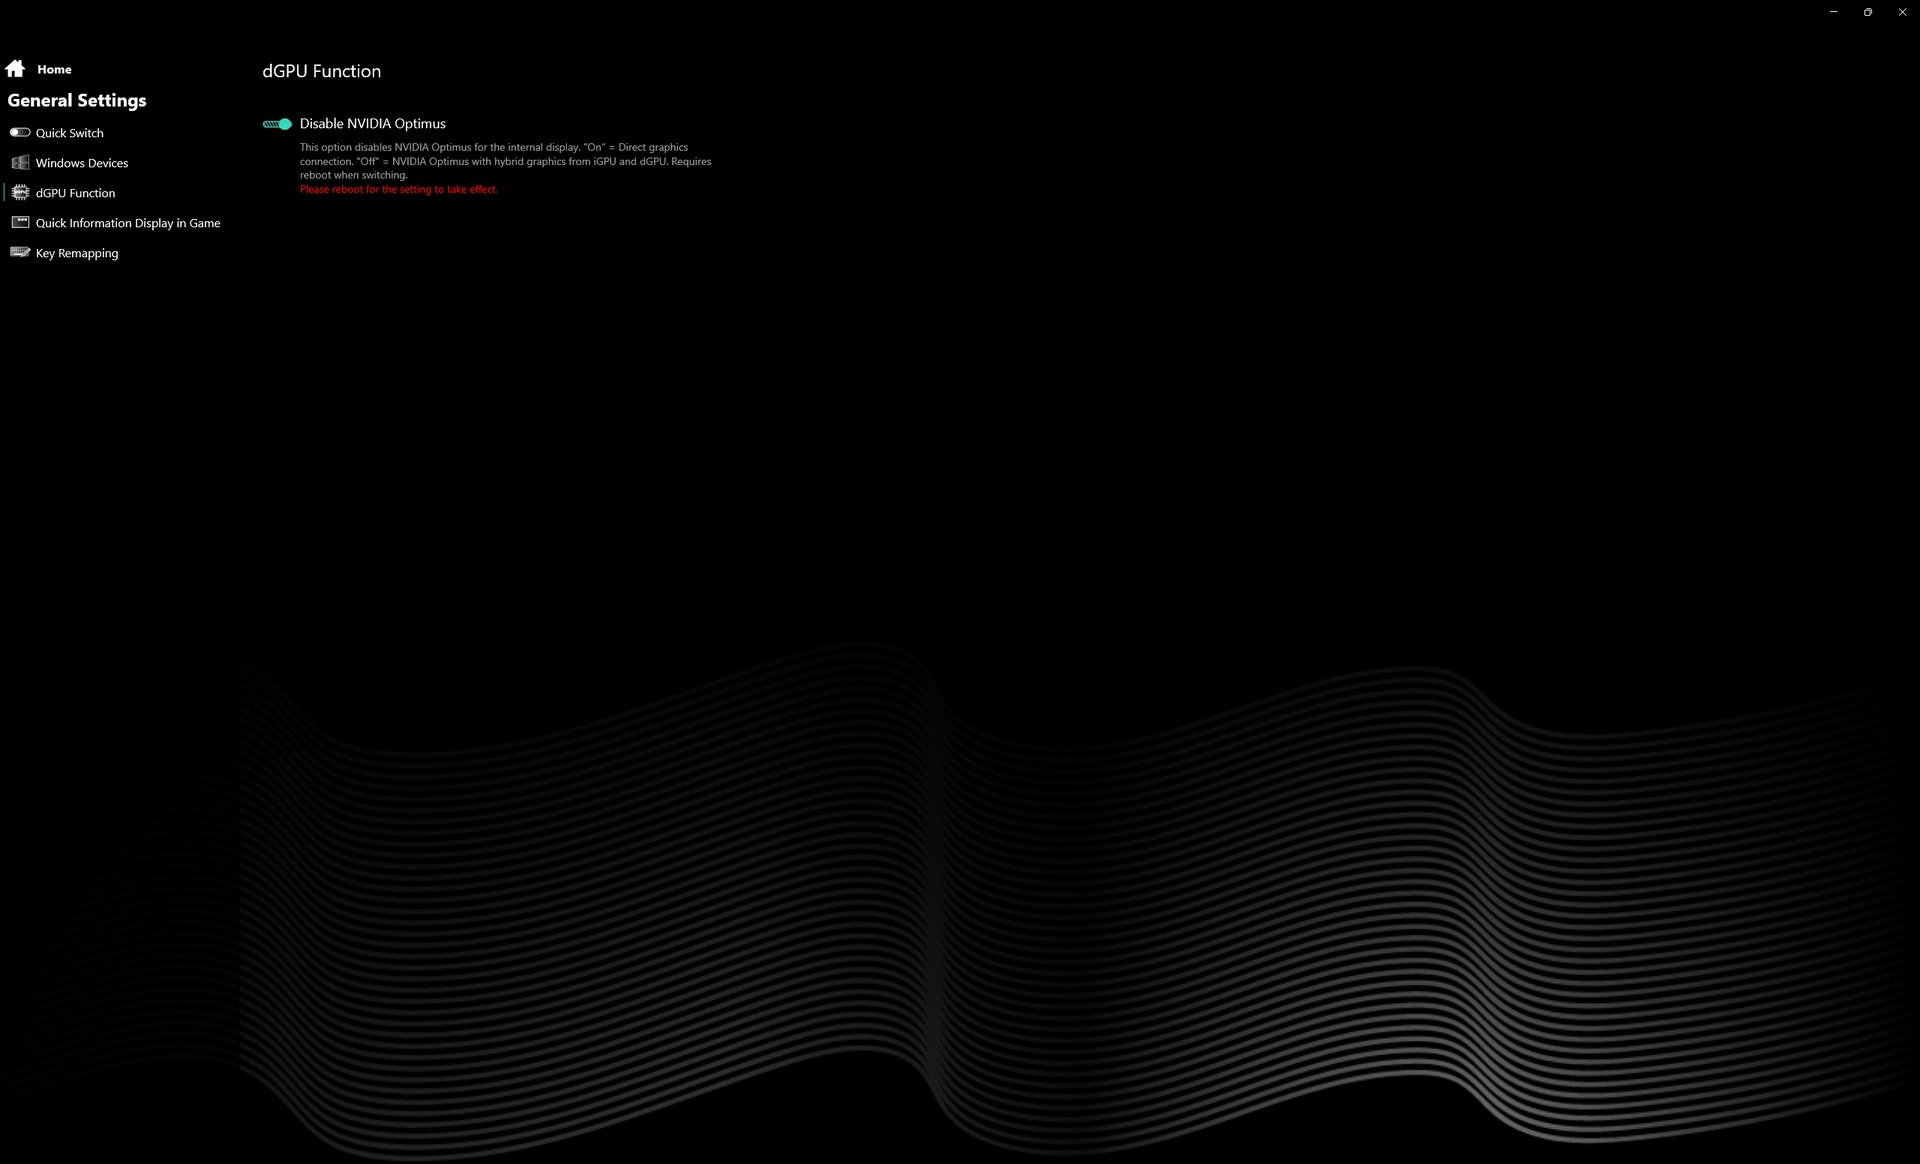
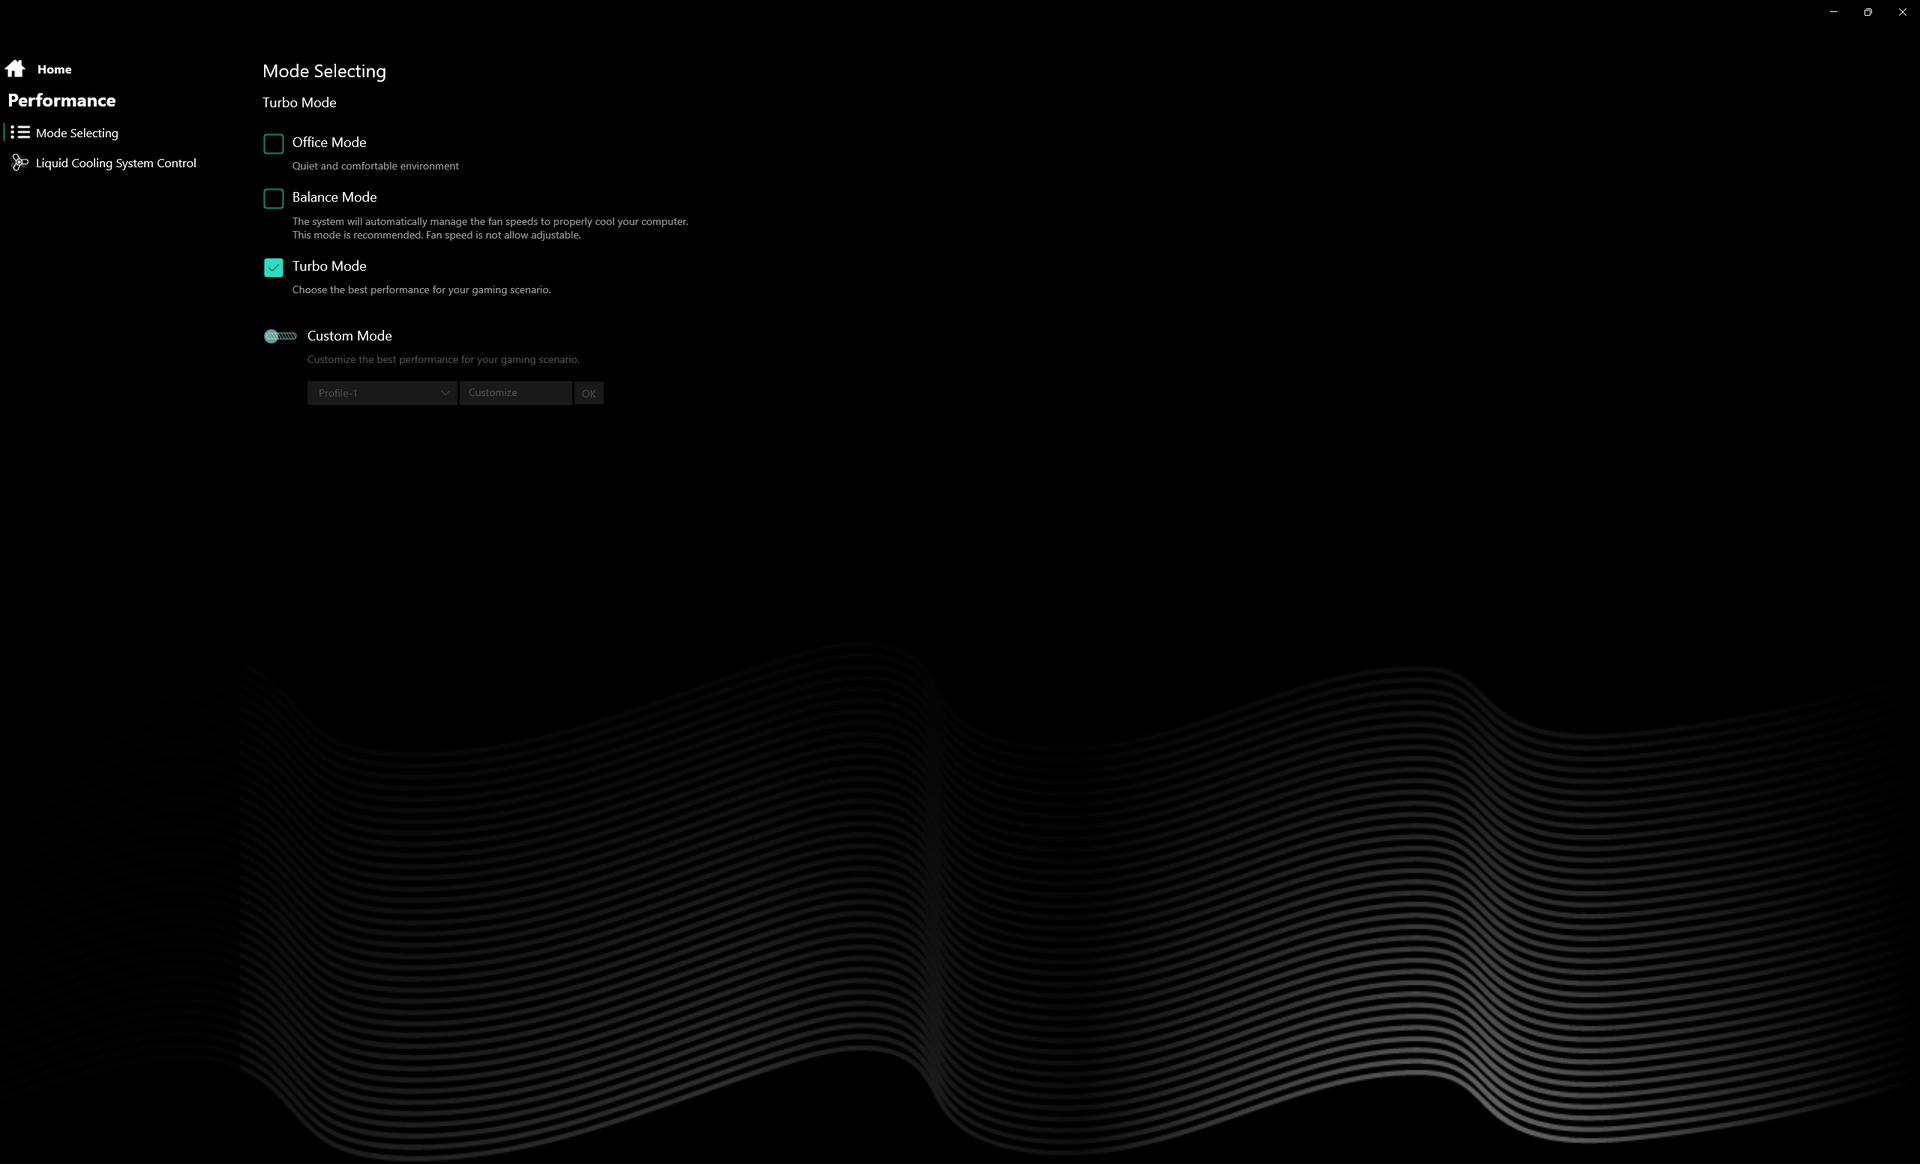
Przed przeprowadzeniem poniższych benchmarków ustawiliśmy nasze urządzenie w trybie Turbo za pośrednictwem preinstalowanego oprogramowania Control Center z wyłączonym Optimusem. System nie obsługuje zaawansowanego Optimusa, co oznacza, że przy przełączaniu się pomiędzy dyskretnym GPU a Optimusem wymagany jest restart komputera. Zachęcamy użytkowników do zapoznania się z preinstalowanym oprogramowaniem Control Center, ponieważ jest to centrum regulacji profili wydajności, Optimusa i nie tylko.
G-Sync nie jest obsługiwany na wewnętrznym wyświetlaczu.

Procesor
Po przetestowaniu kilku laptopów do gier dla entuzjastów z procesorami Core i9 13. generacji możemy wreszcie zobaczyć, jak skaluje się procesor Core i7-13700HX z wyższej półki. Benchmarki pokazują, że jest on o około 25 procent szybszy od poprzedniej, 12. generacji Core i7-12700H powszechnie spotykany w większości średniej i wyższej klasy laptopów do gier z 2022 roku. Uaktualnienie do Core i9-13900HX ma dość znacznie zwiększyć wydajność o 35 procent.
Ogólna wydajność jest znacznie wyższa od jakiegokolwiek mobilnego procesora Zen 3+, podczas gdy najnowszy Zen 4 Ryzen 9 7945HX jest wciąż szybszym procesorem o 20 do 50 procent. Stabilność wydajności jest doskonała, bez większych wahań częstotliwości taktowania pod obciążeniem.
Więcej szczegółów technicznych i porównań benchmarków dotyczących Core i7-13700HX można znaleźć na naszej dedykowanej stronie tutaj.
Cinebench R15 Multi Loop
Cinebench R23: Multi Core | Single Core
Cinebench R20: CPU (Multi Core) | CPU (Single Core)
Cinebench R15: CPU Multi 64Bit | CPU Single 64Bit
Blender: v2.79 BMW27 CPU
7-Zip 18.03: 7z b 4 | 7z b 4 -mmt1
Geekbench 5.5: Multi-Core | Single-Core
HWBOT x265 Benchmark v2.2: 4k Preset
LibreOffice : 20 Documents To PDF
R Benchmark 2.5: Overall mean
| CPU Performance rating | |
| Schenker XMG Neo 16 E23 | |
| Asus ROG Strix G16 G614JZ | |
| Asus ROG Strix G17 G713PI | |
| Corsair One i300 | |
| Razer Blade 16 Early 2023 | |
| MSI Titan GT77 12UHS | |
| Uniwill GM6PX7X RTX 4070 | |
| Przeciętny Intel Core i7-13700HX | |
| Gigabyte AERO 16 OLED BSF | |
| MSI Pulse GL76 12UGK | |
| Alienware m17 R5 (R9 6900HX, RX 6850M XT) | |
| Razer Blade 17 Early 2022 | |
| Alienware x17 RTX 3080 P48E -2! | |
| Asus ROG Strix G17 G713QE-RB74 -2! | |
| Cinebench R23 / Multi Core | |
| Asus ROG Strix G17 G713PI | |
| Asus ROG Strix G16 G614JZ | |
| Schenker XMG Neo 16 E23 | |
| Razer Blade 16 Early 2023 | |
| Corsair One i300 | |
| MSI Titan GT77 12UHS | |
| Uniwill GM6PX7X RTX 4070 | |
| Przeciętny Intel Core i7-13700HX (15558 - 22598, n=11) | |
| Gigabyte AERO 16 OLED BSF | |
| MSI Pulse GL76 12UGK | |
| Alienware x17 RTX 3080 P48E | |
| Alienware m17 R5 (R9 6900HX, RX 6850M XT) | |
| Asus ROG Strix G17 G713QE-RB74 | |
| Razer Blade 17 Early 2022 | |
| Cinebench R23 / Single Core | |
| Asus ROG Strix G16 G614JZ | |
| Schenker XMG Neo 16 E23 | |
| Razer Blade 16 Early 2023 | |
| Corsair One i300 | |
| MSI Titan GT77 12UHS | |
| Razer Blade 17 Early 2022 | |
| Asus ROG Strix G17 G713PI | |
| Przeciętny Intel Core i7-13700HX (1666 - 1933, n=11) | |
| Uniwill GM6PX7X RTX 4070 | |
| MSI Pulse GL76 12UGK | |
| Gigabyte AERO 16 OLED BSF | |
| Alienware m17 R5 (R9 6900HX, RX 6850M XT) | |
| Alienware x17 RTX 3080 P48E | |
| Asus ROG Strix G17 G713QE-RB74 | |
| Cinebench R20 / CPU (Multi Core) | |
| Asus ROG Strix G16 G614JZ | |
| Schenker XMG Neo 16 E23 | |
| Asus ROG Strix G17 G713PI | |
| Corsair One i300 | |
| Razer Blade 16 Early 2023 | |
| MSI Titan GT77 12UHS | |
| Uniwill GM6PX7X RTX 4070 | |
| Przeciętny Intel Core i7-13700HX (6160 - 8610, n=11) | |
| Gigabyte AERO 16 OLED BSF | |
| MSI Pulse GL76 12UGK | |
| Alienware x17 RTX 3080 P48E | |
| Alienware m17 R5 (R9 6900HX, RX 6850M XT) | |
| Asus ROG Strix G17 G713QE-RB74 | |
| Razer Blade 17 Early 2022 | |
| Cinebench R20 / CPU (Single Core) | |
| Asus ROG Strix G16 G614JZ | |
| Schenker XMG Neo 16 E23 | |
| Corsair One i300 | |
| Razer Blade 16 Early 2023 | |
| MSI Titan GT77 12UHS | |
| Asus ROG Strix G17 G713PI | |
| Uniwill GM6PX7X RTX 4070 | |
| Przeciętny Intel Core i7-13700HX (644 - 740, n=11) | |
| Razer Blade 17 Early 2022 | |
| MSI Pulse GL76 12UGK | |
| Gigabyte AERO 16 OLED BSF | |
| Alienware m17 R5 (R9 6900HX, RX 6850M XT) | |
| Alienware x17 RTX 3080 P48E | |
| Asus ROG Strix G17 G713QE-RB74 | |
| Cinebench R15 / CPU Multi 64Bit | |
| Asus ROG Strix G17 G713PI | |
| Asus ROG Strix G16 G614JZ | |
| Asus ROG Strix G16 G614JZ | |
| Schenker XMG Neo 16 E23 | |
| Razer Blade 16 Early 2023 | |
| MSI Titan GT77 12UHS | |
| Corsair One i300 | |
| Uniwill GM6PX7X RTX 4070 | |
| Przeciętny Intel Core i7-13700HX (2548 - 3482, n=12) | |
| Gigabyte AERO 16 OLED BSF | |
| MSI Pulse GL76 12UGK | |
| Alienware m17 R5 (R9 6900HX, RX 6850M XT) | |
| Alienware x17 RTX 3080 P48E | |
| Asus ROG Strix G17 G713QE-RB74 | |
| Razer Blade 17 Early 2022 | |
| Cinebench R15 / CPU Single 64Bit | |
| Asus ROG Strix G16 G614JZ | |
| Asus ROG Strix G16 G614JZ | |
| Schenker XMG Neo 16 E23 | |
| Asus ROG Strix G17 G713PI | |
| Corsair One i300 | |
| MSI Titan GT77 12UHS | |
| Razer Blade 16 Early 2023 | |
| Przeciętny Intel Core i7-13700HX (243 - 279, n=11) | |
| Uniwill GM6PX7X RTX 4070 | |
| Razer Blade 17 Early 2022 | |
| MSI Pulse GL76 12UGK | |
| Alienware m17 R5 (R9 6900HX, RX 6850M XT) | |
| Gigabyte AERO 16 OLED BSF | |
| Asus ROG Strix G17 G713QE-RB74 | |
| Alienware x17 RTX 3080 P48E | |
| Blender / v2.79 BMW27 CPU | |
| Razer Blade 17 Early 2022 | |
| Asus ROG Strix G17 G713QE-RB74 | |
| Alienware m17 R5 (R9 6900HX, RX 6850M XT) | |
| Alienware x17 RTX 3080 P48E | |
| MSI Pulse GL76 12UGK | |
| Gigabyte AERO 16 OLED BSF | |
| Przeciętny Intel Core i7-13700HX (138 - 207, n=10) | |
| Uniwill GM6PX7X RTX 4070 | |
| MSI Titan GT77 12UHS | |
| Corsair One i300 | |
| Schenker XMG Neo 16 E23 | |
| Razer Blade 16 Early 2023 | |
| Asus ROG Strix G16 G614JZ | |
| Asus ROG Strix G17 G713PI | |
| 7-Zip 18.03 / 7z b 4 | |
| Asus ROG Strix G17 G713PI | |
| Schenker XMG Neo 16 E23 | |
| Asus ROG Strix G16 G614JZ | |
| Razer Blade 16 Early 2023 | |
| Corsair One i300 | |
| Uniwill GM6PX7X RTX 4070 | |
| MSI Titan GT77 12UHS | |
| Przeciętny Intel Core i7-13700HX (58912 - 89294, n=11) | |
| Gigabyte AERO 16 OLED BSF | |
| MSI Pulse GL76 12UGK | |
| Alienware m17 R5 (R9 6900HX, RX 6850M XT) | |
| Asus ROG Strix G17 G713QE-RB74 | |
| Alienware x17 RTX 3080 P48E | |
| Razer Blade 17 Early 2022 | |
| 7-Zip 18.03 / 7z b 4 -mmt1 | |
| Asus ROG Strix G17 G713PI | |
| Schenker XMG Neo 16 E23 | |
| Asus ROG Strix G16 G614JZ | |
| Corsair One i300 | |
| Razer Blade 16 Early 2023 | |
| MSI Titan GT77 12UHS | |
| Przeciętny Intel Core i7-13700HX (5552 - 6409, n=11) | |
| Uniwill GM6PX7X RTX 4070 | |
| Razer Blade 17 Early 2022 | |
| Alienware m17 R5 (R9 6900HX, RX 6850M XT) | |
| MSI Pulse GL76 12UGK | |
| Gigabyte AERO 16 OLED BSF | |
| Asus ROG Strix G17 G713QE-RB74 | |
| Alienware x17 RTX 3080 P48E | |
| Geekbench 5.5 / Multi-Core | |
| Schenker XMG Neo 16 E23 | |
| Asus ROG Strix G16 G614JZ | |
| Asus ROG Strix G17 G713PI | |
| Razer Blade 16 Early 2023 | |
| Corsair One i300 | |
| MSI Titan GT77 12UHS | |
| Uniwill GM6PX7X RTX 4070 | |
| Przeciętny Intel Core i7-13700HX (10156 - 15850, n=12) | |
| Gigabyte AERO 16 OLED BSF | |
| MSI Pulse GL76 12UGK | |
| Alienware m17 R5 (R9 6900HX, RX 6850M XT) | |
| Razer Blade 17 Early 2022 | |
| Geekbench 5.5 / Single-Core | |
| Asus ROG Strix G17 G713PI | |
| Schenker XMG Neo 16 E23 | |
| Asus ROG Strix G16 G614JZ | |
| Corsair One i300 | |
| MSI Titan GT77 12UHS | |
| Uniwill GM6PX7X RTX 4070 | |
| Przeciętny Intel Core i7-13700HX (1666 - 1899, n=12) | |
| Razer Blade 16 Early 2023 | |
| Razer Blade 17 Early 2022 | |
| Gigabyte AERO 16 OLED BSF | |
| MSI Pulse GL76 12UGK | |
| Alienware m17 R5 (R9 6900HX, RX 6850M XT) | |
| HWBOT x265 Benchmark v2.2 / 4k Preset | |
| Asus ROG Strix G17 G713PI | |
| Schenker XMG Neo 16 E23 | |
| Asus ROG Strix G16 G614JZ | |
| Corsair One i300 | |
| Razer Blade 16 Early 2023 | |
| MSI Titan GT77 12UHS | |
| Uniwill GM6PX7X RTX 4070 | |
| Przeciętny Intel Core i7-13700HX (17.1 - 25.5, n=11) | |
| Gigabyte AERO 16 OLED BSF | |
| MSI Pulse GL76 12UGK | |
| Alienware x17 RTX 3080 P48E | |
| Alienware m17 R5 (R9 6900HX, RX 6850M XT) | |
| Asus ROG Strix G17 G713QE-RB74 | |
| Razer Blade 17 Early 2022 | |
| LibreOffice / 20 Documents To PDF | |
| Gigabyte AERO 16 OLED BSF | |
| Alienware m17 R5 (R9 6900HX, RX 6850M XT) | |
| Asus ROG Strix G17 G713QE-RB74 | |
| Asus ROG Strix G16 G614JZ | |
| Razer Blade 16 Early 2023 | |
| Alienware x17 RTX 3080 P48E | |
| MSI Pulse GL76 12UGK | |
| Asus ROG Strix G17 G713PI | |
| Przeciętny Intel Core i7-13700HX (36.5 - 52.9, n=11) | |
| Razer Blade 17 Early 2022 | |
| MSI Titan GT77 12UHS | |
| Uniwill GM6PX7X RTX 4070 | |
| Corsair One i300 | |
| Schenker XMG Neo 16 E23 | |
| R Benchmark 2.5 / Overall mean | |
| Alienware x17 RTX 3080 P48E | |
| Asus ROG Strix G17 G713QE-RB74 | |
| Gigabyte AERO 16 OLED BSF | |
| Alienware m17 R5 (R9 6900HX, RX 6850M XT) | |
| MSI Pulse GL76 12UGK | |
| Uniwill GM6PX7X RTX 4070 | |
| Przeciętny Intel Core i7-13700HX (0.4274 - 0.513, n=11) | |
| Razer Blade 17 Early 2022 | |
| MSI Titan GT77 12UHS | |
| Asus ROG Strix G17 G713PI | |
| Razer Blade 16 Early 2023 | |
| Corsair One i300 | |
| Asus ROG Strix G16 G614JZ | |
| Schenker XMG Neo 16 E23 | |
Cinebench R23: Multi Core | Single Core
Cinebench R20: CPU (Multi Core) | CPU (Single Core)
Cinebench R15: CPU Multi 64Bit | CPU Single 64Bit
Blender: v2.79 BMW27 CPU
7-Zip 18.03: 7z b 4 | 7z b 4 -mmt1
Geekbench 5.5: Multi-Core | Single-Core
HWBOT x265 Benchmark v2.2: 4k Preset
LibreOffice : 20 Documents To PDF
R Benchmark 2.5: Overall mean
* ... im mniej tym lepiej
AIDA64: FP32 Ray-Trace | FPU Julia | CPU SHA3 | CPU Queen | FPU SinJulia | FPU Mandel | CPU AES | CPU ZLib | FP64 Ray-Trace | CPU PhotoWorxx
| Performance rating | |
| Lenovo Legion Pro 7 16IRX8H | |
| Asus ROG Strix G16 G614JZ | |
| Schenker XMG Neo 16 E23 | |
| Razer Blade 16 Early 2023 | |
| Uniwill GM6PX7X RTX 4070 | |
| Gigabyte AERO 16 OLED BSF | |
| Przeciętny Intel Core i7-13700HX | |
| AIDA64 / FP32 Ray-Trace | |
| Asus ROG Strix G16 G614JZ | |
| Lenovo Legion Pro 7 16IRX8H | |
| Razer Blade 16 Early 2023 | |
| Razer Blade 16 Early 2023 | |
| Razer Blade 16 Early 2023 | |
| Schenker XMG Neo 16 E23 | |
| Uniwill GM6PX7X RTX 4070 | |
| Przeciętny Intel Core i7-13700HX (14261 - 21999, n=11) | |
| Gigabyte AERO 16 OLED BSF | |
| AIDA64 / FPU Julia | |
| Lenovo Legion Pro 7 16IRX8H | |
| Asus ROG Strix G16 G614JZ | |
| Razer Blade 16 Early 2023 | |
| Razer Blade 16 Early 2023 | |
| Razer Blade 16 Early 2023 | |
| Schenker XMG Neo 16 E23 | |
| Uniwill GM6PX7X RTX 4070 | |
| Przeciętny Intel Core i7-13700HX (74636 - 109364, n=11) | |
| Gigabyte AERO 16 OLED BSF | |
| AIDA64 / CPU SHA3 | |
| Lenovo Legion Pro 7 16IRX8H | |
| Asus ROG Strix G16 G614JZ | |
| Razer Blade 16 Early 2023 | |
| Razer Blade 16 Early 2023 | |
| Razer Blade 16 Early 2023 | |
| Schenker XMG Neo 16 E23 | |
| Uniwill GM6PX7X RTX 4070 | |
| Przeciętny Intel Core i7-13700HX (3359 - 5053, n=11) | |
| Gigabyte AERO 16 OLED BSF | |
| AIDA64 / CPU Queen | |
| Asus ROG Strix G16 G614JZ | |
| Schenker XMG Neo 16 E23 | |
| Razer Blade 16 Early 2023 | |
| Razer Blade 16 Early 2023 | |
| Lenovo Legion Pro 7 16IRX8H | |
| Uniwill GM6PX7X RTX 4070 | |
| Przeciętny Intel Core i7-13700HX (86532 - 114717, n=11) | |
| Gigabyte AERO 16 OLED BSF | |
| AIDA64 / FPU SinJulia | |
| Asus ROG Strix G16 G614JZ | |
| Razer Blade 16 Early 2023 | |
| Razer Blade 16 Early 2023 | |
| Razer Blade 16 Early 2023 | |
| Lenovo Legion Pro 7 16IRX8H | |
| Schenker XMG Neo 16 E23 | |
| Uniwill GM6PX7X RTX 4070 | |
| Przeciętny Intel Core i7-13700HX (9290 - 13519, n=11) | |
| Gigabyte AERO 16 OLED BSF | |
| AIDA64 / FPU Mandel | |
| Lenovo Legion Pro 7 16IRX8H | |
| Asus ROG Strix G16 G614JZ | |
| Razer Blade 16 Early 2023 | |
| Razer Blade 16 Early 2023 | |
| Razer Blade 16 Early 2023 | |
| Schenker XMG Neo 16 E23 | |
| Uniwill GM6PX7X RTX 4070 | |
| Przeciętny Intel Core i7-13700HX (35751 - 53484, n=11) | |
| Gigabyte AERO 16 OLED BSF | |
| AIDA64 / CPU AES | |
| Schenker XMG Neo 16 E23 | |
| Uniwill GM6PX7X RTX 4070 | |
| Razer Blade 16 Early 2023 | |
| Razer Blade 16 Early 2023 | |
| Razer Blade 16 Early 2023 | |
| Gigabyte AERO 16 OLED BSF | |
| Asus ROG Strix G16 G614JZ | |
| Lenovo Legion Pro 7 16IRX8H | |
| Przeciętny Intel Core i7-13700HX (67846 - 182575, n=11) | |
| AIDA64 / CPU ZLib | |
| Lenovo Legion Pro 7 16IRX8H | |
| Asus ROG Strix G16 G614JZ | |
| Razer Blade 16 Early 2023 | |
| Razer Blade 16 Early 2023 | |
| Razer Blade 16 Early 2023 | |
| Schenker XMG Neo 16 E23 | |
| Uniwill GM6PX7X RTX 4070 | |
| Przeciętny Intel Core i7-13700HX (981 - 1451, n=11) | |
| Gigabyte AERO 16 OLED BSF | |
| AIDA64 / FP64 Ray-Trace | |
| Lenovo Legion Pro 7 16IRX8H | |
| Asus ROG Strix G16 G614JZ | |
| Razer Blade 16 Early 2023 | |
| Razer Blade 16 Early 2023 | |
| Razer Blade 16 Early 2023 | |
| Schenker XMG Neo 16 E23 | |
| Uniwill GM6PX7X RTX 4070 | |
| Przeciętny Intel Core i7-13700HX (7728 - 11837, n=11) | |
| Gigabyte AERO 16 OLED BSF | |
| AIDA64 / CPU PhotoWorxx | |
| Razer Blade 16 Early 2023 | |
| Razer Blade 16 Early 2023 | |
| Razer Blade 16 Early 2023 | |
| Schenker XMG Neo 16 E23 | |
| Lenovo Legion Pro 7 16IRX8H | |
| Gigabyte AERO 16 OLED BSF | |
| Uniwill GM6PX7X RTX 4070 | |
| Asus ROG Strix G16 G614JZ | |
| Przeciętny Intel Core i7-13700HX (19678 - 42415, n=11) | |
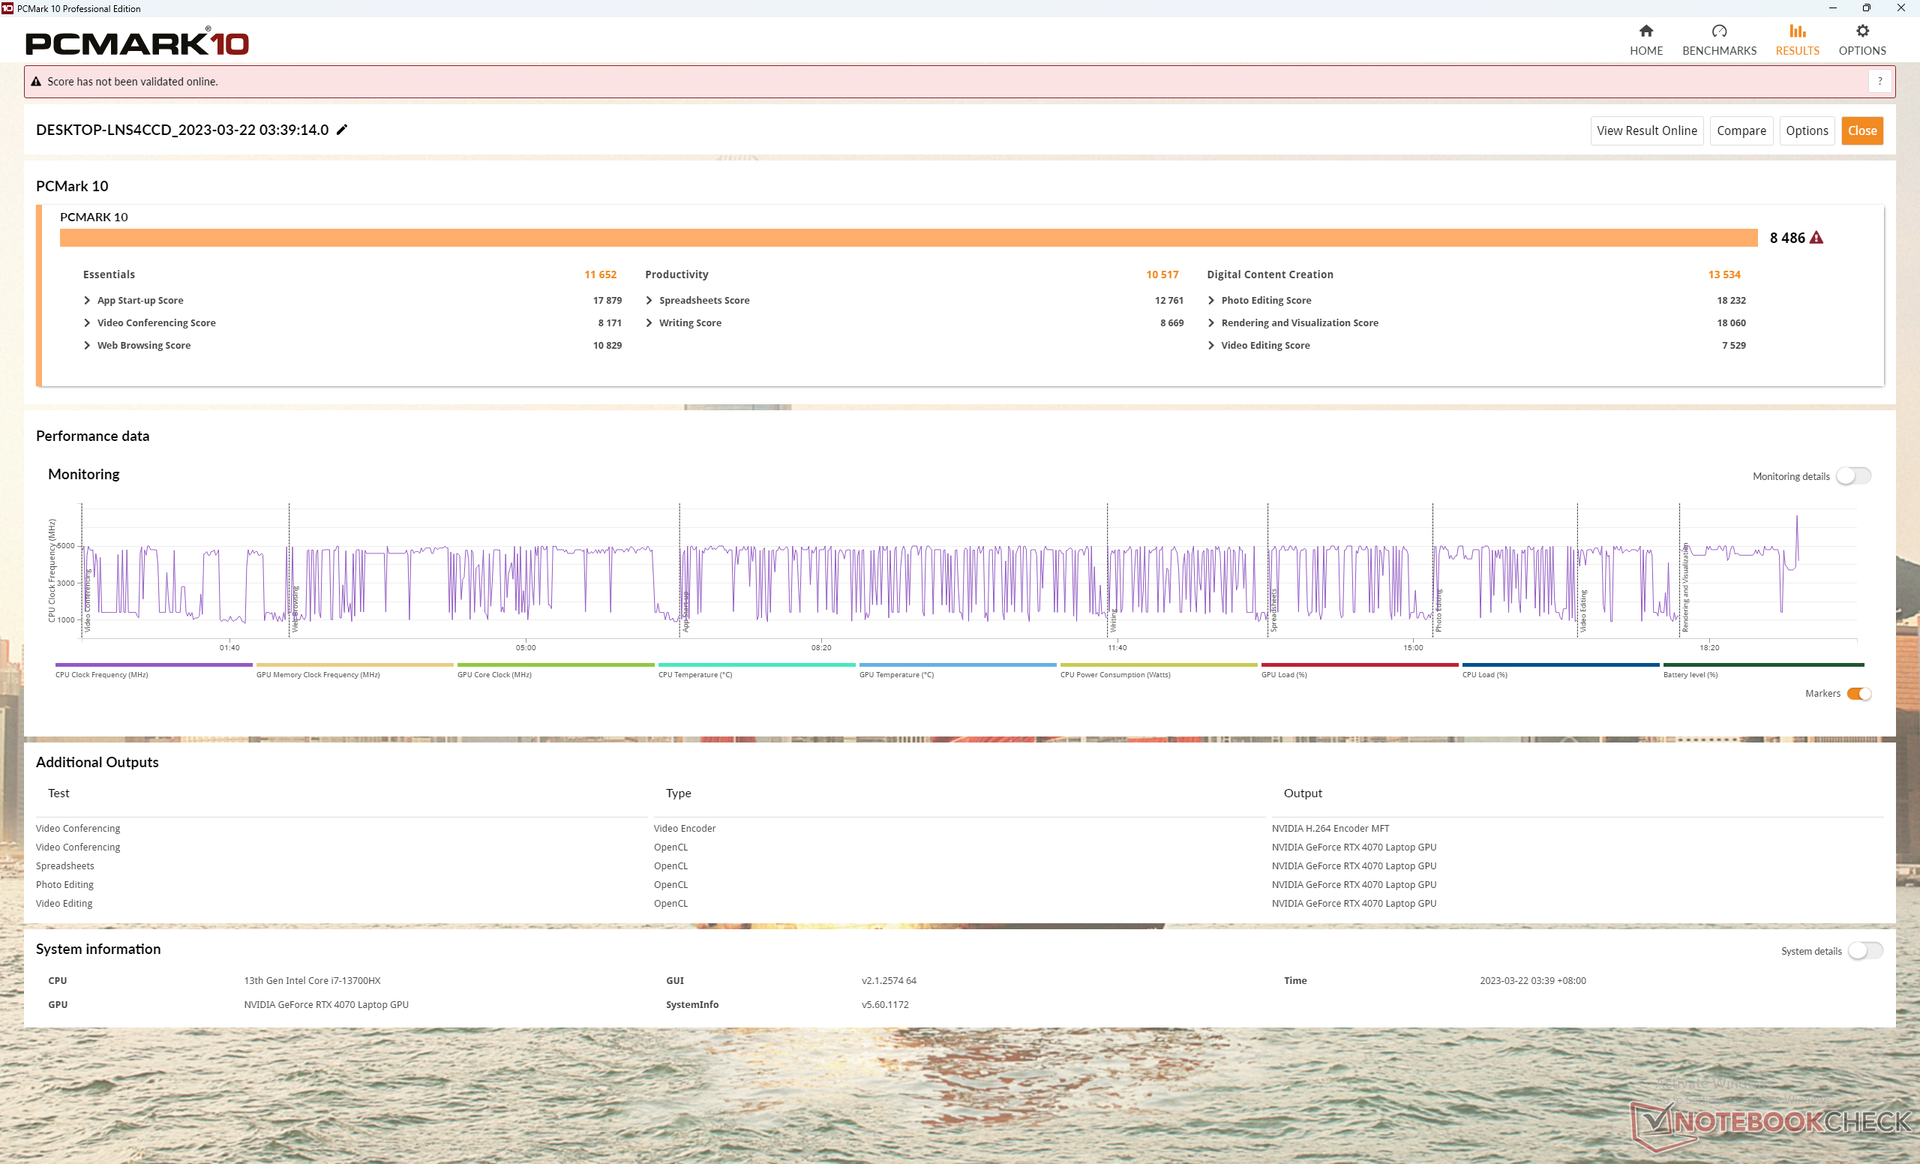
Wydajność systemu
Wyniki PCMark są porównywalne z innymi high-endowymi laptopami do gier, działającymi na procesorach Core 13. generacji i układach graficznych GeForce 40, jak Gigabyte AERO 16 czy Razer Blade 16. Wyniki konsekwentnie wyprzedzają Schenker XMG Neo 15 działający na starszym sprzęcie Zen 3+ i GeForce 30.
CrossMark: Overall | Productivity | Creativity | Responsiveness
| PCMark 10 / Score | |
| Uniwill GM6PX7X RTX 4070 | |
| Schenker XMG Neo 16 E23 | |
| Gigabyte AERO 16 OLED BSF | |
| Razer Blade 16 Early 2023 | |
| Lenovo Legion Pro 7 16IRX8H | |
| Asus ROG Strix G16 G614JZ | |
| PCMark 10 / Essentials | |
| Asus ROG Strix G16 G614JZ | |
| Lenovo Legion Pro 7 16IRX8H | |
| Uniwill GM6PX7X RTX 4070 | |
| Gigabyte AERO 16 OLED BSF | |
| Razer Blade 16 Early 2023 | |
| Schenker XMG Neo 16 E23 | |
| PCMark 10 / Productivity | |
| Lenovo Legion Pro 7 16IRX8H | |
| Uniwill GM6PX7X RTX 4070 | |
| Schenker XMG Neo 16 E23 | |
| Gigabyte AERO 16 OLED BSF | |
| Razer Blade 16 Early 2023 | |
| Asus ROG Strix G16 G614JZ | |
| PCMark 10 / Digital Content Creation | |
| Schenker XMG Neo 16 E23 | |
| Razer Blade 16 Early 2023 | |
| Gigabyte AERO 16 OLED BSF | |
| Uniwill GM6PX7X RTX 4070 | |
| Asus ROG Strix G16 G614JZ | |
| Lenovo Legion Pro 7 16IRX8H | |
| CrossMark / Overall | |
| Asus ROG Strix G16 G614JZ | |
| Schenker XMG Neo 16 E23 | |
| Uniwill GM6PX7X RTX 4070 | |
| Gigabyte AERO 16 OLED BSF | |
| Razer Blade 16 Early 2023 | |
| CrossMark / Productivity | |
| Asus ROG Strix G16 G614JZ | |
| Schenker XMG Neo 16 E23 | |
| Uniwill GM6PX7X RTX 4070 | |
| Gigabyte AERO 16 OLED BSF | |
| Razer Blade 16 Early 2023 | |
| CrossMark / Creativity | |
| Schenker XMG Neo 16 E23 | |
| Asus ROG Strix G16 G614JZ | |
| Uniwill GM6PX7X RTX 4070 | |
| Gigabyte AERO 16 OLED BSF | |
| Razer Blade 16 Early 2023 | |
| CrossMark / Responsiveness | |
| Asus ROG Strix G16 G614JZ | |
| Gigabyte AERO 16 OLED BSF | |
| Uniwill GM6PX7X RTX 4070 | |
| Schenker XMG Neo 16 E23 | |
| Razer Blade 16 Early 2023 | |
| PCMark 10 Score | 8486 pkt. | |
Pomoc | ||
| AIDA64 / Memory Copy | |
| Razer Blade 16 Early 2023 | |
| Razer Blade 16 Early 2023 | |
| Razer Blade 16 Early 2023 | |
| Lenovo Legion Pro 7 16IRX8H | |
| Schenker XMG Neo 16 E23 | |
| Gigabyte AERO 16 OLED BSF | |
| Uniwill GM6PX7X RTX 4070 | |
| Asus ROG Strix G16 G614JZ | |
| Przeciętny Intel Core i7-13700HX (36125 - 63990, n=11) | |
| AIDA64 / Memory Read | |
| Razer Blade 16 Early 2023 | |
| Razer Blade 16 Early 2023 | |
| Razer Blade 16 Early 2023 | |
| Lenovo Legion Pro 7 16IRX8H | |
| Schenker XMG Neo 16 E23 | |
| Asus ROG Strix G16 G614JZ | |
| Uniwill GM6PX7X RTX 4070 | |
| Gigabyte AERO 16 OLED BSF | |
| Przeciętny Intel Core i7-13700HX (36510 - 69729, n=11) | |
| AIDA64 / Memory Write | |
| Razer Blade 16 Early 2023 | |
| Razer Blade 16 Early 2023 | |
| Razer Blade 16 Early 2023 | |
| Schenker XMG Neo 16 E23 | |
| Lenovo Legion Pro 7 16IRX8H | |
| Gigabyte AERO 16 OLED BSF | |
| Uniwill GM6PX7X RTX 4070 | |
| Asus ROG Strix G16 G614JZ | |
| Przeciętny Intel Core i7-13700HX (33598 - 85675, n=11) | |
| AIDA64 / Memory Latency | |
| Razer Blade 16 Early 2023 | |
| Razer Blade 16 Early 2023 | |
| Razer Blade 16 Early 2023 | |
| Gigabyte AERO 16 OLED BSF | |
| Asus ROG Strix G16 G614JZ | |
| Uniwill GM6PX7X RTX 4070 | |
| Przeciętny Intel Core i7-13700HX (81.5 - 97.9, n=11) | |
| Schenker XMG Neo 16 E23 | |
| Lenovo Legion Pro 7 16IRX8H | |
* ... im mniej tym lepiej
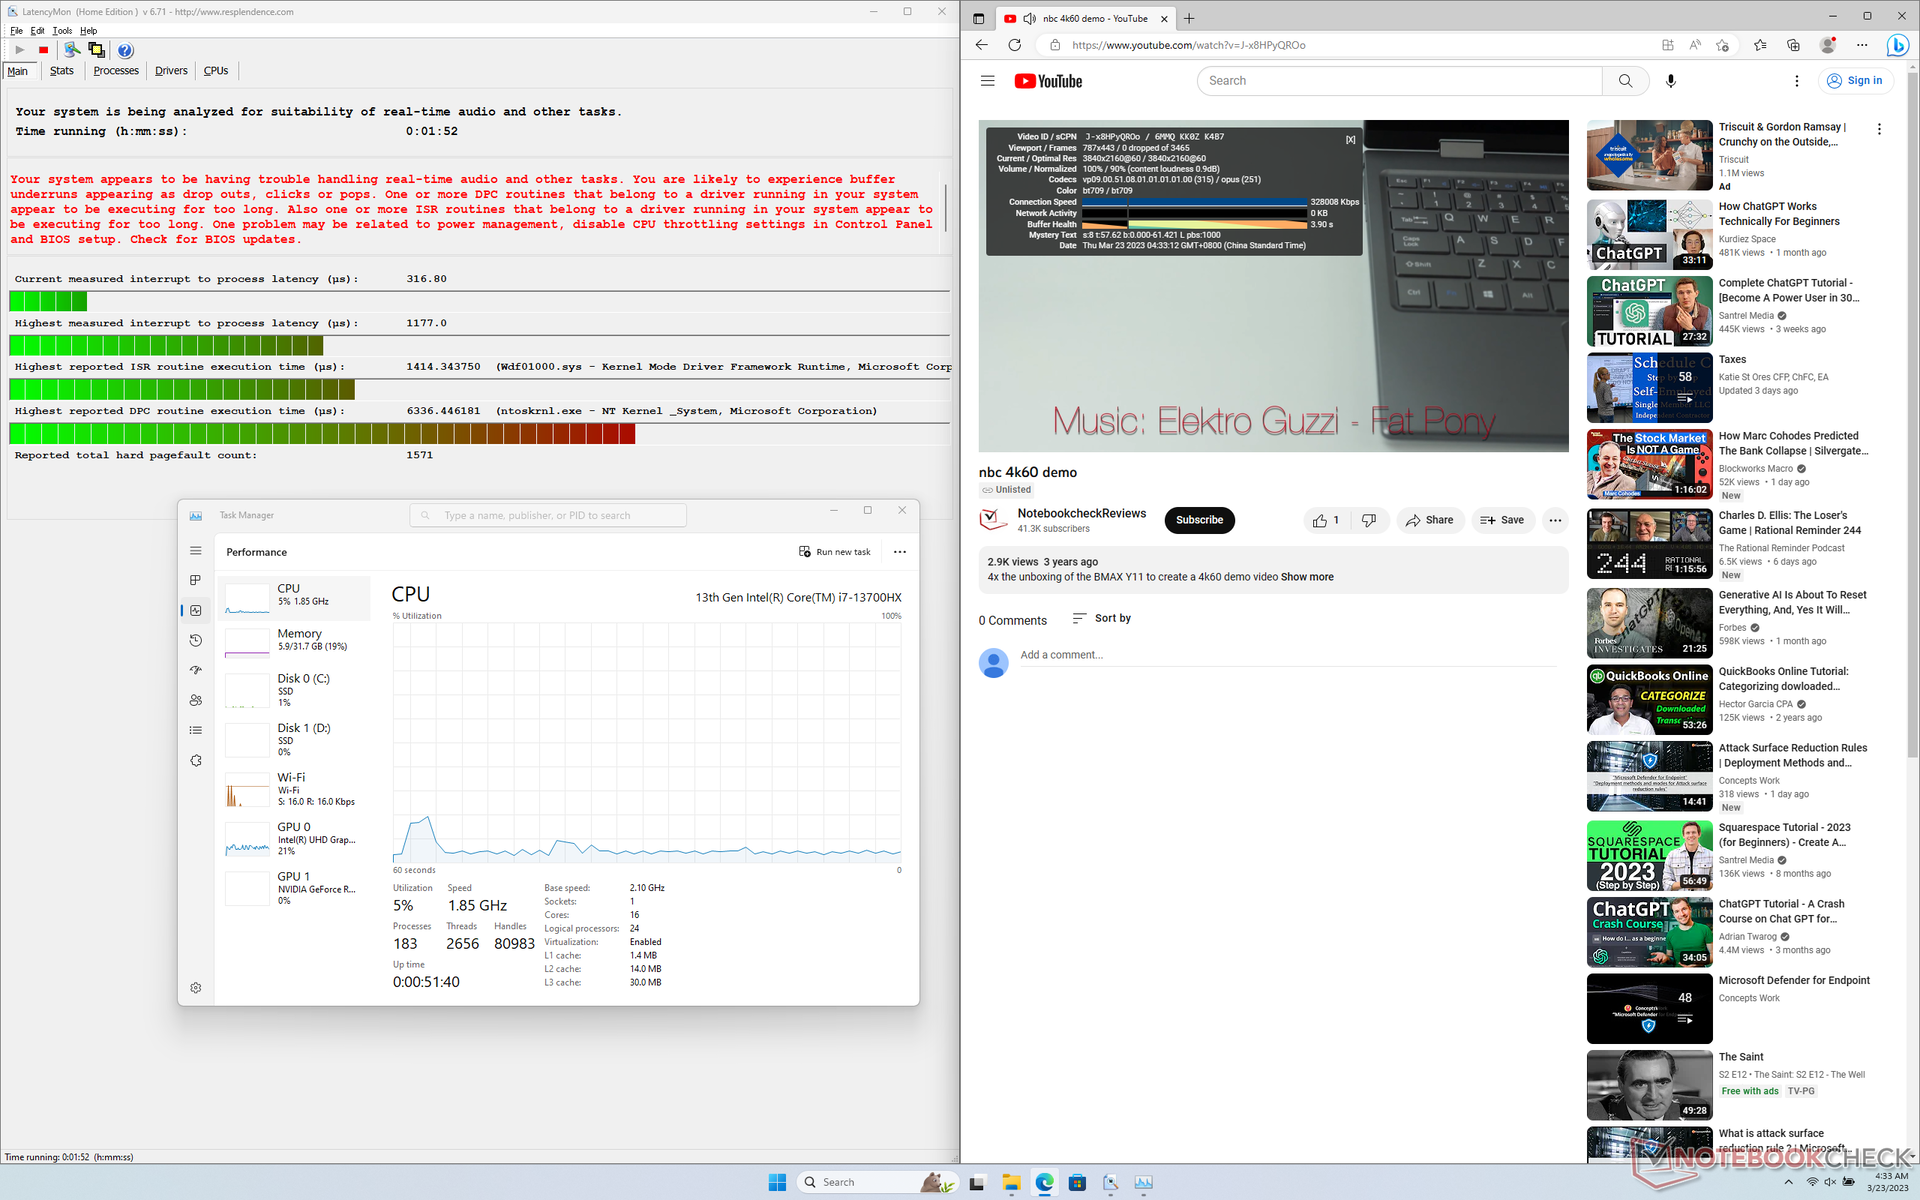
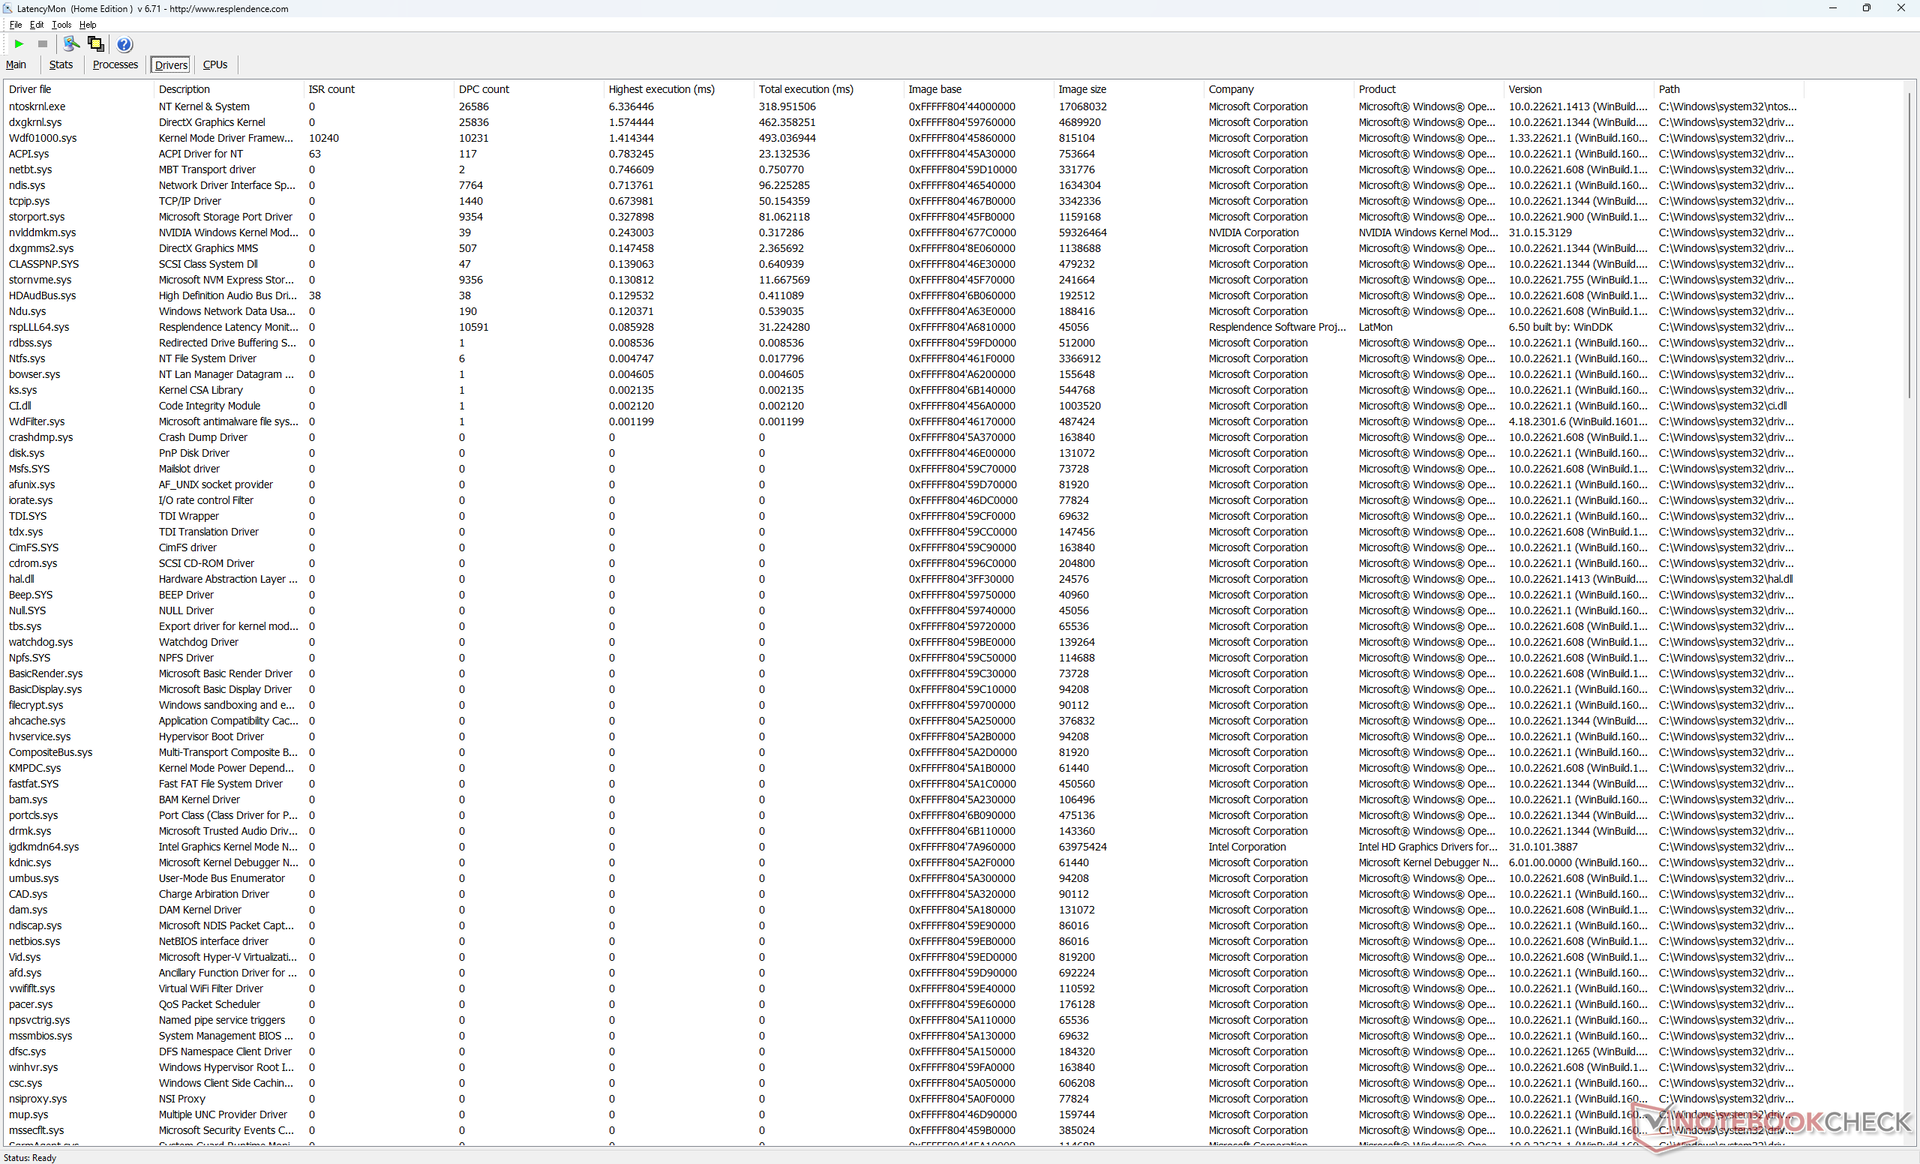
Opóźnienie DPC
LatencyMon ujawnia problemy z DPC podczas otwierania wielu kart przeglądarki na naszej stronie głównej. odtwarzanie wideo 4K przy 60 FPS jest poza tym perfekcyjne, z niskim wykorzystaniem CPU i GPU oraz brakiem porzuconych klatek.
| DPC Latencies / LatencyMon - interrupt to process latency (max), Web, Youtube, Prime95 | |
| Schenker XMG Neo 16 E23 | |
| Asus ROG Strix G16 G614JZ | |
| Razer Blade 16 Early 2023 | |
| Uniwill GM6PX7X RTX 4070 | |
| Gigabyte AERO 16 OLED BSF | |
| Lenovo Legion Pro 7 16IRX8H | |
* ... im mniej tym lepiej
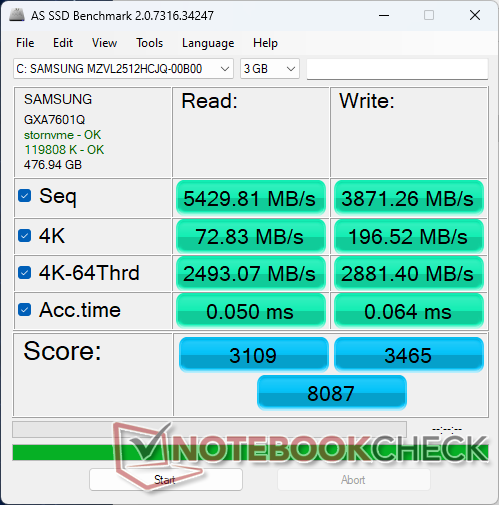
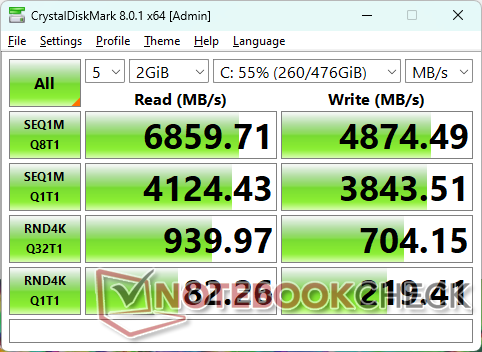
Urządzenia do przechowywania danych
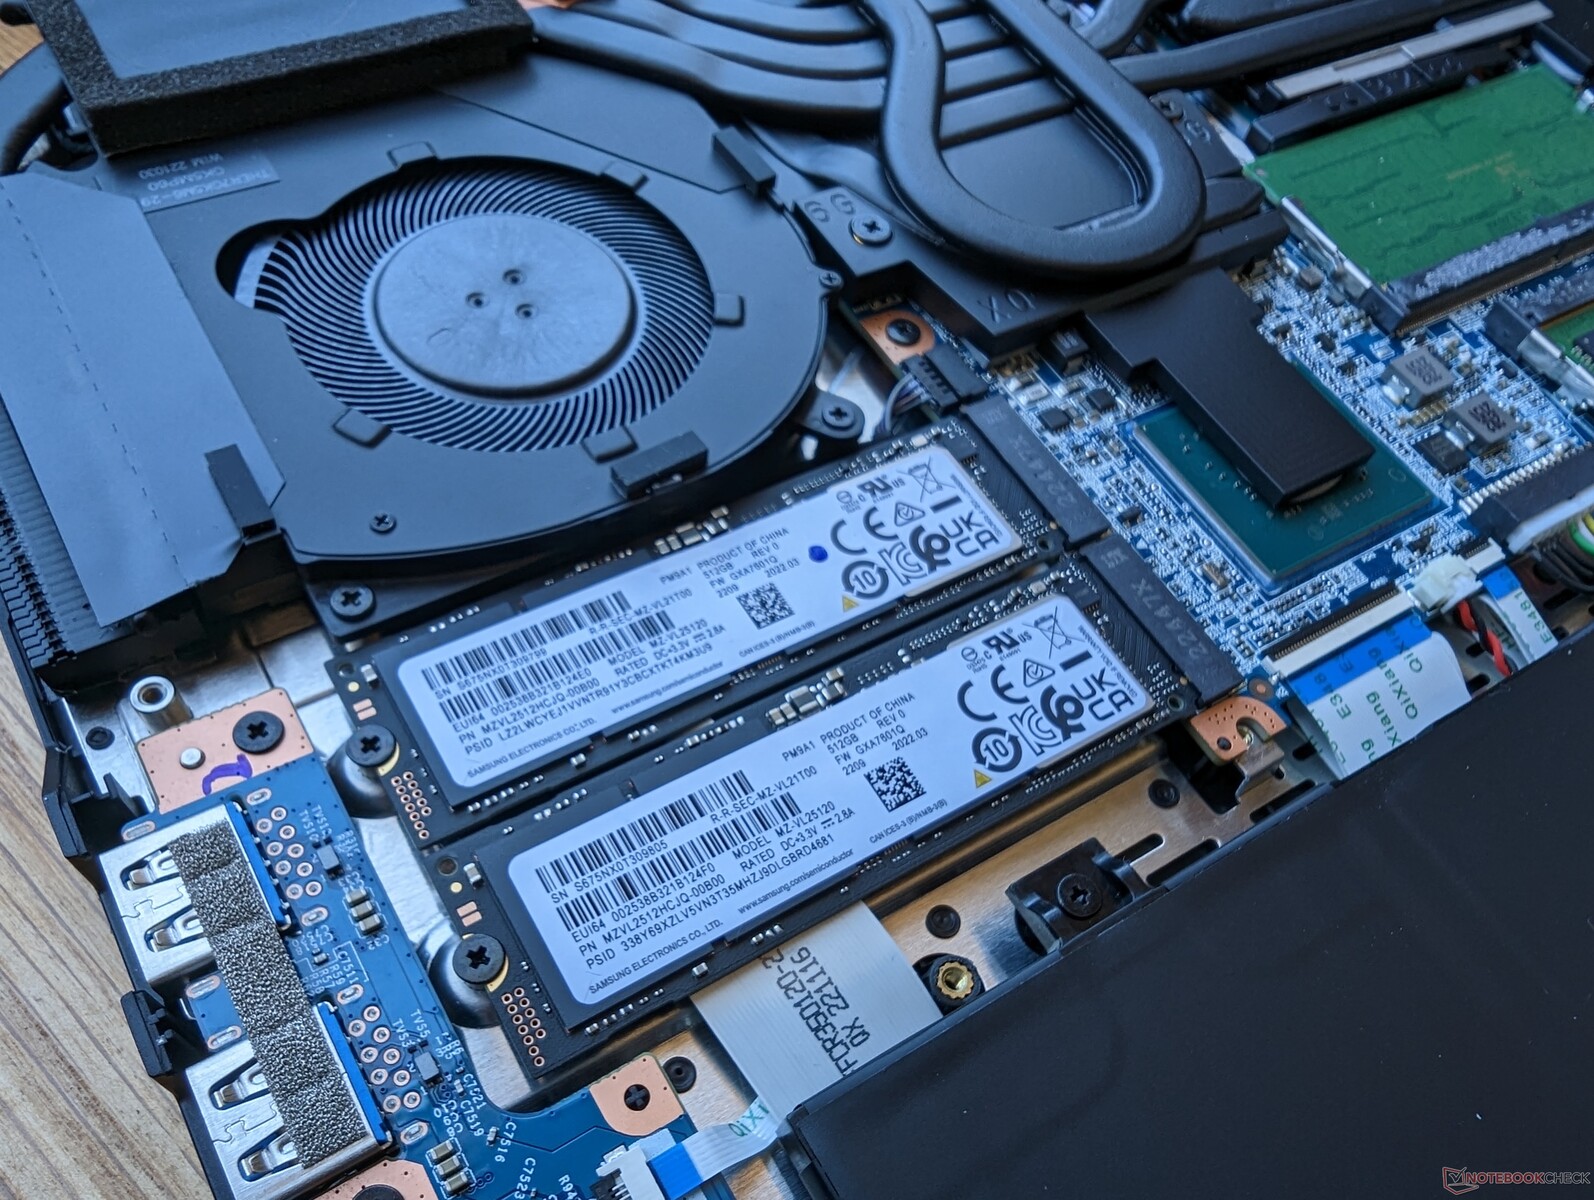
Nasz testowy egzemplarz został wyposażony w kartę PCIe4 x4 Samsung PM9A1 MZVL2512HCJQ NVMe SSD obsługujący sekwencyjny odczyt z prędkością 6700 MB/s. Szybkie tempo jest również trwałe, bez spadków wydajności w warunkach stresu.

| Drive Performance rating - Percent | |
| Lenovo Legion Pro 7 16IRX8H | |
| Uniwill GM6PX7X RTX 4070 | |
| Gigabyte AERO 16 OLED BSF | |
| Razer Blade 16 Early 2023 | |
| Asus ROG Strix G16 G614JZ | |
| Schenker XMG Neo 16 E23 | |
* ... im mniej tym lepiej
Disk Throttling: DiskSpd Read Loop, Queue Depth 8
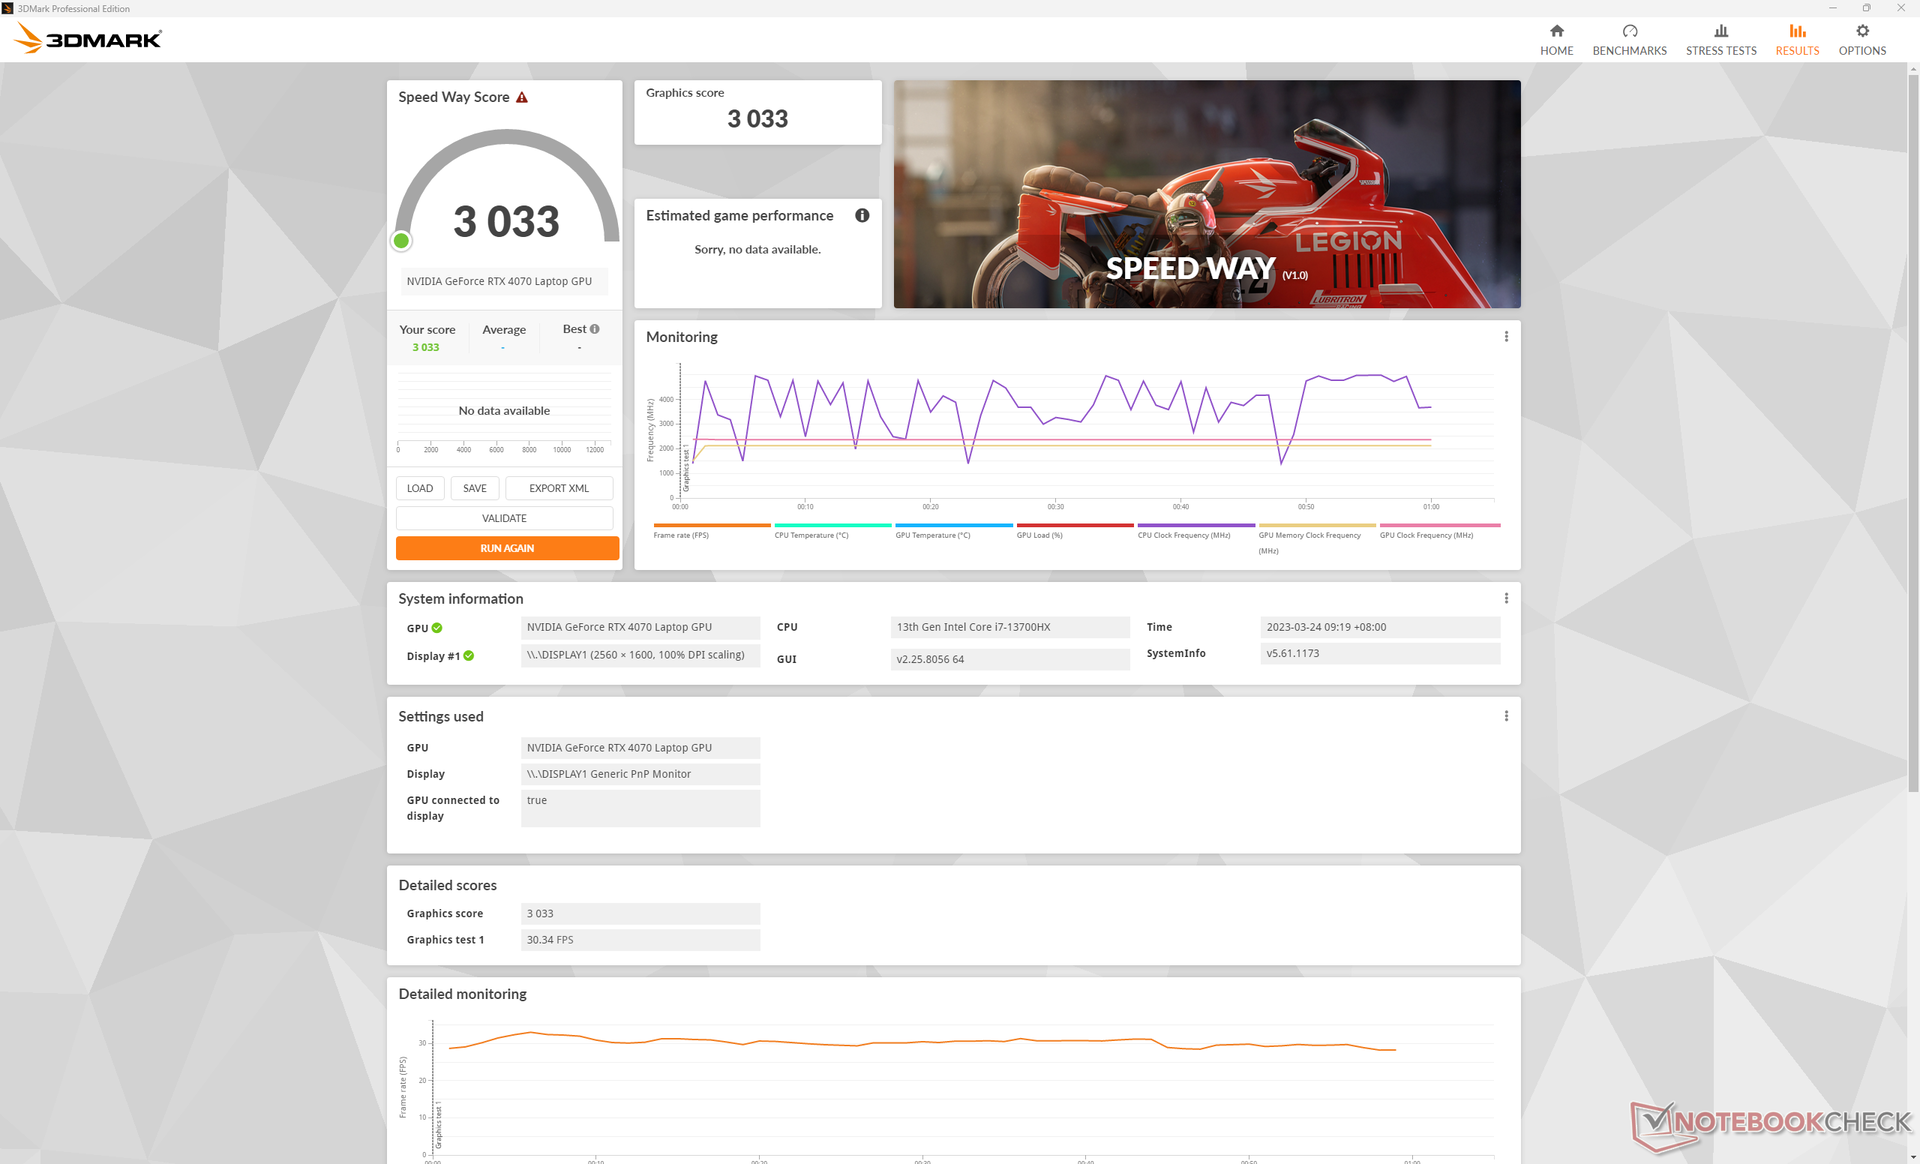
Wydajność GPU
Po przetestowaniu garstki GeForce RTX 4060, 4070, 4080 oraz 4090 laptopy do tej pory, spodziewane różnice w wydajności między nimi stają się jasne. Jeśli chodzi o 140 W mobilny RTX 4070, użytkownicy mogą oczekiwać, że będzie on działał o 15 do 20 procent szybciej niż mobilny RTX 4060 lub mniej więcej 30 do 35 procent wolniej niż 175 W mobilny RTX 4080. Tym samym różnica w wydajności między mobilnym RTX 4070 a mobilnym RTX 4080 jest znacznie większa niż różnica między mobilnym RTX 4060 a RTX 4070. Może to być sposób Nvidii na zachęcenie potencjalnych nabywców do rozważenia zamiast tego konfiguracji z wyższej półki 4080 lub 4090.
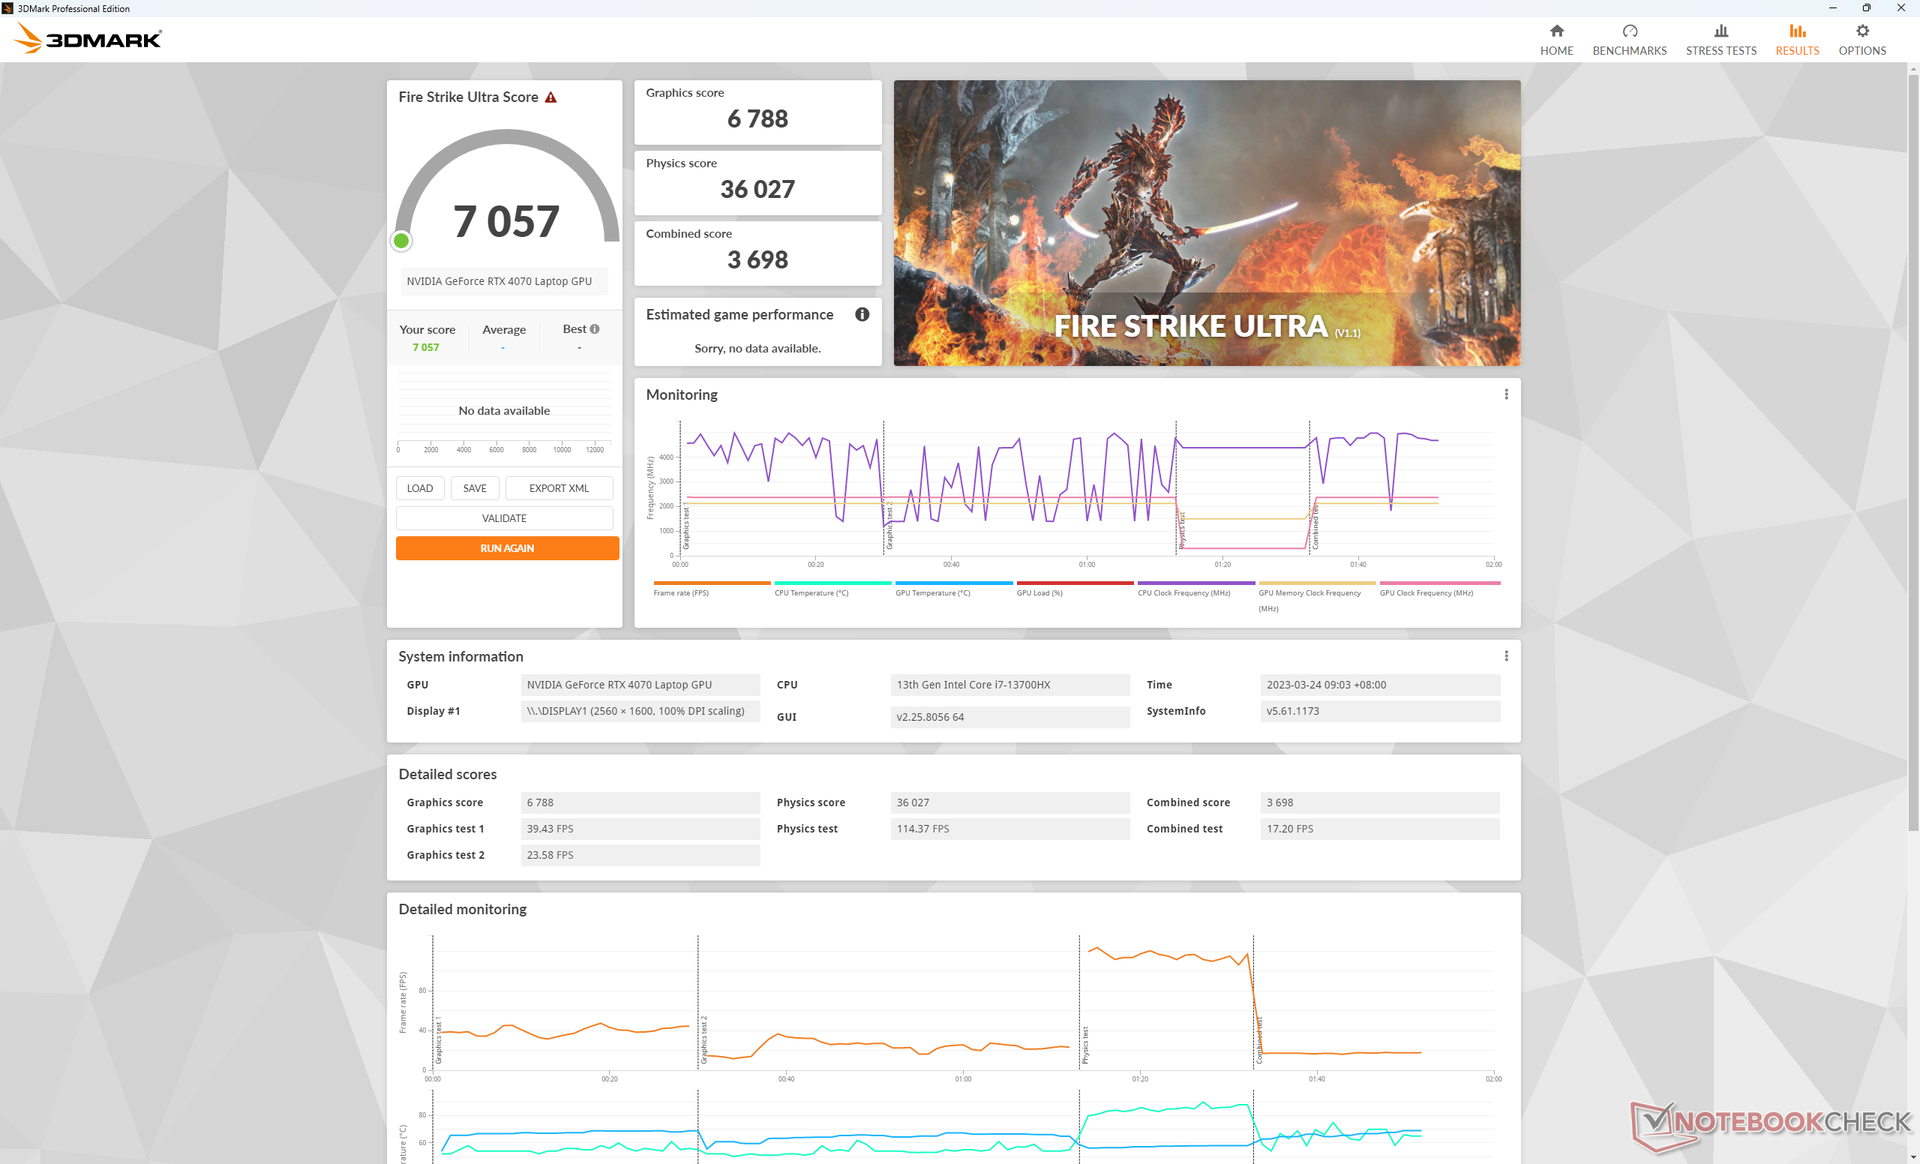
Aktualizacja z mobilnego RTX 4070 do opcji 175 W mobilnego RTX 4090 zwiększa surową wydajność o około 55 do 80 procent. Niezwykle wymagające gry w 4K, takie jak Cyberpunk 2077 czy F1 22, nie działają dobrze na mobilnym RTX 4070, chyba że obsługiwane jest DLSS lub generowanie klatek.
| 3DMark 11 - 1280x720 Performance GPU | |
| Gigabyte Aorus GeForce RTX 4070 Ti Master | |
| Schenker XMG Neo 16 E23 | |
| Corsair One i300 | |
| Asus ROG Strix G16 G614JZ | |
| MSI Titan GT77 12UHS | |
| Alienware x17 RTX 3080 P48E | |
| Alienware m17 R5 (R9 6900HX, RX 6850M XT) | |
| Uniwill GM6PX7X RTX 4070 | |
| Gigabyte AERO 16 OLED BSF | |
| Przeciętny NVIDIA GeForce RTX 4070 Laptop GPU (24229 - 46434, n=67) | |
| MSI Katana 17 B13VFK | |
| Alienware m17 R3 P45E | |
| MSI Pulse GL76 12UGK | |
| Asus ROG Strix G15 G512LW | |
| Asus ROG Strix G17 G713QE-RB74 | |
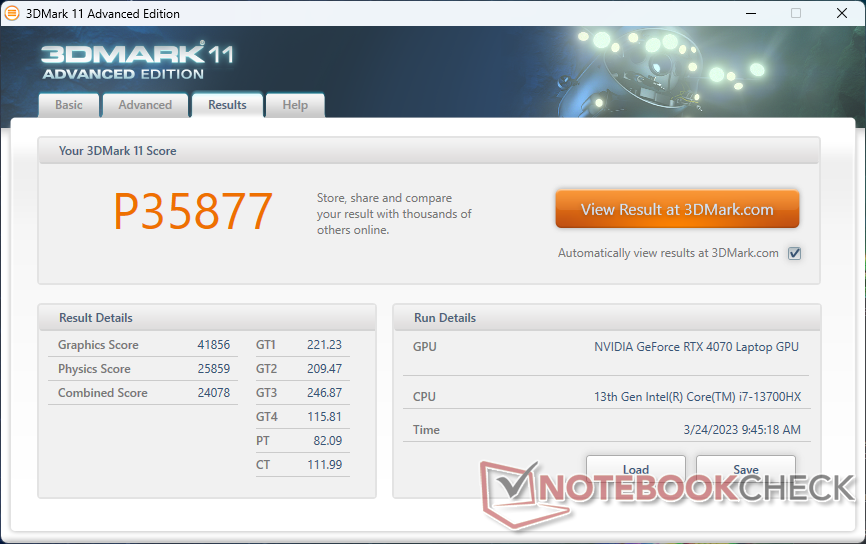
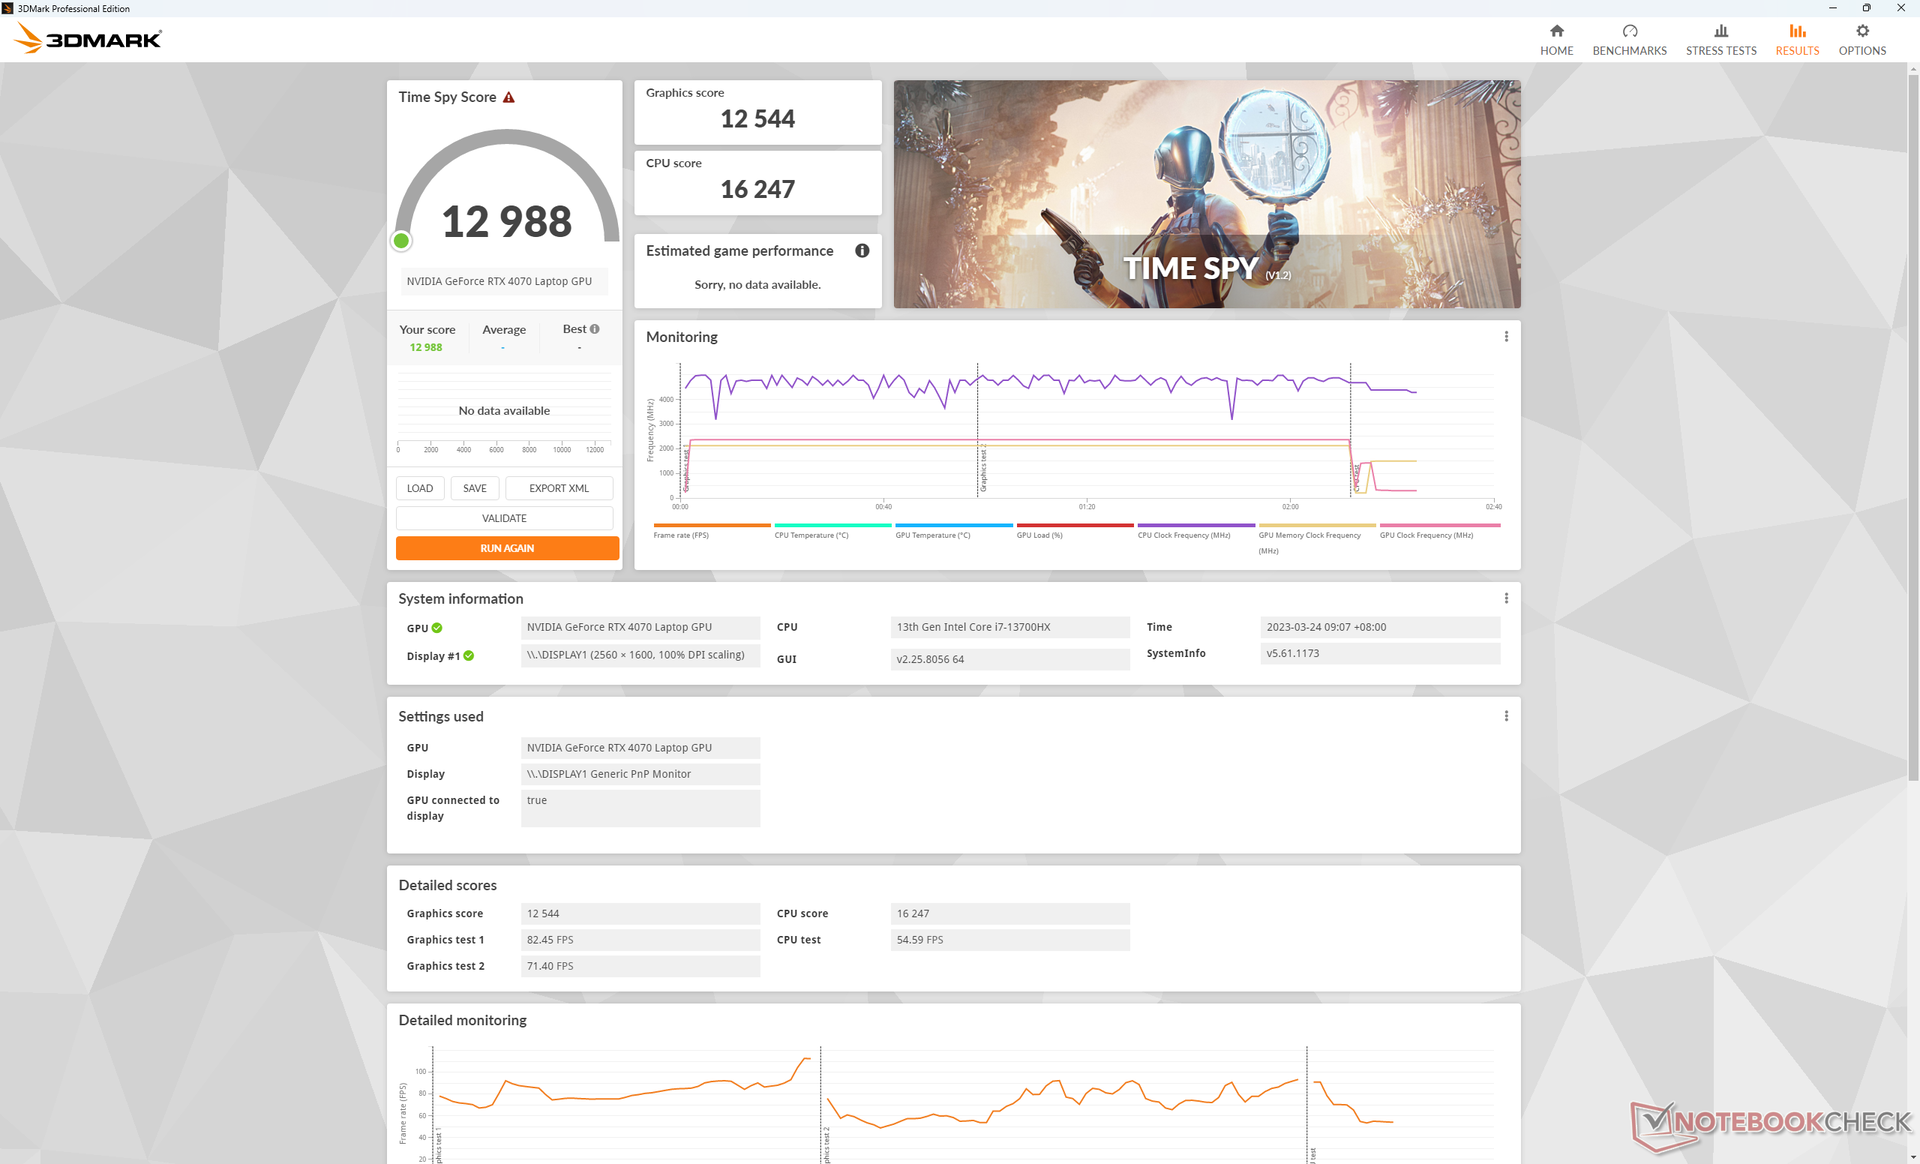
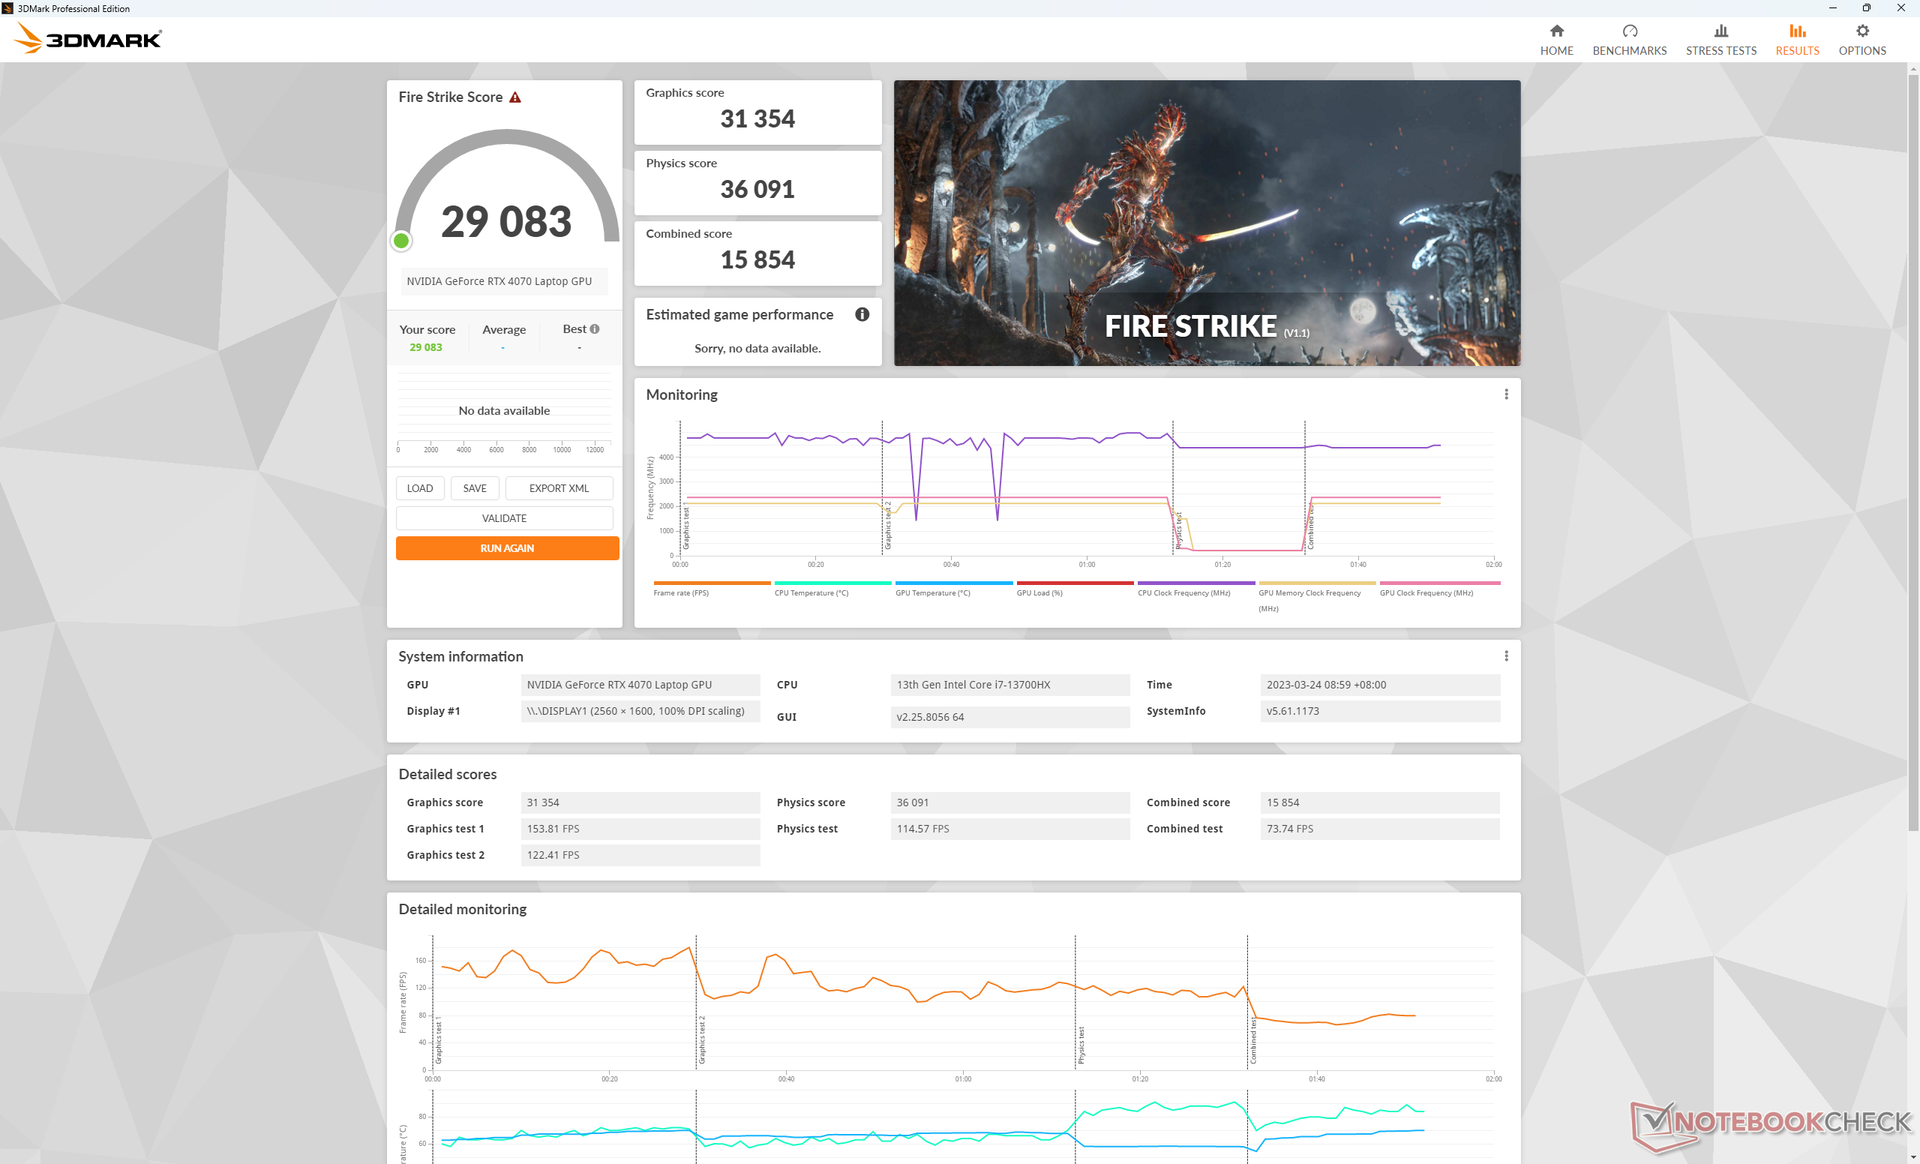
| 3DMark 11 Performance | 35877 pkt. | |
| 3DMark Fire Strike Score | 29083 pkt. | |
| 3DMark Time Spy Score | 12988 pkt. | |
Pomoc | ||
| Blender | |
| v3.3 Classroom OPTIX/RTX | |
| MSI Pulse GL76 12UGK | |
| MSI Titan GT77 12UHS | |
| Przeciętny NVIDIA GeForce RTX 4070 Laptop GPU (18 - 30, n=68) | |
| Gigabyte AERO 16 OLED BSF | |
| Uniwill GM6PX7X RTX 4070 | |
| Asus ROG Strix G16 G614JZ | |
| Schenker XMG Neo 16 E23 | |
| Gigabyte Aorus GeForce RTX 4070 Ti Master | |
| v3.3 Classroom CUDA | |
| MSI Pulse GL76 12UGK | |
| Przeciętny NVIDIA GeForce RTX 4070 Laptop GPU (32 - 50, n=67) | |
| Gigabyte AERO 16 OLED BSF | |
| Uniwill GM6PX7X RTX 4070 | |
| MSI Titan GT77 12UHS | |
| Asus ROG Strix G16 G614JZ | |
| Gigabyte Aorus GeForce RTX 4070 Ti Master | |
| Schenker XMG Neo 16 E23 | |
| v3.3 Classroom CPU | |
| Alienware m17 R5 (R9 6900HX, RX 6850M XT) | |
| MSI Pulse GL76 12UGK | |
| Gigabyte AERO 16 OLED BSF | |
| Przeciętny NVIDIA GeForce RTX 4070 Laptop GPU (158 - 440, n=67) | |
| MSI Titan GT77 12UHS | |
| Uniwill GM6PX7X RTX 4070 | |
| Schenker XMG Neo 16 E23 | |
| Asus ROG Strix G16 G614JZ | |
| Gigabyte Aorus GeForce RTX 4070 Ti Master | |
* ... im mniej tym lepiej
| Performance rating - Percent | |
| Gigabyte Aorus GeForce RTX 4070 Ti Master -1! | |
| Schenker XMG Neo 16 E23 | |
| Corsair One i300 | |
| Asus ROG Strix G16 G614JZ | |
| MSI Titan GT77 12UHS | |
| Uniwill GM6PX7X RTX 4070 | |
| Gigabyte AERO 16 OLED BSF | |
| MSI Katana 17 B13VFK | |
| Alienware x17 RTX 3080 P48E | |
| MSI Pulse GL76 12UGK | |
| Alienware m17 R3 P45E -2! | |
| Alienware m17 R5 (R9 6900HX, RX 6850M XT) | |
| Asus ROG Strix G15 G512LW | |
| Asus ROG Strix G17 G713QE-RB74 | |
| The Witcher 3 - 1920x1080 Ultra Graphics & Postprocessing (HBAO+) | |
| Gigabyte Aorus GeForce RTX 4070 Ti Master | |
| Schenker XMG Neo 16 E23 | |
| Corsair One i300 | |
| Asus ROG Strix G16 G614JZ | |
| MSI Titan GT77 12UHS | |
| Alienware m17 R5 (R9 6900HX, RX 6850M XT) | |
| Uniwill GM6PX7X RTX 4070 | |
| Gigabyte AERO 16 OLED BSF | |
| Alienware x17 RTX 3080 P48E | |
| MSI Katana 17 B13VFK | |
| Alienware m17 R3 P45E | |
| MSI Pulse GL76 12UGK | |
| Asus ROG Strix G15 G512LW | |
| Asus ROG Strix G17 G713QE-RB74 | |
| GTA V - 1920x1080 Highest AA:4xMSAA + FX AF:16x | |
| Gigabyte Aorus GeForce RTX 4070 Ti Master | |
| Corsair One i300 | |
| Schenker XMG Neo 16 E23 | |
| Asus ROG Strix G16 G614JZ | |
| MSI Titan GT77 12UHS | |
| Uniwill GM6PX7X RTX 4070 | |
| Gigabyte AERO 16 OLED BSF | |
| MSI Katana 17 B13VFK | |
| MSI Pulse GL76 12UGK | |
| Alienware x17 RTX 3080 P48E | |
| Alienware m17 R5 (R9 6900HX, RX 6850M XT) | |
| Asus ROG Strix G15 G512LW | |
| Asus ROG Strix G17 G713QE-RB74 | |
| Final Fantasy XV Benchmark - 1920x1080 High Quality | |
| Gigabyte Aorus GeForce RTX 4070 Ti Master | |
| Schenker XMG Neo 16 E23 | |
| Corsair One i300 | |
| Asus ROG Strix G16 G614JZ | |
| MSI Titan GT77 12UHS | |
| Uniwill GM6PX7X RTX 4070 | |
| Gigabyte AERO 16 OLED BSF | |
| Alienware m17 R5 (R9 6900HX, RX 6850M XT) | |
| Alienware x17 RTX 3080 P48E | |
| Alienware m17 R3 P45E | |
| MSI Katana 17 B13VFK | |
| MSI Pulse GL76 12UGK | |
| Asus ROG Strix G15 G512LW | |
| Asus ROG Strix G17 G713QE-RB74 | |
| Strange Brigade - 1920x1080 ultra AA:ultra AF:16 | |
| Schenker XMG Neo 16 E23 | |
| Corsair One i300 | |
| Asus ROG Strix G16 G614JZ | |
| Alienware m17 R5 (R9 6900HX, RX 6850M XT) | |
| MSI Titan GT77 12UHS | |
| Uniwill GM6PX7X RTX 4070 | |
| Gigabyte AERO 16 OLED BSF | |
| Alienware x17 RTX 3080 P48E | |
| MSI Katana 17 B13VFK | |
| MSI Pulse GL76 12UGK | |
| Asus ROG Strix G15 G512LW | |
| Asus ROG Strix G17 G713QE-RB74 | |
| Dota 2 Reborn - 1920x1080 ultra (3/3) best looking | |
| Gigabyte Aorus GeForce RTX 4070 Ti Master | |
| Corsair One i300 | |
| Schenker XMG Neo 16 E23 | |
| Asus ROG Strix G16 G614JZ | |
| MSI Titan GT77 12UHS | |
| Uniwill GM6PX7X RTX 4070 | |
| MSI Katana 17 B13VFK | |
| Gigabyte AERO 16 OLED BSF | |
| Alienware x17 RTX 3080 P48E | |
| MSI Pulse GL76 12UGK | |
| Alienware m17 R3 P45E | |
| Asus ROG Strix G15 G512LW | |
| Asus ROG Strix G17 G713QE-RB74 | |
| Alienware m17 R5 (R9 6900HX, RX 6850M XT) | |
| X-Plane 11.11 - 1920x1080 high (fps_test=3) | |
| Gigabyte Aorus GeForce RTX 4070 Ti Master | |
| Asus ROG Strix G16 G614JZ | |
| Corsair One i300 | |
| Schenker XMG Neo 16 E23 | |
| Uniwill GM6PX7X RTX 4070 | |
| MSI Titan GT77 12UHS | |
| MSI Katana 17 B13VFK | |
| Gigabyte AERO 16 OLED BSF | |
| MSI Pulse GL76 12UGK | |
| Alienware m17 R3 P45E | |
| Alienware x17 RTX 3080 P48E | |
| Asus ROG Strix G15 G512LW | |
| Asus ROG Strix G17 G713QE-RB74 | |
| Alienware m17 R5 (R9 6900HX, RX 6850M XT) | |
Witcher 3 FPS Chart
| low | med. | high | ultra | QHD | 4K | |
|---|---|---|---|---|---|---|
| GTA V (2015) | 187 | 186.9 | 183.1 | 124.8 | 93.1 | 93.6 |
| The Witcher 3 (2015) | 606.3 | 430.3 | 260.5 | 123.2 | 78.8 | |
| Dota 2 Reborn (2015) | 213 | 187.9 | 187.2 | 170.2 | 146.6 | |
| Final Fantasy XV Benchmark (2018) | 227 | 177.3 | 121.2 | 88.6 | 48.8 | |
| X-Plane 11.11 (2018) | 189.4 | 165.6 | 129.2 | 109.2 | ||
| Strange Brigade (2018) | 567 | 332 | 255 | 217 | 143.3 | 75.3 |
| Cyberpunk 2077 1.6 (2022) | 182.8 | 152.9 | 115.1 | 93.6 | 55.6 | 24.4 |
| F1 22 (2022) | 310 | 306 | 231 | 83.1 | 53.8 | 26.5 |
Emisje
Szum systemu
Szum wentylatora zależy od profilu zasilania i ustawienia procesora graficznego. Na przykład w trybie dyskretnego układu GPU hałas wentylatora w stanie spoczynku na pulpicie wynosiłby 29 dB(A), a w cichym tle 22,4 dB(A). Dla porównania, w trybie Optimus hałas wentylatora byłby znacznie cichszy i wynosiłby zaledwie 22,9 dB(A). Dlatego też warto pozostawić system w trybie Optimus przy niewymagających zadaniach, takich jak przeglądanie stron internetowych czy strumieniowanie wideo.
Uruchomienie strony Witcher 3 w trybie Performance z aktywnym dGPU hałas wentylatora wynosiłby nieco poniżej 49 dB(A), czyli ciszej niż w wielu innych 16-calowych laptopach do gier, w tym w grubszym Neo 16 z RTX 4090 lubLenovo Legion Pro 7 16. Mimo to szum wentylatora może osiągnąć jeszcze głośniejsze 55 dB(A), jeśli tytuł jest znacznie bardziej wymagający.
Hałas
| luz |
| 22.9 / 29 / 29 dB |
| obciążenie |
| 40.2 / 55 dB |
 | ||
30 dB cichy 40 dB(A) słyszalny 50 dB(A) irytujący |
||
min: | ||
| Uniwill GM6PX7X RTX 4070 GeForce RTX 4070 Laptop GPU, i7-13700HX, Samsung PM9A1 MZVL2512HCJQ | Schenker XMG Neo 16 E23 GeForce RTX 4090 Laptop GPU, i9-13900HX, Crucial P5 Plus 1TB CT1000P5PSSD8 | Asus ROG Strix G16 G614JZ GeForce RTX 4080 Laptop GPU, i9-13980HX, WD PC SN560 SDDPNQE-1T00 | Lenovo Legion Pro 7 16IRX8H GeForce RTX 4080 Laptop GPU, i9-13900HX, Samsung PM9A1 MZVL21T0HCLR | Gigabyte AERO 16 OLED BSF GeForce RTX 4070 Laptop GPU, i9-13900H, Gigabyte AG470S1TB-SI B10 | Razer Blade 16 Early 2023 GeForce RTX 4080 Laptop GPU, i9-13950HX, SSSTC CA6-8D1024 | |
|---|---|---|---|---|---|---|
| Noise | -25% | -6% | -10% | -6% | 6% | |
| wyłączone / środowisko * (dB) | 22.4 | 25 -12% | 25 -12% | 24 -7% | 23 -3% | 23 -3% |
| Idle Minimum * (dB) | 22.9 | 31 -35% | 26 -14% | 26 -14% | 23 -0% | 23 -0% |
| Idle Average * (dB) | 29 | 33 -14% | 28 3% | 28 3% | 23 21% | 23 21% |
| Idle Maximum * (dB) | 29 | 42 -45% | 30 -3% | 34 -17% | 33.64 -16% | 23.6 19% |
| Load Average * (dB) | 40.2 | 58 -44% | 48 -19% | 47 -17% | 51.49 -28% | 39 3% |
| Witcher 3 ultra * (dB) | 48.7 | 57 -17% | 49 -1% | 55 -13% | 55.27 -13% | 51.6 -6% |
| Load Maximum * (dB) | 55 | 59 -7% | 52 5% | 56 -2% | 55.24 -0% | 51.3 7% |
* ... im mniej tym lepiej
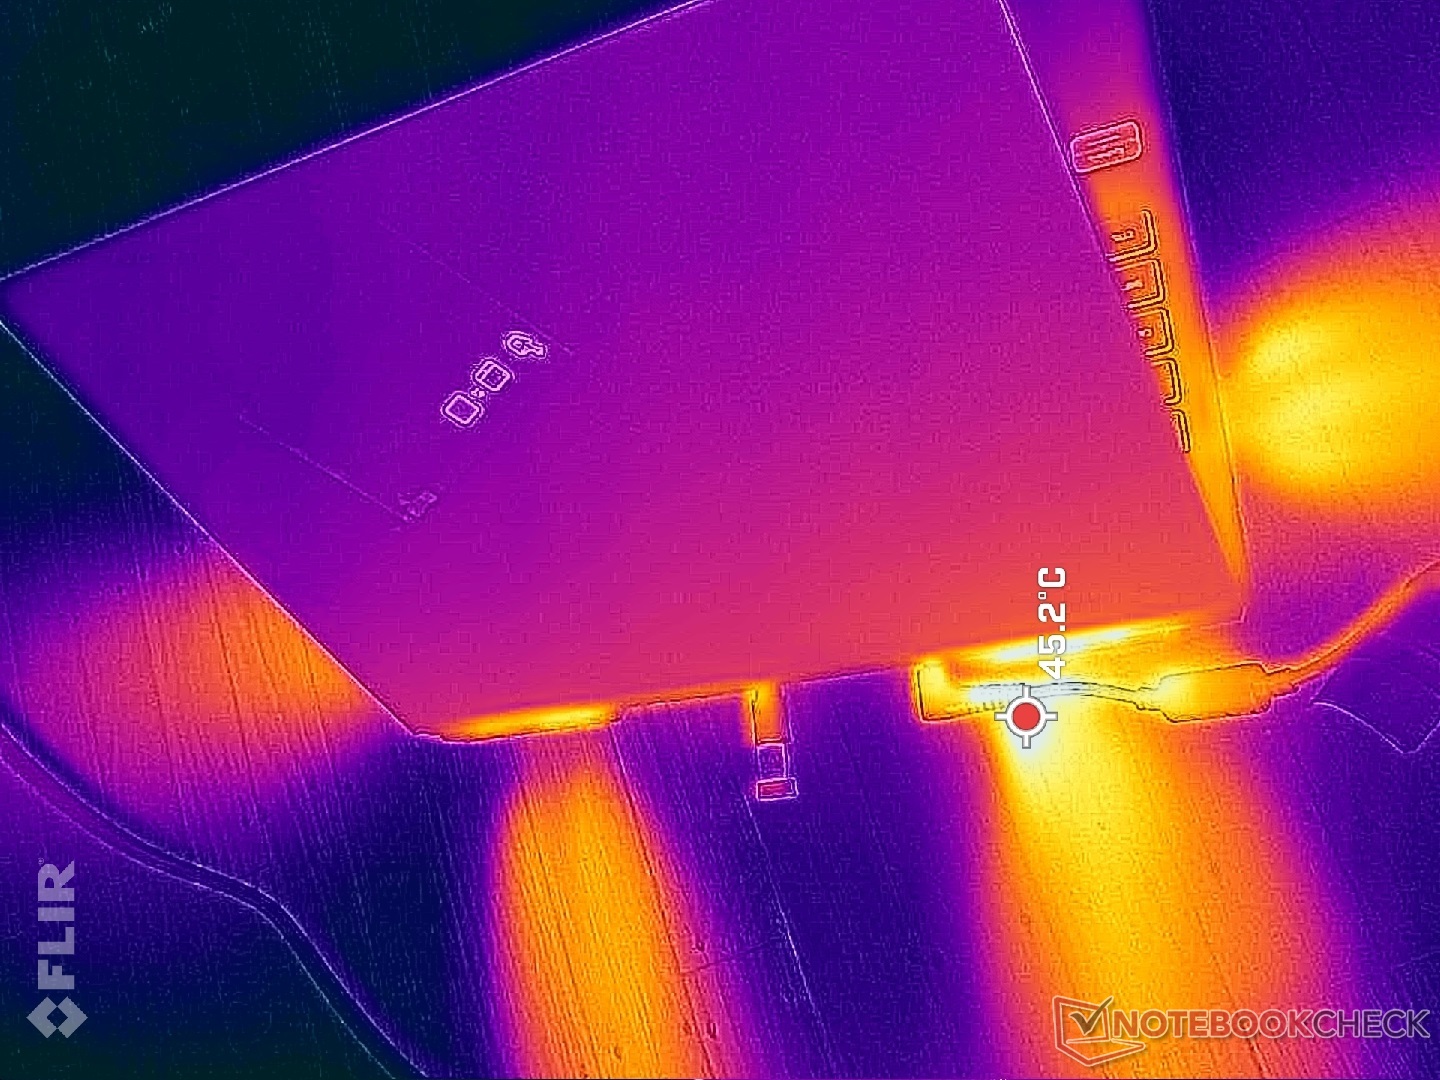
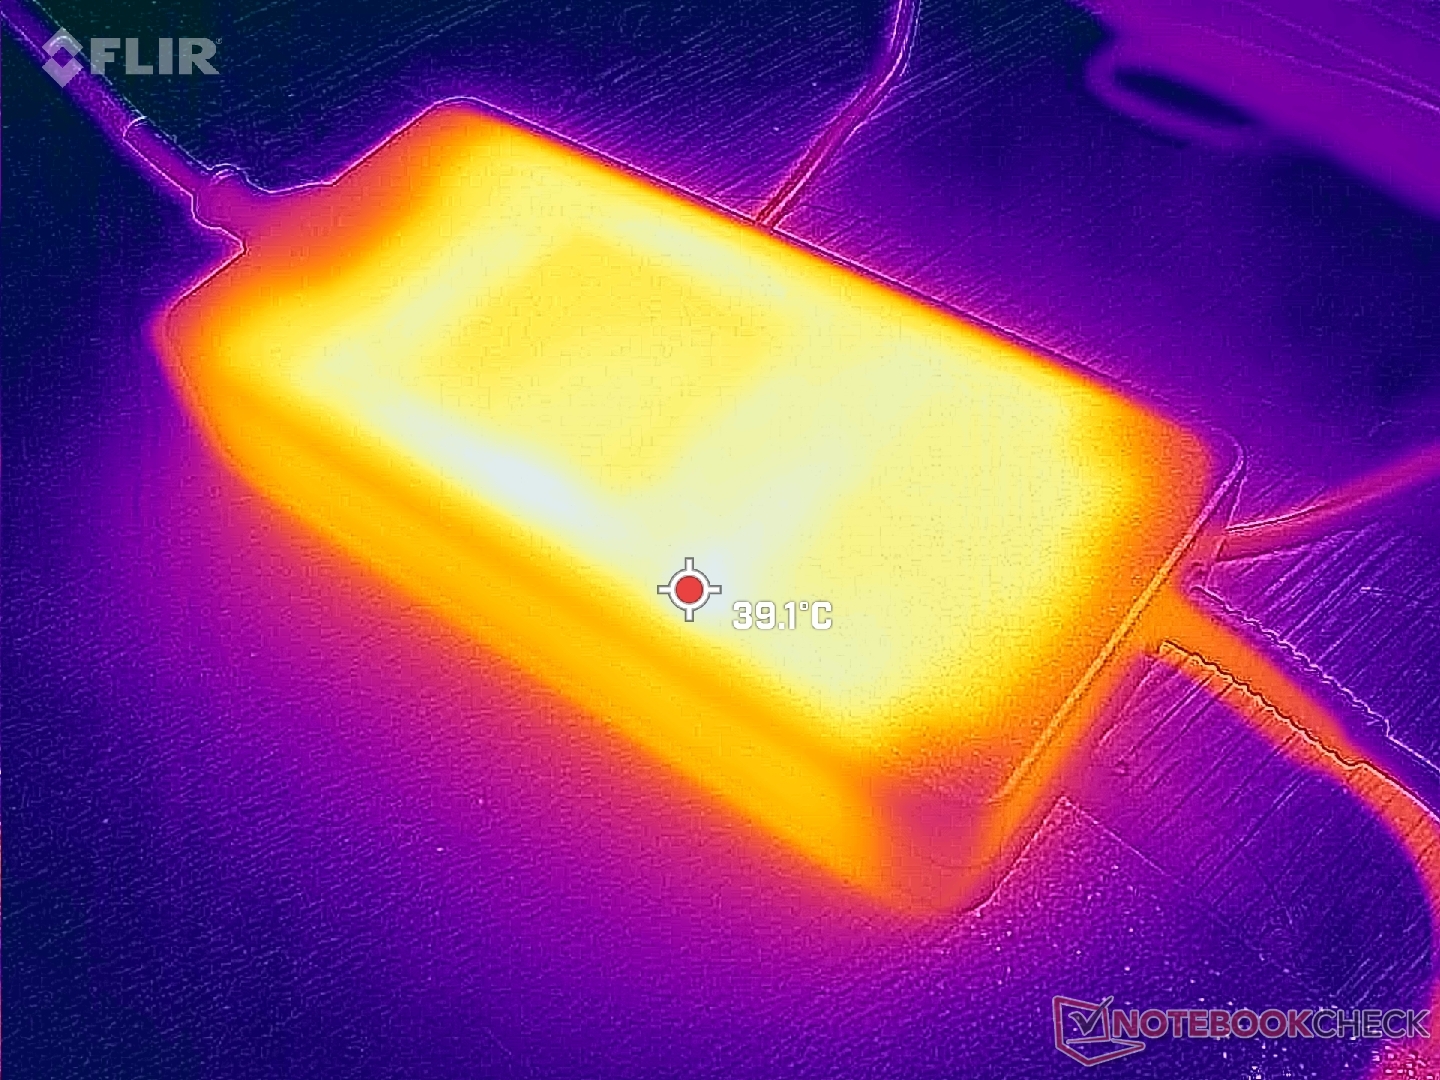
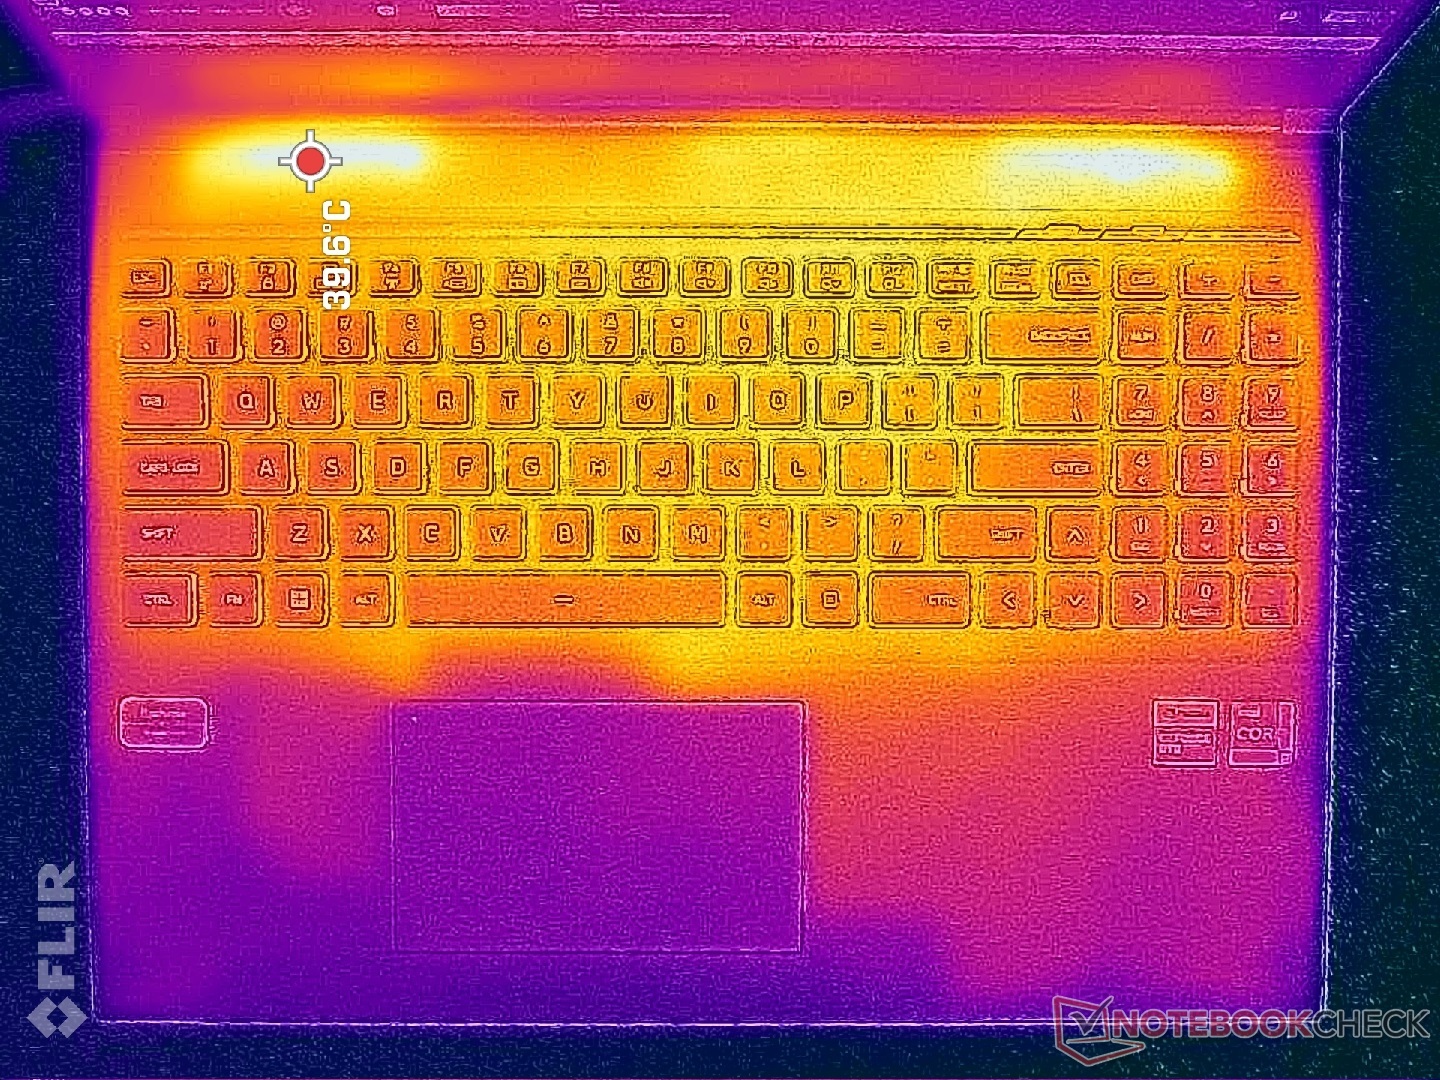
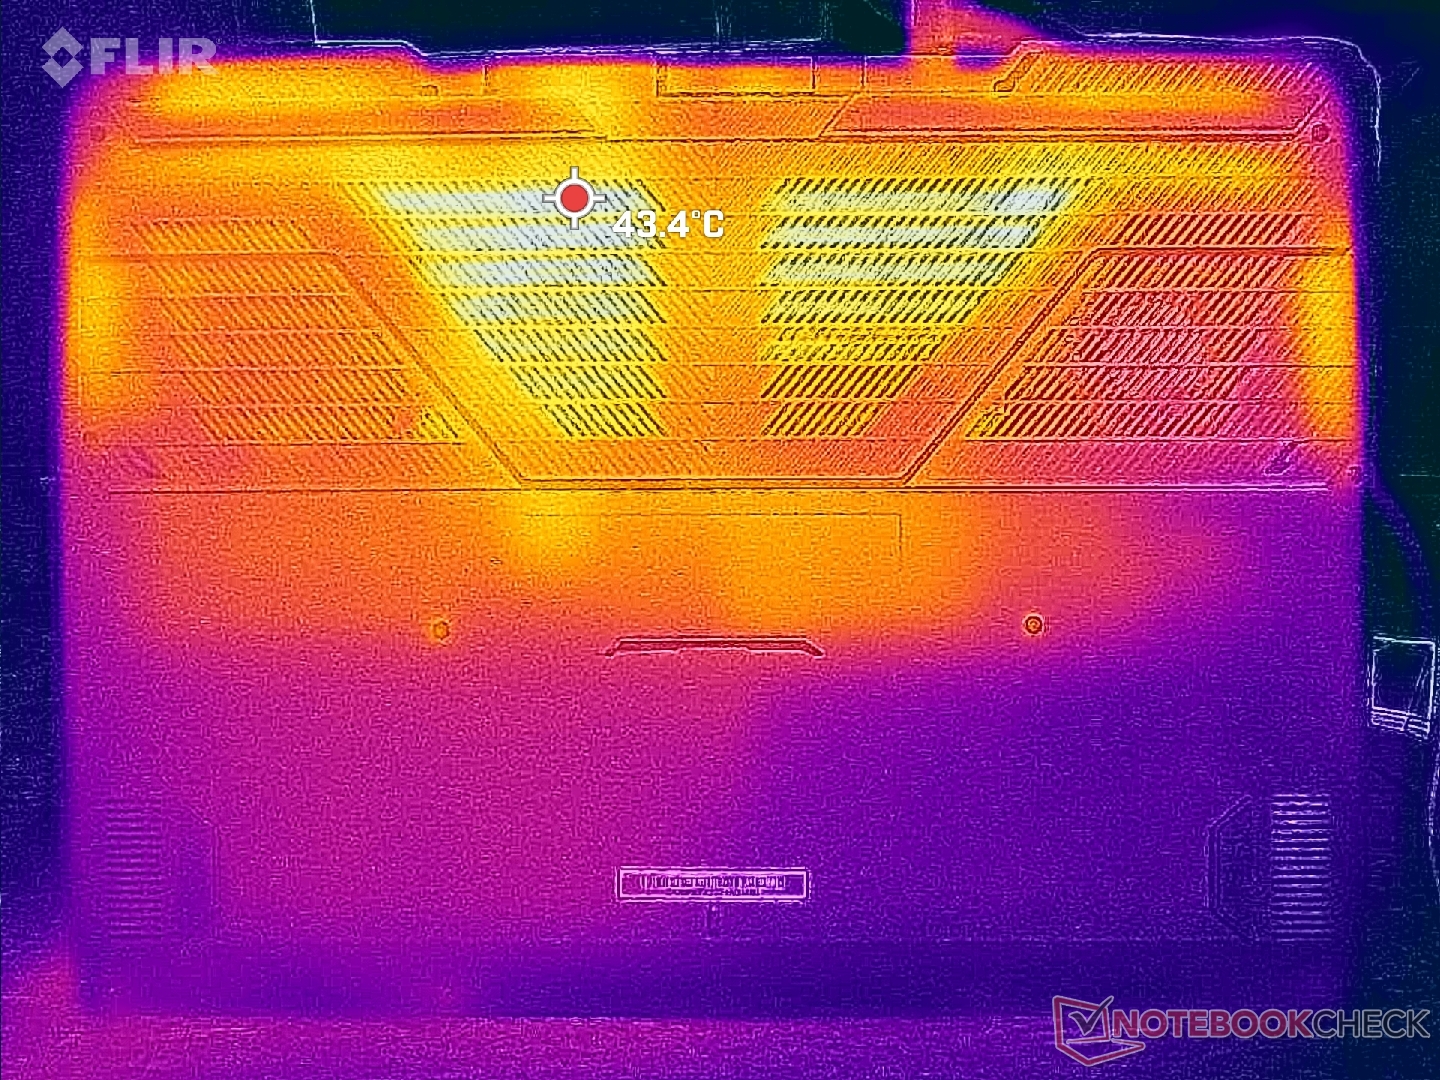
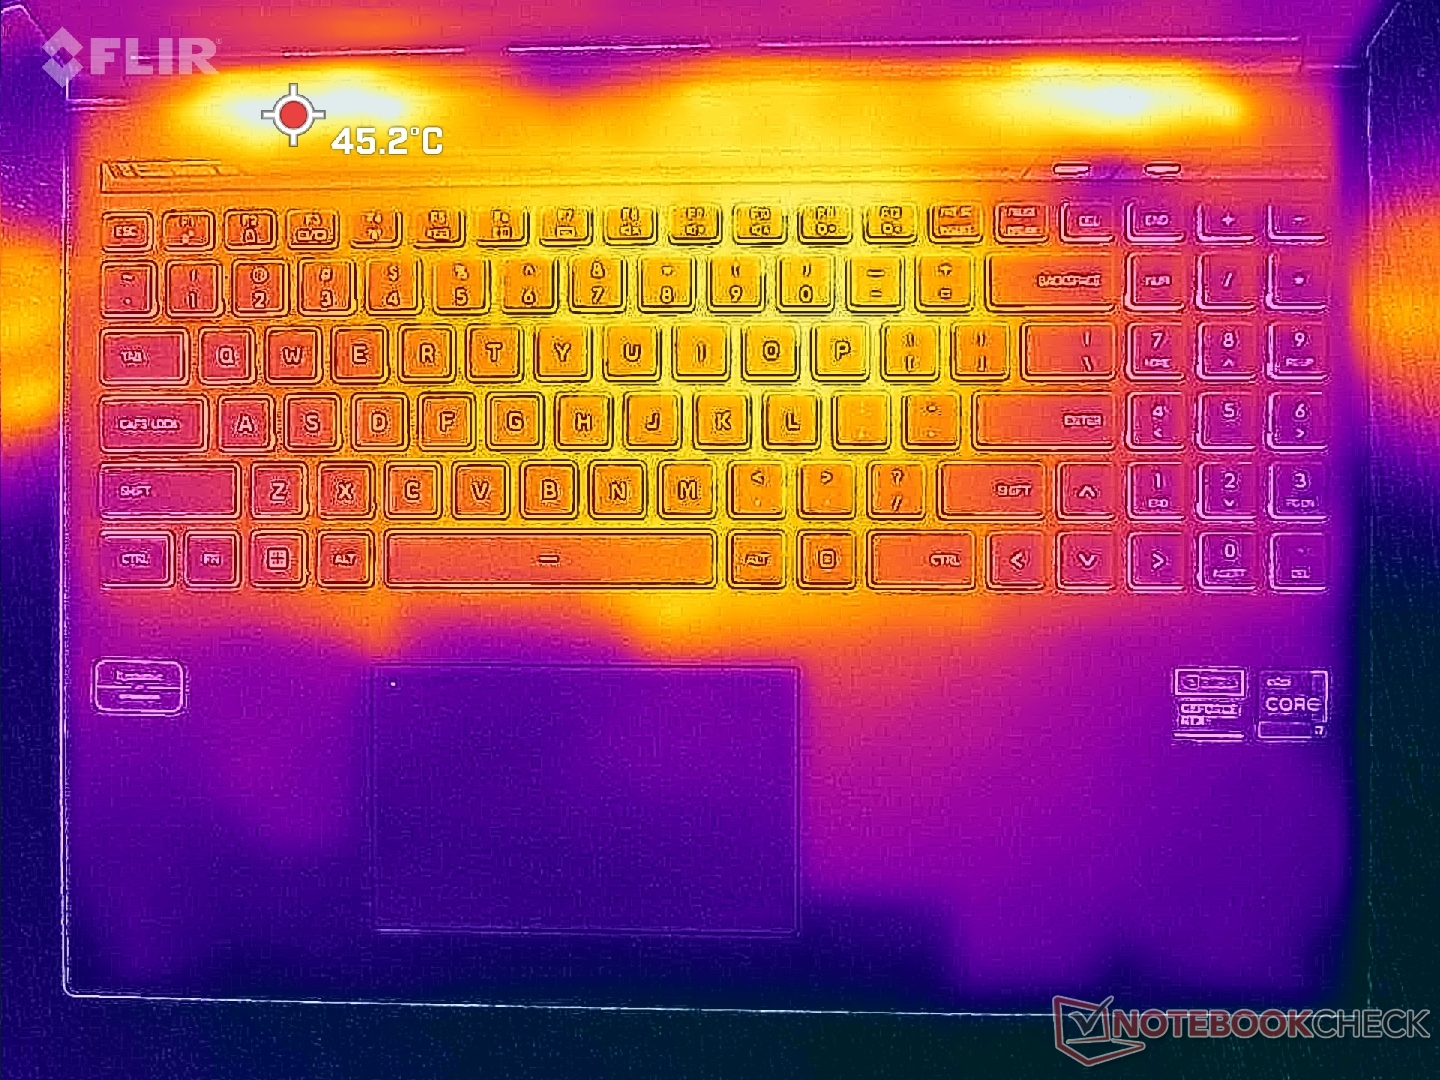
Temperatura
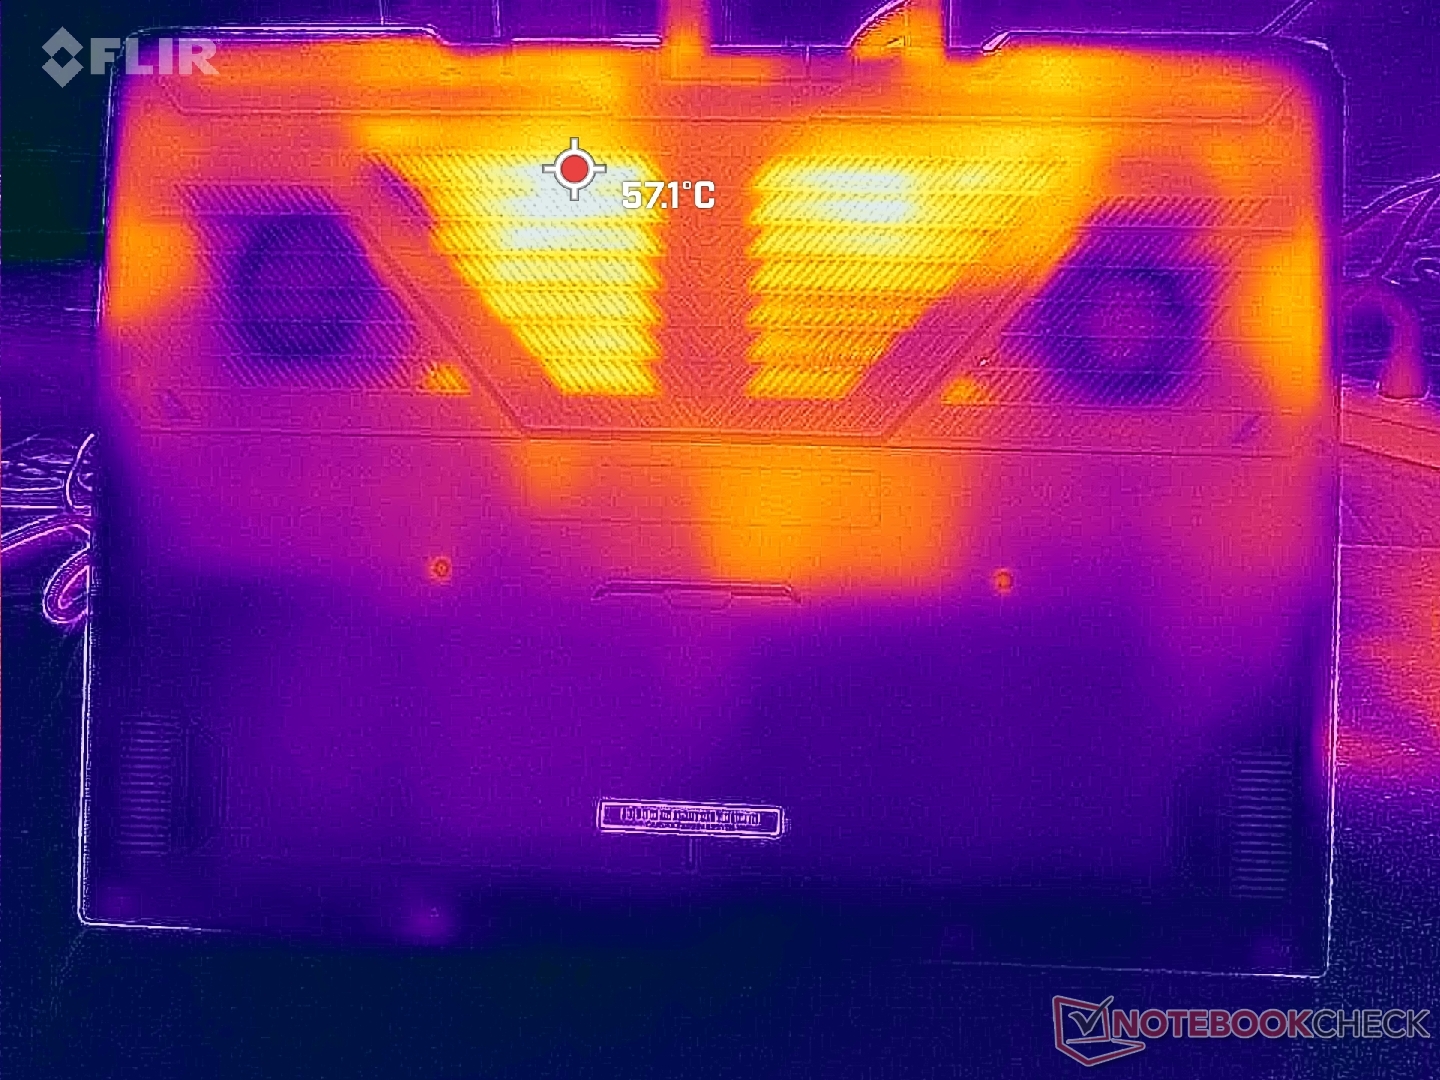
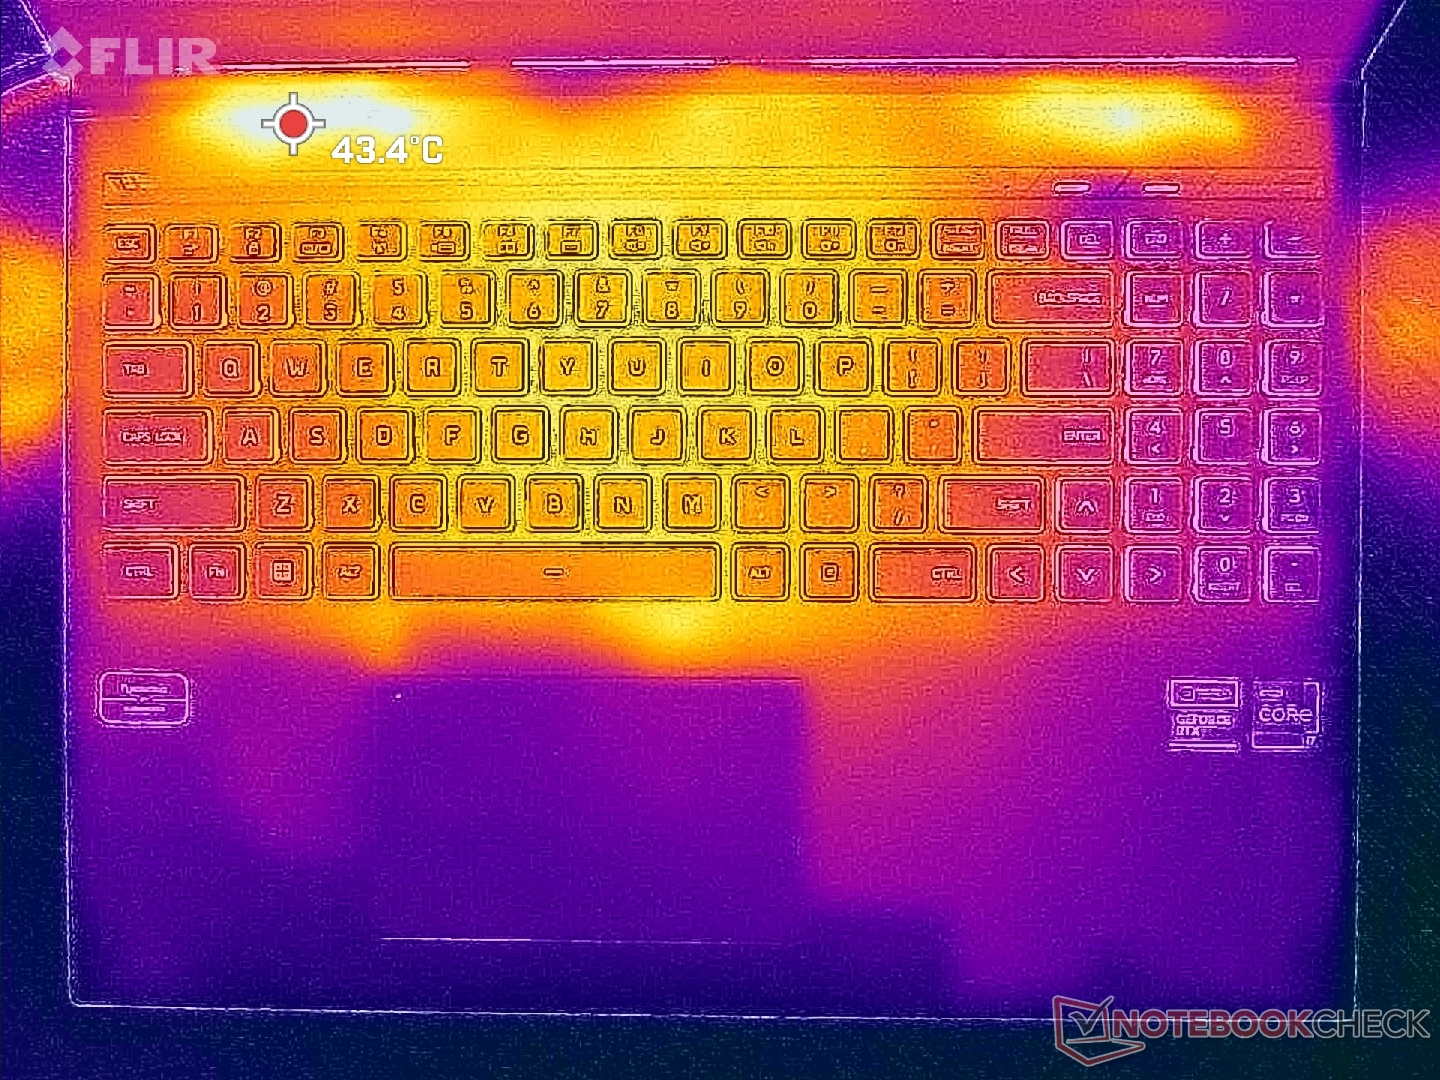
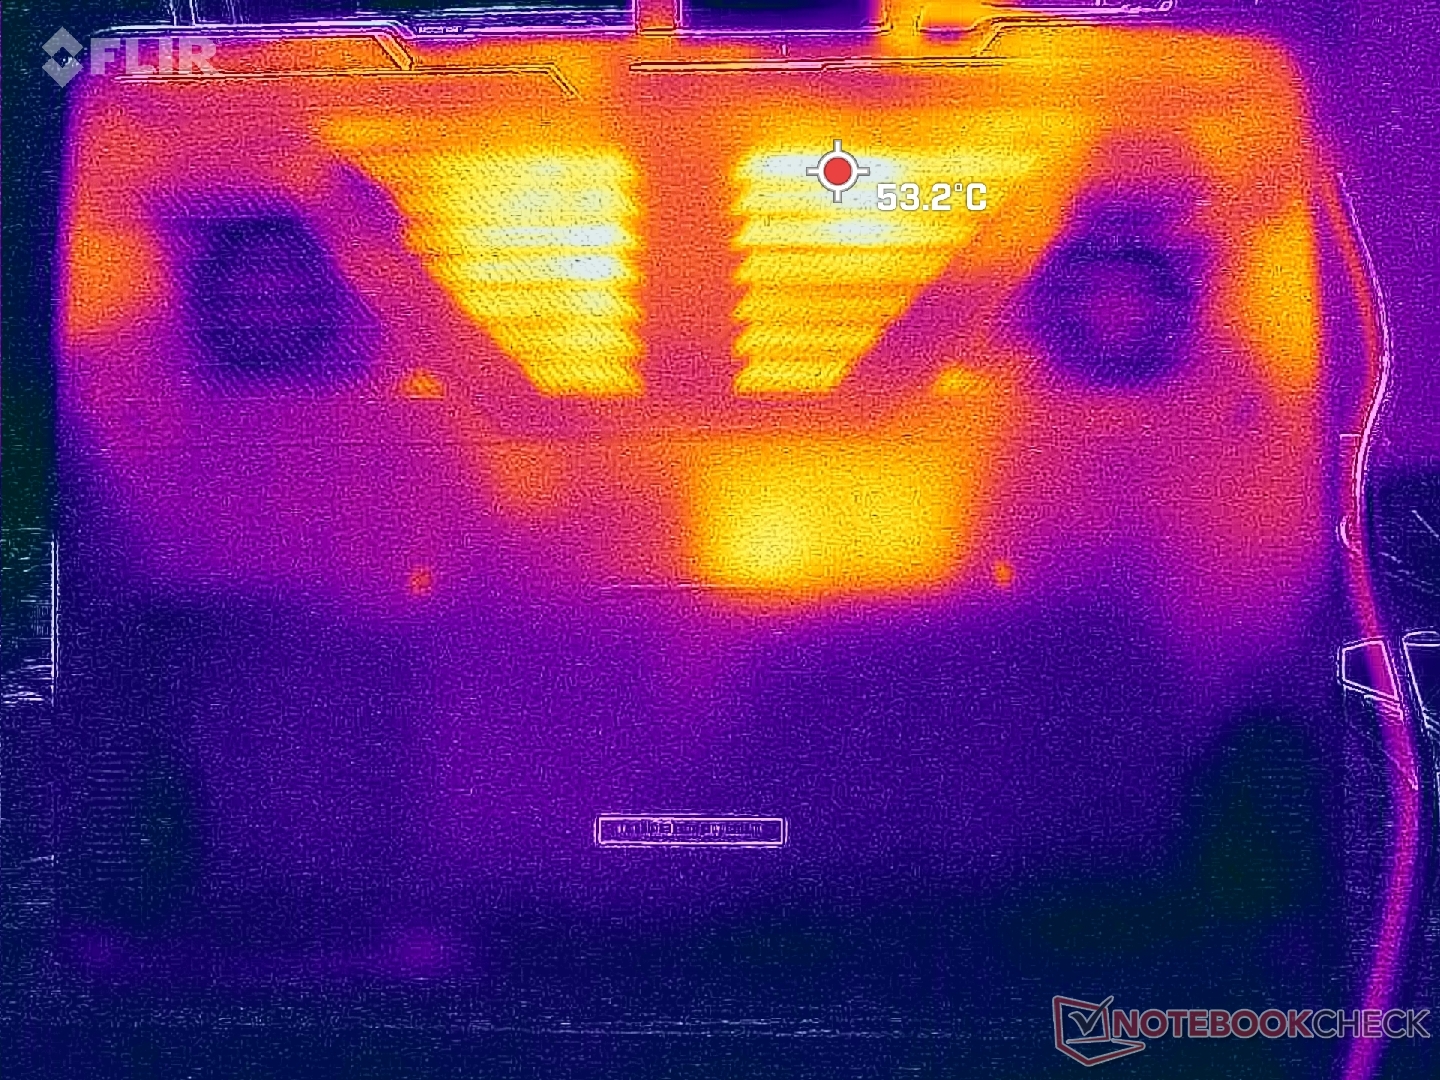
Temperatury powierzchni podczas grania są stosunkowo chłodne w porównaniu z innymi 16-calowymi laptopami do gier. Na stronie .Asus ROG Strix G16może osiągnąć ponad 54 stopnie C, podczas gdy gorące punkty na Uniwillu osiągają 40 stopni C na górze i 45 stopni C na dole. Przy podobnym obciążeniu w grach temperatury są o kilka stopni C niższe niż w Neo 16 napędzanym RTX 4090.
(+) Maksymalna temperatura w górnej części wynosi 38.2 °C / 101 F, w porównaniu do średniej 40.4 °C / 105 F , począwszy od 21.2 do 68.8 °C dla klasy Gaming.
(±) Dno nagrzewa się maksymalnie do 45 °C / 113 F, w porównaniu do średniej 43.2 °C / 110 F
(+) W stanie bezczynności średnia temperatura górnej części wynosi 28.9 °C / 84 F, w porównaniu ze średnią temperaturą urządzenia wynoszącą 33.9 °C / ### class_avg_f### F.
(±) Podczas gry w Wiedźmina 3 średnia temperatura górnej części wynosi 32.7 °C / 91 F, w porównaniu do średniej temperatury urządzenia wynoszącej 33.9 °C / ## #class_avg_f### F.
(+) Podpórki pod nadgarstki i touchpad są chłodniejsze niż temperatura skóry i maksymalnie 26.4 °C / 79.5 F i dlatego są chłodne w dotyku.
(+) Średnia temperatura obszaru podparcia dłoni w podobnych urządzeniach wynosiła 28.8 °C / 83.8 F (+2.4 °C / 4.3 F).
| Uniwill GM6PX7X RTX 4070 Intel Core i7-13700HX, NVIDIA GeForce RTX 4070 Laptop GPU | Schenker XMG Neo 16 E23 Intel Core i9-13900HX, NVIDIA GeForce RTX 4090 Laptop GPU | Asus ROG Strix G16 G614JZ Intel Core i9-13980HX, NVIDIA GeForce RTX 4080 Laptop GPU | Lenovo Legion Pro 7 16IRX8H Intel Core i9-13900HX, NVIDIA GeForce RTX 4080 Laptop GPU | Gigabyte AERO 16 OLED BSF Intel Core i9-13900H, NVIDIA GeForce RTX 4070 Laptop GPU | Razer Blade 16 Early 2023 Intel Core i9-13950HX, NVIDIA GeForce RTX 4080 Laptop GPU | |
|---|---|---|---|---|---|---|
| Heat | 2% | -8% | -9% | 16% | 9% | |
| Maximum Upper Side * (°C) | 38.2 | 50 -31% | 54 -41% | 48 -26% | 41 -7% | 40 -5% |
| Maximum Bottom * (°C) | 45 | 51 -13% | 55 -22% | 49 -9% | 47 -4% | 37.6 16% |
| Idle Upper Side * (°C) | 33.6 | 28 17% | 29 14% | 40 -19% | 23 32% | 32.4 4% |
| Idle Bottom * (°C) | 39.6 | 26 34% | 33 17% | 33 17% | 23 42% | 31.4 21% |
* ... im mniej tym lepiej
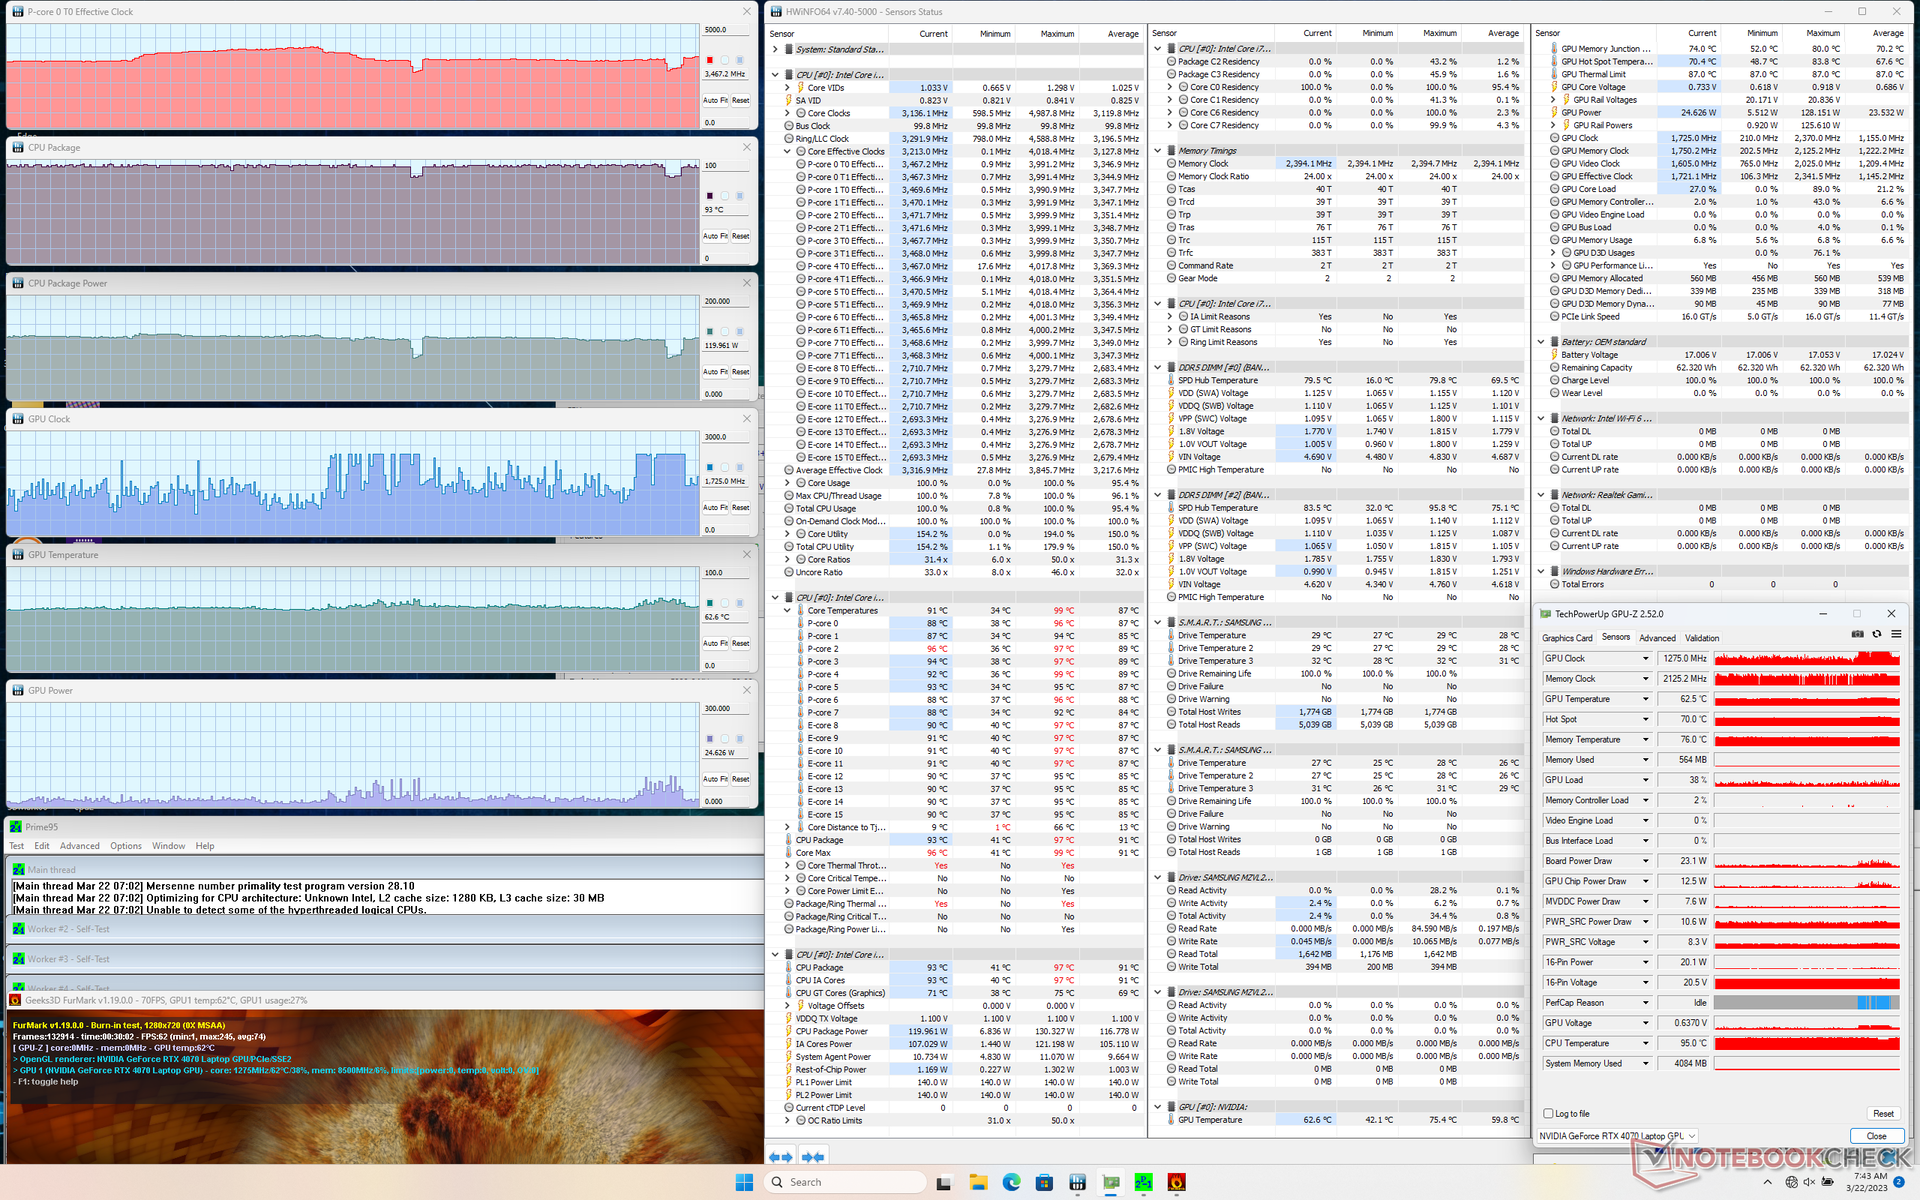
Stress Test
Pod obciążeniem pod Prime95 procesor zwiększał taktowanie do 4 GHz i 130 W tylko przez kilka pierwszych minut. Później częstotliwość taktowania i pobór mocy na płycie spadłyby do 3,4 GHz i 122 W. Temperatura rdzenia oscylowała wokół 90 C, co jest bardzo ciepłe nawet jak na laptop do gier. W tym samym teście na przykład w Razer Blade 16 temperatura CPU byłaby znacznie bliższa 80 C.
Temperatura CPU i GPU podczas pracy pod adresem Witcher 3 ustabilizowała się na poziomie odpowiednio 83 i 73 C, w porównaniu do 78 C na Blade 16. Pobór mocy przez kartę graficzną ustabilizowałby się na poziomie zaledwie 100 W, w porównaniu do 140 W, jakie pobiera TGP.
Praca na zasilaniu akumulatorowym ogranicza wydajność, czego można się było spodziewać. Test Fire Strike na akumulatorze przyniósłby wyniki w dziedzinie fizyki i grafiki na poziomie 9314 i 11777 punktów, w porównaniu do 36091 i 31354 punktów przy zasilaniu z sieci.
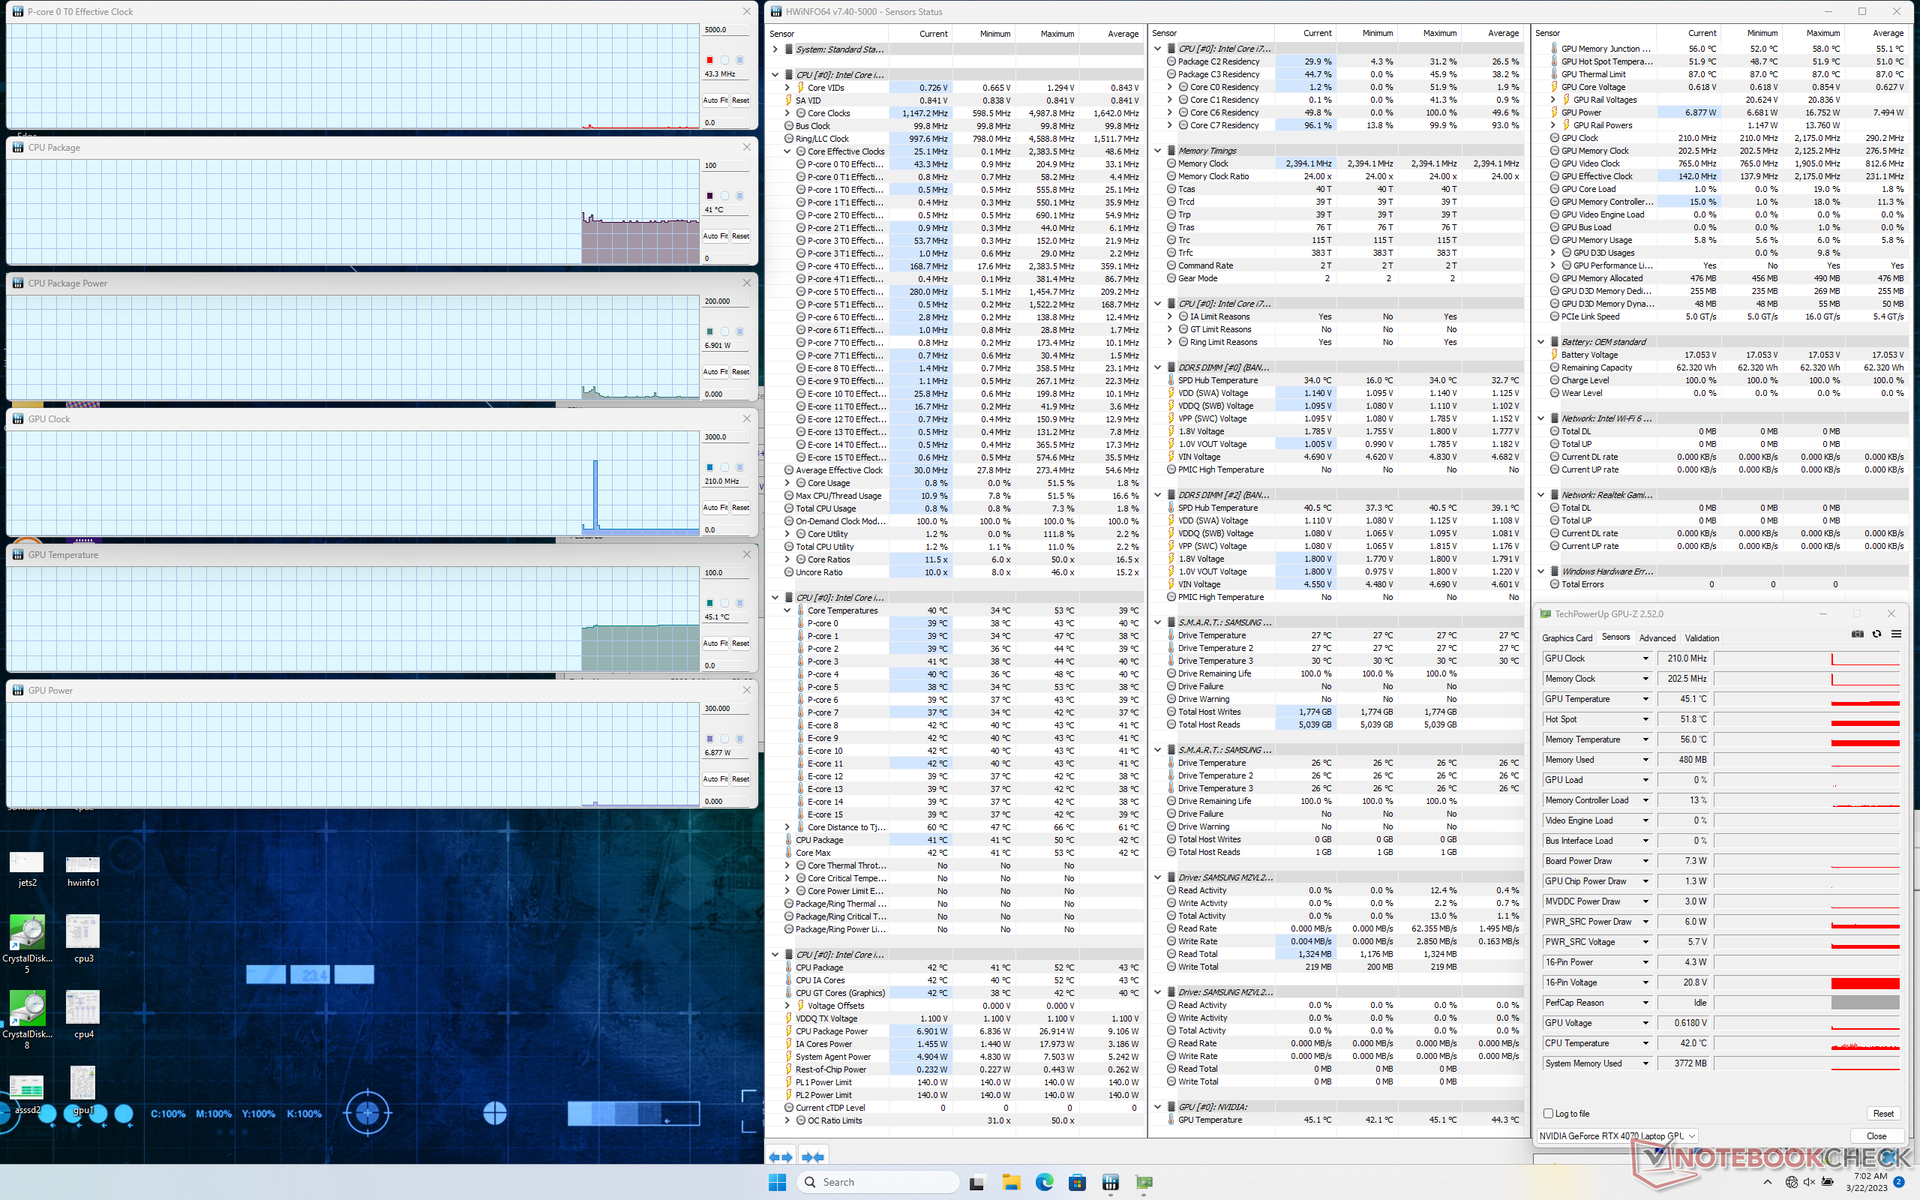
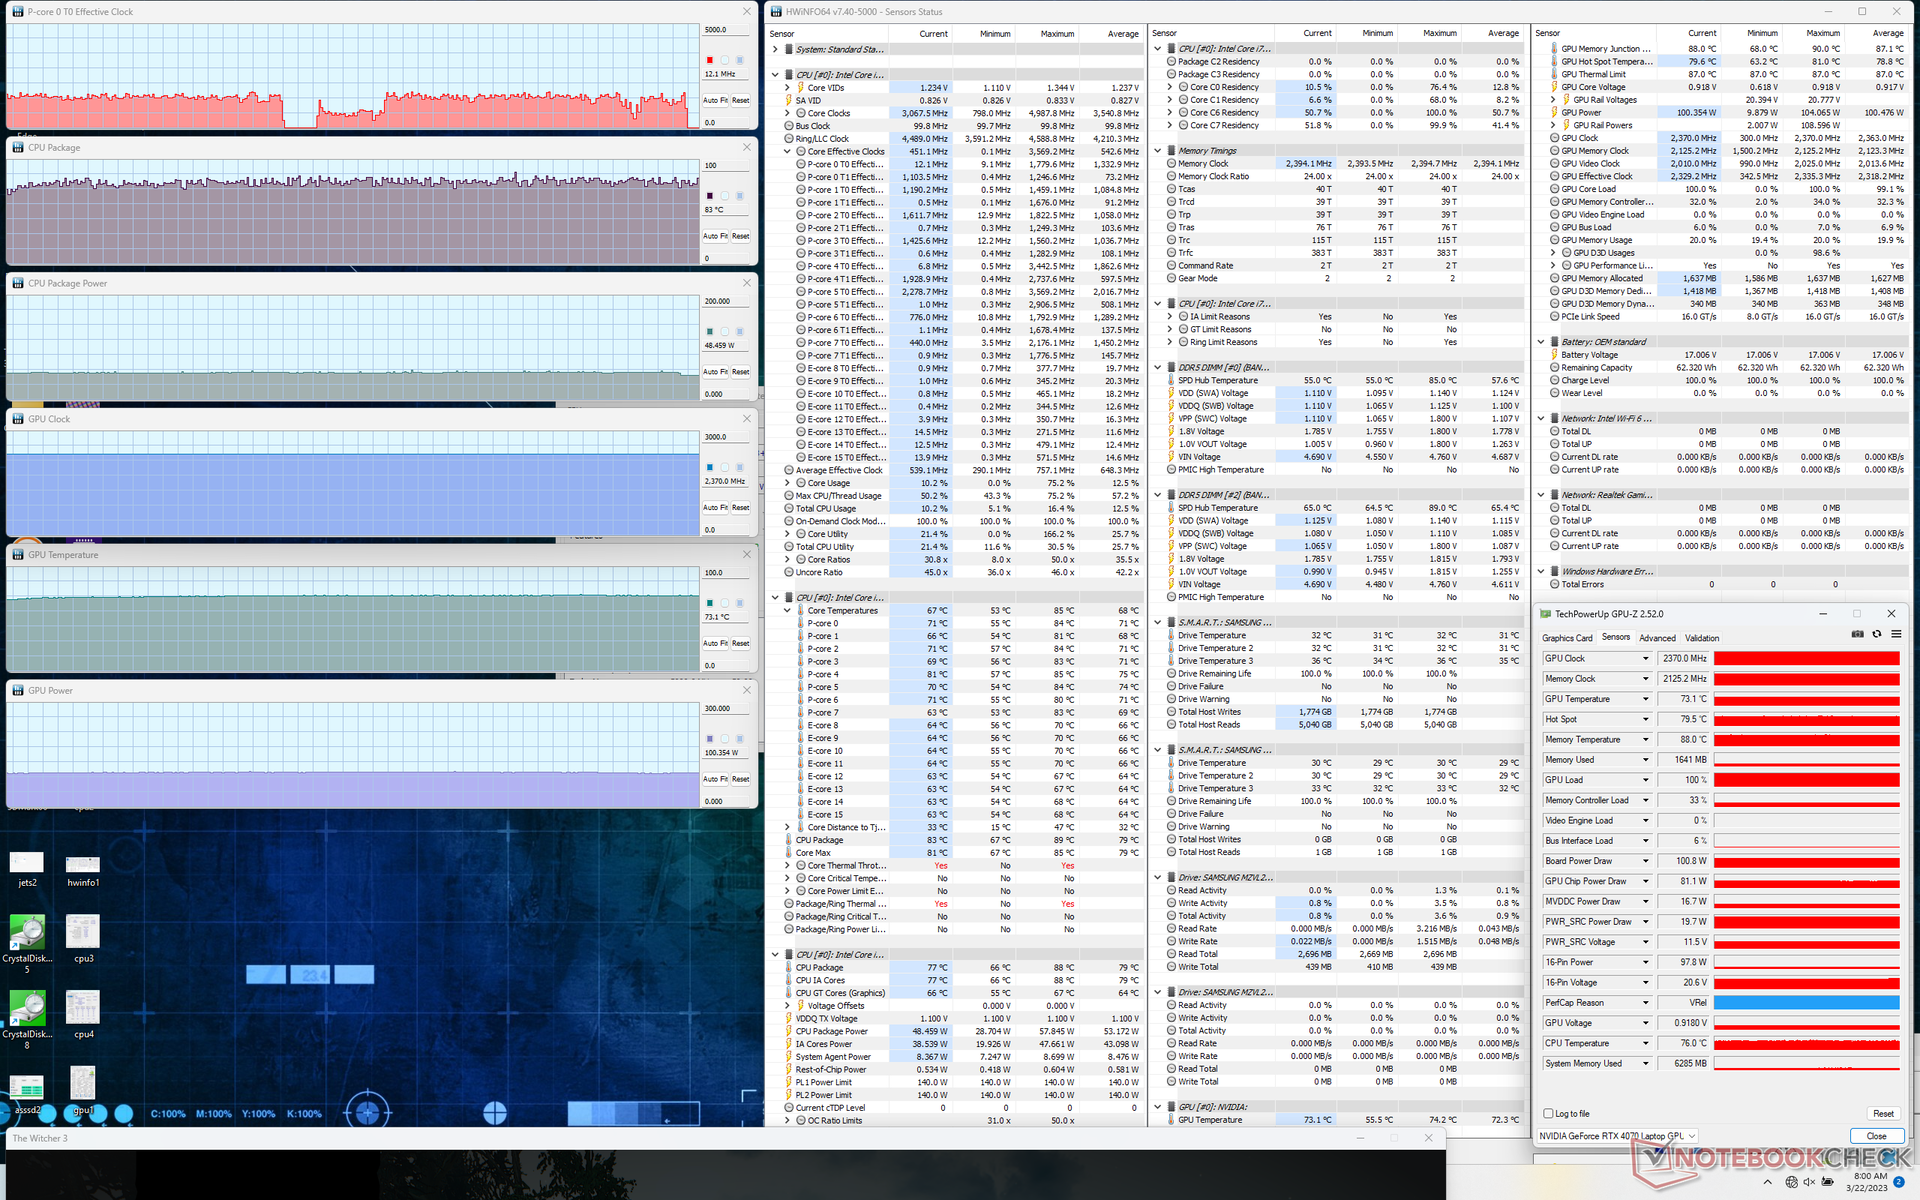
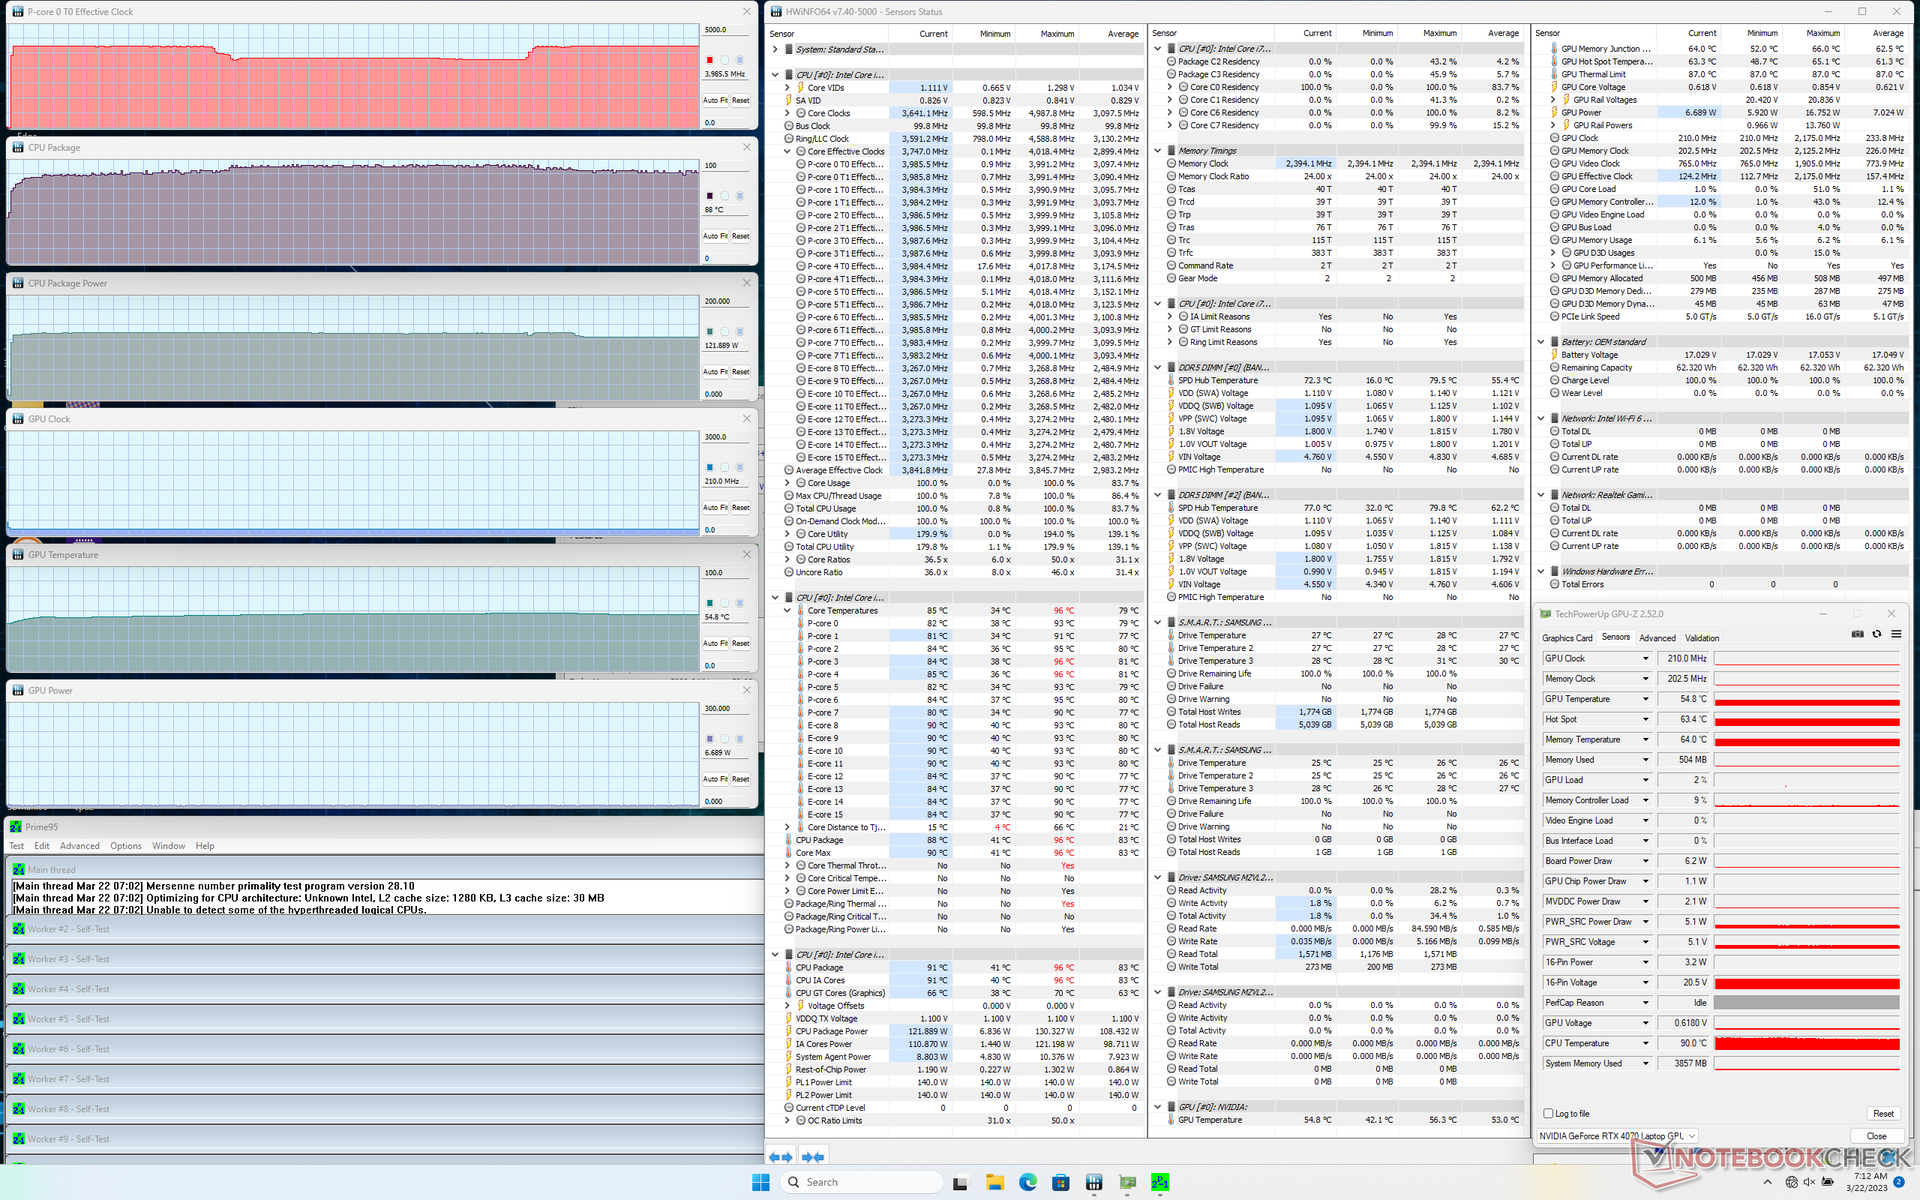
| ZegarCPU (GHz) | Zegar GPU (MHz) | Średnia temperatura CPU (°C) | Średnia temperatura GPU (°C) | |
| System w stanie bezczynności | -- | -- | 41 | 45 |
| Prime95 Stress | 3.4 - 4.0 | -- | 89 | 55 |
| Prime95 + FurMark Stress | ~3,5 | 1275 - 2350 | 93 | 63 |
| Witcher 3 Stress | ~1450 | 2370 | 83 | 73 |
Mówcy
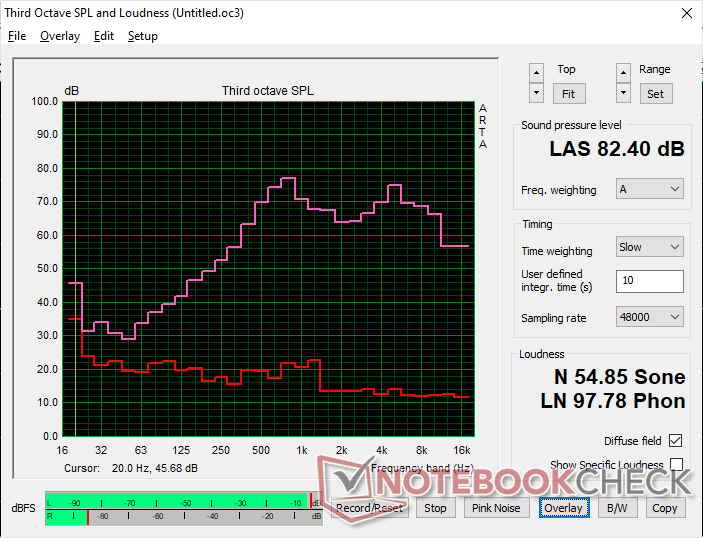
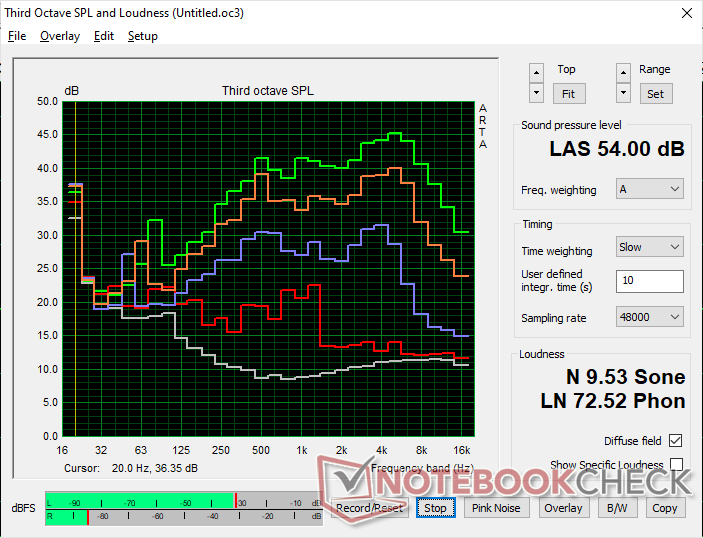
Uniwill GM6PX7X RTX 4070 analiza dźwięku
(+) | głośniki mogą odtwarzać stosunkowo głośno (82.4 dB)
Bas 100 - 315 Hz
(-) | prawie brak basu - średnio 18.6% niższa od mediany
(+) | bas jest liniowy (6.4% delta do poprzedniej częstotliwości)
Średnie 400 - 2000 Hz
(+) | zbalansowane środki średnie - tylko 4.4% od mediany
(±) | liniowość środka jest średnia (8.4% delta do poprzedniej częstotliwości)
Wysokie 2–16 kHz
(+) | zrównoważone maksima - tylko 2.9% od mediany
(+) | wzloty są liniowe (5.5% delta do poprzedniej częstotliwości)
Ogólnie 100 - 16.000 Hz
(±) | liniowość ogólnego dźwięku jest średnia (16.8% różnicy w stosunku do mediany)
W porównaniu do tej samej klasy
» 44% wszystkich testowanych urządzeń w tej klasie było lepszych, 11% podobnych, 46% gorszych
» Najlepszy miał deltę 6%, średnia wynosiła ###średnia###%, najgorsza wynosiła 132%
W porównaniu do wszystkich testowanych urządzeń
» 29% wszystkich testowanych urządzeń było lepszych, 8% podobnych, 63% gorszych
» Najlepszy miał deltę 4%, średnia wynosiła ###średnia###%, najgorsza wynosiła 134%
Apple MacBook Pro 16 2021 M1 Pro analiza dźwięku
(+) | głośniki mogą odtwarzać stosunkowo głośno (84.7 dB)
Bas 100 - 315 Hz
(+) | dobry bas - tylko 3.8% od mediany
(+) | bas jest liniowy (5.2% delta do poprzedniej częstotliwości)
Średnie 400 - 2000 Hz
(+) | zbalansowane środki średnie - tylko 1.3% od mediany
(+) | średnie są liniowe (2.1% delta do poprzedniej częstotliwości)
Wysokie 2–16 kHz
(+) | zrównoważone maksima - tylko 1.9% od mediany
(+) | wzloty są liniowe (2.7% delta do poprzedniej częstotliwości)
Ogólnie 100 - 16.000 Hz
(+) | ogólny dźwięk jest liniowy (4.6% różnicy w stosunku do mediany)
W porównaniu do tej samej klasy
» 0% wszystkich testowanych urządzeń w tej klasie było lepszych, 0% podobnych, 100% gorszych
» Najlepszy miał deltę 5%, średnia wynosiła ###średnia###%, najgorsza wynosiła 45%
W porównaniu do wszystkich testowanych urządzeń
» 0% wszystkich testowanych urządzeń było lepszych, 0% podobnych, 100% gorszych
» Najlepszy miał deltę 4%, średnia wynosiła ###średnia###%, najgorsza wynosiła 134%
Zarządzanie energią
Pobór mocy
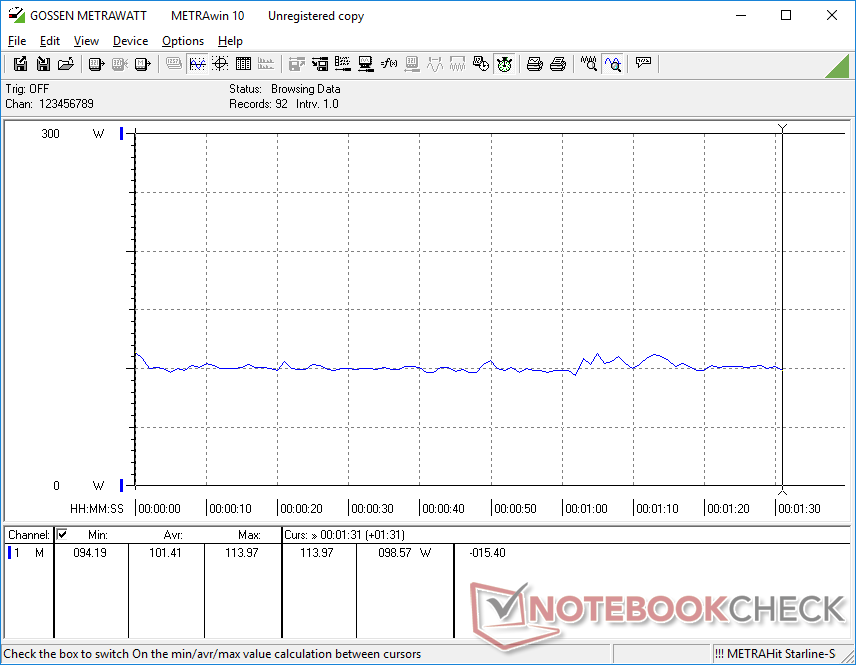
Zużycie energii powinno być mniejsze niż w przypadku szybszego modelu Neo 16 wyposażonego w RTX 4090 we wszystkich przypadkach, ale o dziwo tak nie jest. Praca na biegu jałowym na pulpicie wymagałaby od 12 do 32 W w porównaniu do zaledwie 8 i 28 W na Neo 16 z RTX 4090. Sprawdziliśmy dwukrotnie nasze profile zasilania i ustawienia jasności, ale wyniki nie uległy poprawie.
Uruchamianie większych obciążeń, takich jak gry, pobiera od 24 do 37 procent mniej energii niż Neo 16. Mobilny RTX 4070 jest o 35 do 45 procent wolniejszy od mobilnego RTX 4090, więc niższy pobór mocy nie jest niespodziewany.
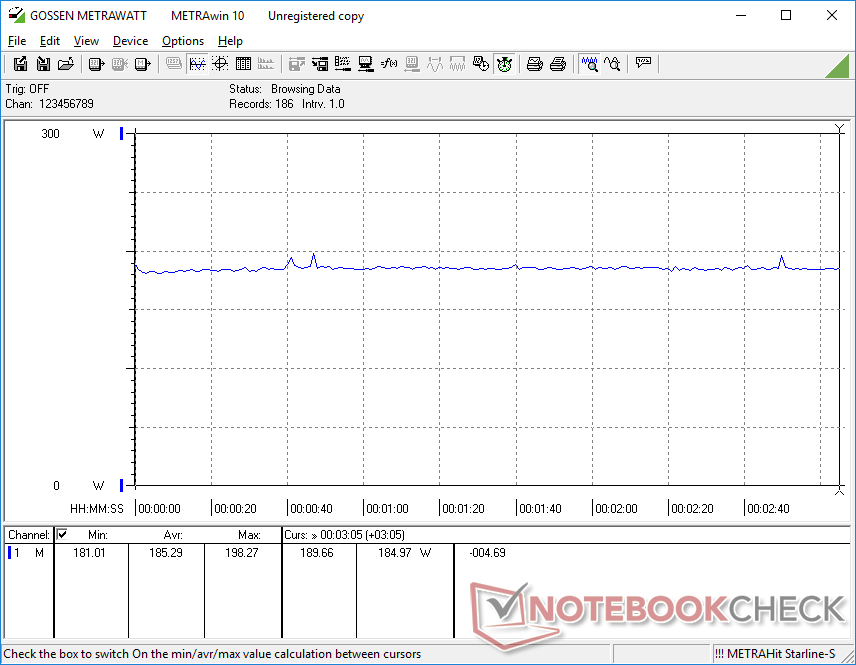
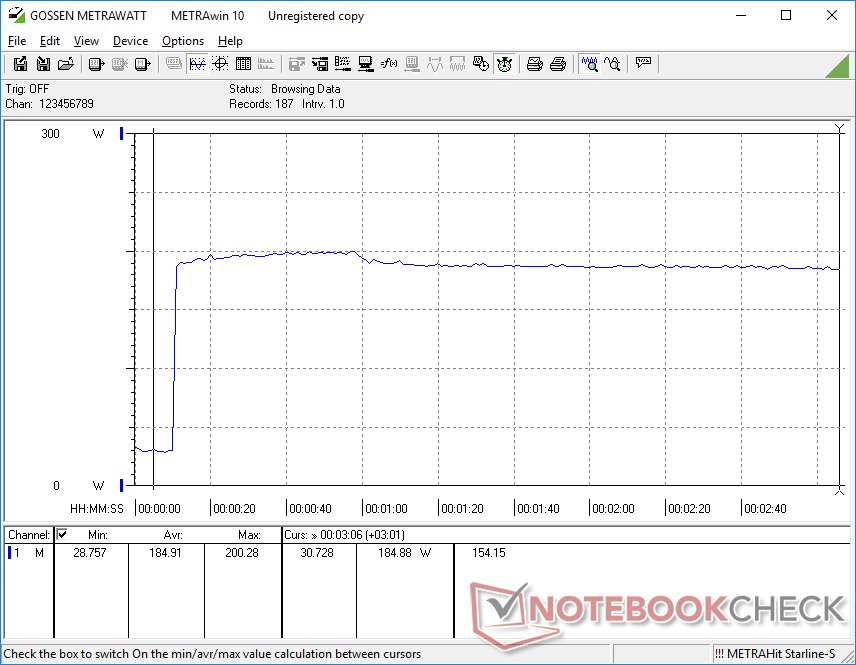
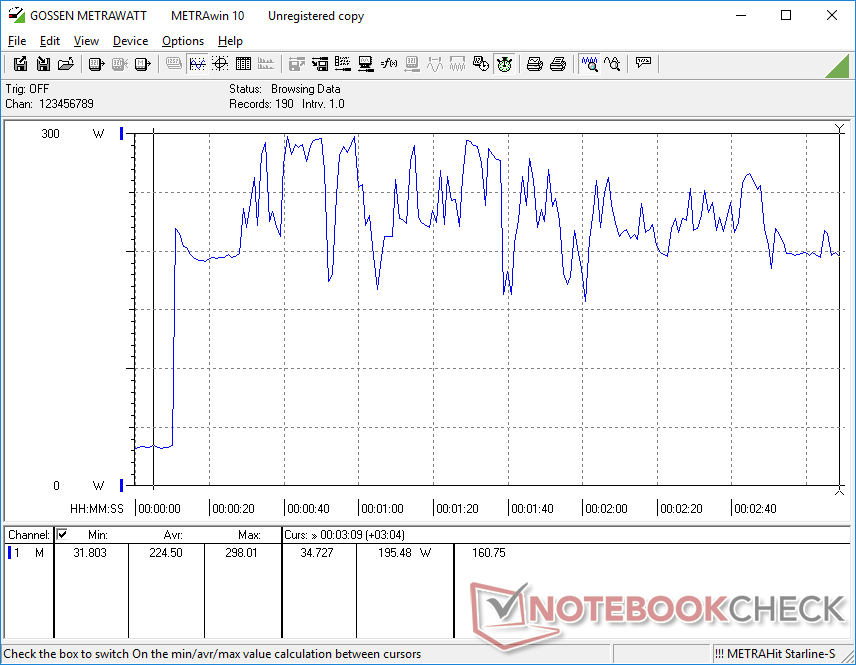
Jednoczesne uruchomienie programów Prime95 i FurMark spowodowało silną zmianę poboru mocy od 167 W do 298 W, mimo że duży (~18 x 8,4 x 3,5 cm) zasilacz sieciowy ma moc 280 W. Pobór mocy był znacznie bardziej stabilny podczas powtarzania tego testu na Neo 16 wyposażonym w RTX 4090, co pokazuje poniższy wykres porównawczy.
| wyłączony / stan wstrzymania | |
| luz | |
| obciążenie |
|
Legenda:
min: | |
| Uniwill GM6PX7X RTX 4070 i7-13700HX, GeForce RTX 4070 Laptop GPU, Samsung PM9A1 MZVL2512HCJQ, IPS, 2560x1600, 16" | Schenker XMG Neo 16 E23 i9-13900HX, GeForce RTX 4090 Laptop GPU, Crucial P5 Plus 1TB CT1000P5PSSD8, IPS, 2560x1600, 16" | Asus ROG Strix G16 G614JZ i9-13980HX, GeForce RTX 4080 Laptop GPU, WD PC SN560 SDDPNQE-1T00, IPS, 2560x1600, 16" | Lenovo Legion Pro 7 16IRX8H i9-13900HX, GeForce RTX 4080 Laptop GPU, Samsung PM9A1 MZVL21T0HCLR, IPS, 2560x1600, 16" | Gigabyte AERO 16 OLED BSF i9-13900H, GeForce RTX 4070 Laptop GPU, Gigabyte AG470S1TB-SI B10, OLED, 3840x2400, 16" | Razer Blade 16 Early 2023 i9-13950HX, GeForce RTX 4080 Laptop GPU, SSSTC CA6-8D1024, IPS, 2560x1600, 16" | |
|---|---|---|---|---|---|---|
| Power Consumption | -13% | -5% | -26% | 19% | -25% | |
| Idle Minimum * (Watt) | 12.6 | 8 37% | 10 21% | 18 -43% | 11.8 6% | 15.2 -21% |
| Idle Average * (Watt) | 17.7 | 18 -2% | 16 10% | 24 -36% | 16.1 9% | 22.8 -29% |
| Idle Maximum * (Watt) | 31.8 | 28 12% | 27 15% | 32 -1% | 17 47% | 49.8 -57% |
| Load Average * (Watt) | 101.4 | 133 -31% | 129 -27% | 130 -28% | 100.6 1% | 121.2 -20% |
| Witcher 3 ultra * (Watt) | 185.3 | 294 -59% | 247 -33% | 260 -40% | 158 15% | 242 -31% |
| Load Maximum * (Watt) | 298 | 399 -34% | 342 -15% | 320 -7% | 192 36% | 273.7 8% |
* ... im mniej tym lepiej
Power Consumption Witcher 3 / Stresstest
Power Consumption external Monitor
Czas pracy na baterii
Pojemność akumulatora jest o jedną trzecią mniejsza, niż w zasilanym RTX 4090 modelu Neo 16, co przekłada się na krótszy czas pracy na baterii WLAN - około 4 godzin. Większość innych 16-calowych laptopów do gier ma w porównaniu większe pojemności akumulatorów i czasy pracy.
Ładowanie od pustej do pełnej pojemności trwa nieco poniżej dwóch godzin. Żadna z naszych ładowarek USB-C nie jest w stanie naładować tego laptopa.
| Uniwill GM6PX7X RTX 4070 i7-13700HX, GeForce RTX 4070 Laptop GPU, 62 Wh | Schenker XMG Neo 16 E23 i9-13900HX, GeForce RTX 4090 Laptop GPU, 99 Wh | Asus ROG Strix G16 G614JZ i9-13980HX, GeForce RTX 4080 Laptop GPU, 90 Wh | Lenovo Legion Pro 7 16IRX8H i9-13900HX, GeForce RTX 4080 Laptop GPU, 99.9 Wh | Gigabyte AERO 16 OLED BSF i9-13900H, GeForce RTX 4070 Laptop GPU, 88 Wh | Razer Blade 16 Early 2023 i9-13950HX, GeForce RTX 4080 Laptop GPU, 95.2 Wh | |
|---|---|---|---|---|---|---|
| Czasy pracy | 68% | 142% | 27% | 88% | 53% | |
| WiFi v1.3 (h) | 4 | 6.7 68% | 9.7 142% | 5.1 27% | 7.5 88% | 6.1 53% |
| H.264 (h) | 5.8 | 7.4 | ||||
| Witcher 3 ultra (h) | 1.4 | |||||
| Load (h) | 1.1 | 2.1 | 2.1 | 1.4 | ||
| Reader / Idle (h) | 6.4 | 8.9 |
Za
Przeciw
Werdykt
Uniwill GM6PX7X to solidny 16-calowy laptop do gier, nawet jeśli nie wyróżnia się w żadnej konkretnej kategorii. Układ jest lekki, ale np Gigabyte Aero 16 jest jeszcze lżejszy. Pokrycie kolorów zbliża się do 100 procent sRGB, ale jeszcze głębsze kolory P3 są dostępne naAsus ROG Strix G16 lubRazer Blade 16. Wydajność graficzna jest świetna jak na ten rozmiar, ale brak obsługi Advanced Optimus lub G-Sync na monitorze wewnętrznym jest cierniem dla doświadczenia. Podświetlenie RGB oparte na strefach jest obsługiwane, ale oświetlenie RGB dla każdego klawisza jest związane z opcjonalną aktualizacją mechaniczną Cherry. Tymczasem konfiguracja z szybszym GeForce RTX 4080 lub 4090 wiąże się z grubszą i cięższą obudową, co neguje jedną z kluczowych zalet konstrukcji Uniwill GM6PX7X. Nie ma żadnych zauważalnych słabych punktów ani wyróżniających się cech Uniwill, co daje poczucie spójności, które niektórzy gracze mogą docenić.
Uniwill GM6PX7X jest laptopem do gier, który jest ponadprzeciętny w większości kategorii, ale brakuje mu oomph lub przyciągającej uwagę funkcji, aby pomóc wyróżnić się z tłumu.
Nadal możemy pochwalić ten model za pełnowymiarowy numpad i klawisze strzałek oraz rzadką obsługę opcjonalnej zewnętrznej chłodnicy wody. Te same klawisze klawiatury są zwykle mniejsze i bardziej ciasne w innych laptopach do gier. Entuzjaści mogą chcieć rozważyć wyższe klasy RTX 4080 lub 4090 SKU, aby lepiej wykorzystać opcjonalne chłodzenie wodne.
Cena i dostępność
Uniwill GM6PX7X jest obecnie wysyłany pod kilkoma różnymi nazwami i cenami w zależności od regionu. Schenker na przykład oferuje podwozie pod marką XMG Neo 16.
Uniwill GM6PX7X RTX 4070
- 28/03/2023 v7 (old)
Allen Ngo
Przezroczystość
Wyboru urządzeń do recenzji dokonuje nasza redakcja. Próbka testowa została udostępniona autorowi jako pożyczka od producenta lub sprzedawcy detalicznego na potrzeby tej recenzji. Pożyczkodawca nie miał wpływu na tę recenzję, producent nie otrzymał też kopii tej recenzji przed publikacją. Nie było obowiązku publikowania tej recenzji. Jako niezależna firma medialna, Notebookcheck nie podlega władzy producentów, sprzedawców detalicznych ani wydawców.
Tak testuje Notebookcheck
Każdego roku Notebookcheck niezależnie sprawdza setki laptopów i smartfonów, stosując standardowe procedury, aby zapewnić porównywalność wszystkich wyników. Od około 20 lat stale rozwijamy nasze metody badawcze, ustanawiając przy tym standardy branżowe. W naszych laboratoriach testowych doświadczeni technicy i redaktorzy korzystają z wysokiej jakości sprzętu pomiarowego. Testy te obejmują wieloetapowy proces walidacji. Nasz kompleksowy system ocen opiera się na setkach uzasadnionych pomiarów i benchmarków, co pozwala zachować obiektywizm.Price comparison

