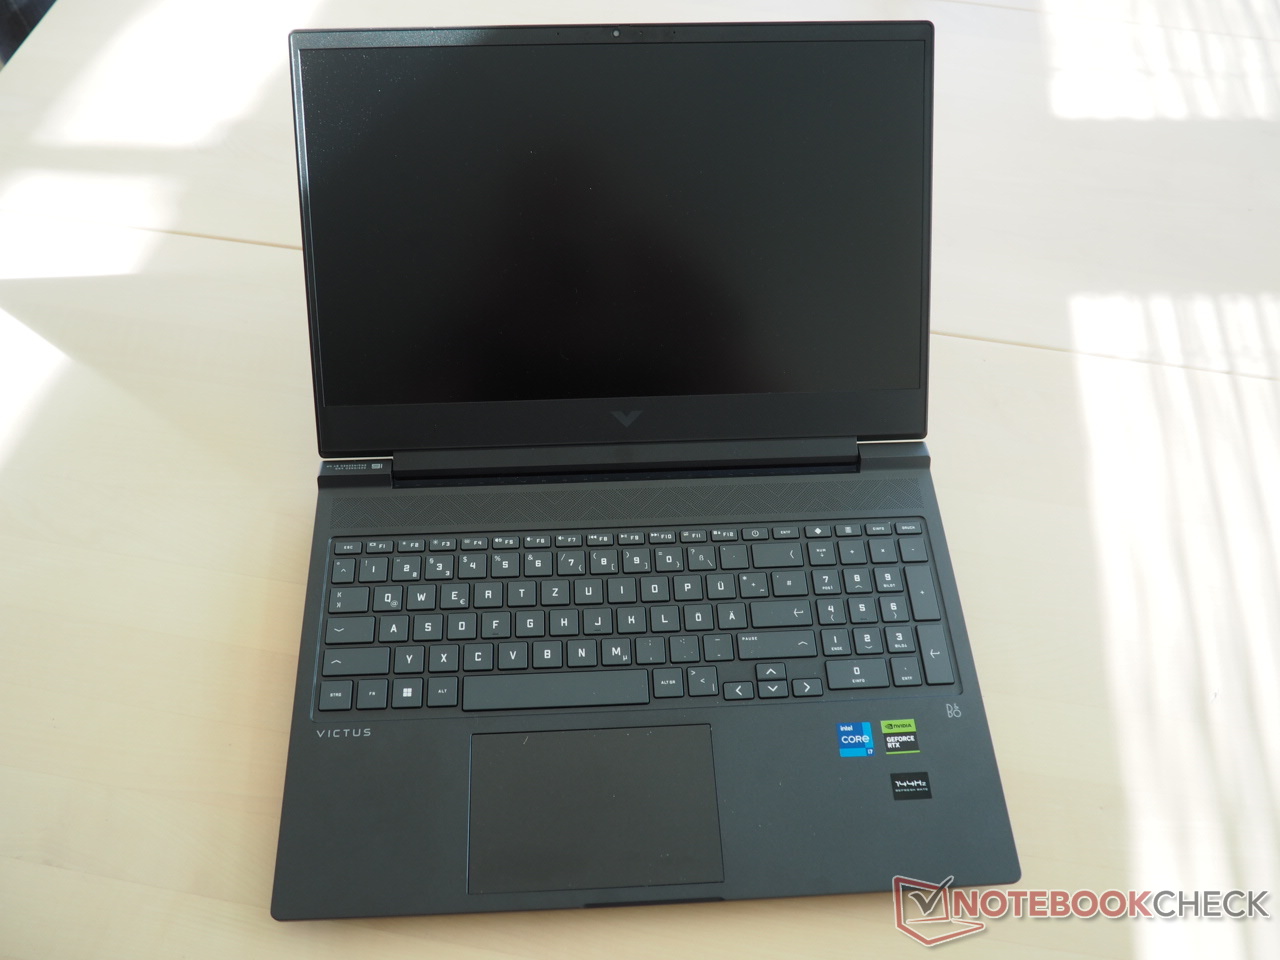
Recenzja laptopa HP Victus 16: Gracz Full HD z RTX 4070

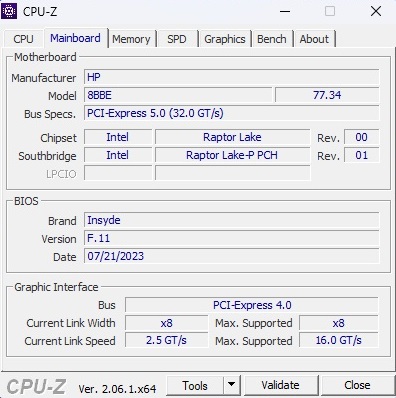
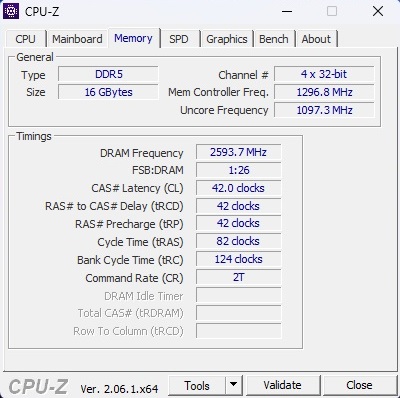
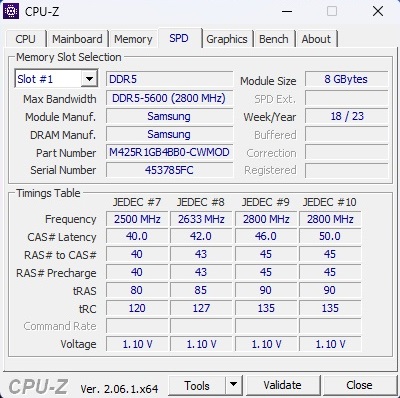
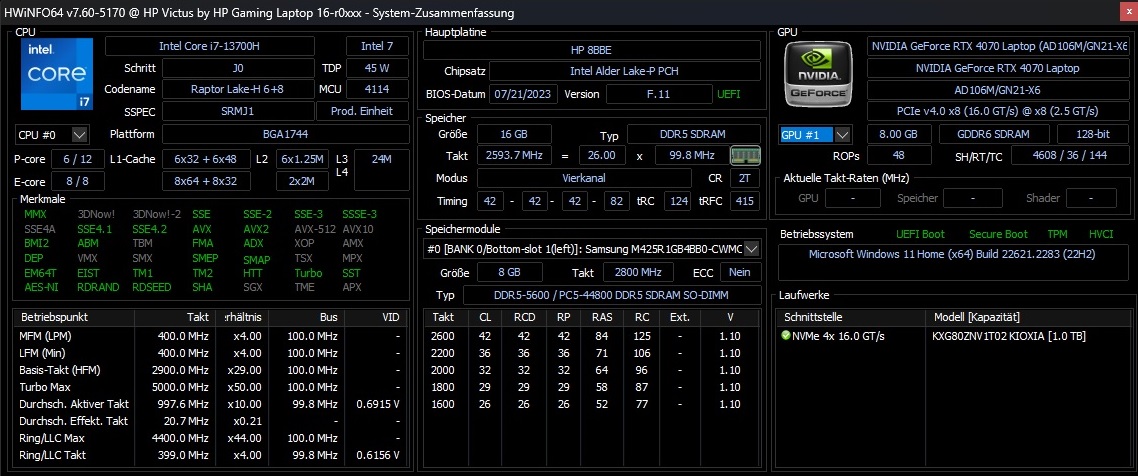
Podobnie jak seria Omen, Victus jest również dostępny w różnych konfiguracjach sprzętowych. Nasza jednostka testowa, z procesorem Core i7-13700H i GeForce RTX 4070należy do górnej części skali wydajności. 16 GB pamięci RAM DDR5-5600 i dysk SSD M.2 NVMe o pojemności 1 TB to również solidne wyposażenie na rok 2023. Wyświetlacz to matowy panel IPS w formacie 16:9 przy 1920 x 1080 i 144 Hz. Koszt całego pakietu: obecnie co najmniej 1 439,99 USD.
Wśród konkurentów Victusa 16 znajdują się inne 16-calowe monitory dla graczy, również wyposażone w GeForce RTX 4070, takie jakLenovo Legion Pro 5 16ARX8i Acer Nitro 16 AN16-41, Gigabyte Gigabyte Aero 16 OLED BSF oraz MSI Stealth 16 Studio A13VGniektóre z nich wykorzystują procesor AMD i wszystkie pojawiają się w poniższych tabelach jako urządzenia porównawcze.
Potencjalni konkurenci w porównaniu
Ocena | Data | Model | Waga | Wysokość | Rozmiar | Rezolucja | Cena |
|---|---|---|---|---|---|---|---|
| 85.1 % v7 (old) | 09/2023 | HP Victus 16-r0077ng i7-13700H, GeForce RTX 4070 Laptop GPU | 2.4 kg | 24 mm | 16.10" | 1920x1080 | |
| 86.6 % v7 (old) | 09/2023 | HP Omen 16-xf0376ng R7 7840HS, GeForce RTX 4070 Laptop GPU | 2.4 kg | 23.5 mm | 16.10" | 1920x1080 | |
| 88.4 % v7 (old) | 05/2023 | Lenovo Legion Pro 5 16ARX8 R7 7745HX, GeForce RTX 4070 Laptop GPU | 2.5 kg | 26.8 mm | 16.00" | 2560x1600 | |
| 88.1 % v7 (old) | 06/2023 | Acer Nitro 16 AN16-41 R7 7735HS, GeForce RTX 4070 Laptop GPU | 2.7 kg | 27.9 mm | 16.00" | 2560x1600 | |
| 86.2 % v7 (old) | 03/2023 | Gigabyte AERO 16 OLED BSF i9-13900H, GeForce RTX 4070 Laptop GPU | 2.1 kg | 18 mm | 16.00" | 3840x2400 | |
| 88.8 % v7 (old) | 07/2023 | MSI Stealth 16 Studio A13VG i7-13700H, GeForce RTX 4070 Laptop GPU | 2 kg | 19.95 mm | 16.00" | 2560x1600 |
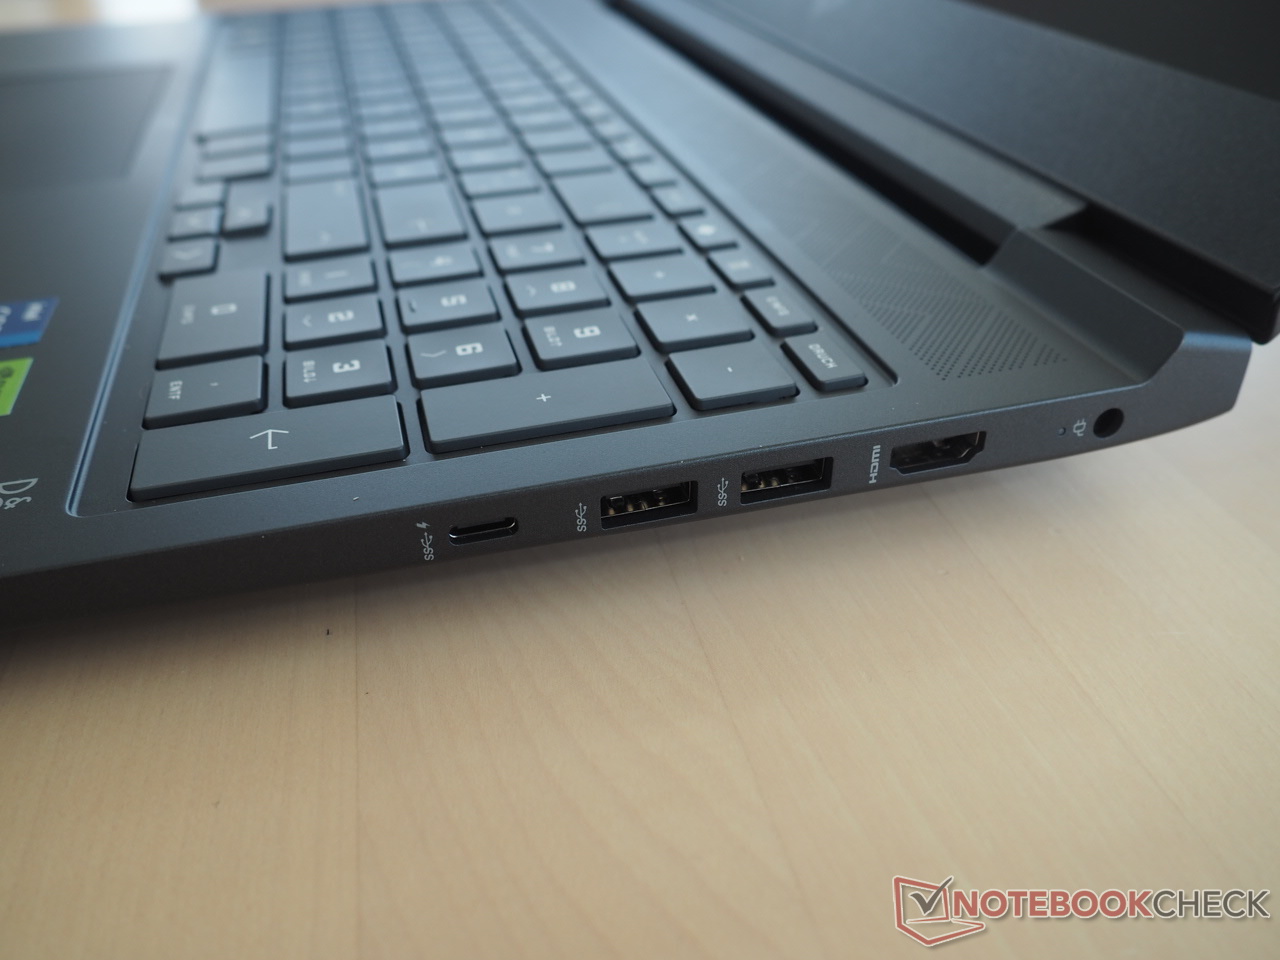
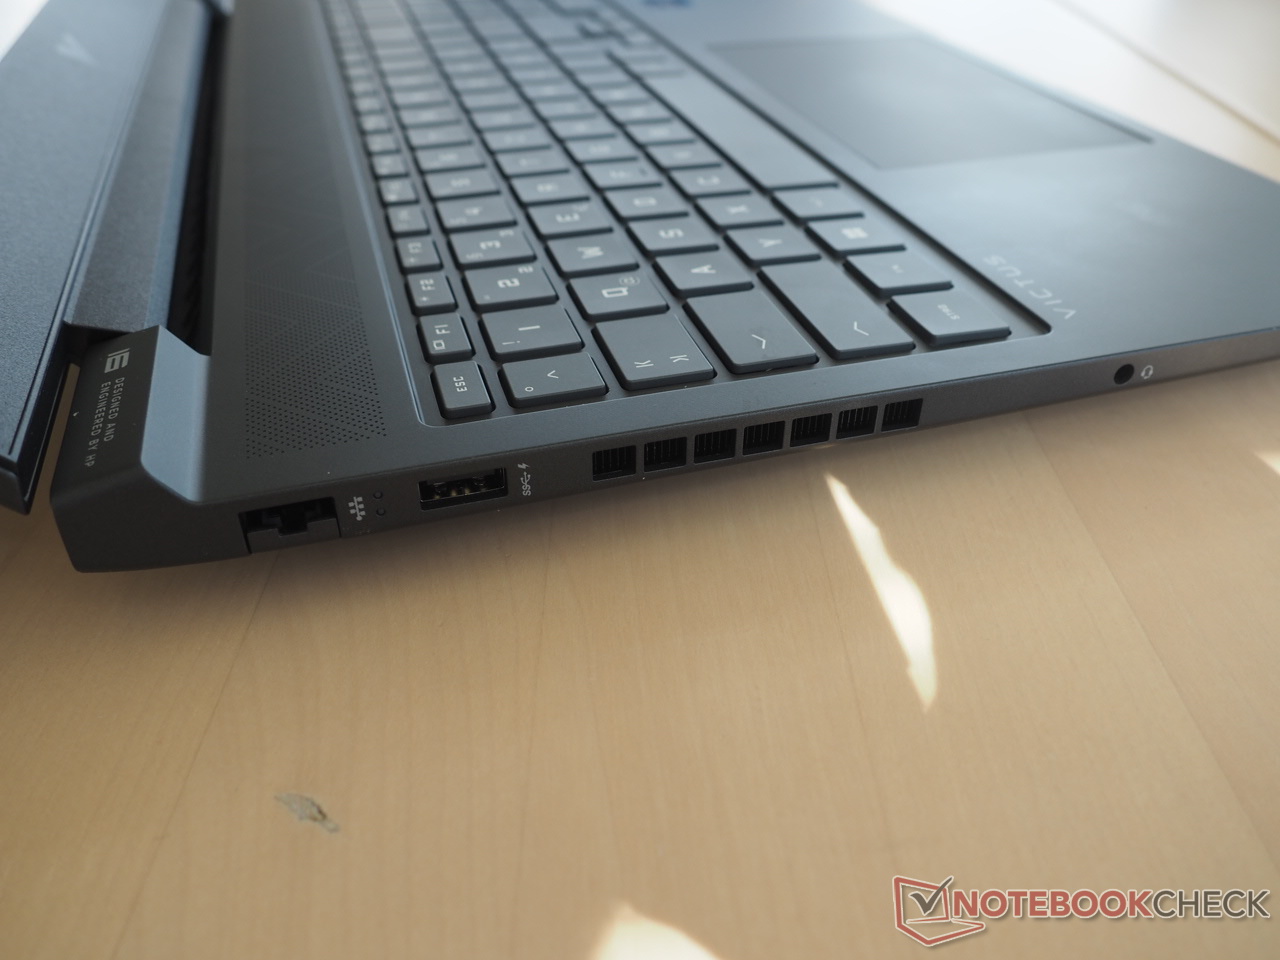
Ponieważ obudowa jest identyczna z niedawno recenzowaną wersją amerykańską z procesorem Core i5-13500HX i GeForce RTX 4050,nie wchodzimy w szczegóły dotyczące obudowy, wyposażenia i urządzeń wejściowych w tej recenzji. Wszystkie istotne informacje można znaleźć w odpowiedniej recenzji tutaj.
Komunikacja
Kamera internetowa


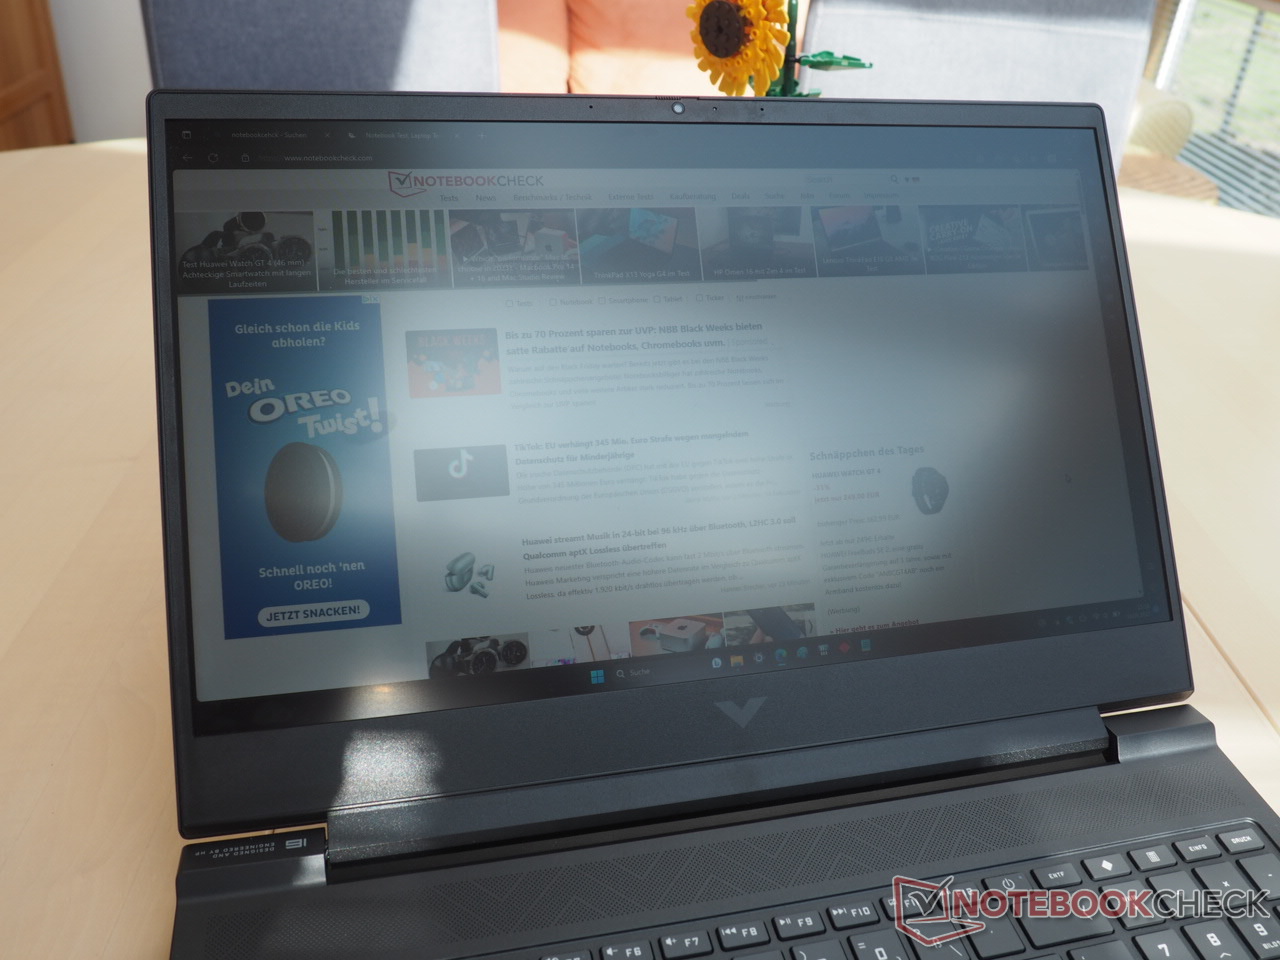
Wyświetlacz
Chociaż oznaczenia paneli są bardzo podobne, wersja RTX 4070 ma nieco inny wyświetlacz Full HD niż wariant RTX 4050, chociaż wyniki w większości prawie się nie różnią.
| |||||||||||||||||||||||||
rozświetlenie: 85 %
na akumulatorze: 308 cd/m²
kontrast: 1232:1 (czerń: 0.25 cd/m²)
ΔE ColorChecker Calman: 1.3 | ∀{0.5-29.43 Ø4.72}
calibrated: 0.92
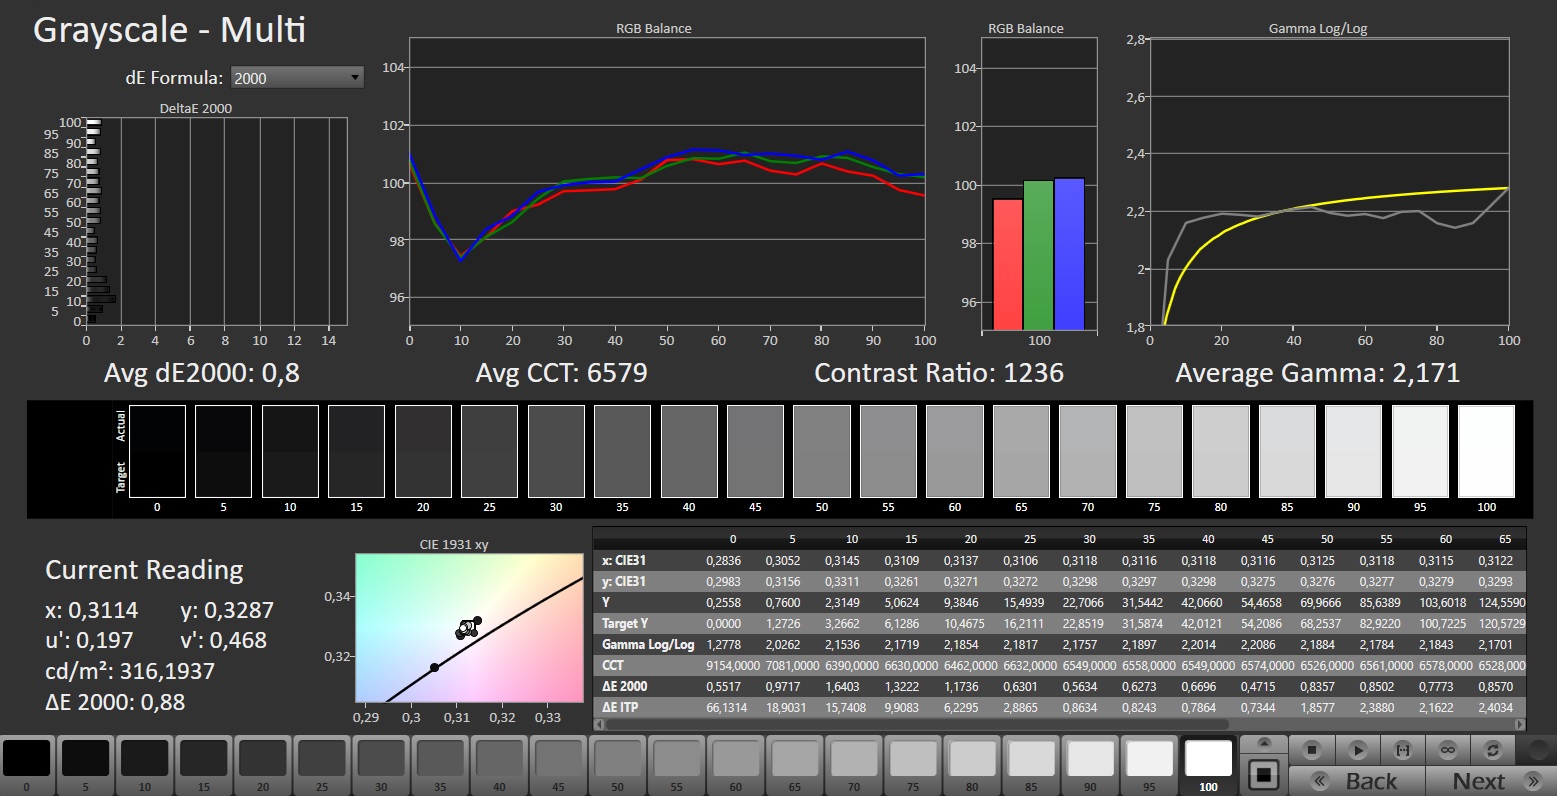
ΔE Greyscale Calman: 1.7 | ∀{0.09-98 Ø4.97}
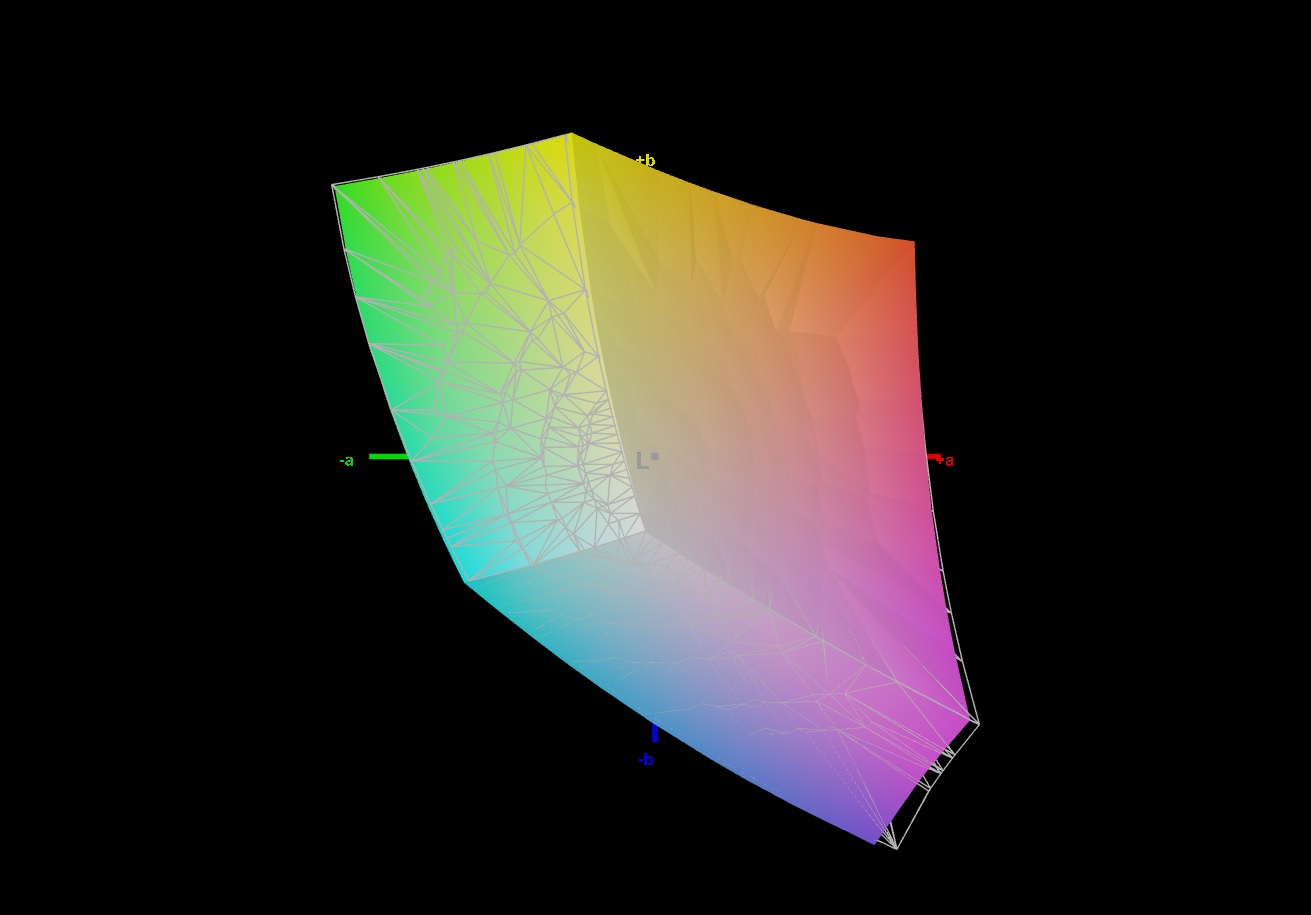
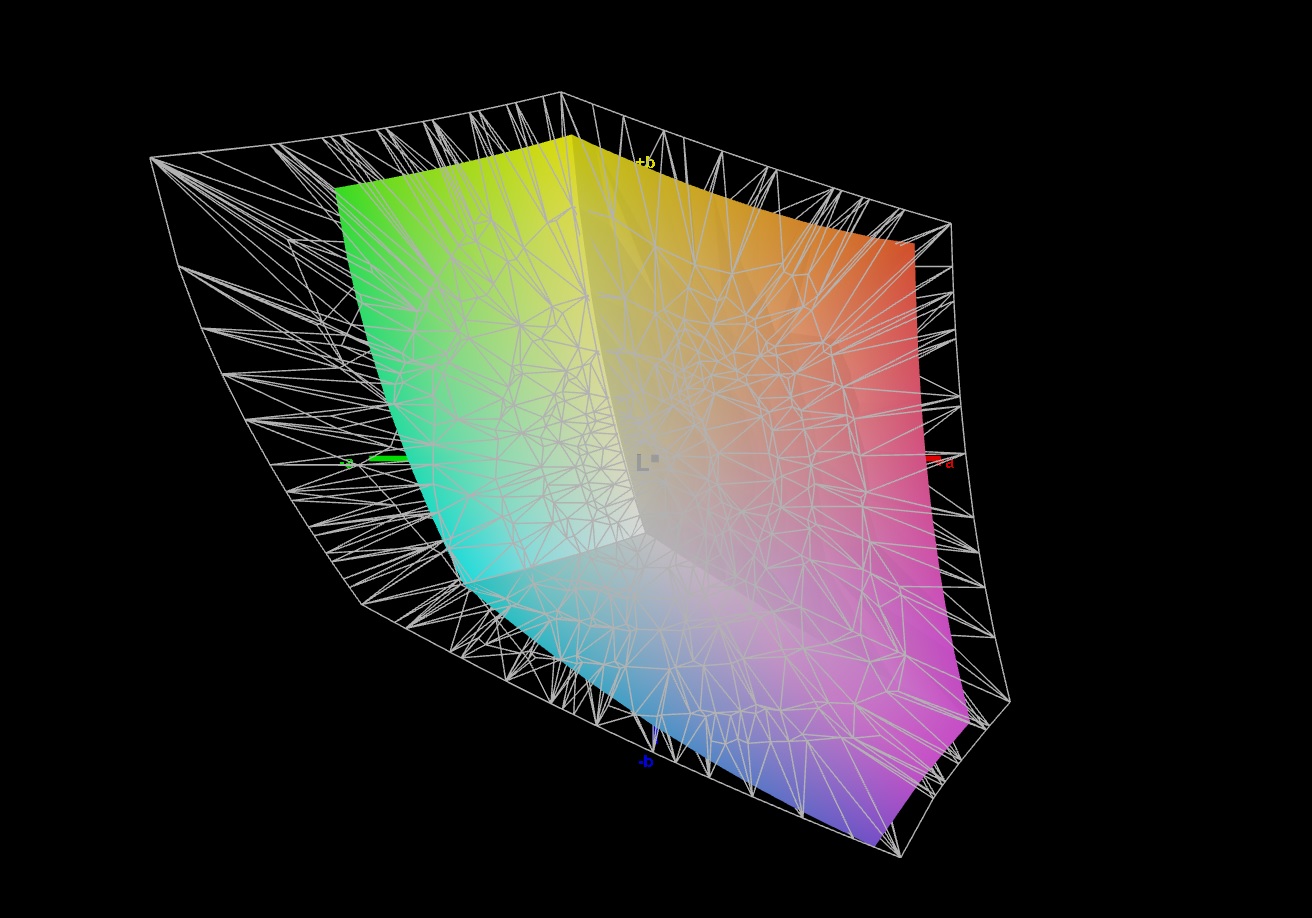
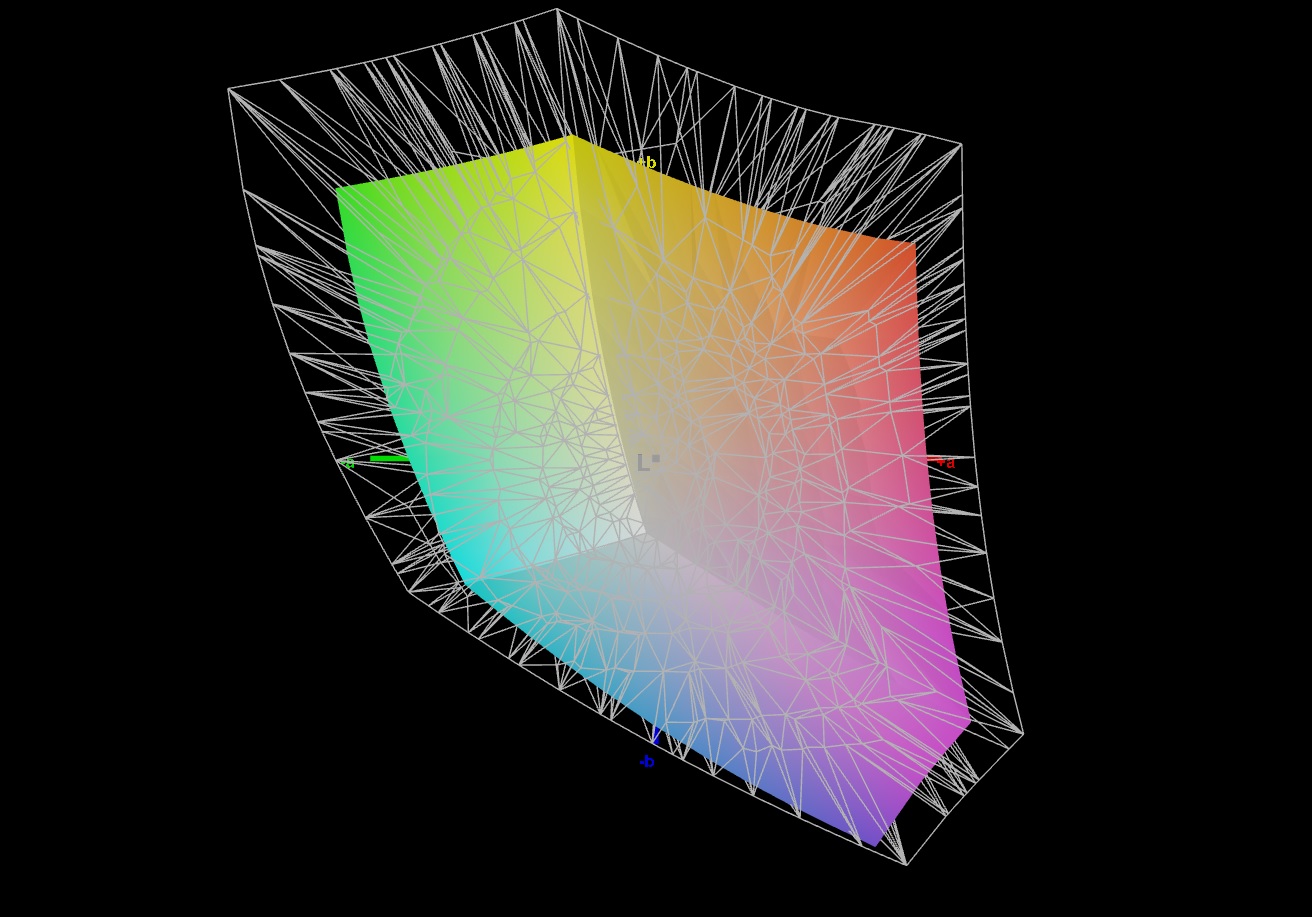
69% AdobeRGB 1998 (Argyll 3D)
98% sRGB (Argyll 3D)
66.7% Display P3 (Argyll 3D)
Gamma: 2.167
CCT: 6767 K
| HP Victus 16-r0077ng CMN162D, IPS, 1920x1080, 16.1" | HP Omen 16-xf0376ng BOE0B81, IPS, 1920x1080, 16.1" | Lenovo Legion Pro 5 16ARX8 CSOT T3 MNG007DA1-Q, IPS, 2560x1600, 16" | Acer Nitro 16 AN16-41 BOE CQ NE16QDM-NY1, IPS, 2560x1600, 16" | Gigabyte AERO 16 OLED BSF Samsung SDC4191 (ATNA60YV09-0, OLED, 3840x2400, 16" | MSI Stealth 16 Studio A13VG AUO26A9, IPS, 2560x1600, 16" | |
|---|---|---|---|---|---|---|
| Display | 5% | 4% | 1% | 31% | 23% | |
| Display P3 Coverage (%) | 66.7 | 72.1 8% | 70.4 6% | 67.9 2% | 99.9 50% | 96.4 45% |
| sRGB Coverage (%) | 98 | 99.6 2% | 99.6 2% | 99.1 1% | 100 2% | 99.7 2% |
| AdobeRGB 1998 Coverage (%) | 69 | 72.3 5% | 72.6 5% | 69.9 1% | 96.4 40% | 84.8 23% |
| Response Times | 10% | 18% | 28% | 81% | 50% | |
| Response Time Grey 50% / Grey 80% * (ms) | 13.3 ? | 12.3 ? 8% | 7 ? 47% | 11 ? 17% | 2 ? 85% | 4.4 ? 67% |
| Response Time Black / White * (ms) | 8.2 ? | 7.2 ? 12% | 9.1 ? -11% | 5 ? 39% | 1.98 ? 76% | 5.6 ? 32% |
| PWM Frequency (Hz) | 60 | |||||
| Screen | -68% | 11% | -12% | 101% | -73% | |
| Brightness middle (cd/m²) | 308 | 350 14% | 355.3 15% | 520 69% | 389.97 27% | 424 38% |
| Brightness (cd/m²) | 285 | 338 19% | 340 19% | 494 73% | 395 39% | 411 44% |
| Brightness Distribution (%) | 85 | 91 7% | 91 7% | 91 7% | 97 14% | 88 4% |
| Black Level * (cd/m²) | 0.25 | 0.35 -40% | 0.32 -28% | 0.39 -56% | 0.03 88% | 0.37 -48% |
| Contrast (:1) | 1232 | 1000 -19% | 1110 -10% | 1333 8% | 12999 955% | 1146 -7% |
| Colorchecker dE 2000 * | 1.3 | 3.29 -153% | 1.13 13% | 1.94 -49% | 2 -54% | 3.04 -134% |
| Colorchecker dE 2000 max. * | 2.76 | 8.47 -207% | 2.78 -1% | 5.62 -104% | 4.1 -49% | 7.5 -172% |
| Colorchecker dE 2000 calibrated * | 0.92 | 2.23 -142% | 0.32 65% | 0.74 20% | 1.68 -83% | 3.04 -230% |
| Greyscale dE 2000 * | 1.7 | 3.2 -88% | 1.4 18% | 2.94 -73% | 2.23 -31% | 4.34 -155% |
| Gamma | 2.167 102% | 2.131 103% | 2.24 98% | 2.37 93% | 2.41 91% | 2.32 95% |
| CCT | 6767 96% | 6317 103% | 6372 102% | 6443 101% | 6323 103% | 6952 93% |
| Całkowita średnia (program / ustawienia) | -18% /
-41% | 11% /
11% | 6% /
-3% | 71% /
83% | 0% /
-35% |
* ... im mniej tym lepiej
Przy średniej jasności 285 cd/m², Victus 16 niestety nie należy do najjaśniejszych modeli. Podczas gdy wartość ta może być wystarczająca dla większości pomieszczeń, szybko osiągniesz granice czytelności i rozpoznawalności na zewnątrz. Dzięki stosunkowo dobrej wartości czerni wynoszącej 0,25 cd/m² dla standardów IPS, wyświetlacz nadal osiąga solidny kontrast około 1200:1.
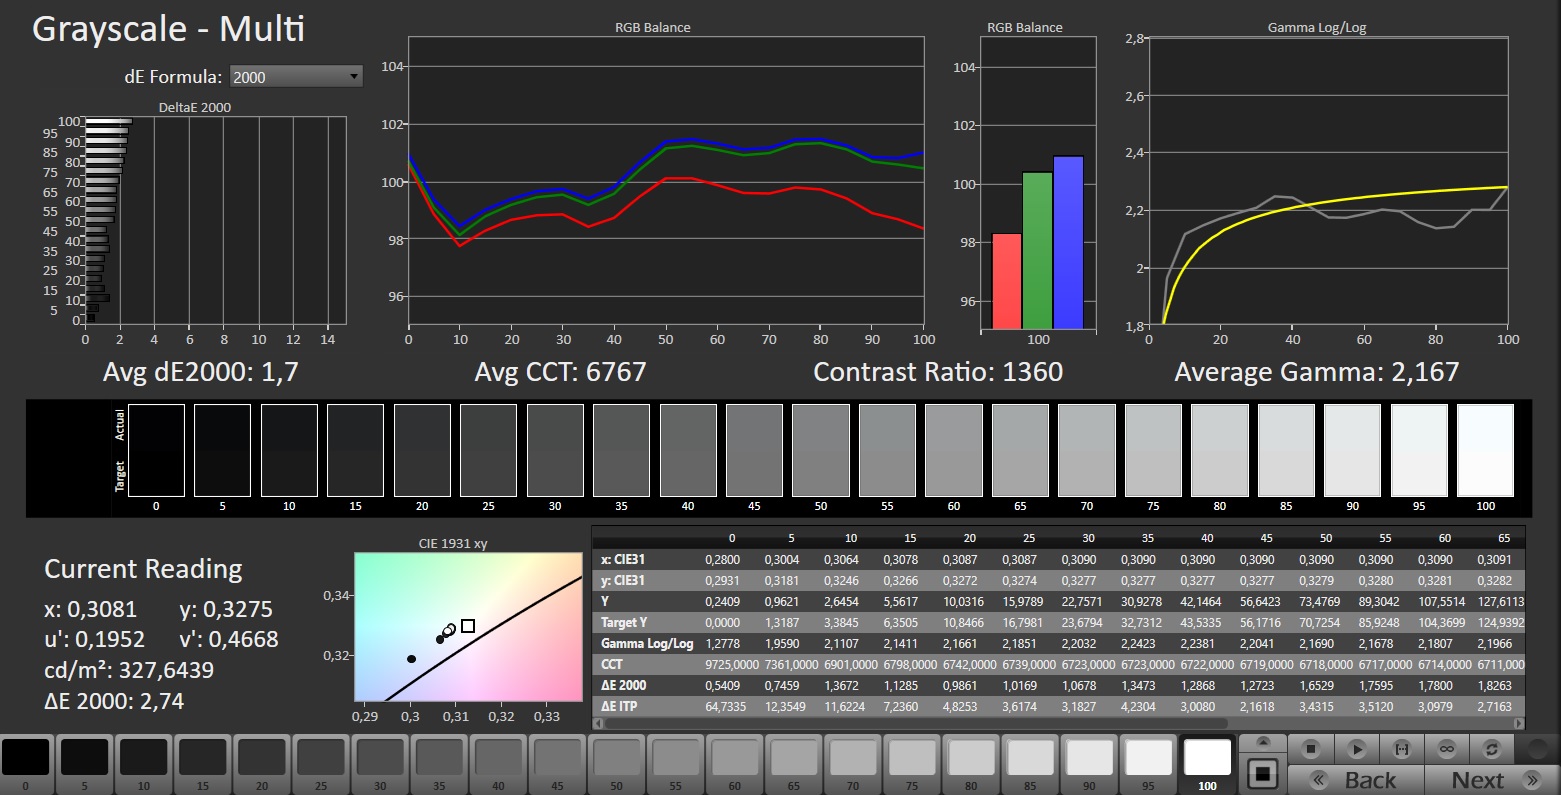
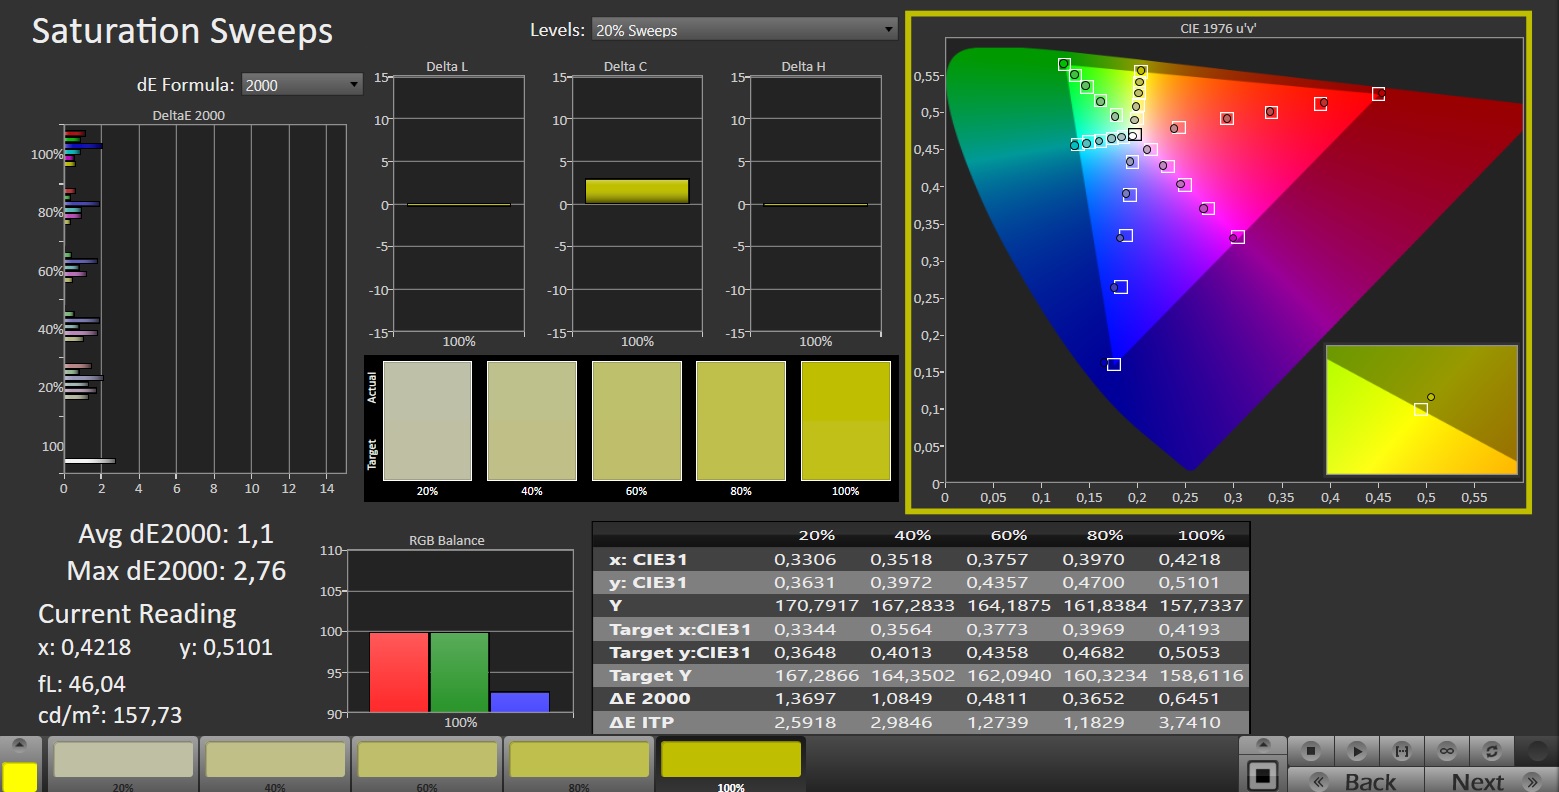
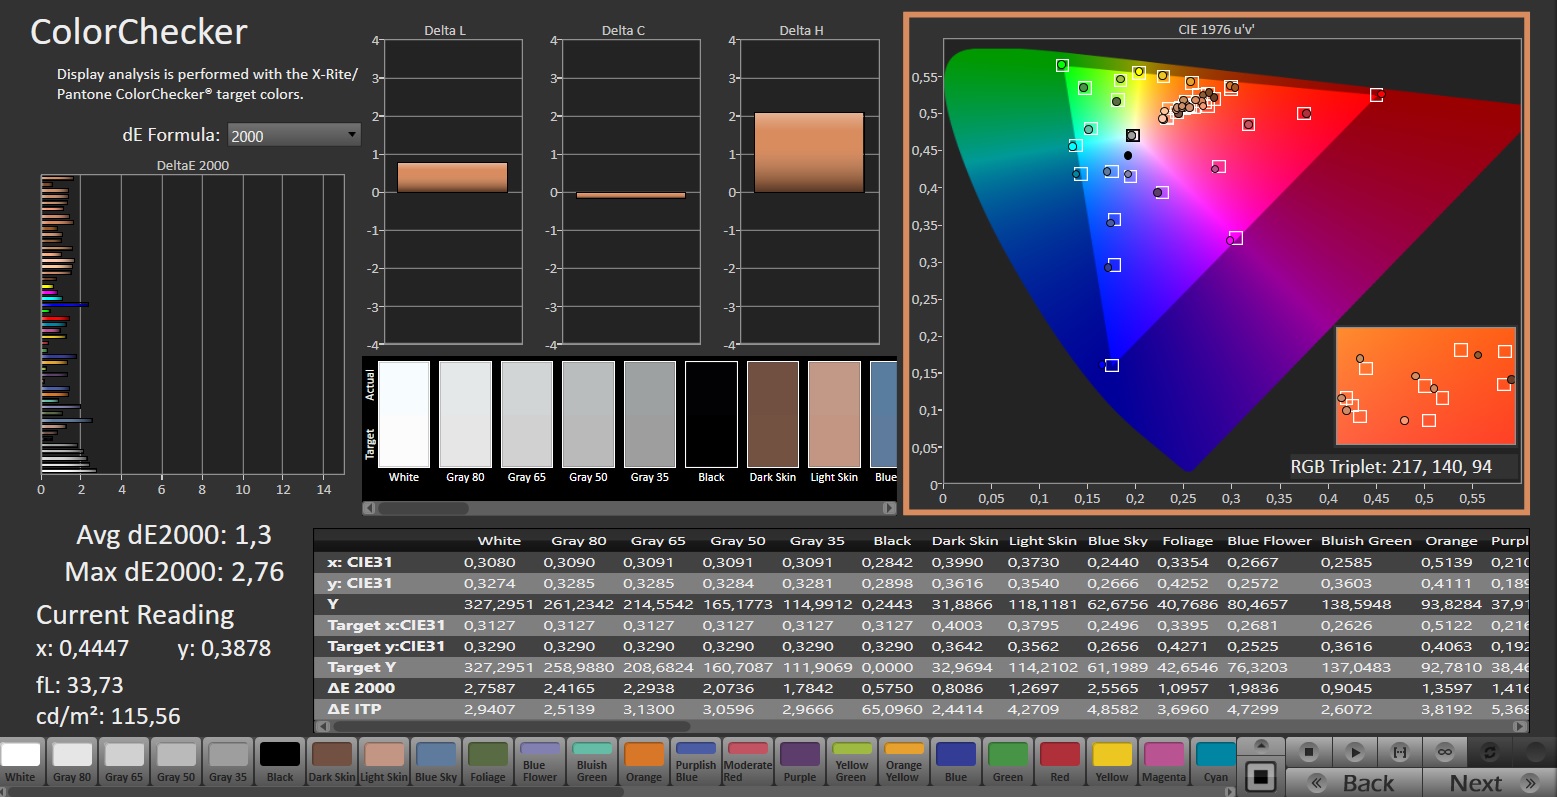
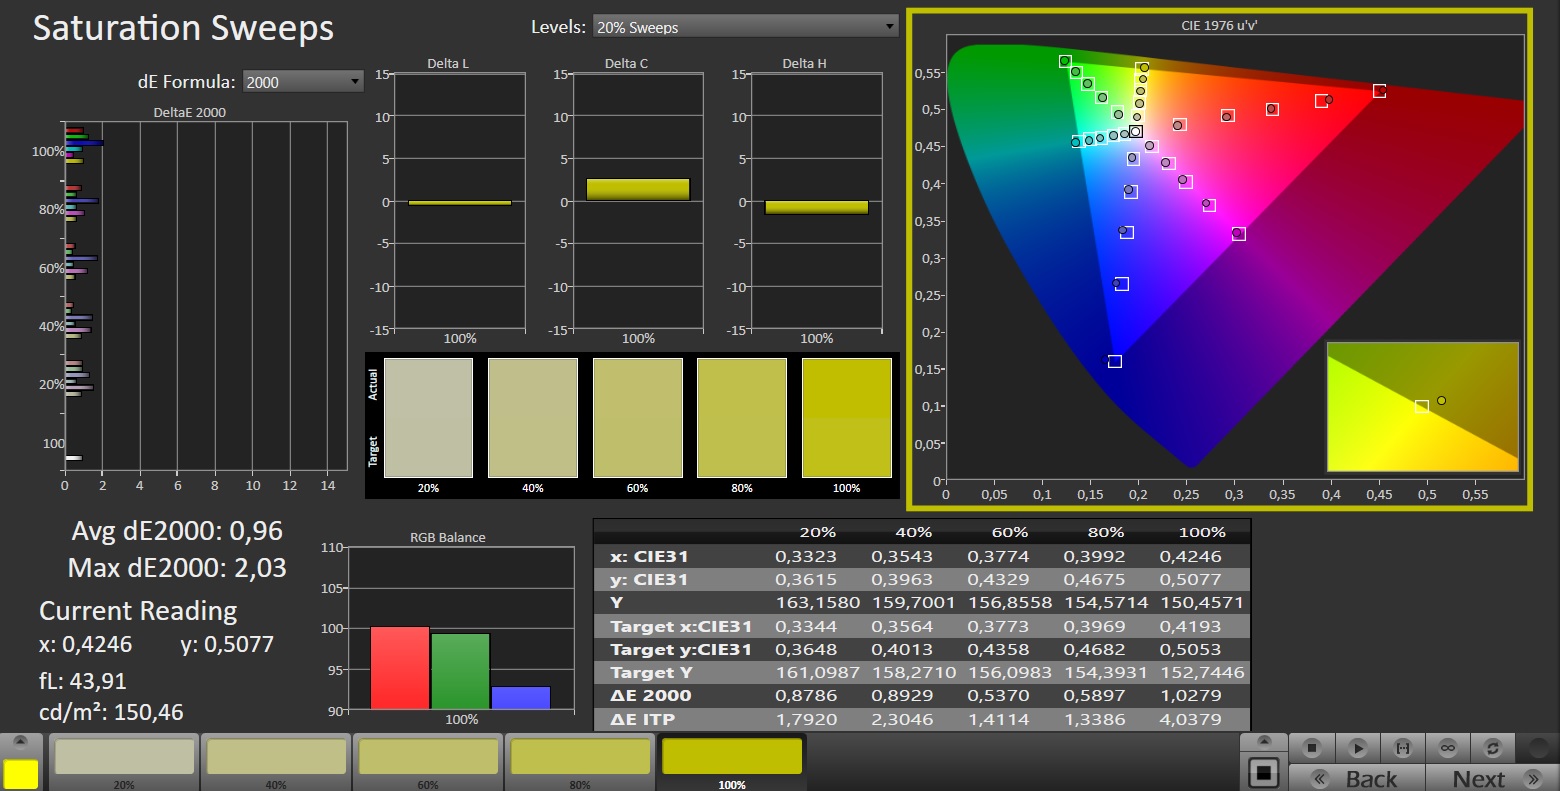
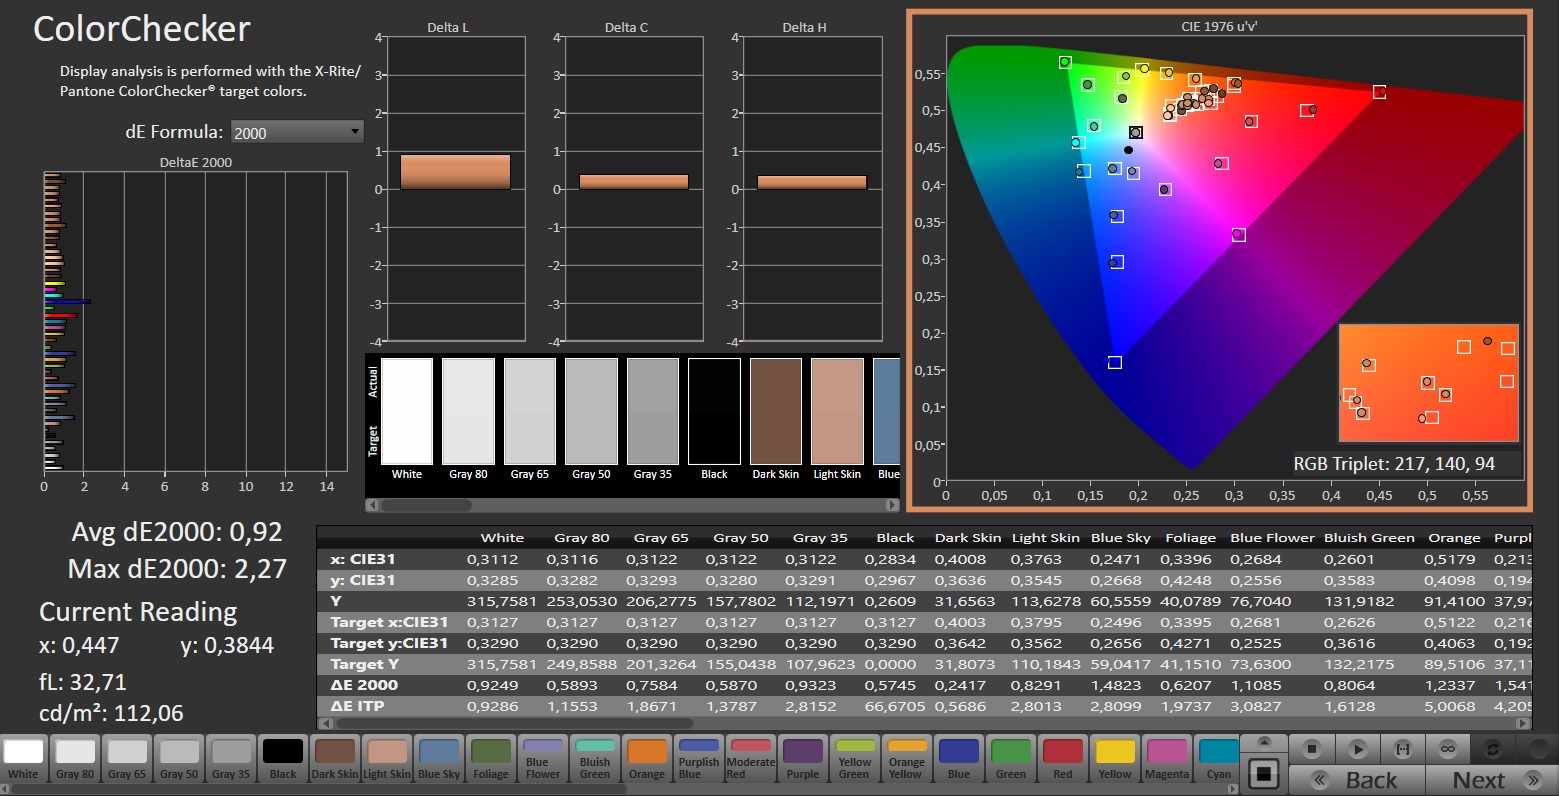
Przestrzeń kolorów również nie daje powodów do krytyki, ponieważ sRGB ma prawie 100% pokrycia. 69% dla AdobeRGB i 67% dla DCI-P3 są również akceptowalne dla notebooka do gier. Victus 16 zasługuje na szczególną pochwałę za dokładność odwzorowania kolorów: nawet w stanie dostawy wartości mieszczą się w idealnym zakresie (patrz zrzuty ekranu Calmana).
Kąty widzenia są na typowym (dobrym) poziomie IPS. Nasze urządzenie testowe nie wykazywało żadnych oznak migotania ekranu lub krwawienia ekranu. Czasy reakcji również nie rzucały się w oczy i powinny spełnić wymagania większości użytkowników.
Wyświetl czasy reakcji
| ↔ Czas reakcji od czerni do bieli | ||
|---|---|---|
| 8.2 ms ... wzrost ↗ i spadek ↘ łącznie | ↗ 4.5 ms wzrost | 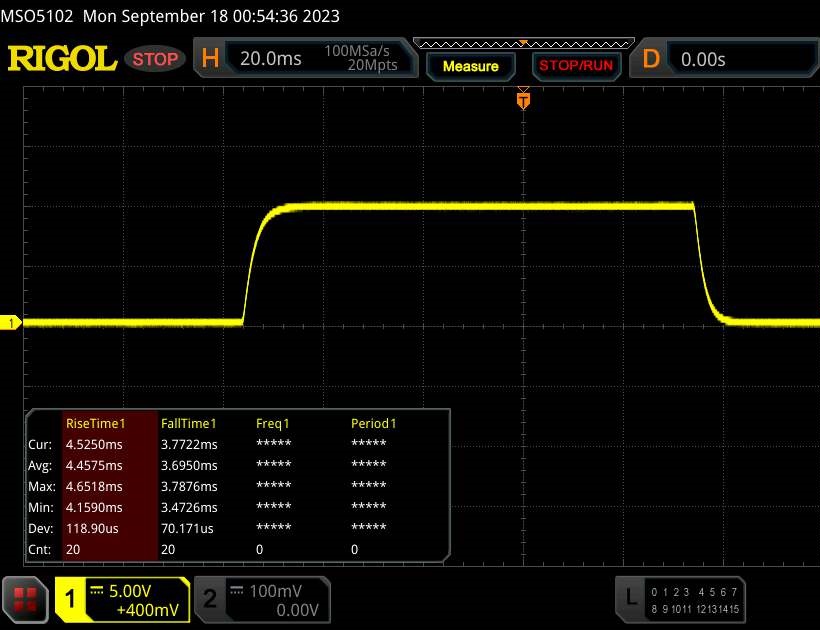 |
| ↘ 3.7 ms upadek | ||
| W naszych testach ekran wykazuje szybki czas reakcji i powinien nadawać się do gier. Dla porównania, wszystkie testowane urządzenia wahają się od 0.1 (minimum) do 240 (maksimum) ms. » 24 % wszystkich urządzeń jest lepszych. Oznacza to, że zmierzony czas reakcji jest lepszy od średniej wszystkich testowanych urządzeń (19.8 ms). | ||
| ↔ Czas reakcji 50% szarości do 80% szarości | ||
| 13.3 ms ... wzrost ↗ i spadek ↘ łącznie | ↗ 6 ms wzrost | 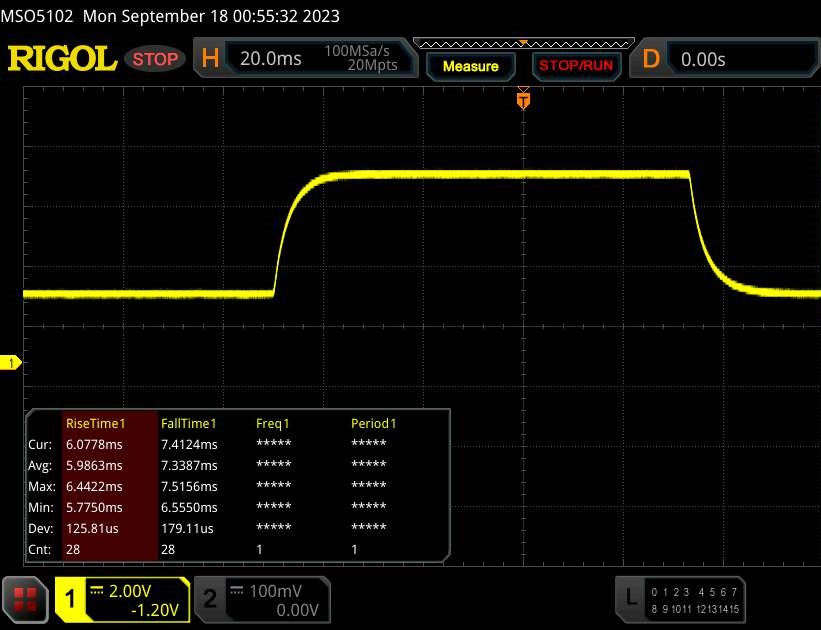 |
| ↘ 7.3 ms upadek | ||
| W naszych testach ekran wykazuje dobry współczynnik reakcji, ale może być zbyt wolny dla graczy rywalizujących ze sobą. Dla porównania, wszystkie testowane urządzenia wahają się od 0.165 (minimum) do 636 (maksimum) ms. » 27 % wszystkich urządzeń jest lepszych. Oznacza to, że zmierzony czas reakcji jest lepszy od średniej wszystkich testowanych urządzeń (31 ms). | ||
Migotanie ekranu / PWM (modulacja szerokości impulsu)
| Migotanie ekranu/nie wykryto PWM | 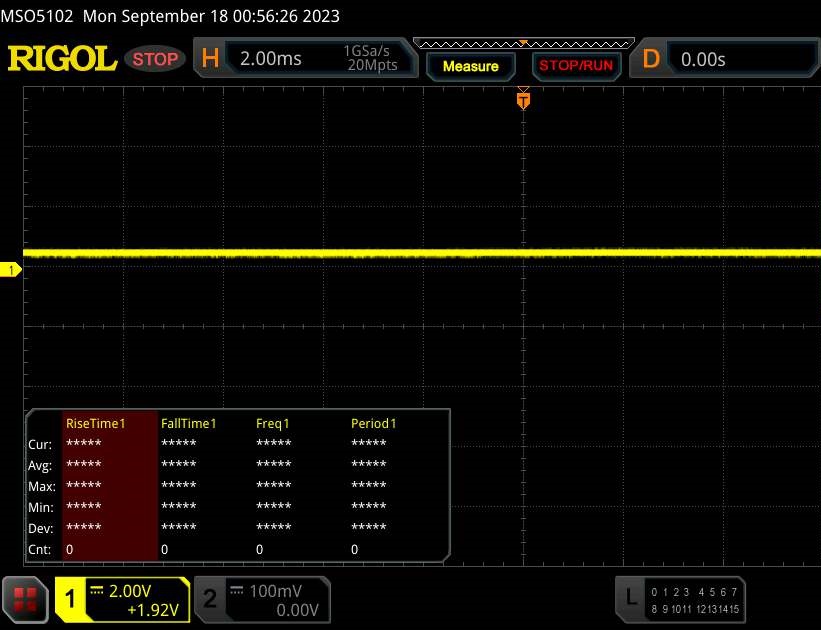 | ||
Dla porównania: 52 % wszystkich testowanych urządzeń nie używa PWM do przyciemniania wyświetlacza. Jeśli wykryto PWM, zmierzono średnio 7769 (minimum: 5 - maksimum: 343500) Hz. | |||
Wydajność
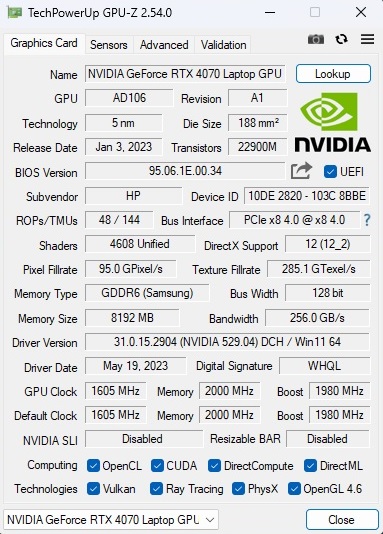
Pod względem sprzętowym Victus 16 plasuje się pomiędzy segmentami średniej i wysokiej klasy. Podczas gdy procesor Intela powinien mieć więcej niż wystarczające rezerwy na nadchodzące lata, GeForce RTX 4070 może zmagać się z nieco skromnym rozmiarem pamięci VRAM (8 GB GDDR6 nie jest już całkiem aktualne ani przyszłościowe).
Warunki testowania
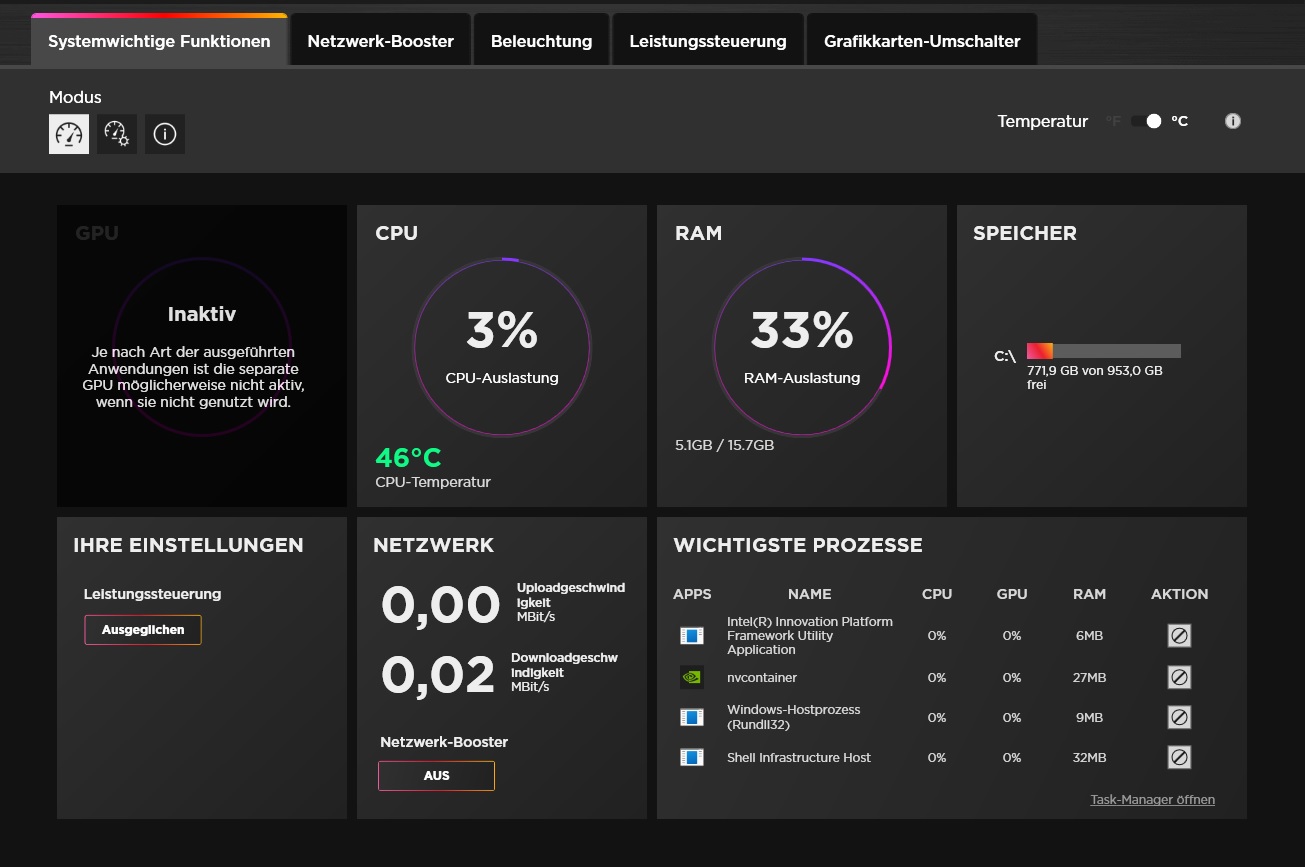
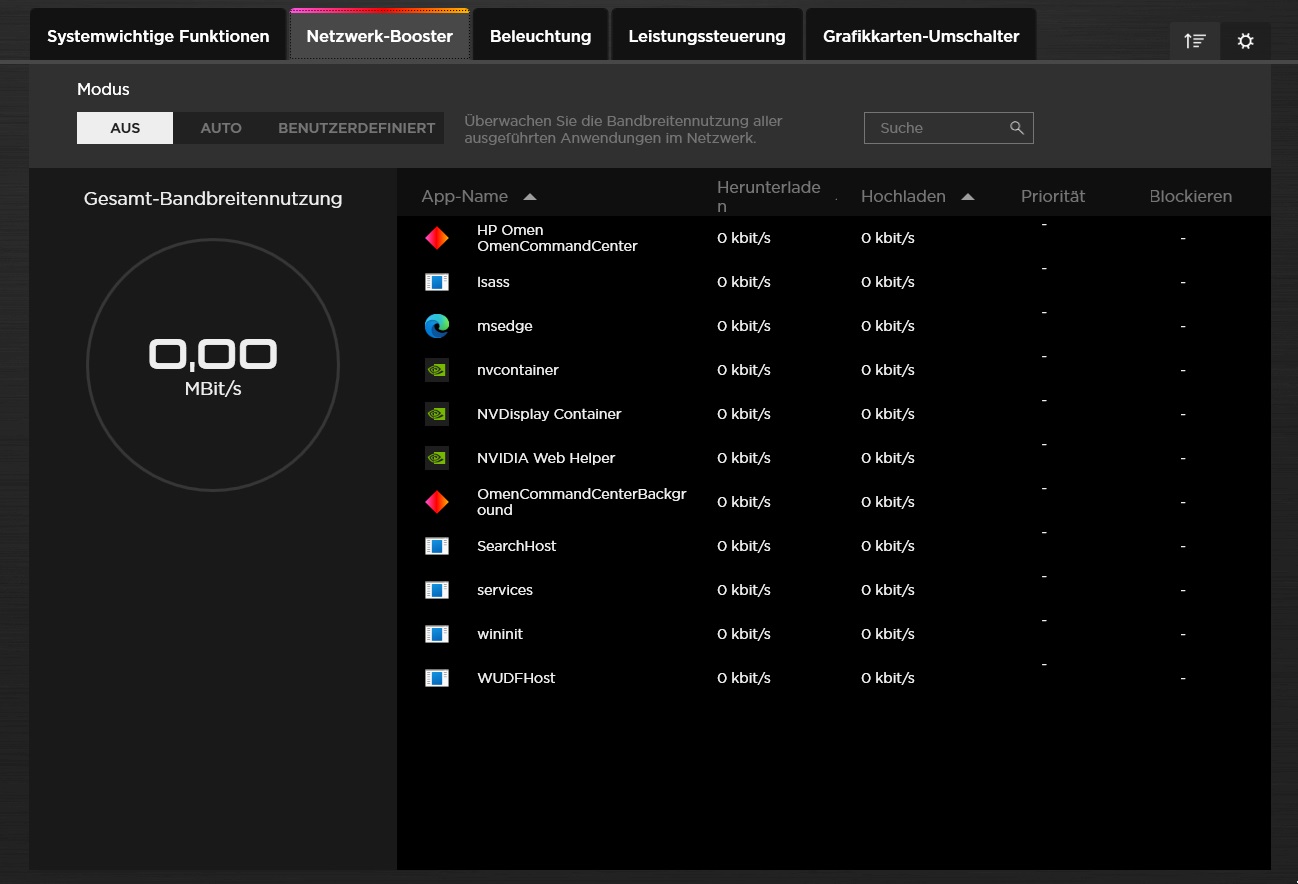
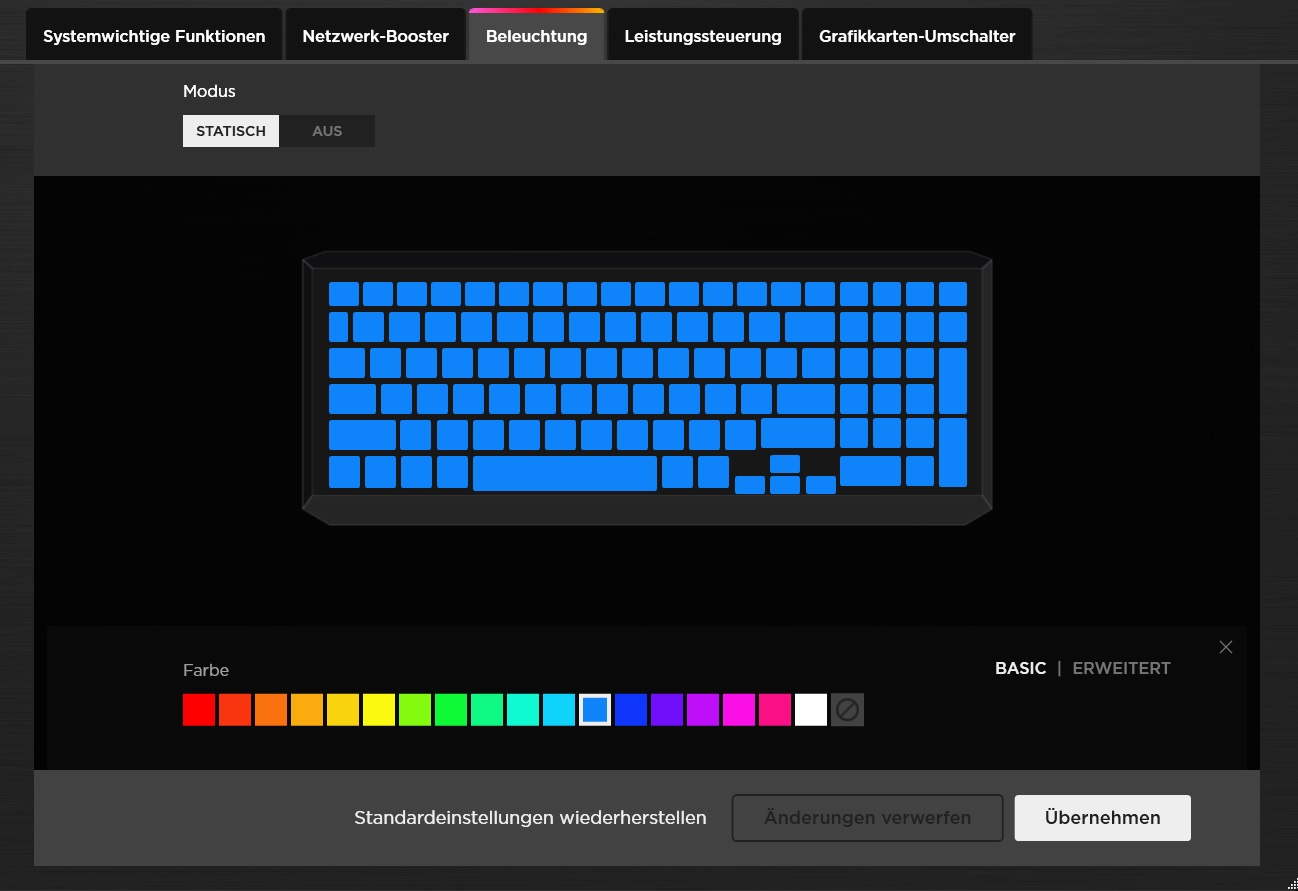
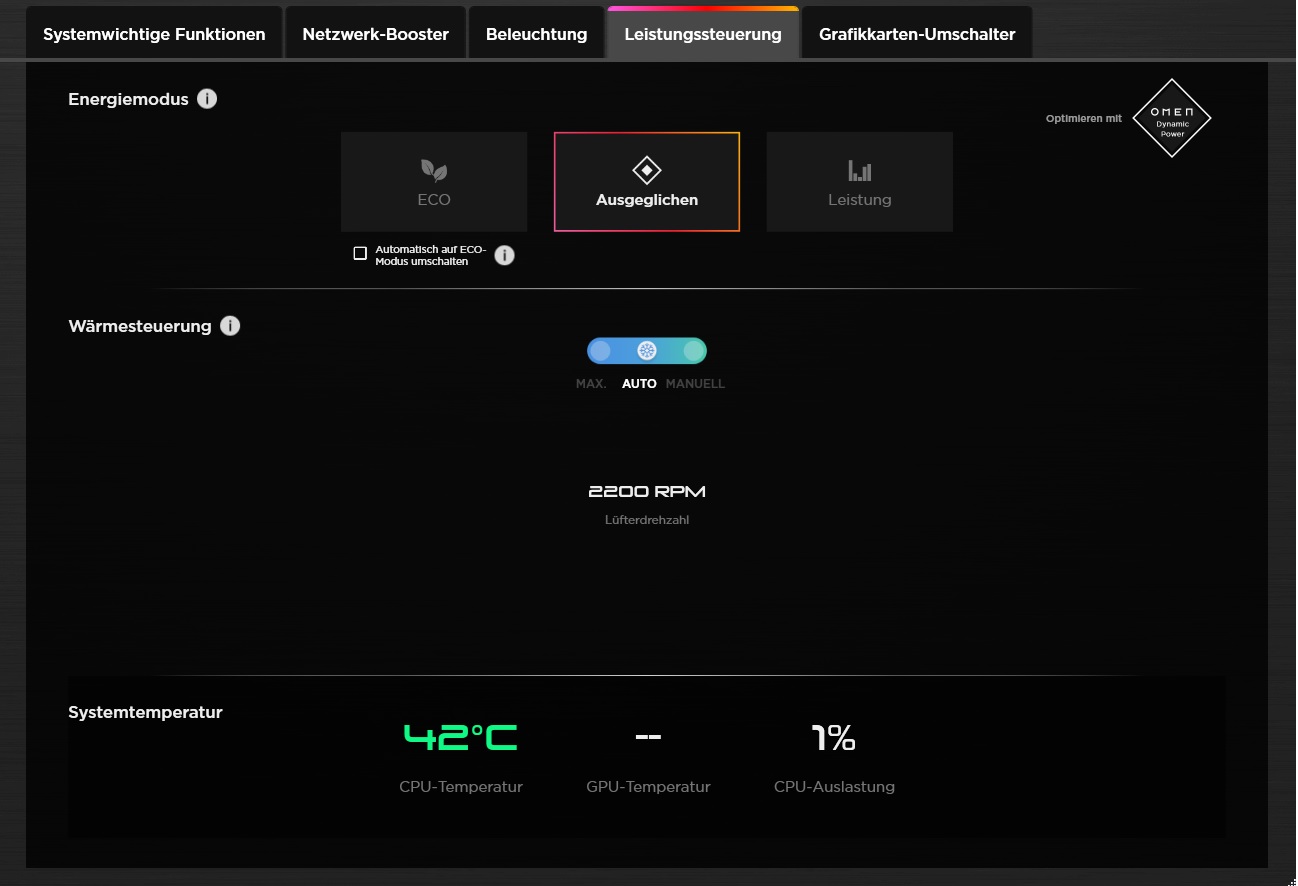
W preinstalowanym Omen Gaming Hub użytkownicy mogą między innymi dostosować kontrolę wydajności (zrzut ekranu #4). Ponieważ wydajność 3D prawie nie wzrasta w trybie wydajności , ale hałas znacznie wzrasta, wszystkie pomiary przeprowadziliśmy w trybie zrównoważonym . Tryb Eco tylko częściowo zasługuje na swoją nazwę: liczba klatek na sekundę i poziom hałasu grawitują w kierunku trybu środkowego.
| Witcher 3 (FHD/Ultra) | Eco | Zrównoważony | Wydajność |
|---|---|---|---|
| Liczba klatek na sekundę | ~110 fps | ~114 fps | ~118 fps |
| Hałas | ~46 dB(A) | ~46 dB(A) | ~56 dB(A) |
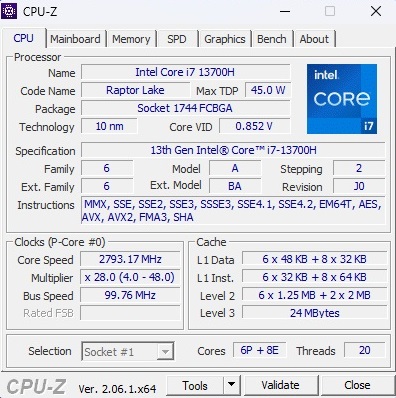
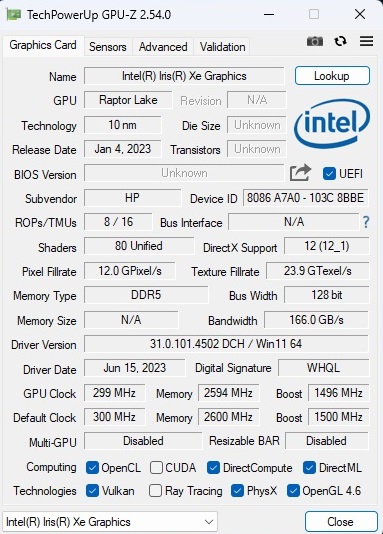
Procesor
Procesor Intel Core i7-13700H znajduje się obecnie w wielu notebookach do gier. Wykonany w technologii 10 nm model z generacji Raptor Lake oferuje 6 wydajnych rdzeni z hyper-threadingiem i 8 wydajnych rdzeni bez HT, co przekłada się na maksymalnie 20 równoległych wątków
W testach porównawczych Core i7-13700H w Victusie 16 zapewnia wydajność nieco poniżej średniej, jeśli porównać wyniki z poprzednią średnią. Przynajmniej trzeba przyznać HP, że wydajność pozostaje dość stabilna przez długi czas. W naszej pętli Cinebench nie było większych wahań ani spadków.
Cinebench R15 Multi Sustained Load
* ... im mniej tym lepiej
AIDA64: FP32 Ray-Trace | FPU Julia | CPU SHA3 | CPU Queen | FPU SinJulia | FPU Mandel | CPU AES | CPU ZLib | FP64 Ray-Trace | CPU PhotoWorxx
| Performance rating | |
| Średnia w klasie Gaming | |
| Lenovo Legion Pro 5 16ARX8 | |
| HP Omen 16-xf0376ng | |
| Gigabyte AERO 16 OLED BSF | |
| MSI Stealth 16 Studio A13VG | |
| Acer Nitro 16 AN16-41 | |
| Przeciętny Intel Core i7-13700H | |
| HP Victus 16-r0077ng | |
| AIDA64 / FP32 Ray-Trace | |
| Średnia w klasie Gaming (10227 - 85542, n=107, ostatnie 2 lata) | |
| Lenovo Legion Pro 5 16ARX8 | |
| HP Omen 16-xf0376ng | |
| Gigabyte AERO 16 OLED BSF | |
| MSI Stealth 16 Studio A13VG | |
| Acer Nitro 16 AN16-41 | |
| HP Victus 16-r0077ng | |
| Przeciętny Intel Core i7-13700H (4986 - 18908, n=29) | |
| AIDA64 / FPU Julia | |
| Średnia w klasie Gaming (51376 - 238426, n=107, ostatnie 2 lata) | |
| Lenovo Legion Pro 5 16ARX8 | |
| HP Omen 16-xf0376ng | |
| Acer Nitro 16 AN16-41 | |
| Gigabyte AERO 16 OLED BSF | |
| MSI Stealth 16 Studio A13VG | |
| HP Victus 16-r0077ng | |
| Przeciętny Intel Core i7-13700H (25360 - 92359, n=29) | |
| AIDA64 / CPU SHA3 | |
| Średnia w klasie Gaming (2180 - 9817, n=107, ostatnie 2 lata) | |
| Lenovo Legion Pro 5 16ARX8 | |
| HP Omen 16-xf0376ng | |
| Gigabyte AERO 16 OLED BSF | |
| MSI Stealth 16 Studio A13VG | |
| Acer Nitro 16 AN16-41 | |
| HP Victus 16-r0077ng | |
| Przeciętny Intel Core i7-13700H (1339 - 4224, n=29) | |
| AIDA64 / CPU Queen | |
| Lenovo Legion Pro 5 16ARX8 | |
| HP Omen 16-xf0376ng | |
| Średnia w klasie Gaming (49785 - 173351, n=95, ostatnie 2 lata) | |
| Acer Nitro 16 AN16-41 | |
| MSI Stealth 16 Studio A13VG | |
| Przeciętny Intel Core i7-13700H (59324 - 107159, n=29) | |
| Gigabyte AERO 16 OLED BSF | |
| HP Victus 16-r0077ng | |
| AIDA64 / FPU SinJulia | |
| Lenovo Legion Pro 5 16ARX8 | |
| HP Omen 16-xf0376ng | |
| Średnia w klasie Gaming (4424 - 33636, n=107, ostatnie 2 lata) | |
| Acer Nitro 16 AN16-41 | |
| MSI Stealth 16 Studio A13VG | |
| Gigabyte AERO 16 OLED BSF | |
| Przeciętny Intel Core i7-13700H (4800 - 11050, n=29) | |
| HP Victus 16-r0077ng | |
| AIDA64 / FPU Mandel | |
| Średnia w klasie Gaming (25115 - 128721, n=107, ostatnie 2 lata) | |
| Lenovo Legion Pro 5 16ARX8 | |
| HP Omen 16-xf0376ng | |
| Acer Nitro 16 AN16-41 | |
| Gigabyte AERO 16 OLED BSF | |
| MSI Stealth 16 Studio A13VG | |
| HP Victus 16-r0077ng | |
| Przeciętny Intel Core i7-13700H (12321 - 45118, n=29) | |
| AIDA64 / CPU AES | |
| Gigabyte AERO 16 OLED BSF | |
| Średnia w klasie Gaming (39258 - 247074, n=107, ostatnie 2 lata) | |
| MSI Stealth 16 Studio A13VG | |
| Przeciętny Intel Core i7-13700H (28769 - 151254, n=29) | |
| Lenovo Legion Pro 5 16ARX8 | |
| HP Omen 16-xf0376ng | |
| HP Victus 16-r0077ng | |
| Acer Nitro 16 AN16-41 | |
| AIDA64 / CPU ZLib | |
| Średnia w klasie Gaming (574 - 2531, n=107, ostatnie 2 lata) | |
| Gigabyte AERO 16 OLED BSF | |
| Lenovo Legion Pro 5 16ARX8 | |
| HP Omen 16-xf0376ng | |
| MSI Stealth 16 Studio A13VG | |
| HP Victus 16-r0077ng | |
| Przeciętny Intel Core i7-13700H (389 - 1215, n=29) | |
| Acer Nitro 16 AN16-41 | |
| AIDA64 / FP64 Ray-Trace | |
| Średnia w klasie Gaming (5509 - 45446, n=107, ostatnie 2 lata) | |
| Lenovo Legion Pro 5 16ARX8 | |
| HP Omen 16-xf0376ng | |
| Gigabyte AERO 16 OLED BSF | |
| MSI Stealth 16 Studio A13VG | |
| Acer Nitro 16 AN16-41 | |
| HP Victus 16-r0077ng | |
| Przeciętny Intel Core i7-13700H (2540 - 10135, n=29) | |
| AIDA64 / CPU PhotoWorxx | |
| MSI Stealth 16 Studio A13VG | |
| Gigabyte AERO 16 OLED BSF | |
| Średnia w klasie Gaming (12271 - 89891, n=107, ostatnie 2 lata) | |
| Przeciętny Intel Core i7-13700H (12872 - 52727, n=29) | |
| HP Victus 16-r0077ng | |
| HP Omen 16-xf0376ng | |
| Lenovo Legion Pro 5 16ARX8 | |
| Acer Nitro 16 AN16-41 | |
Wydajność systemu
Ponieważ dysk SSD nie jest tak szybki, Victus 16 zajmuje ostatnie miejsce w testach systemowych. Jednak 7 158 punktów w PCMark 10 to wciąż dobry wynik ogólny.
CrossMark: Overall | Productivity | Creativity | Responsiveness
| PCMark 10 / Score | |
| Średnia w klasie Gaming (5828 - 11574, n=95, ostatnie 2 lata) | |
| Lenovo Legion Pro 5 16ARX8 | |
| HP Omen 16-xf0376ng | |
| Gigabyte AERO 16 OLED BSF | |
| Przeciętny Intel Core i7-13700H, NVIDIA GeForce RTX 4070 Laptop GPU (7158 - 7956, n=8) | |
| MSI Stealth 16 Studio A13VG | |
| Acer Nitro 16 AN16-41 | |
| HP Victus 16-r0077ng | |
| PCMark 10 / Essentials | |
| Gigabyte AERO 16 OLED BSF | |
| HP Omen 16-xf0376ng | |
| Lenovo Legion Pro 5 16ARX8 | |
| HP Victus 16-r0077ng | |
| Przeciętny Intel Core i7-13700H, NVIDIA GeForce RTX 4070 Laptop GPU (10252 - 11449, n=8) | |
| Średnia w klasie Gaming (8810 - 12600, n=99, ostatnie 2 lata) | |
| Acer Nitro 16 AN16-41 | |
| MSI Stealth 16 Studio A13VG | |
| PCMark 10 / Productivity | |
| Średnia w klasie Gaming (6845 - 21327, n=97, ostatnie 2 lata) | |
| Lenovo Legion Pro 5 16ARX8 | |
| HP Omen 16-xf0376ng | |
| Przeciętny Intel Core i7-13700H, NVIDIA GeForce RTX 4070 Laptop GPU (8501 - 10769, n=8) | |
| MSI Stealth 16 Studio A13VG | |
| Gigabyte AERO 16 OLED BSF | |
| Acer Nitro 16 AN16-41 | |
| HP Victus 16-r0077ng | |
| PCMark 10 / Digital Content Creation | |
| Średnia w klasie Gaming (7602 - 19657, n=97, ostatnie 2 lata) | |
| Gigabyte AERO 16 OLED BSF | |
| Lenovo Legion Pro 5 16ARX8 | |
| HP Omen 16-xf0376ng | |
| Przeciętny Intel Core i7-13700H, NVIDIA GeForce RTX 4070 Laptop GPU (10358 - 12908, n=8) | |
| MSI Stealth 16 Studio A13VG | |
| Acer Nitro 16 AN16-41 | |
| HP Victus 16-r0077ng | |
| CrossMark / Overall | |
| Lenovo Legion Pro 5 16ARX8 | |
| Średnia w klasie Gaming (1366 - 2409, n=95, ostatnie 2 lata) | |
| Przeciętny Intel Core i7-13700H, NVIDIA GeForce RTX 4070 Laptop GPU (1768 - 2073, n=6) | |
| Gigabyte AERO 16 OLED BSF | |
| MSI Stealth 16 Studio A13VG | |
| Acer Nitro 16 AN16-41 | |
| CrossMark / Productivity | |
| Lenovo Legion Pro 5 16ARX8 | |
| Średnia w klasie Gaming (1386 - 2254, n=95, ostatnie 2 lata) | |
| Przeciętny Intel Core i7-13700H, NVIDIA GeForce RTX 4070 Laptop GPU (1645 - 2006, n=6) | |
| Gigabyte AERO 16 OLED BSF | |
| MSI Stealth 16 Studio A13VG | |
| Acer Nitro 16 AN16-41 | |
| CrossMark / Creativity | |
| Średnia w klasie Gaming (1343 - 2729, n=95, ostatnie 2 lata) | |
| Lenovo Legion Pro 5 16ARX8 | |
| Przeciętny Intel Core i7-13700H, NVIDIA GeForce RTX 4070 Laptop GPU (1936 - 2137, n=6) | |
| Gigabyte AERO 16 OLED BSF | |
| MSI Stealth 16 Studio A13VG | |
| Acer Nitro 16 AN16-41 | |
| CrossMark / Responsiveness | |
| Gigabyte AERO 16 OLED BSF | |
| Lenovo Legion Pro 5 16ARX8 | |
| Przeciętny Intel Core i7-13700H, NVIDIA GeForce RTX 4070 Laptop GPU (1451 - 2202, n=6) | |
| Średnia w klasie Gaming (1226 - 2334, n=95, ostatnie 2 lata) | |
| MSI Stealth 16 Studio A13VG | |
| Acer Nitro 16 AN16-41 | |
| PCMark 10 Score | 7158 pkt. | |
Pomoc | ||
| AIDA64 / Memory Copy | |
| Średnia w klasie Gaming (21750 - 129946, n=107, ostatnie 2 lata) | |
| MSI Stealth 16 Studio A13VG | |
| Gigabyte AERO 16 OLED BSF | |
| HP Omen 16-xf0376ng | |
| Przeciętny Intel Core i7-13700H (24334 - 78081, n=29) | |
| HP Victus 16-r0077ng | |
| Lenovo Legion Pro 5 16ARX8 | |
| Acer Nitro 16 AN16-41 | |
| AIDA64 / Memory Read | |
| MSI Stealth 16 Studio A13VG | |
| Średnia w klasie Gaming (22956 - 118858, n=107, ostatnie 2 lata) | |
| HP Victus 16-r0077ng | |
| Gigabyte AERO 16 OLED BSF | |
| Przeciętny Intel Core i7-13700H (23681 - 79656, n=29) | |
| HP Omen 16-xf0376ng | |
| Lenovo Legion Pro 5 16ARX8 | |
| Acer Nitro 16 AN16-41 | |
| AIDA64 / Memory Write | |
| HP Omen 16-xf0376ng | |
| Średnia w klasie Gaming (22297 - 135096, n=107, ostatnie 2 lata) | |
| MSI Stealth 16 Studio A13VG | |
| Gigabyte AERO 16 OLED BSF | |
| Przeciętny Intel Core i7-13700H (22986 - 99898, n=29) | |
| HP Victus 16-r0077ng | |
| Acer Nitro 16 AN16-41 | |
| Lenovo Legion Pro 5 16ARX8 | |
| AIDA64 / Memory Latency | |
| Średnia w klasie Gaming (75.3 - 259, n=107, ostatnie 2 lata) | |
| Gigabyte AERO 16 OLED BSF | |
| HP Victus 16-r0077ng | |
| Przeciętny Intel Core i7-13700H (82.4 - 136.8, n=29) | |
| Acer Nitro 16 AN16-41 | |
| HP Omen 16-xf0376ng | |
| MSI Stealth 16 Studio A13VG | |
| Lenovo Legion Pro 5 16ARX8 | |
* ... im mniej tym lepiej
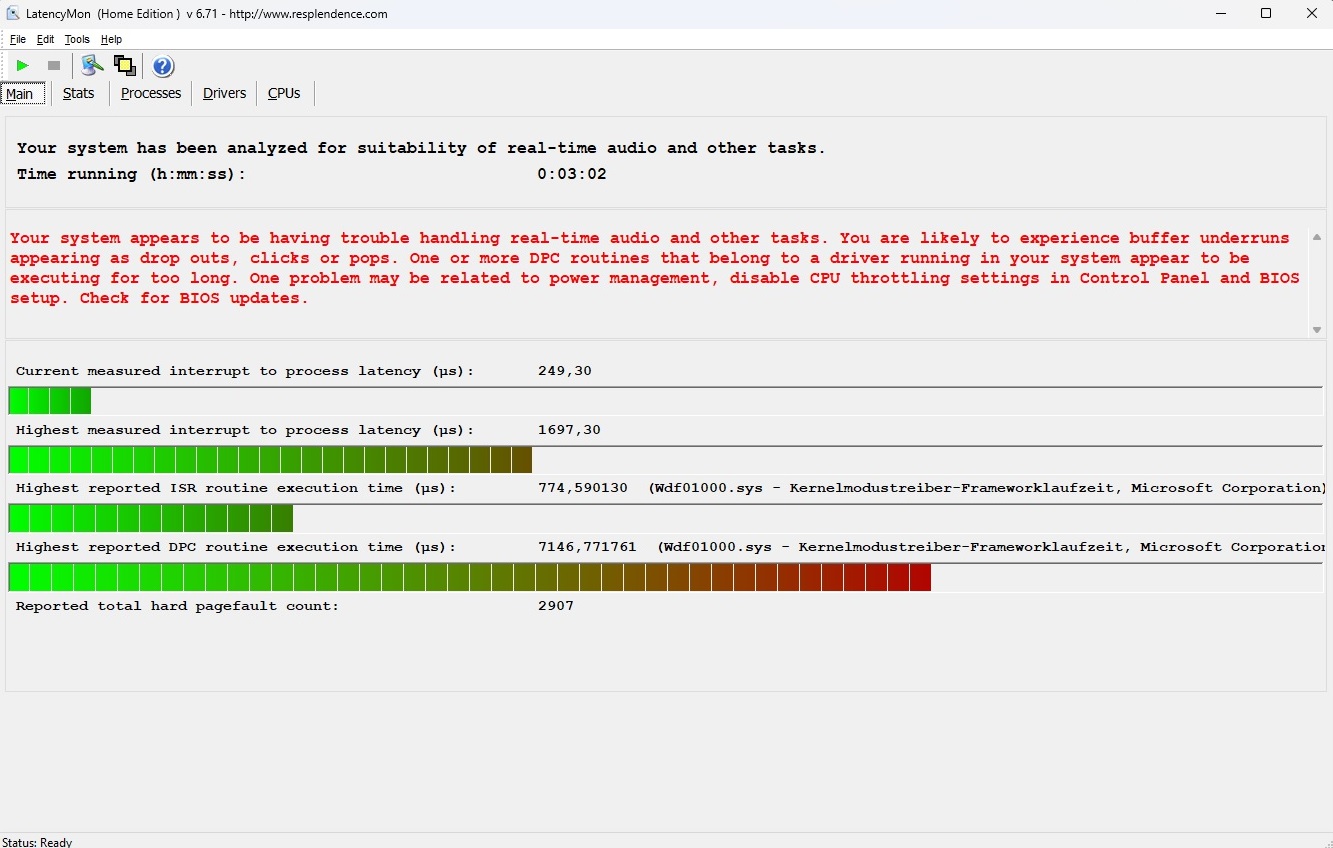
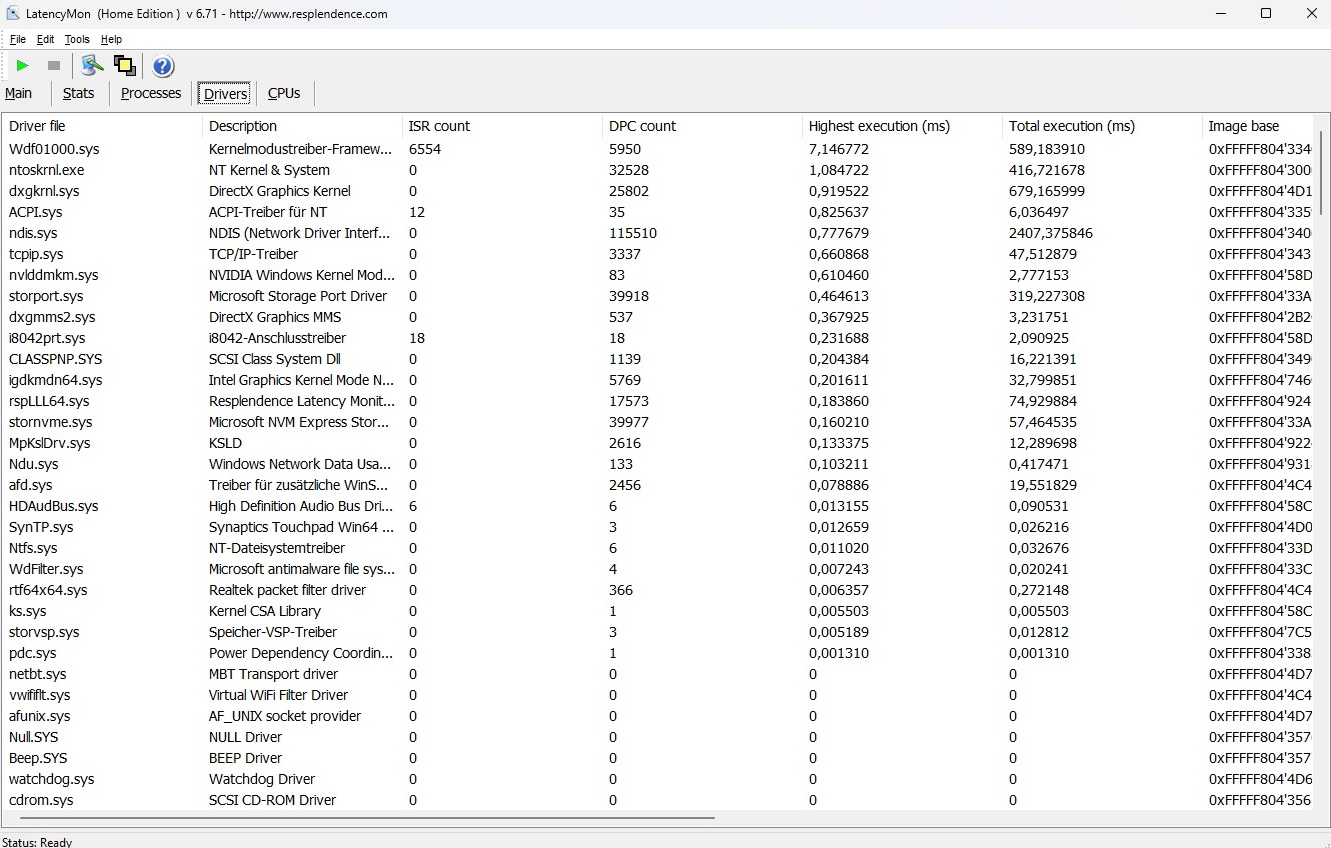
Opóźnienie DPC
Podobnie jak wielu innych konkurentów, Victus 16 również słabnie, jeśli chodzi o opóźnienia. Według narzędzia LatencyMon, użytkownicy mogą napotkać problemy z zadaniami wrażliwymi na opóźnienia, takimi jak edycja audio i wideo w czasie rzeczywistym.
| DPC Latencies / LatencyMon - interrupt to process latency (max), Web, Youtube, Prime95 | |
| MSI Stealth 16 Studio A13VG | |
| HP Omen 16-xf0376ng | |
| HP Victus 16-r0077ng | |
| Acer Nitro 16 AN16-41 | |
| Gigabyte AERO 16 OLED BSF | |
| Lenovo Legion Pro 5 16ARX8 | |
* ... im mniej tym lepiej
Urządzenia pamięci masowej
Ogólnie rzecz biorąc, wydajność SSD jest nieco niższa niż w przypadku Omena 16, pomimo większej pojemności (1000 GB vs 512 GB), która sama w sobie nie jest w stanie nadążyć za konkurencją. Nasza pętla DiskSpd pokazuje również, że dysk SSD Kioxia zainstalowany w Victus 16 traci prędkość po pewnym czasie pod obciążeniem, co można zaobserwować w innych laptopach.

* ... im mniej tym lepiej
Sustained Read Performance: DiskSpd Read Loop, Queue Depth 8
Karta graficzna
Ponieważ Nvidia była raczej oszczędna pod względem rozbudowy pamięci (ilość VRAM, interfejs) - jak wspomniano wcześniej - GeForce RTX 4070 jest daleko w tyle zaRTX 4080 i RTX 4090jeśli porównać wydajność wyłącznie z innymi notebookami z RTX 4070, Victus 16 nie jest zły. W syntetycznych benchmarkach graficznych 16-calowy model jest zmuszony do porażki z konkurencją, ale poprzednia średnia RTX 4070 jest nadal utrzymywana, zwłaszcza że HP nie ogranicza się do maksymalnego możliwego TGP wynoszącego 140 watów, ale ustawia go tylko na 120 watów.
| 3DMark 11 Performance | 33616 pkt. | |
| 3DMark Ice Storm Standard Score | 159379 pkt. | |
| 3DMark Cloud Gate Standard Score | 65316 pkt. | |
| 3DMark Fire Strike Score | 26013 pkt. | |
| 3DMark Time Spy Score | 11427 pkt. | |
Pomoc | ||
* ... im mniej tym lepiej
Wydajność w grach
W praktycznych testach gamingowych wydajność 3D również oscyluje wokół średniej RTX 4070. W natywnej rozdzielczości Full HD, Victus 16 jest w stanie płynnie uruchomić niemal wszystkie aktualne gry, nawet przy maksymalnych ustawieniach. Jedynie bardzo wymagające lub słabo zoptymalizowane tytuły, takie jak Immortals of Aveum czy Starfieldnie są w stanie osiągnąć więcej niż 60 FPS.
| The Witcher 3 - 1920x1080 Ultra Graphics & Postprocessing (HBAO+) | |
| Średnia w klasie Gaming (95 - 240, n=8, ostatnie 2 lata) | |
| Lenovo Legion Pro 5 16ARX8 | |
| MSI Stealth 16 Studio A13VG | |
| Gigabyte AERO 16 OLED BSF | |
| HP Victus 16-r0077ng | |
| Acer Nitro 16 AN16-41 | |
| Przeciętny NVIDIA GeForce RTX 4070 Laptop GPU (69.8 - 133.7, n=57) | |
| HP Omen 16-xf0376ng | |
| Immortals of Aveum - 1920x1080 Ultra AF:16x | |
| Przeciętny NVIDIA GeForce RTX 4070 Laptop GPU (46.1 - 49.9, n=4) | |
| HP Omen 16-xf0376ng | |
| HP Victus 16-r0077ng | |
| Atlas Fallen - 1920x1080 Very High Preset | |
| HP Omen 16-xf0376ng | |
| Przeciętny NVIDIA GeForce RTX 4070 Laptop GPU (105.3 - 111.1, n=4) | |
| HP Victus 16-r0077ng | |
| Armored Core 6 - 1920x1080 Maximum Preset | |
| HP Omen 16-xf0376ng | |
| Przeciętny NVIDIA GeForce RTX 4070 Laptop GPU (87.2 - 107, n=4) | |
| HP Victus 16-r0077ng | |
| Średnia w klasie Gaming (n=1ostatnie 2 lata) | |
| Atomic Heart - 1920x1080 Atomic Preset | |
| Acer Nitro 16 AN16-41 | |
| Przeciętny NVIDIA GeForce RTX 4070 Laptop GPU (70.4 - 79, n=4) | |
| HP Victus 16-r0077ng | |
| High On Life - 1920x1080 Very High Preset | |
| MSI Stealth 16 Studio A13VG | |
| Przeciętny NVIDIA GeForce RTX 4070 Laptop GPU (101.9 - 114, n=4) | |
| HP Victus 16-r0077ng | |
| Company of Heroes 3 - 1920x1080 Maximum Settings | |
| MSI Stealth 16 Studio A13VG | |
| Przeciętny NVIDIA GeForce RTX 4070 Laptop GPU (134 - 157.5, n=5) | |
| HP Victus 16-r0077ng | |
| Resident Evil 4 Remake - 1920x1080 Max Preset | |
| MSI Stealth 16 Studio A13VG | |
| Przeciętny NVIDIA GeForce RTX 4070 Laptop GPU (74.8 - 86.7, n=4) | |
| Acer Nitro 16 AN16-41 | |
| HP Victus 16-r0077ng | |
| Sons of the Forest - 1920x1080 Ultra Preset AA:T | |
| HP Victus 16-r0077ng | |
| HP Omen 16-xf0376ng | |
| Przeciętny NVIDIA GeForce RTX 4070 Laptop GPU (71.1 - 87.5, n=4) | |
| Baldur's Gate 3 - 1920x1080 Ultra Preset AA:T | |
| Średnia w klasie Gaming (59.4 - 246, n=106, ostatnie 2 lata) | |
| Przeciętny NVIDIA GeForce RTX 4070 Laptop GPU (66.7 - 128.5, n=30) | |
| HP Victus 16-r0077ng | |
| Ratchet & Clank Rift Apart - 1920x1080 Very High Preset AA:T | |
| Przeciętny NVIDIA GeForce RTX 4070 Laptop GPU (52.3 - 58.1, n=4) | |
| HP Victus 16-r0077ng | |
W naszej 60-minutowej Witcher 3nie wystąpiły żadne nieprawidłowości, takie jak spadki liczby klatek na sekundę. Wydajność nieznacznie spadła z czasem, ale pozostała dość stabilna.
Witcher 3 FPS chart
| low | med. | high | ultra | |
|---|---|---|---|---|
| GTA V (2015) | 180.9 | 175.7 | 112.8 | |
| The Witcher 3 (2015) | 114 | |||
| Dota 2 Reborn (2015) | 173.9 | 147.9 | 139.3 | 131.6 |
| Final Fantasy XV Benchmark (2018) | 145 | 109.3 | ||
| X-Plane 11.11 (2018) | 136 | 118.3 | 95.4 | |
| Strange Brigade (2018) | 224 | 192.4 | 192 | |
| High On Life (2023) | 166.2 | 126.7 | 101.9 | |
| Atomic Heart (2023) | 131.7 | 86.2 | 70.4 | |
| Company of Heroes 3 (2023) | 174 | 135 | 134 | |
| Sons of the Forest (2023) | 92.1 | 88.5 | 87.5 | |
| Resident Evil 4 Remake (2023) | 108.3 | 105.5 | 74.8 | |
| Ratchet & Clank Rift Apart (2023) | 72.5 | 58 | 52.3 | |
| Atlas Fallen (2023) | 133.8 | 126.7 | 106.6 | |
| Immortals of Aveum (2023) | 56 | 46.1 | ||
| Armored Core 6 (2023) | 102.5 | 101.9 | 97 | |
| Starfield (2023) | 62.3 | 51.2 | 46.6 | |
| The Crew Motorfest (2023) | 60 | 60 | 60 | |
| Baldur's Gate 3 (2023) | 115.2 | 99.1 | 95.4 |
Emisje
Hałas
Jeśli używasz trybu zrównoważonego , Victus 16 nie jest zbyt głośny. Około 46 dB(A) w Witcher 3 to wyraźnie słyszalny, ale nie ekstremalny poziom (w trybie Performance staje się irytująco głośny 56 dB). W sytuacjach bezczynności i nieszkodliwych zadaniach, takich jak praca biurowa, oglądanie filmów czy przeglądanie stron internetowych, wentylatory kręcą się zazwyczaj z głośnością 28-30 dB(A), czyli więcej niż u konkurencji. HP ma tutaj pole do poprawy.
Hałas
| luz |
| 28 / 29 / 30 dB |
| obciążenie |
| 43 / 48 dB |
 | ||
30 dB cichy 40 dB(A) słyszalny 50 dB(A) irytujący |
||
min: | ||
| HP Victus 16-r0077ng i7-13700H, GeForce RTX 4070 Laptop GPU | HP Omen 16-xf0376ng R7 7840HS, GeForce RTX 4070 Laptop GPU | Lenovo Legion Pro 5 16ARX8 R7 7745HX, GeForce RTX 4070 Laptop GPU | Acer Nitro 16 AN16-41 R7 7735HS, GeForce RTX 4070 Laptop GPU | Gigabyte AERO 16 OLED BSF i9-13900H, GeForce RTX 4070 Laptop GPU | MSI Stealth 16 Studio A13VG i7-13700H, GeForce RTX 4070 Laptop GPU | |
|---|---|---|---|---|---|---|
| Noise | 2% | 10% | 3% | -3% | 10% | |
| wyłączone / środowisko * (dB) | 25 | 24 4% | 23.2 7% | 25.7 -3% | 23 8% | 24 4% |
| Idle Minimum * (dB) | 28 | 25 11% | 23.2 17% | 25.7 8% | 23 18% | 24 14% |
| Idle Average * (dB) | 29 | 29 -0% | 23.2 20% | 25.7 11% | 23 21% | 24 17% |
| Idle Maximum * (dB) | 30 | 32 -7% | 26.2 13% | 26.3 12% | 33.64 -12% | 24 20% |
| Load Average * (dB) | 43 | 44 -2% | 31.4 27% | 33.9 21% | 51.49 -20% | 34.81 19% |
| Witcher 3 ultra * (dB) | 46 | 44 4% | 48.4 -5% | 55.27 -20% | 44.05 4% | |
| Load Maximum * (dB) | 48 | 46 4% | 53.8 -12% | 62 -29% | 55.24 -15% | 51.57 -7% |
* ... im mniej tym lepiej
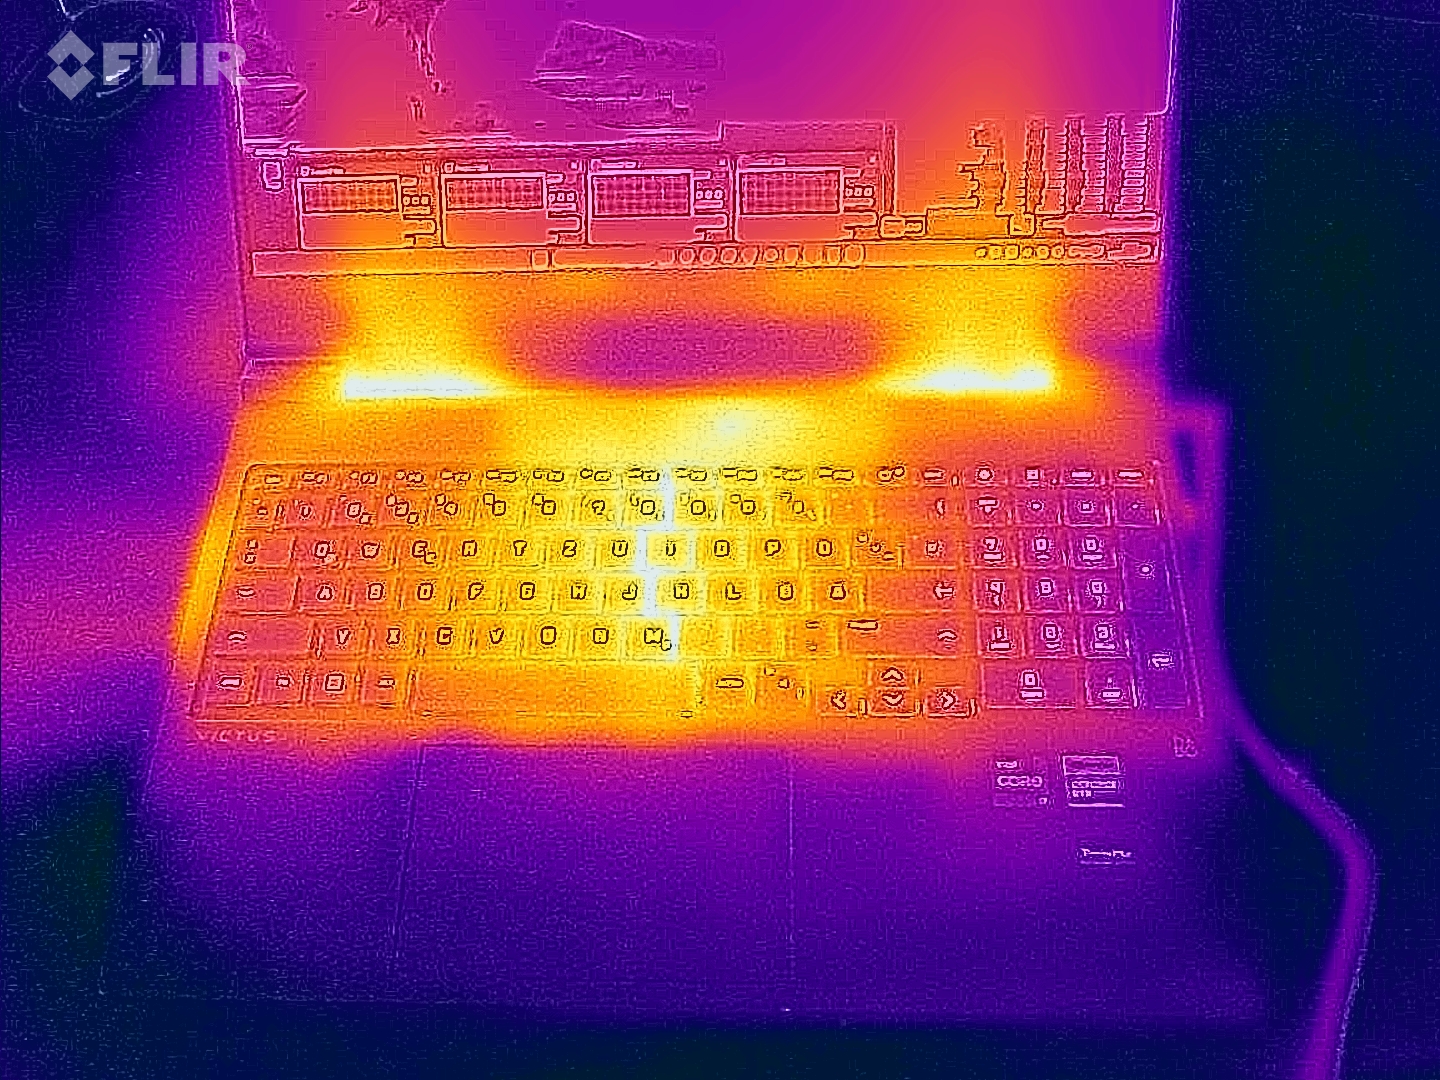
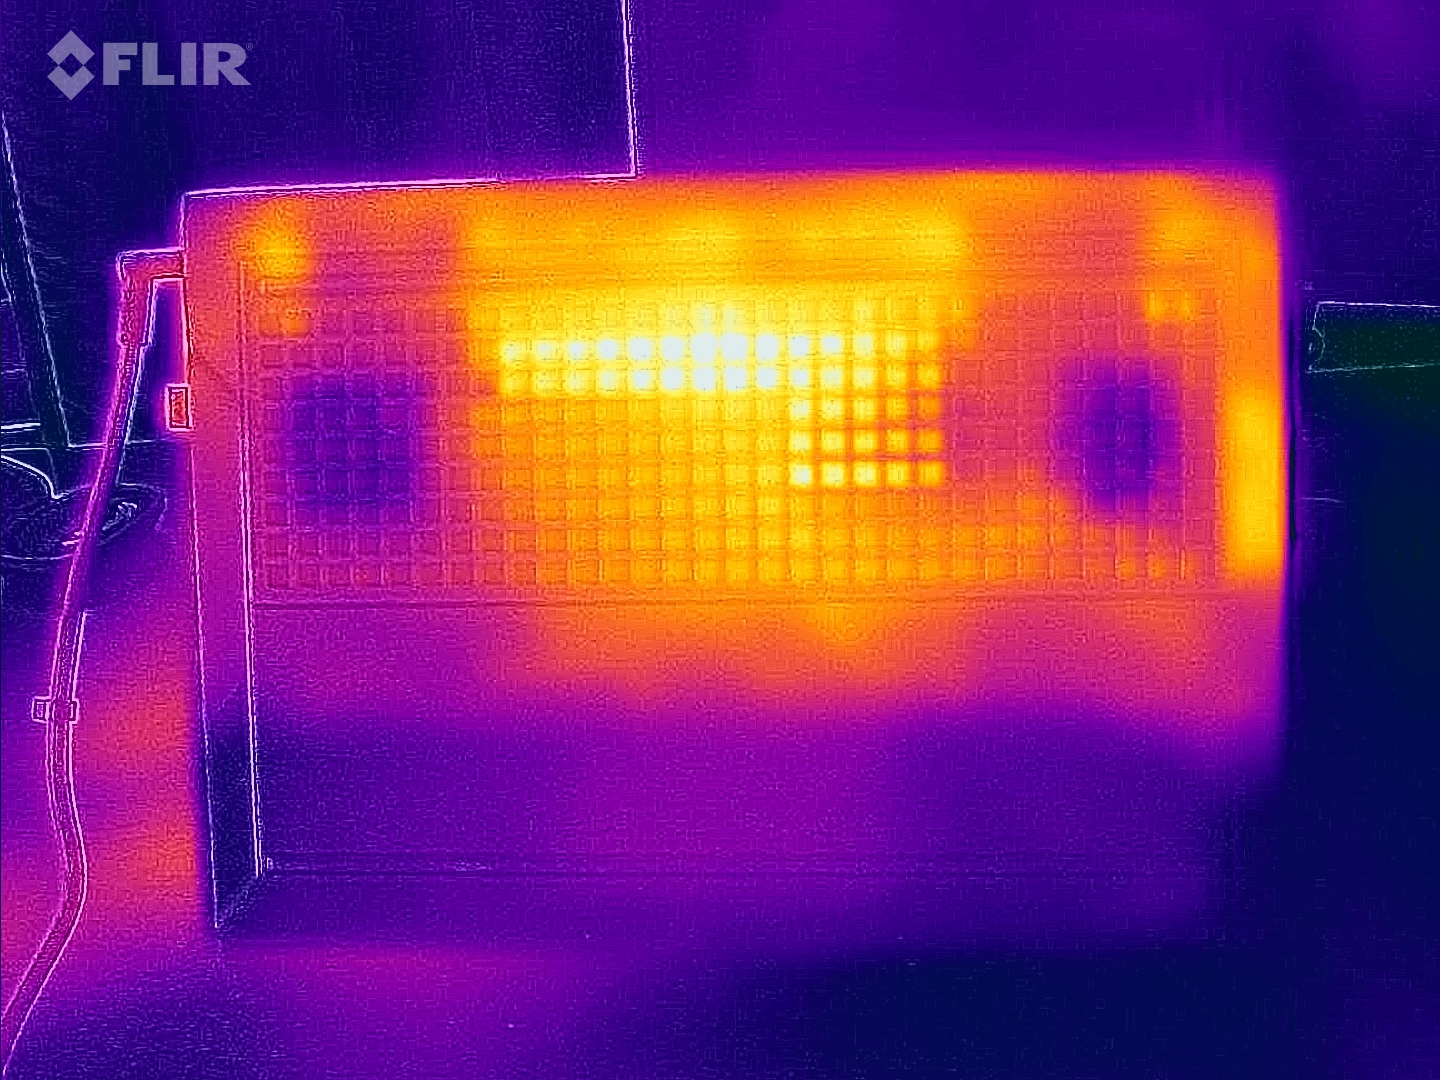
Temperatura
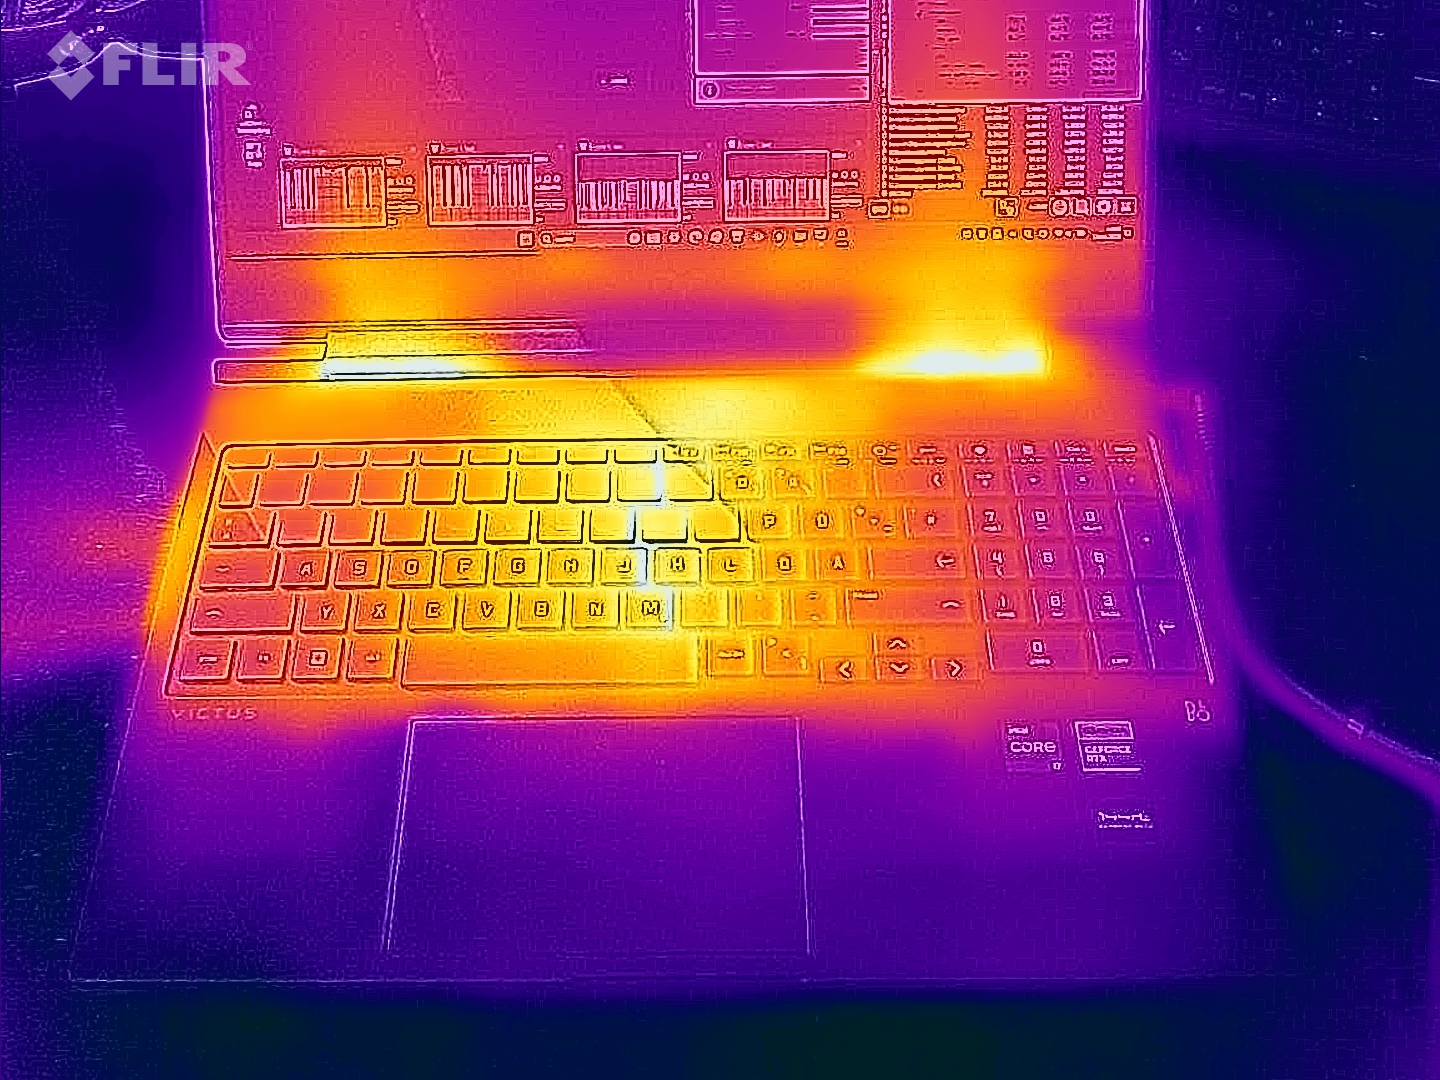
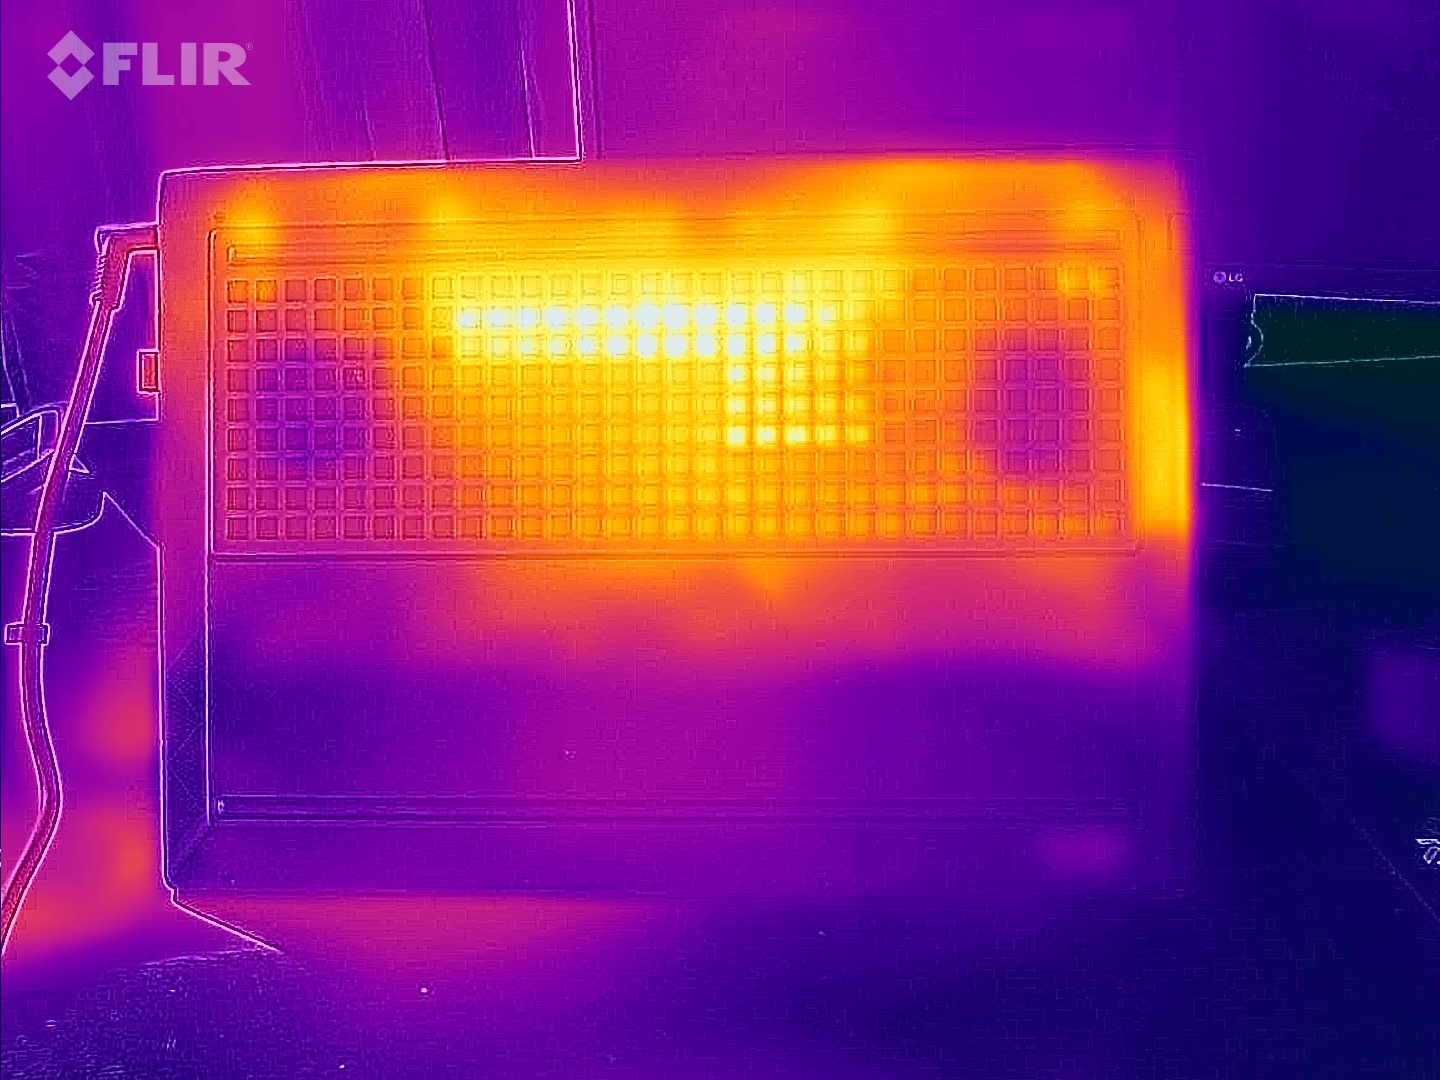
Temperatury są również nieco wyższe niż w przypadku większości urządzeń porównawczych, zarówno w trybie bezczynności, jak i pod obciążeniem. Po godzinie Witcher 3, górna część obudowy osiągnęła 52 °C, a dolna 54 °C, co przemawia na niekorzyść sesji gamingowych na kolanach. Przynajmniej obszar dłoni zawsze pozostaje w komfortowych regionach przy maksymalnie 33 °C.
(-) Maksymalna temperatura w górnej części wynosi 51 °C / 124 F, w porównaniu do średniej 40.4 °C / 105 F , począwszy od 21.2 do 68.8 °C dla klasy Gaming.
(-) Dno nagrzewa się maksymalnie do 54 °C / 129 F, w porównaniu do średniej 43.2 °C / 110 F
(+) W stanie bezczynności średnia temperatura górnej części wynosi 29.8 °C / 86 F, w porównaniu ze średnią temperaturą urządzenia wynoszącą 33.9 °C / ### class_avg_f### F.
(-) Podczas gry w Wiedźmina 3 średnia temperatura górnej części wynosi 41.6 °C / 107 F, w porównaniu do średniej temperatury urządzenia wynoszącej 33.9 °C / ## #class_avg_f### F.
(+) Podparcia dłoni i touchpad osiągają maksymalną temperaturę skóry (33 °C / 91.4 F) i dlatego nie są gorące.
(-) Średnia temperatura obszaru podparcia dłoni w podobnych urządzeniach wynosiła 28.8 °C / 83.8 F (-4.2 °C / -7.6 F).
| HP Victus 16-r0077ng i7-13700H, GeForce RTX 4070 Laptop GPU | HP Omen 16-xf0376ng R7 7840HS, GeForce RTX 4070 Laptop GPU | Lenovo Legion Pro 5 16ARX8 R7 7745HX, GeForce RTX 4070 Laptop GPU | Acer Nitro 16 AN16-41 R7 7735HS, GeForce RTX 4070 Laptop GPU | Gigabyte AERO 16 OLED BSF i9-13900H, GeForce RTX 4070 Laptop GPU | MSI Stealth 16 Studio A13VG i7-13700H, GeForce RTX 4070 Laptop GPU | |
|---|---|---|---|---|---|---|
| Heat | 2% | 15% | 5% | 23% | -16% | |
| Maximum Upper Side * (°C) | 51 | 49 4% | 41.8 18% | 41.5 19% | 41 20% | 60 -18% |
| Maximum Bottom * (°C) | 54 | 57 -6% | 41.4 23% | 51.8 4% | 47 13% | 61 -13% |
| Idle Upper Side * (°C) | 37 | 31 16% | 29 22% | 31.6 15% | 23 38% | 38.2 -3% |
| Idle Bottom * (°C) | 29 | 31 -7% | 30.4 -5% | 34.5 -19% | 23 21% | 37.7 -30% |
* ... im mniej tym lepiej
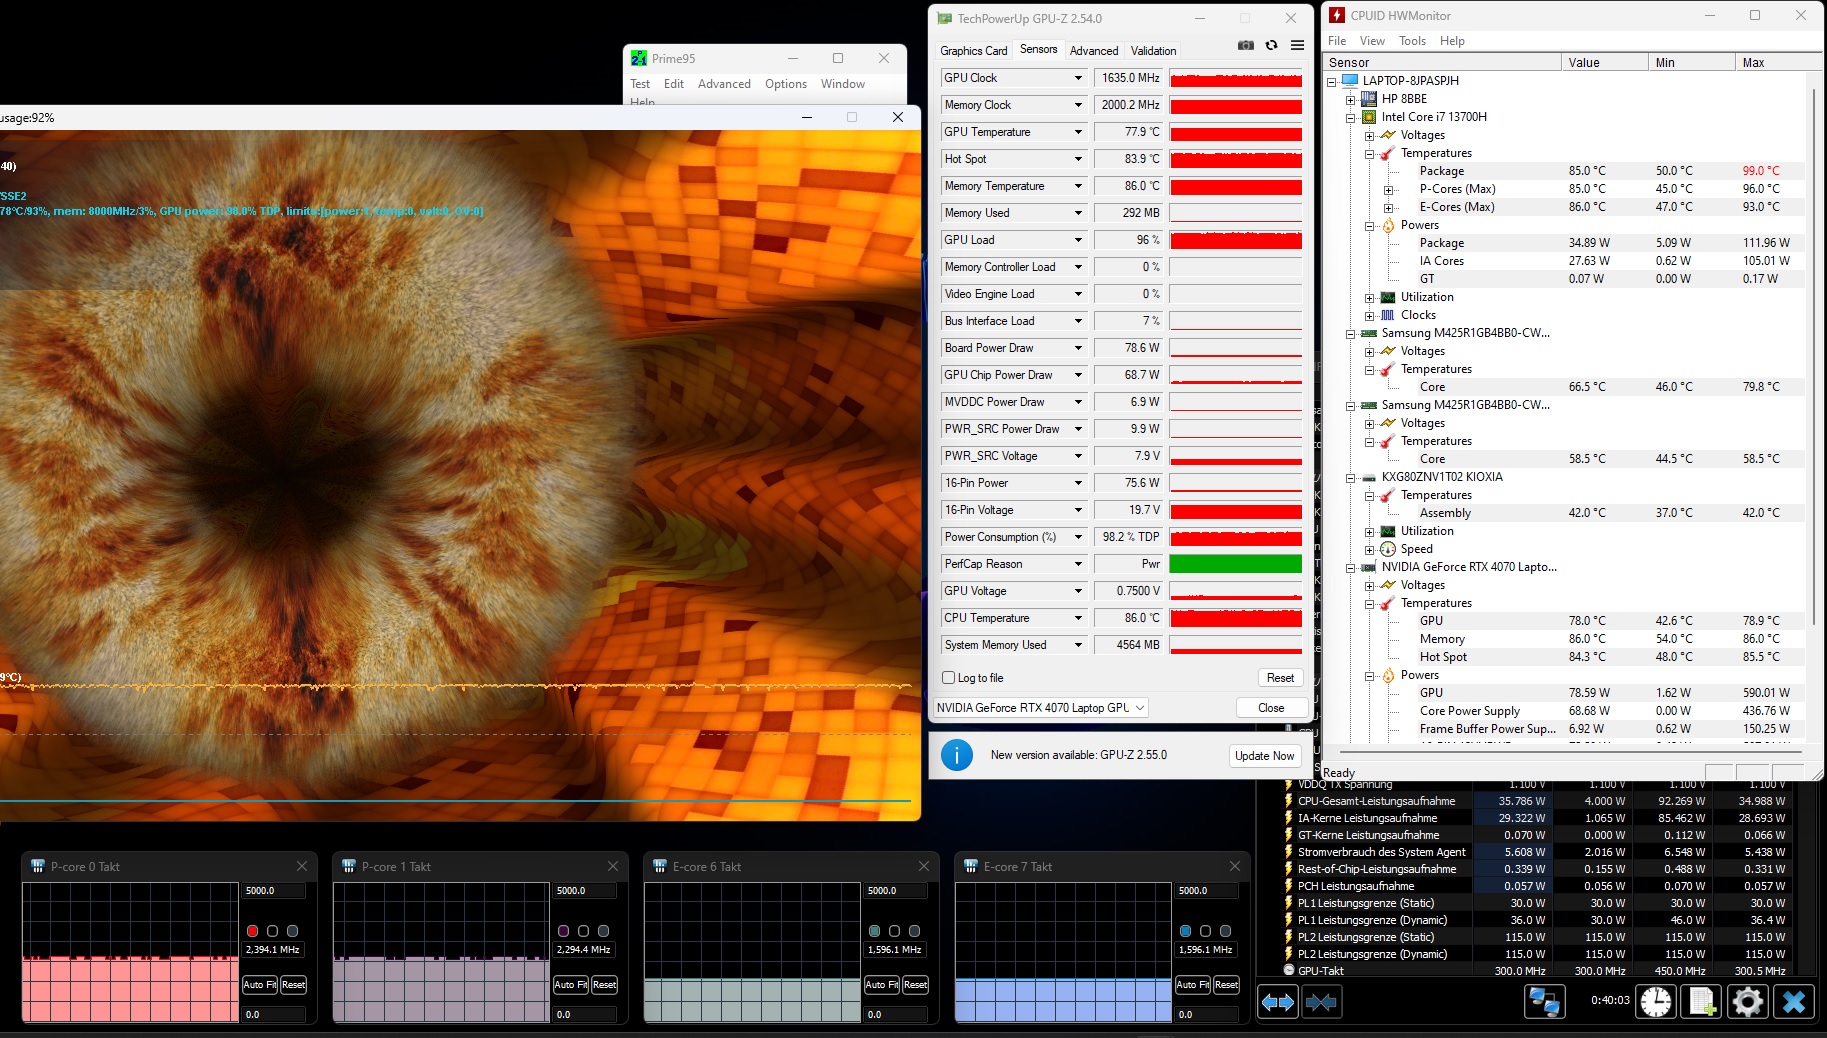
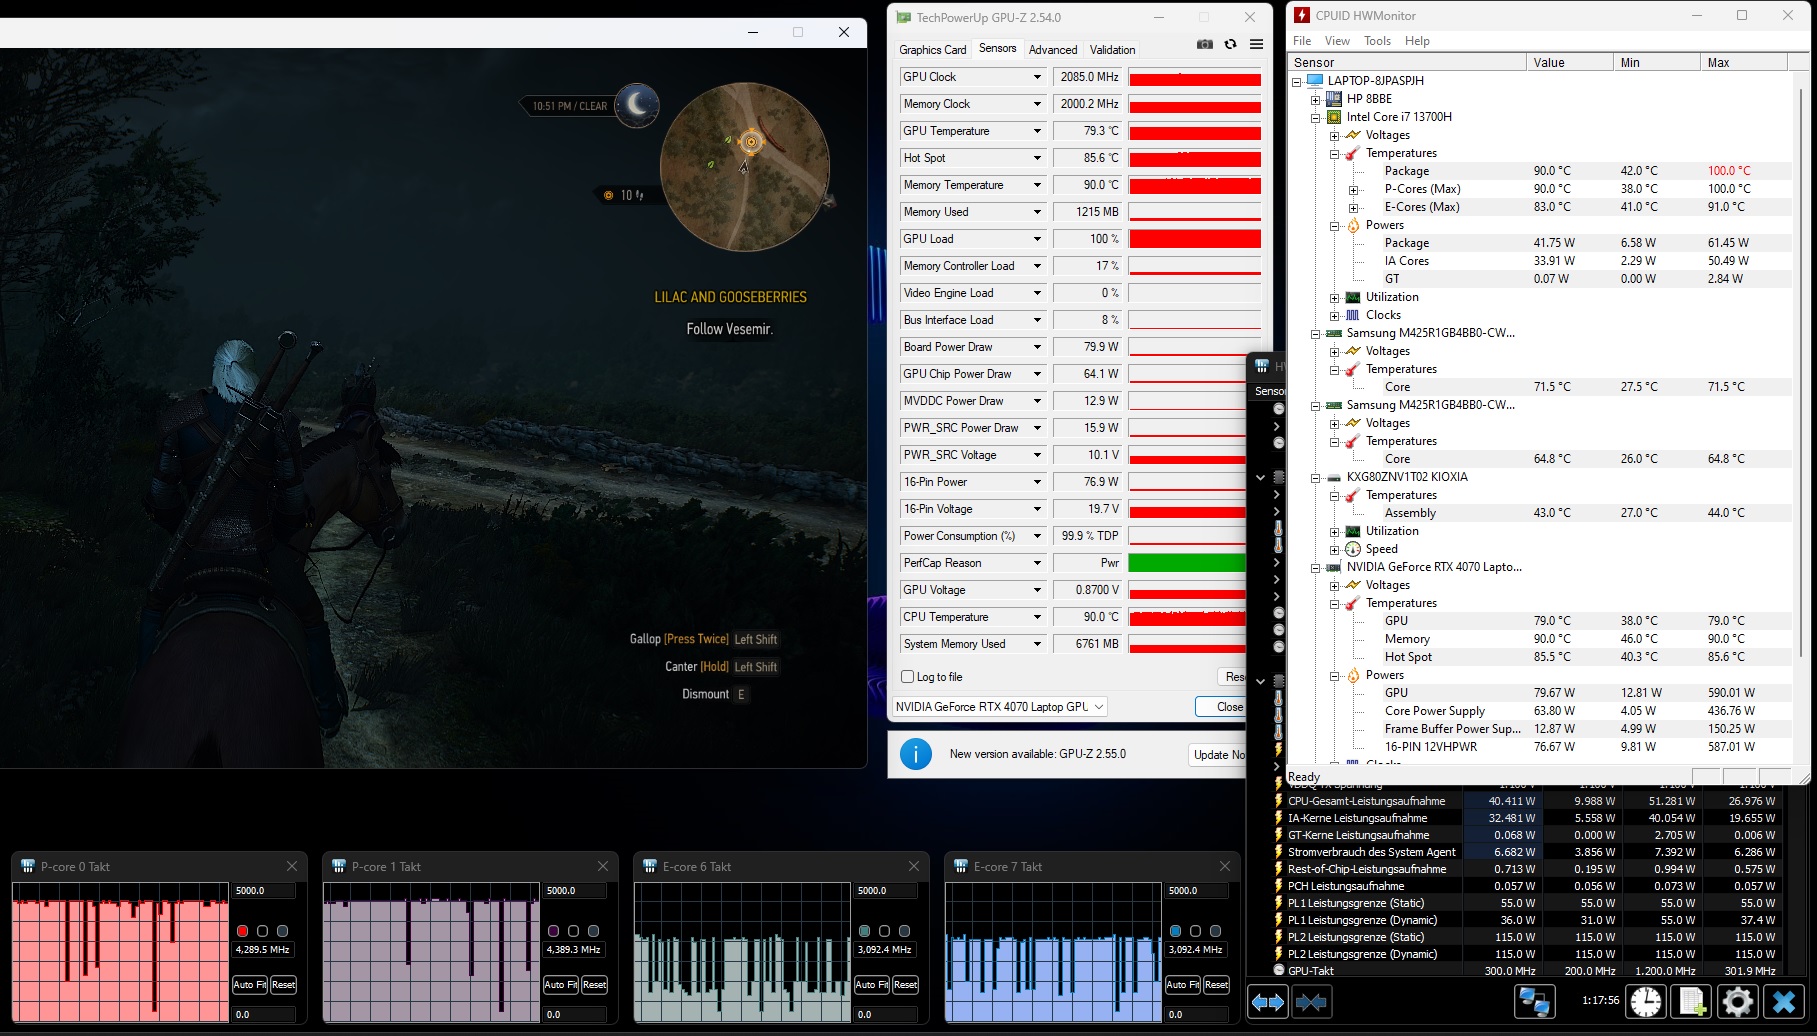
Test warunków skrajnych
System chłodzenia pozostawia nas z mieszanymi uczuciami. Pomimo tego, że Core i7-13700H pod pełnym obciążeniem pracuje tylko na swoim bazowym taktowaniu lub nieco poniżej niego, procesor nagrzewa się do około 85 °C. Sytuacja z kartą graficzną jest nieco spokojniejsza. Nieco poniżej 78 °C i taktowanie 1635 MHz po 60 minutach testów Furmark i Prime95 to solidny wynik.
Głośniki
HP Victus 16-r0077ng analiza dźwięku
(±) | głośność głośnika jest średnia, ale dobra (77 dB)
Bas 100 - 315 Hz
(-) | prawie brak basu - średnio 21.1% niższa od mediany
(±) | liniowość basu jest średnia (13.6% delta do poprzedniej częstotliwości)
Średnie 400 - 2000 Hz
(+) | zbalansowane środki średnie - tylko 1.3% od mediany
(+) | średnie są liniowe (2.7% delta do poprzedniej częstotliwości)
Wysokie 2–16 kHz
(+) | zrównoważone maksima - tylko 2.8% od mediany
(+) | wzloty są liniowe (5.3% delta do poprzedniej częstotliwości)
Ogólnie 100 - 16.000 Hz
(±) | liniowość ogólnego dźwięku jest średnia (15.8% różnicy w stosunku do mediany)
W porównaniu do tej samej klasy
» 37% wszystkich testowanych urządzeń w tej klasie było lepszych, 7% podobnych, 56% gorszych
» Najlepszy miał deltę 6%, średnia wynosiła ###średnia###%, najgorsza wynosiła 132%
W porównaniu do wszystkich testowanych urządzeń
» 24% wszystkich testowanych urządzeń było lepszych, 5% podobnych, 71% gorszych
» Najlepszy miał deltę 4%, średnia wynosiła ###średnia###%, najgorsza wynosiła 134%
HP Omen 16-xf0376ng analiza dźwięku
(±) | głośność głośnika jest średnia, ale dobra (81 dB)
Bas 100 - 315 Hz
(±) | zredukowany bas - średnio 14.9% niższy od mediany
(±) | liniowość basu jest średnia (13.6% delta do poprzedniej częstotliwości)
Średnie 400 - 2000 Hz
(±) | wyższe średnie - średnio 5.2% wyższe niż mediana
(+) | średnie są liniowe (4.7% delta do poprzedniej częstotliwości)
Wysokie 2–16 kHz
(+) | zrównoważone maksima - tylko 3.7% od mediany
(+) | wzloty są liniowe (6.6% delta do poprzedniej częstotliwości)
Ogólnie 100 - 16.000 Hz
(+) | ogólny dźwięk jest liniowy (14.6% różnicy w stosunku do mediany)
W porównaniu do tej samej klasy
» 28% wszystkich testowanych urządzeń w tej klasie było lepszych, 7% podobnych, 65% gorszych
» Najlepszy miał deltę 6%, średnia wynosiła ###średnia###%, najgorsza wynosiła 132%
W porównaniu do wszystkich testowanych urządzeń
» 19% wszystkich testowanych urządzeń było lepszych, 4% podobnych, 77% gorszych
» Najlepszy miał deltę 4%, średnia wynosiła ###średnia###%, najgorsza wynosiła 134%
Zarządzanie energią
Zużycie energii
Victus 16 pozytywnie wyróżnia się na tle konkurencji pod względem zużycia energii. Średni pobór mocy w trybie bezczynności wynosi 13 W, a w grach 142 W, co jest wartością niższą niż w większości porównywanych urządzeń. Dołączony 230-watowy zasilacz jest więc całkowicie wystarczający.
| wyłączony / stan wstrzymania | |
| luz | |
| obciążenie |
|
Legenda:
min: | |
| HP Victus 16-r0077ng i7-13700H, GeForce RTX 4070 Laptop GPU | HP Omen 16-xf0376ng R7 7840HS, GeForce RTX 4070 Laptop GPU | Lenovo Legion Pro 5 16ARX8 R7 7745HX, GeForce RTX 4070 Laptop GPU | Acer Nitro 16 AN16-41 R7 7735HS, GeForce RTX 4070 Laptop GPU | Gigabyte AERO 16 OLED BSF i9-13900H, GeForce RTX 4070 Laptop GPU | MSI Stealth 16 Studio A13VG i7-13700H, GeForce RTX 4070 Laptop GPU | Średnia w klasie Gaming | |
|---|---|---|---|---|---|---|---|
| Power Consumption | 3% | -24% | -20% | -10% | -10% | -31% | |
| Idle Minimum * (Watt) | 8 | 9 -13% | 8.1 -1% | 11.6 -45% | 11.8 -48% | 11 -38% | 13.2 ? -65% |
| Idle Average * (Watt) | 13 | 14 -8% | 15.9 -22% | 15.6 -20% | 16.1 -24% | 18 -38% | 18.9 ? -45% |
| Idle Maximum * (Watt) | 22 | 20 9% | 37.2 -69% | 16.5 25% | 17 23% | 19 14% | 24.5 ? -11% |
| Load Average * (Watt) | 86 | 84 2% | 90.9 -6% | 155 -80% | 100.6 -17% | 91 -6% | 108.8 ? -27% |
| Witcher 3 ultra * (Watt) | 141.8 | 140.9 1% | 189.6 -34% | 154.8 -9% | 158 -11% | 130 8% | |
| Load Maximum * (Watt) | 233 | 176 24% | 263.5 -13% | 205 12% | 192 18% | 228 2% | 254 ? -9% |
* ... im mniej tym lepiej
Power consumption Witcher 3 / Stress test
Power consumption with an external monitor
Żywotność baterii
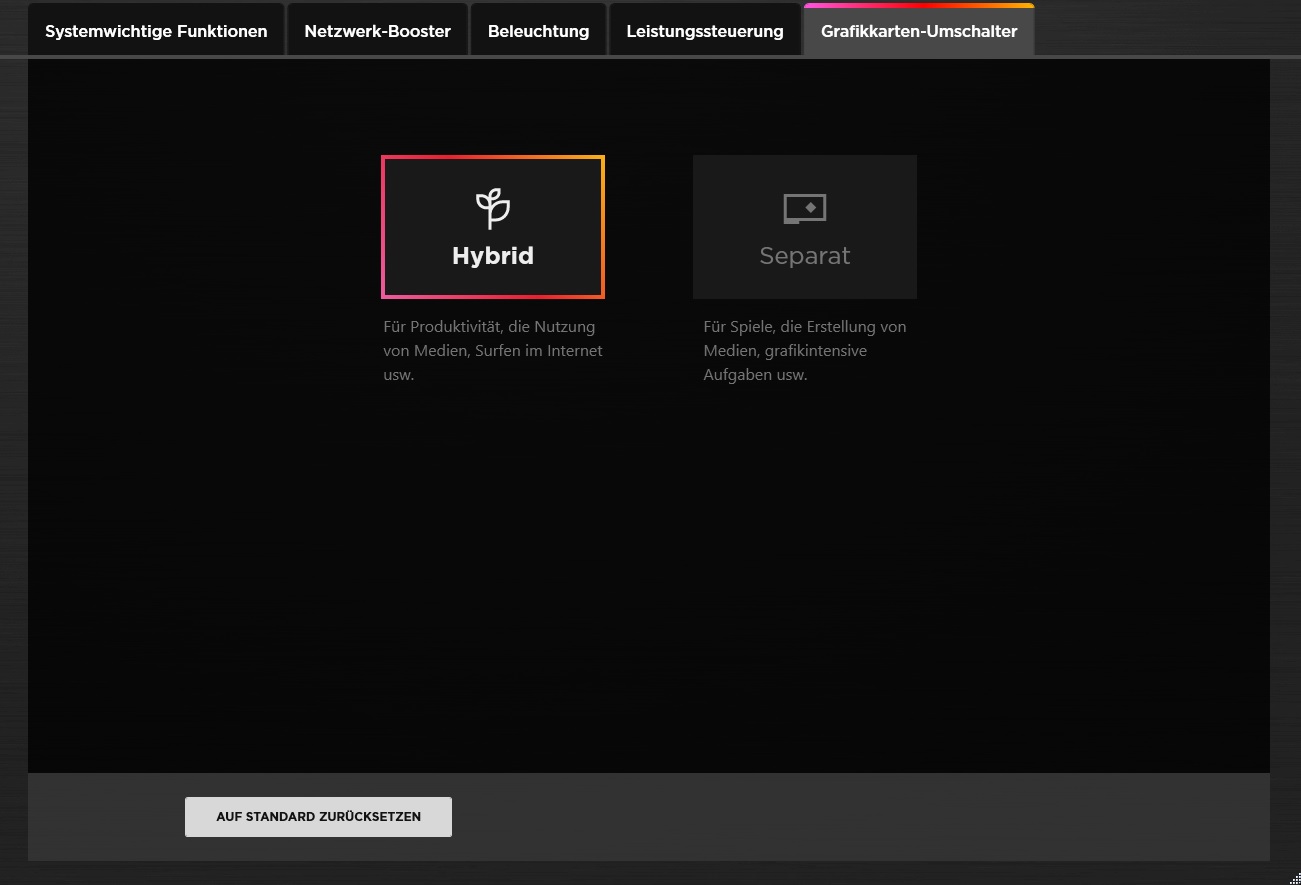
Dzięki aktywnemu przełączaniu grafiki Victus 16 wytrzymuje stosunkowo długi czas bez gniazdka elektrycznego jak na notebooka do gier. W praktycznym teście WLAN (jasność ustawiona na 150 cd/m²), 16-calowe urządzenie wytrzymało 426 minut, prawie 1,5 godziny dłużej niż porównywalny Omen 16, choć niektórzy konkurenci mają jeszcze dłuższe czasy pracy dzięki większym bateriom (Victus 16 oferuje 83 Wh).
| HP Victus 16-r0077ng i7-13700H, GeForce RTX 4070 Laptop GPU, 83 Wh | HP Omen 16-xf0376ng R7 7840HS, GeForce RTX 4070 Laptop GPU, 83 Wh | Lenovo Legion Pro 5 16ARX8 R7 7745HX, GeForce RTX 4070 Laptop GPU, 80 Wh | Acer Nitro 16 AN16-41 R7 7735HS, GeForce RTX 4070 Laptop GPU, 90 Wh | Gigabyte AERO 16 OLED BSF i9-13900H, GeForce RTX 4070 Laptop GPU, 88 Wh | MSI Stealth 16 Studio A13VG i7-13700H, GeForce RTX 4070 Laptop GPU, 99.9 Wh | Średnia w klasie Gaming | |
|---|---|---|---|---|---|---|---|
| Czasy pracy | -20% | -44% | 27% | 6% | 10% | -2% | |
| WiFi v1.3 (h) | 7.1 | 5.7 -20% | 4 -44% | 9 27% | 7.5 6% | 7.8 10% | 6.96 ? -2% |
| Reader / Idle (h) | 6.5 | 12.2 | 11 | 8.71 ? | |||
| Load (h) | 1 | 1.8 | 2.1 | 2.4 | 1.47 ? | ||
| H.264 (h) | 10.2 | 7.4 | 7.7 | 8.28 ? |
Za
Przeciw
Werdykt
Gdyby HP nie poszło drogą rozsądnych cen, Victus 16-r0077ng miałby dość trudną walkę z konkurencją. The Gigabyte Aero 16i Lenovo Legion Pro 5i Acer Nitro 16 i MSI Stealth 16 Studio wszystkie mają lepsze ogólne oceny, chociaż niektóre z nich kosztują znacznie więcej.
Jak na cenę początkową wynoszącą około 949,99 USD, Victus 16 wypada stosunkowo dobrze.
Chociaż plastikowa obudowa nie wygląda na szczególnie wysokiej jakości i musi obejść się bez Thunderbolt 4, to wyróżnia się klasycznym wzornictwem i użytecznymi urządzeniami wejściowymi. Większość kupujących powinna być również zadowolona z dokładnego odwzorowania kolorów wyświetlacza Full HD (144 Hz), chociaż jasność jest raczej słaba. Wydajność procesora Core i7-13700H i GeForce RTX 4070 generalnie spełnia oczekiwania, podczas gdy wartości emisji są nieco mieszane. W trybie zrównoważonym , który zalecamy do codziennego użytku, 16-calowy komputer nie jest zbyt głośny, ale dość ciepły.
Ogólnie rzecz biorąc, gracze zwracający uwagę na cenę nie mogą się tutaj pomylić. Jednak ci, którzy przywiązują większą wagę do jakości w poszczególnych obszarach lub chcą uzyskać lepsze wyniki, powinni raczej kupić jedno z konkurencyjnych urządzeń.
Cena i dostępność
Amerykański odpowiednik naszej konfiguracji recenzenckiej Victus 16 (Core i7-13700H, GeForce RTX 4070 i wyświetlacz 144 Hz) jest dostępny w sklepie internetowym HP za 1 439,99 USD.
Ceny są aktualne na dzień 26.09.2023 i mogą ulec zmianie.
HP Victus 16-r0077ng
- 25/09/2023 v7 (old)
Florian Glaser
Przezroczystość
Wyboru urządzeń do recenzji dokonuje nasza redakcja. Próbka testowa została udostępniona autorowi jako pożyczka od producenta lub sprzedawcy detalicznego na potrzeby tej recenzji. Pożyczkodawca nie miał wpływu na tę recenzję, producent nie otrzymał też kopii tej recenzji przed publikacją. Nie było obowiązku publikowania tej recenzji. Jako niezależna firma medialna, Notebookcheck nie podlega władzy producentów, sprzedawców detalicznych ani wydawców.
Tak testuje Notebookcheck
Każdego roku Notebookcheck niezależnie sprawdza setki laptopów i smartfonów, stosując standardowe procedury, aby zapewnić porównywalność wszystkich wyników. Od około 20 lat stale rozwijamy nasze metody badawcze, ustanawiając przy tym standardy branżowe. W naszych laboratoriach testowych doświadczeni technicy i redaktorzy korzystają z wysokiej jakości sprzętu pomiarowego. Testy te obejmują wieloetapowy proces walidacji. Nasz kompleksowy system ocen opiera się na setkach uzasadnionych pomiarów i benchmarków, co pozwala zachować obiektywizm.Price comparison

