


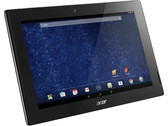
Recenzja Acer Iconia Tab 10 A3-A30
Iconia Tab 10 A3-A30 to tablet z 10-calowym ekranem WUXGA, dość wydajnym procesorem i systemem Android. Oto jego recenzja.
Intel Atom Z3735F, HD Graphics (Bay Trail), 10.1", 540 g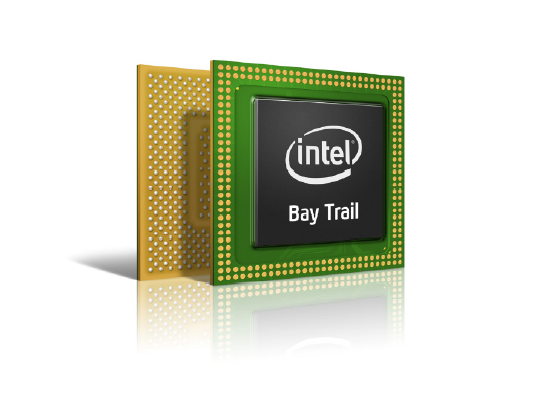
-
HD Graphics Rodzina
| ||||||||||||||||||||||||||||||||||||||||||||||||||||||||||||||||||||||
| Nazwa robocza | Bay Trail | |||||||||||||||||||||||||||||||||||||||||||||||||||||||||||||||||||||
| Architektura | Gen. 7 Ivy Bridge | |||||||||||||||||||||||||||||||||||||||||||||||||||||||||||||||||||||
| iGPU | Integrated Graphics | |||||||||||||||||||||||||||||||||||||||||||||||||||||||||||||||||||||
| Potoki | 4 - ZJC | |||||||||||||||||||||||||||||||||||||||||||||||||||||||||||||||||||||
| Zegar rdzenia | 311 - 896 (Boost) MHz | |||||||||||||||||||||||||||||||||||||||||||||||||||||||||||||||||||||
| Magistrala | 32/64/128 bit | |||||||||||||||||||||||||||||||||||||||||||||||||||||||||||||||||||||
| Pamięć współdzielona | tak | |||||||||||||||||||||||||||||||||||||||||||||||||||||||||||||||||||||
| API | DirectX 11, Shader 5.0, OpenGL 4.0, ES 3.0 | |||||||||||||||||||||||||||||||||||||||||||||||||||||||||||||||||||||
| Technologia | 22 nm | |||||||||||||||||||||||||||||||||||||||||||||||||||||||||||||||||||||
| Data premiery | 11.09.2013 | |||||||||||||||||||||||||||||||||||||||||||||||||||||||||||||||||||||
| ||||||||||||||||||||||||
Zamieszczone niżej wyniki pochodzą z testów zrecenzowanych laptopów. Należy pamiętać, że osiągi poszczególnych konfiguracji zależą od zastosowanej pamięci własnej karty (VRAM), zegarów karty (mogą być różne), procesora, ustawień systemu, sterowników i wersji systemu operacyjnego. Tym samym uzyskane wyniki nie muszą być reprezentatywne dla wszystkich laptopów wyposażonych w daną kartę graficzną. By uzyskać szczegółowe informacje o wynikach testów, należy kliknąć na podaną wartość liczbową (fps, czyli kl/s).


Więcej informacji w rankingu płynności w grach

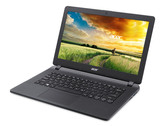
Acer Aspire ES1-111-C56A: Intel Celeron N2840, 11.60", 1.3 kg
Recenzja » Recenzja Acer Aspire ES1-111
Asus Transformer Book T200TA PL: Intel Atom Z3775, 11.60", 1.6 kg
Recenzja » Recenzja Asus Transformer Book T200TA
Lenovo B50-30: Intel Celeron N2815, 15.60", 2.2 kg
Recenzja » Recenzja Lenovo B50-30
Dell Venue 11 Pro 5130: Intel Atom Z3770, 10.80", 0.8 kg
Recenzja » Recenzja Dell Venue 11 Pro
HP Pavilion 11-n070eg x360: Intel Celeron N2820, 11.60", 1.5 kg
Recenzja » Recenzja HP Pavilion x360
Asus Transformer Book T100TA-C1-GR: Intel Atom Z3740, 10.10", 1.1 kg
Recenzja » Recenzja Asus Transformer Book T100TA
» Zestawienie mobilnych układów graficznych
» Mobilne karty graficzne - rozpiska osiągów
» Ranking kart graficznych w grach
» Mobilne procesory - rozpiska osiągów
» Układy graficzne na forum
* lokata szacunkowa
Error file "" empty