Recenzja Asus ROG Flow Z13 ACRNM - laptop konwertowalny dla graczy z RTX 4070
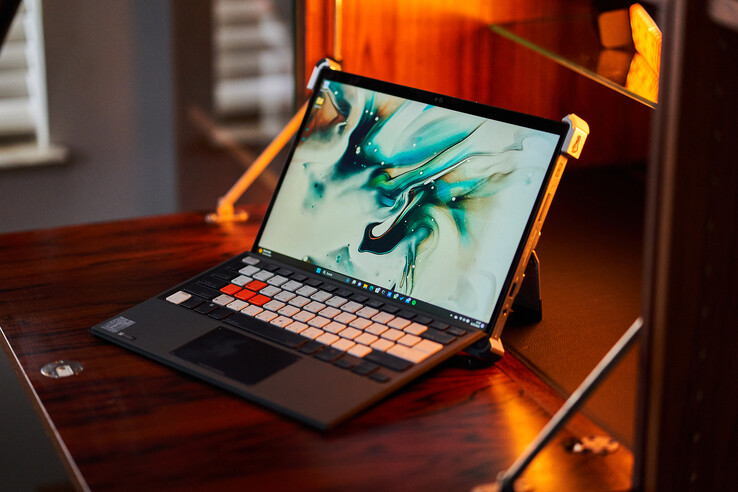
Asus ROG Flow Z13 to gamingowy tablet z wydajnym procesorem i dedykowaną kartą graficzną. Oprócz zwykłego modelu 2023 z procesorem Core i9-13900H i aż GeForce RTX 4060 Laptop, który obecnie również jest w recenzji, Asus oferuje również specjalną edycję we współpracy z niemiecką marką modową ACRONYM, która otrzymuje całkowicie przeprojektowaną obudowę, a także mocniejszy GeForce RTX 4070 Laptop. Recenzujemy ten gamingowy kabriolet, aby dowiedzieć się, czy cena 3400 euro jest uzasadniona. Kabriolet posiada również 13,4-calowy ekran WQHD IPS o częstotliwości odświeżania 165 Hz, 32 GB LPDDR5-RAM, a także kompaktowy dysk SSD 1 TB M.2-2230, który można wymienić.
Możliwe jest również wykorzystanie gamingowego kabrioletu z zewnętrznym GPU Asus XG Mobile z RTX 4090 Laptop, ale to bardzo droga opcja za 2500 euro. W trakcie recenzji zamieścimy też kilka benchmarków eGPU.
Potencjalni konkurenci w porównaniu
Ocena | Data | Model | Waga | Wysokość | Rozmiar | Rezolucja | Cena |
|---|---|---|---|---|---|---|---|
| 89.4 % v7 (old) | 04/2023 | Asus ROG Flow Z13 ACRNM i9-13900H, GeForce RTX 4070 Laptop GPU | 1.7 kg | 20 mm | 13.40" | 2560x1600 | |
| 86.8 % v7 (old) | Asus ROG Flow Z13 GZ301ZE i9-12900H, GeForce RTX 3050 Ti Laptop GPU | 1.2 kg | 12 mm | 13.40" | 1920x1200 | ||
| 86.7 % v7 (old) | Alienware x14 i7 RTX 3060 i7-12700H, GeForce RTX 3060 Laptop GPU | 1.8 kg | 14.5 mm | 14.00" | 1920x1080 | ||
| 89.4 % v7 (old) | Razer Blade 14 Ryzen 9 6900HX R9 6900HX, GeForce RTX 3070 Ti Laptop GPU | 1.8 kg | 16.8 mm | 14.00" | 2560x1440 | ||
| 86.7 % v7 (old) | Asus ROG Zephyrus G14 GA402RK R9 6900HS, Radeon RX 6800S | 1.7 kg | 19.5 mm | 14.00" | 2560x1600 |
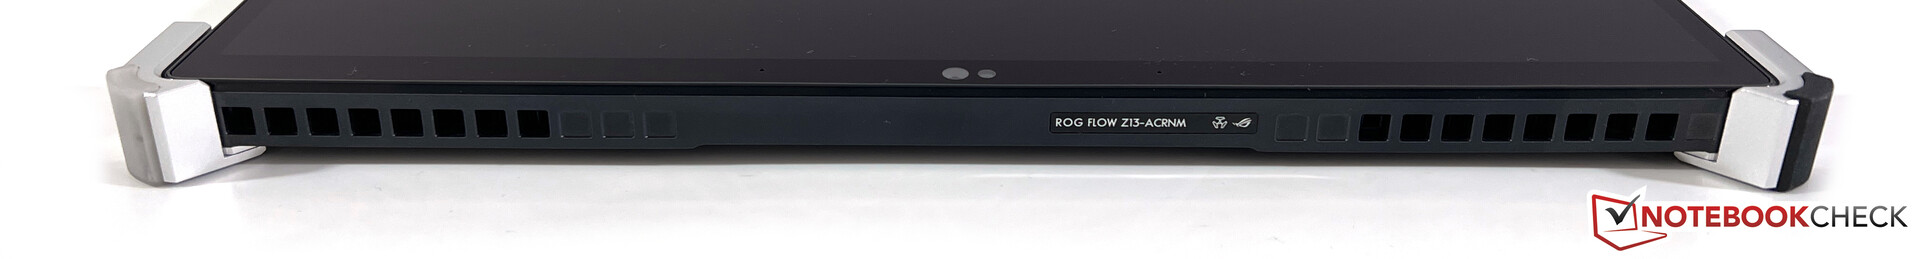
Obudowa - Flow Z13 z efektowną aluminiową obudową
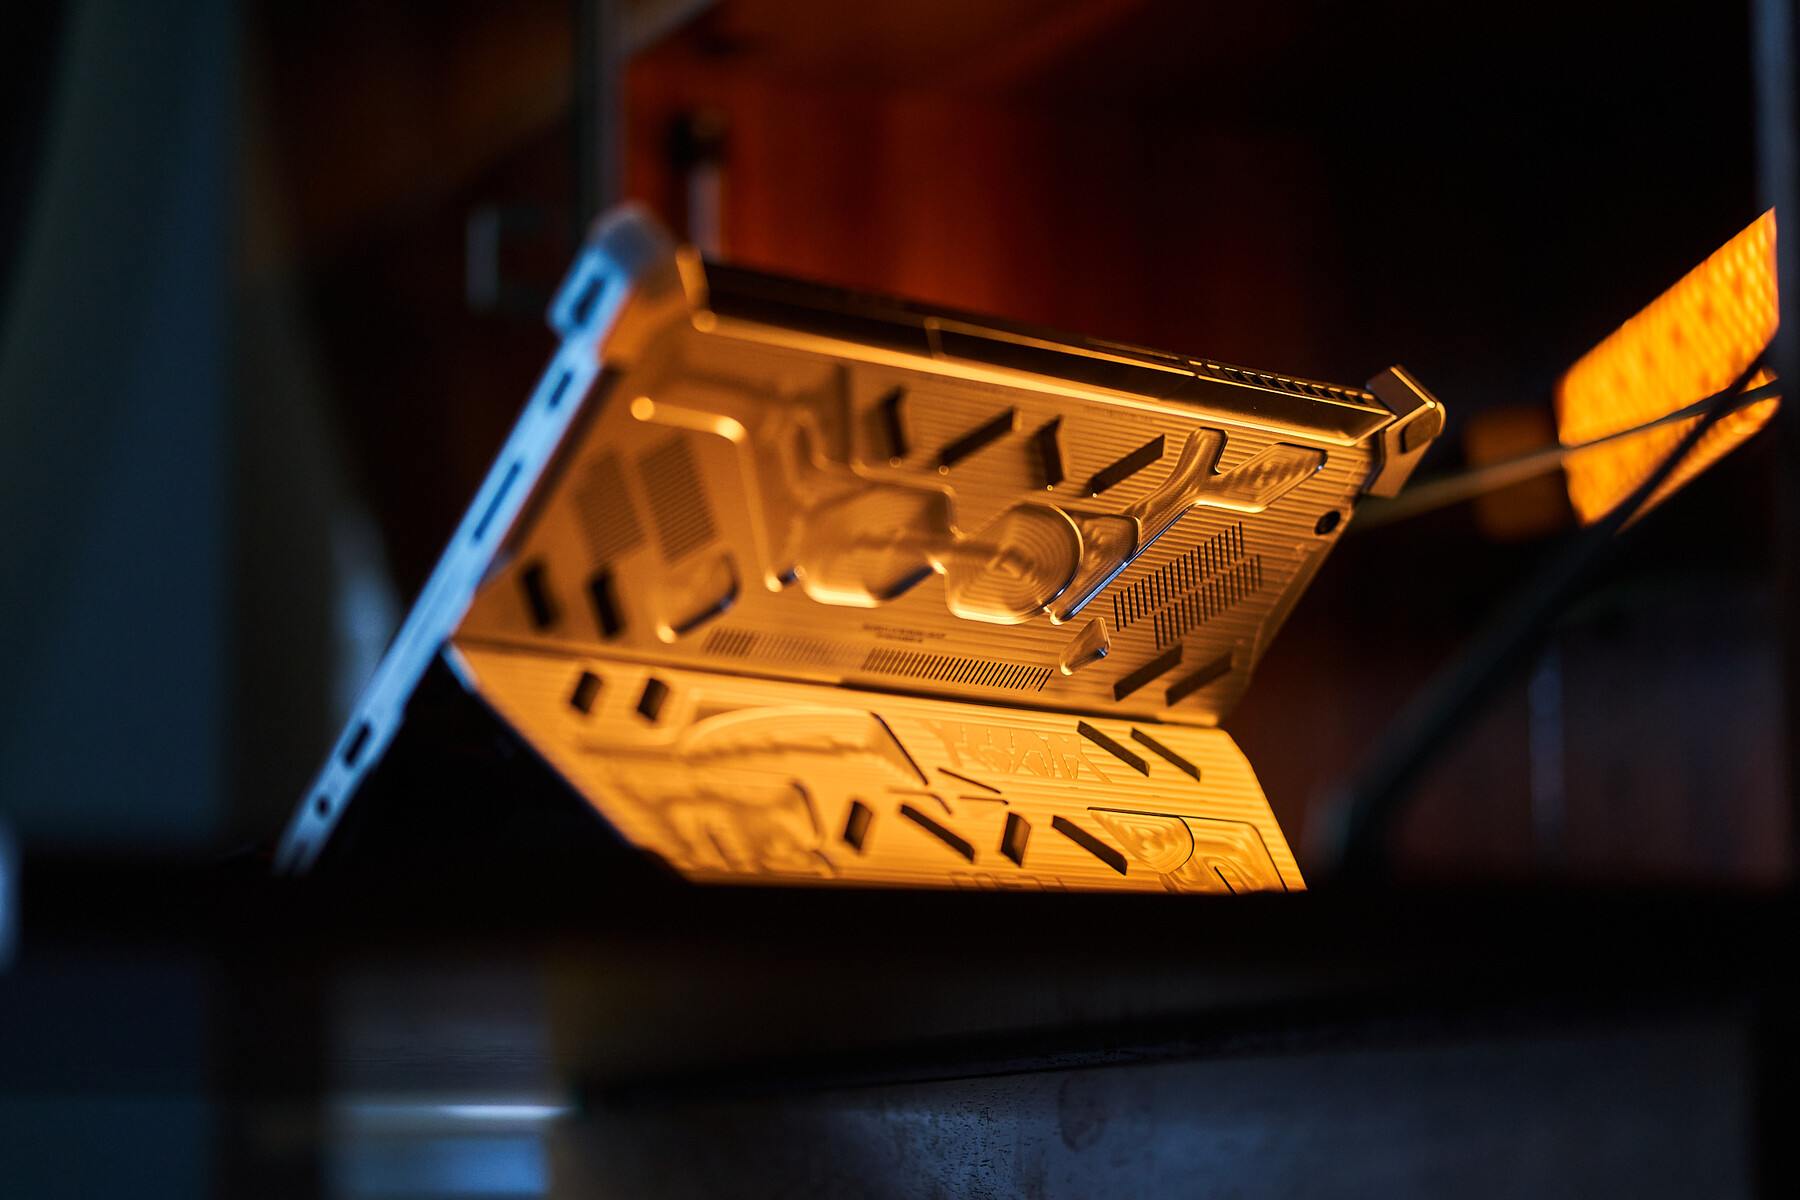
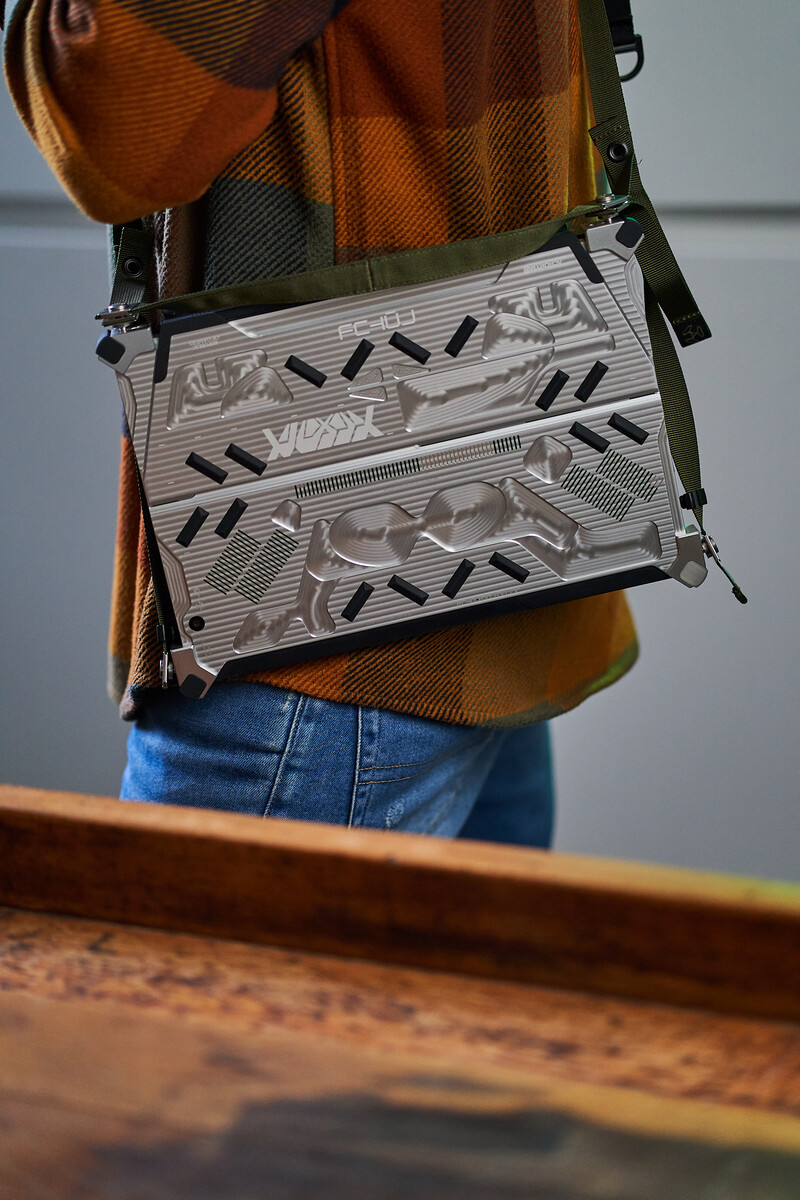
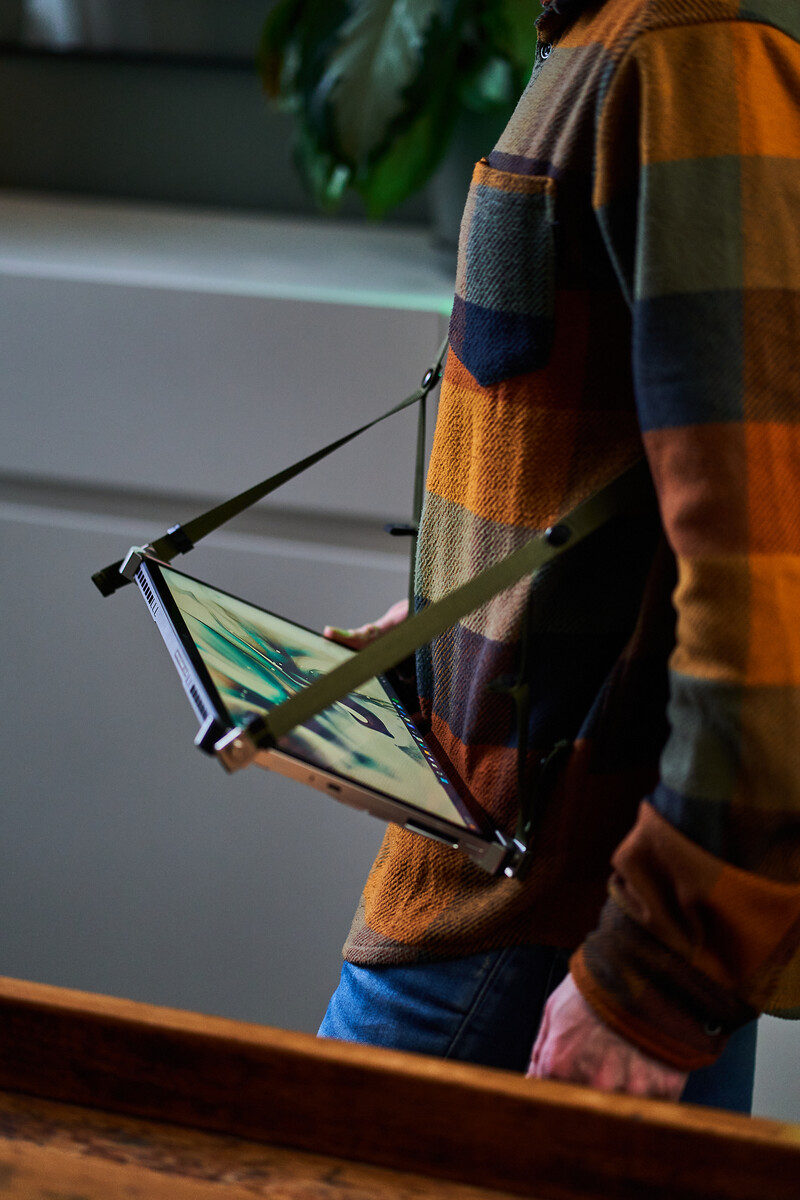
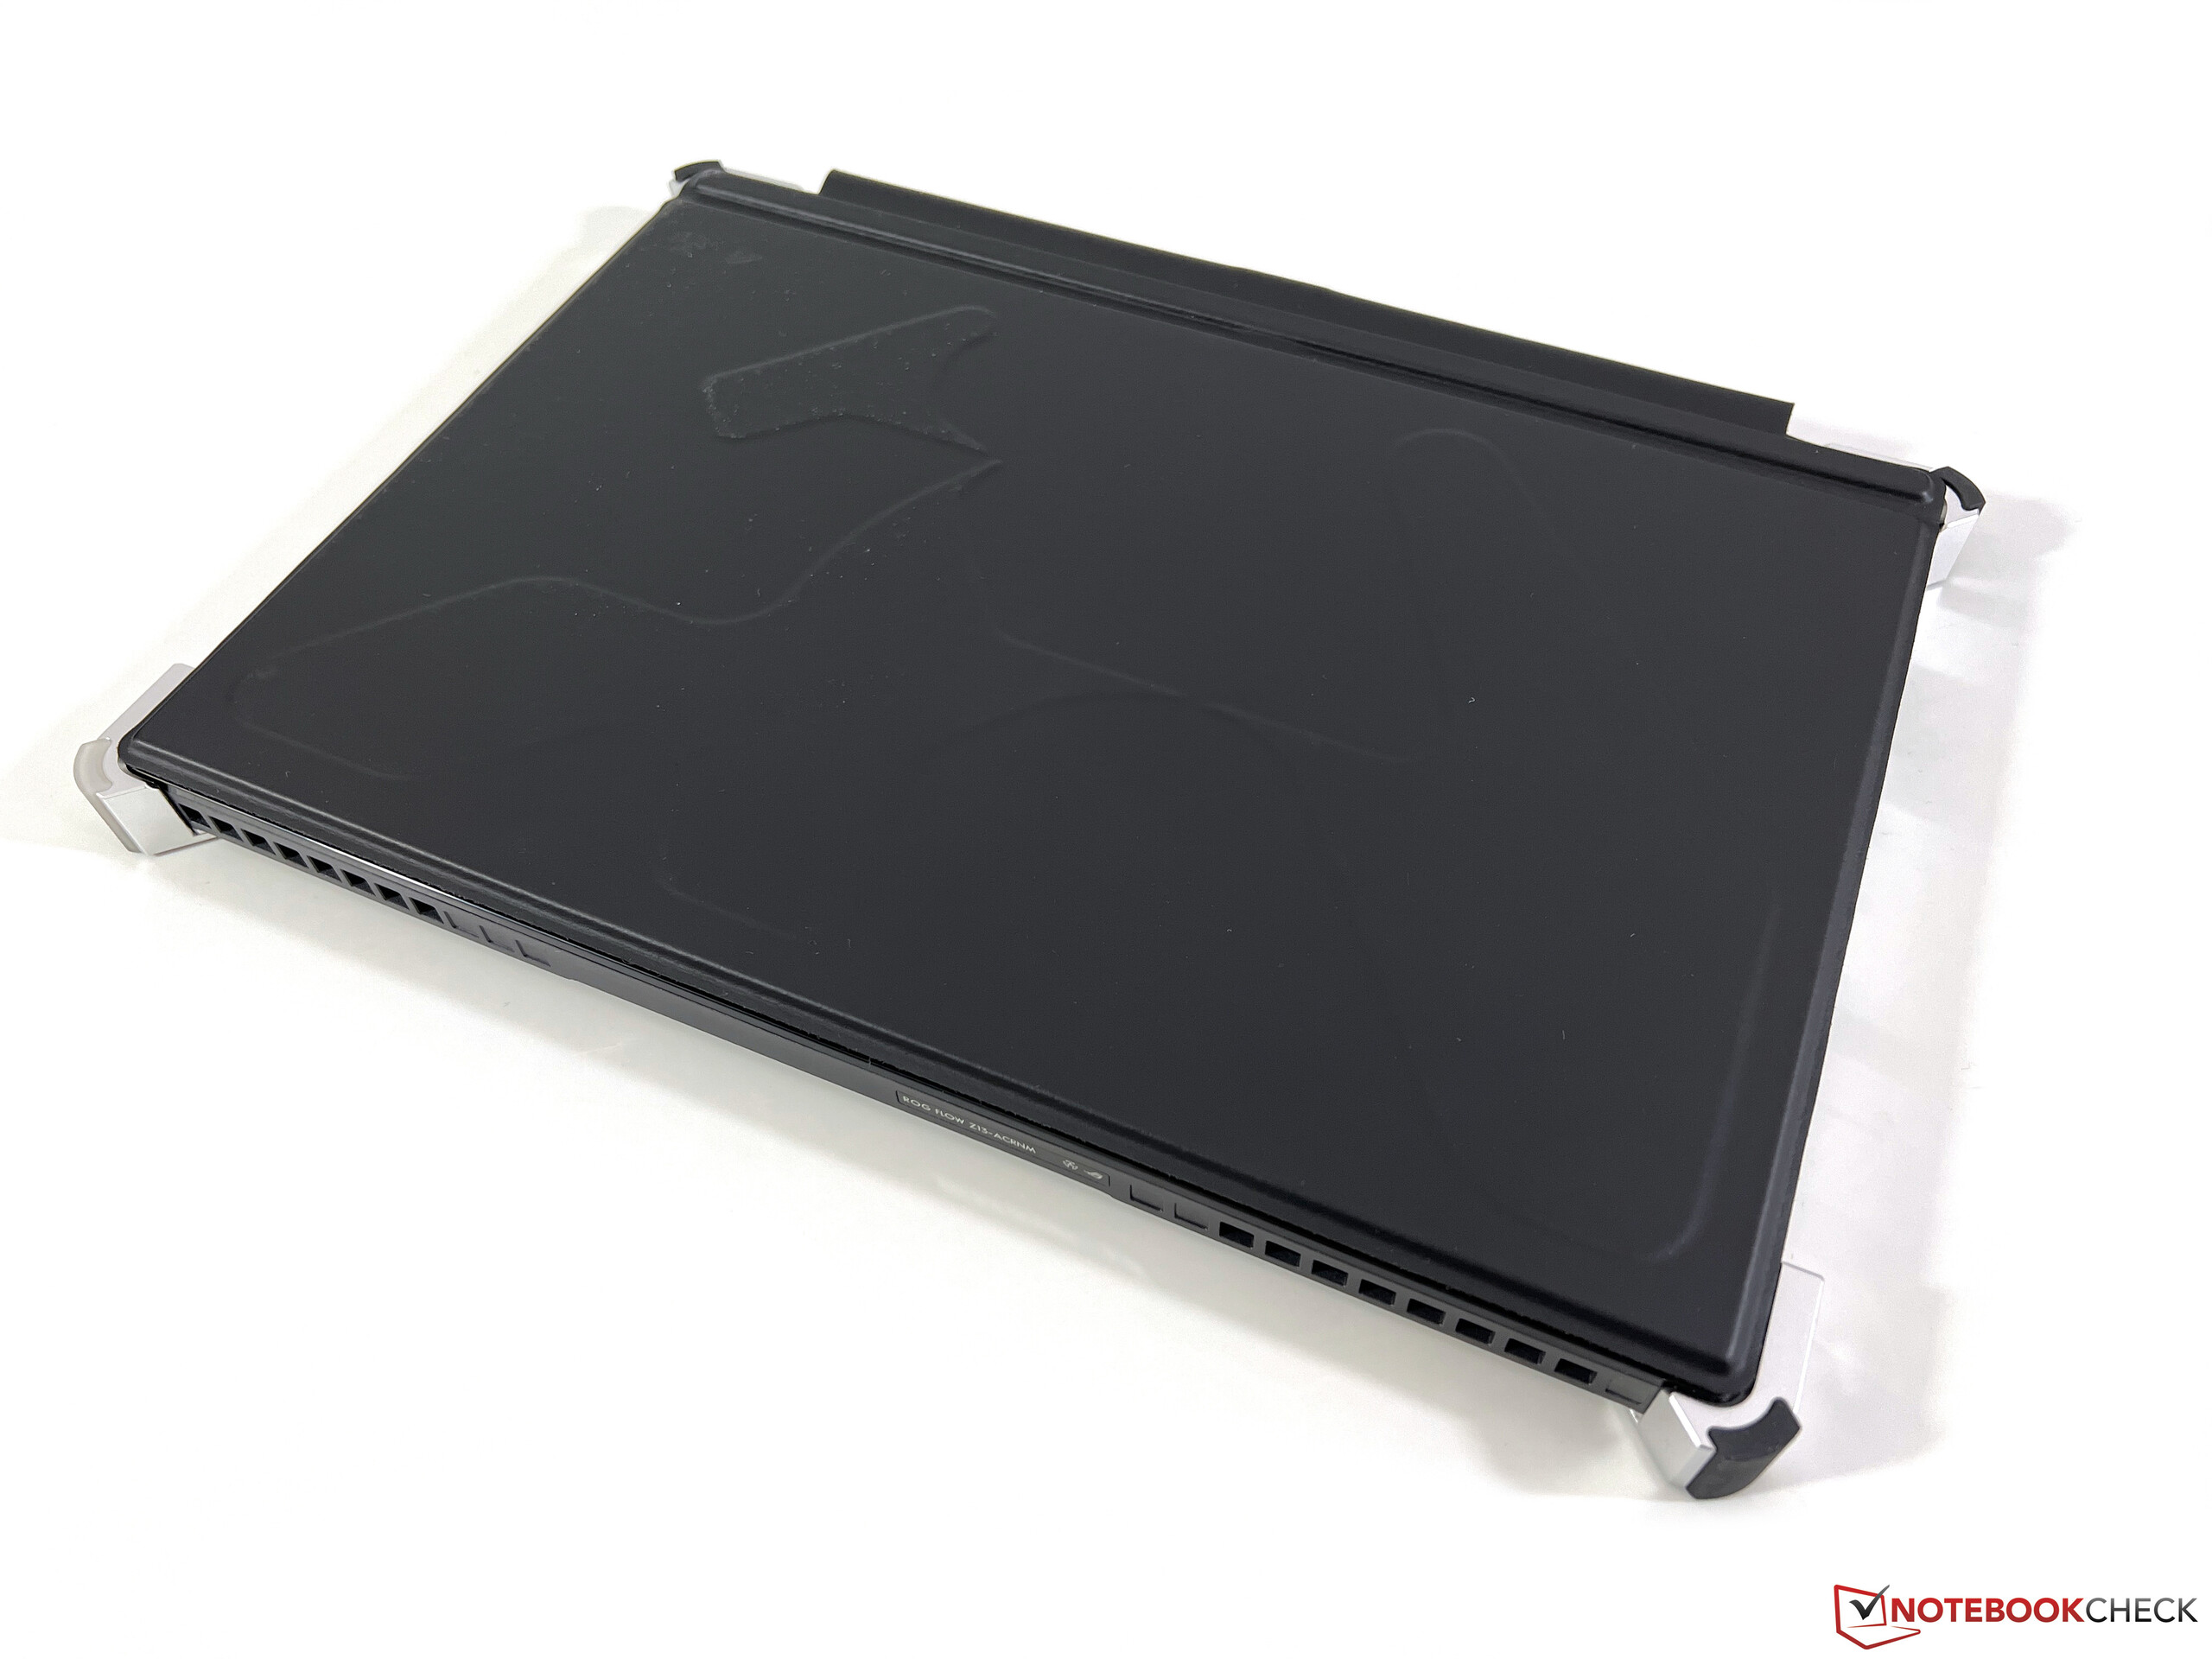
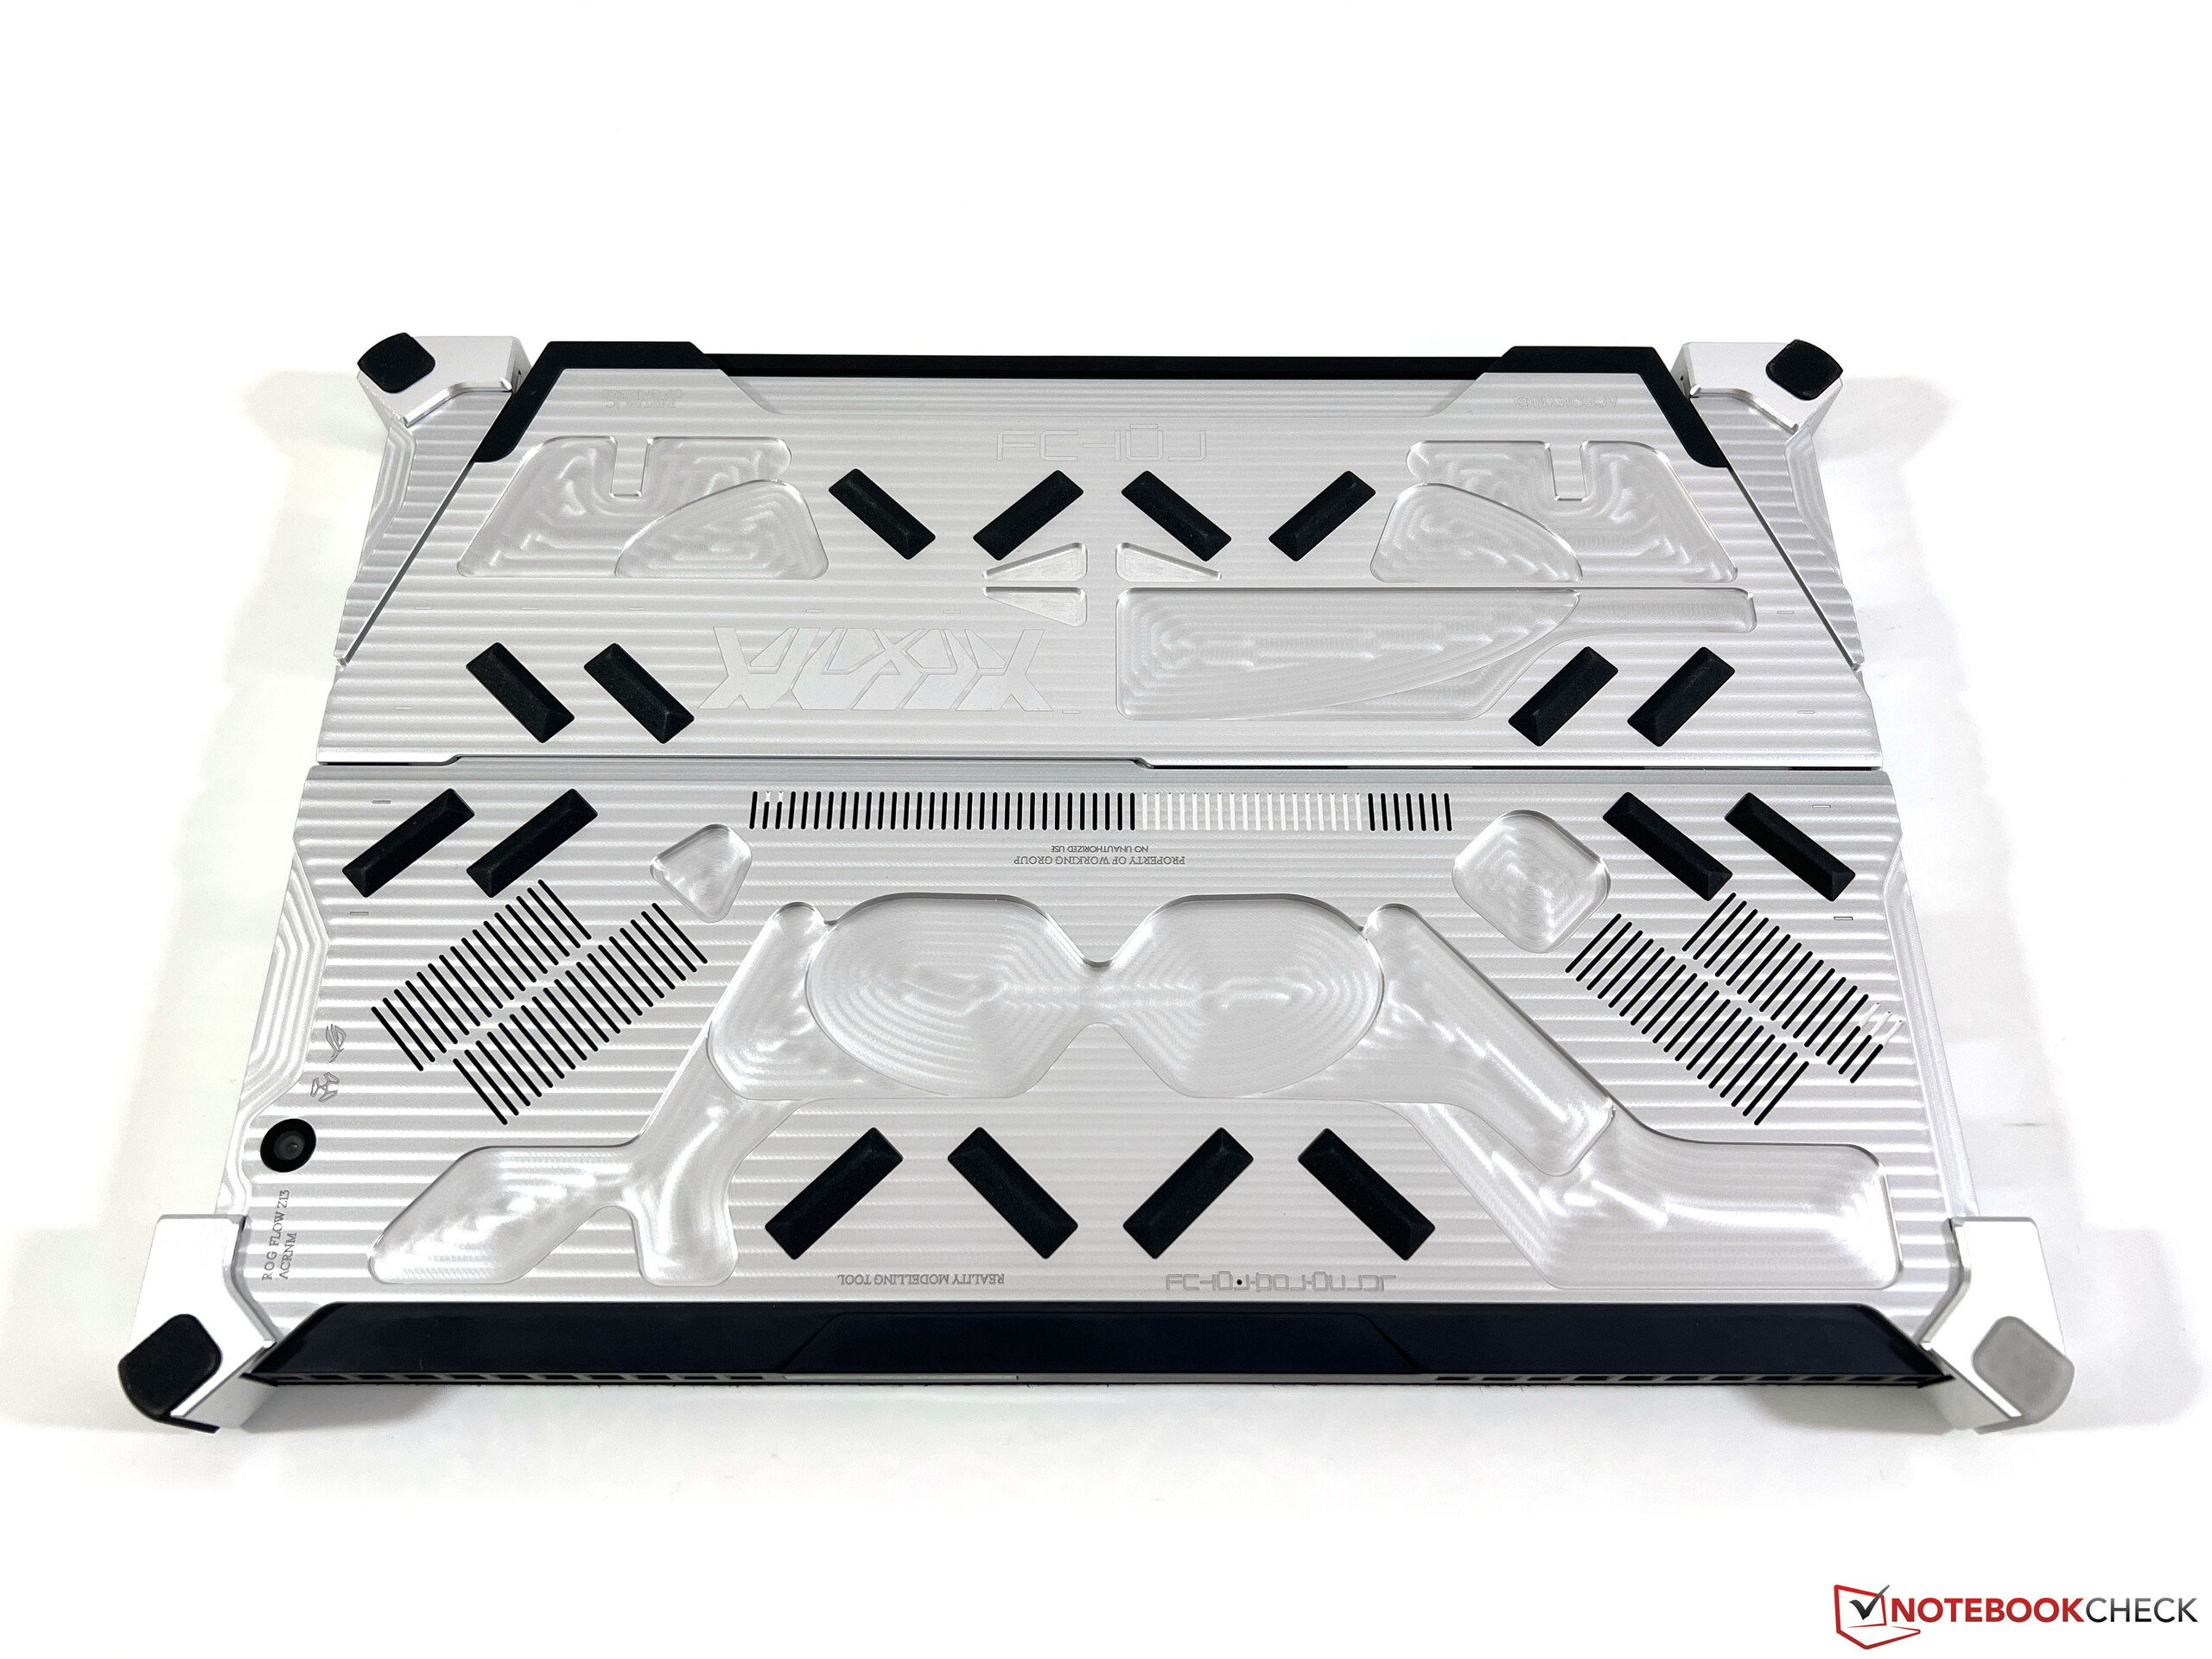
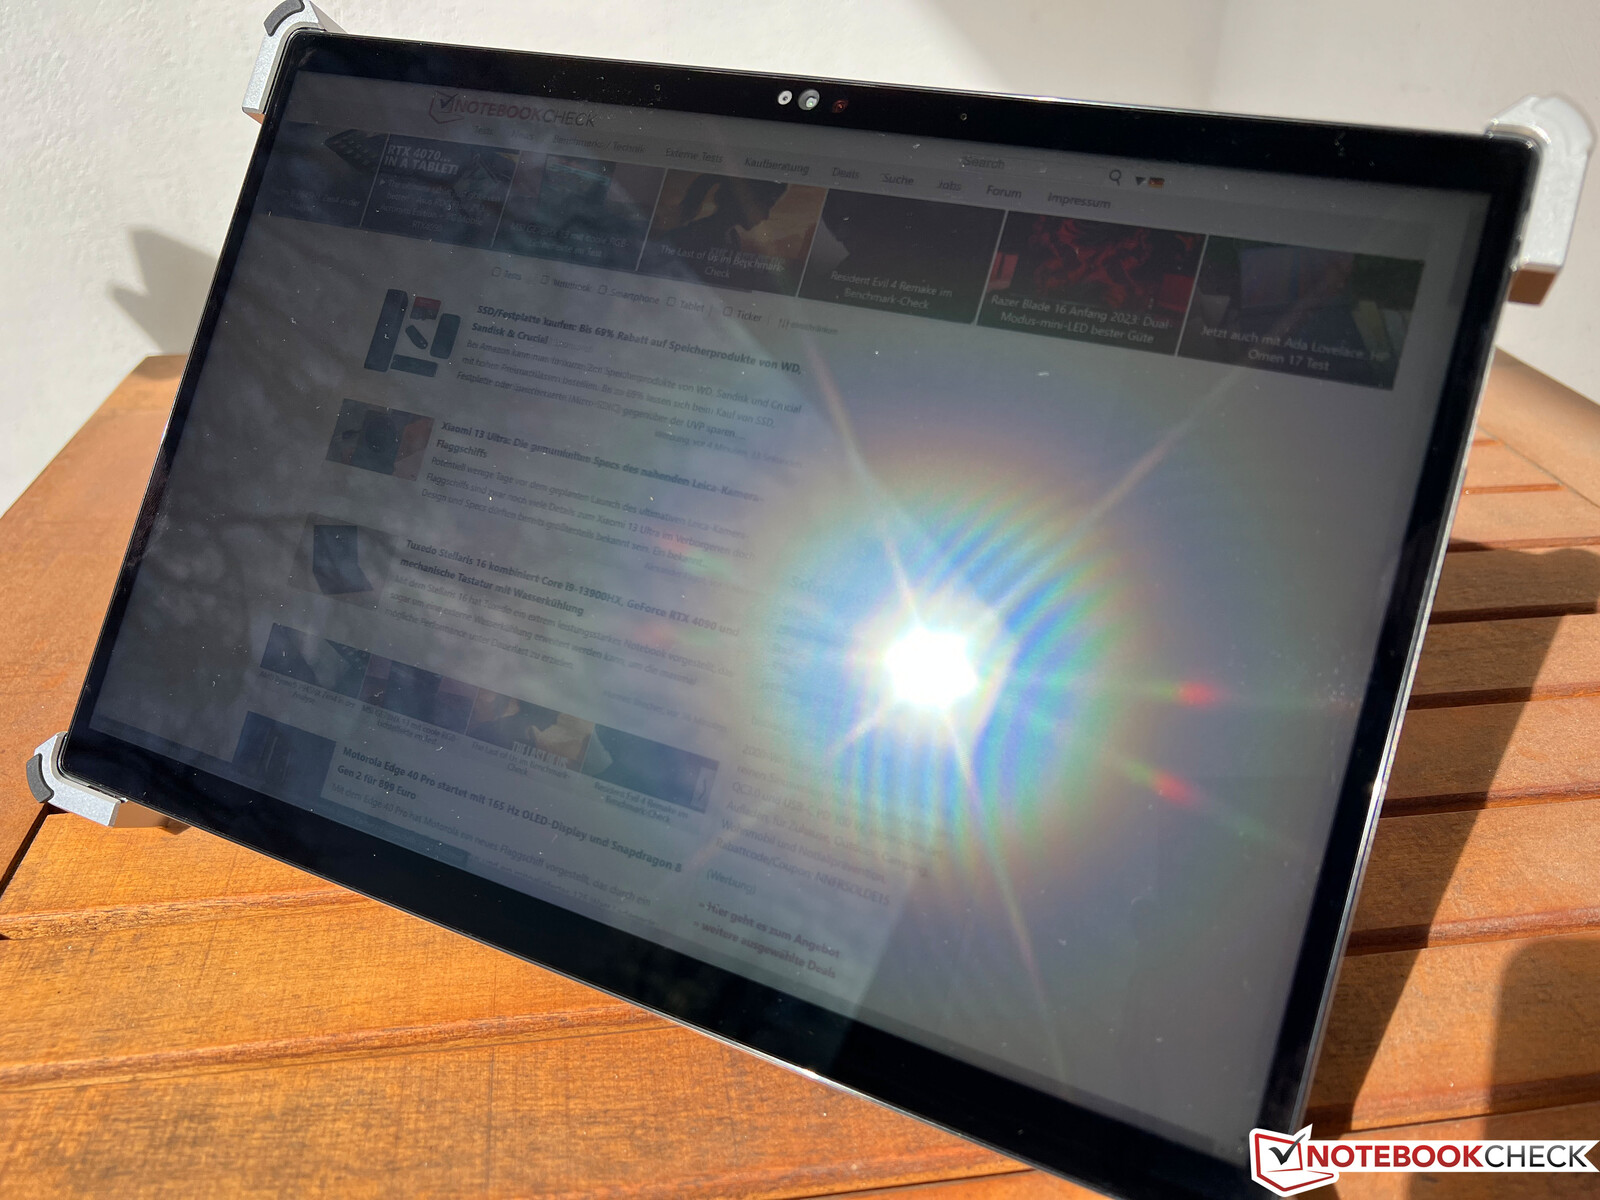
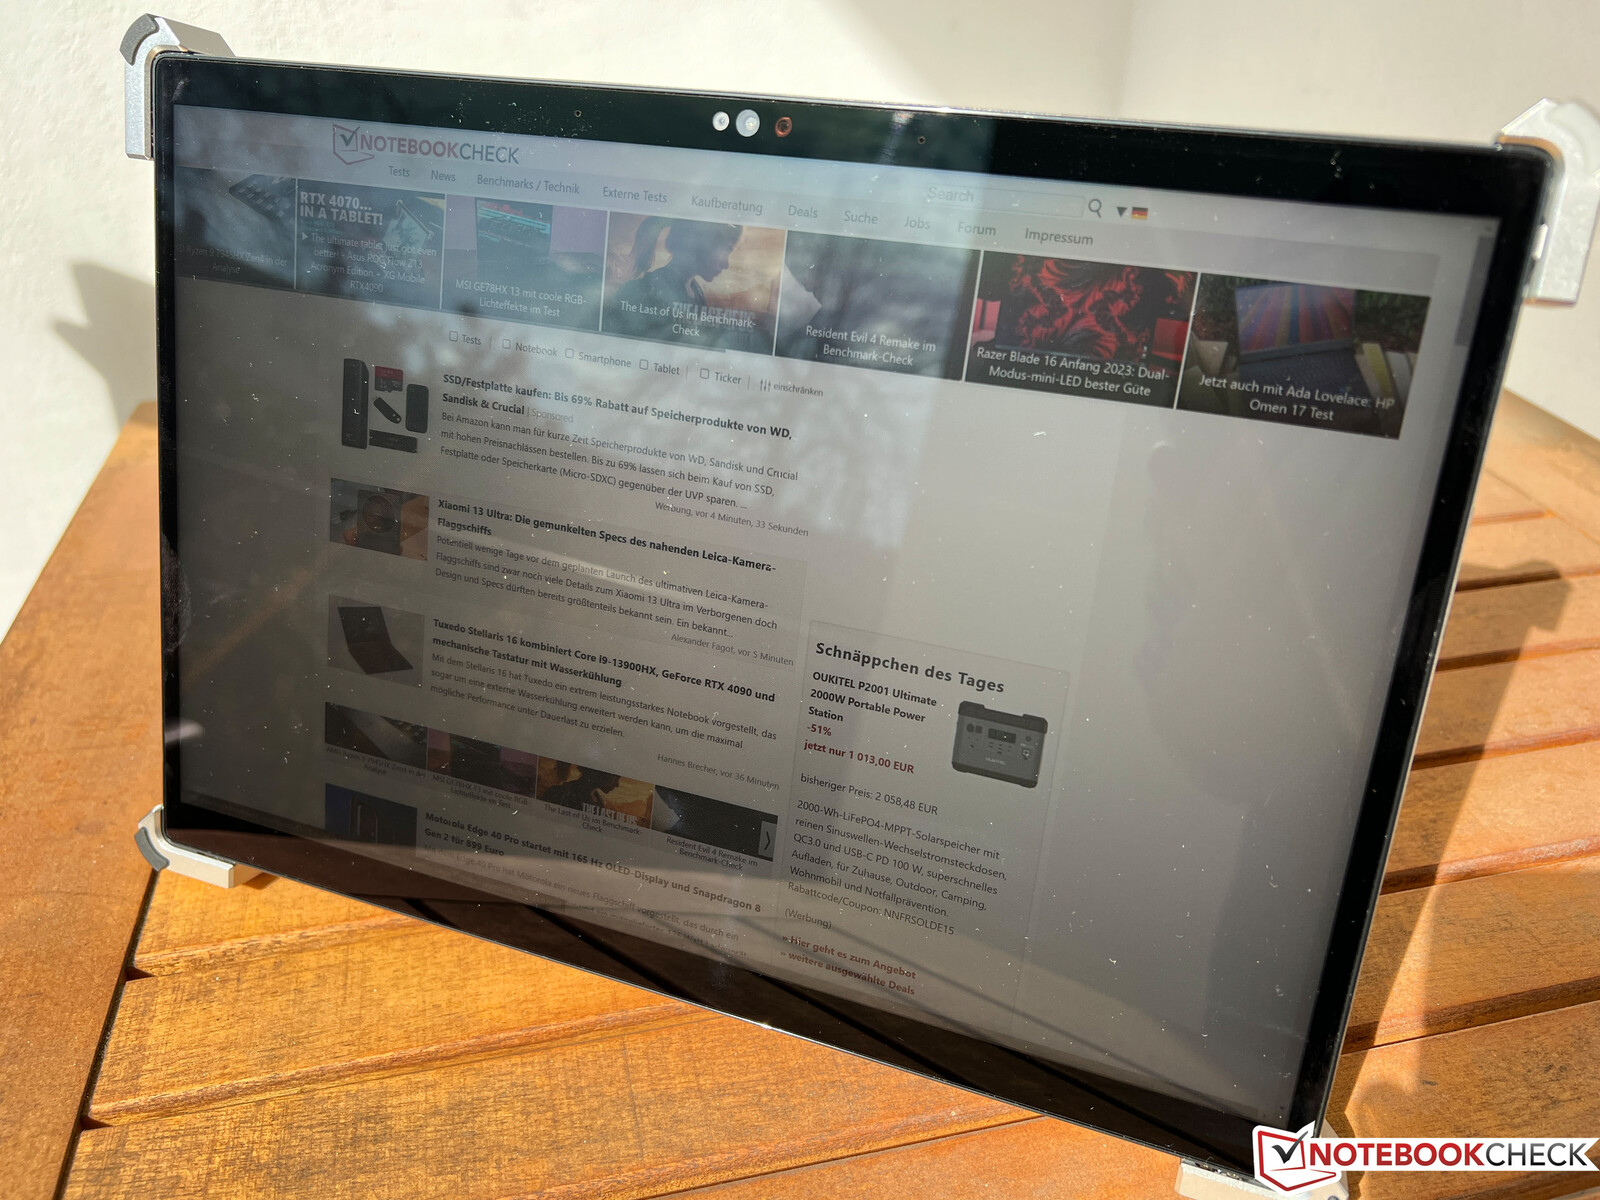
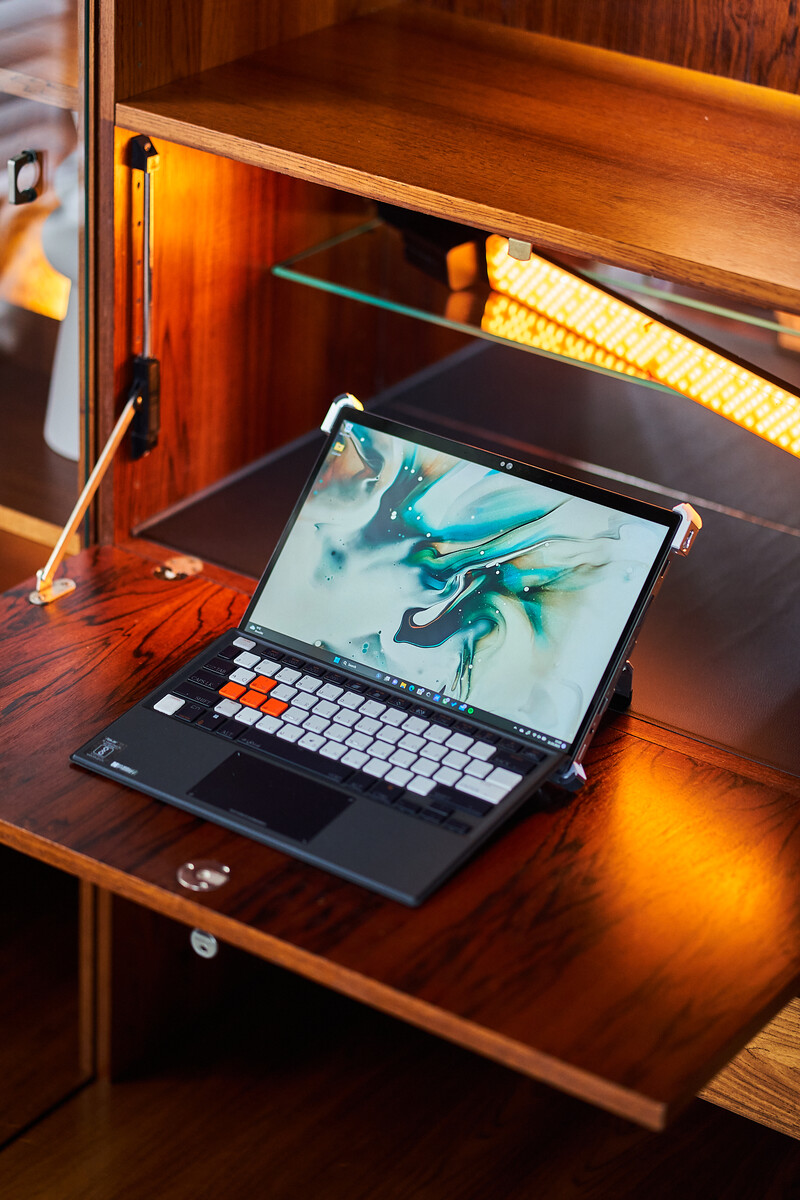
Od razu widać, że specjalna edycja ACRNM wykorzystuje zupełnie inną obudowę w porównaniu do zwykłegoROG Flow Z13. Najbardziej rzucającą się w oczy cechą jest tylna pokrywa z aluminium obrabianego CNC i naprawdę widać, gdzie maszyna usunęła materiał. Asus dołączył również gumowane paski dla lepszego chwytu i jest dodatkowy materiał wokół rogów. ROG Flow Z13 ACRNM wygląda niemal jak tablet typu ruggedized i stabilność z pewnością spełniałaby wymagania, ale w rezultacie urządzenie jest też dość ciężkie - 1,7 kg (kabriolet + pokrywa klawiatury). Asus również o tym wie i cztery narożniki są jednocześnie punktami zaczepienia dla dołączonych pasków. Za ich pomocą można nosić urządzenie jak torbę wokół ramienia lub używać go z przodu ciała, co obrazują poniższe zdjęcia.
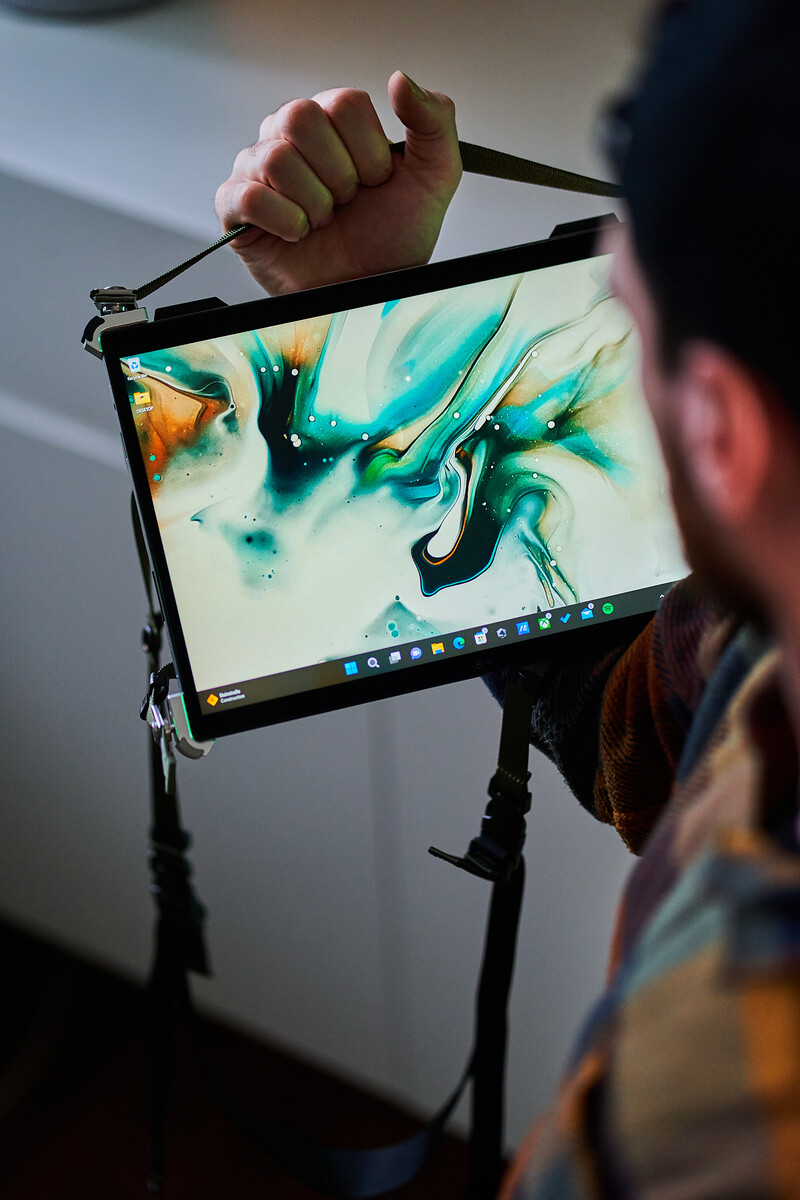
Zintegrowany kickstand z tyłu również pozostawia dobre wrażenie, a zawiasy nie chwieją się. Szczególnie podoba nam się fakt, że rogi kickstandu są również gumowane, co oznacza, że nie ma żadnych zarysowań i można nawet używać kabrioletu w trybie portretowym.
Podsumowując, edycja ACRNM ROG Flow Z13 to zdecydowanie bardzo efektowny design i nie każdemu przypadnie do gustu. Nam się podoba i uważamy, że pasuje do orientacji urządzenia. Nie można otworzyć obudowy, aby na przykład wyczyścić wentylatory, ale można przynajmniej uzyskać dostęp do kompaktowego dysku SSD M.2-2230 przez klapę konserwacyjną z tyłu.
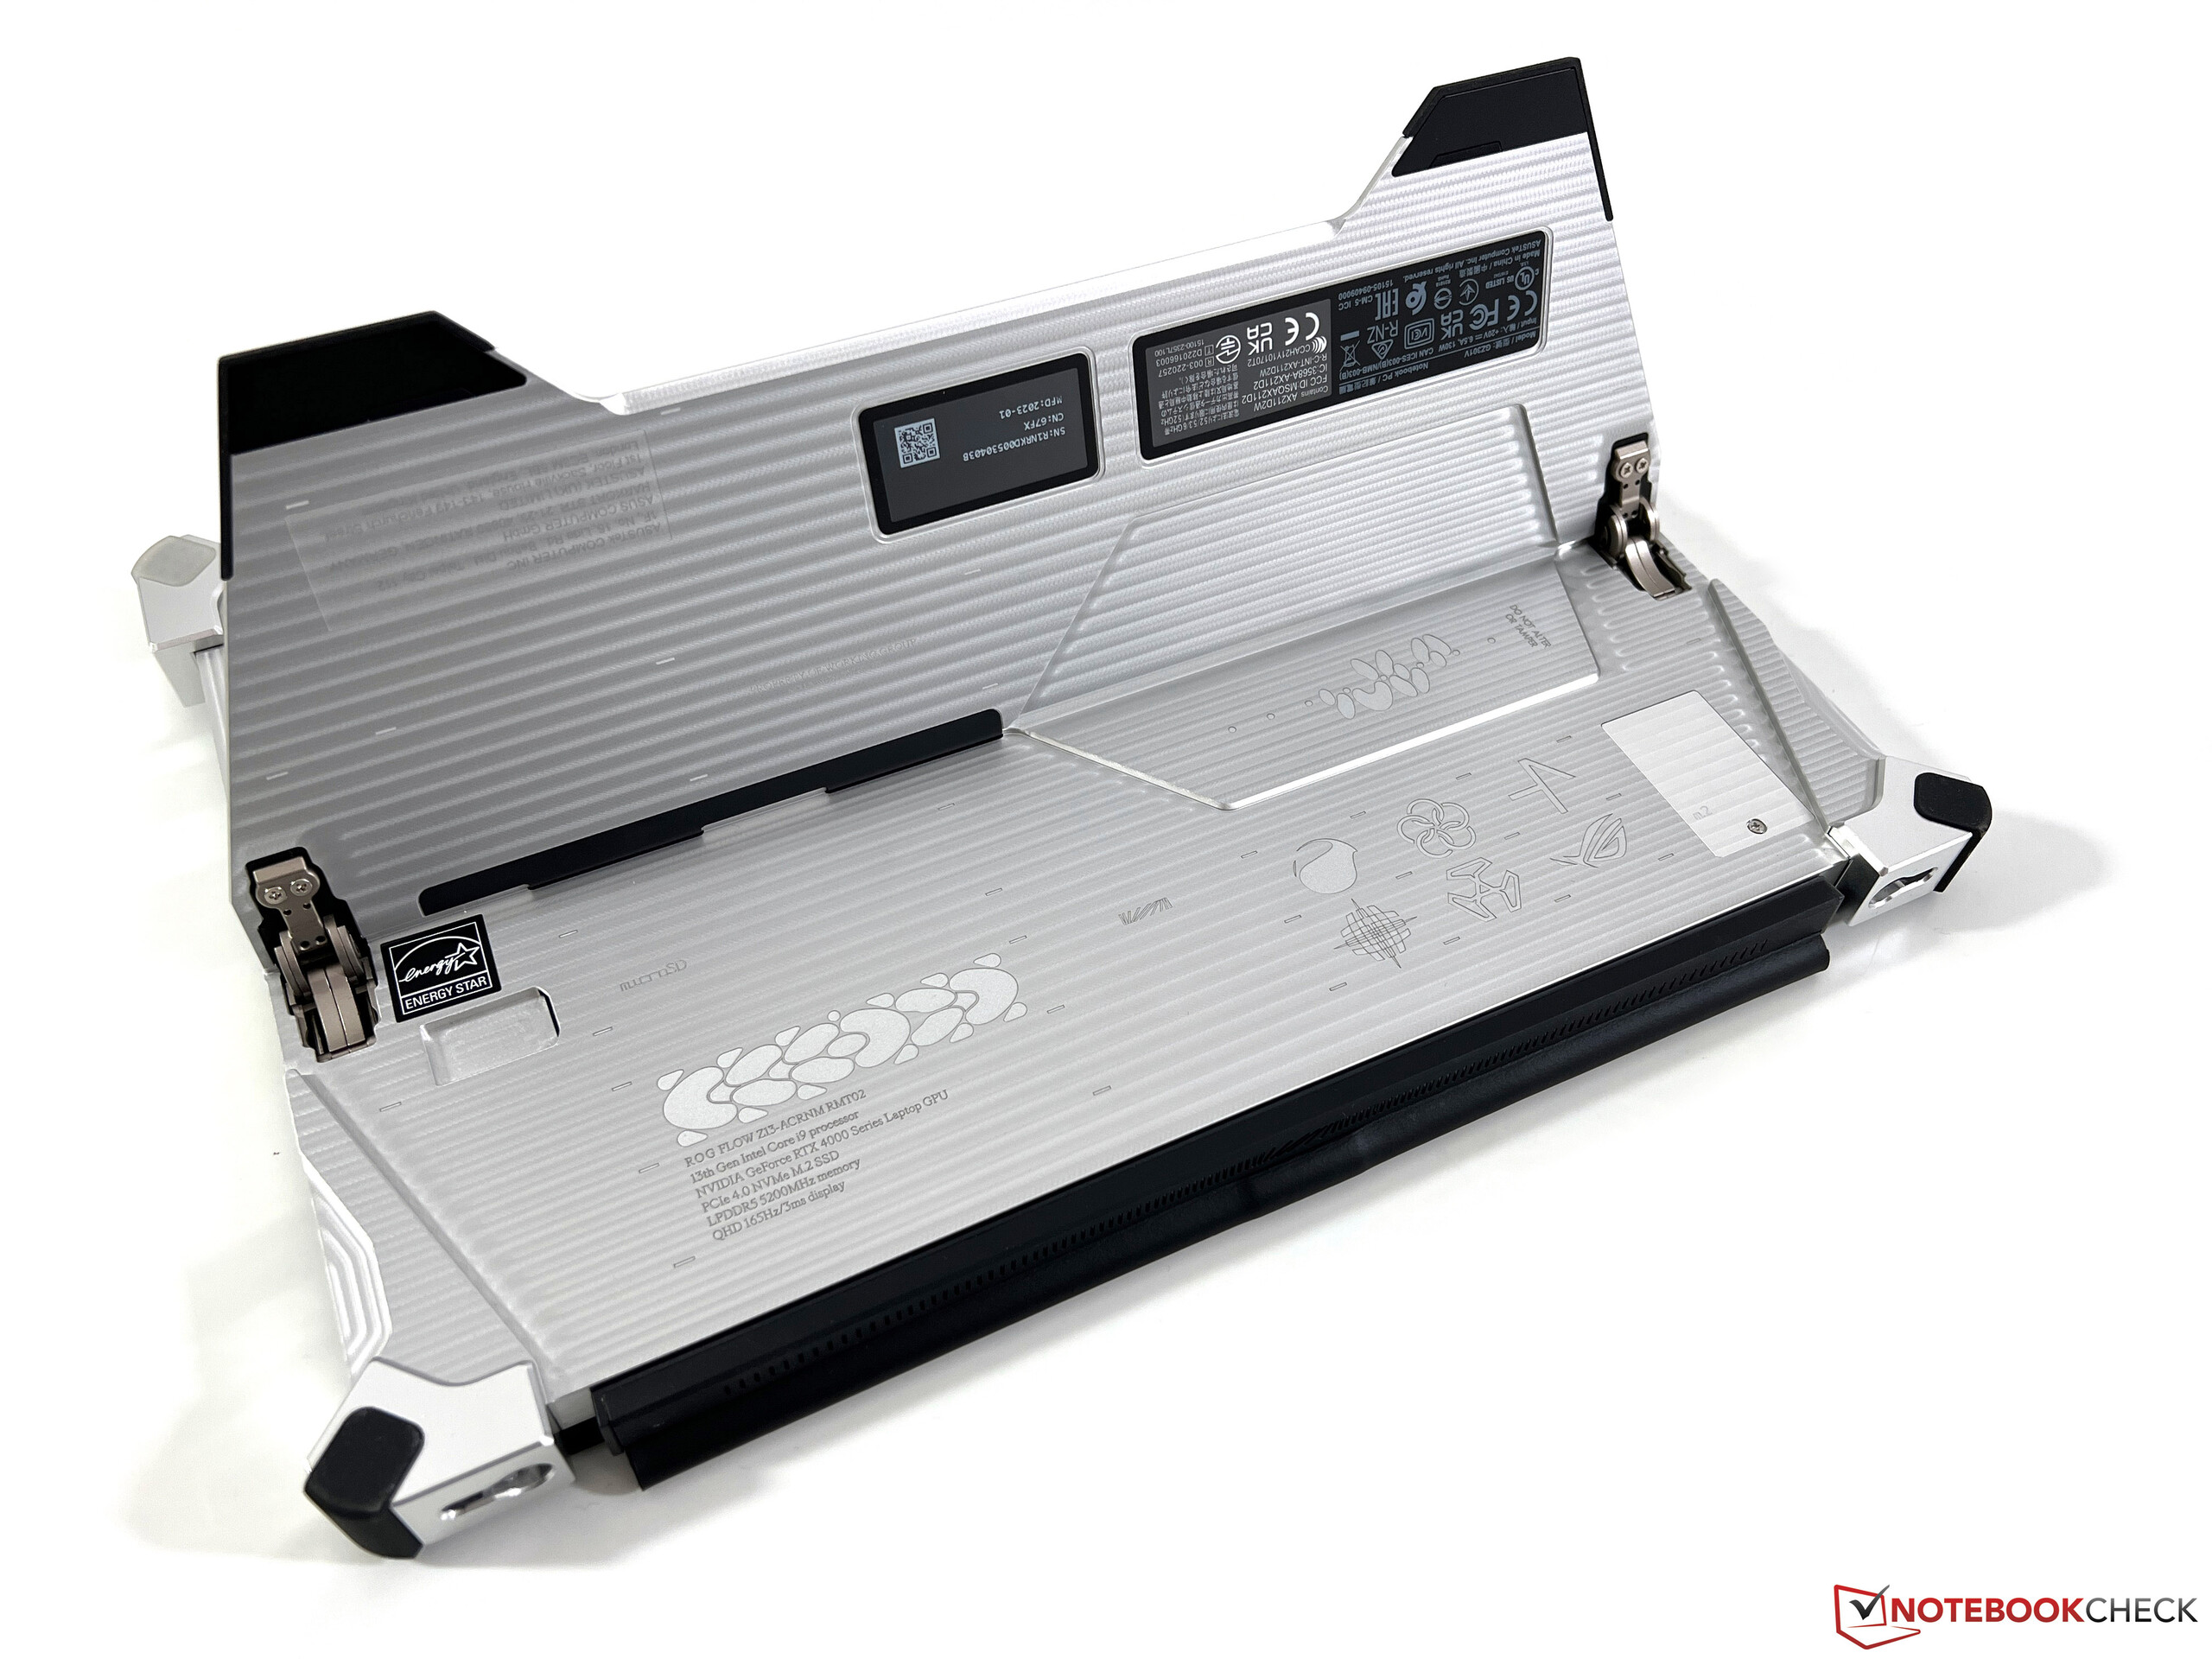
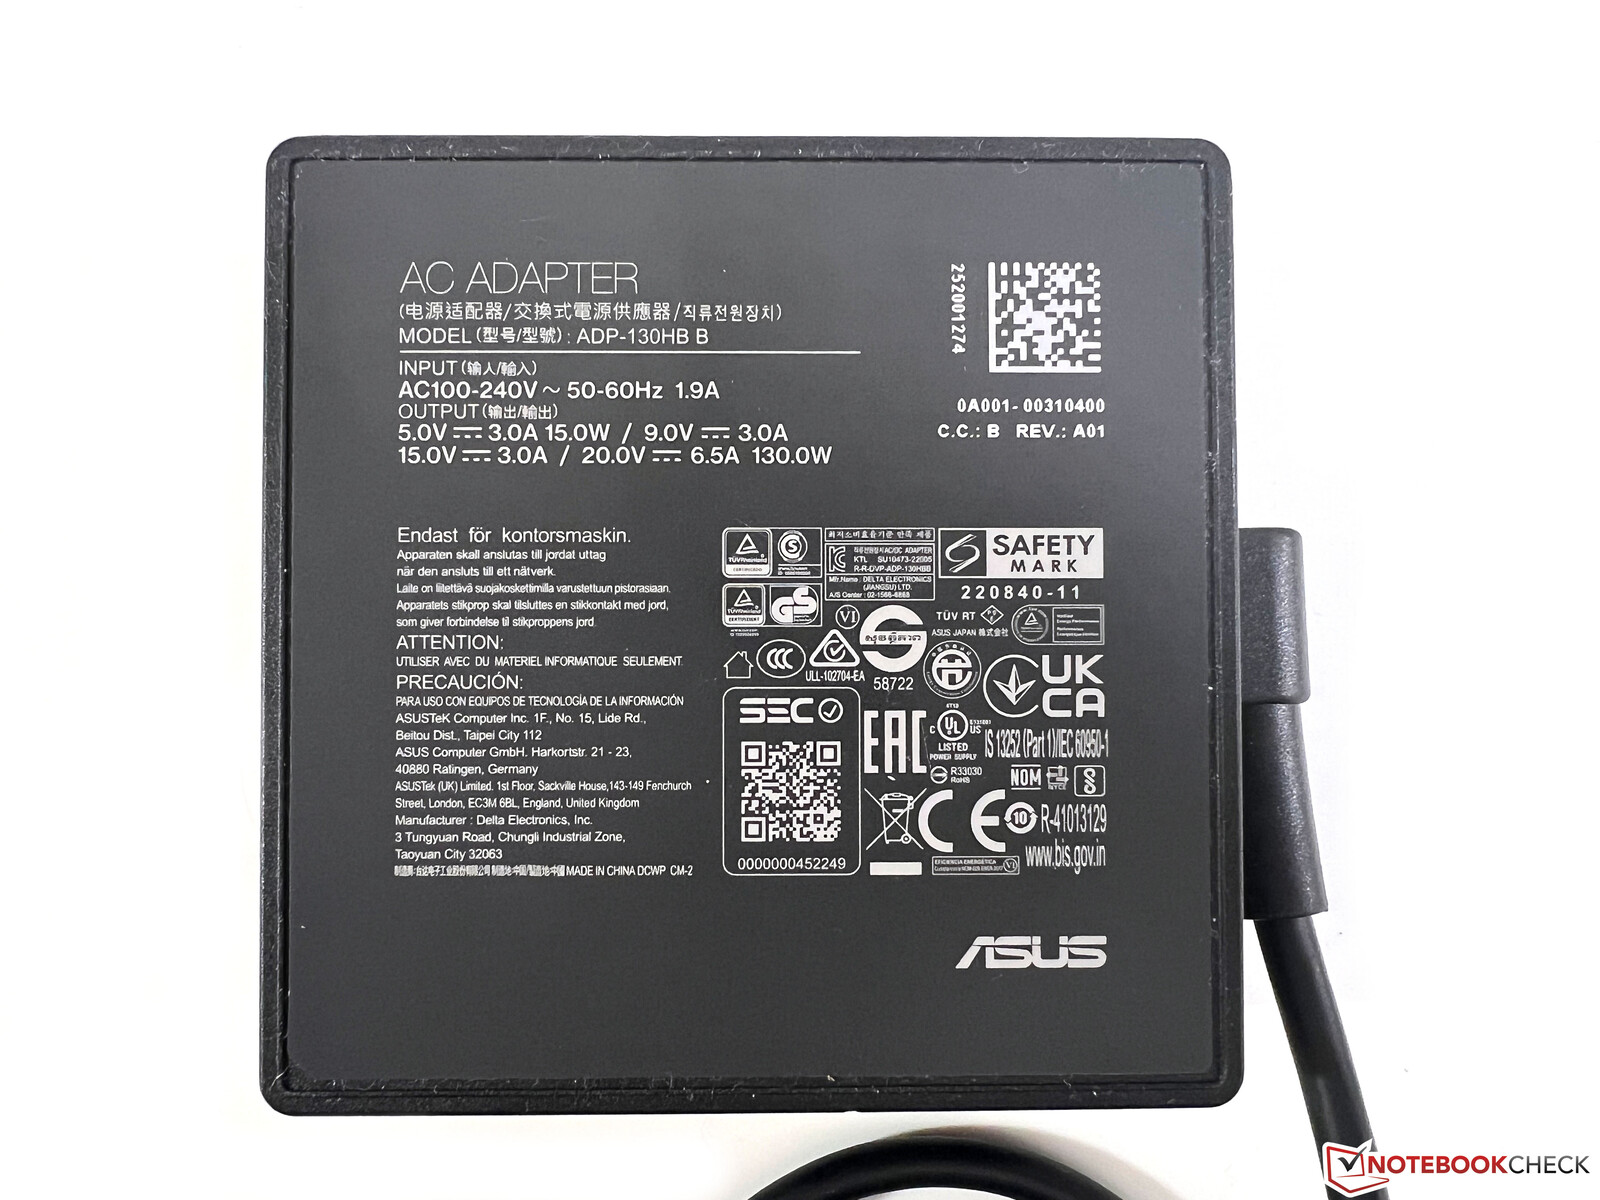
Wspomnieliśmy już o wysokiej wadze 1,7 kg (sekcja tabletu ~1,3 kg), a obudowa jest również bardziej wybrzuszona w porównaniu do zwykłegoROG Flow Z13. Kompaktowy zasilacz o mocy 130W przechyla szalę na stronę 565 gramów.
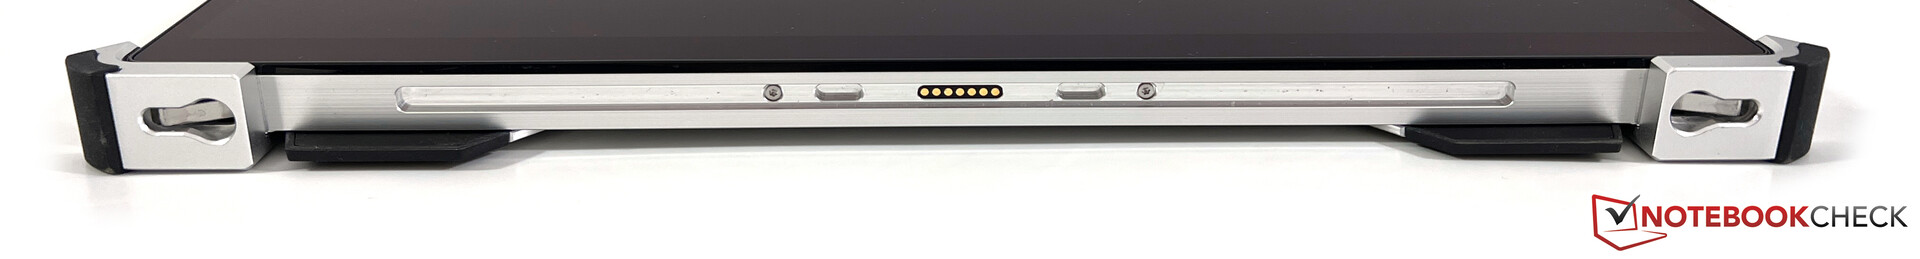
Łączność - Thunderbolt i eGPU
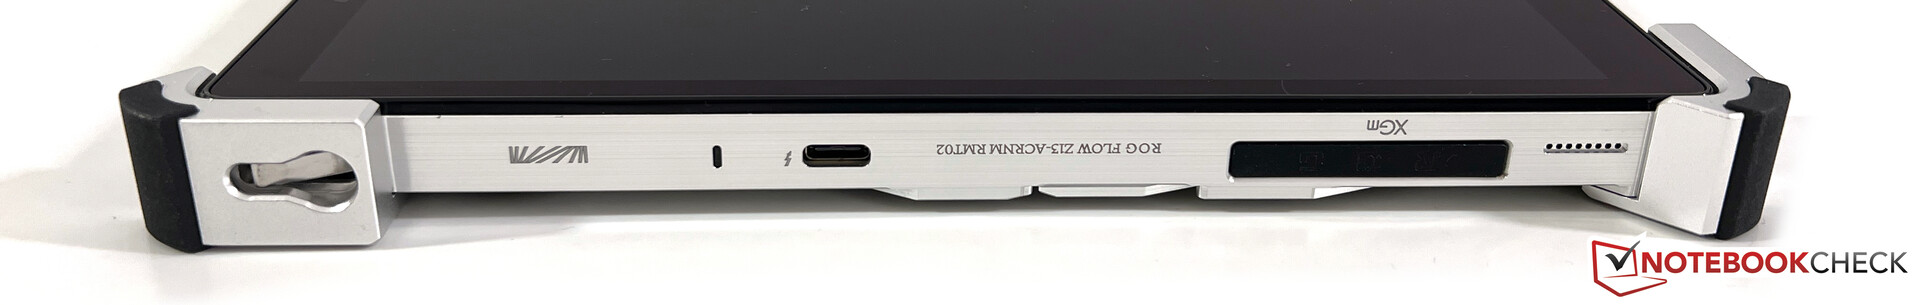
Flow Z13 to wciąż kabriolet, więc różnorodność portów jest ograniczona. Sytuacja nie jest jednak taka zła i otrzymujemy jeden zwykły port USB-A w połączeniu z dwoma portami USB-C, a także złącze dla zewnętrznego GPU. Oba porty USB-C mogą posłużyć do ładowania kabrioletu, a także obsługują wyjście wideo.
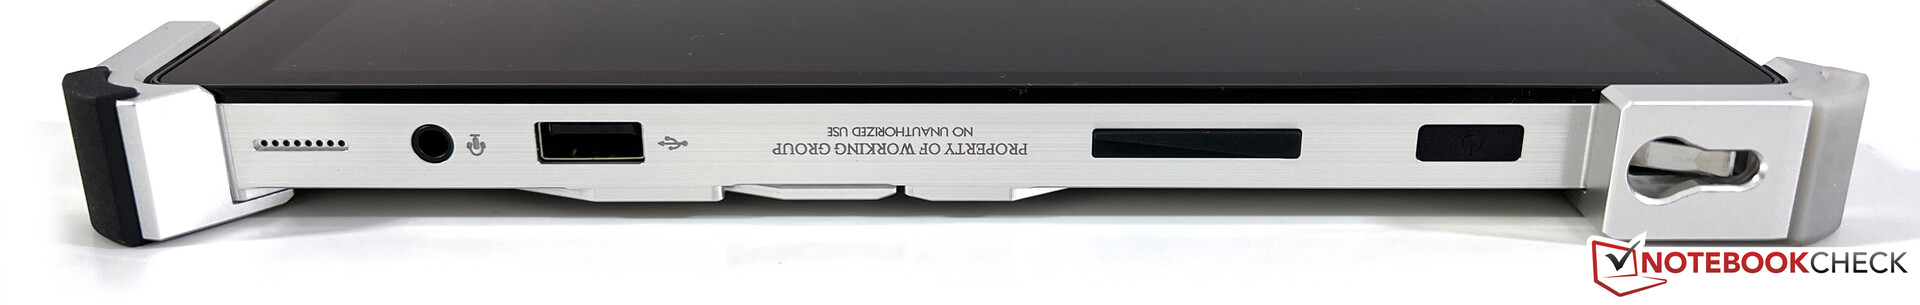
Czytnik kart SD
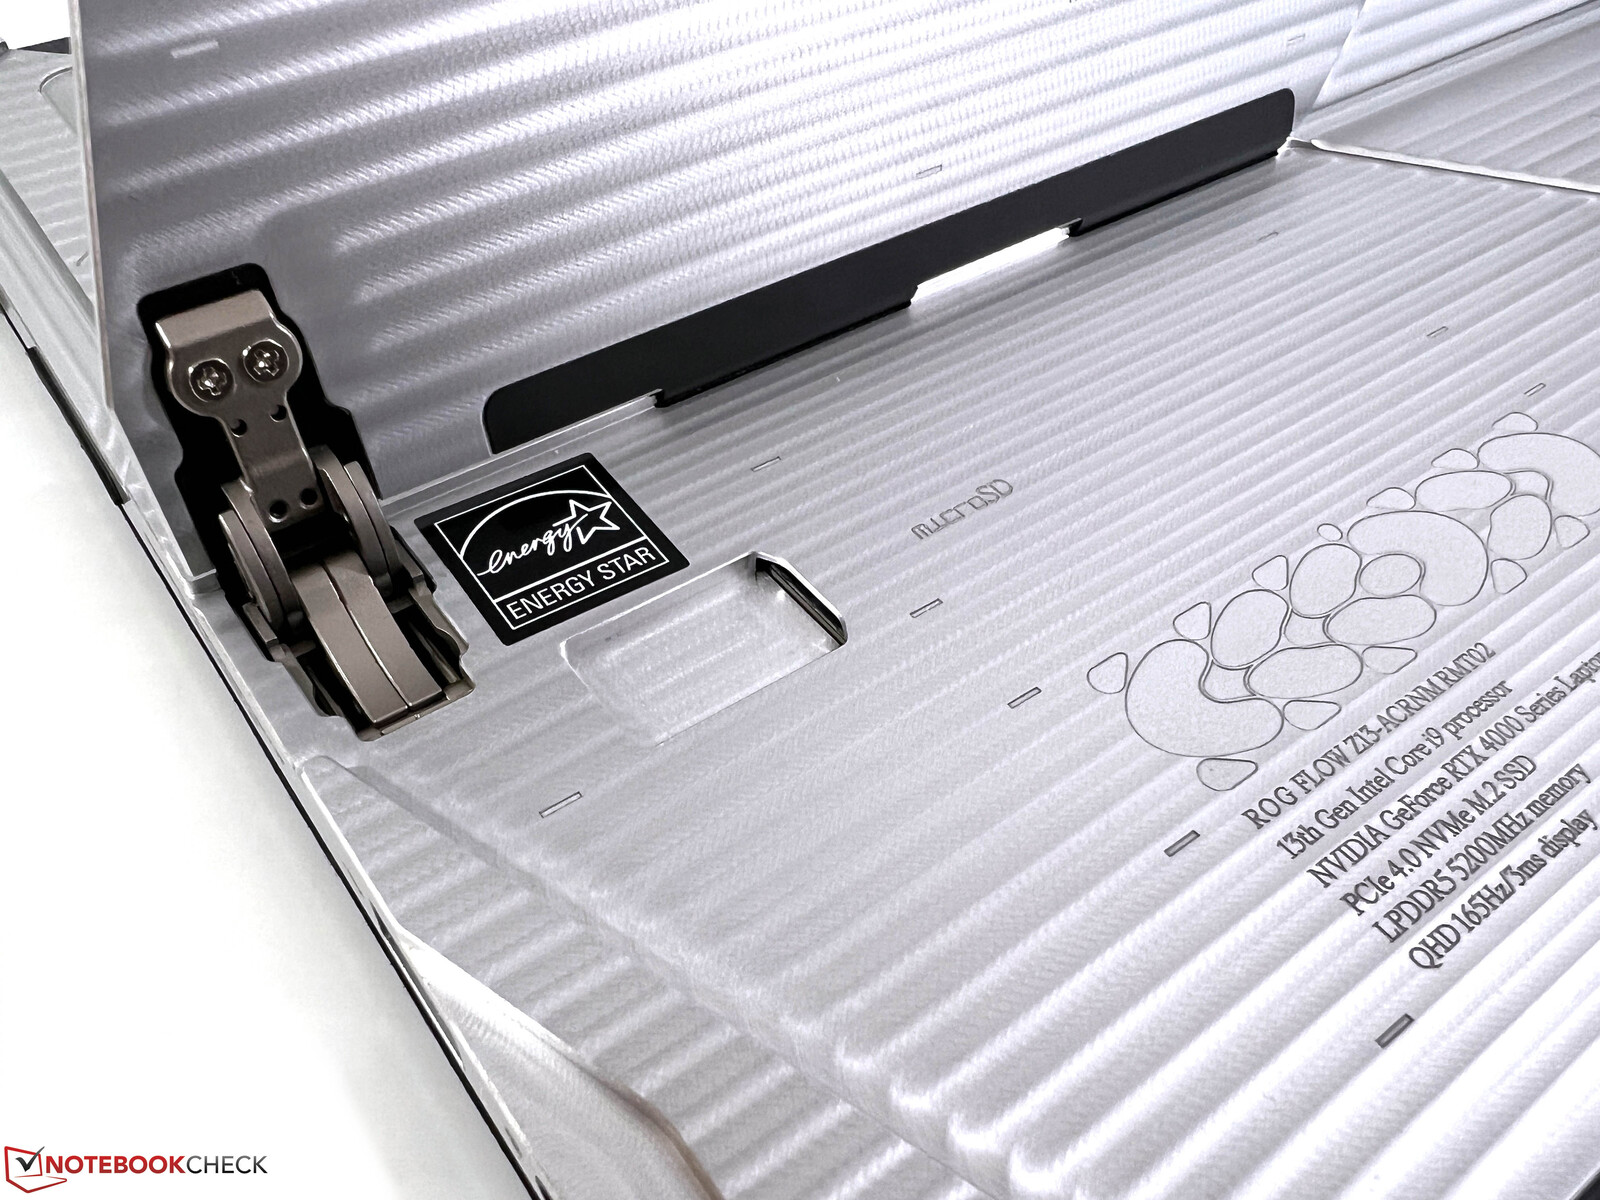
Asus zaimplementował za kickstandem czytnik microSD (mechanizm sprężynowy), do którego dostęp jest łatwy. Mierzymy transfery do 211 MB/s i 190 MB/s podczas kopiowania plików graficznych z naszej karty referencyjnej (Angelbird AV Pro V60).
| SD Card Reader | |
| average JPG Copy Test (av. of 3 runs) | |
| Alienware x14 i7 RTX 3060 (Angelbird AV Pro V60) | |
| Asus ROG Flow Z13 ACRNM (Angelbird AV Pro V60) | |
| Asus ROG Zephyrus G14 GA402RK (AV PRO microSD 128 GB V60) | |
| Średnia w klasie Gaming (20.9 - 210, n=55, ostatnie 2 lata) | |
| Asus ROG Flow Z13 GZ301ZE (Angelbird AV Pro V60) | |
| maximum AS SSD Seq Read Test (1GB) | |
| Asus ROG Flow Z13 GZ301ZE (Angelbird AV Pro V60) | |
| Alienware x14 i7 RTX 3060 (Angelbird AV Pro V60) | |
| Asus ROG Flow Z13 ACRNM (Angelbird AV Pro V60) | |
| Asus ROG Zephyrus G14 GA402RK (AV PRO microSD 128 GB V60) | |
| Średnia w klasie Gaming (25.5 - 261, n=52, ostatnie 2 lata) | |
Komunikacja
W ROG Flow Z13 zastosowano aktualny moduł Wi-Fi Intela AX211, który obsługuje również najnowszy standard Wi-Fi 6E. Mogliśmy jednak nawiązać połączenie z odpowiednią siecią 6 GHz naszego referencyjnego routera od Asusa, ale wydajność z siecią 5 GHz była również bardzo dobra i stabilna.
| Networking | |
| Asus ROG Flow Z13 ACRNM | |
| iperf3 transmit AXE11000 | |
| iperf3 receive AXE11000 | |
| Asus ROG Flow Z13 GZ301ZE | |
| iperf3 transmit AX12 | |
| iperf3 receive AX12 | |
| Alienware x14 i7 RTX 3060 | |
| iperf3 transmit AX12 | |
| iperf3 receive AX12 | |
| Razer Blade 14 Ryzen 9 6900HX | |
| iperf3 transmit AX12 | |
| iperf3 receive AX12 | |
| Asus ROG Zephyrus G14 GA402RK | |
| iperf3 transmit AXE11000 | |
| iperf3 receive AXE11000 | |
Kamera internetowa
Oprócz 5 MP kamery IR dla Windows Hello, Asus umieścił także nową 13 MP kamerę w górnej ramce wyświetlacza. Jakość obrazu jest znacznie lepsza w porównaniu do zwykłych kamer 720p czy nawet 1080p w zwykłych laptopach. W naszej recenzji na YouTube zamieściliśmy również przykładowe nagranie (wideo i audio), dzięki czemu można uzyskać lepsze wrażenie wydajności.


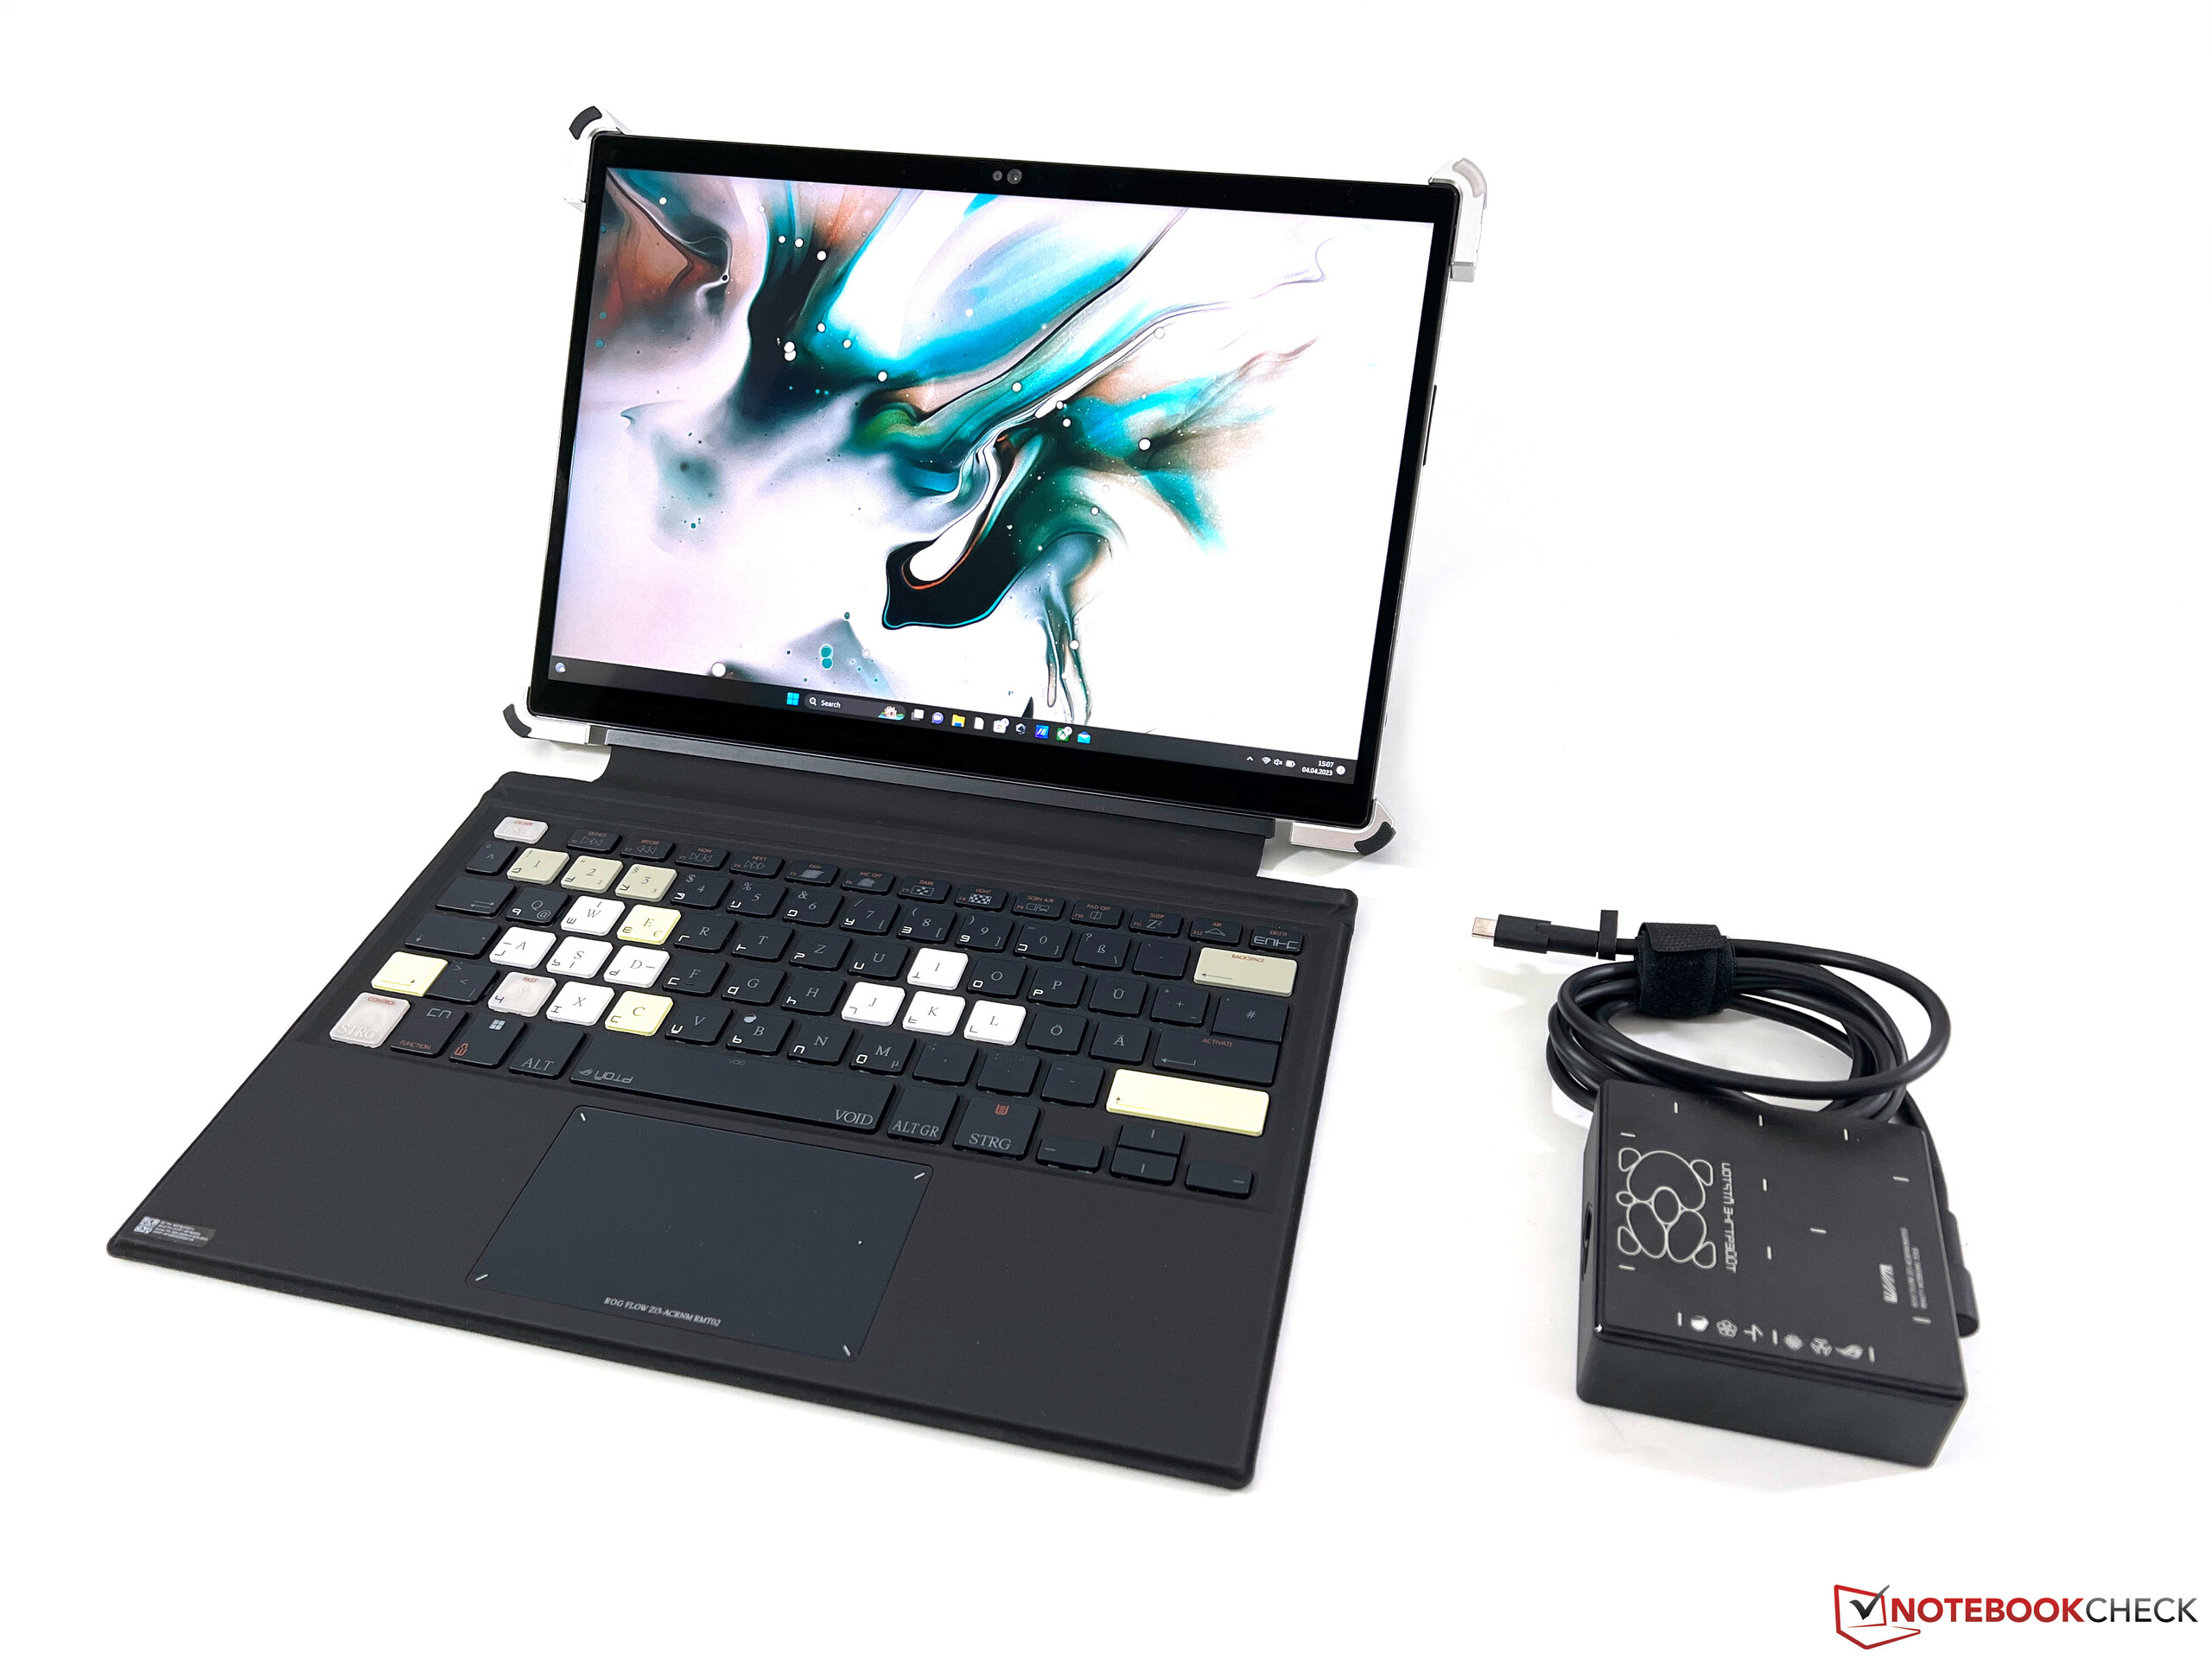
Urządzenia wejściowe - ROG Flow z dwoma klawiaturami
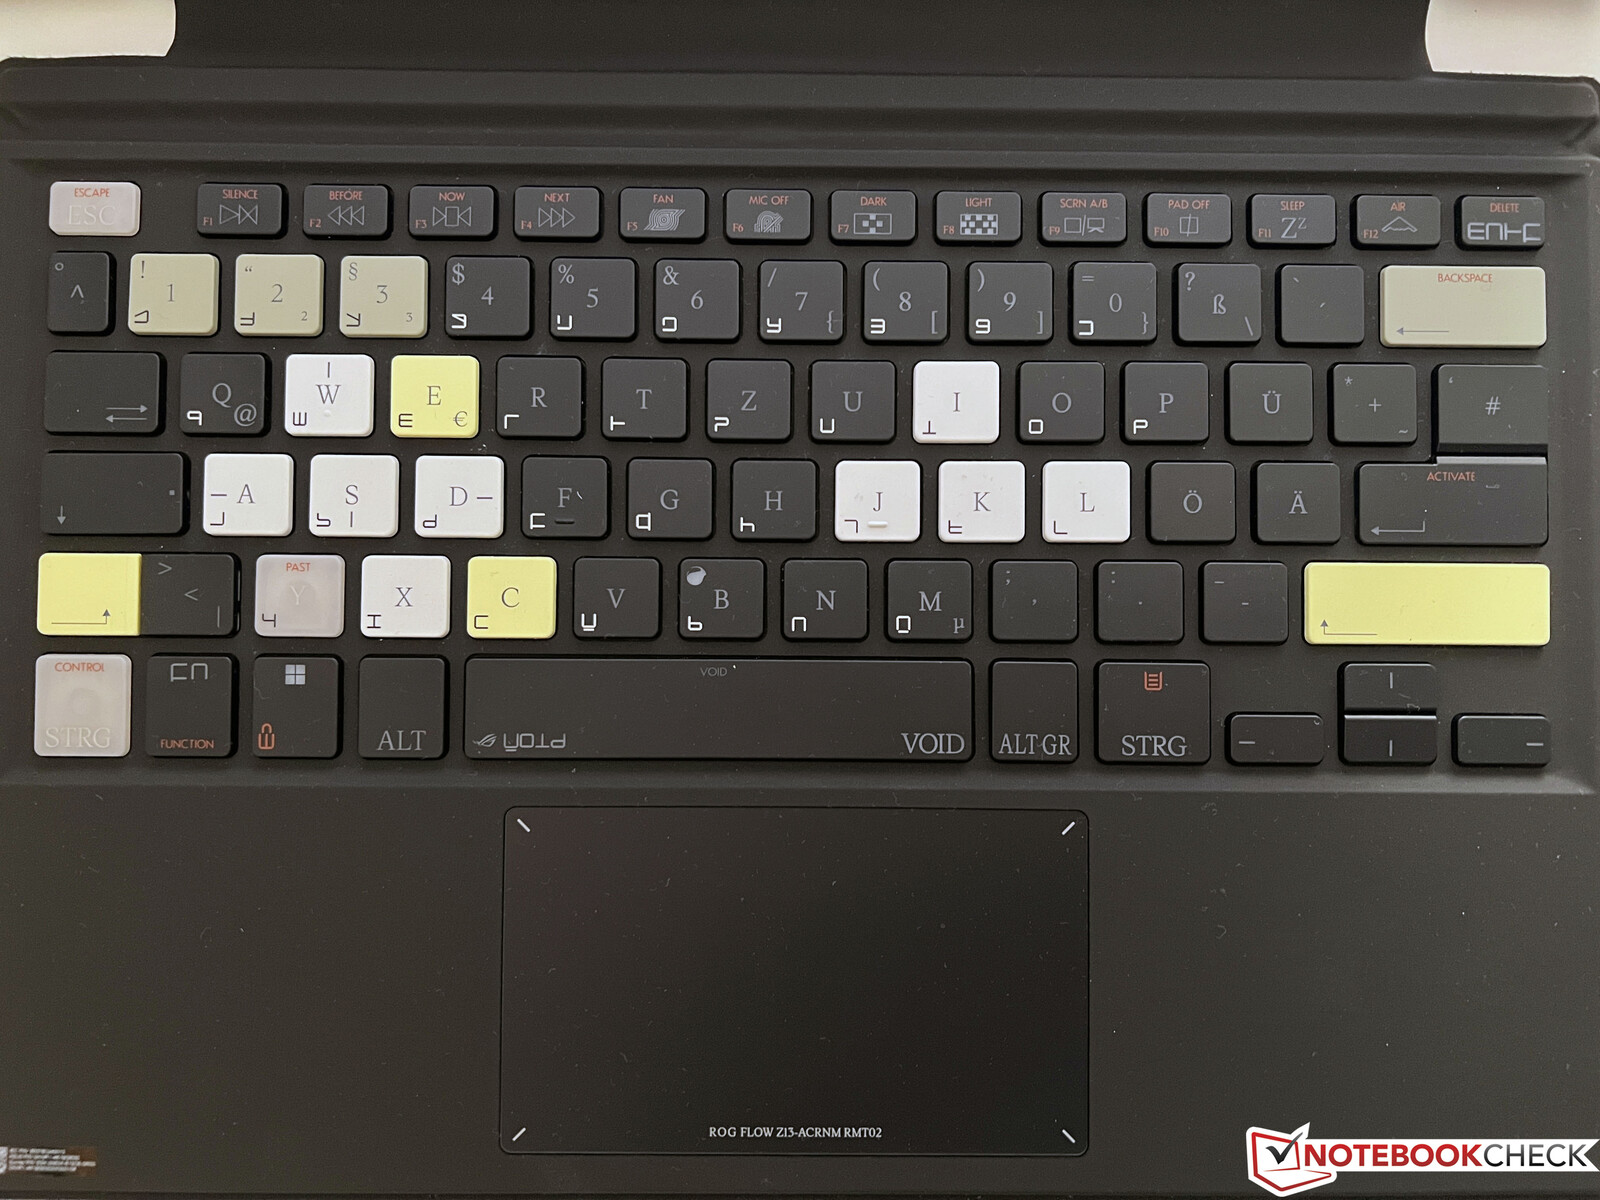
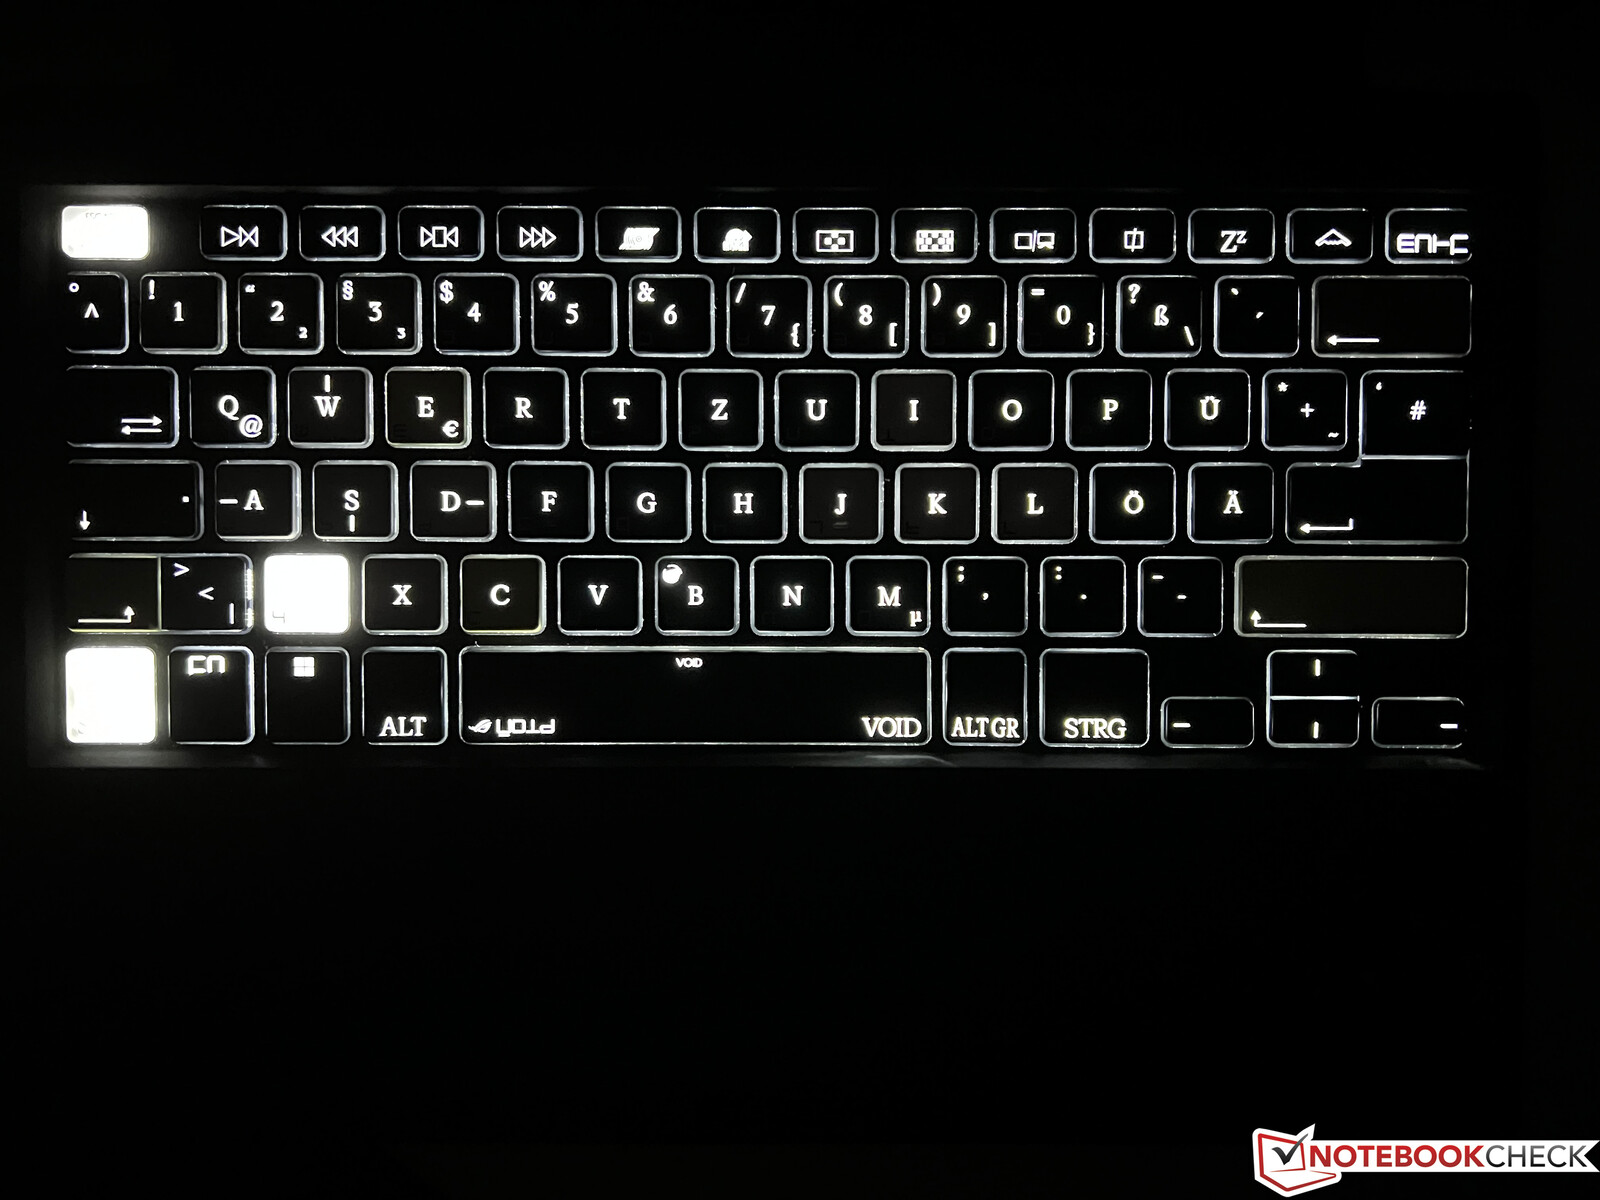
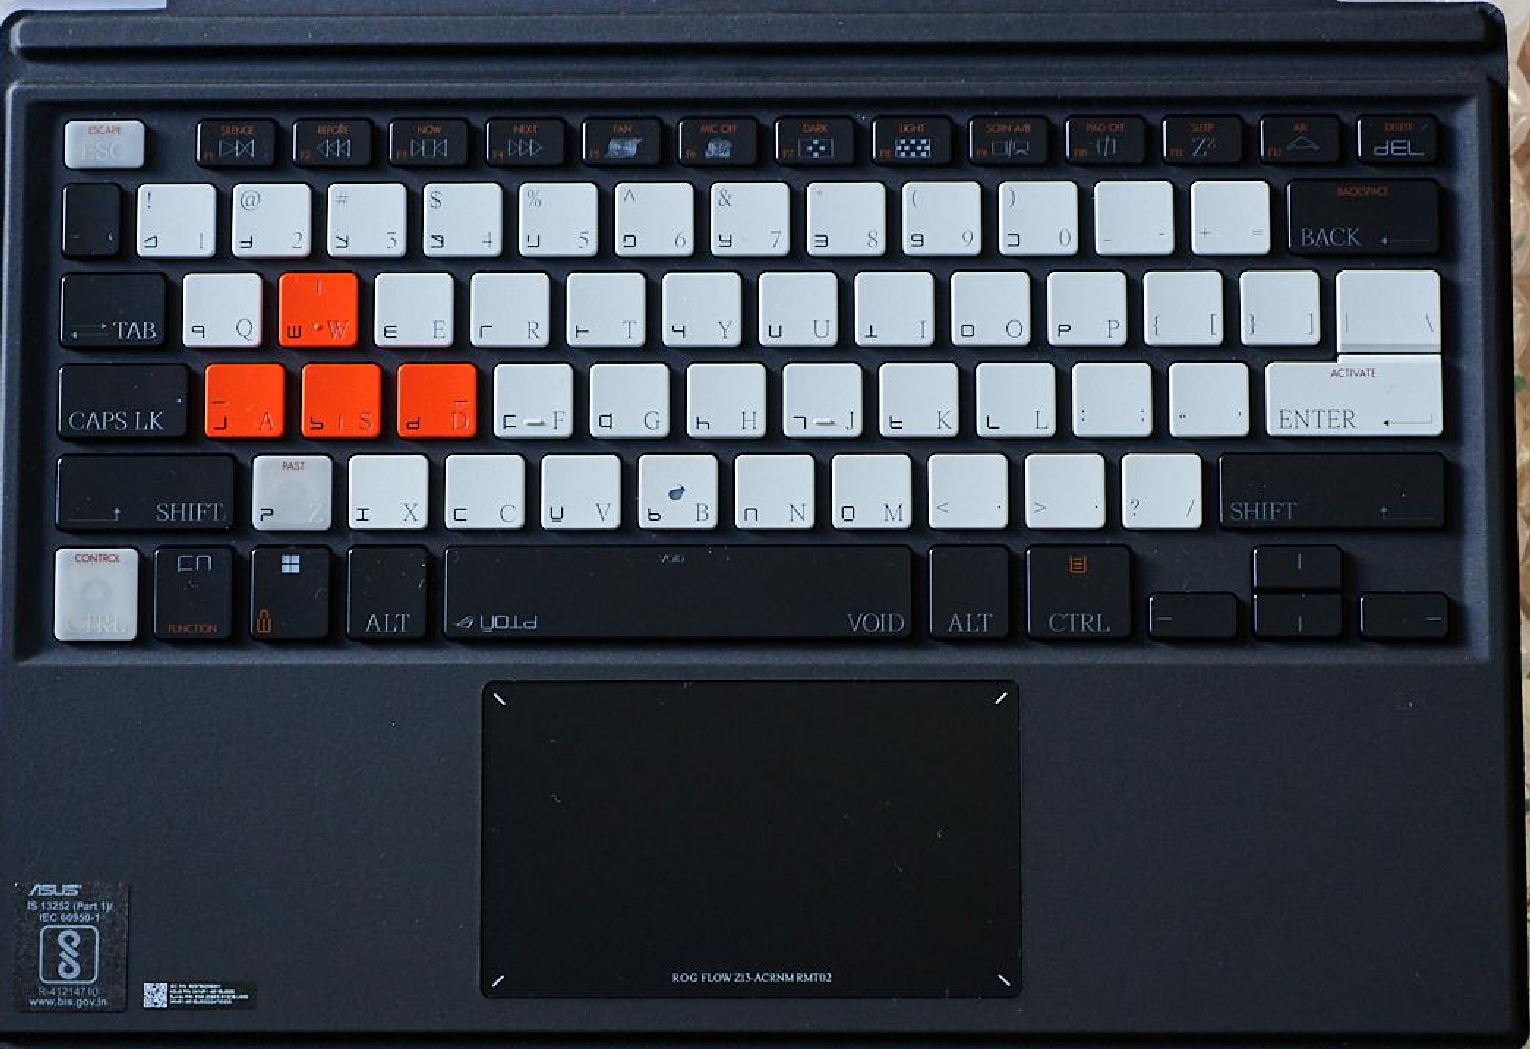
Asus dostarcza ROG Flow z13 ACRNM edition z dwoma różnymi osłonami klawiatury, które są też dość ciężkie (358 gramów) i grube jak na kabriolet. Jak zwykle można używać klawiatury w dwóch kątach, płasko na powierzchni lub lekko pochylonej. Klawiatura jest zaskakująco solidna, a skok klawiszy jest również dość długi jak na klawiaturę odłączaną.
Projekt klawiszy jest równie nietypowy jak obudowa i to stwarza pewne problemy, ponieważ dodatkowe symbole na klawiszach mogą być dość mylące na co dzień, gdy nie można pisać bez patrzenia. Kontrast czarnych klawiszy jest po prostu niewystarczający, podczas gdy dodatkowe symbole mają jednocześnie wysoki kontrast, co jest irytujące. Problem znika w ciemnym otoczeniu, gdyż podświetlenie klawiatury oświetla tylko ważne symbole.
Touchpad jest dość mały - 10,5 x 6 cm - i odgłosy klikania są dość głośne, ale działa dobrze. Pojemnościowy ekran dotykowy nie sprawia żadnych problemów i można go używać także z digitizerem. Asus dostarcza kabriolet z rysikiem SA203 (4096 poziomów nacisku) i nie zauważyliśmy żadnych problemów.
Wyświetlacz - WQHD o częstotliwości 165 Hz
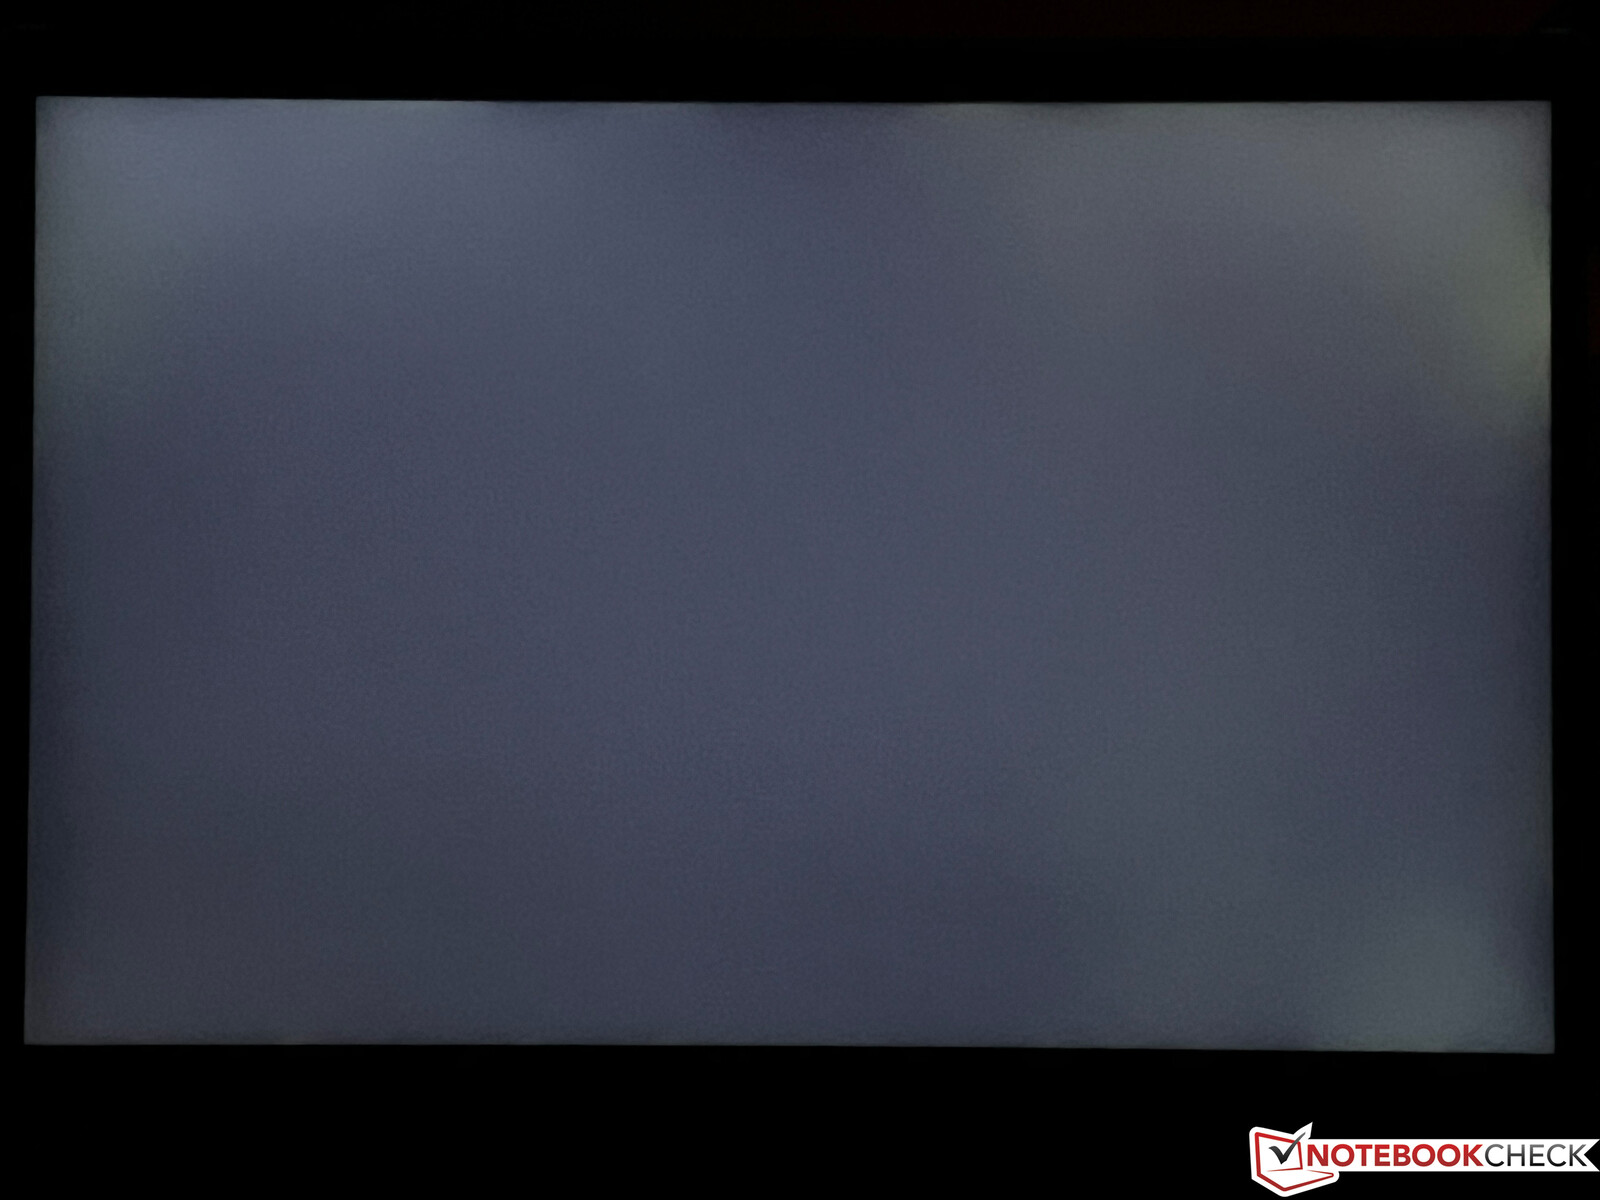
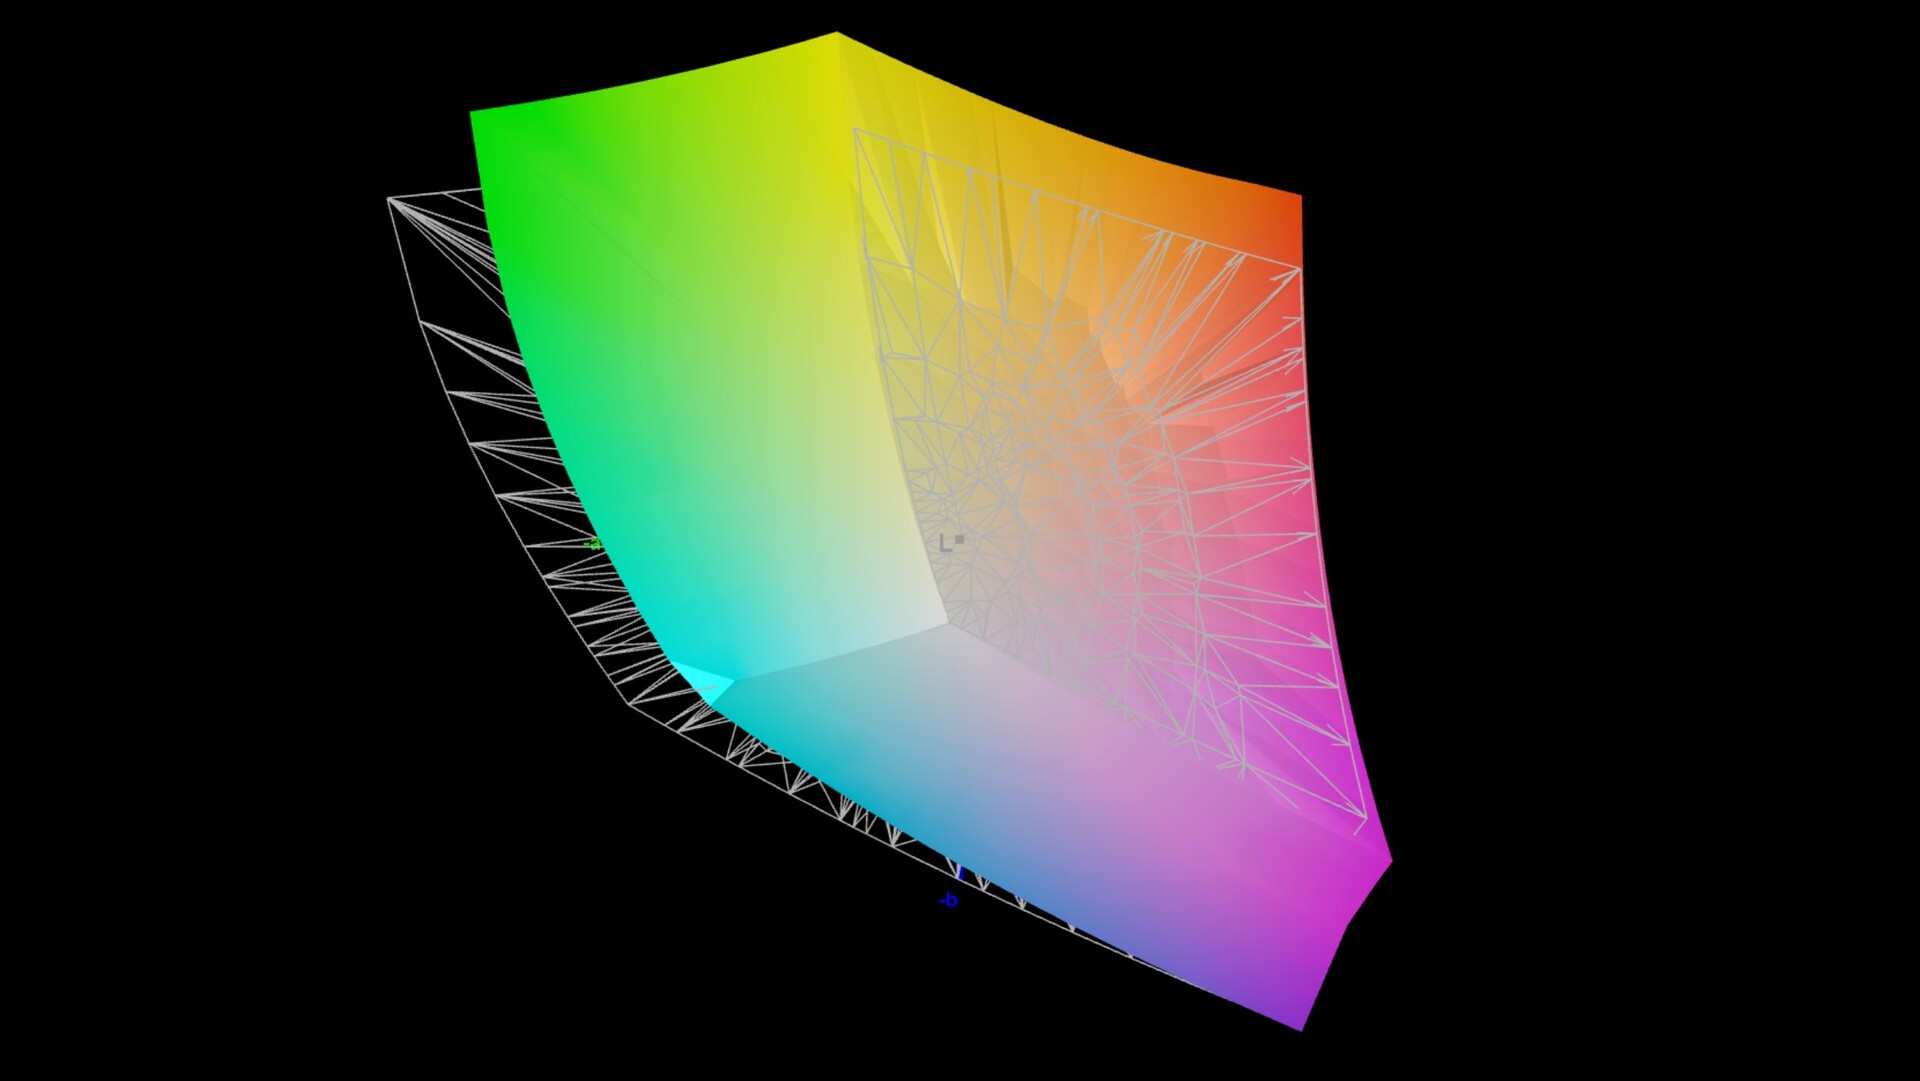
Asus zmodernizował także wyświetlacz i nie ma różnicy między naszą edycją ACRNM a zwykłą wersją ROG Flow Z13. W obu zastosowano panel WQHD o wyższej rozdzielczości (2560 x 1600 pikseli, 16:10) z wyższą częstotliwością odświeżania 165 Hz. Subiektywna jakość obrazu jest znakomita, a ruchy są bardzo płynne. Określamy też szybkie czasy reakcji i nie ma śladu migotania PWM. Nasz egzemplarz recenzencki nie miał też masywnych problemów z backlight bleedingiem.
Ustalamy średnią jasność na poziomie 455 nitów w połączeniu z nieco podniesioną wartością czerni 0,4, co skutkuje współczynnikiem kontrastu 1160:1. To przyzwoity wynik, ale wszyscy rywale z matrycą IPS (w tym poprzednik) poza m.in.Razer Blade 14oferują lepsze wyniki kontrastu. Jasności panelu nie można kontrolować za pomocą czujnika światła otoczenia.
| |||||||||||||||||||||||||
rozświetlenie: 89 %
na akumulatorze: 464 cd/m²
kontrast: 1160:1 (czerń: 0.4 cd/m²)
ΔE ColorChecker Calman: 2 | ∀{0.5-29.43 Ø4.73}
calibrated: 1.2
ΔE Greyscale Calman: 2.7 | ∀{0.09-98 Ø4.97}
85.17% AdobeRGB 1998 (Argyll 3D)
99.92% sRGB (Argyll 3D)
96.94% Display P3 (Argyll 3D)
Gamma: 2.24
CCT: 6832 K
| Asus ROG Flow Z13 ACRNM TL134ADXP01-0, IPS, 2560x1600, 13.4" | Asus ROG Flow Z13 GZ301ZE LQ134N1JW54, IPS, 1920x1200, 13.4" | Alienware x14 i7 RTX 3060 SHP154D, IPS, 1920x1080, 14" | Razer Blade 14 Ryzen 9 6900HX TL140BDXP02-0, IPS, 2560x1440, 14" | Asus ROG Zephyrus G14 GA402RK NE140QDM-NX1 (BOE0A1D), IPS-Level, 2560x1600, 14" | |
|---|---|---|---|---|---|
| Display | -17% | 2% | 0% | 0% | |
| Display P3 Coverage (%) | 96.94 | 67.5 -30% | 99.6 3% | 97.2 0% | 97.4 0% |
| sRGB Coverage (%) | 99.92 | 97.1 -3% | 100 0% | 99.9 0% | 99.9 0% |
| AdobeRGB 1998 Coverage (%) | 85.17 | 69.3 -19% | 87.6 3% | 85.7 1% | 85.5 0% |
| Response Times | -1241% | -255% | -554% | -210% | |
| Response Time Grey 50% / Grey 80% * (ms) | 2.1 ? | 44 ? -1995% | 9.6 ? -357% | 16.8 ? -700% | 8.8 ? -319% |
| Response Time Black / White * (ms) | 3 ? | 17.6 ? -487% | 7.6 ? -153% | 15.2 ? -407% | 6 ? -100% |
| PWM Frequency (Hz) | 27170 ? | ||||
| Screen | 10% | -11% | 0% | -20% | |
| Brightness middle (cd/m²) | 464 | 515 11% | 434 -6% | 354 -24% | 480 3% |
| Brightness (cd/m²) | 455 | 476 5% | 411 -10% | 328 -28% | 456 0% |
| Brightness Distribution (%) | 89 | 87 -2% | 89 0% | 86 -3% | 80 -10% |
| Black Level * (cd/m²) | 0.4 | 0.35 13% | 0.25 37% | 0.37 7% | 0.48 -20% |
| Contrast (:1) | 1160 | 1471 27% | 1736 50% | 957 -17% | 1000 -14% |
| Colorchecker dE 2000 * | 2 | 1.6 20% | 3 -50% | 1.66 17% | 2.62 -31% |
| Colorchecker dE 2000 max. * | 4.2 | 4 5% | 7.1 -69% | 3.83 9% | 6.71 -60% |
| Colorchecker dE 2000 calibrated * | 1.2 | 1.2 -0% | 0.7 42% | 1.12 7% | |
| Greyscale dE 2000 * | 2.7 | 2.5 7% | 5.1 -89% | 1.6 41% | 4.2 -56% |
| Gamma | 2.24 98% | 2.2 100% | 2.19 100% | 2.23 99% | 2.16 102% |
| CCT | 6832 95% | 6939 94% | 6204 105% | 6542 99% | 7122 91% |
| Całkowita średnia (program / ustawienia) | -416% /
-175% | -88% /
-43% | -185% /
-85% | -77% /
-43% |
* ... im mniej tym lepiej
Panel analizowaliśmy za pomocą profesjonalnego oprogramowania CalMAN (X-Rite i1 Pro2) z natywnym profilem kolorystycznym oprogramowania Armoury Crate. Jest też dedykowany profil sRGB, gdy chcemy pracować w mniejszej przestrzeni barw. Wyniki są już przyzwoite po wyjęciu z pudełka i tylko garstka kolorów odbiega od docelowego poziomu DeltaE-2000 wynoszącego 3. Pojawia się też drobny blue cast w połączeniu z nieco chłodniejszą temperaturą barwową, ale jest to zauważalne tylko w bezpośrednim porównaniu ze skalibrowanym ekranem.
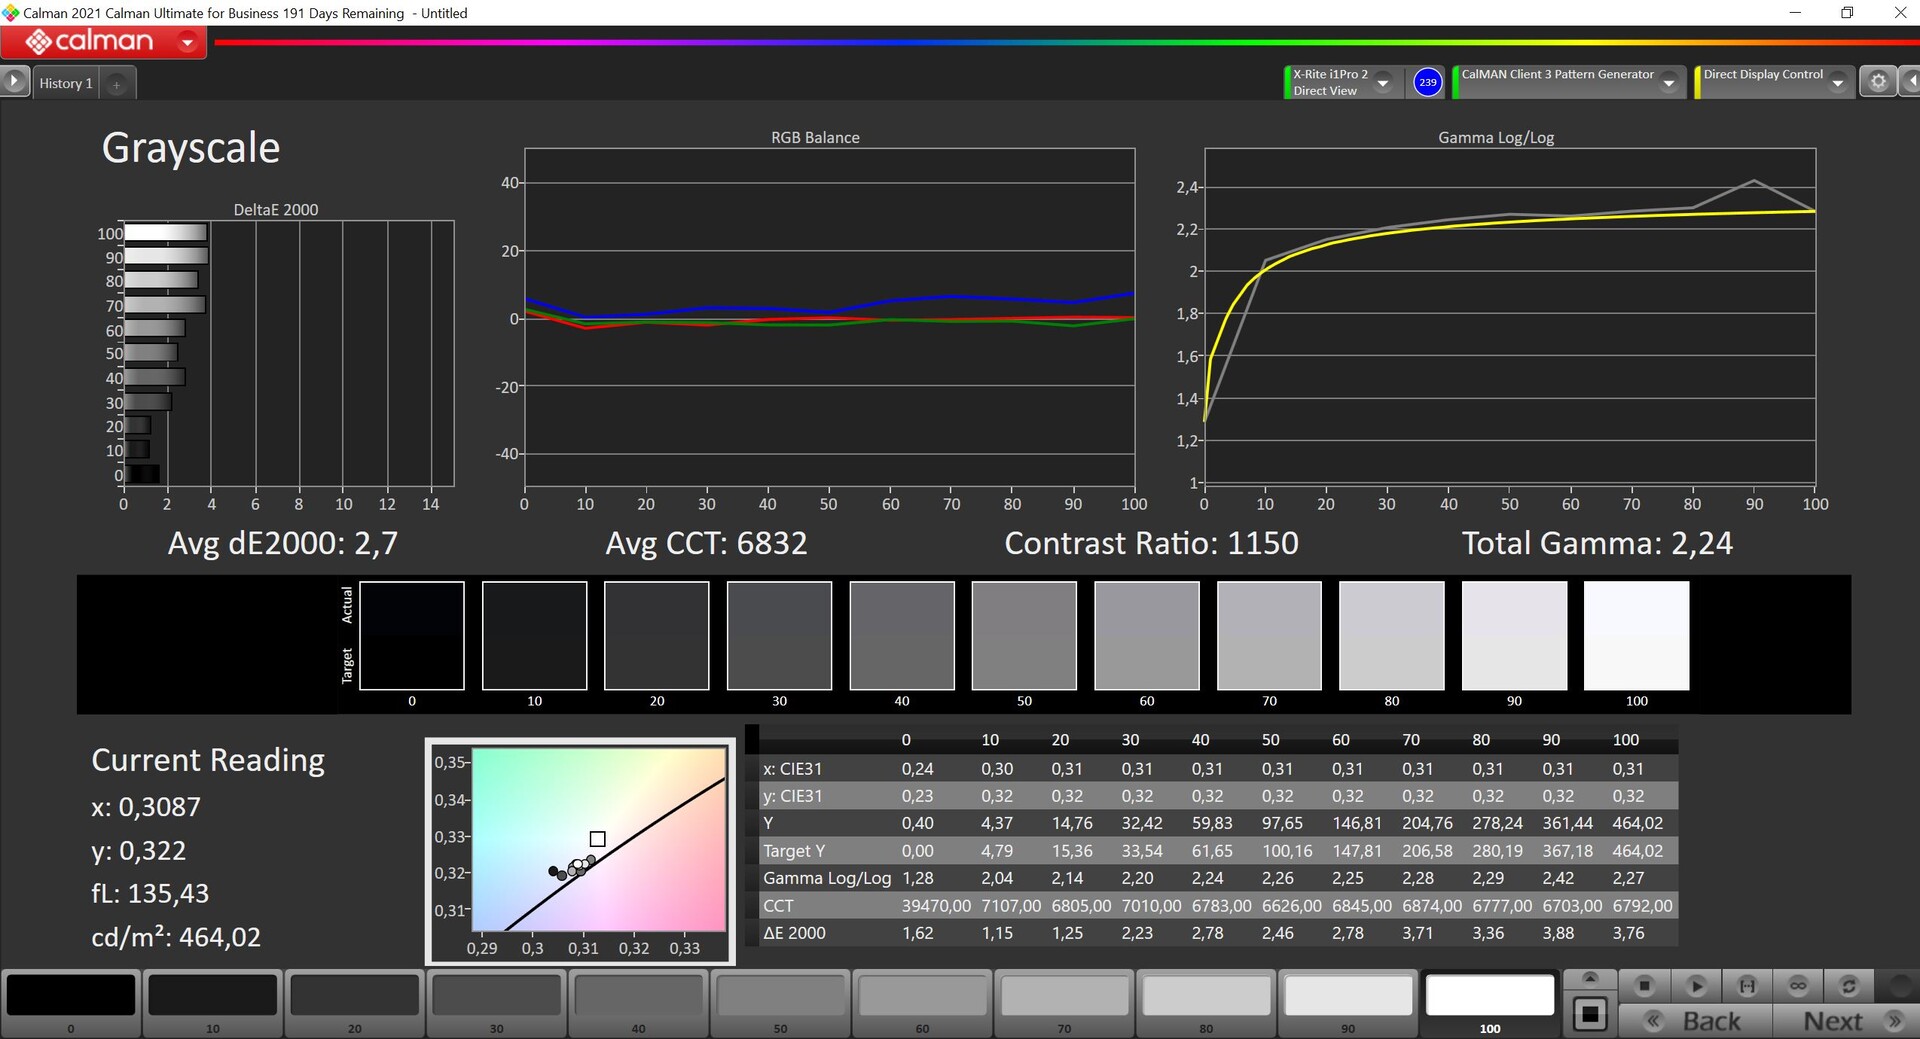
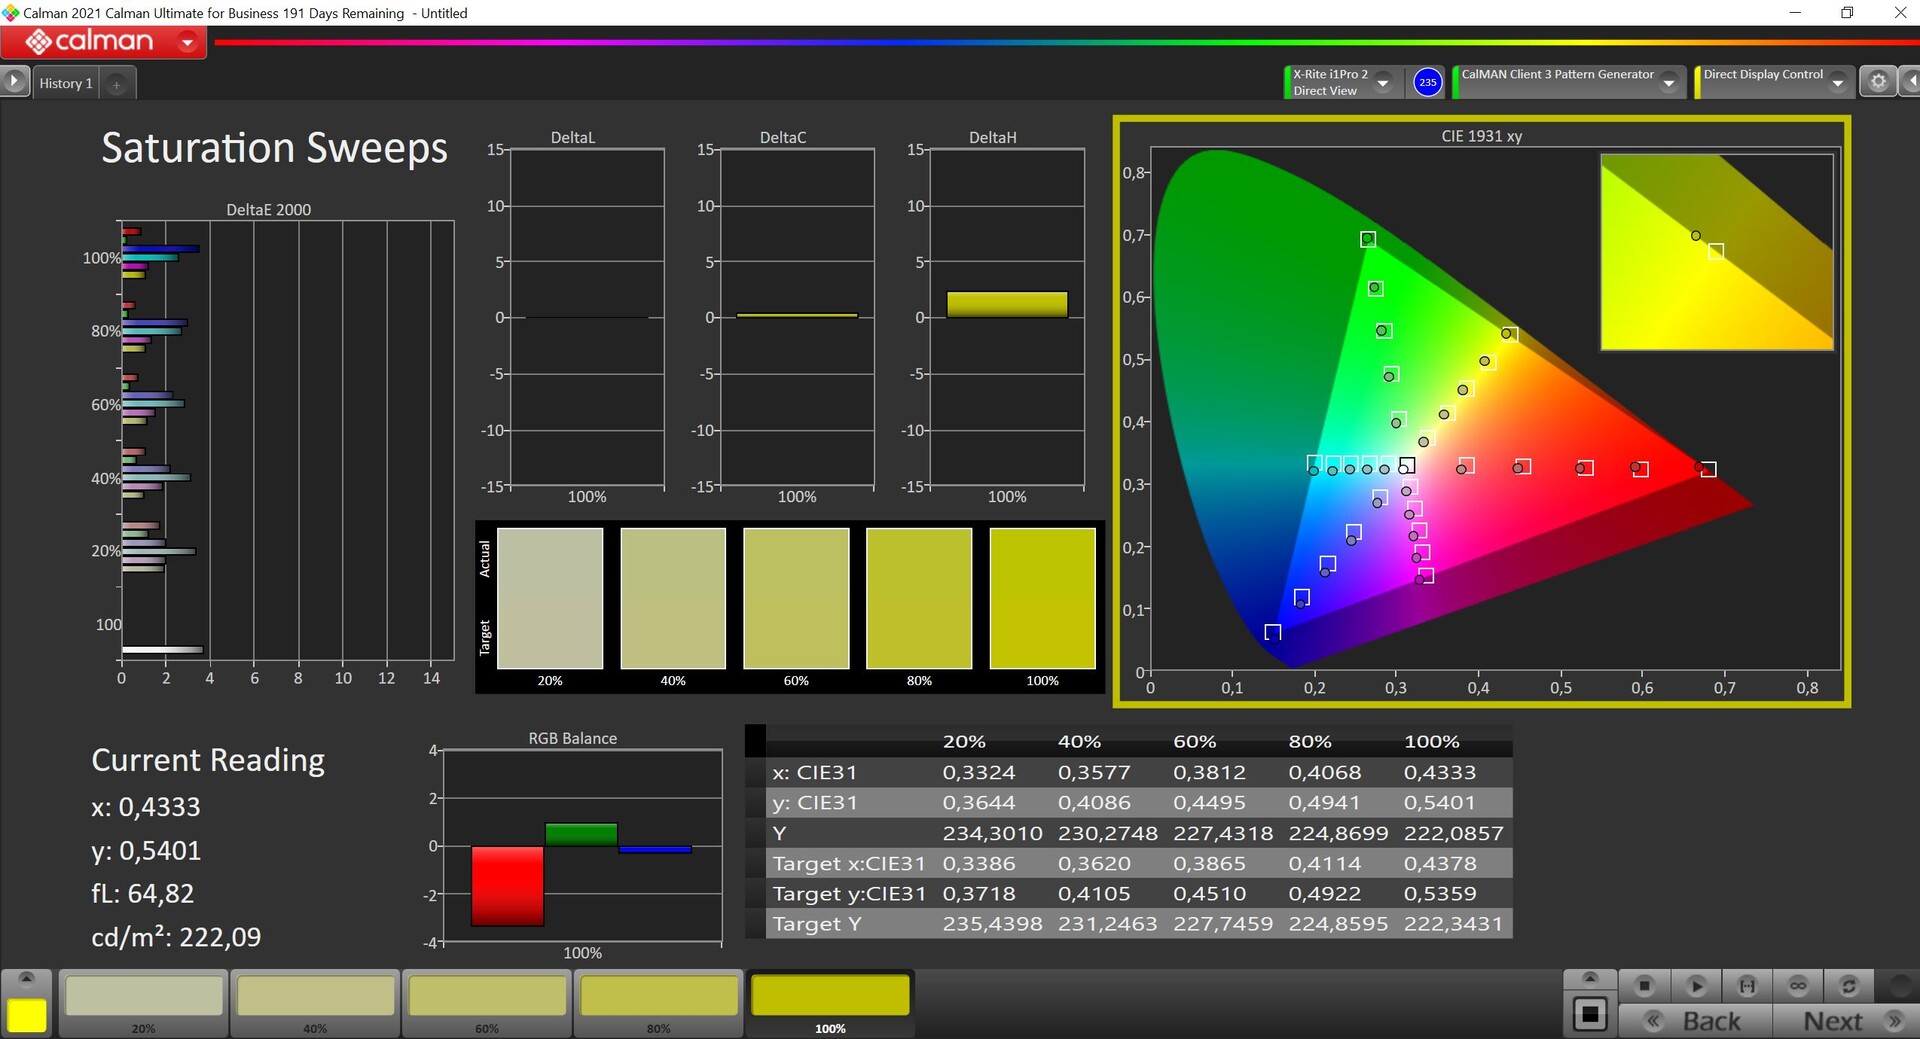
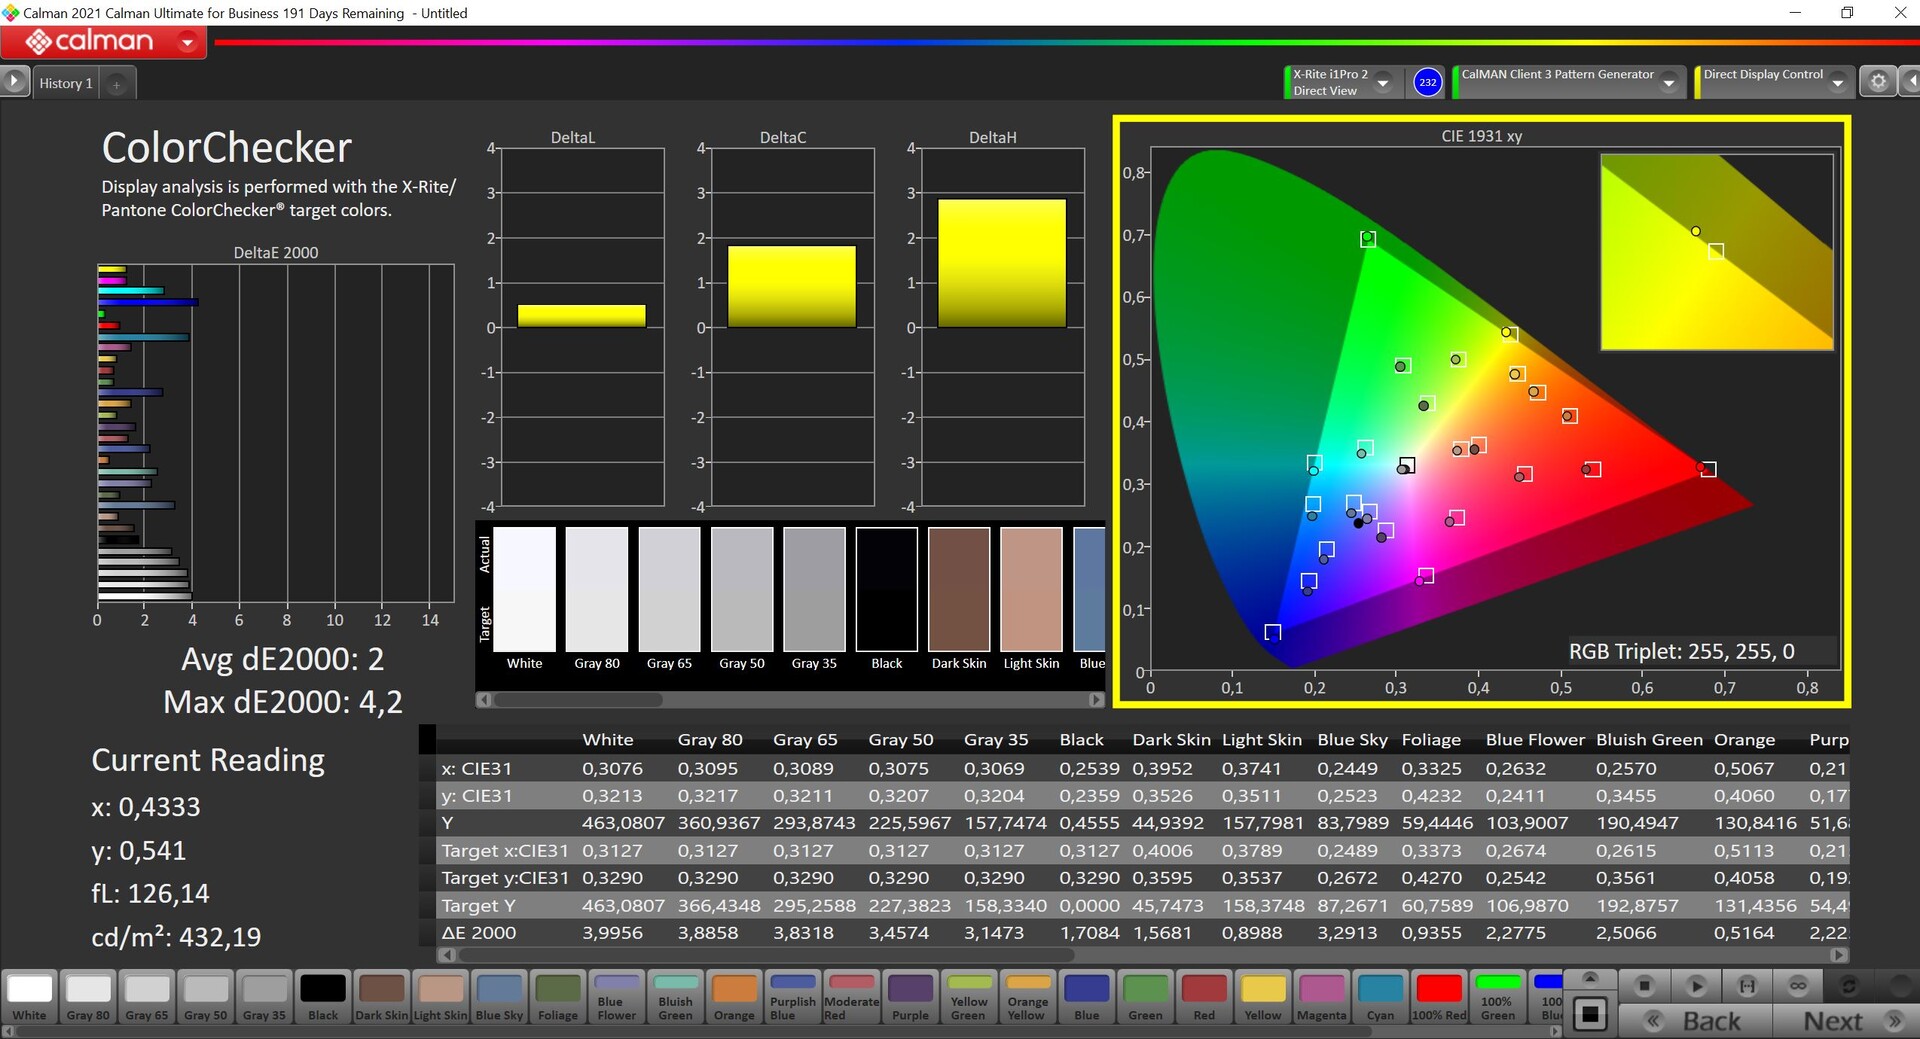
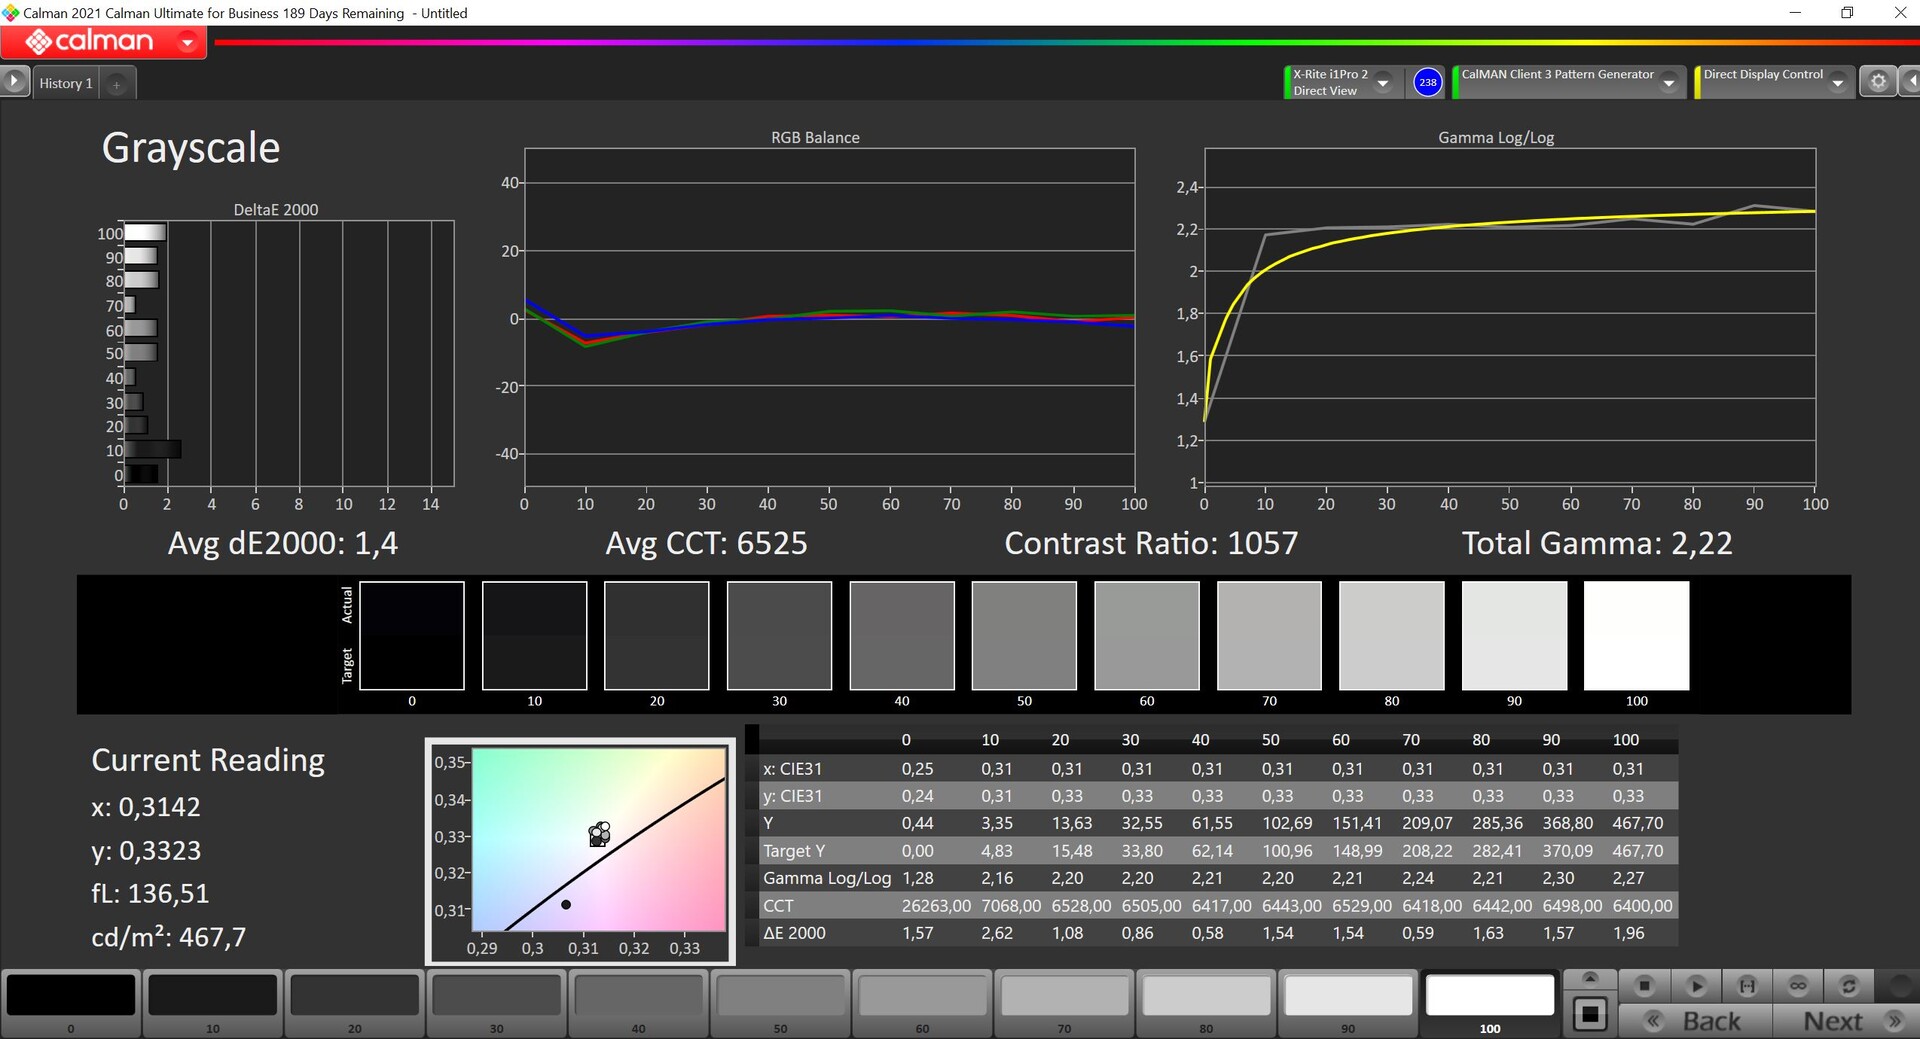
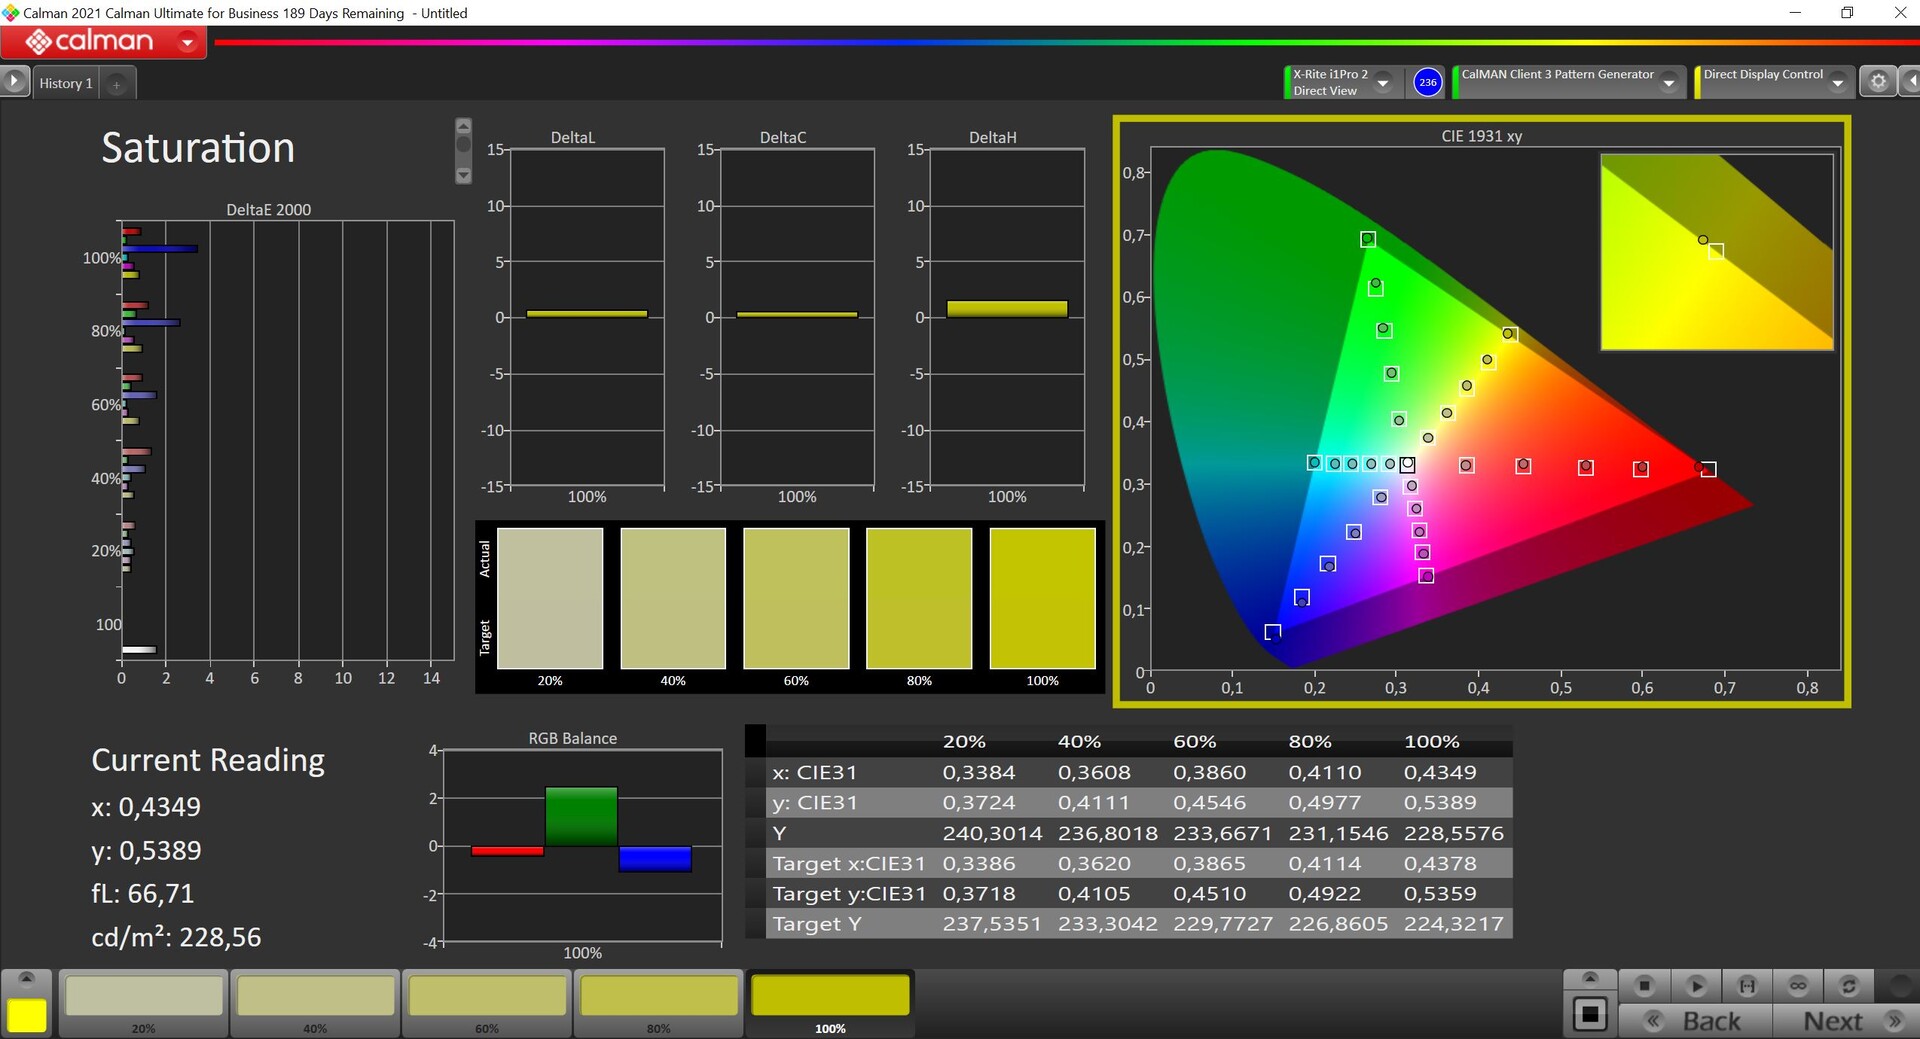
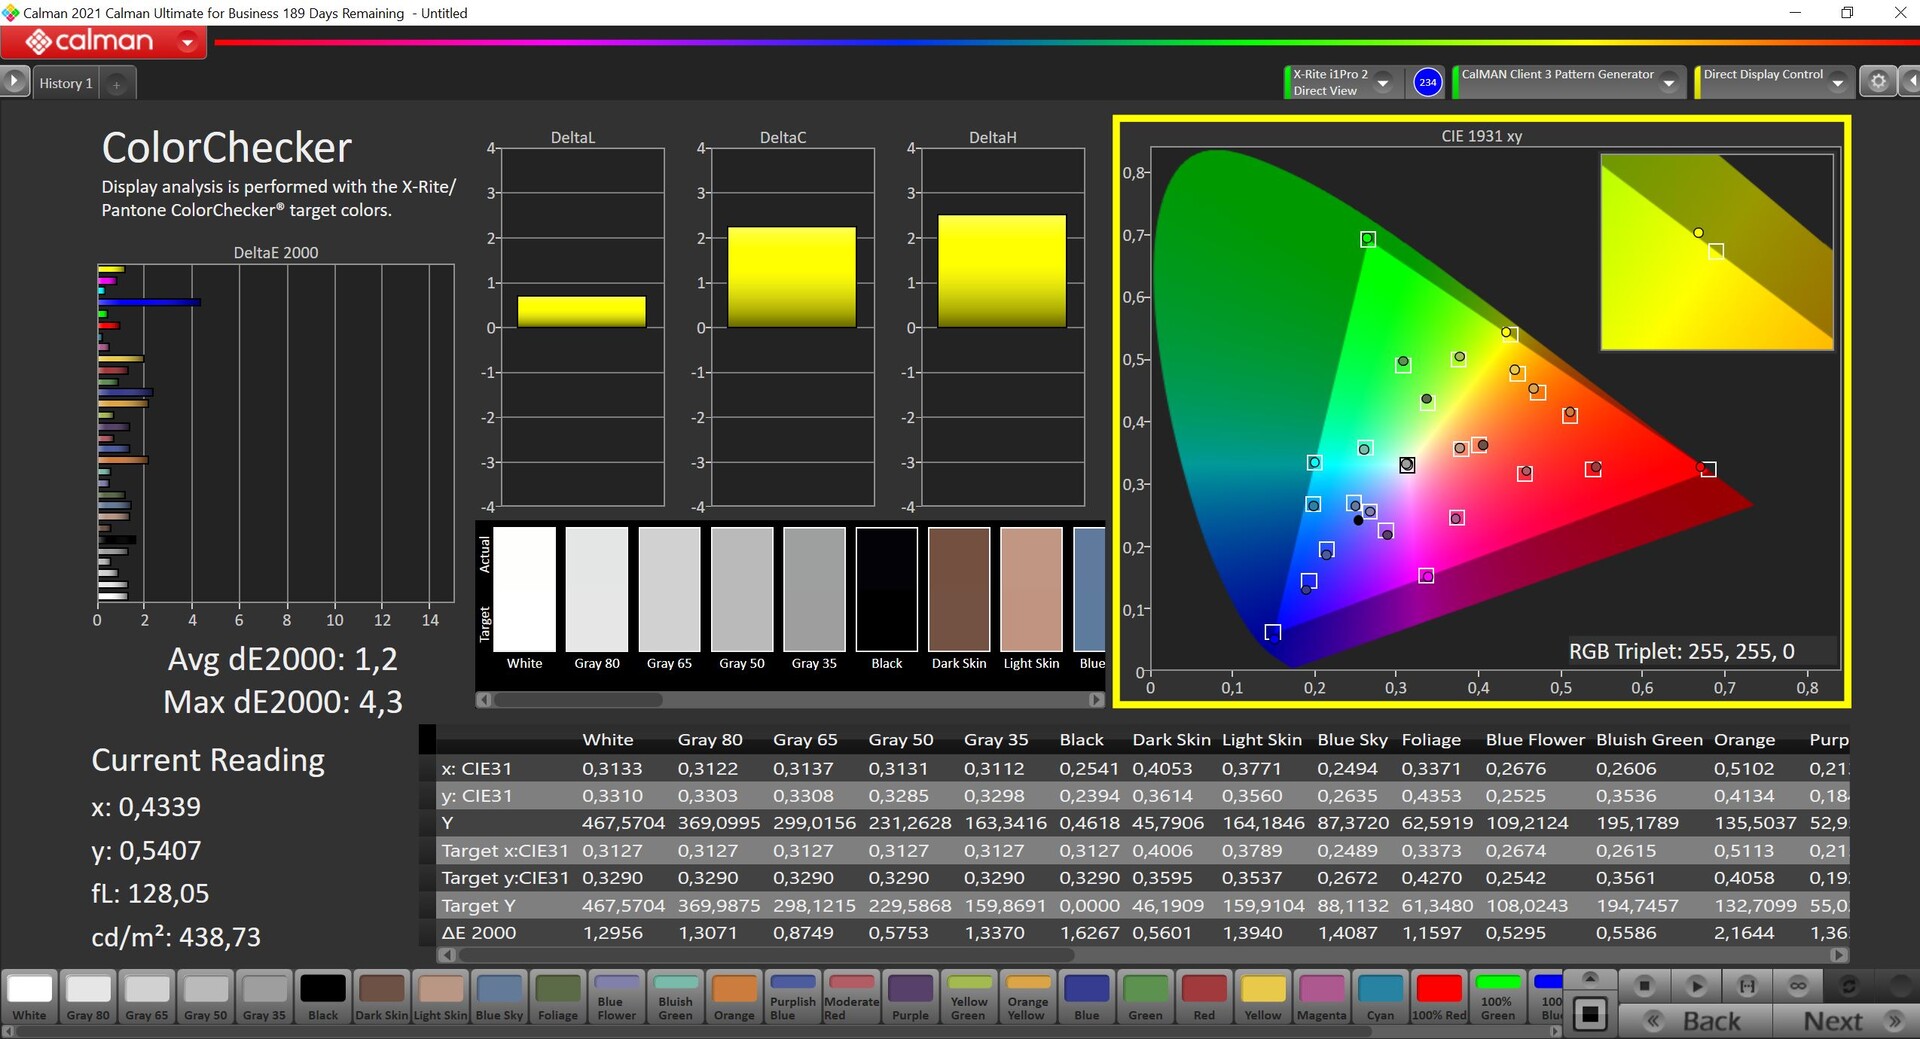
Nasza własna kalibracja (odpowiedni profil można pobrać za darmo w ramce powyżej) poprawia jakość prezentacji skali szarości, jak i kolorów. Jedynie 100-procentowy niebieski jest nadal odstający, ale w połączeniu z wysokim pokryciem DCI-P3 można jeszcze wykorzystać panel do pewnej edycji zdjęć i filmów. Jeśli Flow Z13 ma służyć tylko do grania w gry, to kalibracja ekranu nie jest raczej konieczna.
Wyświetl czasy reakcji
| ↔ Czas reakcji od czerni do bieli | ||
|---|---|---|
| 3 ms ... wzrost ↗ i spadek ↘ łącznie | ↗ 3 ms wzrost | 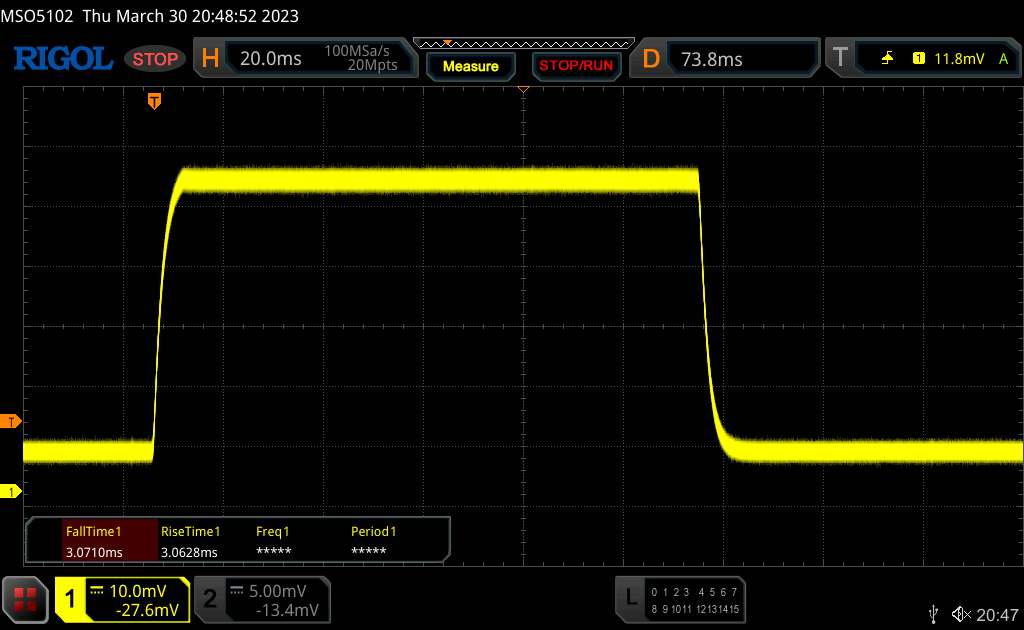 |
| ↘ 3 ms upadek | ||
| W naszych testach ekran wykazuje bardzo szybką reakcję i powinien bardzo dobrze nadawać się do szybkich gier. Dla porównania, wszystkie testowane urządzenia wahają się od 0.1 (minimum) do 240 (maksimum) ms. » 14 % wszystkich urządzeń jest lepszych. Oznacza to, że zmierzony czas reakcji jest lepszy od średniej wszystkich testowanych urządzeń (19.9 ms). | ||
| ↔ Czas reakcji 50% szarości do 80% szarości | ||
| 2.1 ms ... wzrost ↗ i spadek ↘ łącznie | ↗ 2.1 ms wzrost | 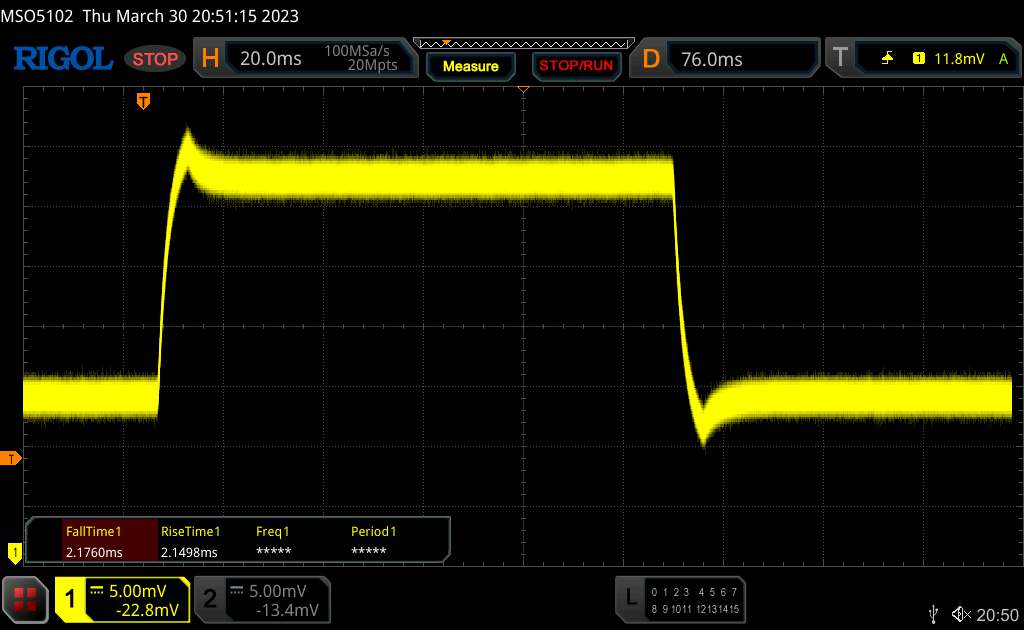 |
| ↘ 2.1 ms upadek | ||
| W naszych testach ekran wykazuje bardzo szybką reakcję i powinien bardzo dobrze nadawać się do szybkich gier. Dla porównania, wszystkie testowane urządzenia wahają się od 0.165 (minimum) do 636 (maksimum) ms. » 11 % wszystkich urządzeń jest lepszych. Oznacza to, że zmierzony czas reakcji jest lepszy od średniej wszystkich testowanych urządzeń (31.1 ms). | ||
Migotanie ekranu / PWM (modulacja szerokości impulsu)
| Migotanie ekranu/nie wykryto PWM |  | ||
Dla porównania: 52 % wszystkich testowanych urządzeń nie używa PWM do przyciemniania wyświetlacza. Jeśli wykryto PWM, zmierzono średnio 7798 (minimum: 5 - maksimum: 343500) Hz. | |||

Należy oczywiście unikać odbić od bezpośrednich źródeł światła na błyszczącym ekranie dotykowym, ale nie jest on tak odblaskowy jak wiele innych paneli i właściwie można nadal używać tego kabrioletu w bardzo jasnym otoczeniu. Stabilność kątów widzenia ekranu IPS jest bardzo dobra.

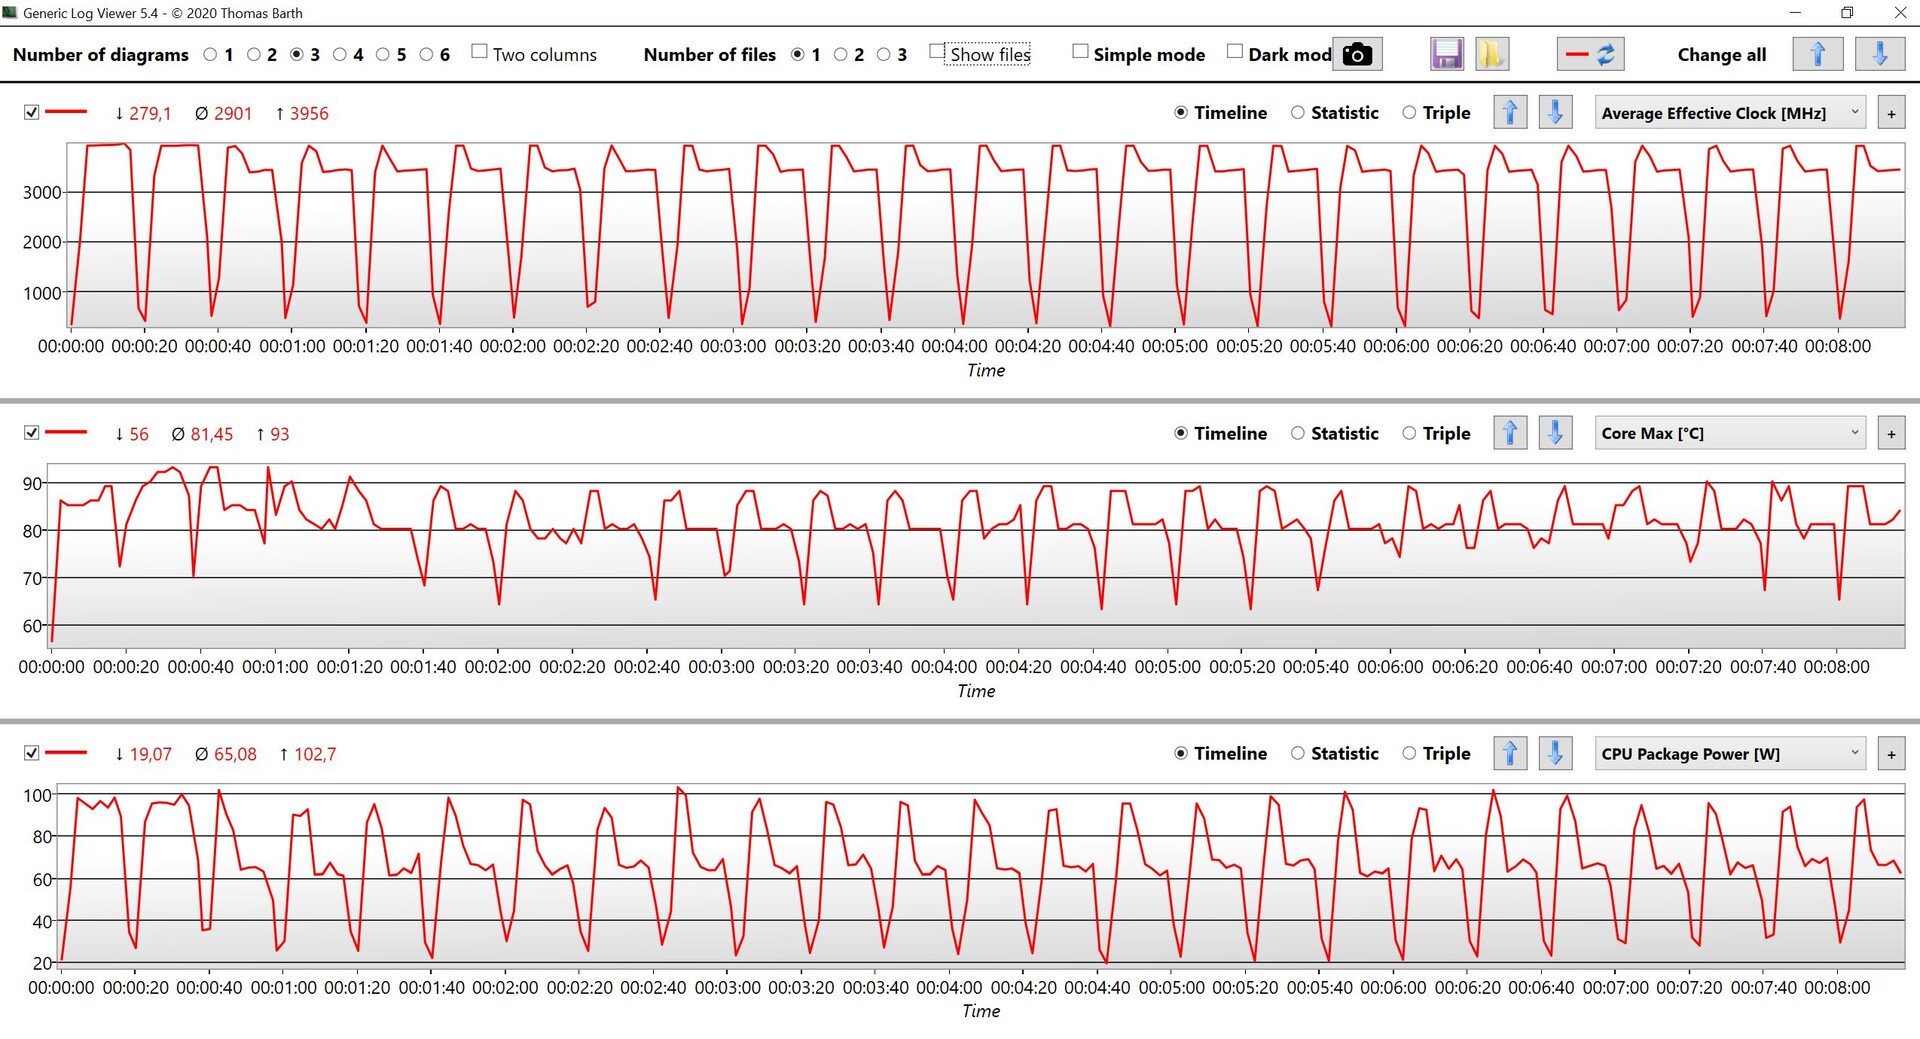
Performance - Raptor Lake i Ada Lovelace
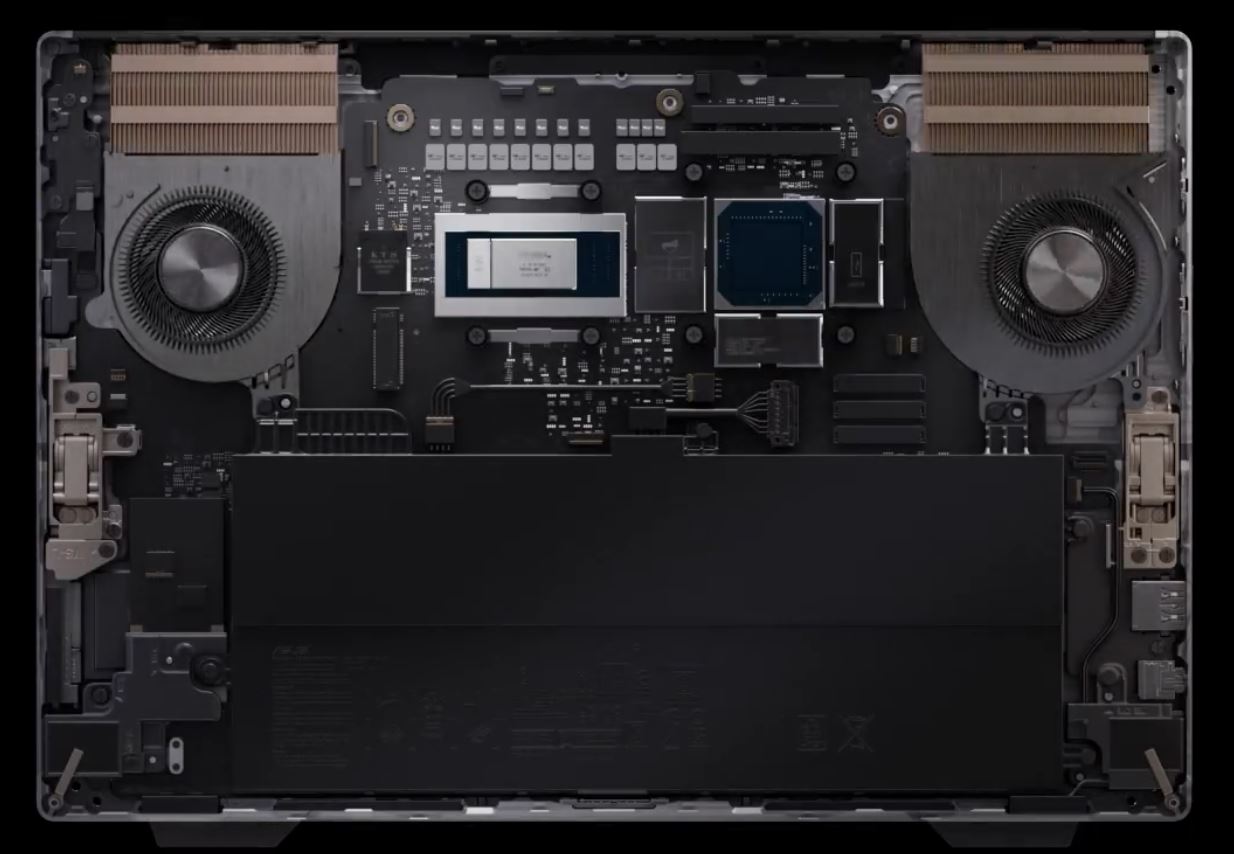
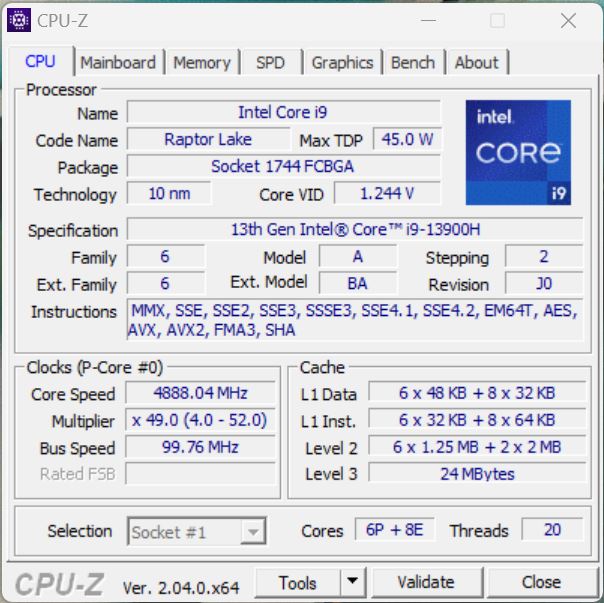
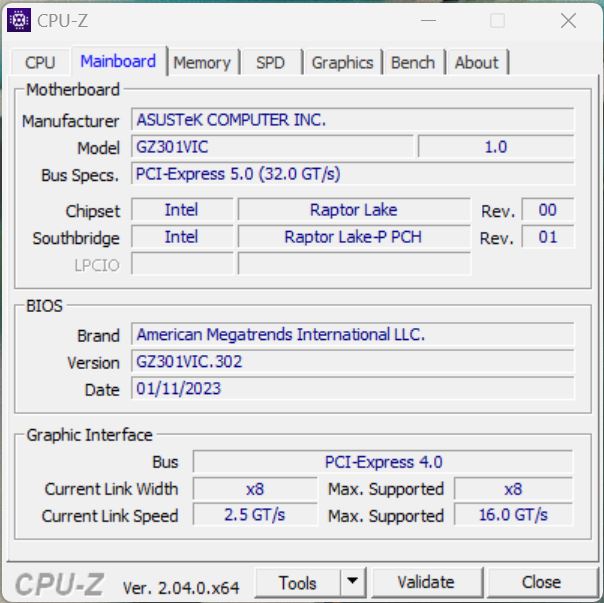
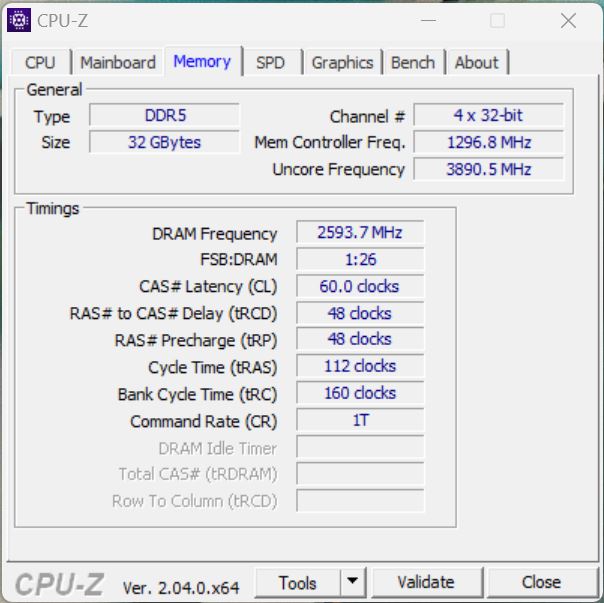
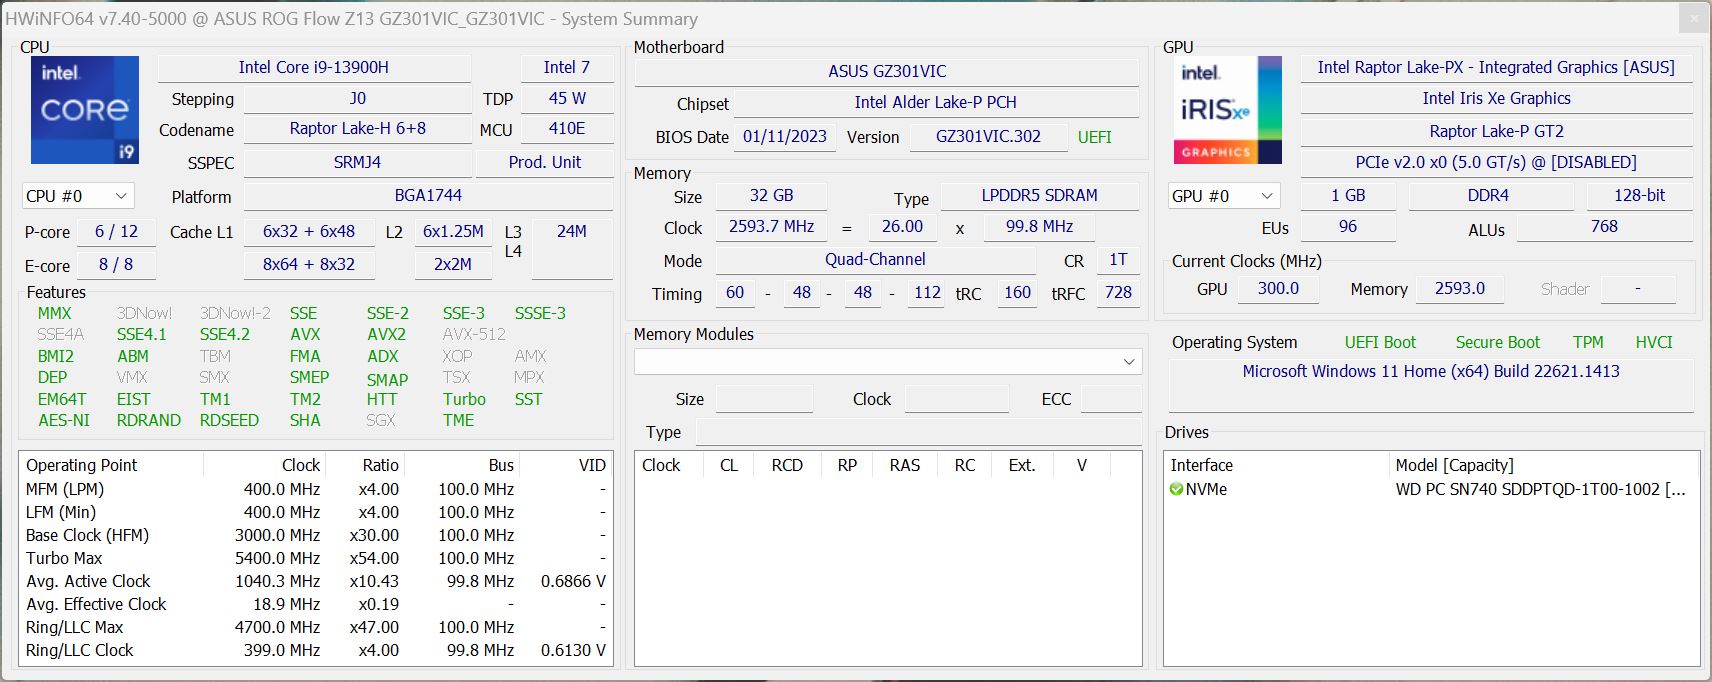
Wszystkie wersje 2023 ROG Flow Z13 są wyposażone w.Intel Core i9-13900H, ale nasza specjalna edycja ACRNM dostaje również nowyNvidia GeForce RTX 4070 Laptop(wersja 65W). Nasza jednostka jest dostarczana z 32 GB LPDDR5-5200 RAM, a także 1 TB PCIe-4.0 SSD.
Przegląd ustawień
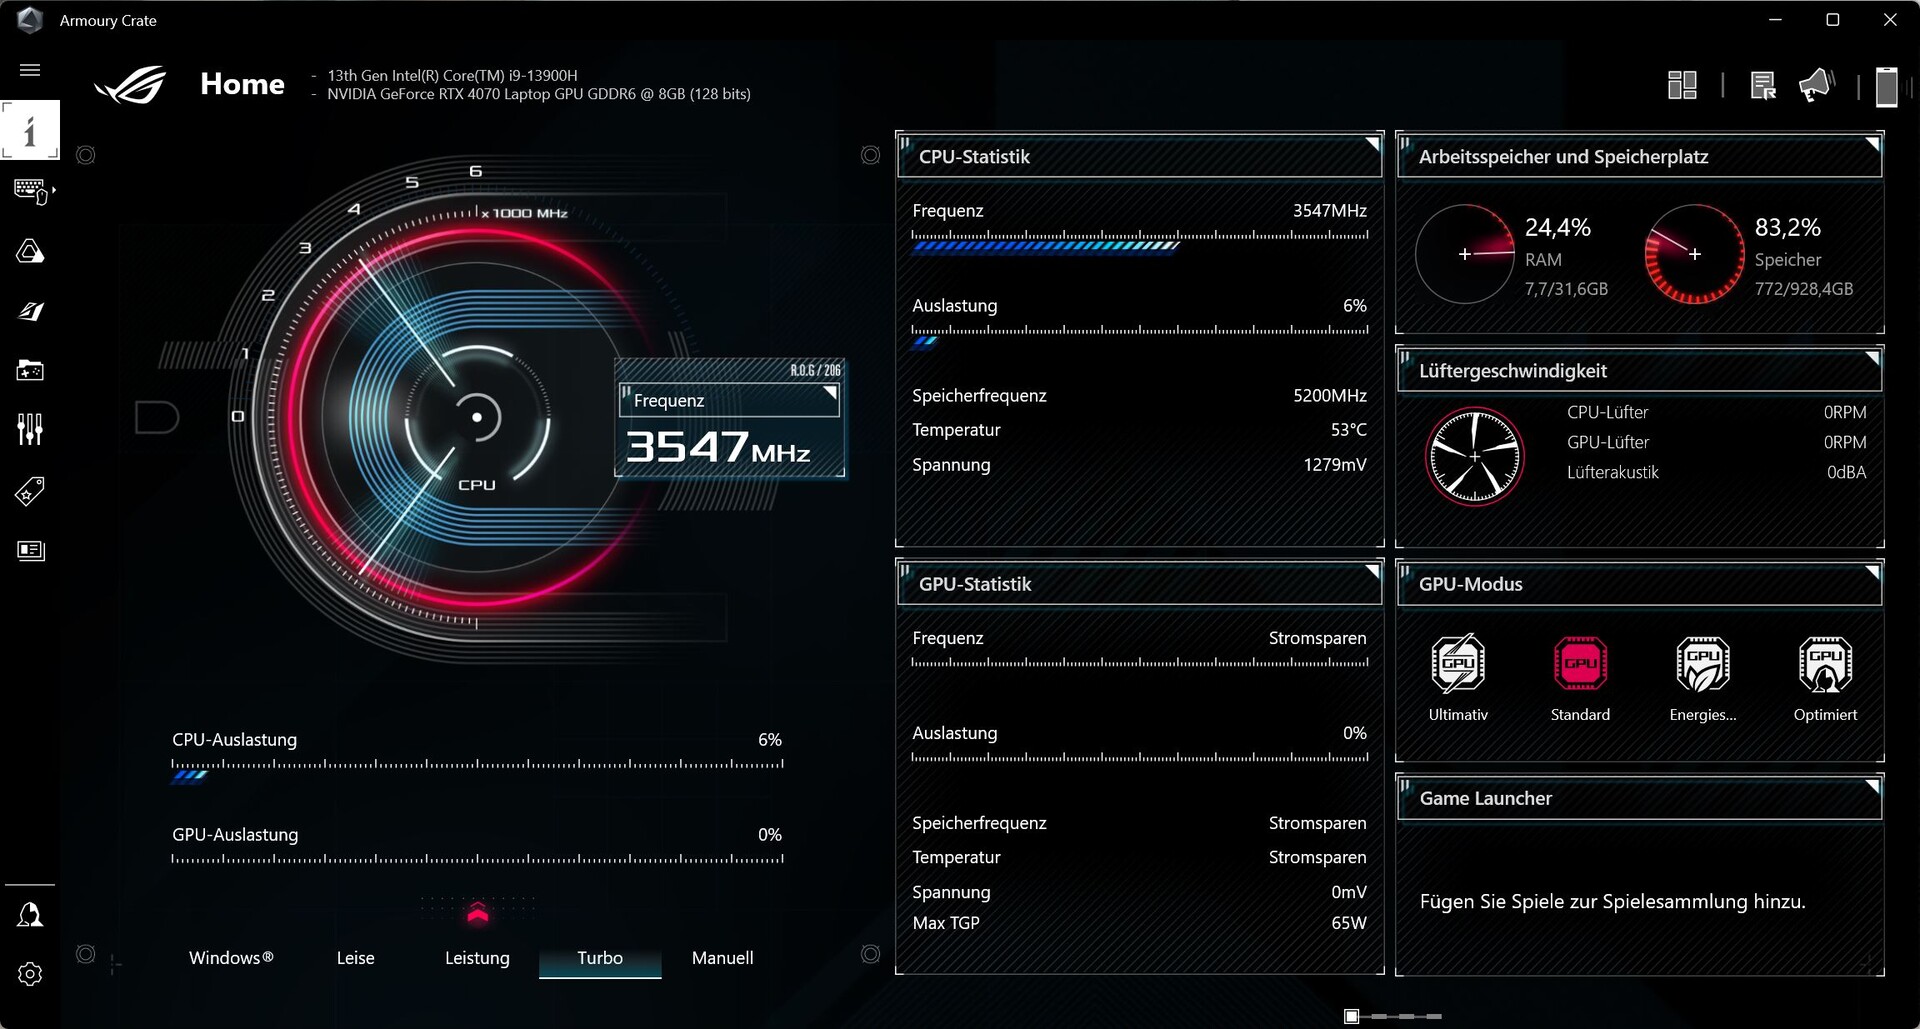
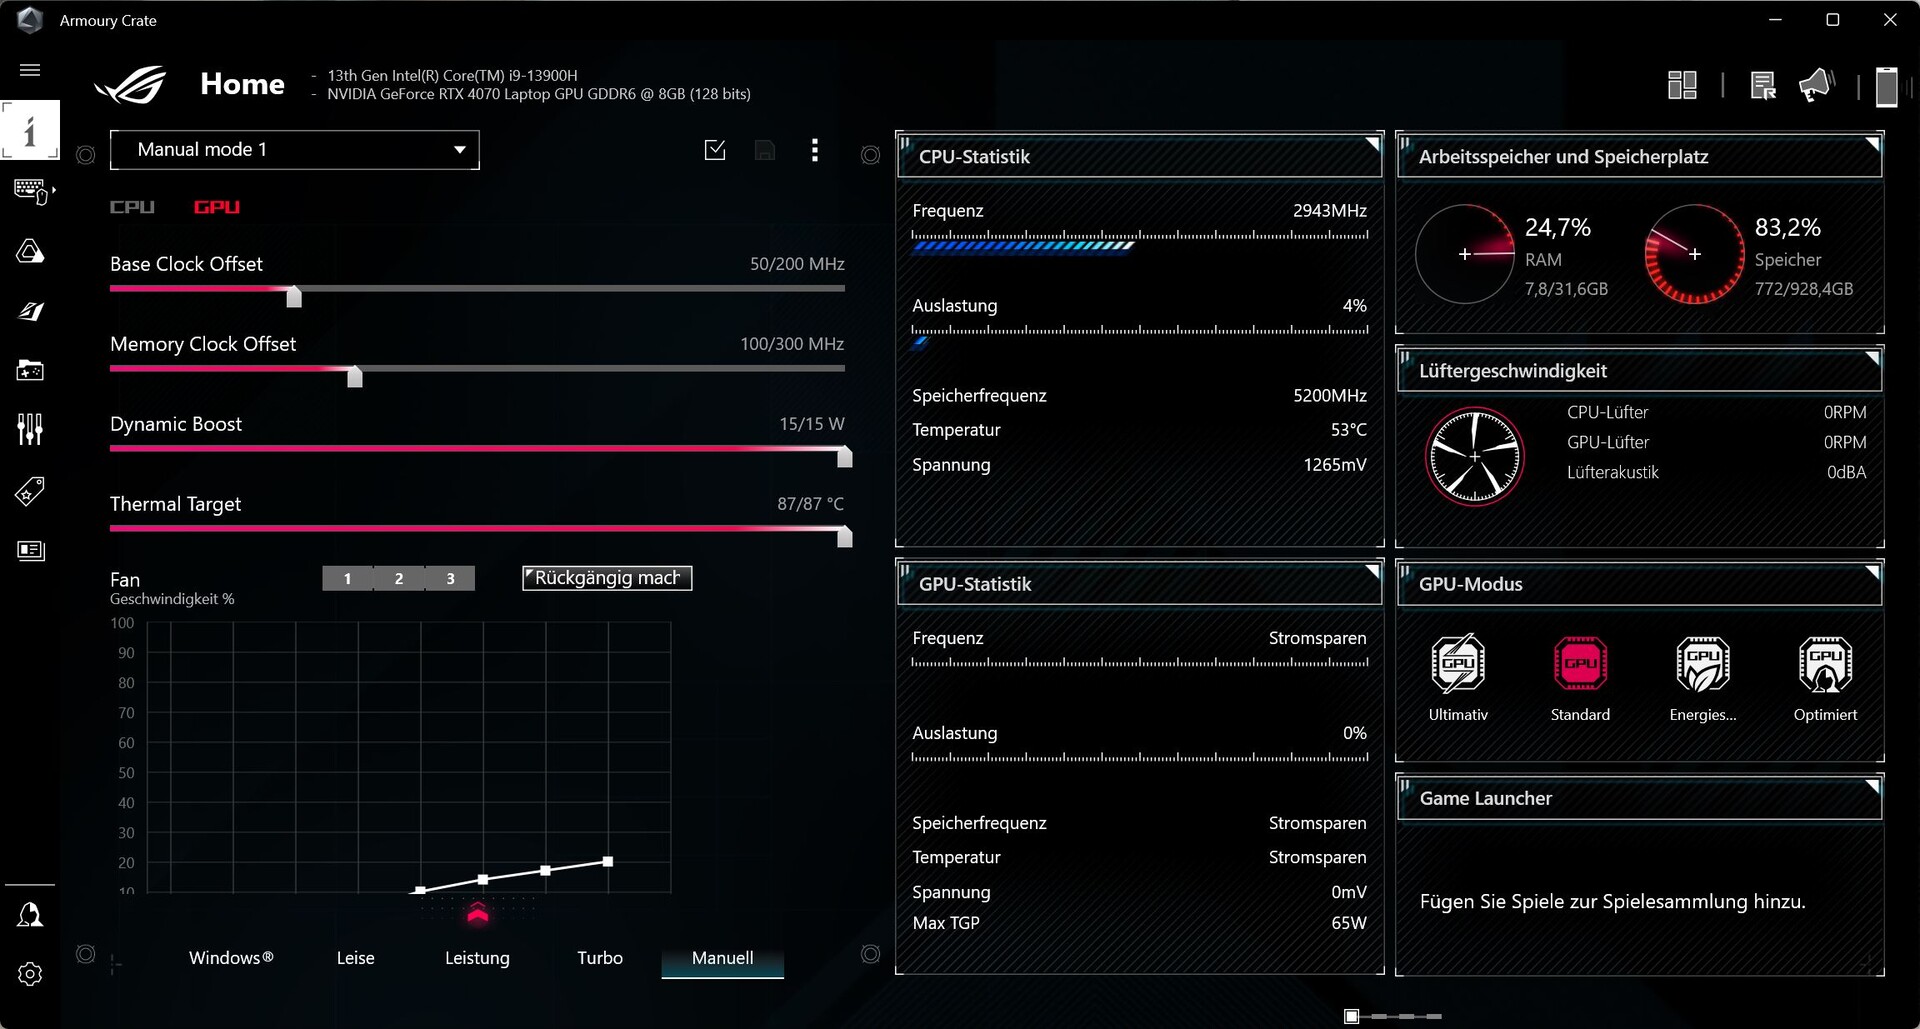
Oprogramowanie Armoury Crate znamy już z innych urządzeń ROG i oferuje ono kompleksowe ustawienia trybów zasilania, a także zachowania GPU. Możliwe jest na przykład całkowite wyłączenie iGPU. Podobnie jak w innych modelach ROG, zauważyliśmy, że dedykowane GPU musi być aktywne po podpięciu zewnętrznego ekranu, co w codziennych sytuacjach zwiększy zużycie energii. Tryby zasilania ROG wymieniliśmy w poniższej tabeli:
| Obciążenie CPU | Obciążenie GPU | Test obciążeniowy | Maksymalny hałas wentylatora | CB R23 Multi | Time Spy Grafika | |
|---|---|---|---|---|---|---|
| Quiet | 36/20 Wat | 35 Wat | CPU: 20 Wat GPU: 35 Watt |
36,5 dB(A) | 8207 punktów | 7344 punktów |
| Wydajność | 100/55 Watów | 50 Watów | CPU: ~35 Watt GPU: 30 W |
43,4 dB(A) | 15557 punktów | 8720 punktów |
| Turbo | 100/65 Watów | 65 Watów | CPU: 30-50 Watt GPU: 45 Watt |
46,9 dB(A) | 18682 pkt | 9513 pkt |
W naszych benchmarkach i pomiarach użyliśmy trybu Turbo, aby uzyskać maksymalną wydajność GPU. Należy pamiętać, że tryb Turbo jest dostępny tylko wtedy, gdy zasilacz jest podłączony. Przyjrzymy się także hałasowi wentylatora przy innych profilach zasilania.
Procesor - Core i9-13900H
Nowy Intel Raptor LakeCore i9-13900Hto w zasadzie staryCore i9-12900Hz poprzedniej wersji z nieco zwiększonymi częstotliwościami Turbo. W trybie Turbo power procesor może pobierać 100 W przy krótkich okresach pracy i 65 W przy długotrwałym obciążeniu. Oznacza to, że wciąż jesteśmy dość daleko od maksymalnego potencjału Core i9, ale ogólne wyniki są i tak bardzo dobre, biorąc pod uwagę kompaktowe rozmiary. Pobór energii z baterii jest ograniczony do 40 W, co oznacza, że w scenariuszach wielordzeniowych stracimy około 25% wydajności procesora. Proszę zobaczyć naszą sekcja techniczna aby zobaczyć więcej benchmarków.
Cinebench R15 Multi Loop
Cinebench R23: Multi Core | Single Core
Cinebench R20: CPU (Multi Core) | CPU (Single Core)
Cinebench R15: CPU Multi 64Bit | CPU Single 64Bit
Blender: v2.79 BMW27 CPU
7-Zip 18.03: 7z b 4 | 7z b 4 -mmt1
Geekbench 5.5: Multi-Core | Single-Core
HWBOT x265 Benchmark v2.2: 4k Preset
LibreOffice : 20 Documents To PDF
R Benchmark 2.5: Overall mean
| CPU Performance rating | |
| Średnia w klasie Gaming | |
| Asus ROG Zephyrus M16 GU604VY-NM042X | |
| Asus ROG Flow Z13 GZ301V | |
| Asus ROG Flow Z13 ACRNM | |
| Przeciętny Intel Core i9-13900H | |
| Asus ROG Flow Z13 GZ301ZE | |
| Gigabyte AERO 16 OLED BSF | |
| Apple MacBook Pro 14 2023 M2 Pro -6! | |
| Alienware x14 i7 RTX 3060 | |
| Razer Blade 14 Ryzen 9 6900HX | |
| Asus ROG Zephyrus G14 GA402RK | |
| Microsoft Surface Pro 9, i7-1255U | |
| Cinebench R23 / Multi Core | |
| Średnia w klasie Gaming (10488 - 40970, n=113, ostatnie 2 lata) | |
| Asus ROG Zephyrus M16 GU604VY-NM042X | |
| Gigabyte AERO 16 OLED BSF | |
| Asus ROG Flow Z13 ACRNM | |
| Asus ROG Flow Z13 GZ301V | |
| Przeciętny Intel Core i9-13900H (11997 - 20385, n=28) | |
| Alienware x14 i7 RTX 3060 | |
| Asus ROG Flow Z13 GZ301ZE | |
| Apple MacBook Pro 14 2023 M2 Pro | |
| Razer Blade 14 Ryzen 9 6900HX | |
| Asus ROG Zephyrus G14 GA402RK | |
| Microsoft Surface Pro 9, i7-1255U | |
| Cinebench R23 / Single Core | |
| Asus ROG Flow Z13 GZ301V | |
| Asus ROG Flow Z13 ACRNM | |
| Średnia w klasie Gaming (1166 - 2356, n=113, ostatnie 2 lata) | |
| Asus ROG Zephyrus M16 GU604VY-NM042X | |
| Asus ROG Flow Z13 GZ301ZE | |
| Przeciętny Intel Core i9-13900H (1297 - 2054, n=26) | |
| Alienware x14 i7 RTX 3060 | |
| Gigabyte AERO 16 OLED BSF | |
| Microsoft Surface Pro 9, i7-1255U | |
| Apple MacBook Pro 14 2023 M2 Pro | |
| Asus ROG Zephyrus G14 GA402RK | |
| Razer Blade 14 Ryzen 9 6900HX | |
| Cinebench R20 / CPU (Multi Core) | |
| Średnia w klasie Gaming (4029 - 16108, n=112, ostatnie 2 lata) | |
| Asus ROG Zephyrus M16 GU604VY-NM042X | |
| Gigabyte AERO 16 OLED BSF | |
| Asus ROG Flow Z13 ACRNM | |
| Asus ROG Flow Z13 GZ301V | |
| Przeciętny Intel Core i9-13900H (4935 - 7716, n=25) | |
| Alienware x14 i7 RTX 3060 | |
| Asus ROG Flow Z13 GZ301ZE | |
| Razer Blade 14 Ryzen 9 6900HX | |
| Asus ROG Zephyrus G14 GA402RK | |
| Apple MacBook Pro 14 2023 M2 Pro | |
| Microsoft Surface Pro 9, i7-1255U | |
| Cinebench R20 / CPU (Single Core) | |
| Asus ROG Flow Z13 GZ301V | |
| Asus ROG Flow Z13 ACRNM | |
| Średnia w klasie Gaming (442 - 895, n=112, ostatnie 2 lata) | |
| Asus ROG Zephyrus M16 GU604VY-NM042X | |
| Asus ROG Flow Z13 GZ301ZE | |
| Przeciętny Intel Core i9-13900H (428 - 792, n=25) | |
| Alienware x14 i7 RTX 3060 | |
| Gigabyte AERO 16 OLED BSF | |
| Microsoft Surface Pro 9, i7-1255U | |
| Asus ROG Zephyrus G14 GA402RK | |
| Razer Blade 14 Ryzen 9 6900HX | |
| Apple MacBook Pro 14 2023 M2 Pro | |
| Cinebench R15 / CPU Multi 64Bit | |
| Średnia w klasie Gaming (1578 - 6271, n=113, ostatnie 2 lata) | |
| Asus ROG Zephyrus M16 GU604VY-NM042X | |
| Gigabyte AERO 16 OLED BSF | |
| Asus ROG Flow Z13 GZ301V | |
| Asus ROG Flow Z13 ACRNM | |
| Asus ROG Flow Z13 GZ301ZE | |
| Przeciętny Intel Core i9-13900H (2061 - 3100, n=26) | |
| Alienware x14 i7 RTX 3060 | |
| Razer Blade 14 Ryzen 9 6900HX | |
| Apple MacBook Pro 14 2023 M2 Pro | |
| Asus ROG Zephyrus G14 GA402RK | |
| Microsoft Surface Pro 9, i7-1255U | |
| Cinebench R15 / CPU Single 64Bit | |
| Asus ROG Flow Z13 GZ301V | |
| Średnia w klasie Gaming (188.8 - 343, n=112, ostatnie 2 lata) | |
| Asus ROG Zephyrus M16 GU604VY-NM042X | |
| Asus ROG Flow Z13 ACRNM | |
| Asus ROG Flow Z13 GZ301ZE | |
| Przeciętny Intel Core i9-13900H (211 - 297, n=26) | |
| Asus ROG Zephyrus G14 GA402RK | |
| Alienware x14 i7 RTX 3060 | |
| Razer Blade 14 Ryzen 9 6900HX | |
| Gigabyte AERO 16 OLED BSF | |
| Apple MacBook Pro 14 2023 M2 Pro | |
| Microsoft Surface Pro 9, i7-1255U | |
| Blender / v2.79 BMW27 CPU | |
| Microsoft Surface Pro 9, i7-1255U | |
| Asus ROG Zephyrus G14 GA402RK | |
| Alienware x14 i7 RTX 3060 | |
| Razer Blade 14 Ryzen 9 6900HX | |
| Asus ROG Flow Z13 GZ301ZE | |
| Przeciętny Intel Core i9-13900H (166 - 268, n=24) | |
| Asus ROG Flow Z13 GZ301V | |
| Asus ROG Flow Z13 ACRNM | |
| Gigabyte AERO 16 OLED BSF | |
| Asus ROG Zephyrus M16 GU604VY-NM042X | |
| Średnia w klasie Gaming (80 - 330, n=110, ostatnie 2 lata) | |
| 7-Zip 18.03 / 7z b 4 | |
| Średnia w klasie Gaming (33491 - 148086, n=111, ostatnie 2 lata) | |
| Asus ROG Zephyrus M16 GU604VY-NM042X | |
| Gigabyte AERO 16 OLED BSF | |
| Asus ROG Flow Z13 GZ301V | |
| Asus ROG Flow Z13 ACRNM | |
| Alienware x14 i7 RTX 3060 | |
| Przeciętny Intel Core i9-13900H (45045 - 79032, n=25) | |
| Asus ROG Flow Z13 GZ301ZE | |
| Razer Blade 14 Ryzen 9 6900HX | |
| Asus ROG Zephyrus G14 GA402RK | |
| Microsoft Surface Pro 9, i7-1255U | |
| 7-Zip 18.03 / 7z b 4 -mmt1 | |
| Asus ROG Flow Z13 GZ301V | |
| Średnia w klasie Gaming (4199 - 7436, n=111, ostatnie 2 lata) | |
| Asus ROG Flow Z13 ACRNM | |
| Asus ROG Zephyrus M16 GU604VY-NM042X | |
| Asus ROG Flow Z13 GZ301ZE | |
| Przeciętny Intel Core i9-13900H (3665 - 6600, n=25) | |
| Asus ROG Zephyrus G14 GA402RK | |
| Razer Blade 14 Ryzen 9 6900HX | |
| Alienware x14 i7 RTX 3060 | |
| Gigabyte AERO 16 OLED BSF | |
| Microsoft Surface Pro 9, i7-1255U | |
| Geekbench 5.5 / Multi-Core | |
| Średnia w klasie Gaming (6460 - 27010, n=111, ostatnie 2 lata) | |
| Asus ROG Zephyrus M16 GU604VY-NM042X | |
| Apple MacBook Pro 14 2023 M2 Pro | |
| Asus ROG Flow Z13 GZ301V | |
| Asus ROG Flow Z13 ACRNM | |
| Asus ROG Flow Z13 GZ301ZE | |
| Gigabyte AERO 16 OLED BSF | |
| Alienware x14 i7 RTX 3060 | |
| Przeciętny Intel Core i9-13900H (9094 - 15410, n=26) | |
| Asus ROG Zephyrus G14 GA402RK | |
| Razer Blade 14 Ryzen 9 6900HX | |
| Microsoft Surface Pro 9, i7-1255U | |
| Geekbench 5.5 / Single-Core | |
| Średnia w klasie Gaming (986 - 2474, n=111, ostatnie 2 lata) | |
| Asus ROG Flow Z13 GZ301V | |
| Asus ROG Flow Z13 ACRNM | |
| Asus ROG Zephyrus M16 GU604VY-NM042X | |
| Apple MacBook Pro 14 2023 M2 Pro | |
| Przeciętny Intel Core i9-13900H (1140 - 2043, n=26) | |
| Asus ROG Flow Z13 GZ301ZE | |
| Alienware x14 i7 RTX 3060 | |
| Gigabyte AERO 16 OLED BSF | |
| Microsoft Surface Pro 9, i7-1255U | |
| Asus ROG Zephyrus G14 GA402RK | |
| Razer Blade 14 Ryzen 9 6900HX | |
| HWBOT x265 Benchmark v2.2 / 4k Preset | |
| Średnia w klasie Gaming (11.5 - 44.3, n=111, ostatnie 2 lata) | |
| Asus ROG Zephyrus M16 GU604VY-NM042X | |
| Gigabyte AERO 16 OLED BSF | |
| Asus ROG Flow Z13 ACRNM | |
| Asus ROG Flow Z13 GZ301V | |
| Przeciętny Intel Core i9-13900H (14.1 - 22.3, n=25) | |
| Razer Blade 14 Ryzen 9 6900HX | |
| Alienware x14 i7 RTX 3060 | |
| Asus ROG Flow Z13 GZ301ZE | |
| Asus ROG Zephyrus G14 GA402RK | |
| Microsoft Surface Pro 9, i7-1255U | |
| LibreOffice / 20 Documents To PDF | |
| Asus ROG Flow Z13 ACRNM | |
| Gigabyte AERO 16 OLED BSF | |
| Microsoft Surface Pro 9, i7-1255U | |
| Asus ROG Zephyrus M16 GU604VY-NM042X | |
| Razer Blade 14 Ryzen 9 6900HX | |
| Średnia w klasie Gaming (19 - 88.8, n=111, ostatnie 2 lata) | |
| Asus ROG Zephyrus G14 GA402RK | |
| Przeciętny Intel Core i9-13900H (34.4 - 82.8, n=25) | |
| Asus ROG Flow Z13 GZ301ZE | |
| Asus ROG Flow Z13 GZ301V | |
| Alienware x14 i7 RTX 3060 | |
| R Benchmark 2.5 / Overall mean | |
| Microsoft Surface Pro 9, i7-1255U | |
| Gigabyte AERO 16 OLED BSF | |
| Razer Blade 14 Ryzen 9 6900HX | |
| Asus ROG Zephyrus G14 GA402RK | |
| Alienware x14 i7 RTX 3060 | |
| Przeciętny Intel Core i9-13900H (0.4052 - 0.723, n=25) | |
| Średnia w klasie Gaming (0.3439 - 0.759, n=112, ostatnie 2 lata) | |
| Asus ROG Flow Z13 GZ301ZE | |
| Asus ROG Flow Z13 ACRNM | |
| Asus ROG Zephyrus M16 GU604VY-NM042X | |
| Asus ROG Flow Z13 GZ301V | |
* ... im mniej tym lepiej
AIDA64: FP32 Ray-Trace | FPU Julia | CPU SHA3 | CPU Queen | FPU SinJulia | FPU Mandel | CPU AES | CPU ZLib | FP64 Ray-Trace | CPU PhotoWorxx
| Performance rating | |
| Średnia w klasie Gaming | |
| Gigabyte AERO 16 OLED BSF | |
| Razer Blade 14 Ryzen 9 6900HX | |
| Asus ROG Flow Z13 ACRNM | |
| Asus ROG Zephyrus G14 GA402RK | |
| Asus ROG Flow Z13 GZ301V | |
| Przeciętny Intel Core i9-13900H | |
| Alienware x14 i7 RTX 3060 | |
| Asus ROG Flow Z13 GZ301ZE | |
| AIDA64 / FP32 Ray-Trace | |
| Średnia w klasie Gaming (10227 - 85542, n=110, ostatnie 2 lata) | |
| Gigabyte AERO 16 OLED BSF | |
| Asus ROG Flow Z13 ACRNM | |
| Razer Blade 14 Ryzen 9 6900HX | |
| Asus ROG Flow Z13 GZ301V | |
| Przeciętny Intel Core i9-13900H (6788 - 19557, n=25) | |
| Asus ROG Zephyrus G14 GA402RK | |
| Alienware x14 i7 RTX 3060 | |
| Asus ROG Flow Z13 GZ301ZE | |
| AIDA64 / FPU Julia | |
| Średnia w klasie Gaming (51376 - 238426, n=110, ostatnie 2 lata) | |
| Razer Blade 14 Ryzen 9 6900HX | |
| Gigabyte AERO 16 OLED BSF | |
| Asus ROG Zephyrus G14 GA402RK | |
| Asus ROG Flow Z13 ACRNM | |
| Asus ROG Flow Z13 GZ301V | |
| Przeciętny Intel Core i9-13900H (22551 - 95579, n=25) | |
| Alienware x14 i7 RTX 3060 | |
| Asus ROG Flow Z13 GZ301ZE | |
| AIDA64 / CPU SHA3 | |
| Średnia w klasie Gaming (2180 - 9817, n=110, ostatnie 2 lata) | |
| Gigabyte AERO 16 OLED BSF | |
| Asus ROG Flow Z13 ACRNM | |
| Przeciętny Intel Core i9-13900H (2491 - 4270, n=25) | |
| Asus ROG Flow Z13 GZ301V | |
| Razer Blade 14 Ryzen 9 6900HX | |
| Asus ROG Zephyrus G14 GA402RK | |
| Alienware x14 i7 RTX 3060 | |
| Asus ROG Flow Z13 GZ301ZE | |
| AIDA64 / CPU Queen | |
| Średnia w klasie Gaming (49785 - 173351, n=101, ostatnie 2 lata) | |
| Asus ROG Flow Z13 GZ301V | |
| Asus ROG Flow Z13 ACRNM | |
| Przeciętny Intel Core i9-13900H (65121 - 120936, n=25) | |
| Asus ROG Flow Z13 GZ301ZE | |
| Asus ROG Zephyrus G14 GA402RK | |
| Razer Blade 14 Ryzen 9 6900HX | |
| Alienware x14 i7 RTX 3060 | |
| Gigabyte AERO 16 OLED BSF | |
| AIDA64 / FPU SinJulia | |
| Średnia w klasie Gaming (4424 - 33636, n=110, ostatnie 2 lata) | |
| Razer Blade 14 Ryzen 9 6900HX | |
| Asus ROG Zephyrus G14 GA402RK | |
| Asus ROG Flow Z13 ACRNM | |
| Gigabyte AERO 16 OLED BSF | |
| Asus ROG Flow Z13 GZ301V | |
| Przeciętny Intel Core i9-13900H (6108 - 11631, n=25) | |
| Alienware x14 i7 RTX 3060 | |
| Asus ROG Flow Z13 GZ301ZE | |
| AIDA64 / FPU Mandel | |
| Średnia w klasie Gaming (25115 - 128721, n=110, ostatnie 2 lata) | |
| Razer Blade 14 Ryzen 9 6900HX | |
| Asus ROG Zephyrus G14 GA402RK | |
| Gigabyte AERO 16 OLED BSF | |
| Asus ROG Flow Z13 ACRNM | |
| Asus ROG Flow Z13 GZ301V | |
| Przeciętny Intel Core i9-13900H (11283 - 48474, n=25) | |
| Alienware x14 i7 RTX 3060 | |
| Asus ROG Flow Z13 GZ301ZE | |
| AIDA64 / CPU AES | |
| Gigabyte AERO 16 OLED BSF | |
| Razer Blade 14 Ryzen 9 6900HX | |
| Asus ROG Zephyrus G14 GA402RK | |
| Średnia w klasie Gaming (39258 - 247074, n=110, ostatnie 2 lata) | |
| Alienware x14 i7 RTX 3060 | |
| Przeciętny Intel Core i9-13900H (3691 - 149377, n=25) | |
| Asus ROG Flow Z13 GZ301ZE | |
| Asus ROG Flow Z13 ACRNM | |
| Asus ROG Flow Z13 GZ301V | |
| AIDA64 / CPU ZLib | |
| Średnia w klasie Gaming (574 - 2531, n=110, ostatnie 2 lata) | |
| Asus ROG Flow Z13 ACRNM | |
| Gigabyte AERO 16 OLED BSF | |
| Asus ROG Flow Z13 GZ301V | |
| Przeciętny Intel Core i9-13900H (789 - 1254, n=25) | |
| Alienware x14 i7 RTX 3060 | |
| Asus ROG Flow Z13 GZ301ZE | |
| Razer Blade 14 Ryzen 9 6900HX | |
| Asus ROG Zephyrus G14 GA402RK | |
| AIDA64 / FP64 Ray-Trace | |
| Średnia w klasie Gaming (5509 - 45446, n=110, ostatnie 2 lata) | |
| Gigabyte AERO 16 OLED BSF | |
| Asus ROG Flow Z13 ACRNM | |
| Razer Blade 14 Ryzen 9 6900HX | |
| Asus ROG Flow Z13 GZ301V | |
| Przeciętny Intel Core i9-13900H (3655 - 10716, n=25) | |
| Asus ROG Zephyrus G14 GA402RK | |
| Alienware x14 i7 RTX 3060 | |
| Asus ROG Flow Z13 GZ301ZE | |
| AIDA64 / CPU PhotoWorxx | |
| Alienware x14 i7 RTX 3060 | |
| Gigabyte AERO 16 OLED BSF | |
| Średnia w klasie Gaming (12271 - 89891, n=110, ostatnie 2 lata) | |
| Asus ROG Flow Z13 ACRNM | |
| Asus ROG Flow Z13 GZ301ZE | |
| Asus ROG Flow Z13 GZ301V | |
| Przeciętny Intel Core i9-13900H (10871 - 50488, n=25) | |
| Asus ROG Zephyrus G14 GA402RK | |
| Razer Blade 14 Ryzen 9 6900HX | |
Wydajność systemu
Wydajność systemowa ROG Flow Z13 jest znakomita, co potwierdzają dobre wyniki w benchmarkach, a także nasze subiektywne wrażenie wydajności.
CrossMark: Overall | Productivity | Creativity | Responsiveness
| PCMark 10 / Score | |
| Średnia w klasie Gaming (5828 - 11574, n=96, ostatnie 2 lata) | |
| Gigabyte AERO 16 OLED BSF | |
| Asus ROG Flow Z13 ACRNM | |
| Asus ROG Flow Z13 ACRNM | |
| Asus ROG Zephyrus G14 GA402RK | |
| Przeciętny Intel Core i9-13900H, NVIDIA GeForce RTX 4070 Laptop GPU (5855 - 8538, n=8) | |
| Asus ROG Flow Z13 GZ301V | |
| Razer Blade 14 Ryzen 9 6900HX | |
| Alienware x14 i7 RTX 3060 | |
| Asus ROG Flow Z13 GZ301ZE | |
| PCMark 10 / Essentials | |
| Asus ROG Flow Z13 ACRNM | |
| Asus ROG Flow Z13 GZ301V | |
| Gigabyte AERO 16 OLED BSF | |
| Asus ROG Flow Z13 ACRNM | |
| Razer Blade 14 Ryzen 9 6900HX | |
| Asus ROG Zephyrus G14 GA402RK | |
| Przeciętny Intel Core i9-13900H, NVIDIA GeForce RTX 4070 Laptop GPU (8835 - 11940, n=8) | |
| Asus ROG Flow Z13 GZ301ZE | |
| Średnia w klasie Gaming (8810 - 12600, n=100, ostatnie 2 lata) | |
| Alienware x14 i7 RTX 3060 | |
| PCMark 10 / Productivity | |
| Średnia w klasie Gaming (6845 - 18766, n=98, ostatnie 2 lata) | |
| Asus ROG Flow Z13 ACRNM | |
| Asus ROG Flow Z13 GZ301V | |
| Asus ROG Flow Z13 ACRNM | |
| Przeciętny Intel Core i9-13900H, NVIDIA GeForce RTX 4070 Laptop GPU (7967 - 10991, n=8) | |
| Asus ROG Zephyrus G14 GA402RK | |
| Asus ROG Flow Z13 GZ301ZE | |
| Alienware x14 i7 RTX 3060 | |
| Gigabyte AERO 16 OLED BSF | |
| Razer Blade 14 Ryzen 9 6900HX | |
| PCMark 10 / Digital Content Creation | |
| Średnia w klasie Gaming (7602 - 19657, n=98, ostatnie 2 lata) | |
| Gigabyte AERO 16 OLED BSF | |
| Asus ROG Flow Z13 ACRNM | |
| Asus ROG Zephyrus G14 GA402RK | |
| Przeciętny Intel Core i9-13900H, NVIDIA GeForce RTX 4070 Laptop GPU (7738 - 13575, n=8) | |
| Asus ROG Flow Z13 ACRNM | |
| Razer Blade 14 Ryzen 9 6900HX | |
| Asus ROG Flow Z13 GZ301V | |
| Alienware x14 i7 RTX 3060 | |
| Asus ROG Flow Z13 GZ301ZE | |
| CrossMark / Overall | |
| Asus ROG Flow Z13 GZ301ZE | |
| Asus ROG Flow Z13 GZ301V | |
| Średnia w klasie Gaming (1366 - 2409, n=98, ostatnie 2 lata) | |
| Asus ROG Flow Z13 ACRNM | |
| Alienware x14 i7 RTX 3060 | |
| Gigabyte AERO 16 OLED BSF | |
| Przeciętny Intel Core i9-13900H, NVIDIA GeForce RTX 4070 Laptop GPU (1104 - 1974, n=7) | |
| CrossMark / Productivity | |
| Asus ROG Flow Z13 GZ301ZE | |
| Asus ROG Flow Z13 GZ301V | |
| Średnia w klasie Gaming (1386 - 2254, n=98, ostatnie 2 lata) | |
| Asus ROG Flow Z13 ACRNM | |
| Alienware x14 i7 RTX 3060 | |
| Gigabyte AERO 16 OLED BSF | |
| Przeciętny Intel Core i9-13900H, NVIDIA GeForce RTX 4070 Laptop GPU (1058 - 1914, n=7) | |
| CrossMark / Creativity | |
| Średnia w klasie Gaming (1343 - 2729, n=98, ostatnie 2 lata) | |
| Asus ROG Flow Z13 GZ301V | |
| Asus ROG Flow Z13 ACRNM | |
| Asus ROG Flow Z13 GZ301ZE | |
| Alienware x14 i7 RTX 3060 | |
| Przeciętny Intel Core i9-13900H, NVIDIA GeForce RTX 4070 Laptop GPU (1178 - 2254, n=7) | |
| Gigabyte AERO 16 OLED BSF | |
| CrossMark / Responsiveness | |
| Asus ROG Flow Z13 GZ301ZE | |
| Gigabyte AERO 16 OLED BSF | |
| Alienware x14 i7 RTX 3060 | |
| Średnia w klasie Gaming (1226 - 2334, n=98, ostatnie 2 lata) | |
| Asus ROG Flow Z13 GZ301V | |
| Asus ROG Flow Z13 ACRNM | |
| Przeciętny Intel Core i9-13900H, NVIDIA GeForce RTX 4070 Laptop GPU (1037 - 1952, n=7) | |
| PCMark 10 Score | 8018 pkt. | |
Pomoc | ||
| AIDA64 / Memory Copy | |
| Alienware x14 i7 RTX 3060 | |
| Asus ROG Flow Z13 GZ301ZE | |
| Średnia w klasie Gaming (21750 - 129946, n=110, ostatnie 2 lata) | |
| Asus ROG Flow Z13 GZ301V | |
| Asus ROG Flow Z13 ACRNM | |
| Gigabyte AERO 16 OLED BSF | |
| Przeciętny Intel Core i9-13900H (37448 - 74486, n=25) | |
| Asus ROG Zephyrus G14 GA402RK | |
| Razer Blade 14 Ryzen 9 6900HX | |
| AIDA64 / Memory Read | |
| Alienware x14 i7 RTX 3060 | |
| Średnia w klasie Gaming (22956 - 118858, n=110, ostatnie 2 lata) | |
| Asus ROG Flow Z13 GZ301ZE | |
| Gigabyte AERO 16 OLED BSF | |
| Asus ROG Flow Z13 ACRNM | |
| Asus ROG Flow Z13 GZ301V | |
| Przeciętny Intel Core i9-13900H (41599 - 75433, n=25) | |
| Asus ROG Zephyrus G14 GA402RK | |
| Razer Blade 14 Ryzen 9 6900HX | |
| AIDA64 / Memory Write | |
| Średnia w klasie Gaming (22297 - 135096, n=110, ostatnie 2 lata) | |
| Asus ROG Flow Z13 GZ301V | |
| Asus ROG Flow Z13 ACRNM | |
| Gigabyte AERO 16 OLED BSF | |
| Przeciętny Intel Core i9-13900H (36152 - 88505, n=25) | |
| Alienware x14 i7 RTX 3060 | |
| Asus ROG Flow Z13 GZ301ZE | |
| Asus ROG Zephyrus G14 GA402RK | |
| Razer Blade 14 Ryzen 9 6900HX | |
| AIDA64 / Memory Latency | |
| Alienware x14 i7 RTX 3060 | |
| Średnia w klasie Gaming (75.3 - 259, n=110, ostatnie 2 lata) | |
| Asus ROG Flow Z13 GZ301ZE | |
| Gigabyte AERO 16 OLED BSF | |
| Asus ROG Flow Z13 ACRNM | |
| Przeciętny Intel Core i9-13900H (75.8 - 102.3, n=25) | |
| Asus ROG Flow Z13 GZ301V | |
| Razer Blade 14 Ryzen 9 6900HX | |
| Asus ROG Zephyrus G14 GA402RK | |
* ... im mniej tym lepiej
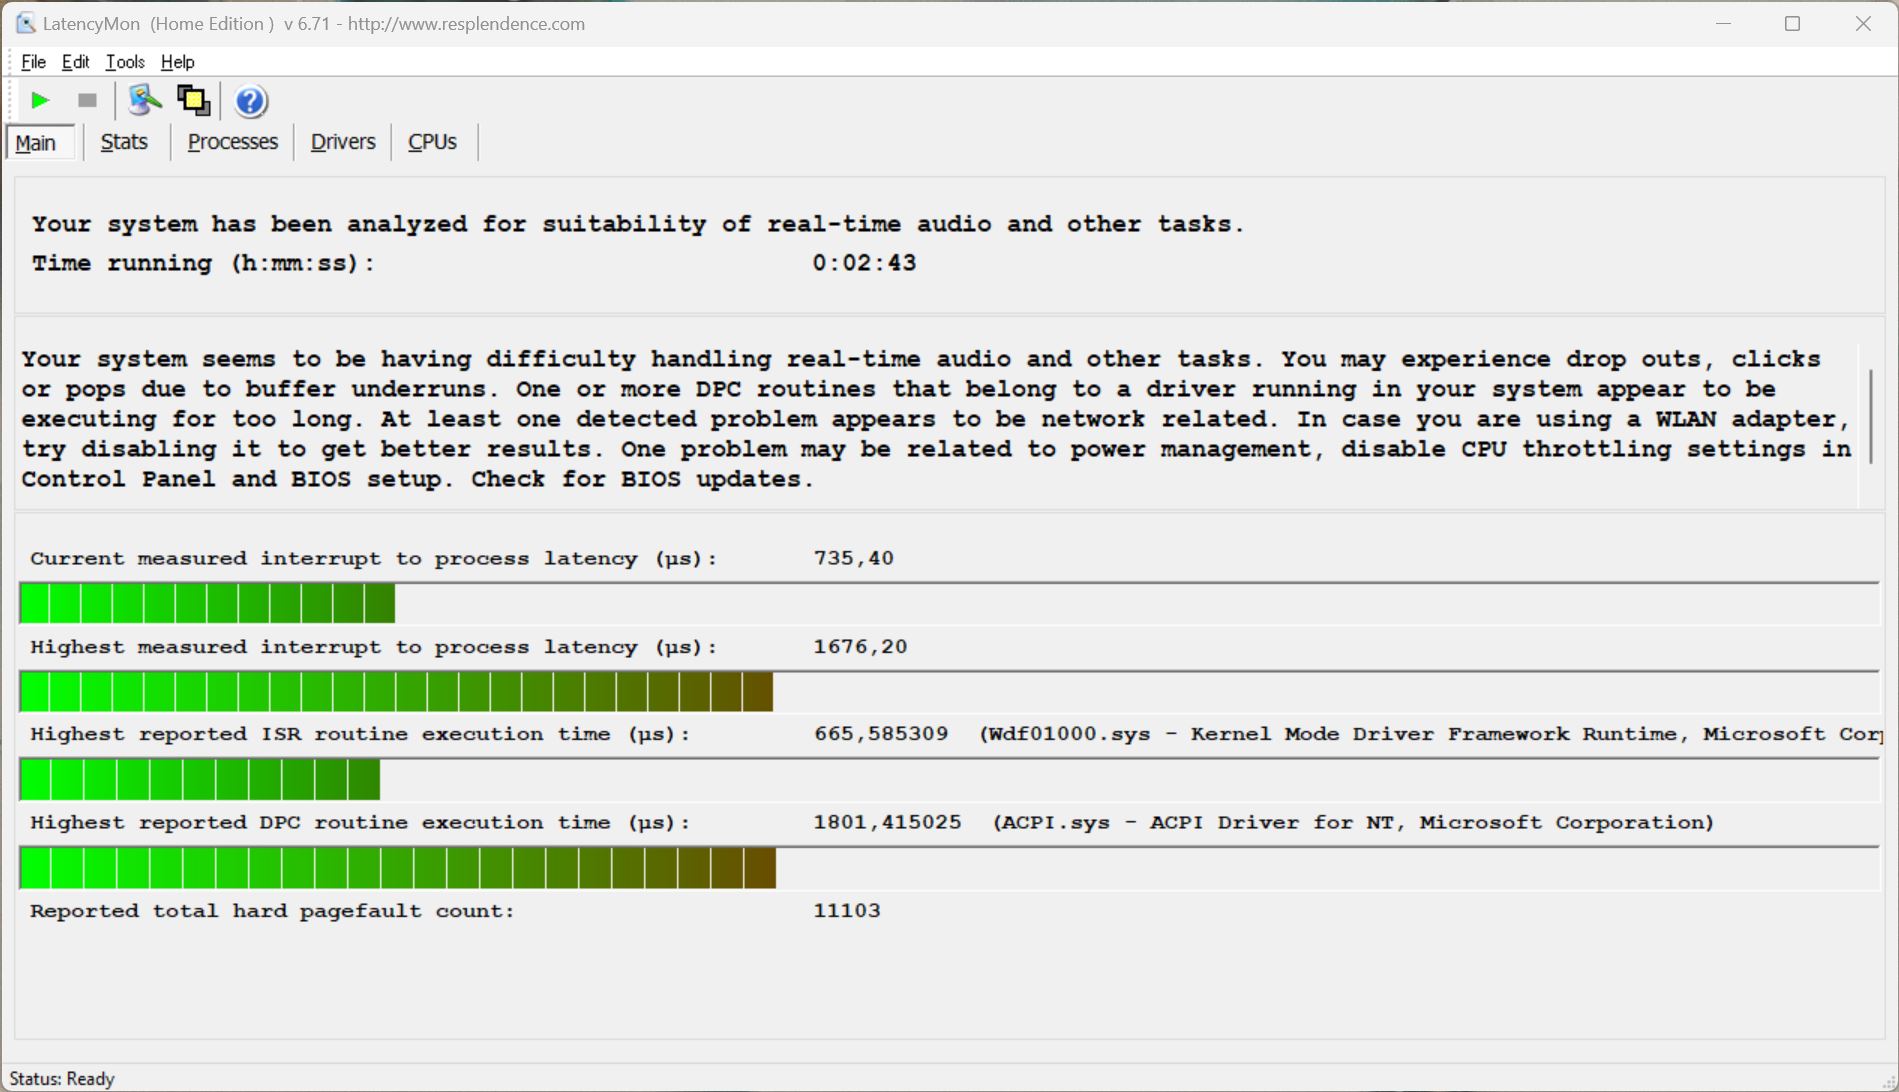
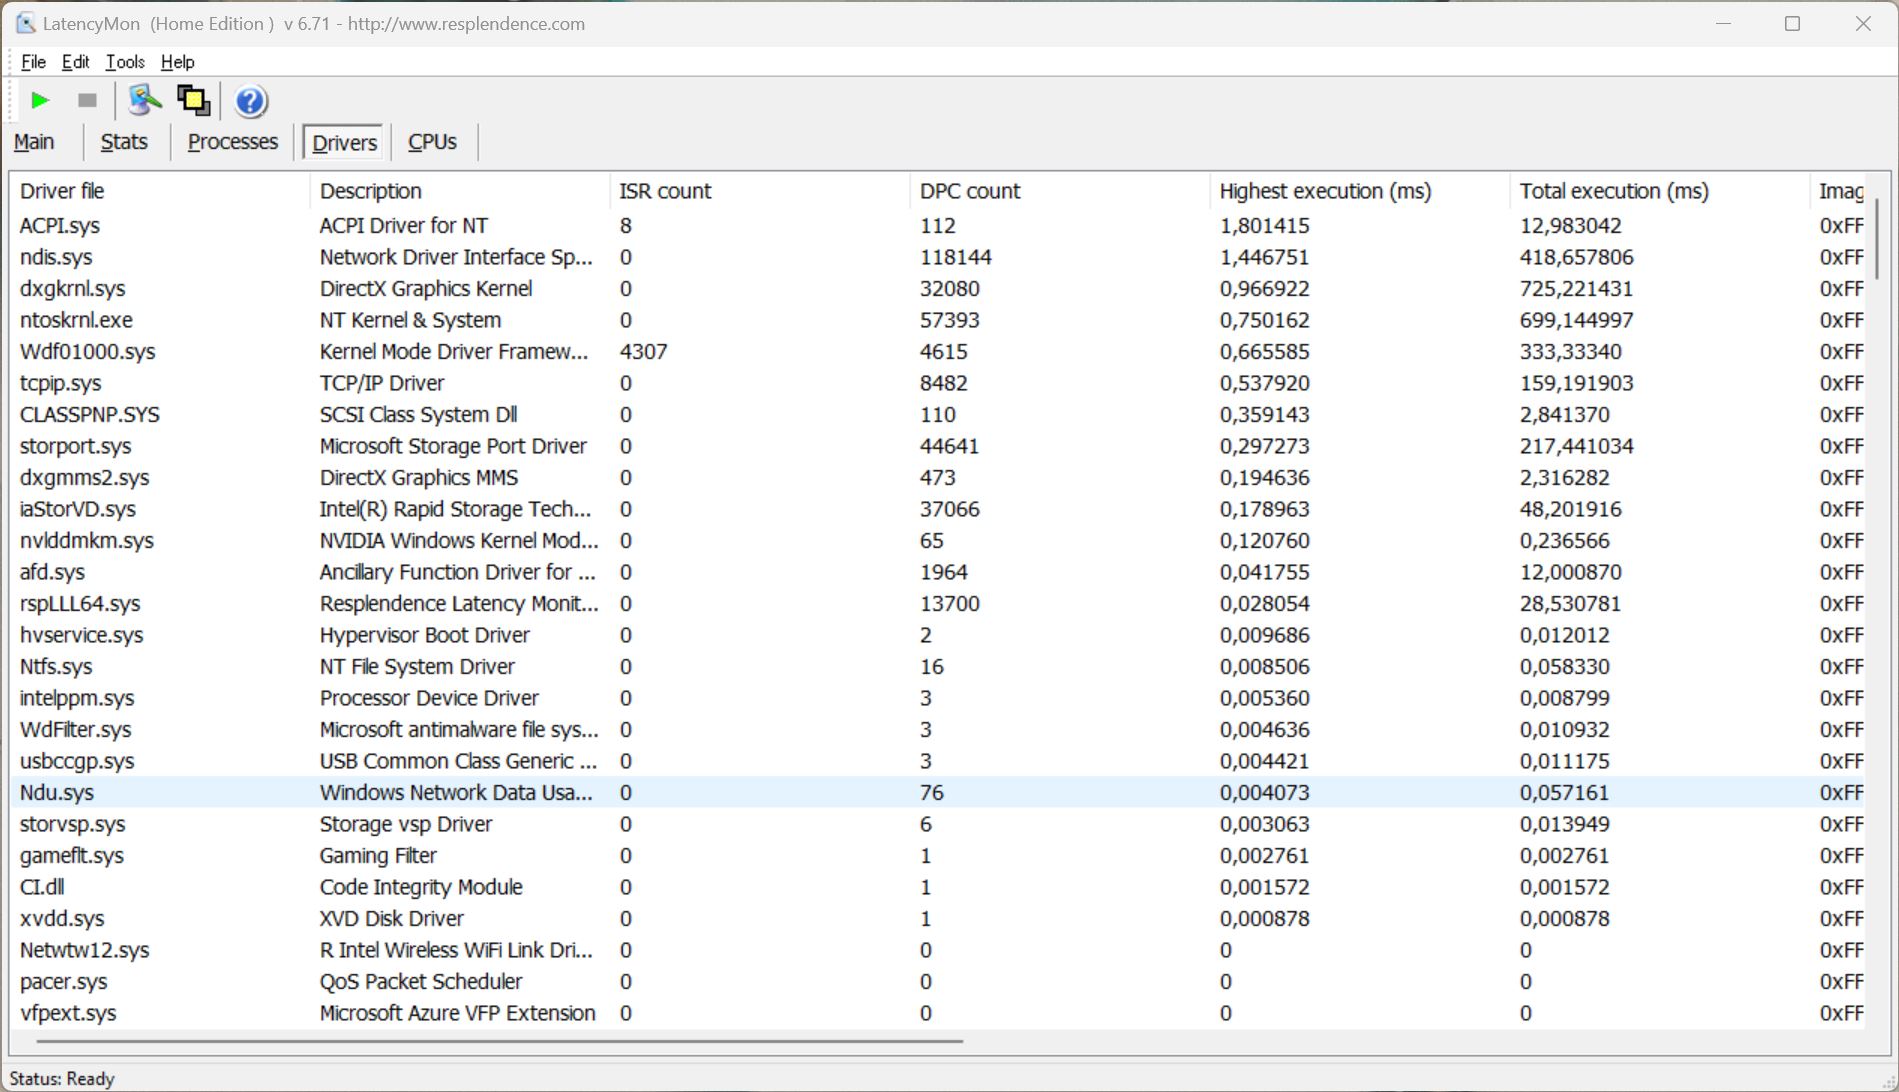
Opóźnienie DPC
Nasz standardowy test opóźnień (przeglądanie stron internetowych, odtwarzanie YouTube 4K, obciążenie procesora) pokazuje pewne problemy z obecną wersją BIOS-u, ale może to być również wynik sterownika GPU Nvidii (od jakiegoś czasu zgłaszane są problemy z opóźnieniami DPC). Sytuacja może się poprawić wraz z przyszłymi aktualizacjami oprogramowania.
| DPC Latencies / LatencyMon - interrupt to process latency (max), Web, Youtube, Prime95 | |
| Asus ROG Zephyrus G14 GA402RK | |
| Asus ROG Flow Z13 ACRNM | |
| Asus ROG Flow Z13 GZ301ZE | |
| Razer Blade 14 Ryzen 9 6900HX | |
| Alienware x14 i7 RTX 3060 | |
* ... im mniej tym lepiej
Urządzenia do przechowywania danych
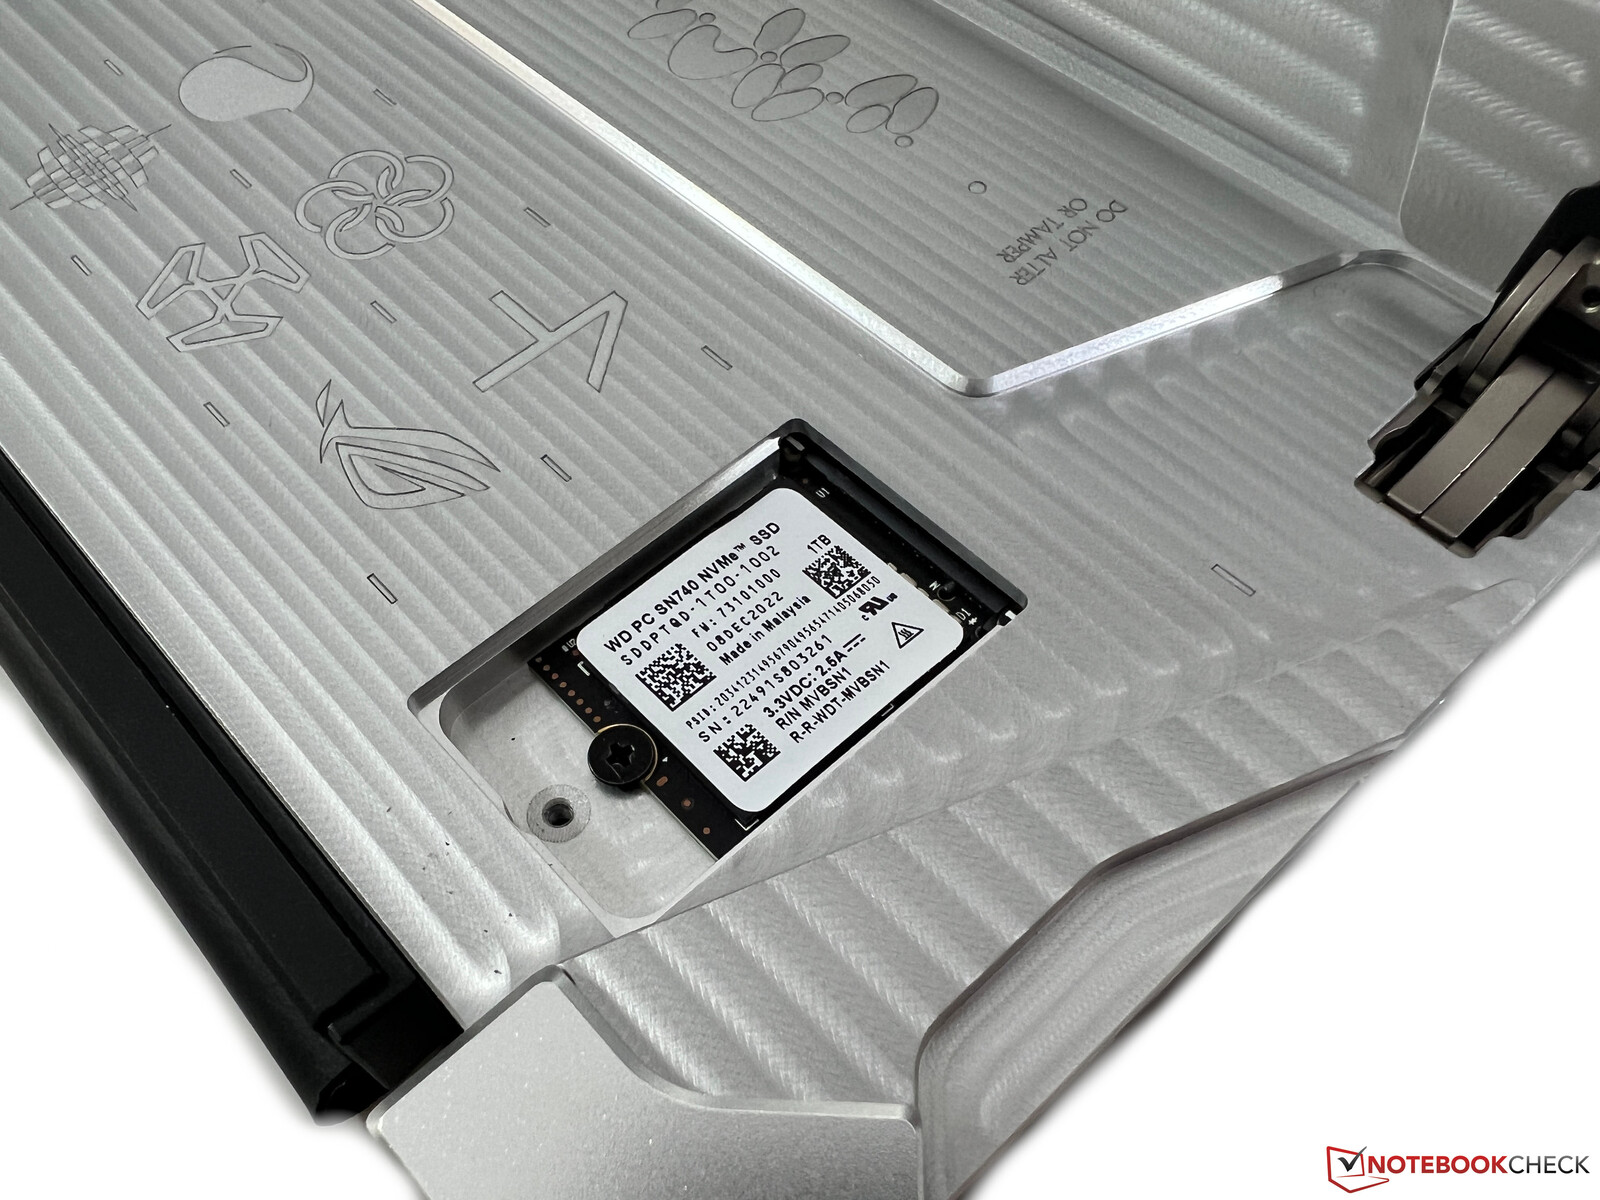
Asus zastosował niezwykle kompaktowy dysk M.2-2230 NVMe-SSD, do którego dostęp i wymiana odbywa się poprzez klapę konserwacyjną w tylnej części tabletu. Nasz egzemplarz recenzencki został wyposażony w wersję 1 TB Western Digital SN740, czyli nowoczesny dysk PCIe 4.0 o maksymalnym transferze 5150 MB/s. Oznacza to, że nie jest to najszybszy dysk, ale osiąga reklamowaną wydajność i jest stabilny nawet przy długotrwałych obciążeniach. Podsumowując, dobry wynik jak na kompaktowy dysk SSD. Więcej benchmarków SSD znajduje się tutaj.

| Drive Performance rating - Percent | |
| Razer Blade 14 Ryzen 9 6900HX | |
| Średnia w klasie Gaming | |
| Asus ROG Flow Z13 GZ301ZE | |
| Alienware x14 i7 RTX 3060 | |
| Asus ROG Zephyrus G14 GA402RK | |
| Przeciętny WD PC SN740 SDDPTQD-1T00 | |
| Asus ROG Flow Z13 ACRNM | |
* ... im mniej tym lepiej
Disk throttling: DiskSpd Read Loop, Queue Depth 8
Wydajność GPU
Edycja ACRNM modelu ROG Flow Z13 została wyposażona w.Nvidia GeForce RTX 4070 Laptoppodczas gdy zwykła wersja jest ograniczona doRTX 4060 Laptop. Oba modele wykorzystują jednak warianty 65W, co oznacza, że wydajność nie jest porównywalna z wersjami zużywającymi 100-110 W, które te GPU mogą konsumować (nie potrzebują więcej mocy podczas grania, wyższe liczby TGP nie mają dla tych GPU znaczenia). Samo GPU ma TGP na poziomie 50 W w połączeniu z 15 W Dynamic Boost od procesora.
Laptop RTX 4070 to oczywiście ogromny upgrade w porównaniu do m.in.RTX 3050 Tipoprzednika i w syntetycznych benchmarkach widzimy przewagę prawie 130 % dla nowego modelu. Z kolei zwykły Flow Z13 z RTX 4060 Laptop jest o około 20 % wolniejszy. W porównaniu z najszybszą wersją RTX 4070 Laptop, jak to ma miejsce w np.Gigabyte Aero 16, model 65W jest o około 20 % wolniejszy, a najszybszy RTX 4060 Laptop (MSI Katana 17, na przykład) jest również nieco szybszy. Jednak 65W RTX 4070 Laptop wciąż wyprzedza starszegoRTX 3070 Tiw Razer Blade 14, a także m.in.RTX 3060wAlienware x14. Jeśli zainwestujesz w XG Mobile eGPU z.RTX 4090 Laptop(maks. TGP o mocy 150 W), można dość znacznie podwoić wydajność GPU.
Ogólna wydajność GPU jest bardzo dobra, jeśli weźmiemy pod uwagę niewielką obudowę, a wydajność jest również bardzo stabilna pod trwałym obciążeniem (Time Spy stress test: 96,3%). Pobór mocy przez GPU jest jednak ograniczony do 35 W na zasilaniu bateryjnym, co powoduje spadek wydajności o ~25%. Więcej benchmarków GPU dostępnych jest w naszej sekcja techniczna.
| 3DMark Performance rating - Percent | |
| Asus ROG Flow Z13 ACRNM | |
| Średnia w klasie Gaming | |
| Gigabyte AERO 16 OLED BSF | |
| Przeciętny NVIDIA GeForce RTX 4070 Laptop GPU | |
| MSI Katana 17 B13VFK | |
| Asus ROG Zephyrus G14 GA402RK | |
| Razer Blade 14 Ryzen 9 6900HX | |
| Asus ROG Flow Z13 ACRNM | |
| Asus ROG Flow Z13 GZ301V | |
| Alienware x14 i7 RTX 3060 -1! | |
| Asus ROG Flow Z13 GZ301ZE | |
| 3DMark 11 - 1280x720 Performance GPU | |
| Asus ROG Flow Z13 ACRNM | |
| Średnia w klasie Gaming (21841 - 80022, n=109, ostatnie 2 lata) | |
| Gigabyte AERO 16 OLED BSF | |
| Przeciętny NVIDIA GeForce RTX 4070 Laptop GPU (24229 - 46434, n=67) | |
| Asus ROG Zephyrus G14 GA402RK | |
| MSI Katana 17 B13VFK | |
| Razer Blade 14 Ryzen 9 6900HX | |
| Asus ROG Flow Z13 ACRNM | |
| Asus ROG Flow Z13 GZ301V | |
| Asus ROG Flow Z13 GZ301ZE | |
| 3DMark | |
| 1920x1080 Fire Strike Graphics | |
| Asus ROG Flow Z13 ACRNM | |
| Średnia w klasie Gaming (12242 - 62849, n=121, ostatnie 2 lata) | |
| Przeciętny NVIDIA GeForce RTX 4070 Laptop GPU (12242 - 33451, n=71) | |
| Gigabyte AERO 16 OLED BSF | |
| MSI Katana 17 B13VFK | |
| Asus ROG Zephyrus G14 GA402RK | |
| Razer Blade 14 Ryzen 9 6900HX | |
| Asus ROG Flow Z13 ACRNM | |
| Asus ROG Flow Z13 GZ301V | |
| Alienware x14 i7 RTX 3060 | |
| Asus ROG Flow Z13 GZ301ZE | |
| 2560x1440 Time Spy Graphics | |
| Asus ROG Flow Z13 ACRNM | |
| Średnia w klasie Gaming (5012 - 26212, n=120, ostatnie 2 lata) | |
| Gigabyte AERO 16 OLED BSF | |
| Przeciętny NVIDIA GeForce RTX 4070 Laptop GPU (5012 - 13391, n=70) | |
| MSI Katana 17 B13VFK | |
| Razer Blade 14 Ryzen 9 6900HX | |
| Asus ROG Flow Z13 ACRNM | |
| Asus ROG Zephyrus G14 GA402RK | |
| Asus ROG Flow Z13 GZ301V | |
| Alienware x14 i7 RTX 3060 | |
| Asus ROG Flow Z13 GZ301ZE | |
| 3DMark 11 Performance | 29603 pkt. | |
| 3DMark Fire Strike Score | 20875 pkt. | |
| 3DMark Time Spy Score | 9917 pkt. | |
| 3DMark Steel Nomad Score | 2228 pkt. | |
| 3DMark Steel Nomad Light Score | 9949 pkt. | |
Pomoc | ||
| Blender / v3.3 Classroom OPTIX/RTX | |
| Asus ROG Flow Z13 GZ301V | |
| Asus ROG Flow Z13 ACRNM | |
| Przeciętny NVIDIA GeForce RTX 4070 Laptop GPU (18 - 30, n=68) | |
| Gigabyte AERO 16 OLED BSF | |
| Średnia w klasie Gaming (9 - 32, n=112, ostatnie 2 lata) | |
| Asus ROG Flow Z13 ACRNM | |
| Blender / v3.3 Classroom CUDA | |
| Asus ROG Flow Z13 GZ301V | |
| Asus ROG Flow Z13 ACRNM | |
| Przeciętny NVIDIA GeForce RTX 4070 Laptop GPU (32 - 50, n=67) | |
| Gigabyte AERO 16 OLED BSF | |
| Średnia w klasie Gaming (15 - 228, n=112, ostatnie 2 lata) | |
| Blender / v3.3 Classroom CPU | |
| Asus ROG Flow Z13 GZ301V | |
| Asus ROG Flow Z13 ACRNM | |
| Gigabyte AERO 16 OLED BSF | |
| Przeciętny NVIDIA GeForce RTX 4070 Laptop GPU (158 - 440, n=67) | |
| Średnia w klasie Gaming (122 - 565, n=108, ostatnie 2 lata) | |
* ... im mniej tym lepiej
Wydajność w grach
Wydajność w grach jest również bardzo dobra i można grać w nowoczesne tytuły w natywnej rozdzielczości QHD przy maksymalnych detalach. Ray tracing będzie jednak często zbyt wymagający, więc trzeba będzie stosować upscaling. Flow Z13 w wersji 65W ponownie wypada gorzej od najmocniejszych wersji RTX 4070 Laptop i również 4060 Laptop, ale wyprzedza RTX 3070 Ti. Ponownie trzeba wziąć pod uwagę kompaktową obudowę, a wydajność w grach jest stabilna także podczas dłuższych sesji gier.
| Performance rating - Percent | |
| Średnia w klasie Gaming | |
| Asus ROG Flow Z13 ACRNM | |
| Gigabyte AERO 16 OLED BSF | |
| MSI Katana 17 B13VFK | |
| Asus ROG Flow Z13 ACRNM | |
| Razer Blade 14 Ryzen 9 6900HX | |
| Alienware x14 i7 RTX 3060 -1! | |
| Asus ROG Zephyrus G14 GA402RK | |
| The Witcher 3 - 1920x1080 Ultra Graphics & Postprocessing (HBAO+) | |
| Asus ROG Flow Z13 ACRNM | |
| Średnia w klasie Gaming (95 - 240, n=8, ostatnie 2 lata) | |
| Gigabyte AERO 16 OLED BSF | |
| MSI Katana 17 B13VFK | |
| Razer Blade 14 Ryzen 9 6900HX | |
| Asus ROG Zephyrus G14 GA402RK | |
| Asus ROG Flow Z13 ACRNM | |
| Alienware x14 i7 RTX 3060 | |
| Alienware x14 i7 RTX 3060 | |
| GTA V - 1920x1080 Highest AA:4xMSAA + FX AF:16x | |
| Średnia w klasie Gaming (48.3 - 186.9, n=103, ostatnie 2 lata) | |
| Gigabyte AERO 16 OLED BSF | |
| MSI Katana 17 B13VFK | |
| Asus ROG Flow Z13 ACRNM | |
| Asus ROG Flow Z13 ACRNM | |
| Razer Blade 14 Ryzen 9 6900HX | |
| Alienware x14 i7 RTX 3060 | |
| Asus ROG Zephyrus G14 GA402RK | |
| Final Fantasy XV Benchmark - 1920x1080 High Quality | |
| Asus ROG Flow Z13 ACRNM | |
| Średnia w klasie Gaming (41 - 215, n=104, ostatnie 2 lata) | |
| Gigabyte AERO 16 OLED BSF | |
| Razer Blade 14 Ryzen 9 6900HX | |
| MSI Katana 17 B13VFK | |
| Asus ROG Flow Z13 ACRNM | |
| Asus ROG Zephyrus G14 GA402RK | |
| Alienware x14 i7 RTX 3060 | |
| Strange Brigade - 1920x1080 ultra AA:ultra AF:16 | |
| Średnia w klasie Gaming (76.3 - 456, n=94, ostatnie 2 lata) | |
| Asus ROG Flow Z13 ACRNM | |
| Gigabyte AERO 16 OLED BSF | |
| MSI Katana 17 B13VFK | |
| Razer Blade 14 Ryzen 9 6900HX | |
| Asus ROG Zephyrus G14 GA402RK | |
| Asus ROG Flow Z13 ACRNM | |
| Alienware x14 i7 RTX 3060 | |
| Dota 2 Reborn - 1920x1080 ultra (3/3) best looking | |
| MSI Katana 17 B13VFK | |
| Alienware x14 i7 RTX 3060 | |
| Średnia w klasie Gaming (84.8 - 248, n=113, ostatnie 2 lata) | |
| Gigabyte AERO 16 OLED BSF | |
| Asus ROG Flow Z13 ACRNM | |
| Asus ROG Flow Z13 ACRNM | |
| Razer Blade 14 Ryzen 9 6900HX | |
| Asus ROG Zephyrus G14 GA402RK | |
| X-Plane 11.11 - 1920x1080 high (fps_test=3) | |
| MSI Katana 17 B13VFK | |
| Gigabyte AERO 16 OLED BSF | |
| Asus ROG Flow Z13 ACRNM | |
| Asus ROG Flow Z13 ACRNM | |
| Średnia w klasie Gaming (52.1 - 143.5, n=116, ostatnie 2 lata) | |
| Razer Blade 14 Ryzen 9 6900HX | |
| Asus ROG Zephyrus G14 GA402RK | |
| Cyberpunk 2077 1.6 - 2560x1440 Ultra Preset | |
| Asus ROG Flow Z13 ACRNM | |
| Asus ROG Flow Z13 ACRNM | |
| Przeciętny NVIDIA GeForce RTX 4070 Laptop GPU (30 - 63.9, n=24) | |
| Gigabyte AERO 16 OLED BSF | |
| MSI Katana 17 B13VFK | |
| Razer Blade 14 Ryzen 9 6900HX | |
| Asus ROG Zephyrus G14 GA402RK | |
| Call of Duty Modern Warfare 2 2022 - 2560x1440 Extreme Quality Preset AA:T2X Filmic SM | |
| Asus ROG Flow Z13 ACRNM | |
| Przeciętny NVIDIA GeForce RTX 4070 Laptop GPU (59 - 77, n=9) | |
| Gigabyte AERO 16 OLED BSF | |
| Razer Blade 15 OLED (Early 2022) | |
| MSI Katana 17 B13VFK | |
| Asus ROG Flow Z13 ACRNM | |
| Far Cry 6 - 2560x1440 Ultra Graphics Quality + HD Textures AA:T | |
| Asus ROG Flow Z13 ACRNM | |
| Średnia w klasie Gaming (74.5 - 116.7, n=2, ostatnie 2 lata) | |
| Przeciętny NVIDIA GeForce RTX 4070 Laptop GPU (70 - 91, n=11) | |
| Asus ROG Zephyrus G14 GA402RK | |
| Asus ROG Flow Z13 ACRNM | |
| MSI Katana 17 B13VFK | |
| GTA V - 2560x1440 Highest AA:4xMSAA + FX AF:16x | |
| Średnia w klasie Gaming (36.9 - 183.9, n=75, ostatnie 2 lata) | |
| Asus ROG Flow Z13 ACRNM | |
| Razer Blade 15 OLED (Early 2022) | |
| Razer Blade 15 OLED (Early 2022) | |
| Gigabyte AERO 16 OLED BSF | |
| Razer Blade 14 Ryzen 9 6900HX | |
| Przeciętny NVIDIA GeForce RTX 4070 Laptop GPU (36.9 - 102.2, n=51) | |
| MSI Katana 17 B13VFK | |
| Asus ROG Flow Z13 ACRNM | |
| Spider-Man Miles Morales - 2560x1440 Very High Preset AA:T | |
| Asus ROG Flow Z13 ACRNM | |
| Razer Blade 15 OLED (Early 2022) | |
| Przeciętny NVIDIA GeForce RTX 4070 Laptop GPU (53.1 - 86, n=3) | |
| Gigabyte AERO 16 OLED BSF | |
| MSI Katana 17 B13VFK | |
| Asus ROG Flow Z13 ACRNM | |
Witcher 3 FPS chart
| low | med. | high | ultra | QHD DLSS | QHD | 4K | |
|---|---|---|---|---|---|---|---|
| GTA V (2015) | 182.2 | 175.4 | 165.8 | 94.8 | 75.9 | ||
| The Witcher 3 (2015) | 83.2 | ||||||
| Dota 2 Reborn (2015) | 171 | 152.5 | 142.8 | 135 | 107 | ||
| Final Fantasy XV Benchmark (2018) | 128.2 | 93.3 | 71.6 | 40.3 | |||
| X-Plane 11.11 (2018) | 165.7 | 141.8 | 110.3 | 103.4 | |||
| Strange Brigade (2018) | 393 | 249 | 202 | 174.8 | 122.8 | ||
| Shadow of the Tomb Raider (2018) | 117 | 86 | |||||
| Assassin´s Creed Valhalla (2020) | 86 | 65 | |||||
| Far Cry 6 (2021) | 92 | 70 | |||||
| Cyberpunk 2077 1.6 (2022) | 71.62 | 53.88 | |||||
| Tiny Tina's Wonderlands (2022) | 79.7 | 57.61 | |||||
| F1 22 (2022) | 192.3 | 190 | 163 | 61.8 | 40.9 | ||
| Call of Duty Modern Warfare 2 2022 (2022) | 80 | 59 | |||||
| Spider-Man Miles Morales (2022) | 82.3 | 53.1 | |||||
| Baldur's Gate 3 (2023) | 86.1 | 62.3 | |||||
| Cyberpunk 2077 (2023) | 66.79 | 49.7 | 40.1 | ||||
| Horizon Forbidden West (2024) | 56.1 | 54.6 | 45.5 | ||||
| Ghost of Tsushima (2024) | 55.3 | 57 | 43.6 | ||||
| F1 24 (2024) | 58.4 | 57 | 36.8 | ||||
| Black Myth: Wukong (2024) | 25 | 28 | 18 | ||||
| Star Wars Outlaws (2024) | 35.4 | 35.3 | 25.9 | ||||
| God of War Ragnarök (2024) | 76.2 | 78 | 60.5 | ||||
| Call of Duty Black Ops 6 (2024) | 71 | 60 | 52 | ||||
| Indiana Jones and the Great Circle (2024) | 97.5 | 55 | 39.4 | ||||
| Monster Hunter Wilds (2025) | 39.7 | 35.69 | 29 |
Emisje - Słabe głośniki
Szum systemu
Asus zastosował dwa wentylatory, ciekły metal dla lepszego odprowadzania ciepła, a także komorę parową dla rozwiązania chłodzącego. Hałas wentylatorów zależy głównie od wybranego profilu zasilania i nie polecalibyśmy trybu Turbo do codziennej pracy, ponieważ w tym trybie wentylatory natychmiast skaczą do 37 dB(A), gdy tylko zaczynają się kręcić. Tryb Quiet nadaje się znacznie lepiej i jest znacznie cichszy przy lekkich obciążeniach. Wentylatory są generalnie głośniejsze pod obciążeniem w porównaniu do staregoROG Flow Z13 z RTX 3050 Ti. Sam szmer wentylatorów nie jest denerwujący, ale przy wyższych prędkościach wentylatorów zauważa się lekkie wibracje. Wyniki hałasu przy różnych trybach zasilania zestawiliśmy w tabeli poniżej:
| Cichy | Wydajność | Turbo | |
|---|---|---|---|
| Obciążenie Średnie | 31,3 dB(A) | 40,6 dB(A) | 41,3 dB(A) |
| Witcher 3 Ustawienia ultra | 35,7 dB(A) | 40,6 dB(A) | 44,7 dB(A) |
| Stress test | 36,5 dB(A) | 43,4 dB(A) | 46,9 dB(A) |
Zauważyliśmy również wysoki szum, gdy urządzenie jest w stanie czuwania i podłączony jest zasilacz. Jest on cichy, ale zdecydowanie zauważalny i denerwujący. Asus powinien przyjrzeć się tej kwestii.
Hałas
| luz |
| 24 / 24 / 36.5 dB |
| obciążenie |
| 41.3 / 46.9 dB |
 | ||
30 dB cichy 40 dB(A) słyszalny 50 dB(A) irytujący |
||
min: | ||
| Asus ROG Flow Z13 ACRNM GeForce RTX 4070 Laptop GPU, i9-13900H, WD PC SN740 SDDPTQD-1T00 | Asus ROG Flow Z13 GZ301ZE GeForce RTX 3050 Ti Laptop GPU, i9-12900H, Micron 2450 1TB MTFDKBK1T0TFK | Alienware x14 i7 RTX 3060 GeForce RTX 3060 Laptop GPU, i7-12700H, WDC PC SN810 1TB | Razer Blade 14 Ryzen 9 6900HX GeForce RTX 3070 Ti Laptop GPU, R9 6900HX, Samsung PM9A1 MZVL21T0HCLR | Asus ROG Zephyrus G14 GA402RK Radeon RX 6800S, R9 6900HS, Micron 2450 1TB MTFDKBK1T0TFK | |
|---|---|---|---|---|---|
| Noise | 7% | -2% | 11% | 1% | |
| wyłączone / środowisko * (dB) | 24 | 24.5 -2% | 24.7 -3% | 23.3 3% | 24 -0% |
| Idle Minimum * (dB) | 24 | 24.5 -2% | 24.7 -3% | 23.3 3% | 24 -0% |
| Idle Average * (dB) | 24 | 24.5 -2% | 24.7 -3% | 23.3 3% | 26 -8% |
| Idle Maximum * (dB) | 36.5 | 24.5 33% | 30.9 15% | 23.3 36% | 31 15% |
| Load Average * (dB) | 41.3 | 41 1% | 40 3% | 34.7 16% | 45 -9% |
| Witcher 3 ultra * (dB) | 44.7 | 41 8% | 51.5 -15% | 42.1 6% | 43 4% |
| Load Maximum * (dB) | 46.9 | 41 13% | 51.5 -10% | 42.1 10% | 45 4% |
* ... im mniej tym lepiej
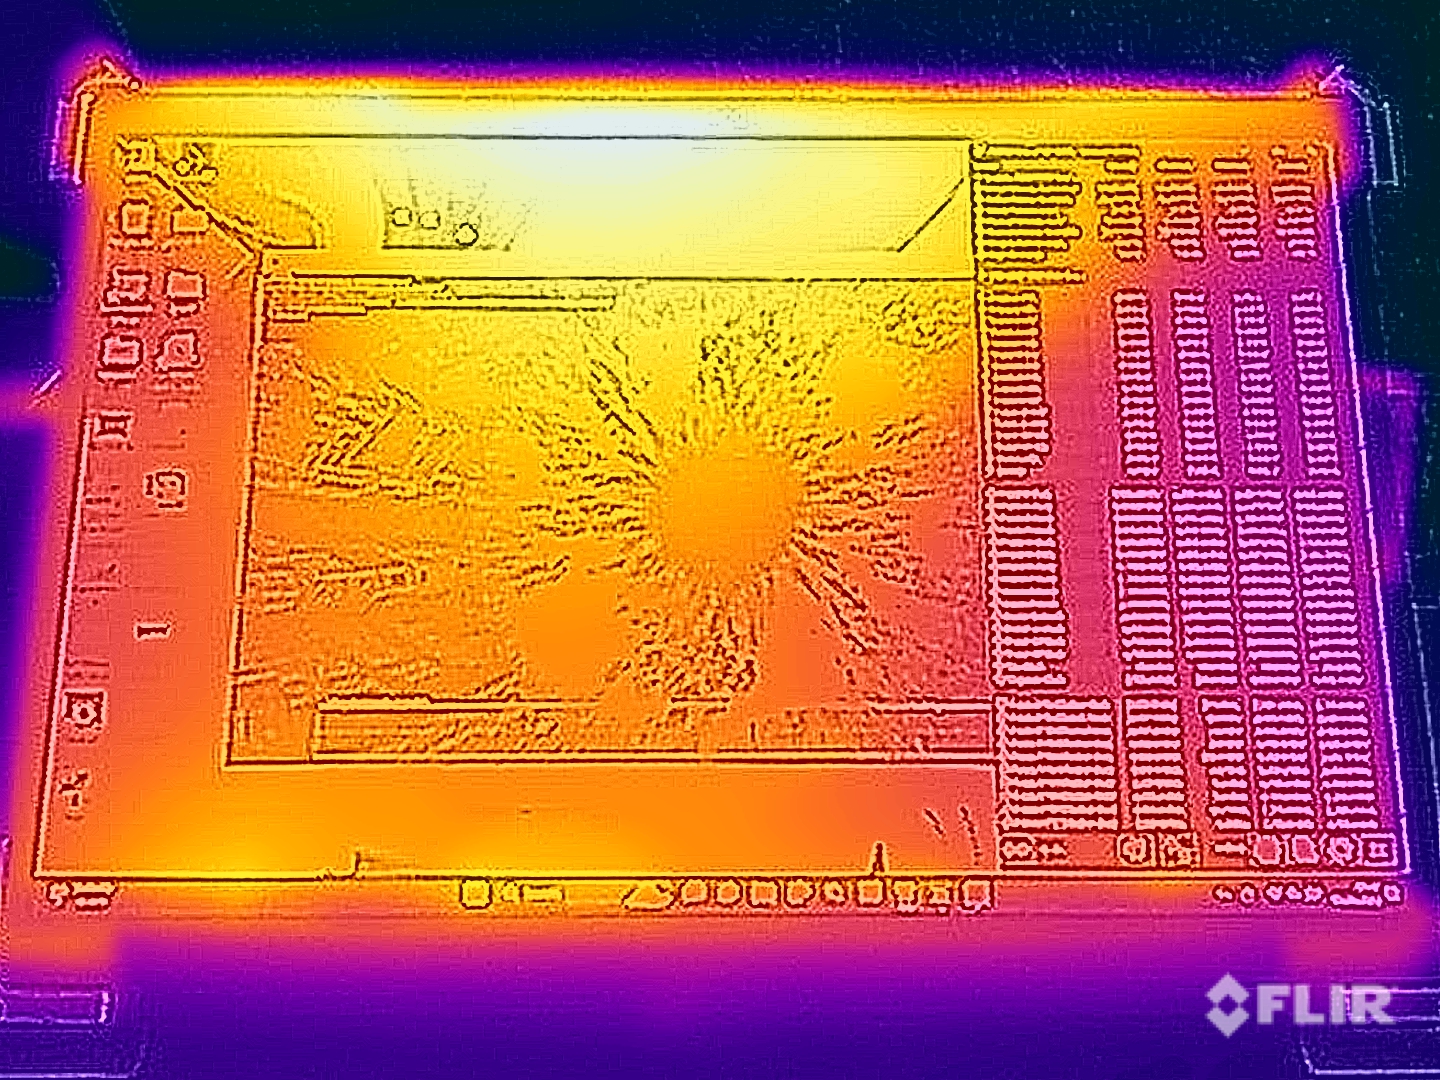
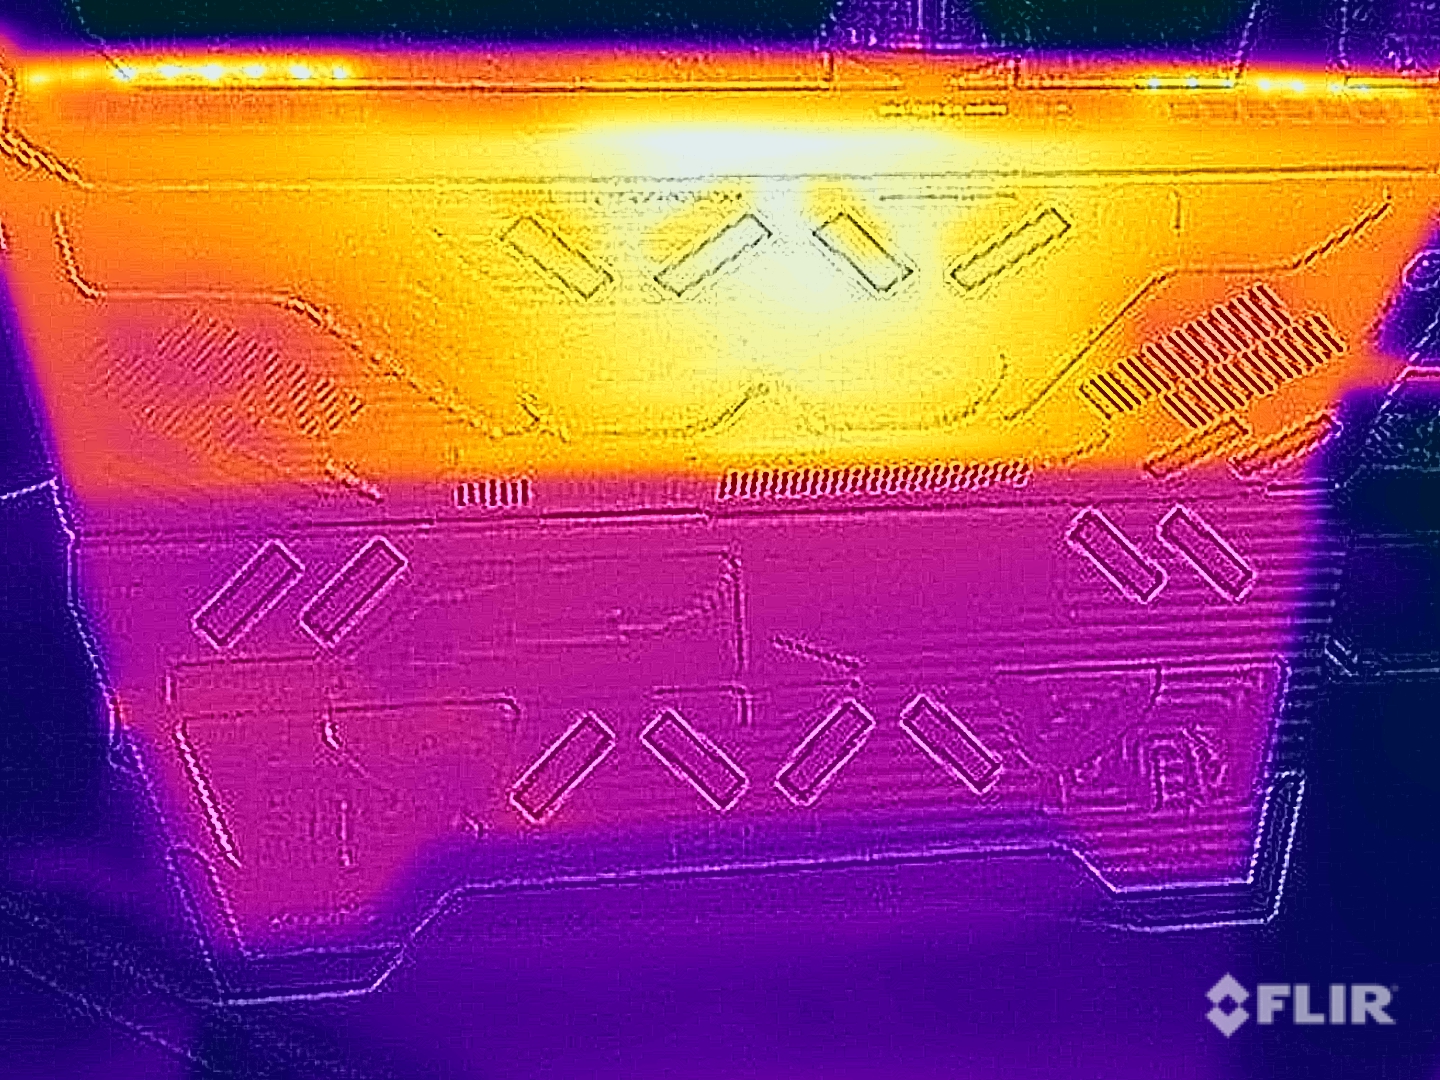
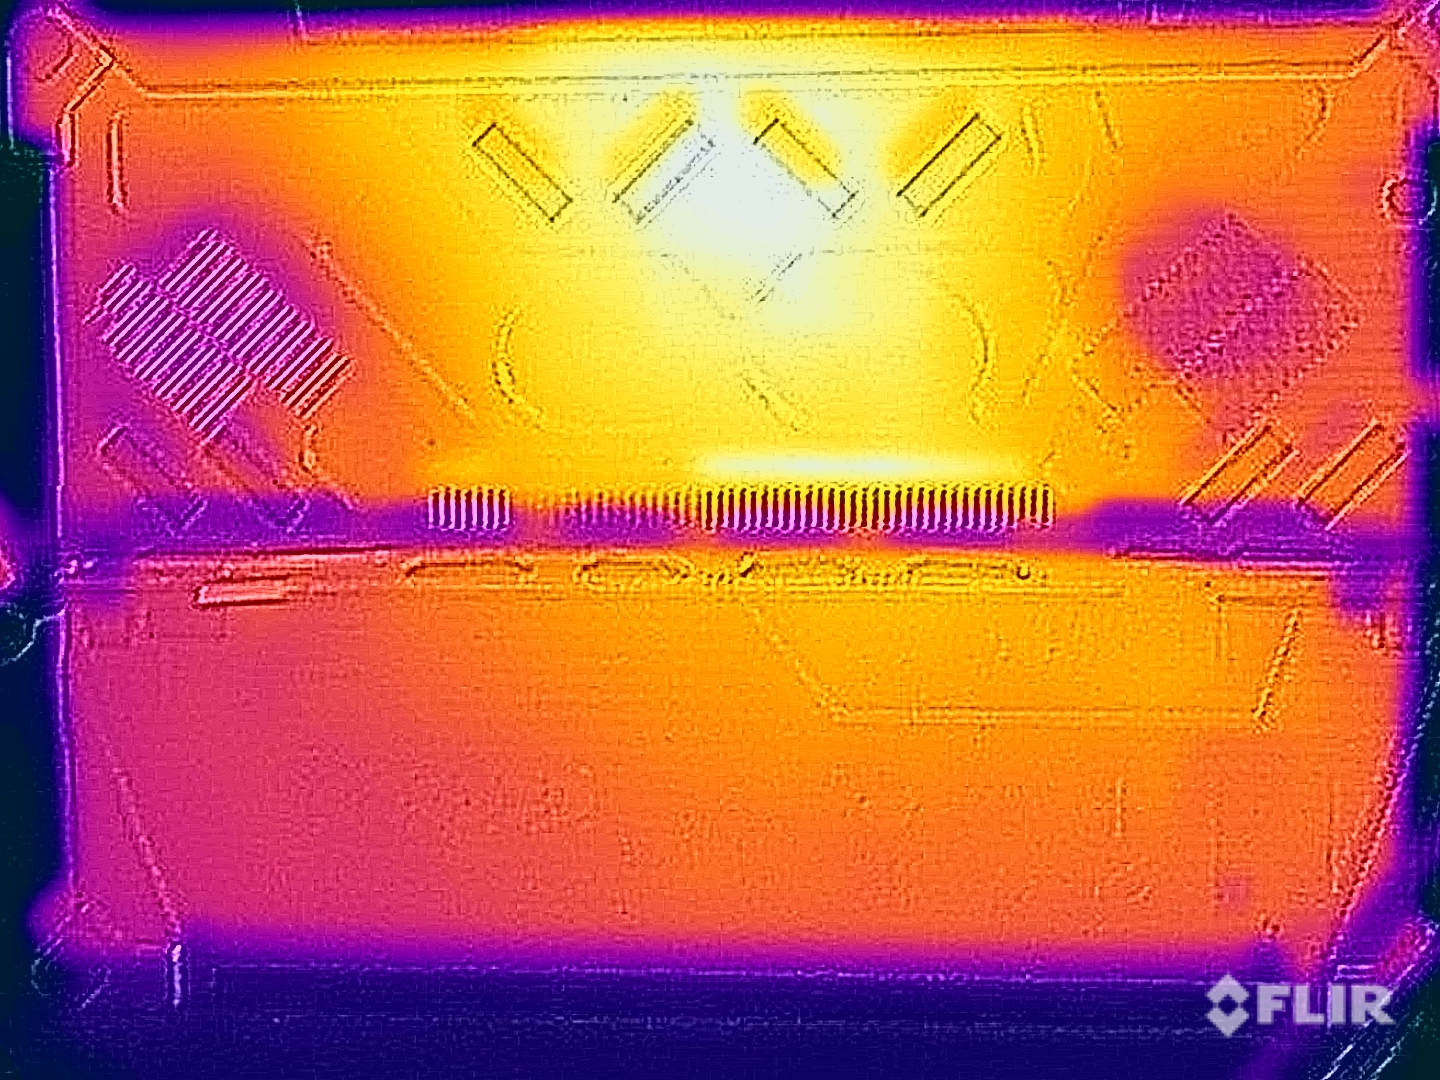
Temperatura
Asus bardzo dobrze zarządza temperaturami powierzchni Flow Z13 ACRNM, a bardziej zwaliste obudowy zdecydowanie pozytywnie wpływają na wyniki. Urządzenie jest bardzo chłodne w scenariuszach lekkiego obciążenia i nadal można go używać jako tabletu pod maksymalnym obciążeniem bez żadnych ograniczeń. Z tyłu możemy zmierzyć do ~42 °C, co jest zauważalną poprawą w porównaniu do poprzednika z RTX 3050 Ti (do 48 °C).
Wydajność podczas naszego stress testu również jest dobra. GPU utrzymuje 45 W, a zużycie procesora waha się w granicach 30-50 W. Na zasilaniu akumulatorowym wartości te spadają do 18 W dla CPU i 26 W dla GPU. Nie zauważyliśmy spadku wydajności bezpośrednio po teście stresu.
(±) Maksymalna temperatura w górnej części wynosi 42.5 °C / 109 F, w porównaniu do średniej 40.4 °C / 105 F , począwszy od 21.2 do 68.8 °C dla klasy Gaming.
(±) Dno nagrzewa się maksymalnie do 42.6 °C / 109 F, w porównaniu do średniej 43.2 °C / 110 F
(+) W stanie bezczynności średnia temperatura górnej części wynosi 25.6 °C / 78 F, w porównaniu ze średnią temperaturą urządzenia wynoszącą 33.9 °C / ### class_avg_f### F.
(±) Podczas gry w Wiedźmina 3 średnia temperatura górnej części wynosi 37.4 °C / 99 F, w porównaniu do średniej temperatury urządzenia wynoszącej 33.9 °C / ## #class_avg_f### F.
(+) Podparcia dłoni i touchpad osiągają maksymalną temperaturę skóry (35.2 °C / 95.4 F) i dlatego nie są gorące.
(-) Średnia temperatura obszaru podparcia dłoni w podobnych urządzeniach wynosiła 28.8 °C / 83.8 F (-6.4 °C / -11.6 F).
| Asus ROG Flow Z13 ACRNM Intel Core i9-13900H, NVIDIA GeForce RTX 4070 Laptop GPU | Asus ROG Flow Z13 GZ301ZE Intel Core i9-12900H, NVIDIA GeForce RTX 3050 Ti Laptop GPU | Alienware x14 i7 RTX 3060 Intel Core i7-12700H, NVIDIA GeForce RTX 3060 Laptop GPU | Razer Blade 14 Ryzen 9 6900HX AMD Ryzen 9 6900HX, NVIDIA GeForce RTX 3070 Ti Laptop GPU | Asus ROG Zephyrus G14 GA402RK AMD Ryzen 9 6900HS, AMD Radeon RX 6800S | |
|---|---|---|---|---|---|
| Heat | -12% | -8% | -21% | -24% | |
| Maximum Upper Side * (°C) | 42.5 | 45.3 -7% | 51.3 -21% | 40.6 4% | 55 -29% |
| Maximum Bottom * (°C) | 42.6 | 48.3 -13% | 44.4 -4% | 42.6 -0% | 55 -29% |
| Idle Upper Side * (°C) | 26.2 | 29.2 -11% | 27.2 -4% | 38 -45% | 30 -15% |
| Idle Bottom * (°C) | 26 | 30 -15% | 26.6 -2% | 37 -42% | 32 -23% |
* ... im mniej tym lepiej
Mówcy
Dwa głośniki stereo to zdecydowanie słaby punkt kabrioletu, ponieważ dźwięk jest bardzo cienki i brakuje mu basów. Ani muzyka, ani filmy, ani gry nie są tak naprawdę przyjemne, a do tego podczas gry dochodzi szum wentylatora, więc polecamy zestaw słuchawkowy.
Asus ROG Flow Z13 ACRNM analiza dźwięku
(±) | głośność głośnika jest średnia, ale dobra (80.3 dB)
Bas 100 - 315 Hz
(-) | prawie brak basu - średnio 18.3% niższa od mediany
(±) | liniowość basu jest średnia (10.1% delta do poprzedniej częstotliwości)
Średnie 400 - 2000 Hz
(+) | zbalansowane środki średnie - tylko 3.4% od mediany
(+) | średnie są liniowe (4.5% delta do poprzedniej częstotliwości)
Wysokie 2–16 kHz
(±) | wyższe maksima - średnio 6.1% wyższe od mediany
(+) | wzloty są liniowe (3.5% delta do poprzedniej częstotliwości)
Ogólnie 100 - 16.000 Hz
(±) | liniowość ogólnego dźwięku jest średnia (19% różnicy w stosunku do mediany)
W porównaniu do tej samej klasy
» 63% wszystkich testowanych urządzeń w tej klasie było lepszych, 8% podobnych, 29% gorszych
» Najlepszy miał deltę 6%, średnia wynosiła ###średnia###%, najgorsza wynosiła 132%
W porównaniu do wszystkich testowanych urządzeń
» 45% wszystkich testowanych urządzeń było lepszych, 7% podobnych, 48% gorszych
» Najlepszy miał deltę 4%, średnia wynosiła ###średnia###%, najgorsza wynosiła 134%
Apple MacBook Pro 16 2021 M1 Pro analiza dźwięku
(+) | głośniki mogą odtwarzać stosunkowo głośno (84.7 dB)
Bas 100 - 315 Hz
(+) | dobry bas - tylko 3.8% od mediany
(+) | bas jest liniowy (5.2% delta do poprzedniej częstotliwości)
Średnie 400 - 2000 Hz
(+) | zbalansowane środki średnie - tylko 1.3% od mediany
(+) | średnie są liniowe (2.1% delta do poprzedniej częstotliwości)
Wysokie 2–16 kHz
(+) | zrównoważone maksima - tylko 1.9% od mediany
(+) | wzloty są liniowe (2.7% delta do poprzedniej częstotliwości)
Ogólnie 100 - 16.000 Hz
(+) | ogólny dźwięk jest liniowy (4.6% różnicy w stosunku do mediany)
W porównaniu do tej samej klasy
» 0% wszystkich testowanych urządzeń w tej klasie było lepszych, 0% podobnych, 100% gorszych
» Najlepszy miał deltę 5%, średnia wynosiła ###średnia###%, najgorsza wynosiła 45%
W porównaniu do wszystkich testowanych urządzeń
» 0% wszystkich testowanych urządzeń było lepszych, 0% podobnych, 100% gorszych
» Najlepszy miał deltę 4%, średnia wynosiła ###średnia###%, najgorsza wynosiła 134%
Zarządzanie energią - czas pracy na kosztach 165 Hz
Pobór mocy
Pobór mocy w spoczynku jest niemal identyczny w porównaniu do staregoFlow Z13, ale nowa wersja potrzebuje znacznie więcej mocy pod obciążeniem. Podczas gry mierzymy około 100 W, ale urządzenie potrzebuje więcej niż maksymalne 133,6 W na początku stress testu. W pierwszych kilku sekundach system pobiera też z baterii od 4 do 18 W, ale potem zużycie wyrównuje się do około 115 W. To ekstremalny scenariusz i dołączony do zestawu zasilacz 130 W jest w innych przypadkach wystarczający.
| wyłączony / stan wstrzymania | |
| luz | |
| obciążenie |
|
Legenda:
min: | |
| Asus ROG Flow Z13 ACRNM i9-13900H, GeForce RTX 4070 Laptop GPU, WD PC SN740 SDDPTQD-1T00, IPS, 2560x1600, 13.4" | Asus ROG Flow Z13 GZ301ZE i9-12900H, GeForce RTX 3050 Ti Laptop GPU, Micron 2450 1TB MTFDKBK1T0TFK, IPS, 1920x1200, 13.4" | Alienware x14 i7 RTX 3060 i7-12700H, GeForce RTX 3060 Laptop GPU, WDC PC SN810 1TB, IPS, 1920x1080, 14" | Razer Blade 14 Ryzen 9 6900HX R9 6900HX, GeForce RTX 3070 Ti Laptop GPU, Samsung PM9A1 MZVL21T0HCLR, IPS, 2560x1440, 14" | Asus ROG Zephyrus G14 GA402RK R9 6900HS, Radeon RX 6800S, Micron 2450 1TB MTFDKBK1T0TFK, IPS-Level, 2560x1600, 14" | Przeciętny NVIDIA GeForce RTX 4070 Laptop GPU | Średnia w klasie Gaming | |
|---|---|---|---|---|---|---|---|
| Power Consumption | 13% | 1% | -58% | -24% | -50% | -59% | |
| Idle Minimum * (Watt) | 8.9 | 8.8 1% | 7.9 11% | 10.2 -15% | 7 21% | 13.2 ? -48% | 13.3 ? -49% |
| Idle Average * (Watt) | 12.6 | 12.1 4% | 11.1 12% | 26 -106% | 14 -11% | 18.2 ? -44% | 19 ? -51% |
| Idle Maximum * (Watt) | 13 | 12.7 2% | 11.8 9% | 26.7 -105% | 22 -69% | 24.6 ? -89% | 24.5 ? -88% |
| Load Average * (Watt) | 92.5 | 72.3 22% | 107.4 -16% | 89.3 3% | 98 -6% | 97 ? -5% | 108.1 ? -17% |
| Witcher 3 ultra * (Watt) | 104.4 | 77.3 26% | 111 -6% | 158.7 -52% | 141 -35% | ||
| Load Maximum * (Watt) | 133.6 | 103.1 23% | 140.4 -5% | 227.5 -70% | 188 -41% | 221 ? -65% | 254 ? -90% |
* ... im mniej tym lepiej
Power consumption Witcher 3 / Stress test
Power consumption with external screen
Czas pracy na baterii
Pojemność akumulatora to nadal 56 Wh i określamy czas pracy na ponad 6,5 godziny przy 60 Hz (~5,5 godziny przy 165 Hz) dla naszego testu Wi-Fi przy dostosowanej jasności 150 nitów (52% maksymalnej jasności dla naszego egzemplarza recenzenckiego). Przy maksymalnej jasności nasz test Wi-Fi trwał niewiele ponad 5 godzin przy 60 Hz i nieco ponad 4 godziny przy 165 Hz. Wyniki te nie są oczywiście rewelacyjne, ale też nie zaskakują, biorąc pod uwagę mocny sprzęt i stosunkowo niewielki akumulator. Podczas dłuższej podróży zdecydowanie należy uwzględnić kilka przystanków na ładowanie. Ładowanie od 5-60% trwa tylko około 30 minut, gdy urządzenie jest włączone; pełne ładowanie trwa około 80 minut.
| Asus ROG Flow Z13 ACRNM i9-13900H, GeForce RTX 4070 Laptop GPU, 56 Wh | Alienware x14 i7 RTX 3060 i7-12700H, GeForce RTX 3060 Laptop GPU, 80 Wh | Razer Blade 14 Ryzen 9 6900HX R9 6900HX, GeForce RTX 3070 Ti Laptop GPU, 62 Wh | Asus ROG Zephyrus G14 GA402RK R9 6900HS, Radeon RX 6800S, 76 Wh | Asus ROG Flow Z13 GZ301ZE i9-12900H, GeForce RTX 3050 Ti Laptop GPU, 56 Wh | Średnia w klasie Gaming | |
|---|---|---|---|---|---|---|
| Czasy pracy | 35% | 61% | 22% | 11% | 43% | |
| H.264 (h) | 5.2 | 9.4 81% | 6 15% | 8.26 ? 59% | ||
| WiFi v1.3 (h) | 6.6 | 8.9 35% | 9.5 44% | 9.5 44% | 5.6 -15% | 7.01 ? 6% |
| Load (h) | 0.9 | 0.8 -11% | 1.6 78% | 0.9 0% | 1.2 33% | 1.47 ? 63% |
| Witcher 3 ultra (h) | 0.8 | 0.8 |
Za
Przeciw
Werdykt - ROG Flow Z13 ACRNM zachwyca designem i wydajnością
ZeszłorocznyROG Flow Z13był już dość wyjątkowym produktem z Core i9-12900H i GeForce RTX 3050 Ti, ale model 2023 to ogromna poprawa, zwłaszcza pod względem wydajności GPU. Nasza specjalna edycja ACRNM jest wyposażona w nowyGeForce RTX 4070 Laptop, który nie ma problemów z nowoczesnymi grami w natywnej rozdzielczości QHD. Core i9-13900H to ponownie bardzo wydajny procesor, ale najbardziej uderzającym aspektem specjalnej edycji jest oczywiście projekt obudowy z tylną pokrywą obrabianą CNC, a także dodatkowy materiał w rogach, w tym punkt mocowania dla pasków obejmujących. Podoba nam się design, a sam kabriolet jest niezwykle solidny - niemal jak urządzenie typu ruggedized, co odzwierciedla również wysoka waga - 1,7 kg (wraz z pokrywą klawiatury).
Pokrywa klawiatury w edycji ACRNM również różni się od zwykłejROG Flow Z13a nawet dostajemy dwa różne modele. Trzeba jednak rozróżnić to do aspektów. Obie pokrywy klawiatury są nieco grubsze niż zwykła wersja, co dobrze wpływa na stabilność i jak dotąd nigdy nie recenzowaliśmy odłączanej klawiatury z tak dobrymi wrażeniami z pisania. Z drugiej strony napisy i kontrast (lub jego brak) to katastrofa, a design był wyraźnie ważniejszy niż ergonomia. Będzie to problem, jeśli nie piszemy na ślepo.
Asus ROG Flow Z13 w edycji ACRNM to bardzo wydajny gamingowy kabriolet o efektownym wyglądzie. Dzięki nowemu RTX 4070 Laptop poradzi sobie nawet z nowoczesnymi grami na ekranie WQHD.
WydajnośćRTX 4070 Laptopjest dobra, ale trzeba pamiętać, że to tylko wersja 65W. Większe laptopy do gier z RTX 4070 Laptop, a nawet RTX 4060 Laptop będą oferować większą wydajność, ale ogólna wydajność jest nadal doskonała, biorąc pod uwagę kompaktowe rozmiary Flow Z13, a także jest ogromna poprawa w stosunku do poprzedniego modelu. Wentylatory są bardzo słyszalne w trybie Turbo i występują lekkie wibracje. Zauważyliśmy również wysoki dźwięk podczas czuwania.
Wyświetlacz ma teraz rozdzielczość WQHD z 165 Hz i jest używany zarówno w ACRNM, jak i w zwykłej wersji Flow Z13. Podsumowując, ekran IPS pozostawia dobre wrażenie w grach dzięki wysokiej częstotliwości i szybkim czasom reakcji. Radzi sobie również z edycją zdjęć i nie wykryliśmy żadnego migotania PWM.
Zwykły ROG Flow Z13 jest niestety dostępny tylko z RTX 4060 Laptop (lub odpowiednio 4050 Laptop i RTX 2050 Laptop), ale wszystkie są też wersjami 65W, więc to ograniczenie nie jest konieczne. Wzornictwo zwykłego modelu jest znacznie bardziej konserwatywne i bardziej przemawia do niektórych użytkowników. Już teraz recenzujemy również zwykłą wersję z RTX 4060 Laptop, a recenzja zostanie opublikowana wkrótce. Nasz idealny ROG Flow Z13 wykorzystywałby zwykłą obudowę z Laptopem RTX 4070 i grubszą pokrywę klawiatury w edycji ACRNM, ale bez zbędnych napisów. Wciąż nie ma prawie żadnej konkurencji ROG Flow Z13 w obrębie rynku konwertowalnego i trzeba będzie zaopatrzyć się w 14-calowy notebook do gier, aby uzyskać porównywalny poziom wydajności.
Cena i dostępność
ROG Flow Z13 ACRNM można zamówić w Asus eStore za 2499 dolarów.
Asus ROG Flow Z13 ACRNM
- 09/04/2023 v7 (old)
Andreas Osthoff
Przezroczystość
Wyboru urządzeń do recenzji dokonuje nasza redakcja. Próbka testowa została udostępniona autorowi jako pożyczka od producenta lub sprzedawcy detalicznego na potrzeby tej recenzji. Pożyczkodawca nie miał wpływu na tę recenzję, producent nie otrzymał też kopii tej recenzji przed publikacją. Nie było obowiązku publikowania tej recenzji. Jako niezależna firma medialna, Notebookcheck nie podlega władzy producentów, sprzedawców detalicznych ani wydawców.
Tak testuje Notebookcheck
Każdego roku Notebookcheck niezależnie sprawdza setki laptopów i smartfonów, stosując standardowe procedury, aby zapewnić porównywalność wszystkich wyników. Od około 20 lat stale rozwijamy nasze metody badawcze, ustanawiając przy tym standardy branżowe. W naszych laboratoriach testowych doświadczeni technicy i redaktorzy korzystają z wysokiej jakości sprzętu pomiarowego. Testy te obejmują wieloetapowy proces walidacji. Nasz kompleksowy system ocen opiera się na setkach uzasadnionych pomiarów i benchmarków, co pozwala zachować obiektywizm.Price comparison

