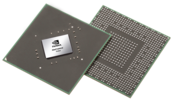
NVIDIA GeForce 940M
Następca modelu 840M. Karta ta ma prawie identyczne parametry, co starszy model (architektura Maxwell, 384 rdzenie CUDA, VRAM DDR3, 64-bitowa szyna danych) - różni się wyższymi zegarami GPU.
GeForce 900M Rodzina Nazwa robocza N16S-GT-S/B Architektura Maxwell Potoki 384 - ZJC Zegar rdzenia 1072 - 1176 (Boost) MHz Zegar pamięci 2000 MHz Magistrala 64 bit Typ pamięci DDR3 Maks. pamięci 4 GB Pamięć współdzielona nie API DirectX 12 (FL 11_0), Shader 5.0, OpenGL 4.5 Pobór prądu 25 W Technologia 28 nm Technologie GPU Boost 2.0, Optimus, PhysX, CUDA, GeForce Experience Wielkość laptopa średni Data premiery 12.03.2015 Witryna producenta http://www.geforce.com/hardware/notebook...
Testy Performance Rating - 3DMark 11 + Fire Strike + Time Spy
4 pt (4%)
...
Intel UHD Graphics Xe 16EUs (Tiger Lake-H) -5%
...
3DMark - 3DMark Ice Storm Unlimited Graphics
min: 107932 avg: 123225 median: 123311 (14%) max: 138345 Points
...
AMD Radeon RX Vega 5 4%
...
3DMark - 3DMark Ice Storm Extreme Graphics
min: 16718 avg: 36481 median: 42559.5 (6%) max: 44085 Points
...
Intel UHD Graphics Xe 750 32EUs (Rocket Lake) -7%
NVIDIA GeForce GTX 1650 Ti Max-Q -6%
...
NVIDIA GeForce RTX 3080 Laptop GPU 1038%
3DMark - 3DMark Cloud Gate Score
min: 5816 avg: 6442 median: 6342 (7%) max: 9112 Points
...
Intel UHD Graphics (Jasper Lake 24 EU) 3%
...
AMD Radeon RX 6500M 1337%
3DMark - 3DMark Cloud Gate Graphics
min: 7647 avg: 8888 median: 8818.5 (3%) max: 9807 Points
...
Intel UHD Graphics G7 (Lakefield GT2 64 EU) -5%
...
AMD Radeon RX 6850M XT 1846%
3DMark - 3DMark Fire Strike Standard Score
min: 1333 avg: 1422 median: 1422 (3%) max: 1555 Points
...
...
AMD Radeon RX 6850M XT 1864%
3DMark - 3DMark Fire Strike Standard Graphics
min: 1530 avg: 1631 median: 1622 (2%) max: 1739 Points
...
...
3DMark - 3DMark Ice Storm Graphics
min: 16771 avg: 52185 median: 51180.5 (7%) max: 81426 Points
...
...
AMD Radeon RX 6800S 901%
3DMark 11 - 3DM11 Performance Score
min: 2282 avg: 2480 median: 2485 (4%) max: 2800 Points
...
...
AMD Radeon RX 6850M XT 1144%
3DMark 11 - 3DM11 Performance GPU
min: 2178 avg: 2417 median: 2405.5 (2%) max: 2602 Points
...
...
AMD Radeon RX 6850M XT 1638%
3DMark Vantage 3DM Vant. Perf. total + 3DMark Vantage - 3DM Vant. Perf. total
min: 7406 avg: 7531 median: 7530.5 (2%) max: 7655 Points
...
Intel UHD Graphics Xe 16EUs (Tiger Lake-H) 1%
...
NVIDIA GeForce RTX 3080 Ti Laptop GPU 1158%
3DM Vant. Perf. GPU no PhysX + 3DMark Vantage - 3DM Vant. Perf. GPU no PhysX
min: 6923 avg: 6943 median: 6942.5 (4%) max: 6962 Points
...
...
NVIDIA GeForce RTX 3080 Ti Laptop GPU 1375%
3DMark 06 3DMark 06 - Standard 1280x1024 +
min: 10614 avg: 12095 median: 11920 (17%) max: 14401 Points
...
...
NVIDIA GeForce RTX 3080 Ti Laptop GPU 372%
Unigine Heaven 2.1 - Heaven 2.1 high
28.3 fps (5%)
...
NVIDIA Quadro M1200 -1%
...
SPECviewperf 11 specvp11 snx-01 + SPECviewperf 11 - specvp11 snx-01
6.5 fps (5%)
...
...
specvp11 tcvis-02 + SPECviewperf 11 - specvp11 tcvis-02
1.6 fps (3%)
...
...
specvp11 sw-02 + SPECviewperf 11 - specvp11 sw-02
11 fps (13%)
...
...
specvp11 proe-05 + SPECviewperf 11 - specvp11 proe-05
1.6 fps (7%)
...
...
NVIDIA Quadro M1200 1308%
specvp11 maya-03 + SPECviewperf 11 - specvp11 maya-03
7.3 fps (5%)
...
...
specvp11 lightwave-01 + SPECviewperf 11 - specvp11 lightwave-01
14.2 fps (15%)
...
NVIDIA NVS 5400M -3%
...
specvp11 ensight-04 + SPECviewperf 11 - specvp11 ensight-04
17.6 fps (8%)
...
...
specvp11 catia-03 + SPECviewperf 11 - specvp11 catia-03
10.2 fps (12%)
...
...
SPECviewperf 12 specvp12 sw-03 + SPECviewperf 12 - specvp12 sw-03
14.7 fps (4%)
...
NVIDIA GeForce MX250 14%
...
specvp12 snx-02 + SPECviewperf 12 - specvp12 snx-02
1.8 fps (0%)
Intel Iris Xe MAX Graphics -46%
NVIDIA GeForce MX250 16%
...
NVIDIA RTX A5500 Laptop GPU 11762%
specvp12 showcase-01 + SPECviewperf 12 - specvp12 showcase-01
6.1 fps (1%)
...
...
NVIDIA RTX A5500 Laptop GPU 2138%
specvp12 mediacal-01 + SPECviewperf 12 - specvp12 mediacal-01
5.7 fps (2%)
...
...
specvp12 maya-04 + SPECviewperf 12 - specvp12 maya-04
2.1 fps (1%)
NVIDIA GeForce MX250 44%
...
NVIDIA RTX A5500 Laptop GPU 7666%
specvp12 energy-01 + SPECviewperf 12 - specvp12 energy-01
0.1 fps (0%)
...
specvp12 creo-01 + SPECviewperf 12 - specvp12 creo-01
6.7 fps (3%)
Intel Iris Xe Graphics G7 96EUs 35%
...
NVIDIA RTX A5500 Laptop GPU 2511%
specvp12 catia-04 + SPECviewperf 12 - specvp12 catia-04
9.7 fps (2%)
...
NVIDIA GeForce MX250 -6%
...
NVIDIA RTX A5500 Laptop GPU 2062%
Cinebench R10 Cinebench R10 Shading (32bit) + Cinebench R10 - Cinebench R10 Shading (32bit)
min: 2990 avg: 5922 median: 6088 (4%) max: 6724 pkt.
...
NVIDIA GeForce MX230 -1%
NVIDIA GeForce GTX 1650 Max-Q 1%
NVIDIA NVS 5400M 2%
...
Cinebench R11.5 Cinebench R11.5 OpenGL 64 Bit + Cinebench R11.5 - Cinebench R11.5 OpenGL 64 Bit
min: 22.83 avg: 37.5 median: 39.7 (14%) max: 49.93 fps
...
...
NVIDIA RTX A2000 Laptop GPU 373%
Cinebench R15 Cinebench R15 OpenGL 64 Bit + Cinebench R15 - Cinebench R15 OpenGL 64 Bit
min: 25.58 avg: 47.8 median: 52.4 (13%) max: 61.9 fps
...
Intel UHD Graphics Xe 16EUs (Tiger Lake-H) 3%
...
NVIDIA RTX A5500 Laptop GPU 666%
Cinebench R15 OpenGL Ref. Match 64 Bit + Cinebench R15 - Cinebench R15 OpenGL Ref. Match 64 Bit
min: 98 avg: 99.5 median: 99.6 (100%) max: 99.6 %
...
AMD Radeon Pro Vega 20 -1%
NVIDIA RTX A3000 Laptop GPU -1%
NVIDIA Quadro P1000 0%
NVIDIA GeForce MX350 0%
NVIDIA Quadro M1200 0%
...
NVIDIA GeForce MX250 0%
GFXBench (DX / GLBenchmark) 2.7 GFXBench 2.7 T-Rex HD Onscreen C24Z16 + GFXBench (DX / GLBenchmark) 2.7 - GFXBench 2.7 T-Rex HD Onscreen C24Z16
min: 43.24 avg: 53.3 median: 57 (2%) max: 59.7 fps
...
Intel Iris Plus Graphics G7 (Ice Lake 64 EU) 0%
...
GFXBench T-Rex HD Offscreen C24Z16 + GFXBench (DX / GLBenchmark) 2.7 - GFXBench T-Rex HD Offscreen C24Z16
min: 122.1 avg: 127.5 median: 127.5 (1%) max: 133 fps
...
Intel UHD Graphics Xe 16EUs (Tiger Lake-H) -3%
Qualcomm Adreno 680 10%
...
NVIDIA GeForce RTX 3080 Ti Laptop GPU 1753%
GFXBench 3.0 - GFXBench 3.0 Manhattan
min: 32.35 avg: 42 median: 37.8 (10%) max: 55.7 fps
...
Intel UHD Graphics 770 9%
...
GFXBench 3.0 - GFXBench 3.0 Manhattan Offscreen
min: 62.9 avg: 65.6 median: 64 (5%) max: 70 fps
...
Intel UHD Graphics (Jasper Lake 32 EU) -18%
AMD Radeon RX Vega 5 2%
Intel UHD Graphics Xe 16EUs (Tiger Lake-H) 18%
...
Apple M1 Max 32-Core GPU 1770%
GFXBench - GFXBench Car Chase Onscreen
34.6 fps (1%)
...
NVIDIA T600 Laptop GPU -1%
NVIDIA GeForce MX230 10%
AMD Radeon RX Vega 6 (Ryzen 4000/5000) 12%
Intel Iris Xe Graphics G7 80EUs 18%
AMD Radeon RX Vega 5 18%
...
NVIDIA GeForce RTX 3070 Laptop GPU 10143%
GFXBench - GFXBench Car Chase Offscreen
38 fps (0%)
...
AMD Radeon RX Vega 6 (Ryzen 4000/5000) 3%
Intel Iris Plus Graphics G7 (Ice Lake 64 EU) 9%
NVIDIA GeForce MX230 18%
AMD Radeon 540X 30%
...
NVIDIA GeForce RTX 3070 Laptop GPU 63468%
LuxMark v2.0 64Bit - LuxMark v2.0 Room GPU
min: 359 avg: 392 median: 386 (2%) max: 431 Samples/s
...
AMD Radeon RX Vega 5 -4%
AMD Radeon RX Vega 6 (Ryzen 4000/5000) -2%
Intel Iris Plus Graphics G7 (Ice Lake 64 EU) 0%
...
NVIDIA GeForce GTX 1650 Ti Mobile 2392%
LuxMark v2.0 64Bit - LuxMark v2.0 Sala GPU
min: 781 avg: 858 median: 878 (2%) max: 916 Samples/s
...
AMD Radeon 680M -7%
AMD Radeon 660M 0%
Intel UHD Graphics Xe G4 48EUs 5%
...
AMD Radeon RX 6800M 1621%
ComputeMark v2.1 - ComputeMark v2.1 Result
min: 1685 avg: 1719 median: 1719 (2%) max: 1753 pkt.
...
Intel UHD Graphics 770 -3%
Intel Iris Plus Graphics 655 7%
Intel UHD Graphics Xe G4 48EUs 8%
...
NVIDIA GeForce RTX 3080 Ti Laptop GPU 1687%
Power Consumption - Furmark Stress Test Power Consumption - external Monitor *
62.8 Watt (9%)
...
NVIDIA T600 Laptop GPU -13%
NVIDIA GeForce MX450 -13%
Intel UHD Graphics Xe 750 32EUs (Rocket Lake) -4%
Intel Arc A350M -4%
NVIDIA RTX A1000 Laptop GPU 2%
NVIDIA GeForce GTX 1650 Ti Max-Q 6%
Intel Arc A370M 8%
NVIDIA GeForce GTX 1650 Ti Mobile 15%
...
AMD Radeon RX 6850M XT 256%
Power Consumption - The Witcher 3 Power Consumption - external Monitor *
45.1 Watt (6%)
Intel UHD Graphics (Jasper Lake 32 EU) -67%
...
NVIDIA GeForce MX250 -6%
AMD Radeon RX Vega 8 (Ryzen 4000/5000) -5%
NVIDIA T500 Laptop GPU -3%
AMD Radeon 680M 9%
NVIDIA GeForce MX350 9%
Intel Iris Xe MAX Graphics 10%
...
AMD Radeon RX 6850M XT 425%
- Zakres wyników testów referencyjnych dla tej karty graficznej
- Średnia wartość wyników testów referencyjnych dla tej karty graficzne
* Smaller numbers mean a higher performance
Testy gier Zamieszczone niżej wyniki pochodzą z testów zrecenzowanych laptopów. Należy pamiętać, że osiągi poszczególnych konfiguracji zależą od zastosowanej pamięci własnej karty (VRAM), zegarów karty (mogą być różne), procesora, ustawień systemu, sterowników i wersji systemu operacyjnego. Tym samym uzyskane wyniki nie muszą być reprezentatywne dla wszystkich laptopów wyposażonych w daną kartę graficzną. By uzyskać szczegółowe informacje o wynikach testów, należy kliknąć na podaną wartość liczbową (fps, czyli kl/s).
...
Intel Iris Plus Graphics G7 (Ice Lake 64 EU) -14%
Intel UHD Graphics Xe 32EUs (Tiger Lake-H) 8%
Intel Iris Xe Graphics G7 96EUs 21%
AMD Radeon RX Vega 5 32%
AMD Radeon 540X 37%
AMD Radeon RX Vega 6 (Ryzen 4000/5000) 58%
NVIDIA GeForce MX330 85%
...
Intel Iris Plus Graphics G7 (Ice Lake 64 EU) -10%
Intel UHD Graphics Xe 32EUs (Tiger Lake-H) 5%
AMD Radeon RX Vega 5 30%
Intel Iris Xe Graphics G7 96EUs 33%
AMD Radeon 540X 34%
AMD Radeon RX Vega 6 (Ryzen 4000/5000) 53%
AMD Radeon RX Vega 7 83%
...
NVIDIA GeForce RTX 2080 Super Mobile 964%
NVIDIA GeForce MX330 -11%
AMD Radeon 540X 24%
AMD Radeon RX Vega 5 26%
Intel Iris Xe Graphics G7 96EUs 40%
AMD Radeon RX Vega 6 (Ryzen 4000/5000) 47%
AMD Radeon RX Vega 7 79%
NVIDIA GeForce MX250 85%
NVIDIA GeForce MX350 108%
AMD Radeon RX Vega 8 (Ryzen 4000/5000) 112%
...
» Niegrywalna na większości testowanych laptopów.
...
AMD Radeon 540X 4%
AMD Radeon RX Vega 5 15%
AMD Radeon RX Vega 6 (Ryzen 4000/5000) 31%
Intel Iris Xe Graphics G7 96EUs 36%
NVIDIA GeForce MX250 41%
NVIDIA GeForce MX330 58%
...
...
Intel Iris Plus Graphics G7 (Ice Lake 64 EU) -26%
AMD Radeon RX Vega 5 31%
AMD Radeon 540X 34%
AMD Radeon RX Vega 6 (Ryzen 4000/5000) 42%
NVIDIA GeForce MX250 50%
AMD Radeon RX Vega 7 68%
NVIDIA GeForce MX330 81%
...
» Niegrywalna na większości testowanych laptopów.
...
AMD Radeon RX Vega 5 9%
AMD Radeon RX Vega 6 (Ryzen 4000/5000) 27%
NVIDIA GeForce MX230 27%
AMD Radeon RX Vega 7 52%
NVIDIA GeForce MX250 66%
NVIDIA GeForce MX350 95%
...
NVIDIA GeForce MX330 10%
AMD Radeon RX Vega 5 30%
AMD Radeon RX Vega 6 (Ryzen 4000/5000) 35%
NVIDIA GeForce MX230 40%
AMD Radeon RX Vega 7 70%
NVIDIA GeForce MX250 75%
NVIDIA GeForce MX350 90%
...
» Niegrywalna na większości testowanych laptopów.
...
NVIDIA GeForce RTX 3070 Laptop GPU 2082%
» Niegrywalna na większości testowanych laptopów.
...
Intel Iris Plus Graphics G7 (Ice Lake 64 EU) 6%
Intel Iris Plus Graphics 655 10%
AMD Radeon RX Vega 5 14%
...
...
Intel Iris Plus Graphics 655 12%
AMD Radeon RX Vega 5 13%
NVIDIA GeForce MX330 23%
AMD Radeon RX Vega 6 (Ryzen 4000/5000) 28%
...
Intel Iris Plus Graphics 655 10%
NVIDIA GeForce MX230 14%
NVIDIA GeForce MX330 14%
AMD Radeon RX Vega 5 14%
AMD Radeon RX Vega 6 (Ryzen 4000/5000) 22%
...
NVIDIA GeForce MX230 11%
NVIDIA GeForce MX250 44%
Intel Iris Plus Graphics G7 (Ice Lake 64 EU) 46%
AMD Radeon 540X 48%
NVIDIA GeForce MX330 48%
...
NVIDIA GeForce RTX 2070 Super Mobile 1474%
» Na wszystkich testowanych laptopach grywalna przy ustawieniach low.
...
...
...
...
» Na wszystkich testowanych laptopach grywalna przy ustawieniach ultra.
...
Intel Iris Plus Graphics G7 (Ice Lake 64 EU) -10%
AMD Radeon 540X -8%
AMD Radeon RX Vega 7 -6%
Intel Iris Xe Graphics G7 80EUs -6%
NVIDIA GeForce MX330 -5%
Intel Iris Plus Graphics 655 2%
NVIDIA GeForce MX230 10%
AMD Radeon RX Vega 8 (Ryzen 4000/5000) 19%
NVIDIA GeForce MX250 34%
Apple M2 8-Core GPU 38%
Intel Iris Xe Graphics G7 96EUs 39%
...
NVIDIA GeForce RTX 3080 Laptop GPU 384%
...
AMD Radeon RX Vega 6 (Ryzen 4000/5000) -19%
AMD Radeon 540X -10%
AMD Radeon RX Vega 7 -4%
NVIDIA GeForce MX230 -3%
NVIDIA GeForce MX330 -3%
Intel Iris Plus Graphics 655 11%
AMD Radeon RX Vega 8 (Ryzen 4000/5000) 22%
Intel Iris Xe Graphics G7 80EUs 26%
NVIDIA GeForce MX250 30%
NVIDIA GeForce MX350 58%
Apple M1 7-Core GPU 58%
...
NVIDIA GeForce RTX 3080 Laptop GPU 795%
...
Intel Iris Plus Graphics G7 (Ice Lake 64 EU) -19%
NVIDIA GeForce MX230 -17%
AMD Radeon RX Vega 5 -12%
AMD Radeon 540X -4%
AMD Radeon RX Vega 6 (Ryzen 4000/5000) -2%
AMD Radeon RX Vega 7 9%
NVIDIA GeForce MX250 13%
Intel Iris Plus Graphics 655 15%
NVIDIA GeForce MX350 31%
AMD Radeon RX Vega 8 (Ryzen 4000/5000) 47%
NVIDIA GeForce MX450 54%
...
NVIDIA GeForce RTX 3080 Laptop GPU 1091%
» Na wszystkich testowanych laptopach grywalna przy ustawieniach low.
Intel Iris Plus Graphics G7 (Ice Lake 64 EU) -26%
NVIDIA GeForce MX230 36%
Intel Iris Plus Graphics 655 36%
...
» Niegrywalna na większości testowanych laptopów.
...
Intel Iris Plus Graphics G7 (Ice Lake 64 EU) -31%
Intel Iris Plus Graphics 655 -21%
Intel UHD Graphics Xe 32EUs (Tiger Lake-H) 11%
AMD Radeon RX Vega 5 19%
AMD Radeon 540X 22%
AMD Radeon RX Vega 6 (Ryzen 4000/5000) 24%
AMD Radeon RX Vega 8 (Ryzen 4000/5000) 30%
NVIDIA GeForce MX250 31%
...
NVIDIA GeForce RTX 2080 Super Max-Q 318%
...
Intel UHD Graphics Xe 16EUs (Tiger Lake-H) -34%
NVIDIA GeForce MX230 -32%
NVIDIA GeForce MX330 -8%
Intel UHD Graphics Xe 32EUs (Tiger Lake-H) 19%
AMD Radeon RX Vega 5 23%
AMD Radeon RX Vega 6 (Ryzen 4000/5000) 27%
Intel Iris Plus Graphics G7 (Ice Lake 64 EU) 30%
AMD Radeon 540X 33%
...
NVIDIA GeForce RTX 2080 Super Mobile 917%
NVIDIA GeForce MX230 -30%
AMD Radeon RX Vega 5 21%
Intel UHD Graphics Xe 32EUs (Tiger Lake-H) 22%
NVIDIA GeForce MX330 23%
AMD Radeon 540X 39%
AMD Radeon RX Vega 6 (Ryzen 4000/5000) 43%
...
» Na wszystkich testowanych laptopach grywalna przy ustawieniach low.
...
Intel UHD Graphics Xe G4 48EUs -19%
AMD Radeon RX Vega 5 -14%
Intel Iris Plus Graphics 655 -5%
AMD Radeon 540X -5%
AMD Radeon RX Vega 6 (Ryzen 4000/5000) -4%
Intel UHD Graphics Xe 32EUs (Tiger Lake-H) -3%
Intel Iris Xe Graphics G7 96EUs 9%
NVIDIA GeForce MX230 16%
AMD Radeon RX Vega 8 (Ryzen 4000/5000) 19%
Intel UHD Graphics 64EUs (Alder Lake 12th Gen) 22%
AMD Radeon RX Vega 7 24%
NVIDIA GeForce MX250 27%
...
NVIDIA GeForce MX230 8%
Intel UHD Graphics Xe G4 48EUs 17%
Intel UHD Graphics Xe 32EUs (Tiger Lake-H) 18%
AMD Radeon RX Vega 5 33%
AMD Radeon RX Vega 6 (Ryzen 4000/5000) 44%
...
» Na wszystkich testowanych laptopach grywalna przy ustawieniach low.
...
Intel Iris Plus Graphics G7 (Ice Lake 64 EU) 25%
Intel Iris Plus Graphics 655 30%
NVIDIA GeForce MX230 44%
...
...