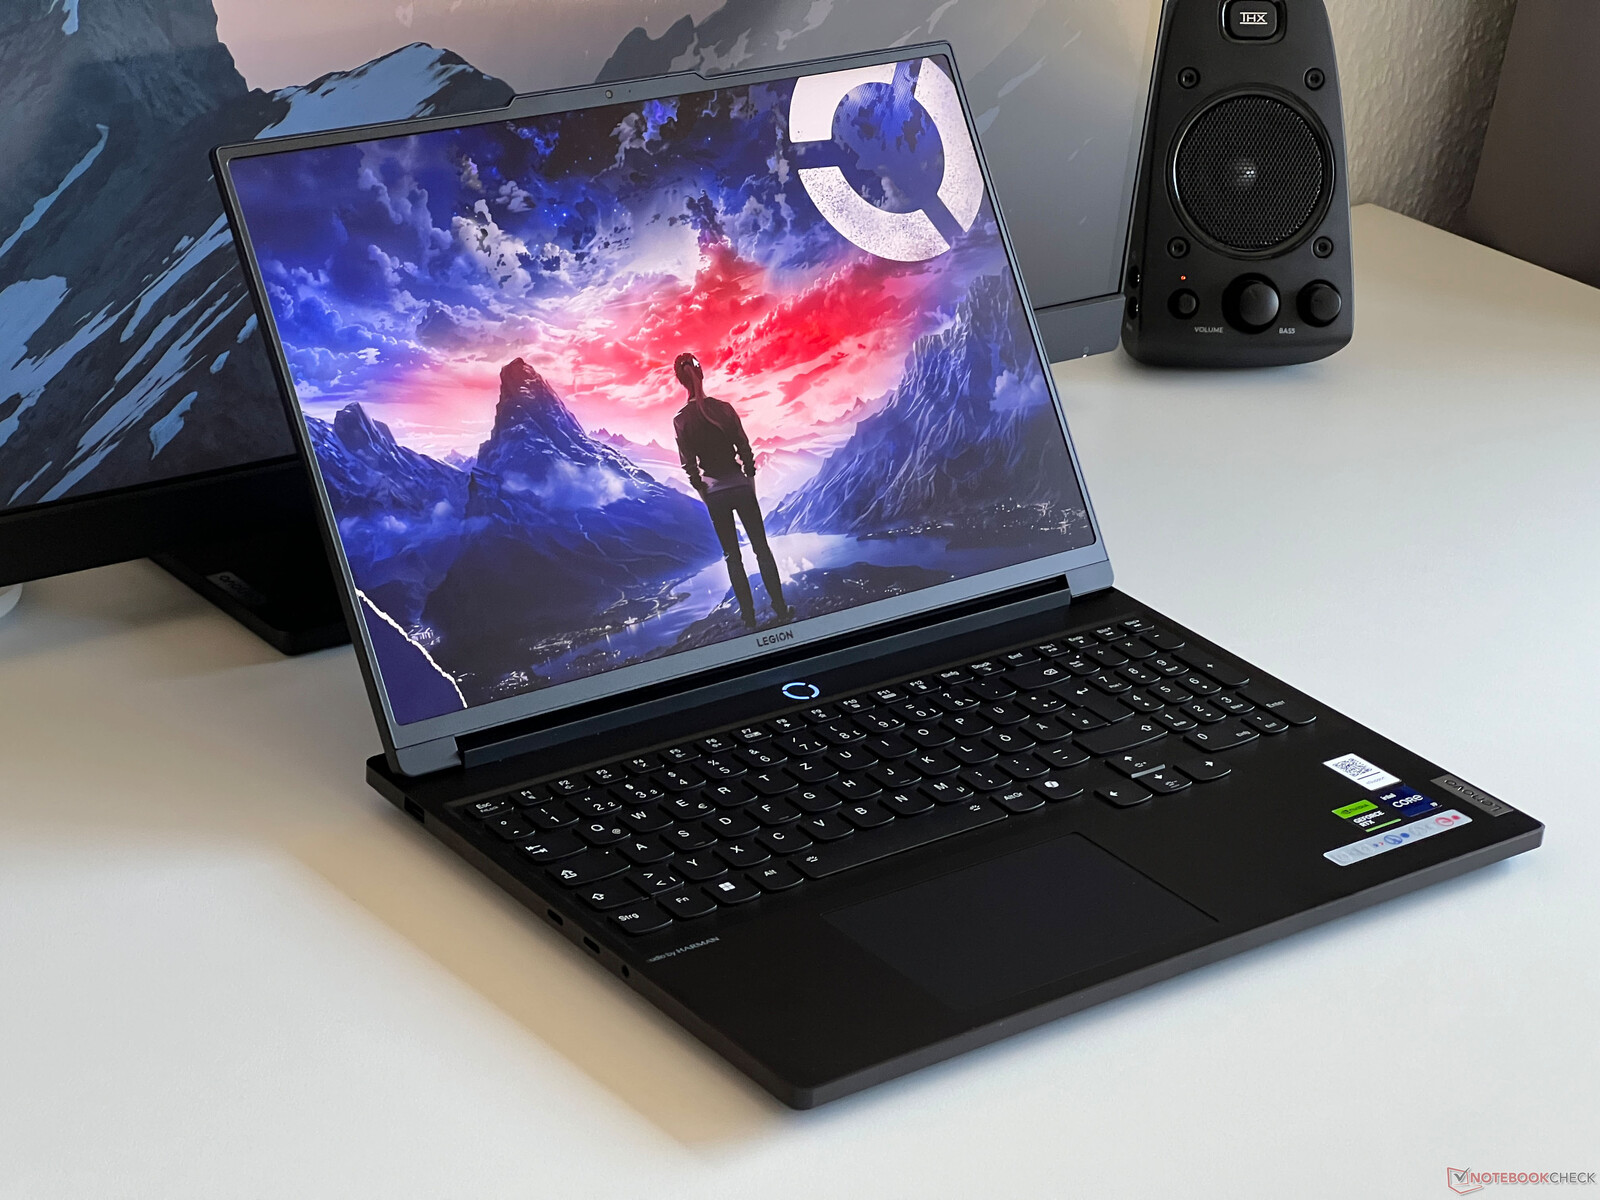
Recenzja laptopa Lenovo Legion 7 16 G9 - gamingowa maszyna z wyświetlaczem 3,2K, procesorem HX i podkręconą kartą graficzną RTX 4070
Legion 7 16 to Legion Pro 7 16 tańszy i smuklejszy brat, którego niedawno recenzowaliśmy. Istnieją różnice, zwłaszcza jeśli chodzi o karty graficzne, przy czym maksymalnym dostępnym GPU zwykłego Legion 7 jest laptop RTX 4070. Jeśli jednak chodzi o procesor, zastosowano te same układy Intel HX, a oprócz paneli WQHD dostępny jest opcjonalny panel IPS o wysokiej rozdzielczości, 165 Hz 3,2K.
Nasze urządzenie do recenzji to wariant Campus za 2 249 USD, który jest wyposażony w Core i9-14900HXlaptop GeForce RTX 4070, 32 GB pamięci RAM, dysk SSD o pojemności 1 TB, a także panel 3,2K. Obecnie wciąż nie ma odpowiednich wariantów dla zwykłych klientów, ale cena powinna być o około 250-300 USD wyższa.
Potencjalni konkurenci w porównaniu
Ocena | Data | Model | Waga | Wysokość | Rozmiar | Rezolucja | Cena |
|---|---|---|---|---|---|---|---|
| 90.8 % v7 (old) | 04/2024 | Lenovo Legion 7 16 IRX G9 i9-14900HX, GeForce RTX 4070 Laptop GPU | 2.3 kg | 19.8 mm | 16.00" | 3200x2000 | |
| 89.3 % v7 (old) | 04/2024 | Lenovo Legion Pro 5 16IRX9 i9-14900HX, GeForce RTX 4070 Laptop GPU | 2.5 kg | 26.95 mm | 16.00" | 2560x1600 | |
| 87.4 % v7 (old) | 04/2024 | Aorus 16X 2024 i9-14900HX, GeForce RTX 4070 Laptop GPU | 2.3 kg | 20 mm | 16.00" | 2560x1600 | |
| 88.4 % v7 (old) | 02/2024 | HP Omen Transcend 16-u1095ng i9-14900HX, GeForce RTX 4070 Laptop GPU | 2.3 kg | 20 mm | 16.00" | 2560x1600 | |
| 90.2 % v7 (old) | 03/2024 | Alienware m16 R2 Ultra 7 155H, GeForce RTX 4070 Laptop GPU | 2.5 kg | 23.5 mm | 16.00" | 2560x1600 | |
| 89.2 % v7 (old) | 10/2023 | Schenker XMG CORE 16 (L23) R7 7840HS, GeForce RTX 4070 Laptop GPU | 2.4 kg | 26.1 mm | 16.00" | 2560x1600 | |
| 89.5 % v7 (old) | 03/2024 | Lenovo Legion Pro 7 16IRX9H i9-14900HX, GeForce RTX 4080 Laptop GPU | 2.7 kg | 21.95 mm | 16.00" | 2560x1600 |
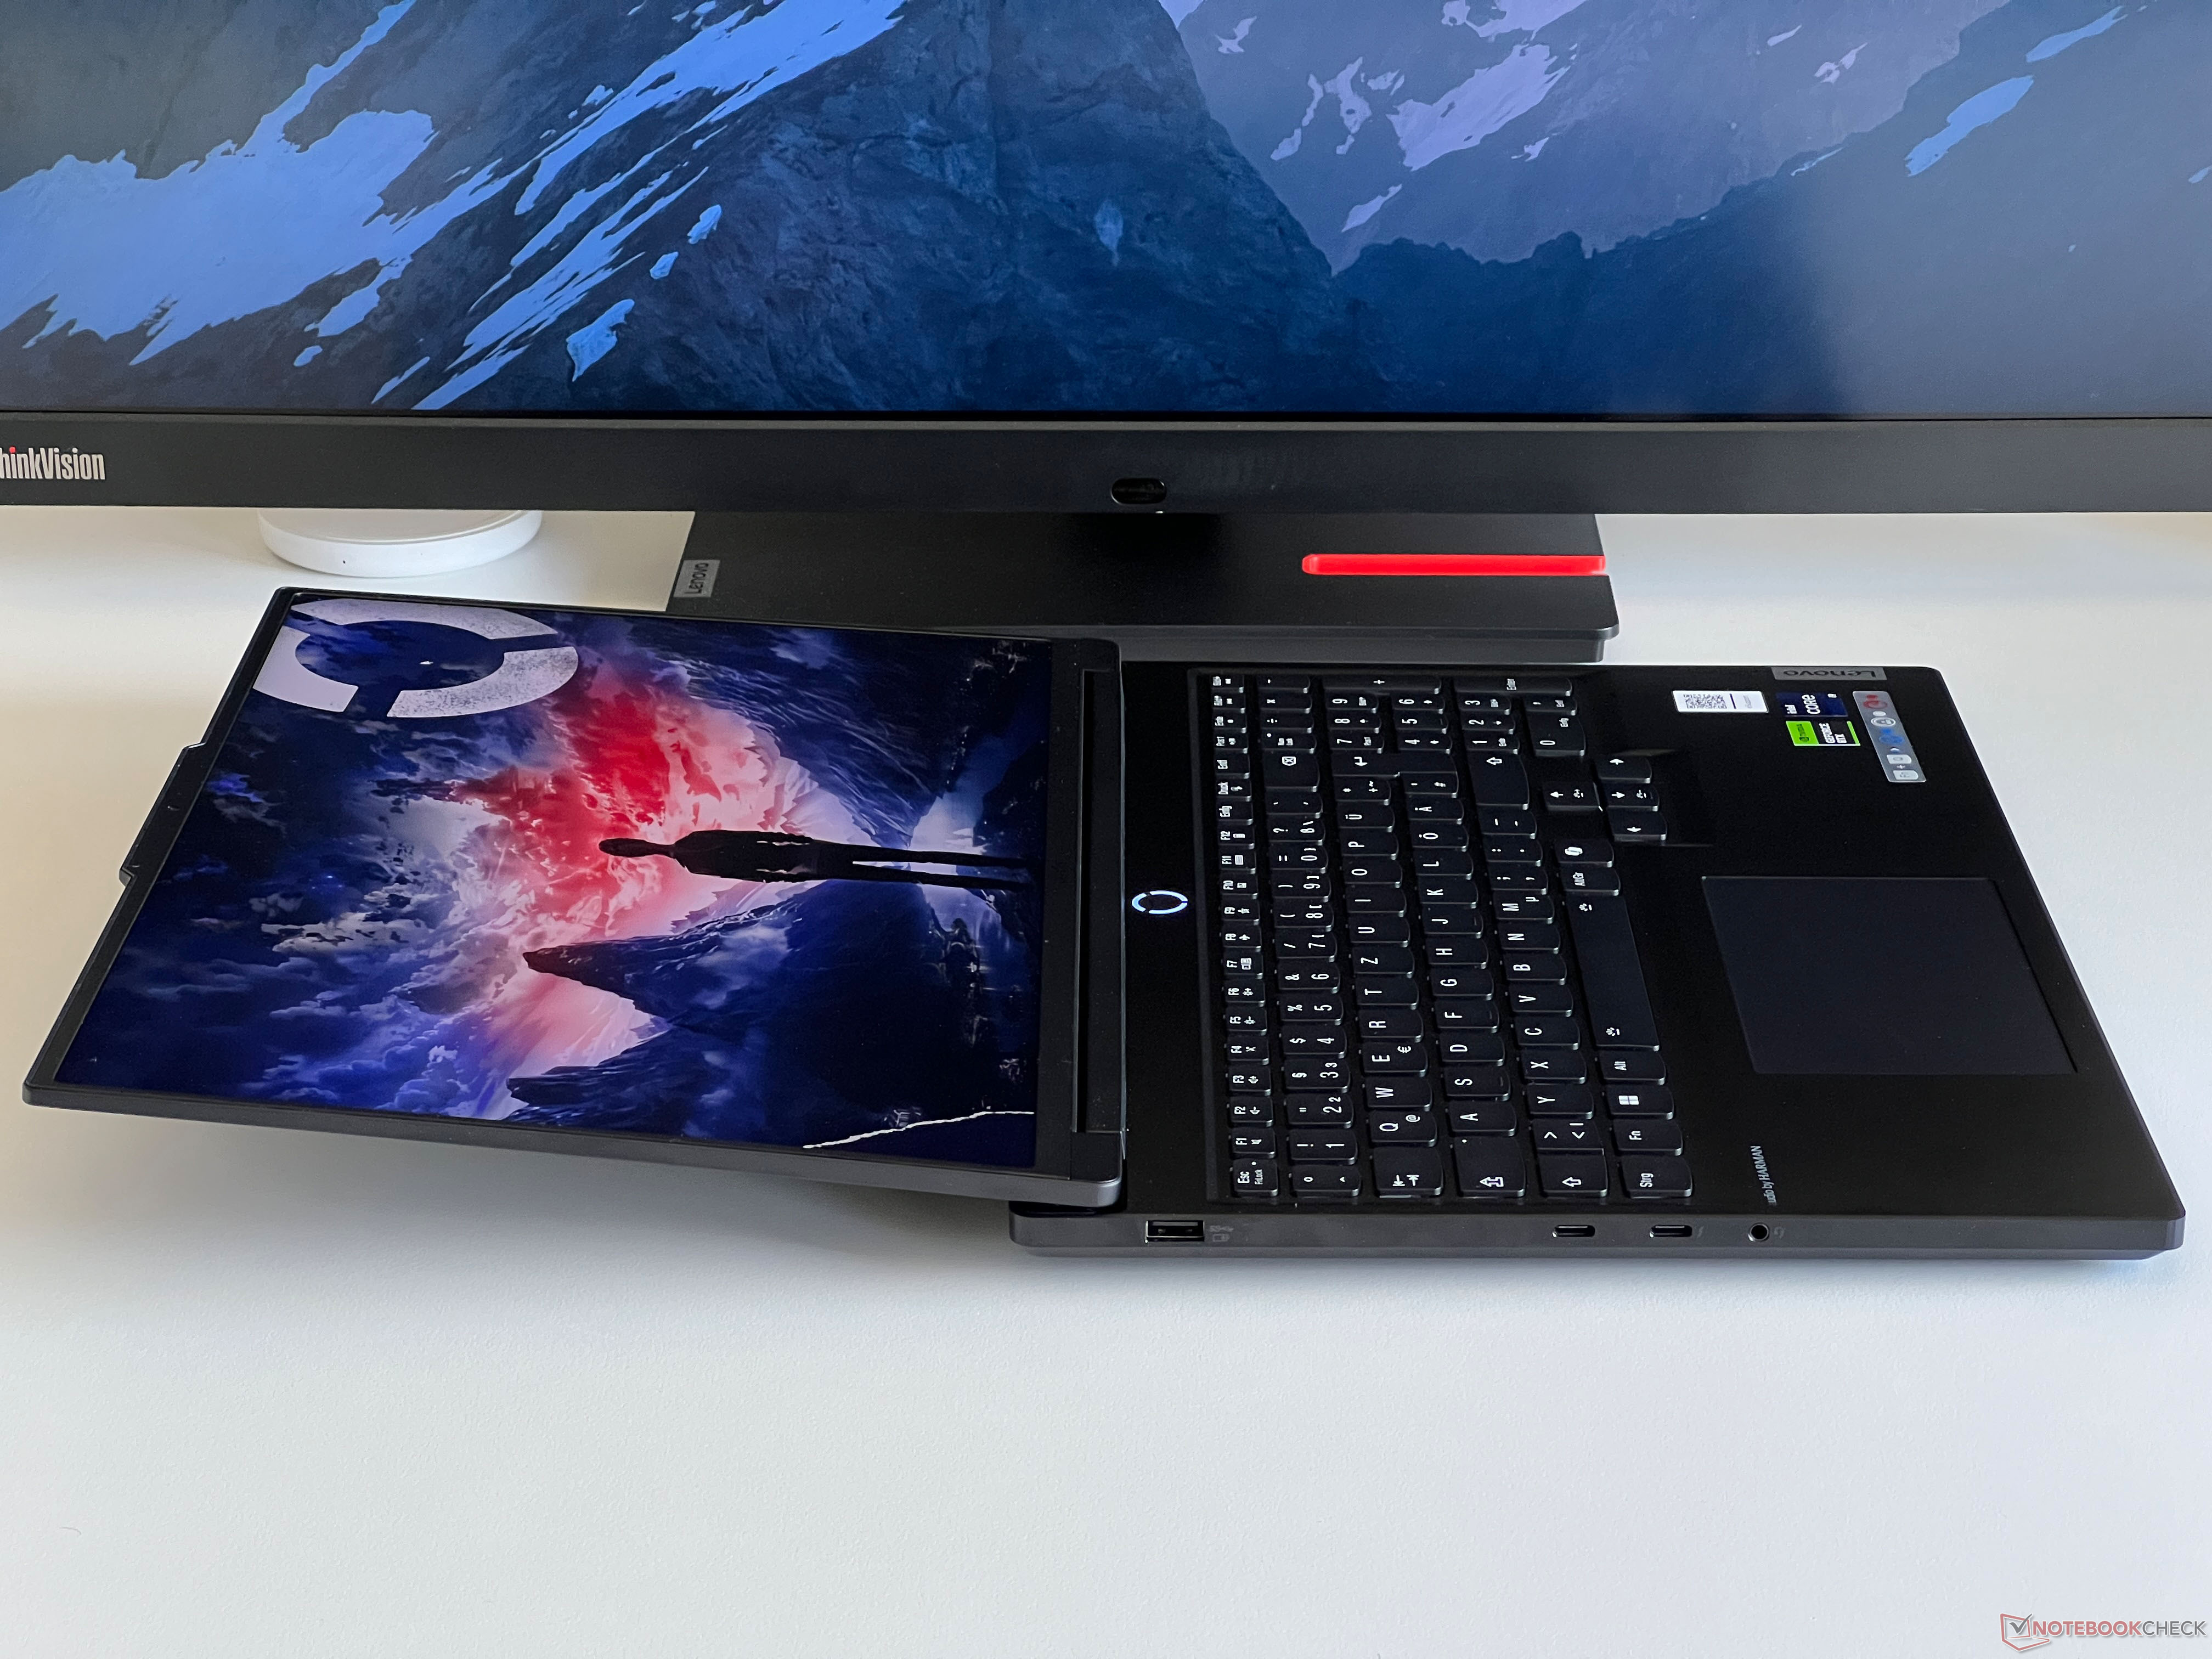
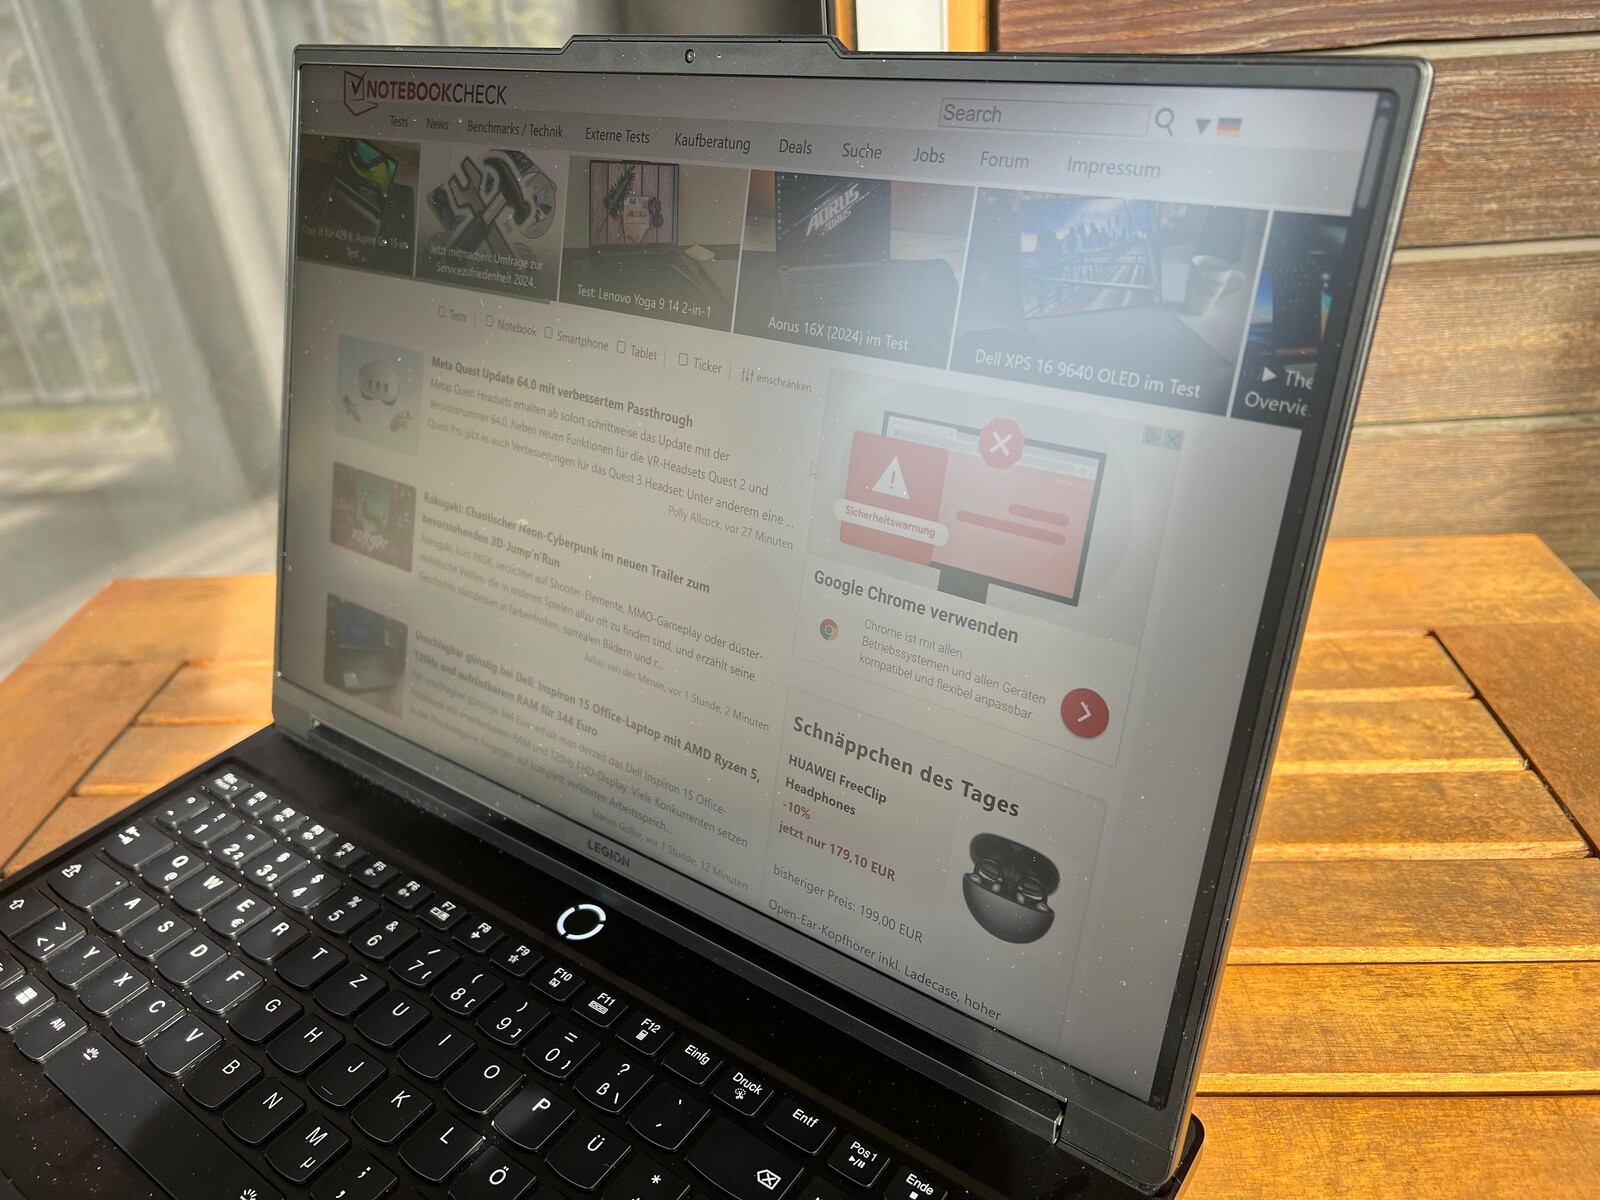
Obudowa - czarny aluminiowy magnes na odciski palców
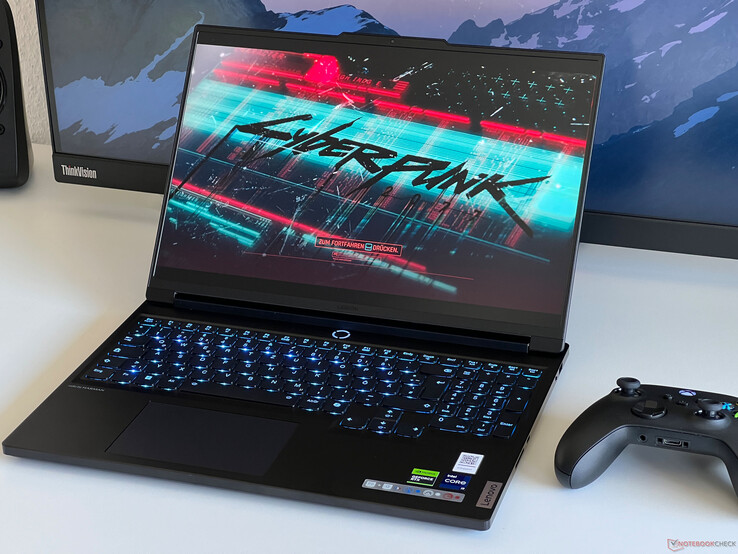
Legion 7 16 to porównywalnie cienki laptop do gier, który jest również bardzo dyskretny dzięki czarnej aluminiowej obudowie. W przeciwieństwie do Legion Pro 7, po bokach urządzenia nie ma wystających elementów chłodzących. Wizualnie obudowa wygląda bardzo dobrze, ale tylko przez krótki czas, ponieważ gładkie powierzchnie w magiczny sposób przyciągają odciski palców. Z tego powodu należy zawsze mieć pod ręką ściereczkę do czyszczenia obudowy. Ramki ekranu są bardzo cienkie, a wygląd psuje jedynie wypukłość kamery, choć ułatwia to otwieranie etui.
Zarówno stabilność etui, jak i jakość wykonania są bardzo dobre i nie byliśmy w stanie sprowokować żadnych odgłosów skrzypienia. Dodatkowo, praktycznie niemożliwe jest wygięcie klawiatury pod naciskiem. Cienka pokrywa wyświetlacza jest nieco bardziej elastyczna, ale jest to również obszar, w którym nie byliśmy w stanie spowodować żadnych zniekształceń obrazu. Jak na nasz gust, zawiasy mogłyby być nieco twardsze, ponieważ podczas regulacji kąta otwarcia (maksymalnie ~170 stopni) występuje widoczny ruch kołysania.
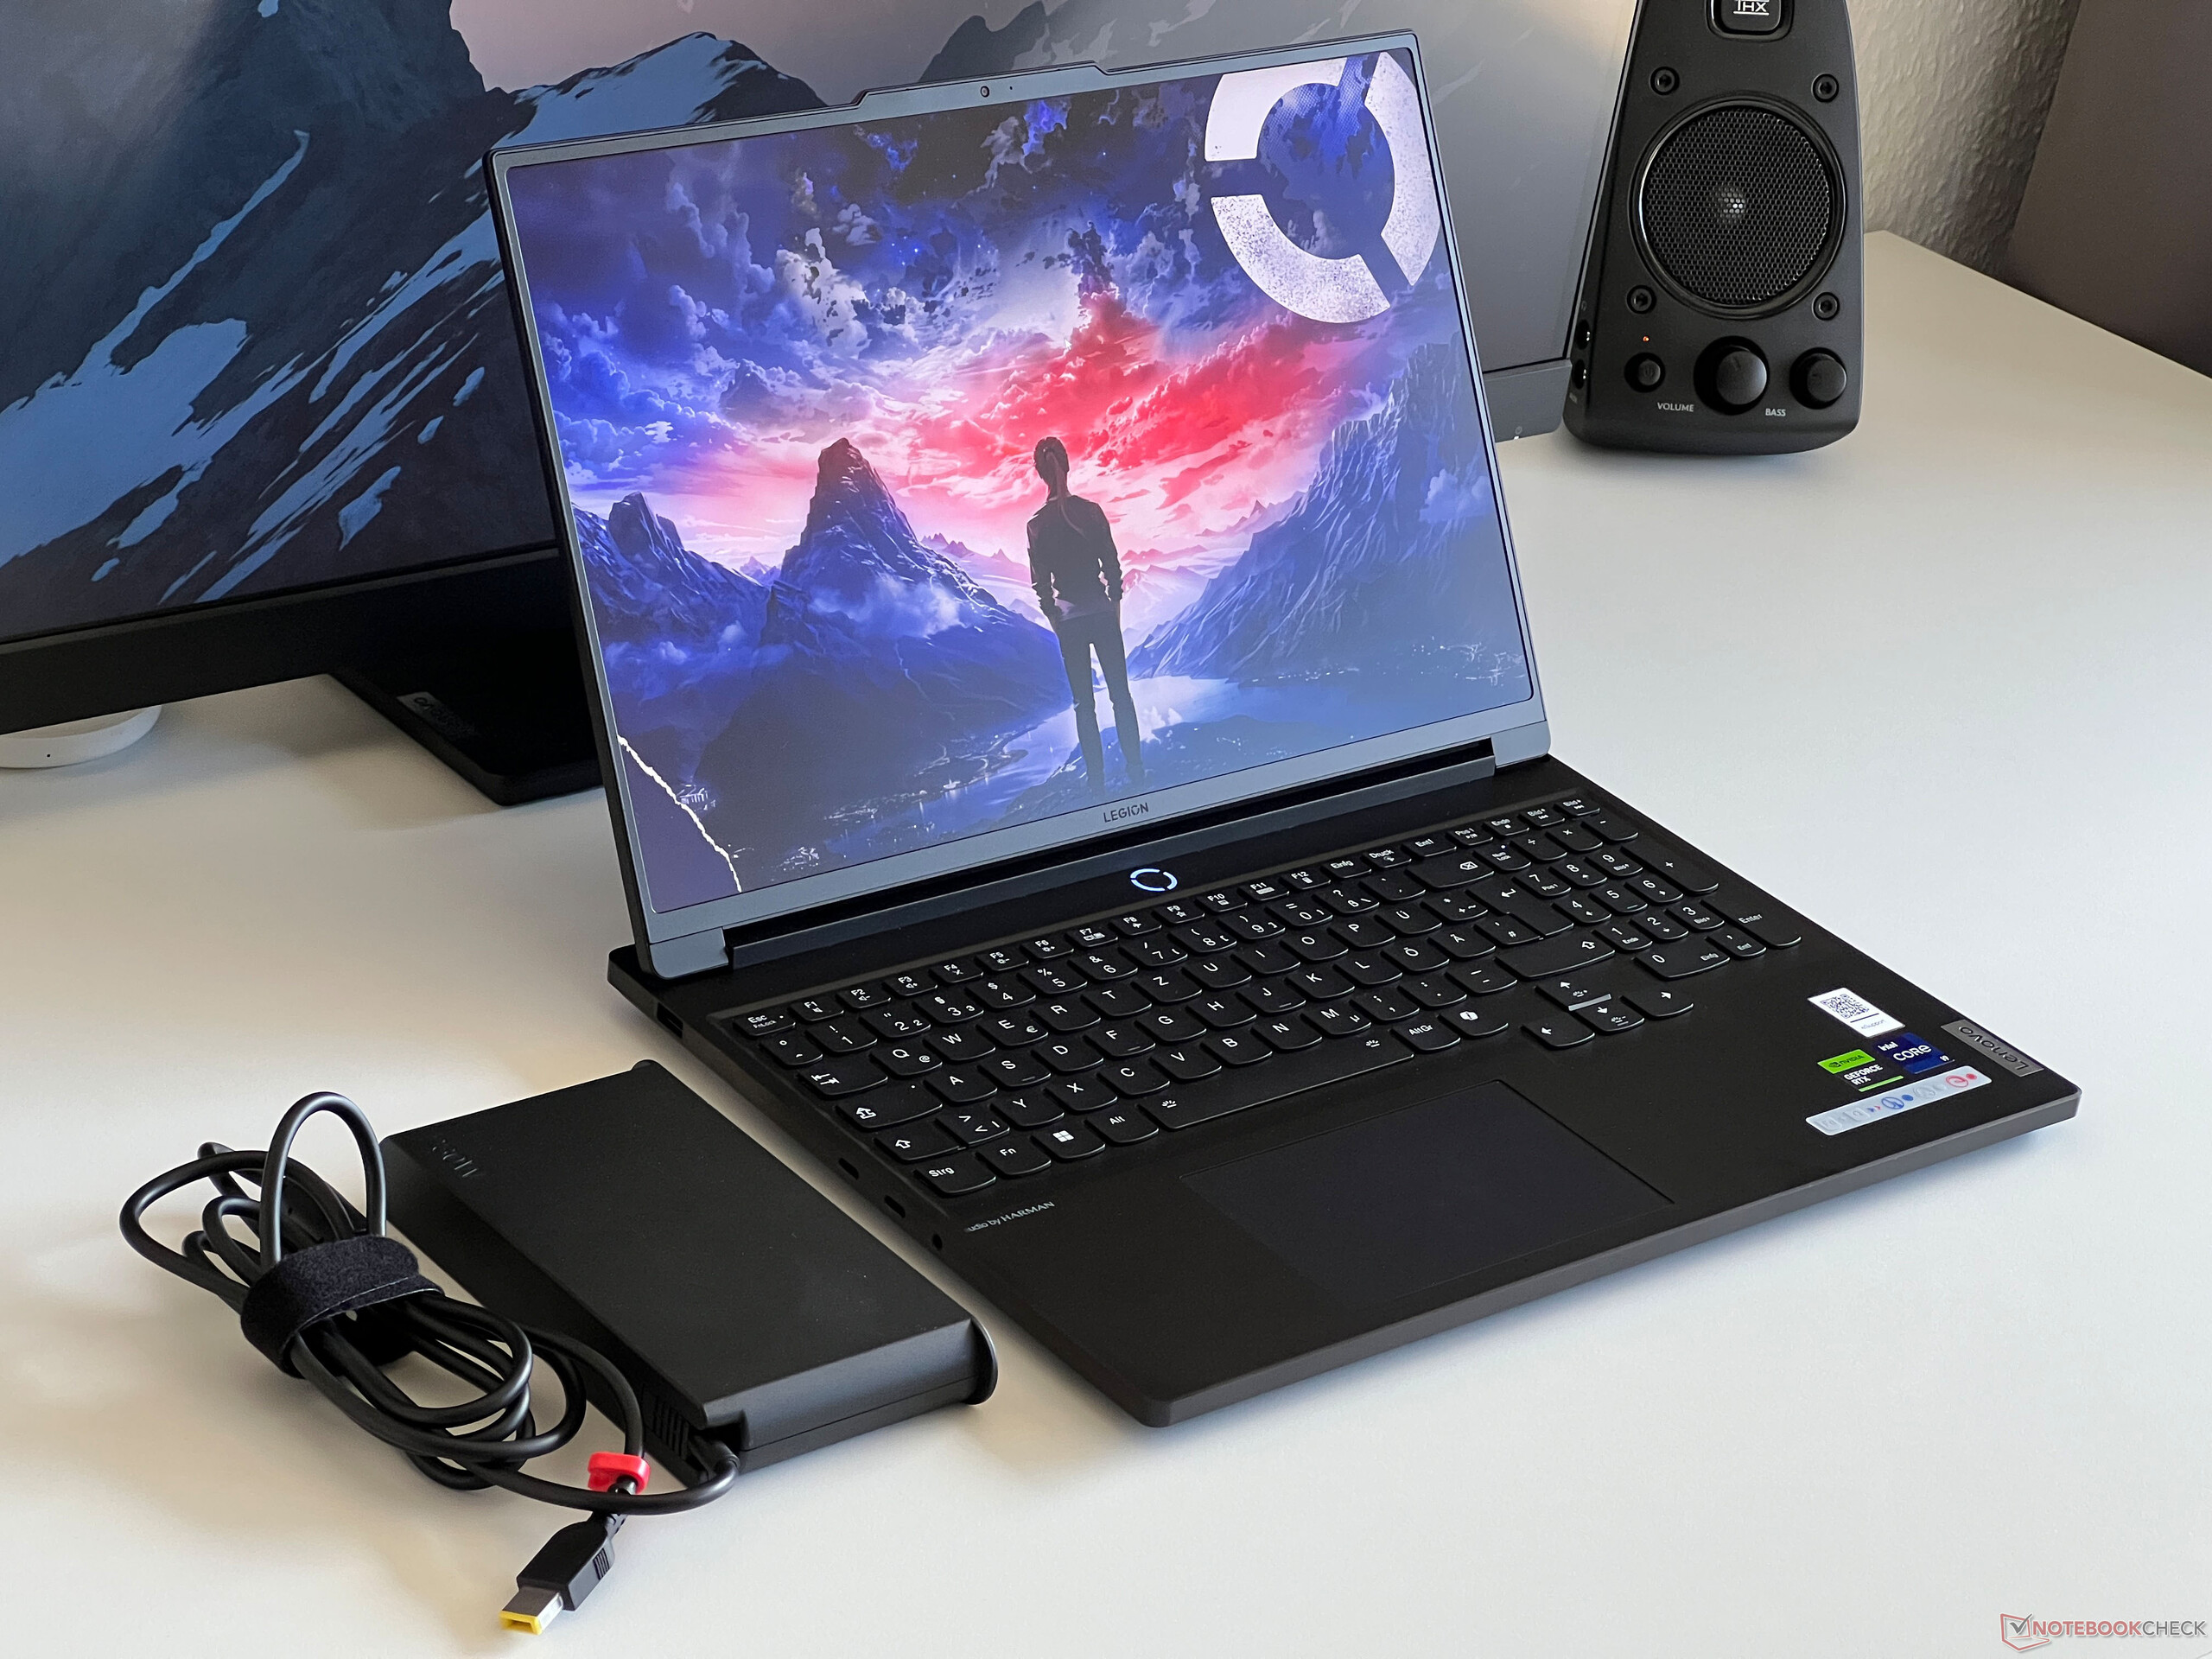
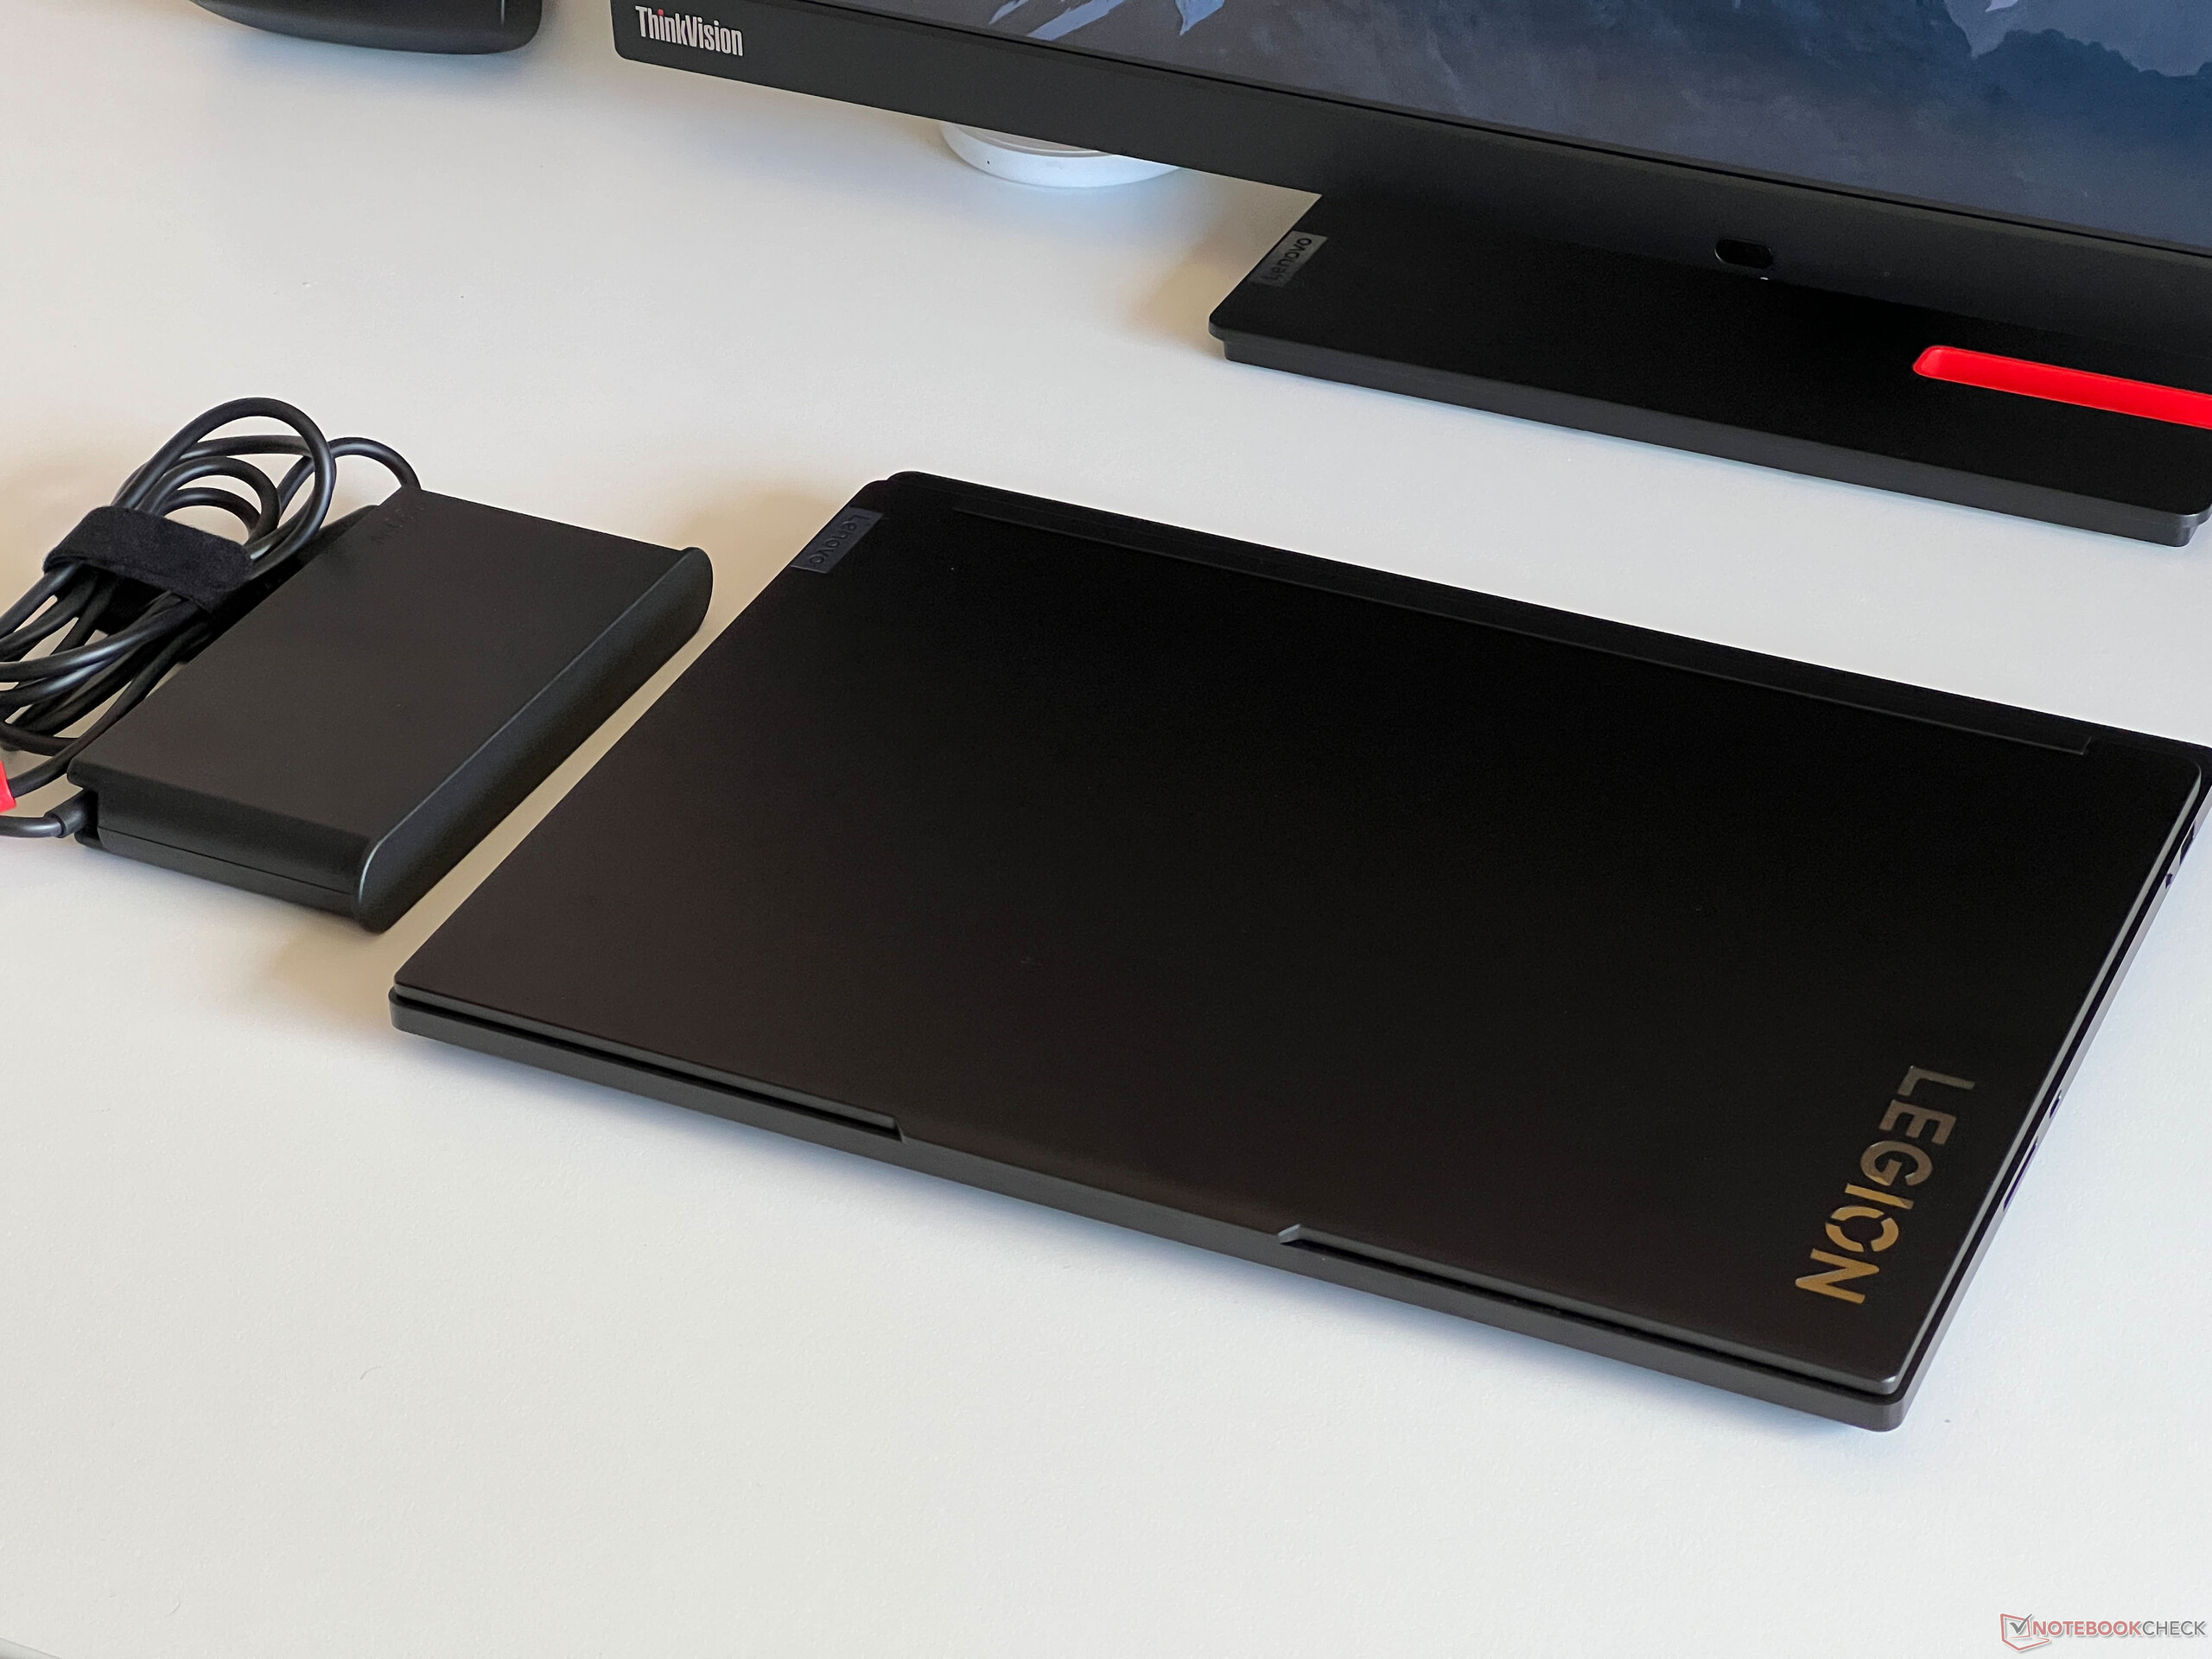

Legion 7 16 jest jednym z najsmuklejszych urządzeń w naszej grupie porównawczej, jednak pod względem wagi i ogólnej powierzchni nie ma dużych różnic. Zasilacz o mocy 230 W waży 948 gramów.
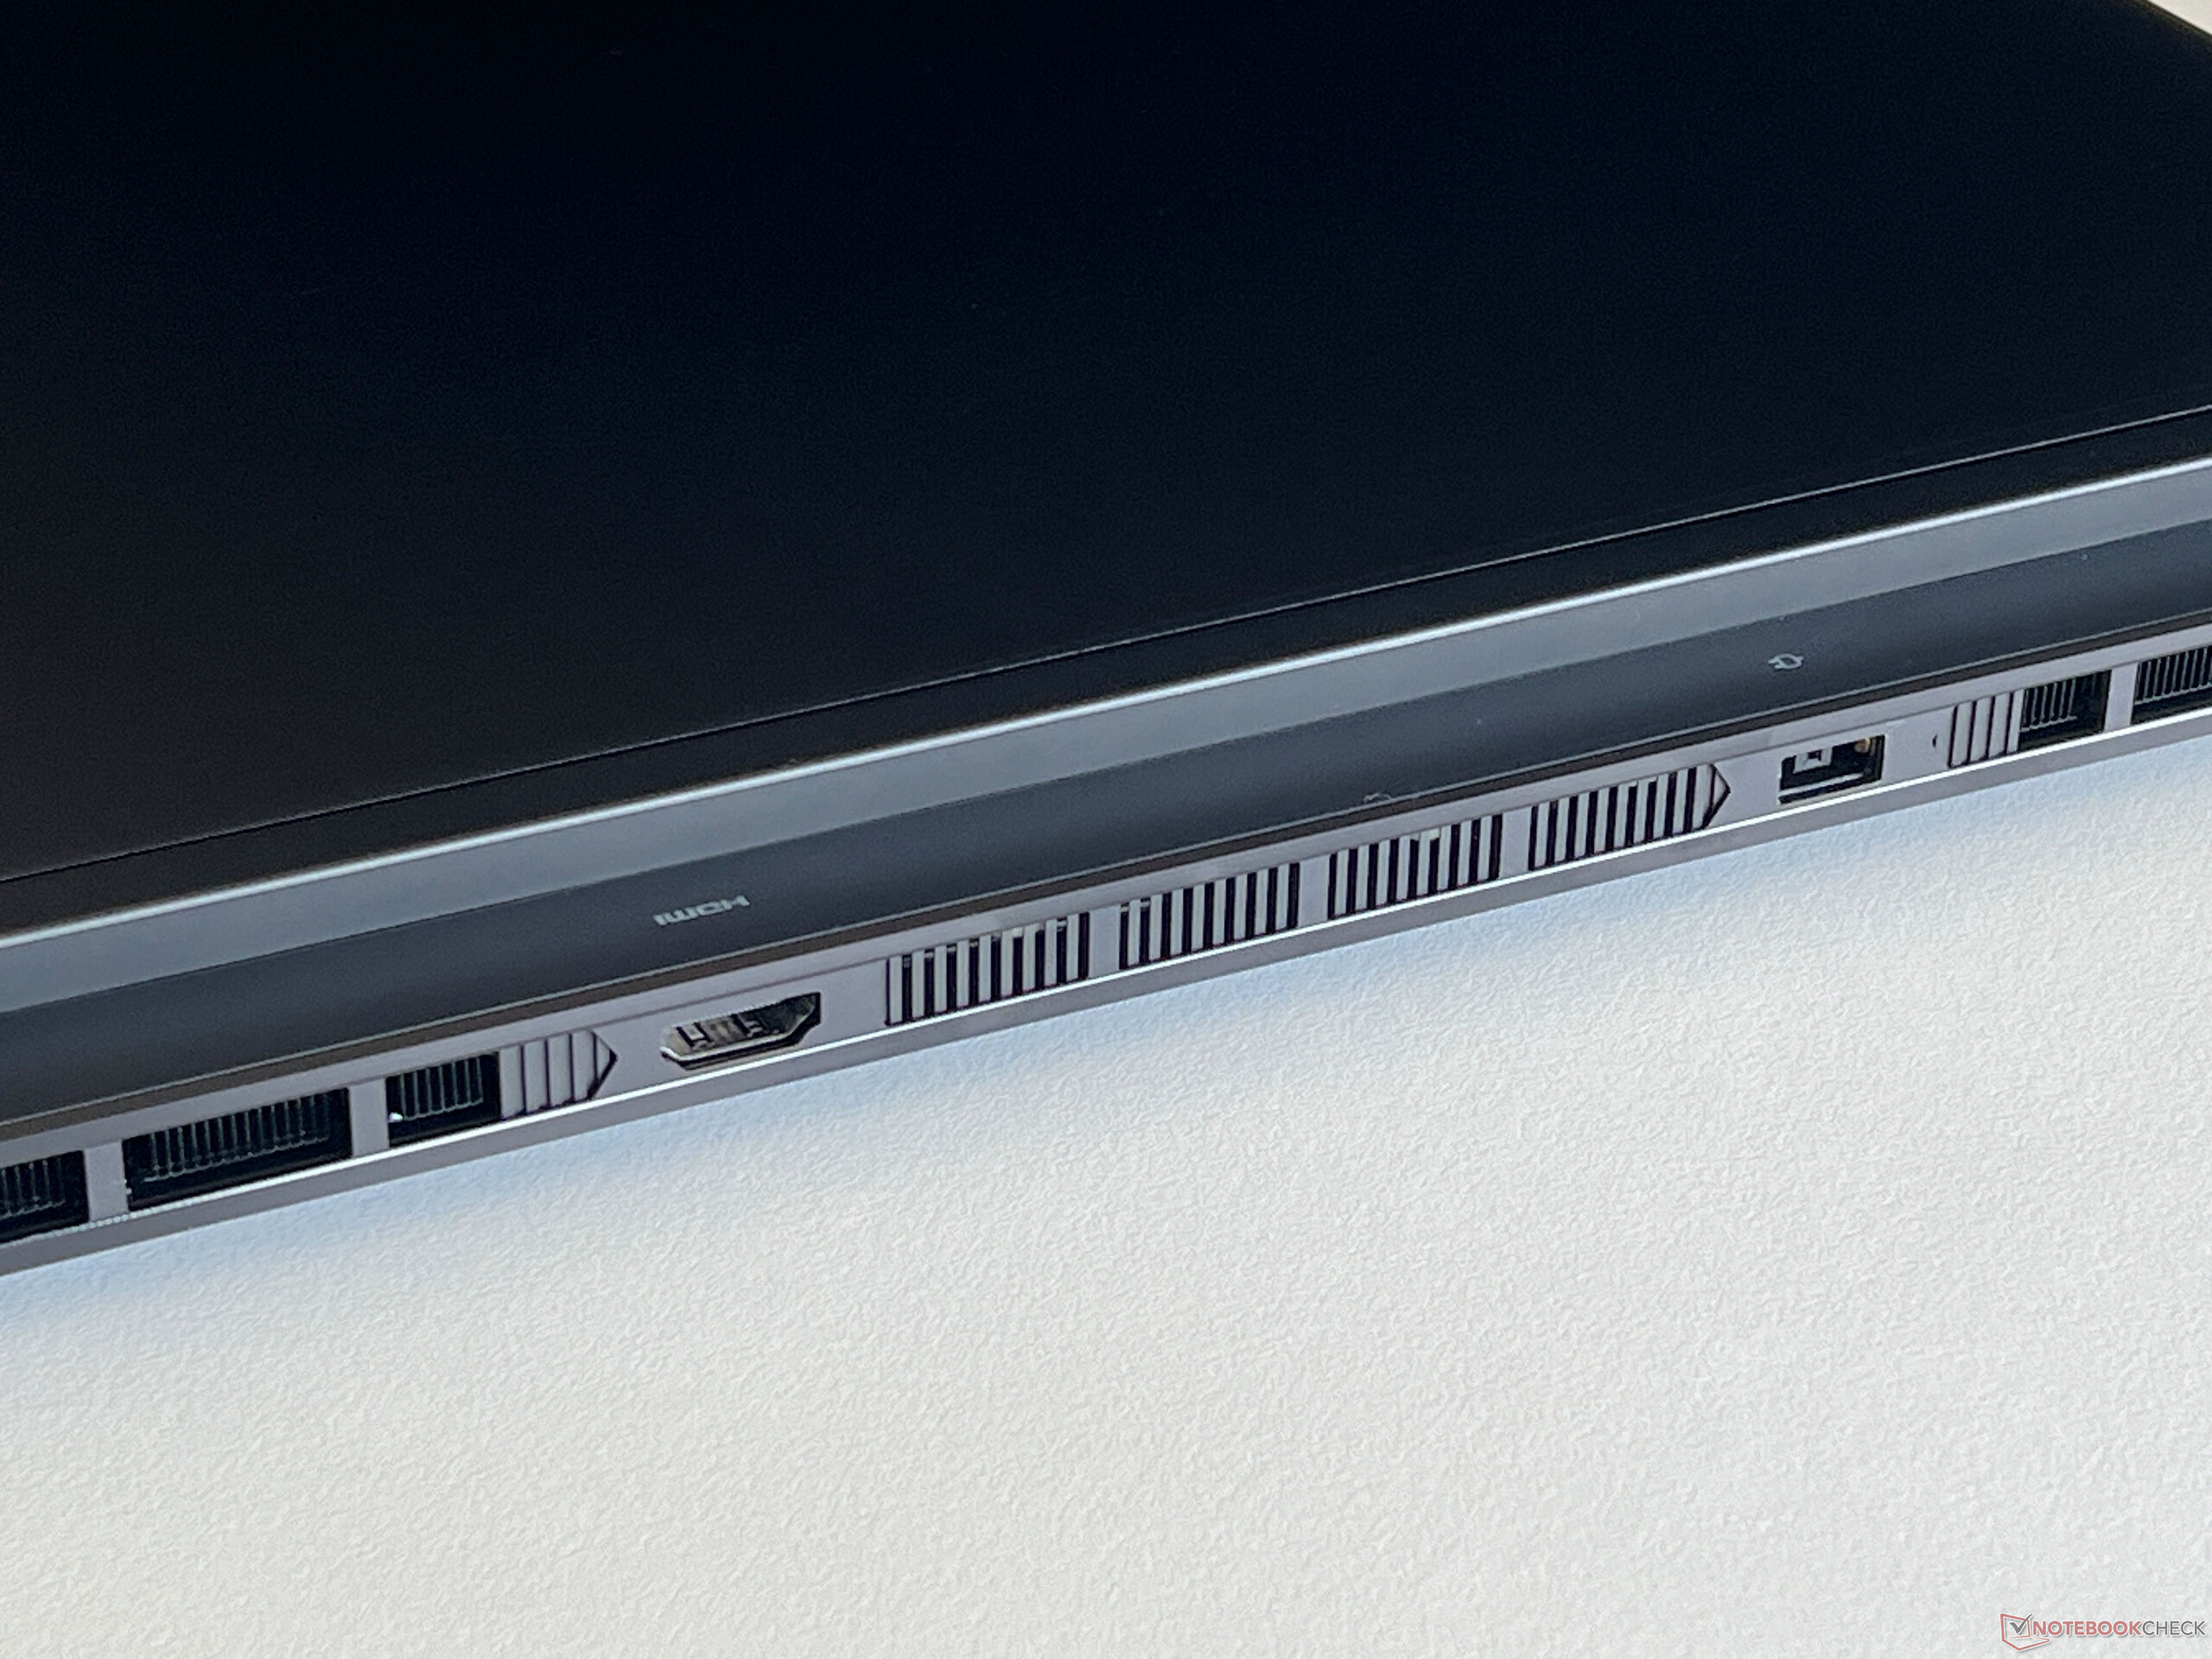
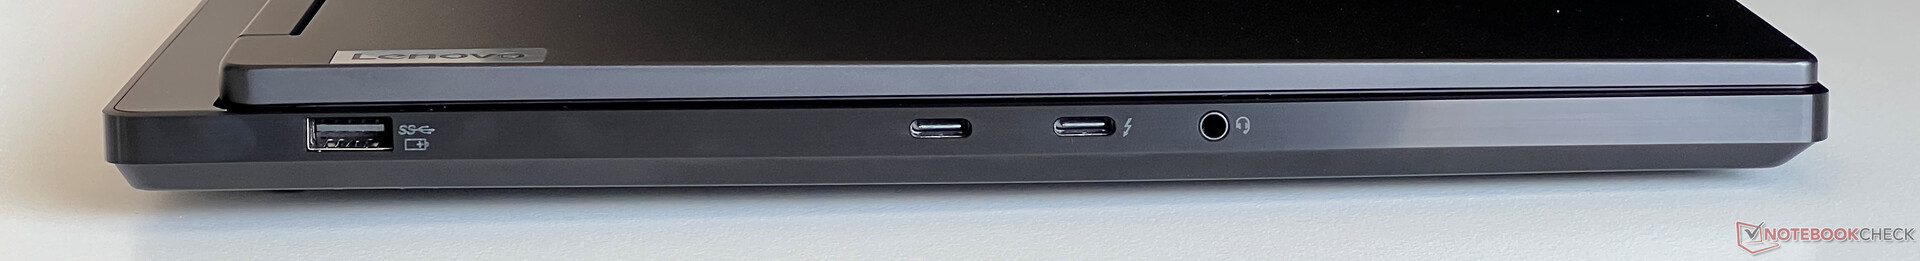
Funkcje - Thunderbolt, ale bez Ethernet
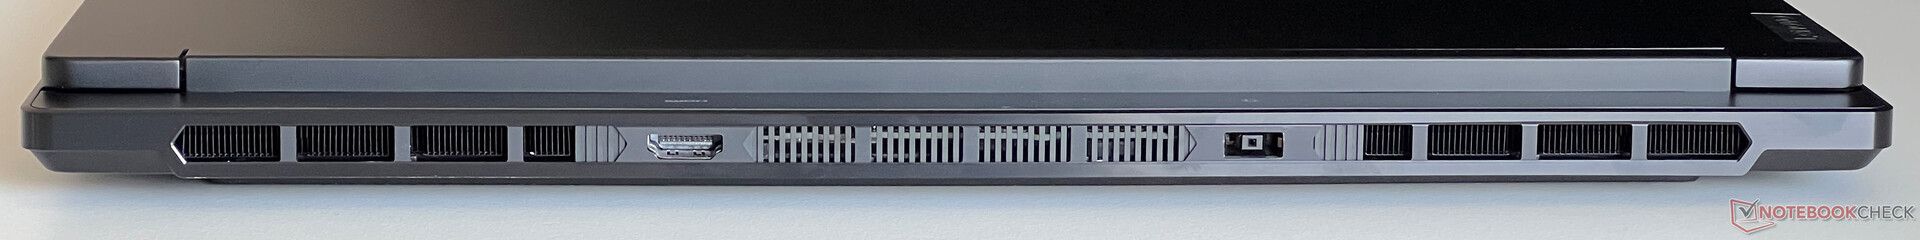
Porty są rozmieszczone zarówno po bokach, jak i z tyłu laptopa. W tym obszarze zwykły Legion 7 wypada nieco lepiej niż droższy Legion Pro 7, ponieważ otwory wentylacyjne znajdują się tylko z tyłu. Wszystkie ważne standardy są tutaj oprócz portu Ethernet, co nie jest idealne dla graczy. Port Thunderbolt jest podłączony przez iGPU, co oznacza, że po podłączeniu zewnętrznego wyświetlacza GPU Nvidii nie zawsze musi być aktywne. Wszystkie inne wyjścia wideo działają bezpośrednio przez dGPU.
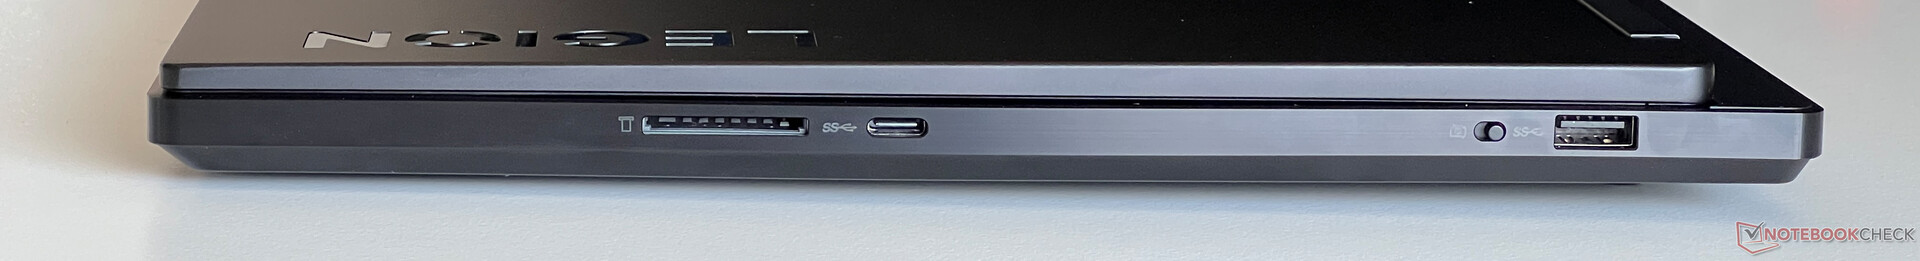
Czytnik kart SD
W połączeniu z naszą referencyjną kartą (Angelbird AV Pro V60), czytnik kart po prawej stronie jest w stanie osiągnąć średnie prędkości transferu na poziomie 75-90 MB/s. Włożone karty wyraźnie wystają jednak z obudowy.
| SD Card Reader | |
| average JPG Copy Test (av. of 3 runs) | |
| Aorus 16X 2024 (AV PRO microSD 128 GB V60) | |
| Średnia w klasie Gaming (20.9 - 210, n=54, ostatnie 2 lata) | |
| Lenovo Legion 7 16 IRX G9 (Angelbird AV Pro V60) | |
| Alienware m16 R2 (AV PRO microSD 128 GB V60) | |
| Schenker XMG CORE 16 (L23) | |
| maximum AS SSD Seq Read Test (1GB) | |
| Alienware m16 R2 (AV PRO microSD 128 GB V60) | |
| Aorus 16X 2024 (AV PRO microSD 128 GB V60) | |
| Średnia w klasie Gaming (25.5 - 261, n=51, ostatnie 2 lata) | |
| Lenovo Legion 7 16 IRX G9 (Angelbird AV Pro V60) | |
| Schenker XMG CORE 16 (L23) | |
Komunikacja
Moduł Realtek Wi-Fi 6E jest zainstalowany wewnątrz Legion. Działa dobrze, a w połączeniu z naszym routerem referencyjnym Asus, zarządzał zarówno wysokimi, jak i stabilnymi prędkościami transferu. Bluetooth 5.1 jest obsługiwany, ale laptop nie oferuje portu Ethernet.
| Networking | |
| Lenovo Legion 7 16 IRX G9 | |
| iperf3 transmit AXE11000 | |
| iperf3 receive AXE11000 | |
| Lenovo Legion Pro 5 16IRX9 | |
| iperf3 transmit AXE11000 | |
| iperf3 receive AXE11000 | |
| iperf3 transmit AXE11000 6GHz | |
| iperf3 receive AXE11000 6GHz | |
| Aorus 16X 2024 | |
| iperf3 transmit AXE11000 | |
| iperf3 receive AXE11000 | |
| HP Omen Transcend 16-u1095ng | |
| iperf3 transmit AXE11000 | |
| iperf3 receive AXE11000 | |
| Alienware m16 R2 | |
| iperf3 transmit AXE11000 | |
| iperf3 receive AXE11000 | |
| iperf3 transmit AXE11000 6GHz | |
| iperf3 receive AXE11000 6GHz | |
| Schenker XMG CORE 16 (L23) | |
| iperf3 transmit AXE11000 | |
| iperf3 receive AXE11000 | |
| Lenovo Legion Pro 7 16IRX9H | |
| iperf3 transmit AXE11000 | |
| iperf3 receive AXE11000 | |
Kamera internetowa
Kamera internetowa 1080p jest umieszczona wewnątrz górnej ramki ekranu i oferuje elektroniczną migawkę (przełącznik znajduje się po prawej stronie), ale nawet w dobrych warunkach oświetleniowych rejestruje tylko przeciętne obrazy. Kamera internetowa nie obsługuje Windows Studio Effects, w przeciwieństwie do obecnych urządzeń Meteor Lake.


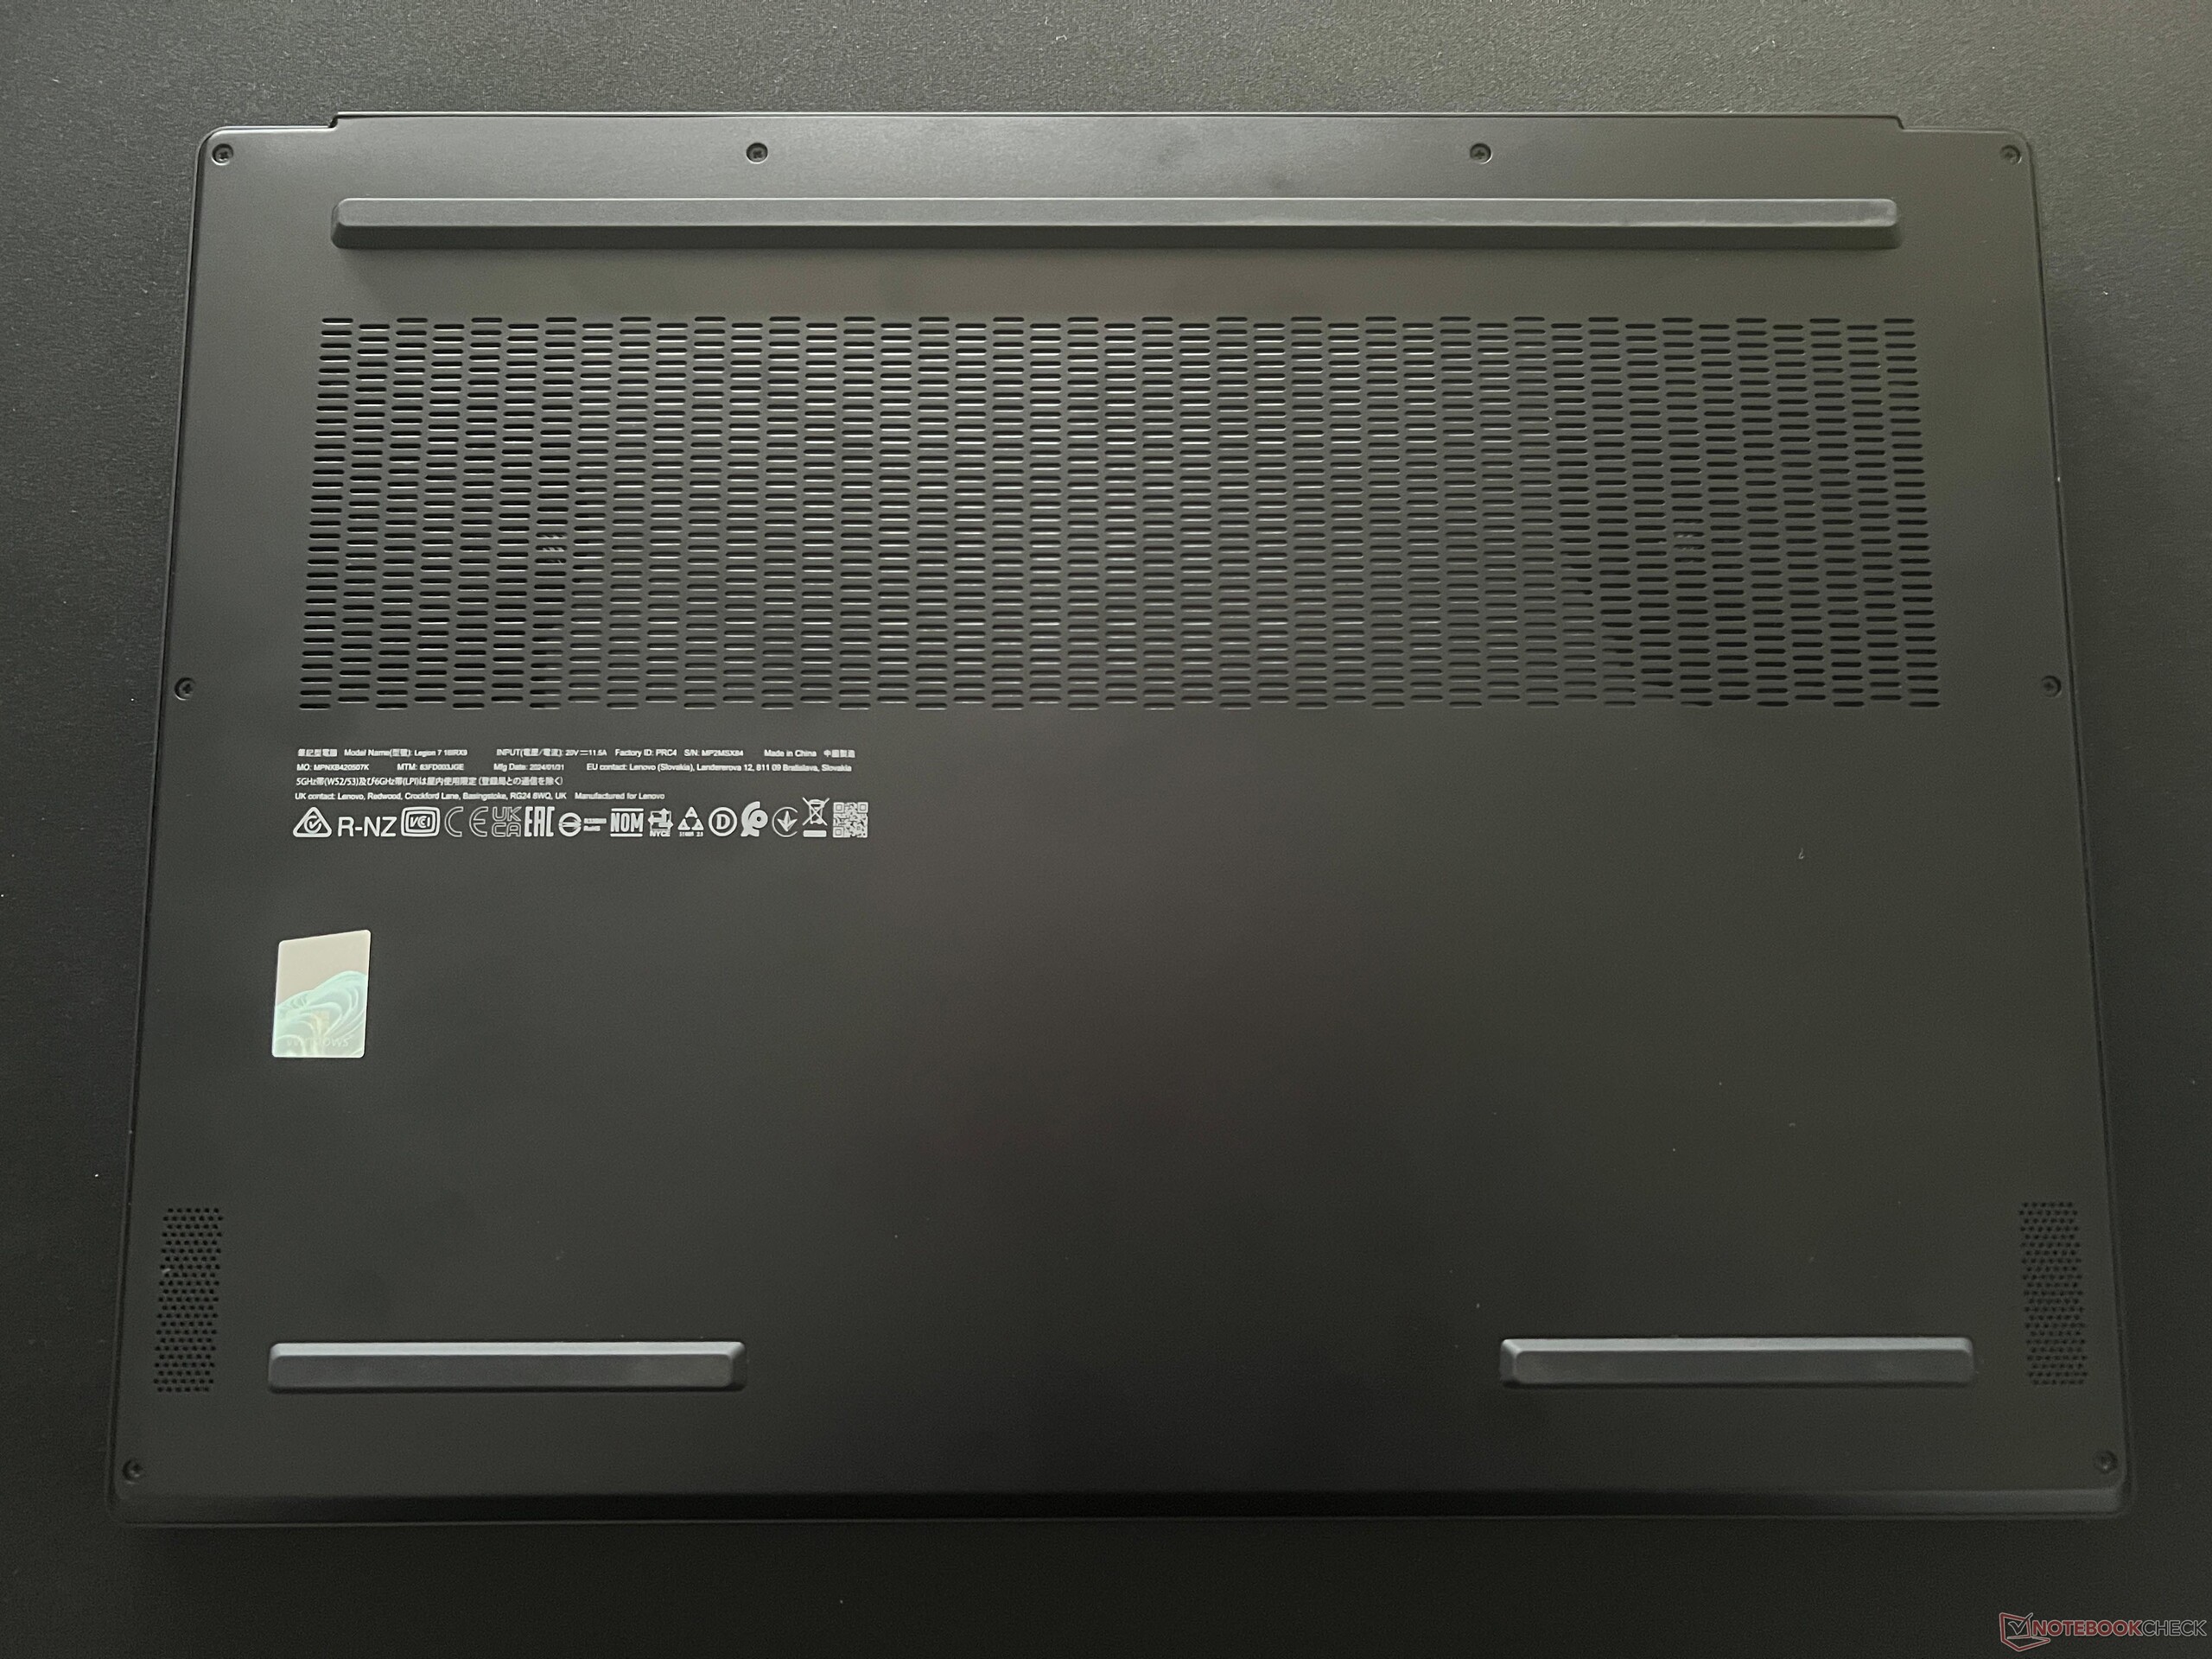
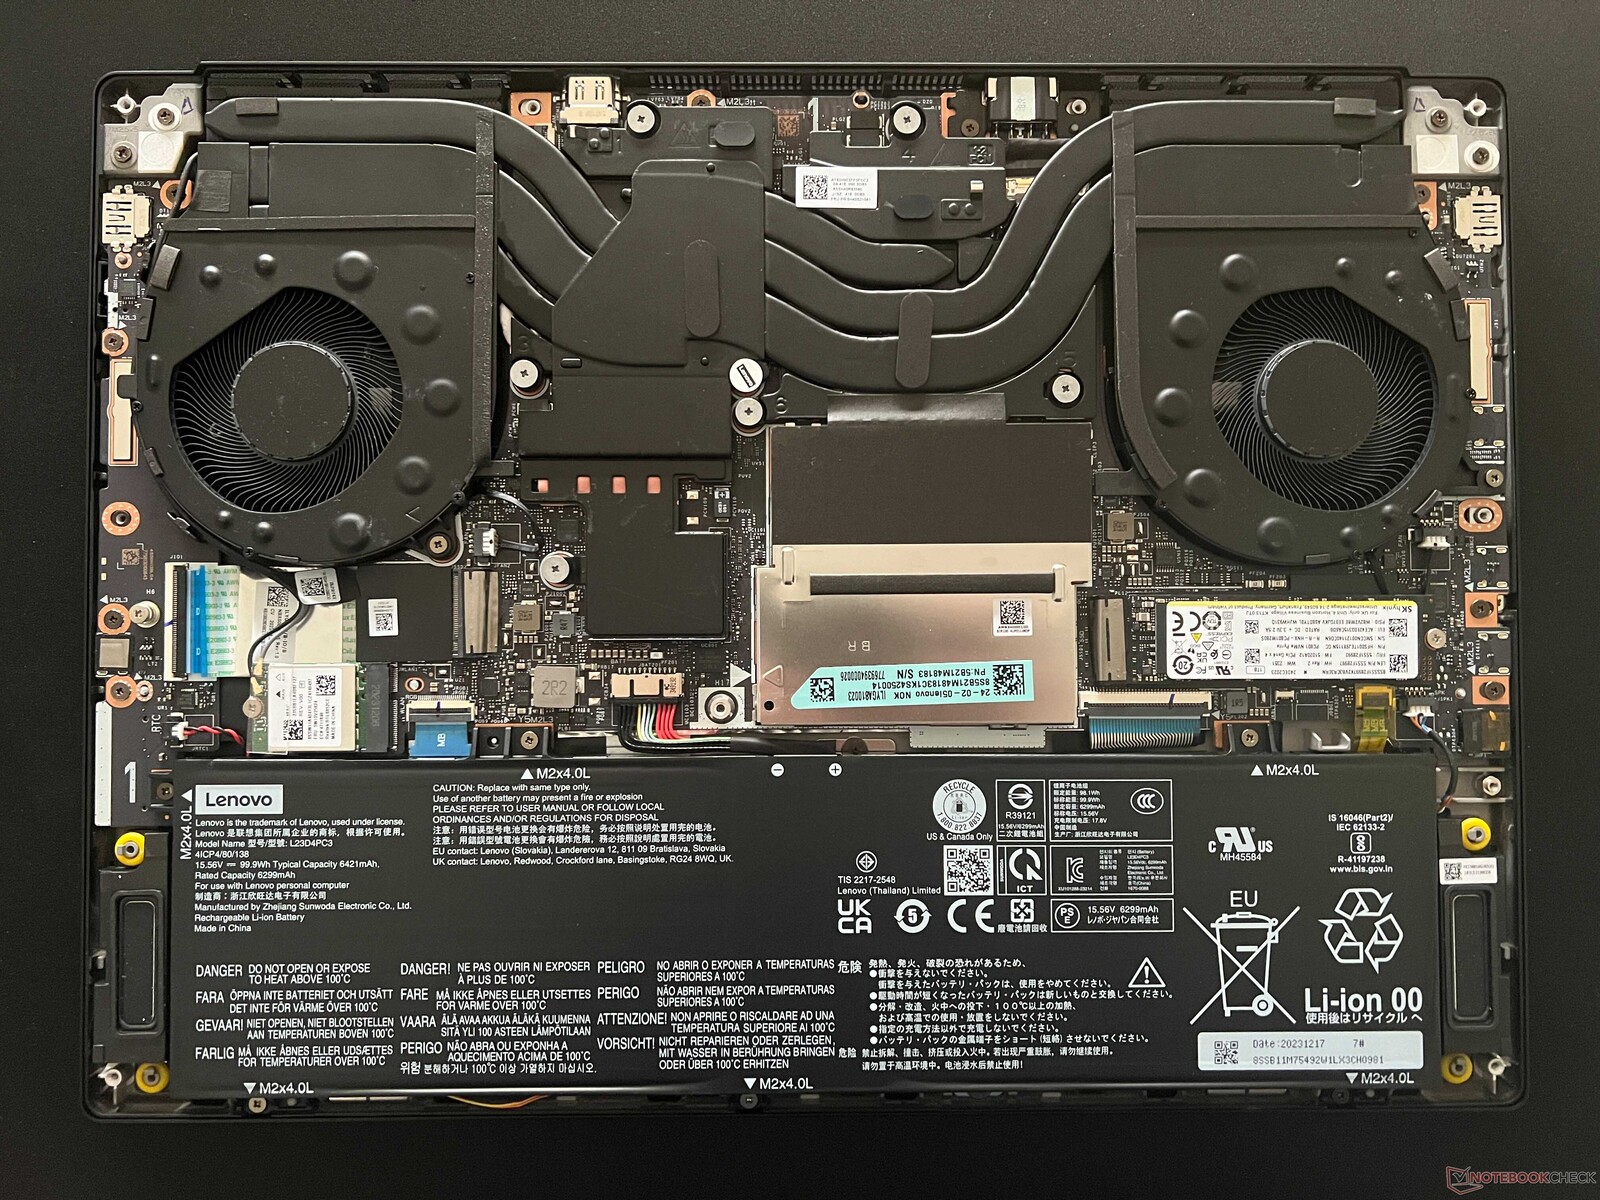
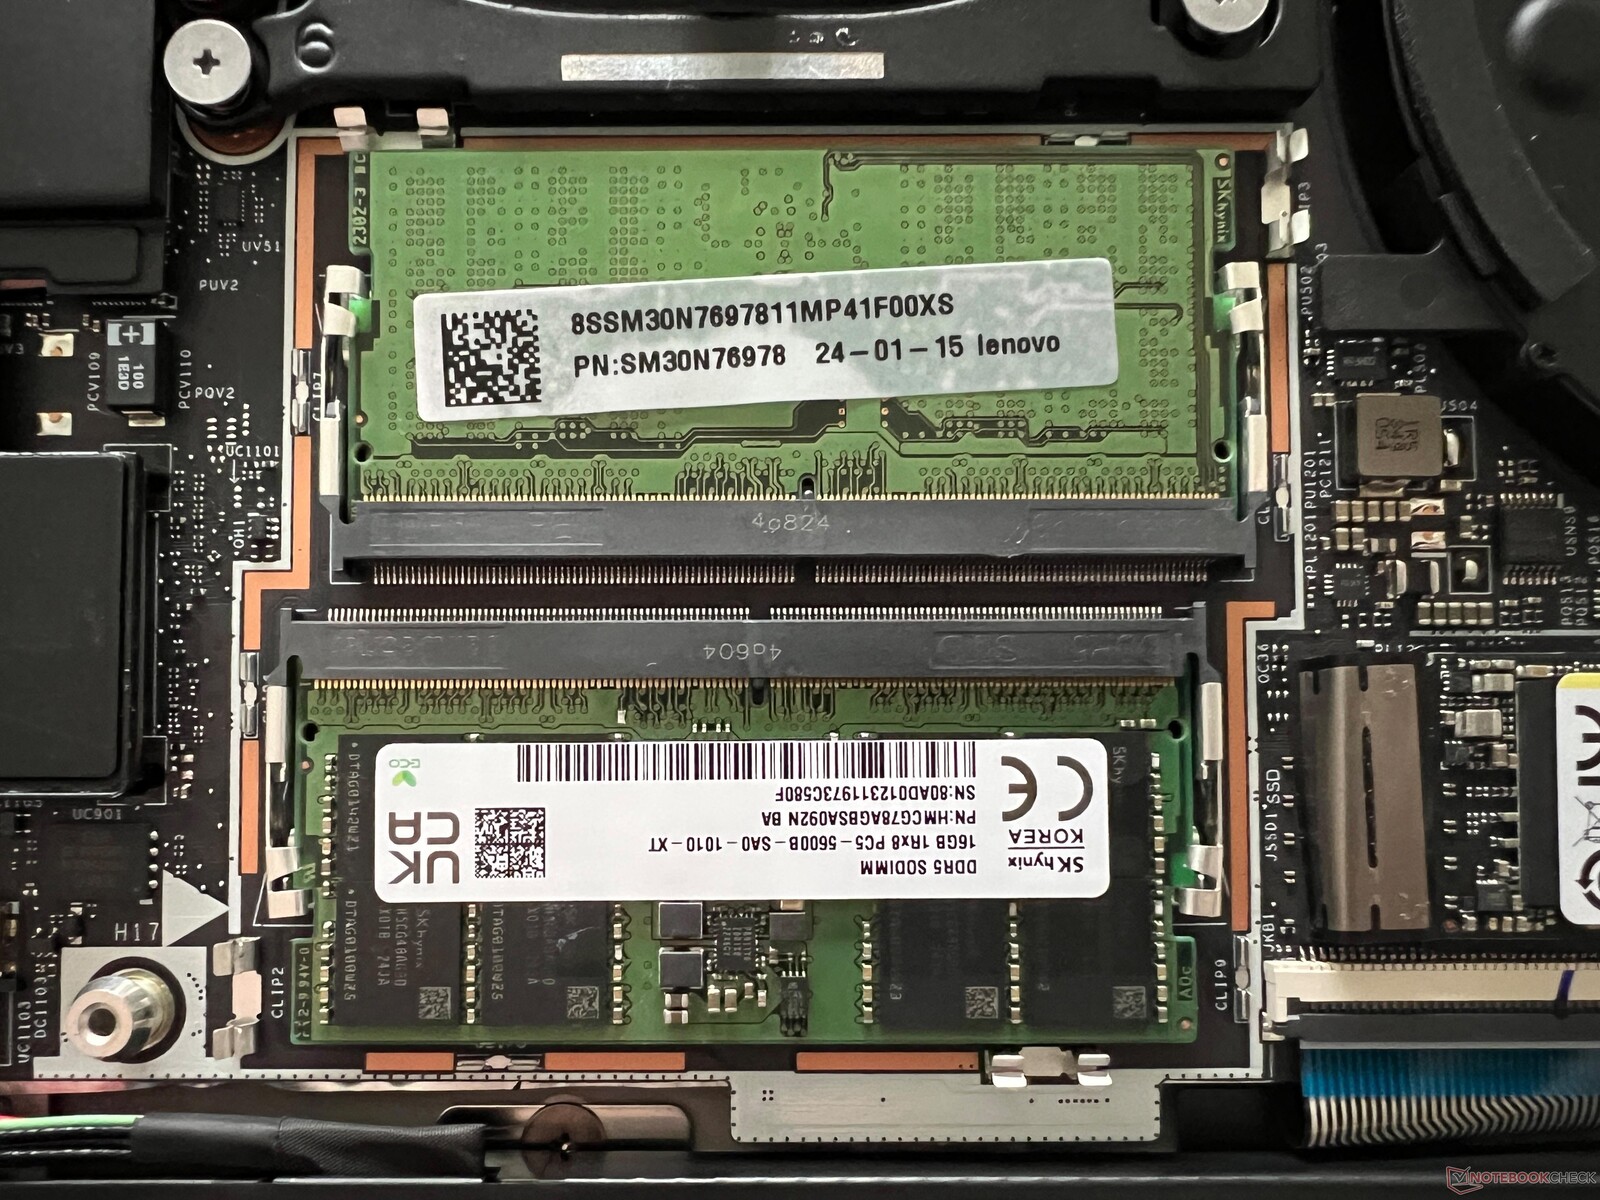
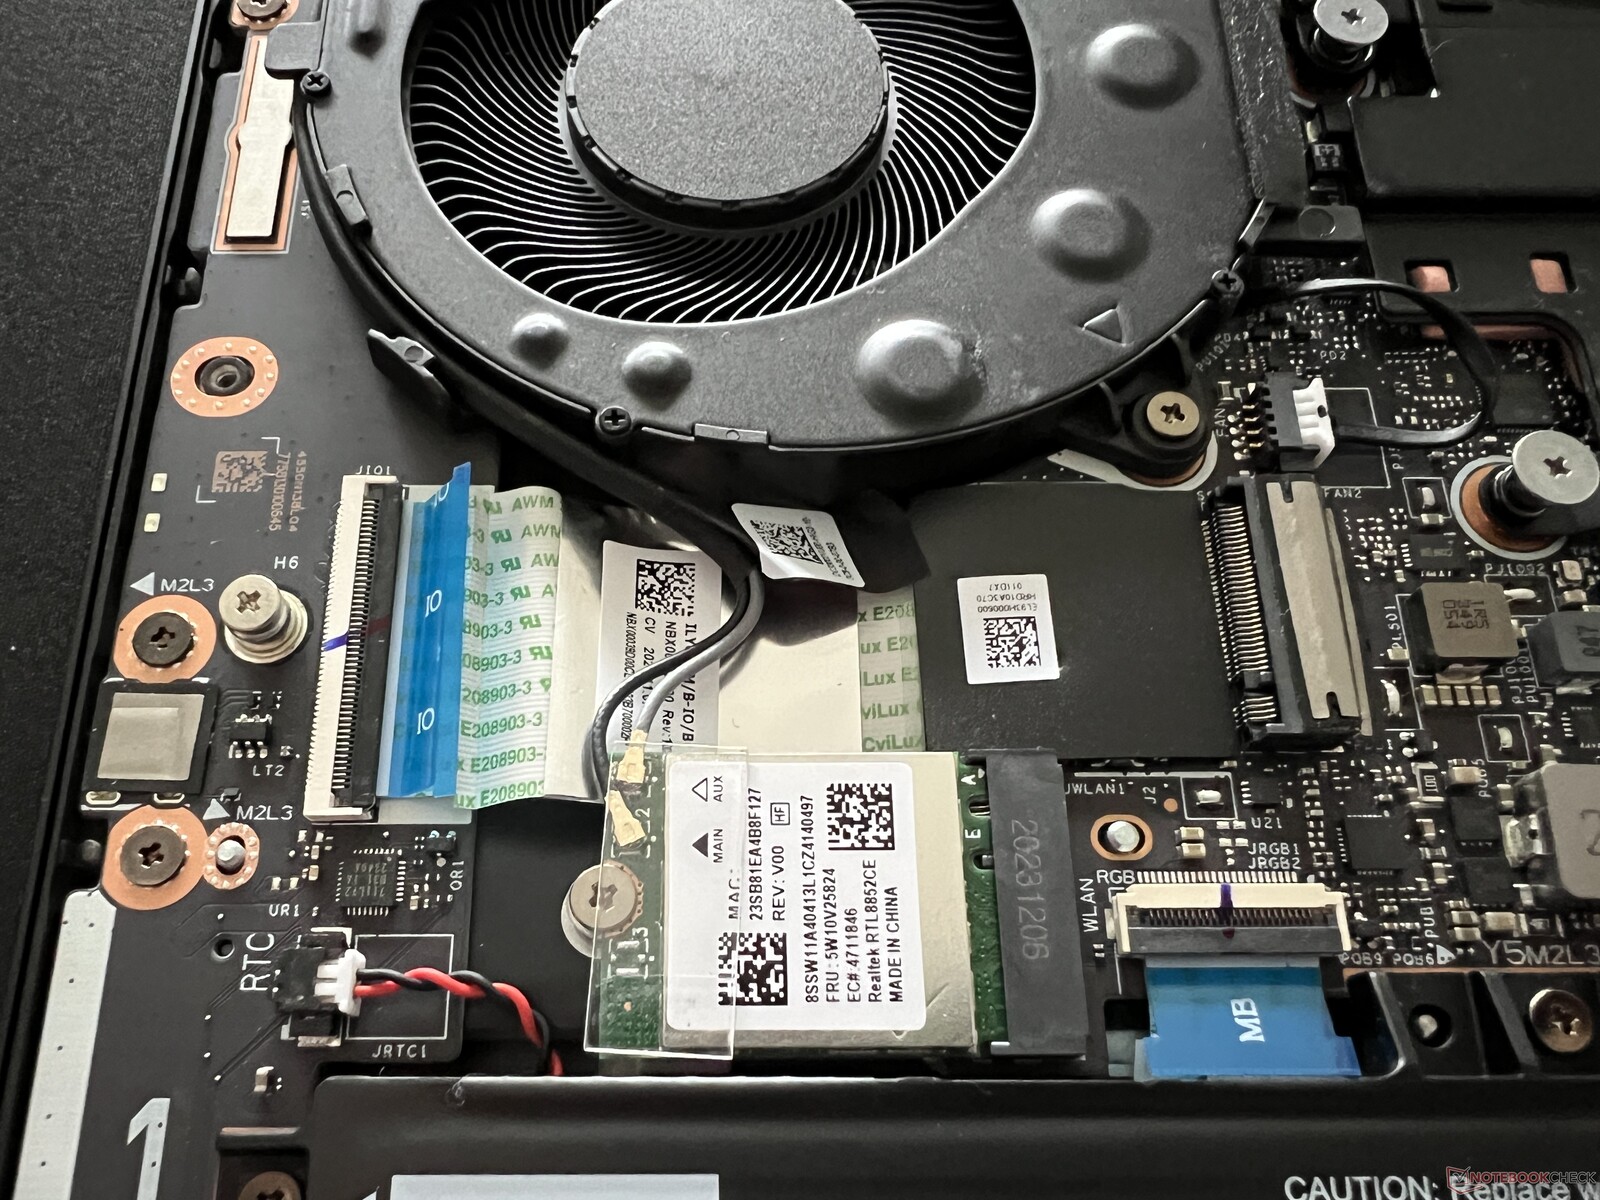
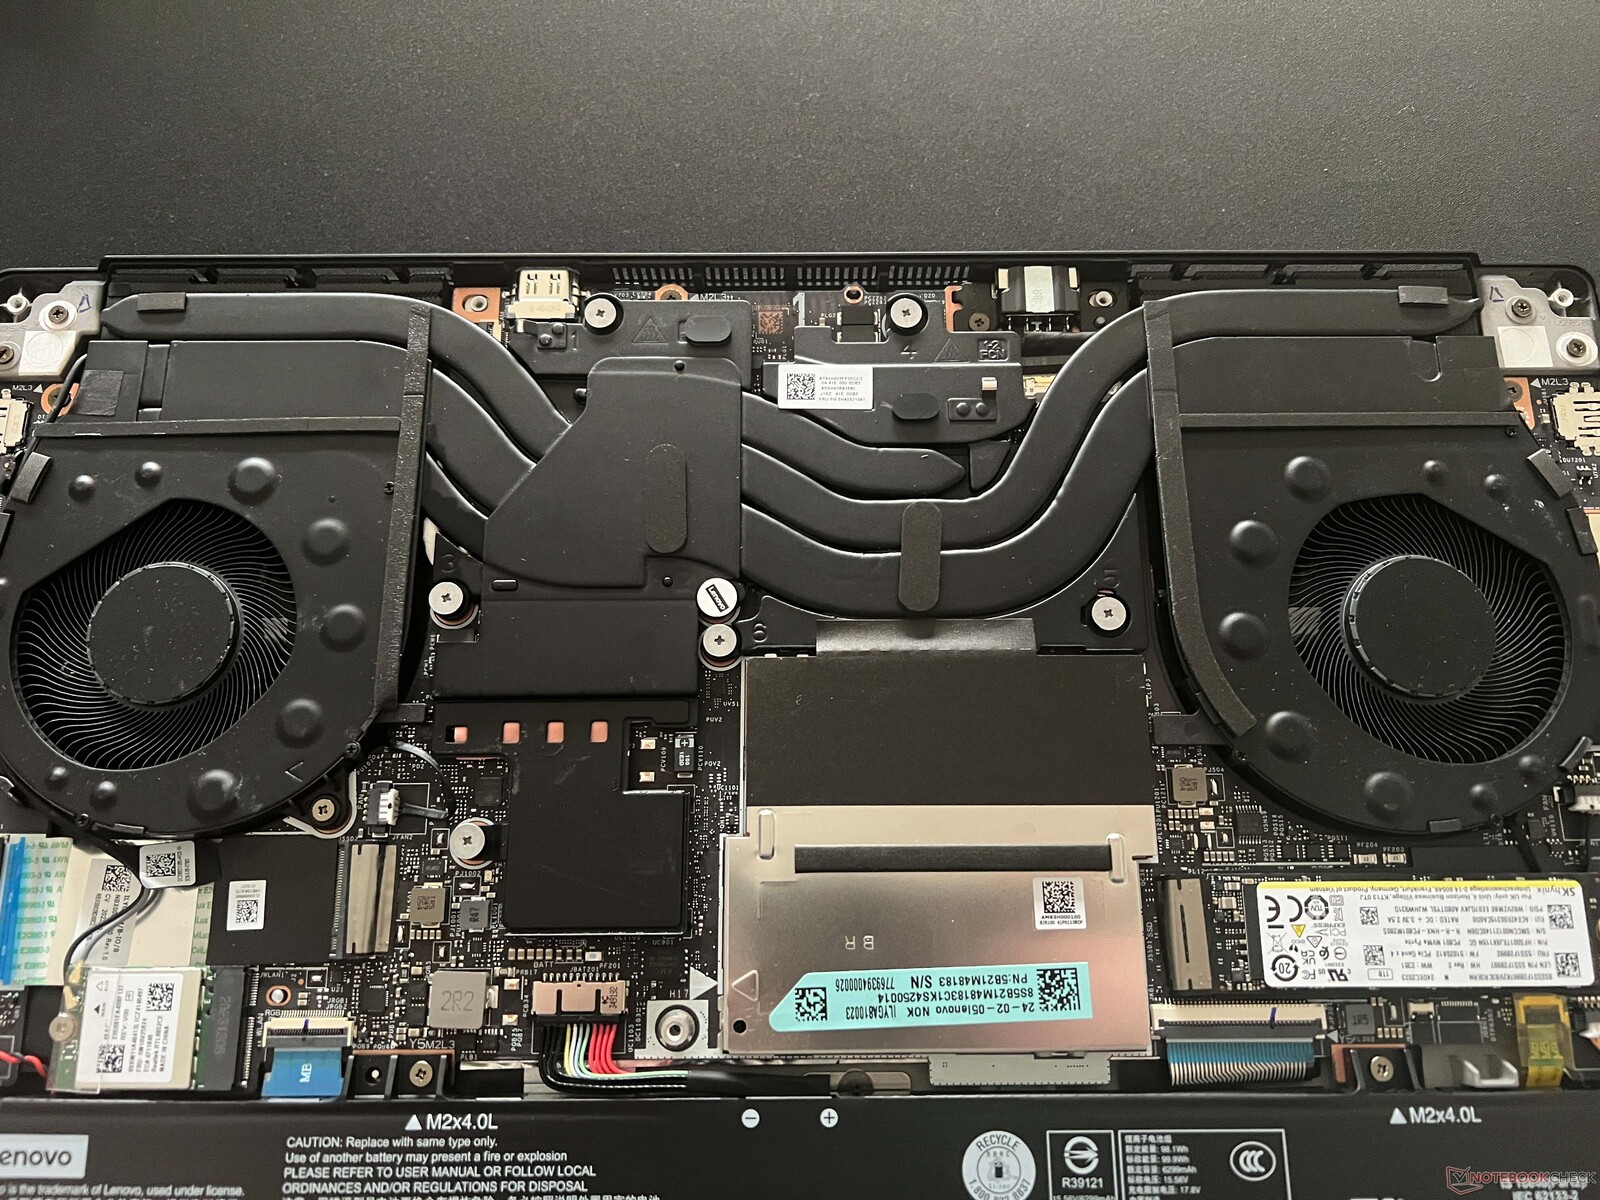
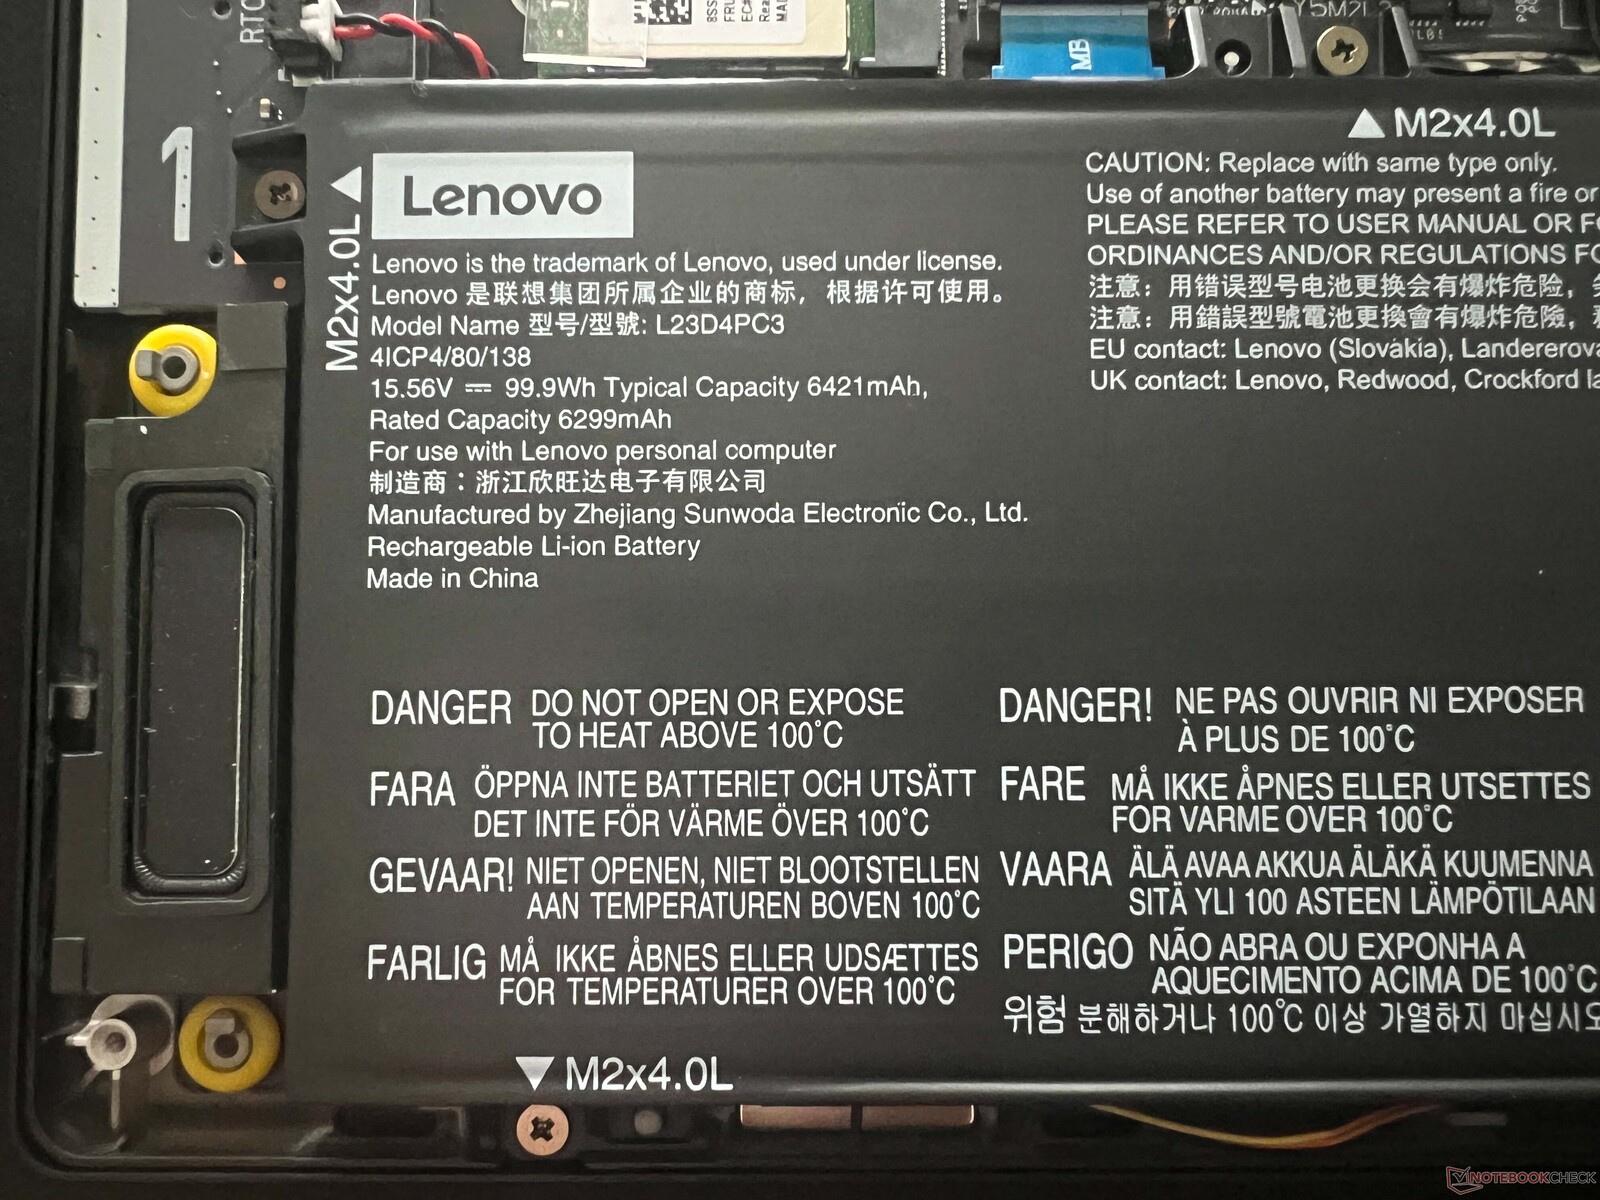
Konserwacja
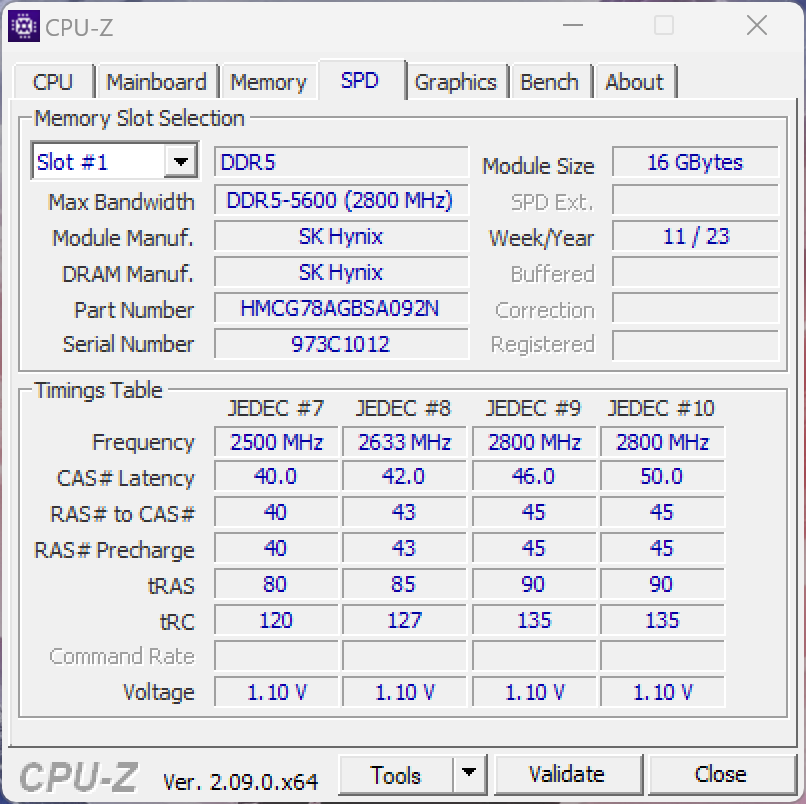
Pokrywa podstawy jest zabezpieczona zwykłymi śrubami krzyżakowymi i można ją bardzo łatwo zdjąć. Oprócz dwóch modułów pamięci RAM, są też dwa sloty M.2 2280, choć dostęp do drugiego slotu jest nieco utrudniony przez kabel Wi-Fi. Podobnie, zarówno moduł Wi-Fi, jak i baterię można wymienić.
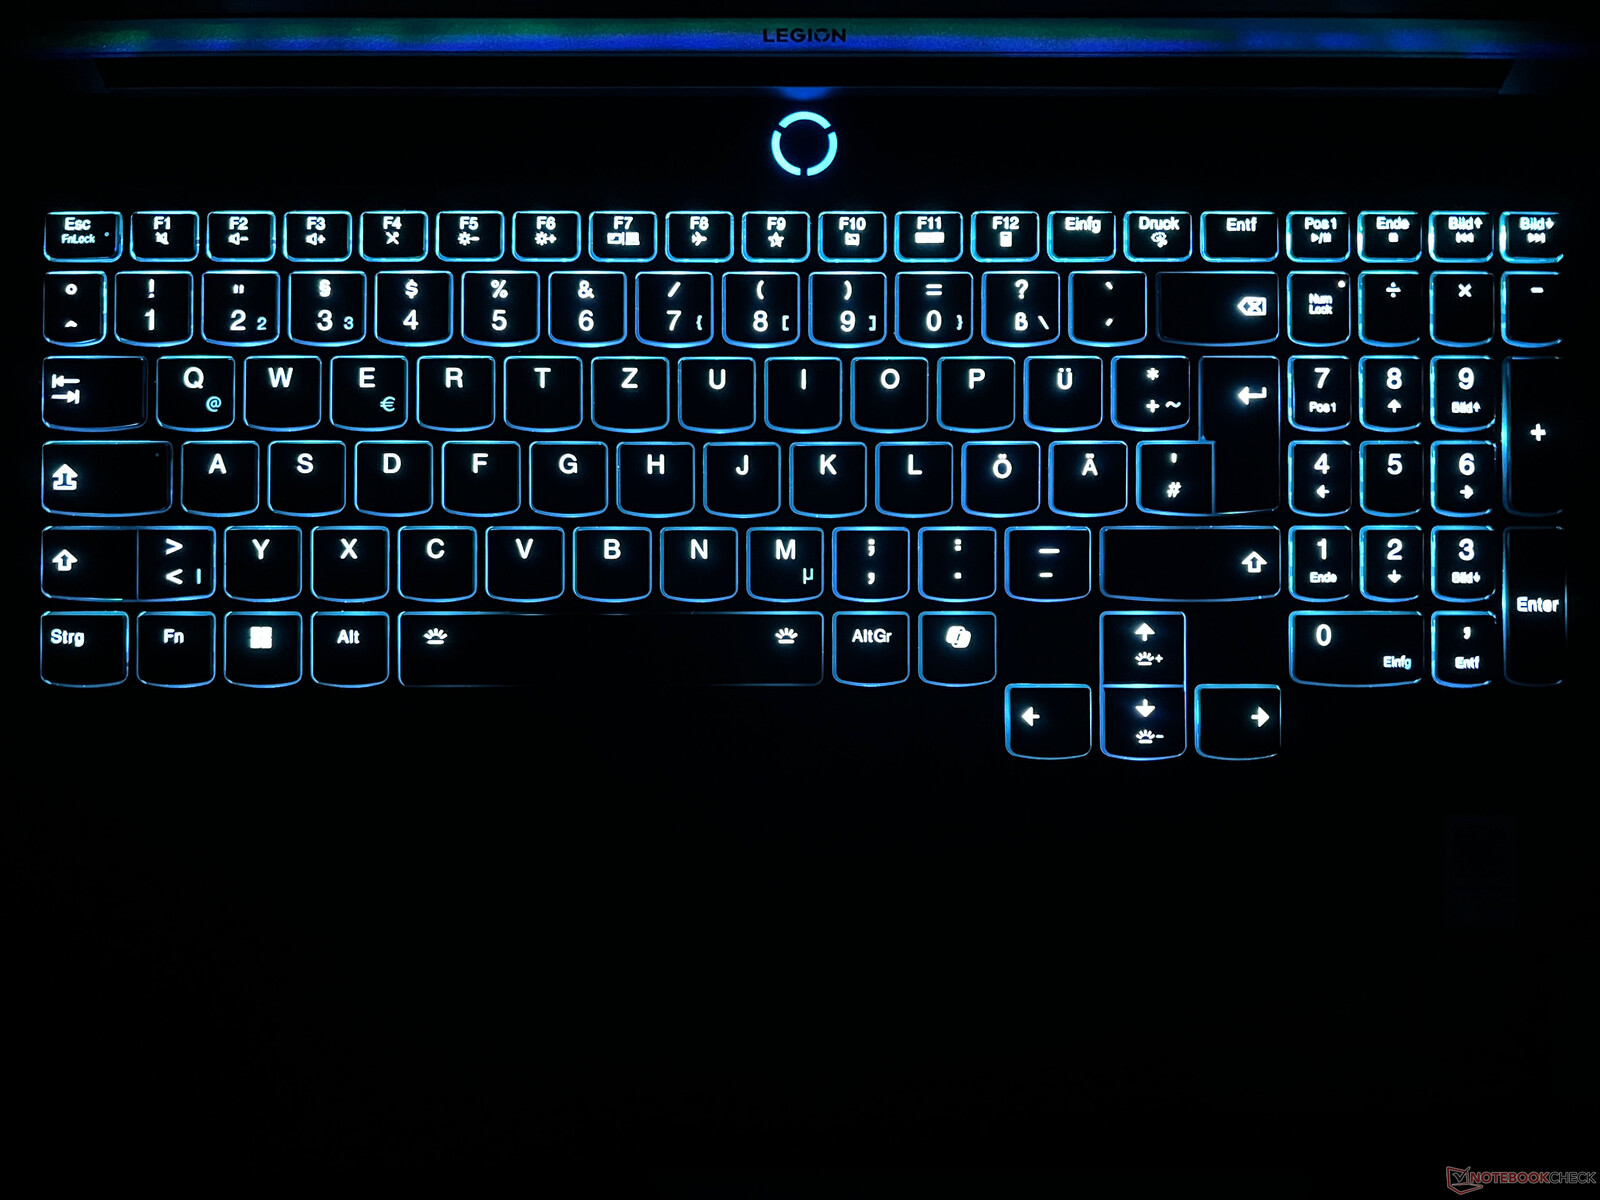
Urządzenia wejściowe - Klawiatura numeryczna i indywidualne podświetlenie klawiszy
Lenovo wyposażyło Legion 7 16 w bardzo wygodną klawiaturę membranową z dedykowanym blokiem numerycznym i indywidualnym podświetleniem klawiszy. Ogólnie rzecz biorąc, dokładne i przyjemnie ciche uderzenia klawiszy nie dają podstaw do narzekań. Nawet dłuższe teksty można wpisywać bez wysiłku. Klawisze klawiatury numerycznej są nieco węższe, ale nie stanowi to żadnego problemu w rzeczywistych sytuacjach. Klawisze strzałek są przyjemnie duże, a skaner linii papilarnych jest zintegrowany z przyciskiem zasilania.
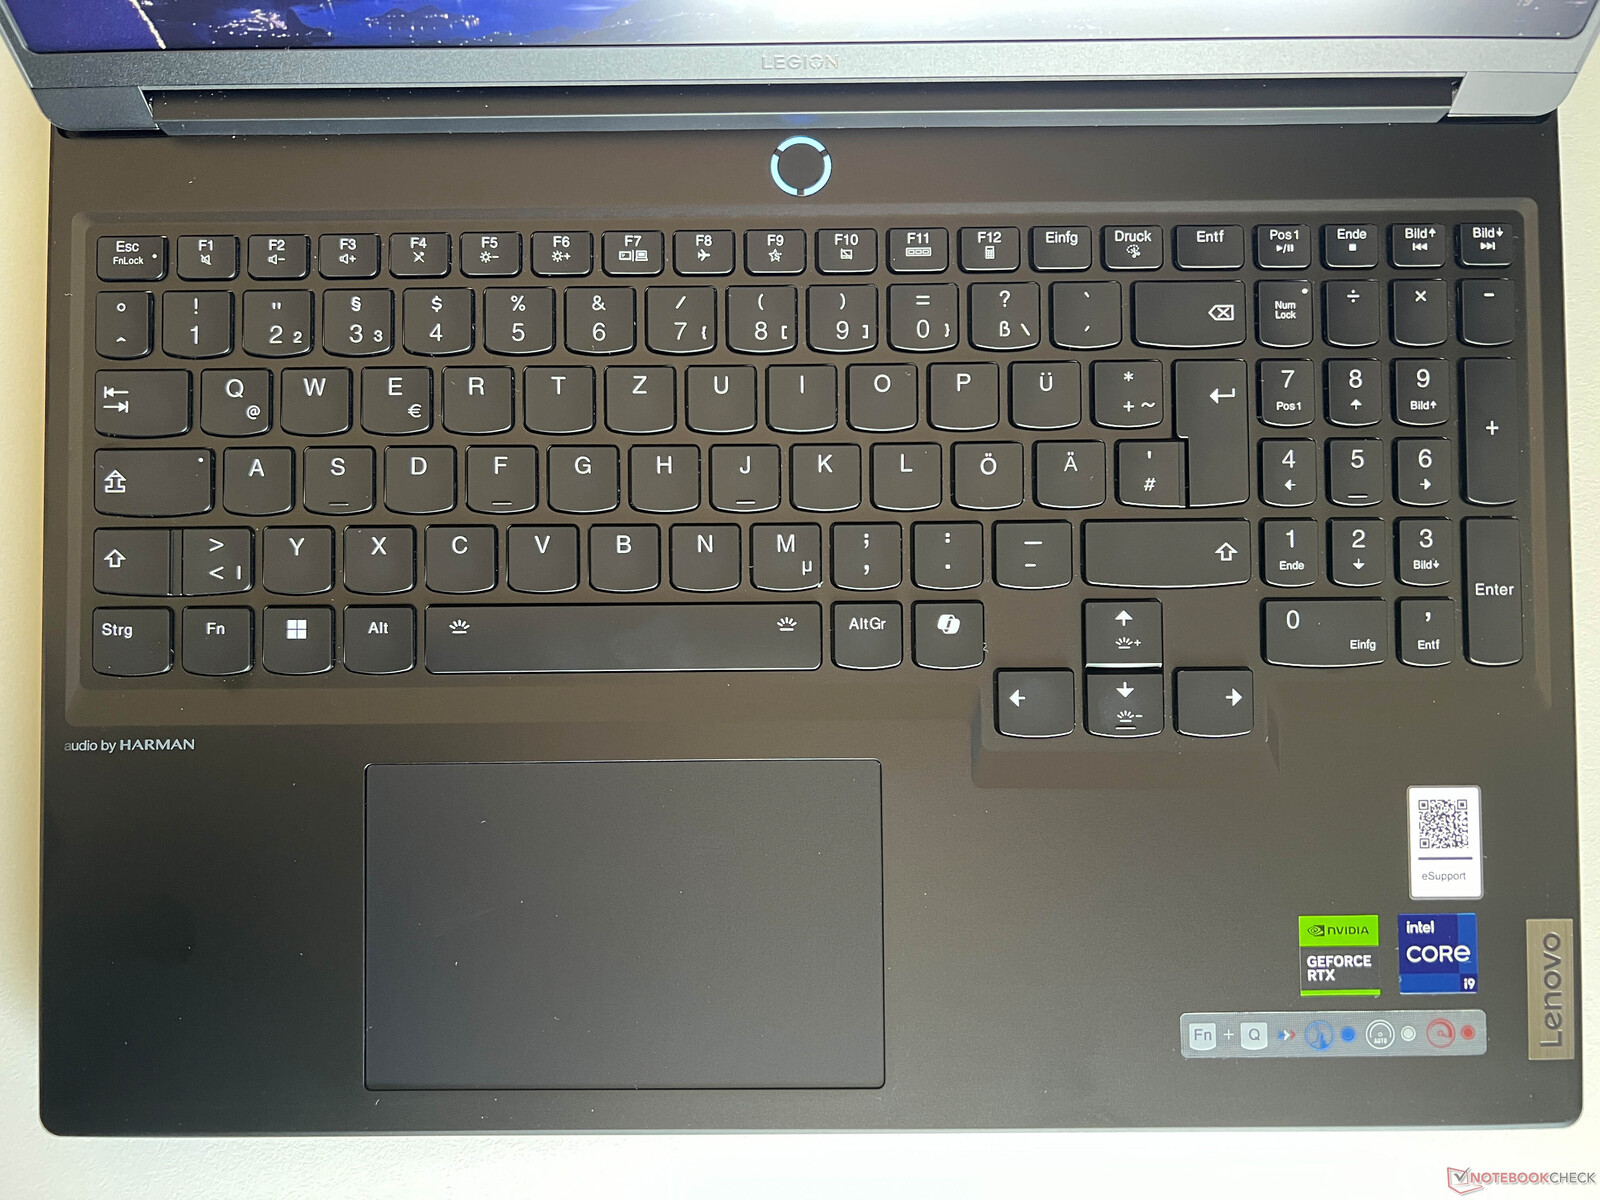
Klawiatura jest umieszczona nieco na lewo od środka i przy wymiarach 12 x 7,5 cm ma dobre proporcje. Czynności przesuwania są tłumaczone bardzo ładnie, a dolną część podkładki można kliknąć - choć raczej głośno. Z tego powodu należy tylko lekko dotykać podkładki. W zestawie znajduje się również mysz Legion Speed Mouse Mad M.
Wyświetlacz - panel IPS 3,2K, 165 Hz i G-Sync
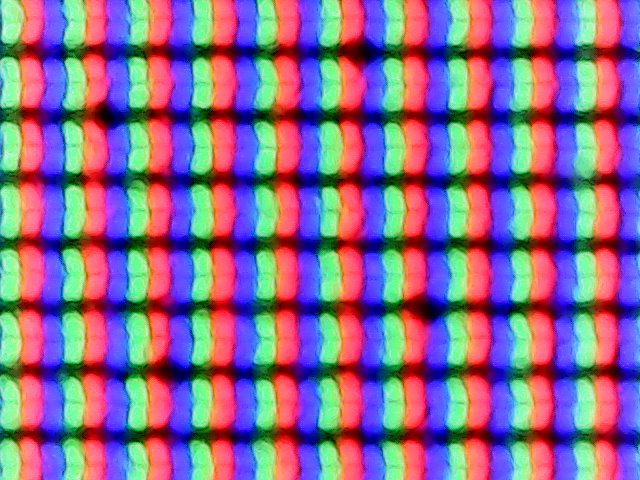
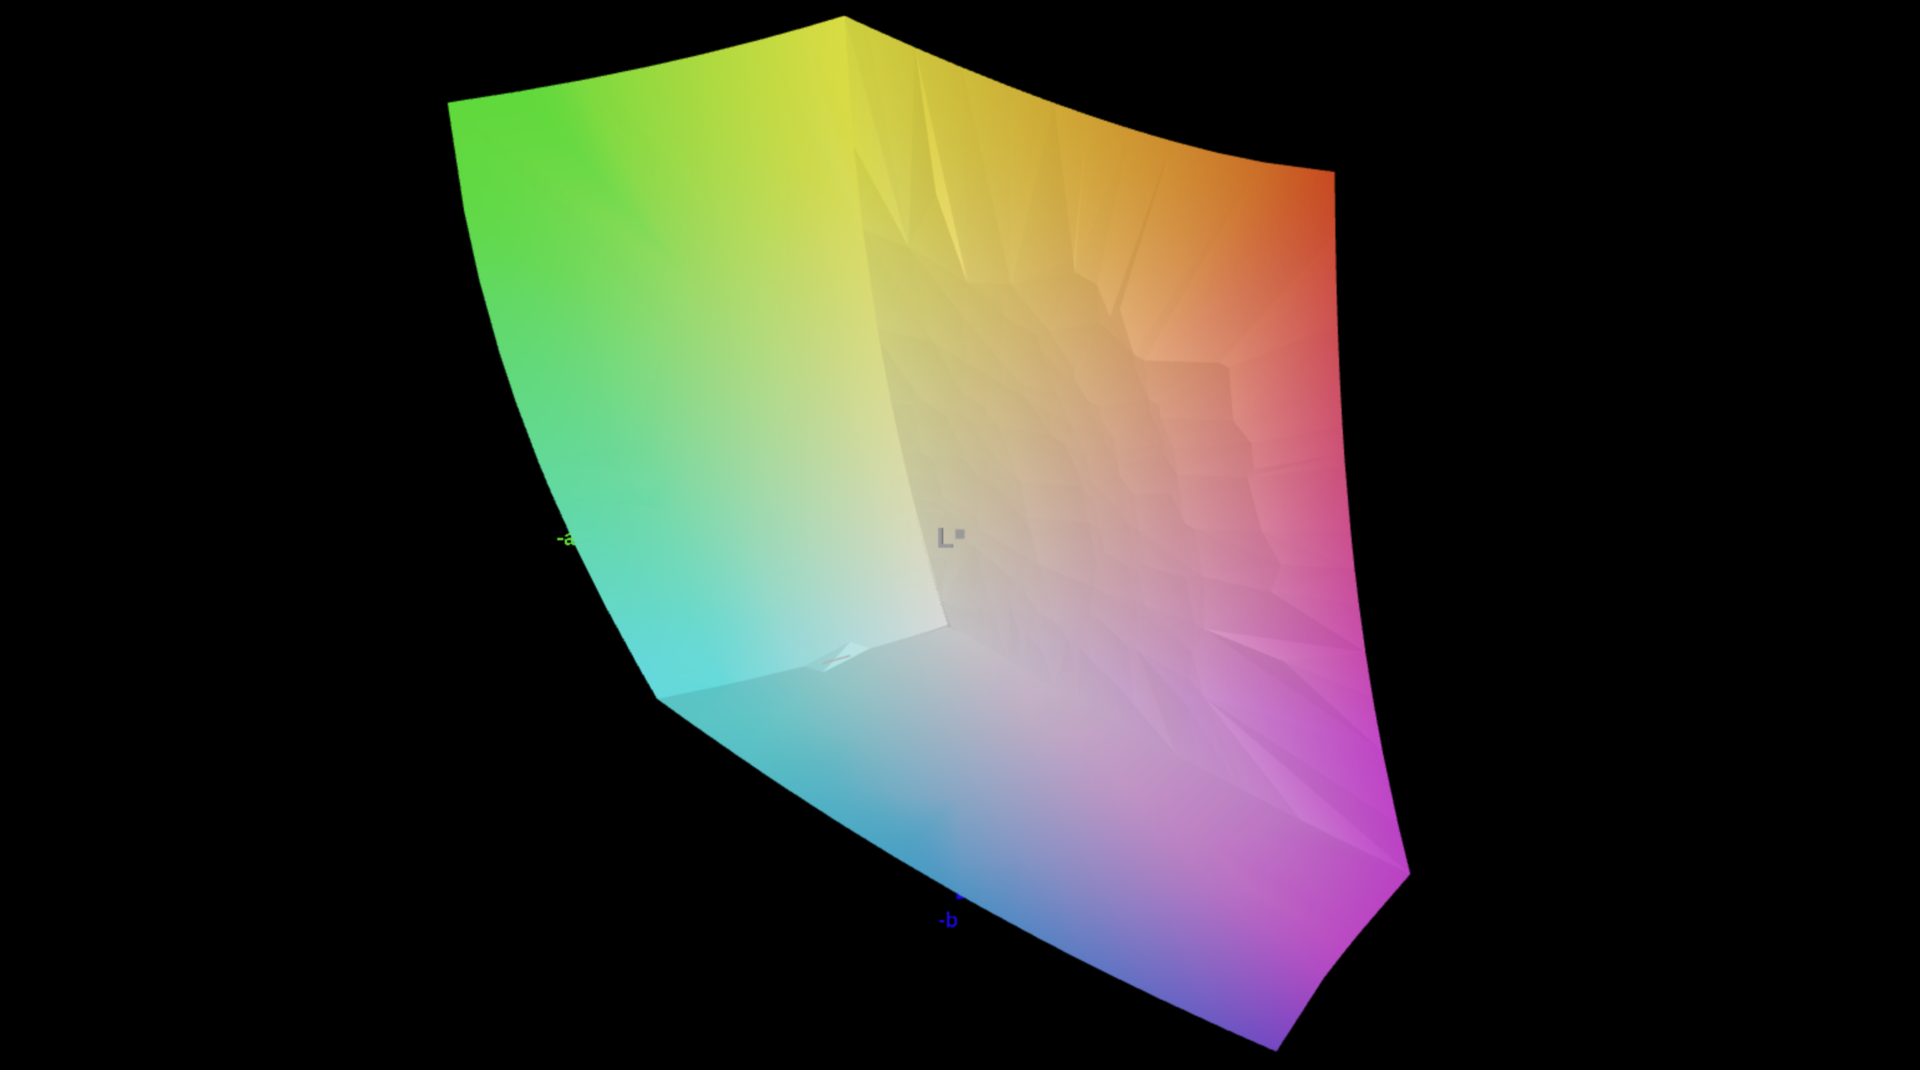
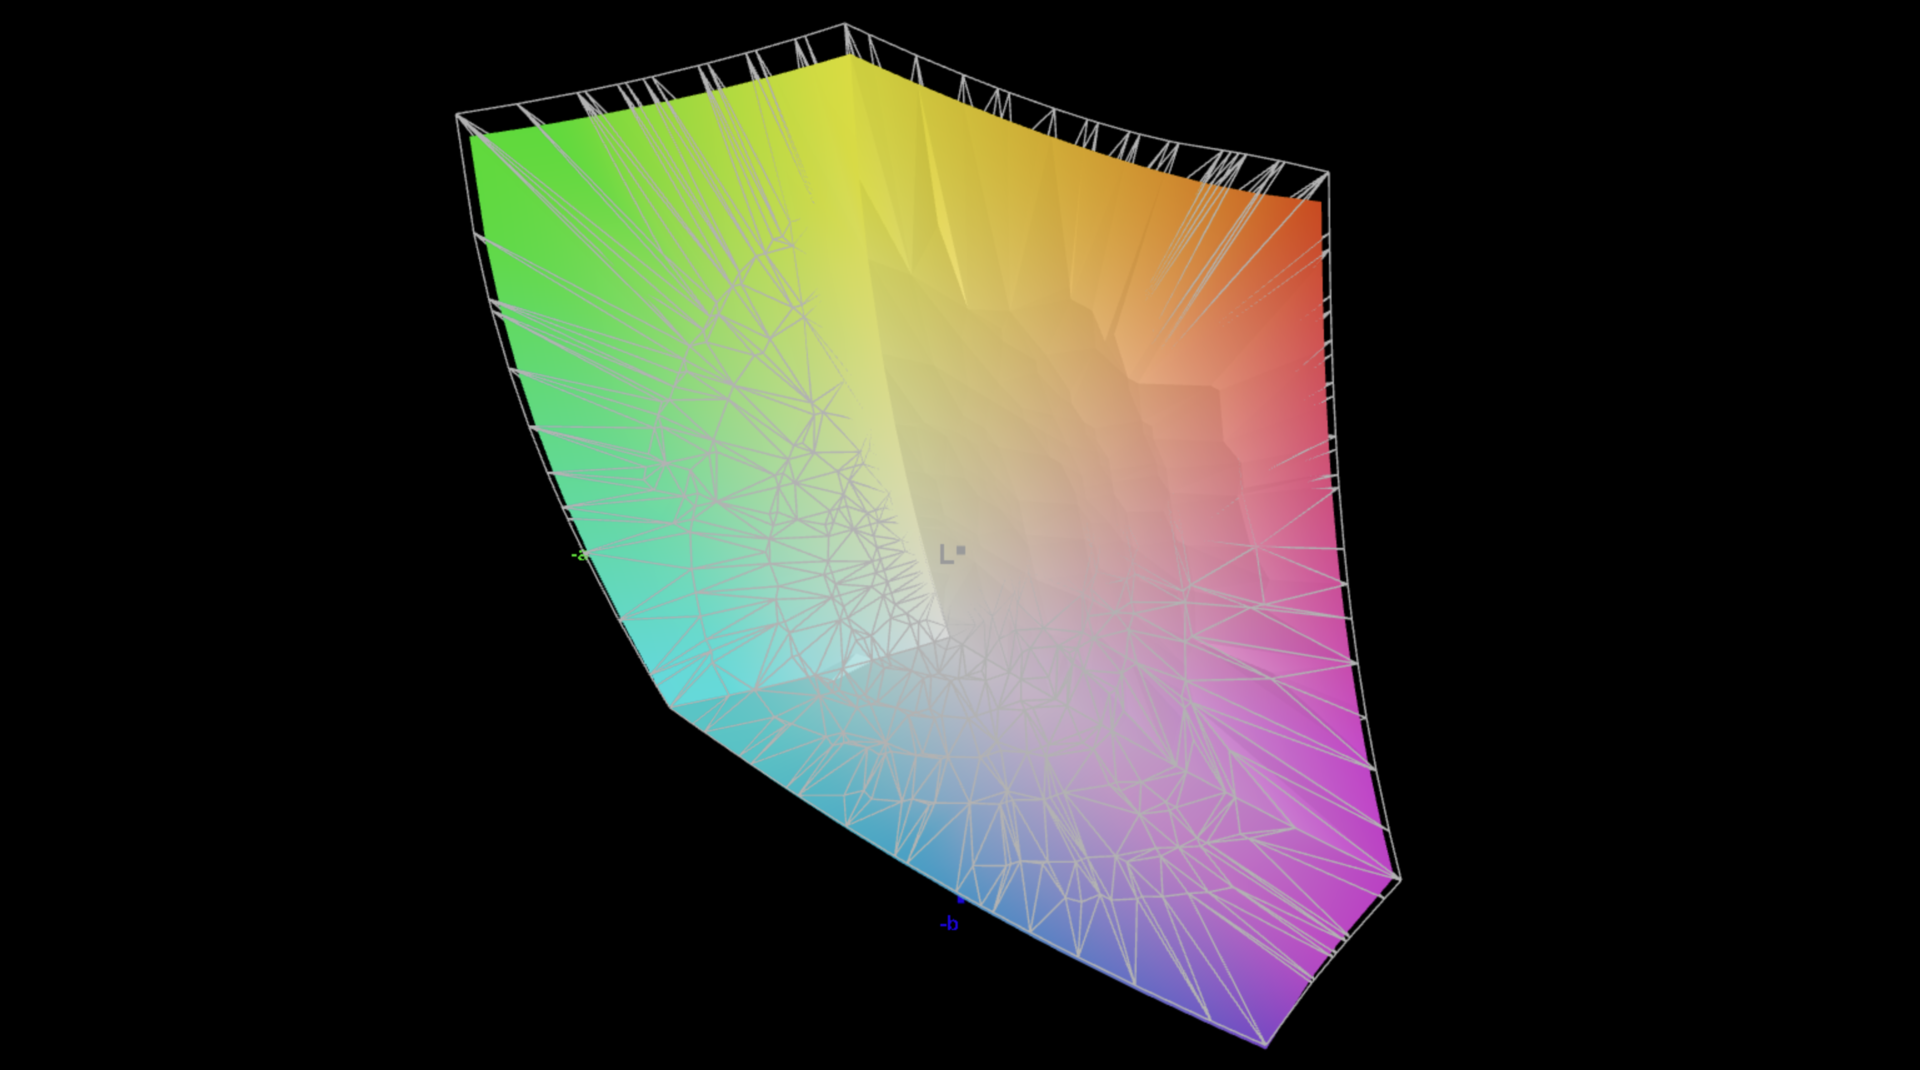
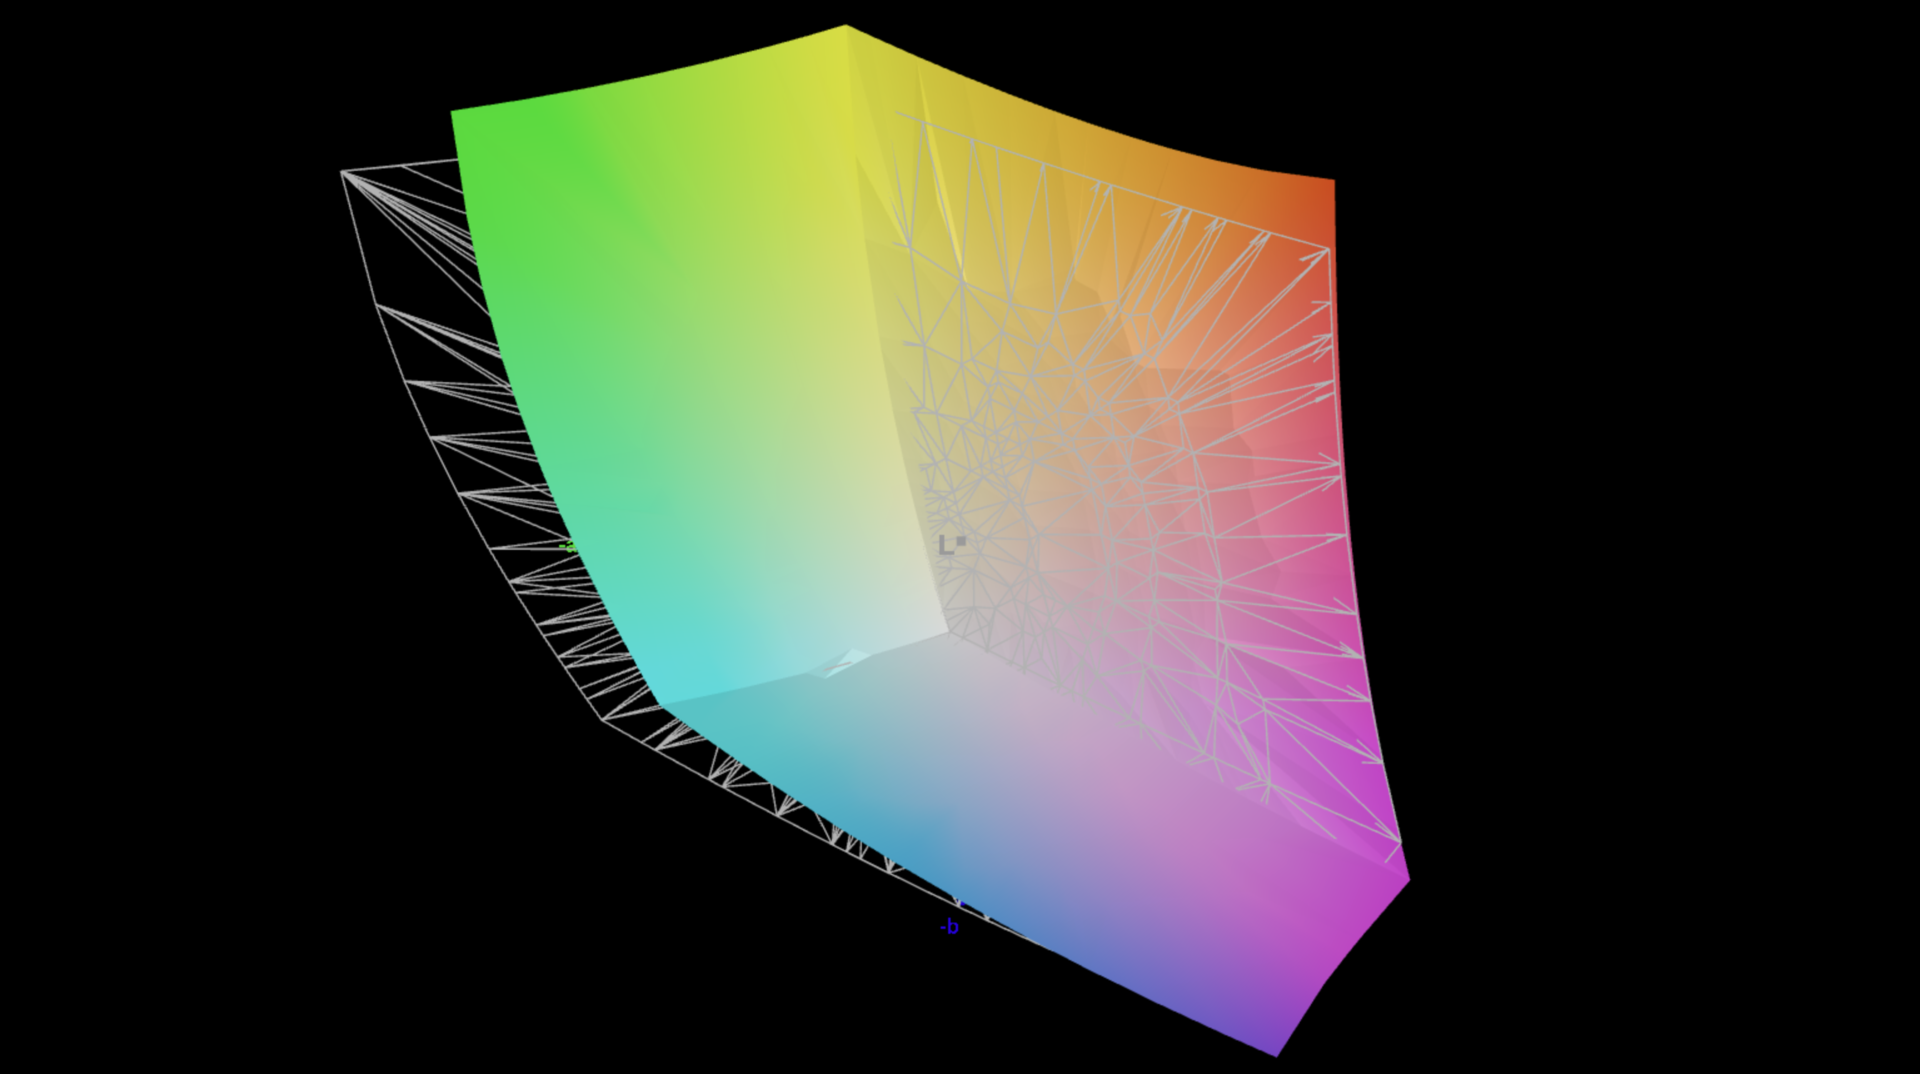
Recenzowane przez nas urządzenie Legion 7 16 jest wyposażone w wyświetlacz IPS o wysokiej rozdzielczości i proporcjach 16:10 (3200 x 2000 pikseli). Subiektywna jakość obrazu jest dobra, a treści wydają się bardzo ostre dzięki wysokiej rozdzielczości wyświetlacza. Podobnie, kolory są również żywe, ale obecne panele OLED oferują bardziej żywe obrazy. Jeśli chodzi o jaśniejsze treści, powierzchnie wydają się nieco ziarniste, jednak Lenovo w większości przypadków udaje się uniknąć tego problemu dzięki standardowemu zastosowaniu trybu ciemnego systemu Windows. Ruchy są bardzo płynne dzięki częstotliwości odświeżania 165 Hz, a czasy reakcji są krótkie. Migotanie PWM nie jest stosowane.
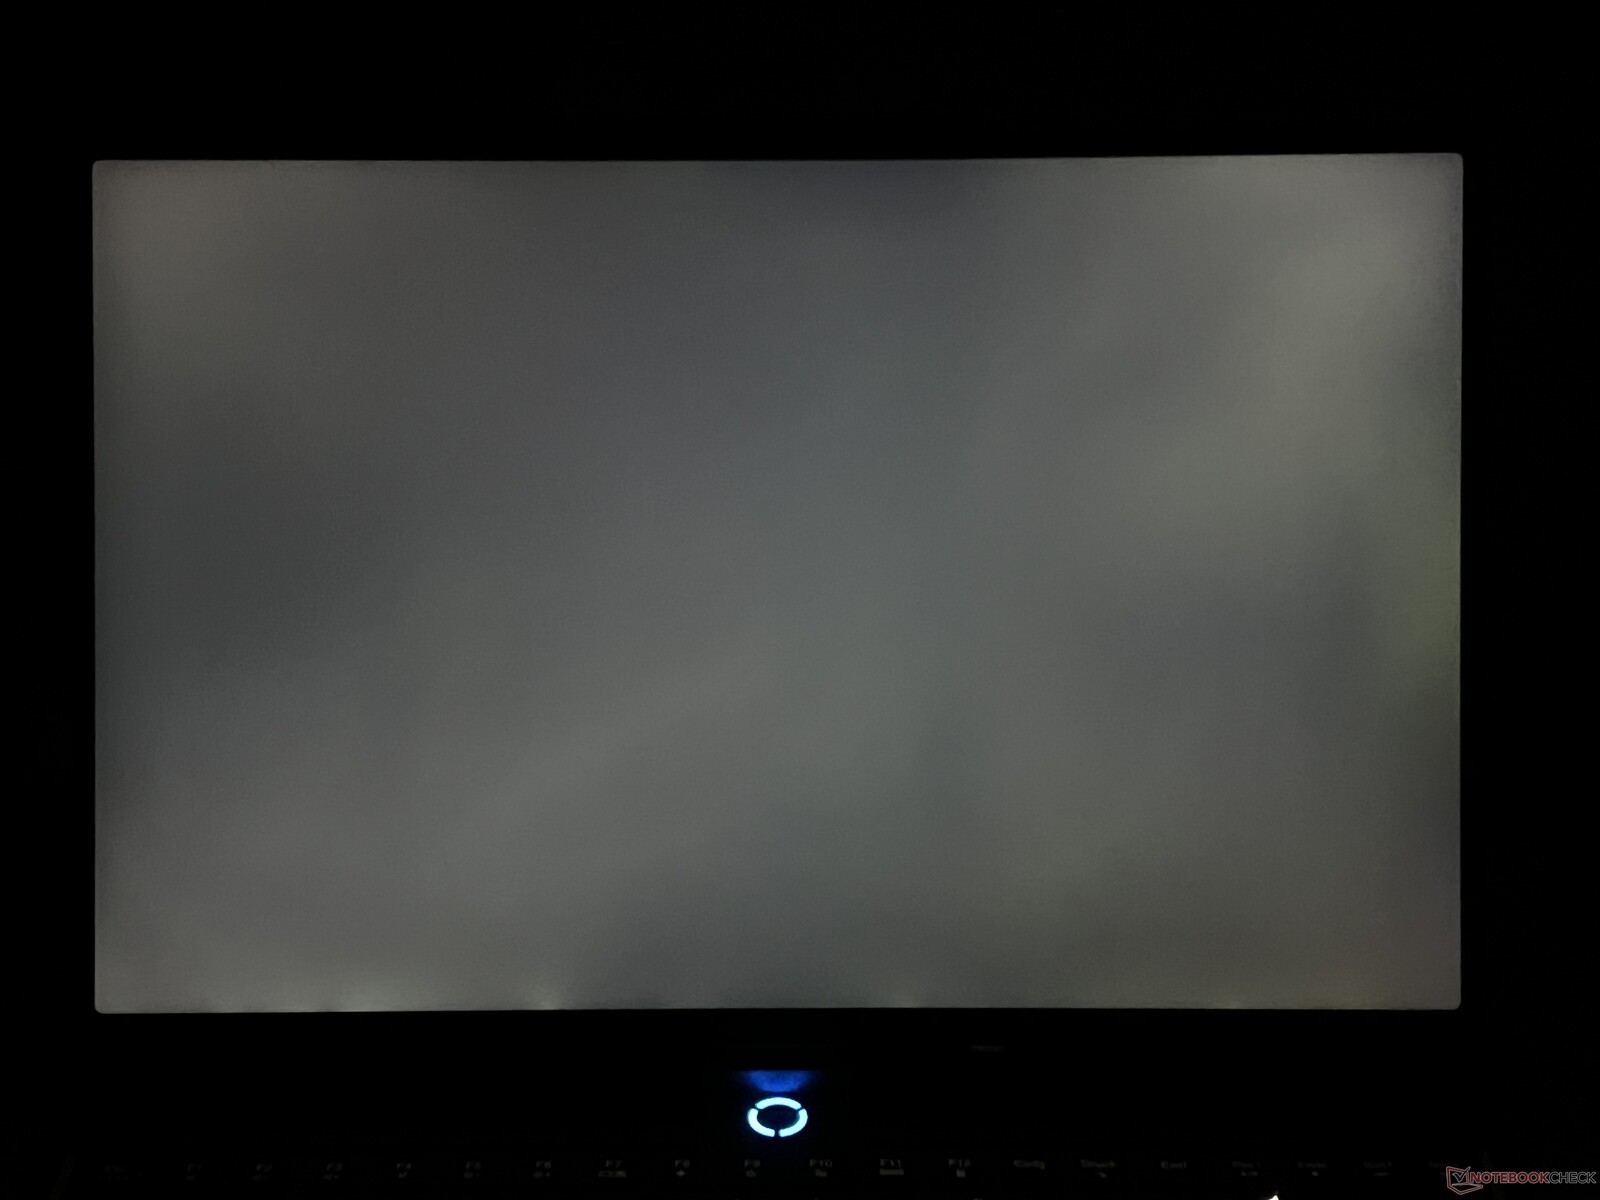
Średnia jasność wynosi około 400 cd/m², ale przy 0,43 cd/m², wartość czerni jest dość wysoka i wyjaśnia, dlaczego maksymalny współczynnik kontrastu wynosi zaledwie 1.000:1. Dodatkowo, przy pełnej jasności i ciemnych treściach, widoczne są prześwietlenia.
| |||||||||||||||||||||||||
rozświetlenie: 89 %
na akumulatorze: 412 cd/m²
kontrast: 958:1 (czerń: 0.43 cd/m²)
ΔE ColorChecker Calman: 0.9 | ∀{0.5-29.43 Ø4.73}
calibrated: 0.6
ΔE Greyscale Calman: 1.4 | ∀{0.09-98 Ø4.97}
87.2% AdobeRGB 1998 (Argyll 3D)
100% sRGB (Argyll 3D)
95% Display P3 (Argyll 3D)
Gamma: 2.23
CCT: 6731 K
| Lenovo Legion 7 16 IRX G9 MNG007ZA1-2, IPS, 3200x2000, 16" | Lenovo Legion Pro 7 16IRX9H BOE CQ NE16QDM-NZB, IPS, 2560x1600, 16" | Lenovo Legion Pro 5 16IRX9 BOE NE160QDM-NYC, IPS, 2560x1600, 16" | Aorus 16X 2024 BOE CQ NE160QDM-NY1, IPS, 2560x1600, 16" | HP Omen Transcend 16-u1095ng ATNA60DL02-0 (SDC41A4), OLED, 2560x1600, 16" | Alienware m16 R2 BOE NE16NYH, IPS, 2560x1600, 16" | Schenker XMG CORE 16 (L23) BOE0AF0 (), IPS, 2560x1600, 16" | |
|---|---|---|---|---|---|---|---|
| Display | 1% | -16% | -18% | 5% | -14% | -16% | |
| Display P3 Coverage (%) | 95 | 98.5 4% | 69.3 -27% | 67.2 -29% | 99.8 5% | 71 -25% | 68.3 -28% |
| sRGB Coverage (%) | 100 | 99.9 0% | 99.4 -1% | 96.7 -3% | 100 0% | 100 0% | 98.6 -1% |
| AdobeRGB 1998 Coverage (%) | 87.2 | 86.7 -1% | 70.1 -20% | 69.3 -21% | 97 11% | 71.4 -18% | 69.6 -20% |
| Response Times | 16% | -4% | 37% | 98% | 20% | 8% | |
| Response Time Grey 50% / Grey 80% * (ms) | 14.4 ? | 12.6 ? 12% | 11.9 ? 17% | 7.5 ? 48% | 0.2 ? 99% | 5.7 ? 60% | 13.2 ? 8% |
| Response Time Black / White * (ms) | 7.2 ? | 5.8 ? 19% | 8.9 ? -24% | 5.4 ? 25% | 0.2 ? 97% | 8.7 ? -21% | 6.6 ? 8% |
| PWM Frequency (Hz) | 120 ? | ||||||
| Screen | 3% | -11% | -58% | 133% | -26% | -69% | |
| Brightness middle (cd/m²) | 412 | 487 18% | 384 -7% | 542 32% | 390 -5% | 345.8 -16% | 376 -9% |
| Brightness (cd/m²) | 396 | 460 16% | 366 -8% | 504 27% | 392 -1% | 337 -15% | 358 -10% |
| Brightness Distribution (%) | 89 | 88 -1% | 91 2% | 86 -3% | 98 10% | 87 -2% | 88 -1% |
| Black Level * (cd/m²) | 0.43 | 0.42 2% | 0.35 19% | 0.45 -5% | 0.02 95% | 0.3 30% | 0.33 23% |
| Contrast (:1) | 958 | 1160 21% | 1097 15% | 1204 26% | 19500 1935% | 1153 20% | 1139 19% |
| Colorchecker dE 2000 * | 0.9 | 1.12 -24% | 0.97 -8% | 2.73 -203% | 1.94 -116% | 1.99 -121% | 2.74 -204% |
| Colorchecker dE 2000 max. * | 2 | 2.26 -13% | 3.57 -79% | 5.29 -165% | 4.26 -113% | 3.52 -76% | 6.78 -239% |
| Colorchecker dE 2000 calibrated * | 0.6 | 0.54 10% | 0.77 -28% | 1.32 -120% | 4.21 -602% | 0.62 -3% | 0.88 -47% |
| Greyscale dE 2000 * | 1.4 | 1.4 -0% | 1.5 -7% | 2.9 -107% | 1.5 -7% | 2.1 -50% | 3.57 -155% |
| Gamma | 2.23 99% | 2.242 98% | 2.24 98% | 2.192 100% | 2.221 99% | 2.32 95% | 2.4 92% |
| CCT | 6731 97% | 6809 95% | 6709 97% | 6173 105% | 6395 102% | 6369 102% | 7246 90% |
| Całkowita średnia (program / ustawienia) | 7% /
5% | -10% /
-11% | -13% /
-36% | 79% /
101% | -7% /
-17% | -26% /
-47% |
* ... im mniej tym lepiej
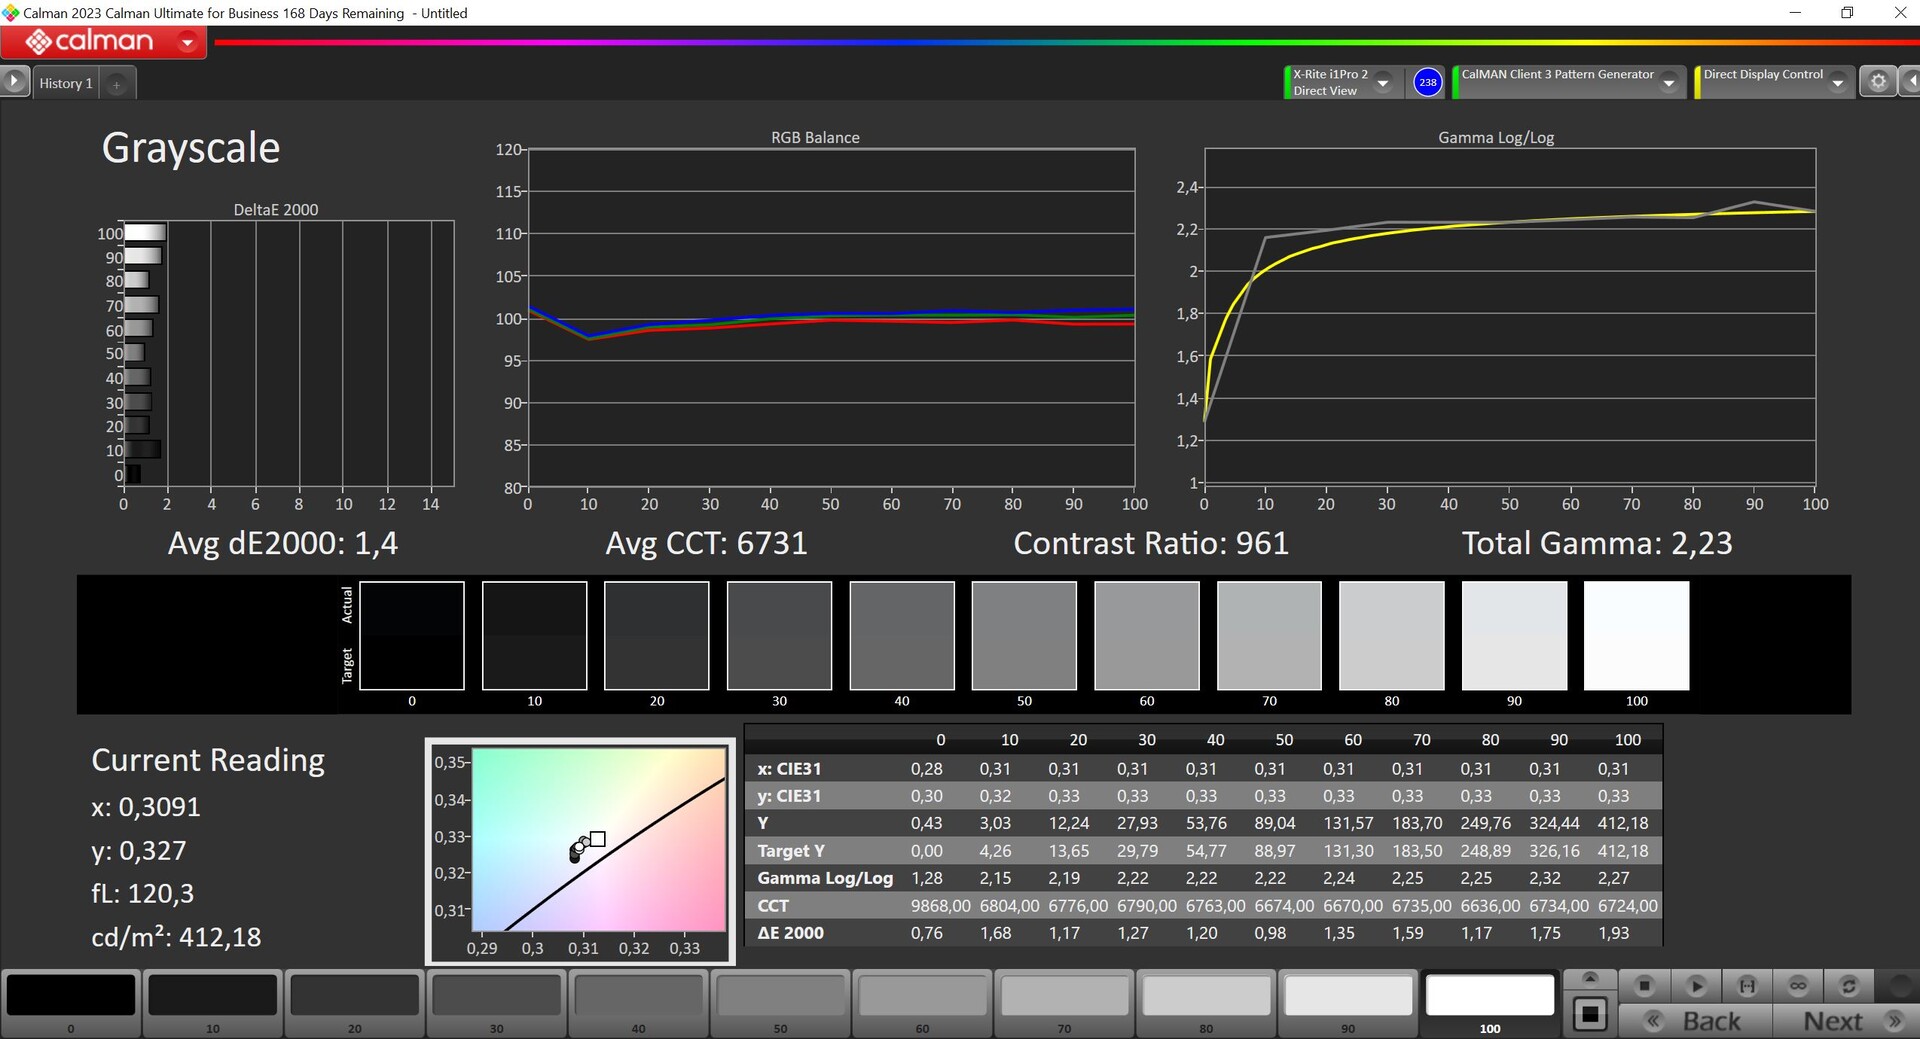
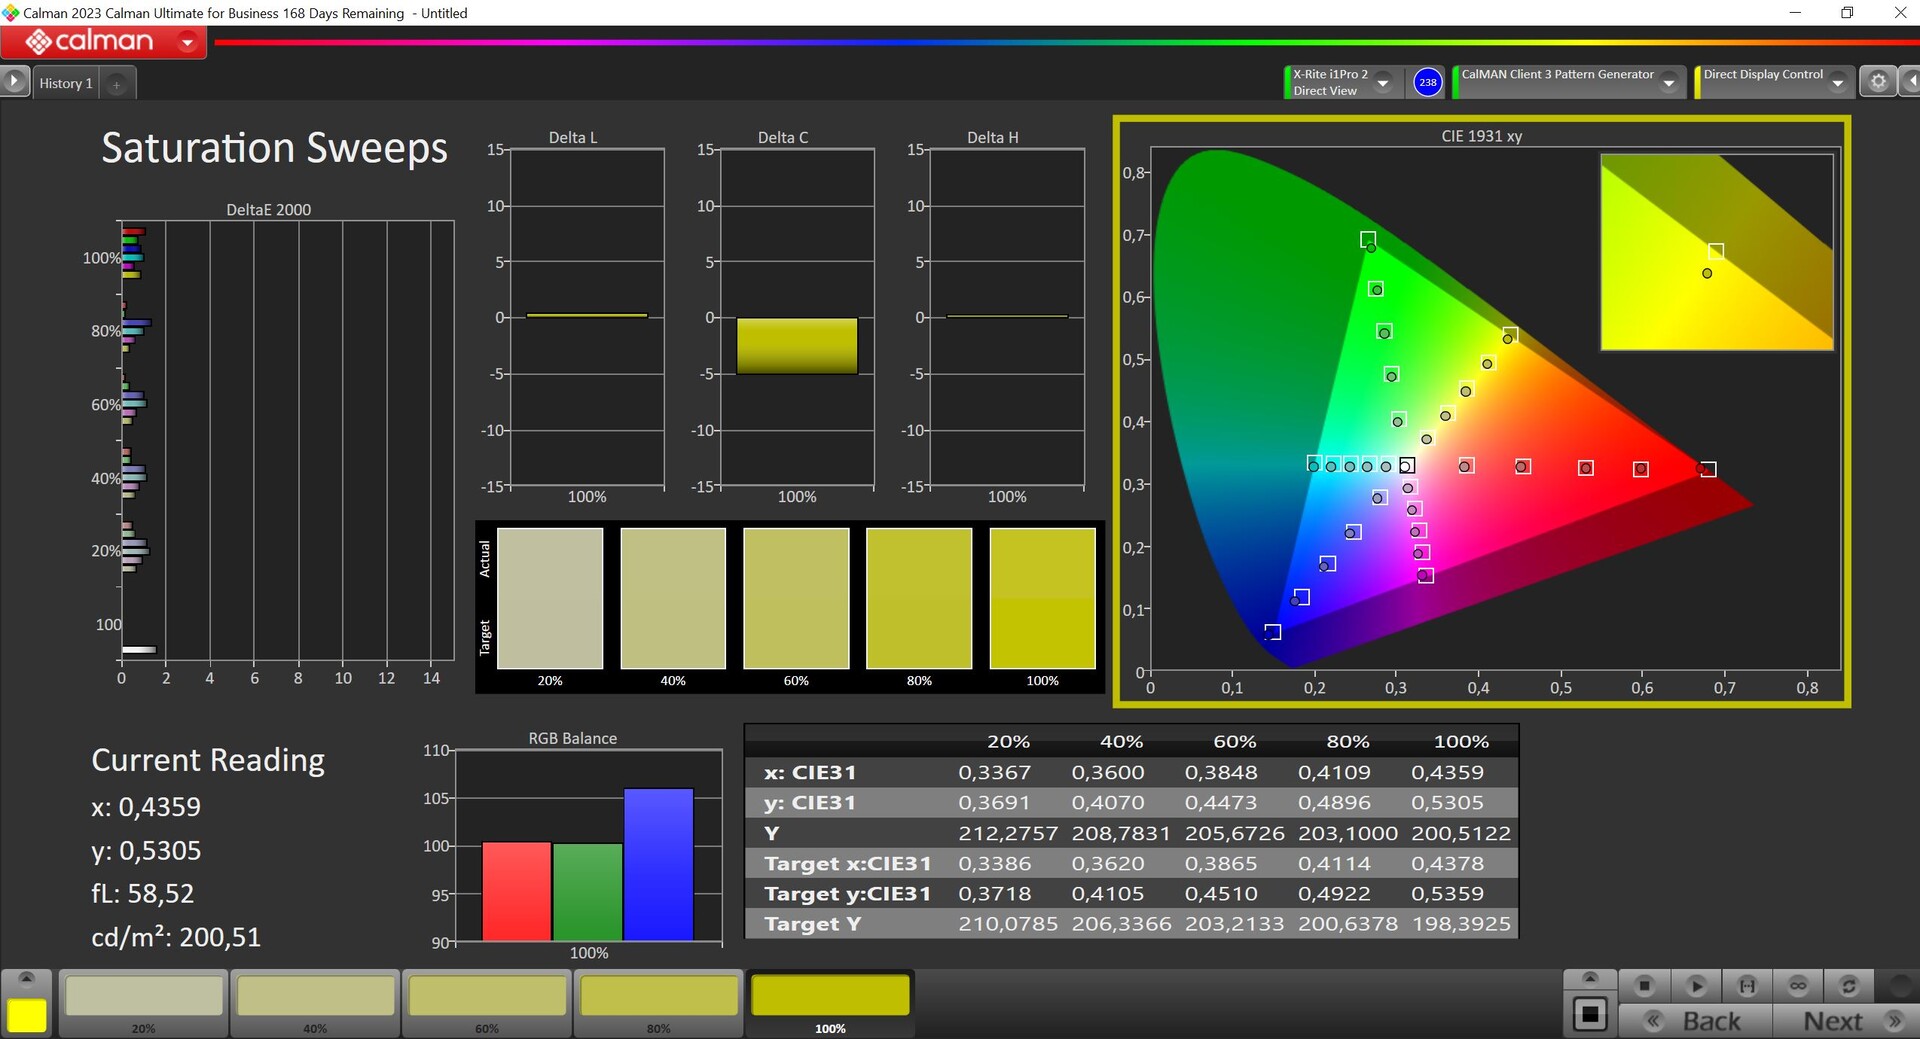
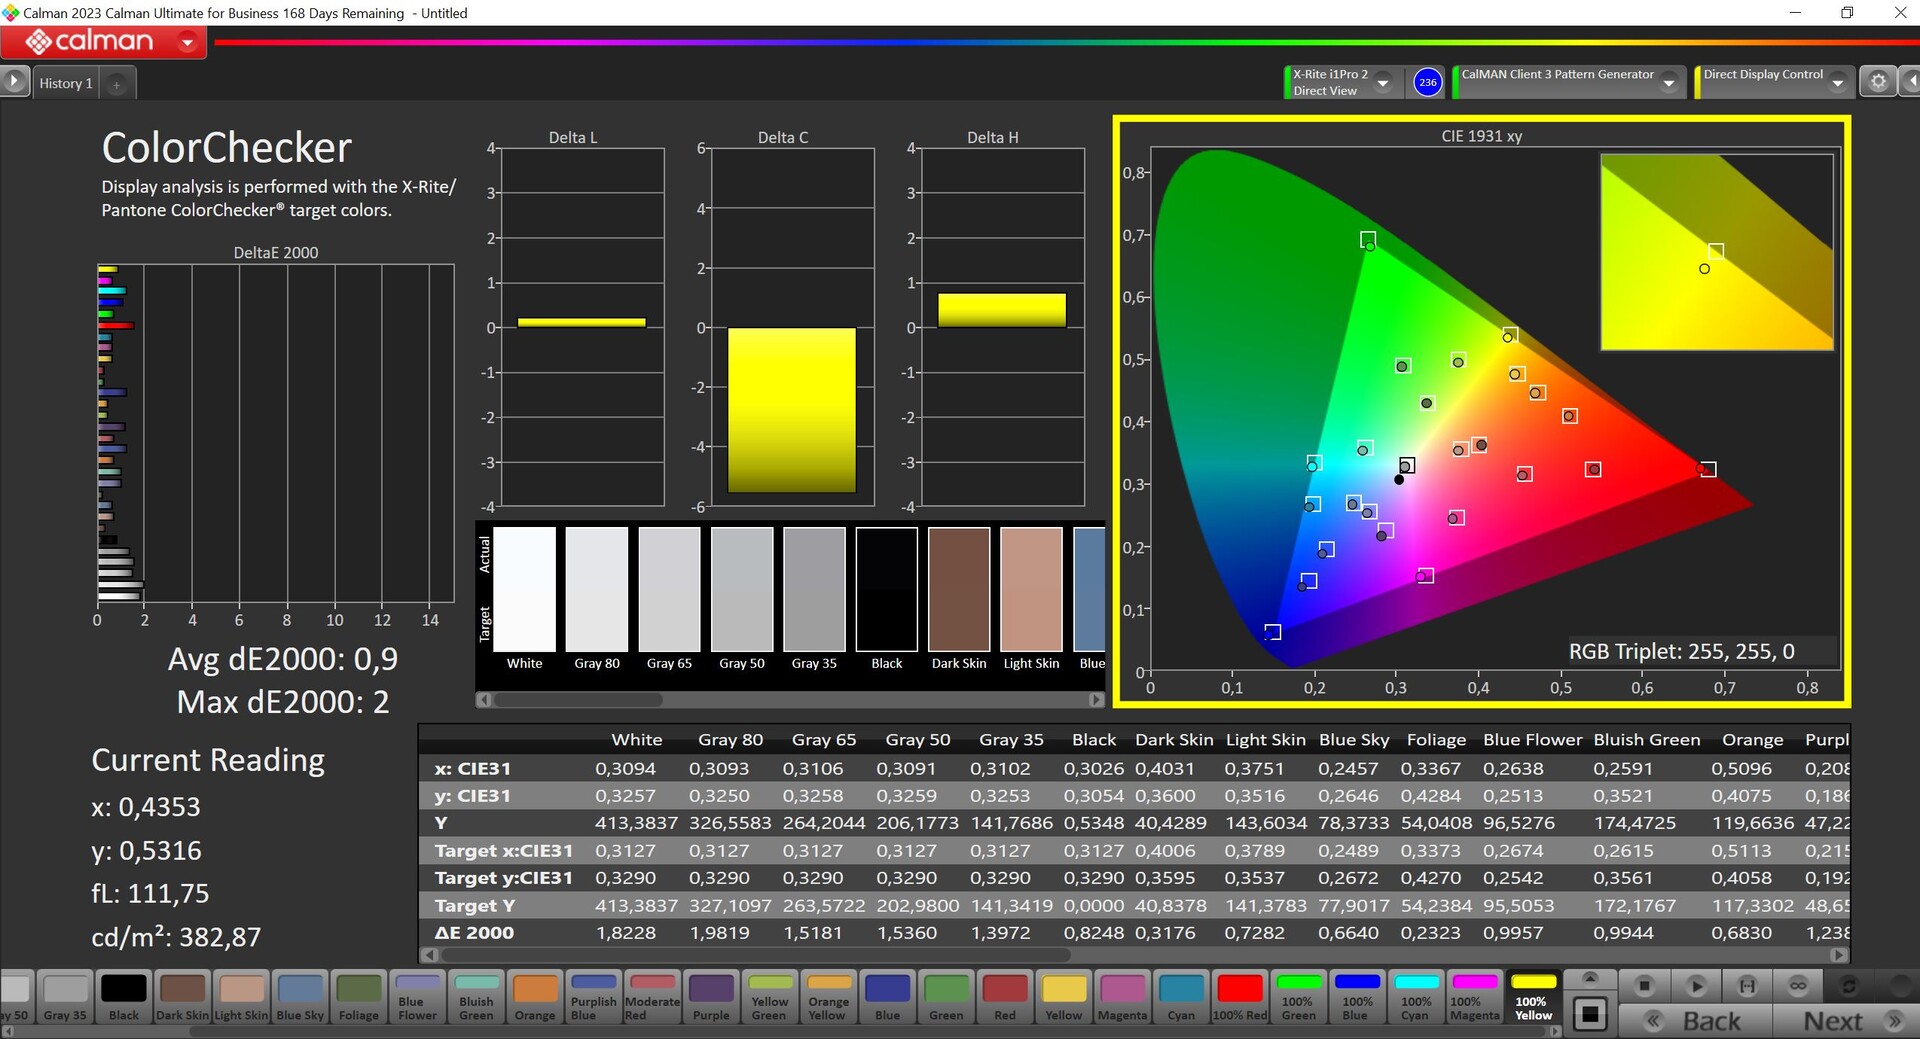
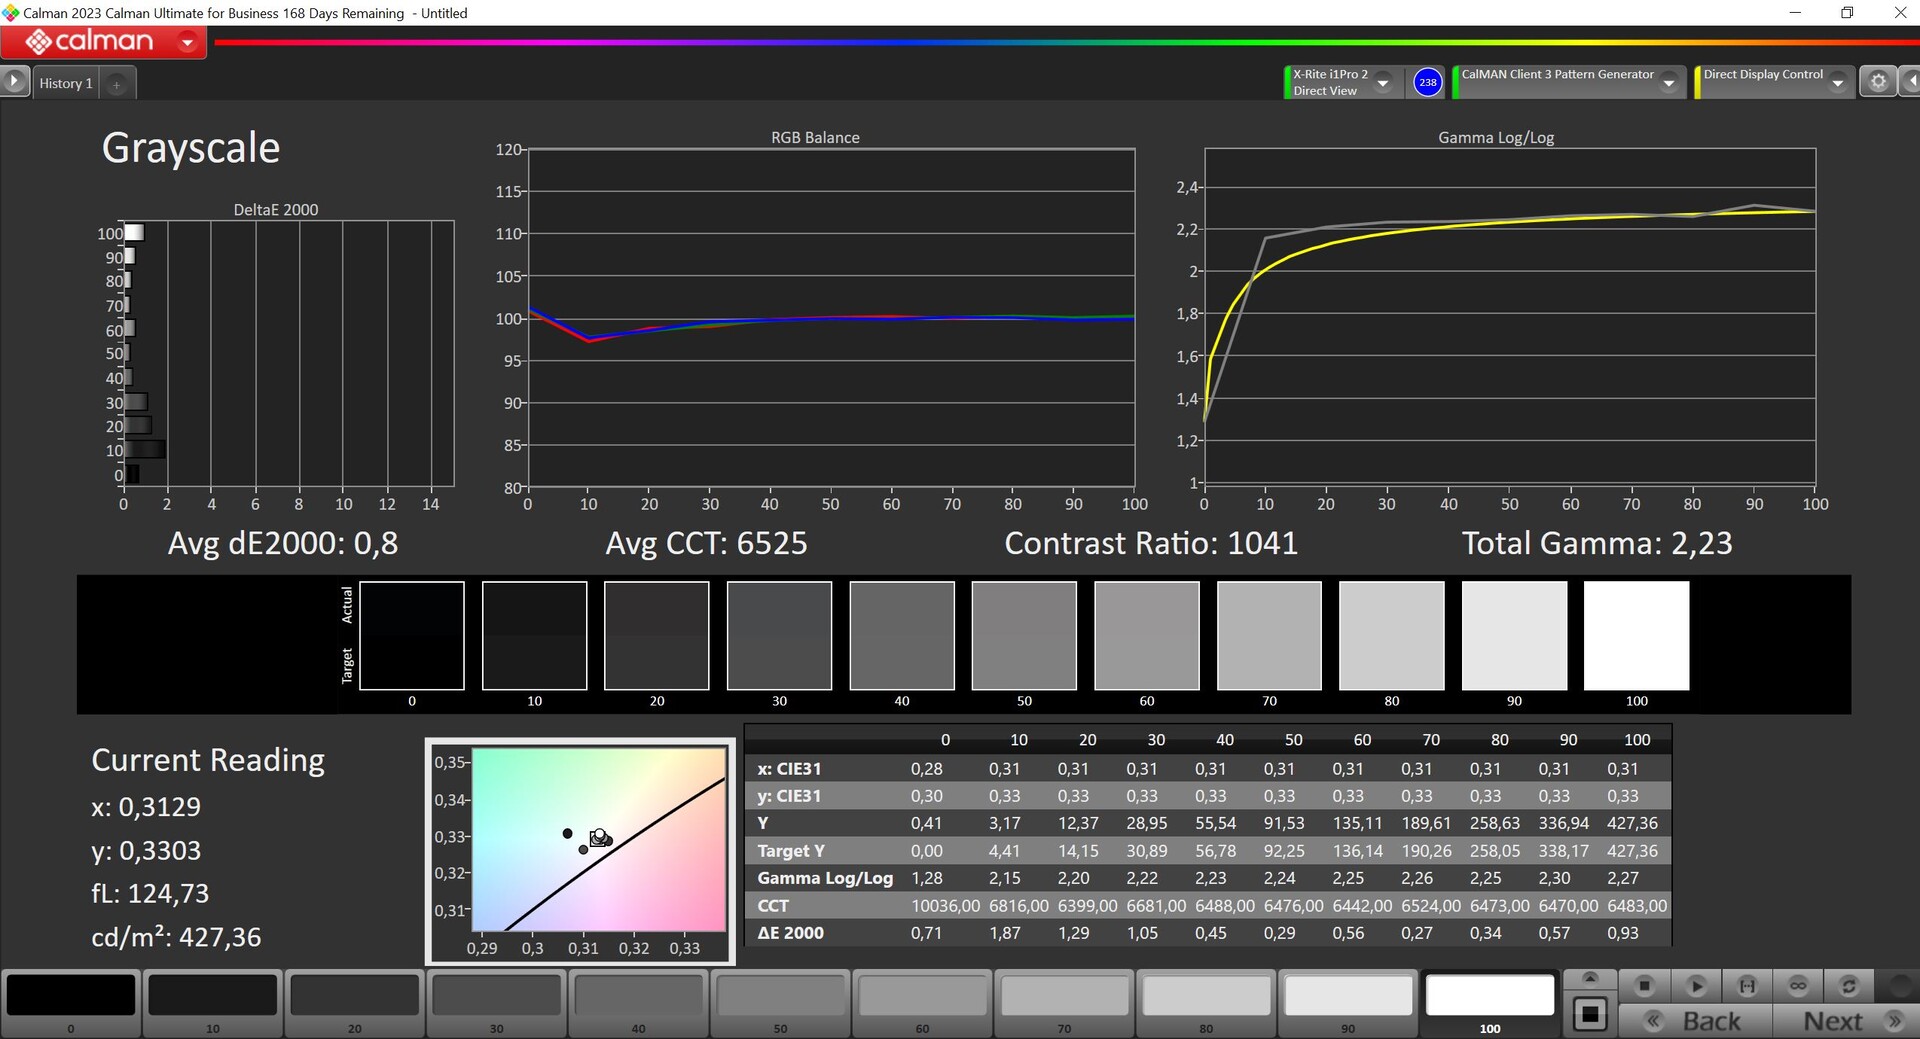

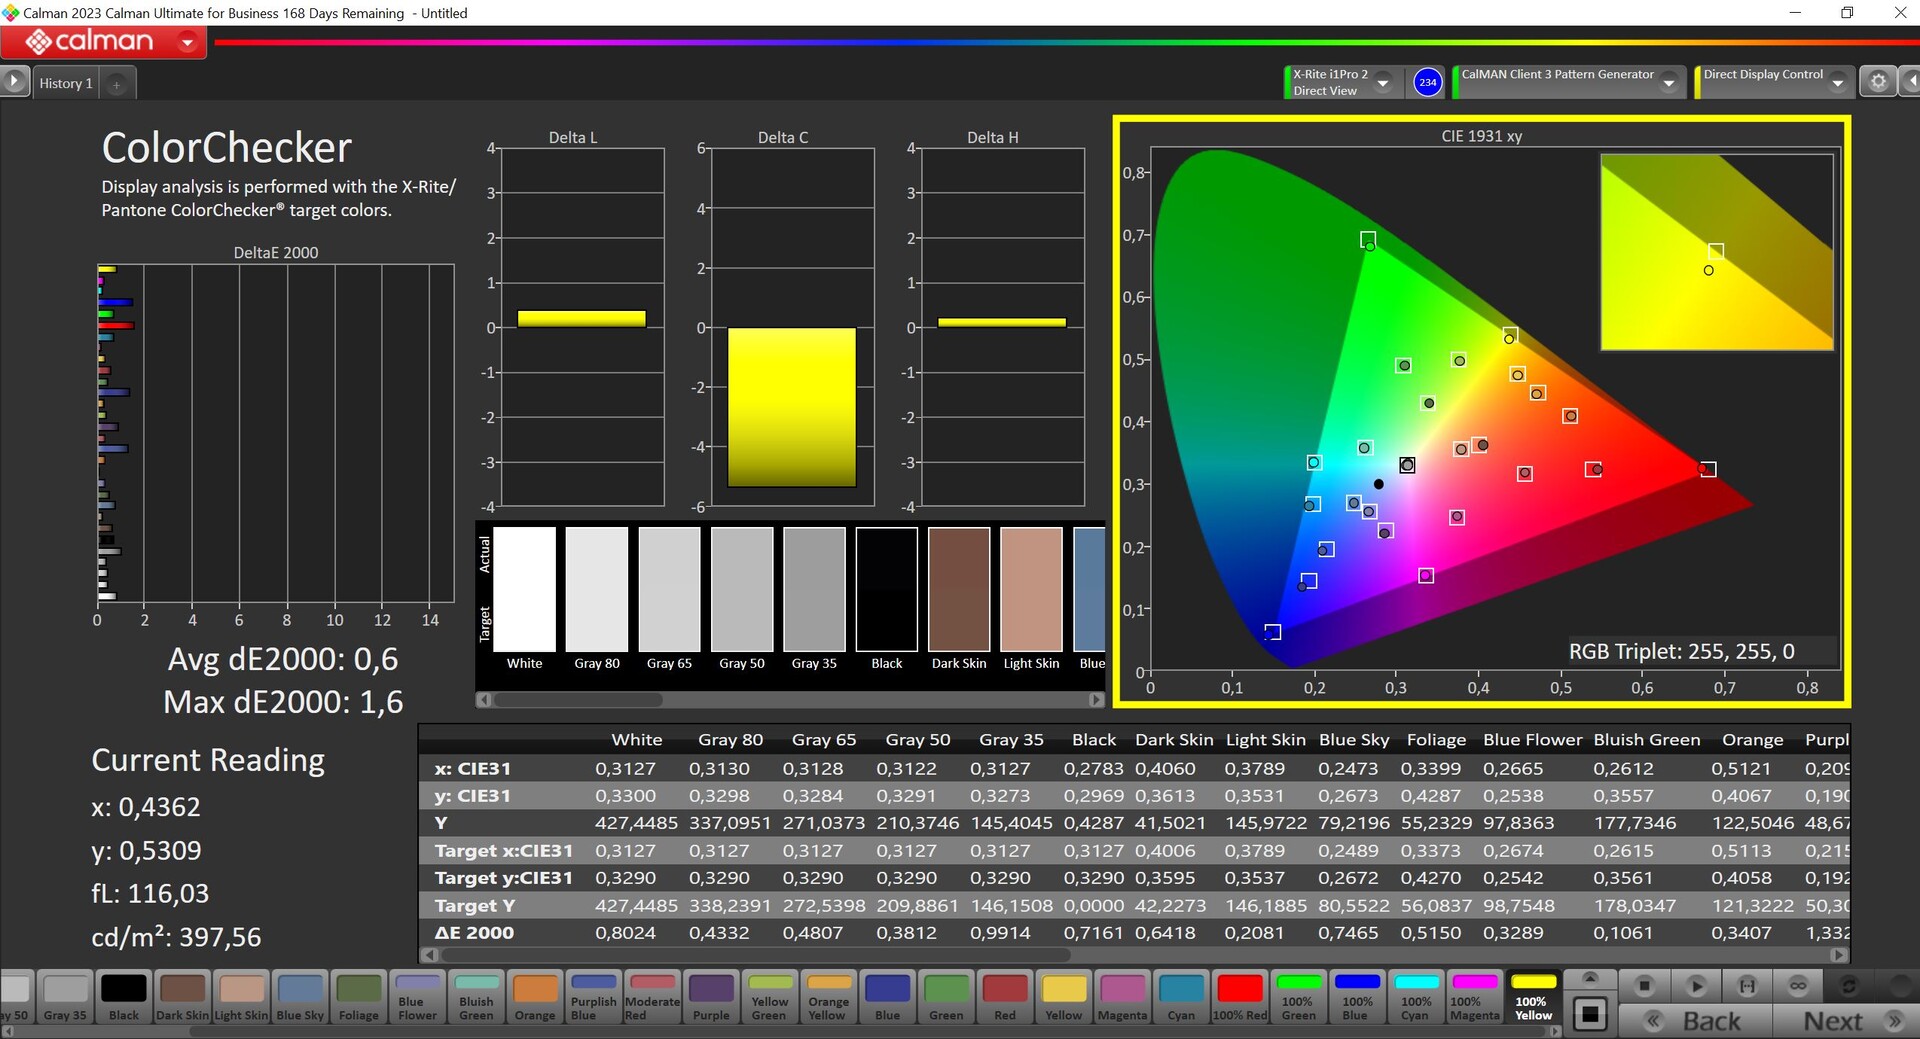
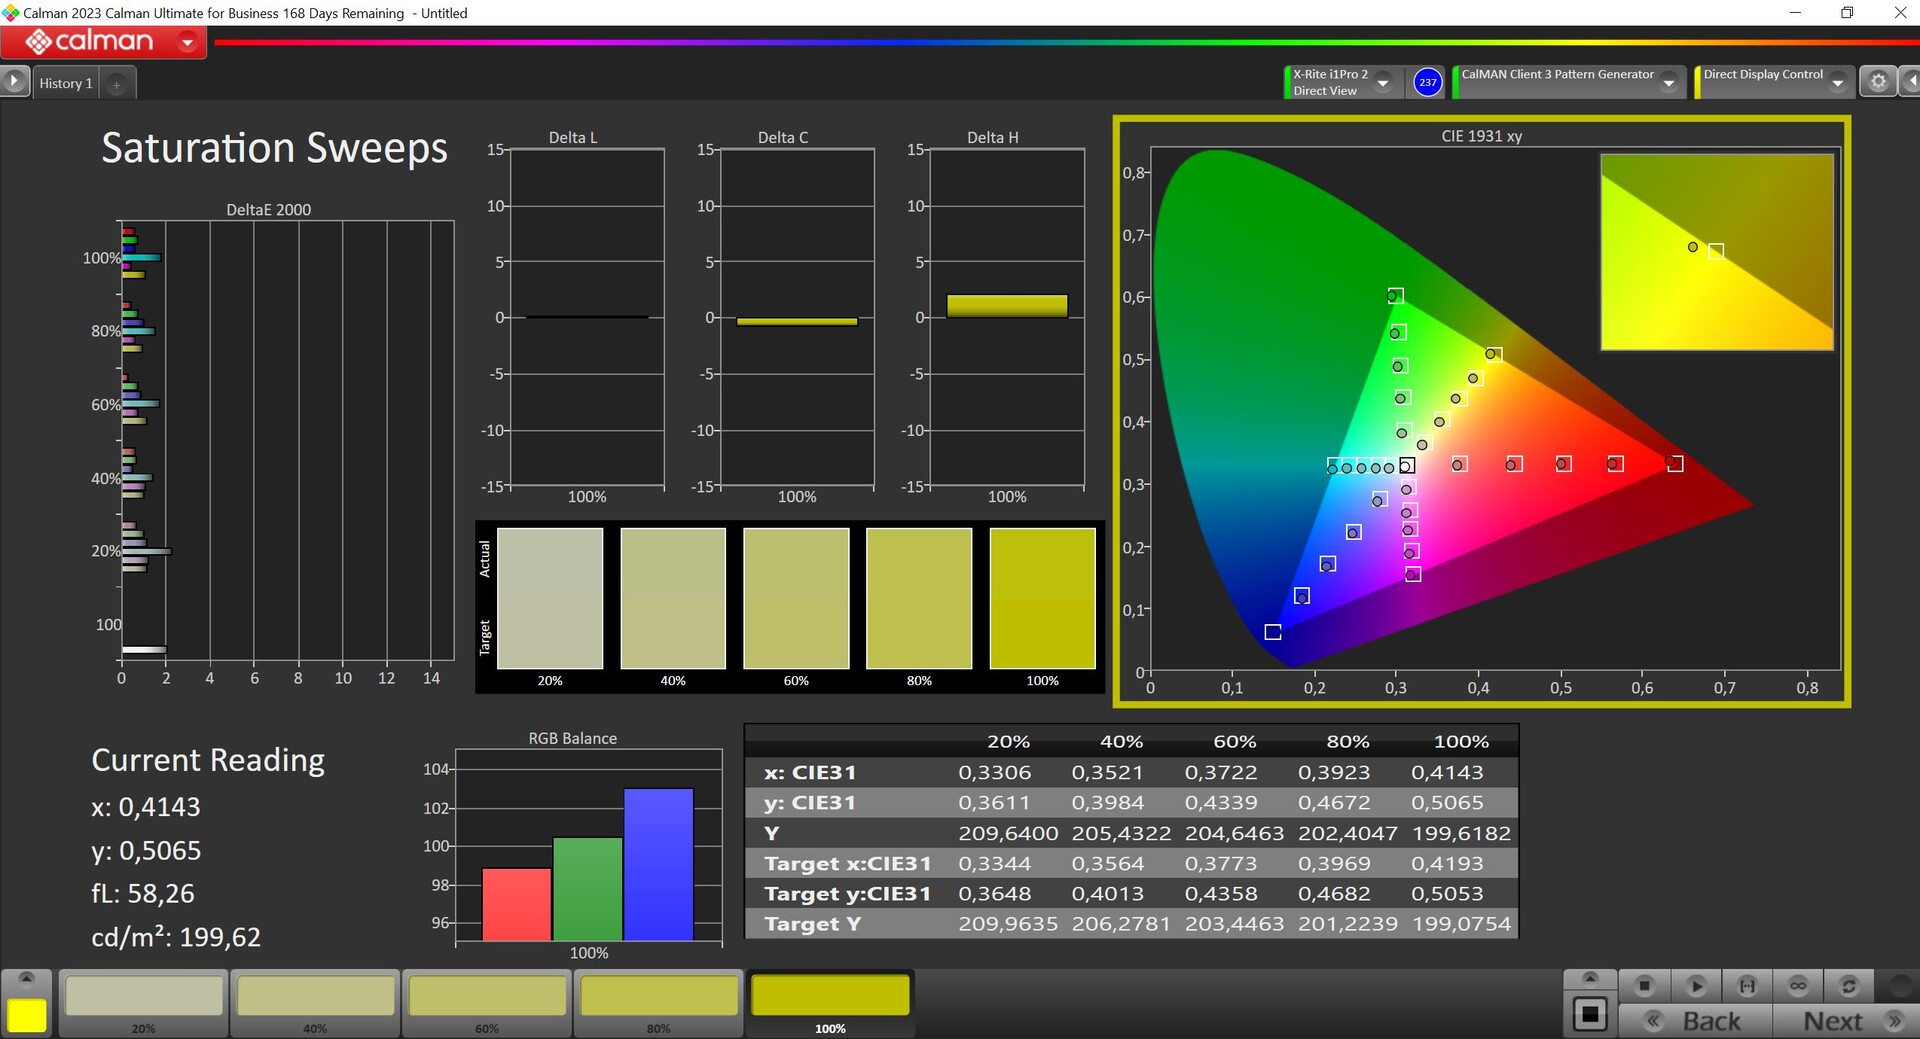
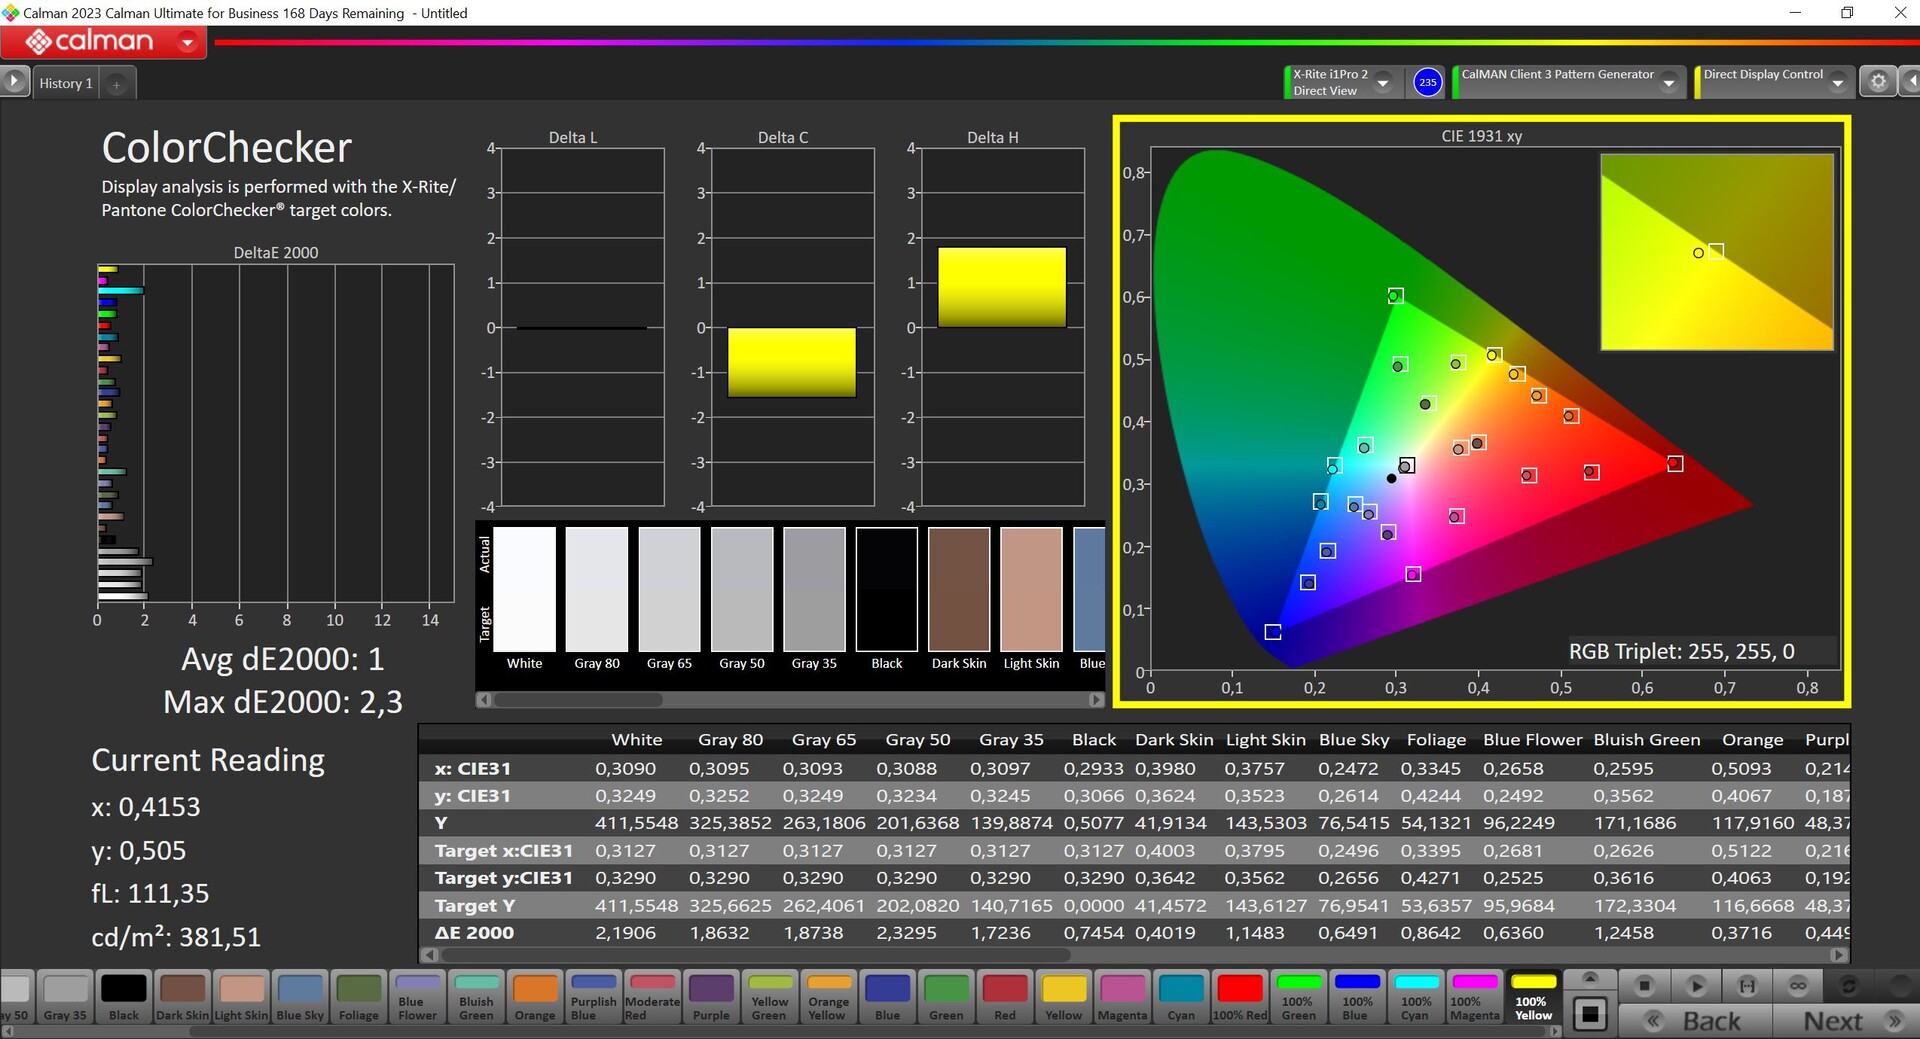
Przeanalizowaliśmy panel przy użyciu profesjonalnego oprogramowania CalMAN (X-Rite i1 Pro 2). Lenovo oferuje różne profile, a po wyjęciu z pudełka domyślny profil zapewnia dokładny obraz. Opcjonalnie dostępny jest również profil natywny z wyższą maksymalną jasnością (~455 cd/m²), ale także temperaturą barwową, która jest zdecydowanie zbyt ciepła, a także ma większe odchylenia kolorów. Dzięki naszej kalibracji byliśmy w stanie jeszcze bardziej poprawić obrazy, a bezpłatne pobranie odpowiedniego profilu jest dostępne powyżej. Podobnie, Lenovo oferuje bardzo dokładny tryb sRGB, który jest szczególnie ważny przy edycji zdjęć. Przestrzeń kolorów sRGB jest całkowicie pokryta; P3 do 95%.

Wyświetl czasy reakcji
| ↔ Czas reakcji od czerni do bieli | ||
|---|---|---|
| 7.2 ms ... wzrost ↗ i spadek ↘ łącznie | ↗ 2.9 ms wzrost | 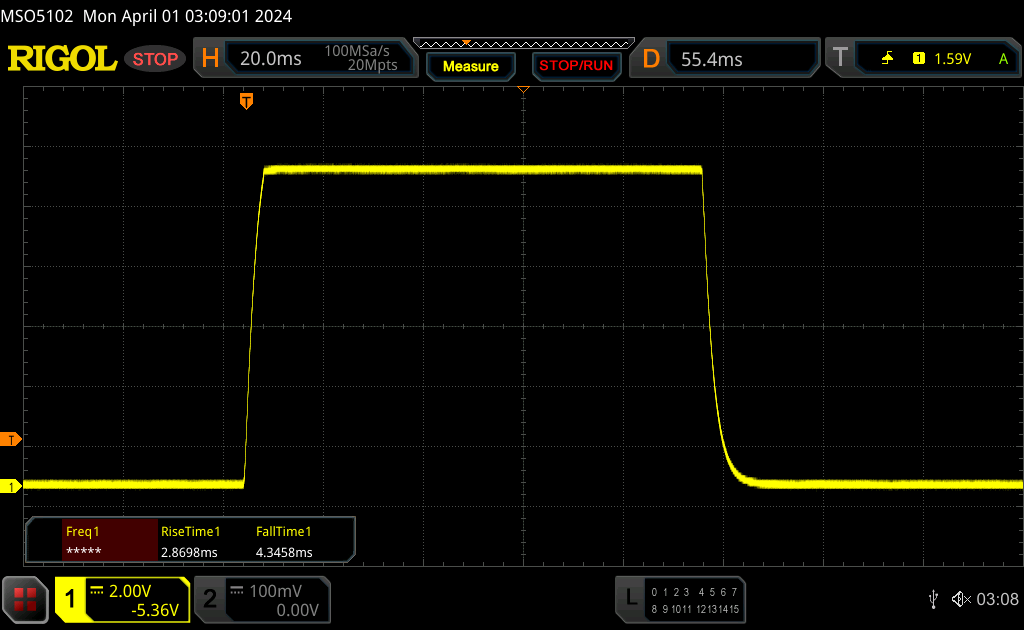 |
| ↘ 4.3 ms upadek | ||
| W naszych testach ekran wykazuje bardzo szybką reakcję i powinien bardzo dobrze nadawać się do szybkich gier. Dla porównania, wszystkie testowane urządzenia wahają się od 0.1 (minimum) do 240 (maksimum) ms. » 21 % wszystkich urządzeń jest lepszych. Oznacza to, że zmierzony czas reakcji jest lepszy od średniej wszystkich testowanych urządzeń (19.9 ms). | ||
| ↔ Czas reakcji 50% szarości do 80% szarości | ||
| 14.4 ms ... wzrost ↗ i spadek ↘ łącznie | ↗ 6.9 ms wzrost | 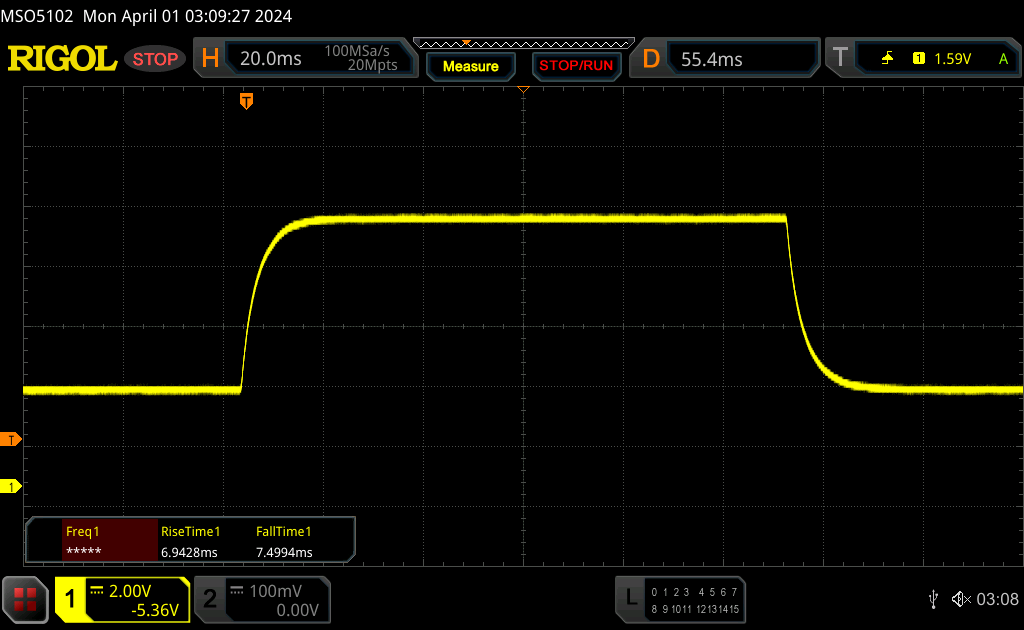 |
| ↘ 7.5 ms upadek | ||
| W naszych testach ekran wykazuje dobry współczynnik reakcji, ale może być zbyt wolny dla graczy rywalizujących ze sobą. Dla porównania, wszystkie testowane urządzenia wahają się od 0.165 (minimum) do 636 (maksimum) ms. » 28 % wszystkich urządzeń jest lepszych. Oznacza to, że zmierzony czas reakcji jest lepszy od średniej wszystkich testowanych urządzeń (31.1 ms). | ||
Migotanie ekranu / PWM (modulacja szerokości impulsu)
| Migotanie ekranu/nie wykryto PWM | 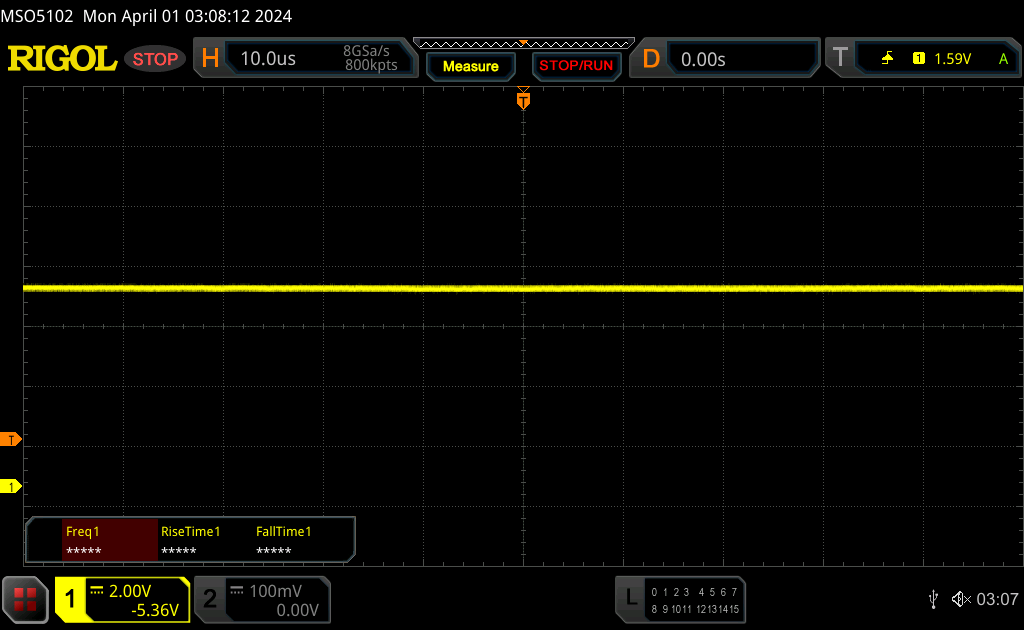 | ||
Dla porównania: 52 % wszystkich testowanych urządzeń nie używa PWM do przyciemniania wyświetlacza. Jeśli wykryto PWM, zmierzono średnio 7784 (minimum: 5 - maksimum: 343500) Hz. | |||


Dzięki matowemu wyświetlaczowi panel może być również używany na zewnątrz, ale w jasne dni jasność może być jeszcze wyższa. Stabilność kąta widzenia panelu IPS jest bardzo dobra.

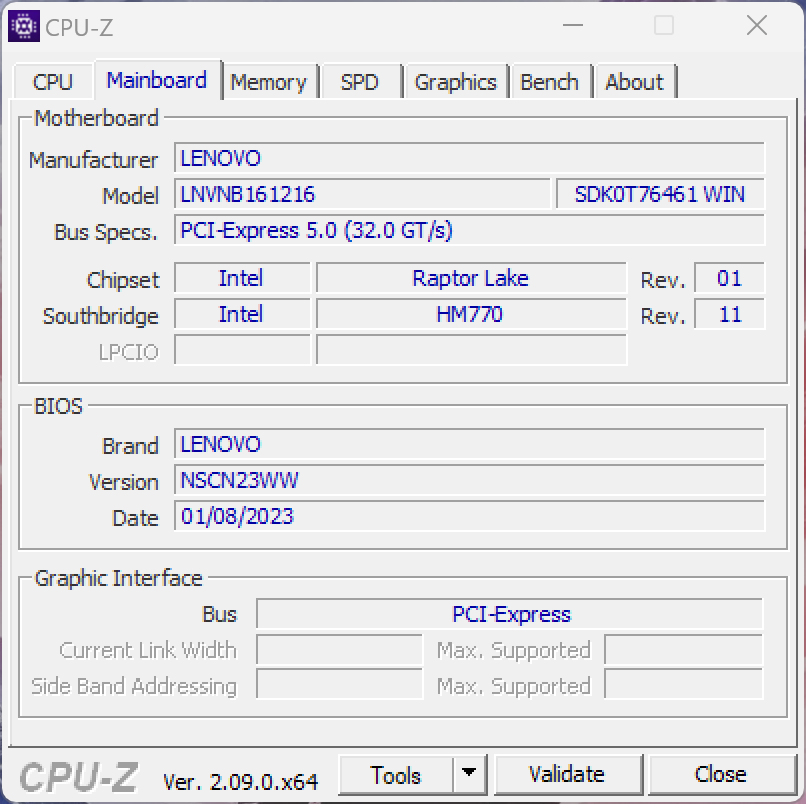
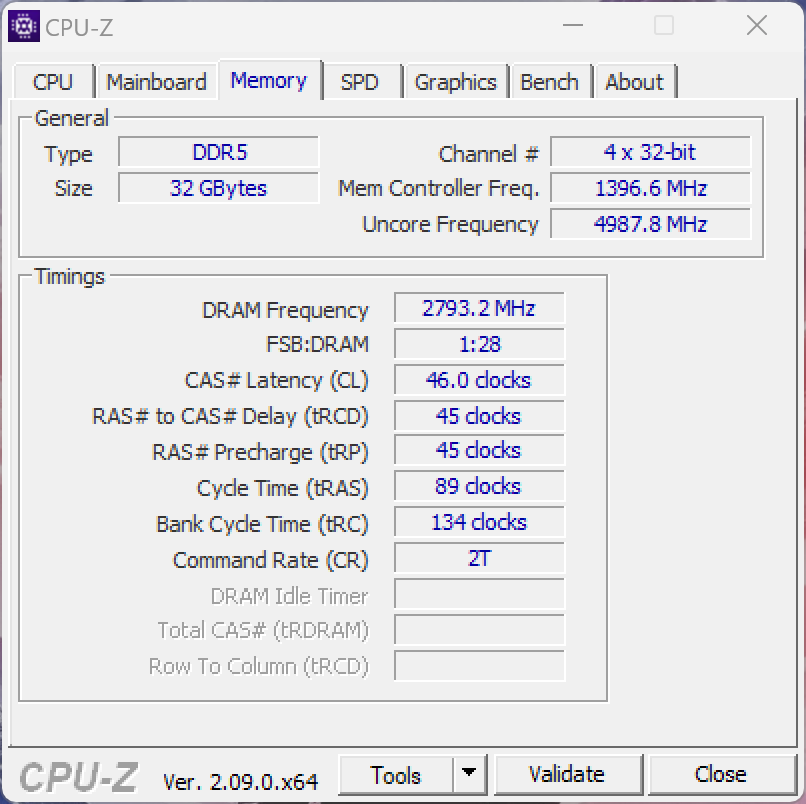
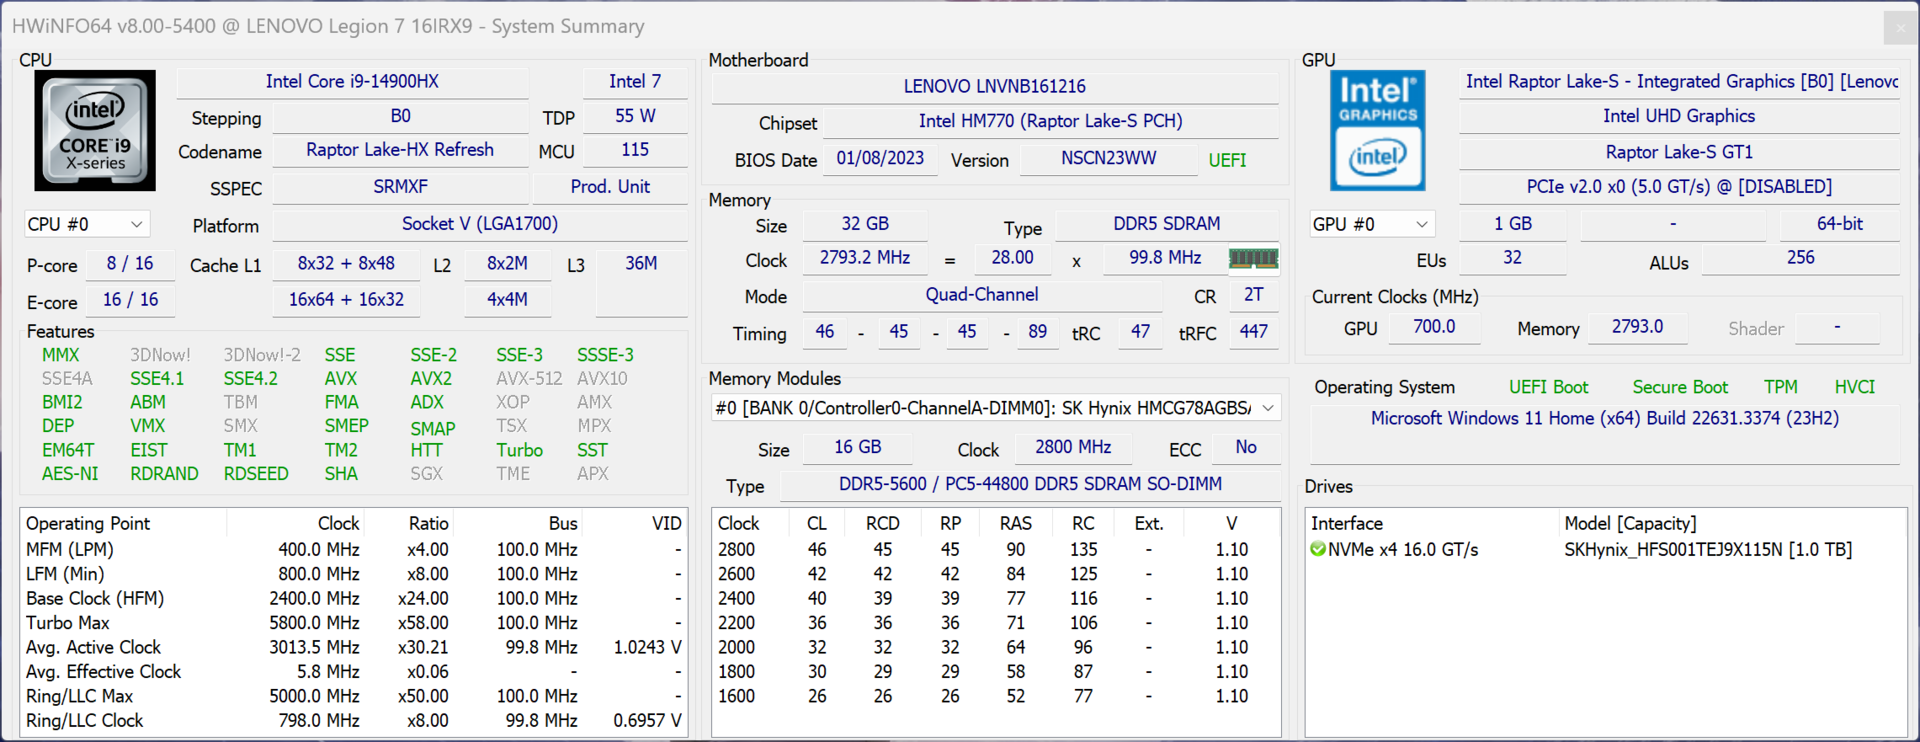
Wydajność - Raptor Lake HX i podkręcony laptop RTX 4070
Warunki testu
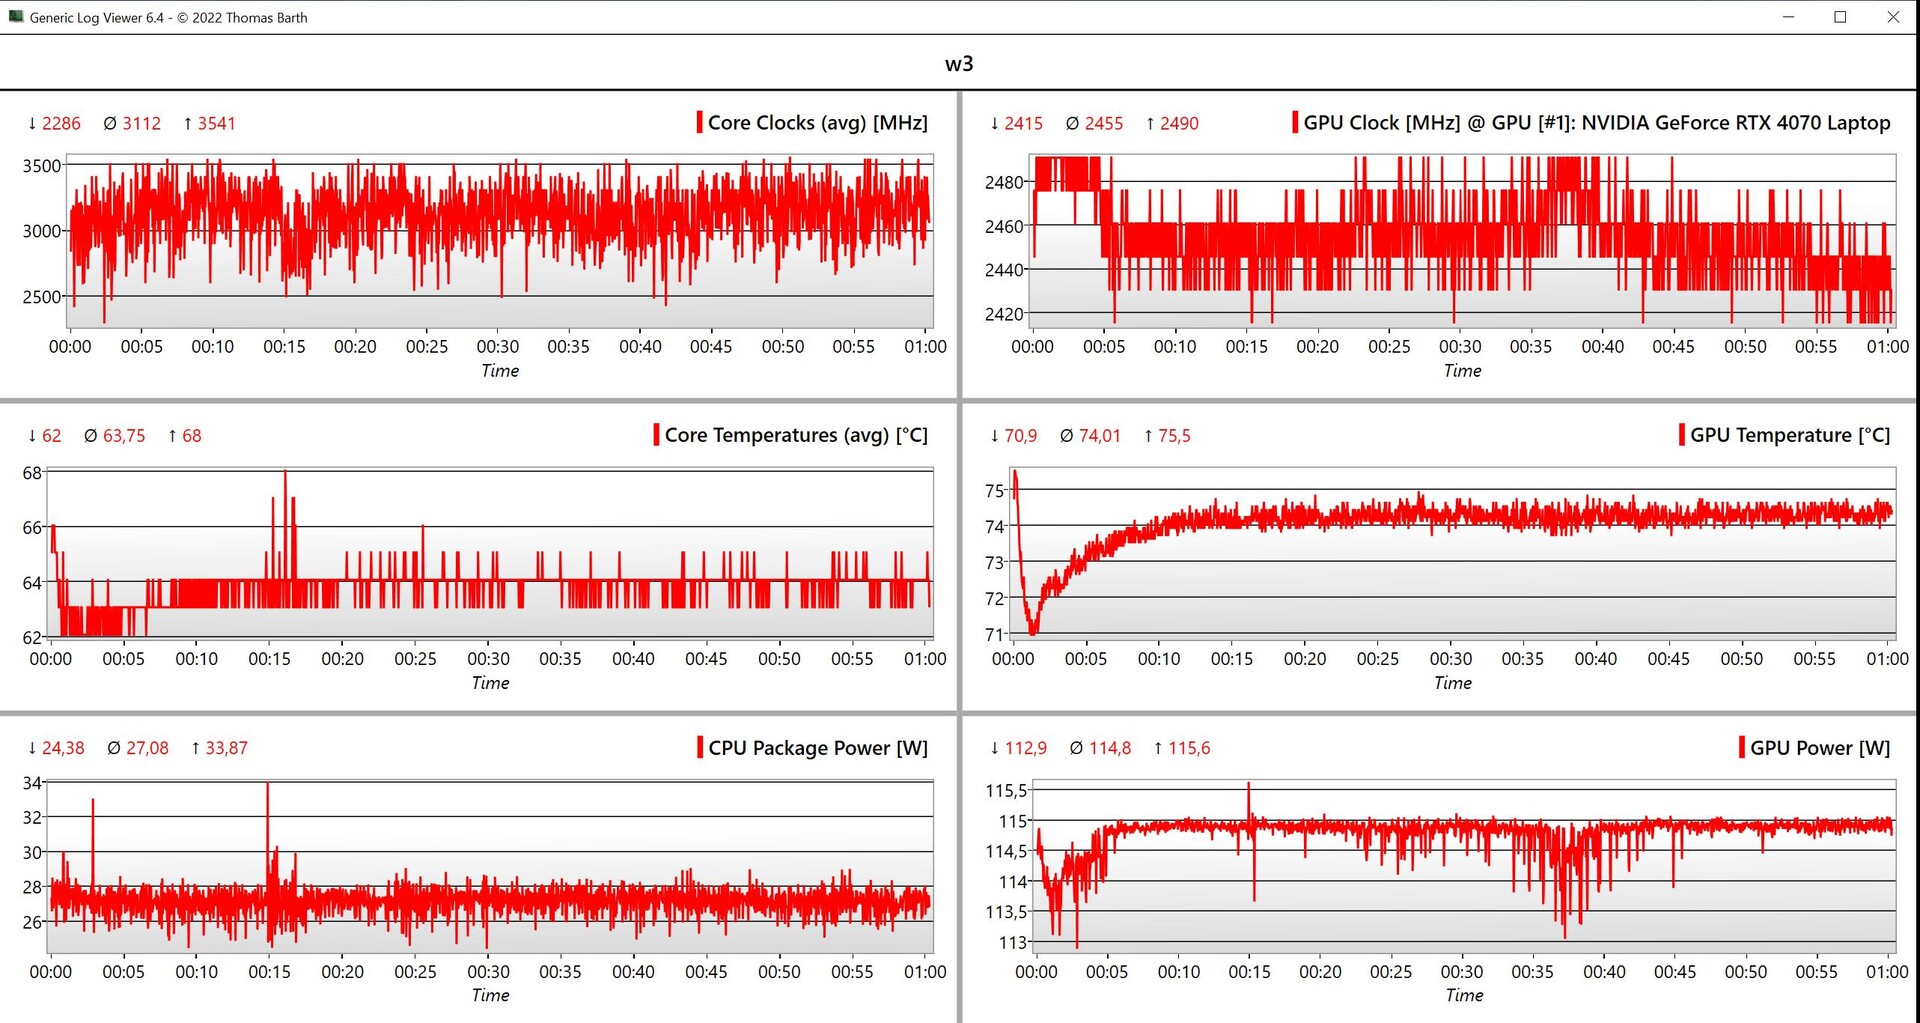
Jak zwykle, Lenovo oferuje różne profile energetyczne, a w poniższej tabeli zebraliśmy podsumowaną listę odpowiednich danych dotyczących wydajności. Bieżący profil jest również wyświetlany za pomocą diody LED przycisku zasilania. Testy porównawcze i pomiary przeprowadziliśmy w trybie wydajności, w którym procesor graficzny jest automatycznie lekko podkręcony (+100 MHz rdzeń, +200 MHz VRAM). Tryb wydajności jest niedostępny w trybie bateryjnym.
| Profil energetyczny | Obciążenie CPU | CB R23 Multi | Obciążenie GPU | Time Spy Grafika | Cyberpunk 2077 QHD Ultra |
maks. głośność wentylatora |
|---|---|---|---|---|---|---|
| Tryb cichy | 65 -> 54 W | 20 203 punktów | 65 W | 8 239 punktów | 35 FPS | 38,4 dB(A) |
| Zrównoważony | 120 -> 85 W | 24 142 punktów | 95 W | 9 853 punktów | 41,5 FPS | 50,7 dB(A) |
| Tryb wydajności | 154 -> 90 W | 31 127 punktów | 115 W | 12 174 punktów | 51,4 FPS | 54,1 dB(A) |
Uwaga: Bezskutecznie próbowaliśmy zaktualizować sterowniki Nvidia. Oficjalny sterownik zakończył instalację z problemem kompatybilności. Do tej pory samo Lenovo udostępniało jedynie preinstalowany sterownik 537.70 i to właśnie z niego nieuchronnie korzystaliśmy.
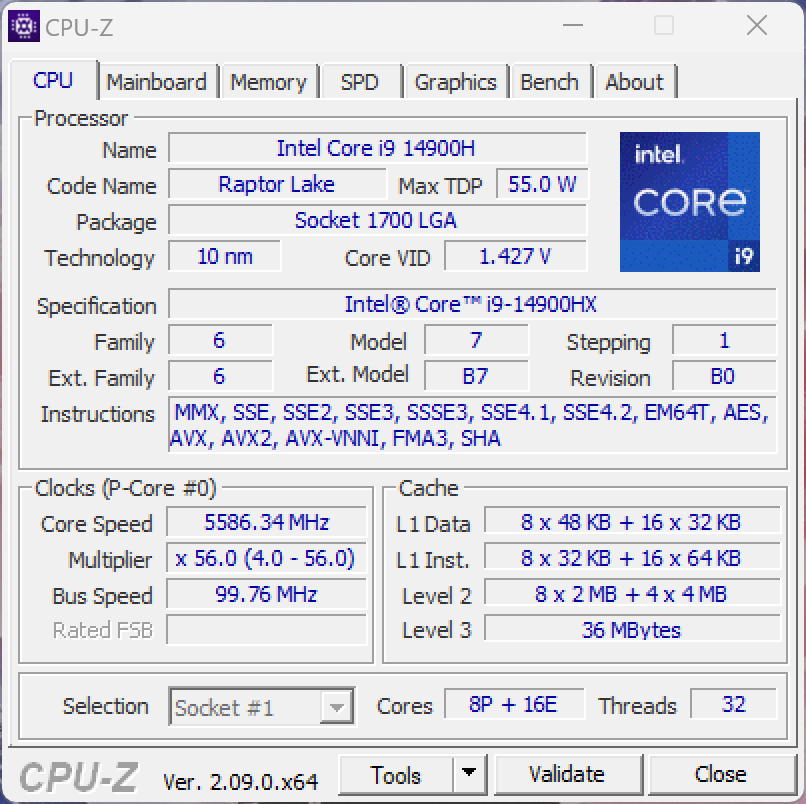
Procesor - Core i9-14900HX
Lenovo wyposażyło również zwykły Legion 7 16 w Core i9-14900HXnajszybszy mobilny procesor Raptor Lake, który można również znaleźć w droższym modelu Legion Pro 7. W porównaniu do obu grubszych modeli Legion Pro 7/5 16, smuklejsza obudowa ma wpływ na limity mocy, spadając do 90 watów po krótkotrwałym osiągnięciu 154 watów. Ogólnie rzecz biorąc, wydajność była wspaniała zarówno w testach wielordzeniowych, jak i jednordzeniowych. W trybie bateryjnym procesor może zużywać maksymalnie 60 watów, dlatego też wydajność wielordzeniowa jest tutaj o około 40% niższa. Dodatkowe testy porównawcze procesora można znaleźć w naszej sekcji technologicznej.
Cinebench R15 Multi Continuous Test
Cinebench R23: Multi Core | Single Core
Cinebench R20: CPU (Multi Core) | CPU (Single Core)
Cinebench R15: CPU Multi 64Bit | CPU Single 64Bit
Blender: v2.79 BMW27 CPU
7-Zip 18.03: 7z b 4 | 7z b 4 -mmt1
Geekbench 6.7: Multi-Core | Single-Core
Geekbench 5.5: Multi-Core | Single-Core
HWBOT x265 Benchmark v2.2: 4k Preset
LibreOffice : 20 Documents To PDF
R Benchmark 2.5: Overall mean
| CPU Performance rating | |
| Lenovo Legion Pro 7 16IRX9H | |
| Lenovo Legion 7 16 IRX G9 | |
| Lenovo Legion Pro 5 16IRX9 | |
| Aorus 16X 2024 | |
| Przeciętny Intel Core i9-14900HX | |
| Średnia w klasie Gaming | |
| HP Omen Transcend 16-u1095ng | |
| Alienware m16 R2 -1! | |
| Schenker XMG CORE 16 (L23) | |
| Cinebench R23 / Multi Core | |
| Lenovo Legion Pro 7 16IRX9H | |
| Lenovo Legion 7 16 IRX G9 | |
| Lenovo Legion Pro 5 16IRX9 | |
| Przeciętny Intel Core i9-14900HX (17078 - 36249, n=37) | |
| Aorus 16X 2024 | |
| Średnia w klasie Gaming (10488 - 40970, n=110, ostatnie 2 lata) | |
| HP Omen Transcend 16-u1095ng | |
| Alienware m16 R2 | |
| Schenker XMG CORE 16 (L23) | |
| Cinebench R23 / Single Core | |
| Lenovo Legion Pro 7 16IRX9H | |
| Lenovo Legion 7 16 IRX G9 | |
| Aorus 16X 2024 | |
| HP Omen Transcend 16-u1095ng | |
| Przeciętny Intel Core i9-14900HX (1720 - 2245, n=37) | |
| Lenovo Legion Pro 5 16IRX9 | |
| Średnia w klasie Gaming (1166 - 2356, n=110, ostatnie 2 lata) | |
| Schenker XMG CORE 16 (L23) | |
| Alienware m16 R2 | |
| Cinebench R20 / CPU (Multi Core) | |
| Lenovo Legion Pro 7 16IRX9H | |
| Lenovo Legion 7 16 IRX G9 | |
| Lenovo Legion Pro 5 16IRX9 | |
| Przeciętny Intel Core i9-14900HX (6579 - 13832, n=37) | |
| Aorus 16X 2024 | |
| Średnia w klasie Gaming (4029 - 16108, n=109, ostatnie 2 lata) | |
| HP Omen Transcend 16-u1095ng | |
| Alienware m16 R2 | |
| Schenker XMG CORE 16 (L23) | |
| Cinebench R20 / CPU (Single Core) | |
| Lenovo Legion 7 16 IRX G9 | |
| Aorus 16X 2024 | |
| HP Omen Transcend 16-u1095ng | |
| Lenovo Legion Pro 7 16IRX9H | |
| Przeciętny Intel Core i9-14900HX (657 - 859, n=37) | |
| Lenovo Legion Pro 5 16IRX9 | |
| Średnia w klasie Gaming (442 - 895, n=109, ostatnie 2 lata) | |
| Schenker XMG CORE 16 (L23) | |
| Alienware m16 R2 | |
| Cinebench R15 / CPU Multi 64Bit | |
| Lenovo Legion Pro 7 16IRX9H | |
| Lenovo Legion 7 16 IRX G9 | |
| Lenovo Legion Pro 5 16IRX9 | |
| Przeciętny Intel Core i9-14900HX (3263 - 5589, n=38) | |
| Aorus 16X 2024 | |
| Średnia w klasie Gaming (1578 - 6271, n=109, ostatnie 2 lata) | |
| HP Omen Transcend 16-u1095ng | |
| Alienware m16 R2 | |
| Schenker XMG CORE 16 (L23) | |
| Cinebench R15 / CPU Single 64Bit | |
| Lenovo Legion Pro 7 16IRX9H | |
| Aorus 16X 2024 | |
| Lenovo Legion 7 16 IRX G9 | |
| Przeciętny Intel Core i9-14900HX (247 - 323, n=37) | |
| Lenovo Legion Pro 5 16IRX9 | |
| HP Omen Transcend 16-u1095ng | |
| Średnia w klasie Gaming (188.8 - 343, n=109, ostatnie 2 lata) | |
| Schenker XMG CORE 16 (L23) | |
| Alienware m16 R2 | |
| Blender / v2.79 BMW27 CPU | |
| Schenker XMG CORE 16 (L23) | |
| HP Omen Transcend 16-u1095ng | |
| Średnia w klasie Gaming (80 - 330, n=107, ostatnie 2 lata) | |
| Aorus 16X 2024 | |
| Lenovo Legion 7 16 IRX G9 | |
| Przeciętny Intel Core i9-14900HX (91 - 206, n=37) | |
| Lenovo Legion Pro 5 16IRX9 | |
| Lenovo Legion Pro 7 16IRX9H | |
| 7-Zip 18.03 / 7z b 4 | |
| Lenovo Legion Pro 7 16IRX9H | |
| Lenovo Legion Pro 5 16IRX9 | |
| Przeciętny Intel Core i9-14900HX (66769 - 136645, n=37) | |
| Lenovo Legion 7 16 IRX G9 | |
| Aorus 16X 2024 | |
| Średnia w klasie Gaming (33491 - 148086, n=108, ostatnie 2 lata) | |
| HP Omen Transcend 16-u1095ng | |
| Schenker XMG CORE 16 (L23) | |
| Alienware m16 R2 | |
| 7-Zip 18.03 / 7z b 4 -mmt1 | |
| Lenovo Legion Pro 7 16IRX9H | |
| Aorus 16X 2024 | |
| Lenovo Legion 7 16 IRX G9 | |
| HP Omen Transcend 16-u1095ng | |
| Przeciętny Intel Core i9-14900HX (5452 - 7545, n=37) | |
| Lenovo Legion Pro 5 16IRX9 | |
| Schenker XMG CORE 16 (L23) | |
| Średnia w klasie Gaming (4199 - 7436, n=108, ostatnie 2 lata) | |
| Alienware m16 R2 | |
| Geekbench 6.7 / Multi-Core | |
| Lenovo Legion Pro 7 16IRX9H | |
| Lenovo Legion Pro 5 16IRX9 | |
| Lenovo Legion 7 16 IRX G9 | |
| Aorus 16X 2024 | |
| Przeciętny Intel Core i9-14900HX (13158 - 19665, n=37) | |
| HP Omen Transcend 16-u1095ng | |
| Średnia w klasie Gaming (6625 - 22104, n=109, ostatnie 2 lata) | |
| Schenker XMG CORE 16 (L23) | |
| Alienware m16 R2 | |
| Geekbench 6.7 / Single-Core | |
| Aorus 16X 2024 | |
| Lenovo Legion Pro 7 16IRX9H | |
| Lenovo Legion 7 16 IRX G9 | |
| Przeciętny Intel Core i9-14900HX (2419 - 3129, n=37) | |
| Lenovo Legion Pro 5 16IRX9 | |
| Średnia w klasie Gaming (1490 - 3259, n=109, ostatnie 2 lata) | |
| HP Omen Transcend 16-u1095ng | |
| Schenker XMG CORE 16 (L23) | |
| Alienware m16 R2 | |
| Geekbench 5.5 / Multi-Core | |
| Lenovo Legion Pro 5 16IRX9 | |
| Lenovo Legion Pro 7 16IRX9H | |
| Lenovo Legion 7 16 IRX G9 | |
| Aorus 16X 2024 | |
| Przeciętny Intel Core i9-14900HX (8618 - 23194, n=37) | |
| HP Omen Transcend 16-u1095ng | |
| Średnia w klasie Gaming (6460 - 27010, n=108, ostatnie 2 lata) | |
| Alienware m16 R2 | |
| Schenker XMG CORE 16 (L23) | |
| Geekbench 5.5 / Single-Core | |
| Aorus 16X 2024 | |
| Lenovo Legion Pro 7 16IRX9H | |
| Lenovo Legion 7 16 IRX G9 | |
| Przeciętny Intel Core i9-14900HX (1669 - 2210, n=37) | |
| HP Omen Transcend 16-u1095ng | |
| Średnia w klasie Gaming (986 - 2474, n=108, ostatnie 2 lata) | |
| Lenovo Legion Pro 5 16IRX9 | |
| Schenker XMG CORE 16 (L23) | |
| Alienware m16 R2 | |
| HWBOT x265 Benchmark v2.2 / 4k Preset | |
| Lenovo Legion Pro 7 16IRX9H | |
| Lenovo Legion Pro 5 16IRX9 | |
| Przeciętny Intel Core i9-14900HX (16.8 - 38.9, n=37) | |
| Lenovo Legion 7 16 IRX G9 | |
| Średnia w klasie Gaming (11.5 - 44.3, n=108, ostatnie 2 lata) | |
| Aorus 16X 2024 | |
| HP Omen Transcend 16-u1095ng | |
| Schenker XMG CORE 16 (L23) | |
| Alienware m16 R2 | |
| LibreOffice / 20 Documents To PDF | |
| Schenker XMG CORE 16 (L23) | |
| HP Omen Transcend 16-u1095ng | |
| Alienware m16 R2 | |
| Średnia w klasie Gaming (19 - 88.8, n=108, ostatnie 2 lata) | |
| Lenovo Legion 7 16 IRX G9 | |
| Przeciętny Intel Core i9-14900HX (19 - 85.1, n=37) | |
| Lenovo Legion Pro 5 16IRX9 | |
| Aorus 16X 2024 | |
| Lenovo Legion Pro 7 16IRX9H | |
| R Benchmark 2.5 / Overall mean | |
| Alienware m16 R2 | |
| Schenker XMG CORE 16 (L23) | |
| Średnia w klasie Gaming (0.3439 - 0.759, n=109, ostatnie 2 lata) | |
| HP Omen Transcend 16-u1095ng | |
| Lenovo Legion 7 16 IRX G9 | |
| Lenovo Legion Pro 5 16IRX9 | |
| Lenovo Legion Pro 7 16IRX9H | |
| Przeciętny Intel Core i9-14900HX (0.3604 - 0.4859, n=37) | |
| Aorus 16X 2024 | |
* ... im mniej tym lepiej
AIDA64: FP32 Ray-Trace | FPU Julia | CPU SHA3 | CPU Queen | FPU SinJulia | FPU Mandel | CPU AES | CPU ZLib | FP64 Ray-Trace | CPU PhotoWorxx
| Performance rating | |
| Lenovo Legion Pro 7 16IRX9H | |
| Lenovo Legion Pro 5 16IRX9 | |
| Średnia w klasie Gaming | |
| Przeciętny Intel Core i9-14900HX | |
| Aorus 16X 2024 | |
| Lenovo Legion 7 16 IRX G9 | |
| Schenker XMG CORE 16 (L23) | |
| HP Omen Transcend 16-u1095ng | |
| Alienware m16 R2 | |
| AIDA64 / FP32 Ray-Trace | |
| Średnia w klasie Gaming (10227 - 85542, n=107, ostatnie 2 lata) | |
| Lenovo Legion Pro 7 16IRX9H | |
| Schenker XMG CORE 16 (L23) | |
| Lenovo Legion 7 16 IRX G9 | |
| Lenovo Legion Pro 5 16IRX9 | |
| Przeciętny Intel Core i9-14900HX (13098 - 33474, n=36) | |
| Aorus 16X 2024 | |
| Alienware m16 R2 | |
| HP Omen Transcend 16-u1095ng | |
| AIDA64 / FPU Julia | |
| Lenovo Legion Pro 7 16IRX9H | |
| Średnia w klasie Gaming (51376 - 238426, n=107, ostatnie 2 lata) | |
| Lenovo Legion Pro 5 16IRX9 | |
| Przeciętny Intel Core i9-14900HX (67573 - 166040, n=36) | |
| Schenker XMG CORE 16 (L23) | |
| Lenovo Legion 7 16 IRX G9 | |
| Aorus 16X 2024 | |
| Alienware m16 R2 | |
| HP Omen Transcend 16-u1095ng | |
| AIDA64 / CPU SHA3 | |
| Lenovo Legion Pro 7 16IRX9H | |
| Lenovo Legion Pro 5 16IRX9 | |
| Średnia w klasie Gaming (2180 - 9817, n=107, ostatnie 2 lata) | |
| Przeciętny Intel Core i9-14900HX (3589 - 7979, n=36) | |
| Aorus 16X 2024 | |
| Lenovo Legion 7 16 IRX G9 | |
| Schenker XMG CORE 16 (L23) | |
| HP Omen Transcend 16-u1095ng | |
| Alienware m16 R2 | |
| AIDA64 / CPU Queen | |
| Lenovo Legion Pro 7 16IRX9H | |
| Lenovo Legion Pro 5 16IRX9 | |
| Lenovo Legion 7 16 IRX G9 | |
| Aorus 16X 2024 | |
| Przeciętny Intel Core i9-14900HX (118405 - 148966, n=36) | |
| HP Omen Transcend 16-u1095ng | |
| Średnia w klasie Gaming (49785 - 173351, n=98, ostatnie 2 lata) | |
| Schenker XMG CORE 16 (L23) | |
| Alienware m16 R2 | |
| AIDA64 / FPU SinJulia | |
| Lenovo Legion Pro 7 16IRX9H | |
| Lenovo Legion Pro 5 16IRX9 | |
| Przeciętny Intel Core i9-14900HX (10475 - 18517, n=36) | |
| Schenker XMG CORE 16 (L23) | |
| Aorus 16X 2024 | |
| Średnia w klasie Gaming (4424 - 33636, n=107, ostatnie 2 lata) | |
| Lenovo Legion 7 16 IRX G9 | |
| HP Omen Transcend 16-u1095ng | |
| Alienware m16 R2 | |
| AIDA64 / FPU Mandel | |
| Średnia w klasie Gaming (25115 - 128721, n=107, ostatnie 2 lata) | |
| Lenovo Legion Pro 7 16IRX9H | |
| Schenker XMG CORE 16 (L23) | |
| Lenovo Legion Pro 5 16IRX9 | |
| Przeciętny Intel Core i9-14900HX (32543 - 83662, n=36) | |
| Aorus 16X 2024 | |
| Alienware m16 R2 | |
| Lenovo Legion 7 16 IRX G9 | |
| HP Omen Transcend 16-u1095ng | |
| AIDA64 / CPU AES | |
| Przeciętny Intel Core i9-14900HX (86964 - 241777, n=36) | |
| Lenovo Legion Pro 7 16IRX9H | |
| Lenovo Legion Pro 5 16IRX9 | |
| Aorus 16X 2024 | |
| Lenovo Legion 7 16 IRX G9 | |
| Średnia w klasie Gaming (39258 - 247074, n=107, ostatnie 2 lata) | |
| Schenker XMG CORE 16 (L23) | |
| HP Omen Transcend 16-u1095ng | |
| Alienware m16 R2 | |
| AIDA64 / CPU ZLib | |
| Lenovo Legion Pro 7 16IRX9H | |
| Lenovo Legion Pro 5 16IRX9 | |
| Przeciętny Intel Core i9-14900HX (1054 - 2292, n=36) | |
| Aorus 16X 2024 | |
| Lenovo Legion 7 16 IRX G9 | |
| Średnia w klasie Gaming (574 - 2531, n=107, ostatnie 2 lata) | |
| HP Omen Transcend 16-u1095ng | |
| Alienware m16 R2 | |
| Schenker XMG CORE 16 (L23) | |
| AIDA64 / FP64 Ray-Trace | |
| Średnia w klasie Gaming (5509 - 45446, n=107, ostatnie 2 lata) | |
| Lenovo Legion Pro 7 16IRX9H | |
| Schenker XMG CORE 16 (L23) | |
| Lenovo Legion Pro 5 16IRX9 | |
| Przeciętny Intel Core i9-14900HX (6809 - 18349, n=36) | |
| Lenovo Legion 7 16 IRX G9 | |
| Aorus 16X 2024 | |
| Alienware m16 R2 | |
| HP Omen Transcend 16-u1095ng | |
| AIDA64 / CPU PhotoWorxx | |
| Lenovo Legion Pro 5 16IRX9 | |
| HP Omen Transcend 16-u1095ng | |
| Aorus 16X 2024 | |
| Lenovo Legion 7 16 IRX G9 | |
| Lenovo Legion Pro 7 16IRX9H | |
| Przeciętny Intel Core i9-14900HX (23903 - 54702, n=36) | |
| Średnia w klasie Gaming (12271 - 89891, n=107, ostatnie 2 lata) | |
| Schenker XMG CORE 16 (L23) | |
| Alienware m16 R2 | |
Wydajność systemu
Subiektywne wrażenia z wydajności są doskonałe, a benchmarki również nie wykazały żadnych problemów. Zdarzały się jedynie sporadyczne zacięcia podczas przełączania się między trybami graficznymi, na przykład podczas uruchamiania gry. To raczej norma w przypadku laptopów korzystających z Advanced Optimus.
CrossMark: Overall | Productivity | Creativity | Responsiveness
WebXPRT 3: Overall
WebXPRT 4: Overall
Mozilla Kraken 1.1: Total
| PCMark 10 / Score | |
| Lenovo Legion Pro 7 16IRX9H | |
| Lenovo Legion Pro 5 16IRX9 | |
| Aorus 16X 2024 | |
| Średnia w klasie Gaming (5828 - 11574, n=94, ostatnie 2 lata) | |
| Przeciętny Intel Core i9-14900HX, NVIDIA GeForce RTX 4070 Laptop GPU (7768 - 8550, n=8) | |
| Schenker XMG CORE 16 (L23) | |
| Lenovo Legion 7 16 IRX G9 | |
| HP Omen Transcend 16-u1095ng | |
| Alienware m16 R2 | |
| PCMark 10 / Essentials | |
| Lenovo Legion Pro 7 16IRX9H | |
| Lenovo Legion Pro 5 16IRX9 | |
| Aorus 16X 2024 | |
| Lenovo Legion 7 16 IRX G9 | |
| Schenker XMG CORE 16 (L23) | |
| Przeciętny Intel Core i9-14900HX, NVIDIA GeForce RTX 4070 Laptop GPU (10104 - 11815, n=8) | |
| Średnia w klasie Gaming (8810 - 12600, n=98, ostatnie 2 lata) | |
| HP Omen Transcend 16-u1095ng | |
| Alienware m16 R2 | |
| PCMark 10 / Productivity | |
| Lenovo Legion Pro 7 16IRX9H | |
| Aorus 16X 2024 | |
| Średnia w klasie Gaming (6845 - 18766, n=96, ostatnie 2 lata) | |
| Schenker XMG CORE 16 (L23) | |
| Przeciętny Intel Core i9-14900HX, NVIDIA GeForce RTX 4070 Laptop GPU (9577 - 11103, n=8) | |
| HP Omen Transcend 16-u1095ng | |
| Lenovo Legion Pro 5 16IRX9 | |
| Lenovo Legion 7 16 IRX G9 | |
| Alienware m16 R2 | |
| PCMark 10 / Digital Content Creation | |
| Lenovo Legion Pro 5 16IRX9 | |
| Lenovo Legion Pro 7 16IRX9H | |
| Średnia w klasie Gaming (7602 - 19657, n=96, ostatnie 2 lata) | |
| Lenovo Legion 7 16 IRX G9 | |
| Przeciętny Intel Core i9-14900HX, NVIDIA GeForce RTX 4070 Laptop GPU (12114 - 14827, n=8) | |
| Aorus 16X 2024 | |
| Alienware m16 R2 | |
| Schenker XMG CORE 16 (L23) | |
| HP Omen Transcend 16-u1095ng | |
| CrossMark / Overall | |
| Lenovo Legion Pro 7 16IRX9H | |
| Aorus 16X 2024 | |
| Lenovo Legion 7 16 IRX G9 | |
| Przeciętny Intel Core i9-14900HX, NVIDIA GeForce RTX 4070 Laptop GPU (2002 - 2312, n=7) | |
| Lenovo Legion Pro 5 16IRX9 | |
| Średnia w klasie Gaming (1366 - 2409, n=96, ostatnie 2 lata) | |
| Alienware m16 R2 | |
| Schenker XMG CORE 16 (L23) | |
| CrossMark / Productivity | |
| Lenovo Legion Pro 7 16IRX9H | |
| Aorus 16X 2024 | |
| Lenovo Legion 7 16 IRX G9 | |
| Przeciętny Intel Core i9-14900HX, NVIDIA GeForce RTX 4070 Laptop GPU (1827 - 2191, n=7) | |
| Średnia w klasie Gaming (1386 - 2254, n=96, ostatnie 2 lata) | |
| Lenovo Legion Pro 5 16IRX9 | |
| Alienware m16 R2 | |
| Schenker XMG CORE 16 (L23) | |
| CrossMark / Creativity | |
| Lenovo Legion Pro 7 16IRX9H | |
| Aorus 16X 2024 | |
| Lenovo Legion 7 16 IRX G9 | |
| Przeciętny Intel Core i9-14900HX, NVIDIA GeForce RTX 4070 Laptop GPU (2258 - 2458, n=7) | |
| Lenovo Legion Pro 5 16IRX9 | |
| Średnia w klasie Gaming (1343 - 2729, n=96, ostatnie 2 lata) | |
| Alienware m16 R2 | |
| Schenker XMG CORE 16 (L23) | |
| CrossMark / Responsiveness | |
| Lenovo Legion 7 16 IRX G9 | |
| Aorus 16X 2024 | |
| Lenovo Legion Pro 7 16IRX9H | |
| Przeciętny Intel Core i9-14900HX, NVIDIA GeForce RTX 4070 Laptop GPU (1734 - 2330, n=7) | |
| Lenovo Legion Pro 5 16IRX9 | |
| Średnia w klasie Gaming (1226 - 2334, n=96, ostatnie 2 lata) | |
| Alienware m16 R2 | |
| Schenker XMG CORE 16 (L23) | |
| WebXPRT 3 / Overall | |
| Lenovo Legion Pro 7 16IRX9H | |
| HP Omen Transcend 16-u1095ng | |
| Lenovo Legion 7 16 IRX G9 | |
| Aorus 16X 2024 | |
| Lenovo Legion Pro 5 16IRX9 | |
| Przeciętny Intel Core i9-14900HX, NVIDIA GeForce RTX 4070 Laptop GPU (269 - 342, n=8) | |
| Średnia w klasie Gaming (242 - 532, n=99, ostatnie 2 lata) | |
| Alienware m16 R2 | |
| Schenker XMG CORE 16 (L23) | |
| WebXPRT 4 / Overall | |
| Lenovo Legion Pro 7 16IRX9H | |
| Przeciętny Intel Core i9-14900HX, NVIDIA GeForce RTX 4070 Laptop GPU (291 - 304, n=6) | |
| Lenovo Legion 7 16 IRX G9 | |
| Lenovo Legion Pro 5 16IRX9 | |
| Średnia w klasie Gaming (176.4 - 354, n=99, ostatnie 2 lata) | |
| Alienware m16 R2 | |
| Mozilla Kraken 1.1 / Total | |
| Alienware m16 R2 | |
| Schenker XMG CORE 16 (L23) | |
| Średnia w klasie Gaming (391 - 590, n=104, ostatnie 2 lata) | |
| Lenovo Legion Pro 5 16IRX9 | |
| Przeciętny Intel Core i9-14900HX, NVIDIA GeForce RTX 4070 Laptop GPU (431 - 469, n=8) | |
| Lenovo Legion 7 16 IRX G9 | |
| Lenovo Legion Pro 7 16IRX9H | |
| HP Omen Transcend 16-u1095ng | |
| Aorus 16X 2024 | |
* ... im mniej tym lepiej
| PCMark 10 Score | 8023 pkt. | |
Pomoc | ||
| AIDA64 / Memory Copy | |
| Lenovo Legion Pro 5 16IRX9 | |
| Lenovo Legion 7 16 IRX G9 | |
| Aorus 16X 2024 | |
| Lenovo Legion Pro 7 16IRX9H | |
| HP Omen Transcend 16-u1095ng | |
| Przeciętny Intel Core i9-14900HX (38028 - 83392, n=36) | |
| Średnia w klasie Gaming (21750 - 129946, n=107, ostatnie 2 lata) | |
| Schenker XMG CORE 16 (L23) | |
| Alienware m16 R2 | |
| AIDA64 / Memory Read | |
| Aorus 16X 2024 | |
| Lenovo Legion Pro 5 16IRX9 | |
| Lenovo Legion Pro 7 16IRX9H | |
| Lenovo Legion 7 16 IRX G9 | |
| HP Omen Transcend 16-u1095ng | |
| Przeciętny Intel Core i9-14900HX (43306 - 87568, n=36) | |
| Alienware m16 R2 | |
| Średnia w klasie Gaming (22956 - 118858, n=107, ostatnie 2 lata) | |
| Schenker XMG CORE 16 (L23) | |
| AIDA64 / Memory Write | |
| Schenker XMG CORE 16 (L23) | |
| HP Omen Transcend 16-u1095ng | |
| Aorus 16X 2024 | |
| Lenovo Legion Pro 5 16IRX9 | |
| Średnia w klasie Gaming (22297 - 135096, n=107, ostatnie 2 lata) | |
| Lenovo Legion 7 16 IRX G9 | |
| Przeciętny Intel Core i9-14900HX (37146 - 80589, n=36) | |
| Lenovo Legion Pro 7 16IRX9H | |
| Alienware m16 R2 | |
| AIDA64 / Memory Latency | |
| Alienware m16 R2 | |
| Średnia w klasie Gaming (75.3 - 259, n=107, ostatnie 2 lata) | |
| Schenker XMG CORE 16 (L23) | |
| HP Omen Transcend 16-u1095ng | |
| Przeciętny Intel Core i9-14900HX (76.1 - 105, n=36) | |
| Lenovo Legion 7 16 IRX G9 | |
| Lenovo Legion Pro 5 16IRX9 | |
| Aorus 16X 2024 | |
| Lenovo Legion Pro 7 16IRX9H | |
* ... im mniej tym lepiej
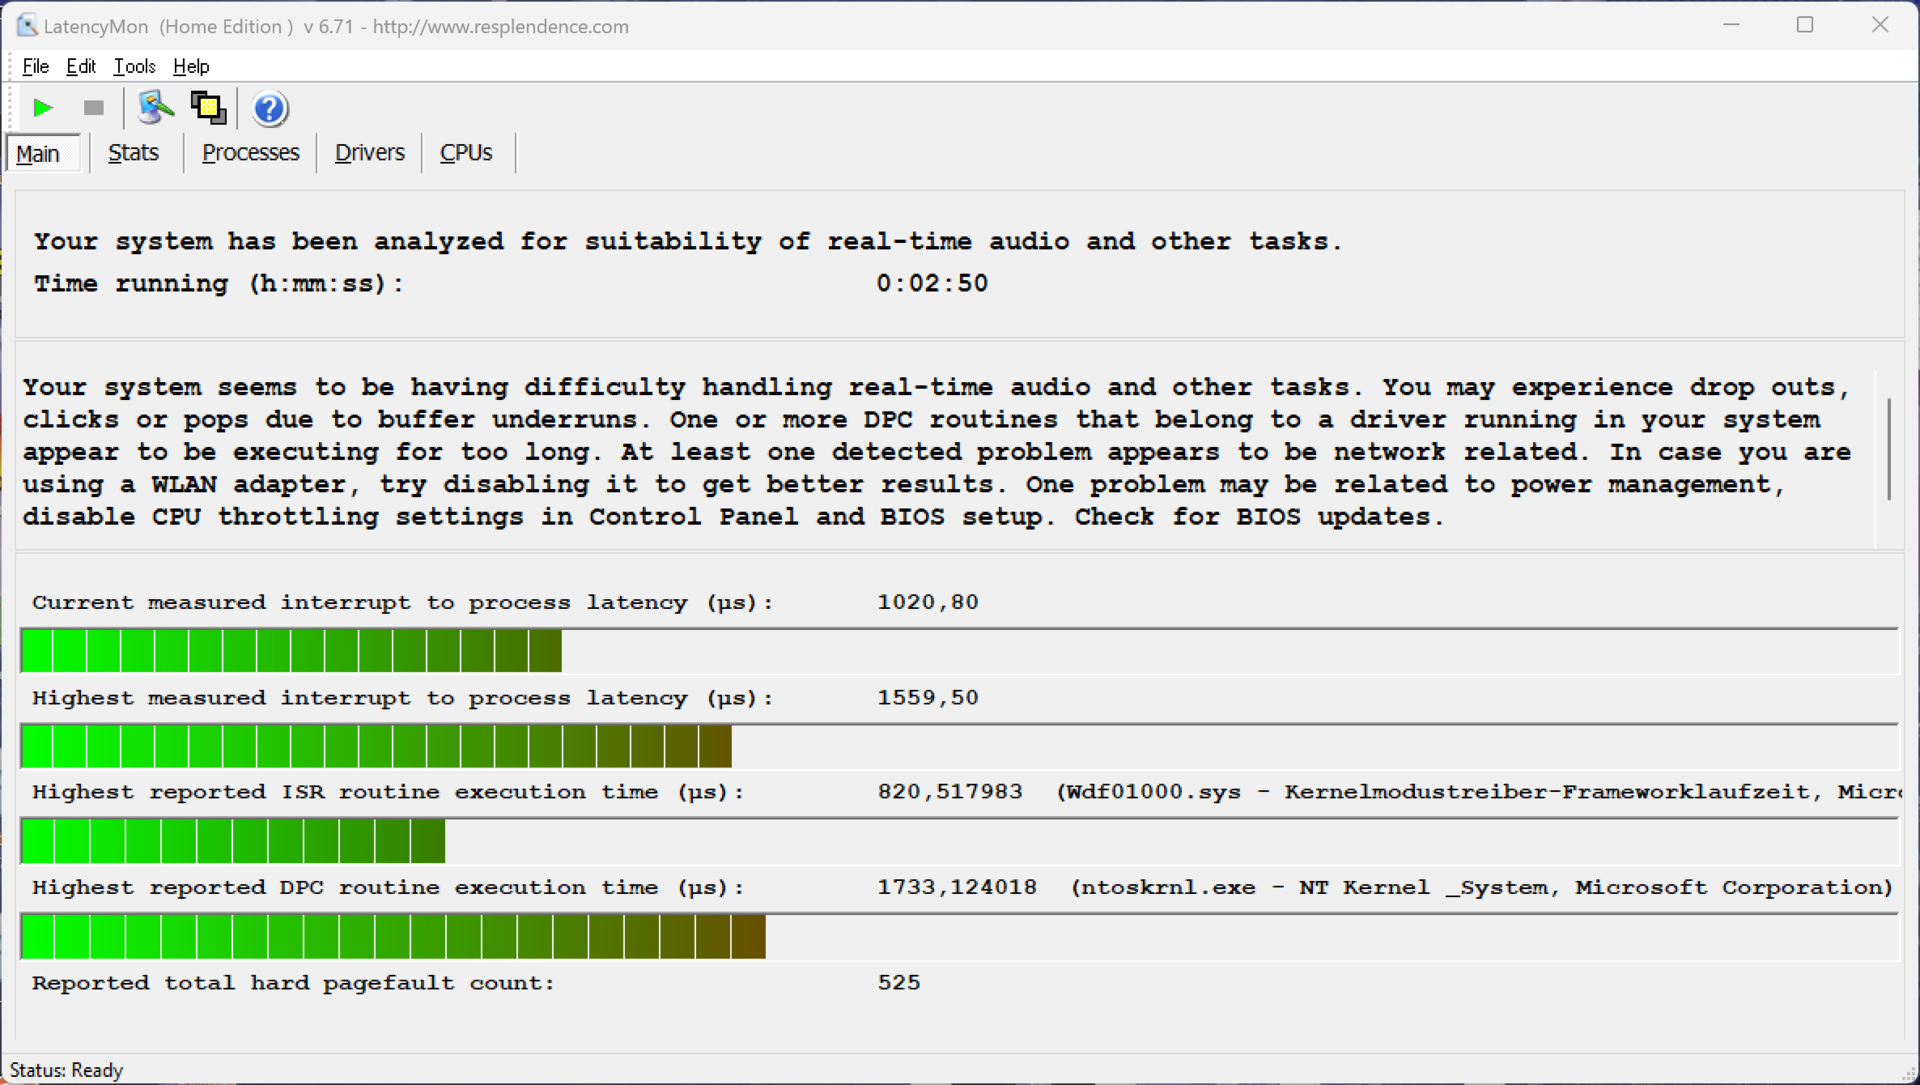
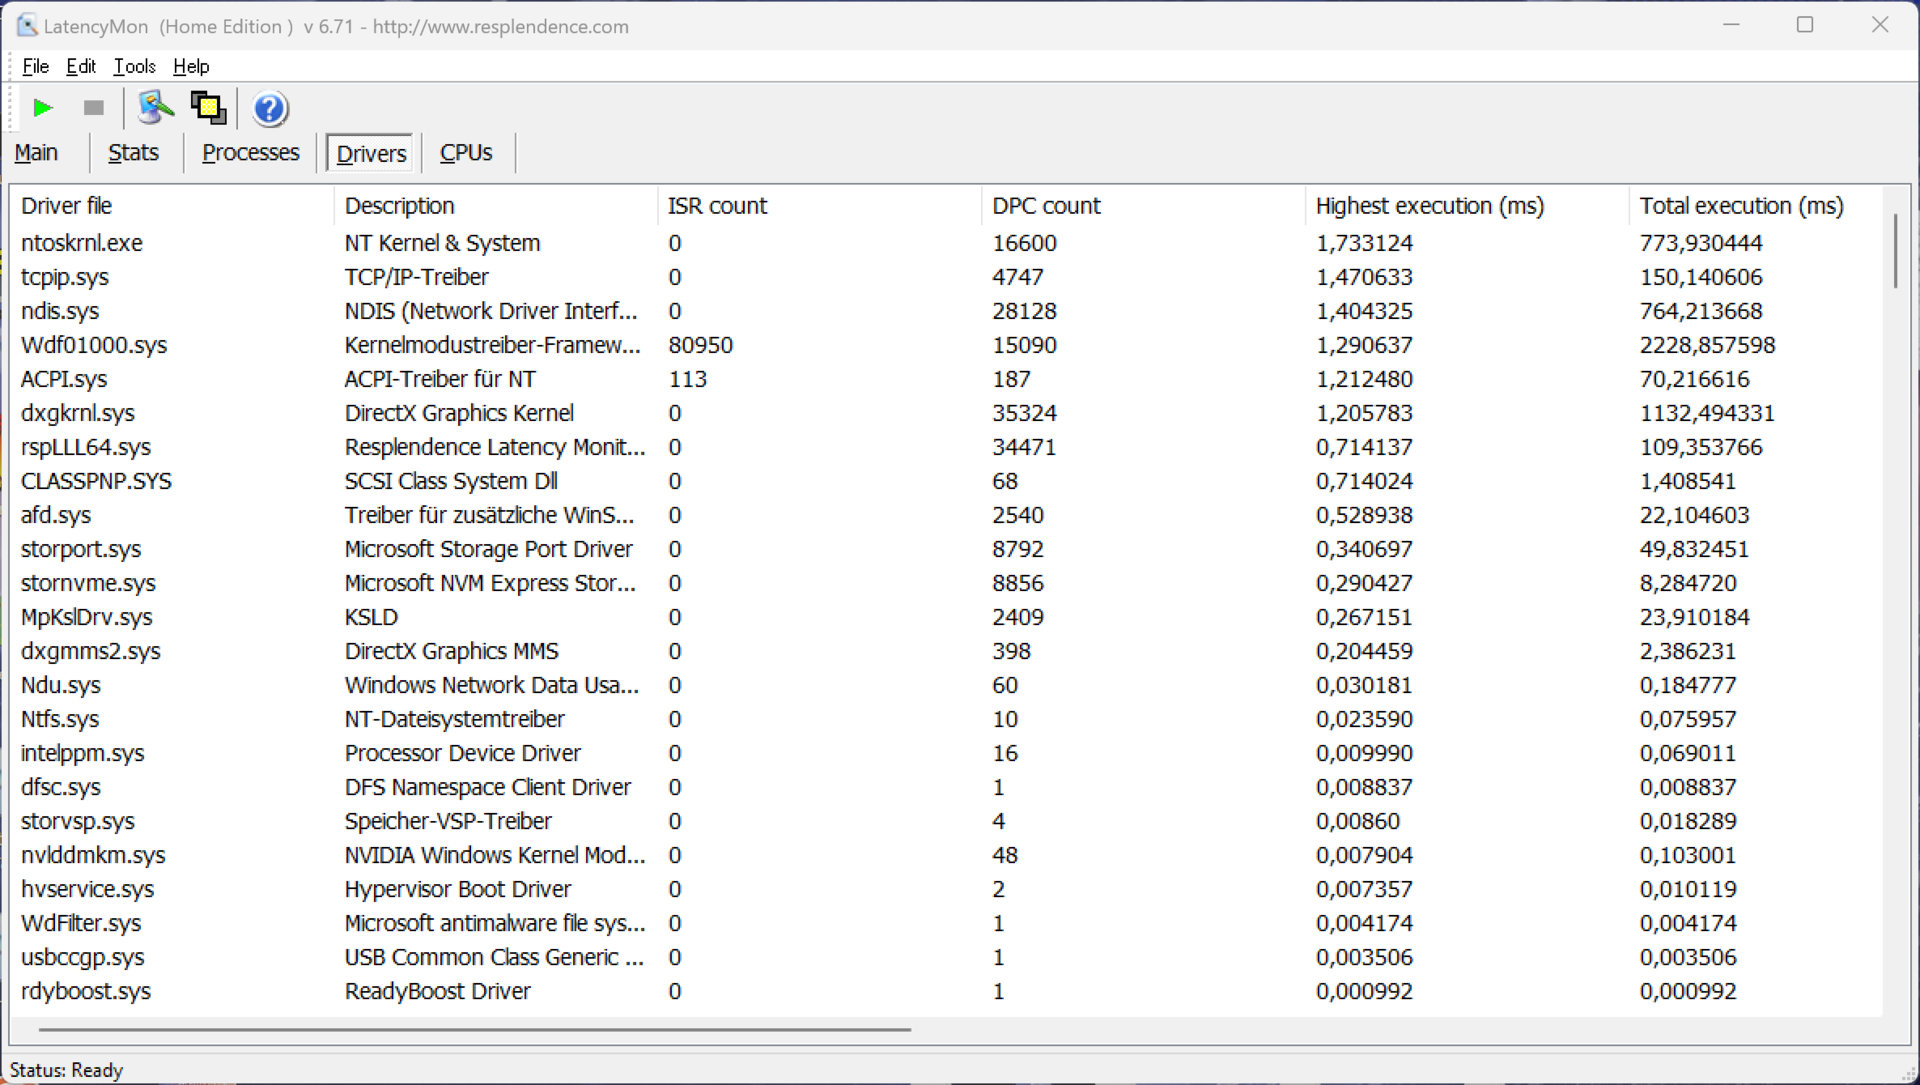
Opóźnienia DPC
W naszym standardowym teście opóźnień (surfowanie po Internecie, odtwarzanie YouTube w 4K, obciążenie procesora) przy użyciu aktualnej wersji BIOS-u, recenzowane urządzenie wykazało pewne ograniczenia, jeśli chodzi o korzystanie z aplikacji audio w czasie rzeczywistym.
| DPC Latencies / LatencyMon - interrupt to process latency (max), Web, Youtube, Prime95 | |
| Alienware m16 R2 | |
| HP Omen Transcend 16-u1095ng | |
| Lenovo Legion 7 16 IRX G9 | |
| Lenovo Legion Pro 7 16IRX9H | |
| Aorus 16X 2024 | |
| Lenovo Legion Pro 5 16IRX9 | |
| Schenker XMG CORE 16 (L23) | |
* ... im mniej tym lepiej
Pamięć masowa
W recenzowanym urządzeniu Lenovo zainstalowało dysk SSD SK Hynix 1 TB PCIe 4.0, ale po pierwszym uruchomieniu do dyspozycji użytkownika jest 877 GB. Przy prędkości do 7 GB/s, prędkość transferu jest bardzo wysoka i ogólnie rzecz biorąc, dysk SSD jest odrobinę szybszy niż konkurencja. Jednakże, chociaż wydajność nie zawsze pozostaje stabilna przy stałym obciążeniu, nie jest to coś, co można zauważyć w codziennych sytuacjach. Dodatkowe testy porównawcze SSD są wymienione tutaj.

* ... im mniej tym lepiej
Continuous Performance Read: DiskSpd Read Loop, Queue Depth 8
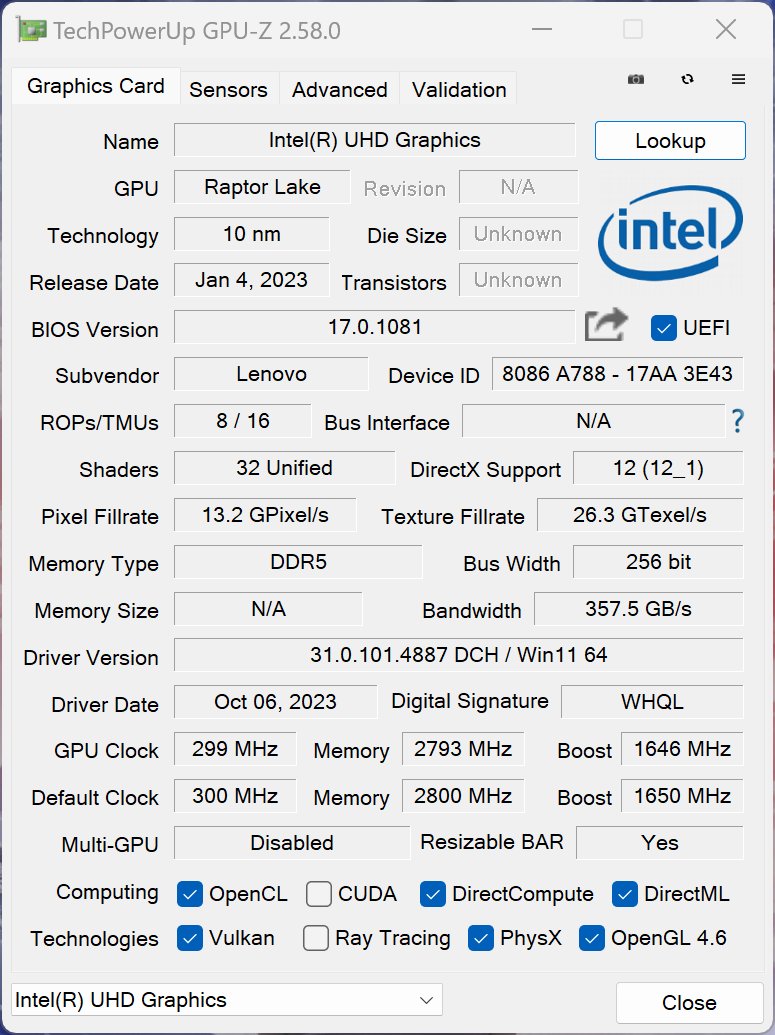
Karta graficzna - GeForce RTX 4070 laptop
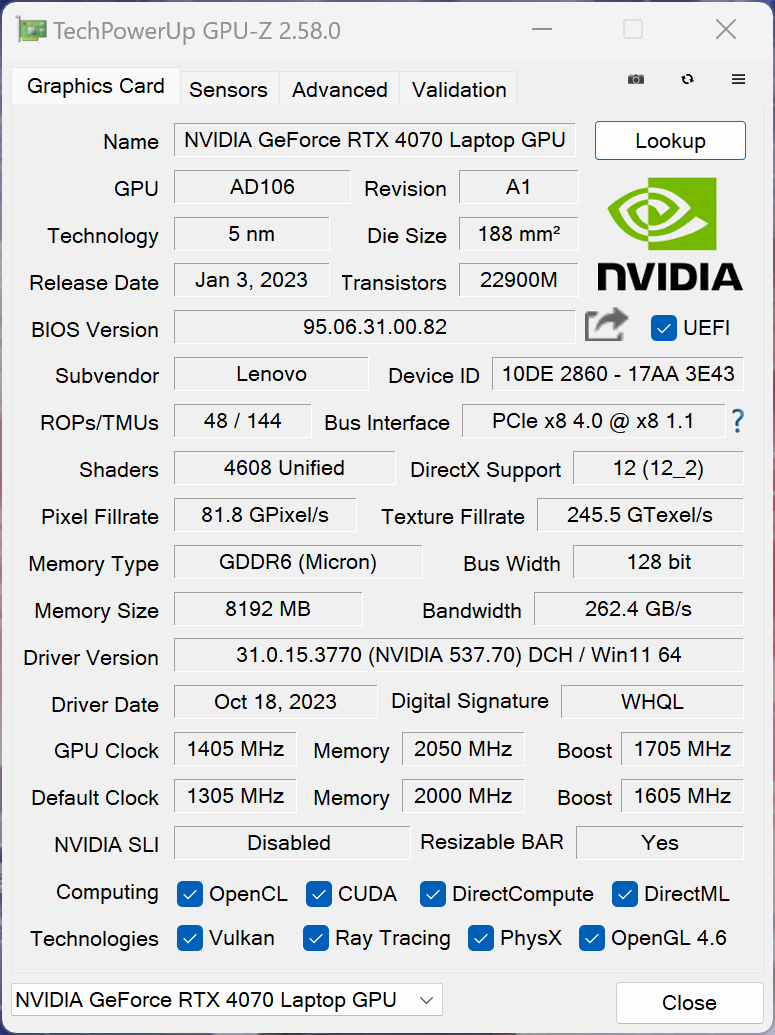
Nasze urządzenie do recenzji jest wyposażone w RTX 4070 laptop choć w rzeczywistości mamy do czynienia z wersją 115-watową. Co więcej, w trybie wydajności GPU jest lekko podkręcony. W syntetycznych testach porównawczych, wyposażony w 140-watowy wariant, Legion 7 16 pozostaje nieco w tyle za konkurencją. Jak się jednak zaraz przekonamy, nie ma to znaczenia w przypadku benchmarków gamingowych, ponieważ laptop z RTX 4070 i tak nie jest w stanie zużyć pełnych 140 watów. Legion obsługuje przełącznik graficzny Advanced Optimus.
Pod długotrwałym obciążeniem GPU pozostaje całkowicie stabilny, a w trybie bateryjnym pobór mocy jest ograniczony do 50 watów. Dlatego też wydajność jest tutaj o około 35% niższa. Dodatkowe testy porównawcze GPU są wymienione tutaj.
| 3DMark 11 Performance | 35070 pkt. | |
| 3DMark Fire Strike Score | 25692 pkt. | |
| 3DMark Time Spy Score | 12844 pkt. | |
Pomoc | ||
| Blender / v3.3 Classroom OPTIX/RTX | |
| HP Omen Transcend 16-u1095ng | |
| Przeciętny NVIDIA GeForce RTX 4070 Laptop GPU (18 - 30, n=68) | |
| Schenker XMG CORE 16 (L23) | |
| Alienware m16 R2 | |
| Aorus 16X 2024 | |
| Lenovo Legion 7 16 IRX G9 | |
| Lenovo Legion Pro 5 16IRX9 | |
| Średnia w klasie Gaming (9 - 32, n=109, ostatnie 2 lata) | |
| Lenovo Legion Pro 7 16IRX9H | |
| Blender / v3.3 Classroom CUDA | |
| HP Omen Transcend 16-u1095ng | |
| Przeciętny NVIDIA GeForce RTX 4070 Laptop GPU (32 - 50, n=67) | |
| Alienware m16 R2 | |
| Średnia w klasie Gaming (15 - 228, n=109, ostatnie 2 lata) | |
| Schenker XMG CORE 16 (L23) | |
| Lenovo Legion Pro 5 16IRX9 | |
| Aorus 16X 2024 | |
| Lenovo Legion 7 16 IRX G9 | |
| Lenovo Legion Pro 7 16IRX9H | |
| Blender / v3.3 Classroom CPU | |
| Schenker XMG CORE 16 (L23) | |
| HP Omen Transcend 16-u1095ng | |
| Alienware m16 R2 | |
| Przeciętny NVIDIA GeForce RTX 4070 Laptop GPU (158 - 440, n=67) | |
| Średnia w klasie Gaming (122 - 565, n=105, ostatnie 2 lata) | |
| Aorus 16X 2024 | |
| Lenovo Legion 7 16 IRX G9 | |
| Lenovo Legion Pro 5 16IRX9 | |
| Lenovo Legion Pro 7 16IRX9H | |
* ... im mniej tym lepiej
Wydajność w grach
Wydajność Legion 7 16 w grach jest bardzo dobra i wszystkie nowoczesne tytuły mogą być płynnie odtwarzane w rozdzielczości QHD i maksymalnych szczegółach. Nawet w natywnej rozdzielczości wydajność powinna być wystarczająca, a w razie potrzeby można aktywować skalowanie DLSS. W testach porównawczych w grach, recenzowane urządzenie uzyskało nieco lepsze wyniki niż w testach syntetycznych, a wydajność pozostała całkowicie stabilna nawet podczas dłuższych sesji grania. Dodatkowe testy porównawcze gier można znaleźć tutaj.
| The Witcher 3 - 1920x1080 Ultra Graphics & Postprocessing (HBAO+) | |
| Lenovo Legion Pro 7 16IRX9H | |
| Średnia w klasie Gaming (95 - 240, n=8, ostatnie 2 lata) | |
| Lenovo Legion Pro 5 16IRX9 | |
| Aorus 16X 2024 | |
| Alienware m16 R2 | |
| Schenker XMG CORE 16 (L23) | |
| HP Omen Transcend 16-u1095ng | |
| Lenovo Legion 7 16 IRX G9 | |
| Final Fantasy XV Benchmark - 1920x1080 High Quality | |
| Lenovo Legion Pro 7 16IRX9H | |
| Średnia w klasie Gaming (41 - 215, n=101, ostatnie 2 lata) | |
| Lenovo Legion Pro 5 16IRX9 | |
| Schenker XMG CORE 16 (L23) | |
| Lenovo Legion 7 16 IRX G9 | |
| Alienware m16 R2 | |
| Aorus 16X 2024 | |
| HP Omen Transcend 16-u1095ng | |
| Horizon Forbidden West | |
| 1920x1080 Very High Preset AA:T | |
| Lenovo Legion Pro 7 16IRX9H | |
| Średnia w klasie Gaming (14.7 - 140.3, n=13, ostatnie 2 lata) | |
| Aorus 16X 2024 | |
| Lenovo Legion 7 16 IRX G9 | |
| Przeciętny NVIDIA GeForce RTX 4070 Laptop GPU (53.2 - 76.7, n=10) | |
| 2560x1440 Very High Preset AA:T | |
| Lenovo Legion Pro 7 16IRX9H | |
| Średnia w klasie Gaming (39.6 - 100.9, n=10, ostatnie 2 lata) | |
| Aorus 16X 2024 | |
| Przeciętny NVIDIA GeForce RTX 4070 Laptop GPU (40.3 - 59.1, n=9) | |
| Lenovo Legion 7 16 IRX G9 | |
Witcher 3 FPS diagram
| low | med. | high | ultra | QHD | |
|---|---|---|---|---|---|
| GTA V (2015) | 182.4 | 124.1 | 94.2 | ||
| The Witcher 3 (2015) | 246 | 113.1 | 92 | ||
| Dota 2 Reborn (2015) | 230 | 205 | 193.4 | 179.5 | |
| Final Fantasy XV Benchmark (2018) | 223 | 166.8 | 119.8 | 89.1 | |
| X-Plane 11.11 (2018) | 198 | 180.6 | 138.2 | ||
| Far Cry 5 (2018) | 193 | 166 | 157 | 146 | 115 |
| Strange Brigade (2018) | 436 | 311 | 250 | 220 | 143 |
| F1 23 (2023) | 287 | 284 | 222 | 70.1 | 43.9 |
| Baldur's Gate 3 (2023) | 155.6 | 127.9 | 115.7 | 115 | 71.9 |
| Cyberpunk 2077 (2023) | 129.7 | 117.1 | 99.6 | 85.2 | 51.4 |
| Horizon Forbidden West (2024) | 107.1 | 103.4 | 73.2 | 64.4 | 49.9 |
Emisje - Głośne, ale skuteczne chłodzenie
Emisja hałasu
Jeśli chodzi o proste zadania, chłodzenie Legion 7 16 często pozostaje wyłączone, nawet w trybie wydajności, a w codziennych sytuacjach można śmiało przejść do trybu cichego, aby zminimalizować hałas wentylatora. Przy maksymalnym natężeniu 38,4 dB(A) w trybie cichym nadal można grać bez słuchawek, jednak w obu pozostałych trybach 50 i 54 dB(A) są zbyt głośne. Pomimo tego, zarówno Legion Pro 5 i Legion Pro 7 są nawet nieco głośniejsze. Po okresach obciążenia wentylatory również szybko zmniejszają swoją prędkość. Żadne inne elektroniczne odgłosy nie były obecne w recenzowanym urządzeniu.
Hałas
| luz |
| 24.5 / 24.5 / 24.5 dB |
| obciążenie |
| 34.8 / 54.1 dB |
 | ||
30 dB cichy 40 dB(A) słyszalny 50 dB(A) irytujący |
||
min: | ||
| Lenovo Legion 7 16 IRX G9 GeForce RTX 4070 Laptop GPU, i9-14900HX, SK Hynix HFS001TEJ9X115N | Lenovo Legion Pro 5 16IRX9 GeForce RTX 4070 Laptop GPU, i9-14900HX, Samsung PM9A1 MZVL21T0HCLR | Aorus 16X 2024 GeForce RTX 4070 Laptop GPU, i9-14900HX, Gigabyte AG450E1024-SI | HP Omen Transcend 16-u1095ng GeForce RTX 4070 Laptop GPU, i9-14900HX, Kioxia XG8 KXG80ZNV1T02 | Alienware m16 R2 GeForce RTX 4070 Laptop GPU, Ultra 7 155H, Samsung PM9A1 MZVL21T0HCLR | Schenker XMG CORE 16 (L23) GeForce RTX 4070 Laptop GPU, R7 7840HS, Samsung 990 Pro 1 TB | Lenovo Legion Pro 7 16IRX9H GeForce RTX 4080 Laptop GPU, i9-14900HX, SK Hynix HFS001TEJ9X115N | |
|---|---|---|---|---|---|---|---|
| Noise | -6% | -21% | -9% | -2% | -1% | -22% | |
| wyłączone / środowisko * (dB) | 24.5 | 23.9 2% | 26 -6% | 24 2% | 24.7 -1% | 23 6% | 24 2% |
| Idle Minimum * (dB) | 24.5 | 24.3 1% | 26 -6% | 29 -18% | 25.3 -3% | 23 6% | 25 -2% |
| Idle Average * (dB) | 24.5 | 24.3 1% | 32 -31% | 30 -22% | 25.3 -3% | 28.48 -16% | 30 -22% |
| Idle Maximum * (dB) | 24.5 | 28.9 -18% | 38 -55% | 31 -27% | 25.3 -3% | 28.48 -16% | 45 -84% |
| Load Average * (dB) | 34.8 | 45.8 -32% | 54 -55% | 45 -29% | 31.7 9% | 30 14% | 50 -44% |
| Witcher 3 ultra * (dB) | 54.1 | 51 6% | 50 8% | 44 19% | 53.8 1% | 54.12 -0% | 54 -0% |
| Load Maximum * (dB) | 54.1 | 56.6 -5% | 55 -2% | 47 13% | 62 -15% | 54.12 -0% | 56 -4% |
* ... im mniej tym lepiej
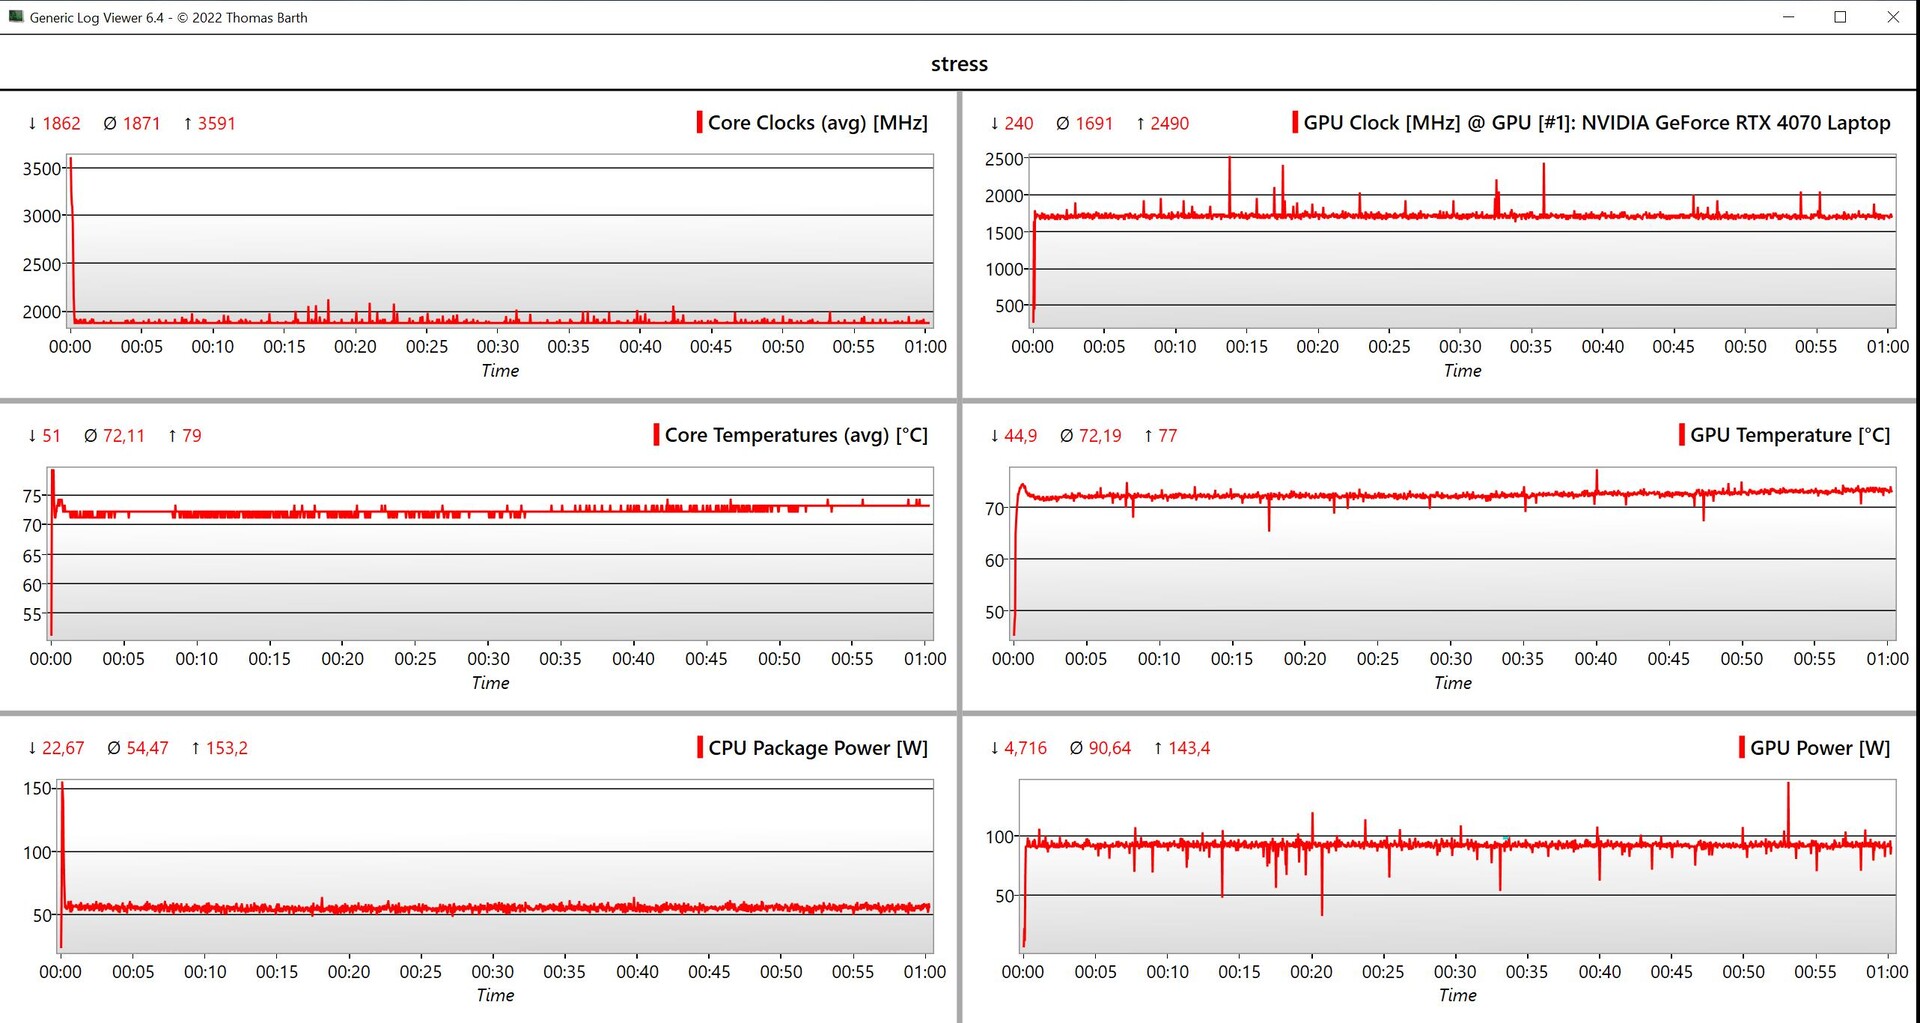
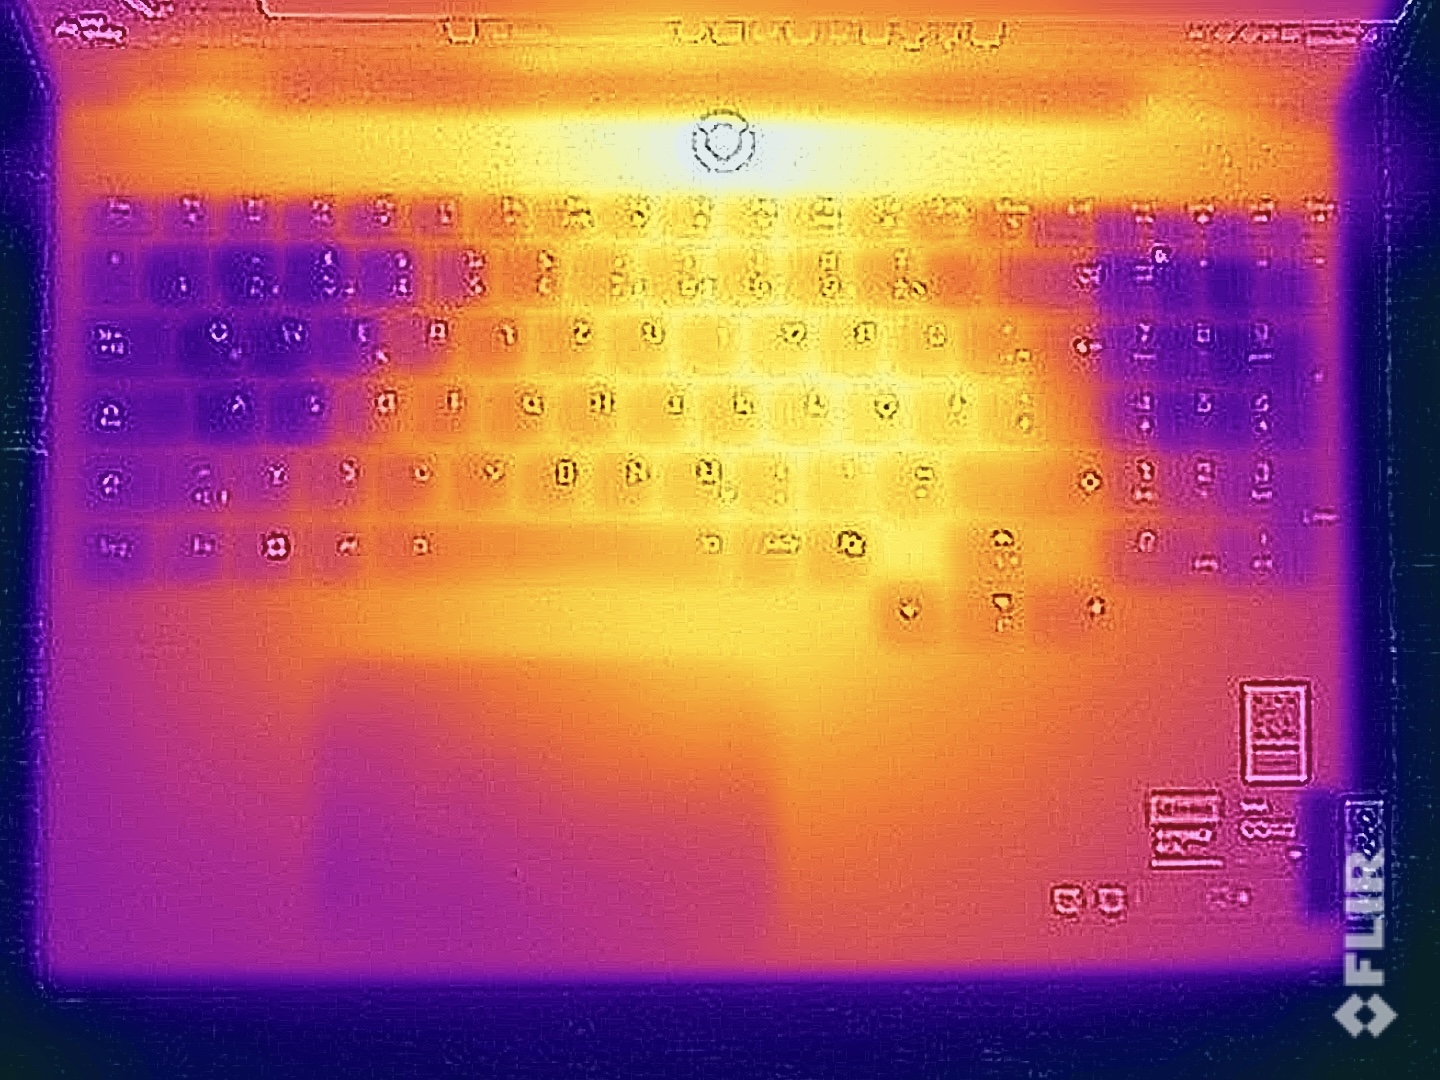
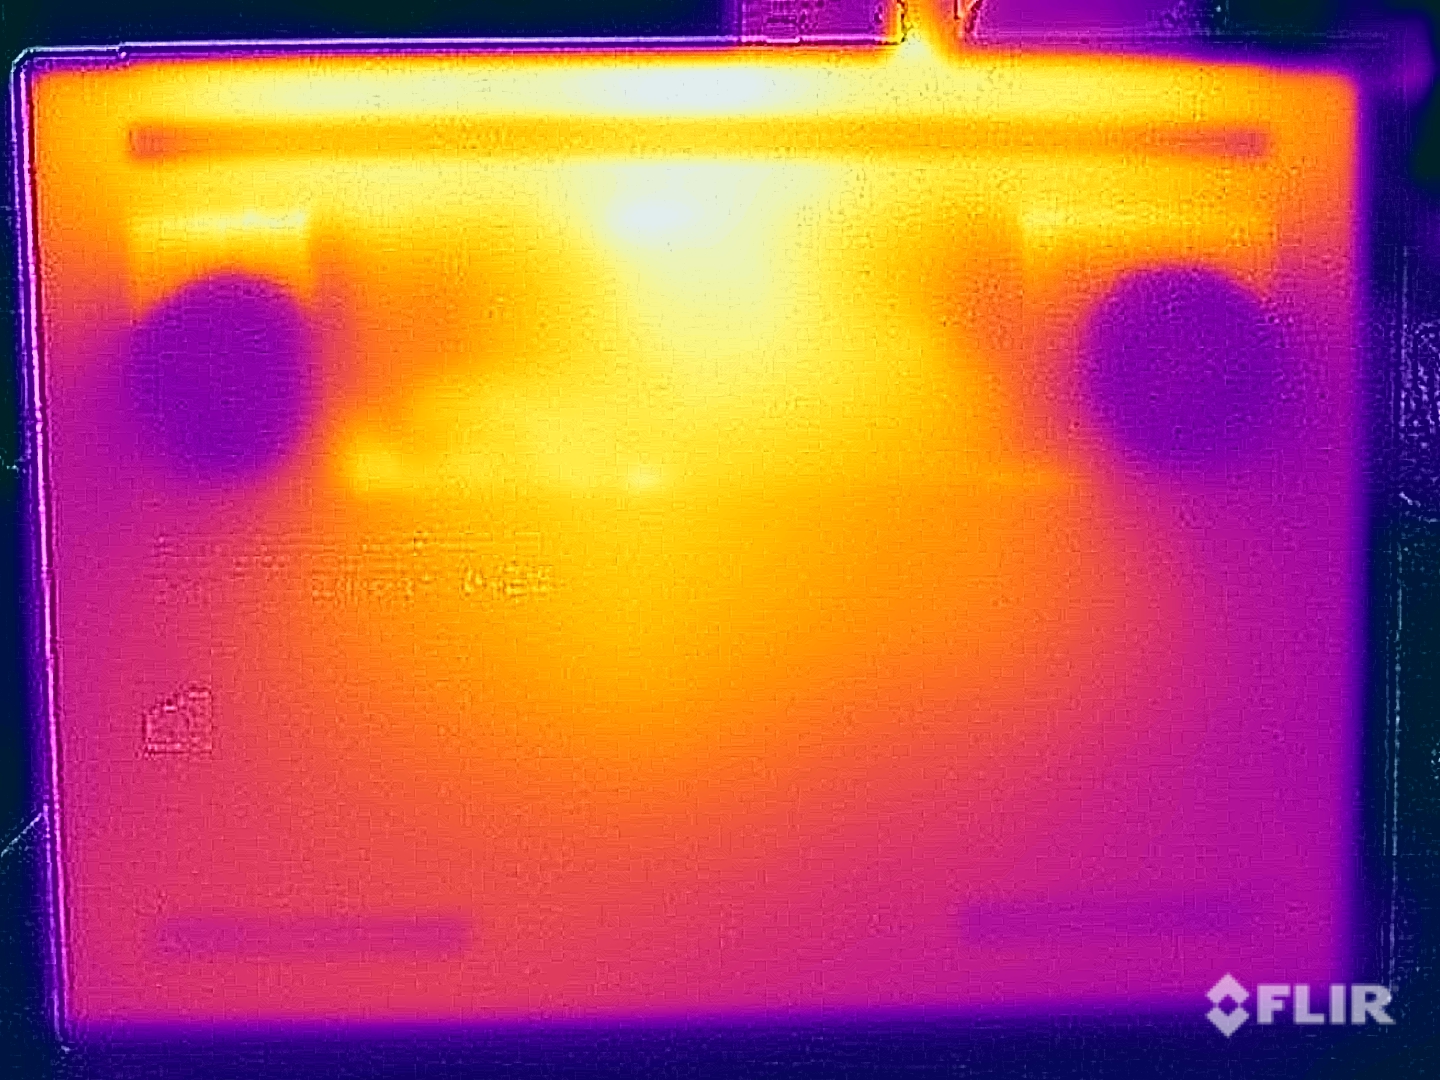
Temperatura
Podczas pracy na biegu jałowym i przy niskim obciążeniu, aluminiowa obudowa pozostaje przyjemnie chłodna, a nawet podczas grania radzi sobie lepiej niż oczekiwano. W niektórych miejscach zmierzyliśmy wartości wahające się od 42 do 43 °C i chociaż jest to coś, co można również zauważyć podczas korzystania z klawiatury, nie powoduje to ograniczenia komfortu użytkowania i po raz kolejny Legion 7 radzi sobie lepiej niż oba konkurencyjne modele pro, pomimo smuklejszej jednostki bazowej. W teście obciążeniowym z połączonym obciążeniem CPU/GPU, GPU działa z mocą 90 watów, a CPU z mocą około 54 watów.
(±) Maksymalna temperatura w górnej części wynosi 43.7 °C / 111 F, w porównaniu do średniej 40.4 °C / 105 F , począwszy od 21.2 do 68.8 °C dla klasy Gaming.
(±) Dno nagrzewa się maksymalnie do 42.9 °C / 109 F, w porównaniu do średniej 43.2 °C / 110 F
(+) W stanie bezczynności średnia temperatura górnej części wynosi 27 °C / 81 F, w porównaniu ze średnią temperaturą urządzenia wynoszącą 33.9 °C / ### class_avg_f### F.
(±) Podczas gry w Wiedźmina 3 średnia temperatura górnej części wynosi 37.2 °C / 99 F, w porównaniu do średniej temperatury urządzenia wynoszącej 33.9 °C / ## #class_avg_f### F.
(±) Podpórki pod nadgarstki i touchpad mogą się bardzo nagrzać w dotyku, maksymalnie do 38.7 °C / 101.7 F.
(-) Średnia temperatura obszaru podparcia dłoni w podobnych urządzeniach wynosiła 28.8 °C / 83.8 F (-9.9 °C / -17.9 F).
| Lenovo Legion 7 16 IRX G9 Intel Core i9-14900HX, NVIDIA GeForce RTX 4070 Laptop GPU | Lenovo Legion Pro 5 16IRX9 Intel Core i9-14900HX, NVIDIA GeForce RTX 4070 Laptop GPU | Aorus 16X 2024 Intel Core i9-14900HX, NVIDIA GeForce RTX 4070 Laptop GPU | HP Omen Transcend 16-u1095ng Intel Core i9-14900HX, NVIDIA GeForce RTX 4070 Laptop GPU | Alienware m16 R2 Intel Core Ultra 7 155H, NVIDIA GeForce RTX 4070 Laptop GPU | Schenker XMG CORE 16 (L23) AMD Ryzen 7 7840HS, NVIDIA GeForce RTX 4070 Laptop GPU | Lenovo Legion Pro 7 16IRX9H Intel Core i9-14900HX, NVIDIA GeForce RTX 4080 Laptop GPU | |
|---|---|---|---|---|---|---|---|
| Heat | -15% | -10% | -14% | -20% | -7% | -18% | |
| Maximum Upper Side * (°C) | 43.7 | 43.8 -0% | 41 6% | 49 -12% | 44.8 -3% | 46 -5% | 46 -5% |
| Maximum Bottom * (°C) | 42.9 | 55.4 -29% | 41 4% | 63 -47% | 48 -12% | 44 -3% | 49 -14% |
| Idle Upper Side * (°C) | 29.1 | 32.8 -13% | 37 -27% | 30 -3% | 37.2 -28% | 32 -10% | 38 -31% |
| Idle Bottom * (°C) | 30.6 | 36 -18% | 38 -24% | 29 5% | 42 -37% | 33 -8% | 37 -21% |
* ... im mniej tym lepiej
Głośniki
Oba głośniki stereo wykonują przyzwoitą robotę, ale istnieje zauważalna różnica między nimi a droższymi Legion Pro 7 16. Moduły są jednak wystarczająco dobre do okazjonalnego oglądania filmów/seriali lub słuchania muzyki w tle. Podczas grania zalecamy korzystanie z zestawu słuchawkowego ze względu na głośne wentylatory.
Lenovo Legion 7 16 IRX G9 analiza dźwięku
(+) | głośniki mogą odtwarzać stosunkowo głośno (82.1 dB)
Bas 100 - 315 Hz
(±) | zredukowany bas - średnio 13.1% niższy od mediany
(±) | liniowość basu jest średnia (9.7% delta do poprzedniej częstotliwości)
Średnie 400 - 2000 Hz
(+) | zbalansowane środki średnie - tylko 2.8% od mediany
(+) | średnie są liniowe (3.7% delta do poprzedniej częstotliwości)
Wysokie 2–16 kHz
(+) | zrównoważone maksima - tylko 4.7% od mediany
(±) | liniowość wysokich wartości jest średnia (7% delta do poprzedniej częstotliwości)
Ogólnie 100 - 16.000 Hz
(+) | ogólny dźwięk jest liniowy (12.6% różnicy w stosunku do mediany)
W porównaniu do tej samej klasy
» 16% wszystkich testowanych urządzeń w tej klasie było lepszych, 3% podobnych, 81% gorszych
» Najlepszy miał deltę 6%, średnia wynosiła ###średnia###%, najgorsza wynosiła 132%
W porównaniu do wszystkich testowanych urządzeń
» 11% wszystkich testowanych urządzeń było lepszych, 2% podobnych, 86% gorszych
» Najlepszy miał deltę 4%, średnia wynosiła ###średnia###%, najgorsza wynosiła 134%
Lenovo Legion Pro 7 16IRX9H analiza dźwięku
(+) | głośniki mogą odtwarzać stosunkowo głośno (84 dB)
Bas 100 - 315 Hz
(±) | zredukowany bas - średnio 8.9% niższy od mediany
(±) | liniowość basu jest średnia (7.4% delta do poprzedniej częstotliwości)
Średnie 400 - 2000 Hz
(+) | zbalansowane środki średnie - tylko 2.8% od mediany
(+) | średnie są liniowe (4% delta do poprzedniej częstotliwości)
Wysokie 2–16 kHz
(+) | zrównoważone maksima - tylko 3% od mediany
(+) | wzloty są liniowe (5% delta do poprzedniej częstotliwości)
Ogólnie 100 - 16.000 Hz
(+) | ogólny dźwięk jest liniowy (8.4% różnicy w stosunku do mediany)
W porównaniu do tej samej klasy
» 2% wszystkich testowanych urządzeń w tej klasie było lepszych, 1% podobnych, 97% gorszych
» Najlepszy miał deltę 6%, średnia wynosiła ###średnia###%, najgorsza wynosiła 132%
W porównaniu do wszystkich testowanych urządzeń
» 2% wszystkich testowanych urządzeń było lepszych, 1% podobnych, 97% gorszych
» Najlepszy miał deltę 4%, średnia wynosiła ###średnia###%, najgorsza wynosiła 134%
Zarządzanie energią - Średni czas pracy na baterii
Zużycie energii
W pomiarach zużycia energii recenzowane urządzenie nie zaskoczyło nas i w trybie bezczynności zarejestrowaliśmy maksymalnie prawie 22 waty. W trybie wydajności 230-watowy zasilacz na krótko stał się czynnikiem ograniczającym, ale szybko się ustabilizował i zużycie szybko ustabilizowało się na poziomie 200 watów. Podsumowując, 230-watowy zasilacz jest dobrze dobrany. Niemniej jednak Lenovo mogłoby poprawić zużycie energii w trybie czuwania o ponad 1,1 wata.
| wyłączony / stan wstrzymania | |
| luz | |
| obciążenie |
|
Legenda:
min: | |
| Lenovo Legion 7 16 IRX G9 i9-14900HX, GeForce RTX 4070 Laptop GPU, SK Hynix HFS001TEJ9X115N, IPS, 3200x2000, 16" | Aorus 16X 2024 i9-14900HX, GeForce RTX 4070 Laptop GPU, Gigabyte AG450E1024-SI, IPS, 2560x1600, 16" | HP Omen Transcend 16-u1095ng i9-14900HX, GeForce RTX 4070 Laptop GPU, Kioxia XG8 KXG80ZNV1T02, OLED, 2560x1600, 16" | Alienware m16 R2 Ultra 7 155H, GeForce RTX 4070 Laptop GPU, Samsung PM9A1 MZVL21T0HCLR, IPS, 2560x1600, 16" | Schenker XMG CORE 16 (L23) R7 7840HS, GeForce RTX 4070 Laptop GPU, Samsung 990 Pro 1 TB, IPS, 2560x1600, 16" | Lenovo Legion Pro 7 16IRX9H i9-14900HX, GeForce RTX 4080 Laptop GPU, SK Hynix HFS001TEJ9X115N, IPS, 2560x1600, 16" | Przeciętny NVIDIA GeForce RTX 4070 Laptop GPU | Średnia w klasie Gaming | |
|---|---|---|---|---|---|---|---|---|
| Power Consumption | -4% | 4% | 6% | 20% | -27% | 10% | 5% | |
| Idle Minimum * (Watt) | 15.4 | 13 16% | 10 35% | 8.1 47% | 11 29% | 16 -4% | 13.2 ? 14% | 13.2 ? 14% |
| Idle Average * (Watt) | 21.2 | 18 15% | 18 15% | 13 39% | 15.2 28% | 21 1% | 18.2 ? 14% | 18.9 ? 11% |
| Idle Maximum * (Watt) | 21.9 | 35 -60% | 32 -46% | 40.3 -84% | 16 27% | 36 -64% | 24.6 ? -12% | 24.3 ? -11% |
| Load Average * (Watt) | 128.5 | 138 -7% | 128 -0% | 79 39% | 64 50% | 132 -3% | 97 ? 25% | 108.3 ? 16% |
| Witcher 3 ultra * (Watt) | 188.4 | 172.6 8% | 148.4 21% | 188.1 -0% | 179 5% | 267 -42% | ||
| Load Maximum * (Watt) | 239.1 | 222 7% | 242 -1% | 254.9 -7% | 280 -17% | 360 -51% | 221 ? 8% | 254 ? -6% |
* ... im mniej tym lepiej
Power consumption Witcher 3 / stress test
Power consumption with an external monitor
Żywotność baterii
Lenovo zainstalowało w swoim Legion 7 16 baterię o pojemności 99,9 Wh i ogólnie rzecz biorąc, czas pracy można uznać za dość przeciętny. Przy 150 cd/m² (co stanowi 63% maksymalnej jasności recenzowanego urządzenia) i 60 Hz, nasz test Wi-Fi trwał ponad 7 godzin (~6,5 godziny przy 165 Hz) i około 5,5 godziny przy pełnej jasności i 60 Hz (~5 godzin przy 165 Hz). W teście wideo przy 150 cd/m² odnotowaliśmy nieco ponad 10 godzin, a pod obciążeniem, w najgorszym przypadku, światła gasną po 50 minutach.
Legion oferuje dwa tryby ładowania, z pełnym cyklem ładowania trwającym 97 minut (80% po ~64 minutach) w trybie normalnym. W trybie ekspresowym zajmuje to 79 minut (80% po zaledwie 34 minutach).
| Lenovo Legion 7 16 IRX G9 i9-14900HX, GeForce RTX 4070 Laptop GPU, 99.9 Wh | Lenovo Legion Pro 5 16IRX9 i9-14900HX, GeForce RTX 4070 Laptop GPU, 80 Wh | Aorus 16X 2024 i9-14900HX, GeForce RTX 4070 Laptop GPU, 99 Wh | HP Omen Transcend 16-u1095ng i9-14900HX, GeForce RTX 4070 Laptop GPU, 97 Wh | Alienware m16 R2 Ultra 7 155H, GeForce RTX 4070 Laptop GPU, 90 Wh | Schenker XMG CORE 16 (L23) R7 7840HS, GeForce RTX 4070 Laptop GPU, 99 Wh | Lenovo Legion Pro 7 16IRX9H i9-14900HX, GeForce RTX 4080 Laptop GPU, 99.9 Wh | Średnia w klasie Gaming | |
|---|---|---|---|---|---|---|---|---|
| Czasy pracy | 3% | 37% | -32% | 19% | 72% | -14% | 21% | |
| H.264 (h) | 10.3 | 9 -13% | 10.2 -1% | 8.26 ? -20% | ||||
| WiFi v1.3 (h) | 7.2 | 4.8 -33% | 8 11% | 4.9 -32% | 8.1 13% | 8.4 17% | 6.2 -14% | 7.04 ? -2% |
| Load (h) | 0.8 | 1.1 38% | 1.7 113% | 1 25% | 2.4 200% | 1.47 ? 84% | ||
| Reader / Idle (h) | 6.7 | 12.6 | 12.6 | 8.71 ? |
Za
Przeciw
Werdykt - dyskretny, wydajny laptop do gier

Wraz z nowym Legion 7i 16 G9, Lenovo oferuje stosunkowo smukły laptop do gier, który nie ujawnił żadnych rażących słabości podczas testów. W porównaniu do droższego Legion Pro 7trzeba zaakceptować ograniczenia, jeśli chodzi o długie okresy wydajności procesora, a także wyposażonego GPU ( Legion 7 osiąga szczyt na laptopie RTX 4070), ale w porównaniu do Pro, aluminiowa obudowa pozostaje chłodniejsza i ogólnie rzecz biorąc, chłodzenie wykonuje bardzo dobrą robotę. Wentylatory są nadal problematyczne, ponieważ podczas grania, korzystając z jednego z szybkich trybów energetycznych, wymagany będzie zestaw słuchawkowy. Dotyczy to jednak również konkurencji, a korzystając z trybu cichego, możliwe jest uzyskanie znośnego poziomu dźwięku kosztem pewnej wydajności.
Ponadto cieńsza obudowa jest znacznie mniej wyróżniająca się niż Legion Pro. Każdy, kto poluje na rozbudowane opcje oświetlenia, będzie rozczarowany, ale z drugiej strony sprawia to, że Legion 7 16 nadaje się również dla innych grup docelowych. Jedyną irytującą rzeczą są powierzchnie wrażliwe na odciski palców. Oprócz brakującego portu Ethernet, wszystkie ważne złącza znajdują się na pokładzie i nie ma żadnych problemów, jeśli chodzi o urządzenia wejściowe.
Nowy Lenovo Legion 7i 16 G9 to przyciągający wzrok laptop do gier z dużą wydajnością i dobrym zestawem funkcji. Wyświetlacz IPS o wysokiej rozdzielczości nadaje się również do przeglądania i edycji zdjęć, a PWM nie jest zaimplementowany.
Ogólnie rzecz biorąc, opcjonalny wyświetlacz IPS i jego rozdzielczość 3200 x 2000 pikseli wykonują dobrą robotę, nawet jeśli subiektywne wrażenie obrazu i czasy reakcji nie są w stanie dotrzymać kroku panelom OLED. Plusem jest brak PWM i irytujących refleksów. Podobnie czas pracy na baterii jest tylko przeciętny, a platforma i jej procesor HX po prostu wymagają zbyt dużo energii.
Nowy Legion 7 16 wypada również dobrze w porównaniu do swoich rówieśników. W szczególności, Legion Pro 7 jest odpowiedni, jeśli potrzebują Państwo GPU szybszego niż RTX 4070. Przy porównywalnej mocy Legion Pro 5 jest natomiast znacznie większy, a także oferuje gorszy ekran. The HP Omen Transcend jest wyposażony w ekran OLED 240 Hz, ale oferuje również nieco niższą wydajność i wyższą cenę.
Cena i dostępność
Legion 7i 16 G9 można kupić bezpośrednio od Lenovo za około 2 099 USD.
Lenovo Legion 7 16 IRX G9
- 13/04/2024 v7 (old)
Andreas Osthoff
Przezroczystość
Wyboru urządzeń do recenzji dokonuje nasza redakcja. Próbka testowa została udostępniona autorowi jako pożyczka od producenta lub sprzedawcy detalicznego na potrzeby tej recenzji. Pożyczkodawca nie miał wpływu na tę recenzję, producent nie otrzymał też kopii tej recenzji przed publikacją. Nie było obowiązku publikowania tej recenzji. Jako niezależna firma medialna, Notebookcheck nie podlega władzy producentów, sprzedawców detalicznych ani wydawców.
Tak testuje Notebookcheck
Każdego roku Notebookcheck niezależnie sprawdza setki laptopów i smartfonów, stosując standardowe procedury, aby zapewnić porównywalność wszystkich wyników. Od około 20 lat stale rozwijamy nasze metody badawcze, ustanawiając przy tym standardy branżowe. W naszych laboratoriach testowych doświadczeni technicy i redaktorzy korzystają z wysokiej jakości sprzętu pomiarowego. Testy te obejmują wieloetapowy proces walidacji. Nasz kompleksowy system ocen opiera się na setkach uzasadnionych pomiarów i benchmarków, co pozwala zachować obiektywizm.Price comparison

