Recenzja XMG Pro 16 Studio (Mid 23): Laptop RTX 4070 dla graczy i twórców
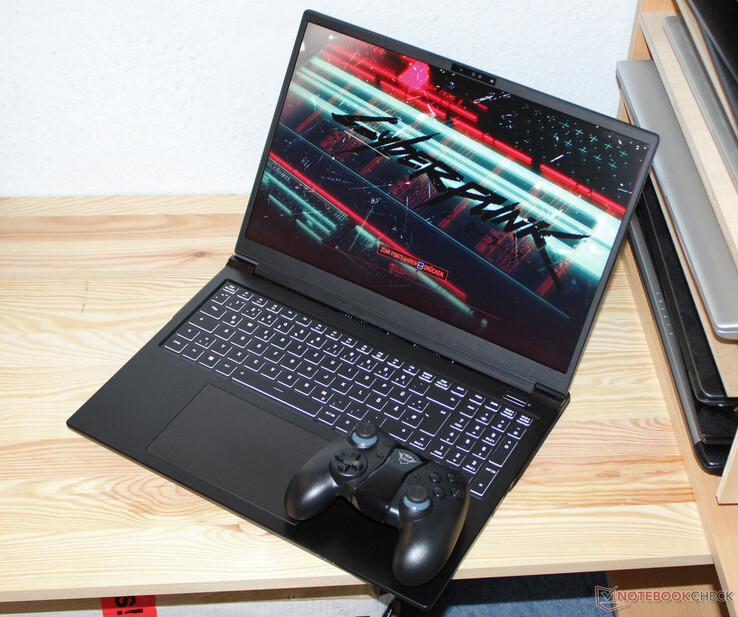
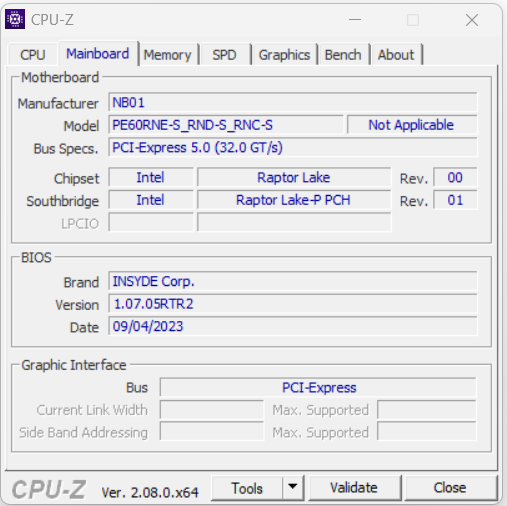
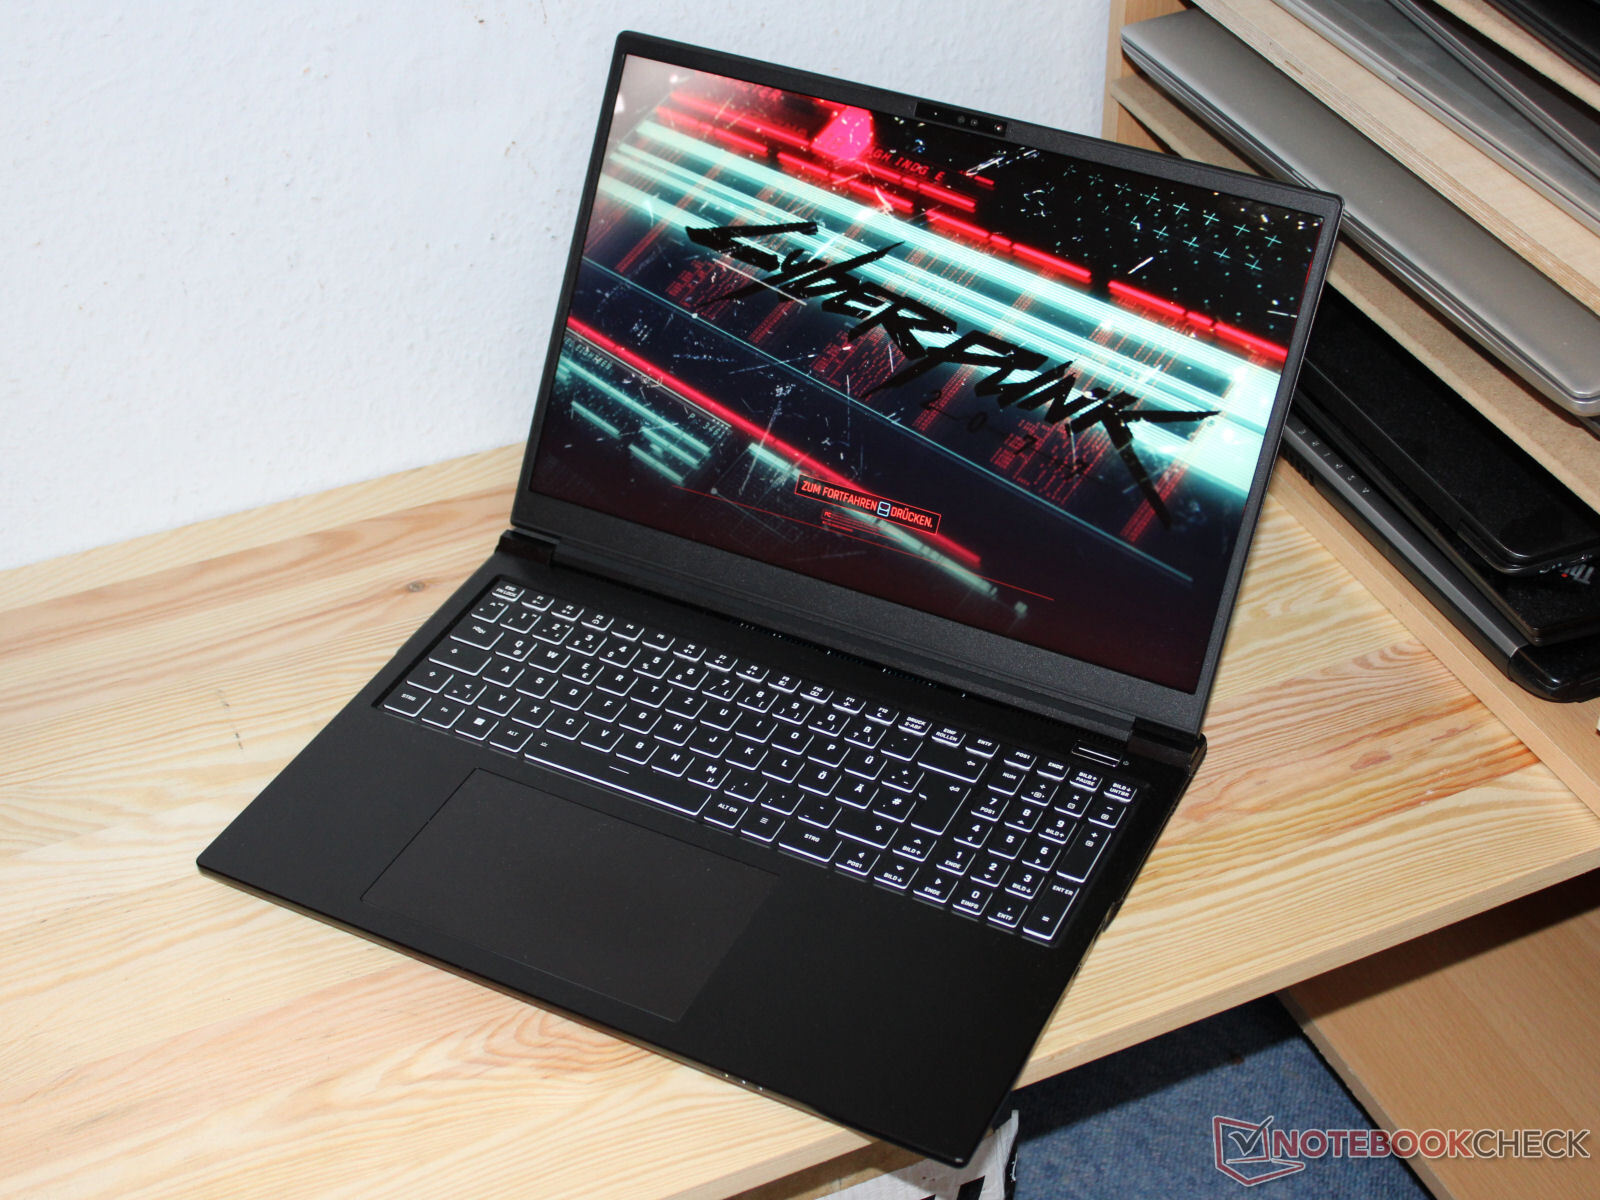
XMG Pro 16 Studio (Mid 23) - 16-calowy laptop dla graczy i twórców - bazuje na barebone (PE60RNE-S) wyprodukowanym przez Clevo, a obecny wariant można obecnie znaleźć za około 2400 USD. Konkurenci to między innymiLenovo Legion Slim 7i 16 Gen 8, HP Omen Transcend 16, Asus Vivobook Pro 16X orazMSI Stealth 16 Studio A13VG.
Potencjalni konkurenci w porównaniu
Ocena | Data | Model | Waga | Wysokość | Rozmiar | Rezolucja | Cena |
|---|---|---|---|---|---|---|---|
| 87.9 % v7 (old) | 10/2023 | Schenker XMG Pro 16 Studio (Mid 23) i9-13900H, GeForce RTX 4070 Laptop GPU | 2.6 kg | 19.9 mm | 16.00" | 2560x1600 | |
| 86.2 % v7 (old) | 07/2023 | Asus Vivobook Pro 16X K6604JV-MX016W i9-13980HX, GeForce RTX 4060 Laptop GPU | 2.1 kg | 22.8 mm | 16.00" | 3200x2000 | |
| 90 % v7 (old) | 07/2023 | Lenovo Legion Slim 7i 16 Gen 8 i9-13900H, GeForce RTX 4070 Laptop GPU | 2.1 kg | 19.9 mm | 16.00" | 2560x1600 | |
| 87.9 % v7 (old) | 08/2023 | HP Omen Transcend 16 i9-13900HX, GeForce RTX 4070 Laptop GPU | 2.3 kg | 19.8 mm | 16.00" | 2560x1600 | |
| 88.8 % v7 (old) | 07/2023 | MSI Stealth 16 Studio A13VG i7-13700H, GeForce RTX 4070 Laptop GPU | 2 kg | 19.95 mm | 16.00" | 2560x1600 |
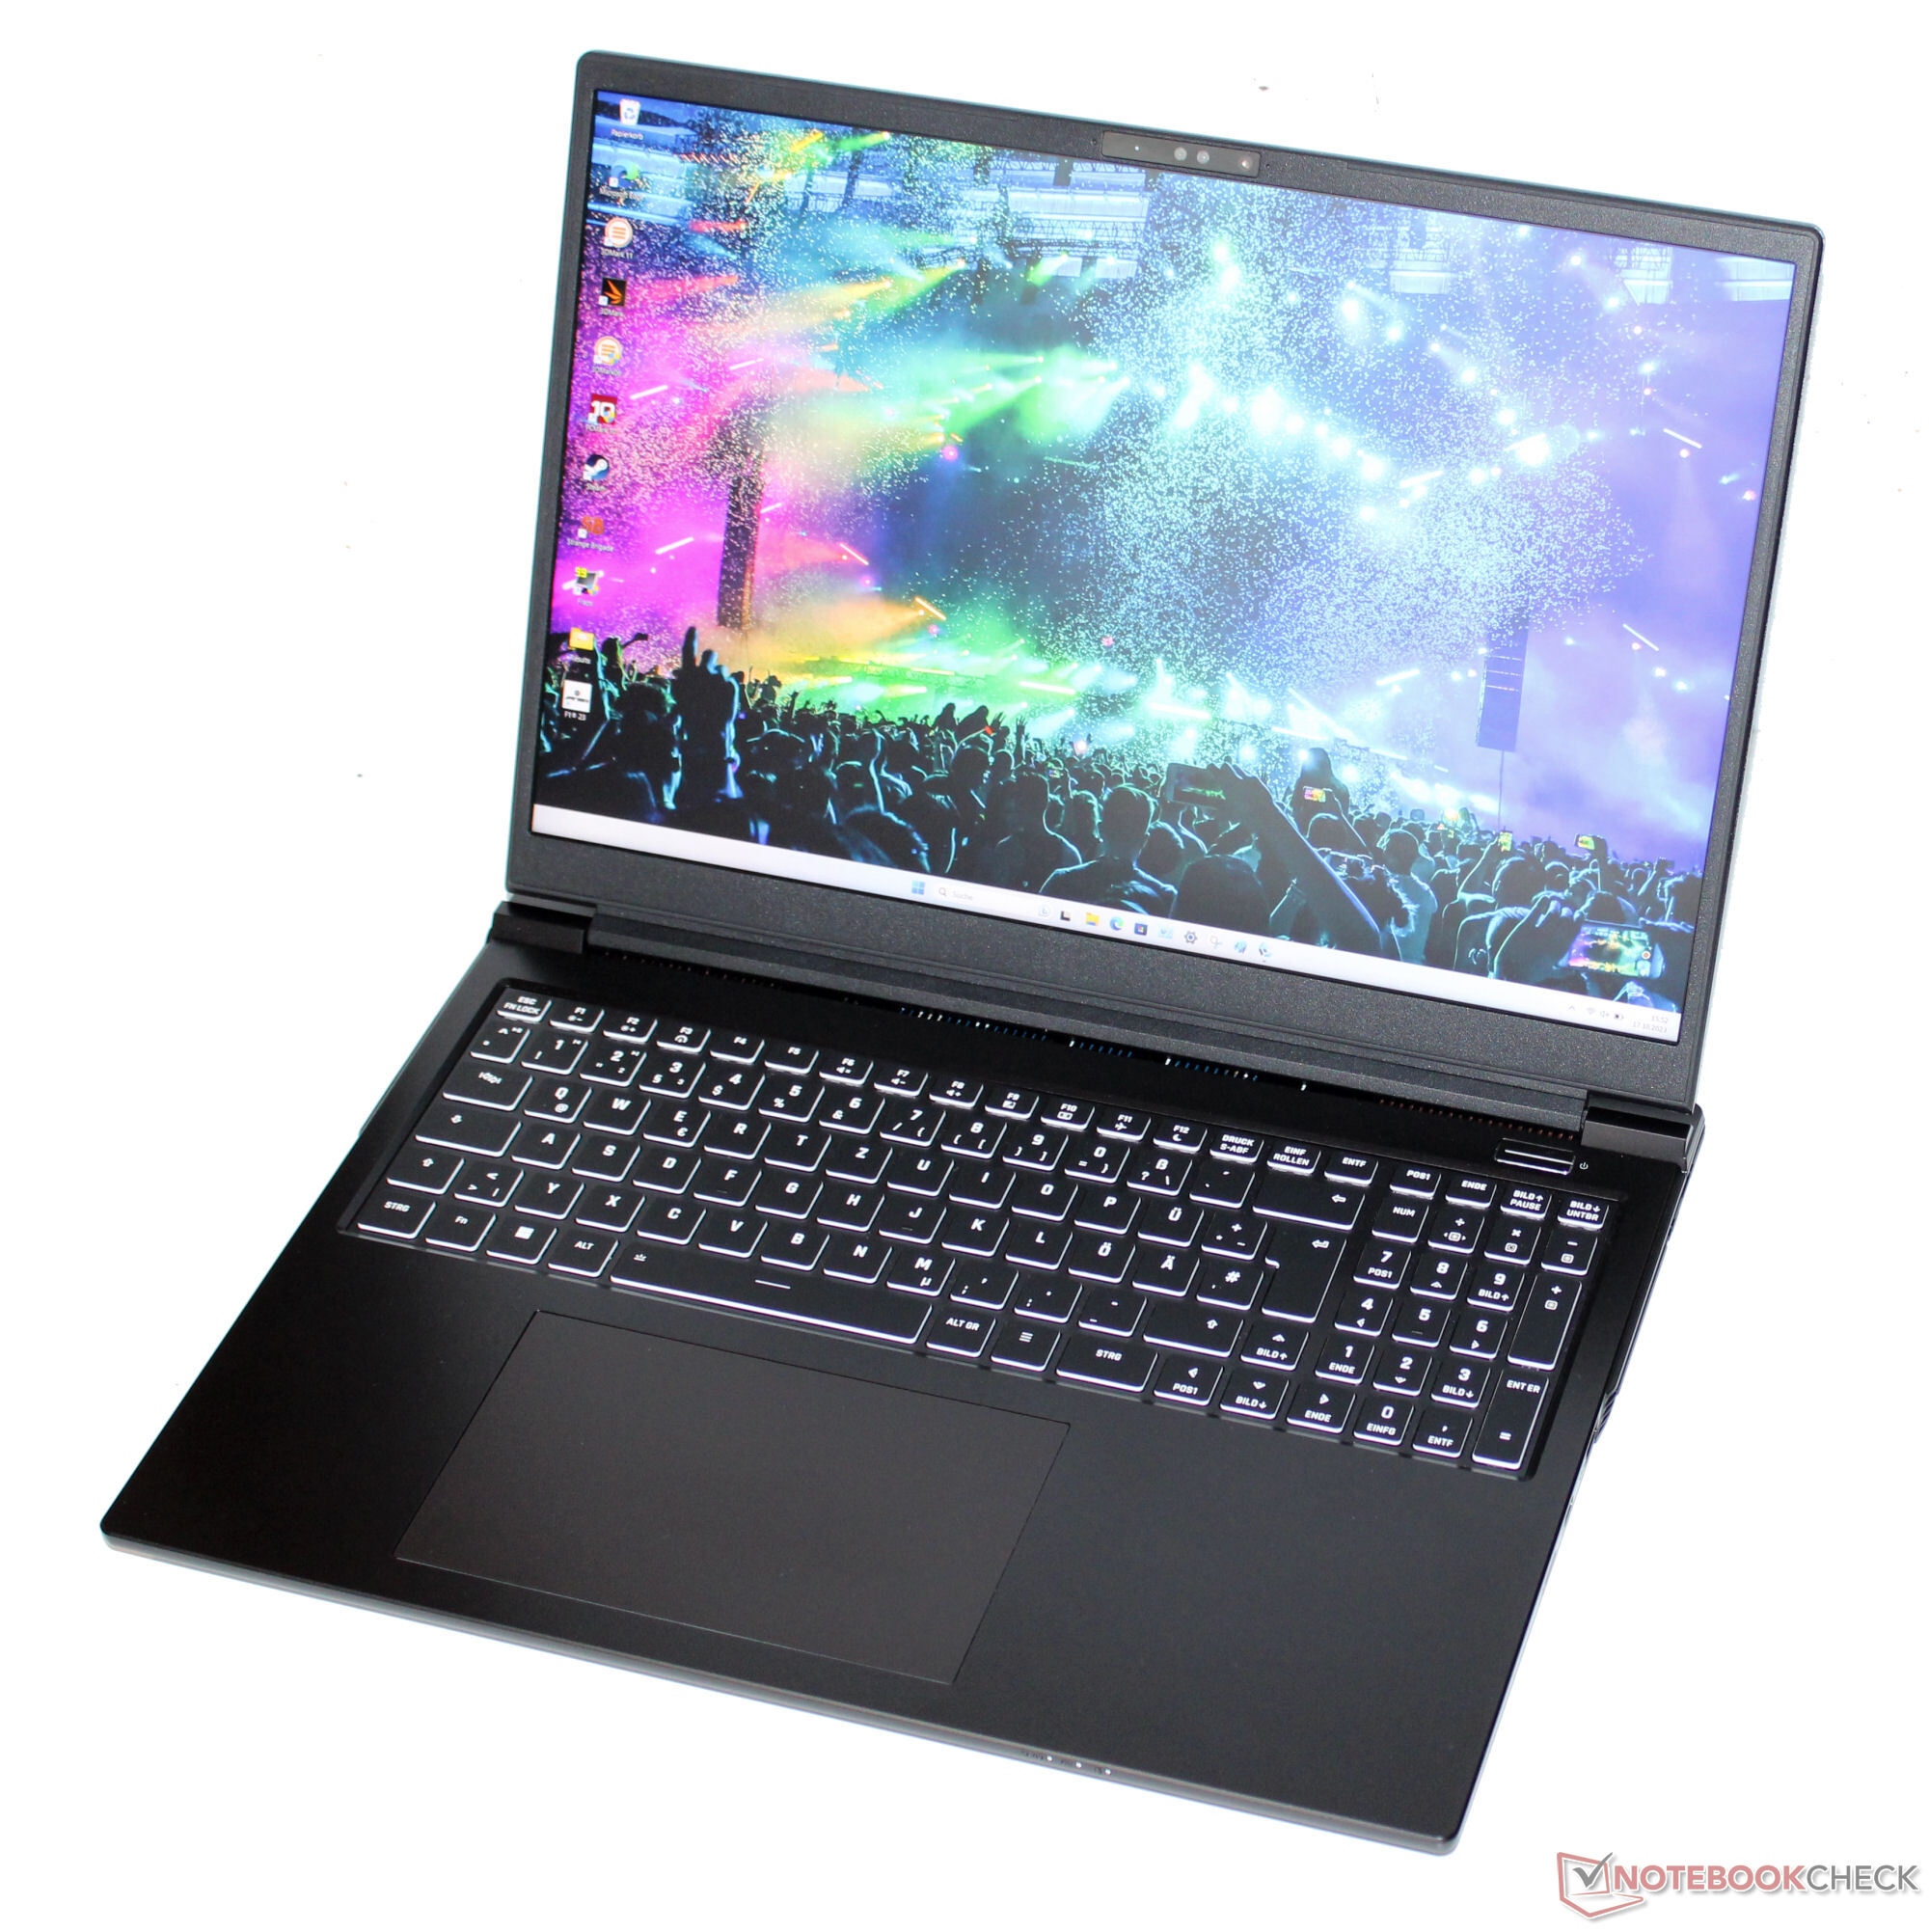
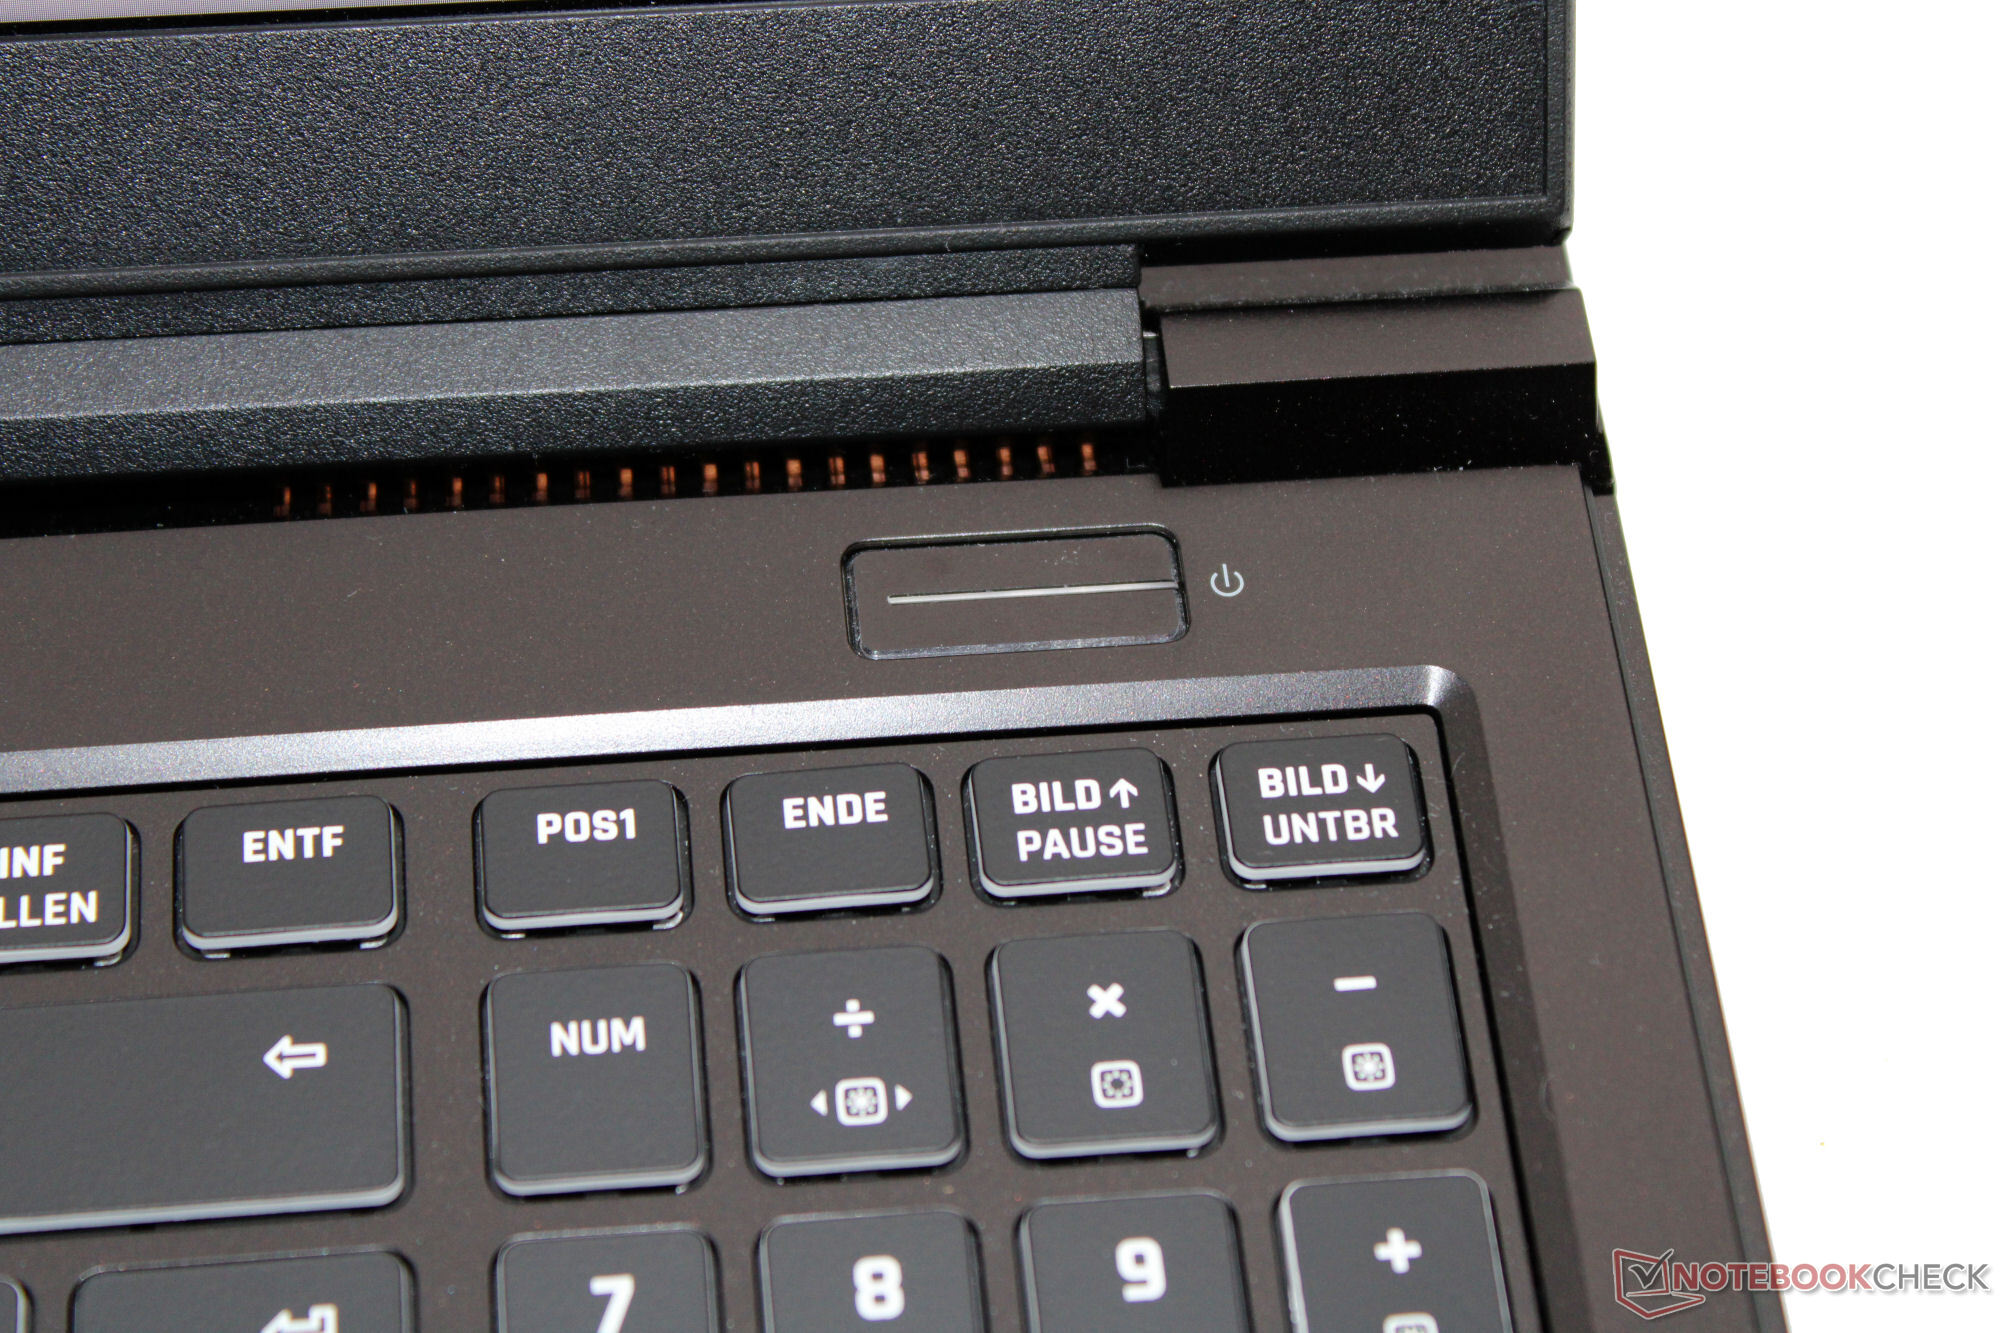
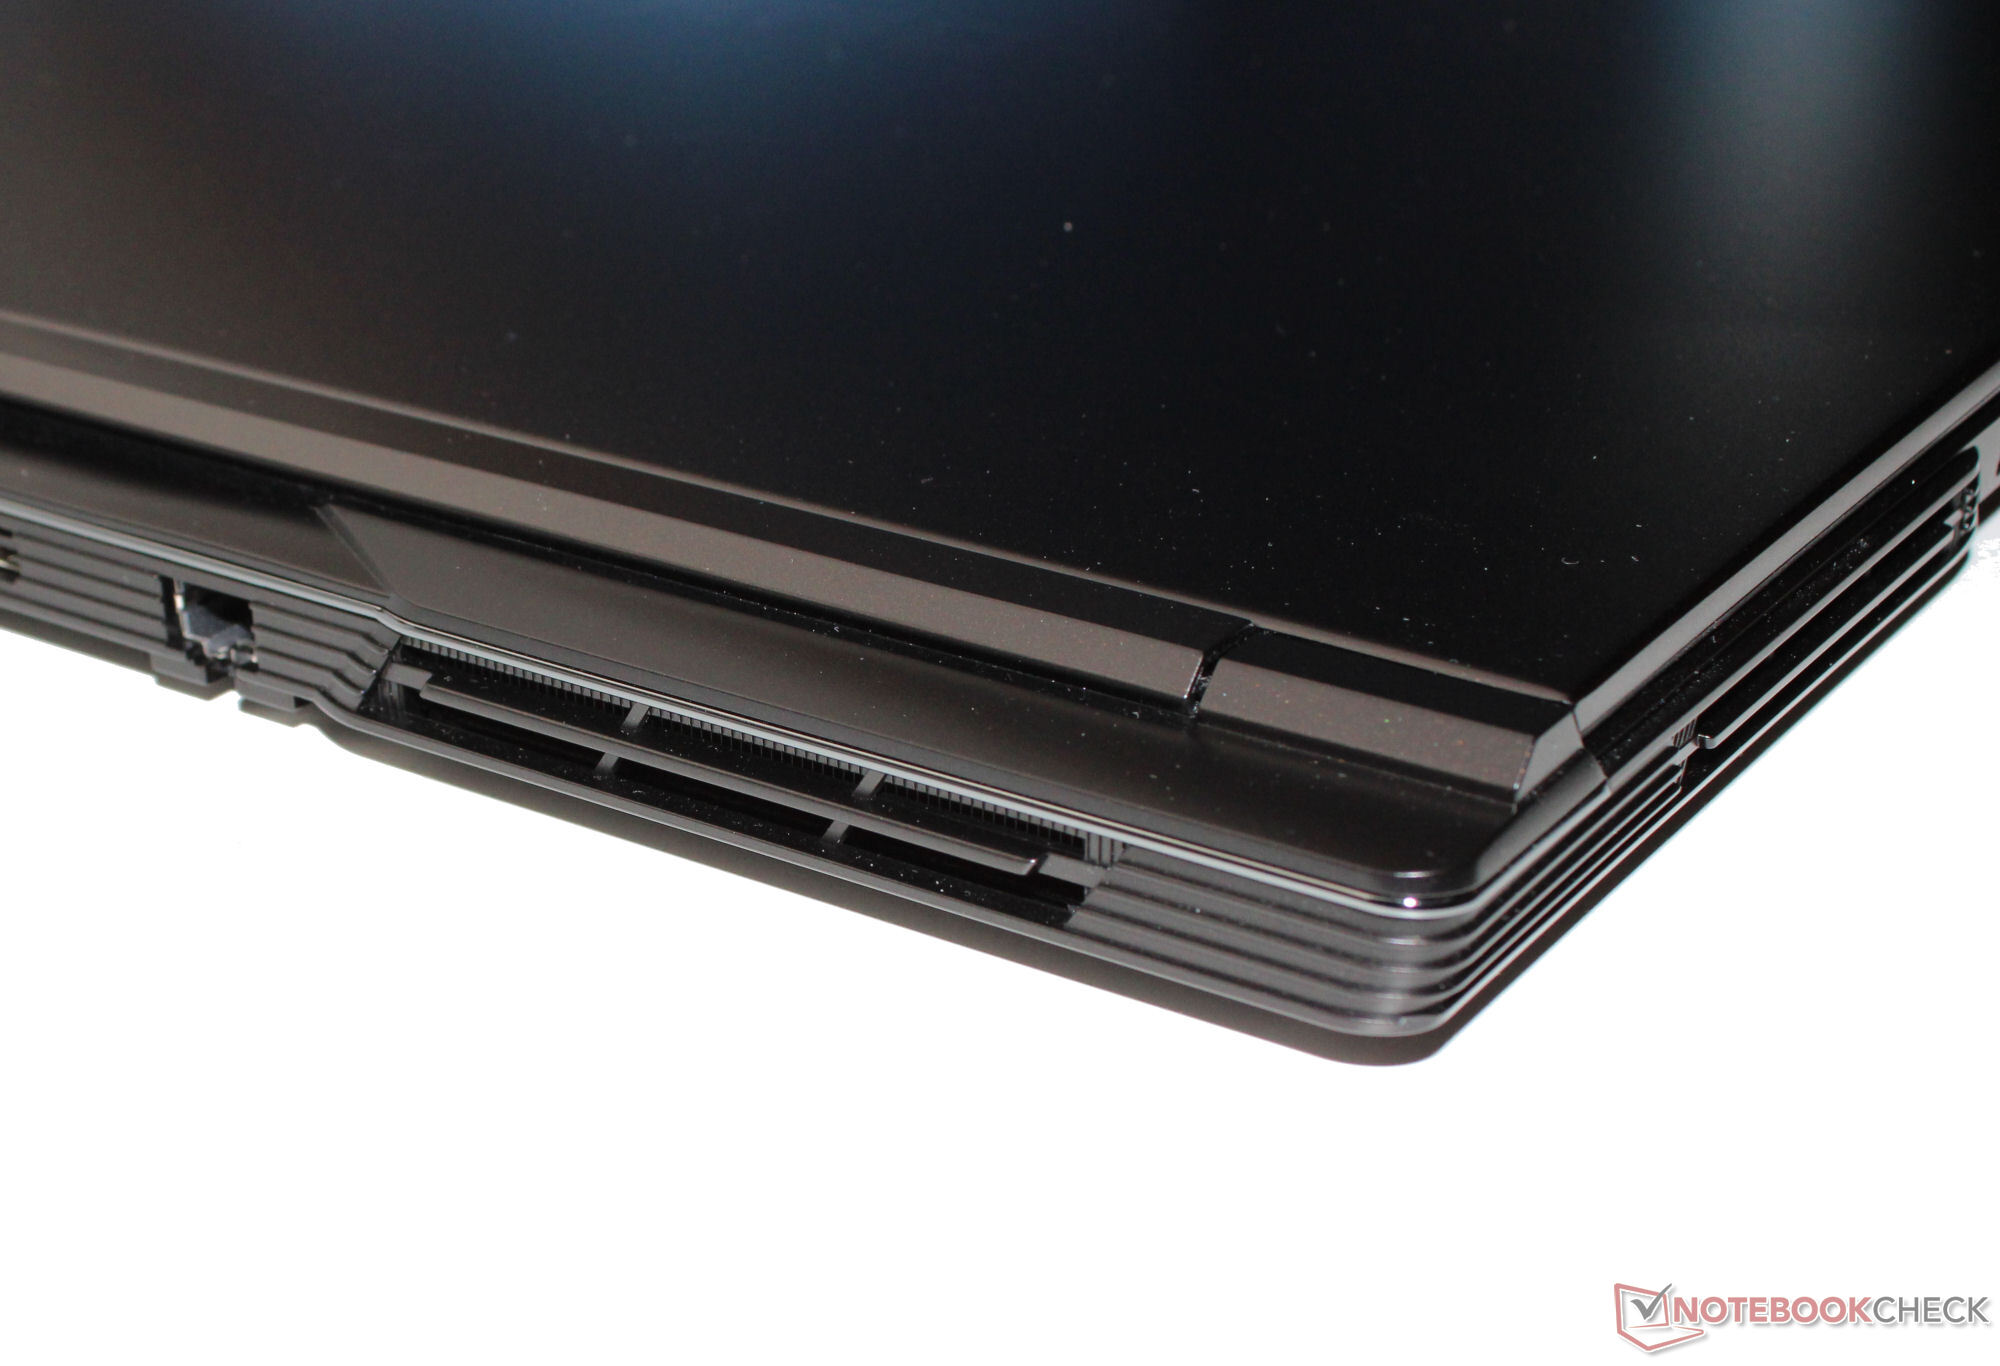
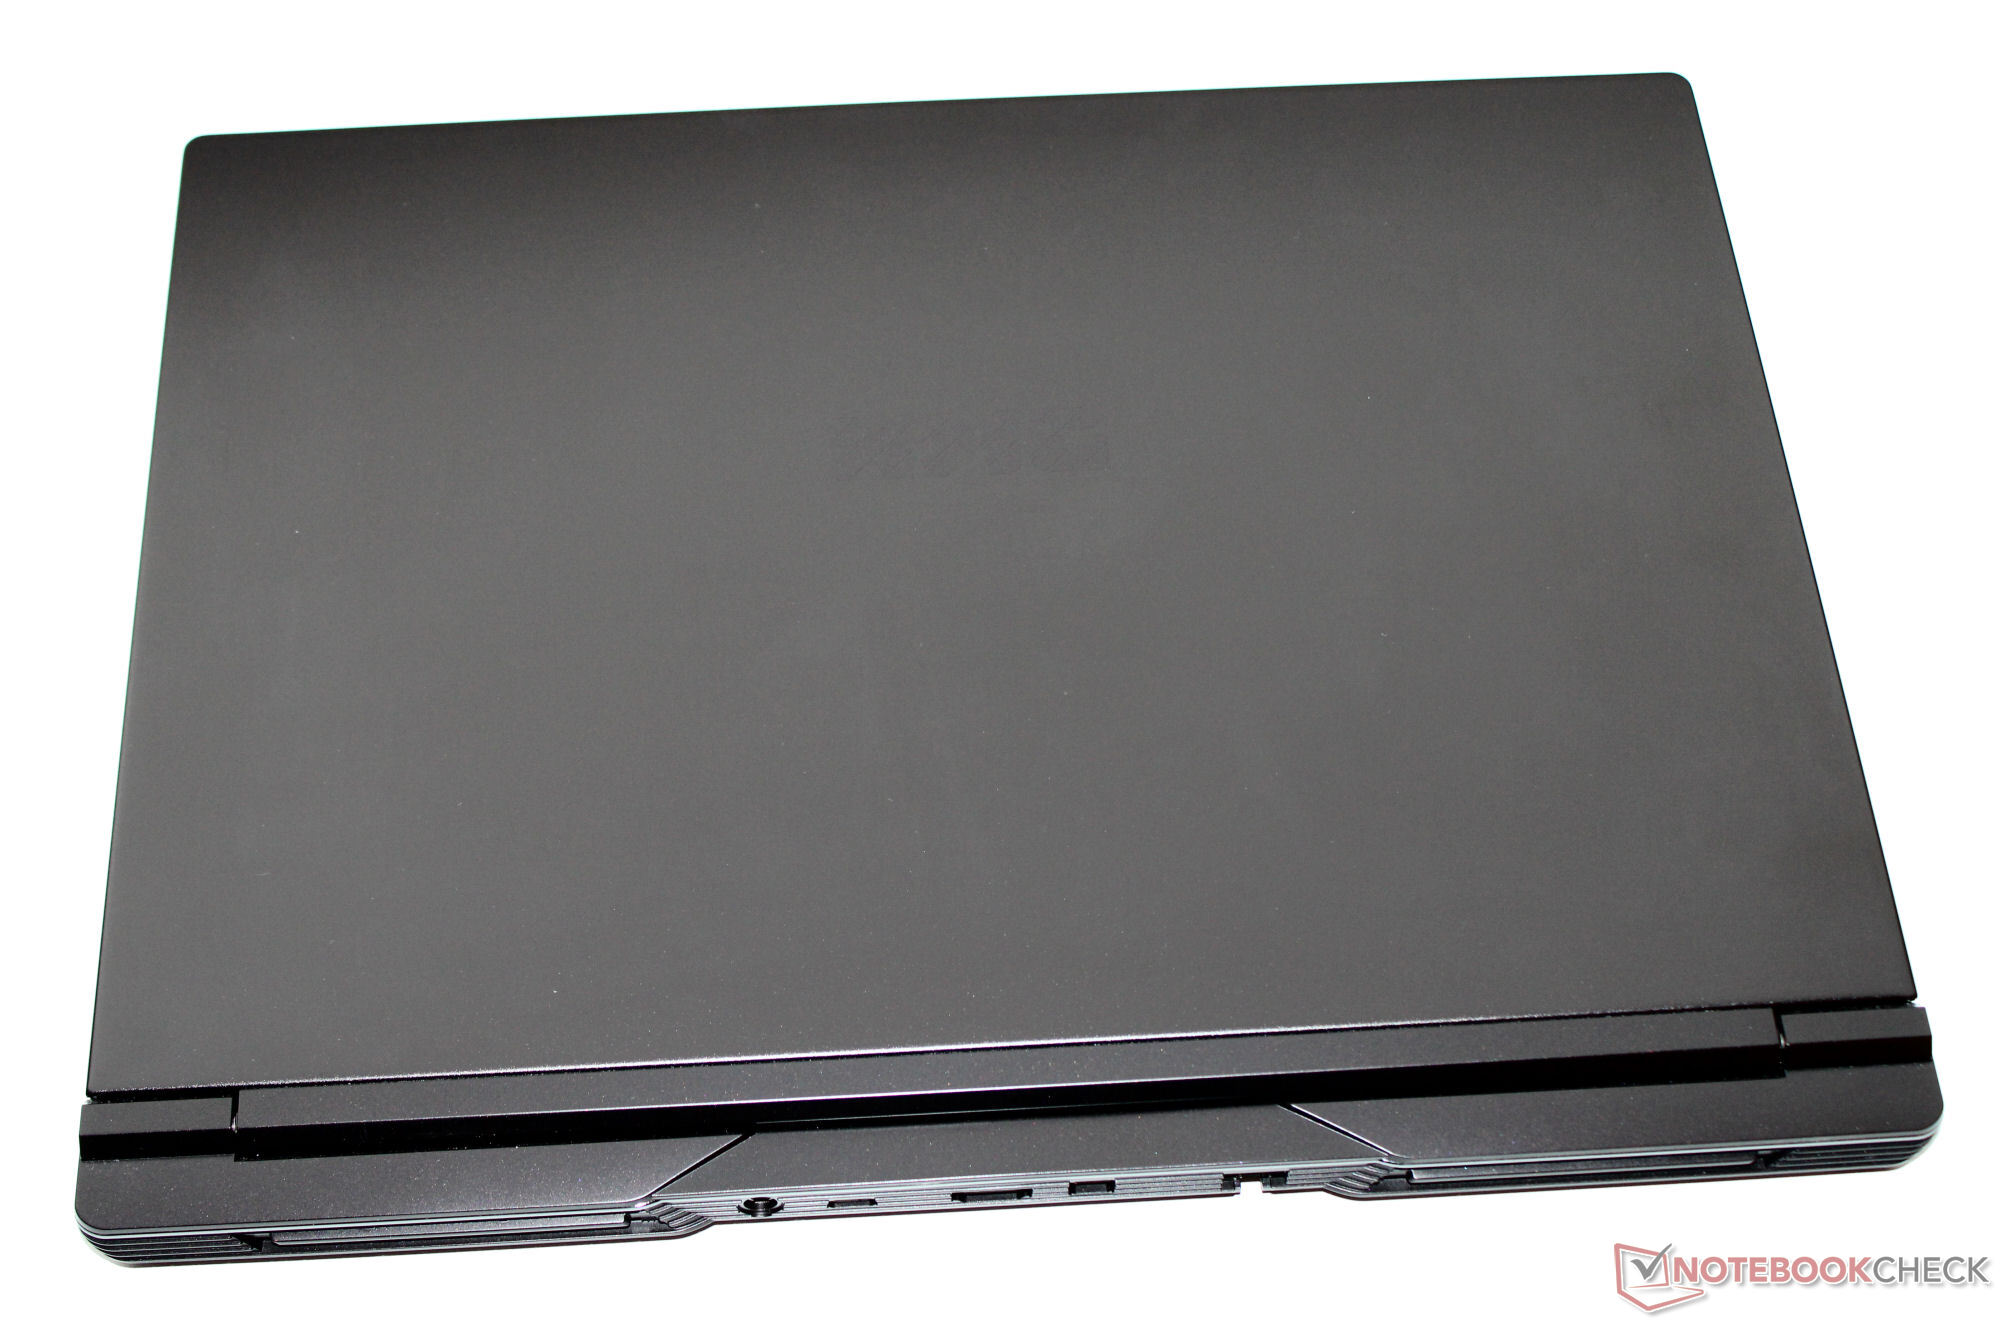
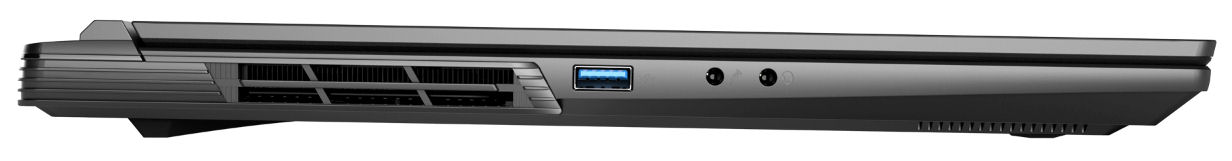
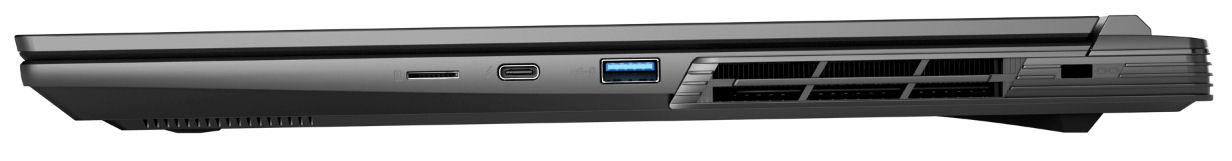
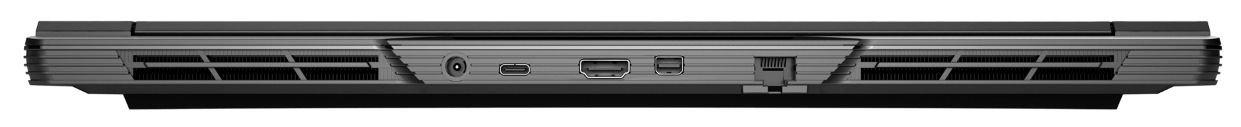
Obudowa i łączność - Clevo barebone z Thunderbolt 4
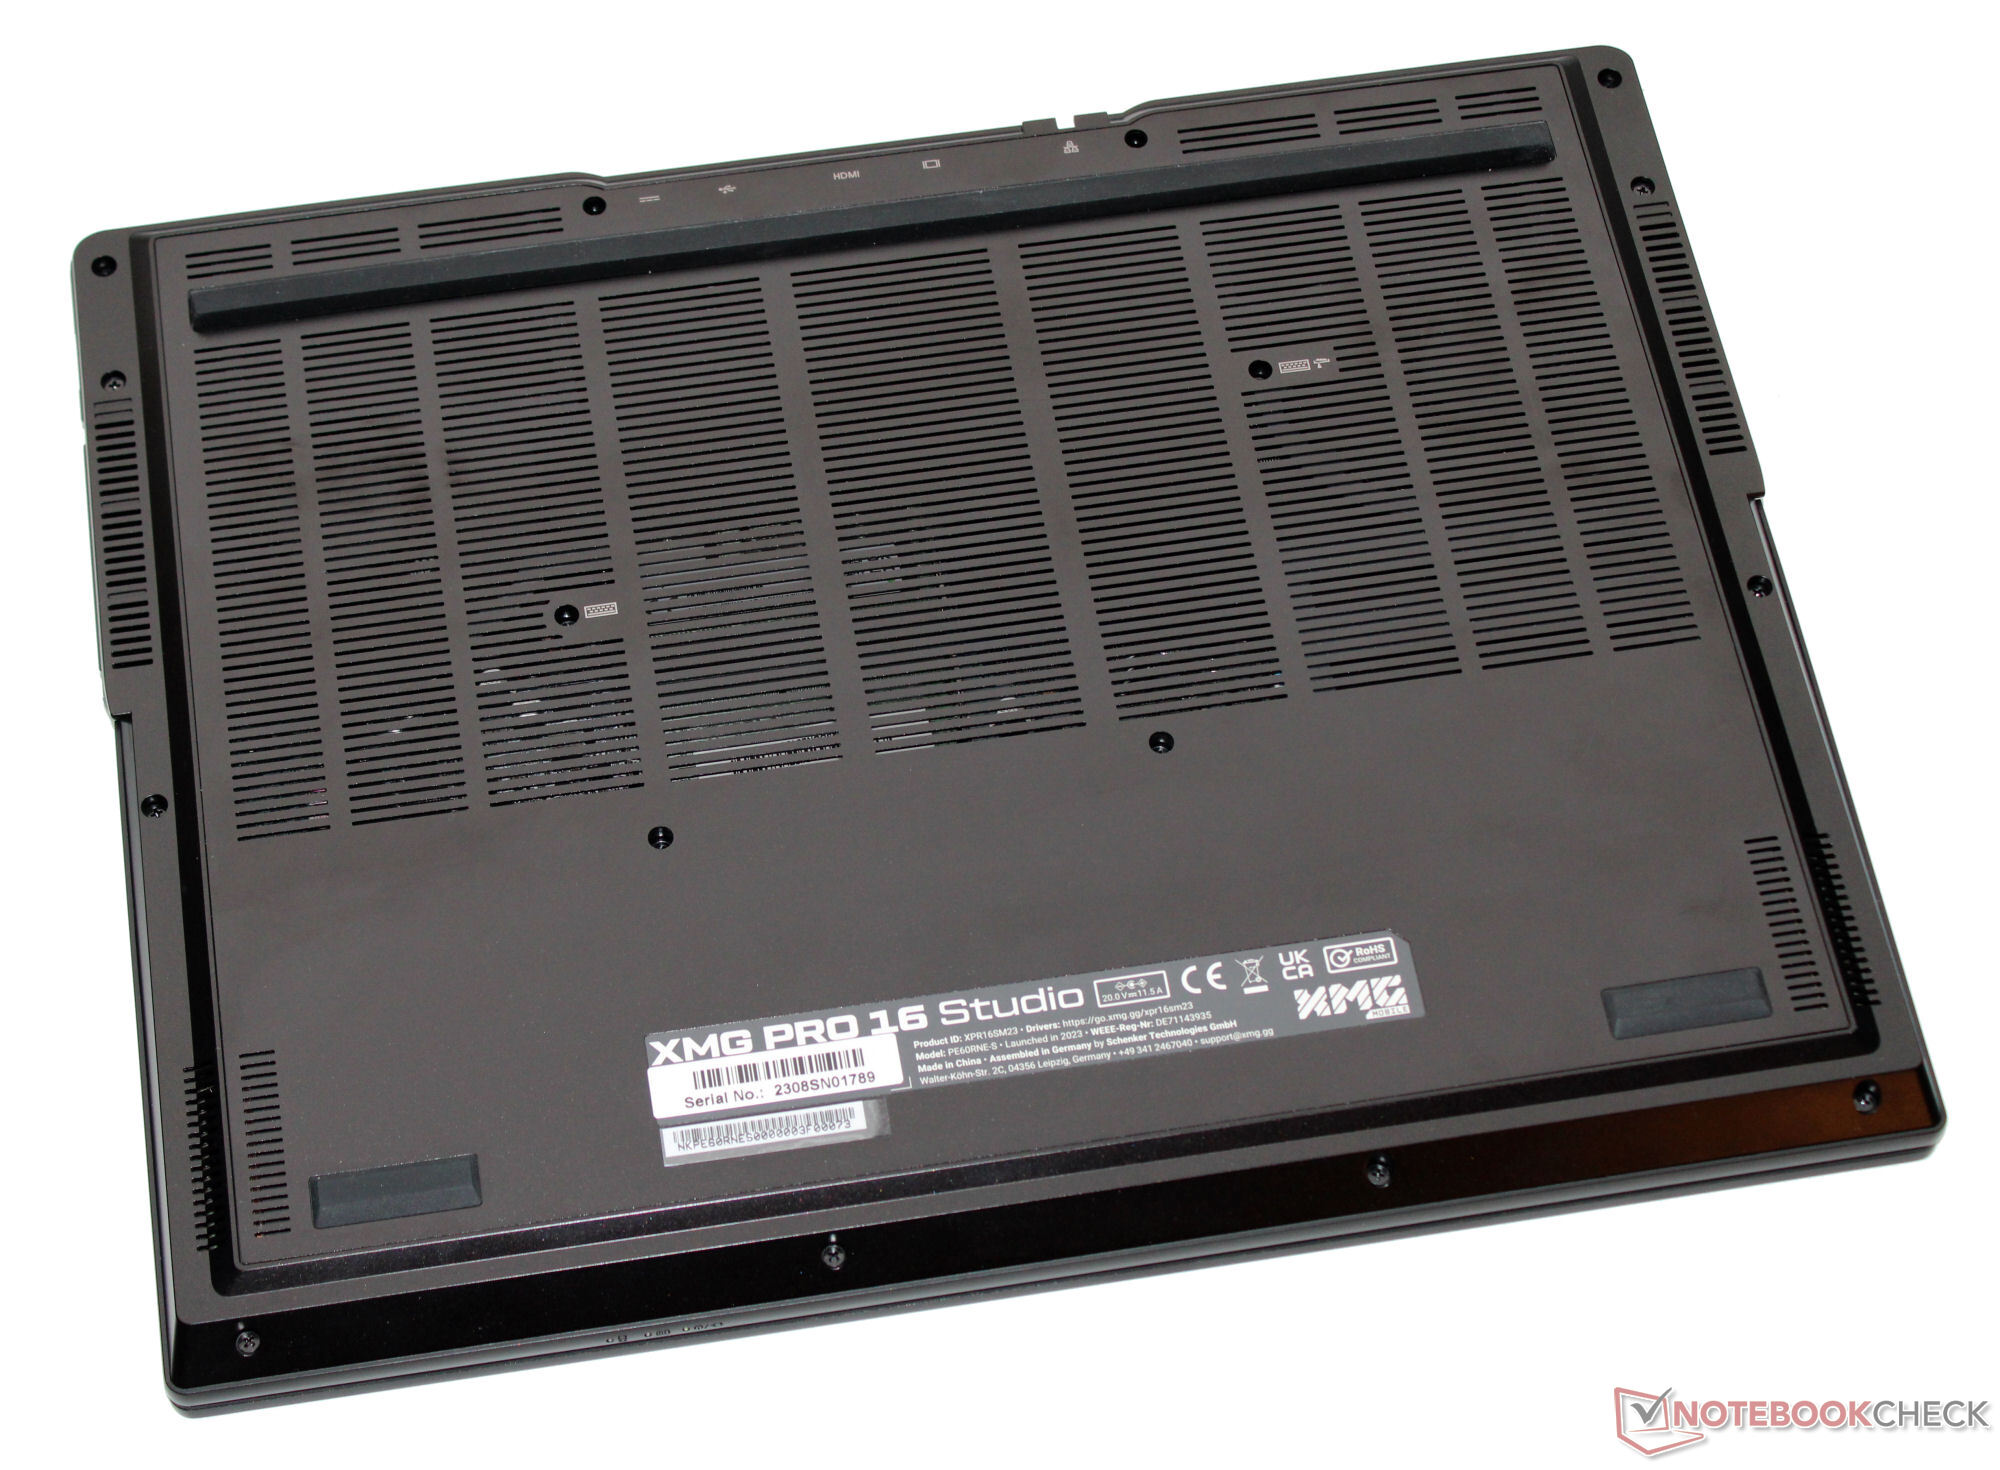
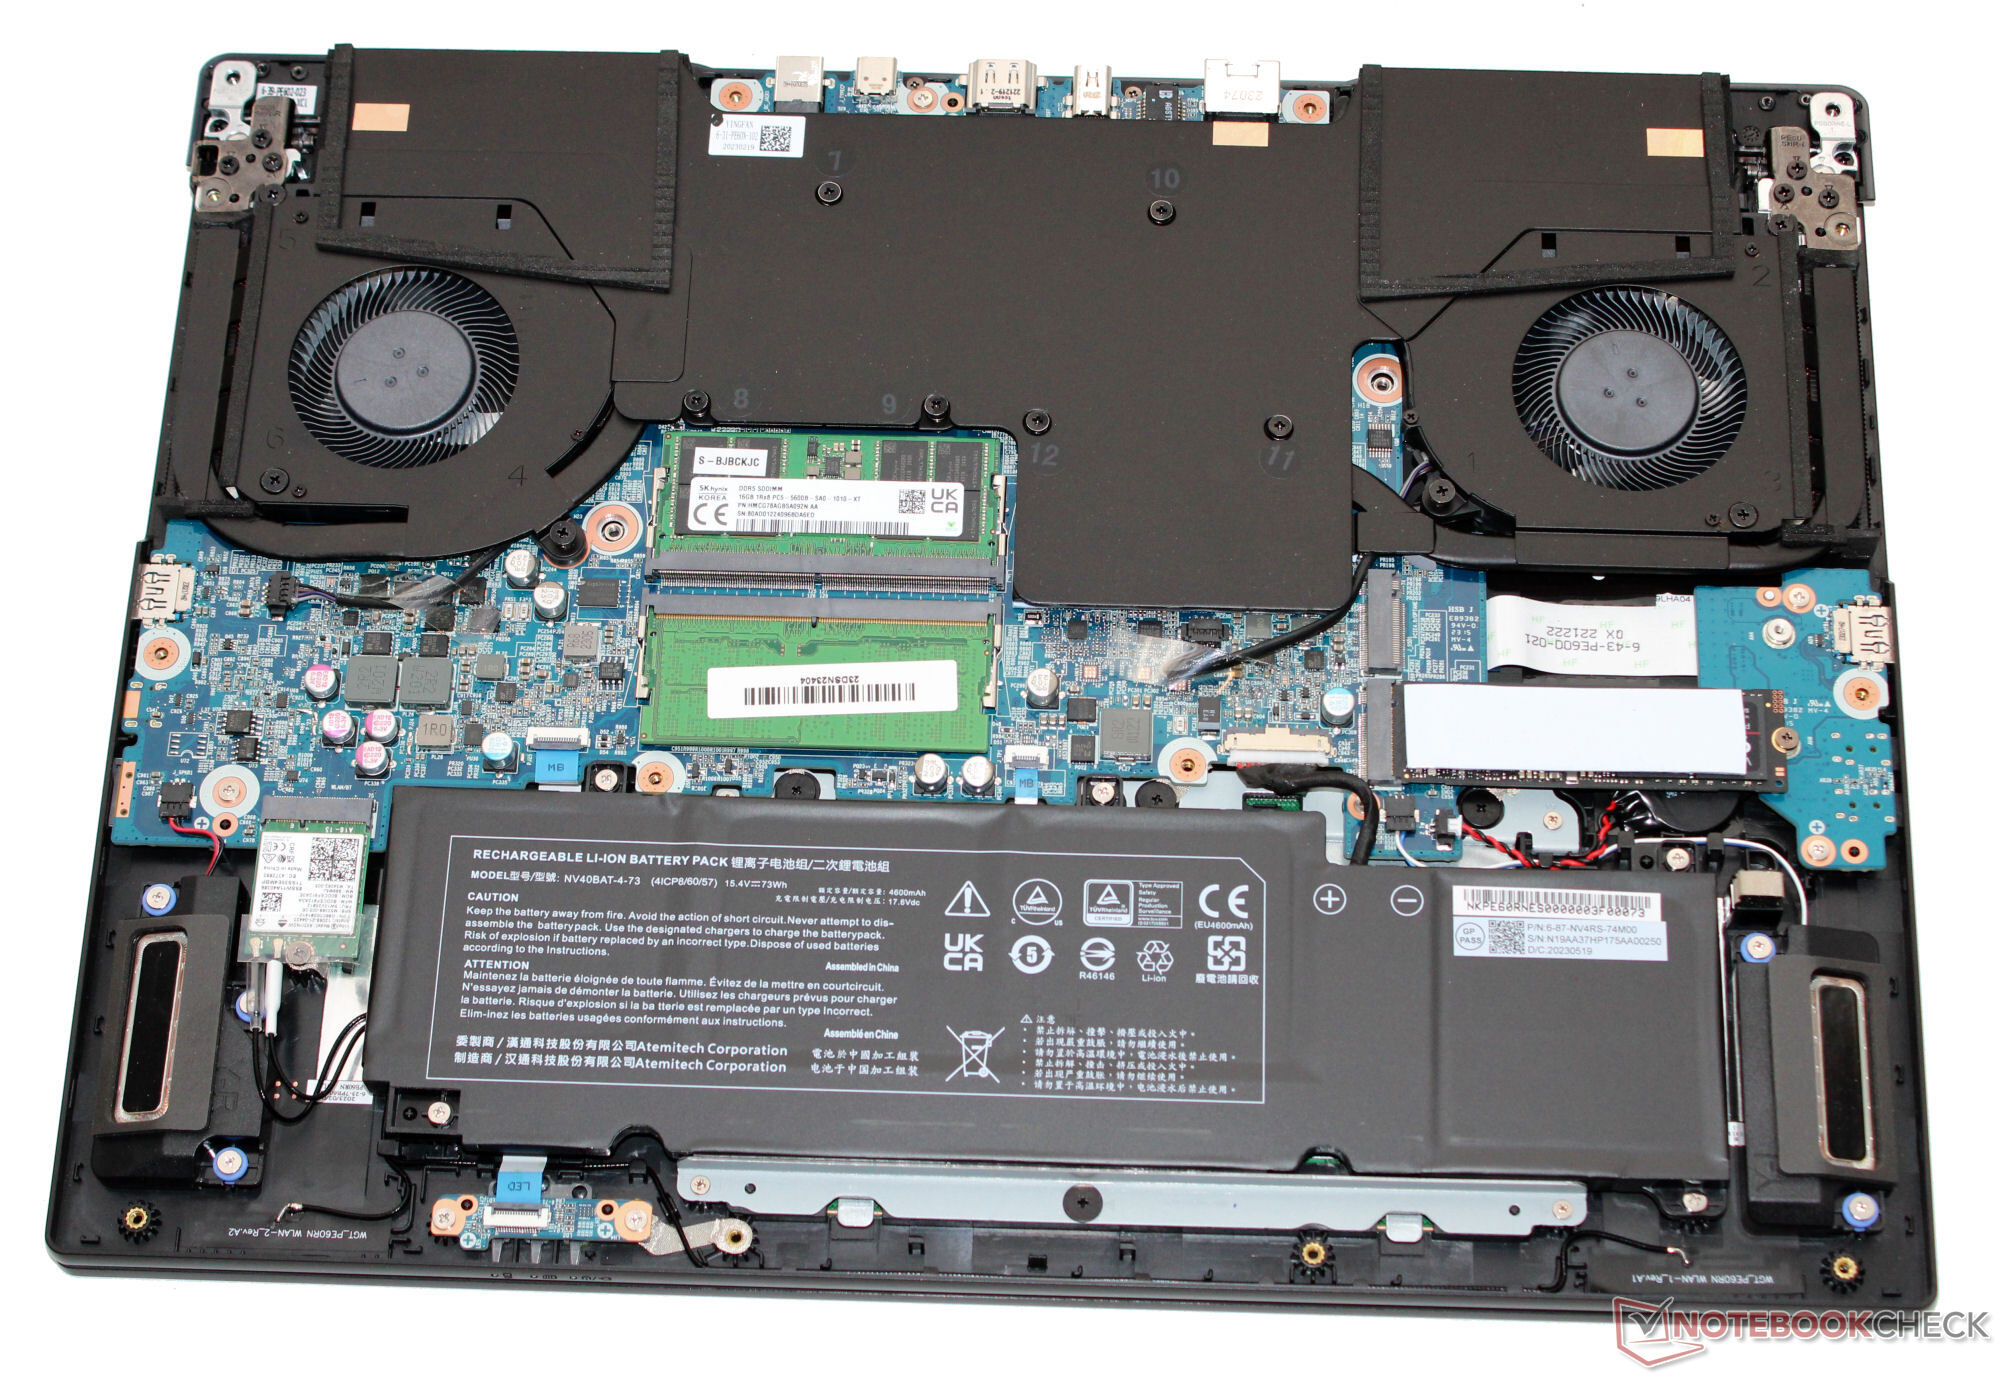
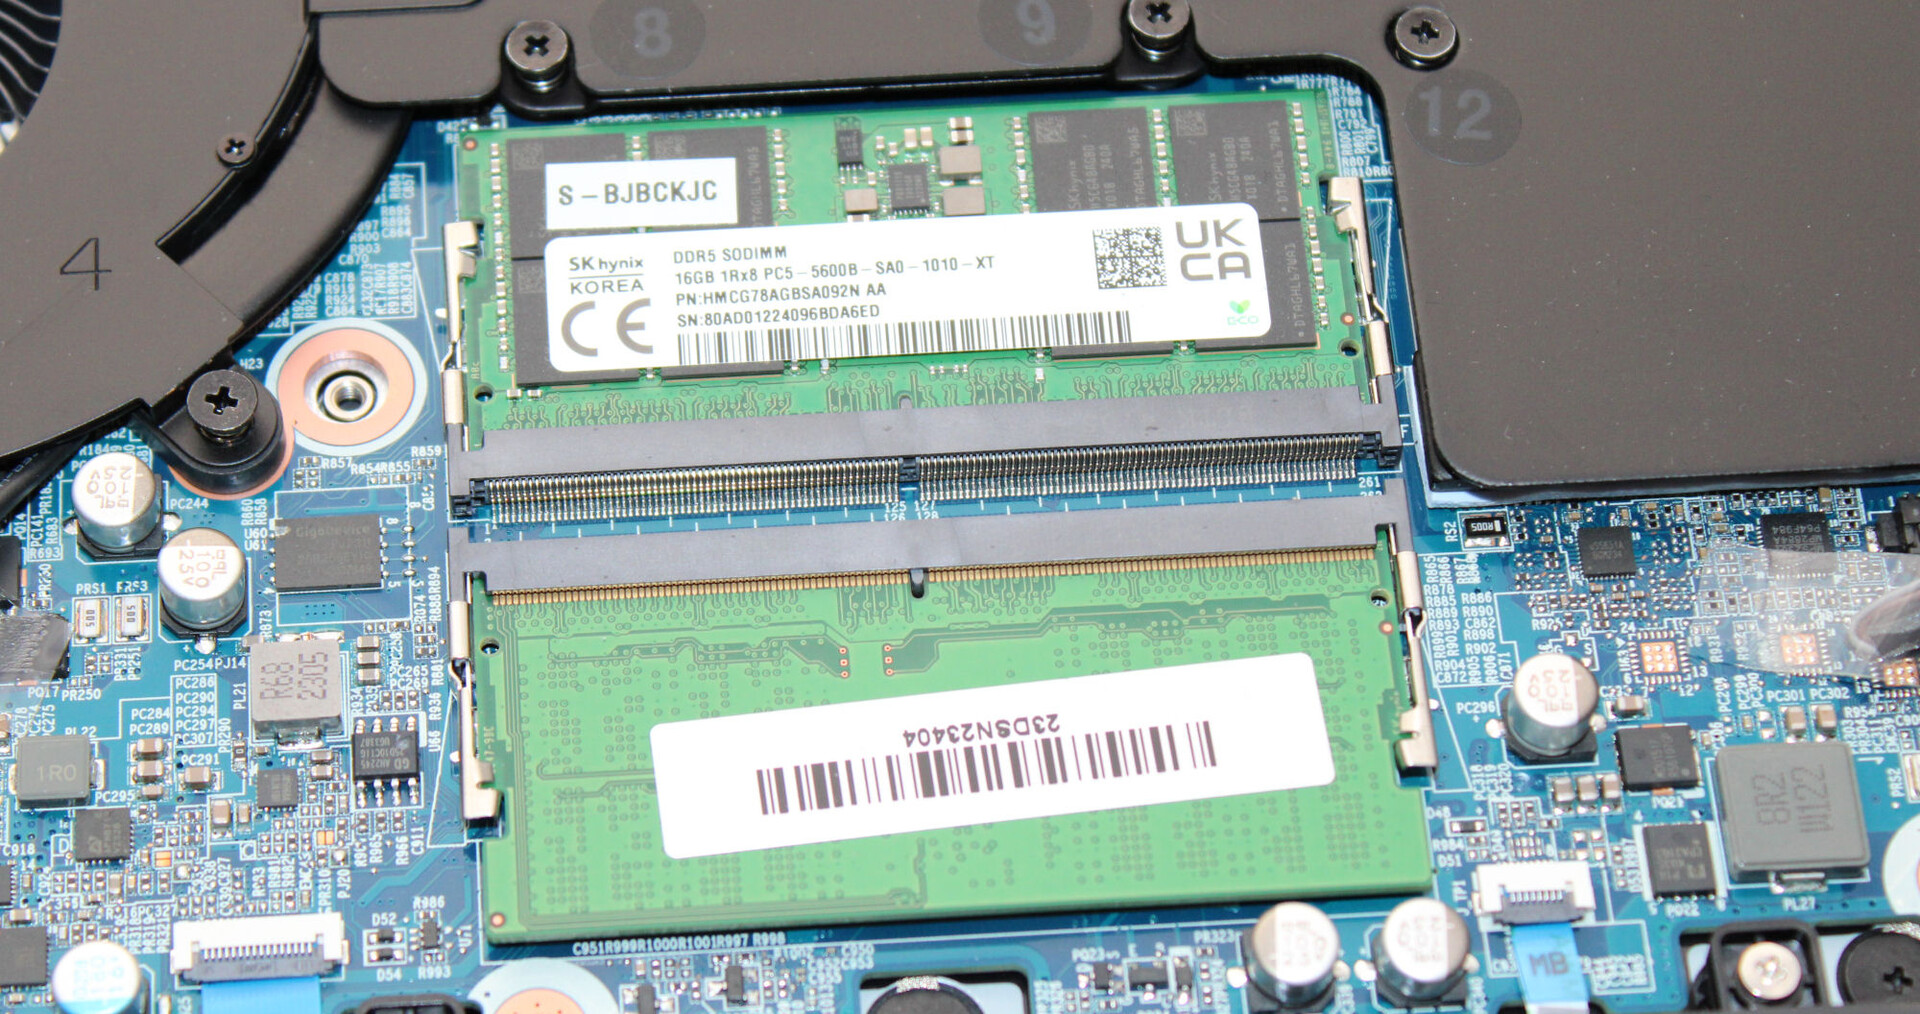
Matowo-czarna pokrywa i spód obudowy wykonane są z aluminium, a reszta z tworzywa sztucznego. Subtelnie zaprojektowana obudowa jest dobrze wykonana. Podstawa i pokrywa mogą być lekko skręcone, ale nie ma się czym martwić. Dostęp do akumulatora (przykręconego, a nie przyklejonego), a także reszty wnętrza laptopa można uzyskać po zdjęciu dolnej płyty.
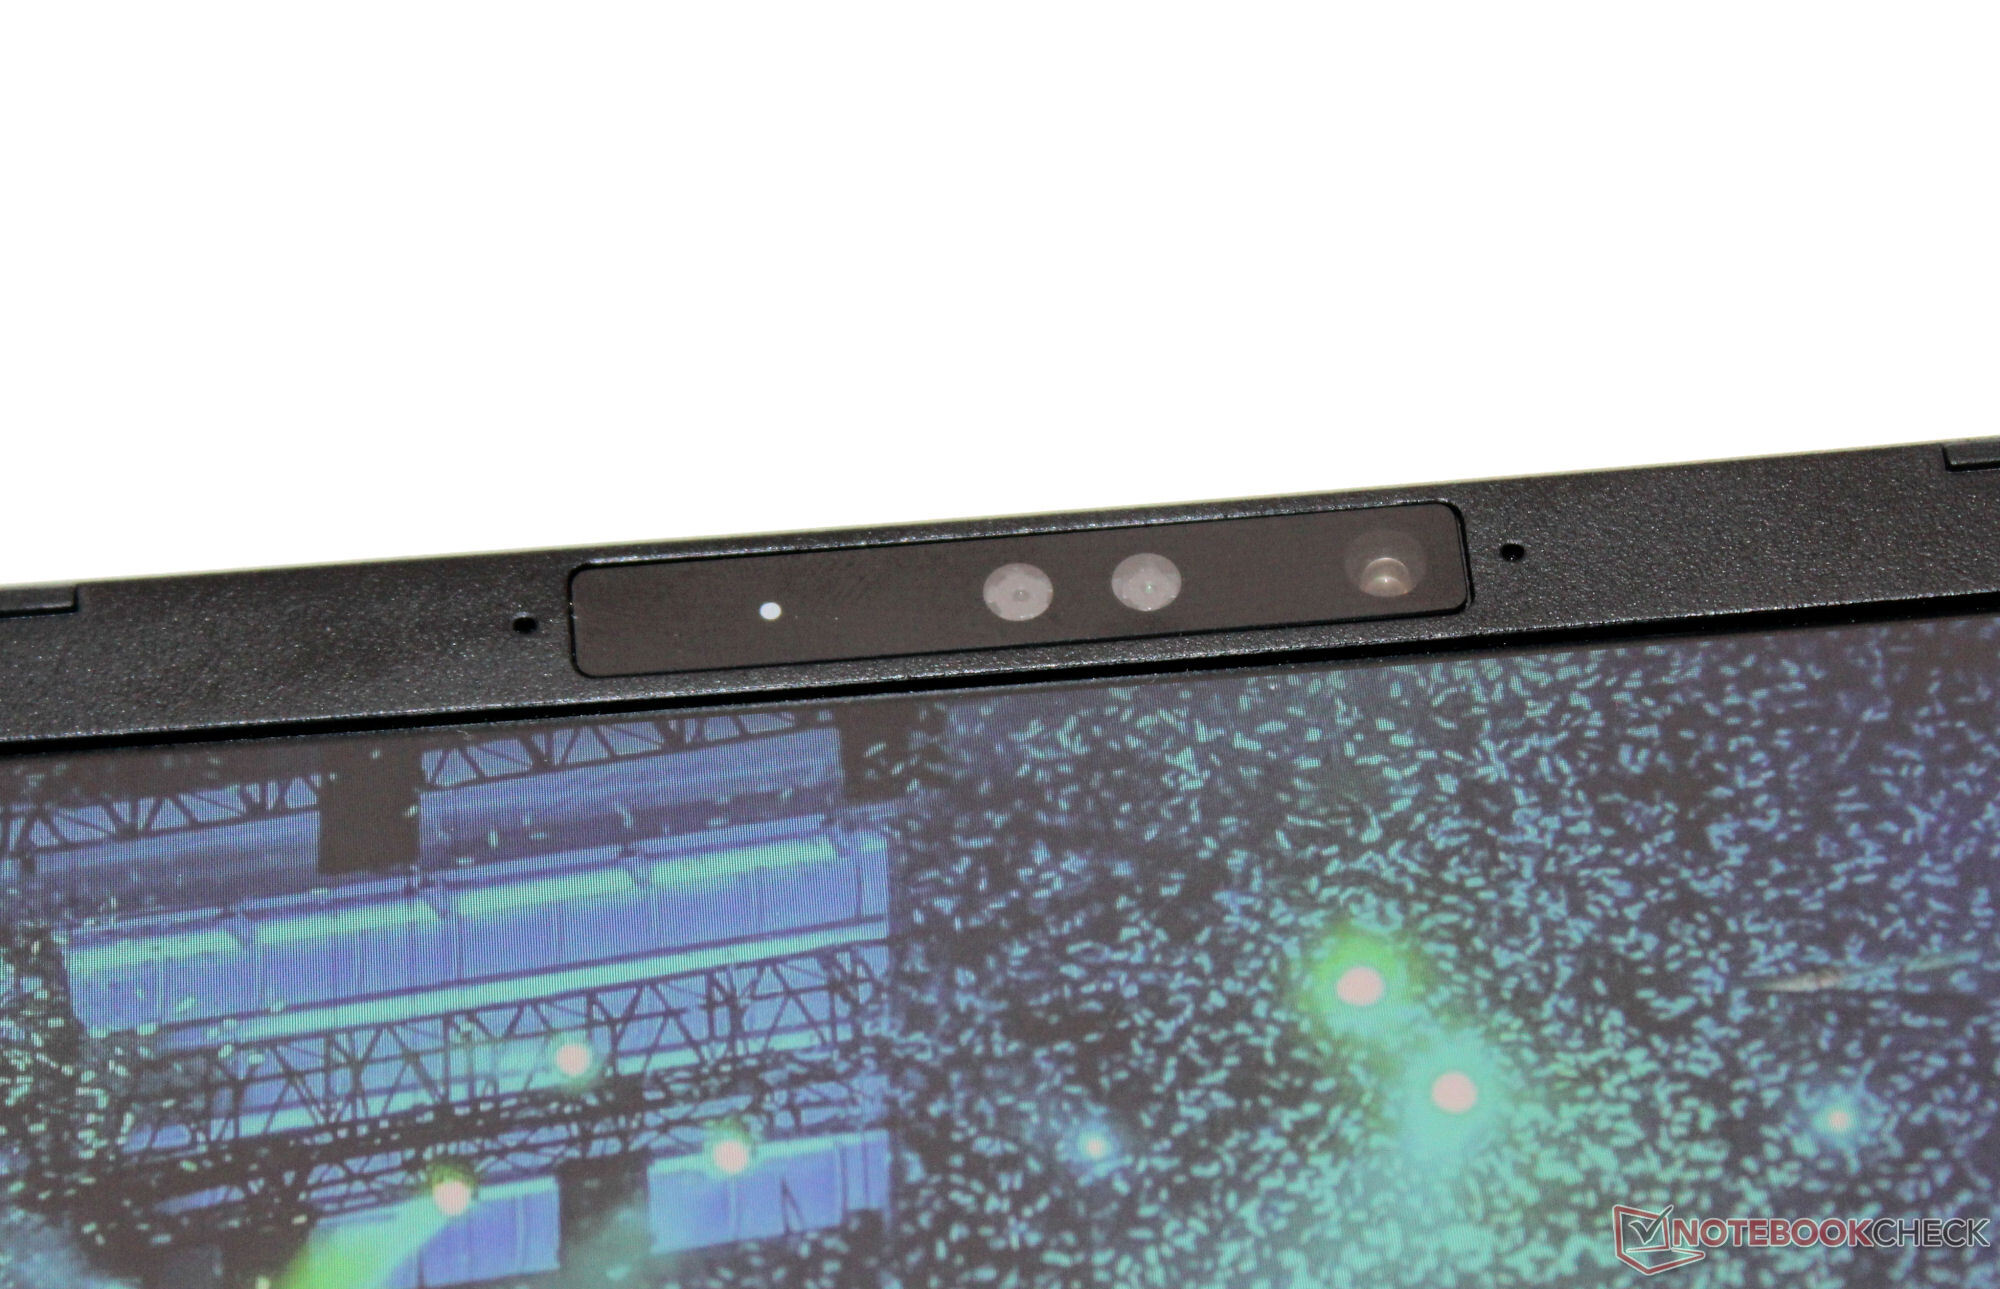
Pro posiada dwa porty USB-A (USB 3.2 Gen 1) i dwa porty USB-C (1x USB 3.2 Gen 2, 1x Thunderbolt 4). Port TB-4 obsługuje funkcję Power Delivery i może wyprowadzać sygnał DisplayPort. Łącznie laptop posiada trzy wyjścia wideo (1x HDMI, 2x DP). Jego czytnik kart MicroSD (karta referencyjna: AV PRO microSD 128 GB V60) można sklasyfikować jako jeden z przeciętnych prędkości. Kamera internetowa (2,1 MP, maks. 1 920 x 1 080 pikseli, bez osłony) jest dość standardowa.
W optymalnych warunkach (brak urządzeń WiFi w pobliżu, niewielka odległość między laptopem a serwerem PC) osiąga doskonałe prędkości transmisji danych WiFi. W laptopie zastosowano układ WiFi 6E (Intel AX211), a za połączenia przewodowe odpowiada kontroler Realtek RTL8125 (2,5 GBit/s).
| SD Card Reader | |
| average JPG Copy Test (av. of 3 runs) | |
| MSI Stealth 16 Studio A13VG | |
| Średnia w klasie Gaming (20.9 - 210, n=54, ostatnie 2 lata) | |
| Asus Vivobook Pro 16X K6604JV-MX016W | |
| Schenker XMG Pro 16 Studio (Mid 23) (AV PRO microSD 128 GB V60) | |
| Lenovo Legion Slim 7i 16 Gen 8 (Toshiba Exceria Pro SDXC 64 GB UHS-II) | |
| maximum AS SSD Seq Read Test (1GB) | |
| MSI Stealth 16 Studio A13VG | |
| Średnia w klasie Gaming (25.5 - 261, n=51, ostatnie 2 lata) | |
| Asus Vivobook Pro 16X K6604JV-MX016W | |
| Schenker XMG Pro 16 Studio (Mid 23) (AV PRO microSD 128 GB V60) | |
| Lenovo Legion Slim 7i 16 Gen 8 (Toshiba Exceria Pro SDXC 64 GB UHS-II) | |

 GeForce RTX 4070 Laptop GPU, i9-13900H, Samsung 990 Pro 1 TB")
 GeForce RTX 4070 Laptop GPU, i9-13900H, Samsung 990 Pro 1 TB")
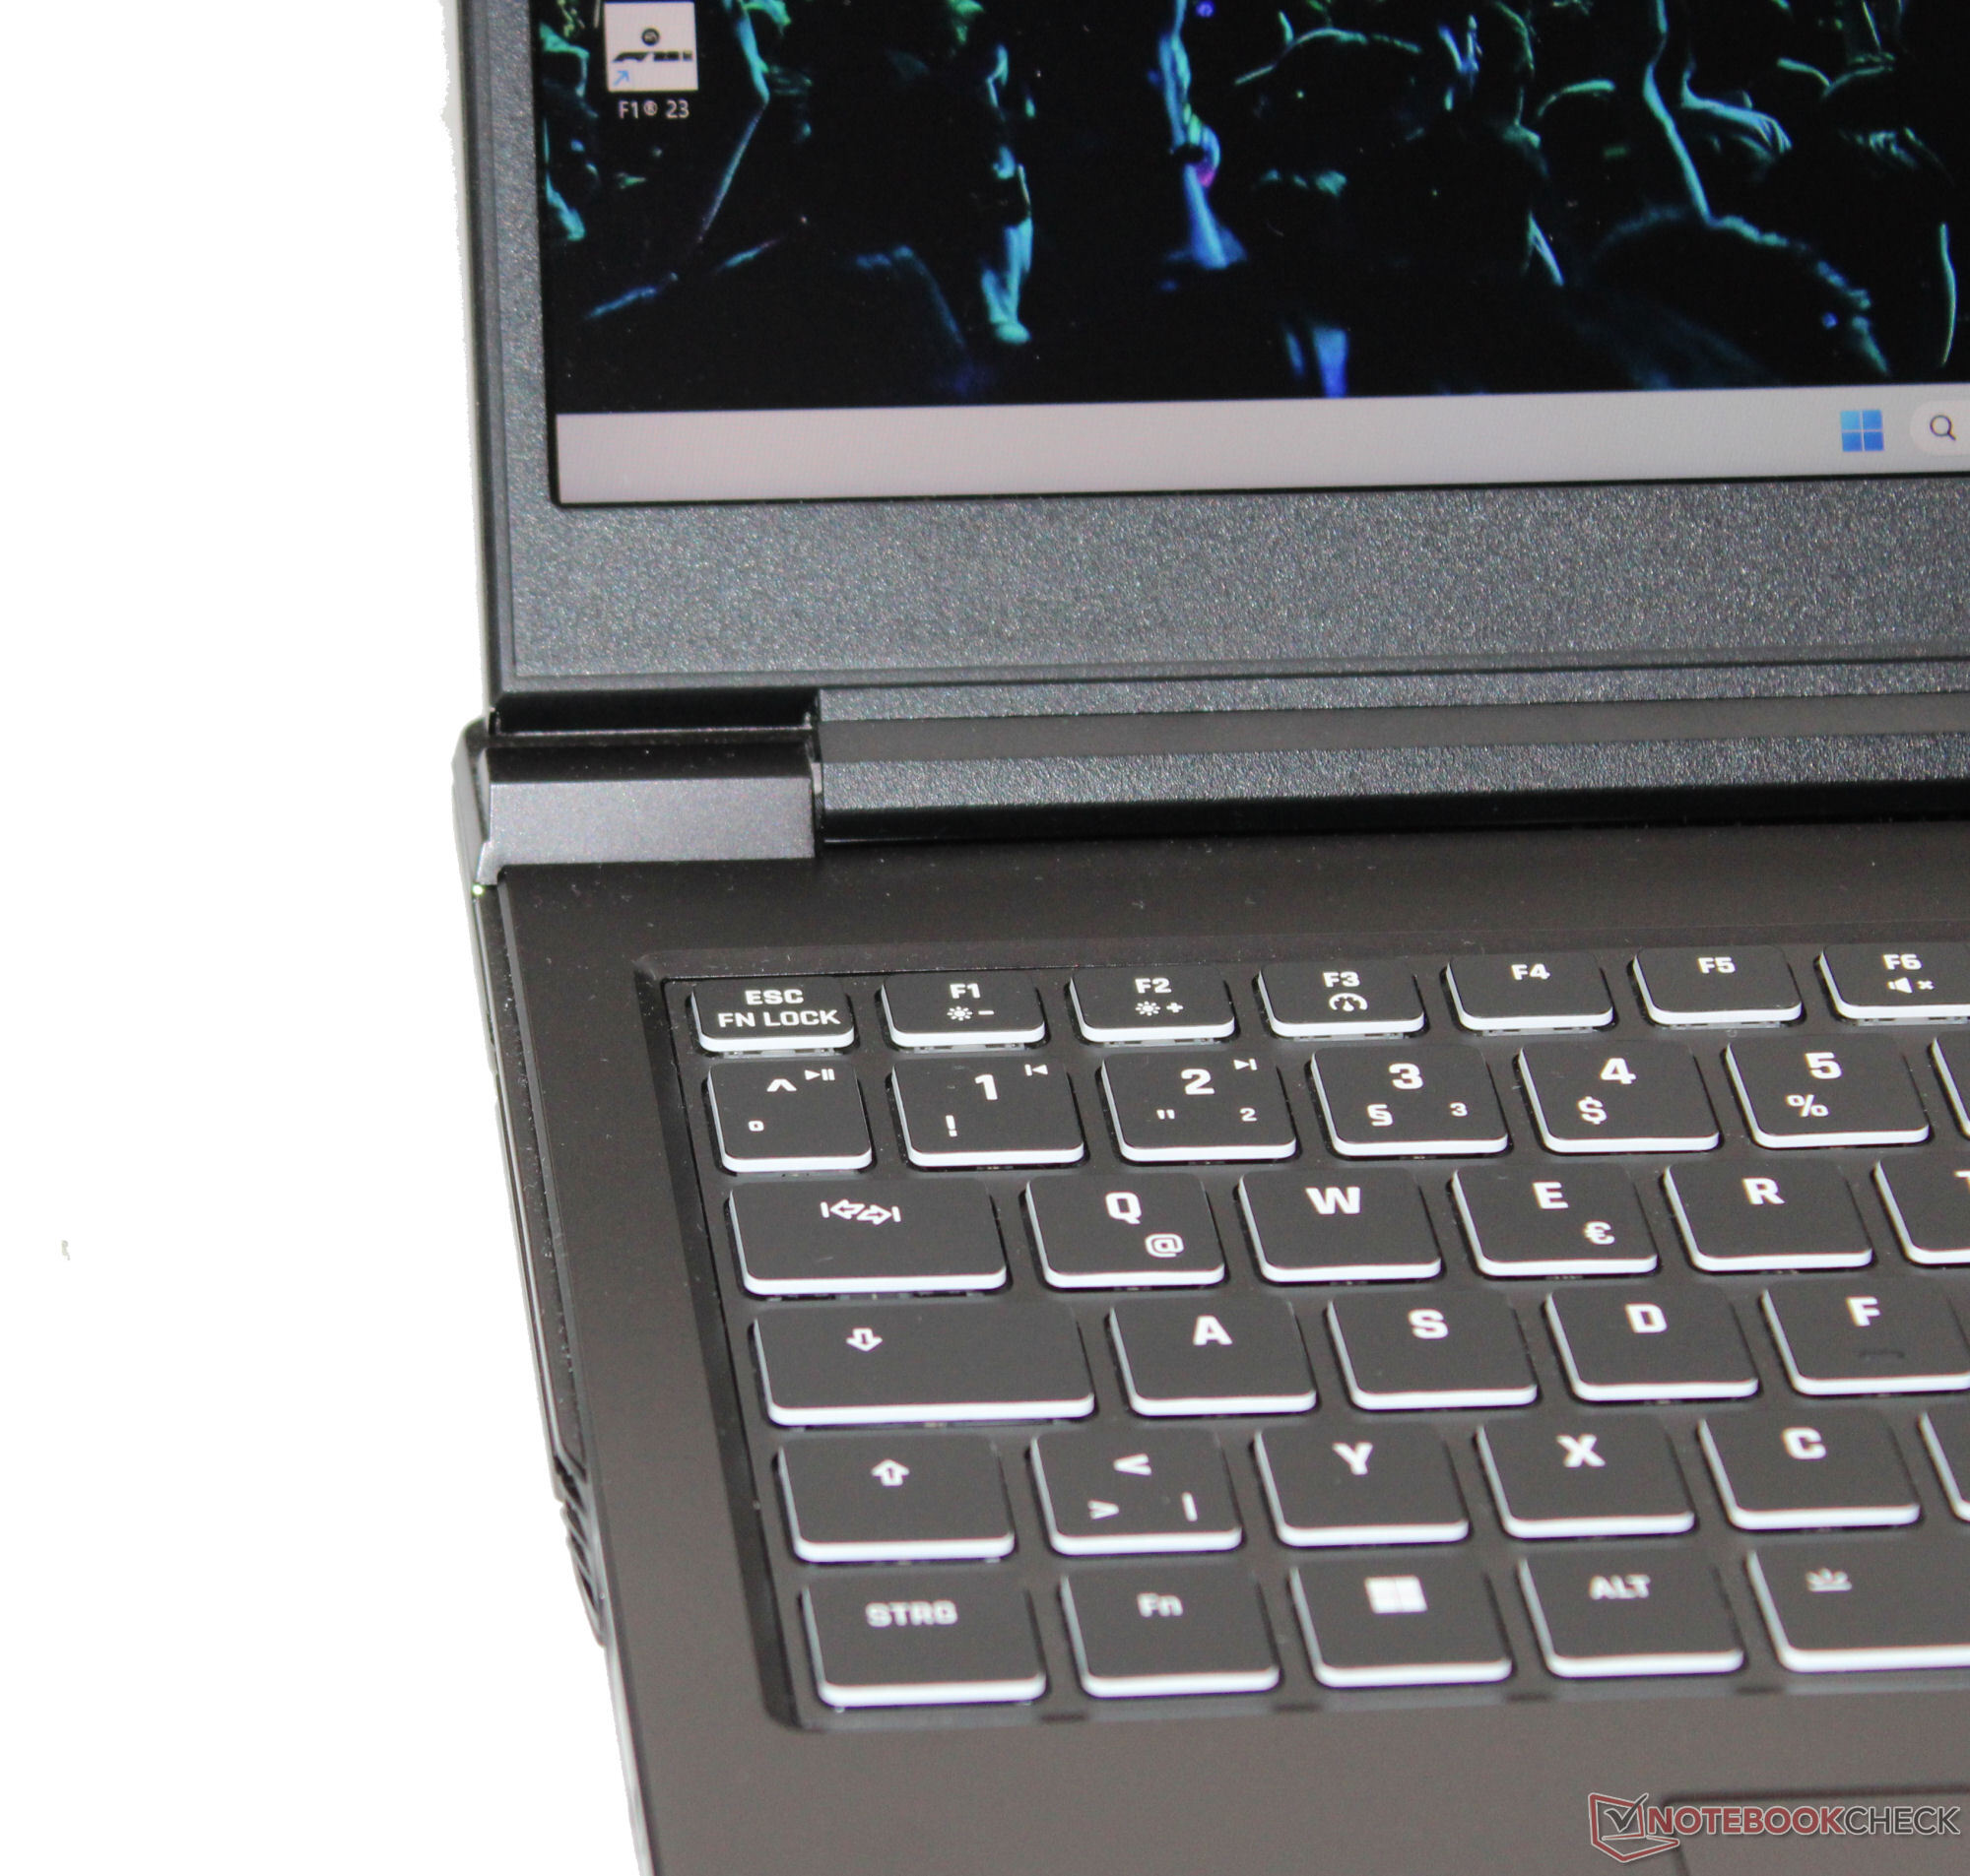
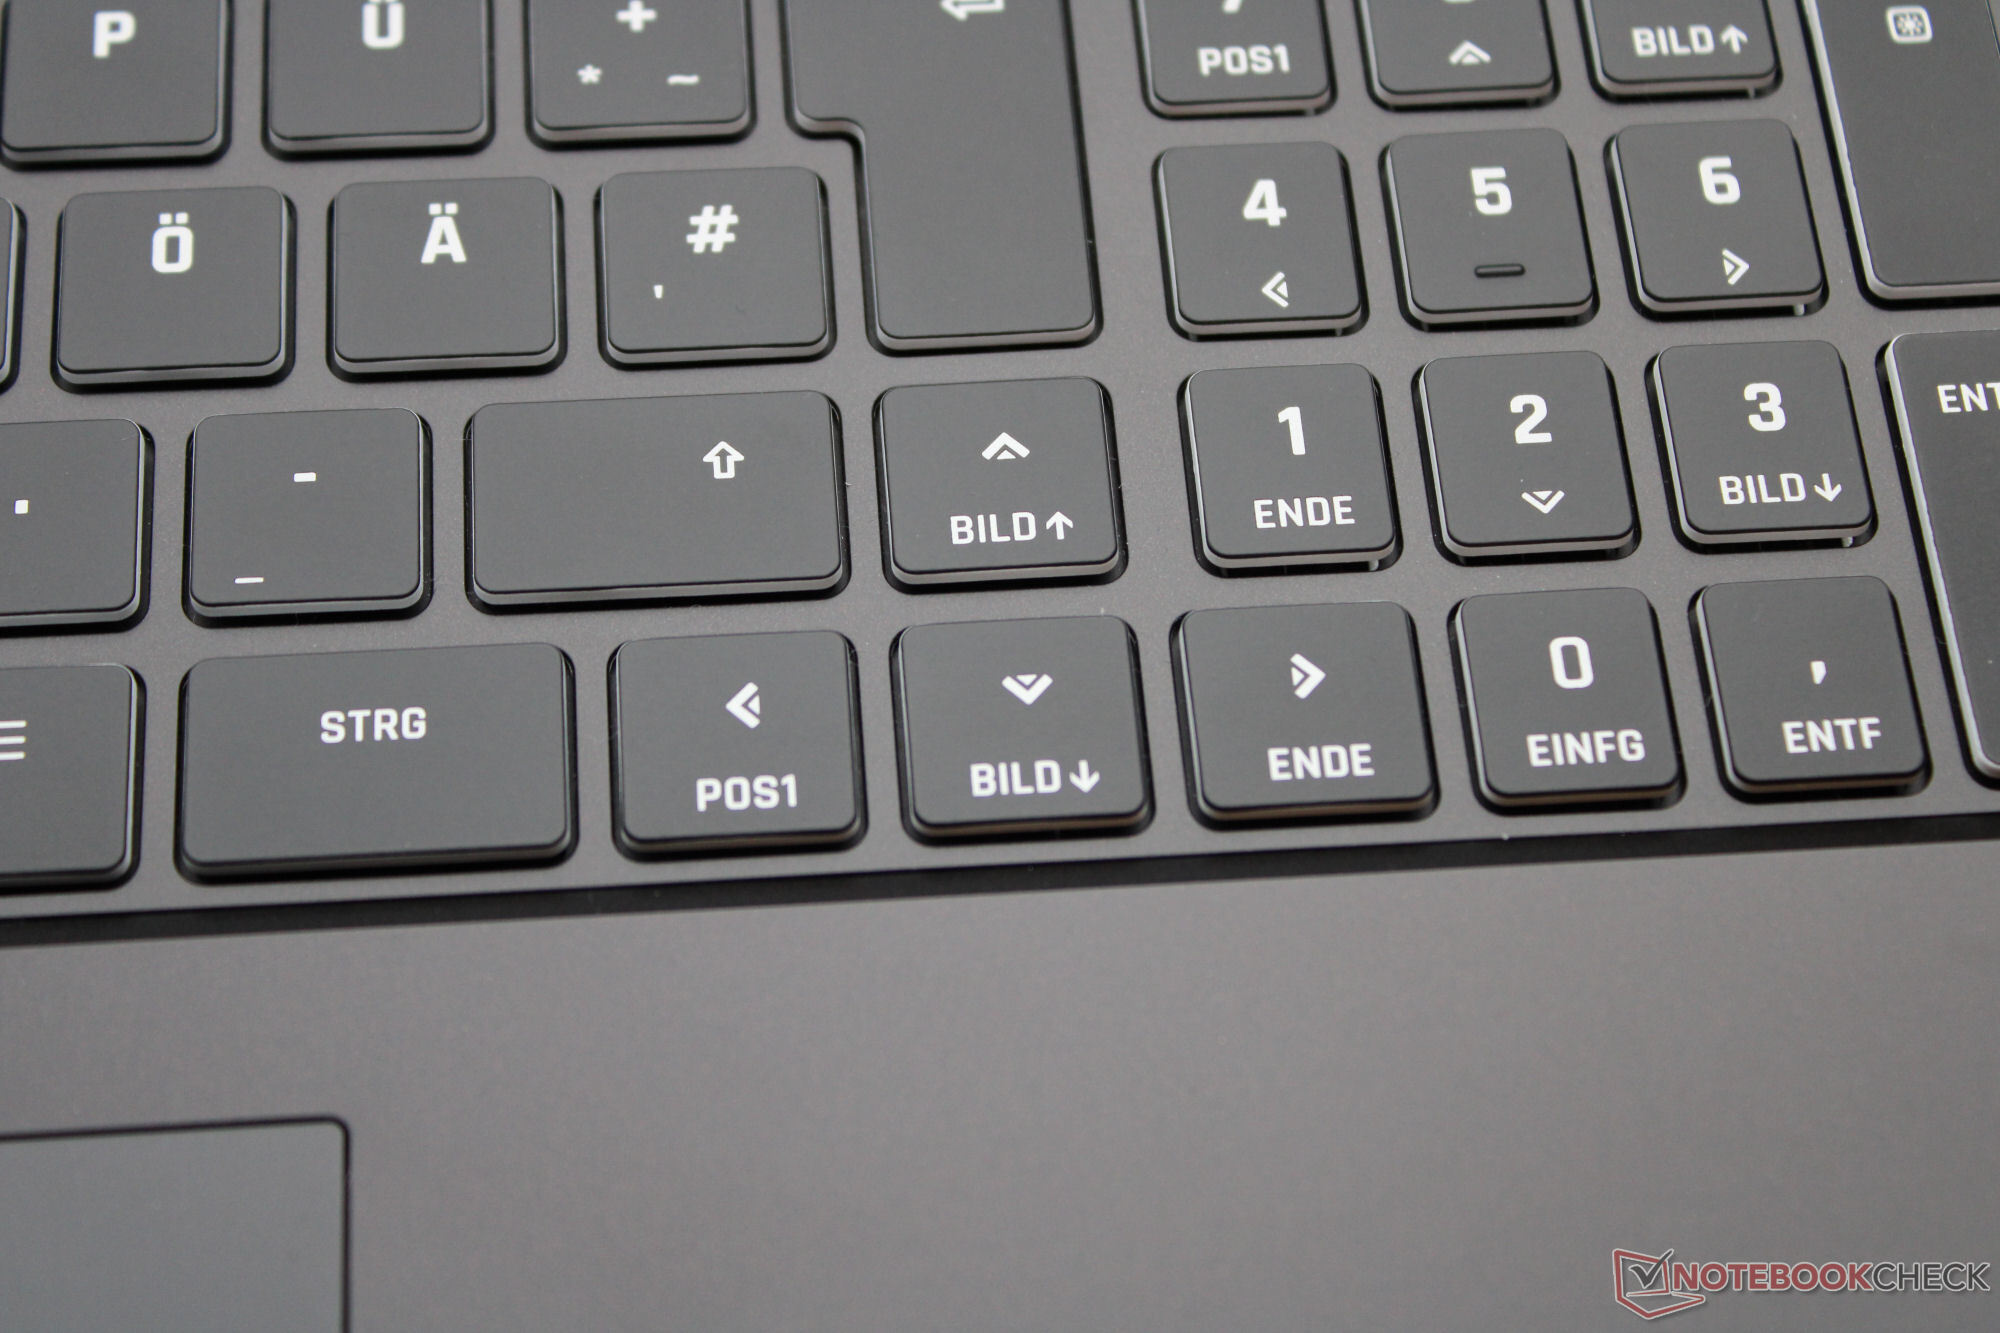
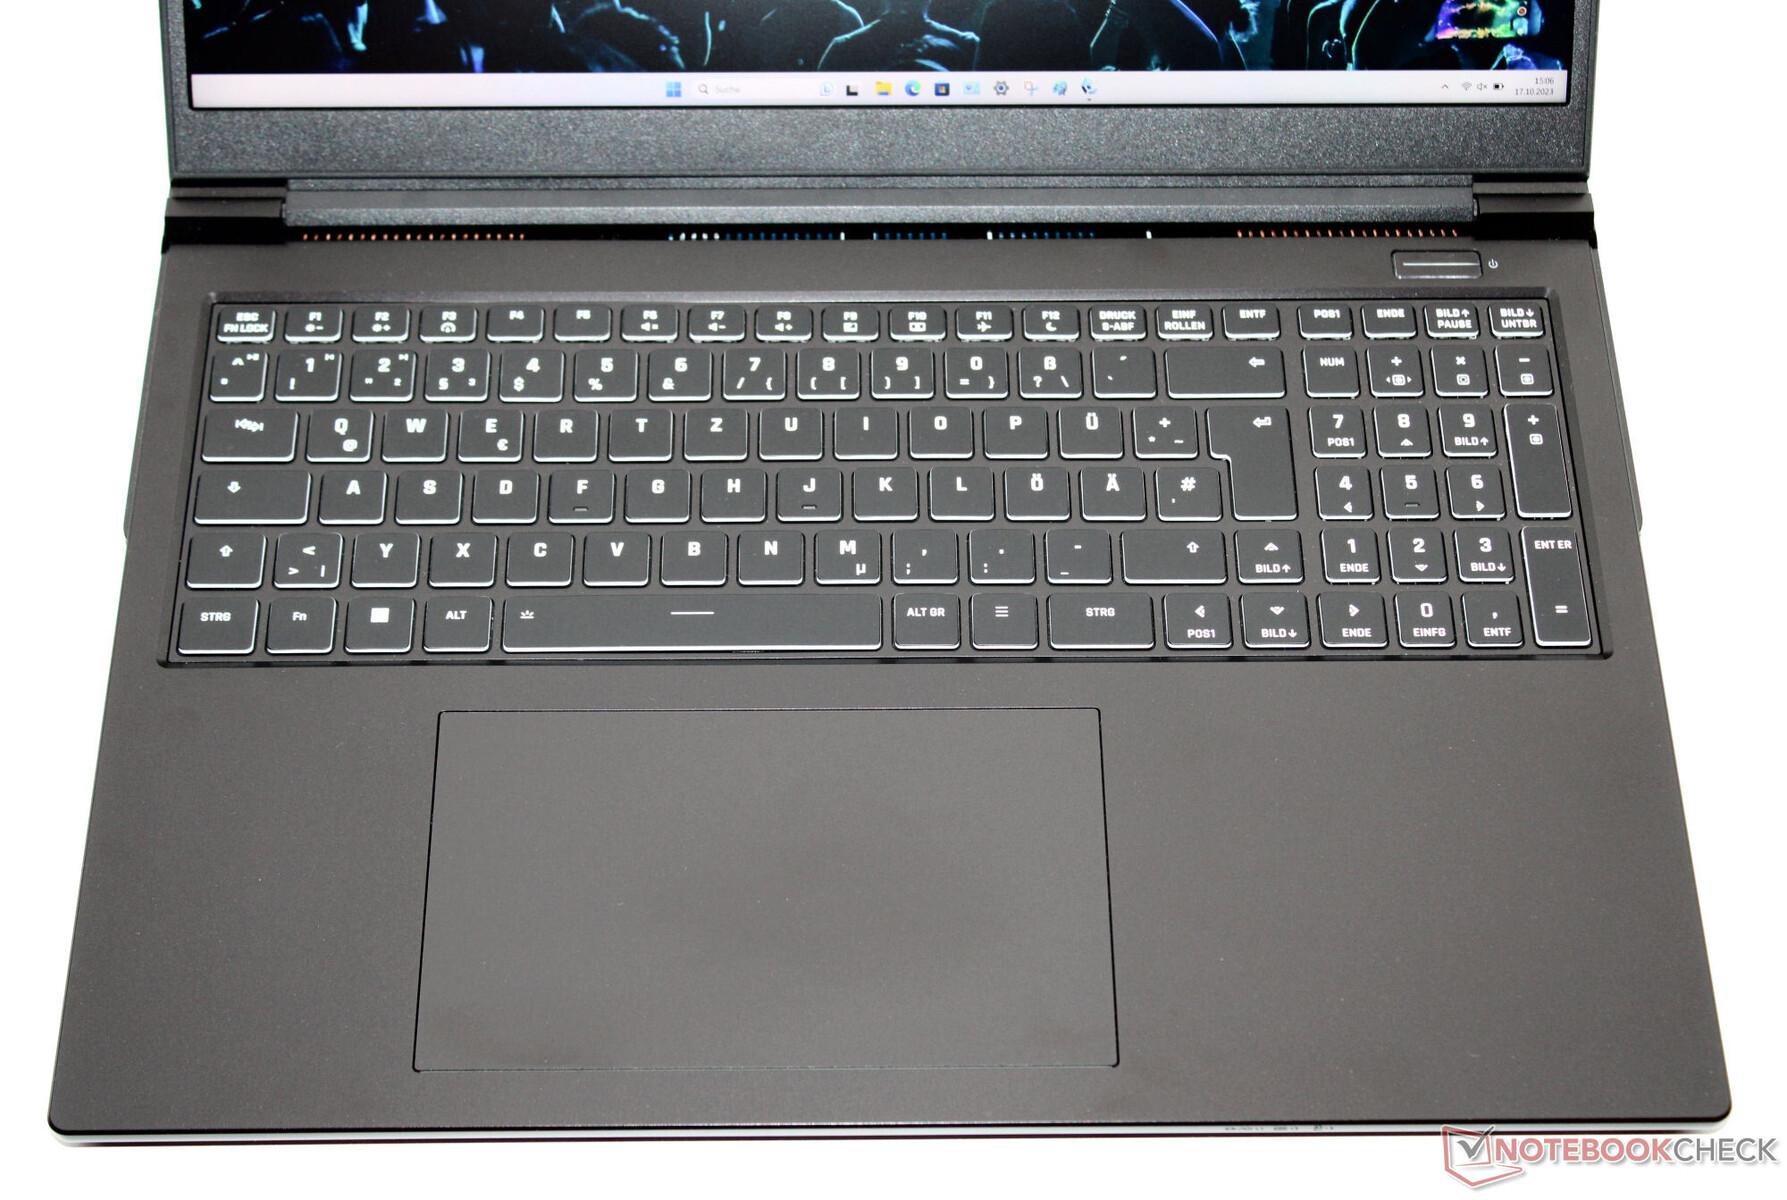
Urządzenia wejściowe - laptop XMG posiada podświetlane klawisze
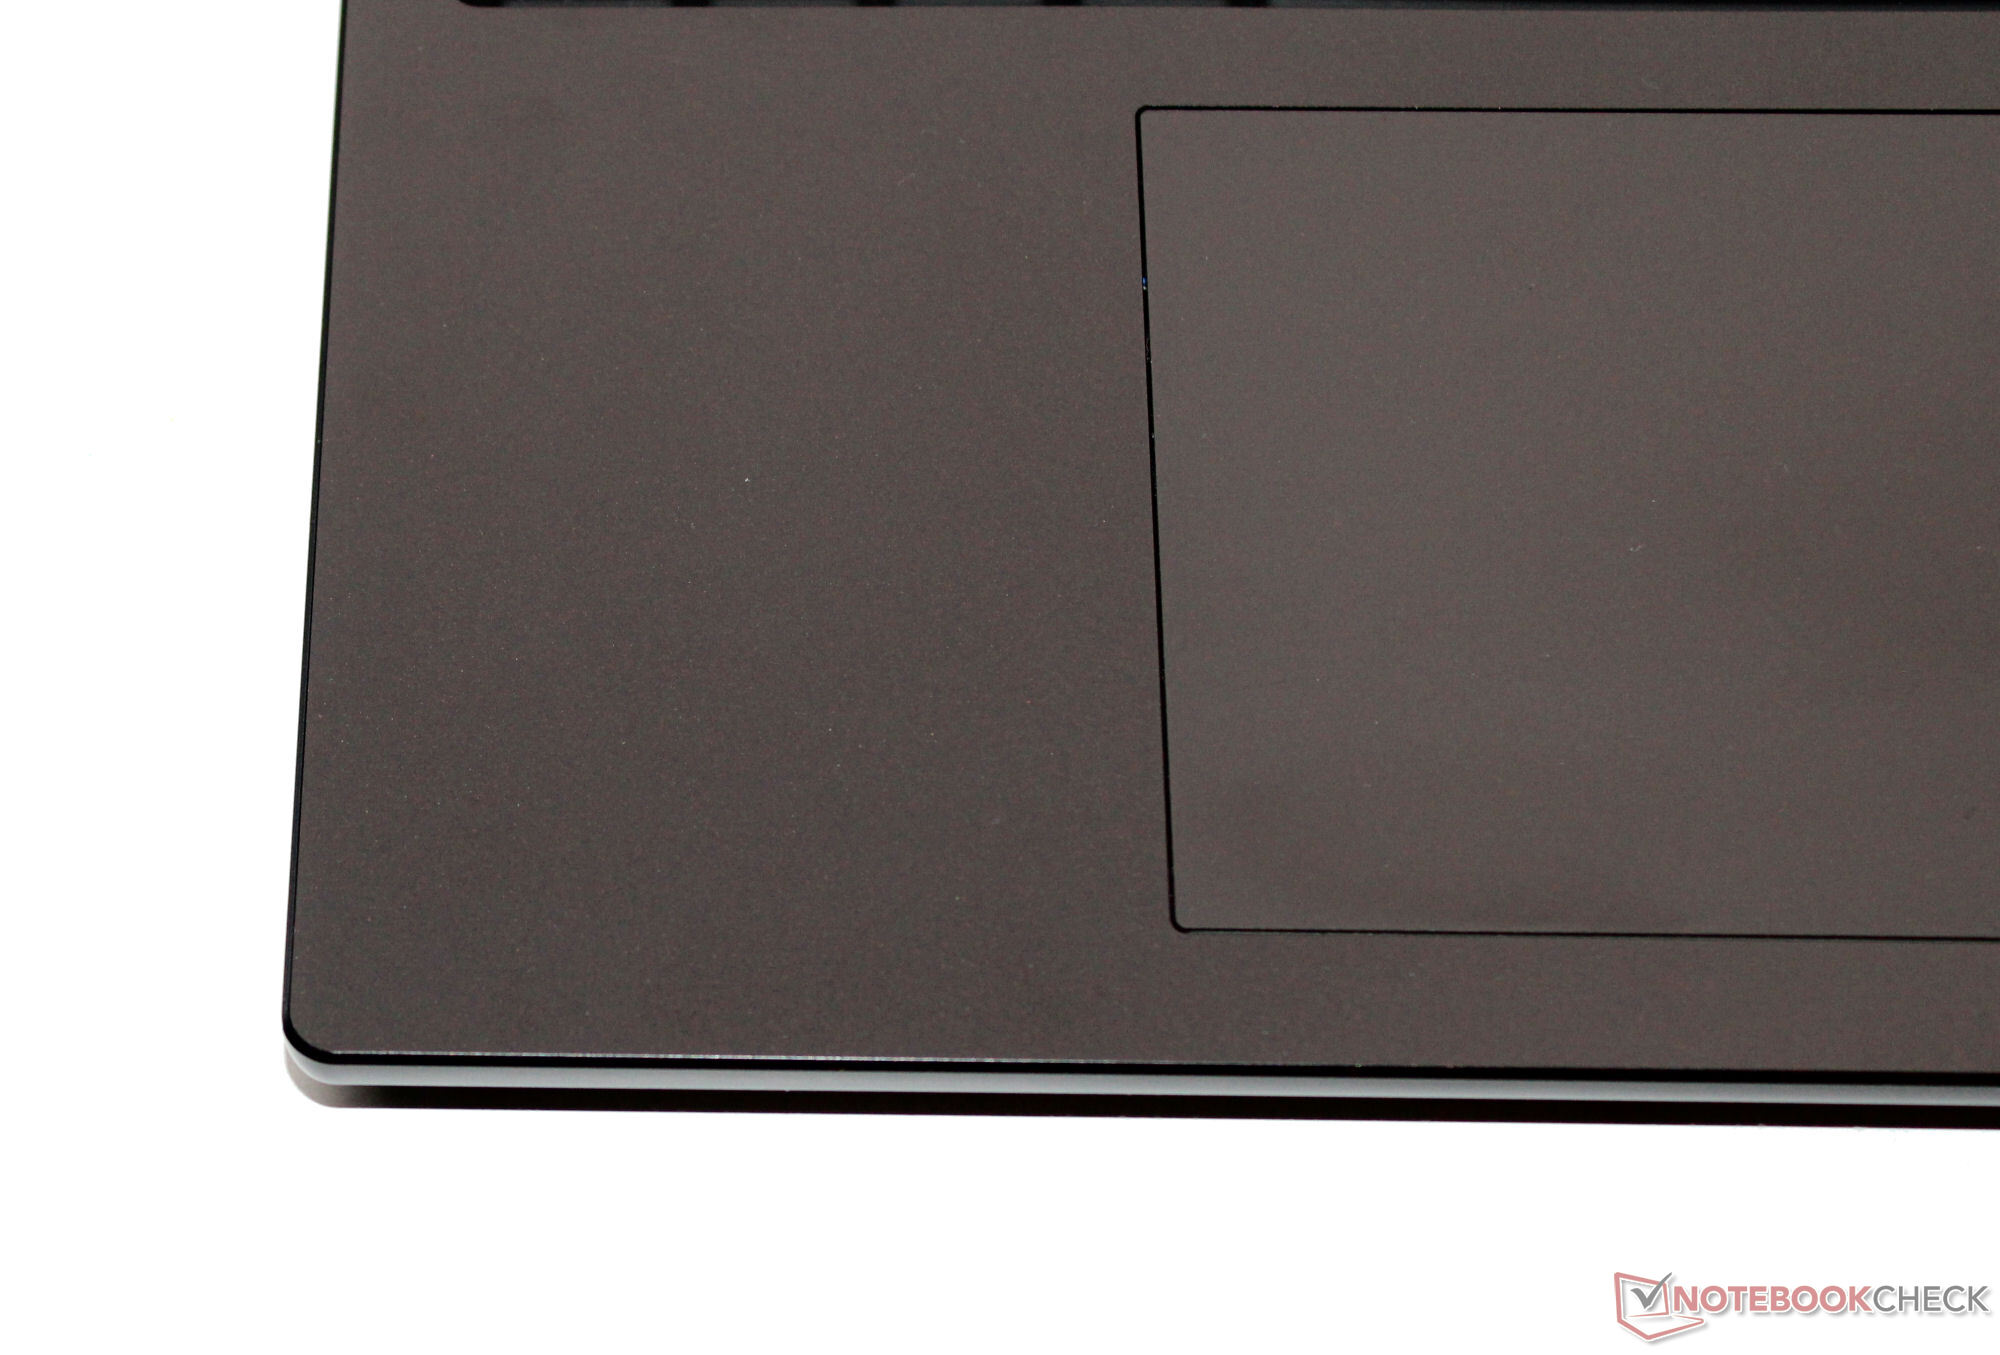
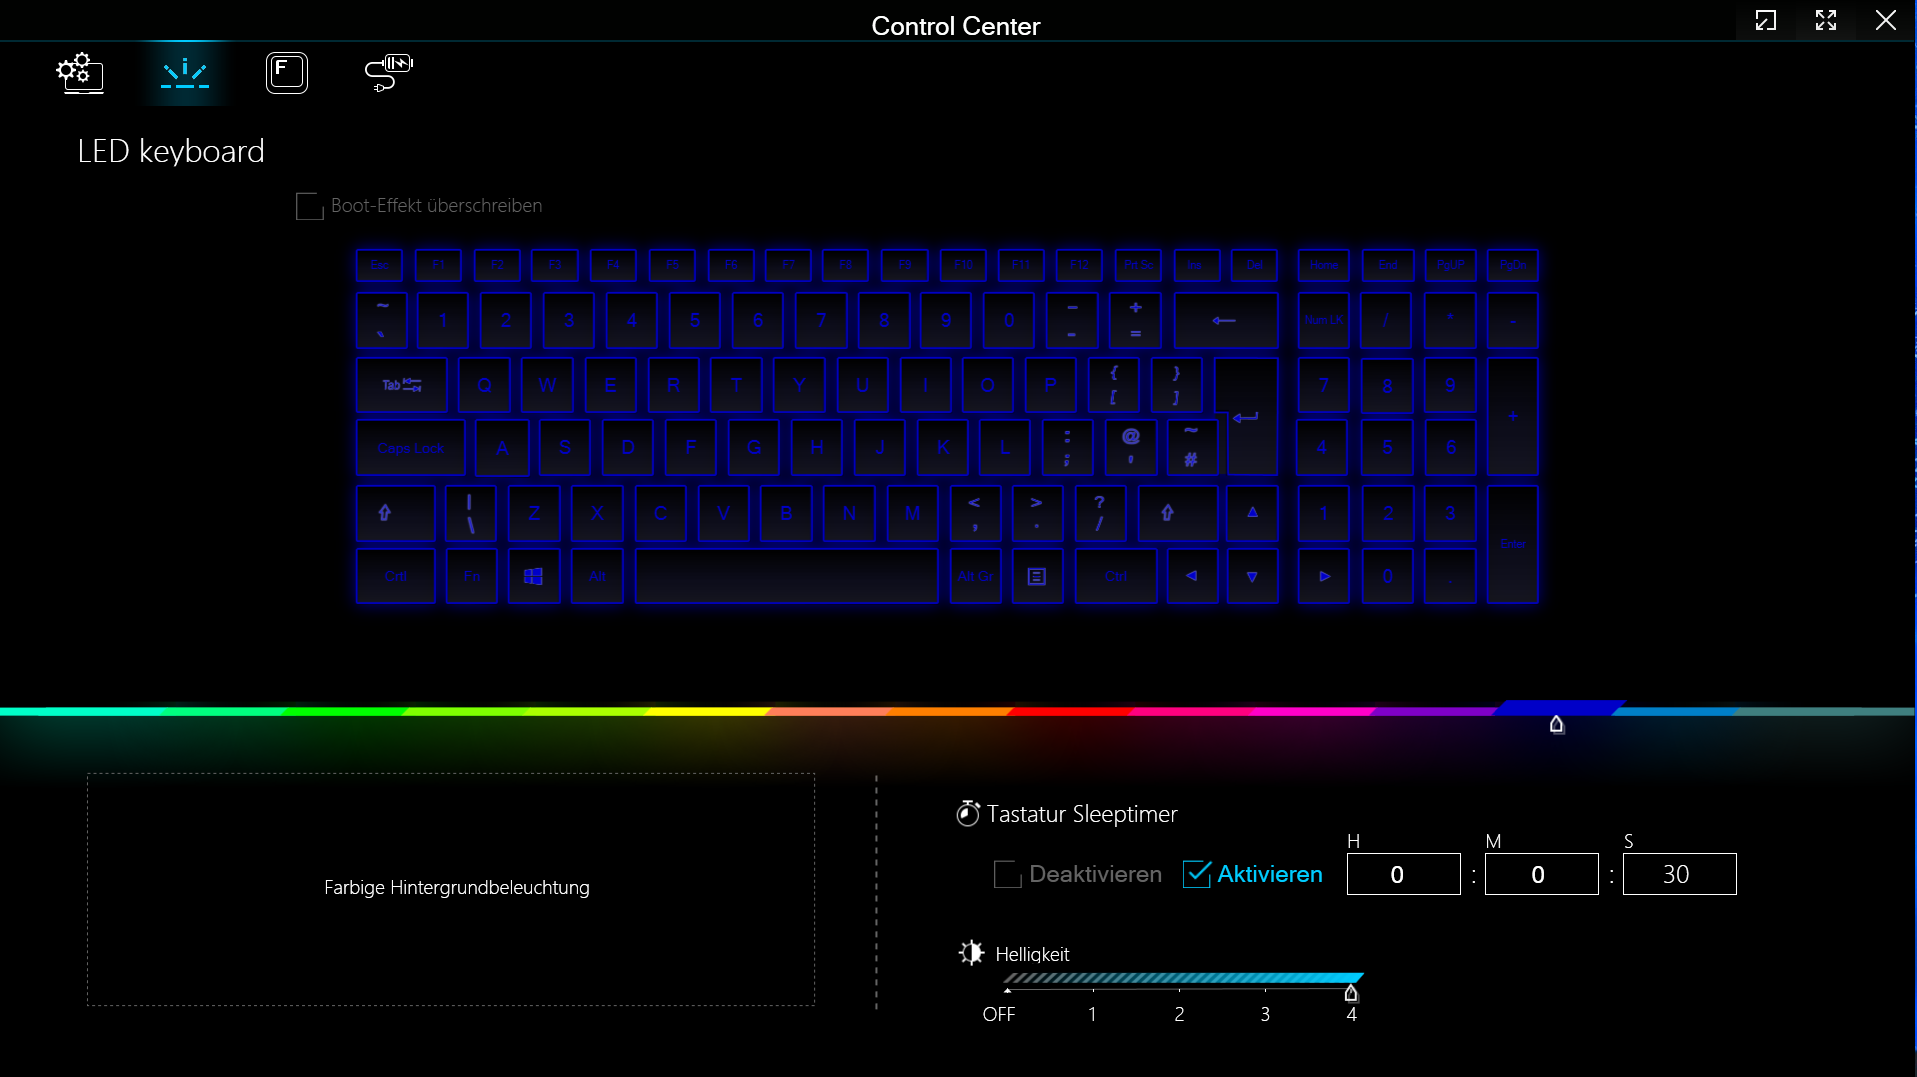
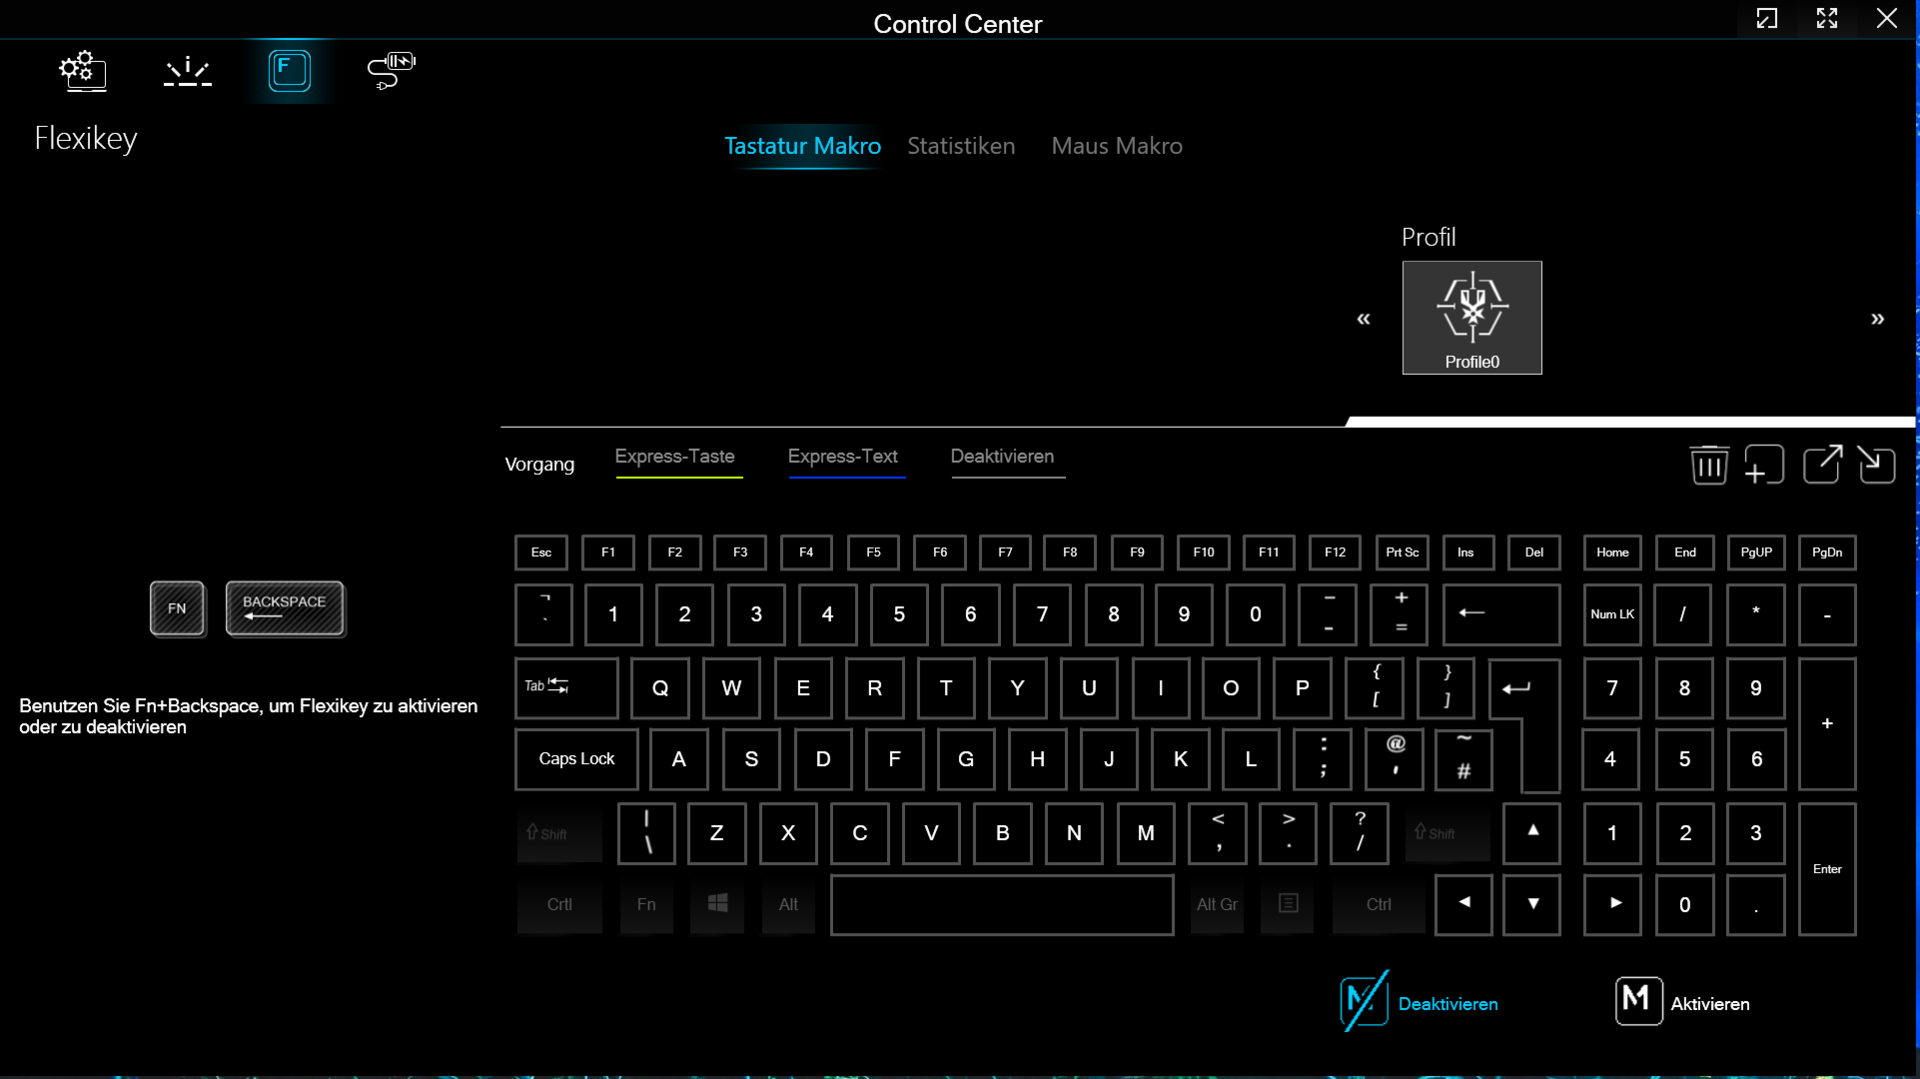
Równe, gładkie klawisze klawiatury typu chiclet (podświetlenie RGB) charakteryzują się średnim skokiem i wyraźnym punktem nacisku. Opór klawiszy mógłby być nieco bardziej wyraźny. Podsumowując, Schenker dostarczył klawiaturę nadającą się do codziennego użytku. Clickpad działa jako zamiennik myszy (około 15,1 x 9,1 cm), która charakteryzuje się krótkim skokiem i wyraźnym punktem nacisku.
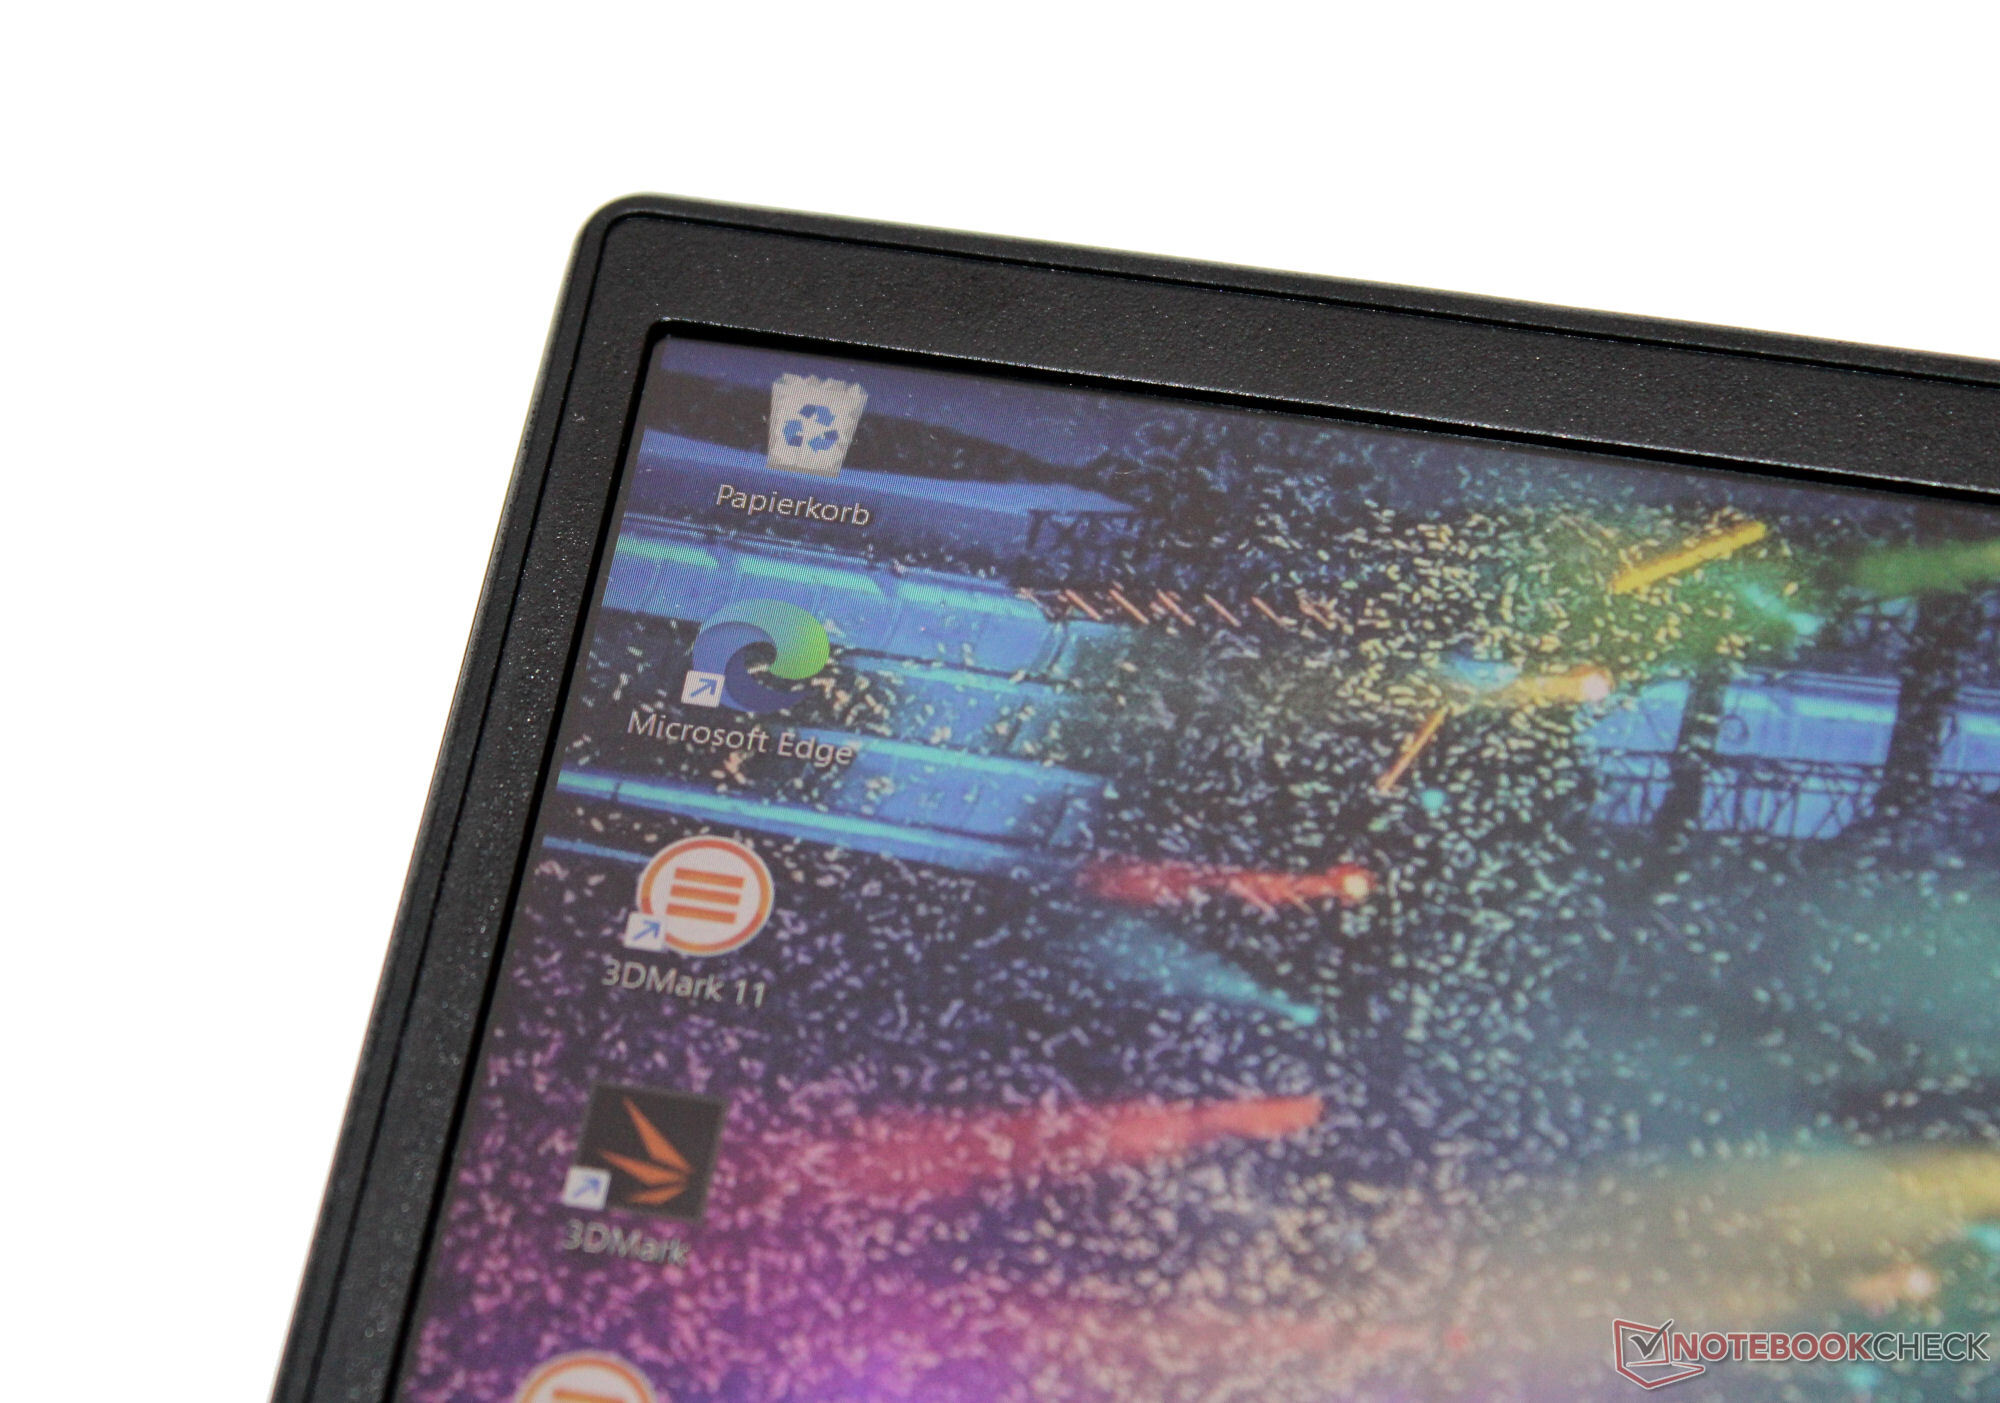
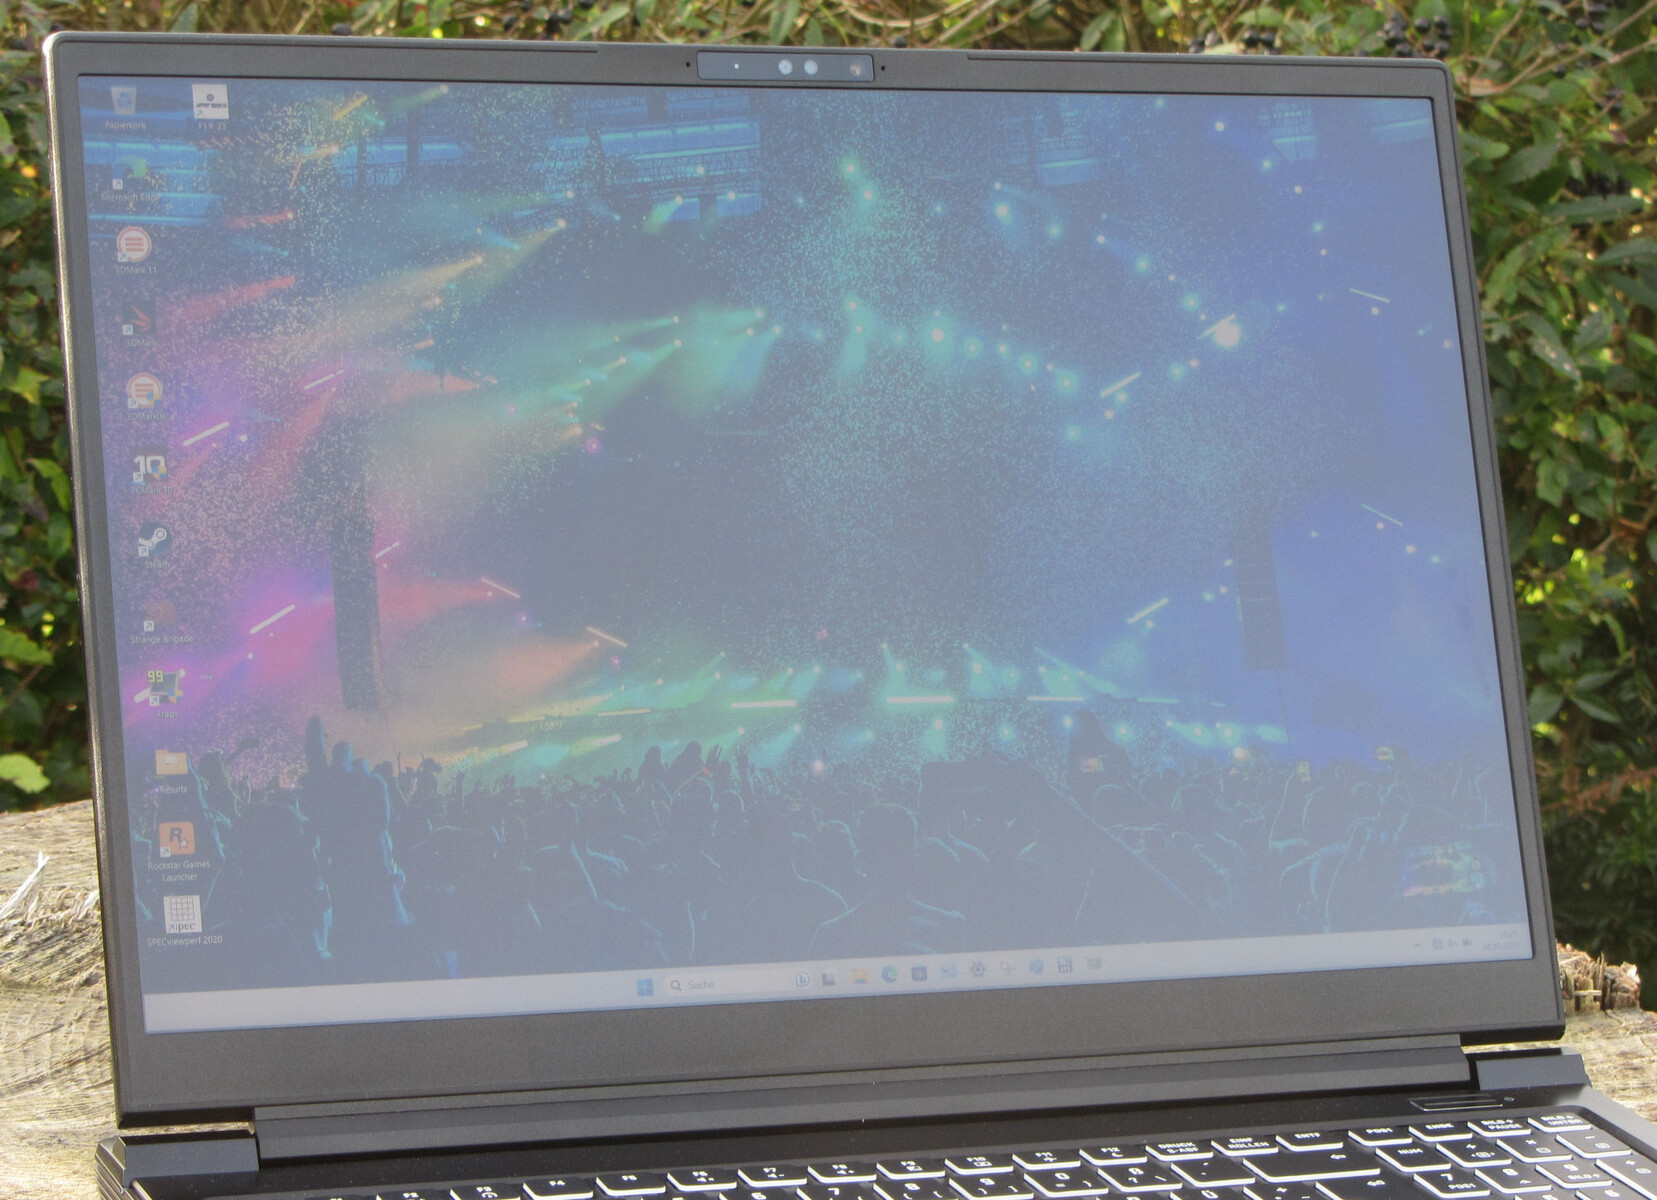
Wyświetlacz - panel 16:10 z pokryciem sRGB
Szybko reagujący panel urządzenia o częstotliwości odświeżania 240 Hz i proporcjach 16:10 nie wykazuje żadnych oznak migotania PWM na żadnym poziomie jasności. Jasność i kontrast matowego, 16-calowego wyświetlacza (2560 x 1600 pikseli) osiągają swoje docelowe wartości (> 300 cd/m² i 1000:1). Alternatywne wyświetlacze nie są dostępne.
| |||||||||||||||||||||||||
rozświetlenie: 93 %
na akumulatorze: 349 cd/m²
kontrast: 1091:1 (czerń: 0.32 cd/m²)
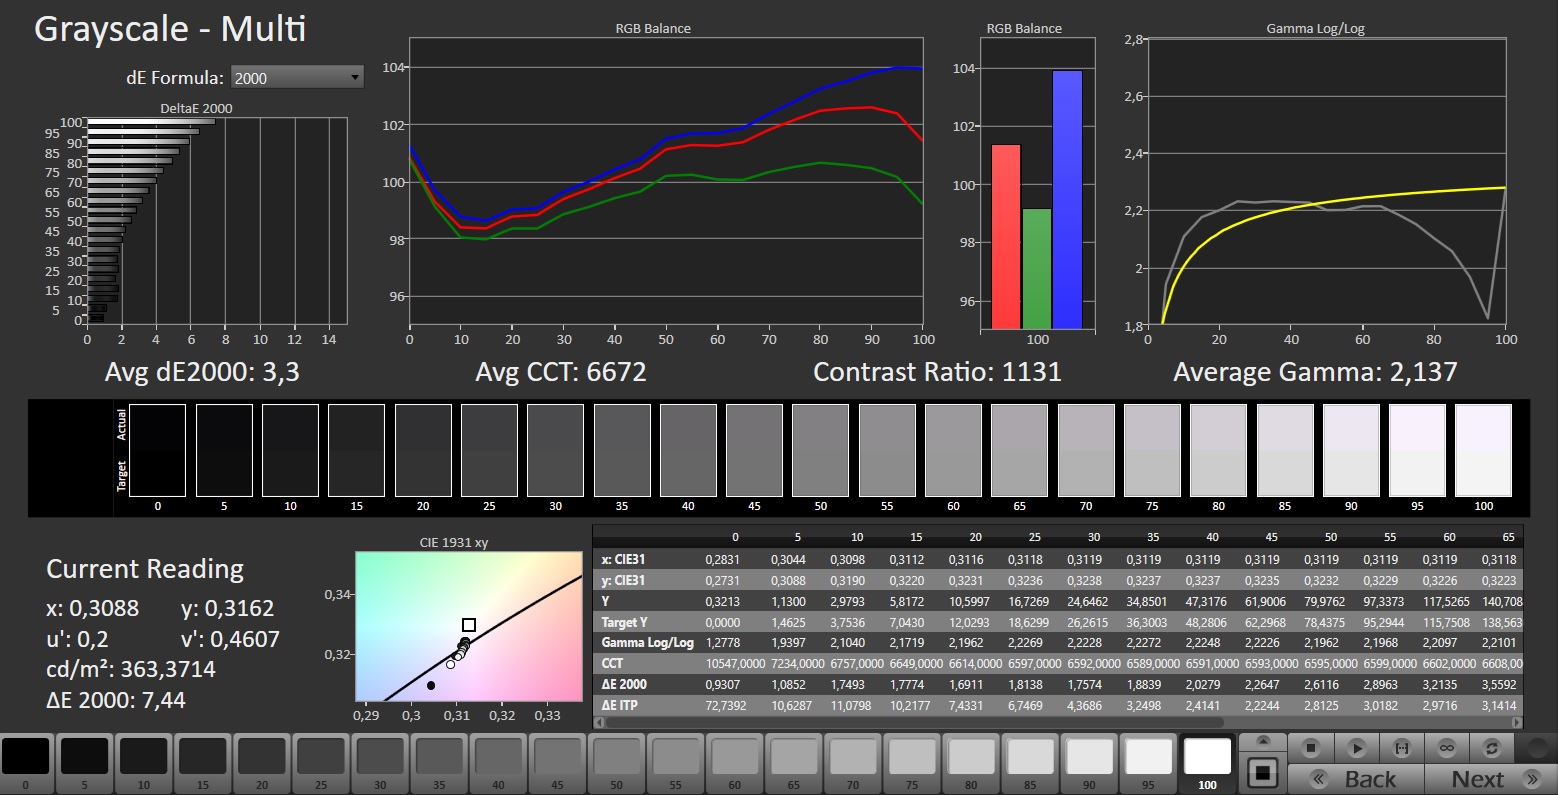
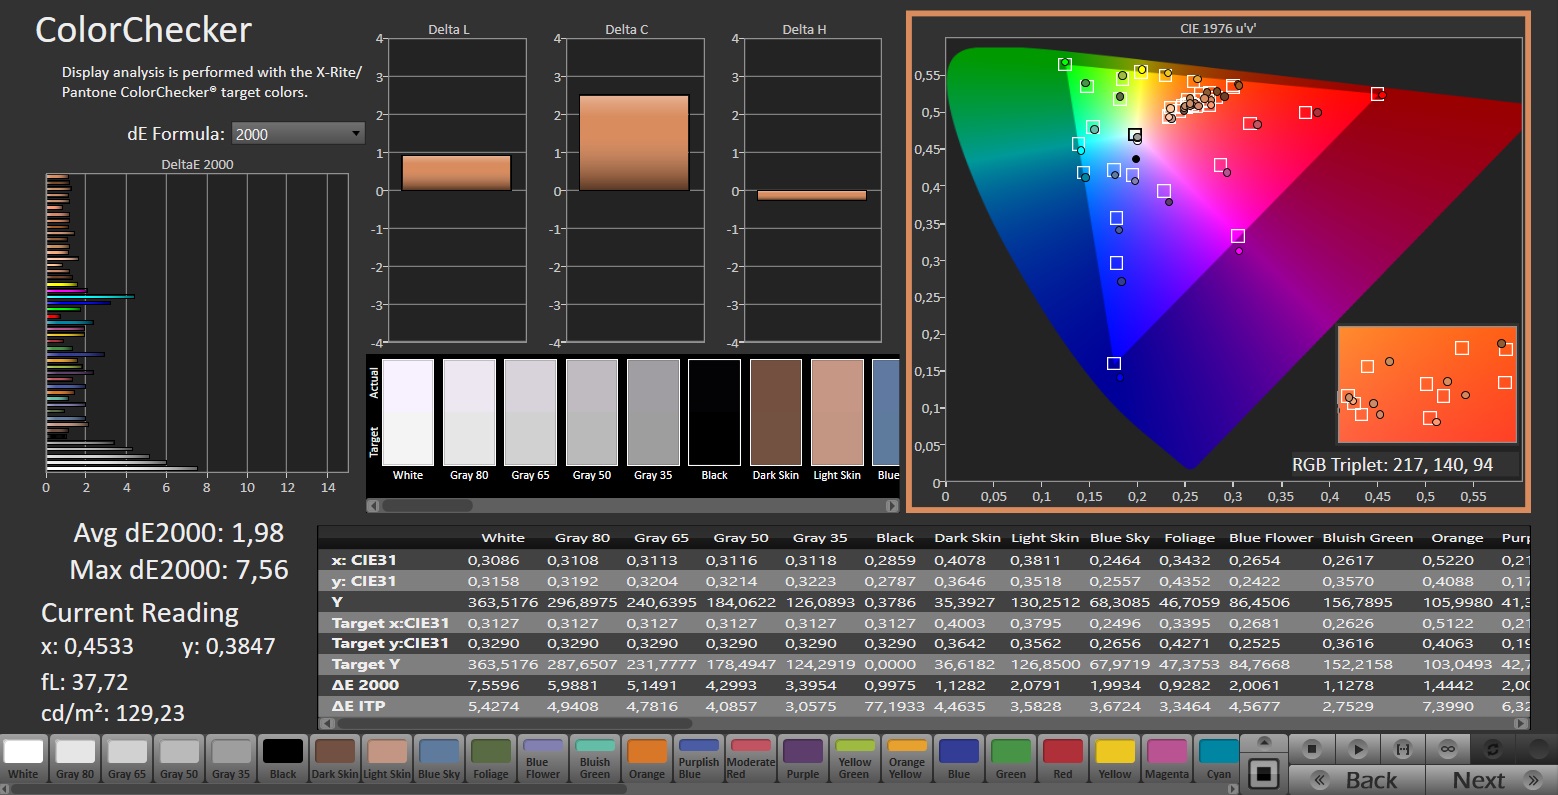
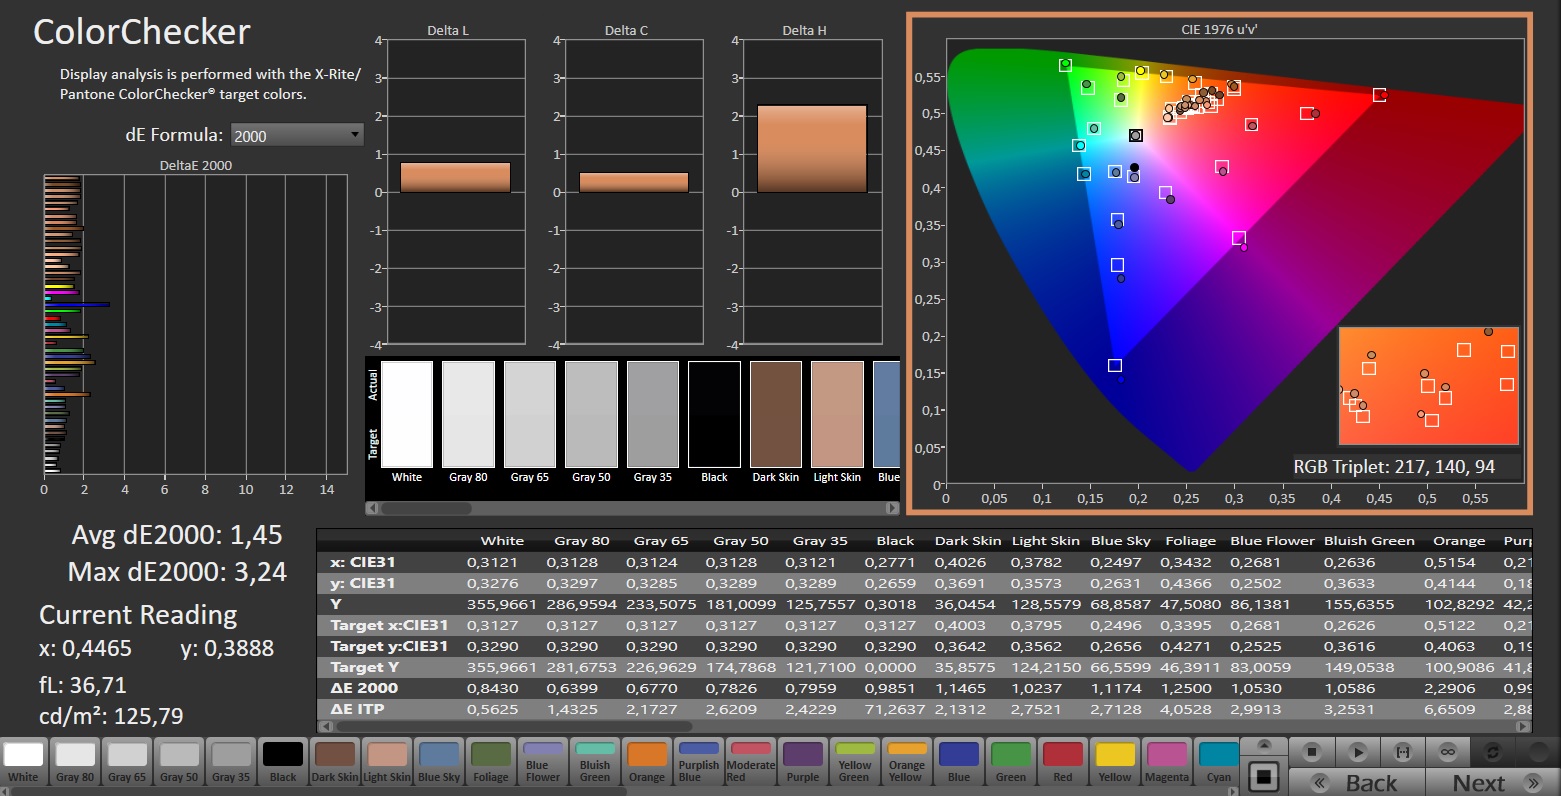
ΔE ColorChecker Calman: 1.98 | ∀{0.5-29.43 Ø4.72}
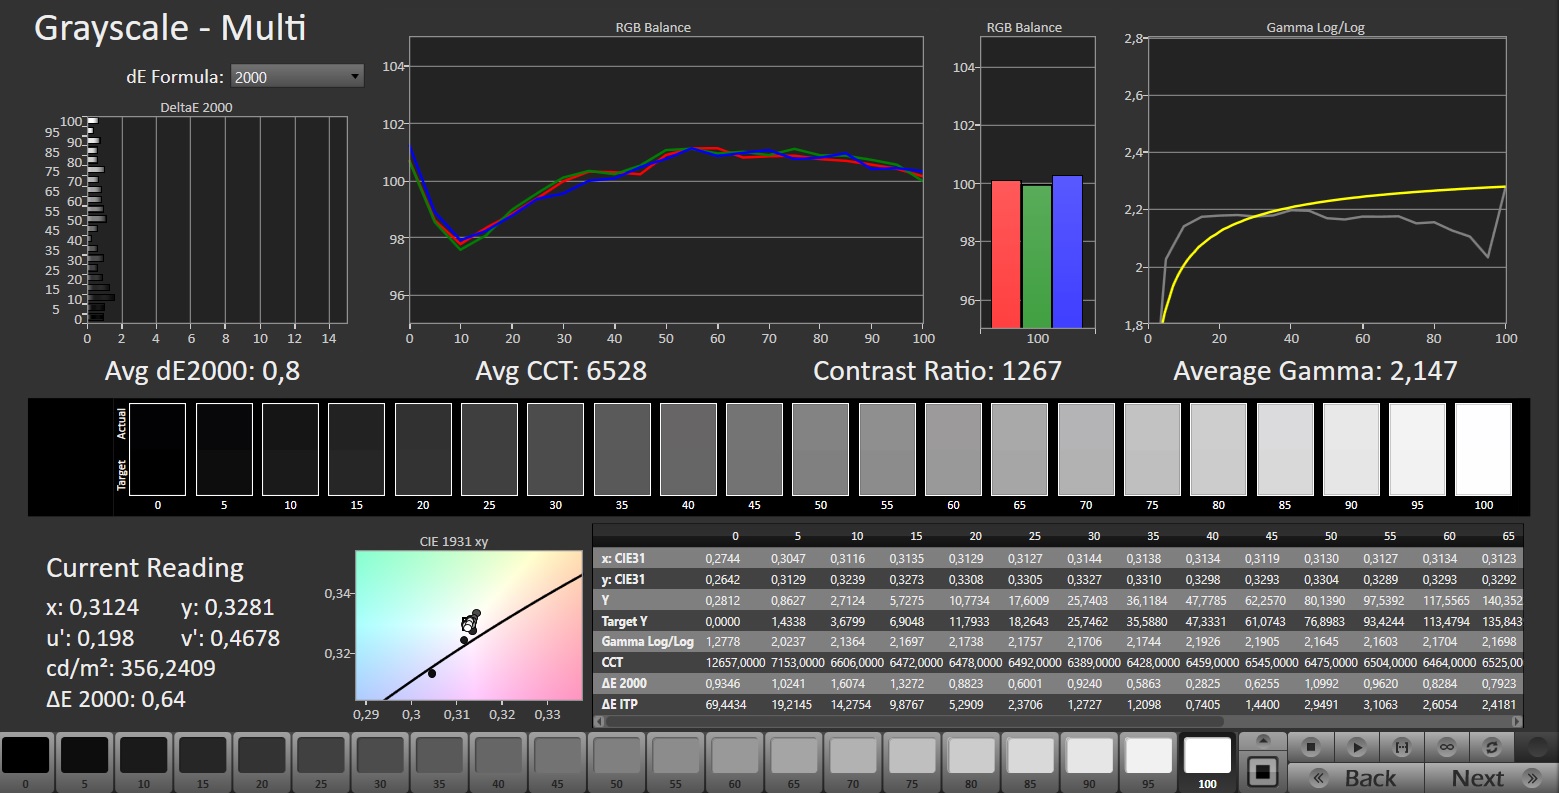
calibrated: 1.45
ΔE Greyscale Calman: 3.3 | ∀{0.09-98 Ø4.97}
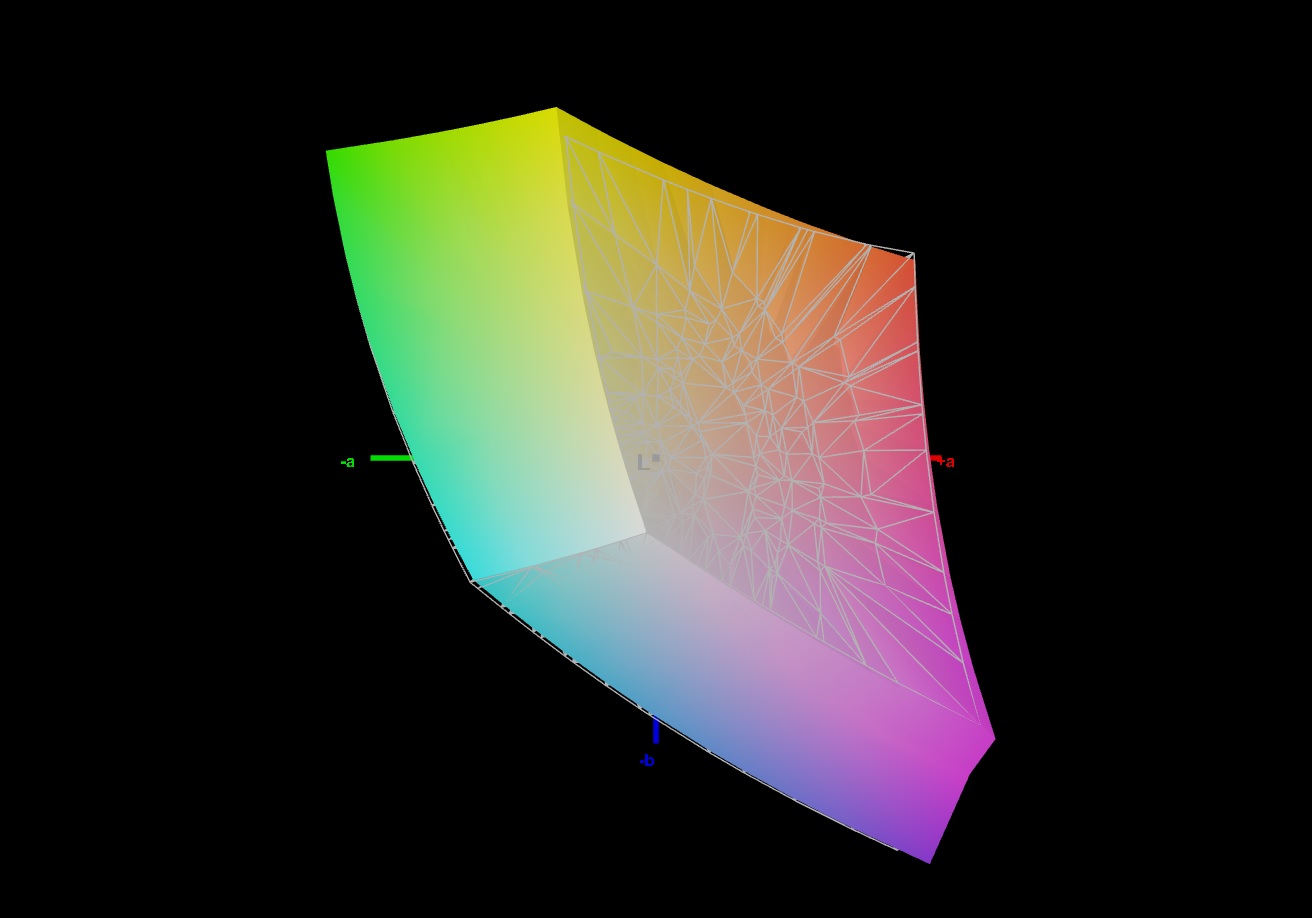
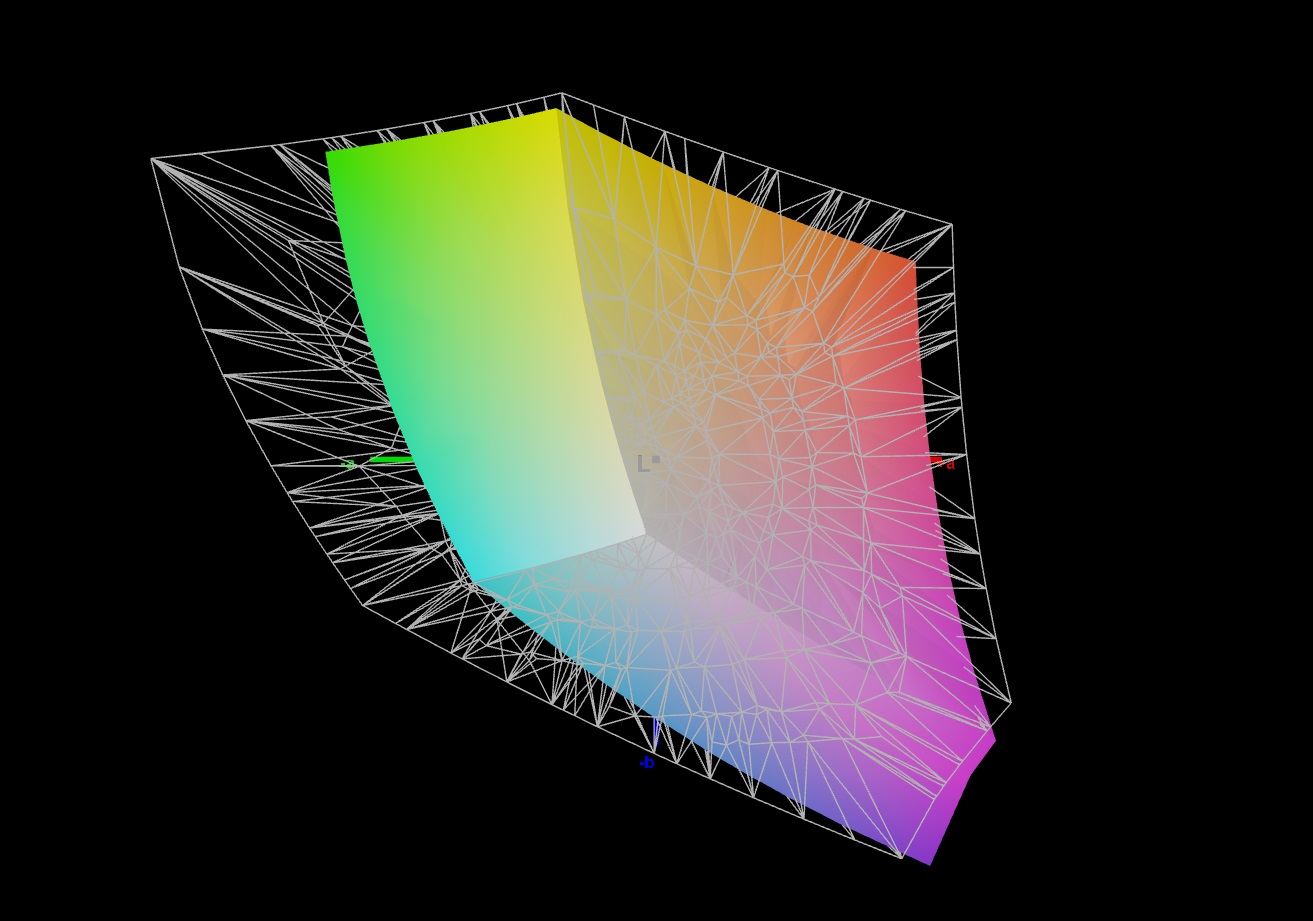
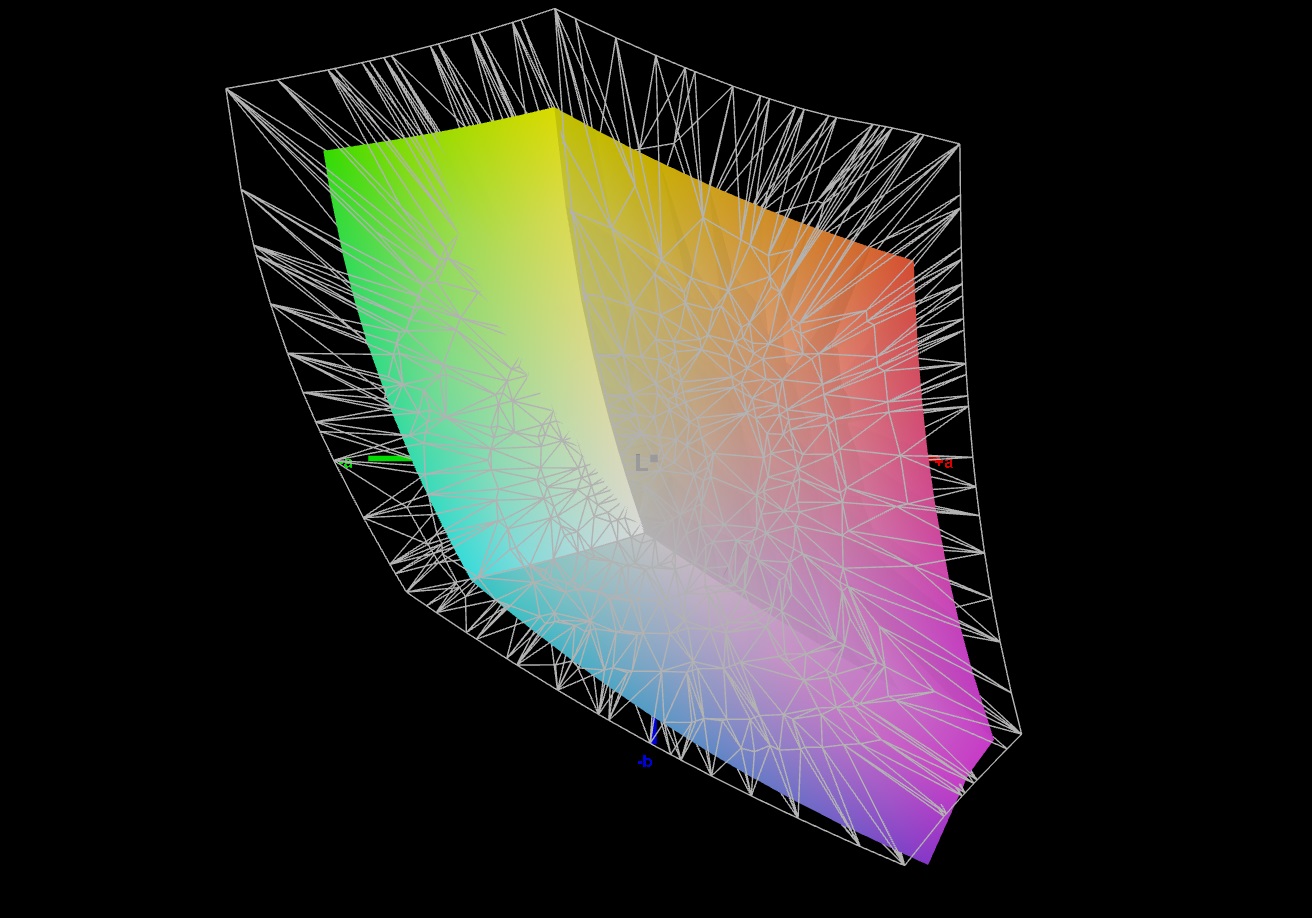
70.1% AdobeRGB 1998 (Argyll 3D)
98.2% sRGB (Argyll 3D)
69.4% Display P3 (Argyll 3D)
Gamma: 2.137
CCT: 6672 K
| Schenker XMG Pro 16 Studio (Mid 23) BOE CQ NE160QDM-NZ1, IPS, 2560x1600, 16" | Asus Vivobook Pro 16X K6604JV-MX016W Samsung SDC4178 ATNA60BX01-1, OLED, 3200x2000, 16" | Lenovo Legion Slim 7i 16 Gen 8 CSOT T3 MNG007DA2-3, IPS, 2560x1600, 16" | HP Omen Transcend 16 AUOA3A6, Mini-LED, 2560x1600, 16" | MSI Stealth 16 Studio A13VG AUO26A9, IPS, 2560x1600, 16" | |
|---|---|---|---|---|---|
| Display | 27% | 2% | 23% | 21% | |
| Display P3 Coverage (%) | 69.4 | 98.4 42% | 70.4 1% | 99.2 43% | 96.4 39% |
| sRGB Coverage (%) | 98.2 | 99.7 2% | 99.4 1% | 100 2% | 99.7 2% |
| AdobeRGB 1998 Coverage (%) | 70.1 | 95.8 37% | 72.5 3% | 87.6 25% | 84.8 21% |
| Response Times | 85% | -7% | -191% | 46% | |
| Response Time Grey 50% / Grey 80% * (ms) | 12.2 ? | 1.6 ? 87% | 12 ? 2% | 26.4 ? -116% | 4.4 ? 64% |
| Response Time Black / White * (ms) | 7.7 ? | 1.4 ? 82% | 8.9 ? -16% | 28.2 ? -266% | 5.6 ? 27% |
| PWM Frequency (Hz) | 120 ? | 3506 ? | |||
| Screen | 66% | 17% | 204% | -19% | |
| Brightness middle (cd/m²) | 349 | 347 -1% | 474.6 36% | 791.1 127% | 424 21% |
| Brightness (cd/m²) | 348 | 346 -1% | 445 28% | 800 130% | 411 18% |
| Brightness Distribution (%) | 93 | 97 4% | 86 -8% | 95 2% | 88 -5% |
| Black Level * (cd/m²) | 0.32 | 0.06 81% | 0.39 -22% | 0.04 87% | 0.37 -16% |
| Contrast (:1) | 1091 | 5783 430% | 1217 12% | 19778 1713% | 1146 5% |
| Colorchecker dE 2000 * | 1.98 | 1.89 5% | 2.12 -7% | 4.37 -121% | 3.04 -54% |
| Colorchecker dE 2000 max. * | 7.56 | 3.26 57% | 4.73 37% | 10.39 -37% | 7.5 1% |
| Colorchecker dE 2000 calibrated * | 1.45 | 1.97 -36% | 0.57 61% | 1.04 28% | 3.04 -110% |
| Greyscale dE 2000 * | 3.3 | 1.55 53% | 2.8 15% | 6.5 -97% | 4.34 -32% |
| Gamma | 2.137 103% | 2.39 92% | 2.22 99% | 2.28 96% | 2.32 95% |
| CCT | 6672 97% | 6458 101% | 6542 99% | 6000 108% | 6952 93% |
| Całkowita średnia (program / ustawienia) | 59% /
60% | 4% /
10% | 12% /
109% | 16% /
-1% |
* ... im mniej tym lepiej
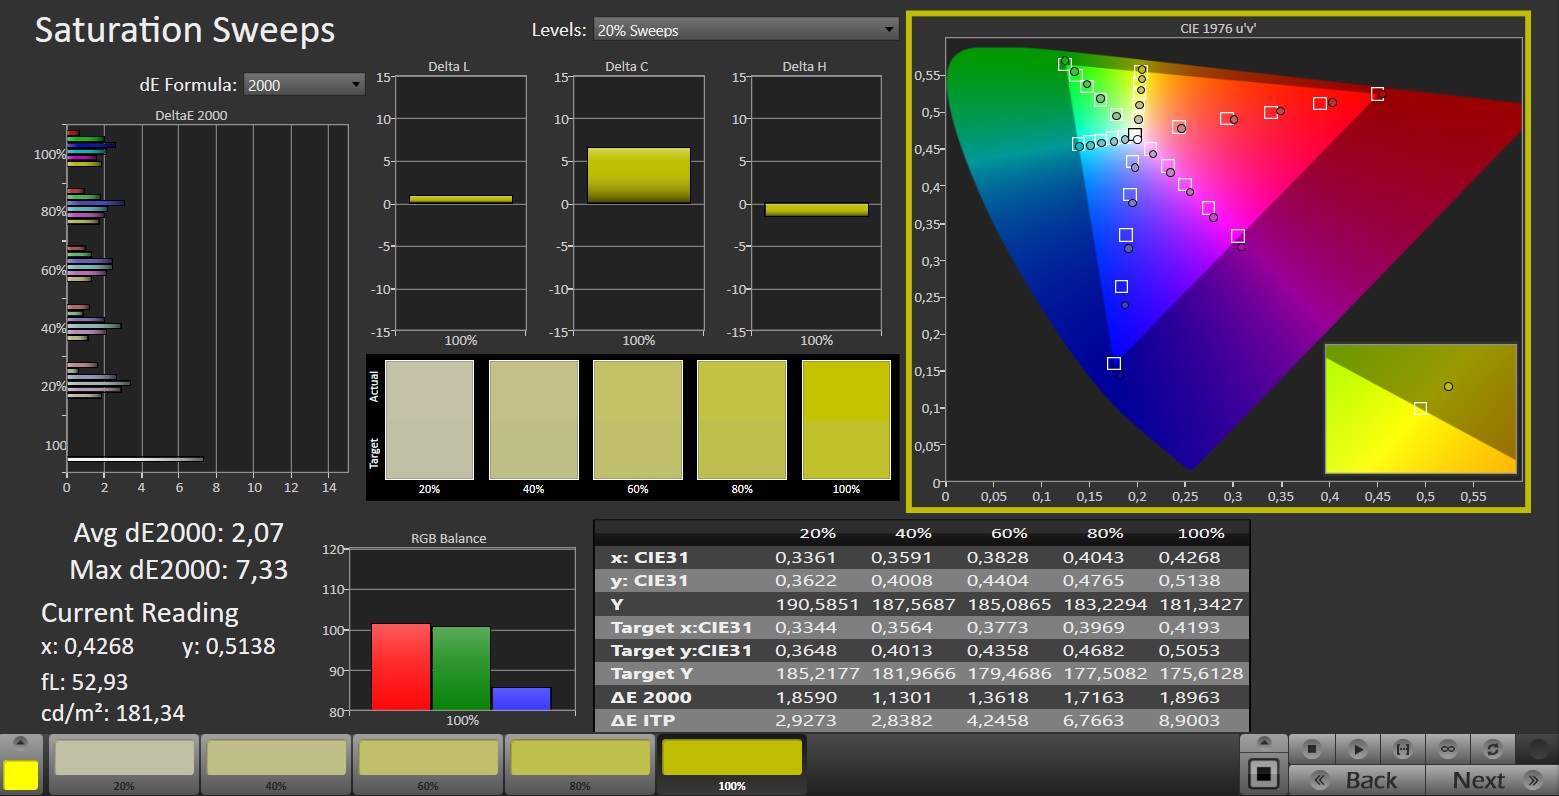
Zaraz po wyjęciu z pudełka ekran pokazuje całkiem dobre odwzorowanie kolorów: Z odchyleniem około 2, cel (DeltaE < 3) został osiągnięty. Kalibracja wyświetlacza prowadzi do mniejszego odchylenia 1,45 i bardziej zrównoważonych odcieni szarości. Panel jest w stanie niemal w całości odwzorować przestrzeń barw sRGB - ale nie AdobeRGB czy DCI P3. Tutaj konkurencja ma czasami więcej do zaoferowania.

Wyświetl czasy reakcji
| ↔ Czas reakcji od czerni do bieli | ||
|---|---|---|
| 7.7 ms ... wzrost ↗ i spadek ↘ łącznie | ↗ 4 ms wzrost | 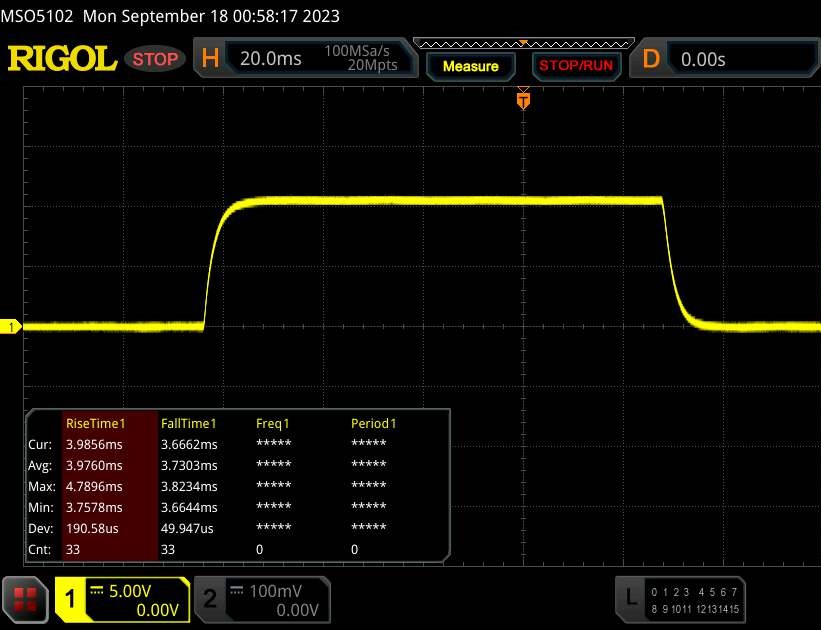 |
| ↘ 3.7 ms upadek | ||
| W naszych testach ekran wykazuje bardzo szybką reakcję i powinien bardzo dobrze nadawać się do szybkich gier. Dla porównania, wszystkie testowane urządzenia wahają się od 0.1 (minimum) do 240 (maksimum) ms. » 22 % wszystkich urządzeń jest lepszych. Oznacza to, że zmierzony czas reakcji jest lepszy od średniej wszystkich testowanych urządzeń (19.8 ms). | ||
| ↔ Czas reakcji 50% szarości do 80% szarości | ||
| 12.2 ms ... wzrost ↗ i spadek ↘ łącznie | ↗ 5.9 ms wzrost | 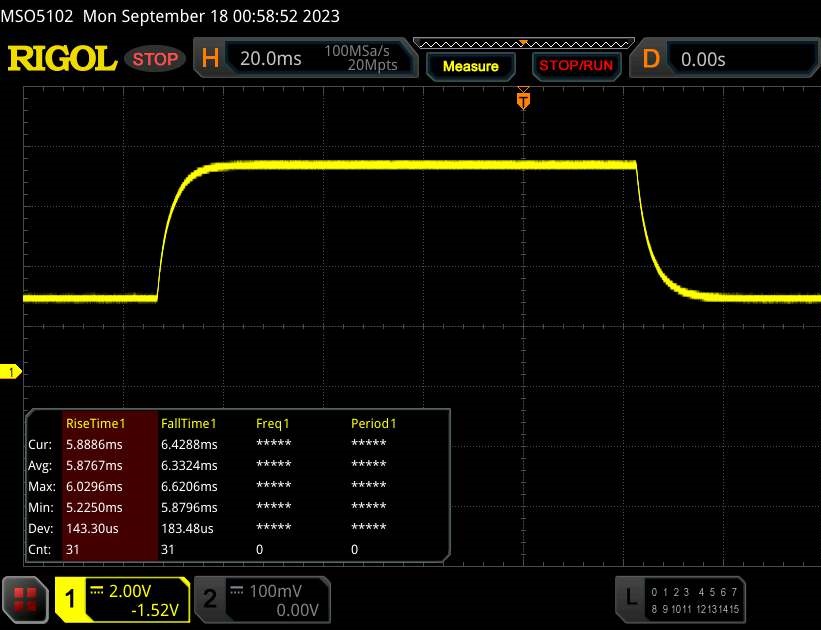 |
| ↘ 6.3 ms upadek | ||
| W naszych testach ekran wykazuje dobry współczynnik reakcji, ale może być zbyt wolny dla graczy rywalizujących ze sobą. Dla porównania, wszystkie testowane urządzenia wahają się od 0.165 (minimum) do 636 (maksimum) ms. » 26 % wszystkich urządzeń jest lepszych. Oznacza to, że zmierzony czas reakcji jest lepszy od średniej wszystkich testowanych urządzeń (31 ms). | ||
Migotanie ekranu / PWM (modulacja szerokości impulsu)
| Migotanie ekranu/nie wykryto PWM | 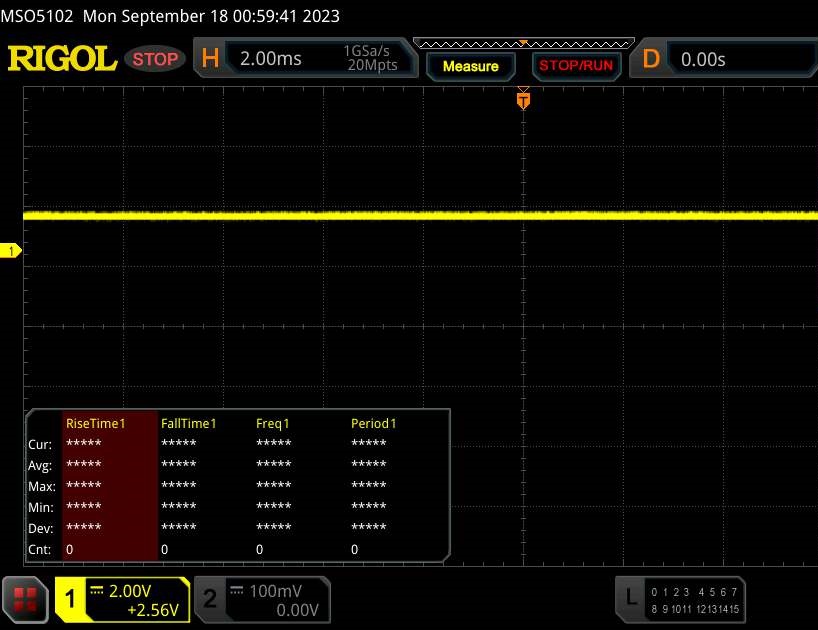 | ||
Dla porównania: 52 % wszystkich testowanych urządzeń nie używa PWM do przyciemniania wyświetlacza. Jeśli wykryto PWM, zmierzono średnio 7763 (minimum: 5 - maksimum: 343500) Hz. | |||
Stabilny pod kątem widzenia panel IPS laptopa pozostaje czytelny pod każdym kątem. Na zewnątrz można czytać z wyświetlacza, o ile słońce nie świeci zbyt mocno.
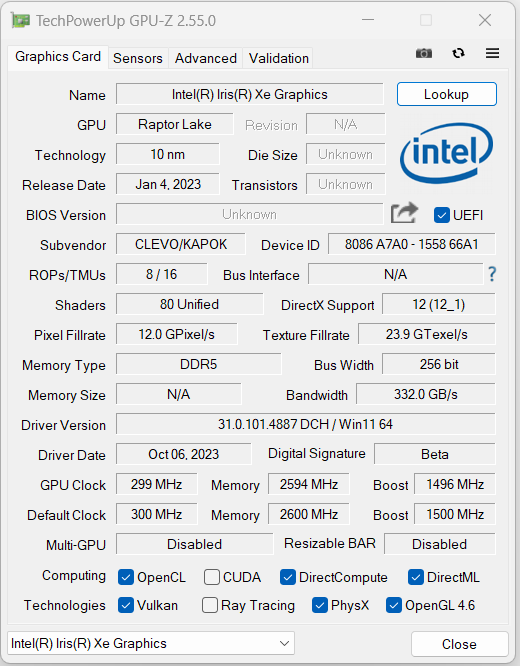
Wydajność - laptop Schenker opiera się na Raptor Lake i Ada Lovelace
Zorientowany na graczy i twórców XMG Pro 16 Studio opiera się na Raptor Lake i Ada Lovelace. Certyfikat GeForce RTX Studio ma gwarantować wysoką wydajność, niestandardowe sterowniki, dobre wsparcie oprogramowania i odpowiednie pokrycie przestrzeni kolorów wyświetlacza. Laptop można indywidualnie skonfigurować za pośrednictwem sklepu internetowego Schenker. Obecny wariant można nabyć za około 2 400 USD, a tańsze modele zaczynają się od około 1 900 USD.
Warunki testowania
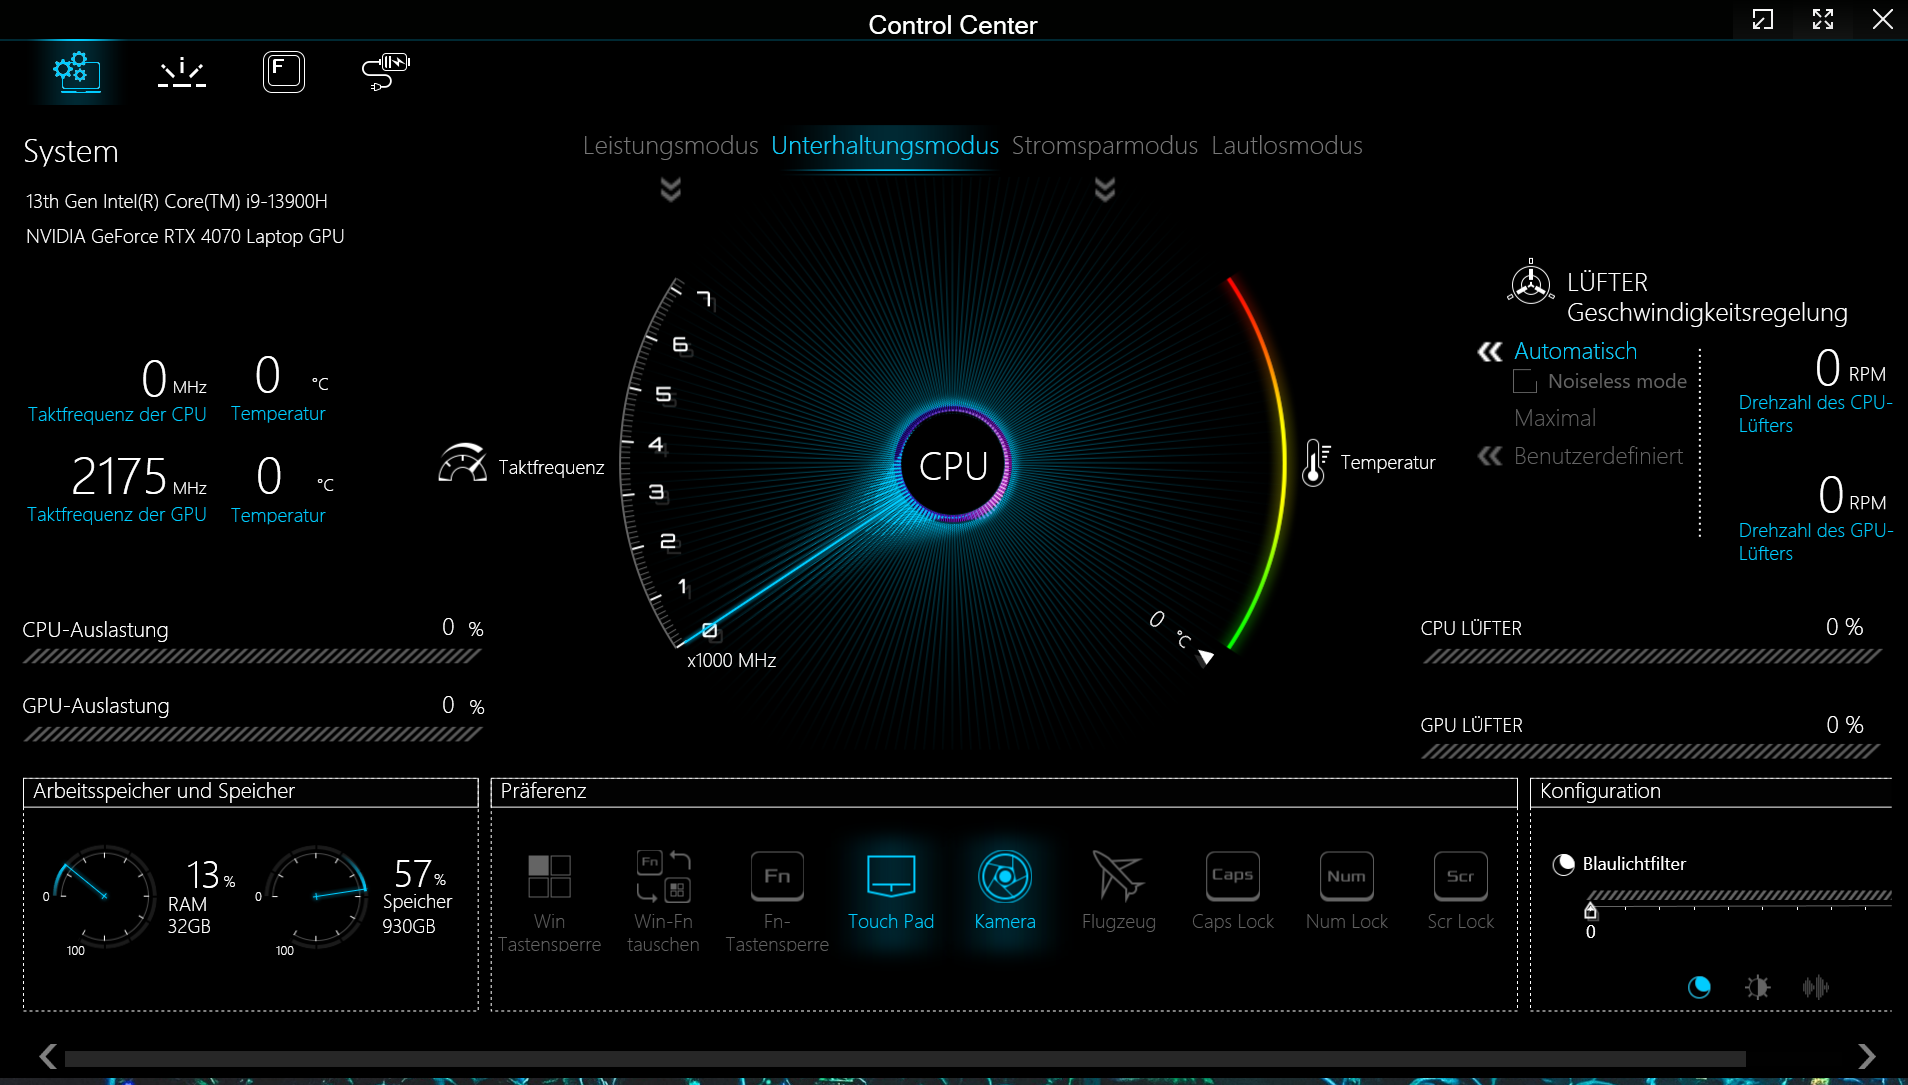
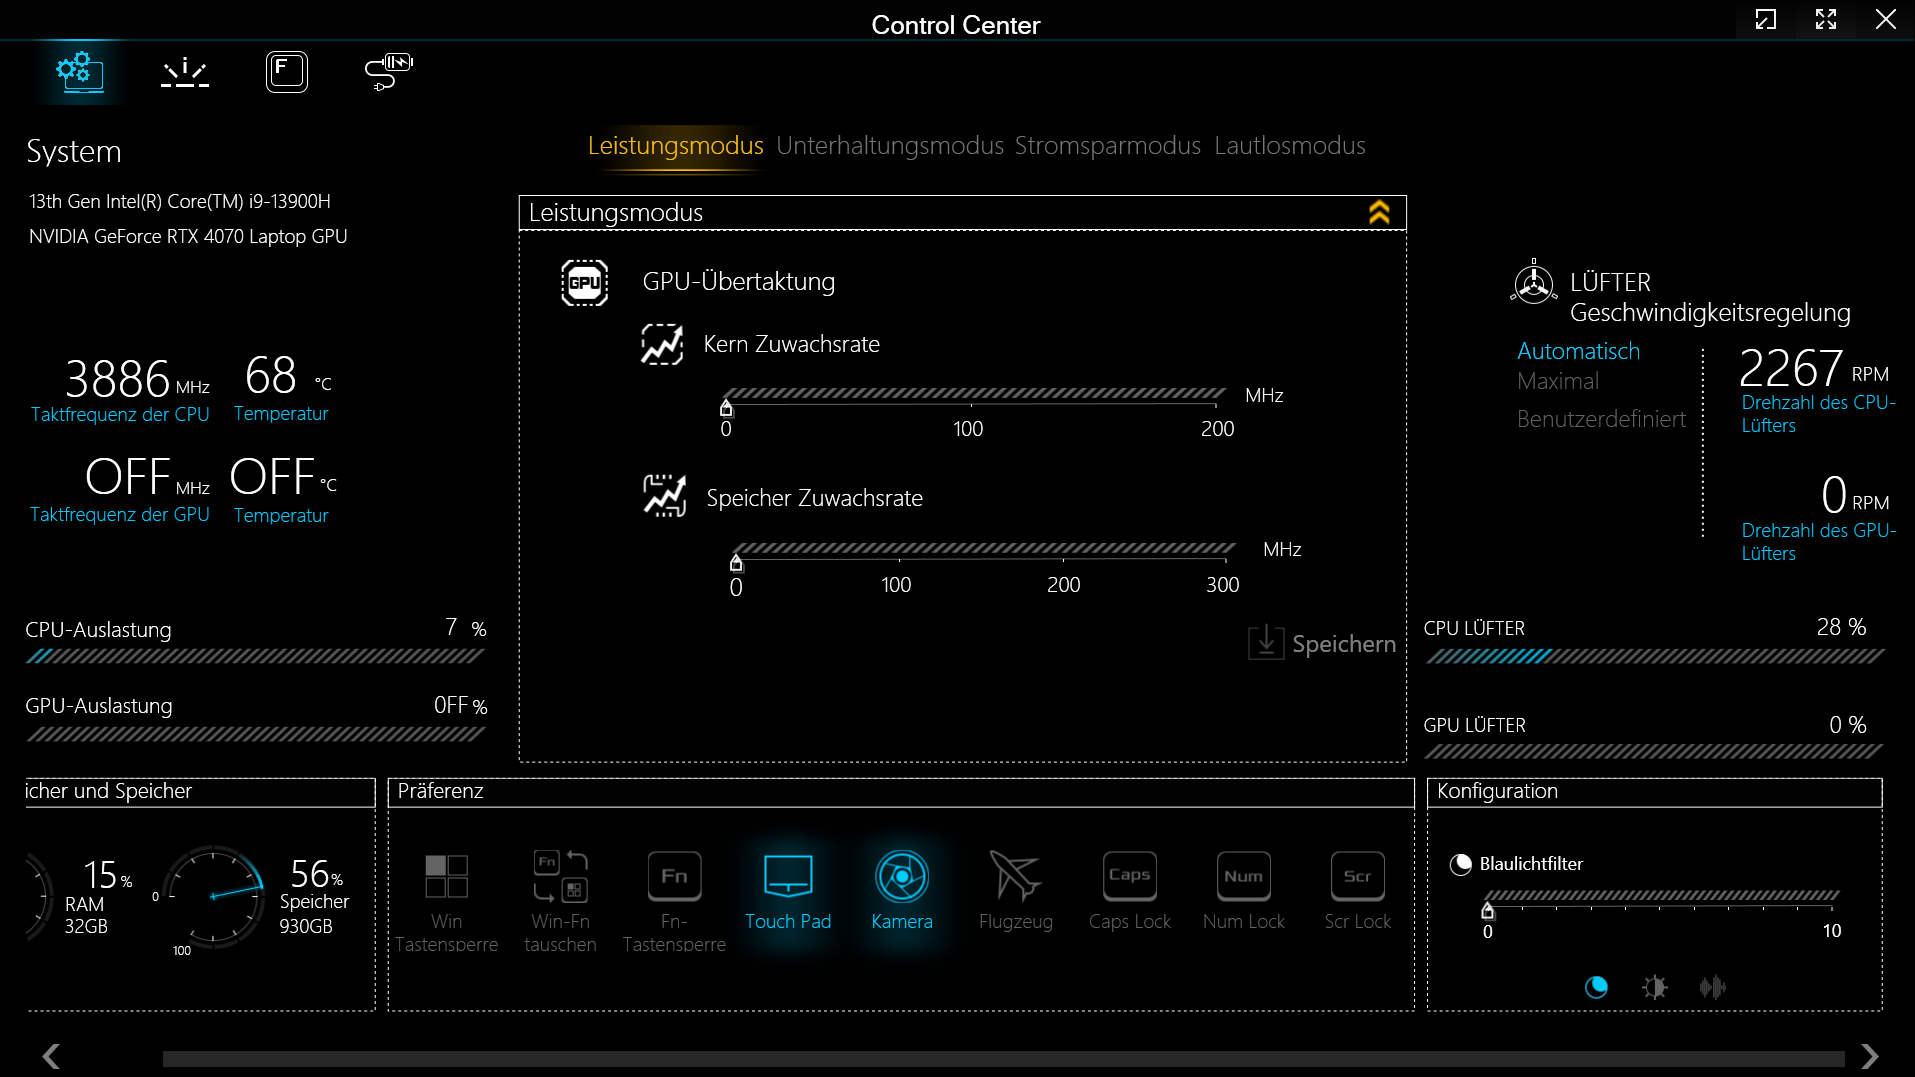
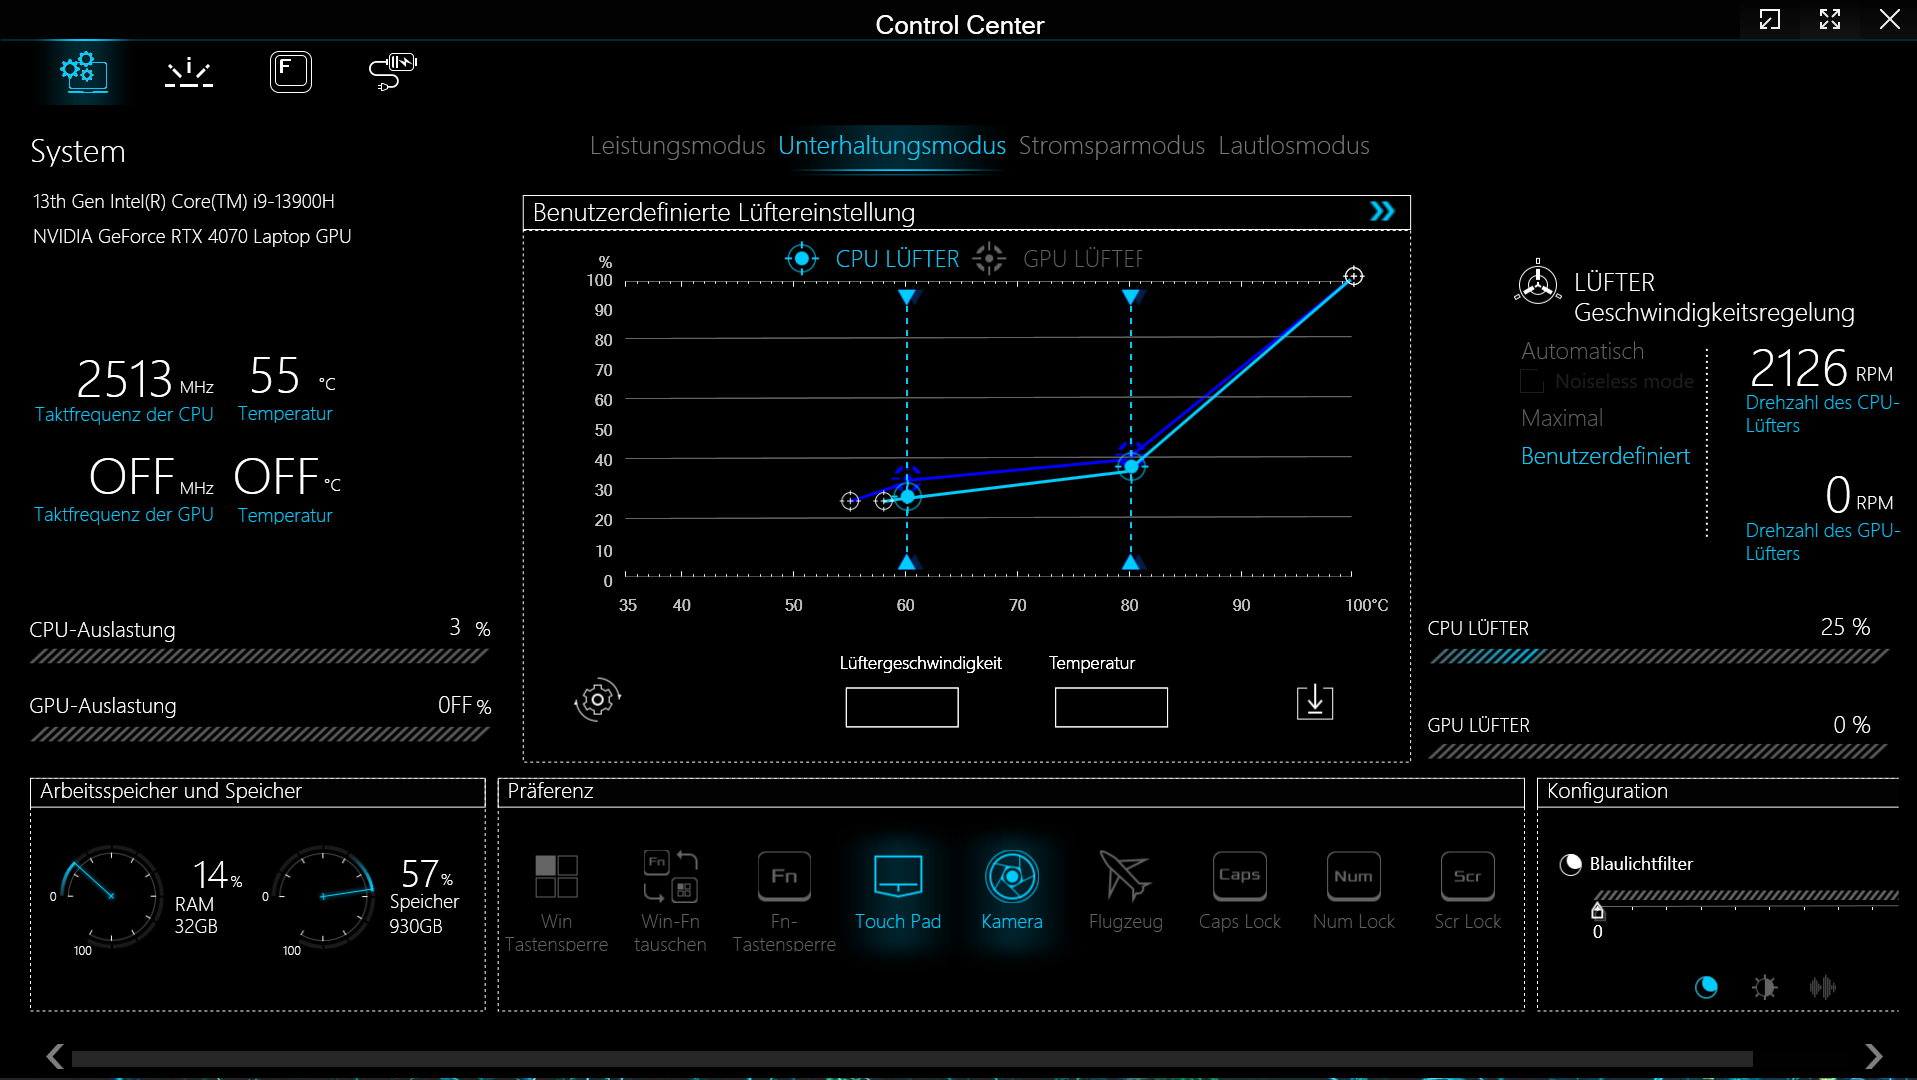
Pro oferuje cztery tryby wydajności specyficzne dla producenta (patrz tabela), między którymi można przełączać się za pomocą oprogramowania Control Center (centrum sterowania laptopa). wykorzystano "Tryb rozrywki" (benchmarki) i "Tryb oszczędzania energii" (testy baterii). Tryb Optimus był aktywny.
| Tryb rozrywki | Tryb wydajności | Tryb oszczędzania energii | Tryb cichy | |
|---|---|---|---|---|
| Limit mocy 1 (HWInfo) | 70 watów | 100 watów | 15 watów | 15 watów |
| Limit mocy 2 (HWInfo) | 90 watów | 120 watów | 30 watów | 30 watów |
| Hałas (Witcher 3) | 48 dB(A) | 55 dB (A) | - | 42 dB (A) |
| Wydajność (Witcher 3) | ~114 fps | ~118 fps | - | ~100-114 fps |
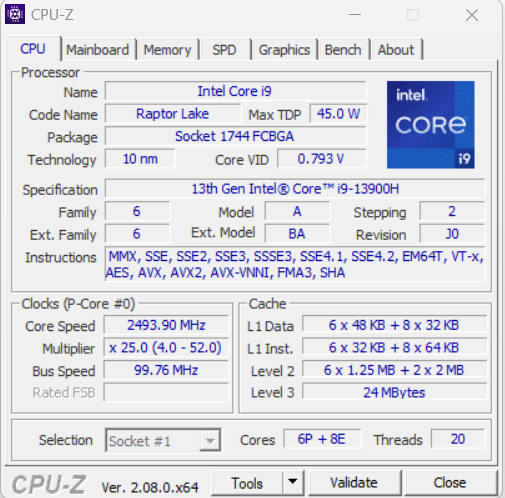
Procesor
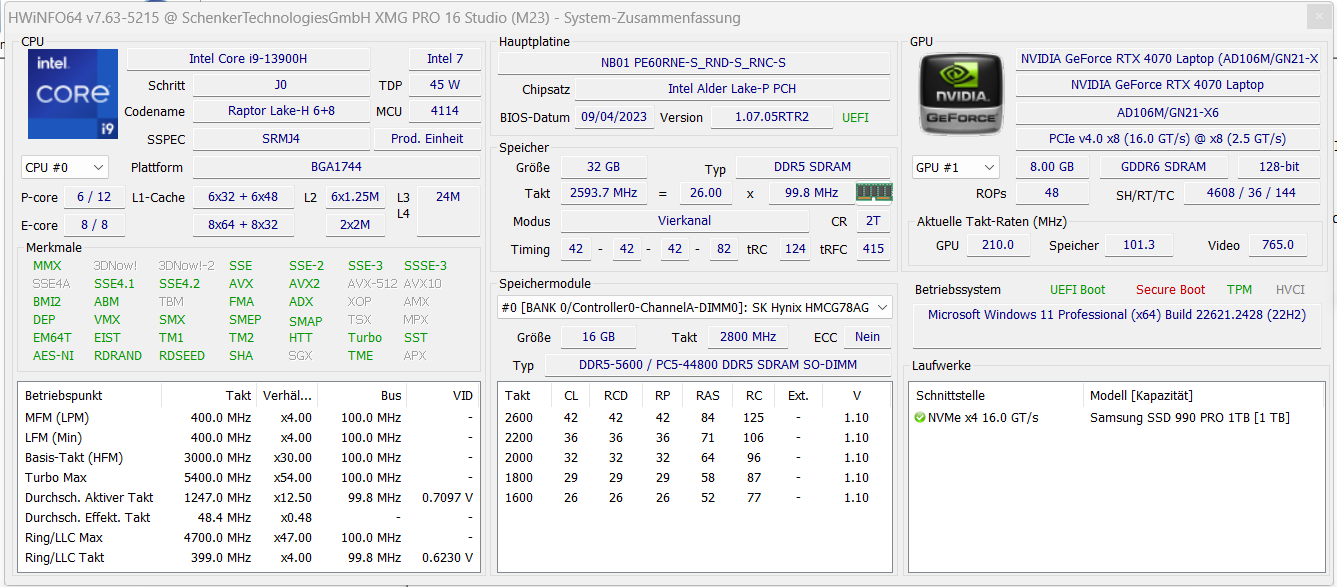
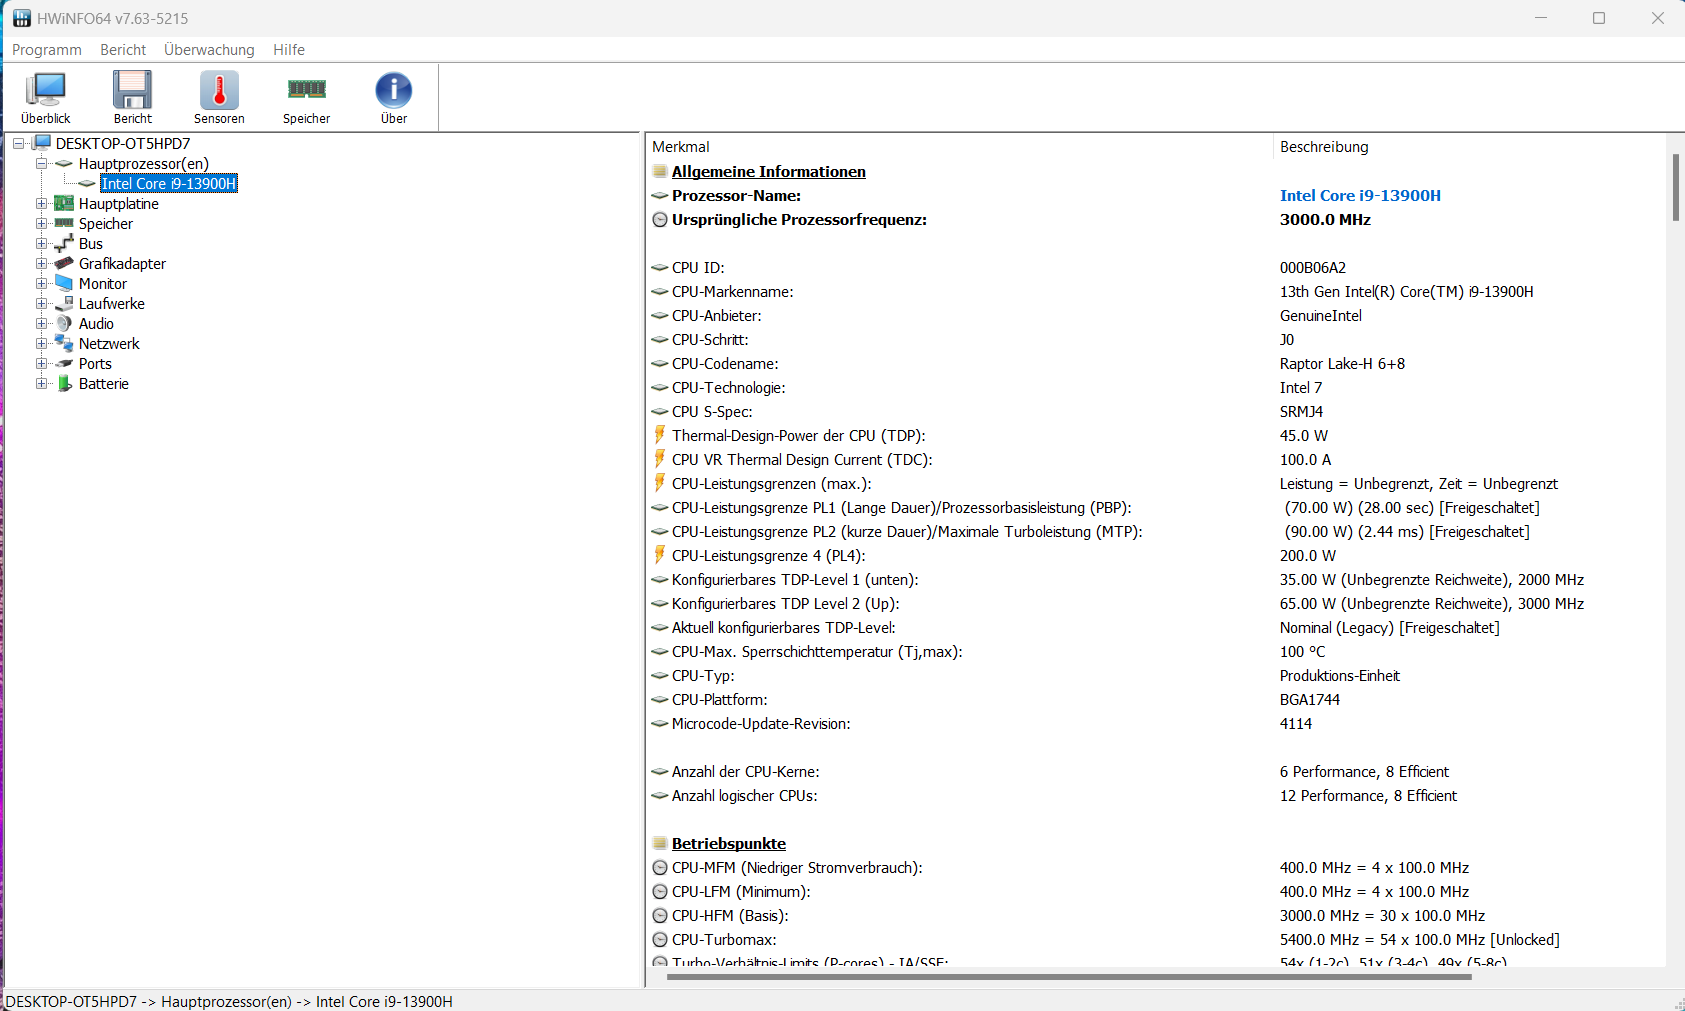
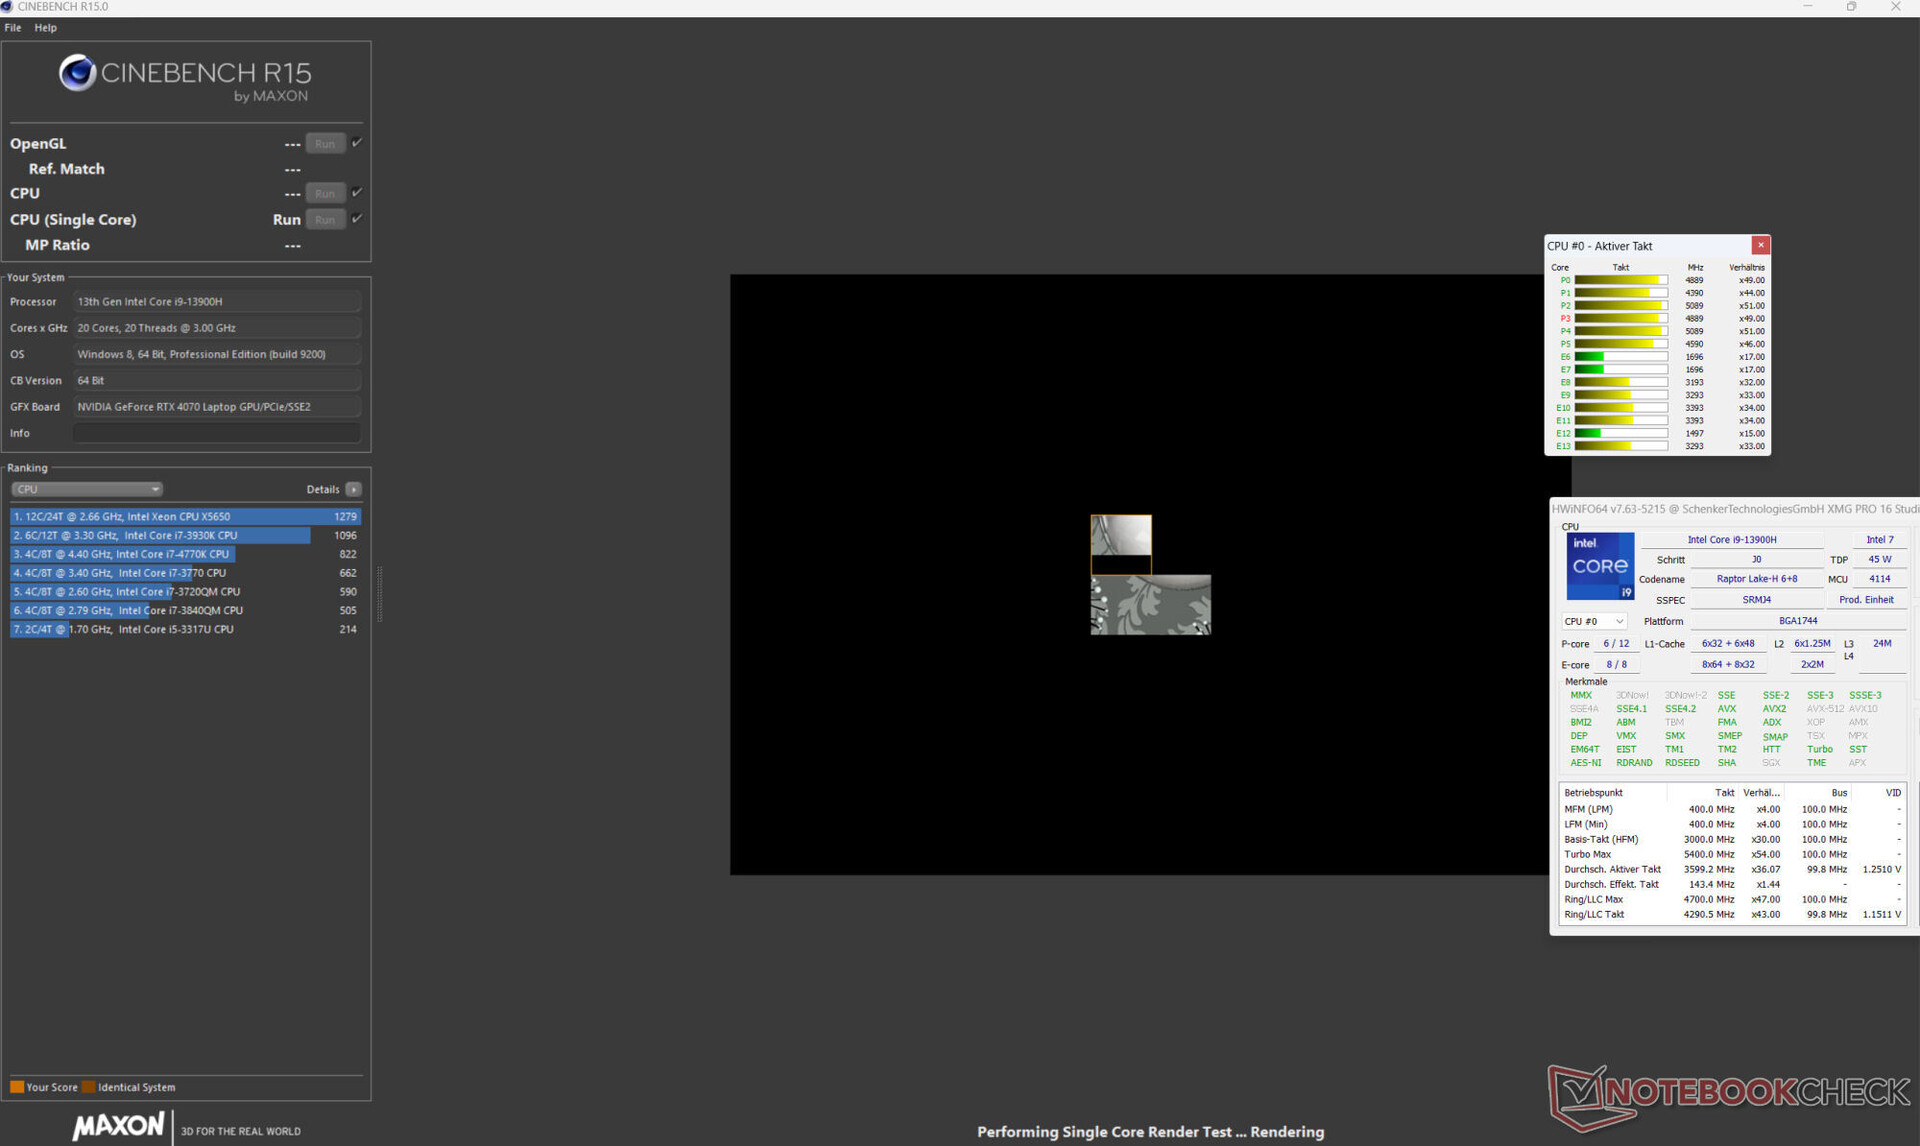
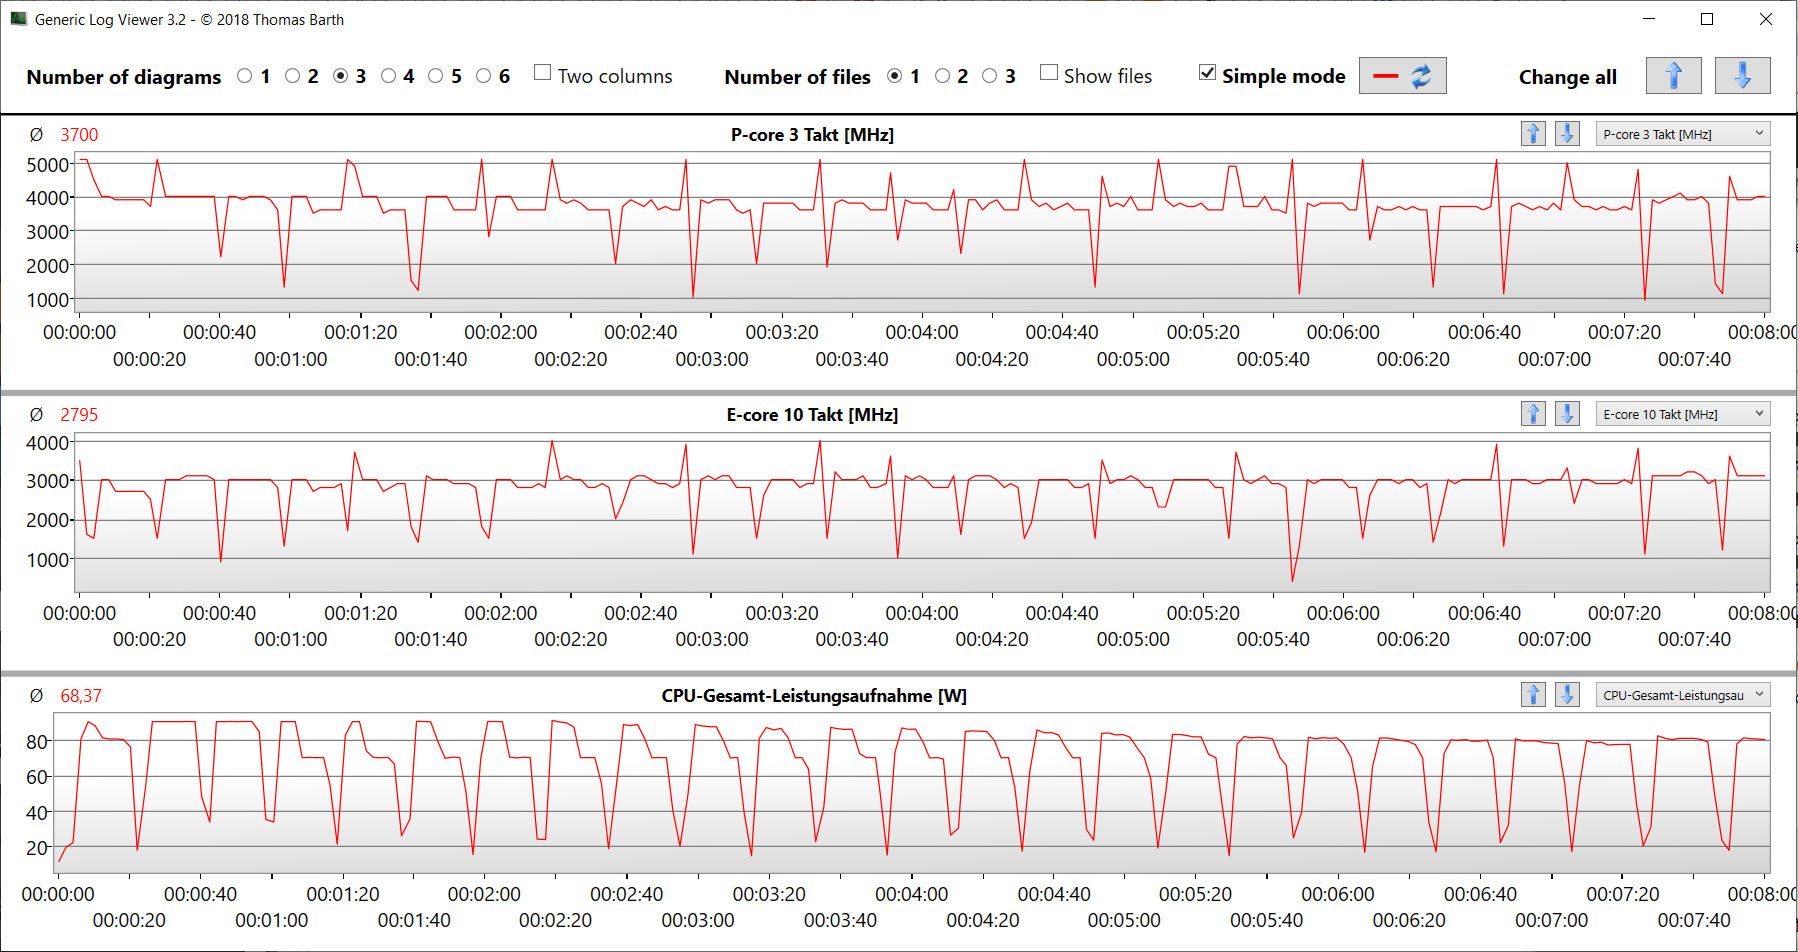
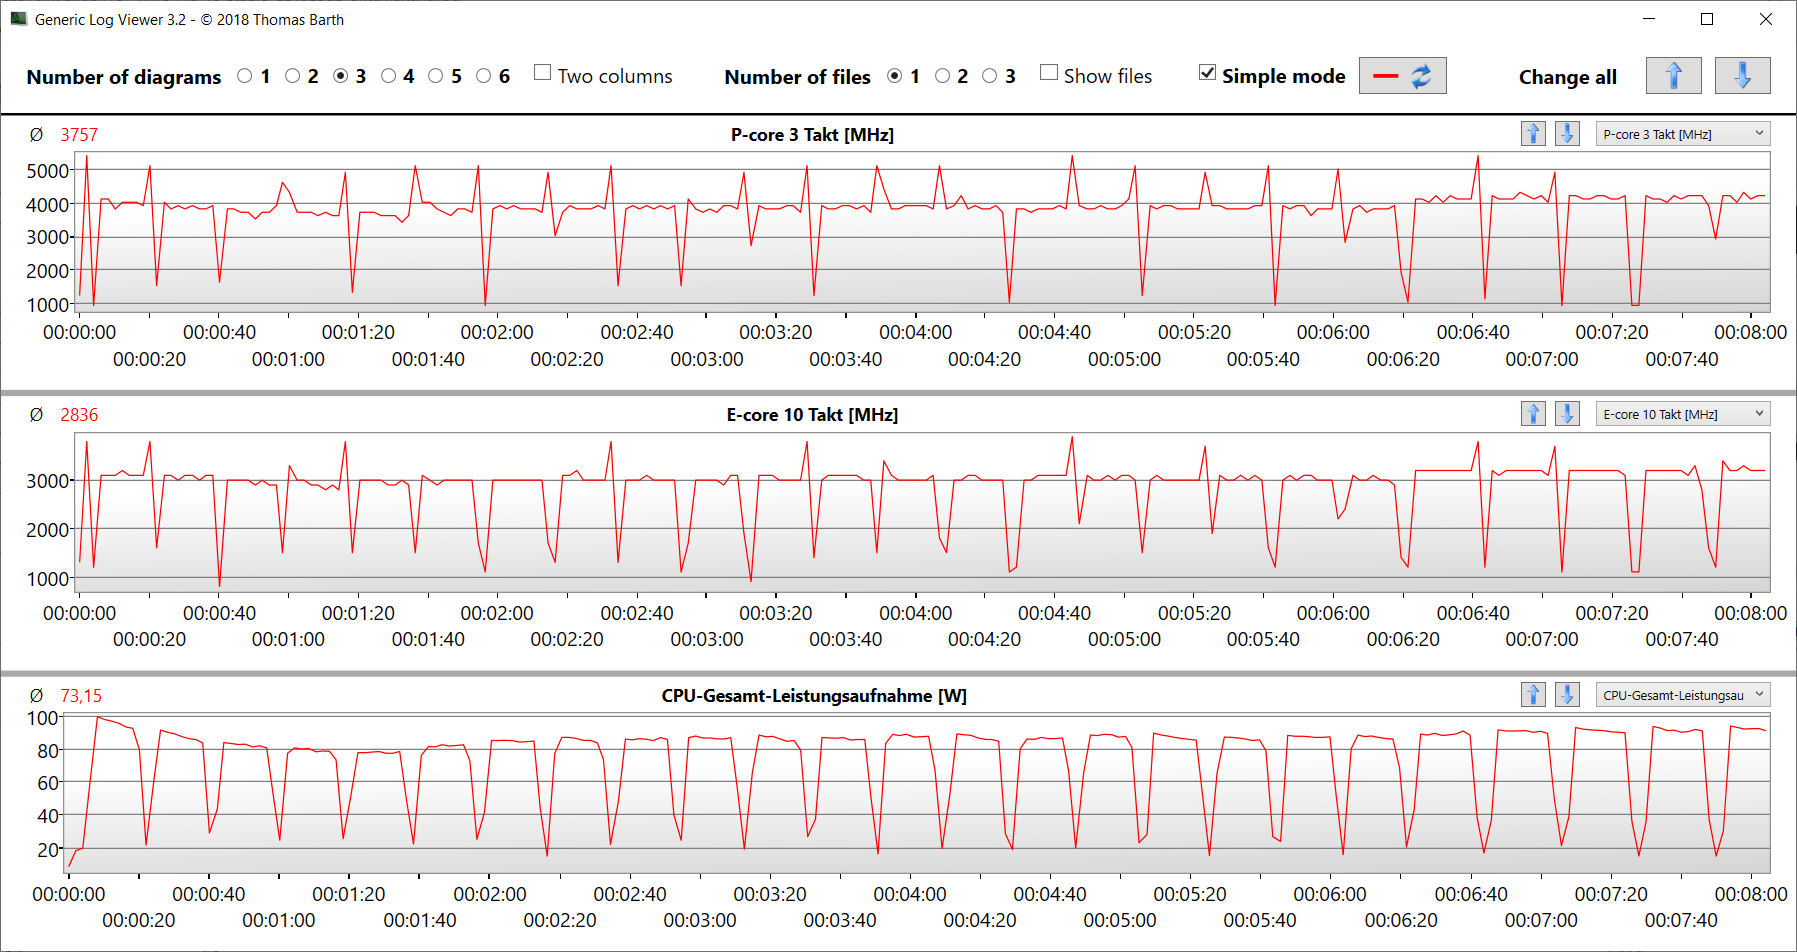
ProcesorCore i9-13900H(6P, 8E) z 14 rdzeniami CPU osiąga maksymalne taktowanie na poziomie 5,4 GHz (P) i 4,1 GHz (E). Stałe obciążenie wielowątkowe (CB15 Loop) doprowadziło do nieznacznego spadku częstotliwości taktowania od pierwszego do czwartego uruchomienia. Następnie wartości pozostały na stałym poziomie.
Zmierzyliśmy wyniki benchmarków nieco powyżej wcześniej ustalonej średniej CPU (podłączonego do sieci). W trybie bateryjnym bardziej istotna wydajność jednowątkowa (158 punktów; CB15) spadła w większym stopniu niż wydajność wielowątkowa (1696 punktów; CB15).
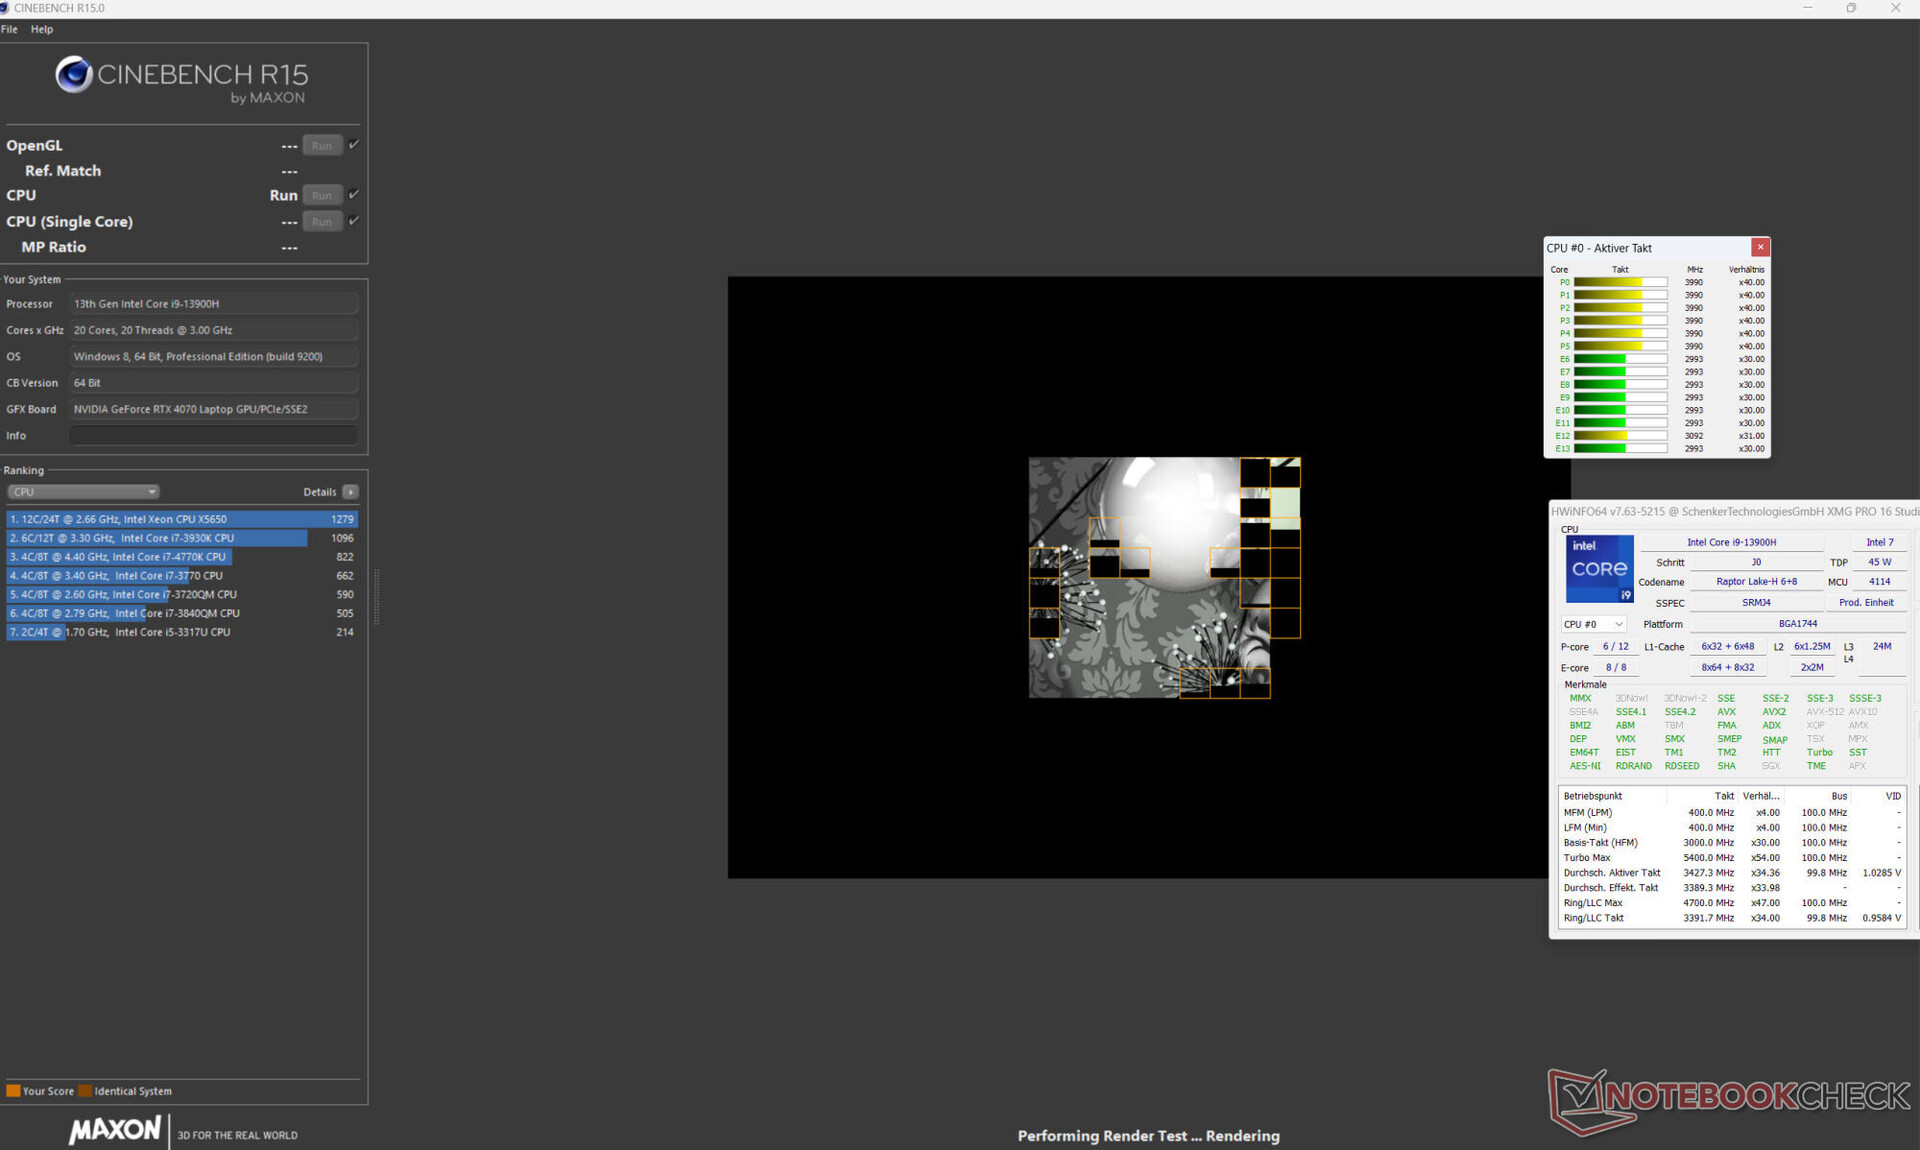
Cinebench R15 Multi continuous test
* ... im mniej tym lepiej
AIDA64: FP32 Ray-Trace | FPU Julia | CPU SHA3 | CPU Queen | FPU SinJulia | FPU Mandel | CPU AES | CPU ZLib | FP64 Ray-Trace | CPU PhotoWorxx
| Performance rating | |
| Średnia w klasie Gaming | |
| HP Omen Transcend 16 | |
| Asus Vivobook Pro 16X K6604JV-MX016W | |
| Schenker XMG Pro 16 Studio (Mid 23) | |
| MSI Stealth 16 Studio A13VG | |
| Lenovo Legion Slim 7i 16 Gen 8 | |
| Przeciętny Intel Core i9-13900H | |
| AIDA64 / FP32 Ray-Trace | |
| Średnia w klasie Gaming (10227 - 85542, n=107, ostatnie 2 lata) | |
| HP Omen Transcend 16 | |
| Asus Vivobook Pro 16X K6604JV-MX016W | |
| MSI Stealth 16 Studio A13VG | |
| Lenovo Legion Slim 7i 16 Gen 8 | |
| Schenker XMG Pro 16 Studio (Mid 23) | |
| Przeciętny Intel Core i9-13900H (6788 - 19557, n=25) | |
| AIDA64 / FPU Julia | |
| Średnia w klasie Gaming (51376 - 238426, n=107, ostatnie 2 lata) | |
| HP Omen Transcend 16 | |
| Asus Vivobook Pro 16X K6604JV-MX016W | |
| Lenovo Legion Slim 7i 16 Gen 8 | |
| Schenker XMG Pro 16 Studio (Mid 23) | |
| MSI Stealth 16 Studio A13VG | |
| Przeciętny Intel Core i9-13900H (22551 - 95579, n=25) | |
| AIDA64 / CPU SHA3 | |
| Średnia w klasie Gaming (2180 - 9817, n=107, ostatnie 2 lata) | |
| HP Omen Transcend 16 | |
| Asus Vivobook Pro 16X K6604JV-MX016W | |
| MSI Stealth 16 Studio A13VG | |
| Lenovo Legion Slim 7i 16 Gen 8 | |
| Schenker XMG Pro 16 Studio (Mid 23) | |
| Przeciętny Intel Core i9-13900H (2491 - 4270, n=25) | |
| AIDA64 / CPU Queen | |
| Asus Vivobook Pro 16X K6604JV-MX016W | |
| HP Omen Transcend 16 | |
| Lenovo Legion Slim 7i 16 Gen 8 | |
| Średnia w klasie Gaming (49785 - 173351, n=94, ostatnie 2 lata) | |
| MSI Stealth 16 Studio A13VG | |
| Przeciętny Intel Core i9-13900H (65121 - 120936, n=25) | |
| Schenker XMG Pro 16 Studio (Mid 23) | |
| AIDA64 / FPU SinJulia | |
| Średnia w klasie Gaming (4424 - 33636, n=107, ostatnie 2 lata) | |
| Asus Vivobook Pro 16X K6604JV-MX016W | |
| HP Omen Transcend 16 | |
| Lenovo Legion Slim 7i 16 Gen 8 | |
| MSI Stealth 16 Studio A13VG | |
| Schenker XMG Pro 16 Studio (Mid 23) | |
| Przeciętny Intel Core i9-13900H (6108 - 11631, n=25) | |
| AIDA64 / FPU Mandel | |
| Średnia w klasie Gaming (25115 - 128721, n=107, ostatnie 2 lata) | |
| HP Omen Transcend 16 | |
| Asus Vivobook Pro 16X K6604JV-MX016W | |
| Lenovo Legion Slim 7i 16 Gen 8 | |
| MSI Stealth 16 Studio A13VG | |
| Schenker XMG Pro 16 Studio (Mid 23) | |
| Przeciętny Intel Core i9-13900H (11283 - 48474, n=25) | |
| AIDA64 / CPU AES | |
| Schenker XMG Pro 16 Studio (Mid 23) | |
| HP Omen Transcend 16 | |
| Średnia w klasie Gaming (39258 - 247074, n=107, ostatnie 2 lata) | |
| Asus Vivobook Pro 16X K6604JV-MX016W | |
| Przeciętny Intel Core i9-13900H (3691 - 149377, n=25) | |
| MSI Stealth 16 Studio A13VG | |
| Lenovo Legion Slim 7i 16 Gen 8 | |
| AIDA64 / CPU ZLib | |
| HP Omen Transcend 16 | |
| Średnia w klasie Gaming (574 - 2531, n=107, ostatnie 2 lata) | |
| Asus Vivobook Pro 16X K6604JV-MX016W | |
| Lenovo Legion Slim 7i 16 Gen 8 | |
| Schenker XMG Pro 16 Studio (Mid 23) | |
| Przeciętny Intel Core i9-13900H (789 - 1254, n=25) | |
| MSI Stealth 16 Studio A13VG | |
| AIDA64 / FP64 Ray-Trace | |
| Średnia w klasie Gaming (5509 - 45446, n=107, ostatnie 2 lata) | |
| HP Omen Transcend 16 | |
| Asus Vivobook Pro 16X K6604JV-MX016W | |
| MSI Stealth 16 Studio A13VG | |
| Lenovo Legion Slim 7i 16 Gen 8 | |
| Schenker XMG Pro 16 Studio (Mid 23) | |
| Przeciętny Intel Core i9-13900H (3655 - 10716, n=25) | |
| AIDA64 / CPU PhotoWorxx | |
| HP Omen Transcend 16 | |
| Schenker XMG Pro 16 Studio (Mid 23) | |
| MSI Stealth 16 Studio A13VG | |
| Średnia w klasie Gaming (12271 - 89891, n=107, ostatnie 2 lata) | |
| Asus Vivobook Pro 16X K6604JV-MX016W | |
| Przeciętny Intel Core i9-13900H (10871 - 50488, n=25) | |
| Lenovo Legion Slim 7i 16 Gen 8 | |
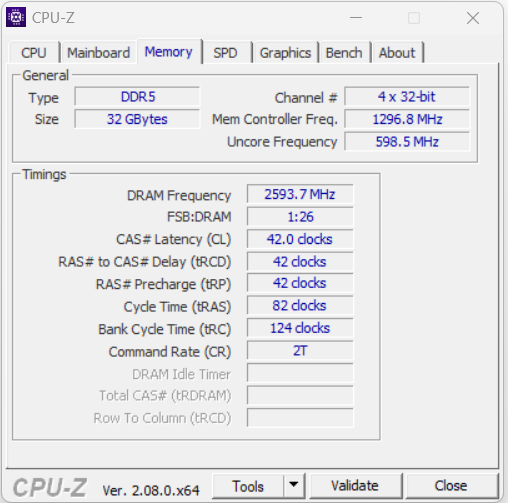
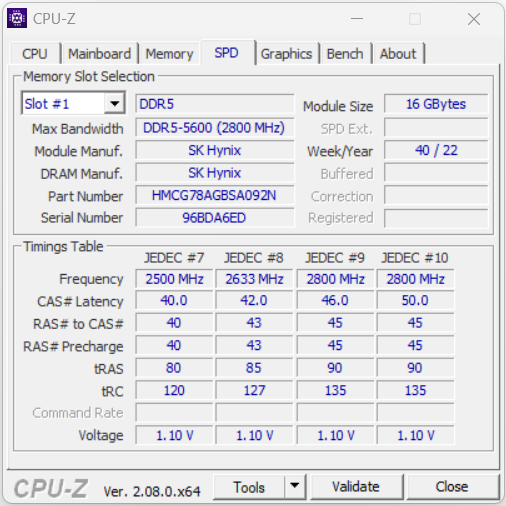
Wydajność systemu
Płynnie działającemu systemowi nie brakuje mocy obliczeniowej. Gry, renderowanie i edycja wideo należą do podstawowych kompetencji komputera. Szybkość transferu pamięci RAM jest na normalnym poziomie dla pamięci DDR5-5600 RAM.
CrossMark: Overall | Productivity | Creativity | Responsiveness
| PCMark 10 / Score | |
| Lenovo Legion Slim 7i 16 Gen 8 | |
| Średnia w klasie Gaming (5828 - 11574, n=95, ostatnie 2 lata) | |
| HP Omen Transcend 16 | |
| Schenker XMG Pro 16 Studio (Mid 23) | |
| Przeciętny Intel Core i9-13900H, NVIDIA GeForce RTX 4070 Laptop GPU (5855 - 8538, n=8) | |
| MSI Stealth 16 Studio A13VG | |
| Asus Vivobook Pro 16X K6604JV-MX016W | |
| PCMark 10 / Essentials | |
| Schenker XMG Pro 16 Studio (Mid 23) | |
| Lenovo Legion Slim 7i 16 Gen 8 | |
| HP Omen Transcend 16 | |
| Przeciętny Intel Core i9-13900H, NVIDIA GeForce RTX 4070 Laptop GPU (8835 - 11940, n=8) | |
| Średnia w klasie Gaming (8810 - 12600, n=99, ostatnie 2 lata) | |
| Asus Vivobook Pro 16X K6604JV-MX016W | |
| MSI Stealth 16 Studio A13VG | |
| PCMark 10 / Productivity | |
| Lenovo Legion Slim 7i 16 Gen 8 | |
| Średnia w klasie Gaming (6845 - 21327, n=97, ostatnie 2 lata) | |
| Schenker XMG Pro 16 Studio (Mid 23) | |
| Przeciętny Intel Core i9-13900H, NVIDIA GeForce RTX 4070 Laptop GPU (7967 - 10991, n=8) | |
| HP Omen Transcend 16 | |
| MSI Stealth 16 Studio A13VG | |
| Asus Vivobook Pro 16X K6604JV-MX016W | |
| PCMark 10 / Digital Content Creation | |
| Średnia w klasie Gaming (7602 - 19657, n=97, ostatnie 2 lata) | |
| Lenovo Legion Slim 7i 16 Gen 8 | |
| HP Omen Transcend 16 | |
| Przeciętny Intel Core i9-13900H, NVIDIA GeForce RTX 4070 Laptop GPU (7738 - 13575, n=8) | |
| Schenker XMG Pro 16 Studio (Mid 23) | |
| MSI Stealth 16 Studio A13VG | |
| Asus Vivobook Pro 16X K6604JV-MX016W | |
| CrossMark / Overall | |
| Asus Vivobook Pro 16X K6604JV-MX016W | |
| Średnia w klasie Gaming (1366 - 2409, n=96, ostatnie 2 lata) | |
| Lenovo Legion Slim 7i 16 Gen 8 | |
| HP Omen Transcend 16 | |
| Schenker XMG Pro 16 Studio (Mid 23) | |
| Przeciętny Intel Core i9-13900H, NVIDIA GeForce RTX 4070 Laptop GPU (1104 - 1974, n=7) | |
| MSI Stealth 16 Studio A13VG | |
| CrossMark / Productivity | |
| Asus Vivobook Pro 16X K6604JV-MX016W | |
| Lenovo Legion Slim 7i 16 Gen 8 | |
| Schenker XMG Pro 16 Studio (Mid 23) | |
| Średnia w klasie Gaming (1386 - 2254, n=96, ostatnie 2 lata) | |
| HP Omen Transcend 16 | |
| Przeciętny Intel Core i9-13900H, NVIDIA GeForce RTX 4070 Laptop GPU (1058 - 1914, n=7) | |
| MSI Stealth 16 Studio A13VG | |
| CrossMark / Creativity | |
| Asus Vivobook Pro 16X K6604JV-MX016W | |
| HP Omen Transcend 16 | |
| Średnia w klasie Gaming (1343 - 2729, n=96, ostatnie 2 lata) | |
| Lenovo Legion Slim 7i 16 Gen 8 | |
| Schenker XMG Pro 16 Studio (Mid 23) | |
| Przeciętny Intel Core i9-13900H, NVIDIA GeForce RTX 4070 Laptop GPU (1178 - 2254, n=7) | |
| MSI Stealth 16 Studio A13VG | |
| CrossMark / Responsiveness | |
| Schenker XMG Pro 16 Studio (Mid 23) | |
| Lenovo Legion Slim 7i 16 Gen 8 | |
| Średnia w klasie Gaming (1226 - 2334, n=96, ostatnie 2 lata) | |
| Asus Vivobook Pro 16X K6604JV-MX016W | |
| Przeciętny Intel Core i9-13900H, NVIDIA GeForce RTX 4070 Laptop GPU (1037 - 1952, n=7) | |
| MSI Stealth 16 Studio A13VG | |
| HP Omen Transcend 16 | |
| PCMark 10 Score | 8010 pkt. | |
Pomoc | ||
| AIDA64 / Memory Copy | |
| HP Omen Transcend 16 | |
| Średnia w klasie Gaming (21750 - 129946, n=107, ostatnie 2 lata) | |
| Schenker XMG Pro 16 Studio (Mid 23) | |
| MSI Stealth 16 Studio A13VG | |
| Asus Vivobook Pro 16X K6604JV-MX016W | |
| Przeciętny Intel Core i9-13900H (37448 - 74486, n=25) | |
| Lenovo Legion Slim 7i 16 Gen 8 | |
| AIDA64 / Memory Read | |
| HP Omen Transcend 16 | |
| Asus Vivobook Pro 16X K6604JV-MX016W | |
| Schenker XMG Pro 16 Studio (Mid 23) | |
| MSI Stealth 16 Studio A13VG | |
| Średnia w klasie Gaming (22956 - 118858, n=107, ostatnie 2 lata) | |
| Przeciętny Intel Core i9-13900H (41599 - 75433, n=25) | |
| Lenovo Legion Slim 7i 16 Gen 8 | |
| AIDA64 / Memory Write | |
| HP Omen Transcend 16 | |
| Średnia w klasie Gaming (22297 - 135096, n=107, ostatnie 2 lata) | |
| Schenker XMG Pro 16 Studio (Mid 23) | |
| MSI Stealth 16 Studio A13VG | |
| Asus Vivobook Pro 16X K6604JV-MX016W | |
| Przeciętny Intel Core i9-13900H (36152 - 88505, n=25) | |
| Lenovo Legion Slim 7i 16 Gen 8 | |
| AIDA64 / Memory Latency | |
| Średnia w klasie Gaming (75.3 - 259, n=107, ostatnie 2 lata) | |
| Asus Vivobook Pro 16X K6604JV-MX016W | |
| Przeciętny Intel Core i9-13900H (75.8 - 102.3, n=25) | |
| HP Omen Transcend 16 | |
| MSI Stealth 16 Studio A13VG | |
| Schenker XMG Pro 16 Studio (Mid 23) | |
| Lenovo Legion Slim 7i 16 Gen 8 | |
* ... im mniej tym lepiej
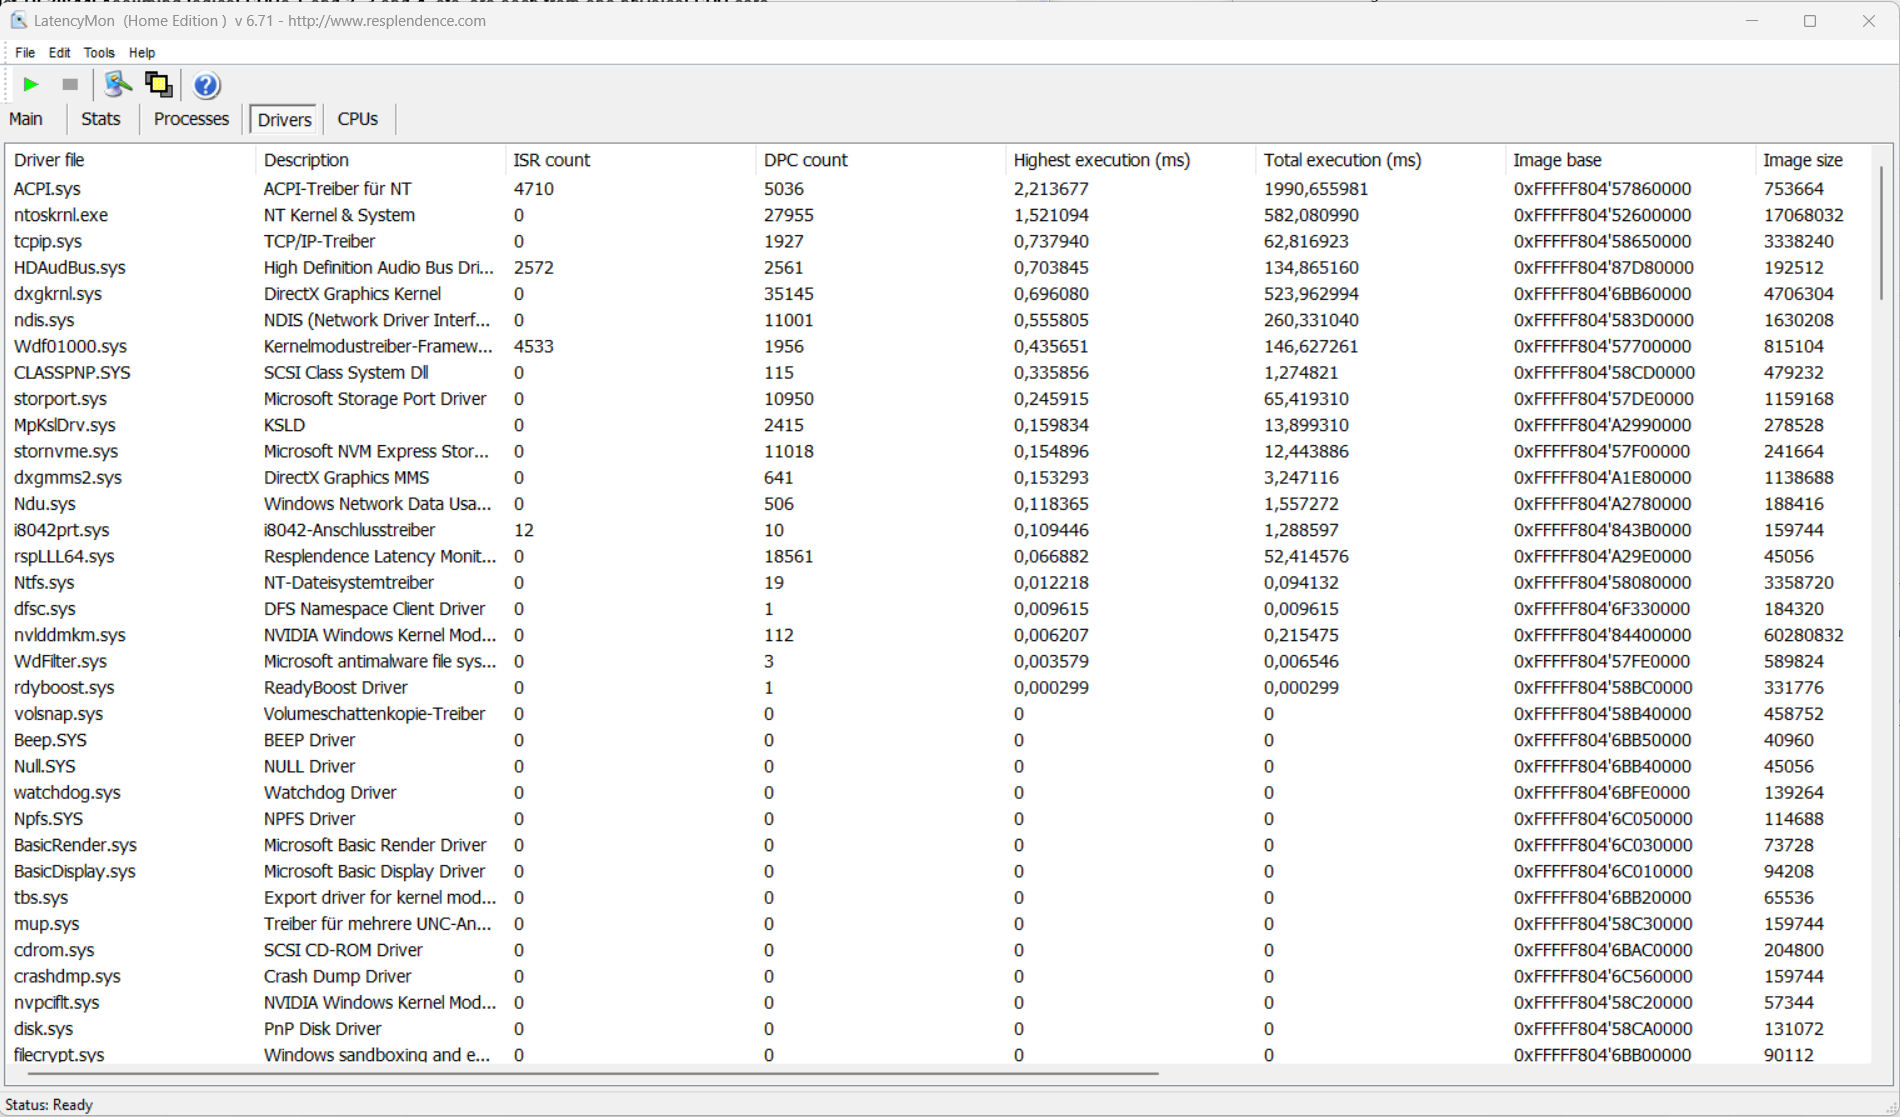
Opóźnienie DPC
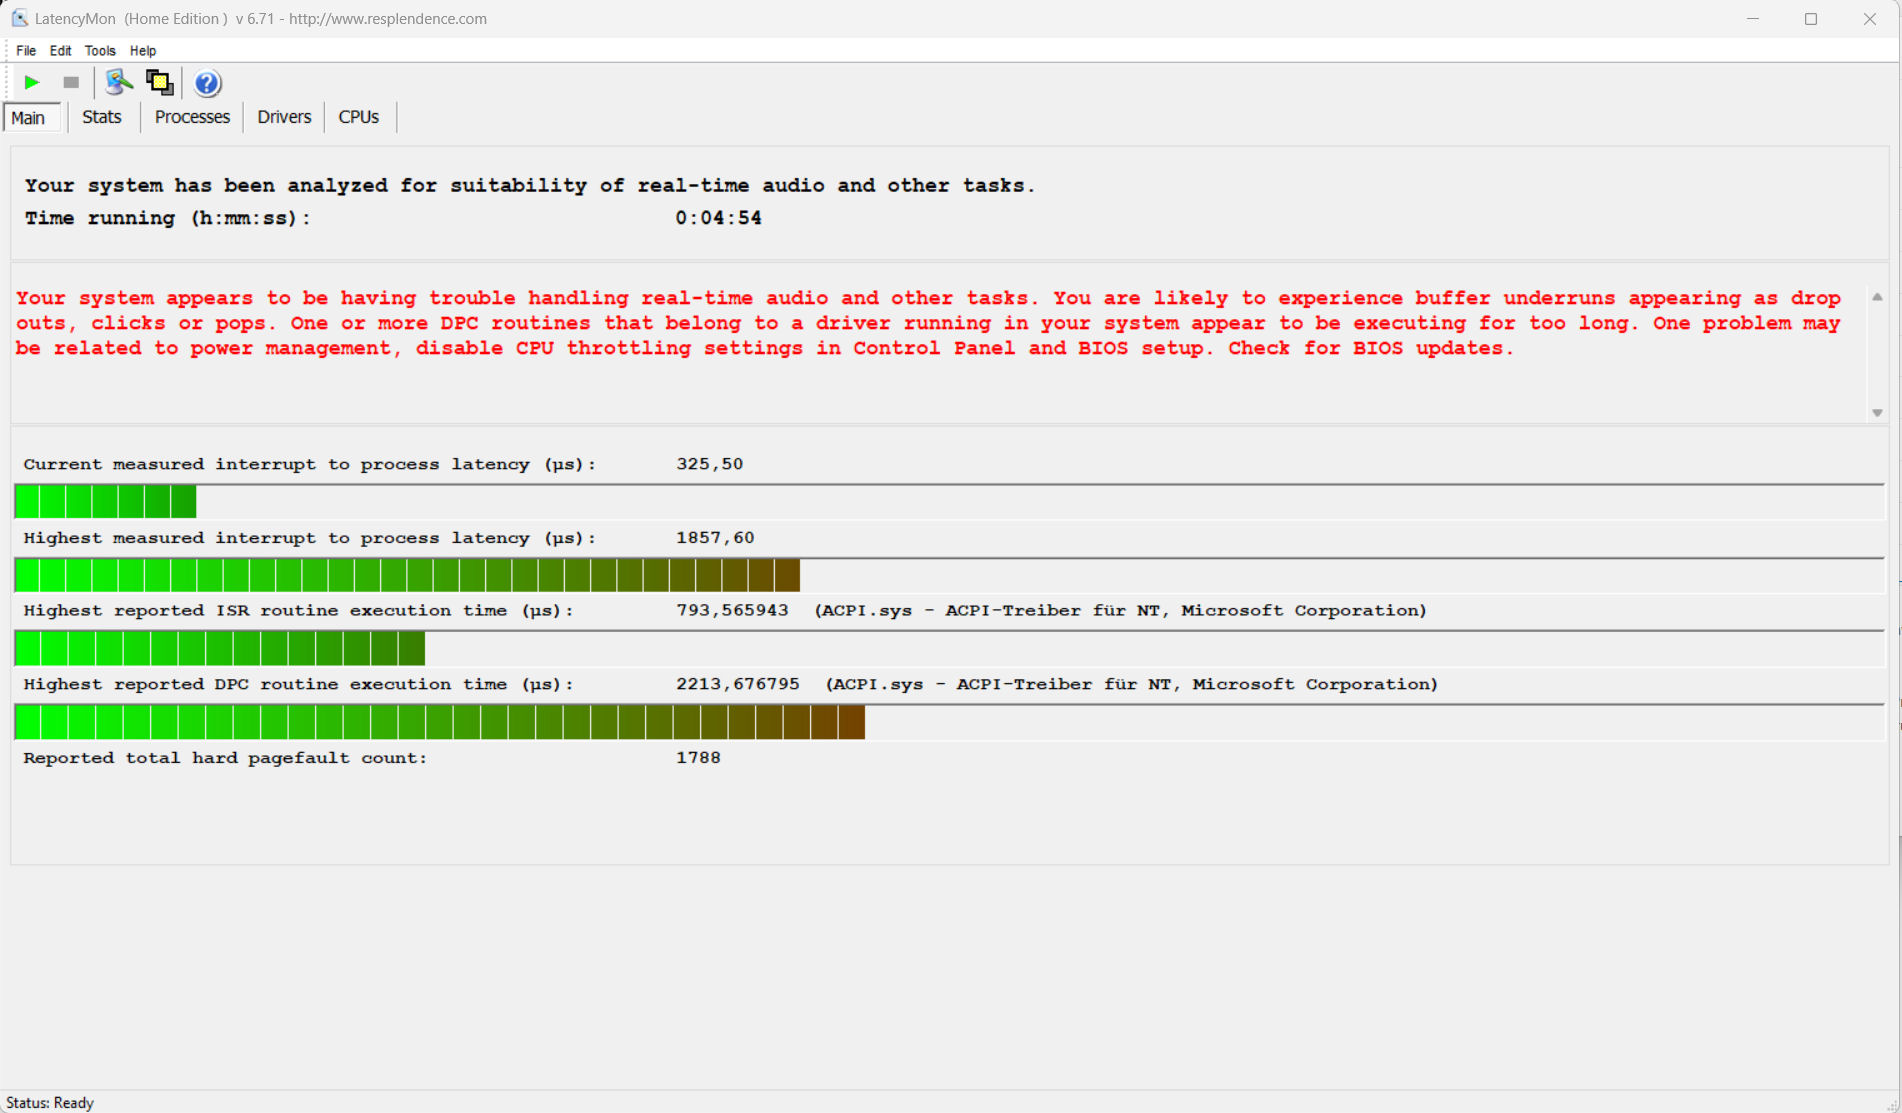
Standardowy test monitora opóźnień (surfowanie po sieci, odtwarzanie wideo 4k, wysokie obciążenie Prime95) ujawnił pewne anomalie. System nie wydaje się być odpowiedni do edycji wideo i audio w czasie rzeczywistym. Przyszłe aktualizacje oprogramowania mogą doprowadzić do poprawy lub nawet pogorszenia wydajności.
| DPC Latencies / LatencyMon - interrupt to process latency (max), Web, Youtube, Prime95 | |
| MSI Stealth 16 Studio A13VG | |
| Lenovo Legion Slim 7i 16 Gen 8 | |
| Asus Vivobook Pro 16X K6604JV-MX016W | |
| Schenker XMG Pro 16 Studio (Mid 23) | |
| HP Omen Transcend 16 | |
* ... im mniej tym lepiej
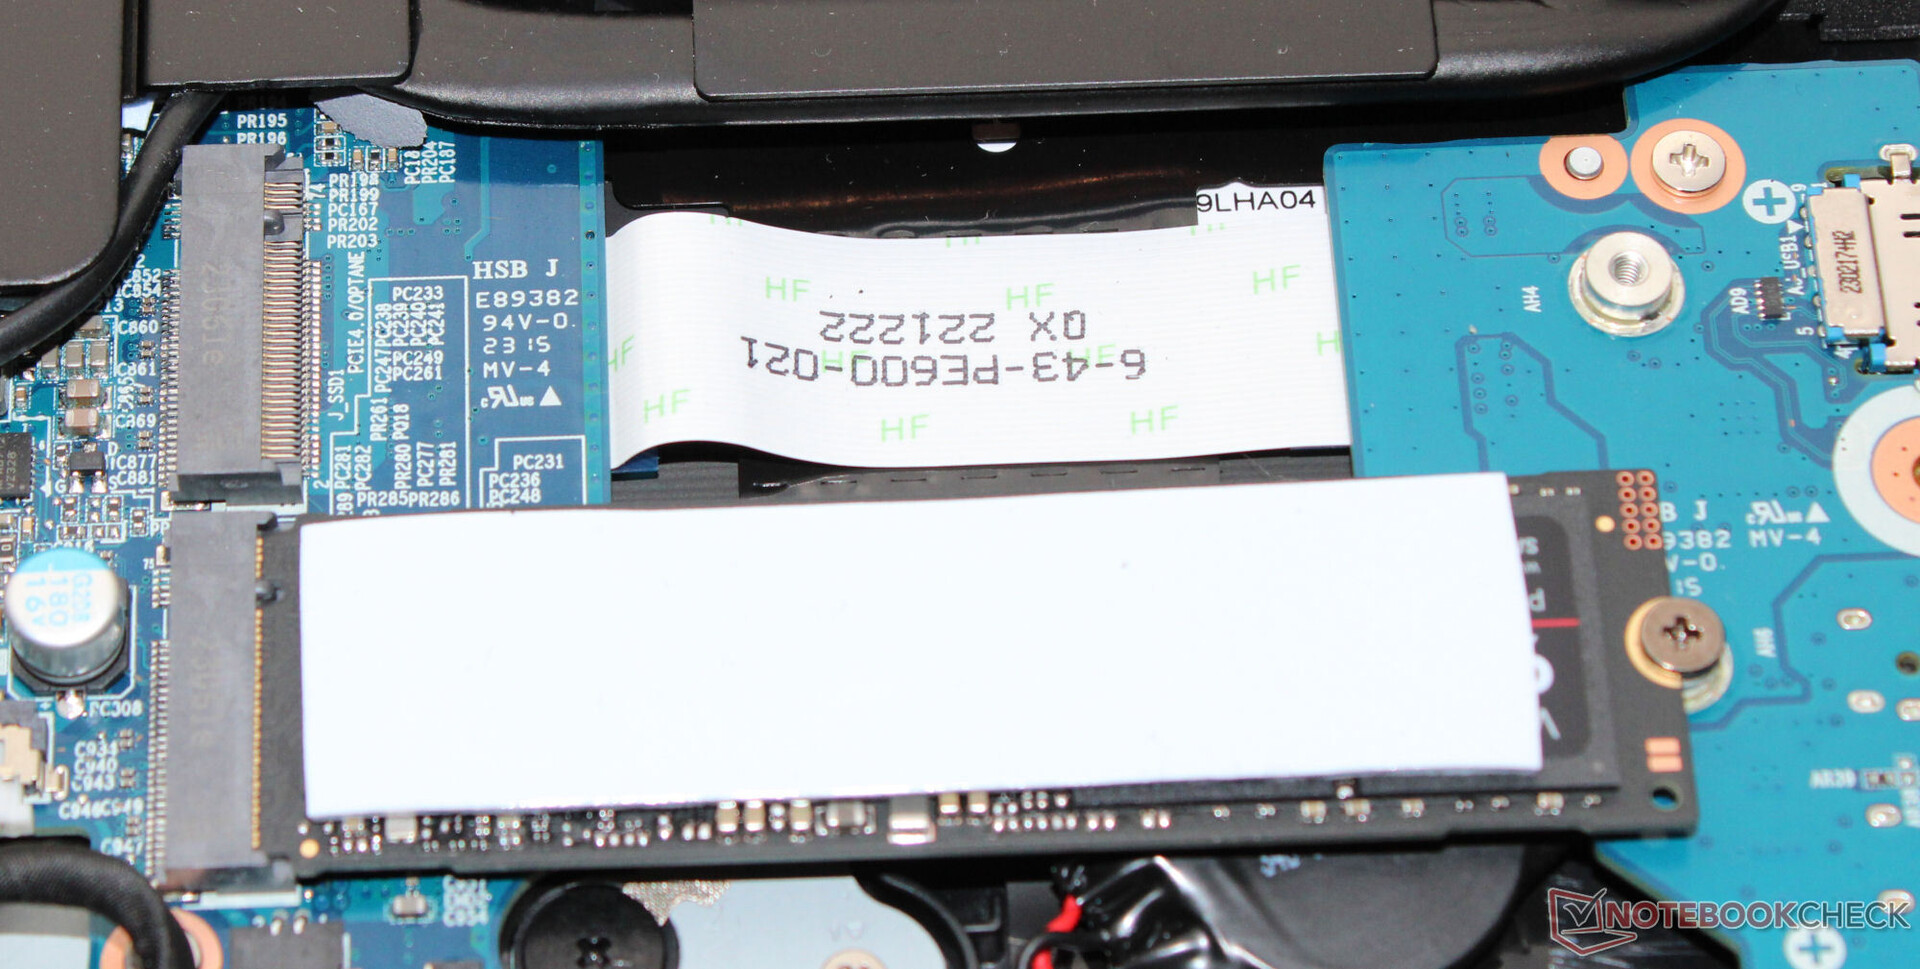
Urządzenia pamięci masowej
Pro 16 może pomieścić łącznie dwa dyski SSD PCIe 4 w formacie M.2-2280. Obsługiwany jest RAID-0/1. Dysk SSD Samsung (1 TB, PCIe 4, M.2-2280) w naszym urządzeniu testowym zapewnił doskonałe prędkości transferu. Pozytywne: Nie wystąpił throttling termiczny.

* ... im mniej tym lepiej
Reading continuous performance: DiskSpd Read Loop, Queue Depth 8
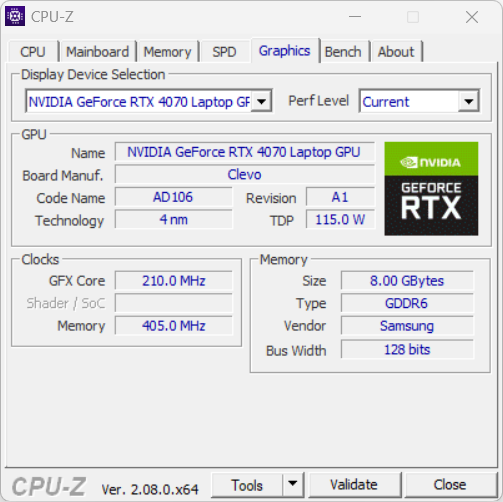
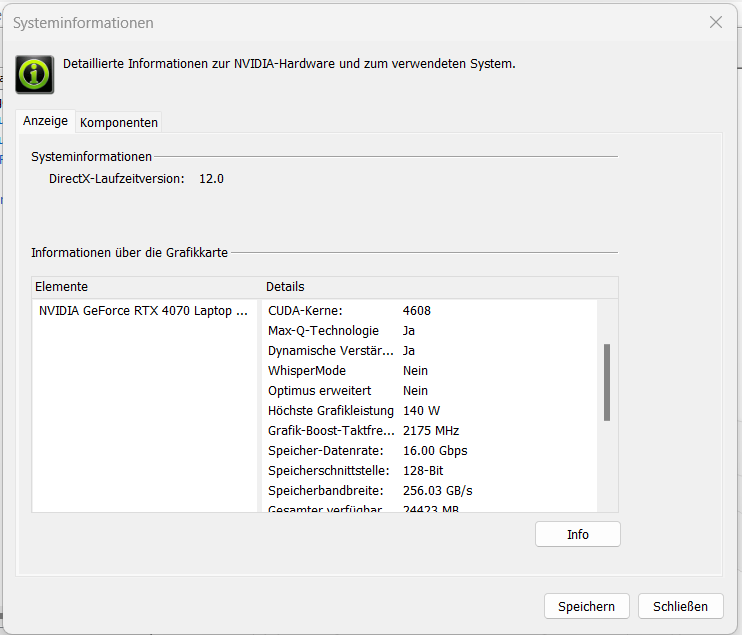
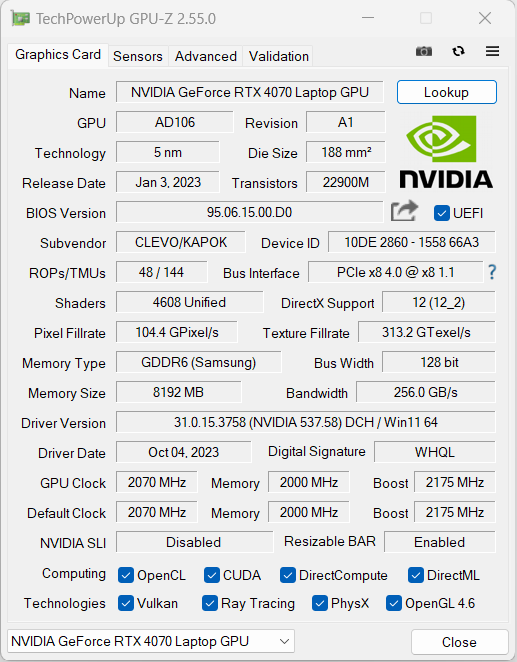
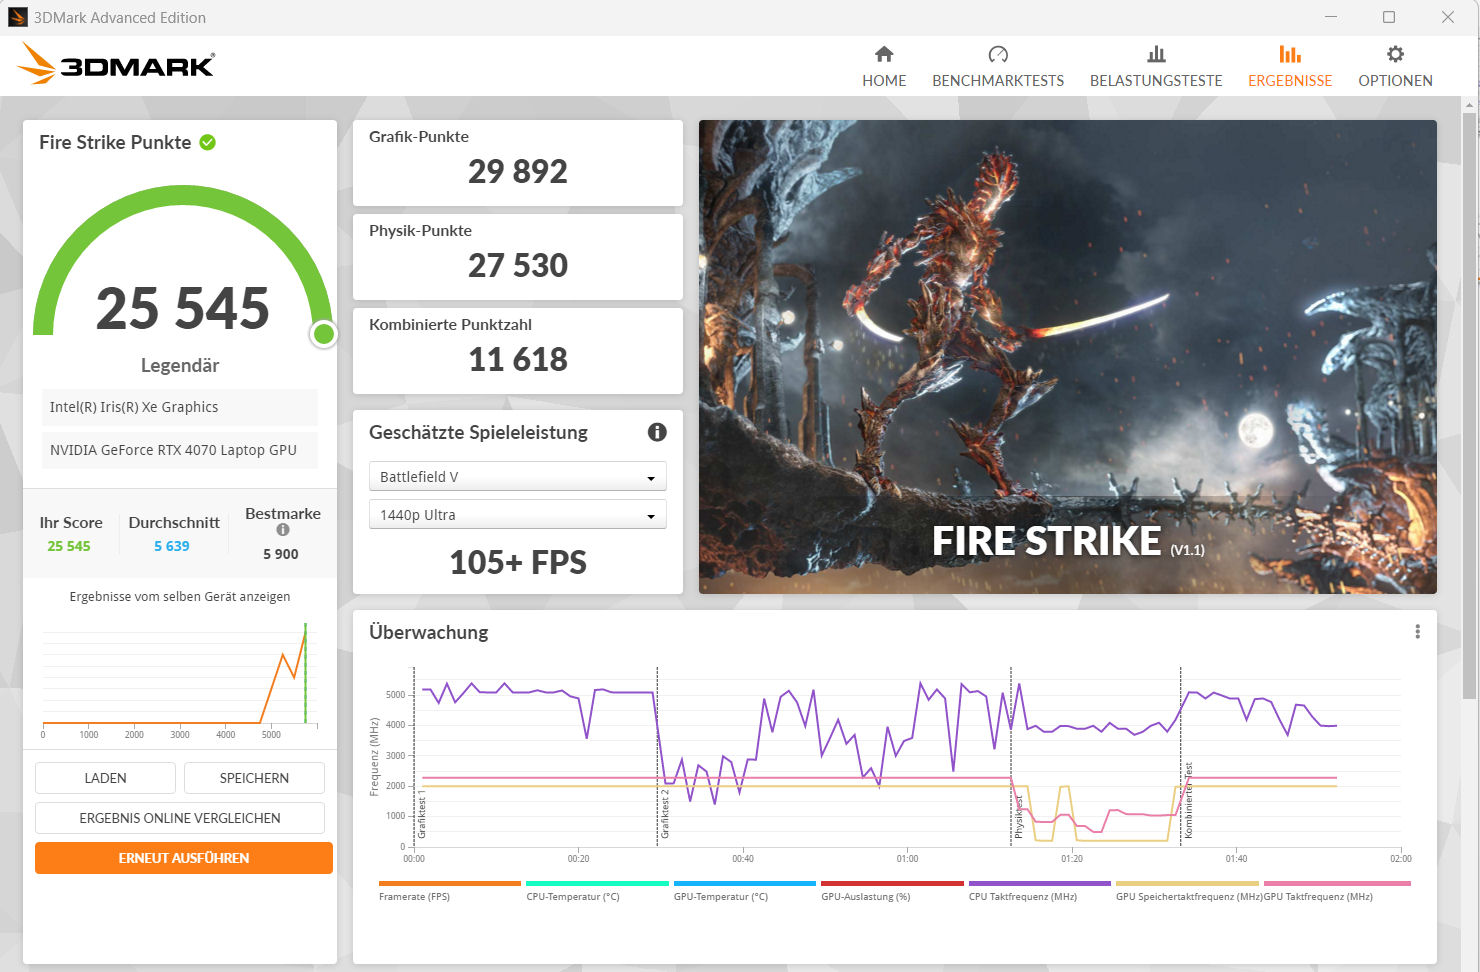
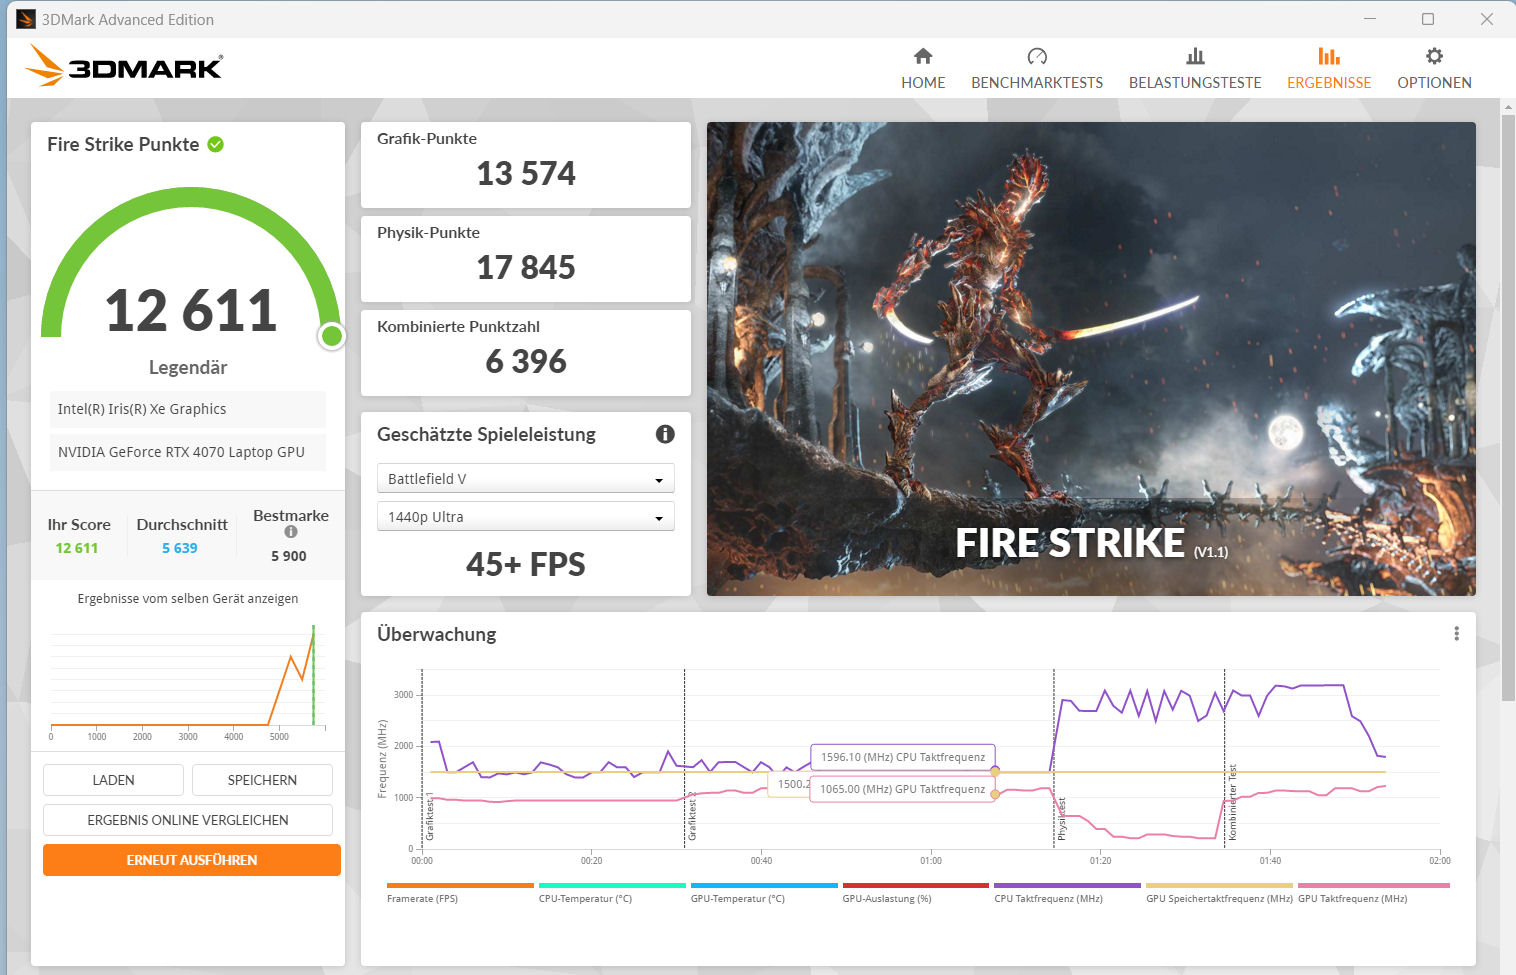
Karta graficzna
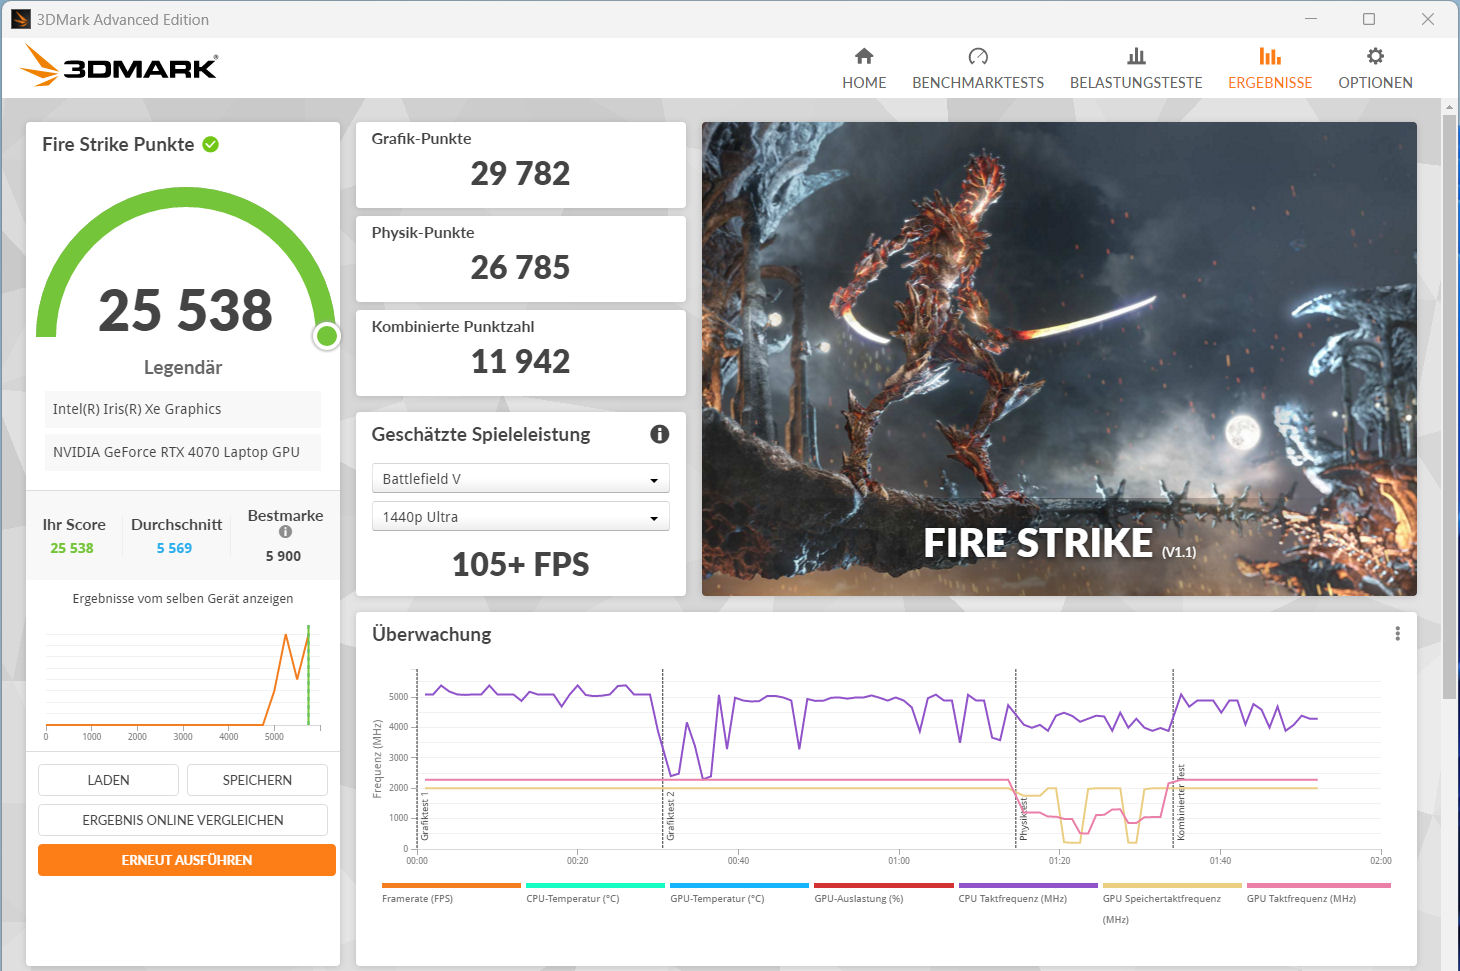
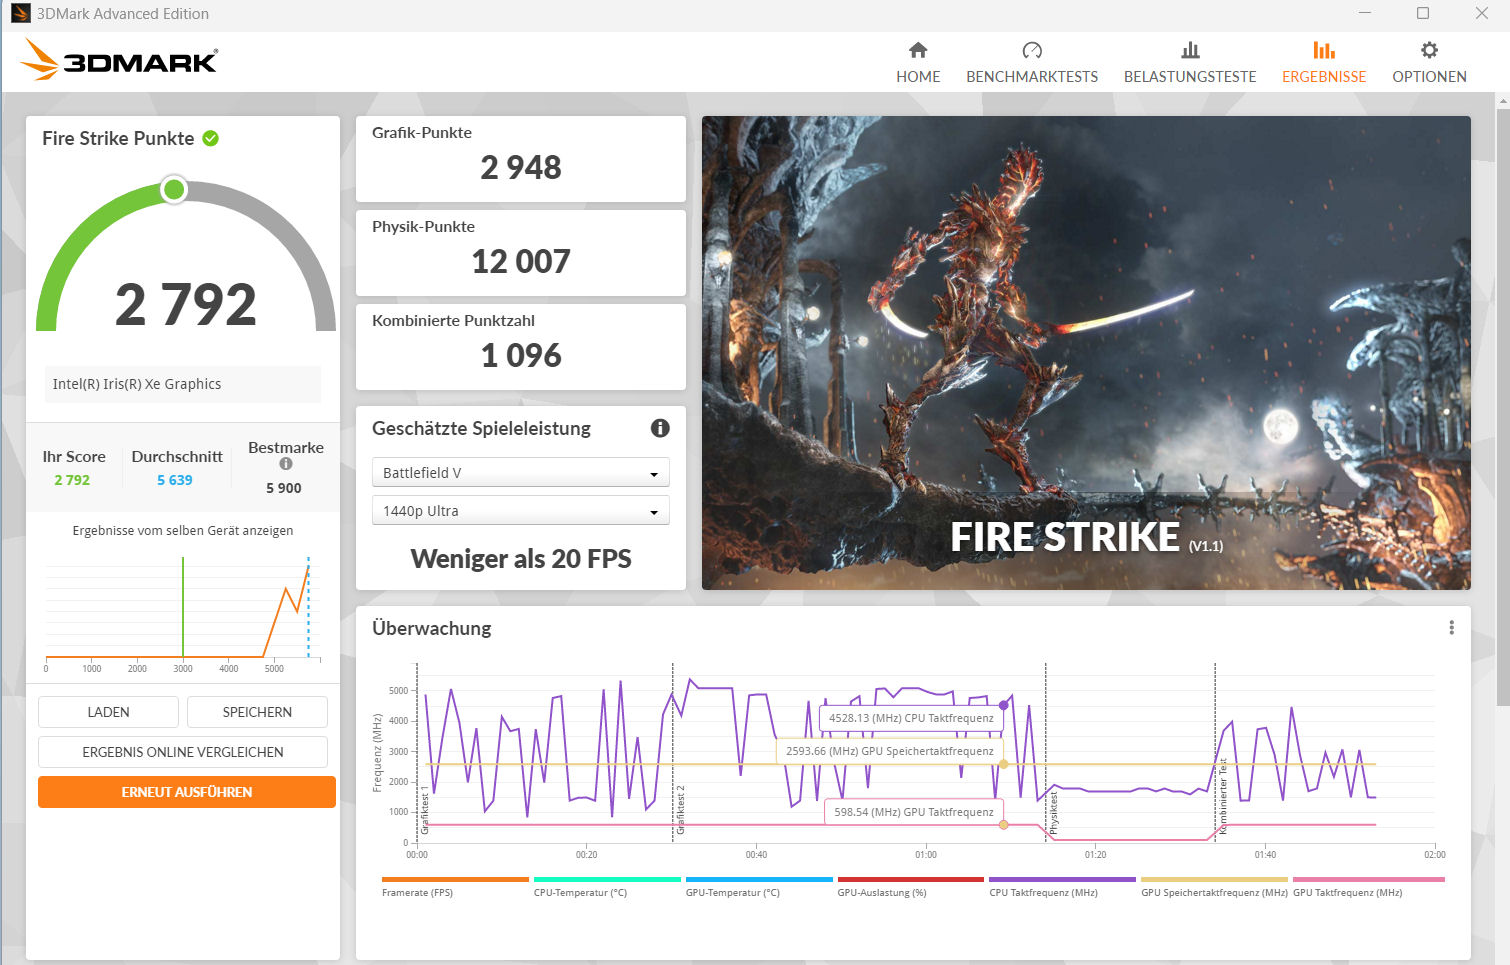
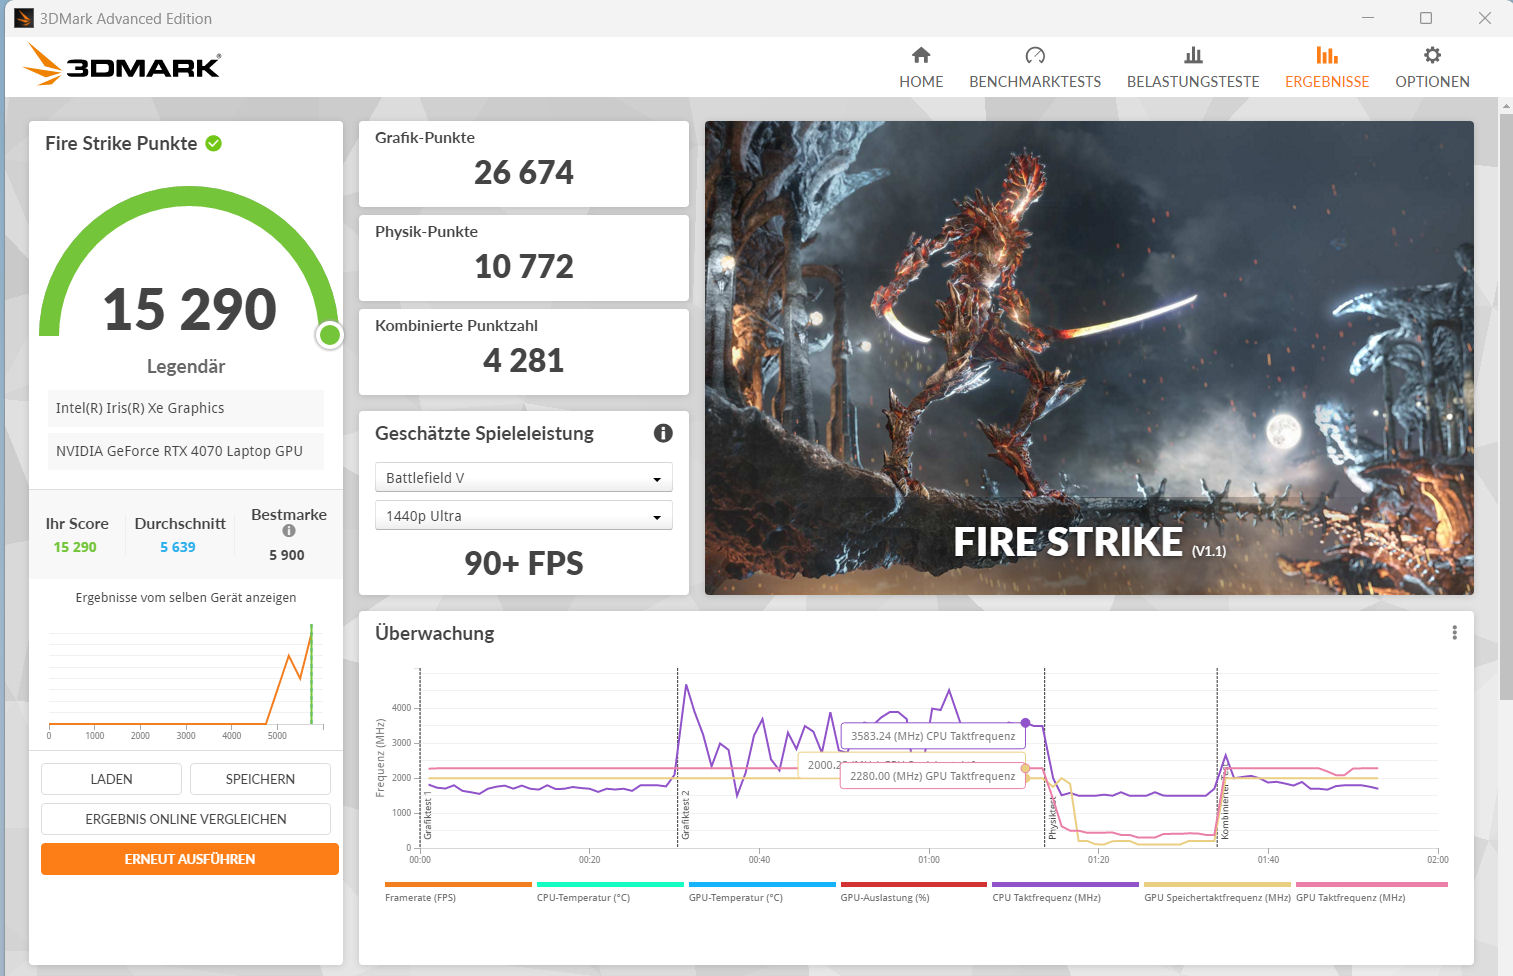
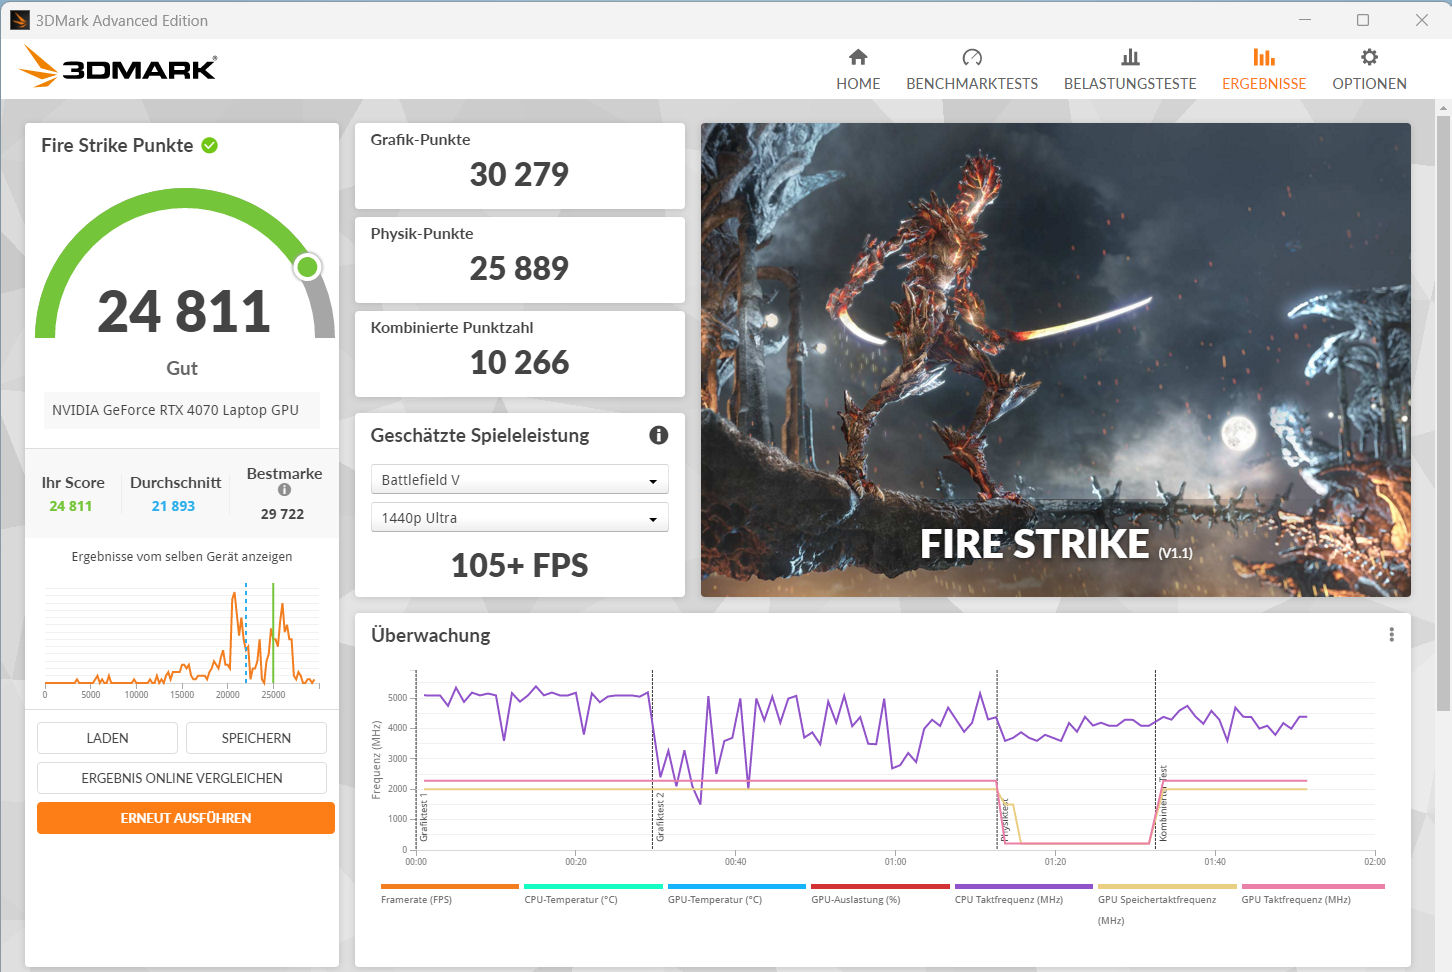
Karta graficznaGeForce RTX 4070 oferuje 4 608 jednostek cieniujących, magistralę o szerokości 128 bitów i szybką pamięć RAM GDDR6 (8 192 MB). Schenker ustalił maksymalne TGP na 140 W (115 W + 25 W Dynamic Boost) - więcej nie jest możliwe.
Rdzeń graficzny pozwala na granie w rozdzielczości QHD przy wysokich i maksymalnych ustawieniach. Osiąga przy tym liczbę klatek na sekundę powyżej wcześniej ustalonej średniej RTX 4070. Korzystanie z trybu dGPU (aktywowanego przez BIOS) prowadzi do niewielkiego wzrostu wydajności. Rdzeń graficzny i pamięć można podkręcać za pośrednictwem Centrum sterowania (Tryb wydajności -> kliknij strzałki skierowane w dół). Advanced Optimus nie jest obsługiwany.
| 3DMark 06 Standard Score | 54913 pkt. | |
| 3DMark 11 Performance | 34302 pkt. | |
| 3DMark Cloud Gate Standard Score | 62061 pkt. | |
| 3DMark Fire Strike Score | 25545 pkt. | |
| 3DMark Time Spy Score | 12134 pkt. | |
Pomoc | ||
* ... im mniej tym lepiej
| The Witcher 3 - 1920x1080 Ultra Graphics & Postprocessing (HBAO+) | |
| Średnia w klasie Gaming (95 - 240, n=7, ostatnie 2 lata) | |
| MSI Stealth 16 Studio A13VG | |
| Schenker XMG Pro 16 Studio (Mid 23) | |
| Lenovo Legion Slim 7i 16 Gen 8 | |
| Przeciętny NVIDIA GeForce RTX 4070 Laptop GPU (69.8 - 133.7, n=57) | |
| HP Omen Transcend 16 | |
| Asus Vivobook Pro 16X K6604JV-MX016W | |
| Lies of P | |
| 1920x1080 Best Preset | |
| Przeciętny NVIDIA GeForce RTX 4070 Laptop GPU (137.4 - 148.1, n=4) | |
| Schenker XMG Pro 16 Studio (Mid 23) | |
| 2560x1440 Best Preset | |
| Przeciętny NVIDIA GeForce RTX 4070 Laptop GPU (97.2 - 98.8, n=4) | |
| Schenker XMG Pro 16 Studio (Mid 23) | |
| Assassin's Creed Mirage | |
| 1920x1080 Ultra High Preset (Adaptive Quality Off) | |
| Schenker XMG Pro 16 Studio (Mid 23) | |
| Przeciętny NVIDIA GeForce RTX 4070 Laptop GPU (91 - 99, n=6) | |
| 2560x1440 Ultra High Preset (Adaptive Quality Off) | |
| Przeciętny NVIDIA GeForce RTX 4070 Laptop GPU (73 - 80, n=6) | |
| Schenker XMG Pro 16 Studio (Mid 23) | |
| Lords of the Fallen | |
| 1920x1080 Ultra Preset | |
| Przeciętny NVIDIA GeForce RTX 4070 Laptop GPU (44.3 - 67.7, n=4) | |
| Schenker XMG Pro 16 Studio (Mid 23) | |
| 2560x1440 Ultra Preset | |
| Przeciętny NVIDIA GeForce RTX 4070 Laptop GPU (29.1 - 47.1, n=4) | |
| Schenker XMG Pro 16 Studio (Mid 23) | |
Witcher 3 FPS diagram
| low | med. | high | ultra | QHD | |
|---|---|---|---|---|---|
| GTA V (2015) | 186.8 | 185.9 | 181.3 | 125.4 | 93.2 |
| The Witcher 3 (2015) | 474.9 | 365.4 | 231.4 | 118.4 | 86.9 |
| Dota 2 Reborn (2015) | 210 | 187.5 | 176.5 | 162.8 | |
| Final Fantasy XV Benchmark (2018) | 219 | 159.8 | 115.5 | 84.1 | |
| X-Plane 11.11 (2018) | 166.7 | 146.4 | 119.5 | ||
| Strange Brigade (2018) | 544 | 280 | 232 | 202 | 132.8 |
| Cyberpunk 2077 1.6 (2022) | 147 | 115 | 95.3 | 86.7 | 55.4 |
| Returnal (2023) | 115 | 112 | 101 | 85 | 63 |
| F1 23 (2023) | 279 | 261 | 198.2 | 67.6 | 45.6 |
| Lies of P (2023) | 206 | 182 | 159.8 | 140.1 | 97.3 |
| Cyberpunk 2077 (2023) | 131.7 | 113.2 | 98.3 | 87.9 | 57.1 |
| Assassin's Creed Mirage (2023) | 143 | 132 | 125 | 99 | 75 |
| Total War Pharaoh (2023) | 385.9 | 239.5 | 146.2 | 113.3 | 87.2 |
| Lords of the Fallen (2023) | 96.9 | 84.1 | 63.4 | 45.9 | 29.1 |
Emisje i moc - Pro 16 zapewnia dobre czasy pracy
Emisja hałasu
Podczas grania emisja hałasu może wzrosnąć do 55 dB(A) (tryb wydajności). "Tryb rozrywki", z którego korzystaliśmy, zapewnia umiarkowaną emisję hałasu na poziomie 48 dB(A). Mogłoby być ciszej: W trybie cichym można osiągnąć emisję na poziomie 42 dB(A), kosztem pewnej wydajności w grach. W trybie bezczynności i w codziennym użytkowaniu (biuro, Internet) jeden z dwóch wentylatorów jest często używany, a czasami oba pozostają wyłączone.
Hałas
| luz |
| 26 / 29 / 34 dB |
| obciążenie |
| 43 / 48 dB |
 | ||
30 dB cichy 40 dB(A) słyszalny 50 dB(A) irytujący |
||
min: | ||
| Schenker XMG Pro 16 Studio (Mid 23) i9-13900H, GeForce RTX 4070 Laptop GPU | Asus Vivobook Pro 16X K6604JV-MX016W i9-13980HX, GeForce RTX 4060 Laptop GPU | Lenovo Legion Slim 7i 16 Gen 8 i9-13900H, GeForce RTX 4070 Laptop GPU | HP Omen Transcend 16 i9-13900HX, GeForce RTX 4070 Laptop GPU | MSI Stealth 16 Studio A13VG i7-13700H, GeForce RTX 4070 Laptop GPU | |
|---|---|---|---|---|---|
| Noise | -4% | 10% | -3% | 11% | |
| wyłączone / środowisko * (dB) | 25 | 25.2 -1% | 22.8 9% | 22.9 8% | 24 4% |
| Idle Minimum * (dB) | 26 | 26.6 -2% | 23.6 9% | 29.1 -12% | 24 8% |
| Idle Average * (dB) | 29 | 26.6 8% | 23.6 19% | 29.1 -0% | 24 17% |
| Idle Maximum * (dB) | 34 | 29.2 14% | 25.7 24% | 29.1 14% | 24 29% |
| Load Average * (dB) | 43 | 53.4 -24% | 27.6 36% | 45.7 -6% | 34.81 19% |
| Witcher 3 ultra * (dB) | 48 | 54.4 -13% | 54.3 -13% | 44.05 8% | |
| Load Maximum * (dB) | 48 | 56.9 -19% | 54.4 -13% | 54.3 -13% | 51.57 -7% |
* ... im mniej tym lepiej
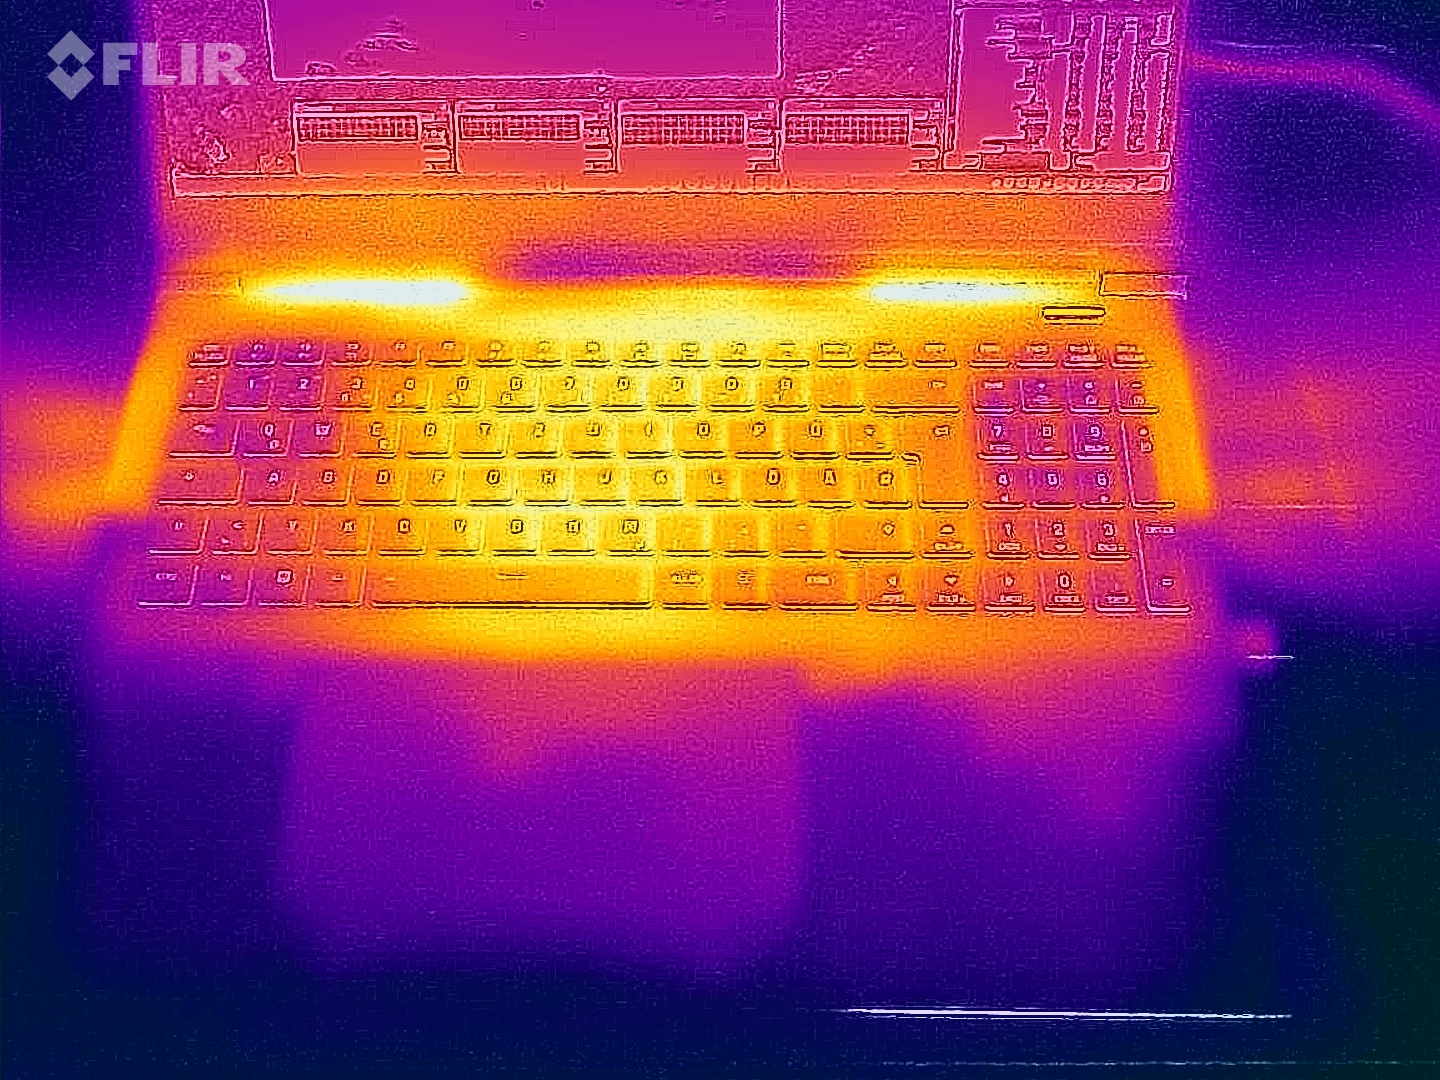
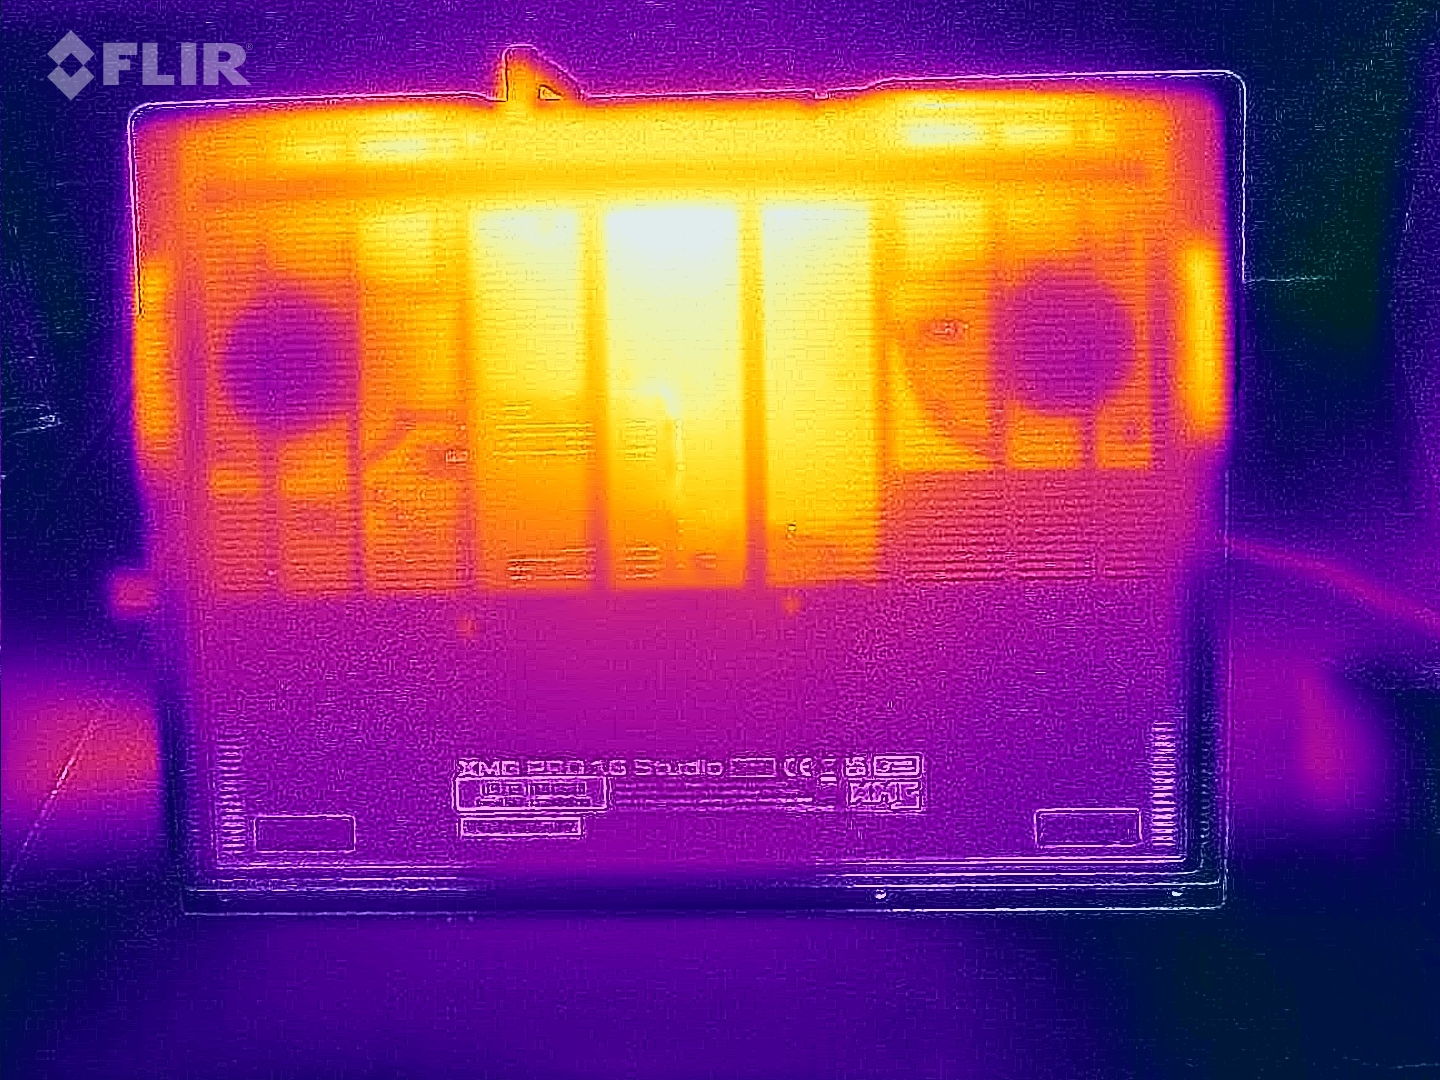
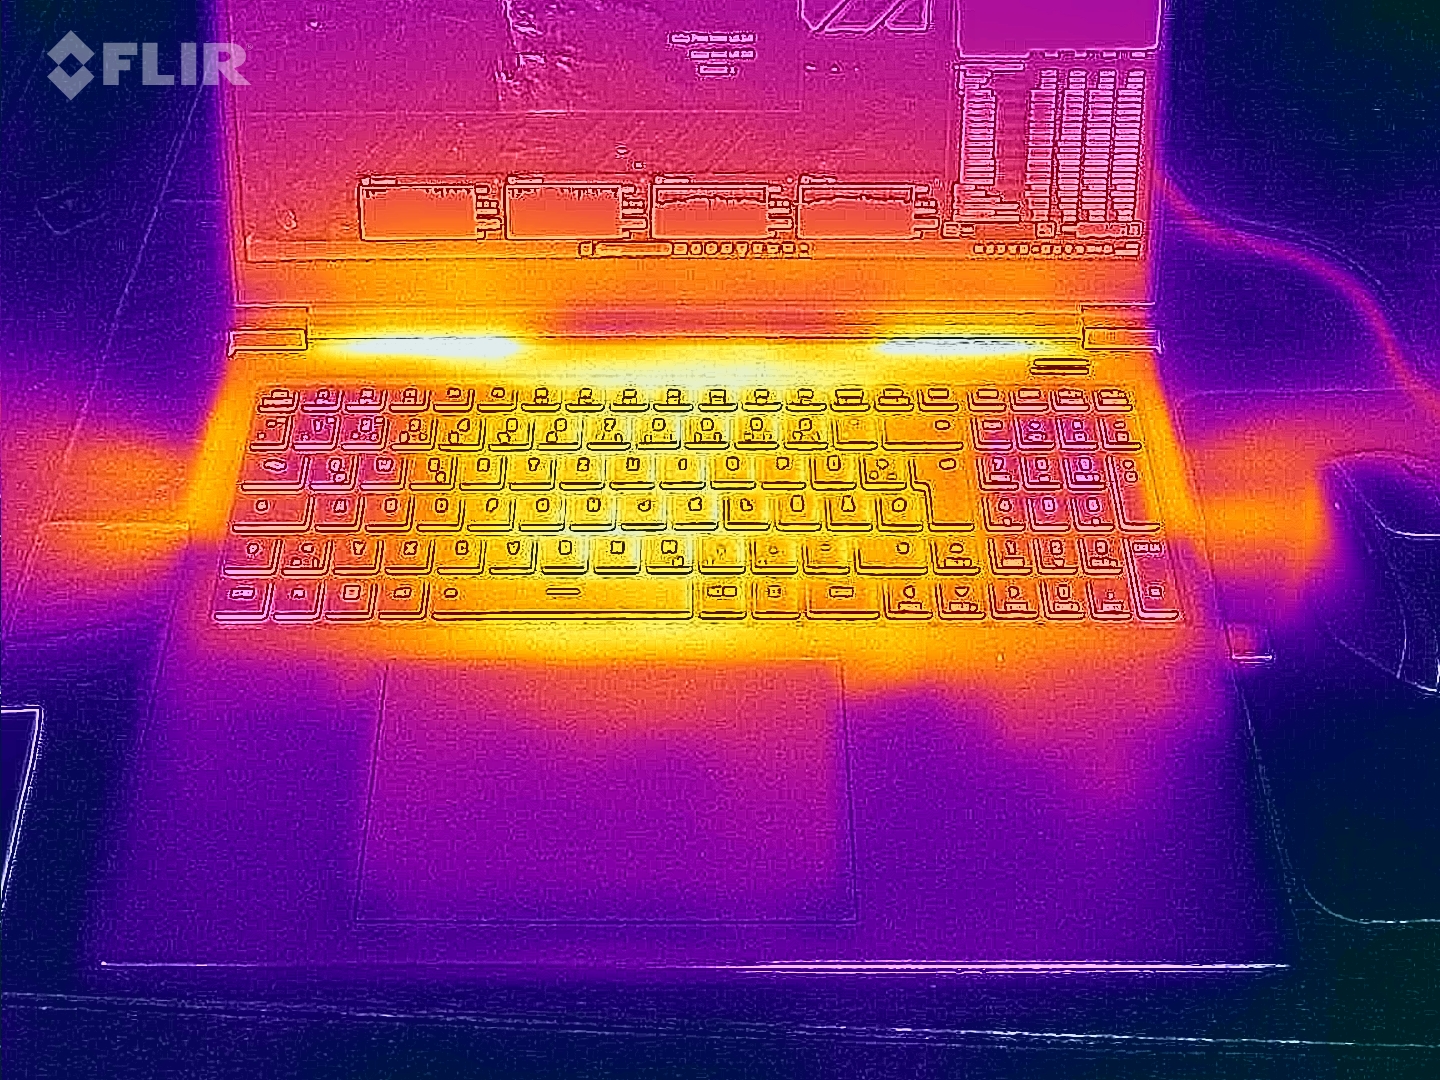
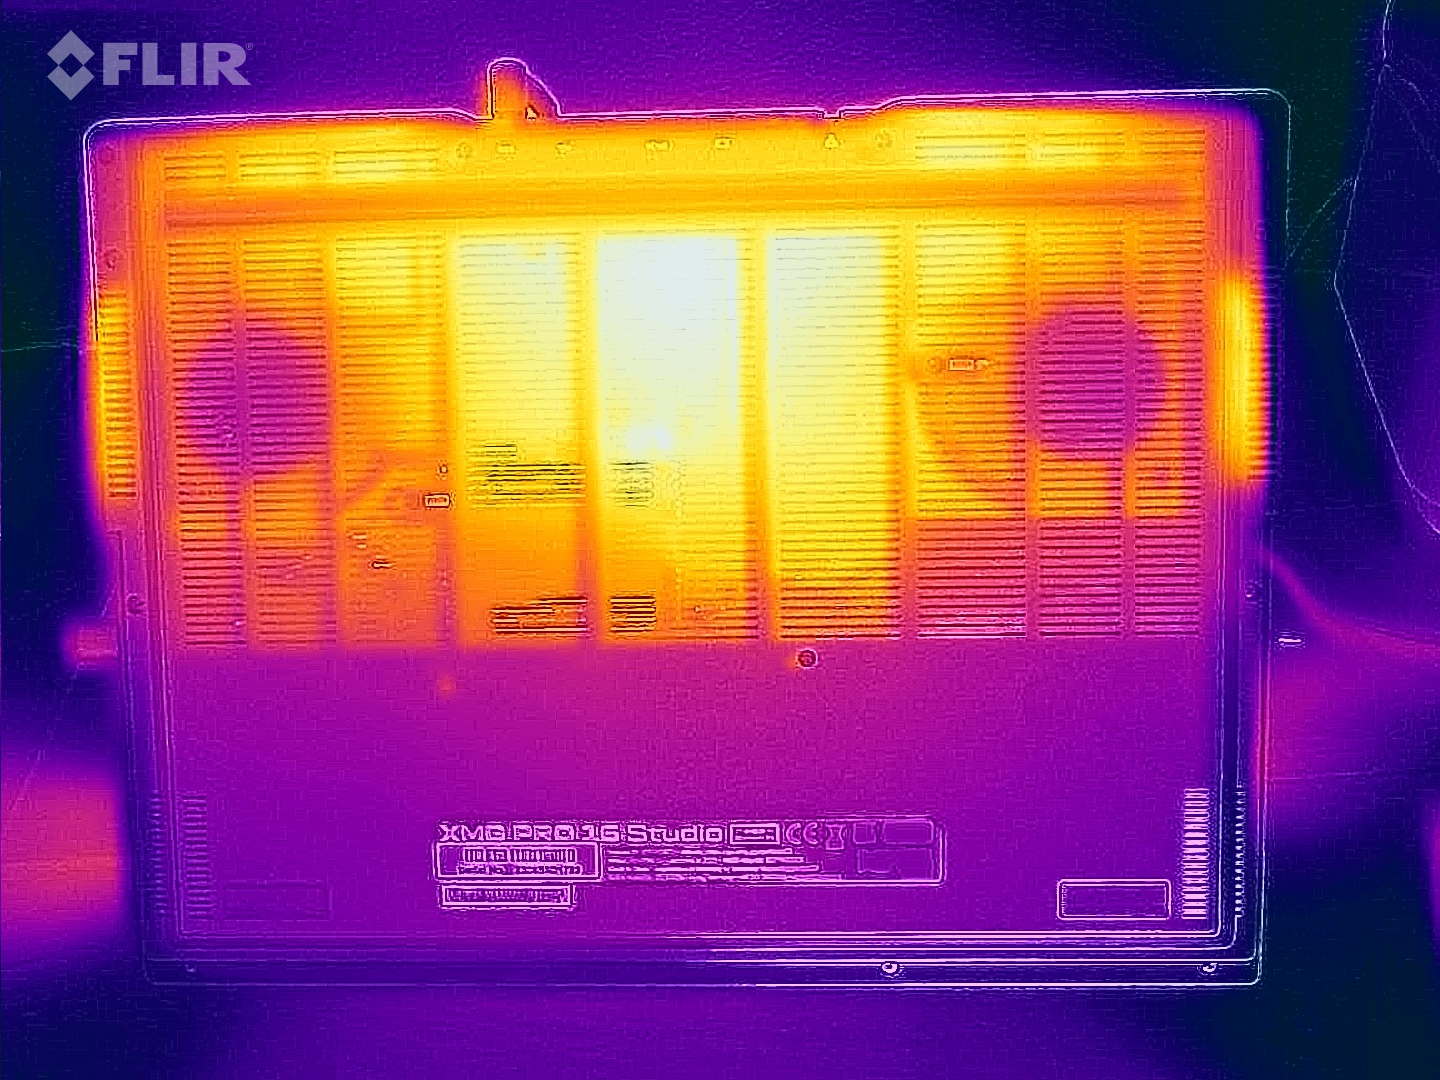
Temperatura
Test warunków skrajnych i Witcher 3 doprowadziły do znacznego wzrostu temperatury laptopa. W niektórych obszarach zmierzyliśmy temperatury powyżej 60 stopni Celsjusza. W codziennym użytkowaniu (biuro, internet) wartości te generalnie utrzymują się w zielonej strefie - ale na wyższym poziomie niż u konkurentów takich jak np.Lenovo Legion Slim 7i 16 Gen 8.
(-) Maksymalna temperatura w górnej części wynosi 55 °C / 131 F, w porównaniu do średniej 40.4 °C / 105 F , począwszy od 21.2 do 68.8 °C dla klasy Gaming.
(-) Dno nagrzewa się maksymalnie do 66 °C / 151 F, w porównaniu do średniej 43.2 °C / 110 F
(+) W stanie bezczynności średnia temperatura górnej części wynosi 30.1 °C / 86 F, w porównaniu ze średnią temperaturą urządzenia wynoszącą 33.9 °C / ### class_avg_f### F.
(-) Podczas gry w Wiedźmina 3 średnia temperatura górnej części wynosi 43.9 °C / 111 F, w porównaniu do średniej temperatury urządzenia wynoszącej 33.9 °C / ## #class_avg_f### F.
(+) Podparcia dłoni i touchpad osiągają maksymalną temperaturę skóry (33 °C / 91.4 F) i dlatego nie są gorące.
(-) Średnia temperatura obszaru podparcia dłoni w podobnych urządzeniach wynosiła 28.8 °C / 83.8 F (-4.2 °C / -7.6 F).
| Schenker XMG Pro 16 Studio (Mid 23) Intel Core i9-13900H, NVIDIA GeForce RTX 4070 Laptop GPU | Asus Vivobook Pro 16X K6604JV-MX016W Intel Core i9-13980HX, NVIDIA GeForce RTX 4060 Laptop GPU | Lenovo Legion Slim 7i 16 Gen 8 Intel Core i9-13900H, NVIDIA GeForce RTX 4070 Laptop GPU | HP Omen Transcend 16 Intel Core i9-13900HX, NVIDIA GeForce RTX 4070 Laptop GPU | MSI Stealth 16 Studio A13VG Intel Core i7-13700H, NVIDIA GeForce RTX 4070 Laptop GPU | |
|---|---|---|---|---|---|
| Heat | 11% | 15% | 16% | -6% | |
| Maximum Upper Side * (°C) | 55 | 39.7 28% | 49.8 9% | 47.4 14% | 60 -9% |
| Maximum Bottom * (°C) | 66 | 60 9% | 48.8 26% | 54.4 18% | 61 8% |
| Idle Upper Side * (°C) | 33 | 30.9 6% | 29.4 11% | 28.4 14% | 38.2 -16% |
| Idle Bottom * (°C) | 35 | 34.7 1% | 30 14% | 29.2 17% | 37.7 -8% |
* ... im mniej tym lepiej
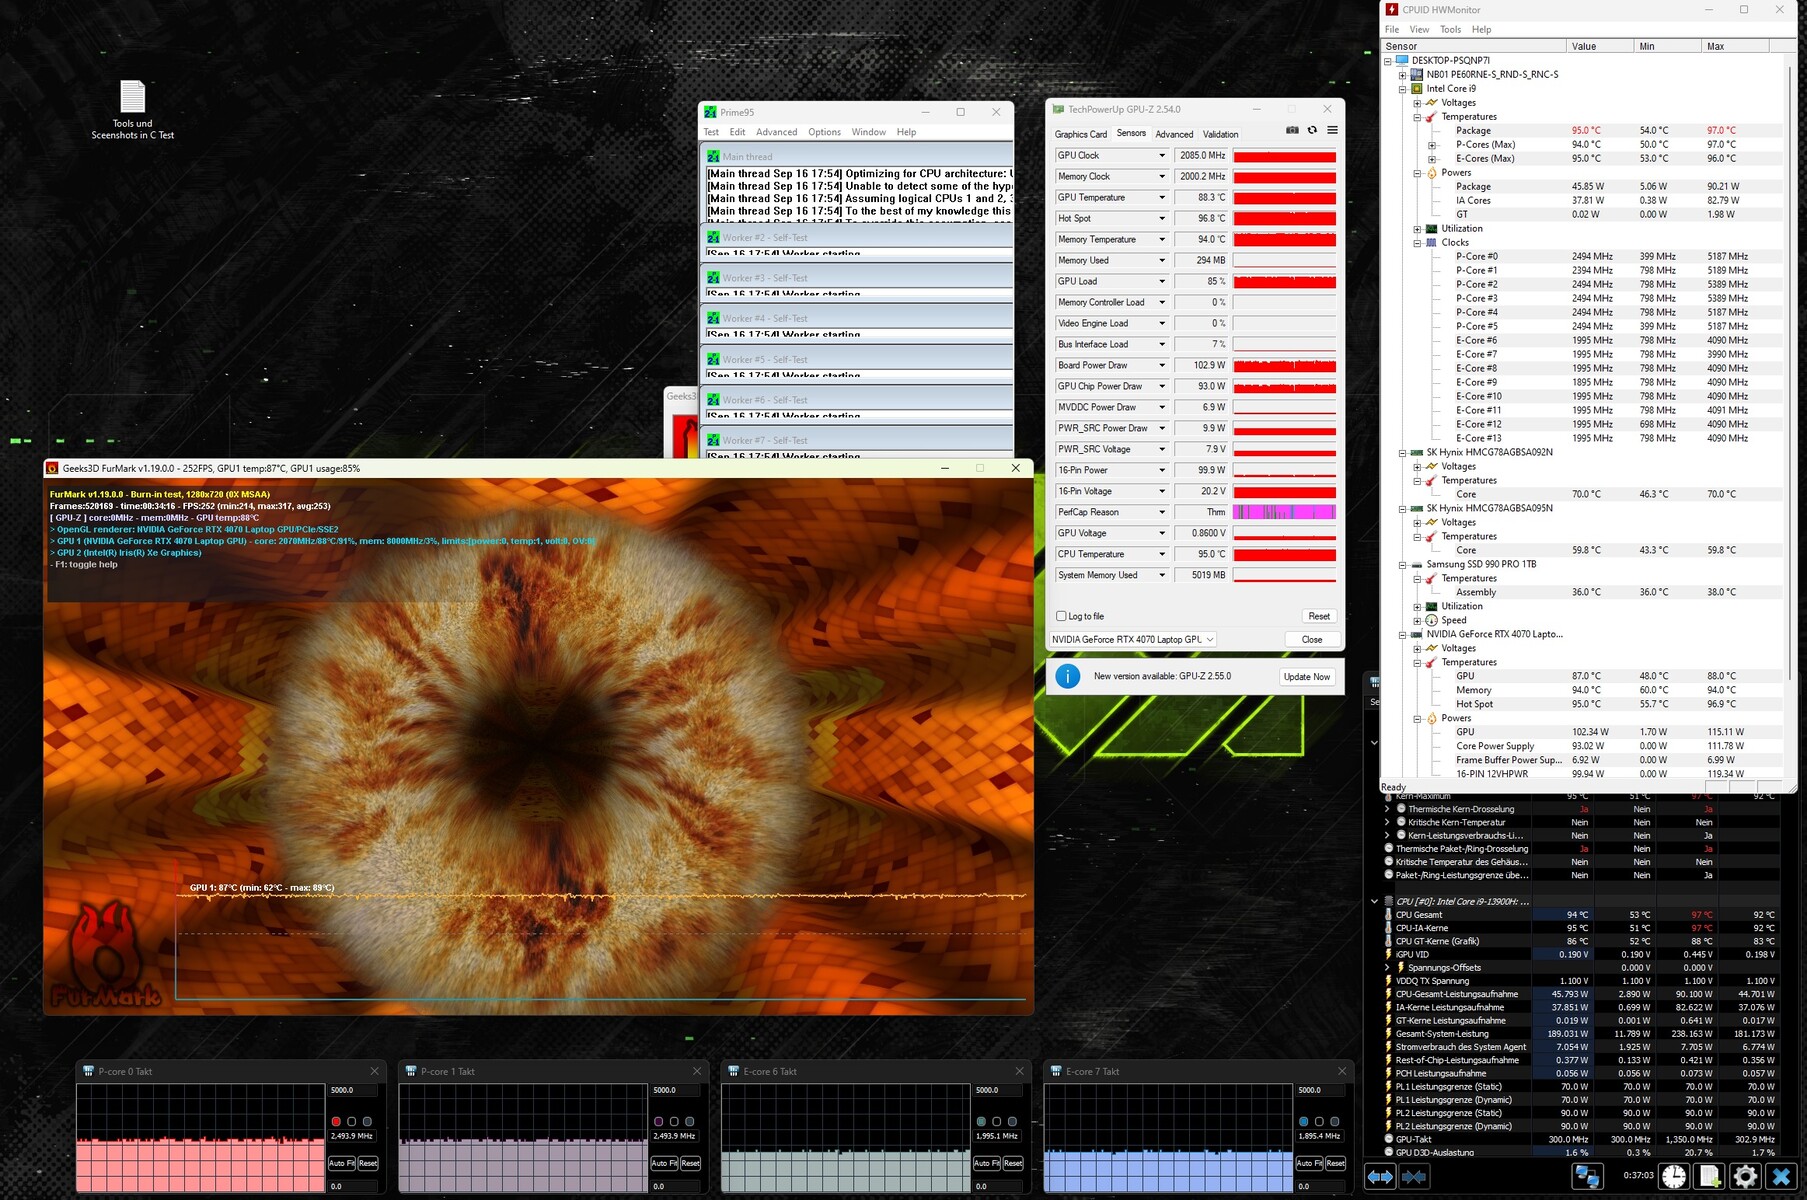
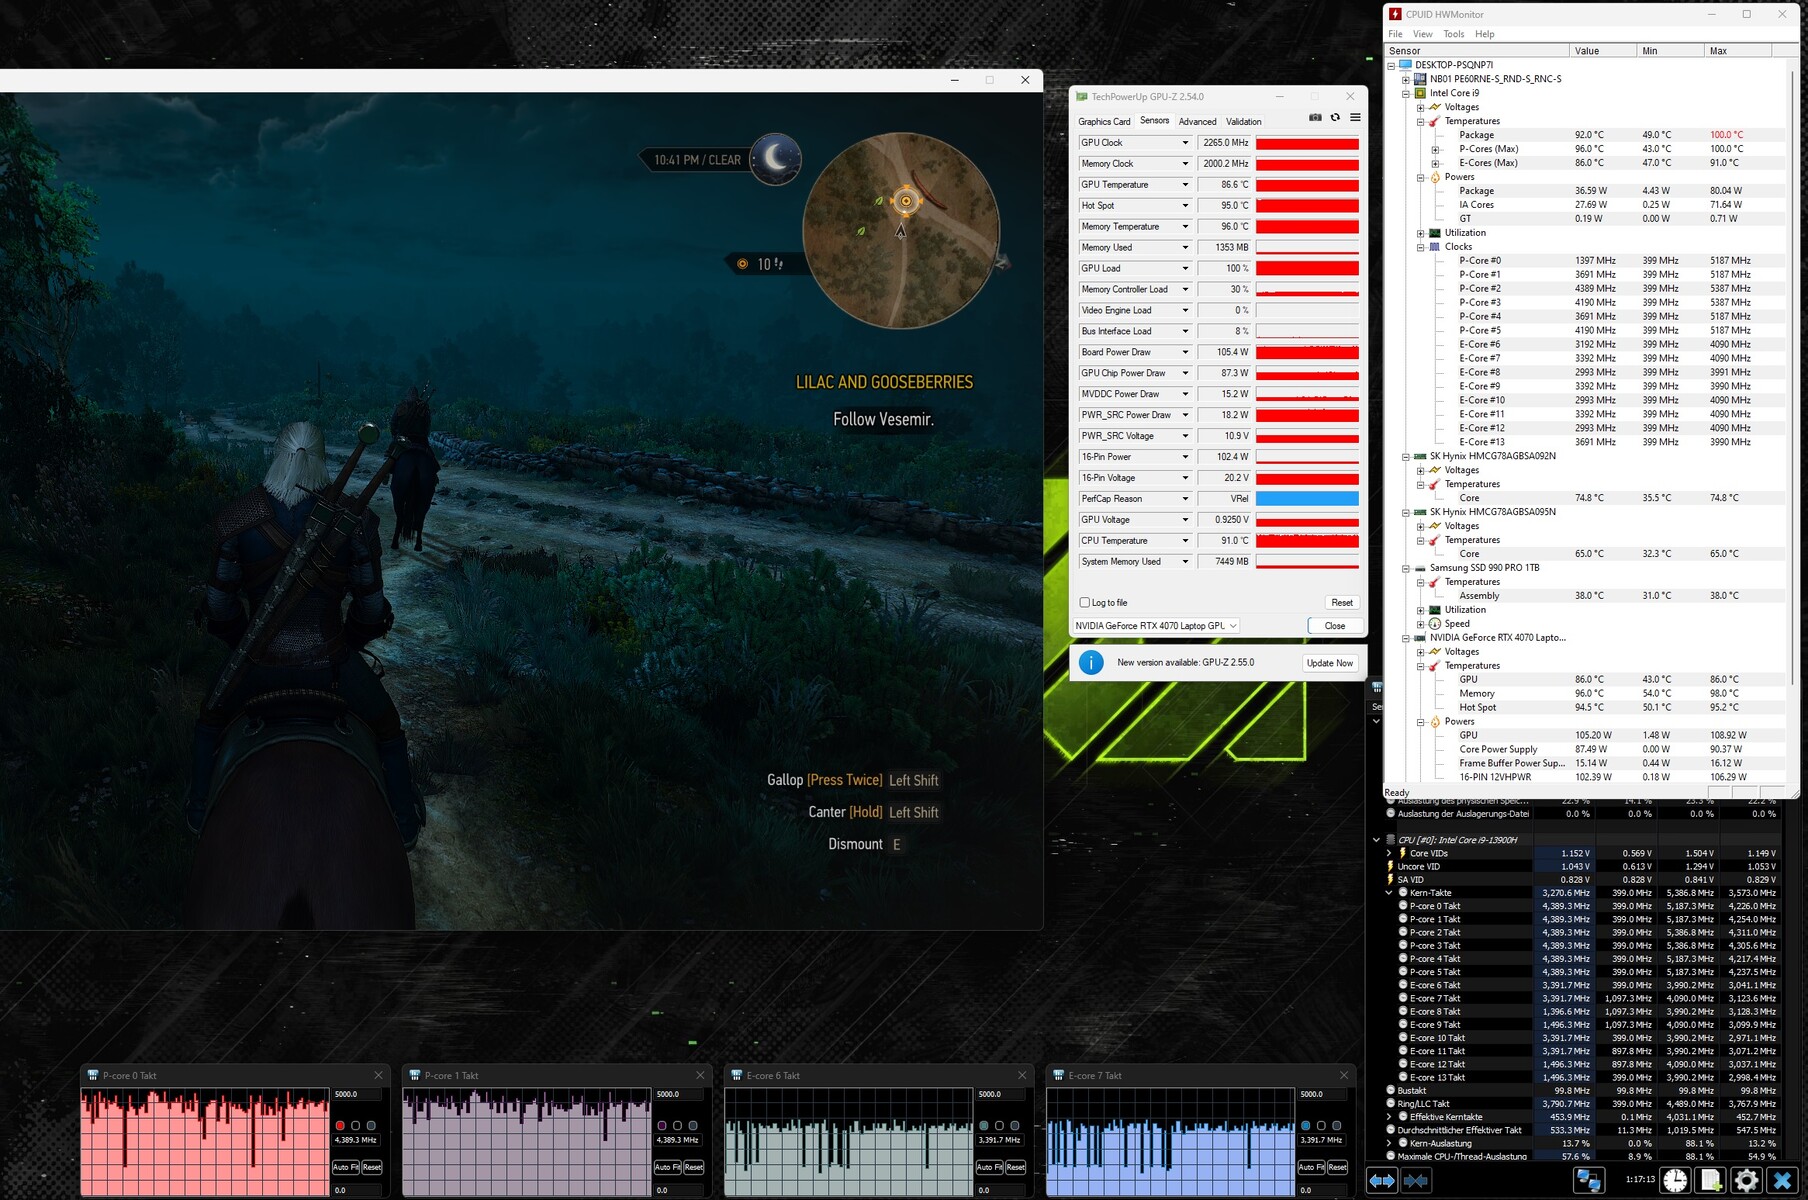
Test warunków skrajnych
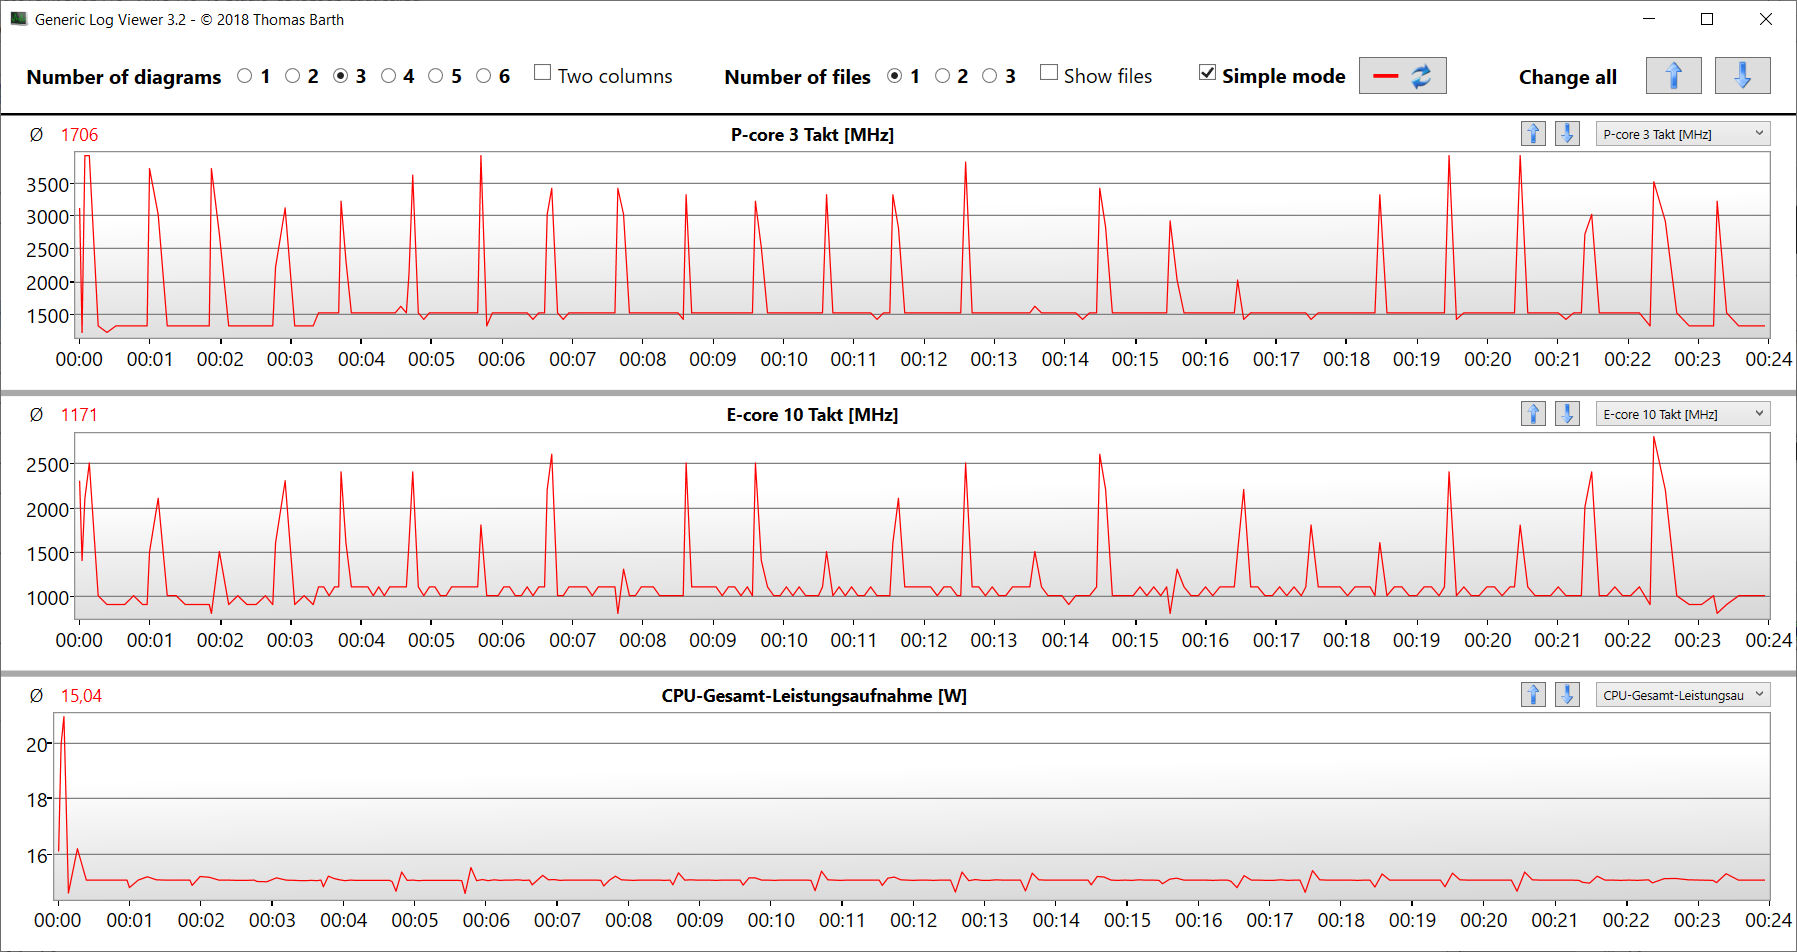
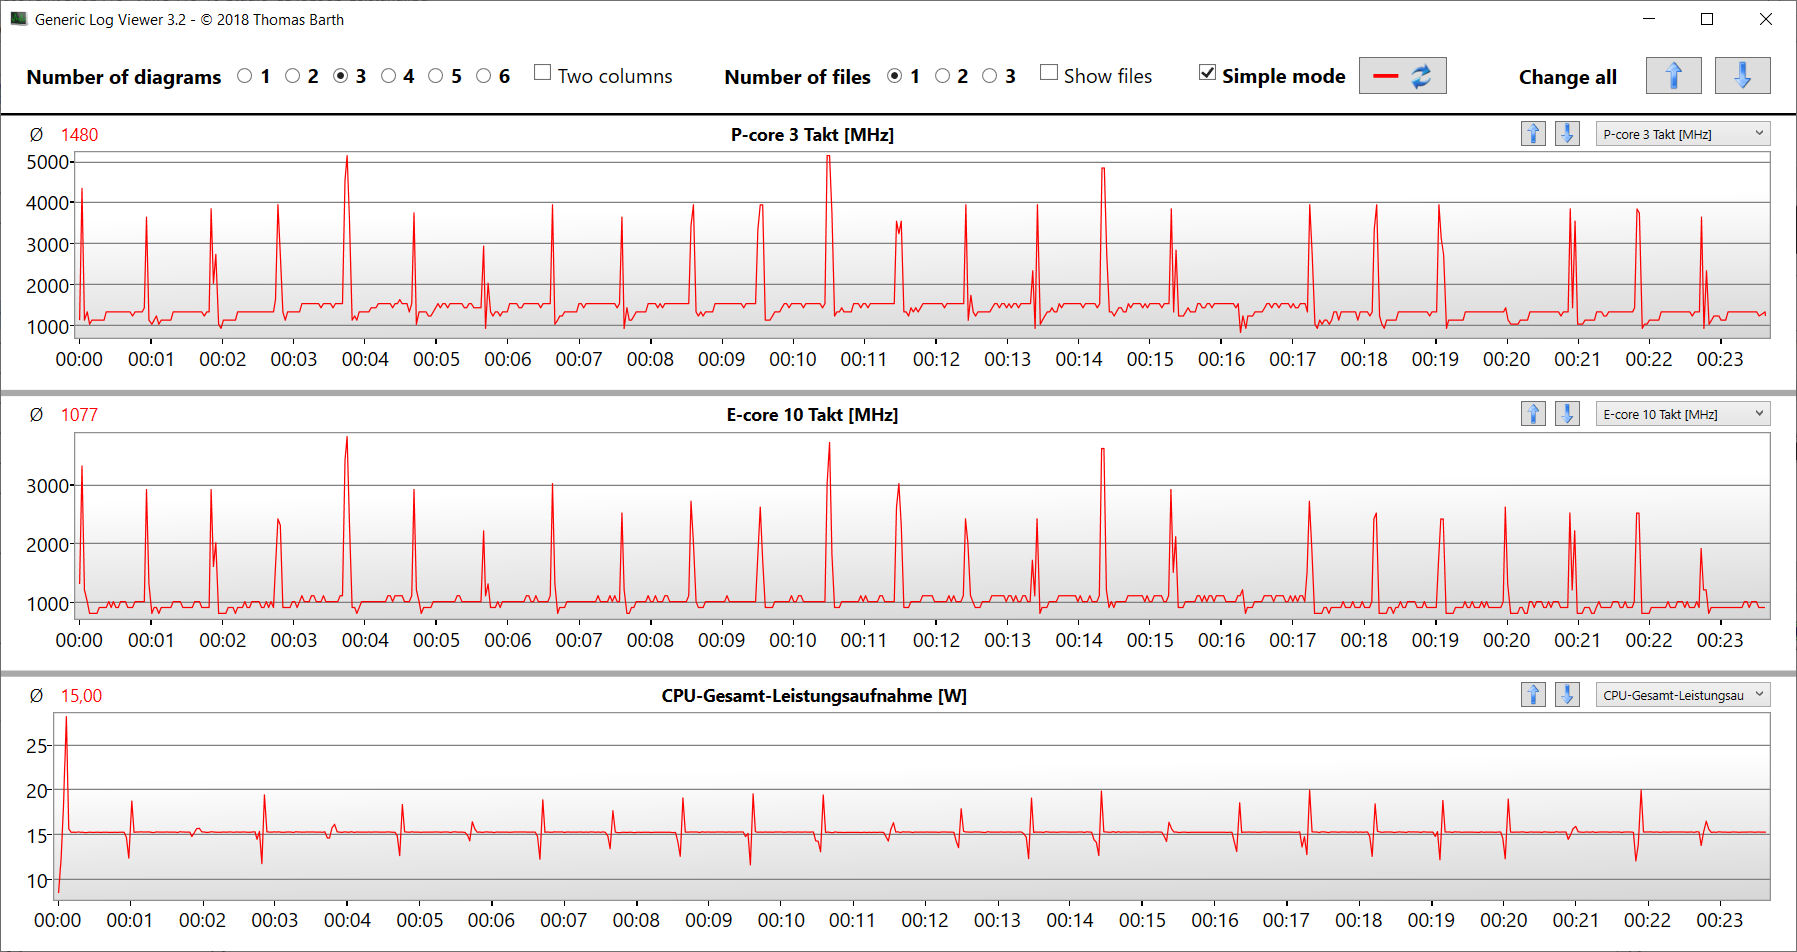
Test obciążeniowy (Prime95 i Furmark w ciągłym użyciu) symuluje ekstremalny scenariusz, aby sprawdzić, jak stabilny pozostaje system pod pełnym obciążeniem. Procesor (P: 3,8 do 3,9 GHz, E: 2,7 GHz) rozpoczął test z wysokimi częstotliwościami taktowania. W dalszej części testu wartości te spadły do poziomu zegara bazowego. GPU pracował z niemal pełną mocą.
Głośniki
Głośniki stereo generują ogólnie bardzo przyzwoity dźwięk. Bas mógłby być mocniejszy.
Schenker XMG Pro 16 Studio (Mid 23) analiza dźwięku
(±) | głośność głośnika jest średnia, ale dobra (80 dB)
Bas 100 - 315 Hz
(±) | zredukowany bas - średnio 12.7% niższy od mediany
(+) | bas jest liniowy (6.1% delta do poprzedniej częstotliwości)
Średnie 400 - 2000 Hz
(+) | zbalansowane środki średnie - tylko 2.3% od mediany
(+) | średnie są liniowe (4.8% delta do poprzedniej częstotliwości)
Wysokie 2–16 kHz
(+) | zrównoważone maksima - tylko 2.6% od mediany
(+) | wzloty są liniowe (6% delta do poprzedniej częstotliwości)
Ogólnie 100 - 16.000 Hz
(+) | ogólny dźwięk jest liniowy (10.9% różnicy w stosunku do mediany)
W porównaniu do tej samej klasy
» 7% wszystkich testowanych urządzeń w tej klasie było lepszych, 3% podobnych, 90% gorszych
» Najlepszy miał deltę 6%, średnia wynosiła ###średnia###%, najgorsza wynosiła 132%
W porównaniu do wszystkich testowanych urządzeń
» 6% wszystkich testowanych urządzeń było lepszych, 2% podobnych, 92% gorszych
» Najlepszy miał deltę 4%, średnia wynosiła ###średnia###%, najgorsza wynosiła 134%
Lenovo Legion Slim 7i 16 Gen 8 analiza dźwięku
(+) | głośniki mogą odtwarzać stosunkowo głośno (84.8 dB)
Bas 100 - 315 Hz
(±) | zredukowany bas - średnio 12.1% niższy od mediany
(±) | liniowość basu jest średnia (9% delta do poprzedniej częstotliwości)
Średnie 400 - 2000 Hz
(+) | zbalansowane środki średnie - tylko 1.4% od mediany
(+) | średnie są liniowe (3.3% delta do poprzedniej częstotliwości)
Wysokie 2–16 kHz
(+) | zrównoważone maksima - tylko 4.4% od mediany
(+) | wzloty są liniowe (5.6% delta do poprzedniej częstotliwości)
Ogólnie 100 - 16.000 Hz
(+) | ogólny dźwięk jest liniowy (10.5% różnicy w stosunku do mediany)
W porównaniu do tej samej klasy
» 6% wszystkich testowanych urządzeń w tej klasie było lepszych, 2% podobnych, 92% gorszych
» Najlepszy miał deltę 6%, średnia wynosiła ###średnia###%, najgorsza wynosiła 132%
W porównaniu do wszystkich testowanych urządzeń
» 5% wszystkich testowanych urządzeń było lepszych, 1% podobnych, 93% gorszych
» Najlepszy miał deltę 4%, średnia wynosiła ###średnia###%, najgorsza wynosiła 134%
Zużycie energii
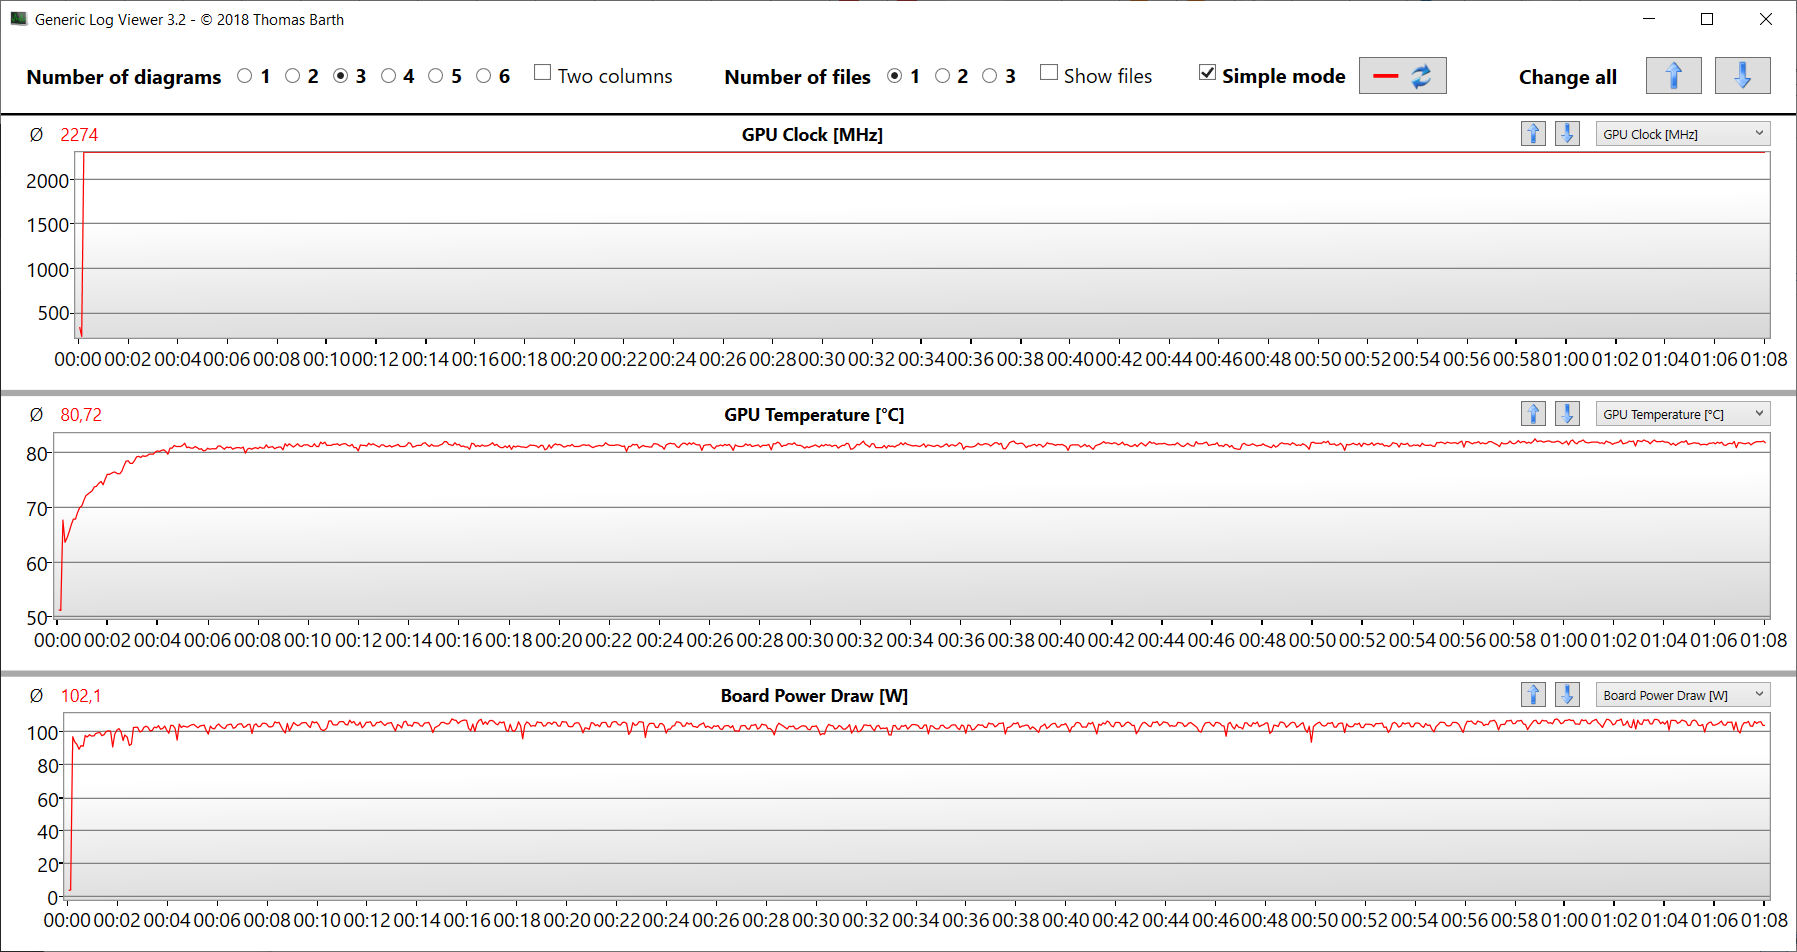
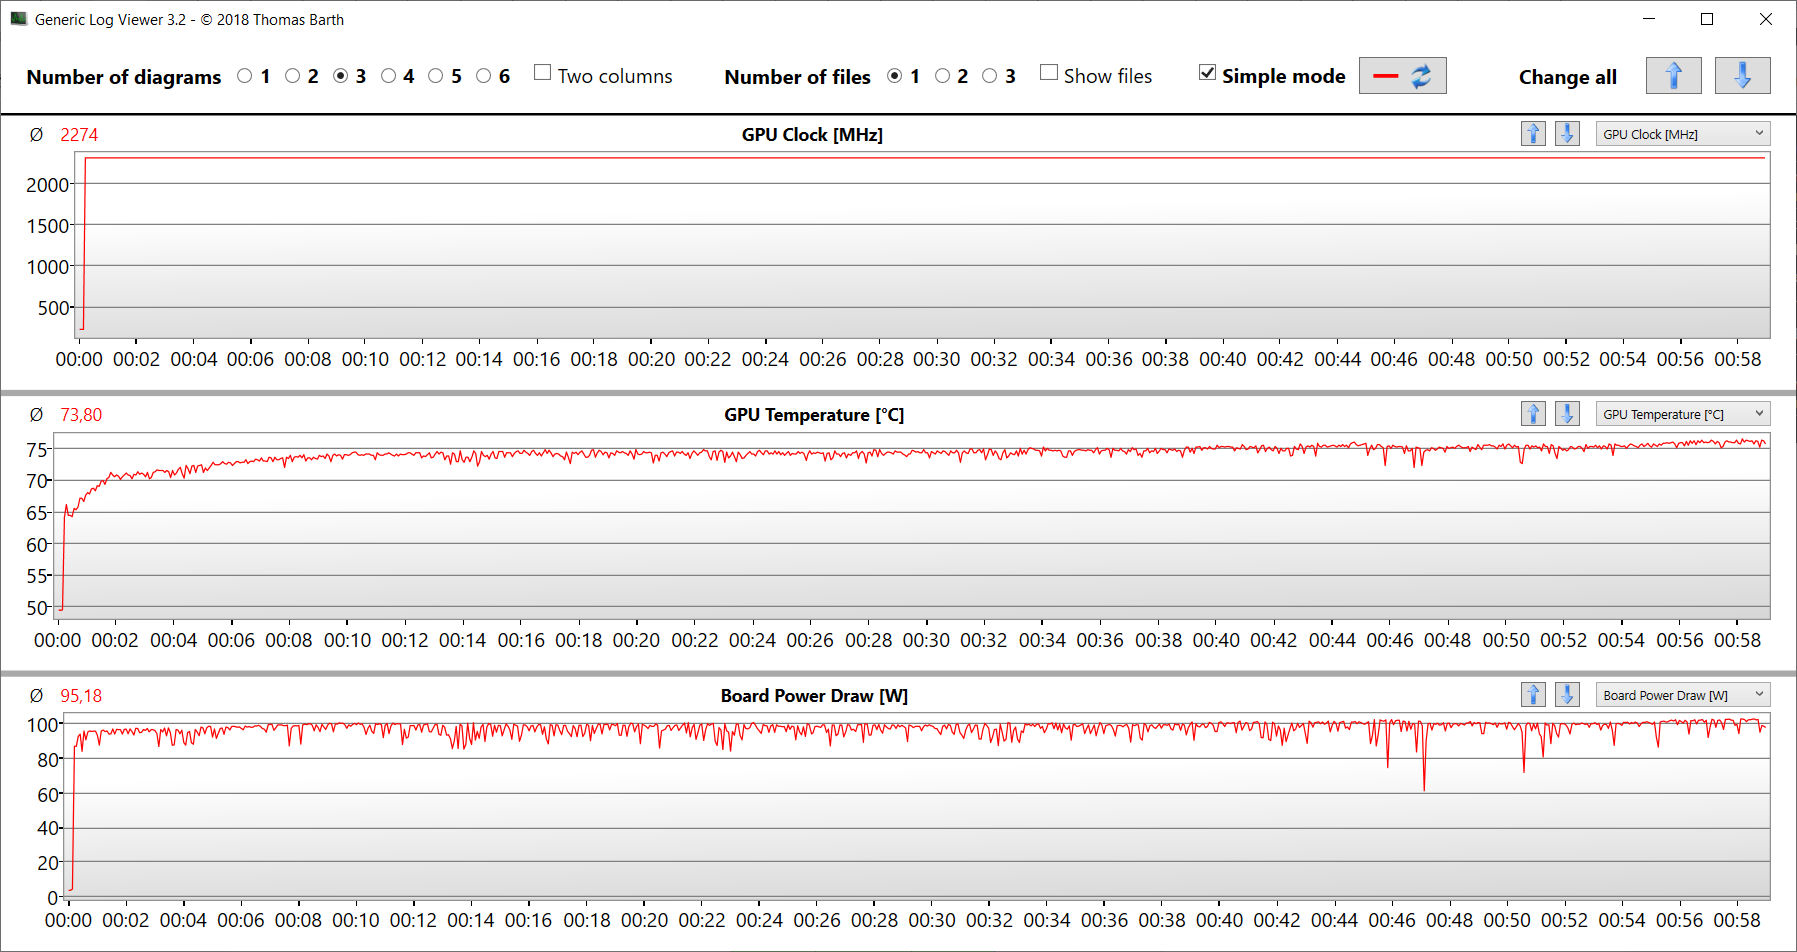
Pro 16 nie wykazał żadnych widocznych wartości zużycia energii. Wskaźniki są na normalnym poziomie dla zainstalowanego sprzętu. Test Witcher 3 test i test warunków skrajnych zostały uruchomione z nieznacznie malejącym zużyciem energii. Zasilacz (230 W) jest wystarczającej wielkości. Godne pochwały: W polu porównawczym laptop XMG cechuje się najniższym ogólnym zużyciem energii.
| wyłączony / stan wstrzymania | |
| luz | |
| obciążenie |
|
Legenda:
min: | |
| Schenker XMG Pro 16 Studio (Mid 23) i9-13900H, GeForce RTX 4070 Laptop GPU | Asus Vivobook Pro 16X K6604JV-MX016W i9-13980HX, GeForce RTX 4060 Laptop GPU | Lenovo Legion Slim 7i 16 Gen 8 i9-13900H, GeForce RTX 4070 Laptop GPU | HP Omen Transcend 16 i9-13900HX, GeForce RTX 4070 Laptop GPU | MSI Stealth 16 Studio A13VG i7-13700H, GeForce RTX 4070 Laptop GPU | Średnia w klasie Gaming | |
|---|---|---|---|---|---|---|
| Power Consumption | -23% | -65% | -76% | -8% | -32% | |
| Idle Minimum * (Watt) | 8 | 13.8 -73% | 22 -175% | 19.2 -140% | 11 -38% | 13 ? -63% |
| Idle Average * (Watt) | 12 | 16 -33% | 29 -142% | 22.7 -89% | 18 -50% | 18.7 ? -56% |
| Idle Maximum * (Watt) | 23 | 19 17% | 39.5 -72% | 55.4 -141% | 19 17% | 24.3 ? -6% |
| Load Average * (Watt) | 94 | 147 -56% | 98.7 -5% | 128.4 -37% | 91 3% | 108.2 ? -15% |
| Witcher 3 ultra * (Watt) | 181.5 | 147.8 19% | 171.8 5% | 206 -13% | 130 28% | |
| Load Maximum * (Watt) | 215 | 244 -13% | 213.2 1% | 292 -36% | 228 -6% | 254 ? -18% |
* ... im mniej tym lepiej
Power consumption Witcher 3 / stress test
Power consumption with external monitor
Czas trwania
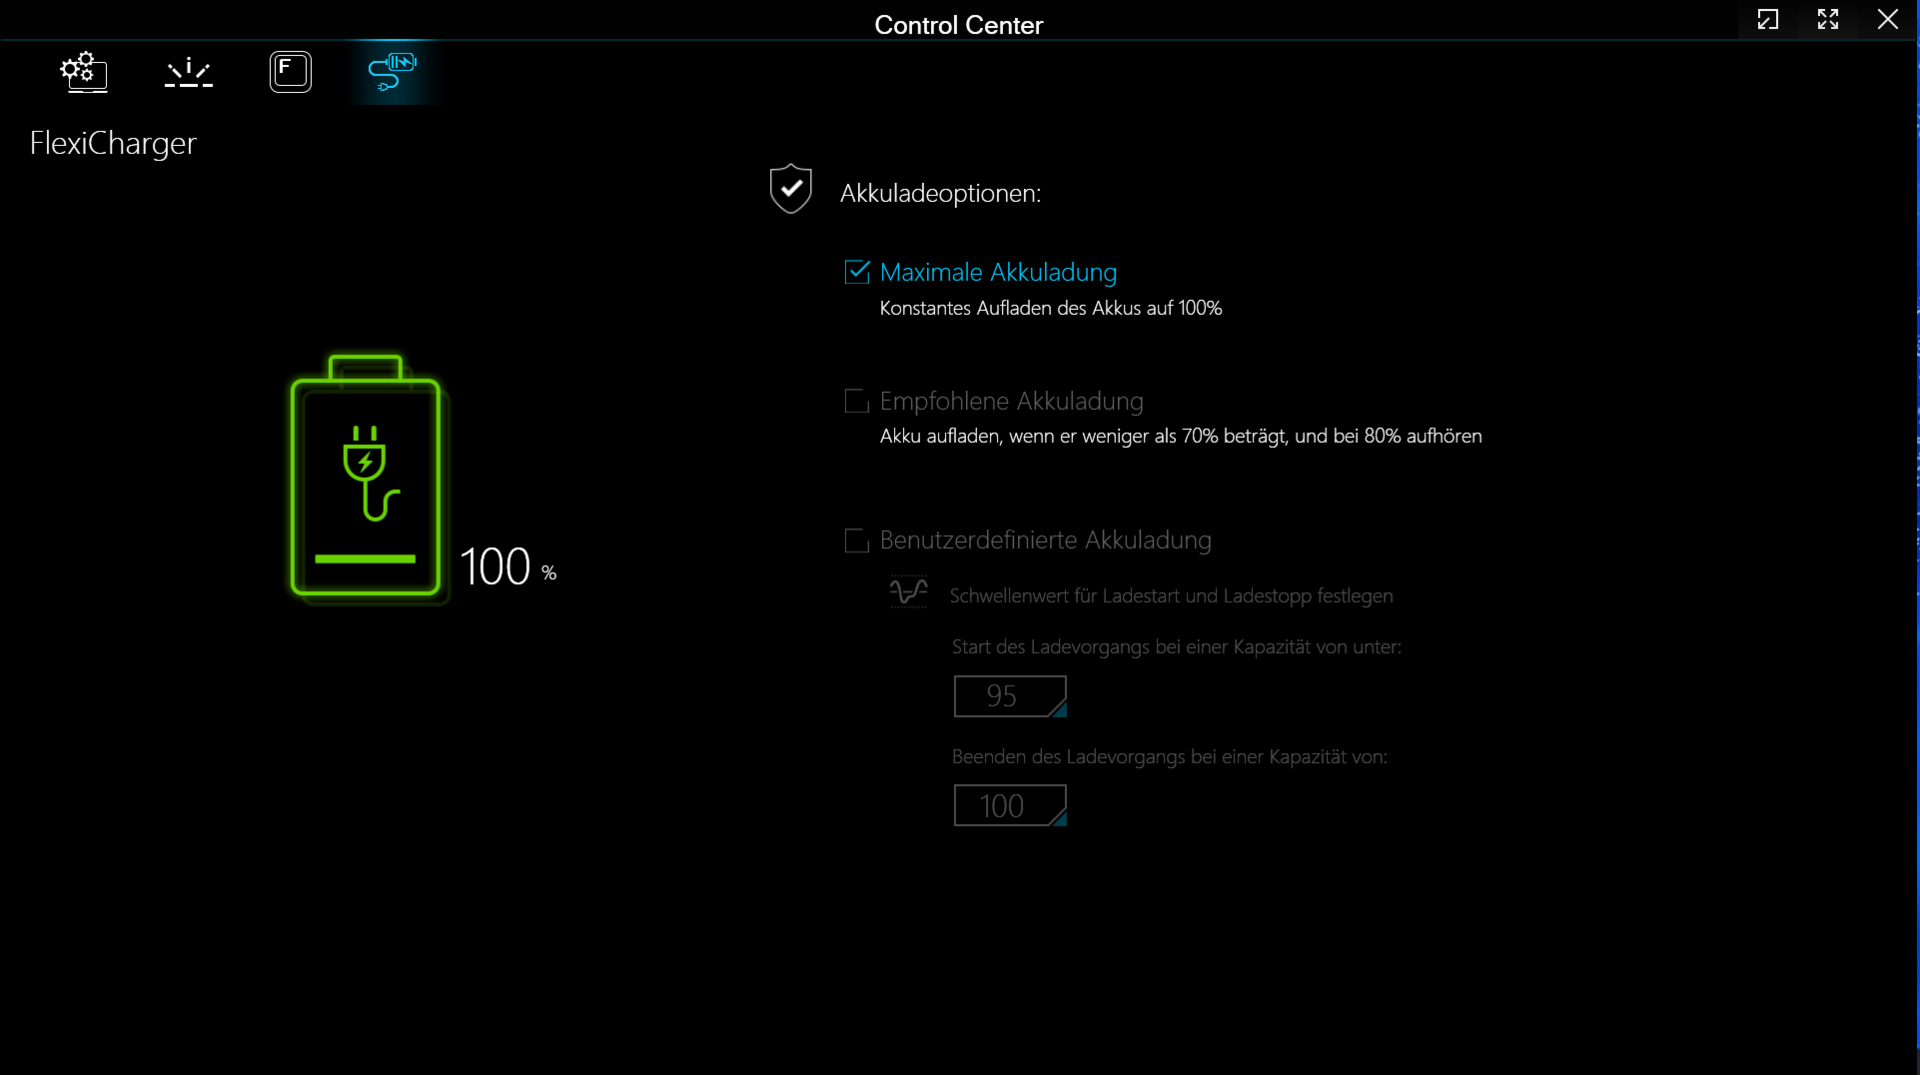
W naszym realistycznym teście WLAN (przedstawiającym obciążenie podczas wywoływania stron internetowych za pomocą skryptu), 16-calowy laptop osiągnął czas pracy wynoszący 6:45 h - ogólnie dobry wynik. W polu porównawczym Pro 16 ma najmniejszą pojemność baterii (73 Wh), ale oferuje najlepszy czas pracy w przeliczeniu na Wh.
Za
Przeciw
Werdykt - Harmonijna potęga
Edycja wideo i obrazów, strumieniowanie, renderowanie i gry są częścią doświadczenia tego laptopa. Wymaganą moc zapewnia procesorCore i9-13900Hi karta graficznaGeForce RTX 4070na niezmiennie wysokim poziomie. Możliwe jest znalezienie dobrego kompromisu między wydajnością a emisją hałasu.
XMG Pro 16 Studio (Mid 23) firmy Schenker okazuje się być potężnym narzędziem dla graczy i twórców.
Jego wyświetlacz QHD+ (16 cali, 2560 x 1600 pikseli, sRGB, IPS, 240 Hz) o przyjaznych dla pracy proporcjach 16:10 ogólnie zrobił na nas dobre wrażenie. Mimo to: Ekran laptopa dla twórców powinien być w stanie odwzorować przestrzeń kolorów DCI P3. Dwa gniazda SSD (PCIe 4) wraz z obsługą RAID-0/1 zapewniają dużą ilość pamięci masowej i krótki czas ładowania.
Porty USB-C (1x USB 3.2 Gen 2, 1x Thunderbolt 4) ułatwiają integrację laptopa z istniejącymi konfiguracjami przestrzeni roboczej i otwierają dalsze opcje rozbudowy (zewnętrzne GPU, dokowanie). Jego port TB-4 może wyprowadzać sygnał DisplayPort i obsługuje Power Delivery. Do tego dochodzą stosunkowo dobre czasy pracy.
Alternatywą może byćLenovo Legion Slim 7i 16 Gen 8: Posiada ten sam procesor i kartę graficzną, ale może zapewnić nieco większą moc obliczeniową. Słabe strony laptopa: Wyższe zużycie energii, przylutowana pamięć RAM, dławienie dysku SSD.
Cena i dostępność
XMG Pro 16 Studio można indywidualnie skonfigurować i zamówić za pośrednictwem sklepu internetowego Schenker. Nasze urządzenie testowe można nabyć za około 2 400 USD.
Schenker XMG Pro 16 Studio (Mid 23)
- 22/10/2023 v7 (old)
Sascha Mölck
Przezroczystość
Wyboru urządzeń do recenzji dokonuje nasza redakcja. Próbka testowa została udostępniona autorowi jako pożyczka od producenta lub sprzedawcy detalicznego na potrzeby tej recenzji. Pożyczkodawca nie miał wpływu na tę recenzję, producent nie otrzymał też kopii tej recenzji przed publikacją. Nie było obowiązku publikowania tej recenzji. Jako niezależna firma medialna, Notebookcheck nie podlega władzy producentów, sprzedawców detalicznych ani wydawców.
Tak testuje Notebookcheck
Każdego roku Notebookcheck niezależnie sprawdza setki laptopów i smartfonów, stosując standardowe procedury, aby zapewnić porównywalność wszystkich wyników. Od około 20 lat stale rozwijamy nasze metody badawcze, ustanawiając przy tym standardy branżowe. W naszych laboratoriach testowych doświadczeni technicy i redaktorzy korzystają z wysokiej jakości sprzętu pomiarowego. Testy te obejmują wieloetapowy proces walidacji. Nasz kompleksowy system ocen opiera się na setkach uzasadnionych pomiarów i benchmarków, co pozwala zachować obiektywizm.Price comparison

