Recenzja Medion Erazer Major X20: Gamingowy notebook z RTX 4070 i solidnym sprzętem
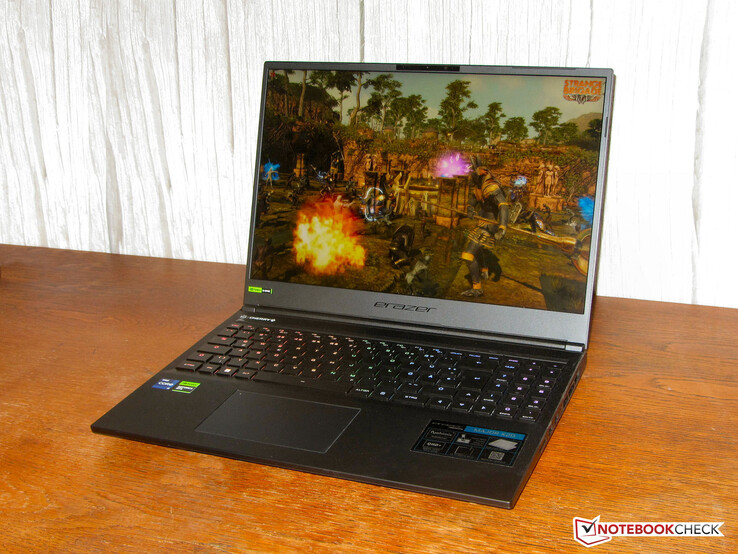
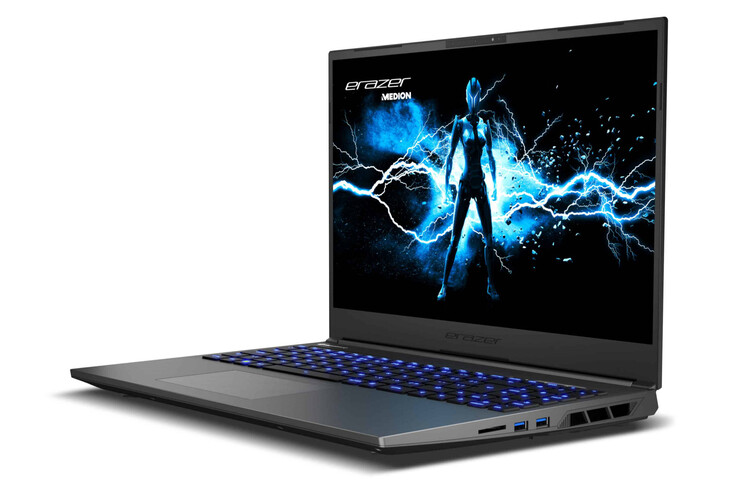
Medion Erazer Major X20 jest przede wszystkim notebookiem do gier, ale jest również stworzony do innych wymagających obliczeniowo scenariuszy zastosowań. W porównaniu do swojego poprzednika https://www.notebookcheck.net/Medion-Erazer-Major-X10-laptop-review-Debut-of-Intel-Arc-A730M.650477.0.htmlx20 otrzymał kilka przydatnych ulepszeń: procesor Arc A730M ustąpił miejsca znacznie wydajniejszemu rdzeniowi graficznemu GeForce RTX 4070. Ponadto mechaniczna klawiatura zastępuje model chiclet, podczas gdy jeden z dwóch portów USB-C (USB 3.2 Gen 2) został usunięty, a pozostały został zmodernizowany do portu Thunderbolt 4.
X20 bazuje na barebone'ie Tongfang (GM6PX7X), który w dużej mierze przypomina model znany z XMG Neo 16, ale brakuje portu dla chłodzenia wodnego. Wśród konkurentów są takie laptopy jak np Aorus 15X "ASF, np Razer Blade 15 OLED (Early 22) oraz Asus ROG Strix G17 G713PI.
Potencjalni konkurenci w porównaniu
Ocena | Data | Model | Waga | Wysokość | Rozmiar | Rezolucja | Cena |
|---|---|---|---|---|---|---|---|
| 89 % v7 (old) | 04/2023 | Medion Erazer Major X20 i9-13900HX, GeForce RTX 4070 Laptop GPU | 2.4 kg | 29 mm | 16.00" | 2560x1600 | |
| 86.2 % v7 (old) | 04/2023 | Aorus 15X ASF i7-13700HX, GeForce RTX 4070 Laptop GPU | 2.3 kg | 19.7 mm | 15.60" | 2560x1440 | |
| 89.9 % v7 (old) | 03/2023 | Razer Blade 15 OLED (Early 2022) i9-12900H, GeForce RTX 3070 Ti Laptop GPU | 2 kg | 16.99 mm | 15.60" | 2560x1440 | |
| 88.4 % v7 (old) | 04/2023 | Asus ROG Strix G17 G713PI R9 7945HX, GeForce RTX 4070 Laptop GPU | 2.8 kg | 30.7 mm | 17.30" | 2560x1440 |
Etui - dyskretna obudowa zewnętrzna dla laptopa Medion
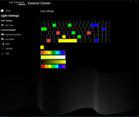
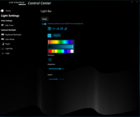
Medion stosuje szykowną, stonowaną obudowę, która nie wyróżnia się nawet w profesjonalnym środowisku. Tylna część wieka matowo czarnej obudowy wykonana jest z aluminium, jednostka zasadnicza z tworzywa sztucznego. Antypoślizgowa gumowa powłoka pokrywa górną część jednostki zasadniczej. Oprócz podświetlenia klawiszy (RGB), dwa dowolnie konfigurowalne paski LED (RGB) wewnątrz tylnych otworów wentylacyjnych oraz podświetlane logo Erazer na pokrywie rozluźniają tę skądinąd poważnie wyglądającą obudowę
16-calówka nie zdradza żadnych wad produkcyjnych. Wymiary szczelin są równe i nie ma żadnych wystających elementów. Jednostka bazowa może być tylko lekko skręcona, wieko wyraźniej, ale całe urządzenie mieści się w rozsądnych granicach. Akumulator (przykręcony, nie przyklejony) i inne elementy wewnętrzne są dostępne po zdjęciu dolnej powłoki. Zawiasy mocno trzymają wieko, a maksymalny kąt otwarcia wynosi około 130 stopni. Otwieranie pokrywy jedną ręką jest możliwe.
Na polu porównawczym laptop Medion jest jednym z urządzeń o najgrubszej budowie. Pod względem wagi ląduje na środkowym polu.
Sprzęt - Major X20 oferuje Thunderbolt 4
Erazer posiada trzy porty USB-A (1x USB 3.2 Gen 1, 2x USB 3.2 Gen 2) i jeden port USB-C (Thunderbolt 4). Ten ostatni wyprowadza sygnał DisplayPort, ale nie zapewnia obsługi Power Delivery. Major X20 może się też pochwalić łącznie dwoma wyjściami wideo (HDMI 2.1, DP). Kolejne złącza to gniazdo na blokadę kabli, dwa gniazda audio oraz port Gigabit Ethernet (2,5 Gbps)
Wyjścia wideo, gniazdo zasilania oraz port sieciowy znajdują się z tyłu urządzenia. Odpowiednie kable biegną więc z tyłu i nie przeszkadzają.
Czytnik kart SD
Czytnik kart pamięci microSD (karta referencyjna: AV PRO microSD 128 GB V60) należy do średnio-szybkich modeli o maksymalnym transferze 78 MB/s (transfer 250 plików graficznych jpg o wielkości około 5 MB każdy) i 88 MB/s (kopiowanie dużych bloków danych).
| SD Card Reader | |
| average JPG Copy Test (av. of 3 runs) | |
| Średnia w klasie Gaming (20 - 210, n=63, ostatnie 2 lata) | |
| Razer Blade 15 OLED (Early 2022) (AV Pro SD microSD 128 GB V60) | |
| Medion Erazer Major X20 (AV PRO microSD 128 GB V60) | |
| maximum AS SSD Seq Read Test (1GB) | |
| Średnia w klasie Gaming (25.5 - 261, n=60, ostatnie 2 lata) | |
| Medion Erazer Major X20 (AV PRO microSD 128 GB V60) | |
| Razer Blade 15 OLED (Early 2022) (AV Pro SD microSD 128 GB V60) | |
Komunikacja
Szybkość transmisji danych WiFi jest doskonała w optymalnych warunkach (brak urządzeń WLAN w bezpośrednim sąsiedztwie, niewielka odległość między laptopem a komputerem serwerowym). X20 ma na pokładzie układ WiFi 6E (Intel AX211). Za połączenia przewodowe odpowiada układ (RTL8125; 2,5 GBit/s) firmy Realtek.
Kamera internetowa
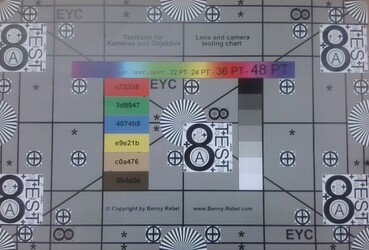
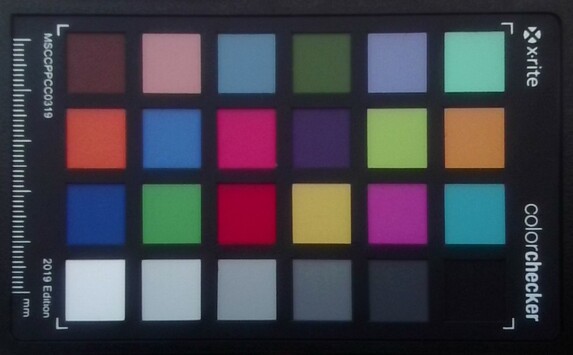
Kamerka internetowa (2,1 MP, maks. 1 920 x 1 080) zapewnia standardową jakość. Brakuje dokładności kolorystycznej: przy odchyleniu kolorów na poziomie około 11 mija się z celem (DeltaE poniżej 3). Na pokładzie nie ma mechanicznej migawki.
Akcesoria
Oprócz typowych dokumentów (skrócona instrukcja obsługi i informacje o gwarancji) do notebooka nie dołączono żadnych innych akcesoriów.
Konserwacja
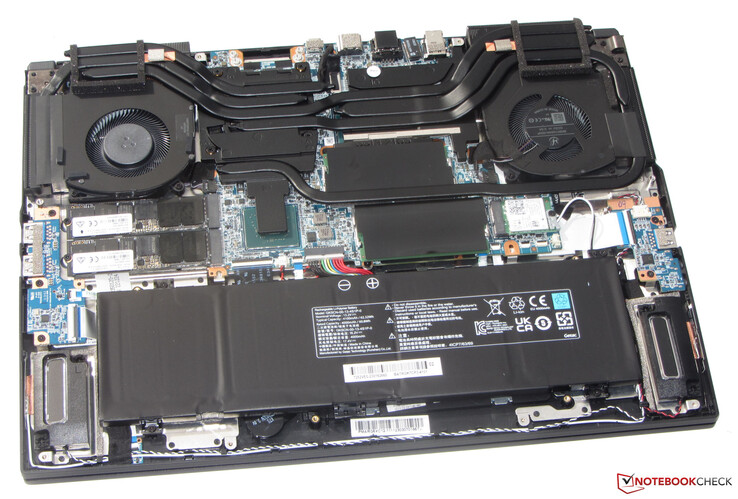
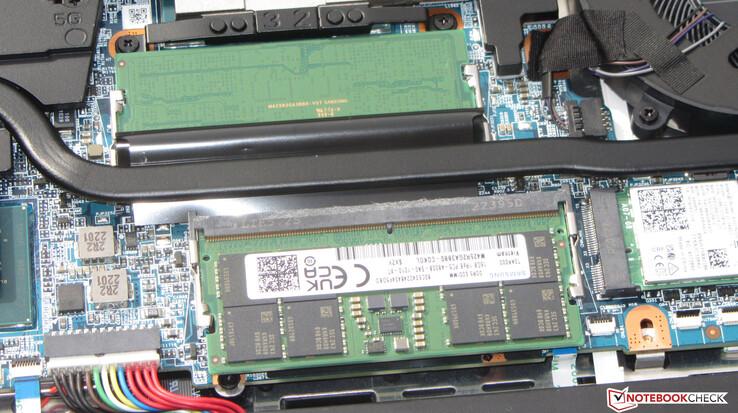
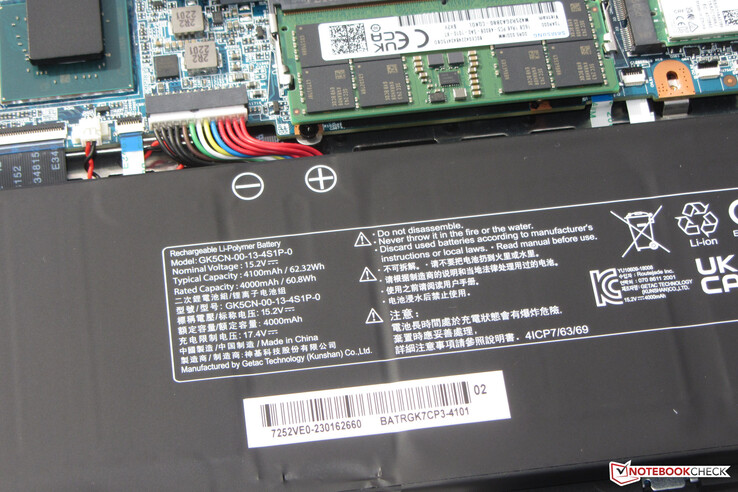
Po odkręceniu wszystkich śrubek na spodzie urządzenia można odłączyć spodnią powłokę przy użyciu płaskiej szpachelki lub gładzika do spoin. Ma się wtedy dostęp do dwóch gniazd pamięci RAM (oba zajęte), dwóch dysków SSD (PCIe 4, M.2-2280), modułu WLAN, wentylatorów, baterii BIOS-u i akumulatora laptopa.
Gwarancja
Medion udziela dwuletniej gwarancji na Erazera w Niemczech. W innych krajach może się to różnić, więc kupujący powinni sprawdzić to dwukrotnie przed zakupem.
Przedłużenia gwarancji są dostępne, ale muszą być zakupione razem z notebookiem w sklepie internetowym Medion. Późniejszy zakup nie jest możliwy.
Urządzenia wejściowe - Klawiatura mechaniczna z przełącznikami Cherry MX
Klawiatura
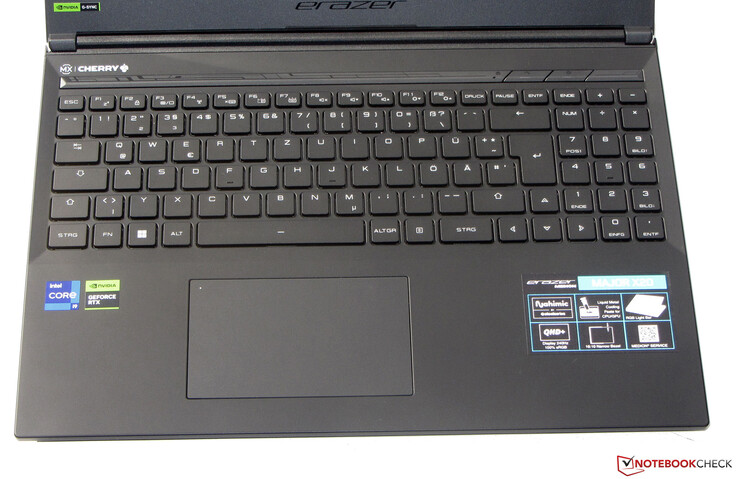
Zamiast klawiatury typu chiclet, Medion zamontował w X20 klawiaturę mechaniczną. Przełączniki Cherry MX mają średni skok oraz wyraźnie słyszalny i wyczuwalny punkt nacisku. Użytkownik jest rozpieszczany bogatym dotykiem pisania i precyzyjnym sprzężeniem zwrotnym, a klawiatura nie ugina się podczas pisania. Dwa klawisze funkcyjne regulują jasność czterostopniowego indywidualnego podświetlenia klawiszy (RGB). Ogólnie rzecz biorąc, możemy tu mówić o solidnej klawiaturze.
Touchpad
Wyświetlacz - QHD+ w formacie 16:10
Medion instaluje panel 240 Hz z obsługą technologii G-Sync. Ta ostatnia dynamicznie dostosowuje częstotliwość odświeżania wyświetlacza i GPU, aby uzyskać jak najpłynniejszą jakość obrazu - zwłaszcza w grach.
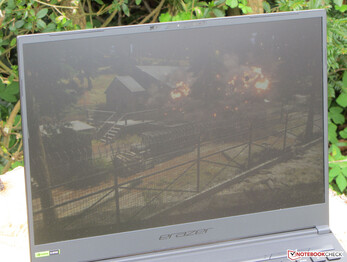
Migotanie PWM nie występuje przy żadnym ustawieniu jasności. Jasność i kontrast matowego 16-calowego panelu (2560x1600) w przyjaznym dla pracy formacie 16:10 osiągają odpowiednie wartości docelowe (> 300 cd/m² lub 1000:1).
| |||||||||||||||||||||||||
rozświetlenie: 92 %
na akumulatorze: 374 cd/m²
kontrast: 1133:1 (czerń: 0.33 cd/m²)
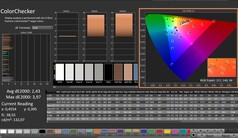
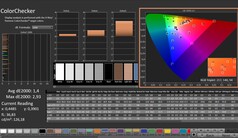
ΔE ColorChecker Calman: 2.43 | ∀{0.5-29.43 Ø4.76}
calibrated: 1.4
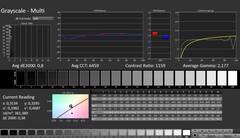
ΔE Greyscale Calman: 3.1 | ∀{0.09-98 Ø5}
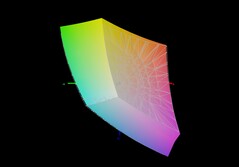
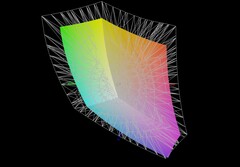
70.9% AdobeRGB 1998 (Argyll 3D)
98% sRGB (Argyll 3D)
69.4% Display P3 (Argyll 3D)
Gamma: 2.191
CCT: 6194 K
| Medion Erazer Major X20 BOE CQ NE160QDM-NZ1, IPS, 2560x1600, 16" | Aorus 15X ASF BOE CQ NE156QHM-NZ1, IPS, 2560x1440, 15.6" | Razer Blade 15 OLED (Early 2022) Samsung ATNA562P02-0, OLED, 2560x1440, 15.6" | Asus ROG Strix G17 G713PI BOE0B69, IPS, 2560x1440, 17.3" | |
|---|---|---|---|---|
| Display | -0% | 25% | 22% | |
| Display P3 Coverage (%) | 69.4 | 69.3 0% | 97.6 41% | 98.3 42% |
| sRGB Coverage (%) | 98 | 98.2 0% | 99.4 1% | 100 2% |
| AdobeRGB 1998 Coverage (%) | 70.9 | 70.5 -1% | 94 33% | 85.9 21% |
| Response Times | -12% | 79% | 21% | |
| Response Time Grey 50% / Grey 80% * (ms) | 13.1 ? | 12.4 ? 5% | 2 ? 85% | 5.3 ? 60% |
| Response Time Black / White * (ms) | 7.3 ? | 9.4 ? -29% | 2 ? 73% | 8.6 ? -18% |
| PWM Frequency (Hz) | 500 ? | |||
| Screen | 14% | 126% | 12% | |
| Brightness middle (cd/m²) | 374 | 316 -16% | 383 2% | 327 -13% |
| Brightness (cd/m²) | 357 | 301 -16% | 384 8% | 320 -10% |
| Brightness Distribution (%) | 92 | 90 -2% | 99 8% | 89 -3% |
| Black Level * (cd/m²) | 0.33 | 0.28 15% | 0.03 91% | 0.38 -15% |
| Contrast (:1) | 1133 | 1129 0% | 12767 1027% | 861 -24% |
| Colorchecker dE 2000 * | 2.43 | 1.54 37% | 1.89 22% | 1.01 58% |
| Colorchecker dE 2000 max. * | 3.97 | 2.46 38% | 3.76 5% | 4.01 -1% |
| Colorchecker dE 2000 calibrated * | 1.4 | 1.21 14% | 2.67 -91% | 0.41 71% |
| Greyscale dE 2000 * | 3.1 | 1.3 58% | 1.26 59% | 1.6 48% |
| Gamma | 2.191 100% | 2.307 95% | 2.41 91% | 2.168 101% |
| CCT | 6194 105% | 6456 101% | 6386 102% | 6659 98% |
| Całkowita średnia (program / ustawienia) | 1% /
7% | 77% /
97% | 18% /
16% |
* ... im mniej tym lepiej
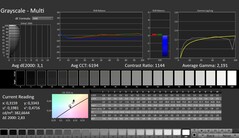
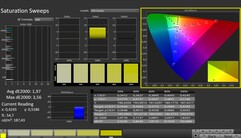
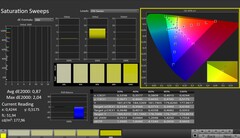
W stanie dostawy ekran daje dobre odwzorowanie kolorów: Cel (DeltaE < 3) jest osiągany z odchyleniem około 2,4. Ręczna kalibracja zmniejsza to odchylenie do 1,4 i zapewnia bardziej zrównoważoną skalę szarości
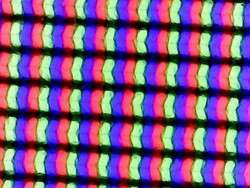
Panel całkowicie pokrywa przestrzeń kolorów sRGB, ale nie przestrzeń kolorów AdobeRGB i DCI-P3. Jeśli wymagane są wszystkie trzy przestrzenie kolorów, nie ma możliwości obejścia tego problemu.Blade 15nie da się obejść ekranu OLED.
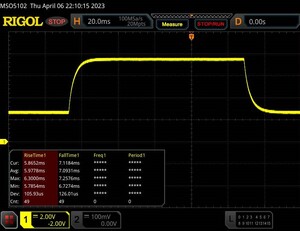
Wyświetl czasy reakcji
| ↔ Czas reakcji od czerni do bieli | ||
|---|---|---|
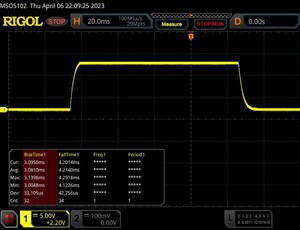
| 7.3 ms ... wzrost ↗ i spadek ↘ łącznie | ↗ 3.1 ms wzrost | |
| ↘ 4.2 ms upadek | ||
| W naszych testach ekran wykazuje bardzo szybką reakcję i powinien bardzo dobrze nadawać się do szybkich gier. Dla porównania, wszystkie testowane urządzenia wahają się od 0.1 (minimum) do 240 (maksimum) ms. » 21 % wszystkich urządzeń jest lepszych. Oznacza to, że zmierzony czas reakcji jest lepszy od średniej wszystkich testowanych urządzeń (20.1 ms). | ||
| ↔ Czas reakcji 50% szarości do 80% szarości | ||
| 13.1 ms ... wzrost ↗ i spadek ↘ łącznie | ↗ 6 ms wzrost | |
| ↘ 7.1 ms upadek | ||
| W naszych testach ekran wykazuje dobry współczynnik reakcji, ale może być zbyt wolny dla graczy rywalizujących ze sobą. Dla porównania, wszystkie testowane urządzenia wahają się od 0.165 (minimum) do 636 (maksimum) ms. » 26 % wszystkich urządzeń jest lepszych. Oznacza to, że zmierzony czas reakcji jest lepszy od średniej wszystkich testowanych urządzeń (31.4 ms). | ||
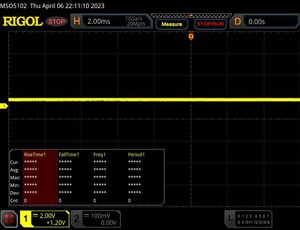
Migotanie ekranu / PWM (modulacja szerokości impulsu)
| Migotanie ekranu/nie wykryto PWM | |||
Dla porównania: 53 % wszystkich testowanych urządzeń nie używa PWM do przyciemniania wyświetlacza. Jeśli wykryto PWM, zmierzono średnio 8016 (minimum: 5 - maksimum: 343500) Hz. | |||
Wydajność - Raptor Lake i Ada Lovelace zasilają notebook dla graczy
Gaming, renderowanie i ogólnie wszystkie wymagające wydajności obszary aplikacji liczą się wśród scenariuszy zastosowań Erazer Major X20. Raptor Lake i Ada Lovelace zapewniają niezbędną moc obliczeniową. Model ten jest dostępny w cenie około 2500 euro (~2,5 tys. dolarów amerykańskich).
Warunki badania
X20 oferuje trzy specyficzne dla producenta tryby zasilania (patrz tabela), które można wybrać za pomocą osobnego przycisku (obok przycisku zasilania). Dioda LED stanu ujawnia, który tryb jest aktywny. używane były "Turbo Mode" (benchmarki) i "Office Mode" (testy na akumulatorze). Aktywny był tryb Optimus.
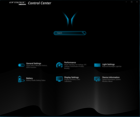
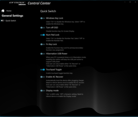
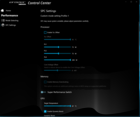
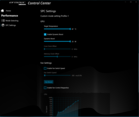
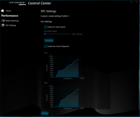
Indywidualne profile można tworzyć za pomocą preinstalowanego oprogramowania Control Center. Można na przykład dostosować limity mocy CPU, TGP GPU i/lub górne granice temperatur.
Użyliśmy anglojęzycznego interfejsu oprogramowania CC, ponieważ niemieckie tłumaczenie było częściowo nieudane. Można przełączać się między dwoma językami.
| Tryb Turbo (dt: Overboost) | Tryb Balance (dt: Balanced) | Tryb Office (dt: Balanced) | |
|---|---|---|---|
| CPU PL1 (HWInfo) | 140 watts | 140 watts | 140 watts |
| CPU PL2 (HWInfo) | 140 watów | 140 watów | 140 watów |
| Hałas (Witcher 3 ) | 50-53 dB(A) | 48-51 dB(A) | 36-43 dB(A), później 32-34 dB(A) |
| Wydajność (Witcher 3 ) | 124 fps | 118 fps | 114-118 fps, później 30 fps lock |
Procesor
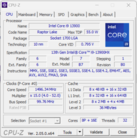
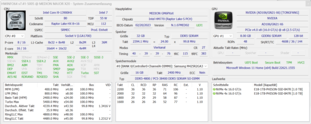
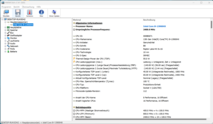
Na stronie Core-i9-13900HX procesor (Raptor Lake) składa się z ośmiu rdzeni wydajnościowych (hyperthreading, od 2,2 do 5,4 GHz) i szesnastu rdzeni efektywnościowych (bez hyperthreadingu, od 1,6 do 3,9 GHz). W sumie są to 32 logiczne rdzenie CPU. Wyniki benchmarków są na równi ze średnimi wskaźnikami procesora.
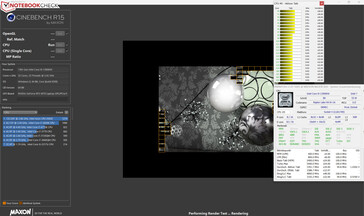
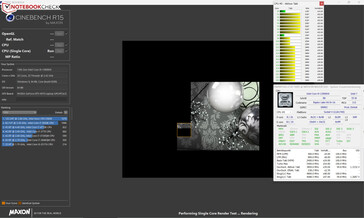
Testy CPU w benchmarku Cinebench R15 były przeprowadzane przy wysokich do maksymalnych częstotliwościach taktowania w czasie pracy pod obciążeniem sieciowym. Wydajność jednowątkowa (222 pkt.), która ma znaczenie w codziennym użytkowaniu, spada w trybie akumulatorowym w znacznie mniejszym stopniu, niż wydajność wielowątkowa (1025 pkt.).
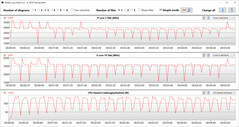
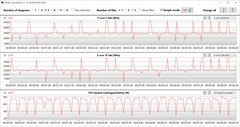
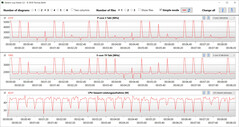
Test pętli CB15 wykazał, że wysokie taktowanie turbo jest konsekwentnie utrzymywane pod obciążeniem wielowątkowym w trybie zasilania sieciowego. Częstotliwość taktowania spada tylko minimalnie w trakcie trwania testu.
Cinebench R15 Multi Sustained Load
| CPU Performance rating - Percent | |
| Asus ROG Strix G17 G713PI | |
| Przeciętny Intel Core i9-13900HX | |
| Medion Erazer Major X20 | |
| Średnia w klasie Gaming | |
| Aorus 15X ASF | |
| Razer Blade 15 OLED (Early 2022) | |
* ... im mniej tym lepiej
AIDA64: FP32 Ray-Trace | FPU Julia | CPU SHA3 | CPU Queen | FPU SinJulia | FPU Mandel | CPU AES | CPU ZLib | FP64 Ray-Trace | CPU PhotoWorxx
| Performance rating | |
| Asus ROG Strix G17 G713PI | |
| Przeciętny Intel Core i9-13900HX | |
| Medion Erazer Major X20 | |
| Średnia w klasie Gaming | |
| Aorus 15X ASF | |
| Razer Blade 15 OLED (Early 2022) | |
| AIDA64 / FP32 Ray-Trace | |
| Asus ROG Strix G17 G713PI | |
| Średnia w klasie Gaming (7192 - 85542, n=133, ostatnie 2 lata) | |
| Medion Erazer Major X20 | |
| Przeciętny Intel Core i9-13900HX (17589 - 27615, n=22) | |
| Aorus 15X ASF | |
| Razer Blade 15 OLED (Early 2022) | |
| AIDA64 / FPU Julia | |
| Asus ROG Strix G17 G713PI | |
| Średnia w klasie Gaming (35040 - 238426, n=133, ostatnie 2 lata) | |
| Medion Erazer Major X20 | |
| Przeciętny Intel Core i9-13900HX (88686 - 137015, n=22) | |
| Aorus 15X ASF | |
| Razer Blade 15 OLED (Early 2022) | |
| AIDA64 / CPU SHA3 | |
| Asus ROG Strix G17 G713PI | |
| Medion Erazer Major X20 | |
| Przeciętny Intel Core i9-13900HX (4362 - 7029, n=22) | |
| Średnia w klasie Gaming (1728 - 9817, n=133, ostatnie 2 lata) | |
| Aorus 15X ASF | |
| Razer Blade 15 OLED (Early 2022) | |
| AIDA64 / CPU Queen | |
| Asus ROG Strix G17 G713PI | |
| Medion Erazer Major X20 | |
| Przeciętny Intel Core i9-13900HX (125644 - 141385, n=22) | |
| Średnia w klasie Gaming (49785 - 173351, n=133, ostatnie 2 lata) | |
| Aorus 15X ASF | |
| Razer Blade 15 OLED (Early 2022) | |
| AIDA64 / FPU SinJulia | |
| Asus ROG Strix G17 G713PI | |
| Medion Erazer Major X20 | |
| Przeciętny Intel Core i9-13900HX (12334 - 17179, n=22) | |
| Średnia w klasie Gaming (4424 - 33636, n=133, ostatnie 2 lata) | |
| Aorus 15X ASF | |
| Razer Blade 15 OLED (Early 2022) | |
| AIDA64 / FPU Mandel | |
| Asus ROG Strix G17 G713PI | |
| Średnia w klasie Gaming (17585 - 128721, n=133, ostatnie 2 lata) | |
| Medion Erazer Major X20 | |
| Przeciętny Intel Core i9-13900HX (43850 - 69202, n=22) | |
| Aorus 15X ASF | |
| Razer Blade 15 OLED (Early 2022) | |
| AIDA64 / CPU AES | |
| Asus ROG Strix G17 G713PI | |
| Aorus 15X ASF | |
| Przeciętny Intel Core i9-13900HX (89413 - 237881, n=22) | |
| Medion Erazer Major X20 | |
| Średnia w klasie Gaming (19065 - 247074, n=133, ostatnie 2 lata) | |
| Razer Blade 15 OLED (Early 2022) | |
| AIDA64 / CPU ZLib | |
| Asus ROG Strix G17 G713PI | |
| Medion Erazer Major X20 | |
| Przeciętny Intel Core i9-13900HX (1284 - 1958, n=22) | |
| Średnia w klasie Gaming (373 - 2531, n=133, ostatnie 2 lata) | |
| Aorus 15X ASF | |
| Razer Blade 15 OLED (Early 2022) | |
| AIDA64 / FP64 Ray-Trace | |
| Asus ROG Strix G17 G713PI | |
| Średnia w klasie Gaming (3856 - 45446, n=133, ostatnie 2 lata) | |
| Medion Erazer Major X20 | |
| Przeciętny Intel Core i9-13900HX (9481 - 15279, n=22) | |
| Aorus 15X ASF | |
| Razer Blade 15 OLED (Early 2022) | |
| AIDA64 / CPU PhotoWorxx | |
| Przeciętny Intel Core i9-13900HX (42994 - 51994, n=22) | |
| Medion Erazer Major X20 | |
| Średnia w klasie Gaming (10805 - 62916, n=133, ostatnie 2 lata) | |
| Aorus 15X ASF | |
| Razer Blade 15 OLED (Early 2022) | |
| Razer Blade 15 OLED (Early 2022) | |
| Asus ROG Strix G17 G713PI | |
Wydajność systemu
CrossMark: Overall | Productivity | Creativity | Responsiveness
| PCMark 10 / Score | |
| Średnia w klasie Gaming (5776 - 10060, n=113, ostatnie 2 lata) | |
| Medion Erazer Major X20 | |
| Przeciętny Intel Core i9-13900HX, NVIDIA GeForce RTX 4070 Laptop GPU (6956 - 8153, n=3) | |
| Asus ROG Strix G17 G713PI | |
| Razer Blade 15 OLED (Early 2022) | |
| Aorus 15X ASF | |
| PCMark 10 / Essentials | |
| Medion Erazer Major X20 | |
| Asus ROG Strix G17 G713PI | |
| Przeciętny Intel Core i9-13900HX, NVIDIA GeForce RTX 4070 Laptop GPU (9865 - 11653, n=3) | |
| Średnia w klasie Gaming (8810 - 12600, n=117, ostatnie 2 lata) | |
| Aorus 15X ASF | |
| Razer Blade 15 OLED (Early 2022) | |
| PCMark 10 / Productivity | |
| Asus ROG Strix G17 G713PI | |
| Średnia w klasie Gaming (6662 - 16716, n=115, ostatnie 2 lata) | |
| Razer Blade 15 OLED (Early 2022) | |
| Medion Erazer Major X20 | |
| Przeciętny Intel Core i9-13900HX, NVIDIA GeForce RTX 4070 Laptop GPU (9470 - 9850, n=3) | |
| Aorus 15X ASF | |
| PCMark 10 / Digital Content Creation | |
| Średnia w klasie Gaming (7440 - 19351, n=115, ostatnie 2 lata) | |
| Przeciętny Intel Core i9-13900HX, NVIDIA GeForce RTX 4070 Laptop GPU (9776 - 13370, n=3) | |
| Razer Blade 15 OLED (Early 2022) | |
| Medion Erazer Major X20 | |
| Aorus 15X ASF | |
| Asus ROG Strix G17 G713PI | |
| CrossMark / Overall | |
| Aorus 15X ASF | |
| Asus ROG Strix G17 G713PI | |
| Średnia w klasie Gaming (1247 - 2344, n=113, ostatnie 2 lata) | |
| Przeciętny Intel Core i9-13900HX, NVIDIA GeForce RTX 4070 Laptop GPU (1842 - 2029, n=3) | |
| Medion Erazer Major X20 | |
| Razer Blade 15 OLED (Early 2022) | |
| CrossMark / Productivity | |
| Aorus 15X ASF | |
| Asus ROG Strix G17 G713PI | |
| Średnia w klasie Gaming (1299 - 2211, n=113, ostatnie 2 lata) | |
| Przeciętny Intel Core i9-13900HX, NVIDIA GeForce RTX 4070 Laptop GPU (1700 - 1872, n=3) | |
| Medion Erazer Major X20 | |
| Razer Blade 15 OLED (Early 2022) | |
| CrossMark / Creativity | |
| Asus ROG Strix G17 G713PI | |
| Przeciętny Intel Core i9-13900HX, NVIDIA GeForce RTX 4070 Laptop GPU (2088 - 2316, n=3) | |
| Średnia w klasie Gaming (1275 - 2729, n=113, ostatnie 2 lata) | |
| Aorus 15X ASF | |
| Medion Erazer Major X20 | |
| Razer Blade 15 OLED (Early 2022) | |
| CrossMark / Responsiveness | |
| Aorus 15X ASF | |
| Średnia w klasie Gaming (1030 - 2330, n=113, ostatnie 2 lata) | |
| Asus ROG Strix G17 G713PI | |
| Przeciętny Intel Core i9-13900HX, NVIDIA GeForce RTX 4070 Laptop GPU (1557 - 1752, n=3) | |
| Medion Erazer Major X20 | |
| Razer Blade 15 OLED (Early 2022) | |
| PCMark 8 Home Score Accelerated v2 | 4889 pkt. | |
| PCMark 8 Work Score Accelerated v2 | 6067 pkt. | |
| PCMark 10 Score | 7575 pkt. | |
Pomoc | ||
| AIDA64 / Memory Copy | |
| Przeciętny Intel Core i9-13900HX (67716 - 79193, n=22) | |
| Średnia w klasie Gaming (21750 - 108104, n=133, ostatnie 2 lata) | |
| Medion Erazer Major X20 | |
| Aorus 15X ASF | |
| Razer Blade 15 OLED (Early 2022) | |
| Asus ROG Strix G17 G713PI | |
| AIDA64 / Memory Read | |
| Przeciętny Intel Core i9-13900HX (73998 - 88462, n=22) | |
| Medion Erazer Major X20 | |
| Średnia w klasie Gaming (22956 - 104349, n=133, ostatnie 2 lata) | |
| Aorus 15X ASF | |
| Razer Blade 15 OLED (Early 2022) | |
| Asus ROG Strix G17 G713PI | |
| AIDA64 / Memory Write | |
| Przeciętny Intel Core i9-13900HX (65472 - 77045, n=22) | |
| Średnia w klasie Gaming (22297 - 133486, n=133, ostatnie 2 lata) | |
| Medion Erazer Major X20 | |
| Asus ROG Strix G17 G713PI | |
| Razer Blade 15 OLED (Early 2022) | |
| Aorus 15X ASF | |
| AIDA64 / Memory Latency | |
| Średnia w klasie Gaming (59.5 - 259, n=133, ostatnie 2 lata) | |
| Razer Blade 15 OLED (Early 2022) | |
| Medion Erazer Major X20 | |
| Asus ROG Strix G17 G713PI | |
| Aorus 15X ASF | |
| Przeciętny Intel Core i9-13900HX (75.3 - 91.1, n=22) | |
* ... im mniej tym lepiej
Opóźnienie DPC
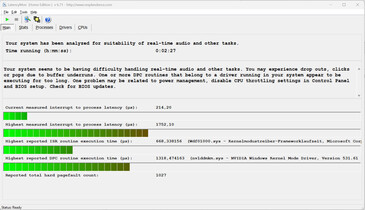
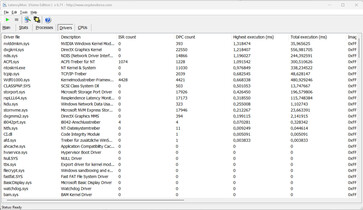
Standardowy test monitora latencji (przeglądanie stron internetowych, odtwarzanie filmów 4k, wysokie obciążenie Prime95) ujawnił anomalie. Wydaje się, że system nie nadaje się do edycji wideo i audio w czasie rzeczywistym. Przyszłe aktualizacje oprogramowania mogą to poprawić lub doprowadzić do dalszego pogorszenia.
| DPC Latencies / LatencyMon - interrupt to process latency (max), Web, Youtube, Prime95 | |
| Aorus 15X ASF | |
| Medion Erazer Major X20 | |
| Asus ROG Strix G17 G713PI | |
| Razer Blade 15 OLED (Early 2022) | |
* ... im mniej tym lepiej
Urządzenia do przechowywania danych
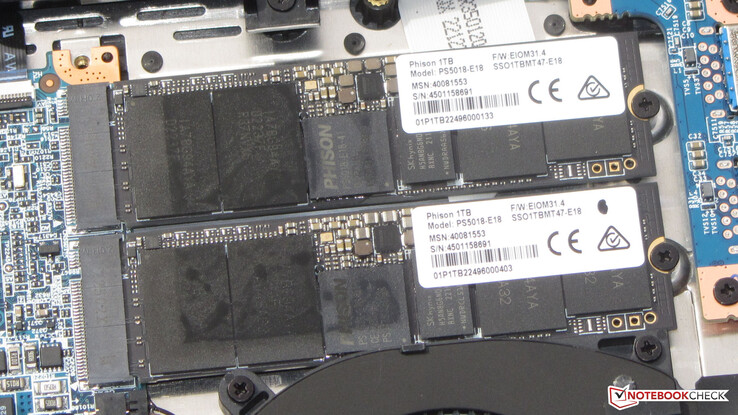
Erazer mieści dwa dyski SSD o pojemności 1 TB (PCIe 4, M.2-2280) firmy Phison, które zapewniają ogólnie dobre wskaźniki wydajności. Dyski SSD nie tworzą macierzy RAID, ani X20 nie oferuje obsługi RAID - jeden dysk SSD służy jako dysk systemowy, a drugi jako magazyn danych. Pozytywny aspekt: nie zaobserwowano throttlingu termicznego.
| Drive Performance rating - Percent | |
| Aorus 15X ASF | |
| Przeciętny Phison E18-1TB-PHISON-SSD-B47R | |
| Medion Erazer Major X20 | |
| Razer Blade 15 OLED (Early 2022) | |
| Średnia w klasie Gaming | |
| Asus ROG Strix G17 G713PI | |
* ... im mniej tym lepiej
Sustained Read Performance: DiskSpd Read Loop, Queue Depth 8
Karta graficzna
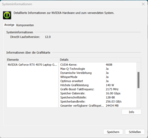
Żadnych (więcej) eksperymentów: Podczas gdy Medion zainstalował jeden z nowych wówczas procesorów graficznych Arc od Intela wMajor X10, X20 jest dostarczany z GeForce RTX 4070 do laptopa karta (VRAM: 8,192 GB GDDR6) od Nvidii. Ma ona do dyspozycji maksymalne możliwe TGP w wysokości 140 W (115 W + 25 W Dynamic Boost), które według testu Witcher 3 nie jest w pełni wykorzystane.
Wyniki benchmarku są powyżej poprzedniej średniej RTX 4070 - zauważalny jest znaczny wzrost wydajności w porównaniu z m.in.Arc A730M GPU z Major X10. Tryb dGPU nie przynosi żadnej poprawy. Przełączanie między dGPU a Optimusem nie wymaga restartu - wspierany jest Advanced Optimus.
| 3DMark 06 Standard Score | 60496 pkt. | |
| 3DMark 11 Performance | 35727 pkt. | |
| 3DMark Cloud Gate Standard Score | 66380 pkt. | |
| 3DMark Fire Strike Score | 27130 pkt. | |
| 3DMark Time Spy Score | 12846 pkt. | |
Pomoc | ||
* ... im mniej tym lepiej
Wydajność w grach
Notebook pozwala na grę w rozdzielczości QHD na ustawieniach wysokich do maksymalnych. Wyższe rozdzielczości byłyby możliwe w przypadku korzystania z zewnętrznego monitora - przy ewentualnie obniżonych ustawieniach. Liczba klatek na sekundę w testowanych tytułach jest powyżej ustalonej średniej dla RTX 4070. Tryb dGPU może w niewielkim stopniu zwiększyć liczbę klatek na sekundę w niektórych grach.
| The Witcher 3 - 1920x1080 Ultra Graphics & Postprocessing (HBAO+) | |
| Średnia w klasie Gaming (80.2 - 240, n=35, ostatnie 2 lata) | |
| Medion Erazer Major X20 | |
| Asus ROG Strix G17 G713PI | |
| Aorus 15X ASF | |
| Przeciętny NVIDIA GeForce RTX 4070 Laptop GPU (69.8 - 133.7, n=57) | |
| Razer Blade 15 OLED (Early 2022) | |
| Medion Erazer Major X10 | |
Aby sprawdzić, czy liczba klatek na sekundę pozostaje w dużej mierze stała przez dłuższy czas, uruchomiliśmy grę "The Witcher 3" przez około 60 minut w rozdzielczości Full HD i przy maksymalnych ustawieniach jakości. Postać w grze nie była poruszana. Spadek liczby klatek na sekundę nie został zarejestrowany.
Witcher 3 FPS chart
| low | med. | high | ultra | QHD | |
|---|---|---|---|---|---|
| GTA V (2015) | 187.3 | 187.2 | 183.8 | 128 | 72.6 |
| The Witcher 3 (2015) | 545 | 391.4 | 242.3 | 127 | |
| Dota 2 Reborn (2015) | 205 | 183.3 | 169.9 | 158.8 | |
| Final Fantasy XV Benchmark (2018) | 220 | 175.2 | 121.2 | 88.4 | |
| X-Plane 11.11 (2018) | 182.3 | 155.9 | 120.8 | ||
| Far Cry 5 (2018) | 188 | 161 | 153 | 144 | 122 |
| Strange Brigade (2018) | 490 | 310 | 244 | 208 | 131.4 |
| F1 22 (2022) | 262 | 264 | 206 | 83.9 | 53.3 |
Emisje - laptop Erazer może wytwarzać dużo hałasu
Hałas
X20 może wytwarzać dużo hałasu pod obciążeniem: szczytowe wartości do 57 dB(A) są osiągane, gdy aktywny jest "Tryb Turbo". Szum tła to coś w rodzaju syczącego dźwięku. Wentylatory nie emitują uciążliwego szumu tła. Niższy poziom hałasu można uzyskać poprzez zastosowanie dwóch pozostałych profili wydajności - kosztem mocy obliczeniowej.
Emisja na biegu jałowym i w codziennym użytkowaniu (biuro, internet) jest przyjemna: wentylatory pracują na bardzo niskich obrotach i często są bezczynne - we wszystkich trzech profilach wydajności.
| Tryb Turbo (dt: Overboost) | Tryb zrównoważony (dt: Zrównoważony) | Tryb biurowy (dt: Zrównoważony) | |
|---|---|---|---|
| CPU PL1 (HWInfo) | 140 watts | 140 watts | 140 watts |
| CPU PL2 (HWInfo) | 140 watów | 140 watów | 140 watów |
| Hałas (Witcher 3 ) | 50-53 dB(A) | 48-51 dB(A) | 36-43 dB(A) później 32-34 dB(A) |
| Wydajność (Witcher 3 ) | 124 fps | 118 fps | 114-118 fps później 30 fps Lock |
Hałas
| luz |
| 25 / 29 / 31 dB |
| obciążenie |
| 50 / 57 dB |
 | ||
30 dB cichy 40 dB(A) słyszalny 50 dB(A) irytujący |
||
min: | ||
| Medion Erazer Major X20 i9-13900HX, GeForce RTX 4070 Laptop GPU | Aorus 15X ASF i7-13700HX, GeForce RTX 4070 Laptop GPU | Razer Blade 15 OLED (Early 2022) i9-12900H, GeForce RTX 3070 Ti Laptop GPU | Asus ROG Strix G17 G713PI R9 7945HX, GeForce RTX 4070 Laptop GPU | |
|---|---|---|---|---|
| Noise | -5% | 7% | 5% | |
| wyłączone / środowisko * (dB) | 24 | 25 -4% | 26 -8% | 25 -4% |
| Idle Minimum * (dB) | 25 | 28 -12% | 28 -12% | 26 -4% |
| Idle Average * (dB) | 29 | 29 -0% | 28 3% | 29 -0% |
| Idle Maximum * (dB) | 31 | 36 -16% | 28 10% | 30 3% |
| Load Average * (dB) | 50 | 50 -0% | 38.5 23% | 46 8% |
| Witcher 3 ultra * (dB) | 53 | 54 -2% | 46 13% | |
| Load Maximum * (dB) | 57 | 58 -2% | 43.9 23% | 47 18% |
* ... im mniej tym lepiej
Temperatura
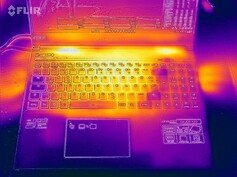
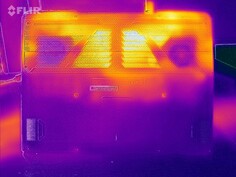
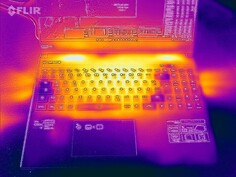
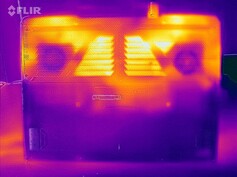
W codziennym użytkowaniu (biuro, internet) temperatury laptopa utrzymują się w zielonym zakresie. Notebook nagrzewa się zauważalnie pod obciążeniem (stress test, Witcher 3 test), ale nie nadmiernie. Temperatury procesora nie są niczym niepokojącym.
(-) Maksymalna temperatura w górnej części wynosi 46 °C / 115 F, w porównaniu do średniej 40.4 °C / 105 F , począwszy od 21.2 do 68.8 °C dla klasy Gaming.
(-) Dno nagrzewa się maksymalnie do 49 °C / 120 F, w porównaniu do średniej 43.3 °C / 110 F
(±) W stanie bezczynności średnia temperatura górnej części wynosi 32 °C / 90 F, w porównaniu ze średnią temperaturą urządzenia wynoszącą 33.9 °C / ### class_avg_f### F.
(±) Podczas gry w Wiedźmina 3 średnia temperatura górnej części wynosi 37 °C / 99 F, w porównaniu do średniej temperatury urządzenia wynoszącej 33.9 °C / ## #class_avg_f### F.
(+) Podpórki pod nadgarstki i touchpad są chłodniejsze niż temperatura skóry i maksymalnie 31 °C / 87.8 F i dlatego są chłodne w dotyku.
(-) Średnia temperatura obszaru podparcia dłoni w podobnych urządzeniach wynosiła 28.8 °C / 83.8 F (-2.2 °C / -4 F).
| Medion Erazer Major X20 Intel Core i9-13900HX, NVIDIA GeForce RTX 4070 Laptop GPU | Aorus 15X ASF Intel Core i7-13700HX, NVIDIA GeForce RTX 4070 Laptop GPU | Razer Blade 15 OLED (Early 2022) Intel Core i9-12900H, NVIDIA GeForce RTX 3070 Ti Laptop GPU | Asus ROG Strix G17 G713PI AMD Ryzen 9 7945HX, NVIDIA GeForce RTX 4070 Laptop GPU | |
|---|---|---|---|---|
| Heat | 16% | 3% | 12% | |
| Maximum Upper Side * (°C) | 46 | 42 9% | 49.5 -8% | 42 9% |
| Maximum Bottom * (°C) | 49 | 51 -4% | 47.5 3% | 41 16% |
| Idle Upper Side * (°C) | 37 | 27 27% | 33.4 10% | 33 11% |
| Idle Bottom * (°C) | 38 | 26 32% | 35 8% | 34 11% |
* ... im mniej tym lepiej
Stress Test
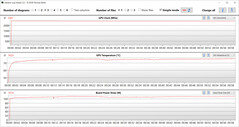
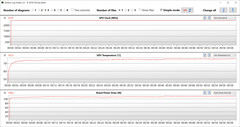
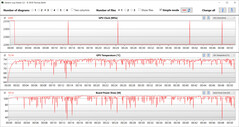
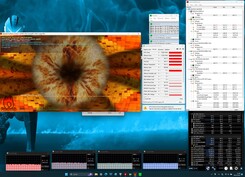
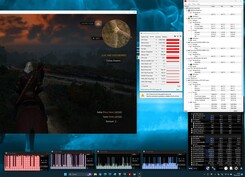
Test obciążeniowy (Prime95 i Furmark w trybie ciągłym) reprezentuje ekstremalny scenariusz badania stabilności systemu pod pełnym obciążeniem. CPU rozpoczyna test z wysokim taktowaniem (P: 4 GHz, E: 3,3 GHz), podczas gdy GPU odpala się z częstotliwością 1,5 do 2 GHz. W ciągu pierwszych 5 minut zegar CPU stopniowo spada do 2-2,4 GHz (rdzenie P) i 1,9-2,1 GHz (rdzenie E). W tym samym czasie taktowanie GPU wzrasta do 2,3-2,4 GHz.
Mówcy
Głośniki stereo wytwarzają bardzo przyzwoity dźwięk, ale przydałoby się więcej basów. Dla lepszej jakości dźwięku zalecane są słuchawki lub głośniki zewnętrzne.
Medion Erazer Major X20 analiza dźwięku
(+) | głośniki mogą odtwarzać stosunkowo głośno (86 dB)
Bas 100 - 315 Hz
(±) | zredukowany bas - średnio 11.9% niższy od mediany
(±) | liniowość basu jest średnia (9.7% delta do poprzedniej częstotliwości)
Średnie 400 - 2000 Hz
(+) | zbalansowane środki średnie - tylko 3.7% od mediany
(+) | średnie są liniowe (4.7% delta do poprzedniej częstotliwości)
Wysokie 2–16 kHz
(+) | zrównoważone maksima - tylko 2.3% od mediany
(+) | wzloty są liniowe (3.4% delta do poprzedniej częstotliwości)
Ogólnie 100 - 16.000 Hz
(+) | ogólny dźwięk jest liniowy (10.4% różnicy w stosunku do mediany)
W porównaniu do tej samej klasy
» 6% wszystkich testowanych urządzeń w tej klasie było lepszych, 2% podobnych, 92% gorszych
» Najlepszy miał deltę 6%, średnia wynosiła ###średnia###%, najgorsza wynosiła 132%
W porównaniu do wszystkich testowanych urządzeń
» 5% wszystkich testowanych urządzeń było lepszych, 1% podobnych, 94% gorszych
» Najlepszy miał deltę 4%, średnia wynosiła ###średnia###%, najgorsza wynosiła 134%
Aorus 15X ASF analiza dźwięku
(+) | głośniki mogą odtwarzać stosunkowo głośno (83 dB)
Bas 100 - 315 Hz
(-) | prawie brak basu - średnio 27.3% niższa od mediany
(-) | bas nie jest liniowy (15.1% delta do poprzedniej częstotliwości)
Średnie 400 - 2000 Hz
(±) | wyższe średnie - średnio 5.8% wyższe niż mediana
(+) | średnie są liniowe (4.8% delta do poprzedniej częstotliwości)
Wysokie 2–16 kHz
(+) | zrównoważone maksima - tylko 3.1% od mediany
(+) | wzloty są liniowe (6.3% delta do poprzedniej częstotliwości)
Ogólnie 100 - 16.000 Hz
(±) | liniowość ogólnego dźwięku jest średnia (20.1% różnicy w stosunku do mediany)
W porównaniu do tej samej klasy
» 71% wszystkich testowanych urządzeń w tej klasie było lepszych, 6% podobnych, 23% gorszych
» Najlepszy miał deltę 6%, średnia wynosiła ###średnia###%, najgorsza wynosiła 132%
W porównaniu do wszystkich testowanych urządzeń
» 51% wszystkich testowanych urządzeń było lepszych, 8% podobnych, 40% gorszych
» Najlepszy miał deltę 4%, średnia wynosiła ###średnia###%, najgorsza wynosiła 134%
Zarządzanie energią - Medion X20 zapewnia słabe czasy pracy
Pobór mocy
Notebook Medion nie wykazuje żadnych nieprawidłowości w zakresie zużycia energii. Wskaźniki te są na normalnym poziomie dla zainstalowanego sprzętu. Test Witcher 3 i stress test przebiegały z relatywnie stałymi wskaźnikami poboru mocy. Zasilacz (330 W) jest więc wystarczająco pojemny.
| wyłączony / stan wstrzymania | |
| luz | |
| obciążenie |
|
Legenda:
min: | |
| Medion Erazer Major X20 i9-13900HX, GeForce RTX 4070 Laptop GPU | Aorus 15X ASF i7-13700HX, GeForce RTX 4070 Laptop GPU | Razer Blade 15 OLED (Early 2022) i9-12900H, GeForce RTX 3070 Ti Laptop GPU | Asus ROG Strix G17 G713PI R9 7945HX, GeForce RTX 4070 Laptop GPU | Przeciętny NVIDIA GeForce RTX 4070 Laptop GPU | Średnia w klasie Gaming | |
|---|---|---|---|---|---|---|
| Power Consumption | 7% | -46% | -6% | 6% | -2% | |
| Idle Minimum * (Watt) | 12 | 11 8% | 31.6 -163% | 15 -25% | 13.2 ? -10% | 13.8 ? -15% |
| Idle Average * (Watt) | 16 | 16 -0% | 33.3 -108% | 20 -25% | 18.2 ? -14% | 19.5 ? -22% |
| Idle Maximum * (Watt) | 26 | 24 8% | 38.6 -48% | 29 -12% | 24.6 ? 5% | 25.5 ? 2% |
| Load Average * (Watt) | 115 | 104 10% | 149 -30% | 121 -5% | 97 ? 16% | 110.6 ? 4% |
| Witcher 3 ultra * (Watt) | 191.6 | 185.4 3% | 149.6 22% | 179.8 6% | ||
| Load Maximum * (Watt) | 319 | 272 15% | 160 50% | 246 23% | 221 ? 31% | 257 ? 19% |
* ... im mniej tym lepiej
Energieaufnahme Witcher 3 / Stresstest
Power consumption with an external monitor
Czas pracy na baterii
W teście WLAN 16-calowiec osiągnął czasy pracy odpowiednio 3:52 h i 4:12 h (ładowanie stron internetowych przy użyciu skryptu) oraz w teście wideo (film krótkometrażowy Big Buck Bunny, kodowanie H.264, FHD, w pętli). Podczas obu testów funkcje oszczędzania energii w notebooku były wyłączone, a jasność wyświetlacza ustawiona na około 150 cd/m². Na potrzeby testu wideo wyłączone zostały również moduły radiowe.
Ogólnie rzecz biorąc, czasy pracy poniżej przeciętnej wynikają z niskiej pojemności akumulatora (62,3 Wh) jak na notebook do gier. Więcej można było uzyskać na akumulatorze o pojemności 80 Wh w poprzedniku poprzednika.
| Medion Erazer Major X20 i9-13900HX, GeForce RTX 4070 Laptop GPU, 62.3 Wh | Aorus 15X ASF i7-13700HX, GeForce RTX 4070 Laptop GPU, 99 Wh | Razer Blade 15 OLED (Early 2022) i9-12900H, GeForce RTX 3070 Ti Laptop GPU, 80 Wh | Asus ROG Strix G17 G713PI R9 7945HX, GeForce RTX 4070 Laptop GPU, 90 Wh | Średnia w klasie Gaming | |
|---|---|---|---|---|---|
| Czasy pracy | 80% | 26% | -20% | 52% | |
| Reader / Idle (h) | 5.8 | 11.3 95% | 6.7 16% | 9.06 ? 56% | |
| H.264 (h) | 4.2 | 7.9 88% | 5.9 40% | 2.8 -33% | 7.93 ? 89% |
| WiFi v1.3 (h) | 3.9 | 8.2 110% | 4.6 18% | 4.3 10% | 6.67 ? 71% |
| Load (h) | 1.6 | 2 25% | 2.1 31% | 1 -37% | 1.483 ? -7% |
| Witcher 3 ultra (h) | 1.1 | 0.958 ? |
Za
Przeciw
Werdykt: Dużo sprzętu
Ten potężny notebook umożliwia granie w rozdzielczości QHD+, ale błyszczy także w innych dziedzinach. A Core i9-13900HX i GeForce RTX 4070 działają ze stałą wysoką częstotliwością taktowania, dwa dyski SSD o pojemności 1 TB zapewniają krótkie czasy ładowania i wystarczającą przestrzeń dyskową. Hałas i wydzielanie ciepła są w wysokim zakresie, typowym dla tej klasy notebooków.
W Erazer Major X20 Medion prezentuje dobrze wyposażony notebook do gier ze średniej półki, bez poważnych słabości.
Klawiatura typu chiclet z poprzedniego modelu ustąpiła miejsca modelowi mechanicznemu (przełączniki Cherry MX, indywidualne podświetlenie klawiszy RGB) - co jest znacznym usprawnieniem. Użytkownicy nieobeznani z taką klawiaturą odkryją nowe wrażenia z pisania.
Matowy 16-calowy ekran (QHD+, IPS, 240 Hz, G-Sync, sRGB) w przyjaznym dla pracy formacie 16:10 sprawia ogólnie dobre wrażenie. Port Thunderbolt 4 zapewnia opcje rozbudowy (zewnętrzne GPU, rozwiązanie dokujące, wyświetlacz), ale nie obsługuje Power Delivery. Czasy pracy na akumulatorze również nie są imponujące.
Na stronie Aorus 15X ASF jest alternatywą o znacznie lepszych czasach pracy. Oferuje on taką samą wydajność graficzną jak X20, ale mniejszą moc procesora.
Cena i dostępność
Recenzowana konfiguracja Medion Erazer Major X20 widnieje w sklepie internetowym Mediona w cenie nieco poniżej 2500 euro, ale jest obecnie wyprzedana. Dostępność tego modelu wydaje się być obecnie ograniczona poza Niemcami.
Medion Erazer Major X20
- 20/04/2023 v7 (old)
Sascha Mölck
Przezroczystość
Wyboru urządzeń do recenzji dokonuje nasza redakcja. Próbka testowa została udostępniona autorowi jako pożyczka od producenta lub sprzedawcy detalicznego na potrzeby tej recenzji. Pożyczkodawca nie miał wpływu na tę recenzję, producent nie otrzymał też kopii tej recenzji przed publikacją. Nie było obowiązku publikowania tej recenzji. Jako niezależna firma medialna, Notebookcheck nie podlega władzy producentów, sprzedawców detalicznych ani wydawców.
Tak testuje Notebookcheck
Każdego roku Notebookcheck niezależnie sprawdza setki laptopów i smartfonów, stosując standardowe procedury, aby zapewnić porównywalność wszystkich wyników. Od około 20 lat stale rozwijamy nasze metody badawcze, ustanawiając przy tym standardy branżowe. W naszych laboratoriach testowych doświadczeni technicy i redaktorzy korzystają z wysokiej jakości sprzętu pomiarowego. Testy te obejmują wieloetapowy proces walidacji. Nasz kompleksowy system ocen opiera się na setkach uzasadnionych pomiarów i benchmarków, co pozwala zachować obiektywizm.

