Recenzja smukłego laptopa Gigabyte AERO 16 OLED: Wydajny RTX 4070 dla graczy i twórców
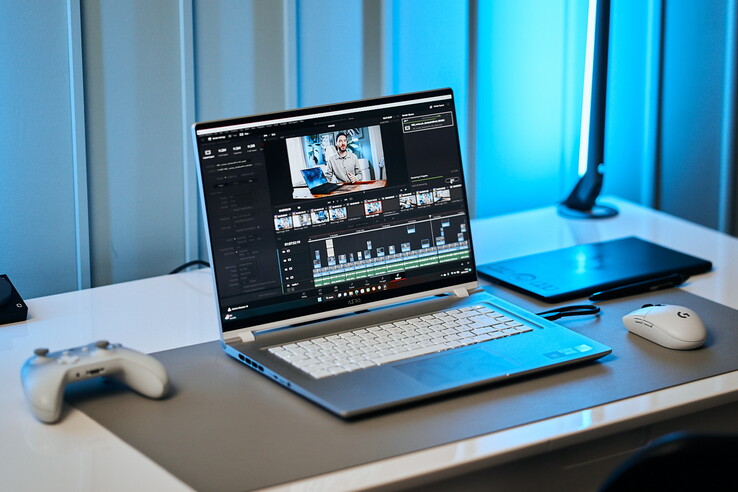
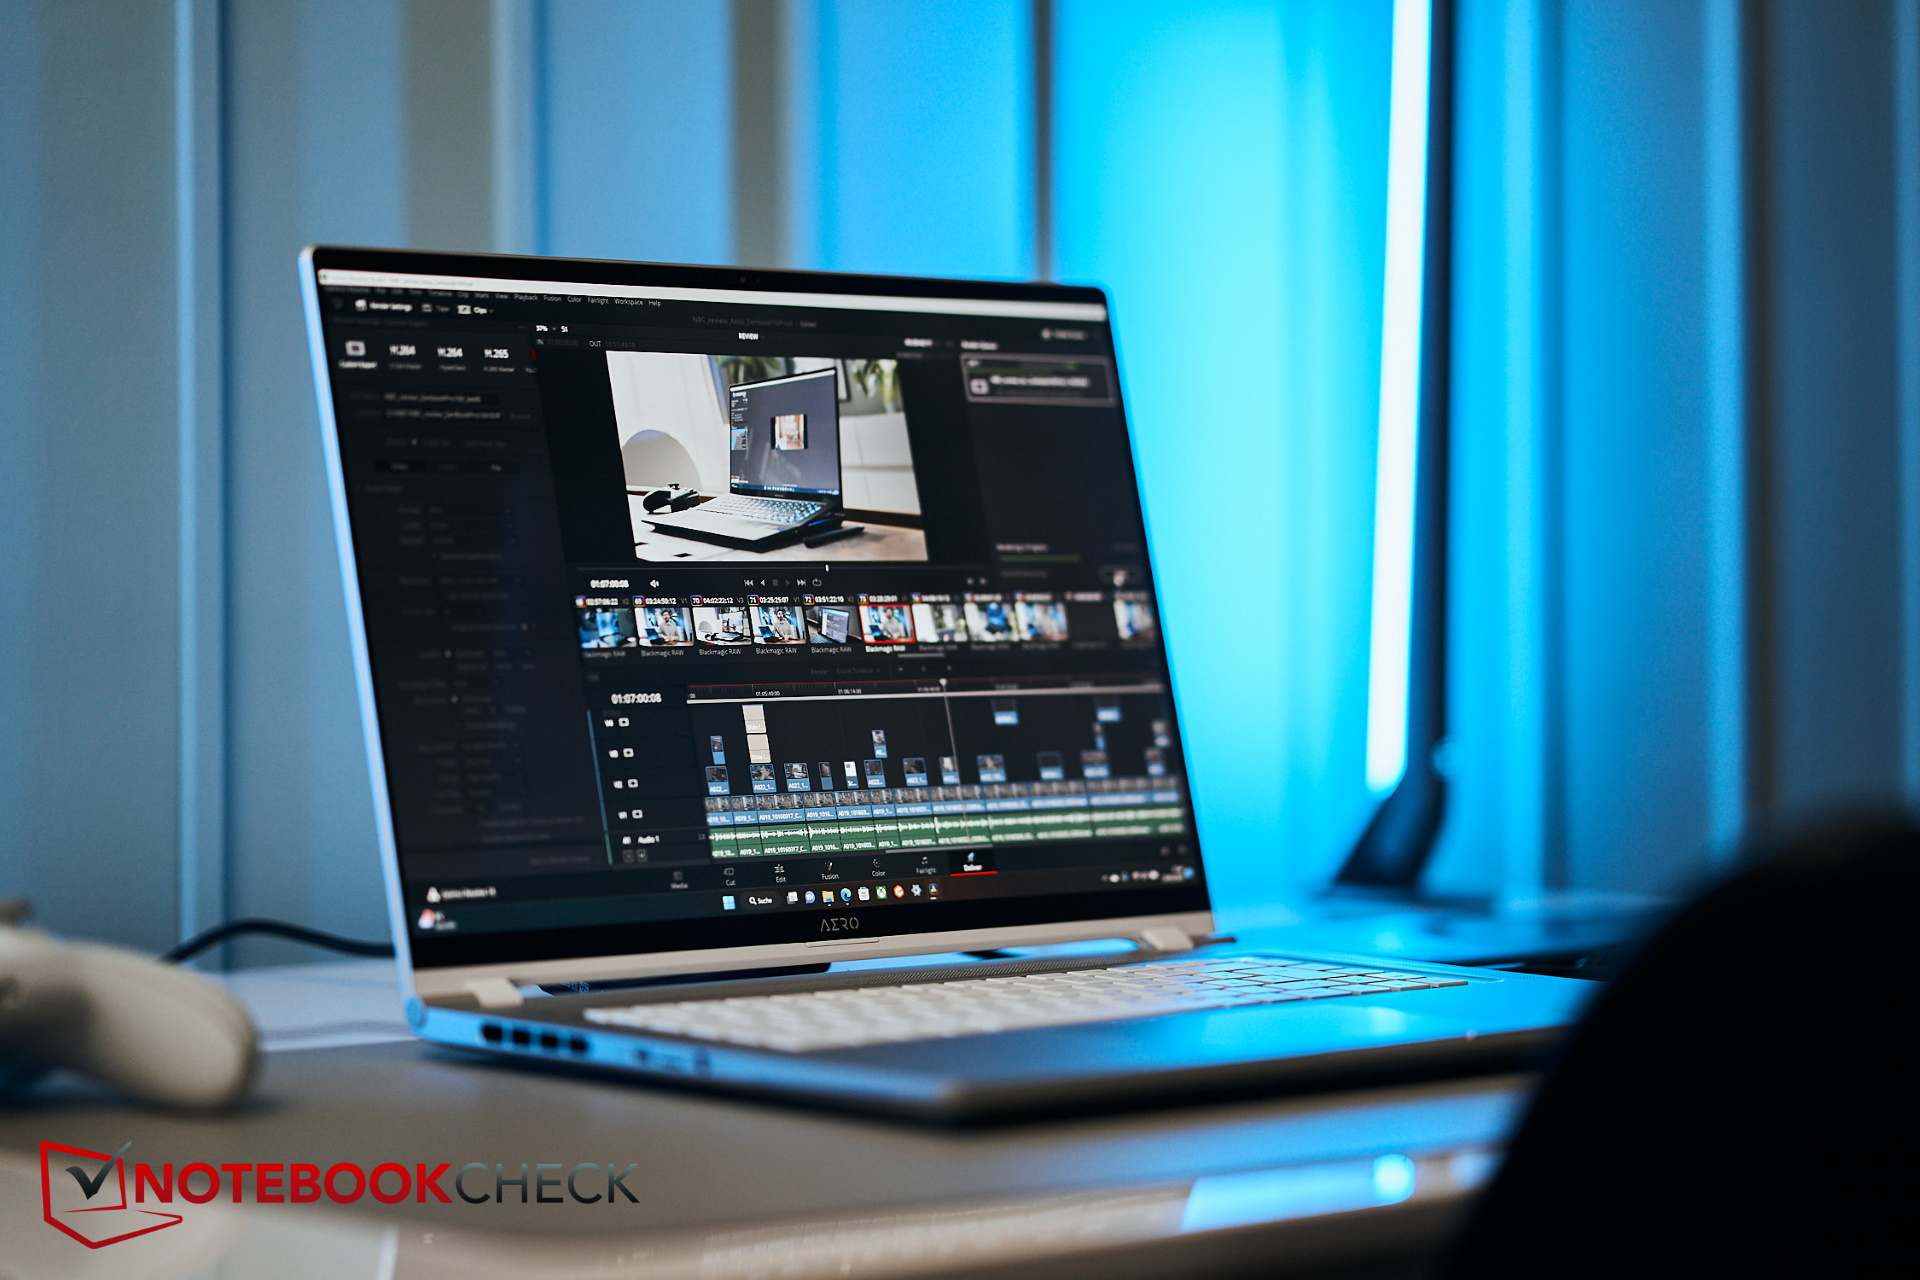
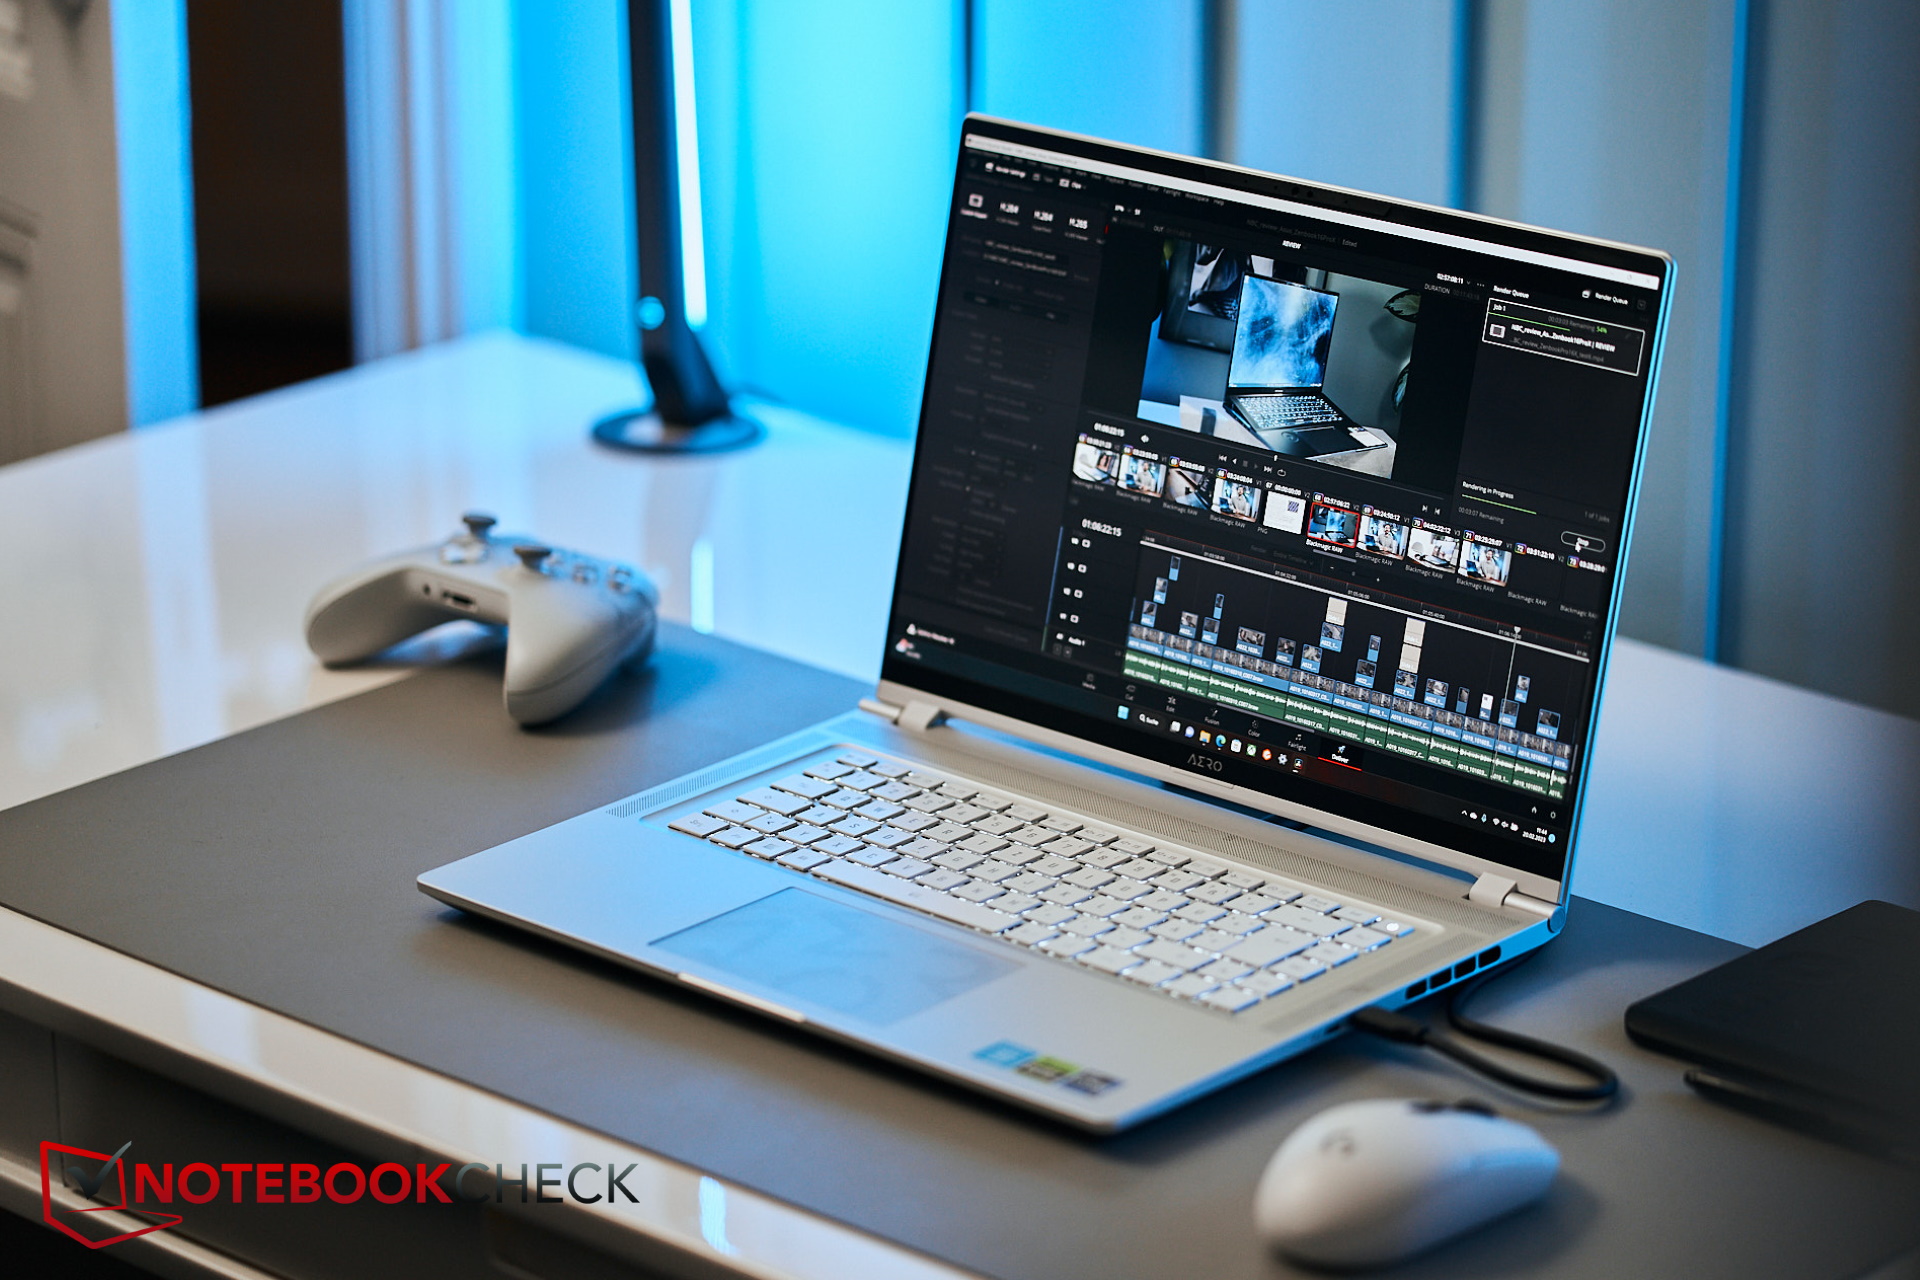
Aero 16 OLED firmy Gigabyte to ciekawa mieszanka laptopa gamingowego i stacji roboczej dla kreatywnych. Poza zmianą procesora z Alder na Raptor Lake i z Nvidia RTX 30x na RTX 40x, wprowadzono także inne zmiany, m.in. w obudowie i portach.
Wcześniej recenzowaliśmy m.in poprzednika z RTX 3080 Ti a nasza obecna konfiguracja ma m.in RTX 4070. Do tej pory zrecenzowaliśmy tylko nowego Razera Blade 18z tym samym GPU, więc 18-calowiec będzie musiał służyć jako porównanie w benchmarkach 3D. W przeciwnym razie porównujemy 16-calowych konkurentów poprzedniej generacji, m.in Asus Zenbook Pro 16X OLED, Asus TUF Gaming A16 oraz MSI CreatorPro Z16P z jego Nvidia A300.
Potencjalni konkurenci w porównaniu
Ocena | Data | Model | Waga | Wysokość | Rozmiar | Rezolucja | Cena |
|---|---|---|---|---|---|---|---|
| 86.2 % v7 (old) | 03/2023 | Gigabyte AERO 16 OLED BSF i9-13900H, GeForce RTX 4070 Laptop GPU | 2.1 kg | 18 mm | 16.00" | 3840x2400 | |
| 84.7 % v7 (old) | Gigabyte Aero 16 YE5 i9-12900HK, GeForce RTX 3080 Ti Laptop GPU | 2.3 kg | 22.4 mm | 16.00" | 3840x2400 | ||
| 91.4 % v7 (old) | 02/2023 | Razer Blade 18 RTX 4070 i9-13950HX, GeForce RTX 4070 Laptop GPU | 3 kg | 21.9 mm | 18.00" | 2560x1600 | |
| 88.4 % v7 (old) | 12/2022 | Asus ZenBook Pro 16X OLED UX7602ZM-ME115W i9-12900H, GeForce RTX 3060 Laptop GPU | 2.4 kg | 19.5 mm | 16.00" | 3840x2400 | |
| 86.2 % v7 (old) | 02/2023 | Asus TUF Gaming A16 FA617 R7 7735HS, Radeon RX 7600S | 2.2 kg | 27 mm | 16.00" | 1920x1200 | |
| 84.3 % v7 (old) | 11/2022 | MSI CreatorPro Z16P B12UKST i7-12700H, RTX A3000 Laptop GPU | 2.4 kg | 19 mm | 16.00" | 2560x1600 |
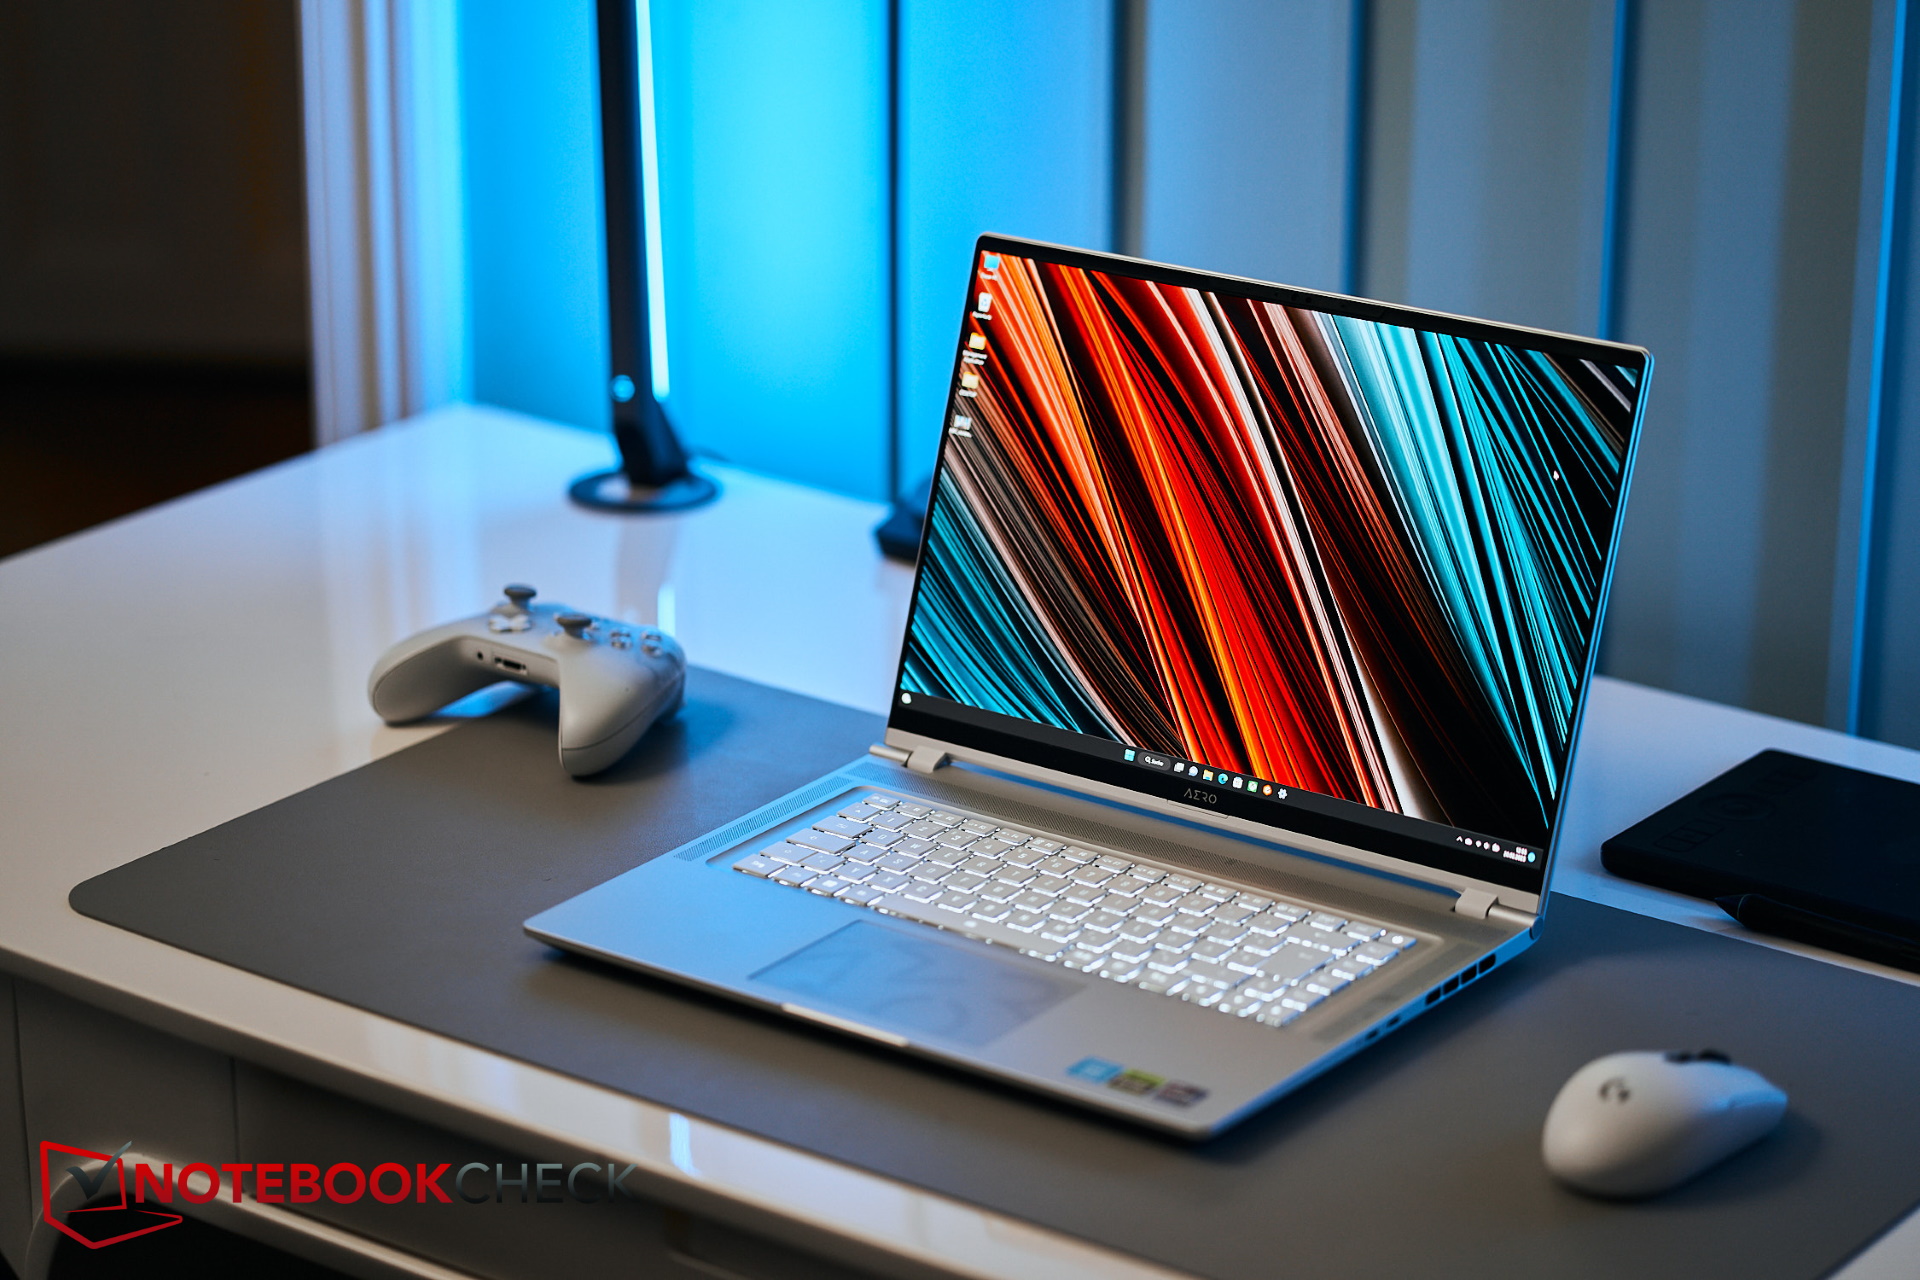
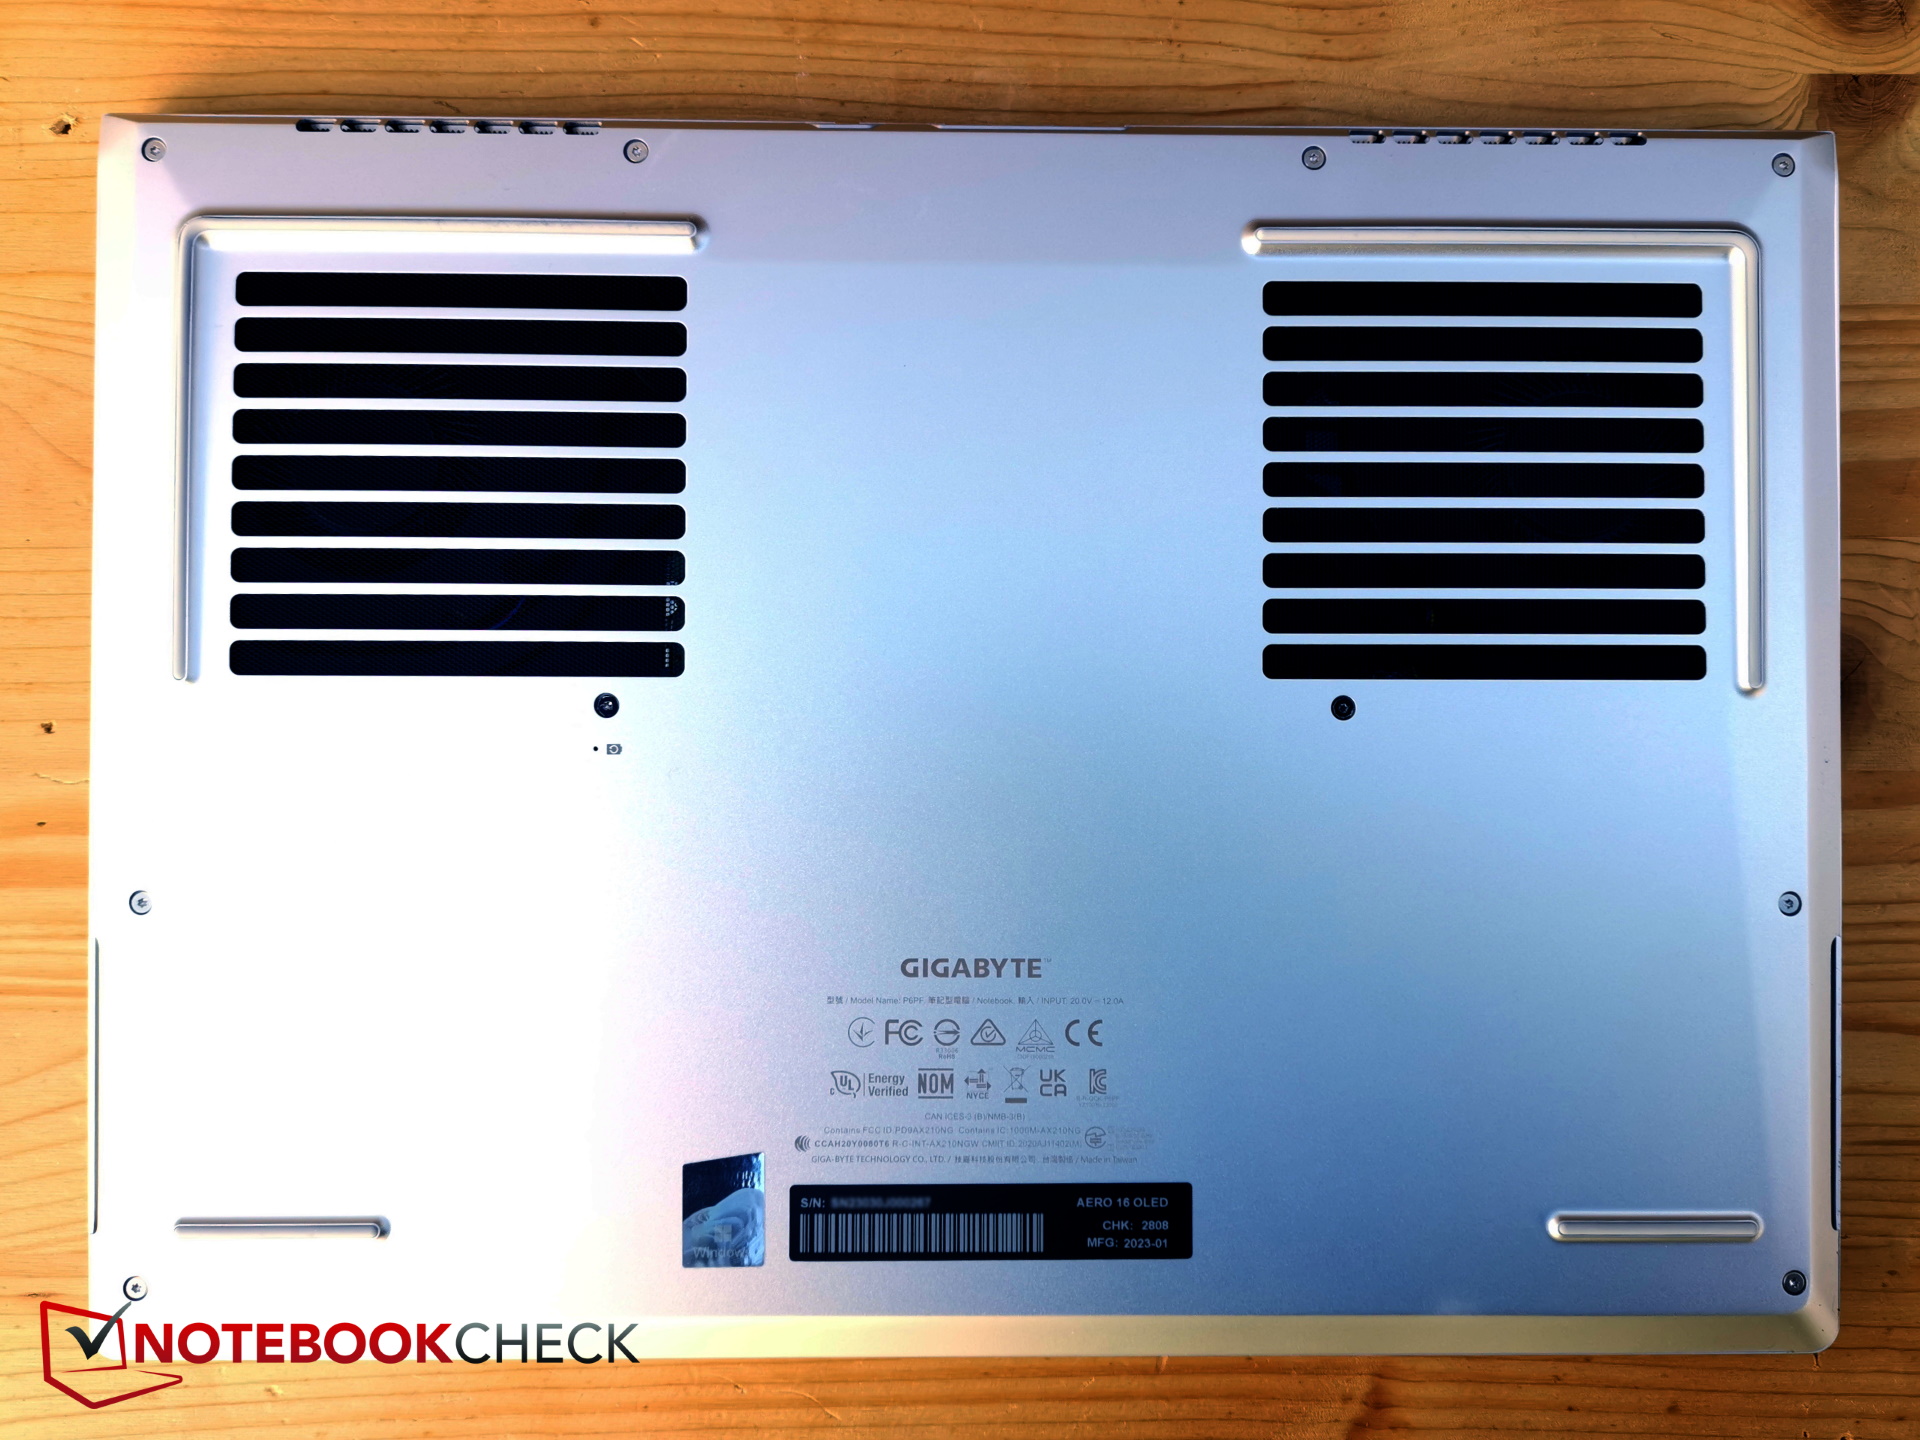
Obudowa - Solidna metalowa obudowa w kolorze srebrnym
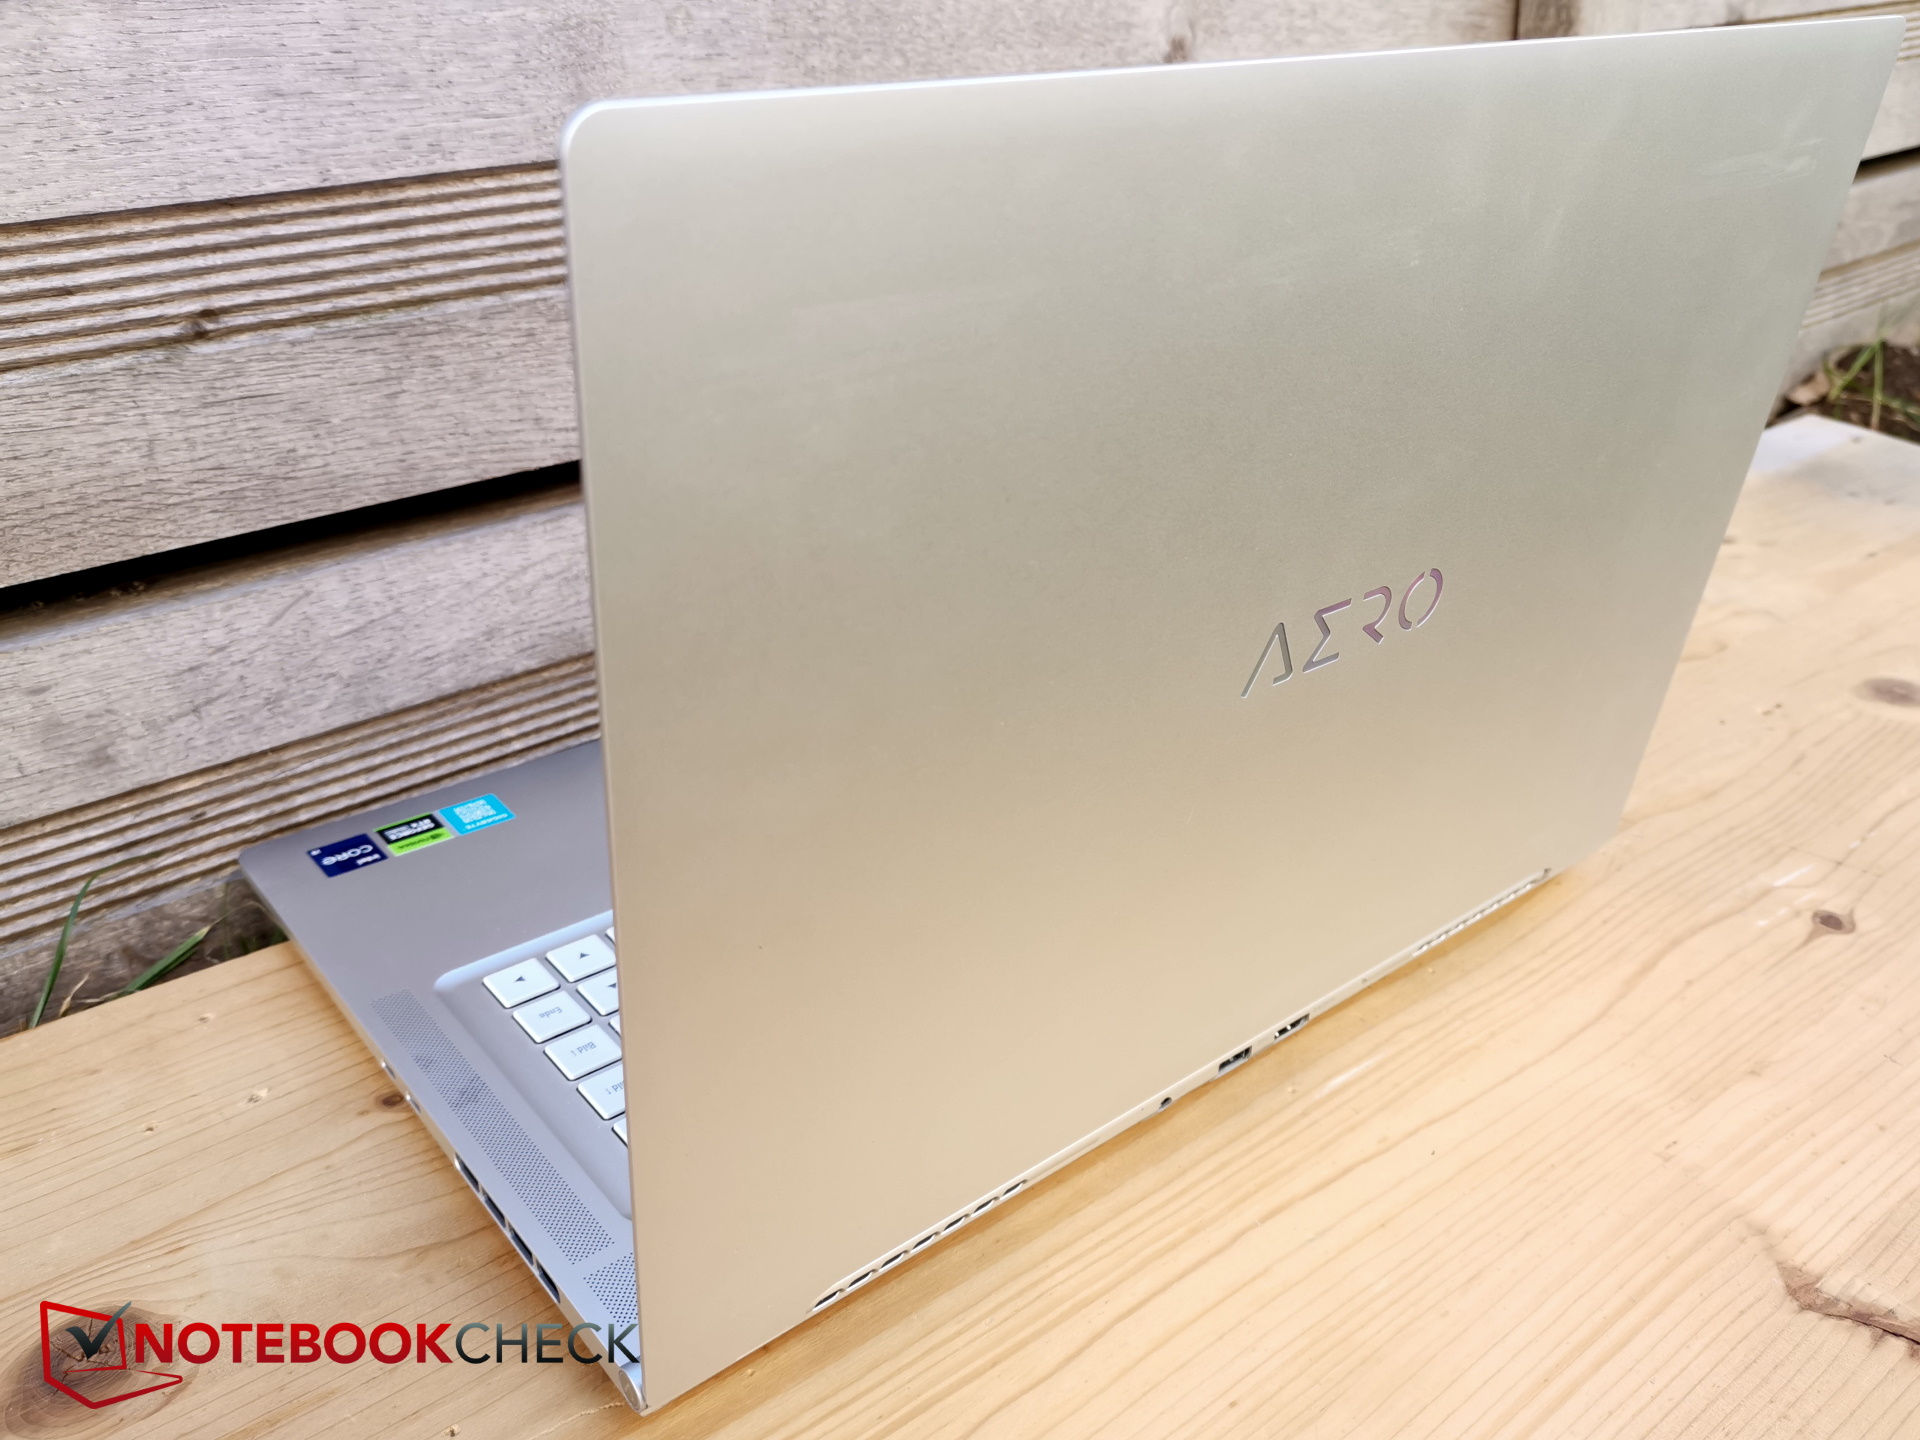
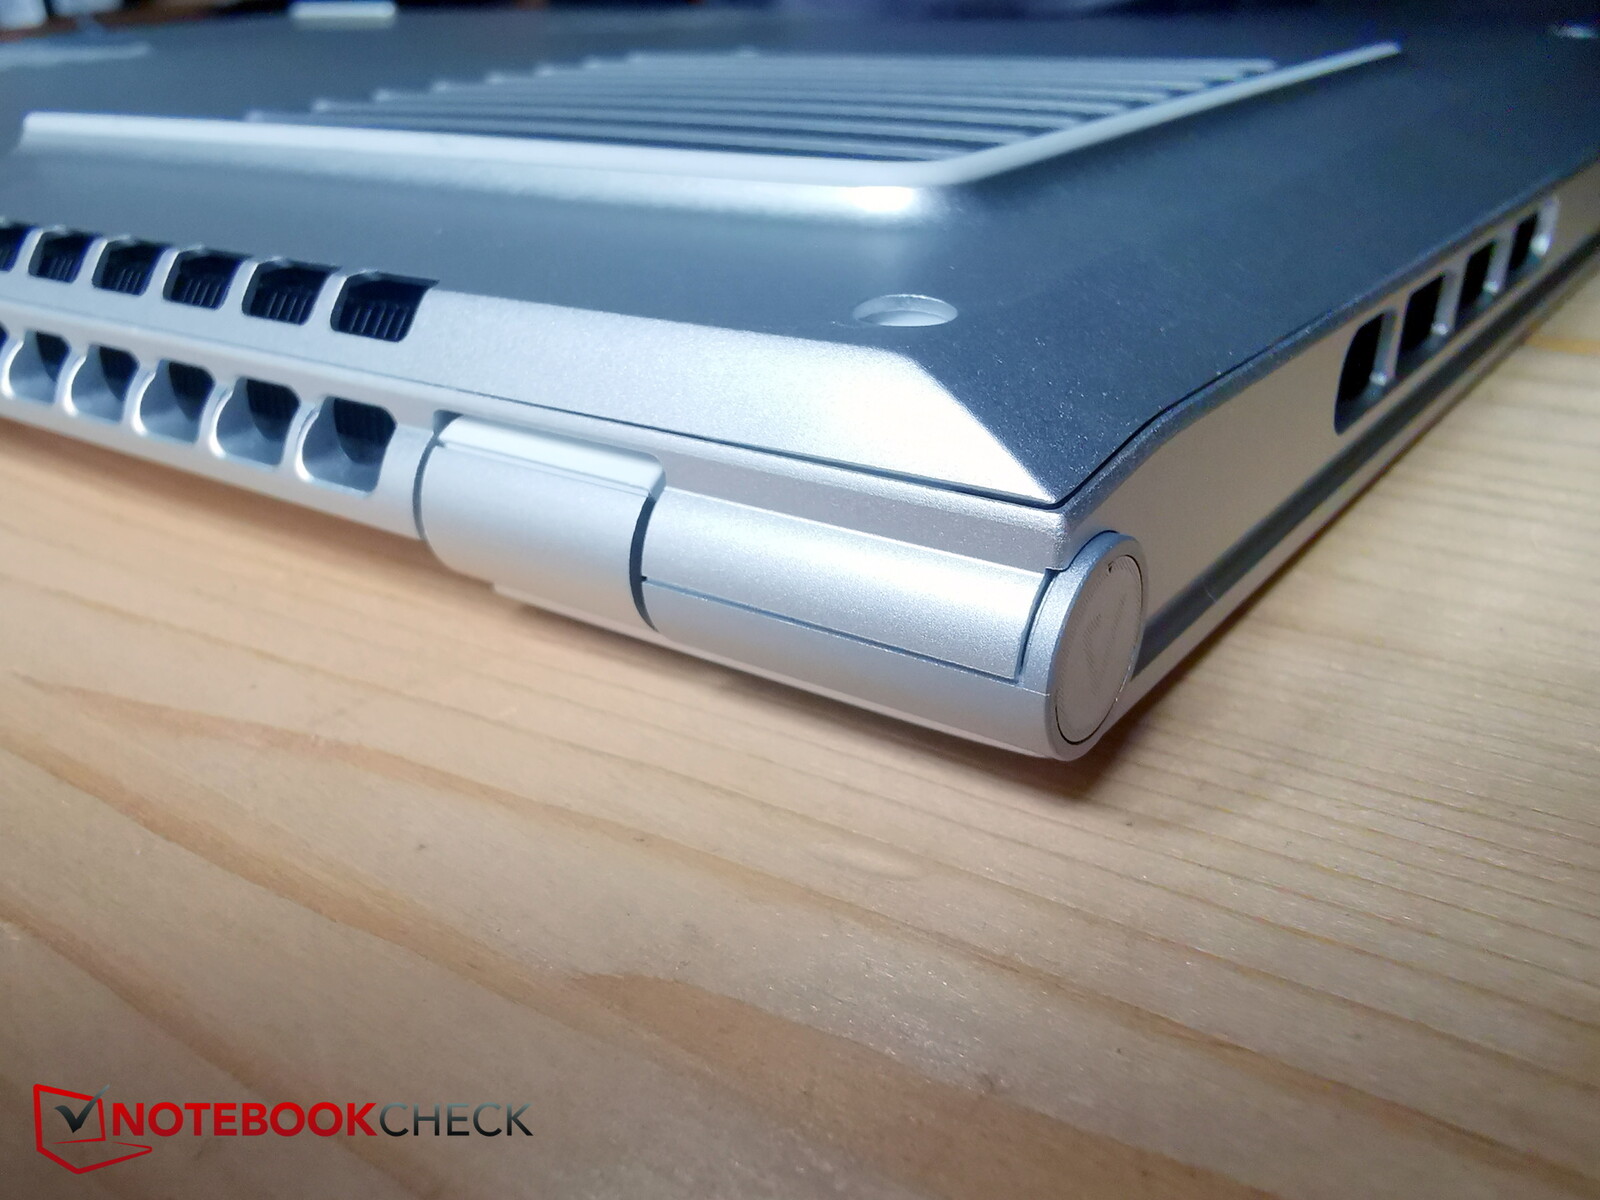
Na pierwszy rzut oka konstrukcja wydaje się być niezmieniona, ale po bliższym przyjrzeniu się widać, że wąska, srebrna, metalowa obudowa uległa sporym zmianom. Na przykład stała się jeszcze cieńsza, a Gigabyte wreszcie przesunął część portów na tył. Ogólnie rzecz biorąc, projekt producenta zmierza bardziej w kierunku laptopa biznesowo-biurowego niż gamingowego, co z pewnością ucieszy grupę docelową. Ukryty gamer wygląda więc dość niepozornie w warunkach biurowych, nawet obok MacBooka.
Gładkie metalowe unibody jest nadal stabilne, zwłaszcza u podstawy, którą trudno wykręcić. Klawiatura została nieco obniżona.
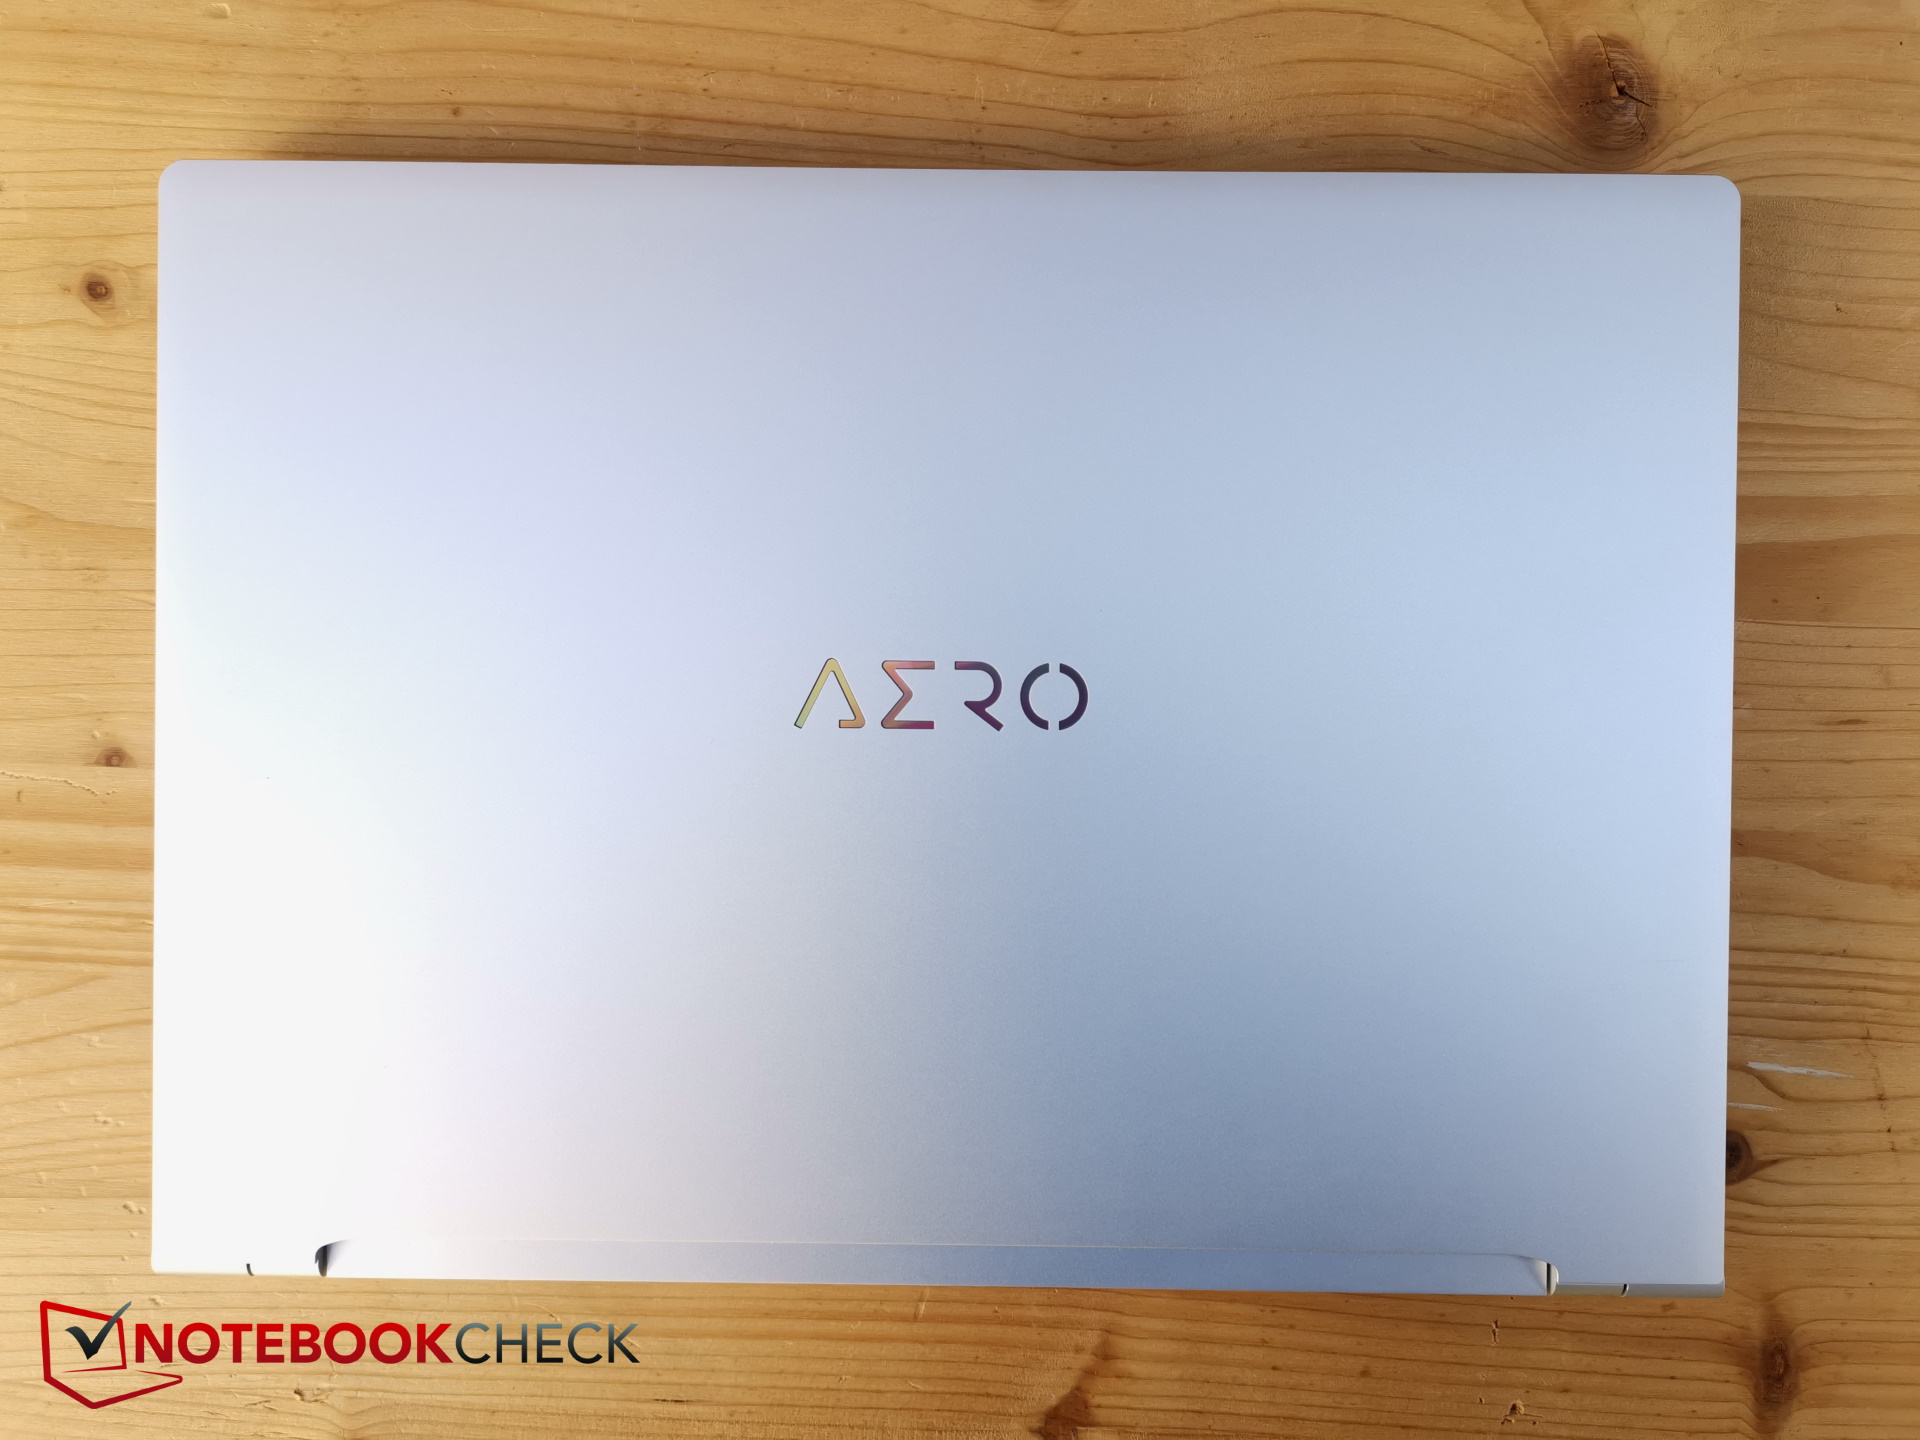
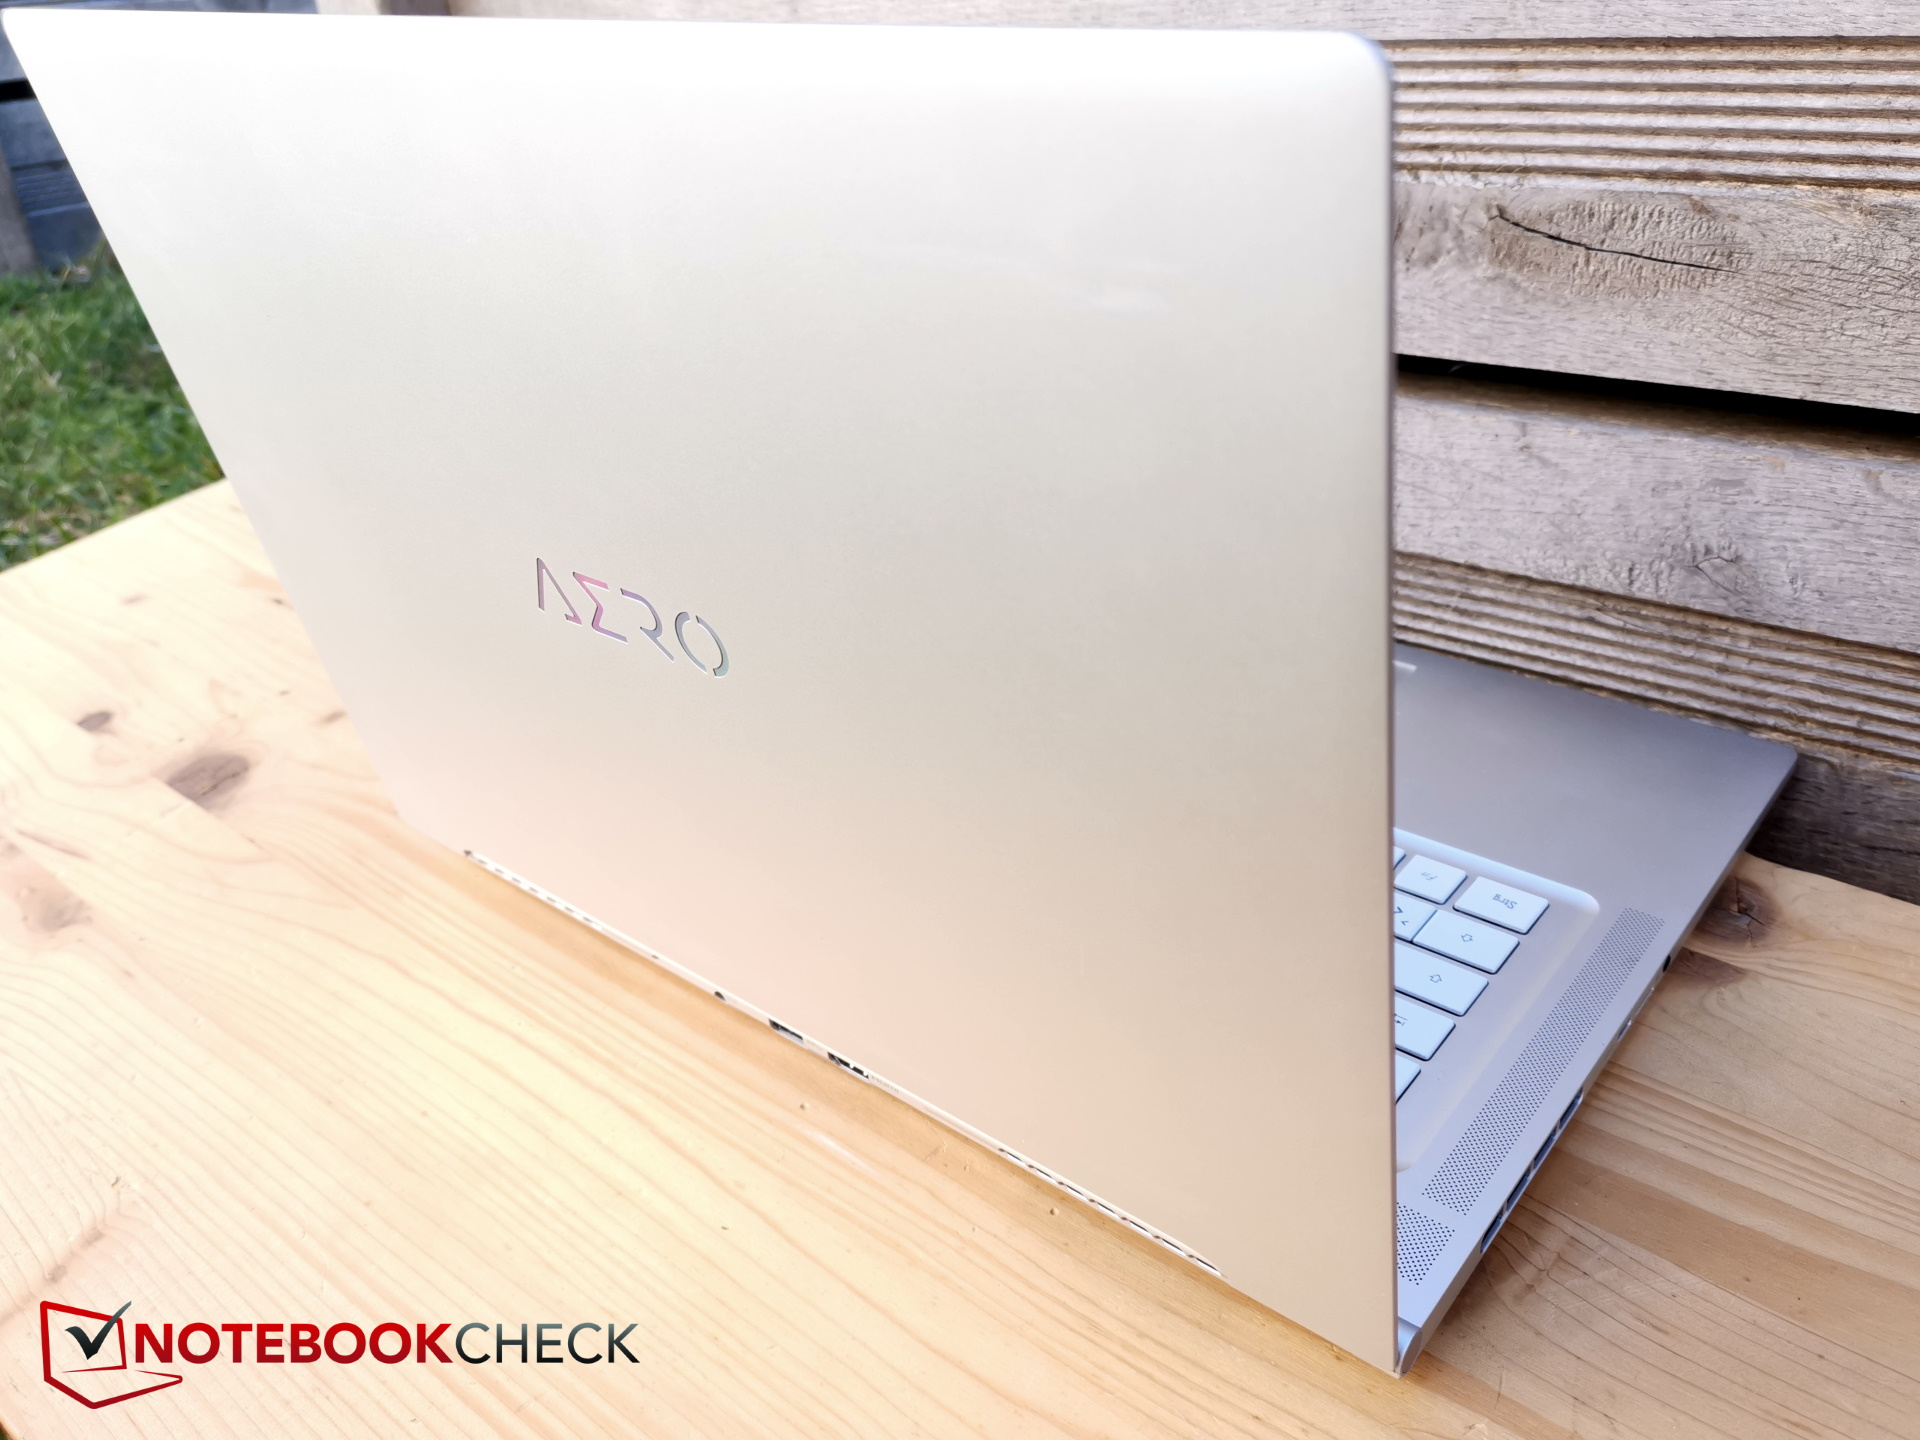
Pokrywa wyświetlacza, na której widnieje podświetlane logo "Aero", jest nieco mniej sztywna. Jedynie ramka wyświetlacza jest wykonana z tworzywa sztucznego.
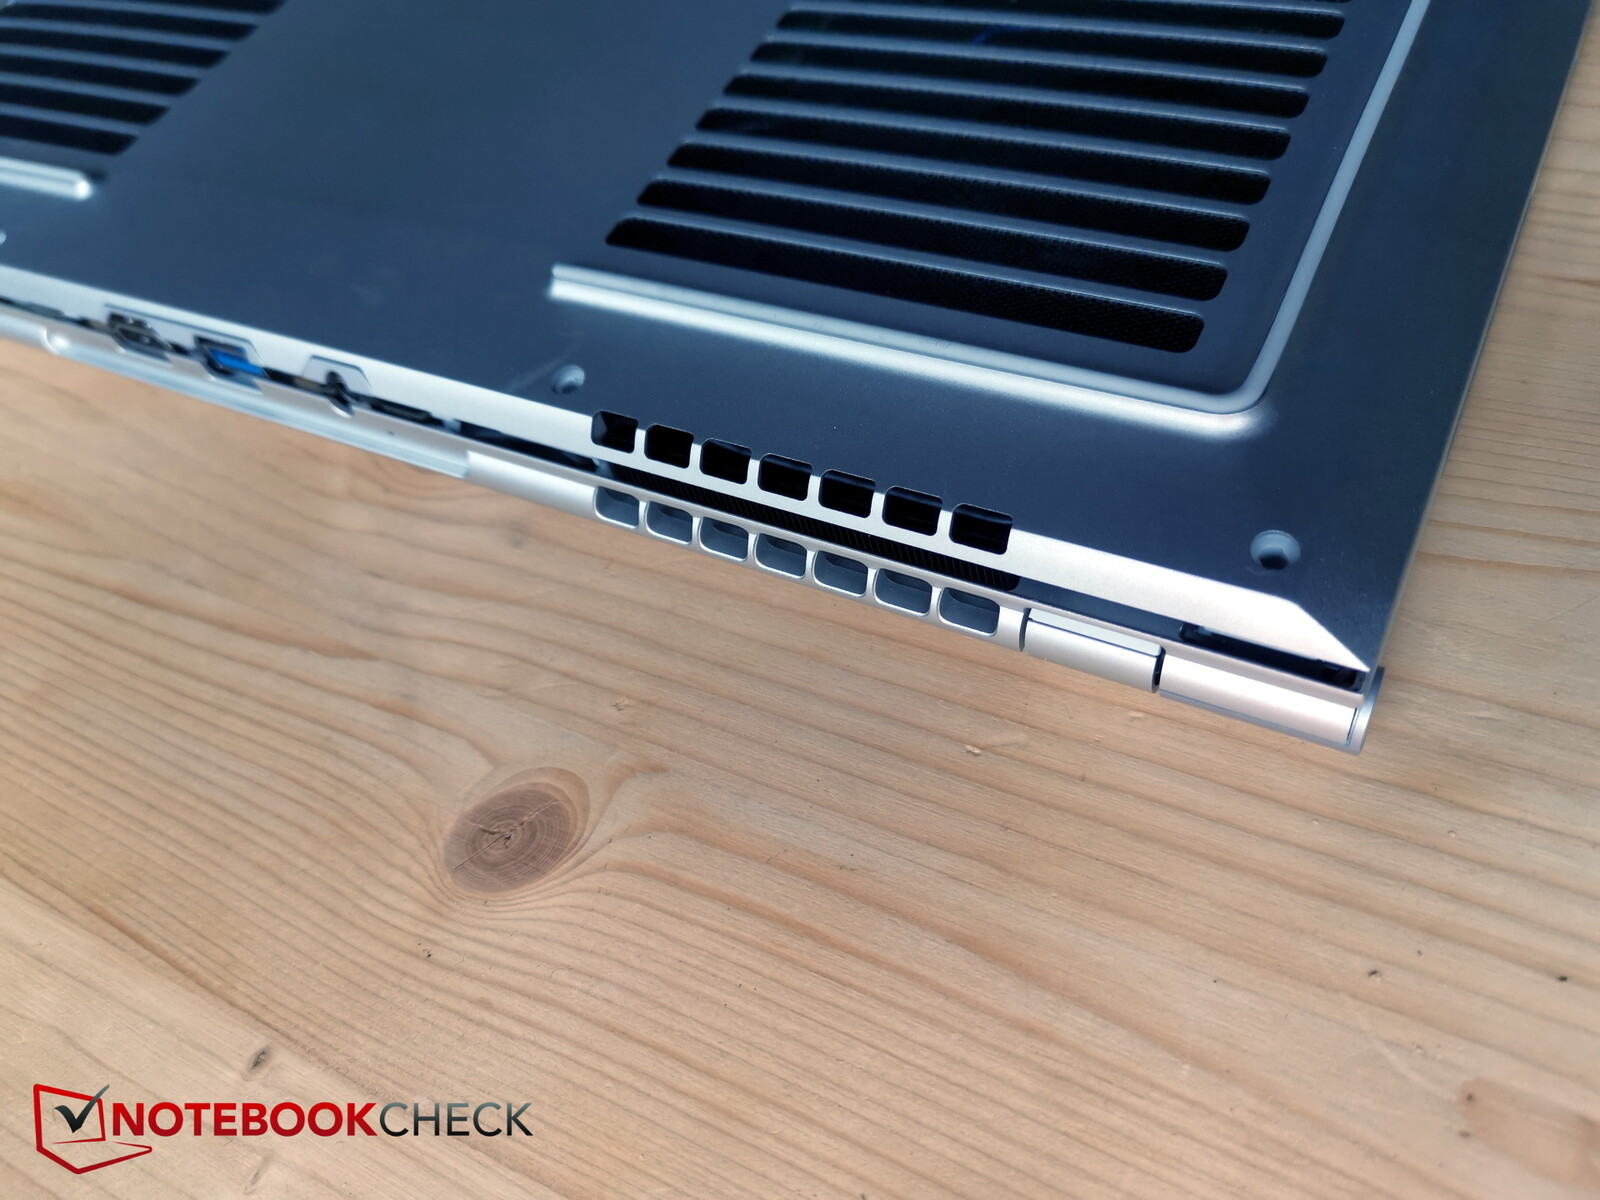
Kratki wentylacyjne są praktycznie wszędzie, czyli z tyłu, po bokach, poniżej i powyżej. Jakość wykonania wydaje się być na dobrym poziomie i nie stwierdzono żadnych braków.

Przy zaledwie 18 mm, Aero 16 jest nieco cieńszy odZenBook Pro 16X lub MSI CreatorPro Z16Pjest też lżejszy - poprzednik ważył o 200 g więcej.
Wyposażenie - Aero 16 z portami nareszcie!
W portach sporo się zmieniło, na szczęście, bo mizerne trzy porty USB-C poprzednika trzeba było rozbudowywać za pomocą Aero Hubu o HDMI, USB-A itd.
W tym roku nowe Aero mieści niemal wszystkie niezbędne porty. Aby to zrobić, wykorzystuje przestrzeń z tyłu, gdzie znajduje się na przykład złącze sieciowe. Wolelibyśmy USB-A zamiast jednego z trzech portów USB-C z boku, nadal brakuje też portu LAN, ale przynajmniej jest teraz port HDMI i czytnik (microSD). Rozmieszczenie portów jest dobre, z wyjątkiem USB-A z tyłu zamiast na boku.


Czytnik kart SD
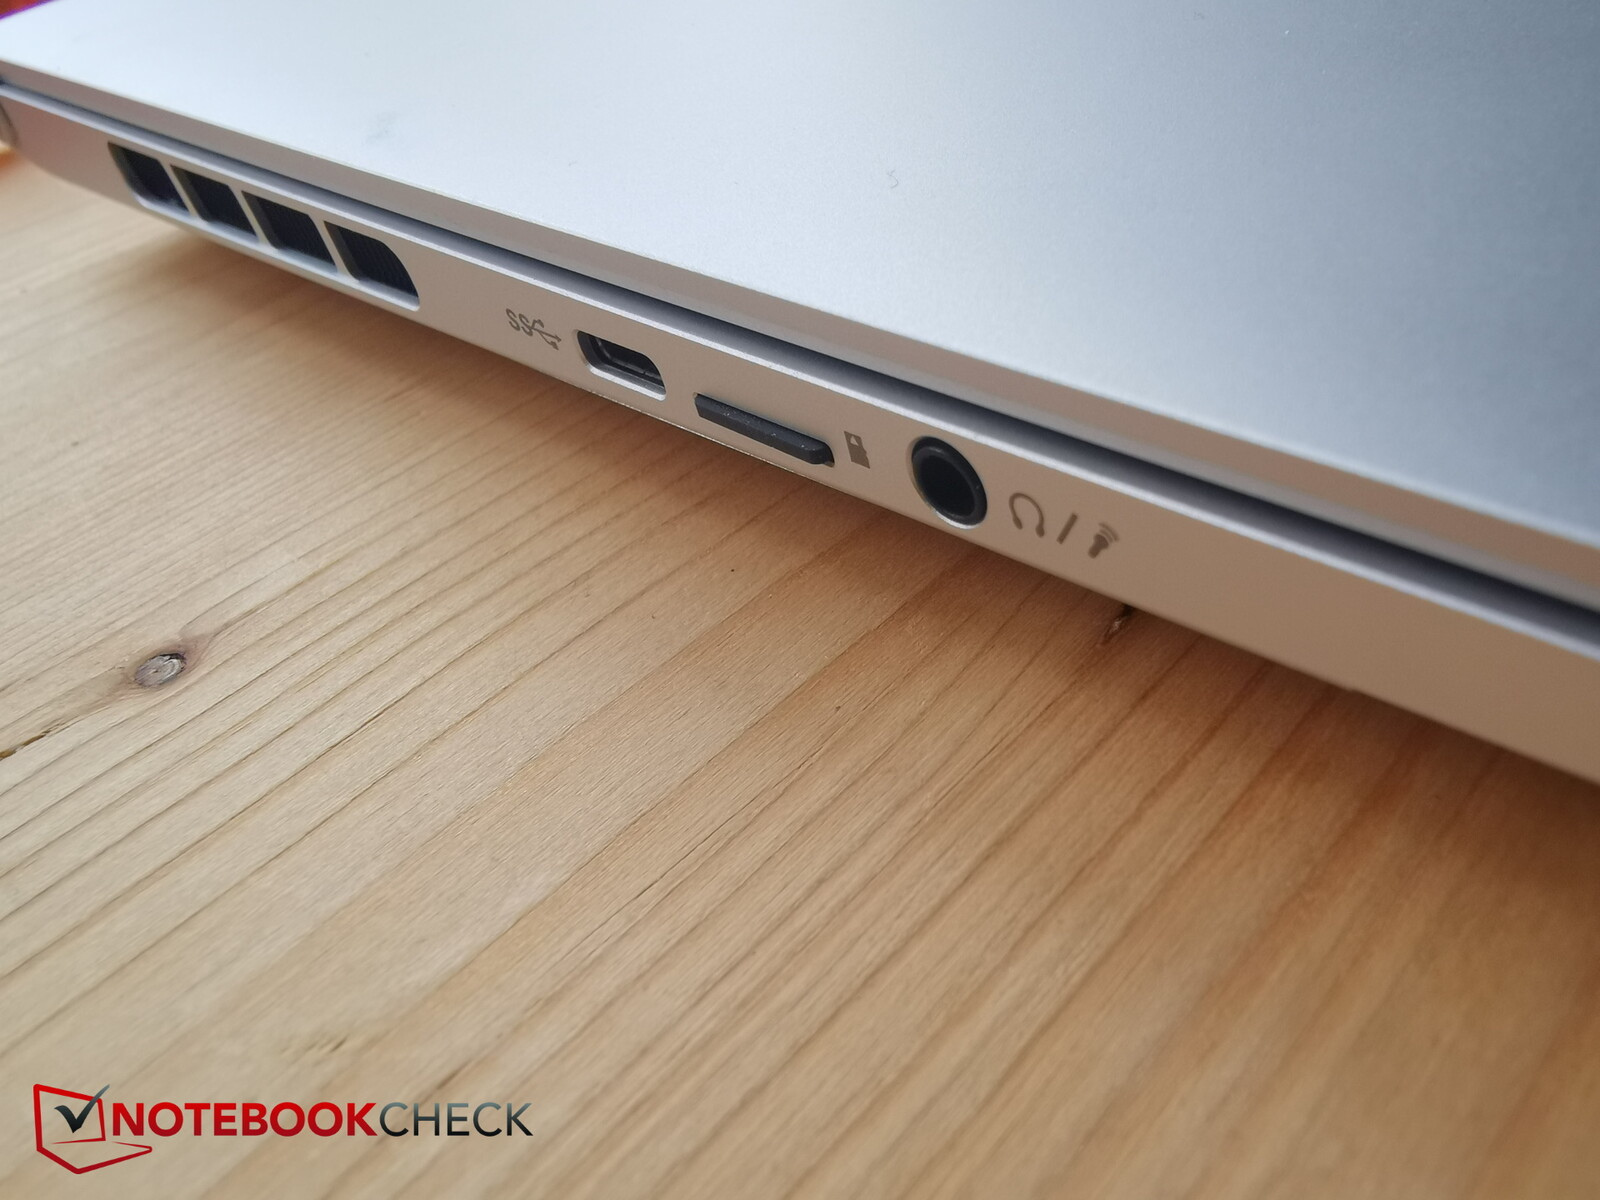
Karty microSD wchodzą na miejsce i wystają tylko minimalnie (1 - 2 mm).
Szybkość transferu jest dobra; skopiowaliśmy 1 GB materiału zdjęciowego z naszego AV PRO microSD 128 GB V60 na pulpit w około 7 sekund.
Jeśli konkurenci mają w ogóle czytnik, to jest on wolniejszy.
| SD Card Reader | |
| average JPG Copy Test (av. of 3 runs) | |
| Razer Blade 18 RTX 4070 (Angelibird AV Pro V60) | |
| Gigabyte AERO 16 OLED BSF | |
| Średnia w klasie Gaming (20.9 - 210, n=54, ostatnie 2 lata) | |
| MSI CreatorPro Z16P B12UKST (AV Pro V60) | |
| Asus ZenBook Pro 16X OLED UX7602ZM-ME115W (AV Pro SD microSD 128 GB V60) | |
| maximum AS SSD Seq Read Test (1GB) | |
| Razer Blade 18 RTX 4070 (Angelibird AV Pro V60) | |
| Gigabyte AERO 16 OLED BSF | |
| Średnia w klasie Gaming (25.5 - 261, n=51, ostatnie 2 lata) | |
| MSI CreatorPro Z16P B12UKST (AV Pro V60) | |
| Asus ZenBook Pro 16X OLED UX7602ZM-ME115W (AV Pro SD microSD 128 GB V60) | |
Komunikacja
Układ Intel AX210 został zainstalowany również w zeszłorocznym modelu i ponownie zapewnia dobre prędkości transferu, choć...MSI CreatorPro jest jeszcze szybszy.
Moduł obsługuje Wifi 6E, a więc pasmo 6 GHz.
Kamera internetowa
Gigabyte w końcu zainstalował w laptopie kreatywnym kamerkę Full HD, a uzyskany obraz jest całkiem użyteczny, nawet w nieoptymalnych warunkach oświetleniowych. Spojrzenie na ColorChecker pokazuje jednak niestety, że kolory mocno odbiegają od normy. Poprzednik posiadał kamerkę 720p.


Bezpieczeństwo
Aero nie jest raczej dla fanatyków bezpieczeństwa. Na pokładzie jest TPM, ale nie ma czujnika linii papilarnych ani złącza Kensington.
Akcesoria i gwarancja
Wraz z laptopem przy zakupie nie są dołączane żadne akcesoria.
W Niemczech producent udziela 24-miesięcznej gwarancji. W innych regionach może się ona różnić, więc zainteresowani nabywcy powinni się dwukrotnie upewnić przed zakupem.
Konserwacja
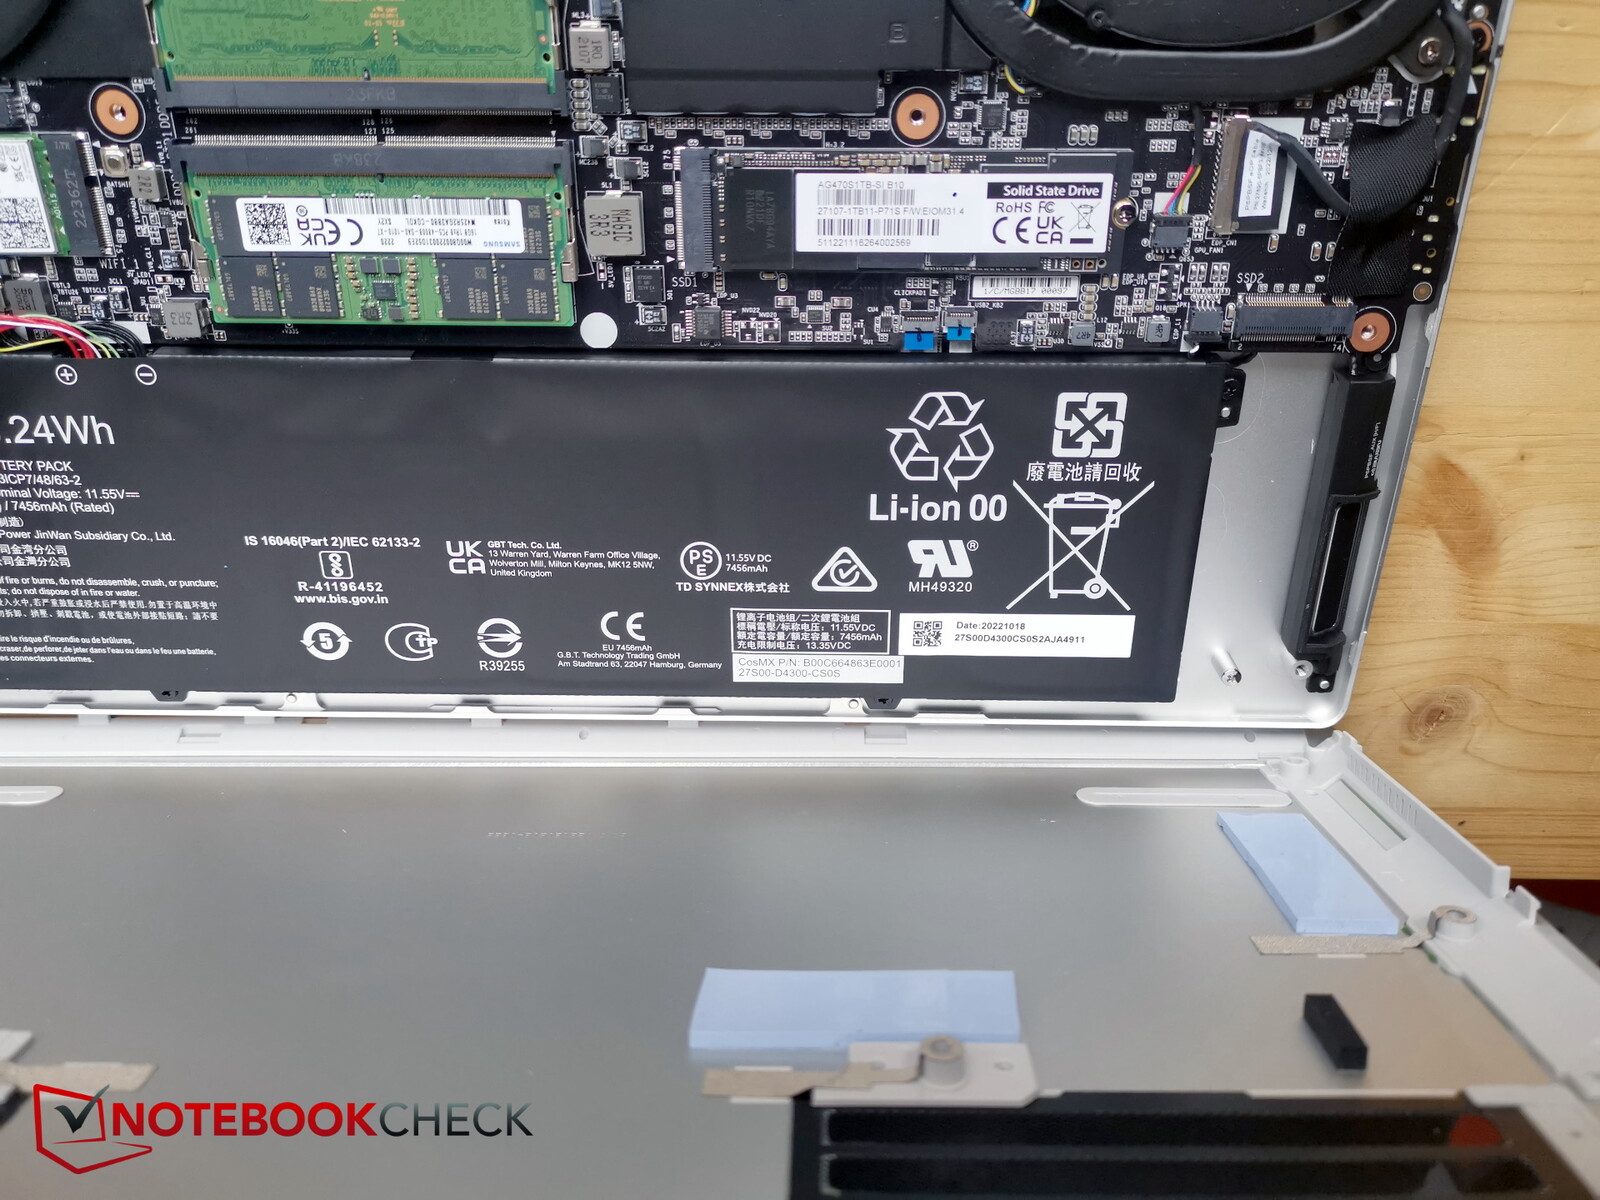
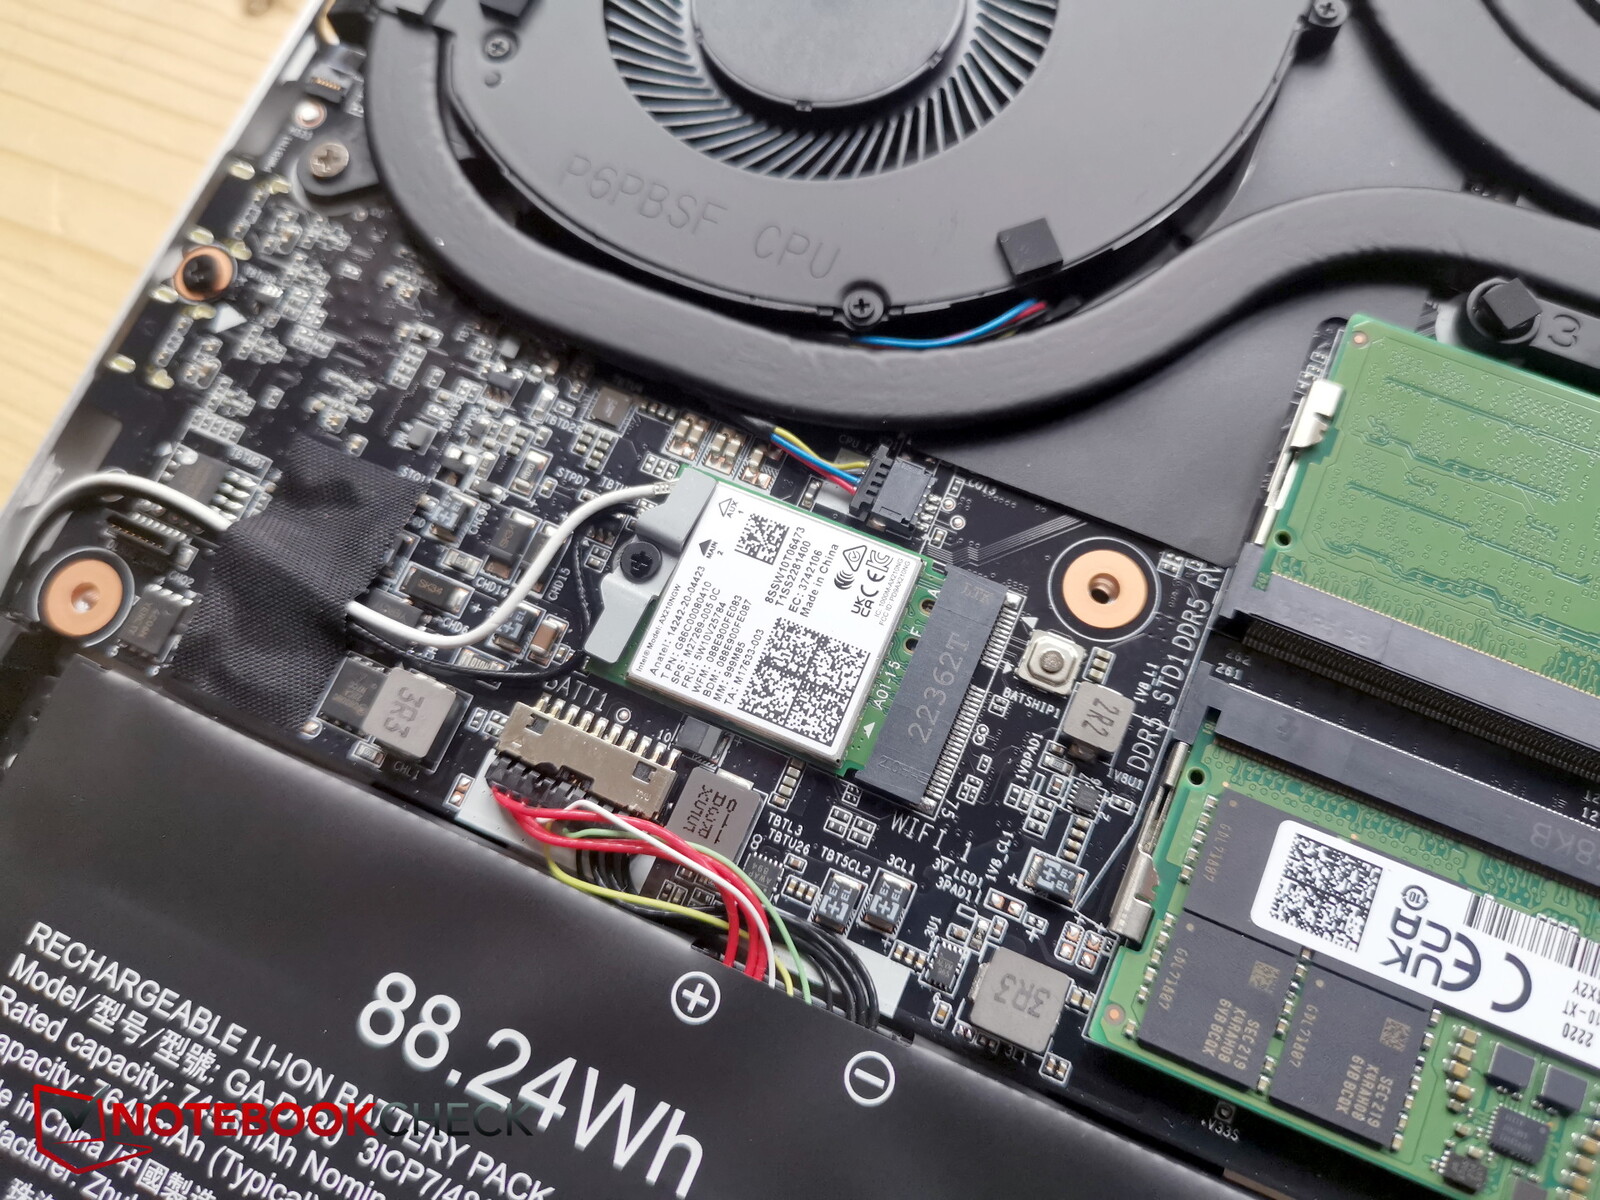
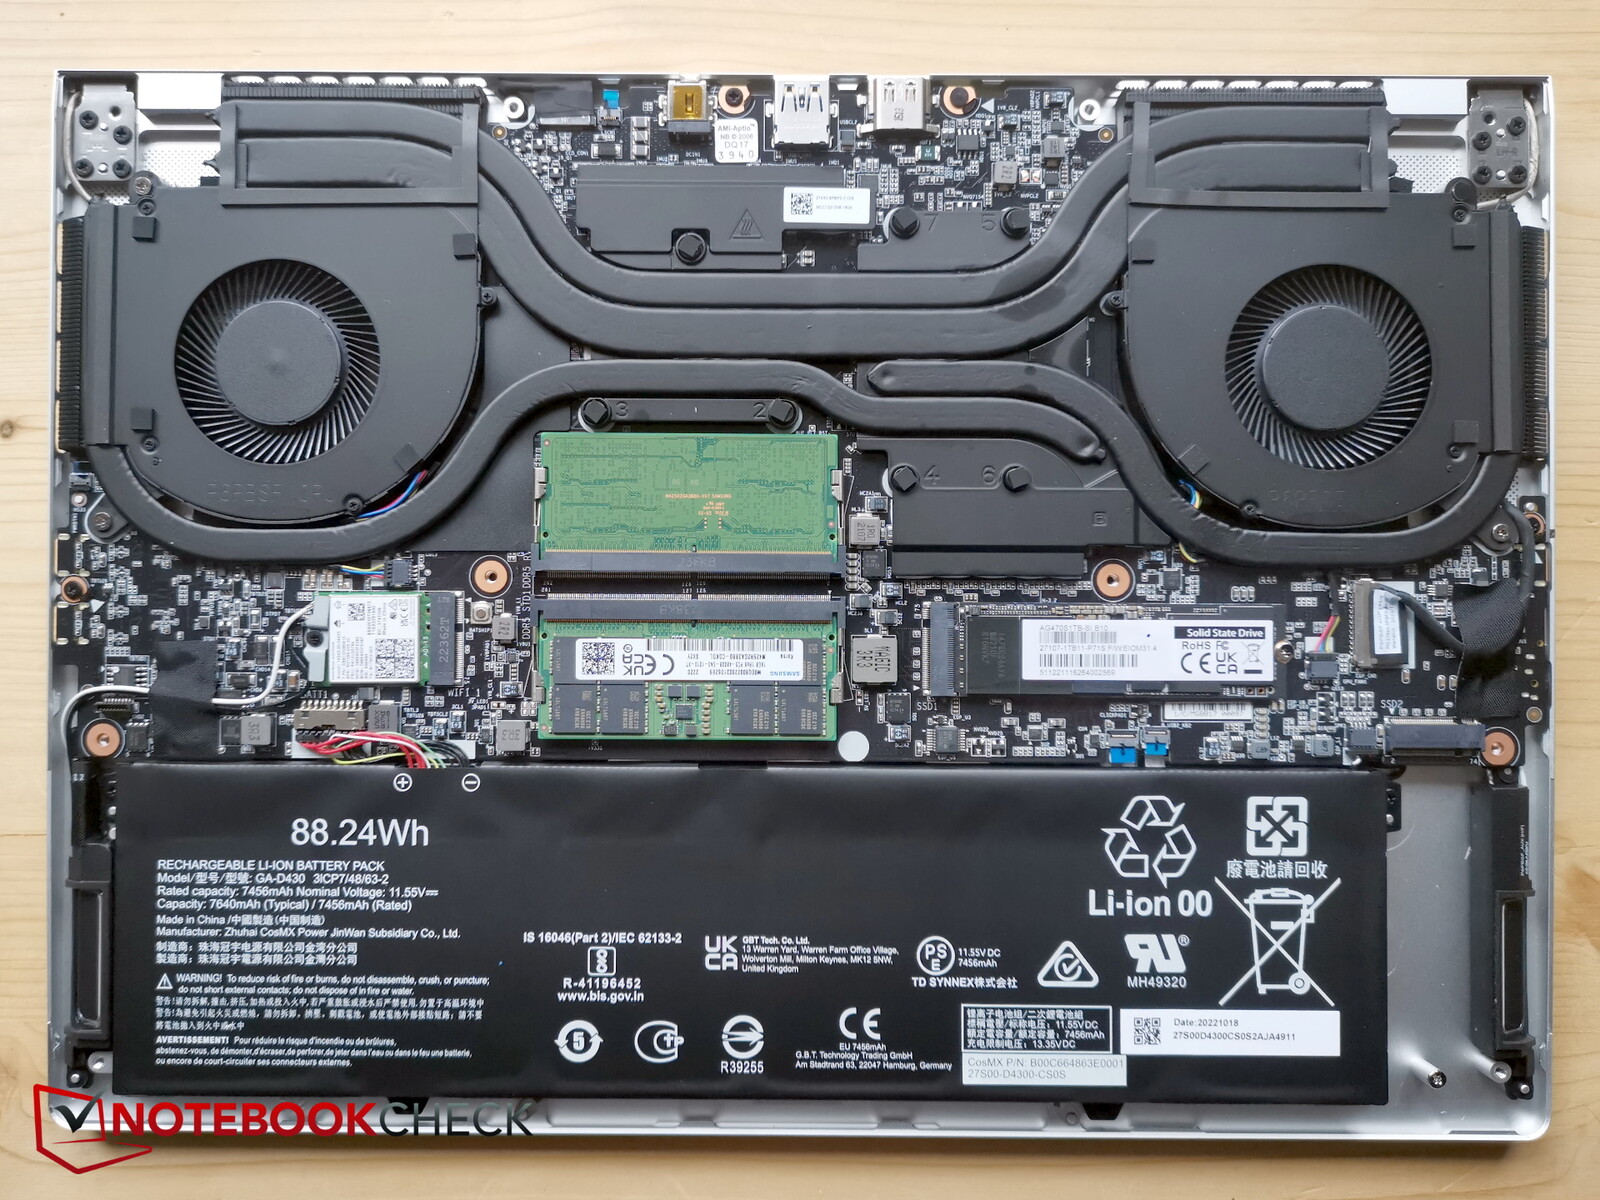
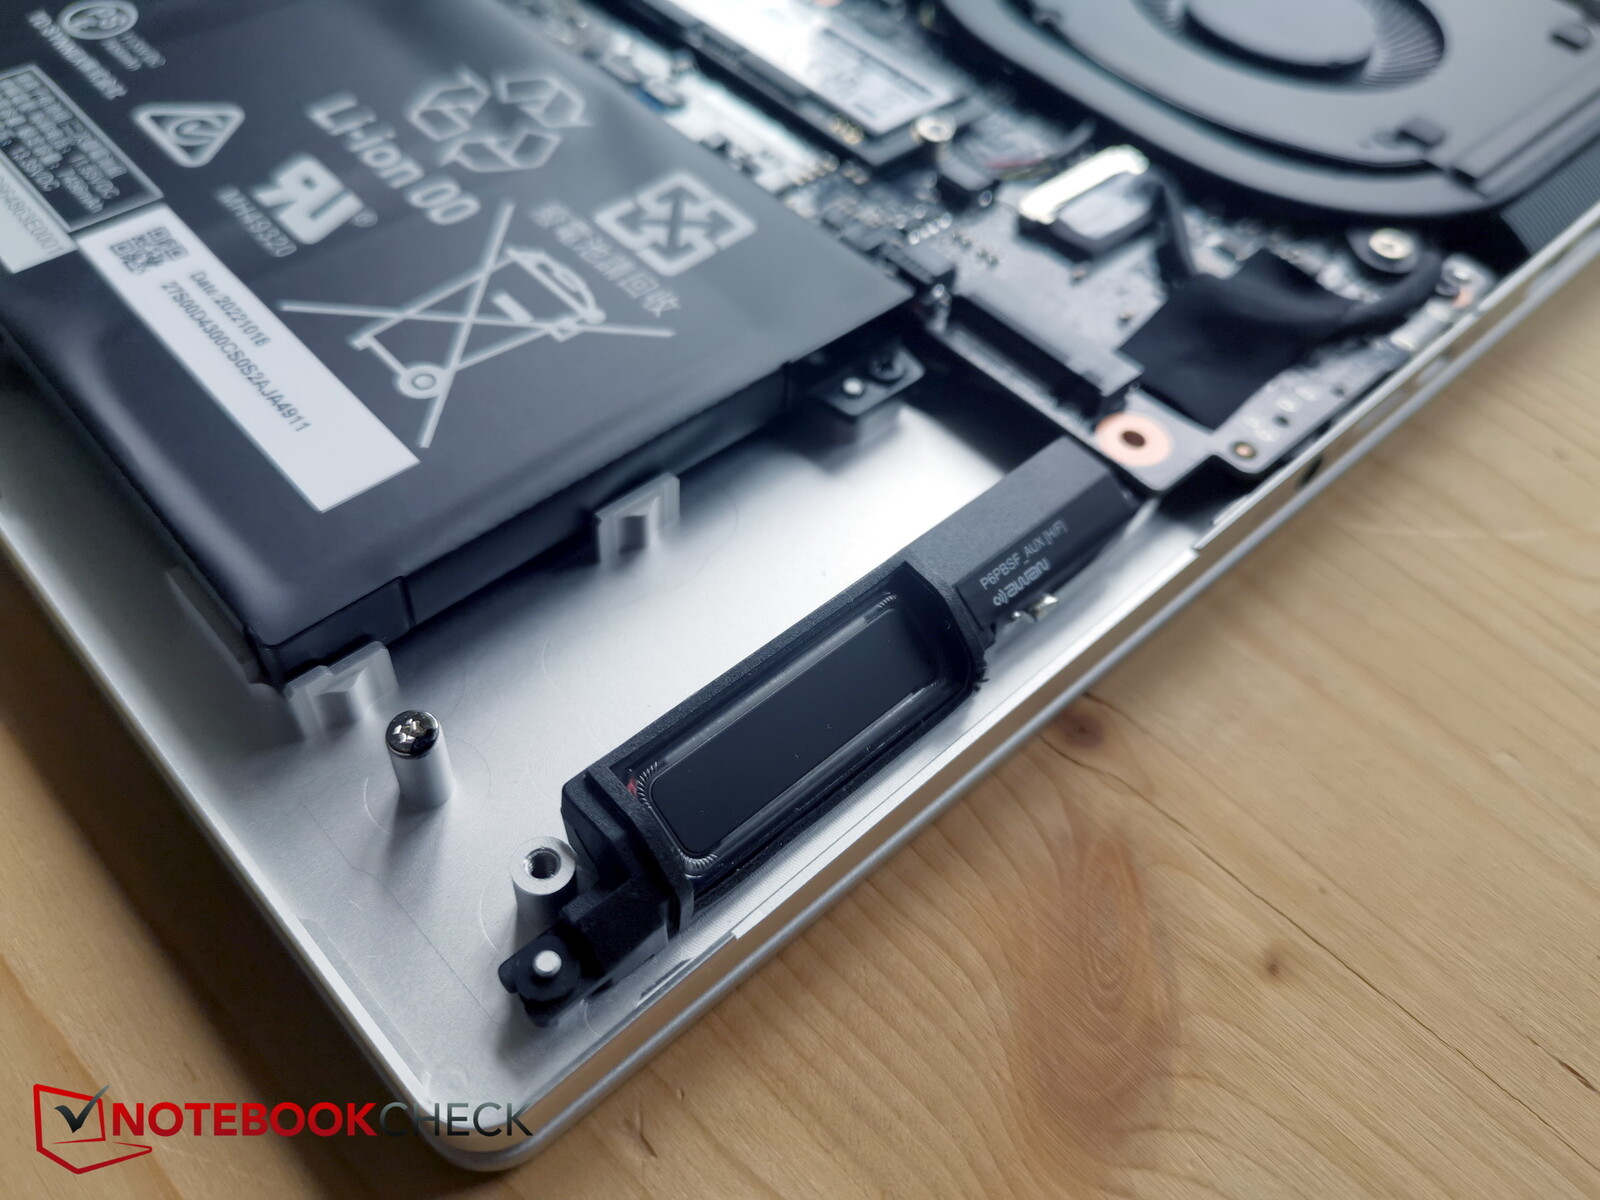
Najpierw trzeba wykręcić 10 śrub torx. Potem znalezienie w ciasnym chassis szczeliny do włożenia narzędzi poziomych nie jest takie proste. Najlepiej zrobić to w kierunku tyłu. Po wykonaniu pierwszego kroku staje się to znacznie łatwiejsze i baseplate można odłączyć dość bez wysiłku.
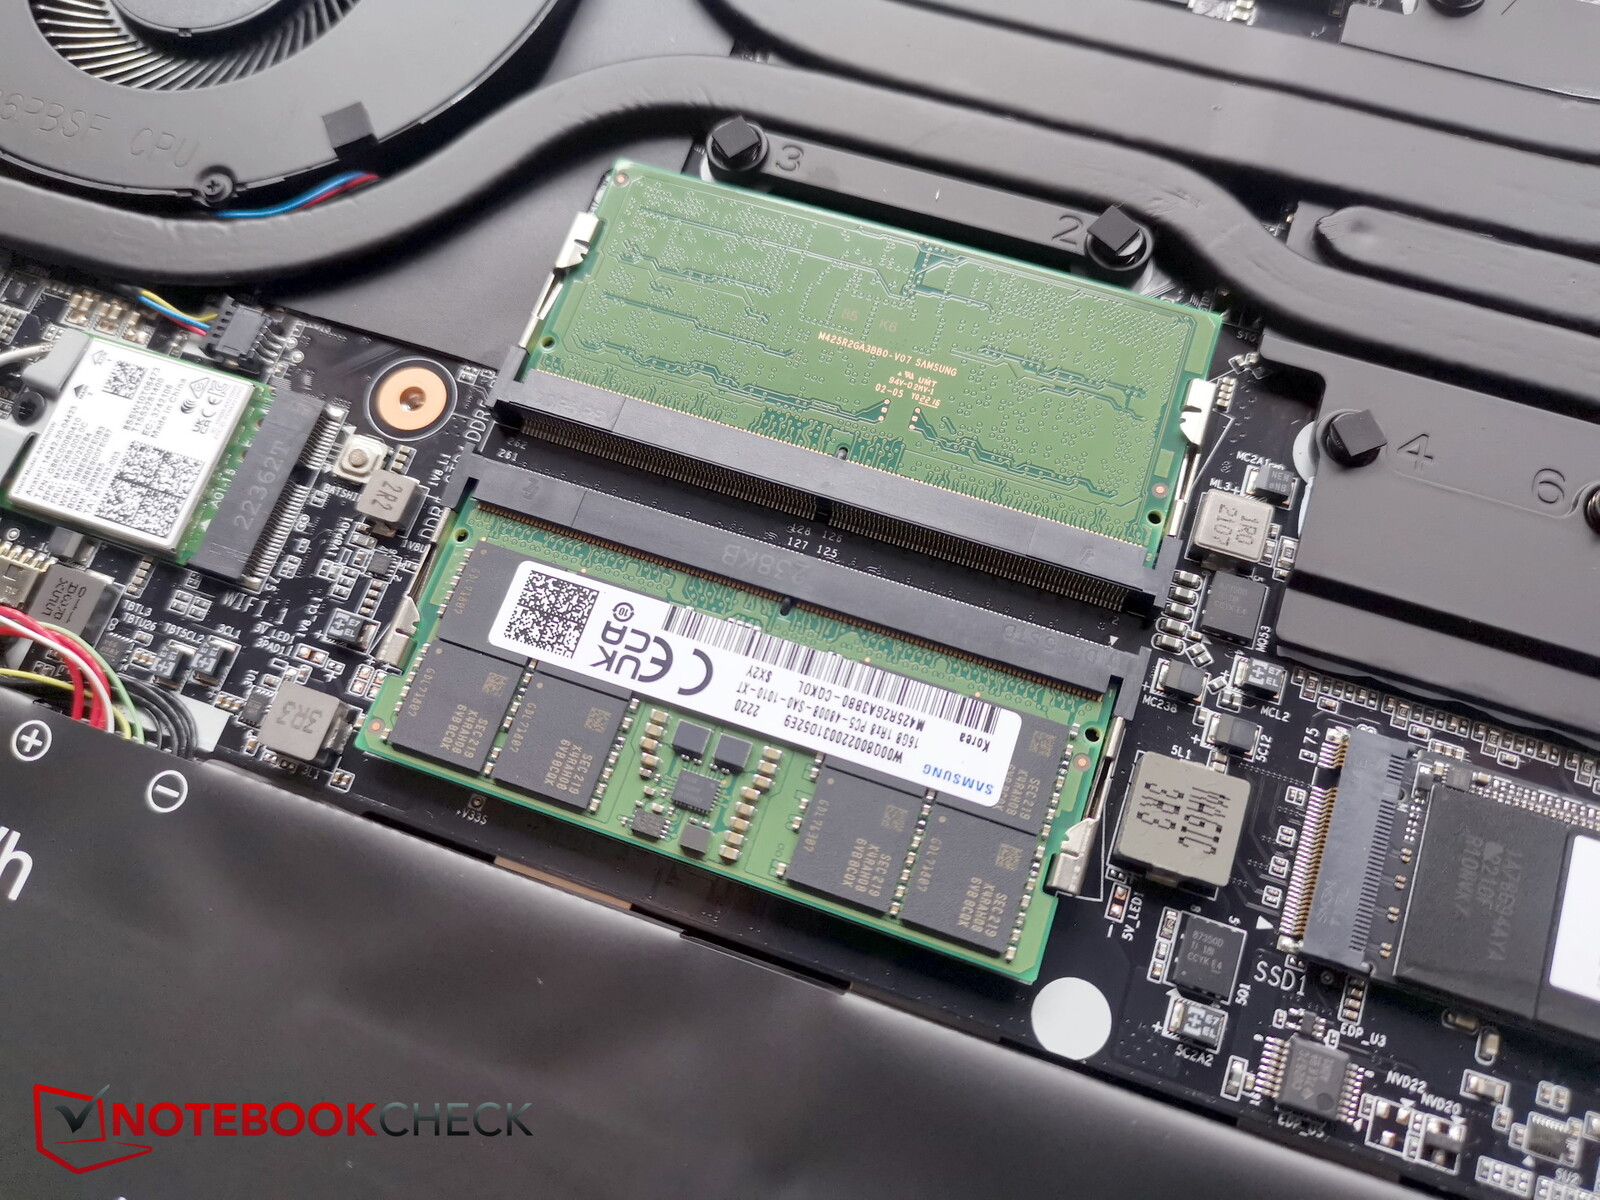
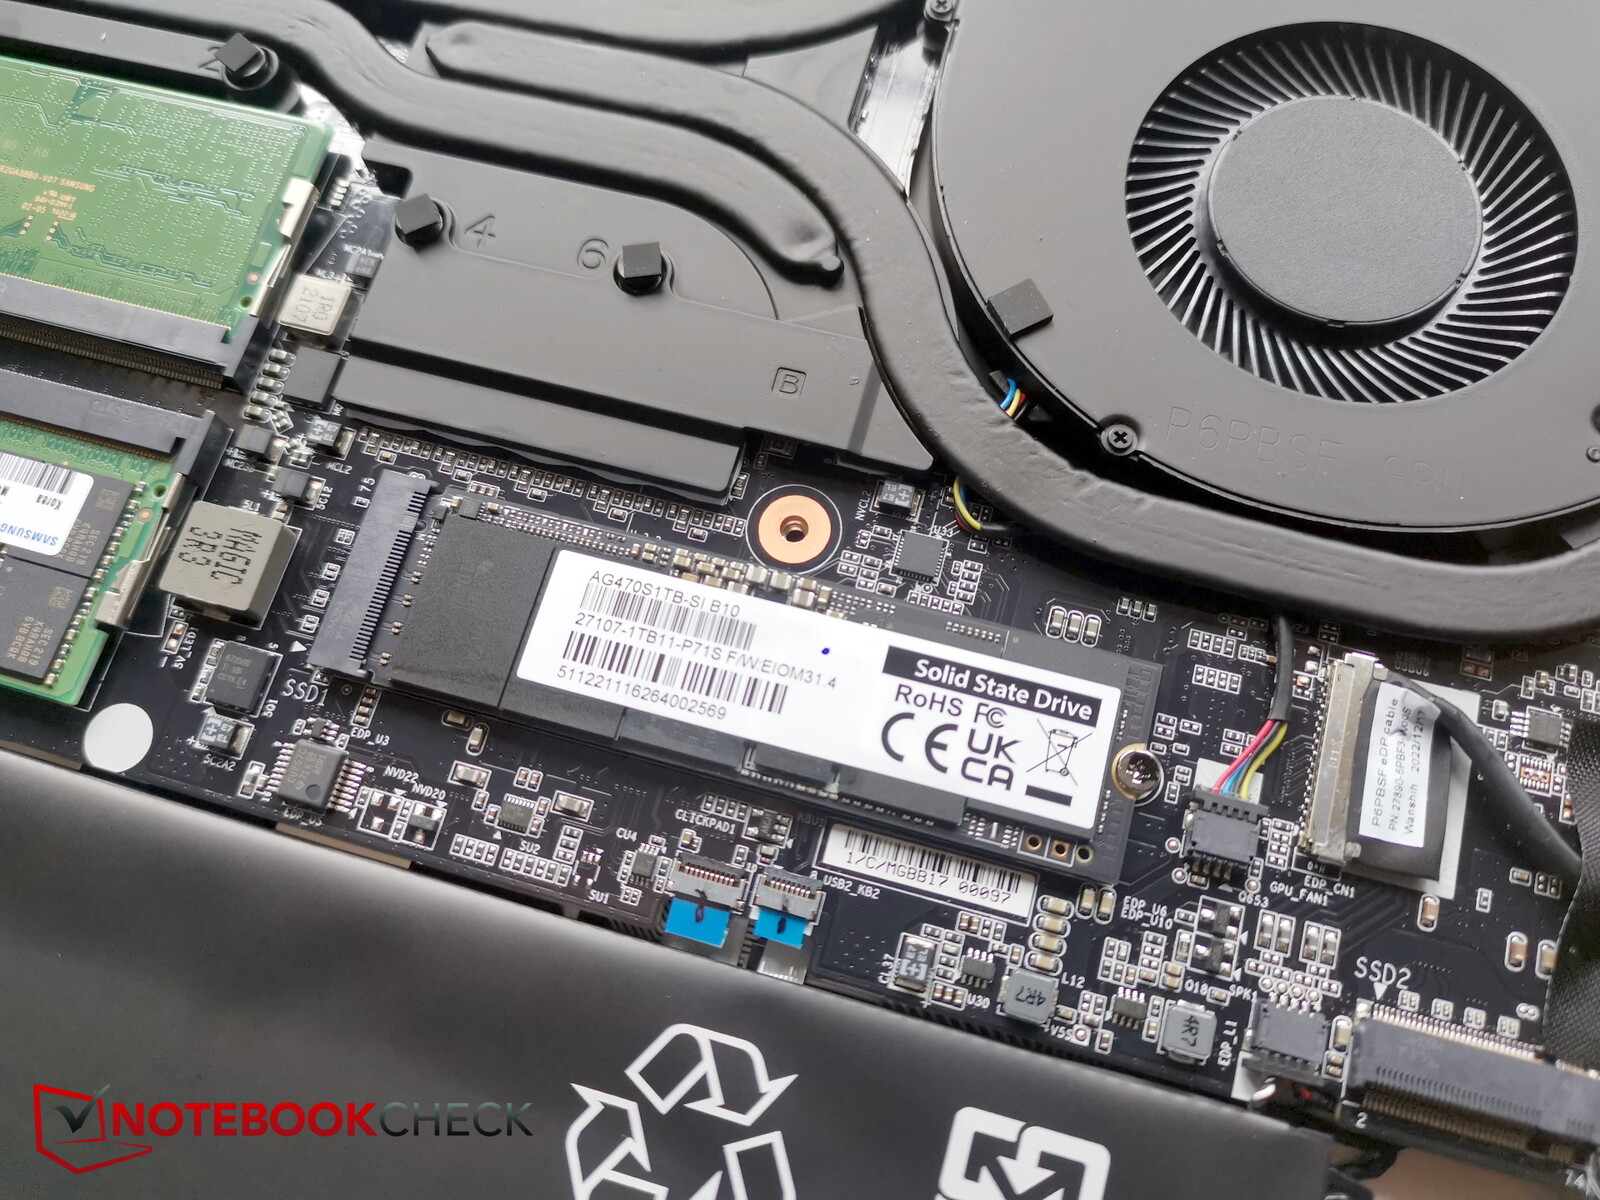
Wewnątrz mamy dostęp do wentylatorów, akumulatora, wymiennego modułu WLAN, dwóch gniazd pamięci RAM i dwóch gniazd na dyski SSD M.2, z których jedno jest zajęte. Na płycie spodniej znajdują się podkładki chłodzące pod dwa gniazda SSD.
Urządzenia wejściowe - Wejścia użytkowe
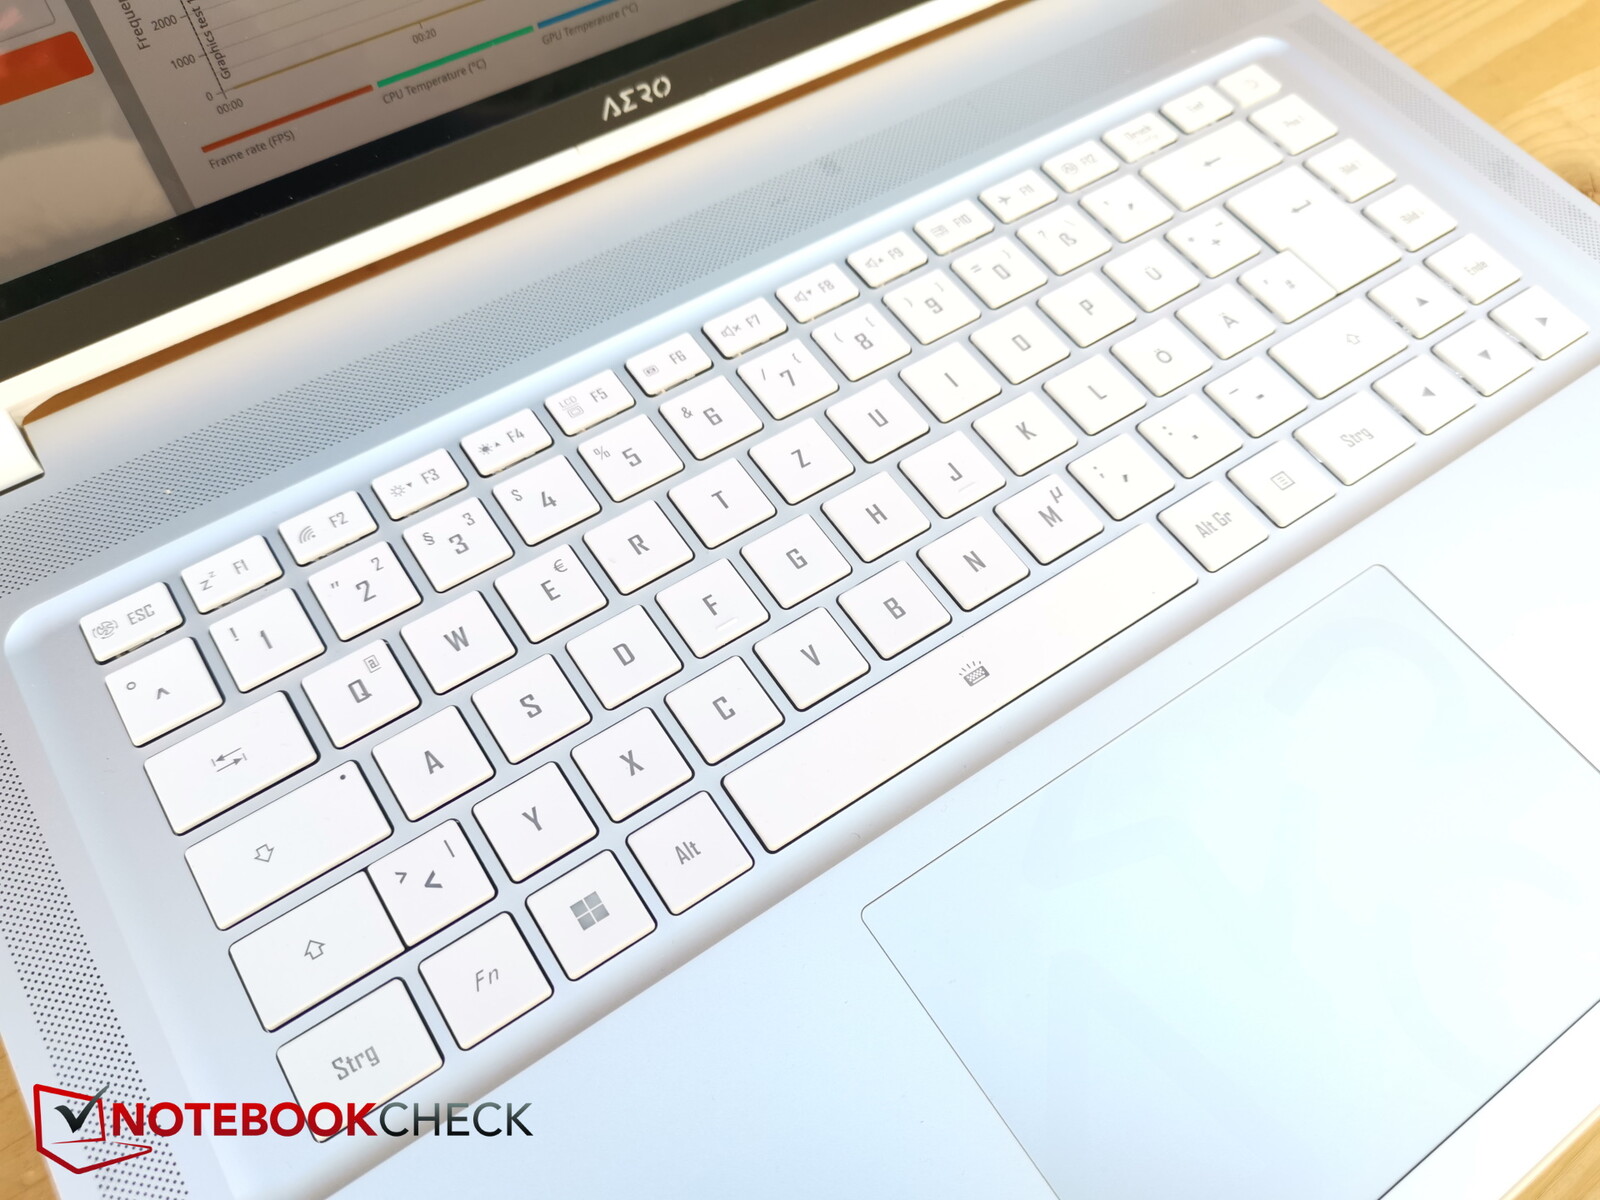
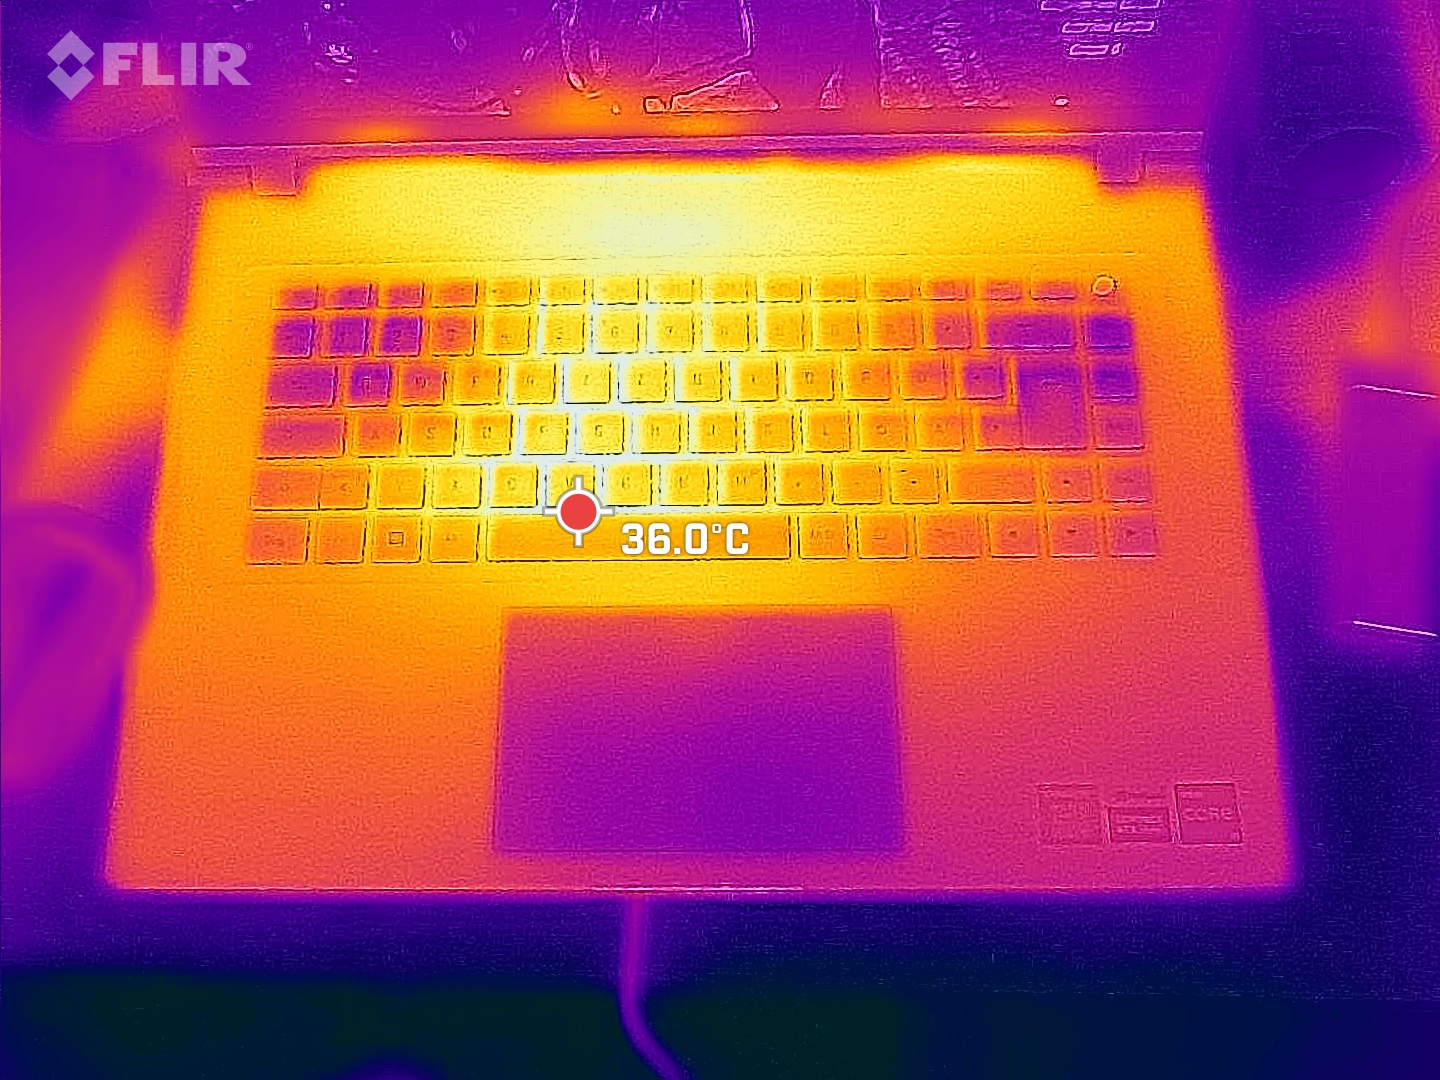
Klawiatura
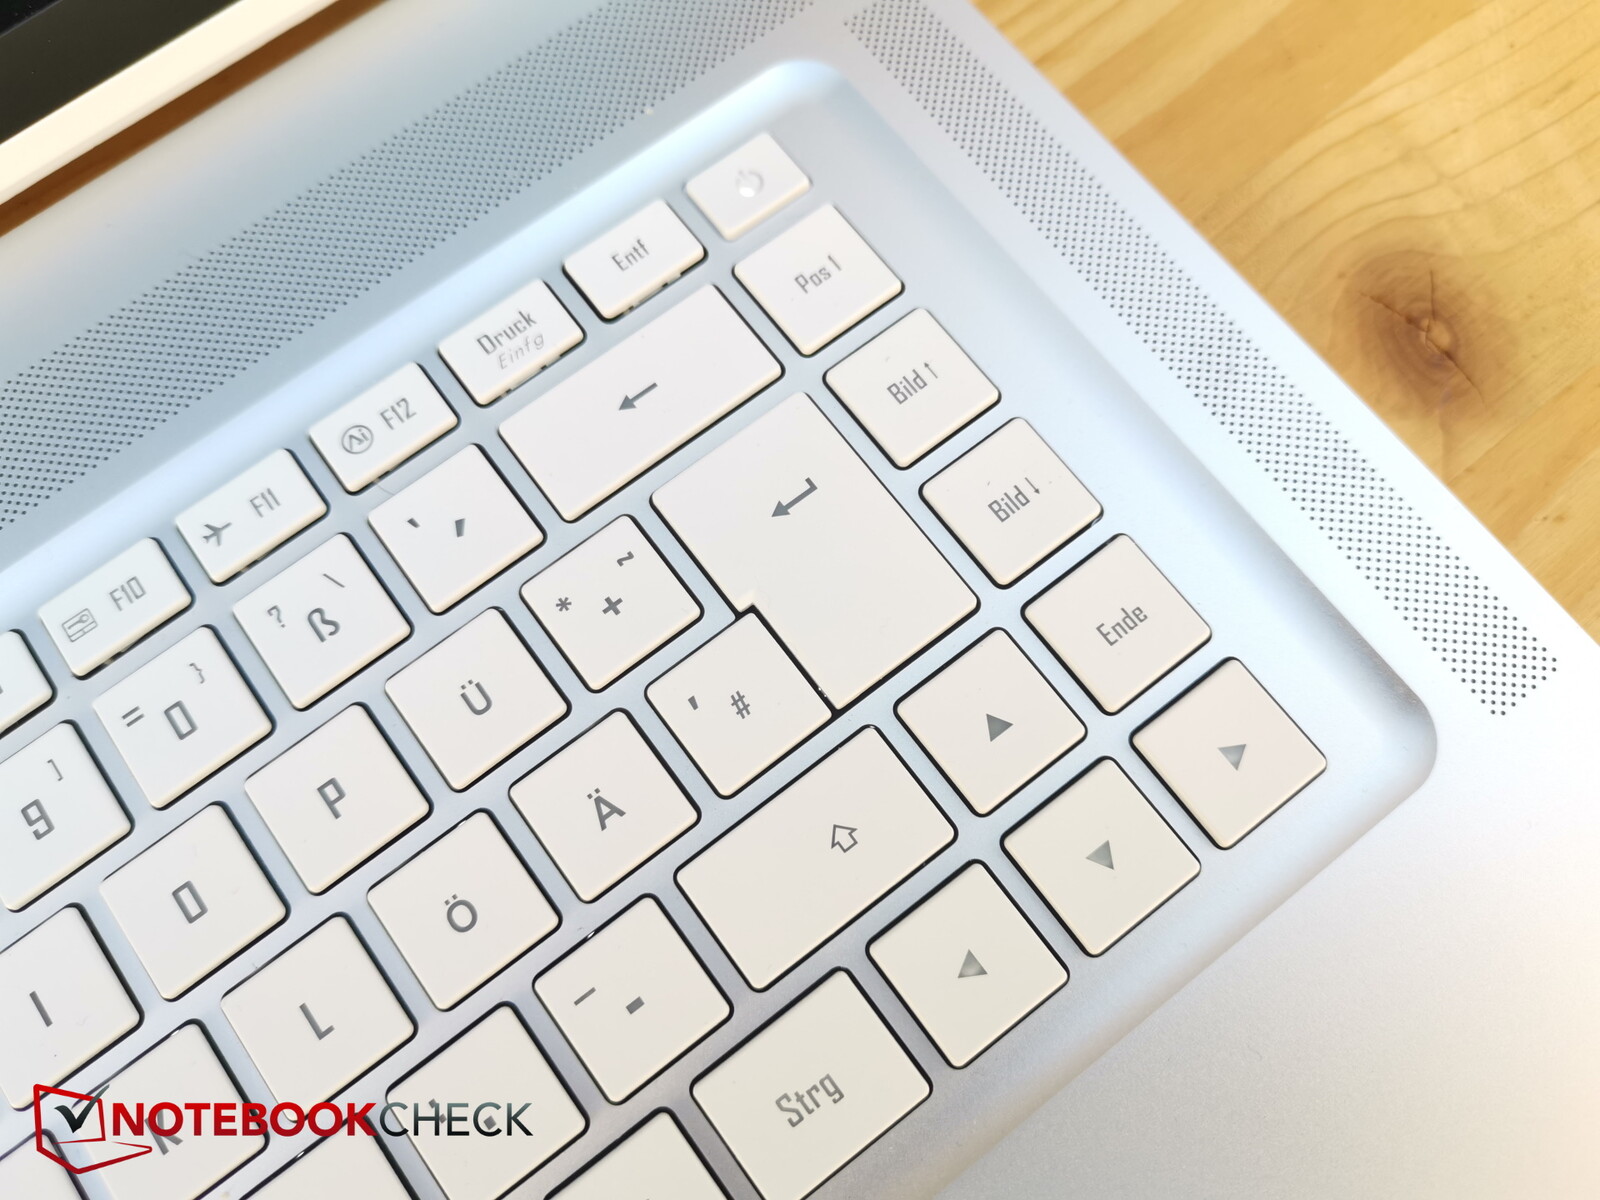
Klawiatura ma teraz białe zamiast czarnych klawiszy. Wygląda to bardziej elegancko, ale należy powstrzymać się od włączania białego podświetlenia klawiatury w jasnym oświetleniu, bo inaczej nie będziemy w stanie rozróżnić napisów - ale kto to robi?

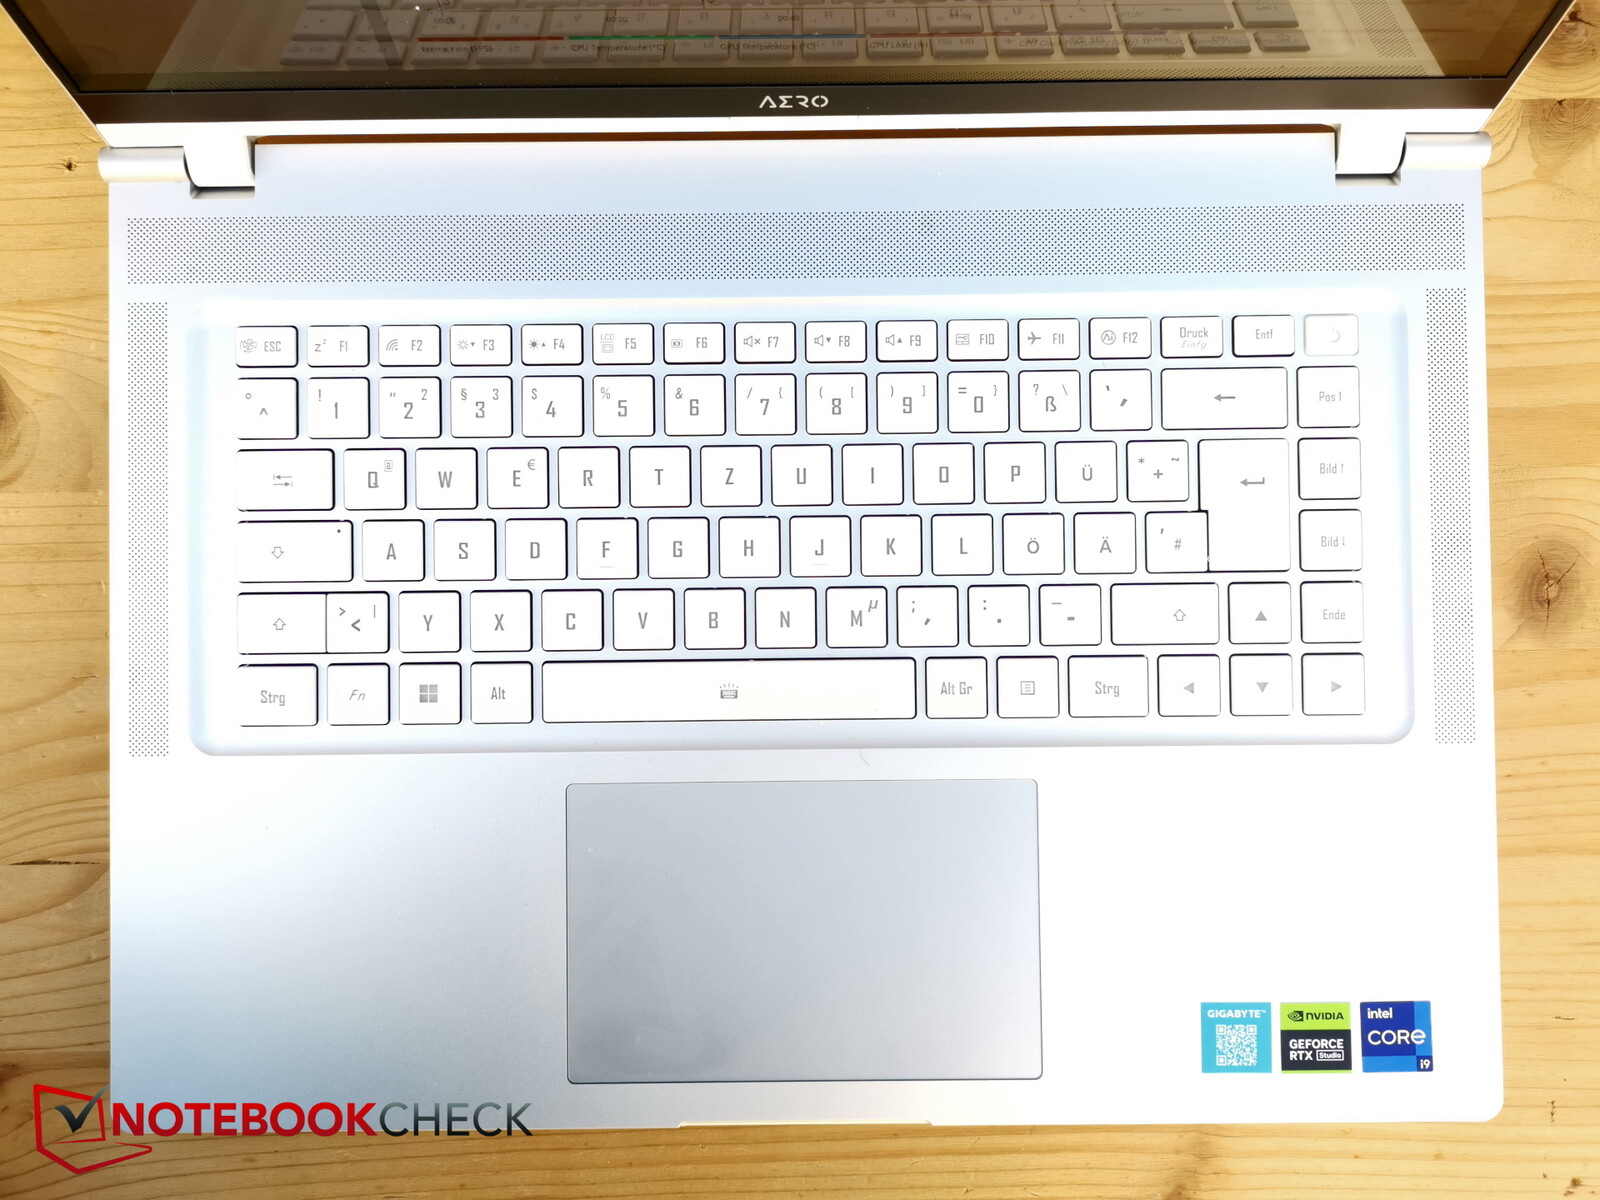
Układ graficzny wygląda bardzo porządnie. Żaden z klawiszy nie wydaje się nie na miejscu, a nawet klawisze strzałek są normalnej wielkości - bardzo dobrze. Klawisze są średniej wielkości i są dobrze rozstawione.
Skok klawiszy wynosi około 1,7 mm, a sprzężenie zwrotne jest ledwie wyczuwalne. Pisanie jest szybkie, a hałas umiarkowany, ale spacja jest trochę głośniejsza.
Choć włącznik jest zintegrowany z prawym górnym rogiem klawiatury, ma on dużo twardszy punkt nacisku i jest nieco mniejszy, dzięki czemu nie jest tak łatwo go przypadkowo nacisnąć. W laptopach Gigabyte klawisze specjalne jasności (tu dalej po lewej) i głośności (tu dalej po prawej) są zwykle zamienione, co wymaga pewnego przyzwyczajenia.
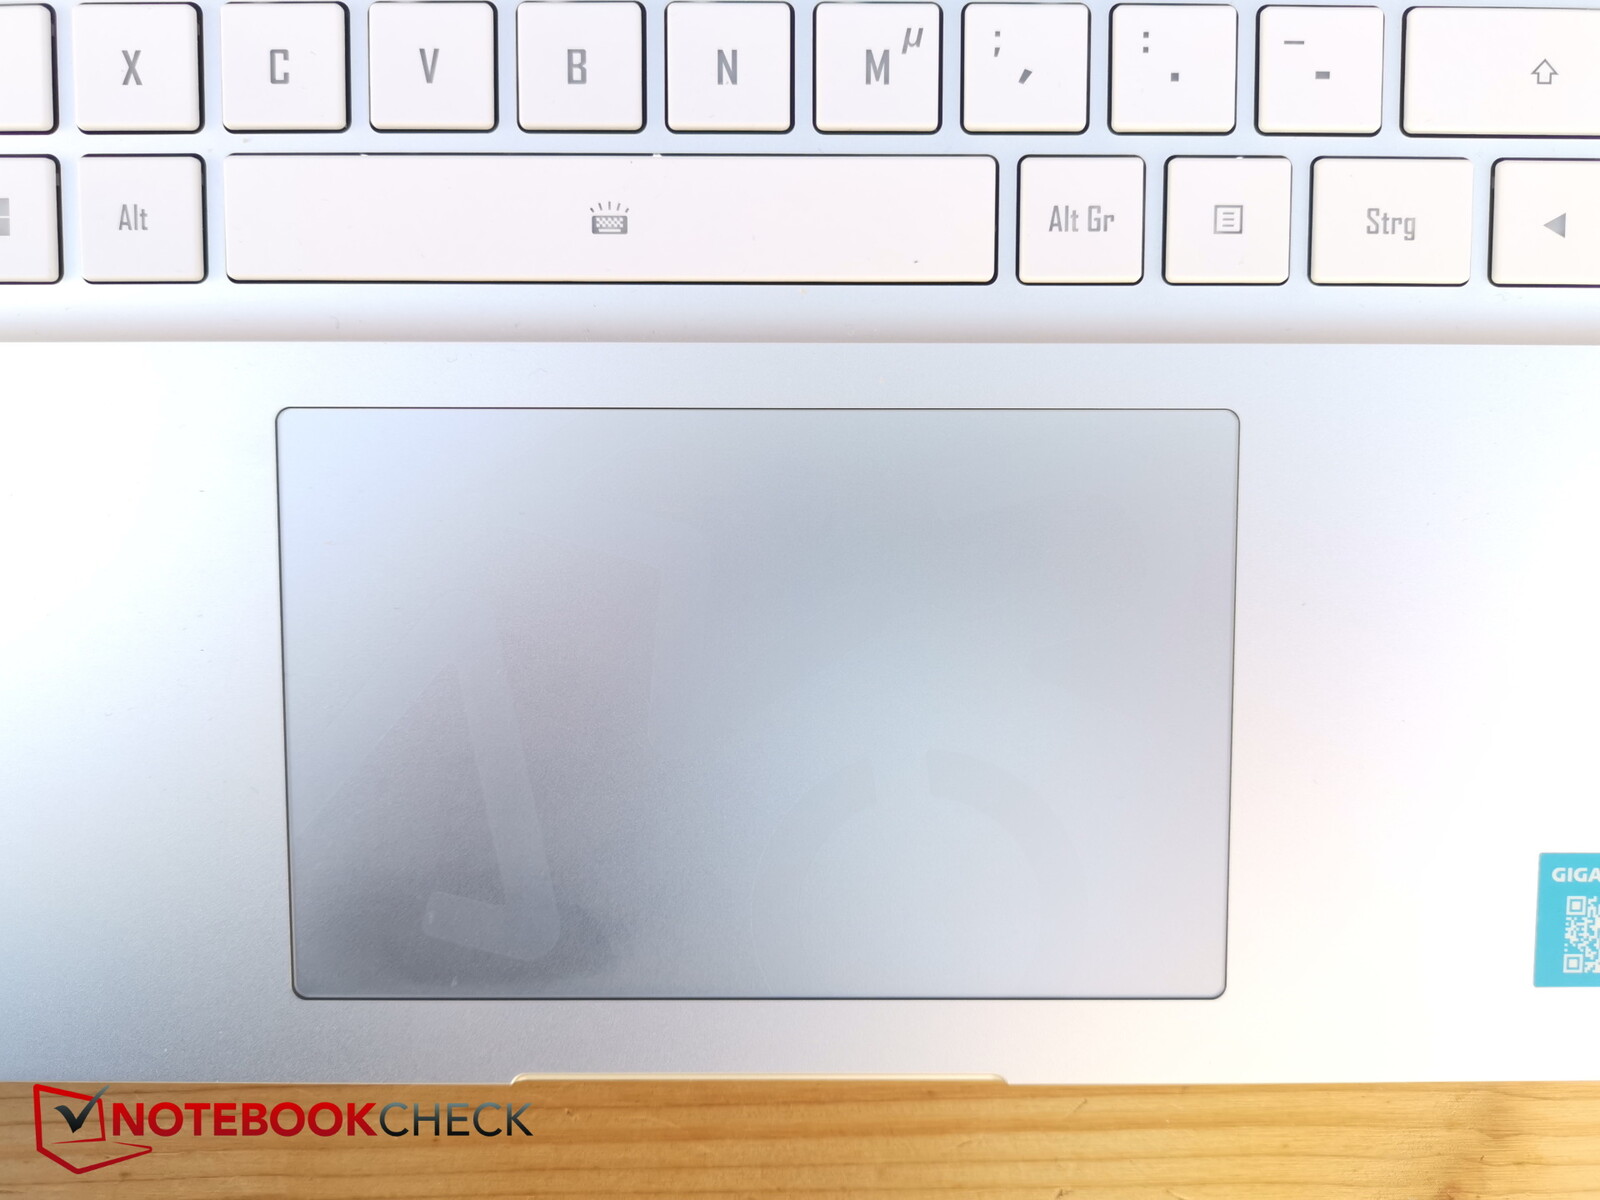
Touchpad
Touchpad pozostaje tej samej wielkości co poprzednik (około 12,1 x 7,6 cm), ale jest teraz srebrny zamiast czarnego i oferuje dobre właściwości ślizgowe, nawet przy bardzo wolnych ruchach.
Zintegrowane klawisze zapewniają wyraźne sprzężenie zwrotne, są więc nieco głośniejsze od klawiszy klawiatury, ale nadal umiarkowane.

Wyświetlacz - 16-calowy OLED, podświetlenie
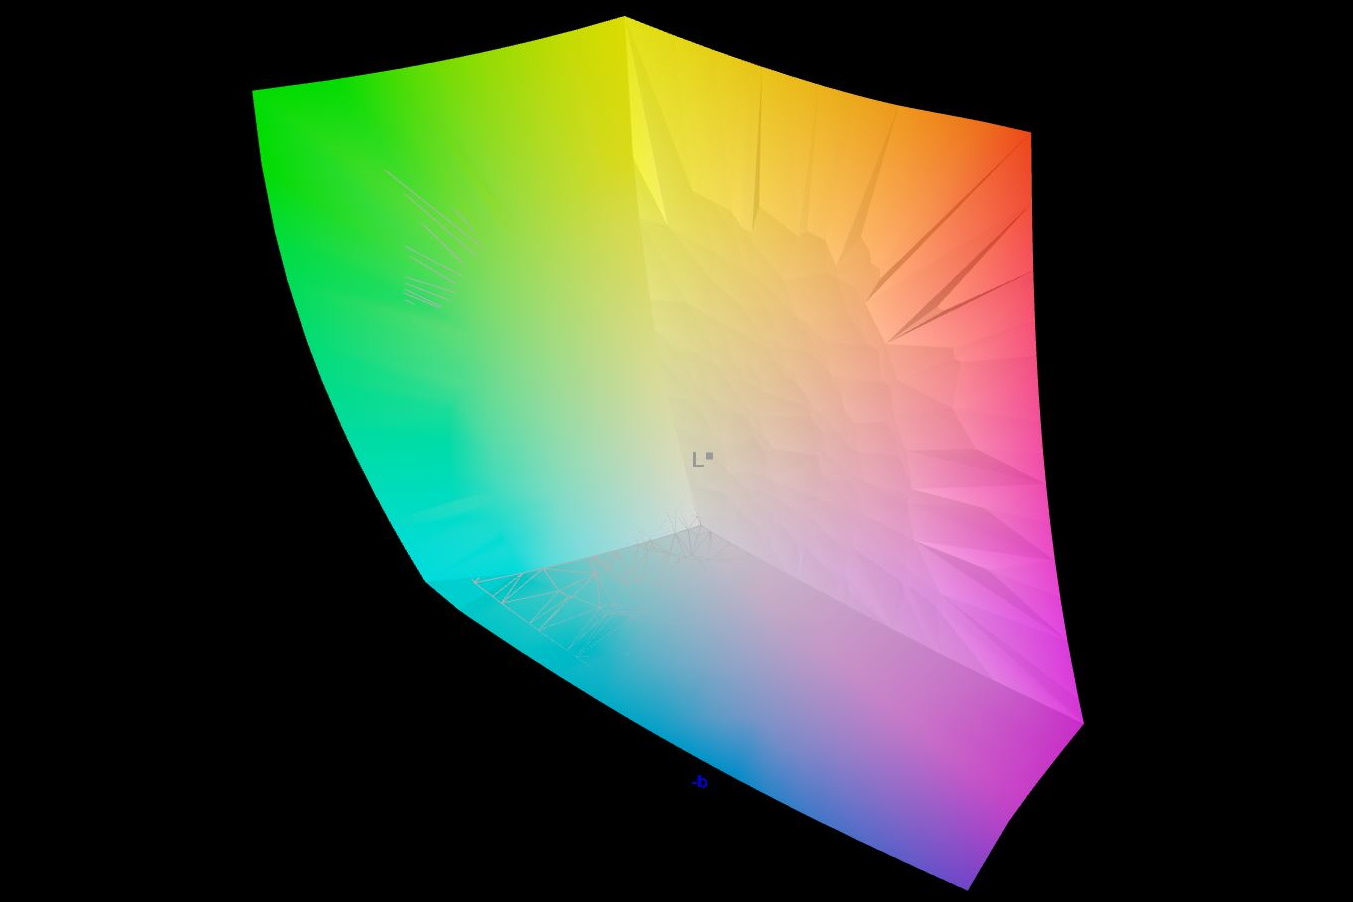
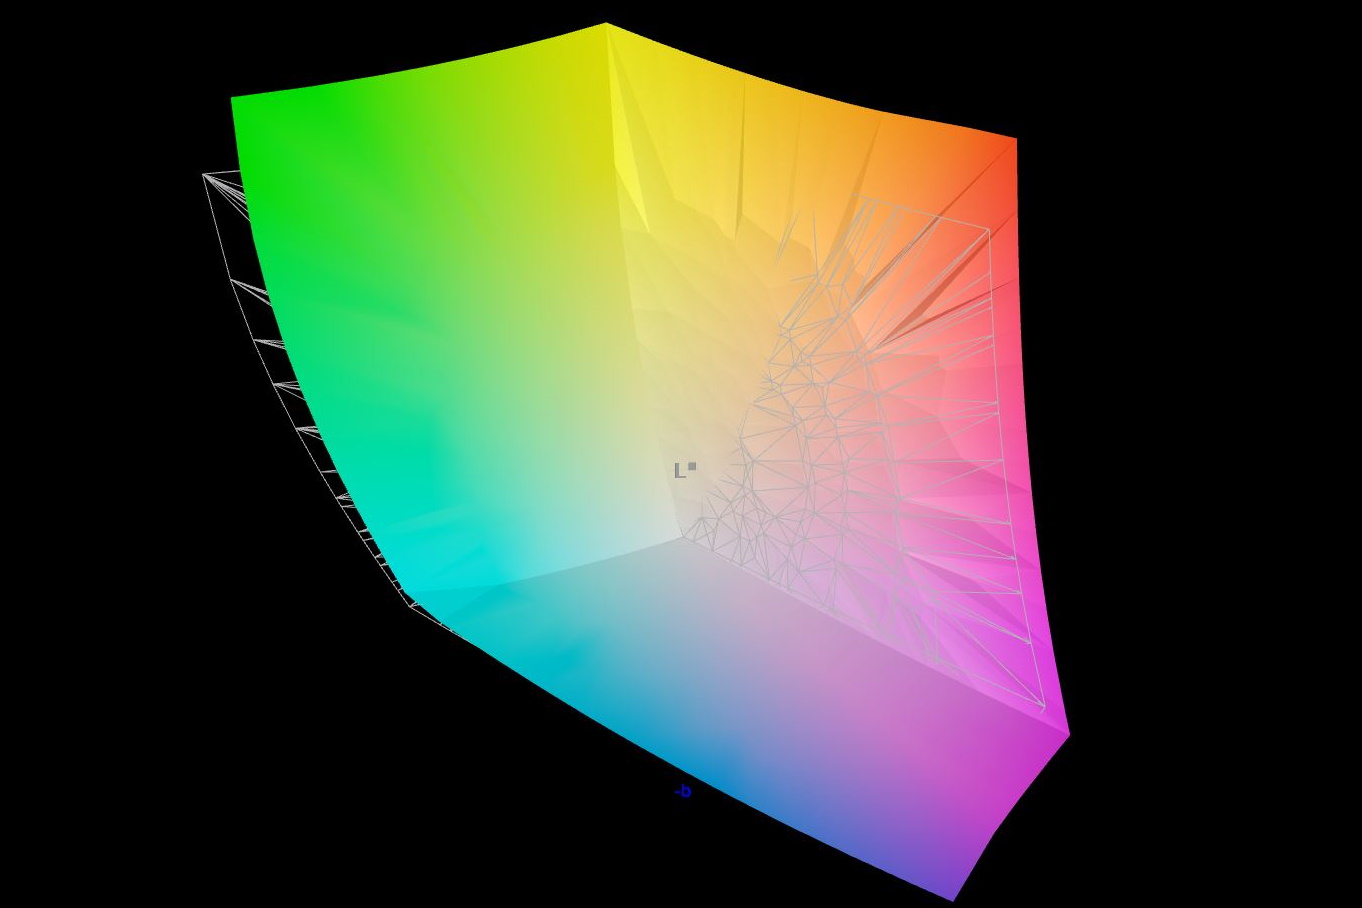
Gigabyte ponownie montuje 16-calowy panel OLED od Samsunga o proporcjach 16:10 i rozdzielczości 4K 3.840 x 2.400. Panel ma nowy numer wersji, ale nadal oferuje tylko 60 Hz - to minus dla graczy. W pozostałych przypadkach panel OLED może pochwalić się bogatym kontrastem, świetnym poziomem czerni i bardzo dobrym podświetleniem. Konkurencja IPS nie może już tutaj dotrzymać kroku.
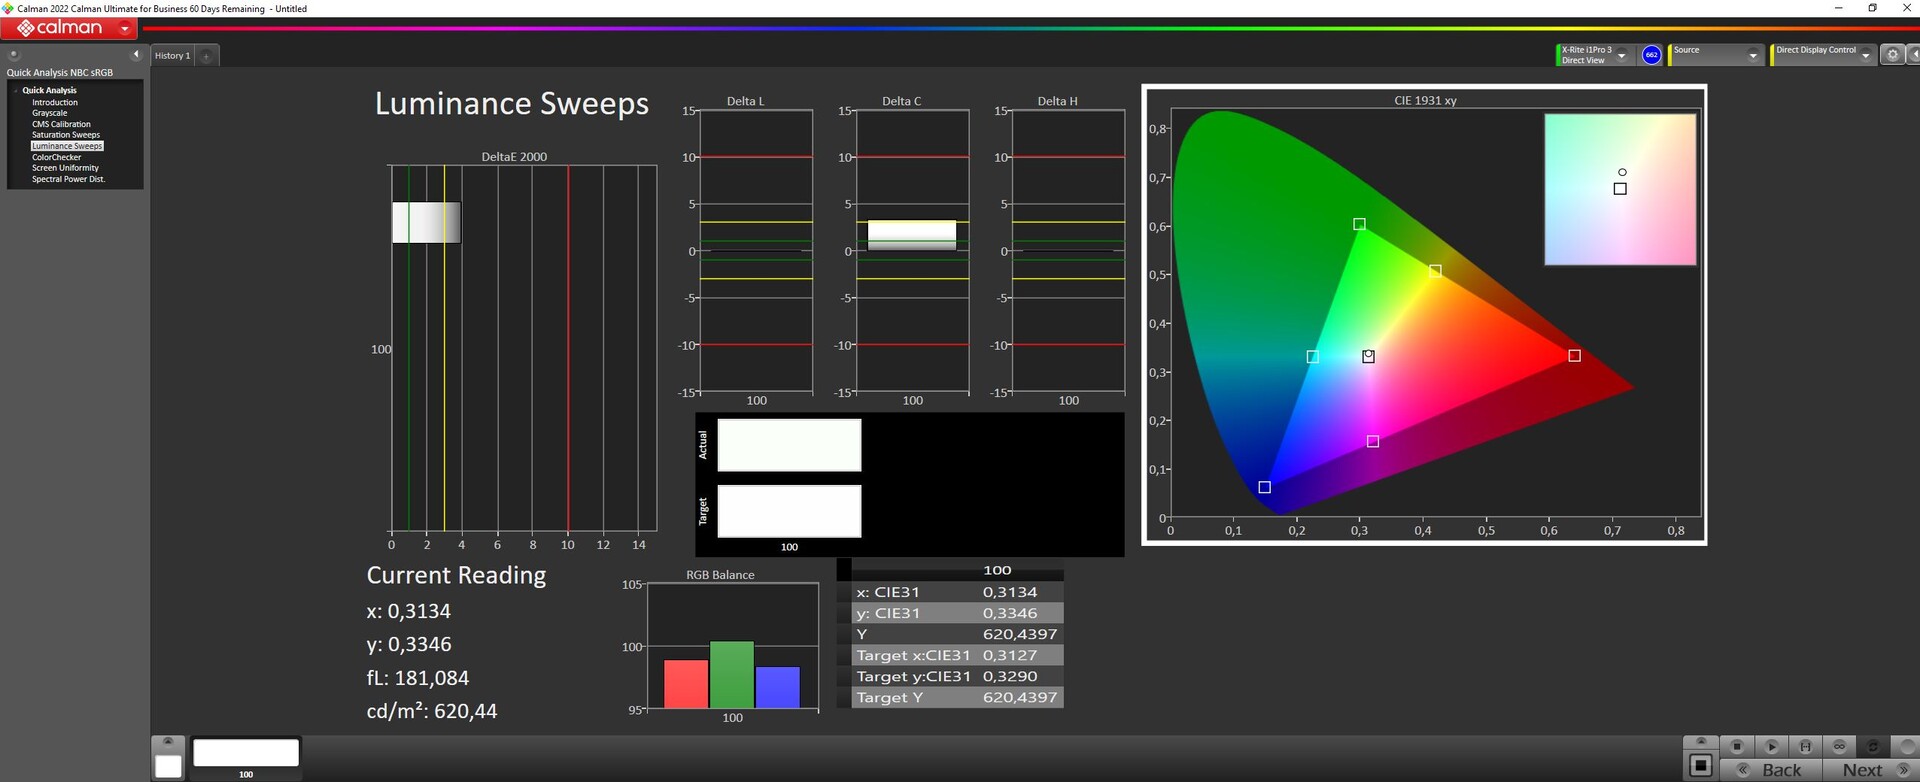
W trybie wyświetlania SDR zmierzyliśmy jasność nieco poniżej 400 nitów. Ale panel spełnia również standard HDR600. Zmierzyliśmy więc w trybie HDR i doszliśmy do szczytowej jasności 620 nitów. Jest to możliwe tylko przy małym polu pomiarowym, ponieważ OLED-y szybko ciemnieją na dużych, jasnych obszarach.
Screen bleeding nie jest problemem w przypadku OLED-ów. Czasy reakcji są również doskonałe.
| |||||||||||||||||||||||||
rozświetlenie: 97 %
na akumulatorze: 387.56 cd/m²
kontrast: 12999:1 (czerń: 0.03 cd/m²)
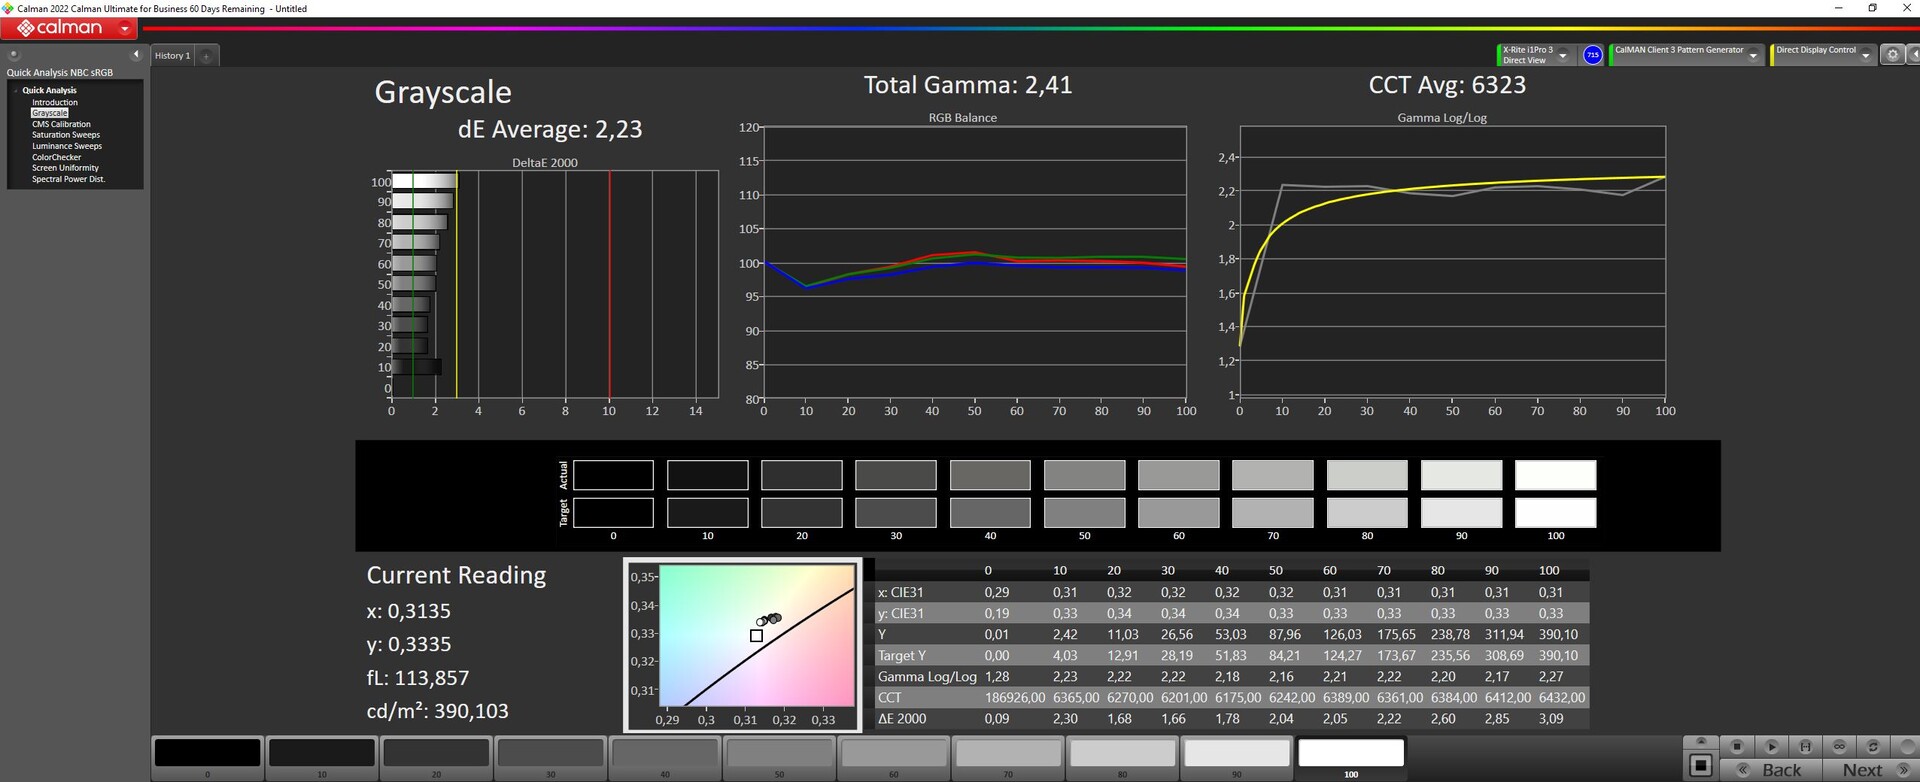
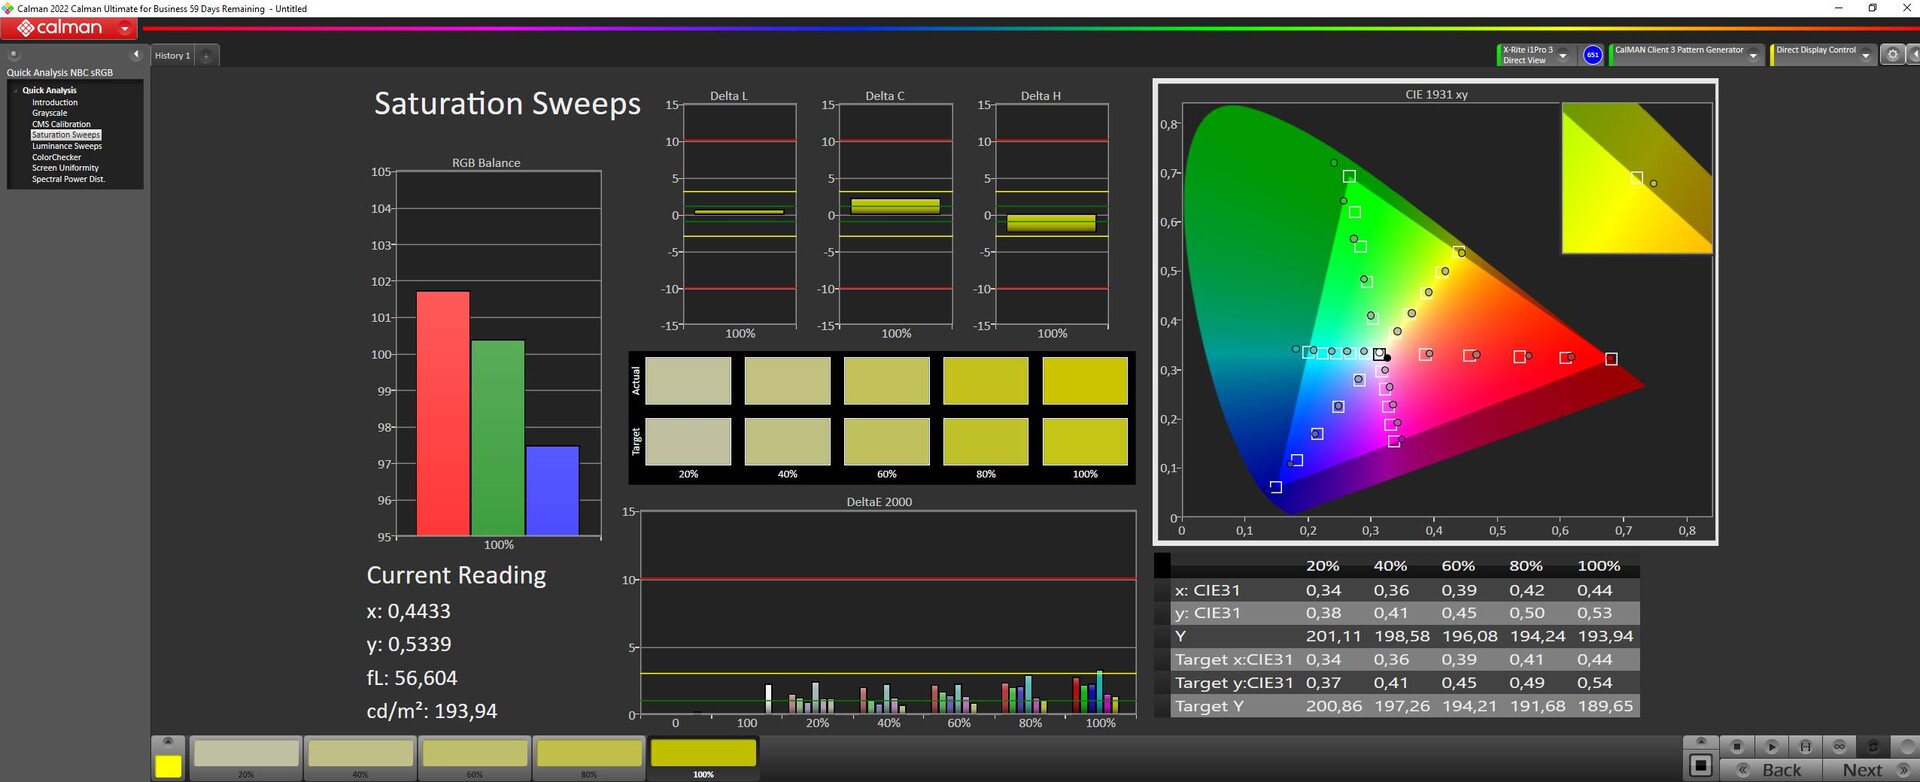
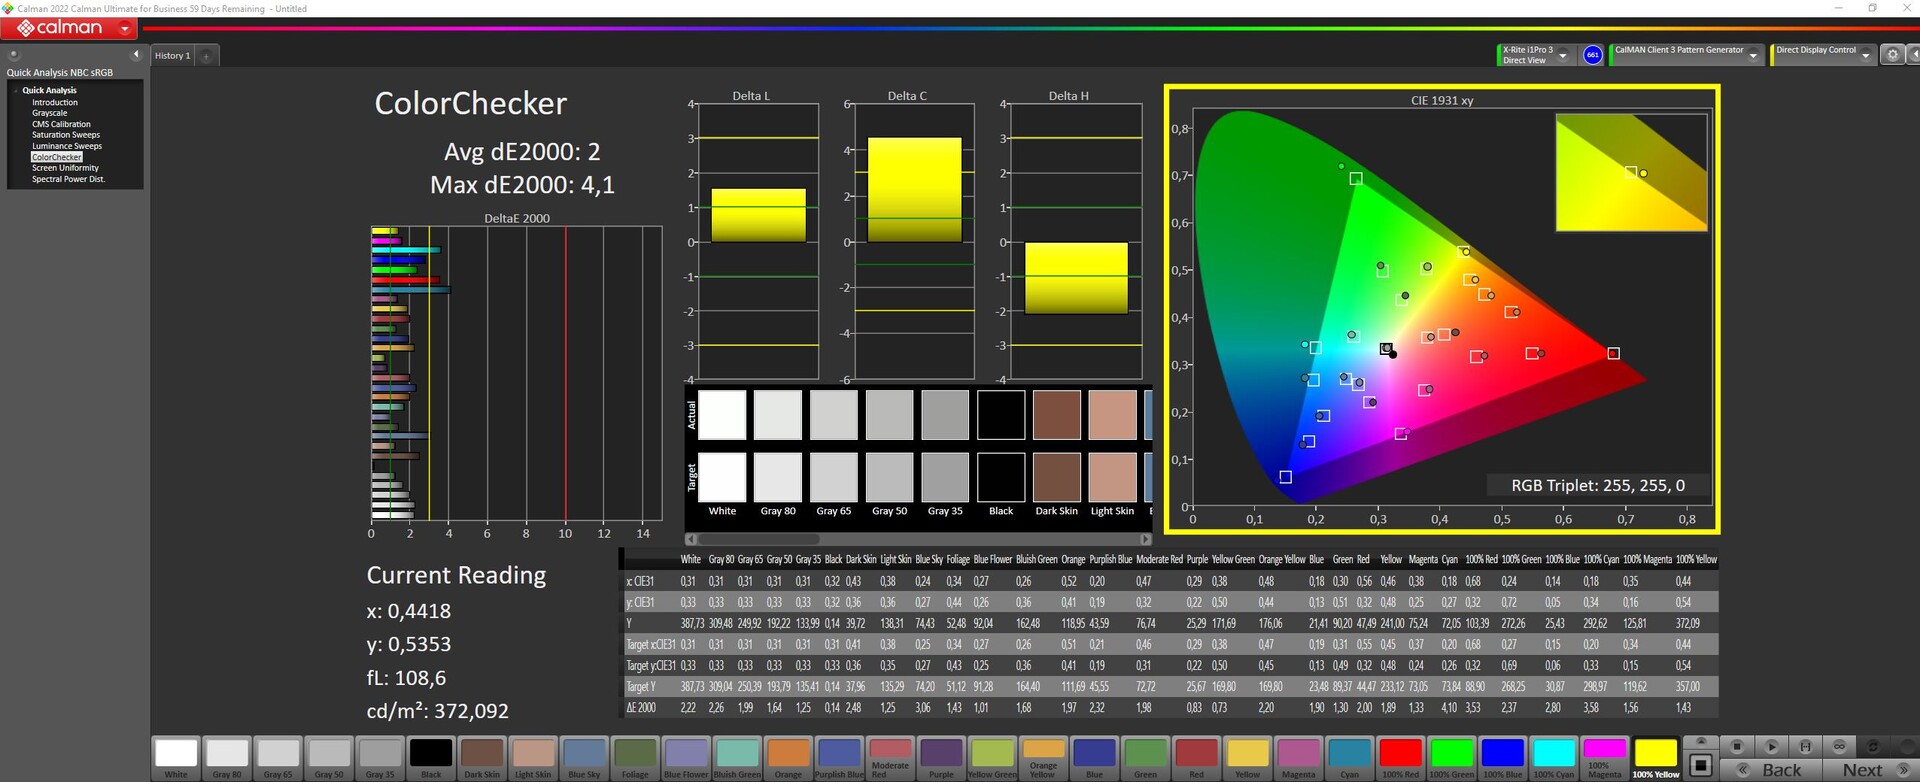
ΔE ColorChecker Calman: 2 | ∀{0.5-29.43 Ø4.73}
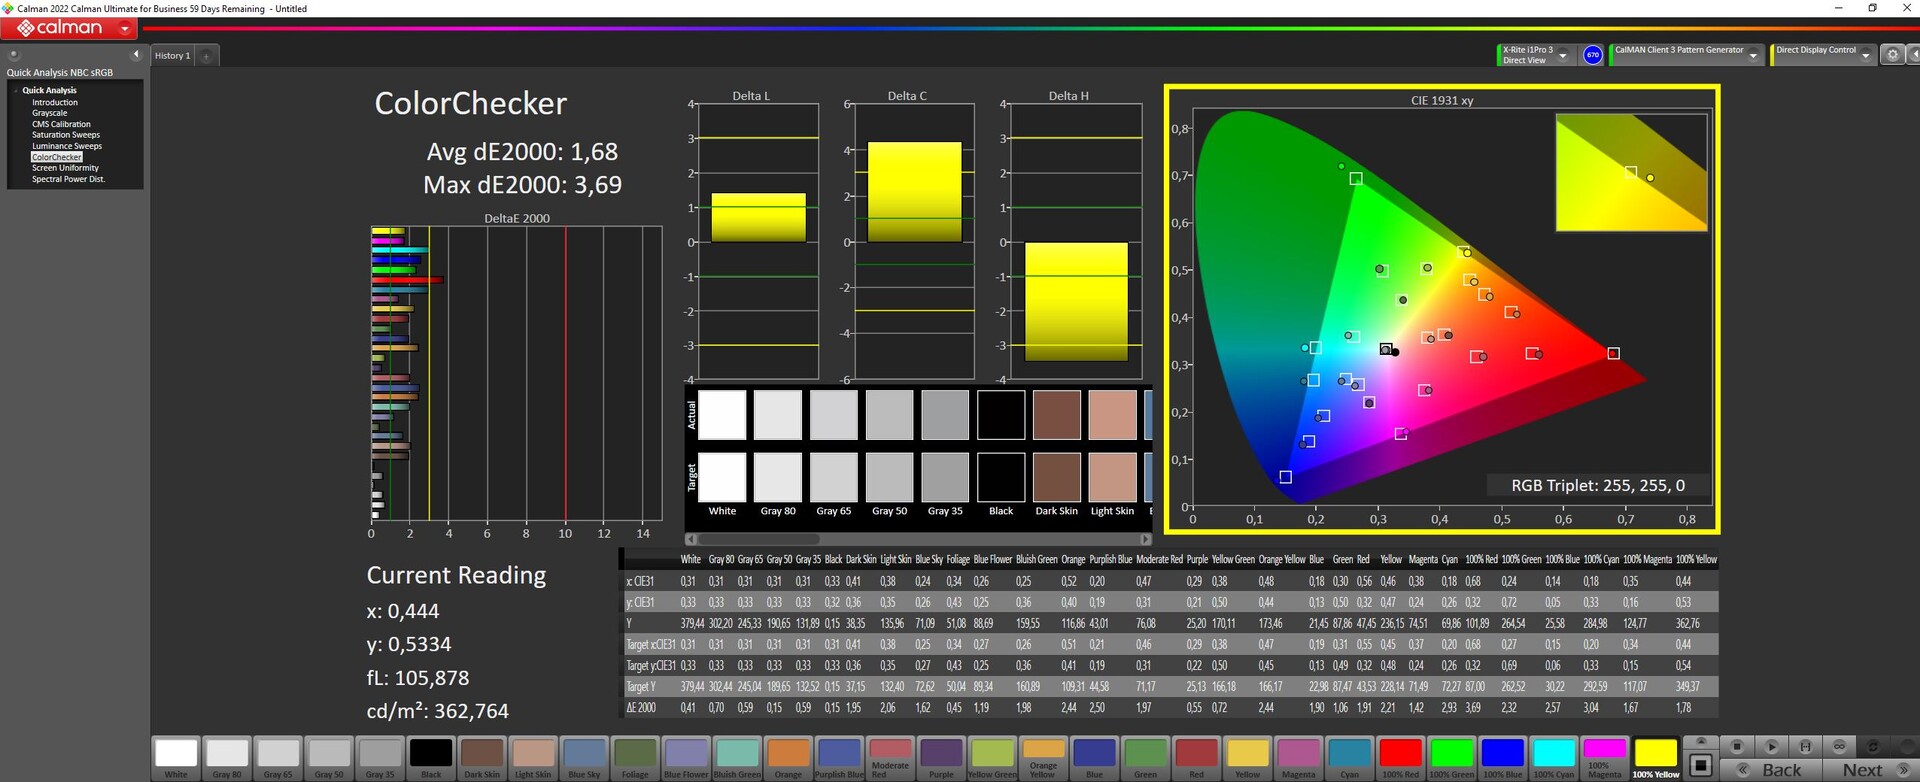
calibrated: 1.68
ΔE Greyscale Calman: 2.23 | ∀{0.09-98 Ø4.97}
96.4% AdobeRGB 1998 (Argyll 3D)
100% sRGB (Argyll 3D)
99.9% Display P3 (Argyll 3D)
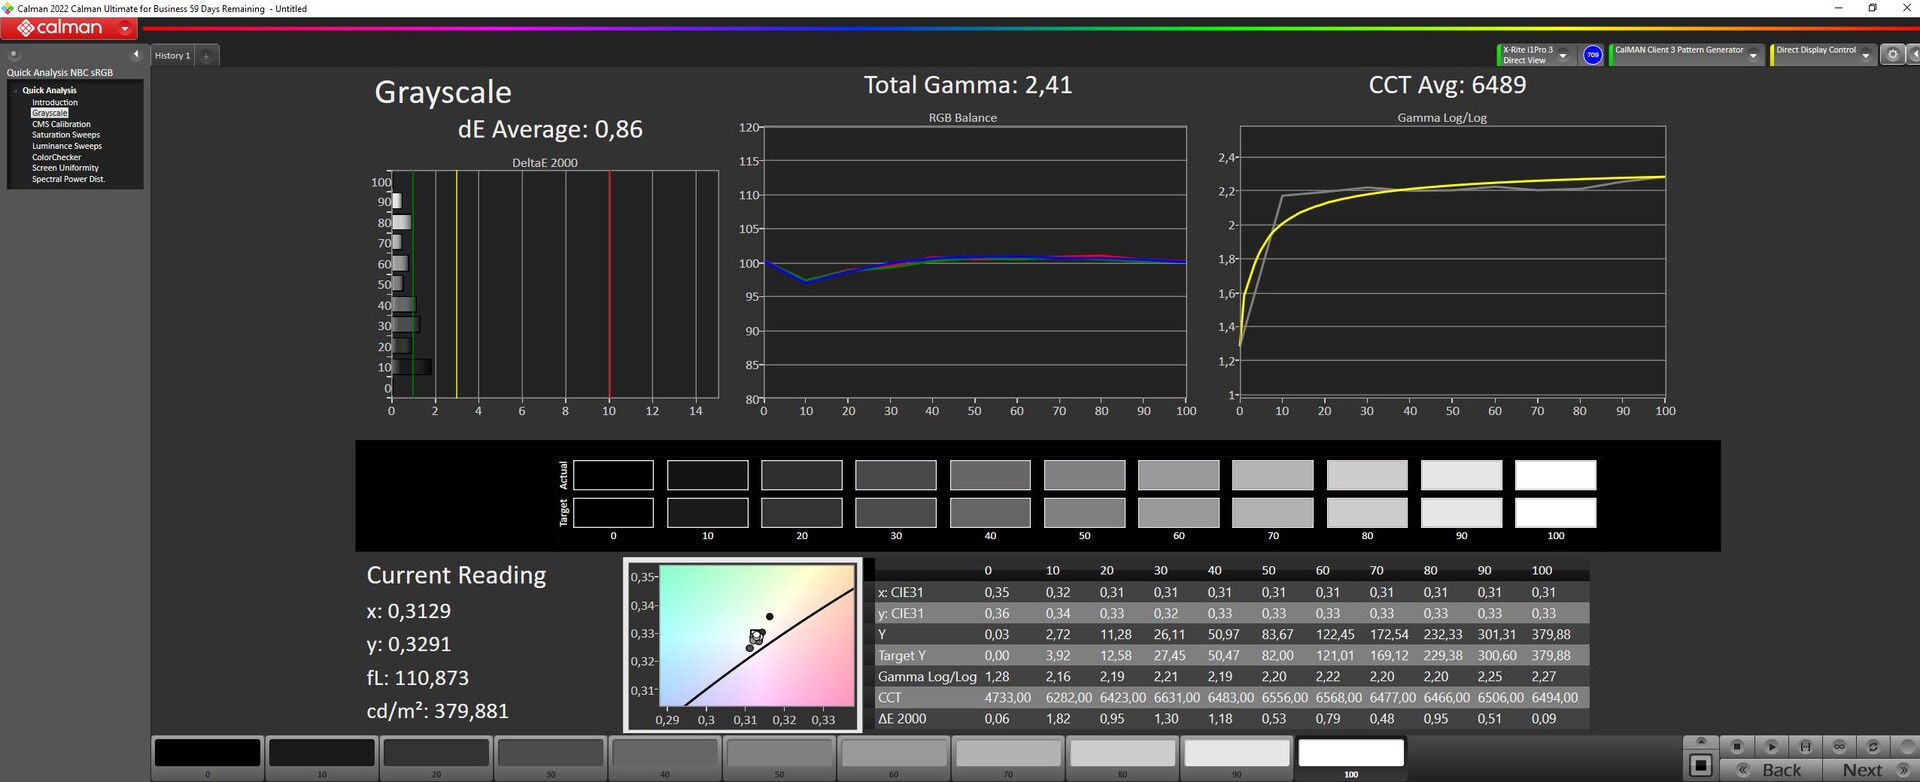
Gamma: 2.41
CCT: 6323 K
| Gigabyte AERO 16 OLED BSF Samsung SDC4191 (ATNA60YV09-0, OLED, 3840x2400, 16" | Gigabyte Aero 16 YE5 Samsung SDC416B, AMOLED, 3840x2400, 16" | Razer Blade 18 RTX 4070 AU Optronics B180QAN01.0, IPS, 2560x1600, 18" | Asus ZenBook Pro 16X OLED UX7602ZM-ME115W Samsung SDC415D, OLED, 3840x2400, 16" | Asus TUF Gaming A16 FA617 NE160WUM-NX2 (BOE0B33), IPS-Level, 1920x1200, 16" | MSI CreatorPro Z16P B12UKST B160QAN02.N, IPS, 2560x1600, 16" | |
|---|---|---|---|---|---|---|
| Display | -5% | -3% | -20% | -4% | ||
| Display P3 Coverage (%) | 99.9 | 96.9 -3% | 99.84 0% | 69.4 -31% | 97.6 -2% | |
| sRGB Coverage (%) | 100 | 99.8 0% | 99.99 0% | 97.8 -2% | 99.9 0% | |
| AdobeRGB 1998 Coverage (%) | 96.4 | 85.3 -12% | 88.9 -8% | 70.9 -26% | 87.4 -9% | |
| Response Times | -11% | -207% | -1% | -580% | -407% | |
| Response Time Grey 50% / Grey 80% * (ms) | 2 ? | 2.4 ? -20% | 4.2 ? -110% | 2 ? -0% | 17 ? -750% | 12.8 ? -540% |
| Response Time Black / White * (ms) | 1.98 ? | 2 ? -1% | 8 ? -304% | 2 ? -1% | 10.1 ? -410% | 7.4 ? -274% |
| PWM Frequency (Hz) | 60 | 60 ? | 59 ? | |||
| Screen | 34% | -208% | -8% | -80% | -118% | |
| Brightness middle (cd/m²) | 389.97 | 368 -6% | 549.6 41% | 346 -11% | 308 -21% | 407 4% |
| Brightness (cd/m²) | 395 | 368 -7% | 524 33% | 354 -10% | 293 -26% | 388 -2% |
| Brightness Distribution (%) | 97 | 93 -4% | 89 -8% | 96 -1% | 90 -7% | 88 -9% |
| Black Level * (cd/m²) | 0.03 | 0.01 67% | 0.53 -1667% | 0.23 -667% | 0.36 -1100% | |
| Contrast (:1) | 12999 | 36800 183% | 1037 -92% | 1339 -90% | 1131 -91% | |
| Colorchecker dE 2000 * | 2 | 2.33 -17% | 3.32 -66% | 2.28 -14% | 1.47 26% | 1.3 35% |
| Colorchecker dE 2000 max. * | 4.1 | 4.34 -6% | 6.63 -62% | 4.94 -20% | 2.98 27% | 2.5 39% |
| Colorchecker dE 2000 calibrated * | 1.68 | 2.7 -61% | 2.16 -29% | 1.02 39% | 0.7 58% | |
| Greyscale dE 2000 * | 2.23 | 0.8 64% | 2 10% | 1.64 26% | 2.2 1% | 2.1 6% |
| Gamma | 2.41 91% | 2.119 104% | 2.29 96% | 2.37 93% | 2.228 99% | 2.26 97% |
| CCT | 6323 103% | 6569 99% | 6319 103% | 6384 102% | 6228 104% | 6437 101% |
| Całkowita średnia (program / ustawienia) | 12% /
25% | -140% /
-164% | -4% /
-6% | -227% /
-138% | -176% /
-135% |
* ... im mniej tym lepiej
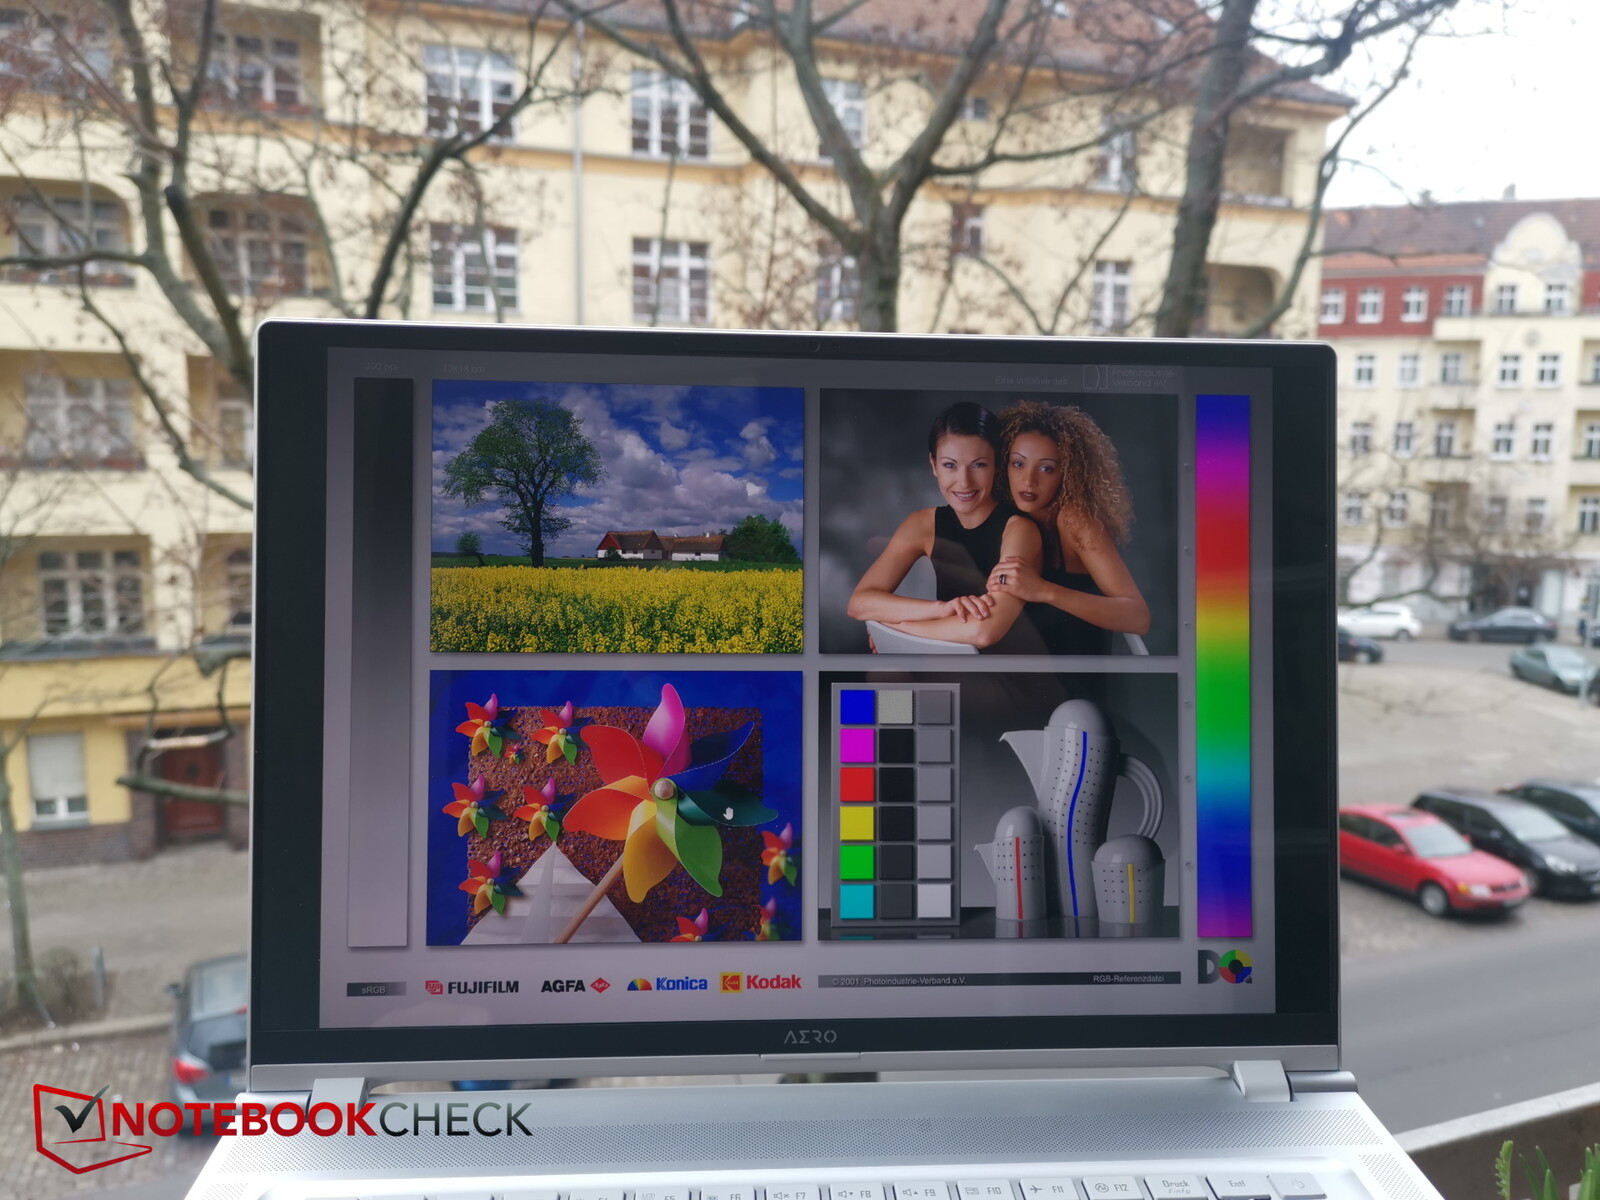
Gigabyte reklamuje Aero 16 jako urządzenie zapewniające 100-procentowe pokrycie DCI-P3 i nasze pomiary to potwierdzają. Nawet AdobeRGB jest pokryte w 96,4 procentach. Wyświetlacz OLED nadaje się więc bardzo dobrze do edycji zdjęć i filmów.
Wyświetlacz jest już dobrze skalibrowany ex works; nasza kalibracja poprzez Portrait Displays Calman Color Calibration spycha wartości DeltaE w dół jeszcze bardziej. Wyświetlacz ma więc tylko bardzo niewielkie odchylenia w kolorze i skali szarości. Nasz profil ICC można pobrać powyżej.
Wyświetl czasy reakcji
| ↔ Czas reakcji od czerni do bieli | ||
|---|---|---|
| 1.98 ms ... wzrost ↗ i spadek ↘ łącznie | ↗ 0.5 ms wzrost | 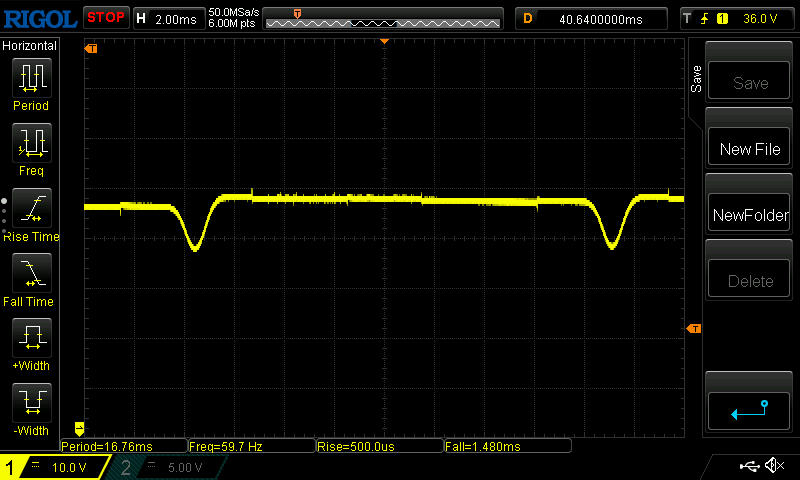 |
| ↘ 1.48 ms upadek | ||
| W naszych testach ekran wykazuje bardzo szybką reakcję i powinien bardzo dobrze nadawać się do szybkich gier. Dla porównania, wszystkie testowane urządzenia wahają się od 0.1 (minimum) do 240 (maksimum) ms. » 11 % wszystkich urządzeń jest lepszych. Oznacza to, że zmierzony czas reakcji jest lepszy od średniej wszystkich testowanych urządzeń (19.9 ms). | ||
| ↔ Czas reakcji 50% szarości do 80% szarości | ||
| 2 ms ... wzrost ↗ i spadek ↘ łącznie | ↗ 1 ms wzrost |  |
| ↘ 1 ms upadek | ||
| W naszych testach ekran wykazuje bardzo szybką reakcję i powinien bardzo dobrze nadawać się do szybkich gier. Dla porównania, wszystkie testowane urządzenia wahają się od 0.165 (minimum) do 636 (maksimum) ms. » 10 % wszystkich urządzeń jest lepszych. Oznacza to, że zmierzony czas reakcji jest lepszy od średniej wszystkich testowanych urządzeń (31.1 ms). | ||
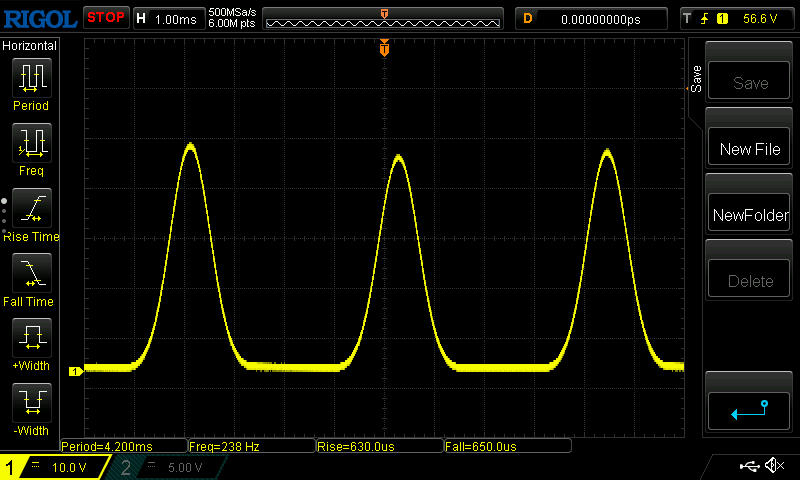
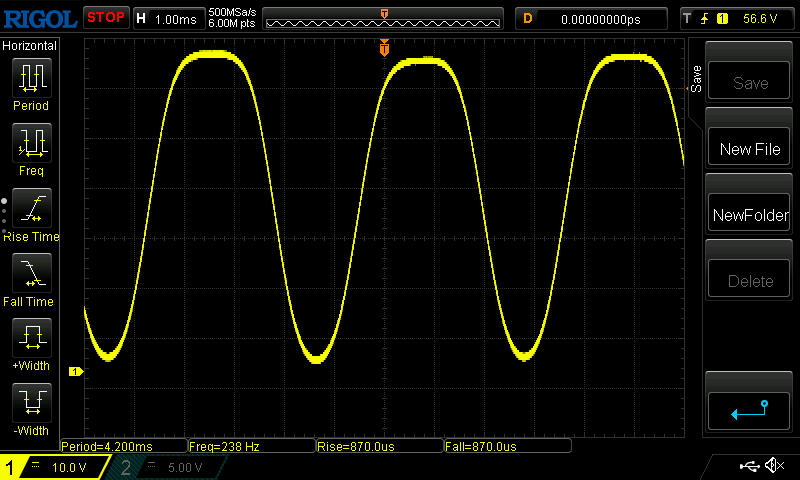
Migotanie ekranu / PWM (modulacja szerokości impulsu)
| Wykryto migotanie ekranu/wykryto PWM | 60 Hz | 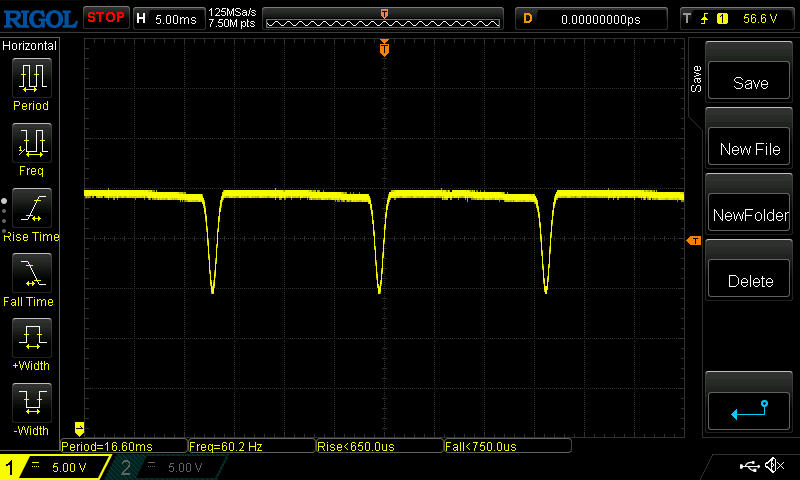 | |
Podświetlenie wyświetlacza miga z częstotliwością 60 Hz (najgorszy przypadek, np. przy użyciu PWM) . Częstotliwość 60 Hz jest bardzo niska, więc migotanie może powodować zmęczenie oczu i bóle głowy po dłuższym użytkowaniu. Dla porównania: 52 % wszystkich testowanych urządzeń nie używa PWM do przyciemniania wyświetlacza. Jeśli wykryto PWM, zmierzono średnio 7798 (minimum: 5 - maksimum: 343500) Hz. | |||
Jak to typowe dla OLED-ów, przy pełnej jasności wyświetlacz migocze z częstotliwością 60 Hz. W okolicach 50 procent jasności i poniżej częstotliwość zmienia się, a 238 Hz może okazać się irytujące dla osób wrażliwych.

Na zewnątrz oczywiście odbijająca światło powierzchnia rozprasza uwagę. Dość przeciętna jasność SDR i dobre kontrasty mogą tylko w ograniczonym stopniu zrównoważyć tę wadę. Zalecane jest zacienione miejsce i bezpośredni kąt patrzenia.
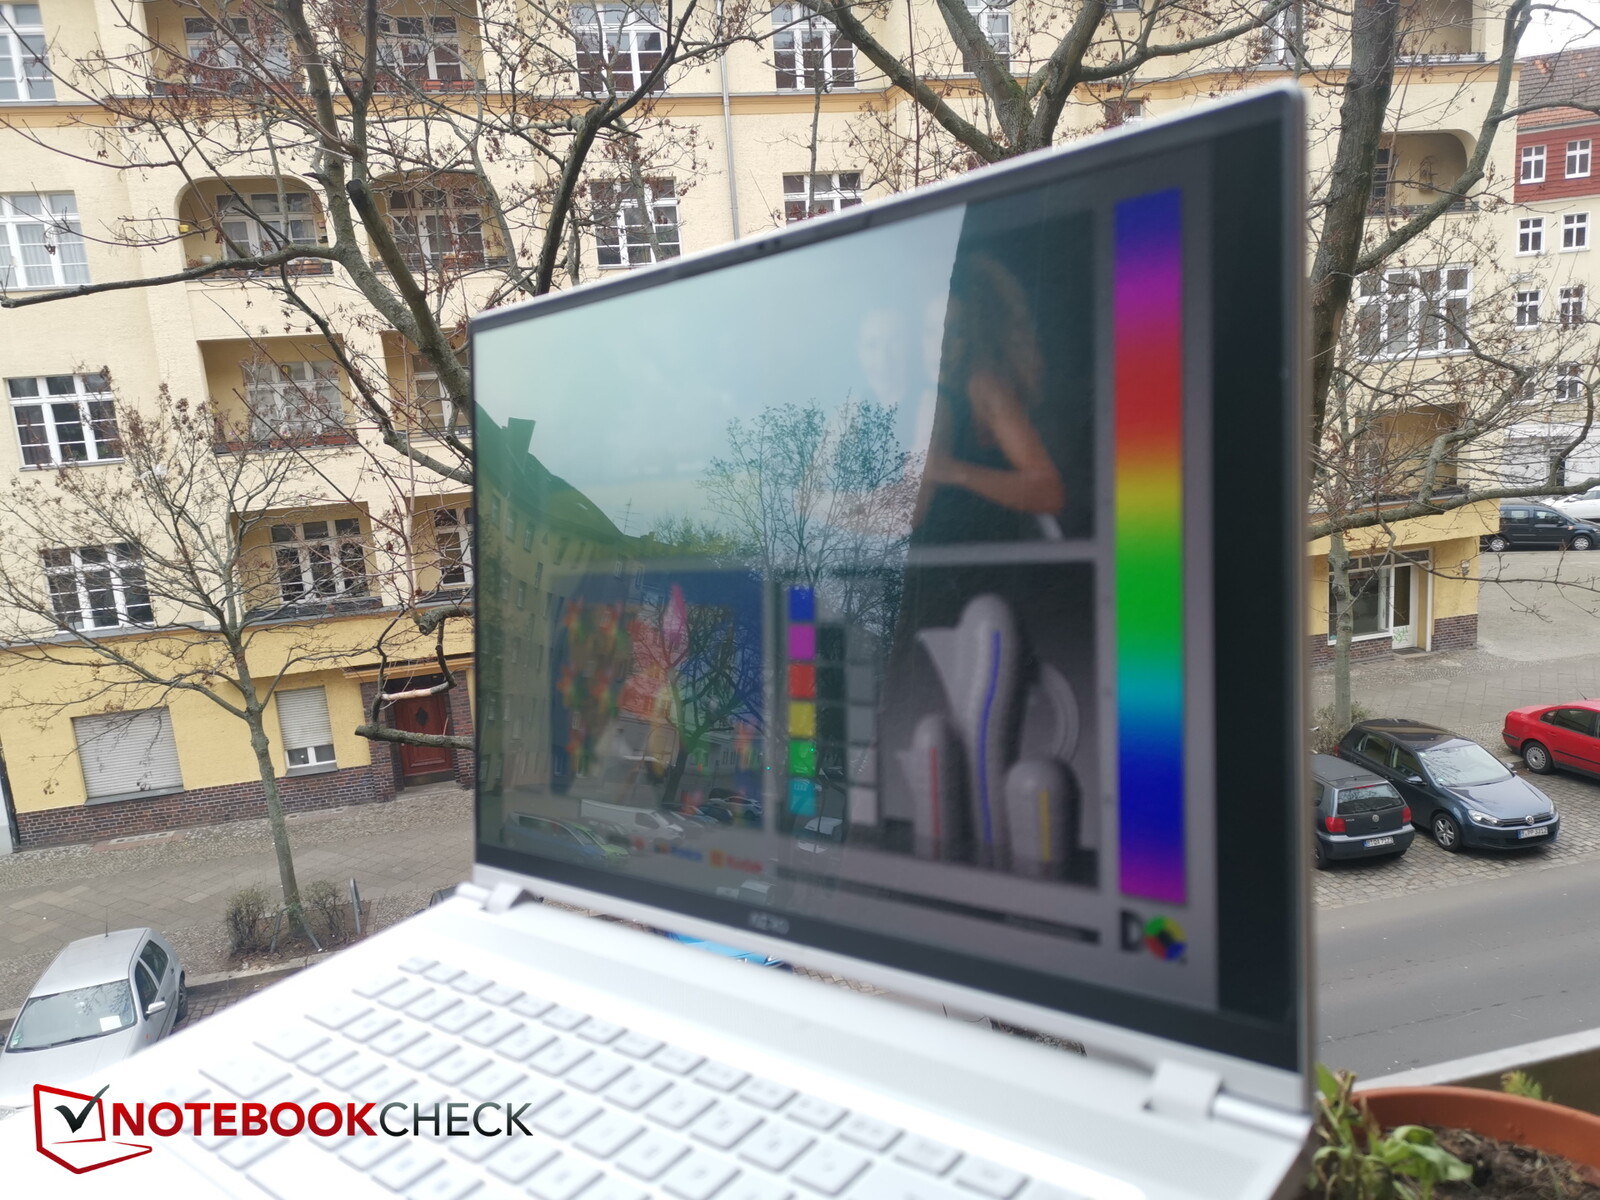
Utrata jasności staje się zauważalna dopiero przy patrzeniu na wyświetlacz pod skrajnymi kątami.

Wydajność - Dobra wydajność 3D pomimo 105 W
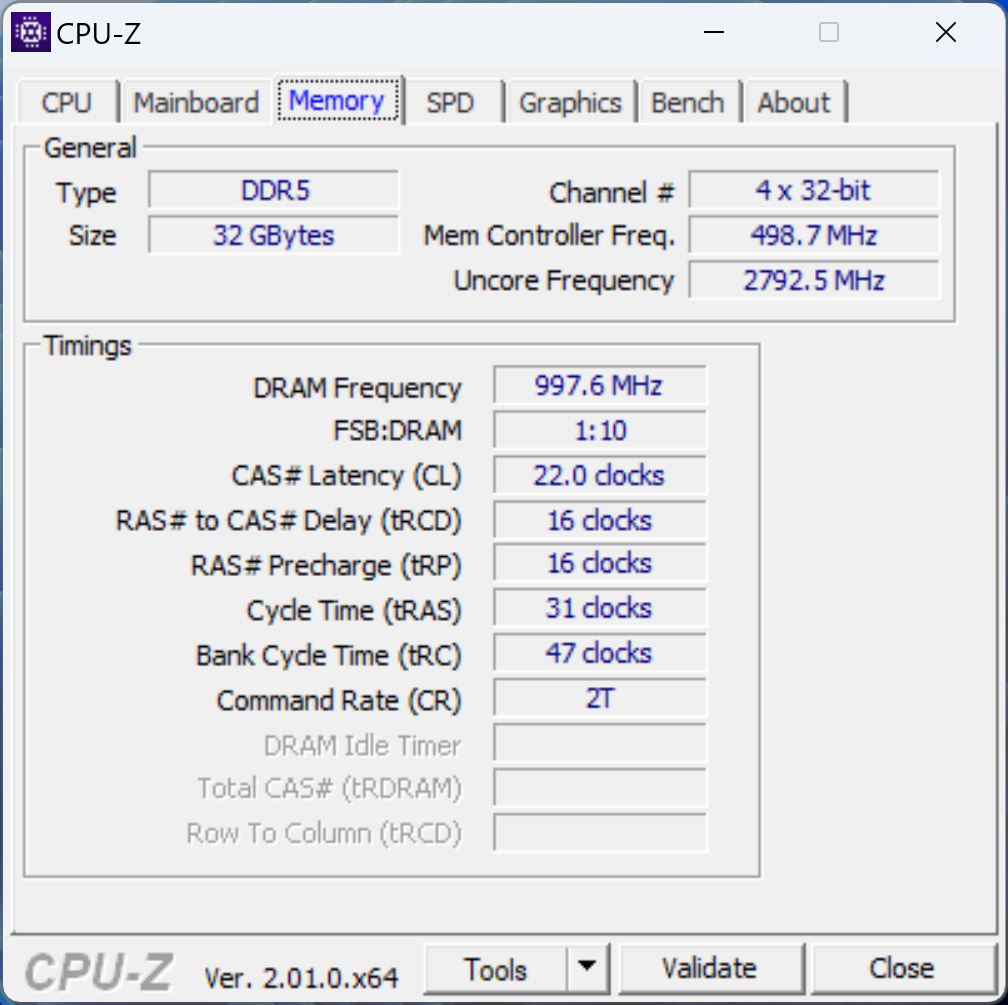
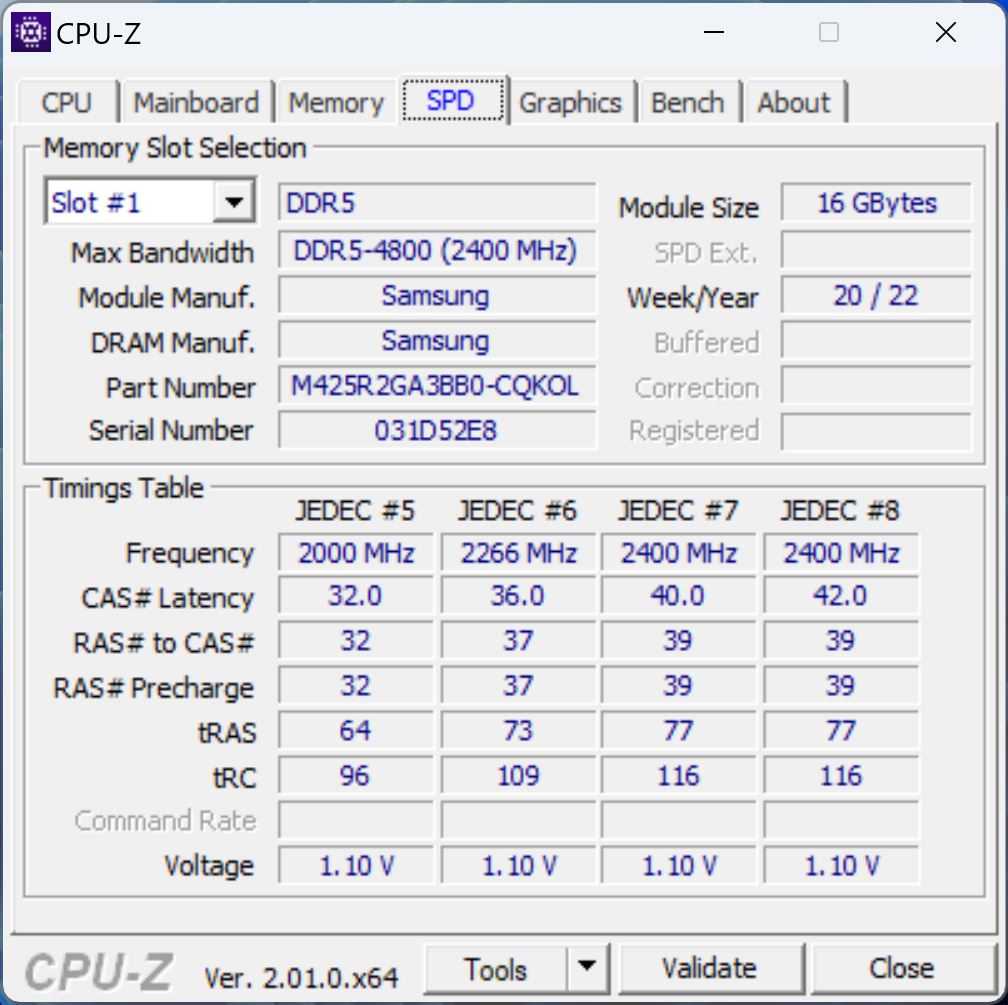
Aero mieści zupełnie nowy sprzęt. Połączeniei9-13900H, RTX 4070i 32 GB DDR5-4800 nie powinno sprawić użytkownikom żadnych problemów, czy to w grach, czy przy korzystaniu z kreatywnych aplikacji.
Cały ten sprzęt jest jednak upakowany w smukłej obudowie, więc nie działa z pełną mocą, co zostanie pokazane poniżej. W końcu laptop kreatywny nie ma być super gorącym ryczącym laptopem, więc hardcorowi gracze będą musieli tutaj trochę pocierpieć.

Warunki badania

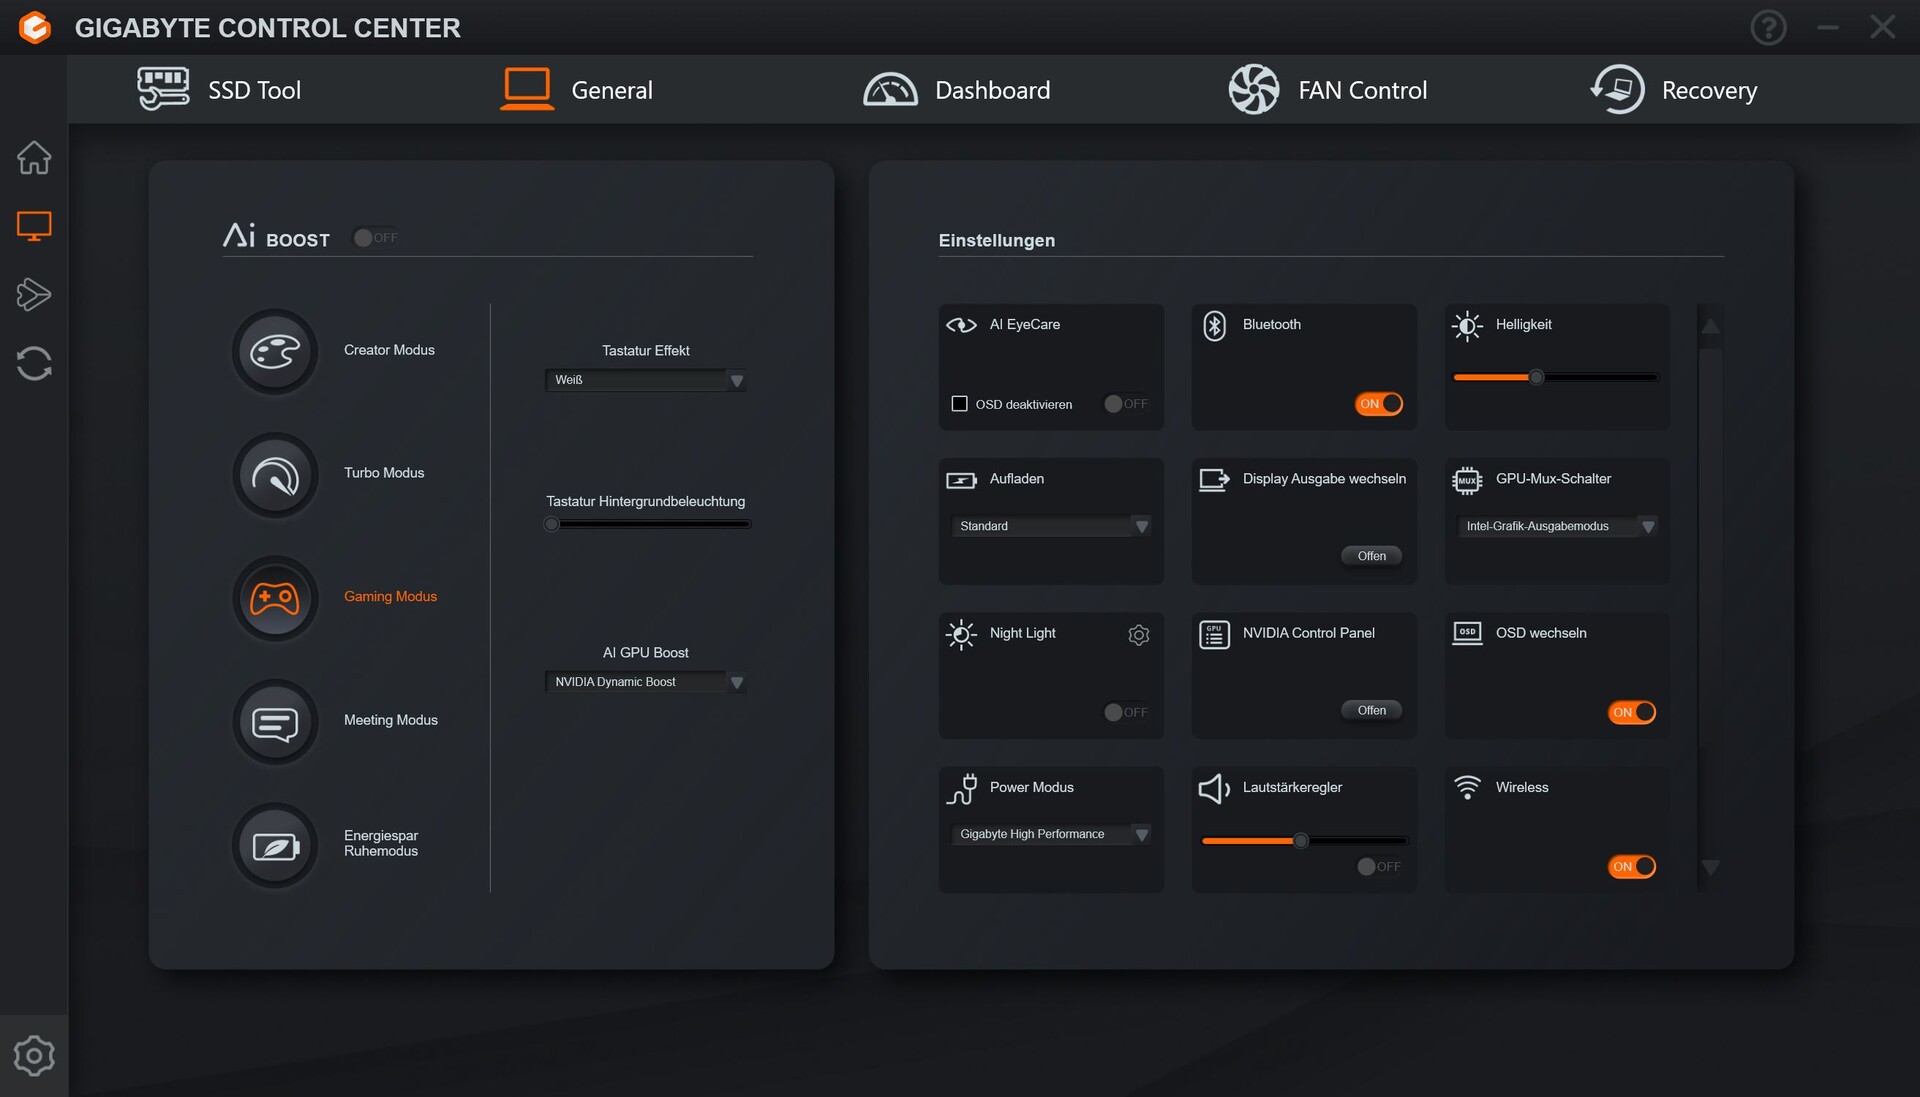
Nasze urządzenie testowe nie miało preinstalowanego Control Center, więc nie było na początek trybów wydajności. Tryby zasilania preinstalowane w systemie Windows przez Gigabyte nie miały praktycznie żadnego wpływu na wydajność procesora w Cinebench R15.
Dlatego też, a także dlatego, że wentylatory na początku nigdy nie stały w miejscu, zainstalowaliśmy po tym Gigabyte Control Center. Tutaj stanęliśmy przed trudnym wyborem trybu wydajności: jest ich tutaj łącznie pięć, a nam ciężko było wybrać pomiędzy Content Creator a Gaming. Musieliśmy więc zdecydować pomiędzy dobrą wydajnością, ale głośniejszymi wentylatorami, a cichszą pracą przy słabszej wydajności.
Ostatecznie benchmarki CPU wykonaliśmy bez Control Center, czyli w stanie dostawy. Benchmarki GPU uruchomiliśmy wtedy w trybie gamingowym.
Oprogramowanie nie zawsze jest całkowicie wolne od błędów. Na przykład podczas niektórych uruchomień wyświetlało po prostu czarne okno. Mylące jest również to, że oprócz trybów jest jeszcze jedno okno wyboru "Power Mode" z kolejnymi opcjami kontroli zasilania. Prawdopodobnie reprezentują one tryby energetyczne, ponieważ jeśli ustawisz to na Custom, można wybrać tryby zasilania Windows.
Na lewo od głównych trybów znajduje się również przełącznik "AI". "AI" niezależnie wybiera najlepszy tryb w zależności od sytuacji, na przykład tryb oszczędzania energii, gdy odłączymy wtyczkę od prądu.

Procesor
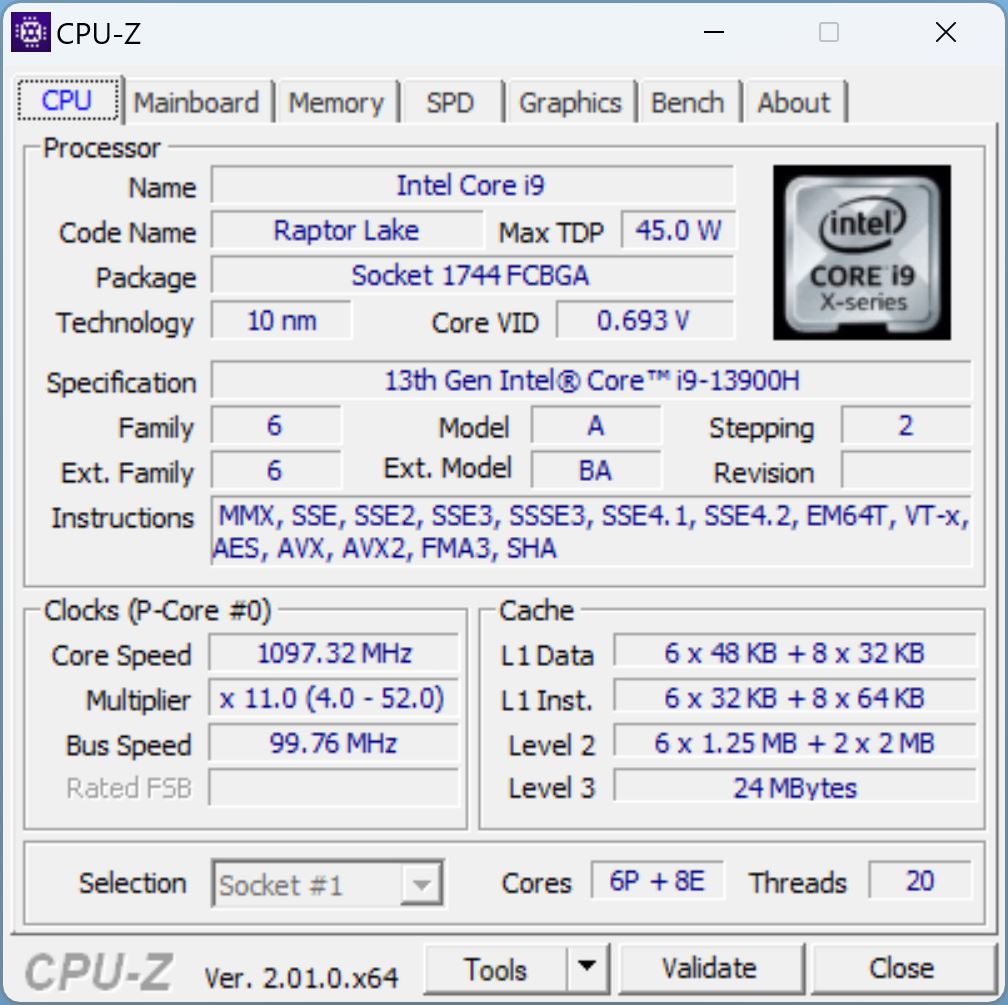
Sercem Aero jestIntel Core i9-13900H, jeden z flagowych układów Intela z zupełnie nowej serii Raptor Lake. Zapewnia on 6 rdzeni wydajnościowych i 8 wydajnościowych, przy czym te pierwsze taktowane są nawet 5,4 GHz w turbo! Alternatywnie, urządzenie dostępne jest także z m.in i7-13700H.
W naszej pętli Cinebench R15, Aero wychodzi na prowadzenie, ale przewaga nad m.in.i9-12900Hz serii Alder Lake jest marginalna, a poprzednik jest niewiele wolniejszy we wszystkich testach CPU.
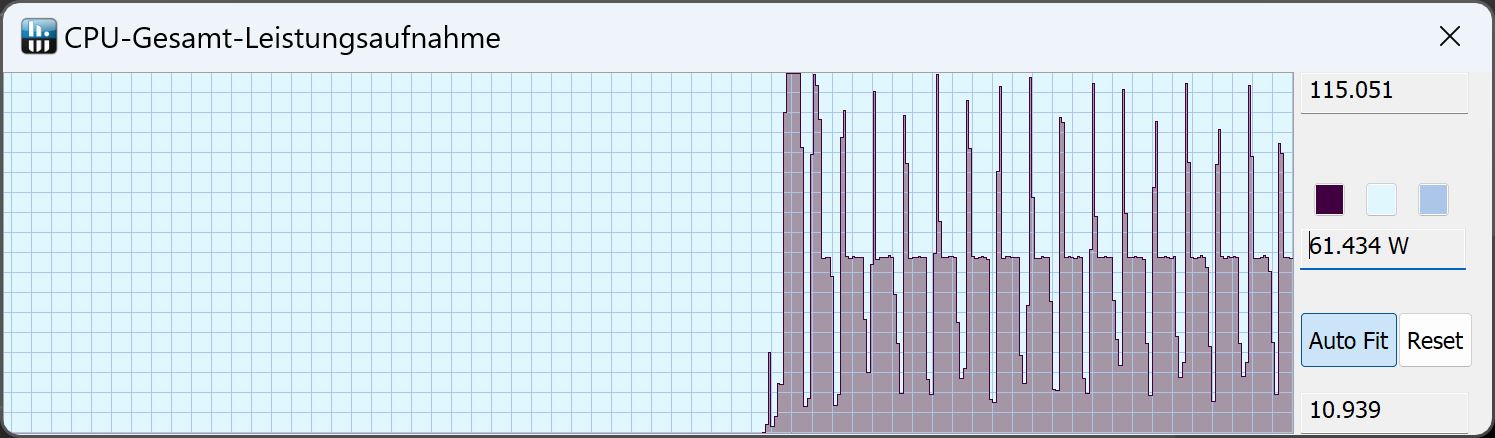
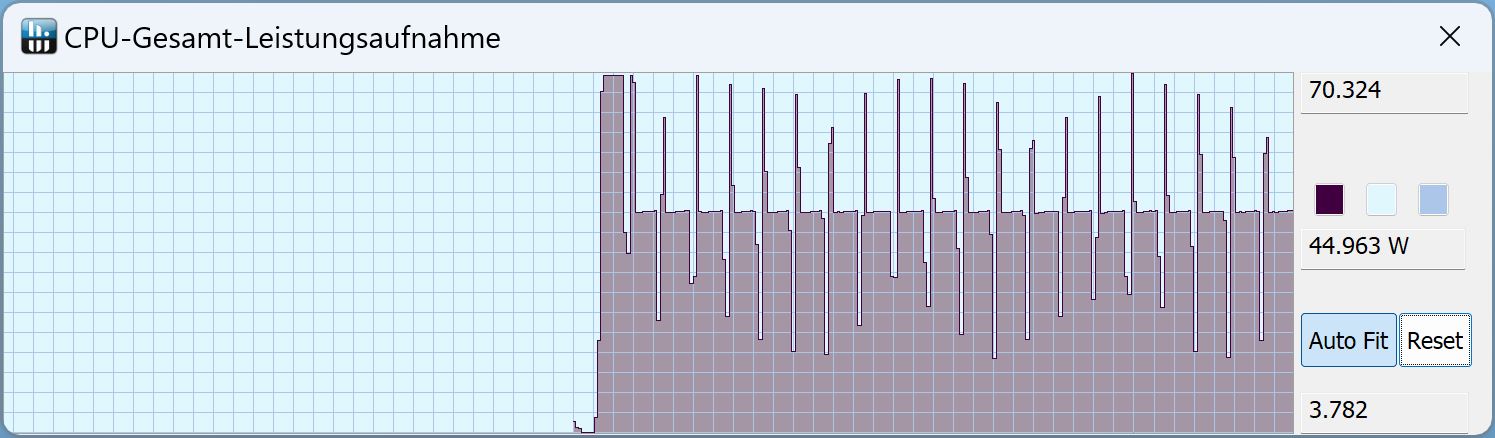
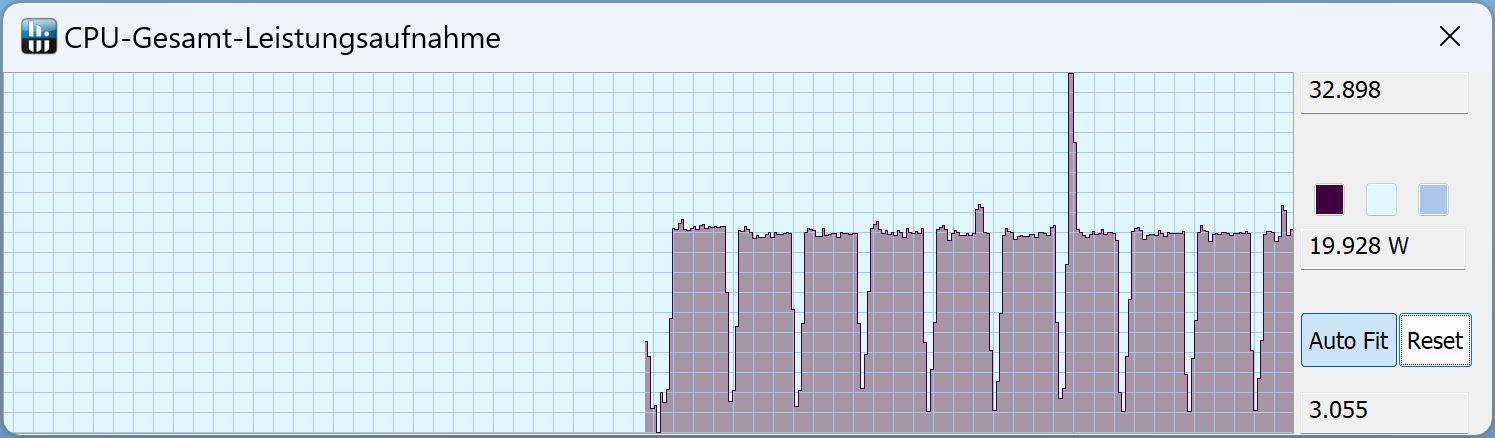
Spojrzenie na pobór mocy pokazuje, że zdecydowanie należy zainstalować Control Center. Ponieważ w stanie dostawy procesor tylko przez krótki czas traktuje się 70 W, po czym spada do 45 W. Z drugiej strony, jeśli przełączyć się w Control Center w tryb Gaming, krótkoterminowe TDP wzrasta do 115 W, a następnie wisi w okolicach 60 W przez resztę biegu Cinebencha. Bardzo dużo zależy więc od ustawień zasilania.
Bez trybu Gaming nowe Aero 16 nie jest szybsze od poprzednika we wszystkich benchmarkach CPU.
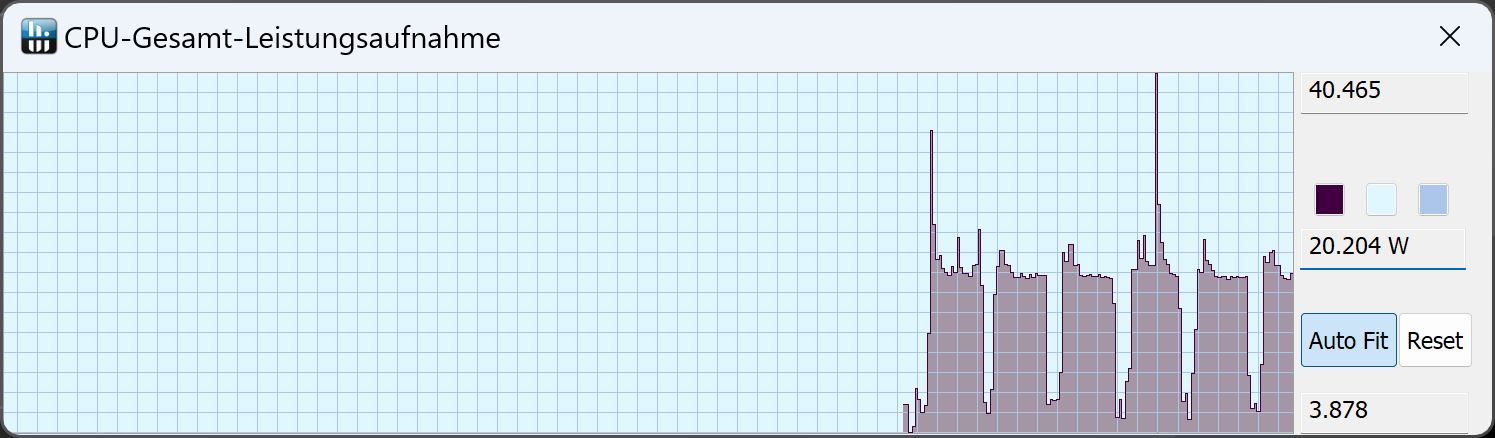
W trybie baterii procesor może pobierać tylko około 20 W, a wynik w Cinebench jest odpowiednio niższy.
Cinebench R15 Multi Sustained Load
Cinebench R23: Multi Core | Single Core
Cinebench R20: CPU (Multi Core) | CPU (Single Core)
Cinebench R15: CPU Multi 64Bit | CPU Single 64Bit
Blender: v2.79 BMW27 CPU
7-Zip 18.03: 7z b 4 | 7z b 4 -mmt1
Geekbench 5.5: Multi-Core | Single-Core
HWBOT x265 Benchmark v2.2: 4k Preset
LibreOffice : 20 Documents To PDF
R Benchmark 2.5: Overall mean
| CPU Performance rating | |
| Razer Blade 18 RTX 4070 | |
| Średnia w klasie Gaming | |
| Gigabyte Aero 16 YE5 | |
| Asus ZenBook Pro 16X OLED UX7602ZM-ME115W | |
| Przeciętny Intel Core i9-13900H | |
| Gigabyte AERO 16 OLED BSF | |
| MSI CreatorPro Z16P B12UKST | |
| Asus TUF Gaming A16 FA617 | |
| Cinebench R23 / Multi Core | |
| Razer Blade 18 RTX 4070 | |
| Średnia w klasie Gaming (10488 - 40970, n=112, ostatnie 2 lata) | |
| Gigabyte AERO 16 OLED BSF | |
| Gigabyte Aero 16 YE5 | |
| MSI CreatorPro Z16P B12UKST | |
| Przeciętny Intel Core i9-13900H (11997 - 20385, n=28) | |
| Asus ZenBook Pro 16X OLED UX7602ZM-ME115W | |
| Asus TUF Gaming A16 FA617 | |
| Cinebench R23 / Single Core | |
| Razer Blade 18 RTX 4070 | |
| Średnia w klasie Gaming (1166 - 2356, n=112, ostatnie 2 lata) | |
| Gigabyte Aero 16 YE5 | |
| Przeciętny Intel Core i9-13900H (1297 - 2054, n=26) | |
| MSI CreatorPro Z16P B12UKST | |
| Asus ZenBook Pro 16X OLED UX7602ZM-ME115W | |
| Gigabyte AERO 16 OLED BSF | |
| Asus TUF Gaming A16 FA617 | |
| Cinebench R20 / CPU (Multi Core) | |
| Razer Blade 18 RTX 4070 | |
| Średnia w klasie Gaming (4029 - 16108, n=111, ostatnie 2 lata) | |
| Gigabyte AERO 16 OLED BSF | |
| Gigabyte Aero 16 YE5 | |
| MSI CreatorPro Z16P B12UKST | |
| Przeciętny Intel Core i9-13900H (4935 - 7716, n=25) | |
| Asus ZenBook Pro 16X OLED UX7602ZM-ME115W | |
| Asus TUF Gaming A16 FA617 | |
| Cinebench R20 / CPU (Single Core) | |
| Razer Blade 18 RTX 4070 | |
| Średnia w klasie Gaming (442 - 895, n=111, ostatnie 2 lata) | |
| Przeciętny Intel Core i9-13900H (428 - 792, n=25) | |
| Gigabyte Aero 16 YE5 | |
| Asus ZenBook Pro 16X OLED UX7602ZM-ME115W | |
| MSI CreatorPro Z16P B12UKST | |
| Gigabyte AERO 16 OLED BSF | |
| Asus TUF Gaming A16 FA617 | |
| Cinebench R15 / CPU Multi 64Bit | |
| Razer Blade 18 RTX 4070 | |
| Średnia w klasie Gaming (1578 - 6271, n=111, ostatnie 2 lata) | |
| Gigabyte AERO 16 OLED BSF | |
| Gigabyte Aero 16 YE5 | |
| Przeciętny Intel Core i9-13900H (2061 - 3100, n=26) | |
| Asus ZenBook Pro 16X OLED UX7602ZM-ME115W | |
| Asus TUF Gaming A16 FA617 | |
| MSI CreatorPro Z16P B12UKST | |
| Cinebench R15 / CPU Single 64Bit | |
| Razer Blade 18 RTX 4070 | |
| Średnia w klasie Gaming (188.8 - 343, n=111, ostatnie 2 lata) | |
| Gigabyte Aero 16 YE5 | |
| Przeciętny Intel Core i9-13900H (211 - 297, n=26) | |
| Asus ZenBook Pro 16X OLED UX7602ZM-ME115W | |
| Asus ZenBook Pro 16X OLED UX7602ZM-ME115W | |
| Asus TUF Gaming A16 FA617 | |
| Gigabyte AERO 16 OLED BSF | |
| MSI CreatorPro Z16P B12UKST | |
| Blender / v2.79 BMW27 CPU | |
| Asus TUF Gaming A16 FA617 | |
| Przeciętny Intel Core i9-13900H (166 - 268, n=24) | |
| MSI CreatorPro Z16P B12UKST | |
| Gigabyte Aero 16 YE5 | |
| Asus ZenBook Pro 16X OLED UX7602ZM-ME115W | |
| Gigabyte AERO 16 OLED BSF | |
| Średnia w klasie Gaming (80 - 330, n=109, ostatnie 2 lata) | |
| Razer Blade 18 RTX 4070 | |
| 7-Zip 18.03 / 7z b 4 | |
| Razer Blade 18 RTX 4070 | |
| Średnia w klasie Gaming (33491 - 148086, n=110, ostatnie 2 lata) | |
| Gigabyte AERO 16 OLED BSF | |
| Asus ZenBook Pro 16X OLED UX7602ZM-ME115W | |
| Gigabyte Aero 16 YE5 | |
| MSI CreatorPro Z16P B12UKST | |
| Przeciętny Intel Core i9-13900H (45045 - 79032, n=25) | |
| Asus TUF Gaming A16 FA617 | |
| 7-Zip 18.03 / 7z b 4 -mmt1 | |
| Razer Blade 18 RTX 4070 | |
| Średnia w klasie Gaming (4199 - 7436, n=110, ostatnie 2 lata) | |
| Gigabyte Aero 16 YE5 | |
| Przeciętny Intel Core i9-13900H (3665 - 6600, n=25) | |
| Asus ZenBook Pro 16X OLED UX7602ZM-ME115W | |
| Asus TUF Gaming A16 FA617 | |
| MSI CreatorPro Z16P B12UKST | |
| Gigabyte AERO 16 OLED BSF | |
| Geekbench 5.5 / Multi-Core | |
| Razer Blade 18 RTX 4070 | |
| Średnia w klasie Gaming (6460 - 27010, n=110, ostatnie 2 lata) | |
| Gigabyte Aero 16 YE5 | |
| Gigabyte AERO 16 OLED BSF | |
| Asus ZenBook Pro 16X OLED UX7602ZM-ME115W | |
| Przeciętny Intel Core i9-13900H (9094 - 15410, n=26) | |
| MSI CreatorPro Z16P B12UKST | |
| Asus TUF Gaming A16 FA617 | |
| Geekbench 5.5 / Single-Core | |
| Średnia w klasie Gaming (986 - 2474, n=110, ostatnie 2 lata) | |
| Razer Blade 18 RTX 4070 | |
| Przeciętny Intel Core i9-13900H (1140 - 2043, n=26) | |
| Gigabyte Aero 16 YE5 | |
| Asus ZenBook Pro 16X OLED UX7602ZM-ME115W | |
| MSI CreatorPro Z16P B12UKST | |
| Gigabyte AERO 16 OLED BSF | |
| Asus TUF Gaming A16 FA617 | |
| HWBOT x265 Benchmark v2.2 / 4k Preset | |
| Razer Blade 18 RTX 4070 | |
| Średnia w klasie Gaming (11.5 - 44.3, n=110, ostatnie 2 lata) | |
| Gigabyte AERO 16 OLED BSF | |
| MSI CreatorPro Z16P B12UKST | |
| Asus ZenBook Pro 16X OLED UX7602ZM-ME115W | |
| Przeciętny Intel Core i9-13900H (14.1 - 22.3, n=25) | |
| Gigabyte Aero 16 YE5 | |
| Asus TUF Gaming A16 FA617 | |
| LibreOffice / 20 Documents To PDF | |
| Asus TUF Gaming A16 FA617 | |
| Gigabyte AERO 16 OLED BSF | |
| Średnia w klasie Gaming (19 - 88.8, n=110, ostatnie 2 lata) | |
| Przeciętny Intel Core i9-13900H (34.4 - 82.8, n=25) | |
| Razer Blade 18 RTX 4070 | |
| Asus ZenBook Pro 16X OLED UX7602ZM-ME115W | |
| Gigabyte Aero 16 YE5 | |
| MSI CreatorPro Z16P B12UKST | |
| R Benchmark 2.5 / Overall mean | |
| Asus TUF Gaming A16 FA617 | |
| Gigabyte AERO 16 OLED BSF | |
| MSI CreatorPro Z16P B12UKST | |
| Przeciętny Intel Core i9-13900H (0.4052 - 0.723, n=25) | |
| Asus ZenBook Pro 16X OLED UX7602ZM-ME115W | |
| Średnia w klasie Gaming (0.3439 - 0.759, n=111, ostatnie 2 lata) | |
| Gigabyte Aero 16 YE5 | |
| Razer Blade 18 RTX 4070 | |
* ... im mniej tym lepiej
AIDA64: FP32 Ray-Trace | FPU Julia | CPU SHA3 | CPU Queen | FPU SinJulia | FPU Mandel | CPU AES | CPU ZLib | FP64 Ray-Trace | CPU PhotoWorxx
| Performance rating | |
| Razer Blade 18 RTX 4070 | |
| Średnia w klasie Gaming | |
| Gigabyte AERO 16 OLED BSF | |
| MSI CreatorPro Z16P B12UKST | |
| Asus TUF Gaming A16 FA617 | |
| Asus ZenBook Pro 16X OLED UX7602ZM-ME115W | |
| Przeciętny Intel Core i9-13900H | |
| Gigabyte Aero 16 YE5 | |
| AIDA64 / FP32 Ray-Trace | |
| Średnia w klasie Gaming (10227 - 85542, n=109, ostatnie 2 lata) | |
| Razer Blade 18 RTX 4070 | |
| Gigabyte AERO 16 OLED BSF | |
| Asus TUF Gaming A16 FA617 | |
| Przeciętny Intel Core i9-13900H (6788 - 19557, n=25) | |
| MSI CreatorPro Z16P B12UKST | |
| Asus ZenBook Pro 16X OLED UX7602ZM-ME115W | |
| Gigabyte Aero 16 YE5 | |
| AIDA64 / FPU Julia | |
| Średnia w klasie Gaming (51376 - 238426, n=109, ostatnie 2 lata) | |
| Razer Blade 18 RTX 4070 | |
| Asus TUF Gaming A16 FA617 | |
| Gigabyte AERO 16 OLED BSF | |
| Przeciętny Intel Core i9-13900H (22551 - 95579, n=25) | |
| Asus ZenBook Pro 16X OLED UX7602ZM-ME115W | |
| MSI CreatorPro Z16P B12UKST | |
| Gigabyte Aero 16 YE5 | |
| AIDA64 / CPU SHA3 | |
| Razer Blade 18 RTX 4070 | |
| Średnia w klasie Gaming (2180 - 9817, n=109, ostatnie 2 lata) | |
| Gigabyte AERO 16 OLED BSF | |
| Asus ZenBook Pro 16X OLED UX7602ZM-ME115W | |
| MSI CreatorPro Z16P B12UKST | |
| Przeciętny Intel Core i9-13900H (2491 - 4270, n=25) | |
| Asus TUF Gaming A16 FA617 | |
| Gigabyte Aero 16 YE5 | |
| AIDA64 / CPU Queen | |
| Razer Blade 18 RTX 4070 | |
| Średnia w klasie Gaming (49785 - 173351, n=100, ostatnie 2 lata) | |
| Asus ZenBook Pro 16X OLED UX7602ZM-ME115W | |
| Gigabyte Aero 16 YE5 | |
| Przeciętny Intel Core i9-13900H (65121 - 120936, n=25) | |
| Asus TUF Gaming A16 FA617 | |
| MSI CreatorPro Z16P B12UKST | |
| Gigabyte AERO 16 OLED BSF | |
| AIDA64 / FPU SinJulia | |
| Razer Blade 18 RTX 4070 | |
| Średnia w klasie Gaming (4424 - 33636, n=109, ostatnie 2 lata) | |
| Asus TUF Gaming A16 FA617 | |
| Gigabyte AERO 16 OLED BSF | |
| Asus ZenBook Pro 16X OLED UX7602ZM-ME115W | |
| Przeciętny Intel Core i9-13900H (6108 - 11631, n=25) | |
| Gigabyte Aero 16 YE5 | |
| MSI CreatorPro Z16P B12UKST | |
| AIDA64 / FPU Mandel | |
| Średnia w klasie Gaming (25115 - 128721, n=109, ostatnie 2 lata) | |
| Razer Blade 18 RTX 4070 | |
| Asus TUF Gaming A16 FA617 | |
| Gigabyte AERO 16 OLED BSF | |
| Przeciętny Intel Core i9-13900H (11283 - 48474, n=25) | |
| Asus ZenBook Pro 16X OLED UX7602ZM-ME115W | |
| MSI CreatorPro Z16P B12UKST | |
| Gigabyte Aero 16 YE5 | |
| AIDA64 / CPU AES | |
| Gigabyte AERO 16 OLED BSF | |
| MSI CreatorPro Z16P B12UKST | |
| Razer Blade 18 RTX 4070 | |
| Średnia w klasie Gaming (39258 - 247074, n=109, ostatnie 2 lata) | |
| Gigabyte Aero 16 YE5 | |
| Przeciętny Intel Core i9-13900H (3691 - 149377, n=25) | |
| Asus ZenBook Pro 16X OLED UX7602ZM-ME115W | |
| Asus TUF Gaming A16 FA617 | |
| AIDA64 / CPU ZLib | |
| Razer Blade 18 RTX 4070 | |
| Średnia w klasie Gaming (574 - 2531, n=109, ostatnie 2 lata) | |
| Gigabyte AERO 16 OLED BSF | |
| Przeciętny Intel Core i9-13900H (789 - 1254, n=25) | |
| Asus ZenBook Pro 16X OLED UX7602ZM-ME115W | |
| MSI CreatorPro Z16P B12UKST | |
| Gigabyte Aero 16 YE5 | |
| Asus TUF Gaming A16 FA617 | |
| AIDA64 / FP64 Ray-Trace | |
| Średnia w klasie Gaming (5509 - 45446, n=109, ostatnie 2 lata) | |
| Razer Blade 18 RTX 4070 | |
| Gigabyte AERO 16 OLED BSF | |
| Asus TUF Gaming A16 FA617 | |
| Przeciętny Intel Core i9-13900H (3655 - 10716, n=25) | |
| Asus ZenBook Pro 16X OLED UX7602ZM-ME115W | |
| MSI CreatorPro Z16P B12UKST | |
| Gigabyte Aero 16 YE5 | |
| AIDA64 / CPU PhotoWorxx | |
| Razer Blade 18 RTX 4070 | |
| Asus ZenBook Pro 16X OLED UX7602ZM-ME115W | |
| Gigabyte AERO 16 OLED BSF | |
| Średnia w klasie Gaming (12271 - 89891, n=109, ostatnie 2 lata) | |
| MSI CreatorPro Z16P B12UKST | |
| Przeciętny Intel Core i9-13900H (10871 - 50488, n=25) | |
| Gigabyte Aero 16 YE5 | |
| Asus TUF Gaming A16 FA617 | |
Wydajność systemu
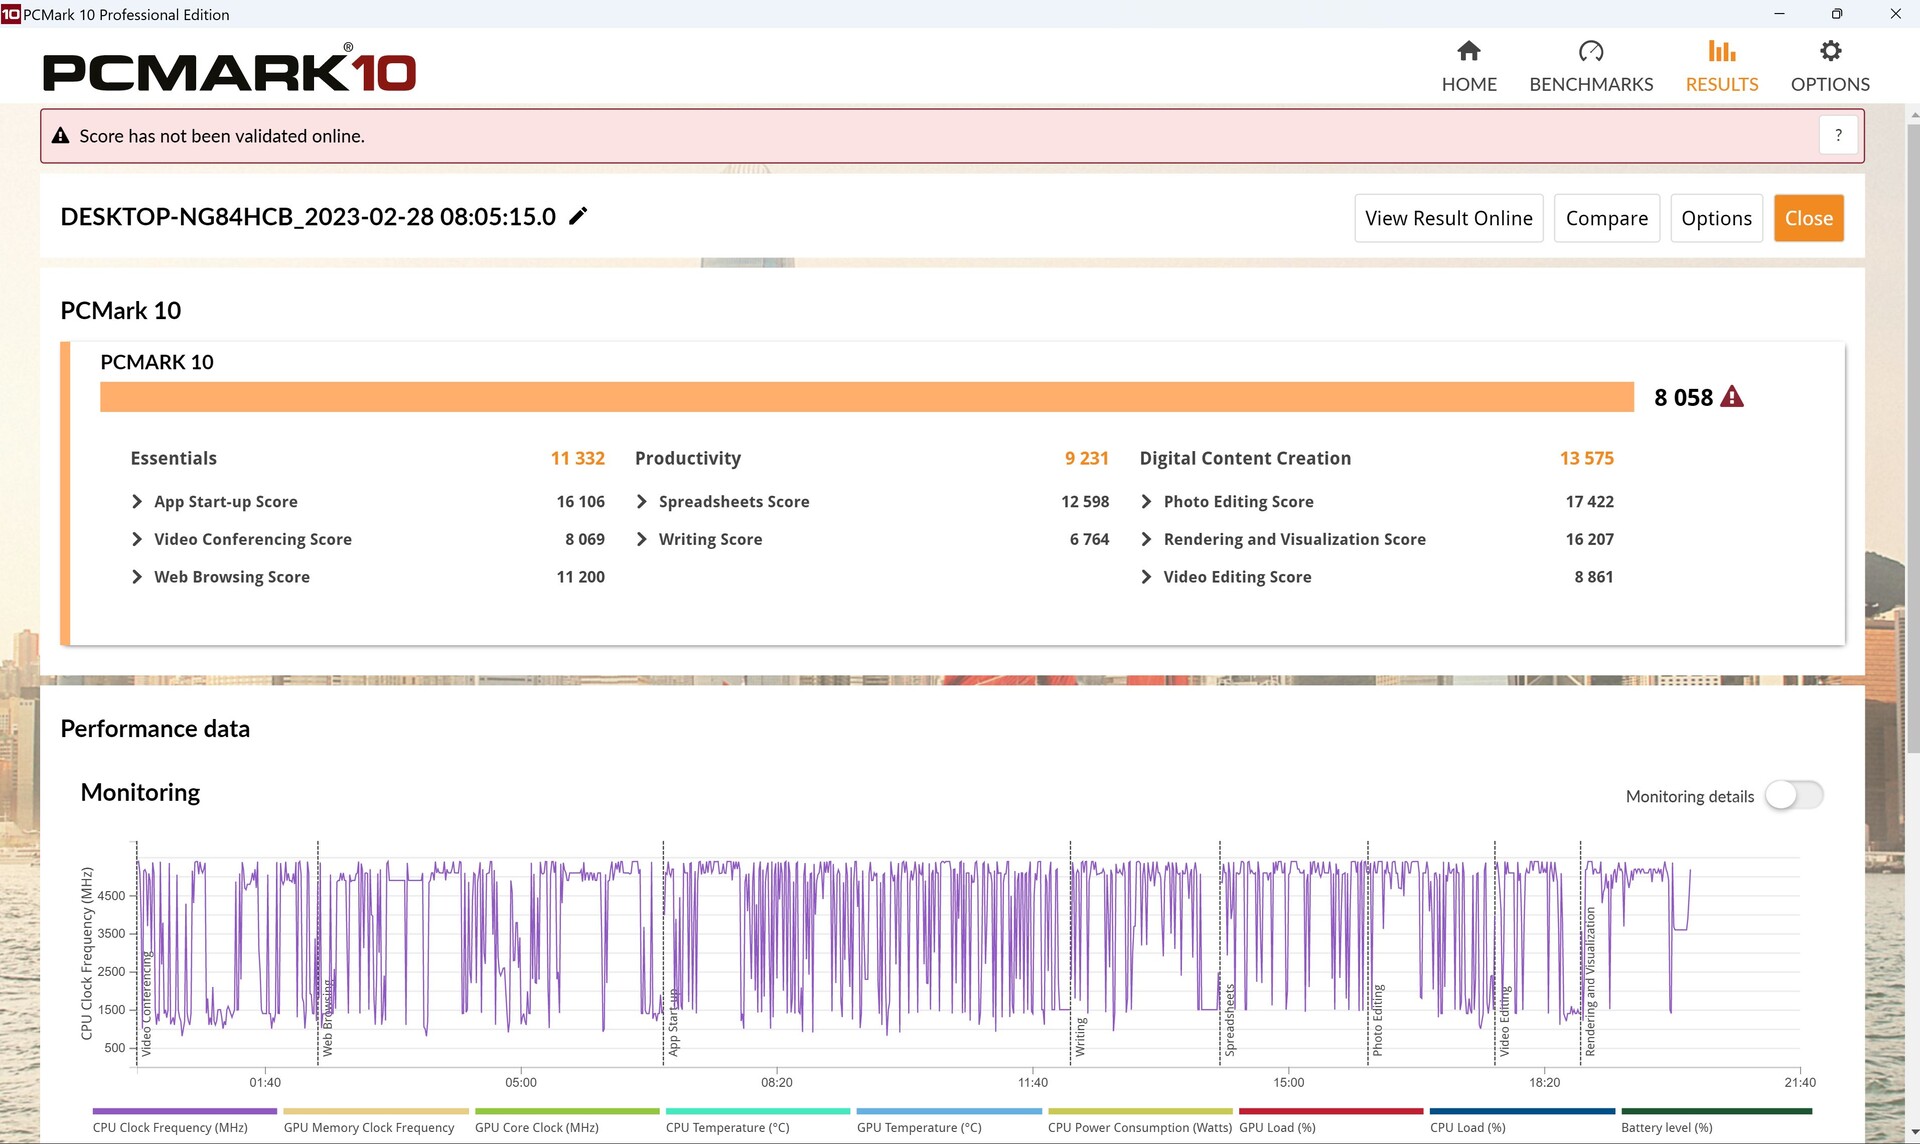
W PCMark 10 nasze Aero wymienia się ciosami z zeszłorocznymMSI CreatorPro Z16Pniestety Aero ma słaby wynik wydajności, ale w pozostałych sub-testach wypada bardzo dobrze.
CrossMark: Overall | Productivity | Creativity | Responsiveness
| PCMark 10 / Score | |
| Średnia w klasie Gaming (5828 - 11574, n=95, ostatnie 2 lata) | |
| Gigabyte AERO 16 OLED BSF | |
| Gigabyte Aero 16 YE5 | |
| Przeciętny Intel Core i9-13900H, NVIDIA GeForce RTX 4070 Laptop GPU (5855 - 8538, n=8) | |
| Razer Blade 18 RTX 4070 | |
| Asus ZenBook Pro 16X OLED UX7602ZM-ME115W | |
| Asus TUF Gaming A16 FA617 | |
| MSI CreatorPro Z16P B12UKST | |
| PCMark 10 / Essentials | |
| Razer Blade 18 RTX 4070 | |
| Gigabyte AERO 16 OLED BSF | |
| Asus ZenBook Pro 16X OLED UX7602ZM-ME115W | |
| Gigabyte Aero 16 YE5 | |
| Przeciętny Intel Core i9-13900H, NVIDIA GeForce RTX 4070 Laptop GPU (8835 - 11940, n=8) | |
| Średnia w klasie Gaming (8810 - 12600, n=99, ostatnie 2 lata) | |
| Asus TUF Gaming A16 FA617 | |
| MSI CreatorPro Z16P B12UKST | |
| PCMark 10 / Productivity | |
| Średnia w klasie Gaming (6845 - 18766, n=97, ostatnie 2 lata) | |
| Asus ZenBook Pro 16X OLED UX7602ZM-ME115W | |
| Gigabyte Aero 16 YE5 | |
| Przeciętny Intel Core i9-13900H, NVIDIA GeForce RTX 4070 Laptop GPU (7967 - 10991, n=8) | |
| Razer Blade 18 RTX 4070 | |
| MSI CreatorPro Z16P B12UKST | |
| Asus TUF Gaming A16 FA617 | |
| Gigabyte AERO 16 OLED BSF | |
| PCMark 10 / Digital Content Creation | |
| Średnia w klasie Gaming (7602 - 19657, n=97, ostatnie 2 lata) | |
| Gigabyte AERO 16 OLED BSF | |
| Gigabyte Aero 16 YE5 | |
| Przeciętny Intel Core i9-13900H, NVIDIA GeForce RTX 4070 Laptop GPU (7738 - 13575, n=8) | |
| Asus TUF Gaming A16 FA617 | |
| Razer Blade 18 RTX 4070 | |
| Asus ZenBook Pro 16X OLED UX7602ZM-ME115W | |
| MSI CreatorPro Z16P B12UKST | |
| CrossMark / Overall | |
| Razer Blade 18 RTX 4070 | |
| Gigabyte Aero 16 YE5 | |
| Średnia w klasie Gaming (1366 - 2409, n=97, ostatnie 2 lata) | |
| MSI CreatorPro Z16P B12UKST | |
| Gigabyte AERO 16 OLED BSF | |
| Przeciętny Intel Core i9-13900H, NVIDIA GeForce RTX 4070 Laptop GPU (1104 - 1974, n=7) | |
| Asus ZenBook Pro 16X OLED UX7602ZM-ME115W | |
| CrossMark / Productivity | |
| Gigabyte Aero 16 YE5 | |
| Razer Blade 18 RTX 4070 | |
| Średnia w klasie Gaming (1386 - 2254, n=97, ostatnie 2 lata) | |
| MSI CreatorPro Z16P B12UKST | |
| Gigabyte AERO 16 OLED BSF | |
| Przeciętny Intel Core i9-13900H, NVIDIA GeForce RTX 4070 Laptop GPU (1058 - 1914, n=7) | |
| Asus ZenBook Pro 16X OLED UX7602ZM-ME115W | |
| CrossMark / Creativity | |
| Razer Blade 18 RTX 4070 | |
| Średnia w klasie Gaming (1343 - 2729, n=97, ostatnie 2 lata) | |
| Gigabyte Aero 16 YE5 | |
| MSI CreatorPro Z16P B12UKST | |
| Asus ZenBook Pro 16X OLED UX7602ZM-ME115W | |
| Przeciętny Intel Core i9-13900H, NVIDIA GeForce RTX 4070 Laptop GPU (1178 - 2254, n=7) | |
| Gigabyte AERO 16 OLED BSF | |
| CrossMark / Responsiveness | |
| Gigabyte Aero 16 YE5 | |
| Gigabyte AERO 16 OLED BSF | |
| Razer Blade 18 RTX 4070 | |
| MSI CreatorPro Z16P B12UKST | |
| Średnia w klasie Gaming (1226 - 2334, n=97, ostatnie 2 lata) | |
| Przeciętny Intel Core i9-13900H, NVIDIA GeForce RTX 4070 Laptop GPU (1037 - 1952, n=7) | |
| Asus ZenBook Pro 16X OLED UX7602ZM-ME115W | |
| PCMark 10 Score | 8058 pkt. | |
Pomoc | ||
| AIDA64 / Memory Copy | |
| Średnia w klasie Gaming (21750 - 129946, n=109, ostatnie 2 lata) | |
| Asus ZenBook Pro 16X OLED UX7602ZM-ME115W | |
| Gigabyte AERO 16 OLED BSF | |
| MSI CreatorPro Z16P B12UKST | |
| Gigabyte Aero 16 YE5 | |
| Przeciętny Intel Core i9-13900H (37448 - 74486, n=25) | |
| MSI Katana 17 B13VFK | |
| Asus TUF Gaming A16 FA617 | |
| AIDA64 / Memory Read | |
| Średnia w klasie Gaming (22956 - 118858, n=109, ostatnie 2 lata) | |
| Asus ZenBook Pro 16X OLED UX7602ZM-ME115W | |
| Gigabyte AERO 16 OLED BSF | |
| Gigabyte Aero 16 YE5 | |
| MSI CreatorPro Z16P B12UKST | |
| Przeciętny Intel Core i9-13900H (41599 - 75433, n=25) | |
| MSI Katana 17 B13VFK | |
| Asus TUF Gaming A16 FA617 | |
| AIDA64 / Memory Write | |
| Średnia w klasie Gaming (22297 - 135096, n=109, ostatnie 2 lata) | |
| Gigabyte AERO 16 OLED BSF | |
| MSI CreatorPro Z16P B12UKST | |
| Przeciętny Intel Core i9-13900H (36152 - 88505, n=25) | |
| Asus ZenBook Pro 16X OLED UX7602ZM-ME115W | |
| Gigabyte Aero 16 YE5 | |
| Asus TUF Gaming A16 FA617 | |
| MSI Katana 17 B13VFK | |
| AIDA64 / Memory Latency | |
| Asus ZenBook Pro 16X OLED UX7602ZM-ME115W | |
| Średnia w klasie Gaming (75.3 - 259, n=109, ostatnie 2 lata) | |
| MSI Katana 17 B13VFK | |
| MSI CreatorPro Z16P B12UKST | |
| Gigabyte AERO 16 OLED BSF | |
| Gigabyte Aero 16 YE5 | |
| Przeciętny Intel Core i9-13900H (75.8 - 102.3, n=25) | |
| Asus TUF Gaming A16 FA617 | |
* ... im mniej tym lepiej
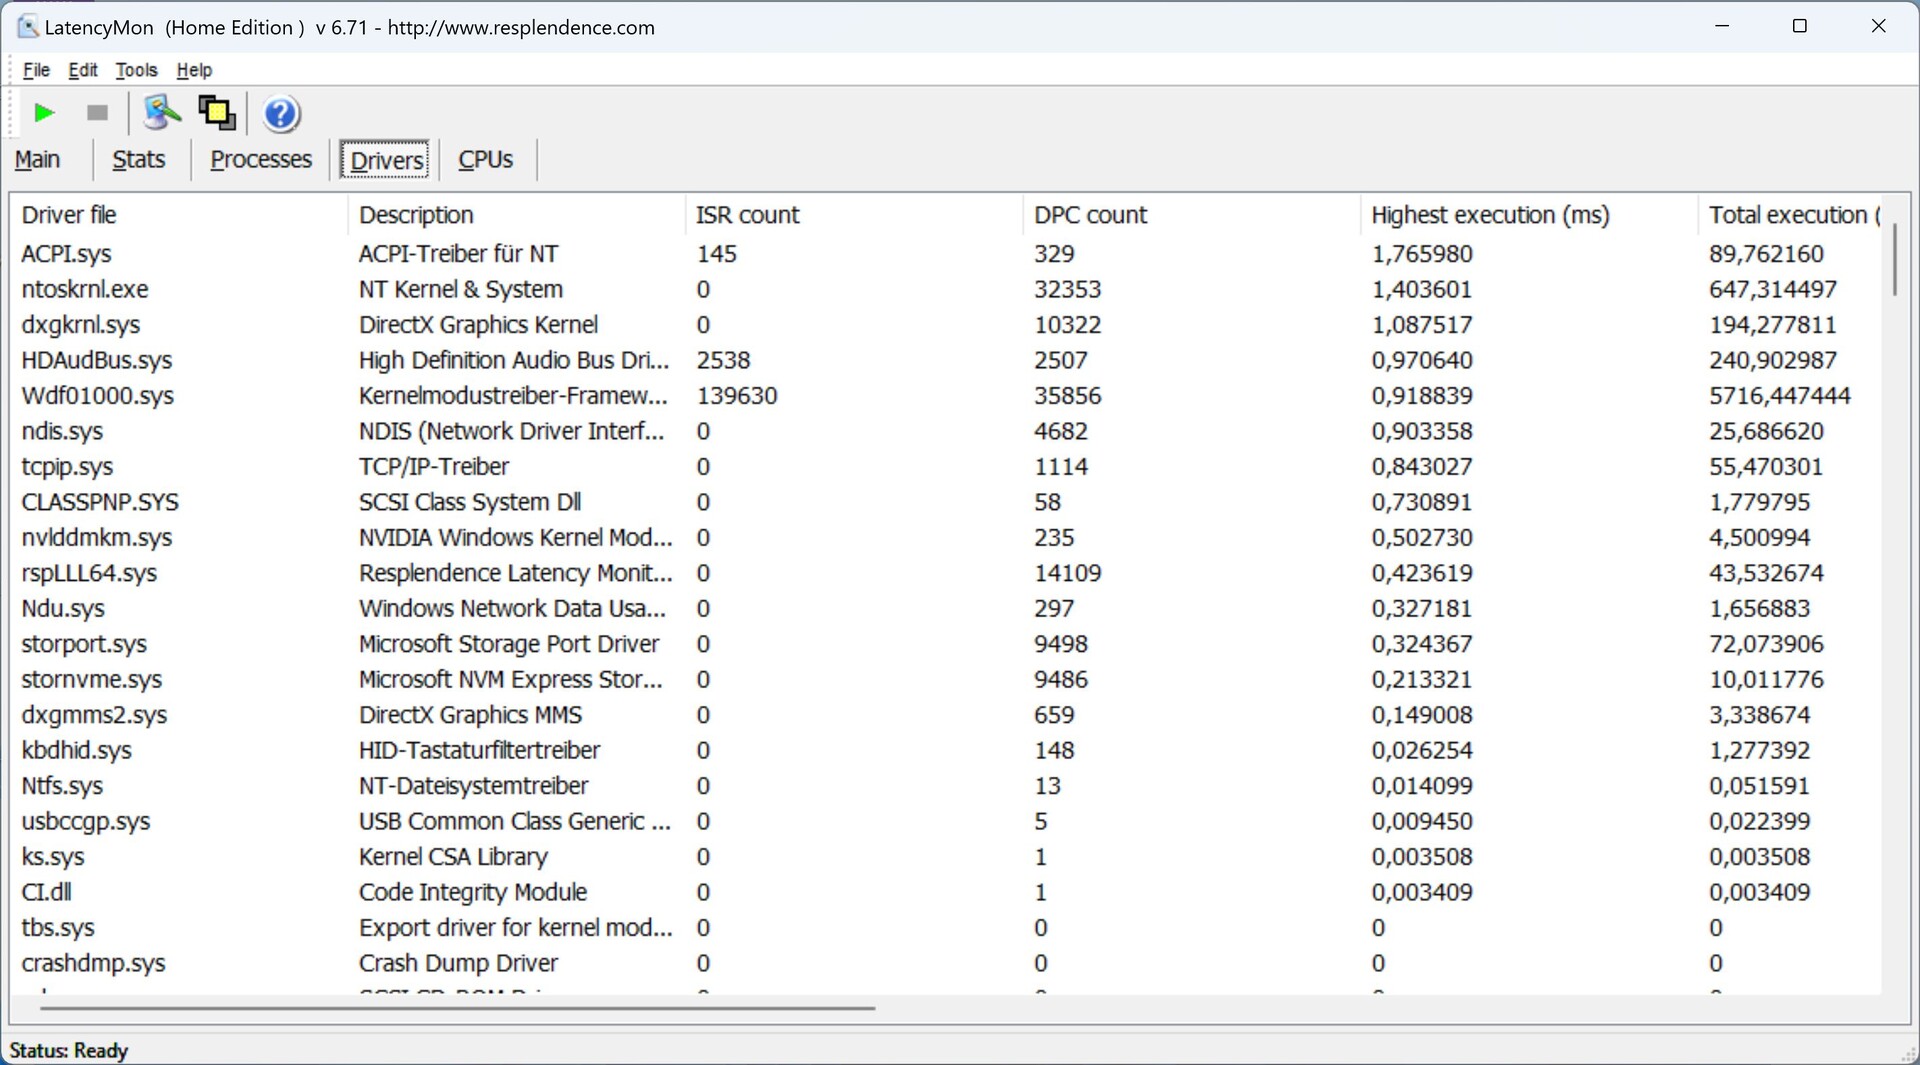
Opóźnienie DPC
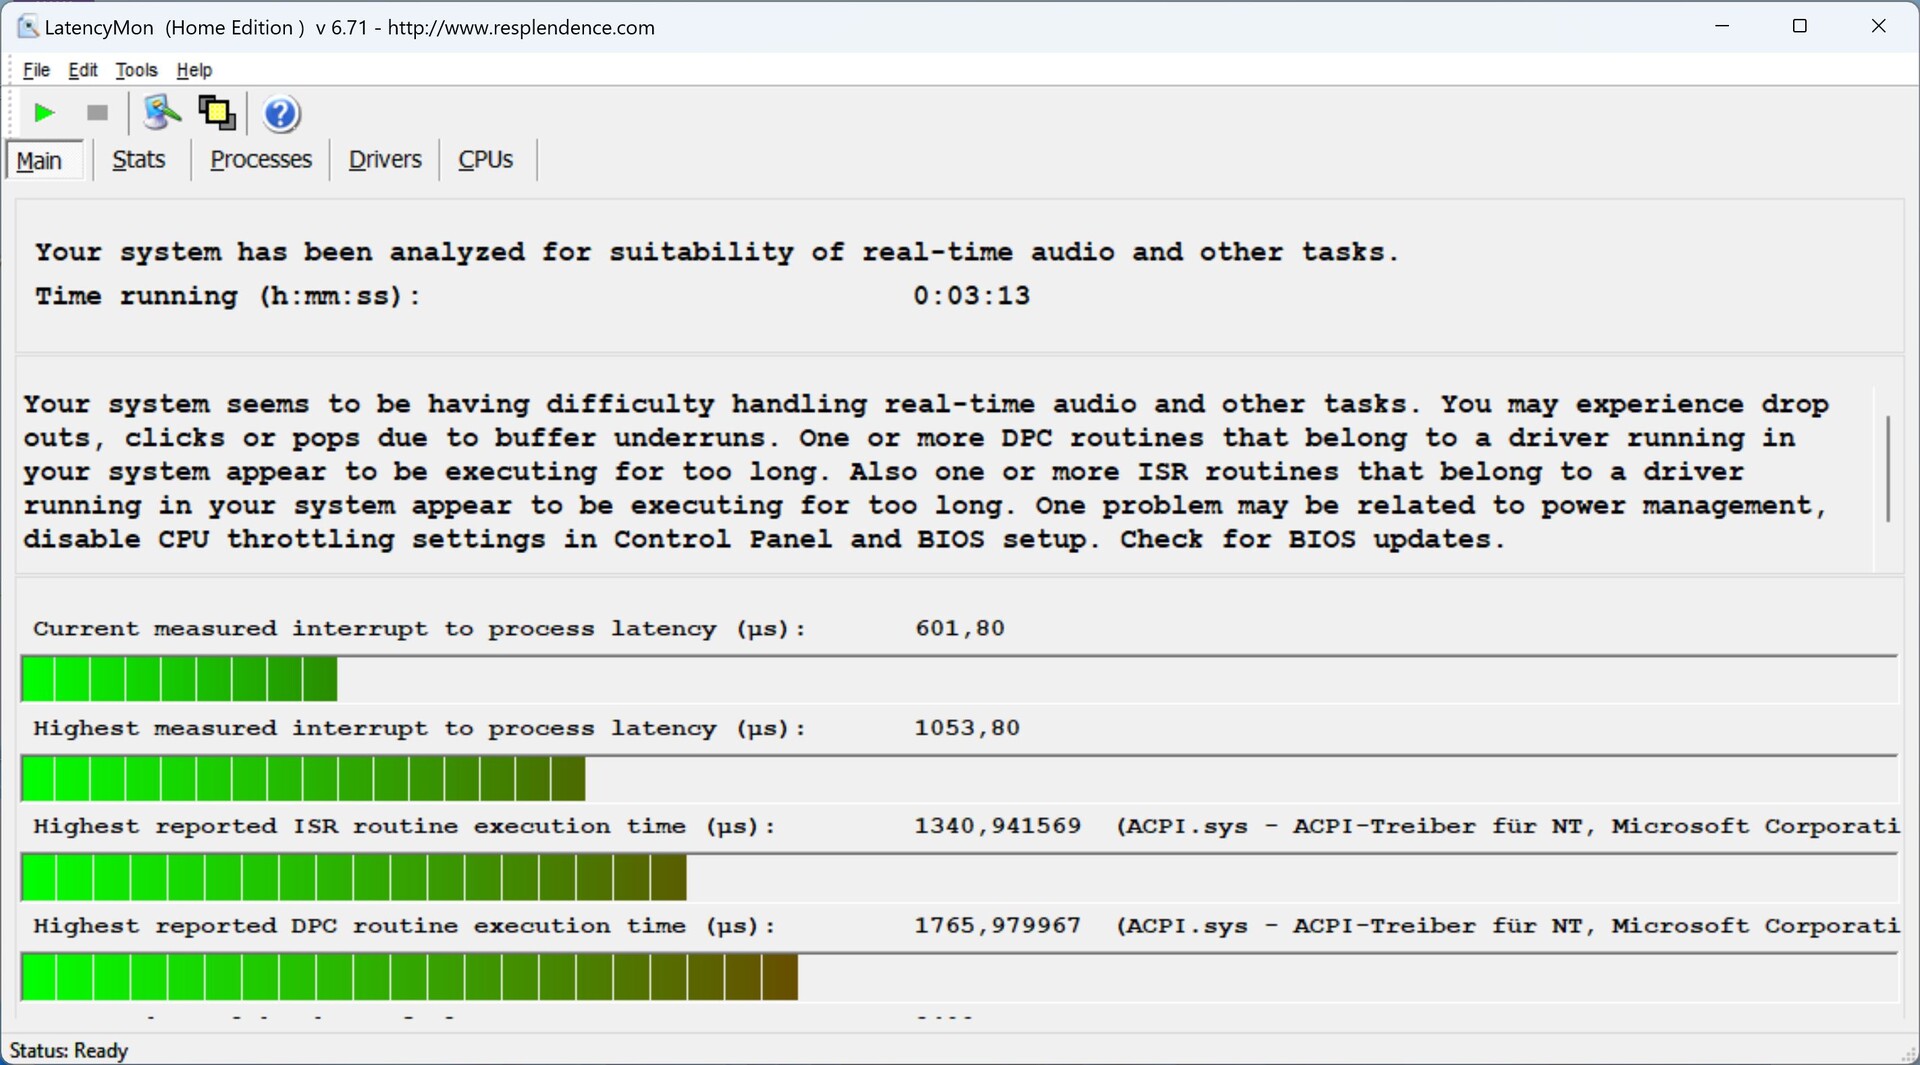
Krótko po uruchomieniu LatencyMon program wykrywa pierwsze opóźnienia DPC. Rosną one dalej podczas uruchamiania przeglądarki i otwierania wielu kart. Z kolei nasze wideo z YouTube w 4K/60 fps jest renderowane płynnie i bez pomijanych klatek.
Razer Blade 18
ma jeszcze gorsze wartości latencji niż nasze Aero.<p style>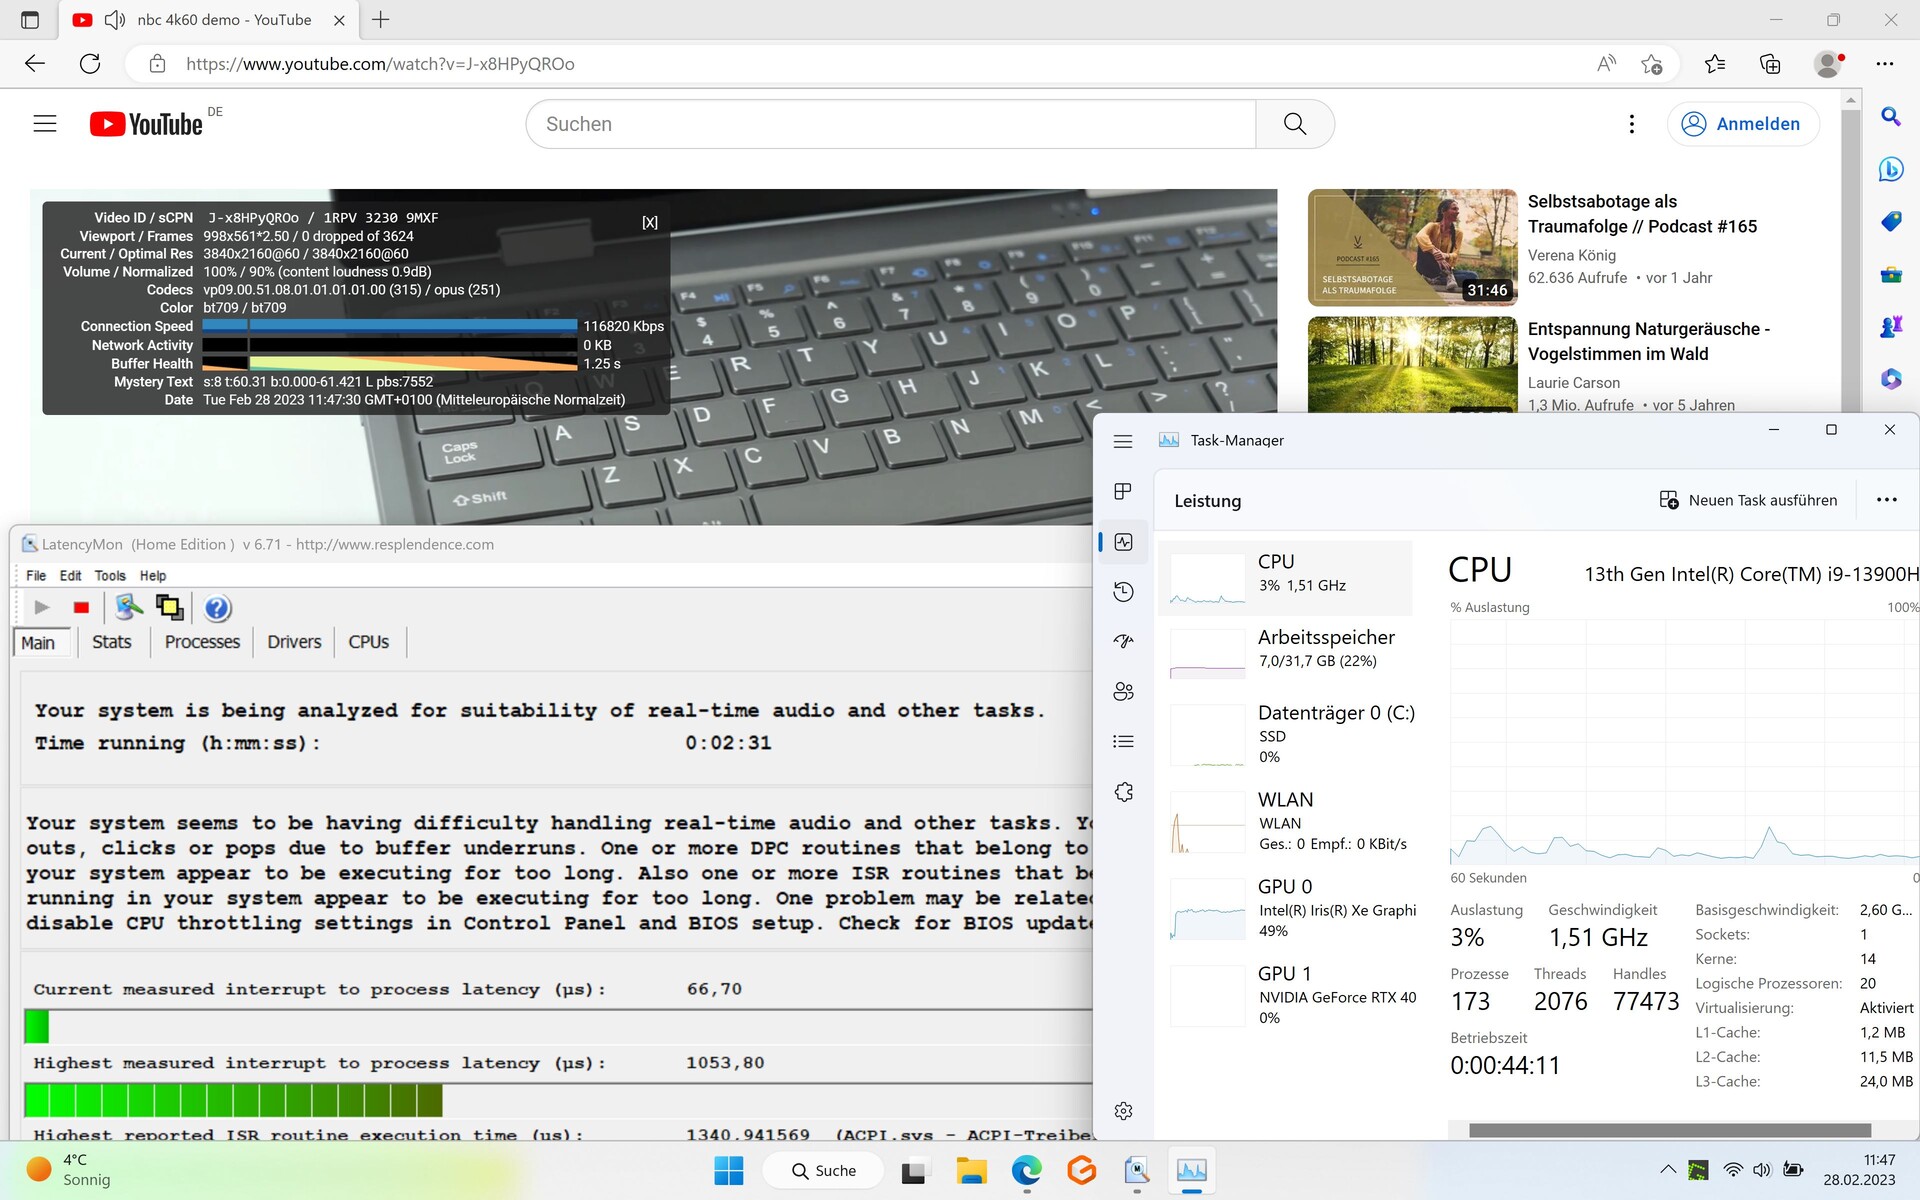
| DPC Latencies / LatencyMon - interrupt to process latency (max), Web, Youtube, Prime95 | |
| Razer Blade 18 RTX 4070 | |
| Gigabyte AERO 16 OLED BSF | |
| Gigabyte Aero 16 YE5 | |
| MSI CreatorPro Z16P B12UKST | |
| Asus ZenBook Pro 16X OLED UX7602ZM-ME115W | |
| Asus TUF Gaming A16 FA617 | |
* ... im mniej tym lepiej
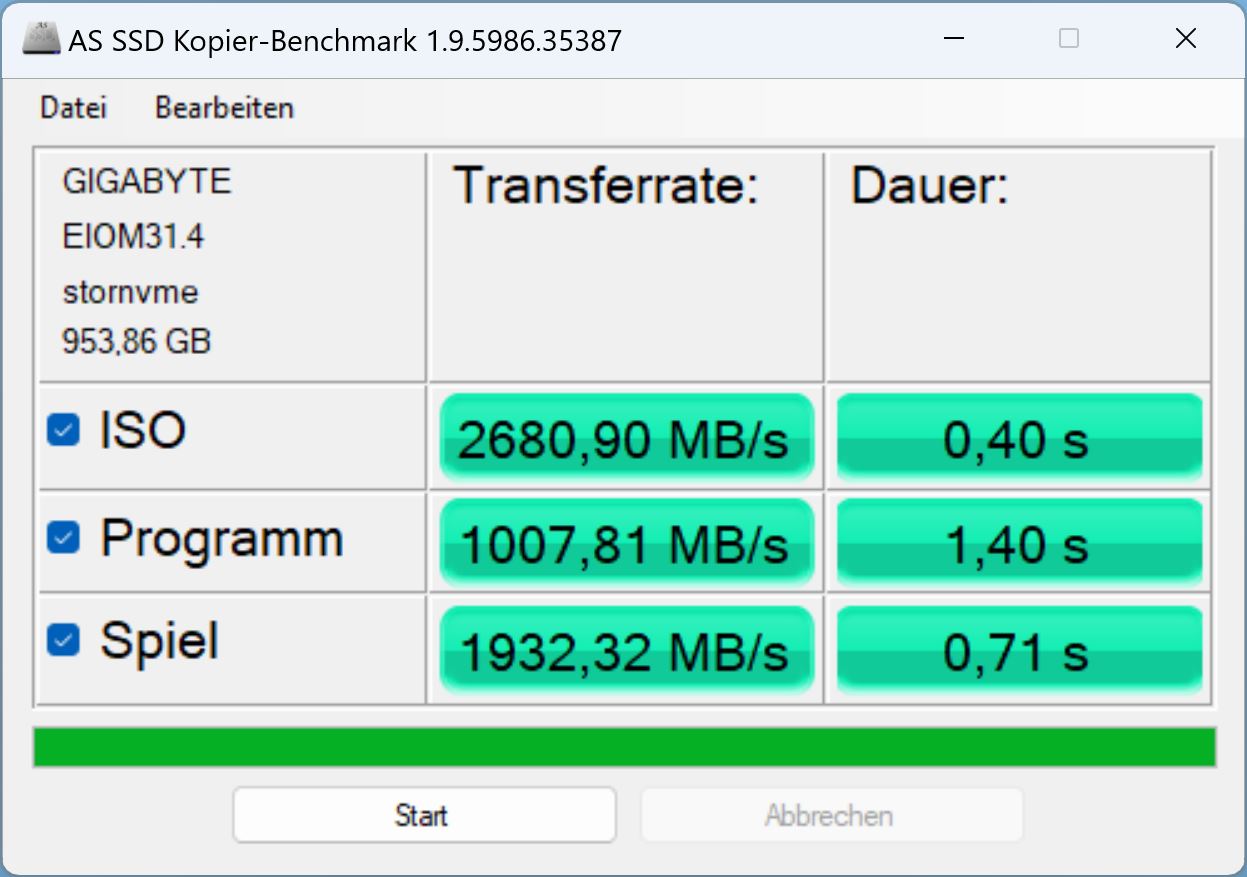
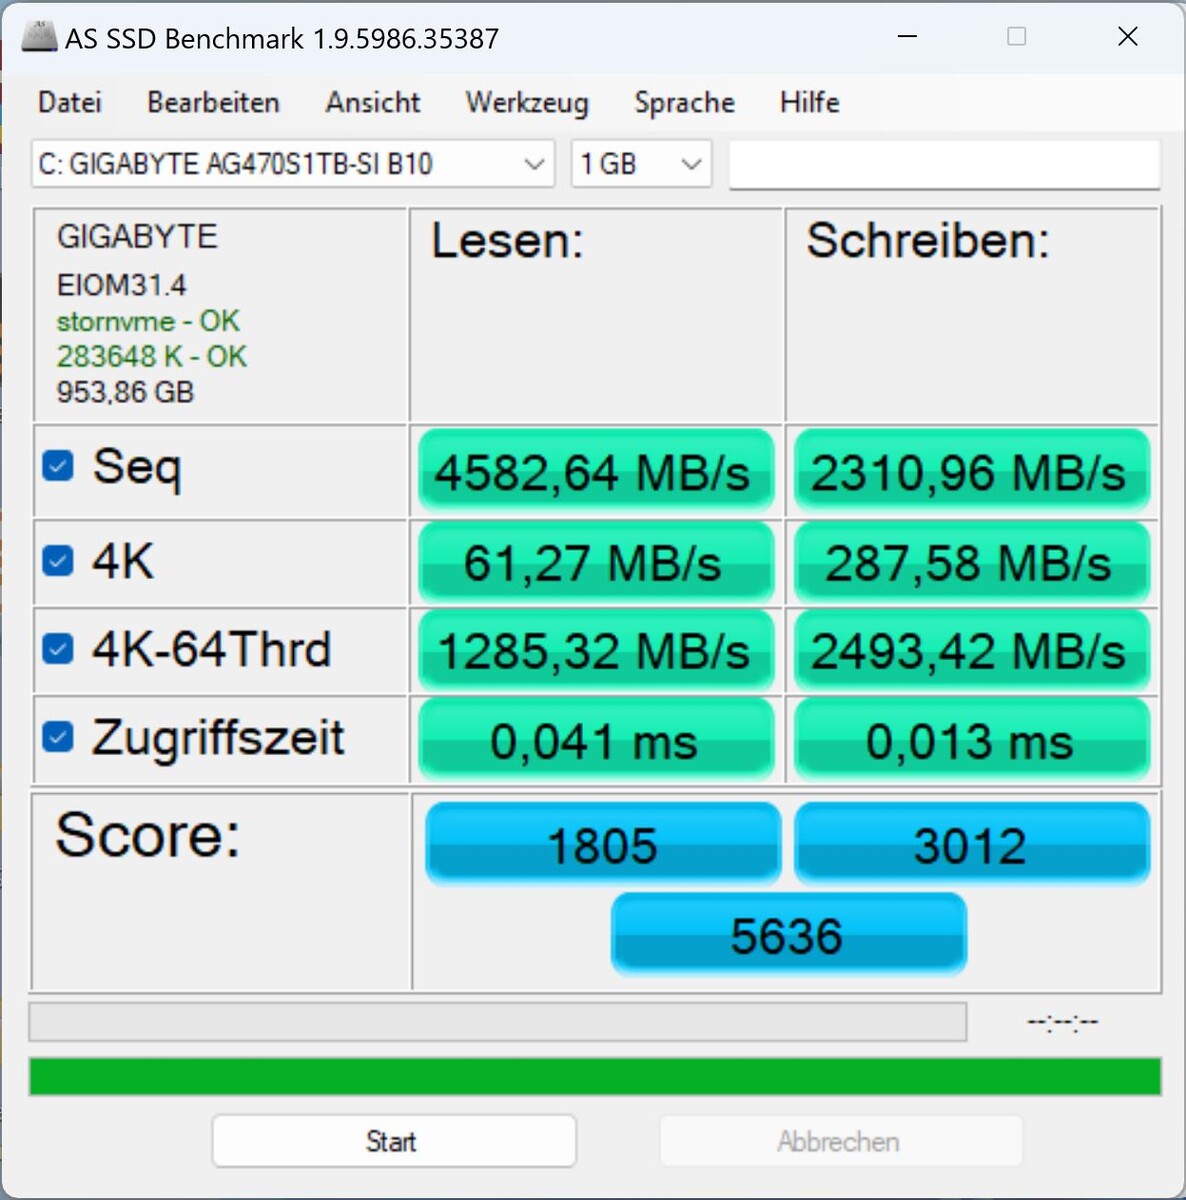
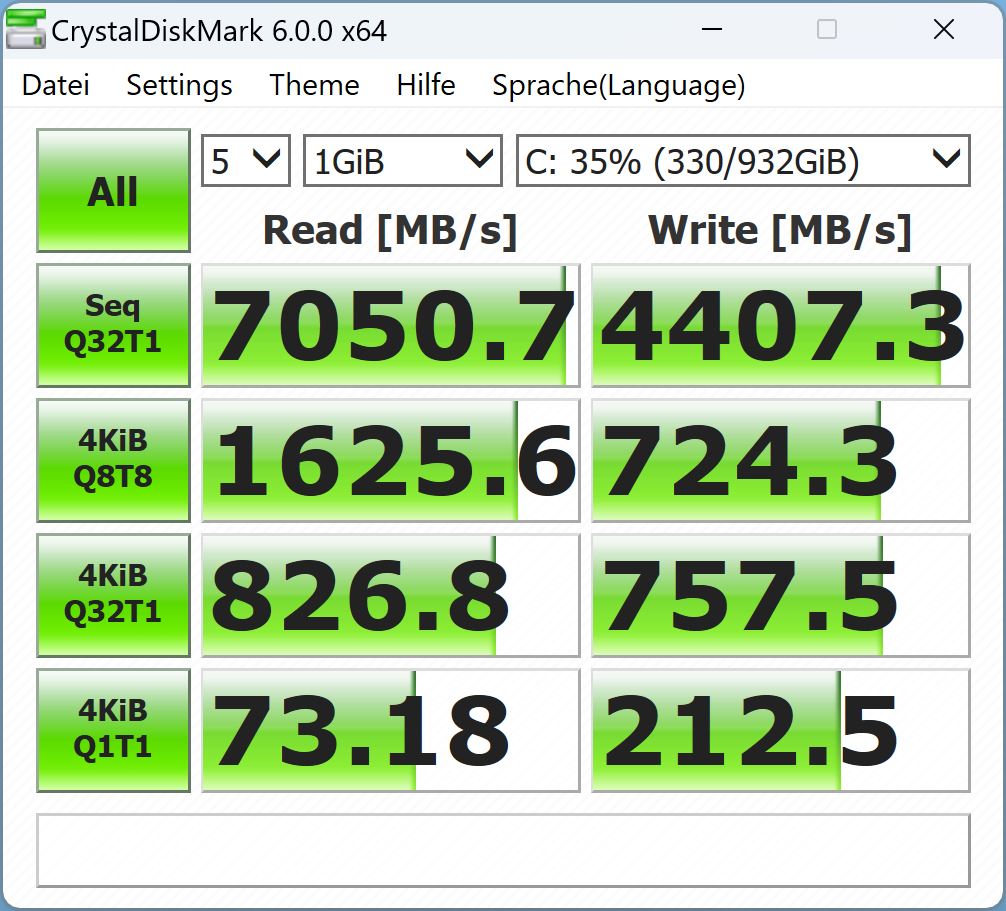
Urządzenie do przechowywania danych
Producent stosuje bardzo szybki dysk SSD PCIe Gen4 NVMe własnej firmy. Zajmuje on obecnie drugie miejsce w naszym zestawieniu najlepszych.
Tutejszy model nie do końca osiąga swoją najlepszą wydajność, zwłaszcza że pamięć Phison w poprzedniku (pozycja 1) jest nieco szybsza.
Przynajmniej wydajność jest w miarę stała i dobrze, że do płyty bazowej dołączona jest podkładka chłodząca.

| Drive Performance rating - Percent | |
| Gigabyte Aero 16 YE5 | |
| MSI CreatorPro Z16P B12UKST -8! | |
| Przeciętny Gigabyte AG470S1TB-SI B10 | |
| Razer Blade 18 RTX 4070 | |
| Gigabyte AERO 16 OLED BSF | |
| Średnia w klasie Gaming | |
| Asus ZenBook Pro 16X OLED UX7602ZM-ME115W | |
| Asus TUF Gaming A16 FA617 | |
* ... im mniej tym lepiej
Sustained Read Performance: DiskSpd Read Loop, Queue Depth 8
Karta graficzna
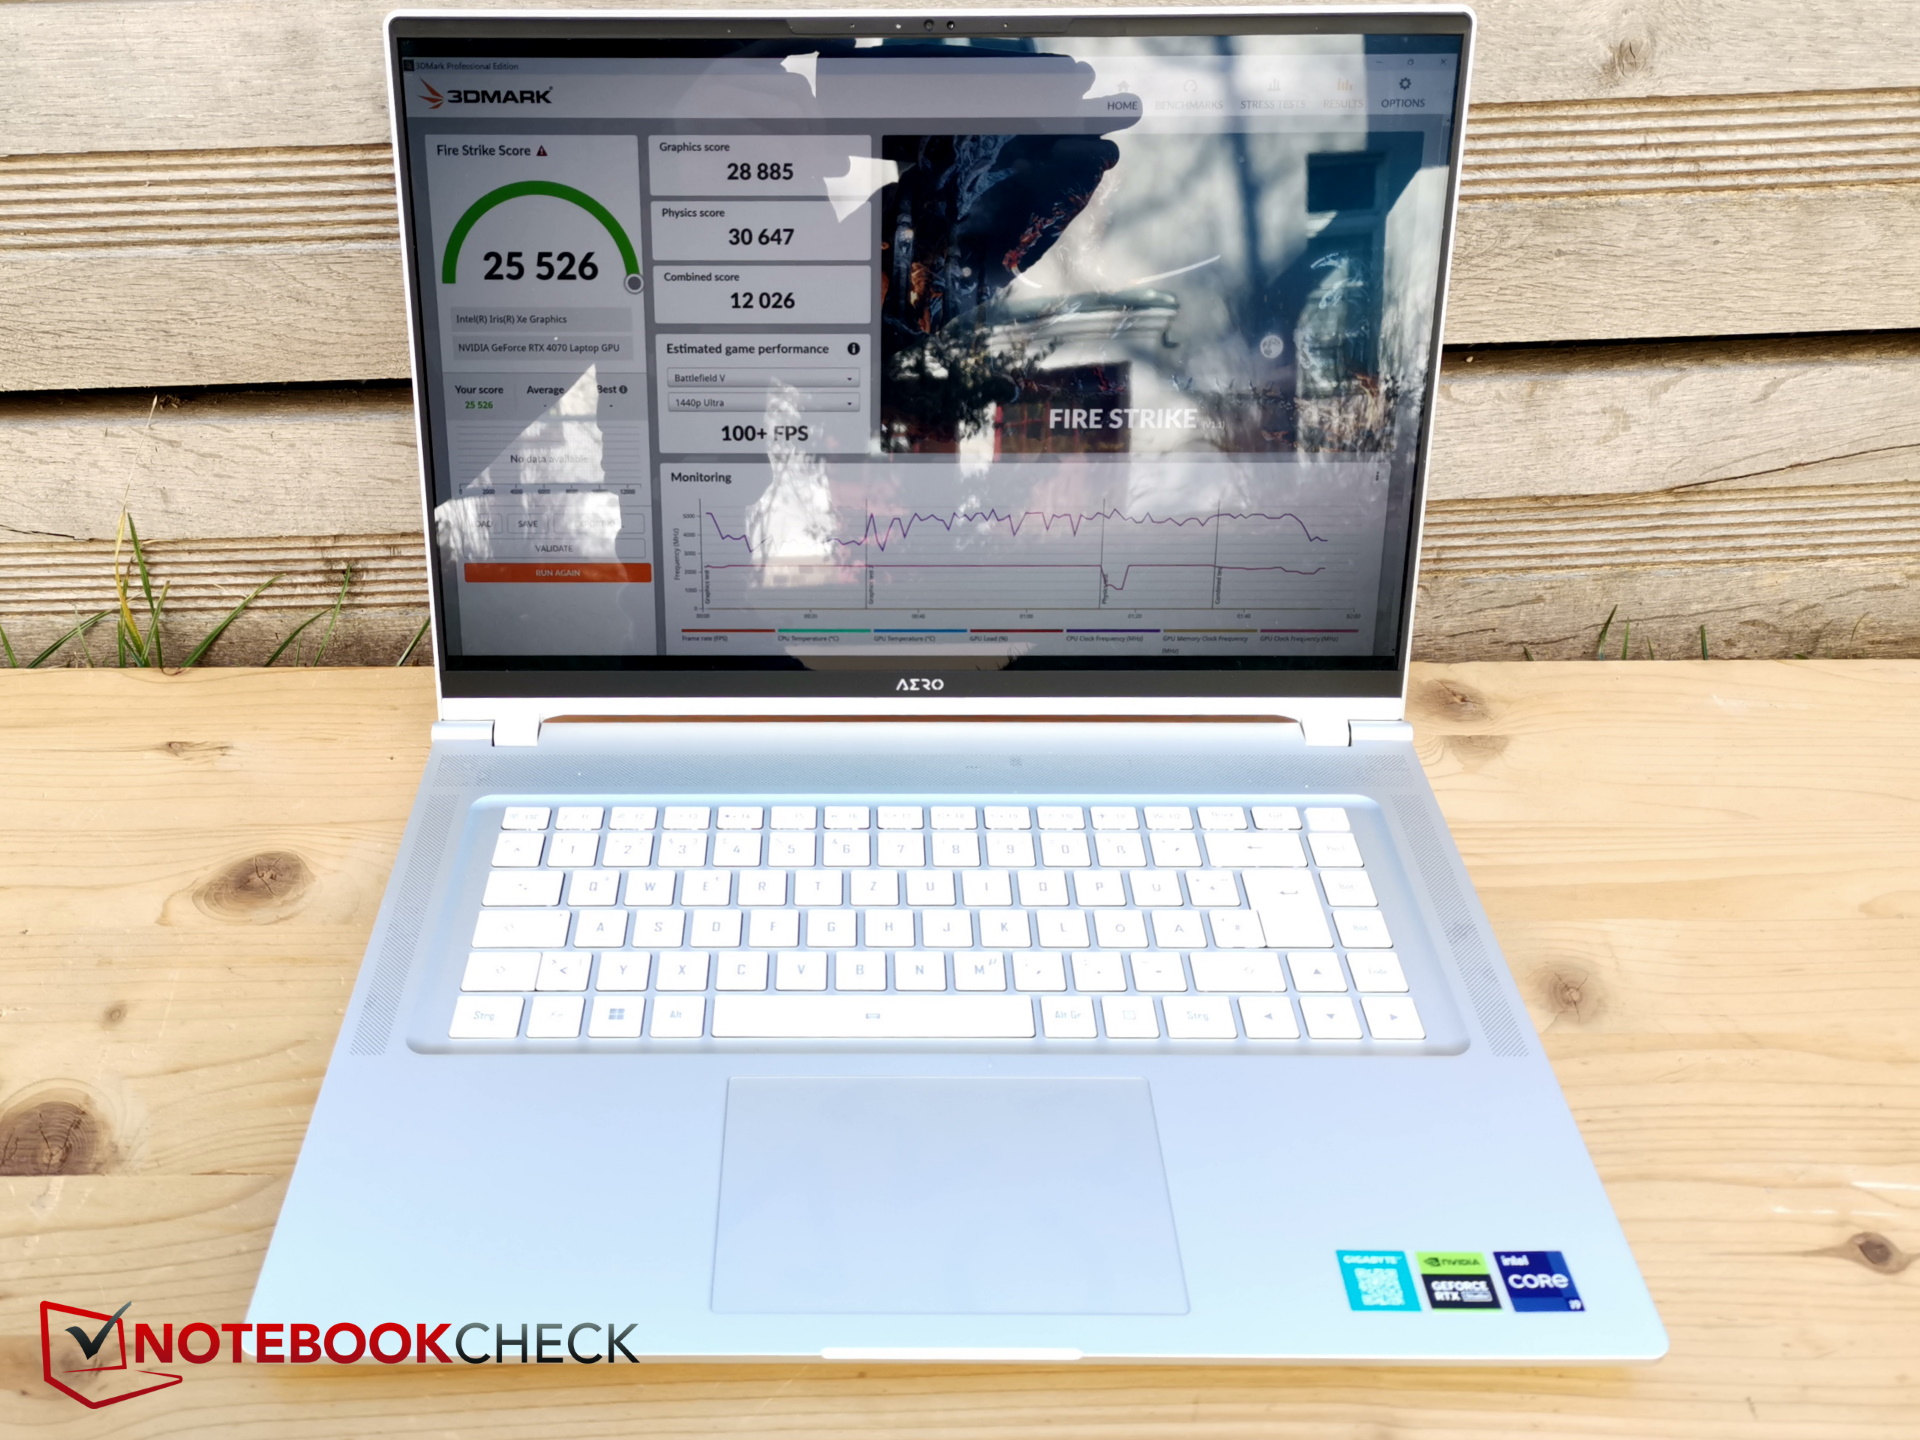
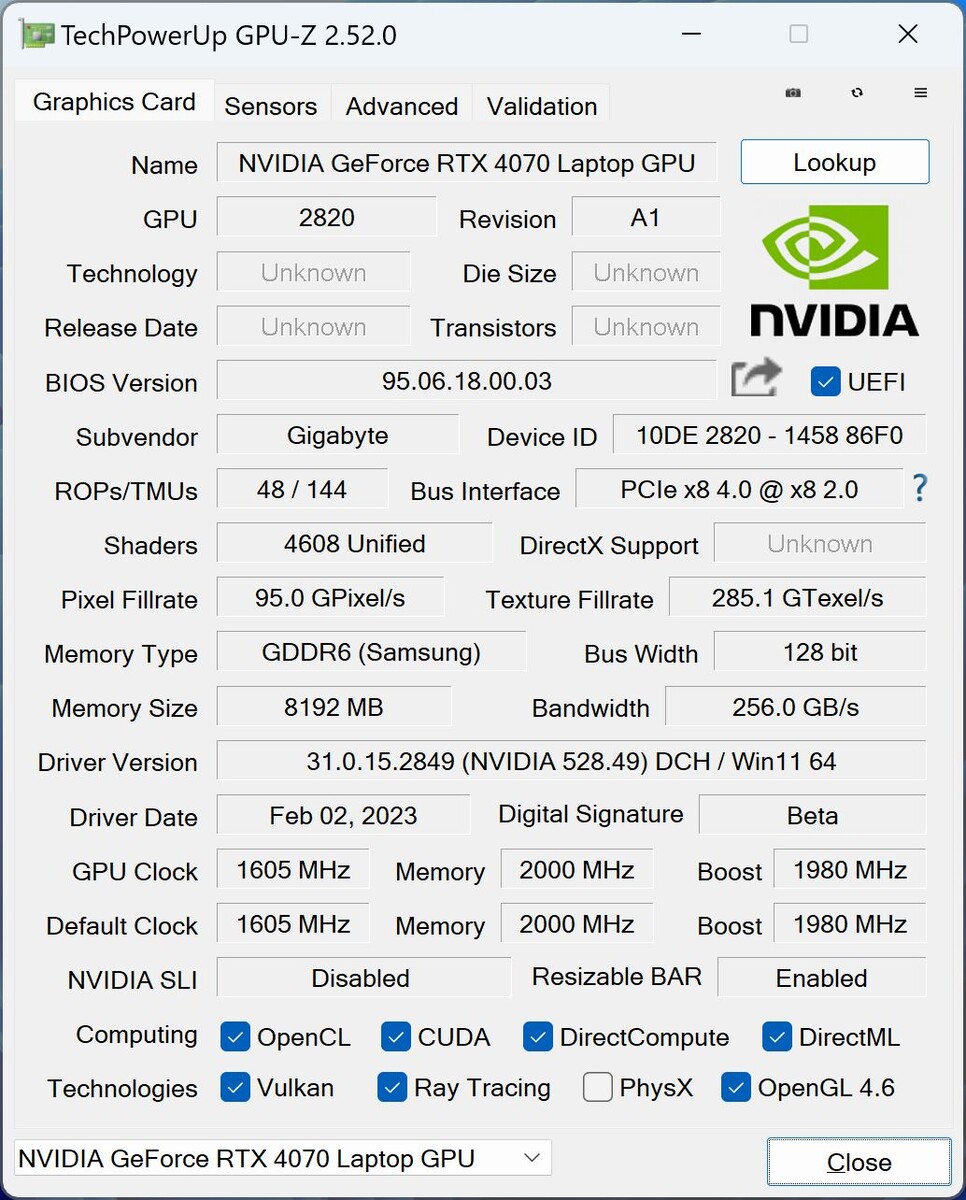
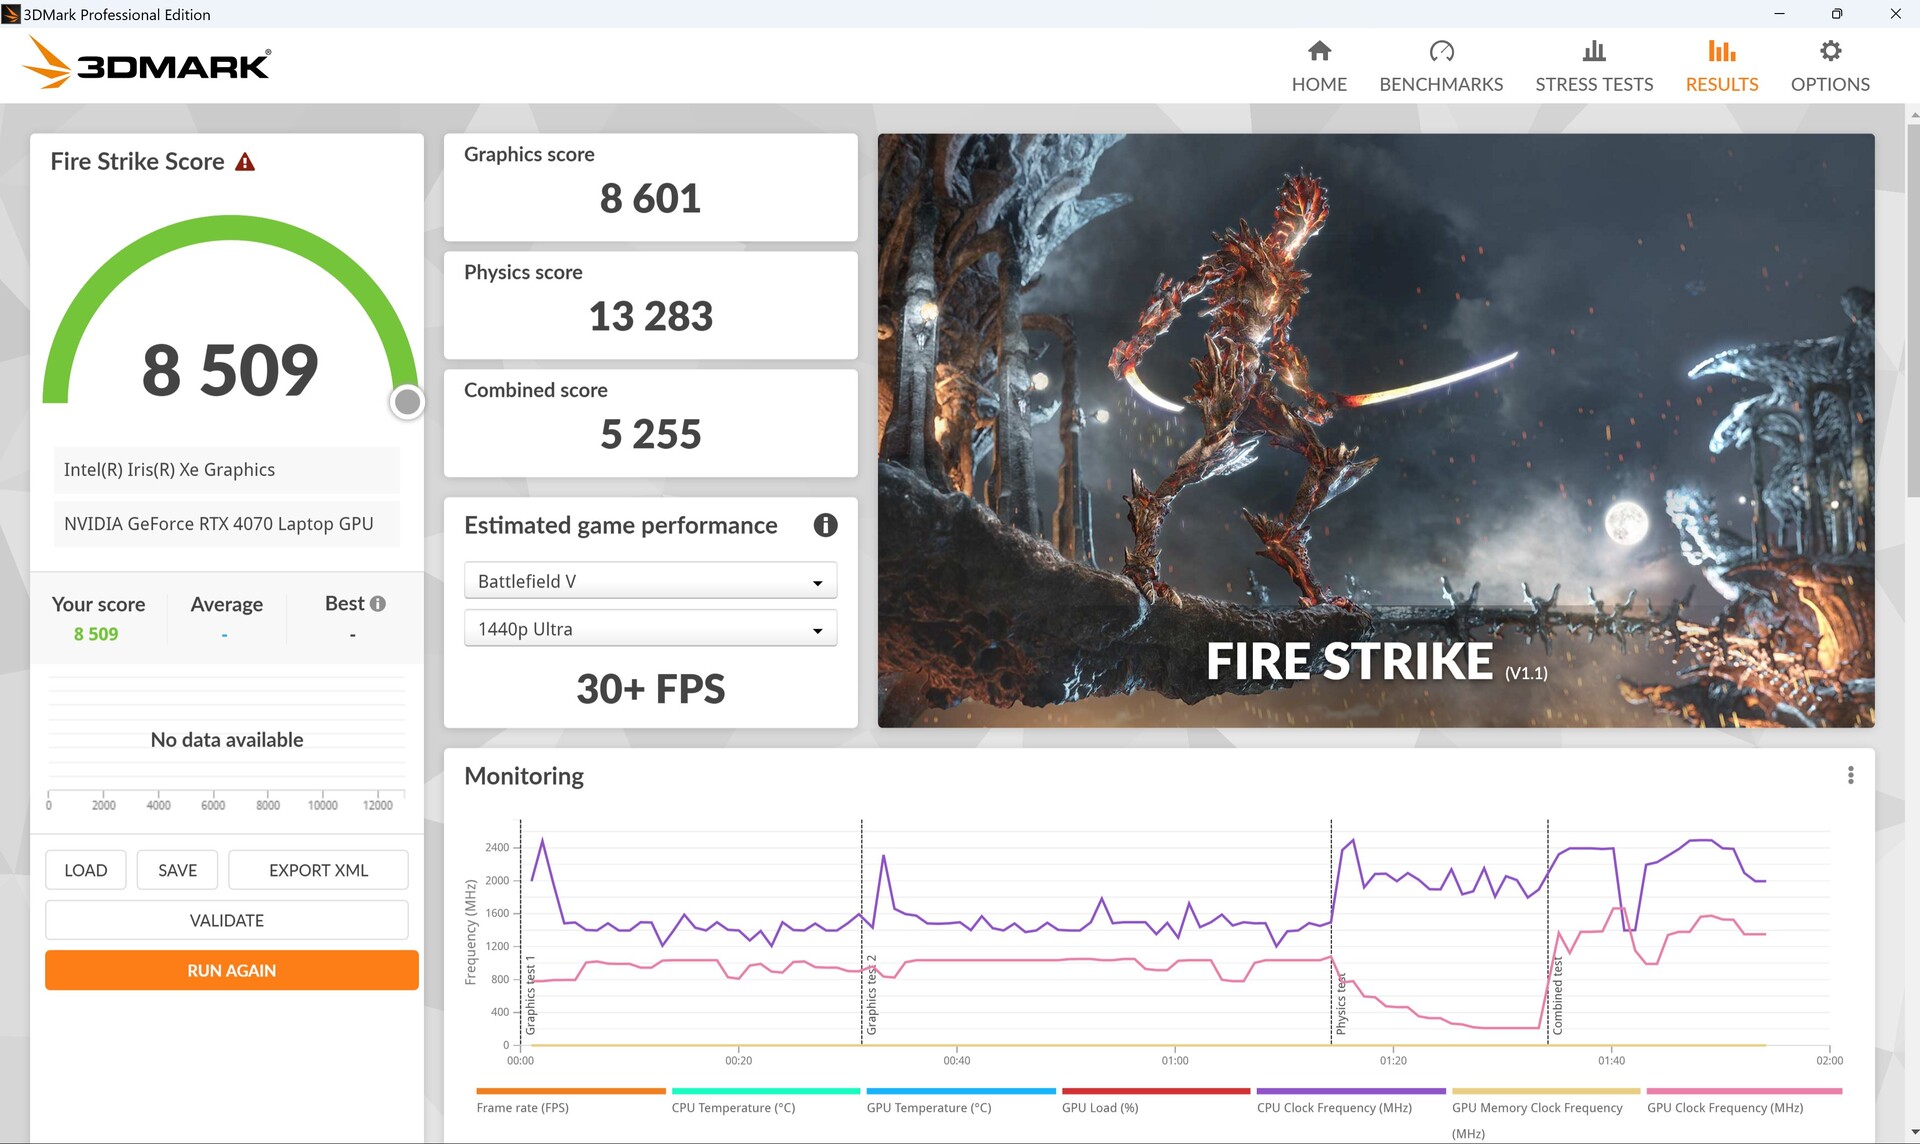
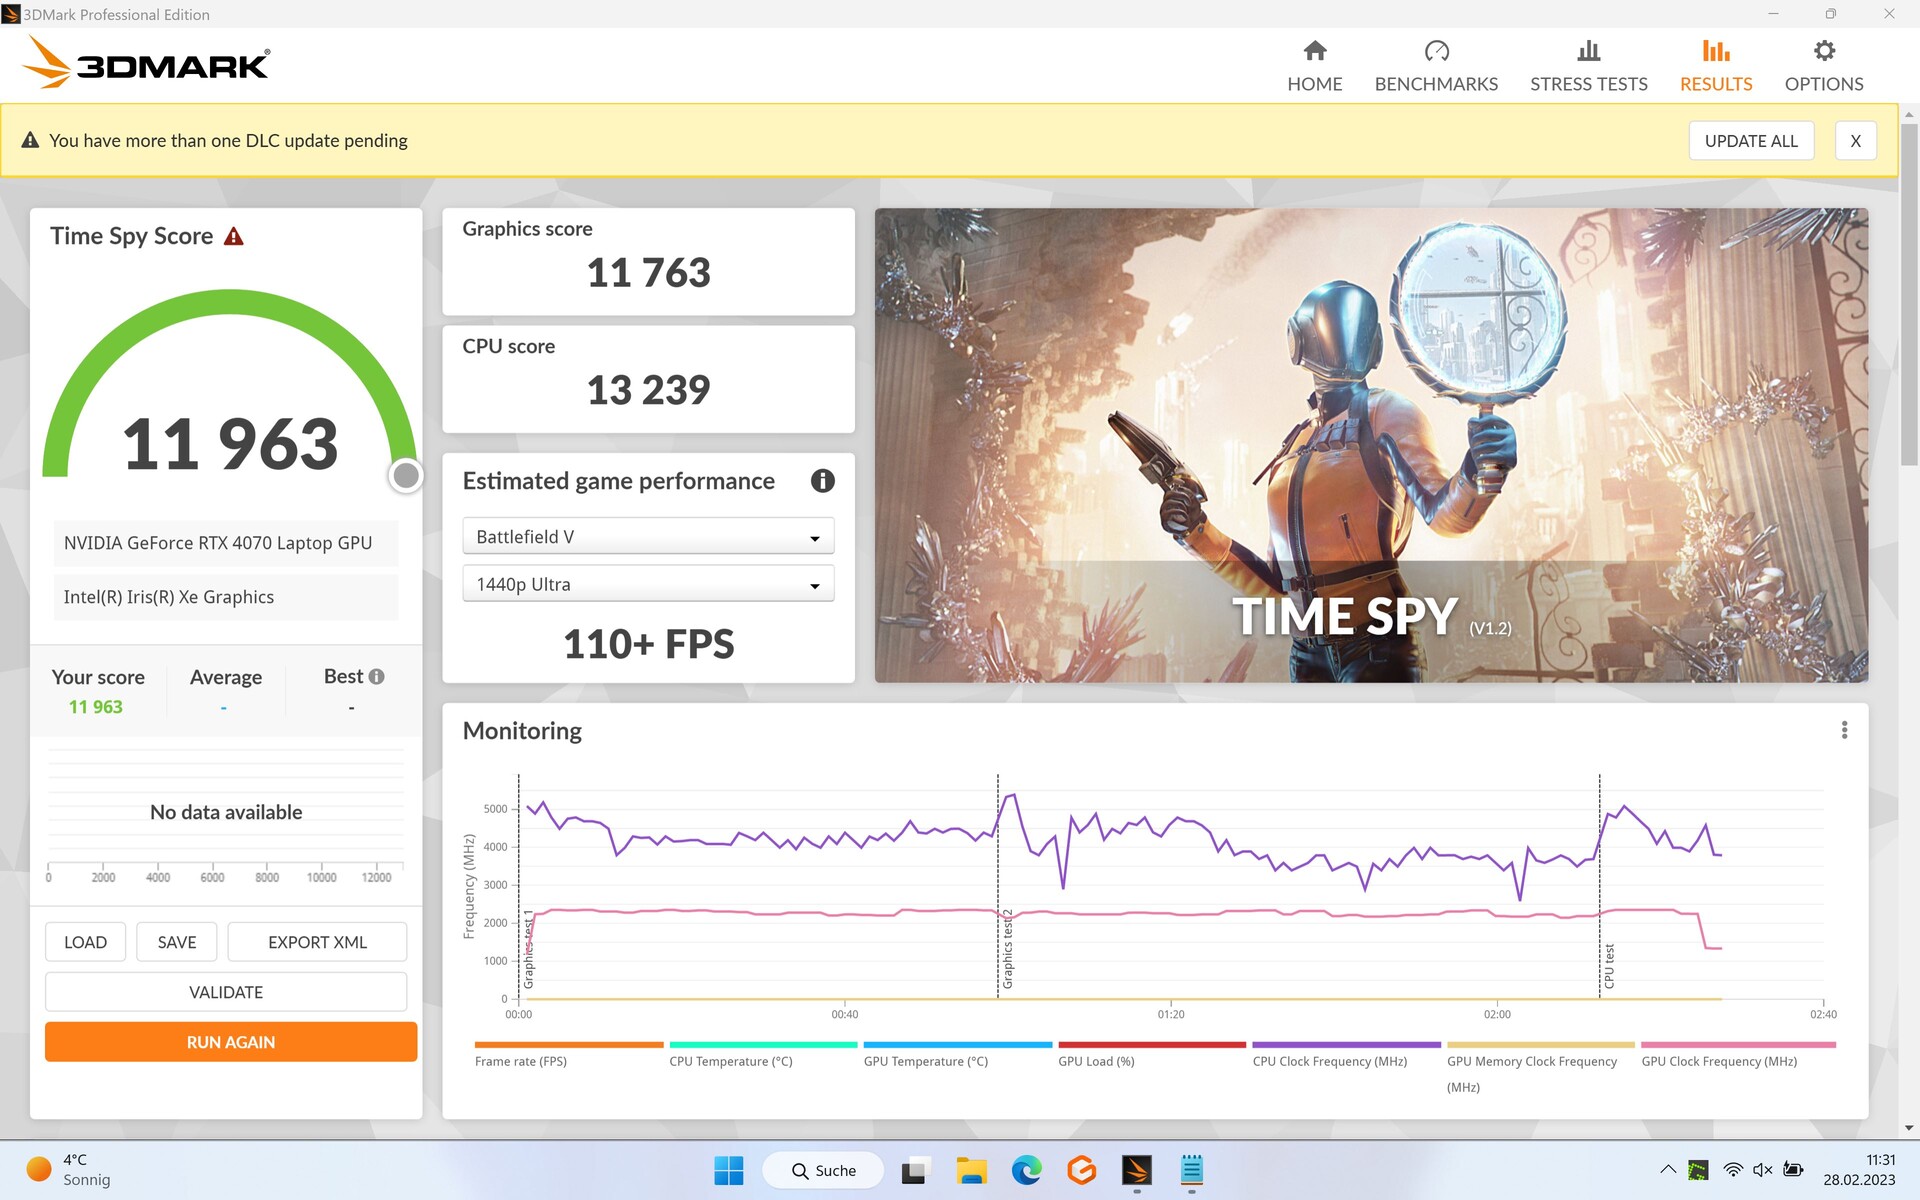
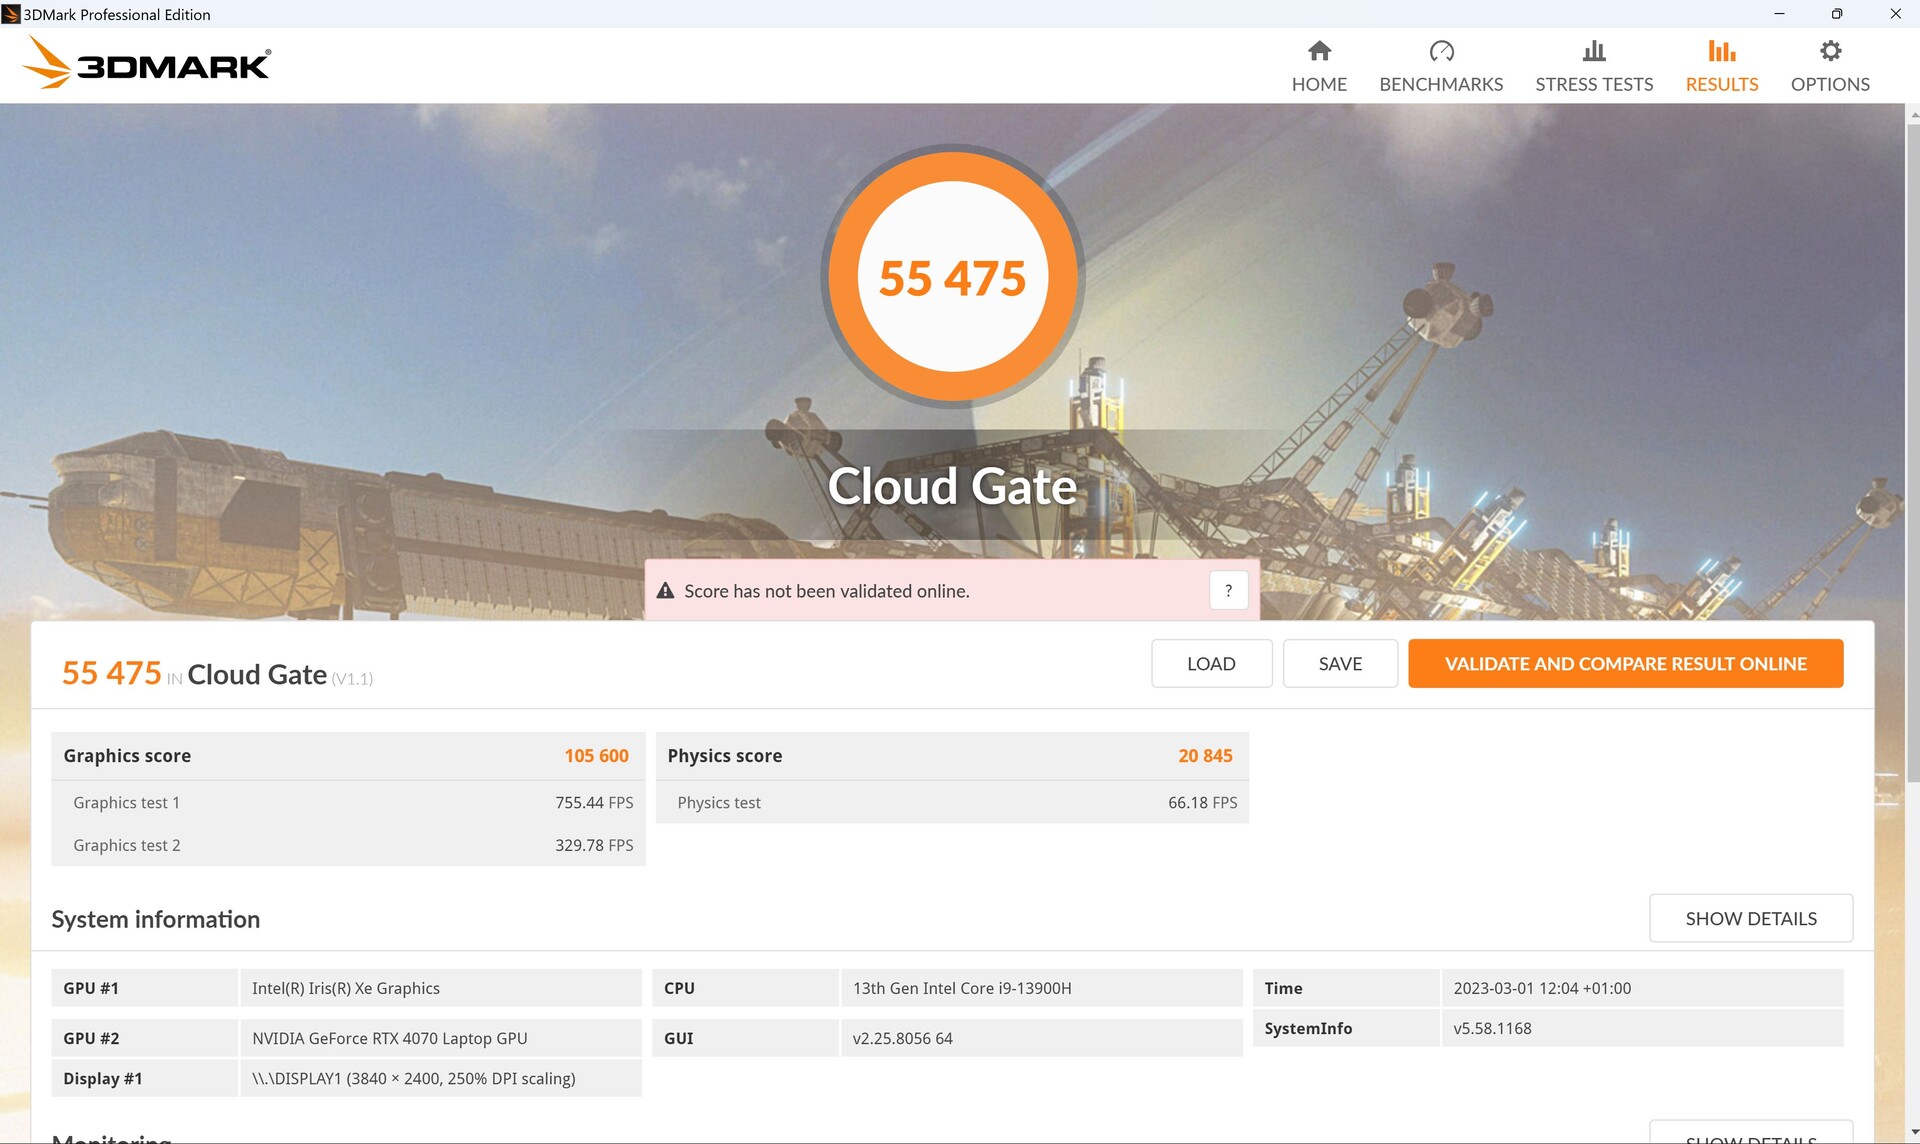
Jeśli chodzi o GPU, masz do wyboru m.in.RTX 4060 i RTX 4070; w naszym egzemplarzu testowym zainstalowano mocniejszy wariant. W cienkim Aero zużywa on standardowo około 105 W. Maksymalnie jest to 115 plus 25 W Dynamic Boost, ale nasz kolega Andreas zwrócił niedawno uwagę w swojej recenzji karty, że prawie żaden wzrost wydajności nie występuje powyżej 100 W w przypadku RTX 4070.
W syntetycznych 3DMarkach karta jest na oczekiwanym poziomie, choć w naszej bazie danych nie mamy zbyt wielu innych pomiarów. Mimo wszystko sporadycznie wyprzedza konkurencyjne urządzenia z np RTX 3080 Ti, podczas gdy poprzednik ze swoim RTX 3080 Ti jest również pokonany o prawie 20 procent, tj CreatorProo 30 procent. Nawet Blade 18 z tym samym GPU i nominalnie szybszym CPU jest nieco w tyle. Na stronie Alienware x15 R2 z RTX 3080 Ti, z drugiej strony, jest nieco do przodu.
Sporo wydajności 3D traci się w trybie bateryjnym, a wynik w Fire Strike spada o prawie 70 procent!

| 3DMark Performance rating - Percent | |
| Średnia w klasie Gaming | |
| Gigabyte AERO 16 OLED BSF | |
| Przeciętny NVIDIA GeForce RTX 4070 Laptop GPU | |
| Razer Blade 18 RTX 4070 | |
| Asus TUF Gaming A16 FA617 | |
| Gigabyte Aero 16 YE5 | |
| Asus ZenBook Pro 16X OLED UX7602ZM-ME115W | |
| MSI CreatorPro Z16P B12UKST | |
| 3DMark 11 Performance | 33703 pkt. | |
| 3DMark Cloud Gate Standard Score | 55475 pkt. | |
| 3DMark Fire Strike Score | 25526 pkt. | |
| 3DMark Fire Strike Extreme Score | 13175 pkt. | |
| 3DMark Time Spy Score | 12029 pkt. | |
Pomoc | ||
* ... im mniej tym lepiej
Wydajność w grach
W grach komputerowych Aero 16 wyprzedził właśnie m.in.Blade 18ogólnie, i to tylko z powodu słabych wyników w DOTA 2 Reborn i X-Plane 11.11. Aero ma nawet przewagę w grach obciążających GPU. Jest to o tyle ciekawe, że np RTX 4070ma dopuszczalne 140 W w Blade, ale tylko 105 W w Aero, co potwierdza, że uruchamianie karty powyżej 100 W nie ma obecnie większego sensu.
Ogólnie rzecz biorąc, radzi sobie ze wszystkimi grami do 2K, a czasem nawet powyżej, choć w bardzo wymagających grach przy 4K karta czasem ucieka.
Z kolei wydajność Ray tracingu jest bardzo dobra. W Cyberpunkcie spada tylko z około 85 do 65 fps przy włączonym ray tracingu w 1080p.
| Performance rating - Percent | |
| Średnia w klasie Gaming | |
| Razer Blade 18 RTX 4070 | |
| Gigabyte AERO 16 OLED BSF | |
| Gigabyte Aero 16 YE5 | |
| Asus ZenBook Pro 16X OLED UX7602ZM-ME115W | |
| MSI CreatorPro Z16P B12UKST | |
| Asus TUF Gaming A16 FA617 | |
| The Witcher 3 - 1920x1080 Ultra Graphics & Postprocessing (HBAO+) | |
| Średnia w klasie Gaming (95 - 240, n=8, ostatnie 2 lata) | |
| Gigabyte AERO 16 OLED BSF | |
| Razer Blade 18 RTX 4070 | |
| Gigabyte Aero 16 YE5 | |
| Asus TUF Gaming A16 FA617 | |
| Asus ZenBook Pro 16X OLED UX7602ZM-ME115W | |
| MSI CreatorPro Z16P B12UKST | |
| GTA V - 1920x1080 Highest AA:4xMSAA + FX AF:16x | |
| Średnia w klasie Gaming (48.3 - 186.9, n=102, ostatnie 2 lata) | |
| Gigabyte AERO 16 OLED BSF | |
| Razer Blade 18 RTX 4070 | |
| Gigabyte Aero 16 YE5 | |
| Asus ZenBook Pro 16X OLED UX7602ZM-ME115W | |
| MSI CreatorPro Z16P B12UKST | |
| Asus TUF Gaming A16 FA617 | |
| Final Fantasy XV Benchmark - 1920x1080 High Quality | |
| Średnia w klasie Gaming (41 - 215, n=103, ostatnie 2 lata) | |
| Gigabyte AERO 16 OLED BSF | |
| Razer Blade 18 RTX 4070 | |
| Gigabyte Aero 16 YE5 | |
| Asus ZenBook Pro 16X OLED UX7602ZM-ME115W | |
| Asus TUF Gaming A16 FA617 | |
| MSI CreatorPro Z16P B12UKST | |
| Strange Brigade - 1920x1080 ultra AA:ultra AF:16 | |
| Średnia w klasie Gaming (76.3 - 456, n=93, ostatnie 2 lata) | |
| Razer Blade 18 RTX 4070 | |
| Gigabyte AERO 16 OLED BSF | |
| Asus TUF Gaming A16 FA617 | |
| Gigabyte Aero 16 YE5 | |
| Asus ZenBook Pro 16X OLED UX7602ZM-ME115W | |
| MSI CreatorPro Z16P B12UKST | |
| Dota 2 Reborn - 1920x1080 ultra (3/3) best looking | |
| Razer Blade 18 RTX 4070 | |
| Gigabyte Aero 16 YE5 | |
| Średnia w klasie Gaming (84.8 - 248, n=112, ostatnie 2 lata) | |
| MSI CreatorPro Z16P B12UKST | |
| Gigabyte AERO 16 OLED BSF | |
| Asus ZenBook Pro 16X OLED UX7602ZM-ME115W | |
| Asus TUF Gaming A16 FA617 | |
| X-Plane 11.11 - 1920x1080 high (fps_test=3) | |
| Razer Blade 18 RTX 4070 | |
| Gigabyte AERO 16 OLED BSF | |
| Gigabyte Aero 16 YE5 | |
| Średnia w klasie Gaming (52.1 - 143.5, n=115, ostatnie 2 lata) | |
| MSI CreatorPro Z16P B12UKST | |
| Asus ZenBook Pro 16X OLED UX7602ZM-ME115W | |
| Asus TUF Gaming A16 FA617 | |
Aero 16 nie oferuje Advanced Optimus, podobnie jest z trybem Whisper firmy Nvidia. Dostępny jest jednak przełącznik MUX, dzięki czemu można ręcznie przełączać się między iGPU a dGPU.
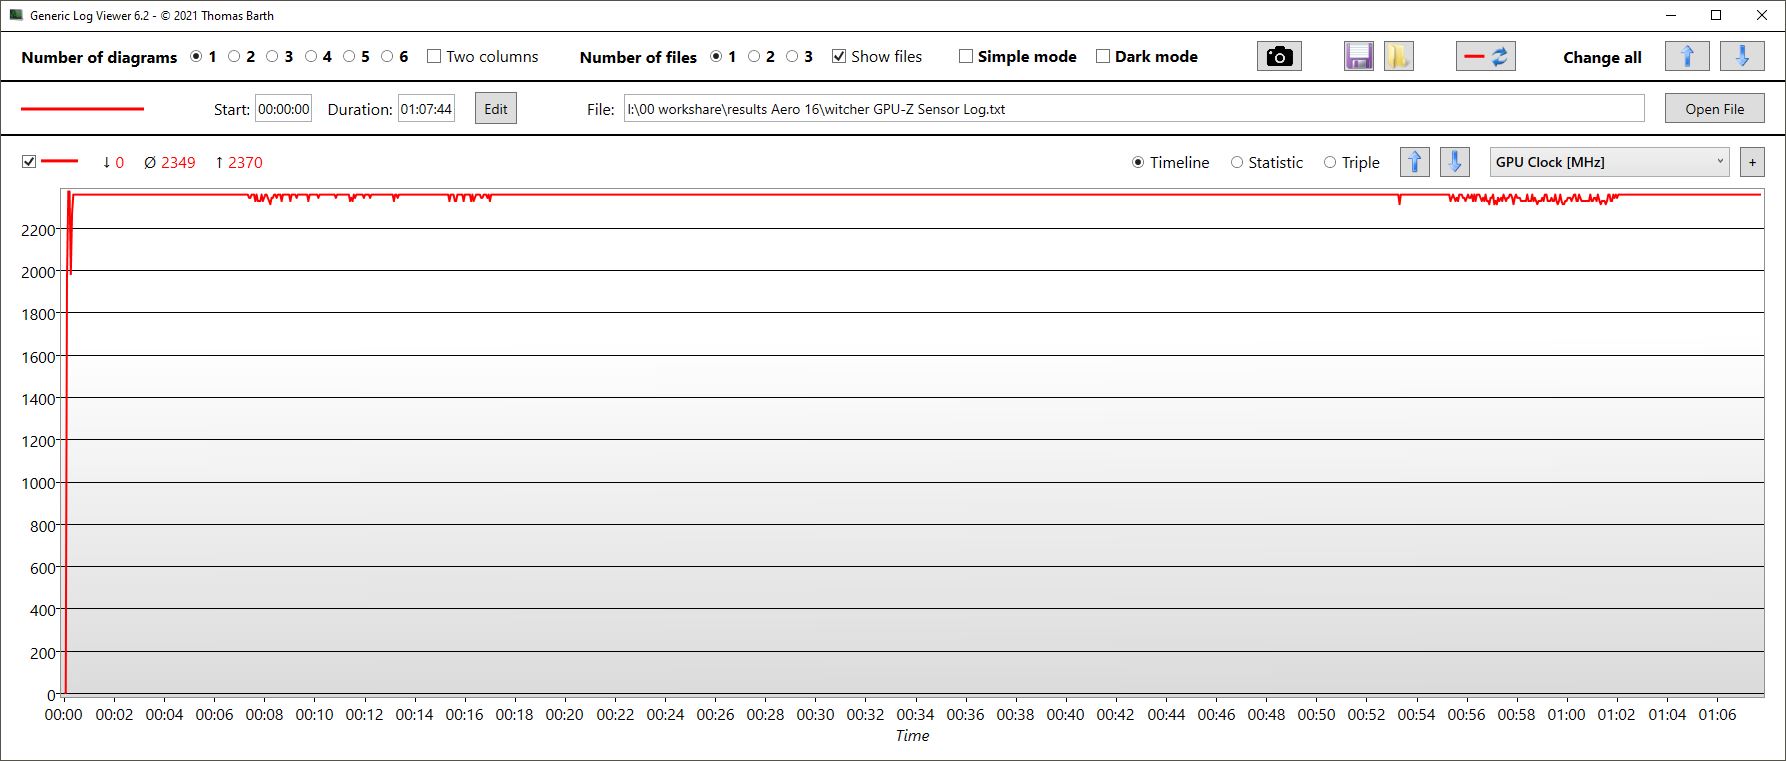
W trybie gamingowym liczba klatek na sekundę w Witcher 3 jest dość stała przez ponad godzinę i przewyższa m.in.Razer Blade 18.
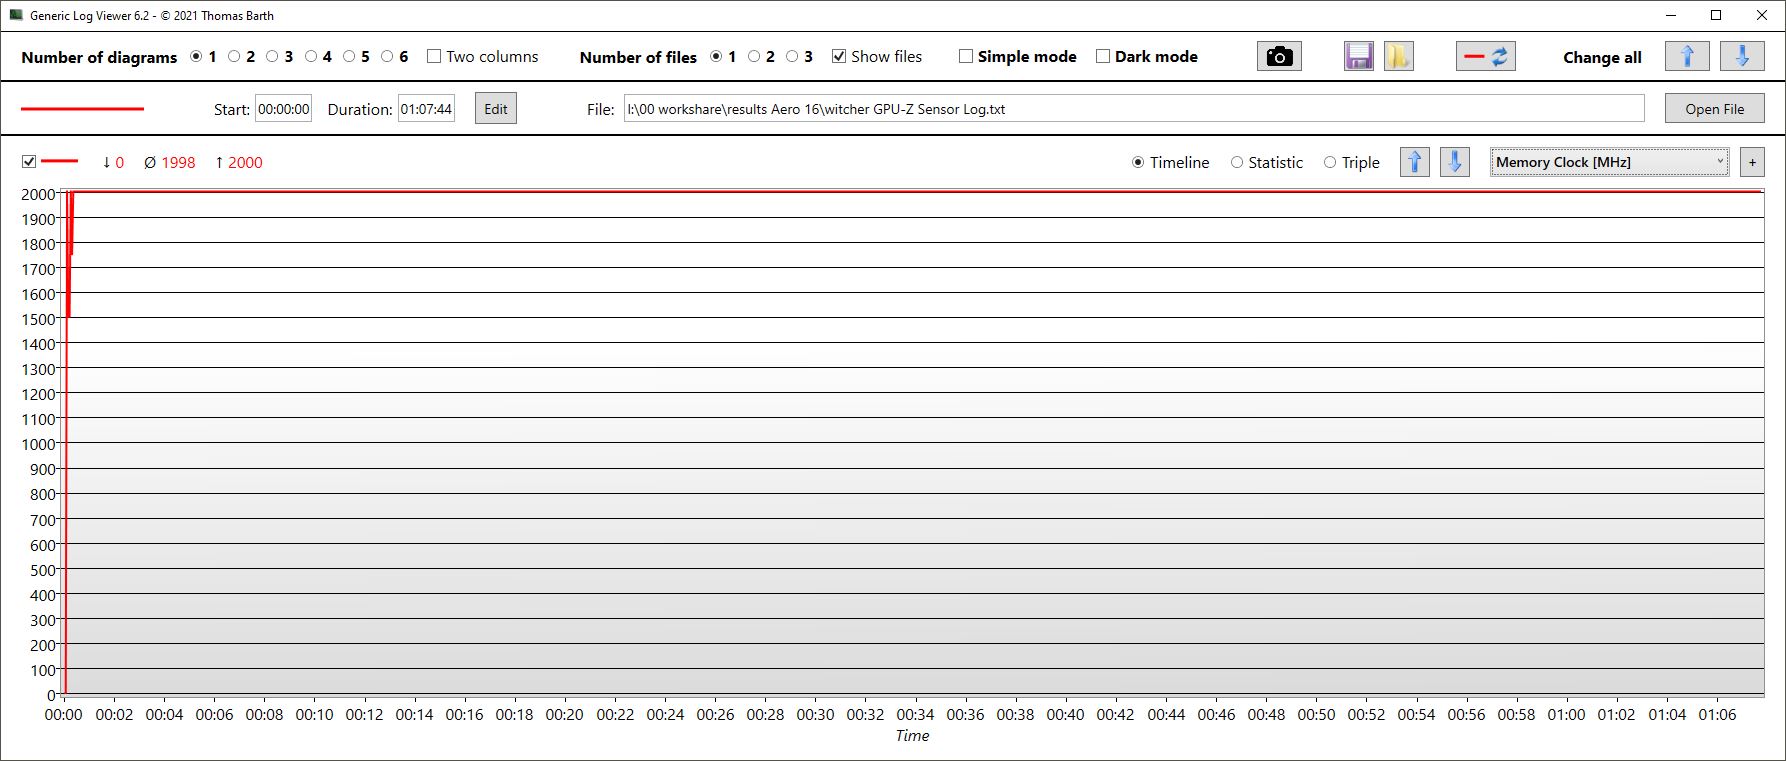
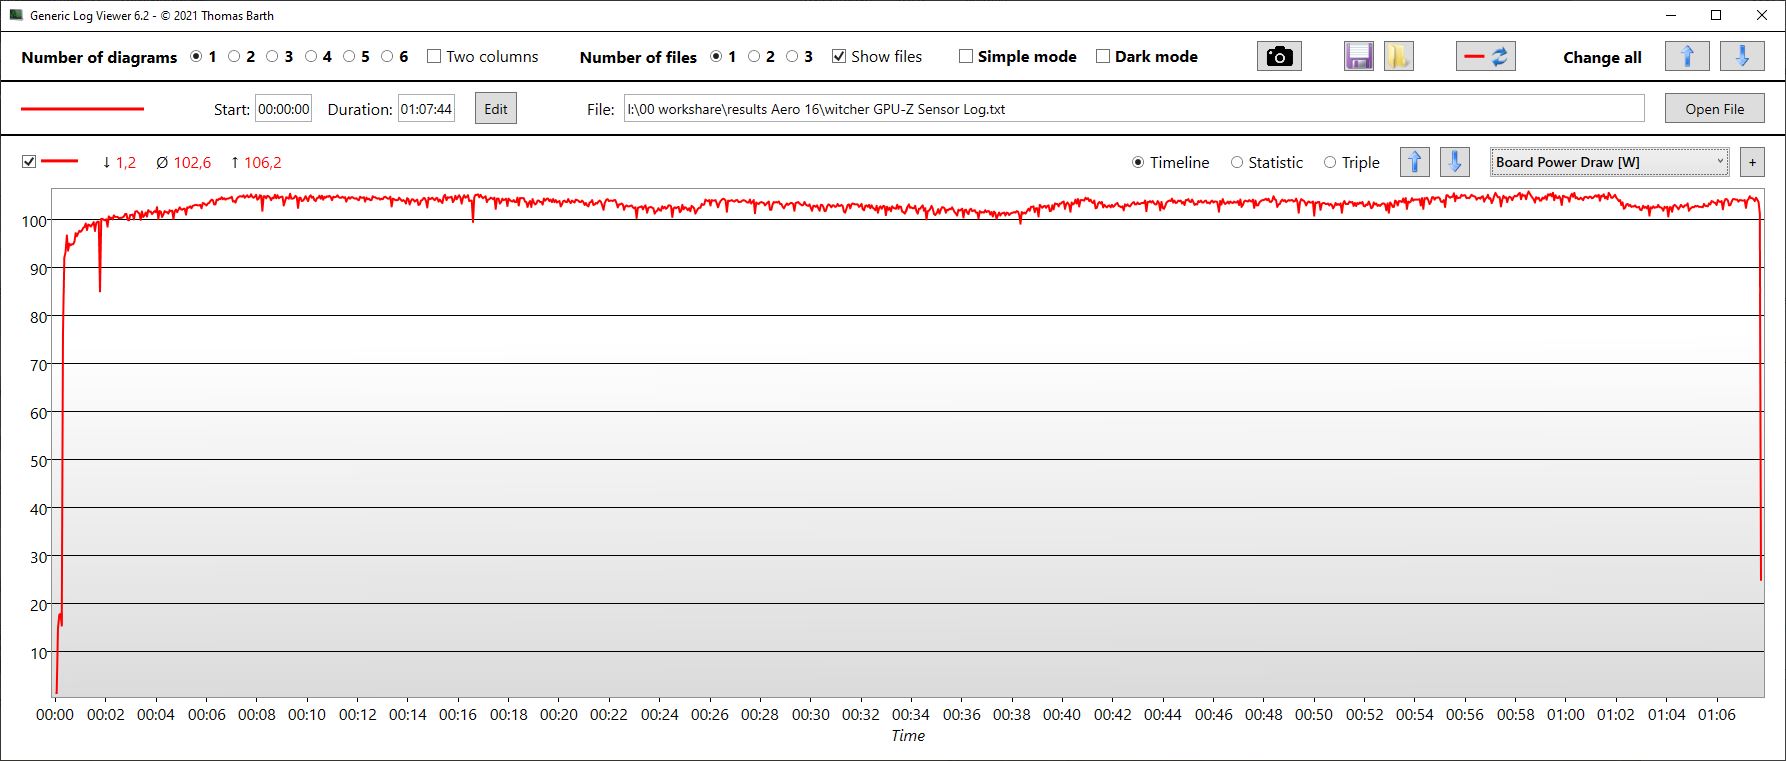
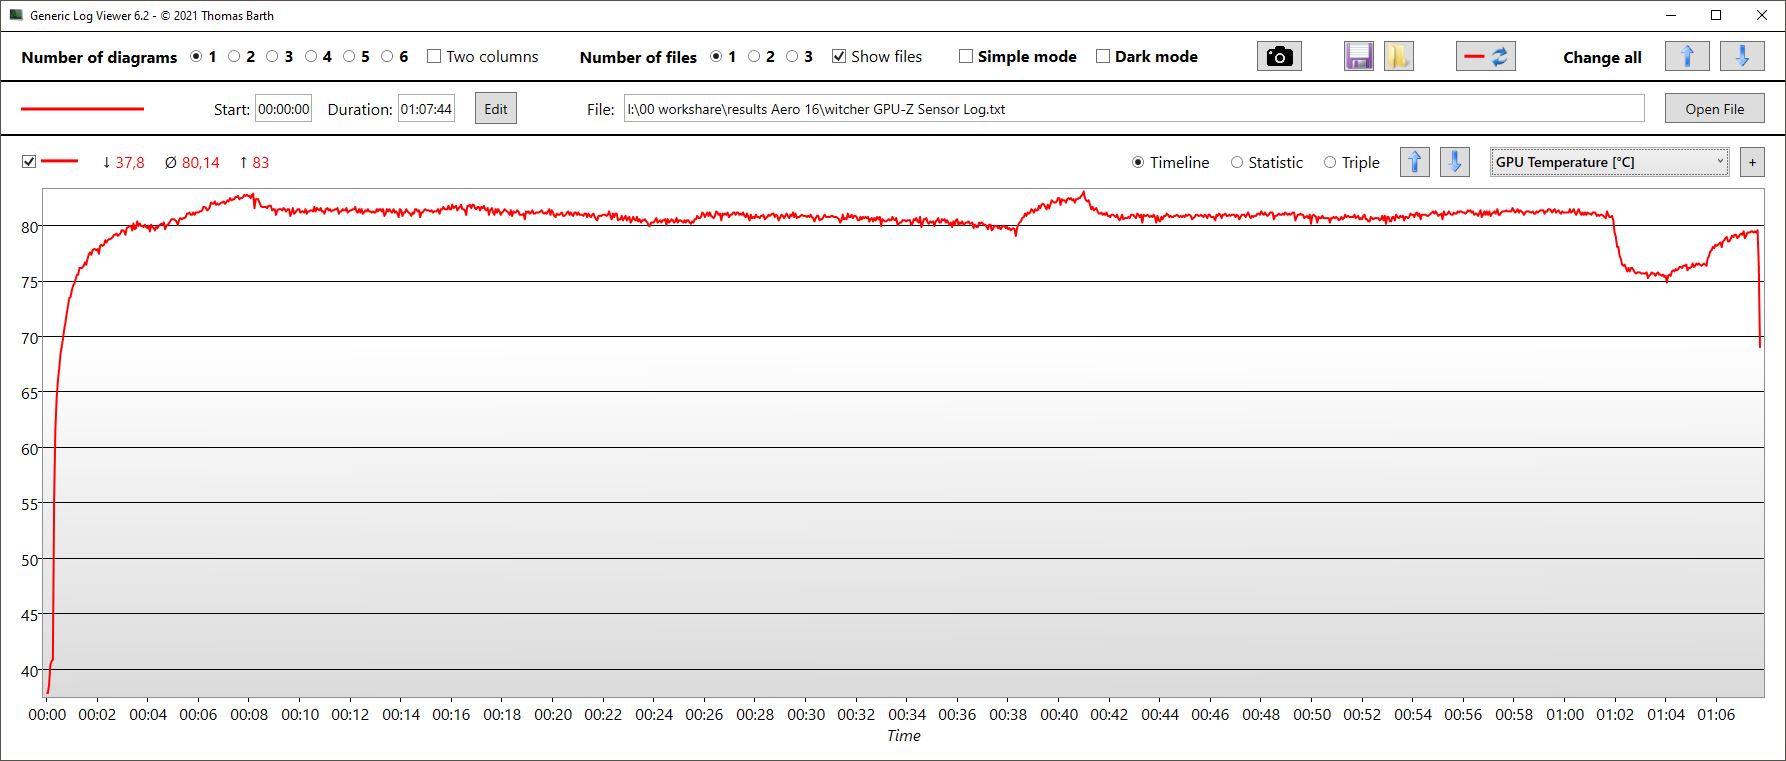
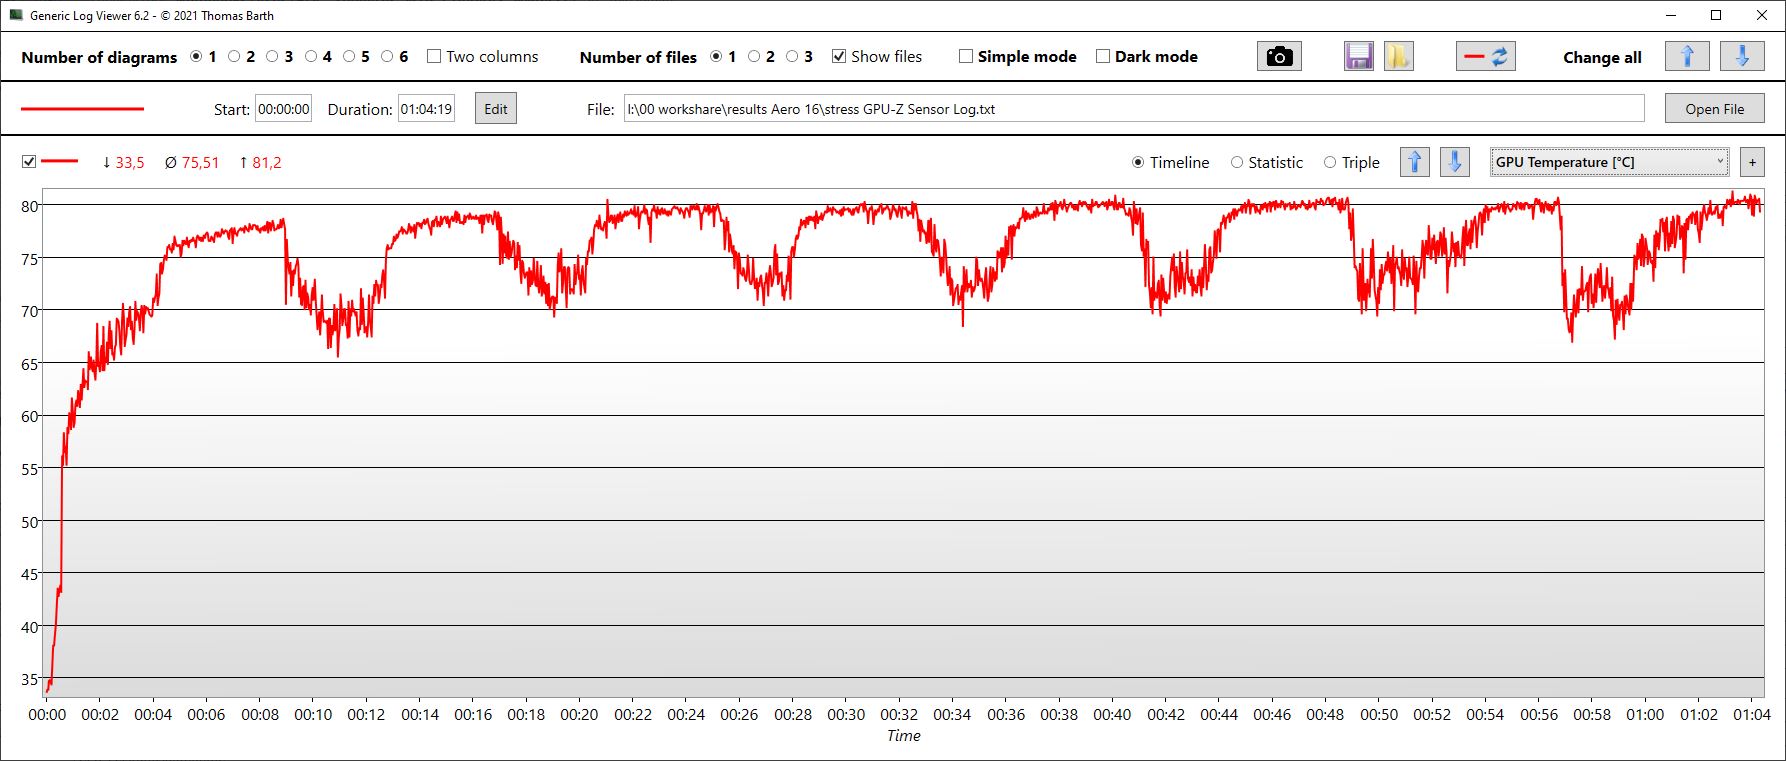
Pobór mocy przez GPU jest niemal stały i wynosi około 105 W, co oznacza, że zarówno taktowanie rdzenia (2350 MHz) jak i pamięci (2000 MHz) jest również bardzo stałe. Karta nagrzewa się do około 80°C.
Witcher 3 FPS Chart
| low | med. | high | ultra | QHD | 4K | |
|---|---|---|---|---|---|---|
| GTA V (2015) | 185.3 | 186.4 | 183.1 | 123.2 | 90.6 | 75 |
| The Witcher 3 (2015) | 236 | 116 | ||||
| Dota 2 Reborn (2015) | 164.7 | 157 | 150.9 | 144.5 | 128.3 | |
| Final Fantasy XV Benchmark (2018) | 132.3 | 116.2 | 84.7 | 46.1 | ||
| X-Plane 11.11 (2018) | 169.3 | 148 | 115.3 | 98.5 | ||
| Far Cry 5 (2018) | 202 | 168 | 159 | 149 | 115 | 55 |
| Strange Brigade (2018) | 481 | 300 | 237 | 204 | 138.8 | 67.6 |
| Shadow of the Tomb Raider (2018) | 158 | 129 | 70 | |||
| Assassin´s Creed Valhalla (2020) | 106 | 78 | 41 | |||
| Cyberpunk 2077 1.6 (2022) | 84.75 | 53.28 | 19.59 | |||
| F1 22 (2022) | 220 | 214 | 173.8 | 66.6 | 44.3 | 21.5 |
| Call of Duty Modern Warfare 2 2022 (2022) | 101 | 72 | 39 | |||
| Spider-Man Miles Morales (2022) | 90.5 | 68.9 | 40.5 | |||
| The Callisto Protocol (2022) | 78.86 | 59.07 | 32.96 |
Emisje - Aero 16 pozostaje całkiem chłodne, ale nie ciche
Hałas
Smukły Aero 16 staje się dość głośny w trybie Gaming pod dużym obciążeniem. W trybie Gaming lub naszym teście obciążeniowym wentylatory kręcą się z głośnością do 55 dB, co jest głośniejsze od konkurencji, ale nie dziwi, biorąc pod uwagę cienką obudowę.
W trybie Creator głośność spada z 55 dB w trybie Gaming do około 50 dB w testach obciążeniowych. To zbliża Aero do konkurencji, która ma podobny poziom hałasu. Jedynie tryb Meeting Mode stara się utrzymać urządzenie w naprawdę cichej pozycji.
Hałas
| luz |
| 23 / 23 / 33.64 dB |
| obciążenie |
| 51.49 / 55.24 dB |
 | ||
30 dB cichy 40 dB(A) słyszalny 50 dB(A) irytujący |
||
min: | ||
| Gigabyte AERO 16 OLED BSF GeForce RTX 4070 Laptop GPU, i9-13900H, Gigabyte AG470S1TB-SI B10 | Gigabyte Aero 16 YE5 GeForce RTX 3080 Ti Laptop GPU, i9-12900HK, Phison ESR01TBMFCT | Razer Blade 18 RTX 4070 GeForce RTX 4070 Laptop GPU, i9-13950HX, SSSTC CA6-8D1024 | Asus ZenBook Pro 16X OLED UX7602ZM-ME115W GeForce RTX 3060 Laptop GPU, i9-12900H, Samsung PM9A1 MZVL21T0HCLR | Asus TUF Gaming A16 FA617 Radeon RX 7600S, R7 7735HS, Micron 2400 MTFDKBA1T0QFM | MSI CreatorPro Z16P B12UKST RTX A3000 Laptop GPU, i7-12700H, Samsung PM9A1 MZVL21T0HCLR | |
|---|---|---|---|---|---|---|
| Noise | -7% | 8% | -1% | 5% | 4% | |
| wyłączone / środowisko * (dB) | 23 | 25 -9% | 23.5 -2% | 26 -13% | 24 -4% | 24.1 -5% |
| Idle Minimum * (dB) | 23 | 30 -30% | 23.8 -3% | 26 -13% | 24 -4% | 27.1 -18% |
| Idle Average * (dB) | 23 | 32 -39% | 23.8 -3% | 26 -13% | 25 -9% | 27.1 -18% |
| Idle Maximum * (dB) | 33.64 | 33 2% | 26.8 20% | 26 23% | 28 17% | 27.1 19% |
| Load Average * (dB) | 51.49 | 45 13% | 37.3 28% | 48 7% | 42 18% | 42.9 17% |
| Witcher 3 ultra * (dB) | 55.27 | 50 10% | 48 13% | 50 10% | 44 20% | |
| Load Maximum * (dB) | 55.24 | 52 6% | 53.5 3% | 54.6 1% | 50 9% | 47 15% |
* ... im mniej tym lepiej
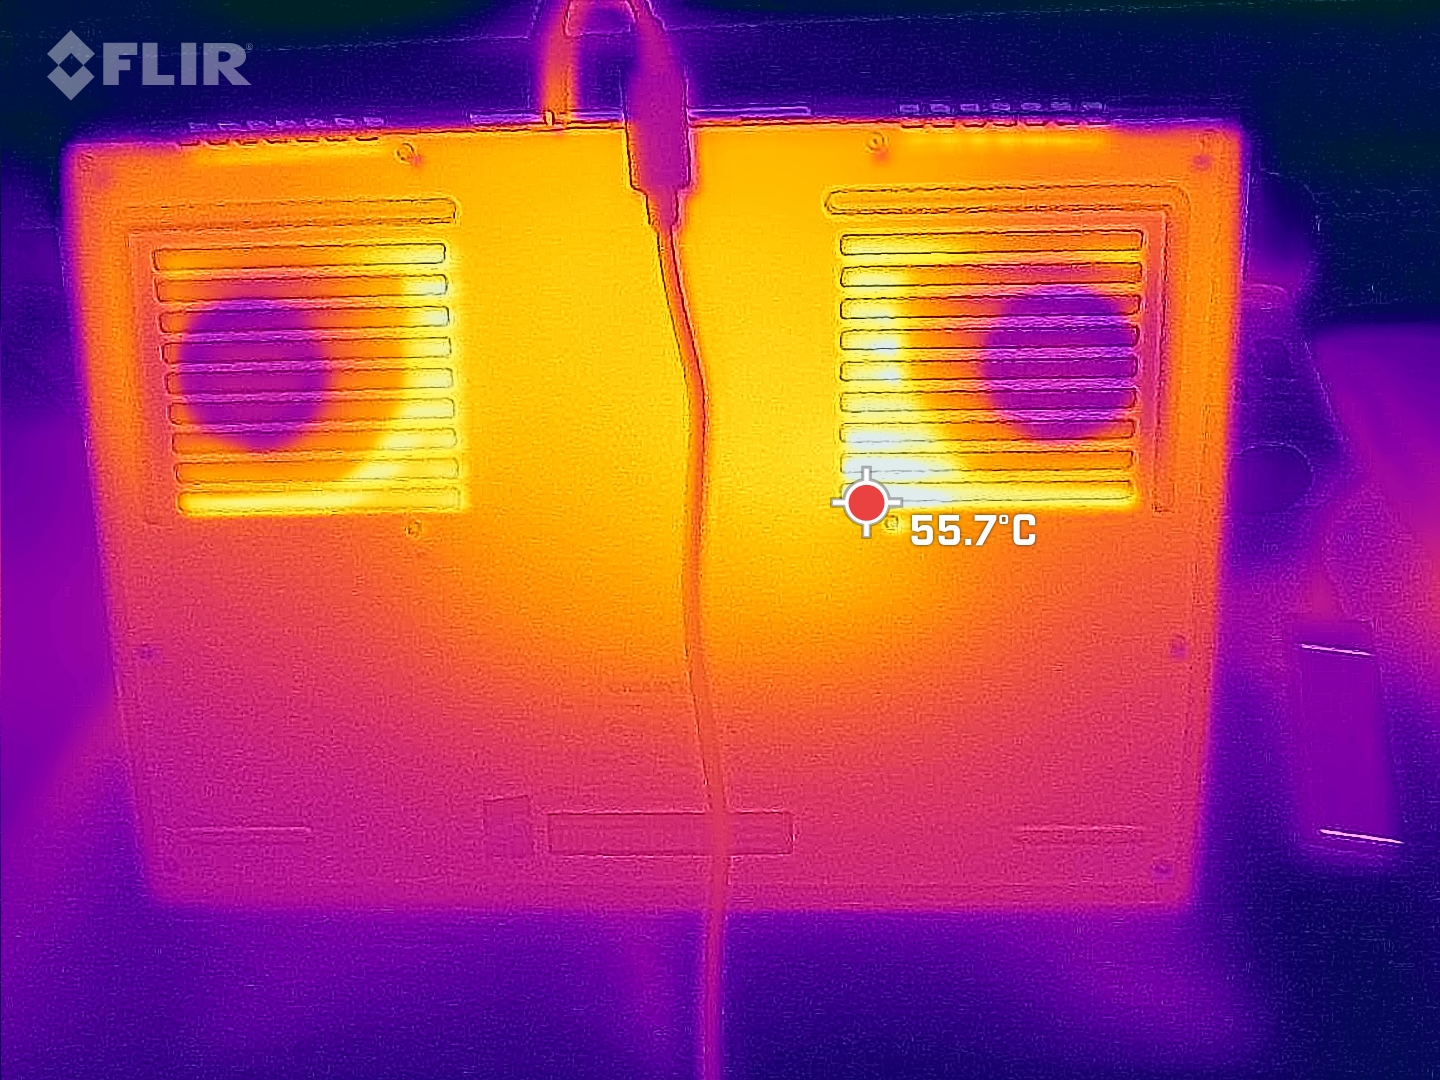
Temperatura
Pomimo smukłej obudowy Aero wypada na tym polu dobrze. Stosunkowo głośne wentylatory i metalowa obudowa dobrze odprowadzają ciepło, dzięki czemu gorące punkty na plecach utrzymują się znacznie poniżej 50°C. Poprzednik i kilku konkurentów wypadają tutaj gorzej. Miejsca oparcia dłoni znajdują się zawsze w komfortowym zakresie.
(±) Maksymalna temperatura w górnej części wynosi 41 °C / 106 F, w porównaniu do średniej 40.4 °C / 105 F , począwszy od 21.2 do 68.8 °C dla klasy Gaming.
(-) Dno nagrzewa się maksymalnie do 47 °C / 117 F, w porównaniu do średniej 43.2 °C / 110 F
(+) W stanie bezczynności średnia temperatura górnej części wynosi 21.8 °C / 71 F, w porównaniu ze średnią temperaturą urządzenia wynoszącą 33.9 °C / ### class_avg_f### F.
(±) Podczas gry w Wiedźmina 3 średnia temperatura górnej części wynosi 36.8 °C / 98 F, w porównaniu do średniej temperatury urządzenia wynoszącej 33.9 °C / ## #class_avg_f### F.
(+) Podparcia dłoni i touchpad osiągają maksymalną temperaturę skóry (33 °C / 91.4 F) i dlatego nie są gorące.
(-) Średnia temperatura obszaru podparcia dłoni w podobnych urządzeniach wynosiła 28.8 °C / 83.8 F (-4.2 °C / -7.6 F).
| Gigabyte AERO 16 OLED BSF Intel Core i9-13900H, NVIDIA GeForce RTX 4070 Laptop GPU | Gigabyte Aero 16 YE5 Intel Core i9-12900HK, NVIDIA GeForce RTX 3080 Ti Laptop GPU | Razer Blade 18 RTX 4070 Intel Core i9-13950HX, NVIDIA GeForce RTX 4070 Laptop GPU | Asus ZenBook Pro 16X OLED UX7602ZM-ME115W Intel Core i9-12900H, NVIDIA GeForce RTX 3060 Laptop GPU | Asus TUF Gaming A16 FA617 AMD Ryzen 7 7735HS, AMD Radeon RX 7600S | MSI CreatorPro Z16P B12UKST Intel Core i7-12700H, NVIDIA RTX A3000 Laptop GPU | |
|---|---|---|---|---|---|---|
| Heat | -31% | -14% | -17% | -45% | -26% | |
| Maximum Upper Side * (°C) | 41 | 49 -20% | 39.2 4% | 32 22% | 54 -32% | 56.3 -37% |
| Maximum Bottom * (°C) | 47 | 55 -17% | 35.6 24% | 41.6 11% | 47 -0% | 68.3 -45% |
| Idle Upper Side * (°C) | 23 | 33 -43% | 31.8 -38% | 32.6 -42% | 40 -74% | 25.2 -10% |
| Idle Bottom * (°C) | 23 | 33 -43% | 33.2 -44% | 36 -57% | 40 -74% | 25.9 -13% |
* ... im mniej tym lepiej
Testy warunków skrajnych
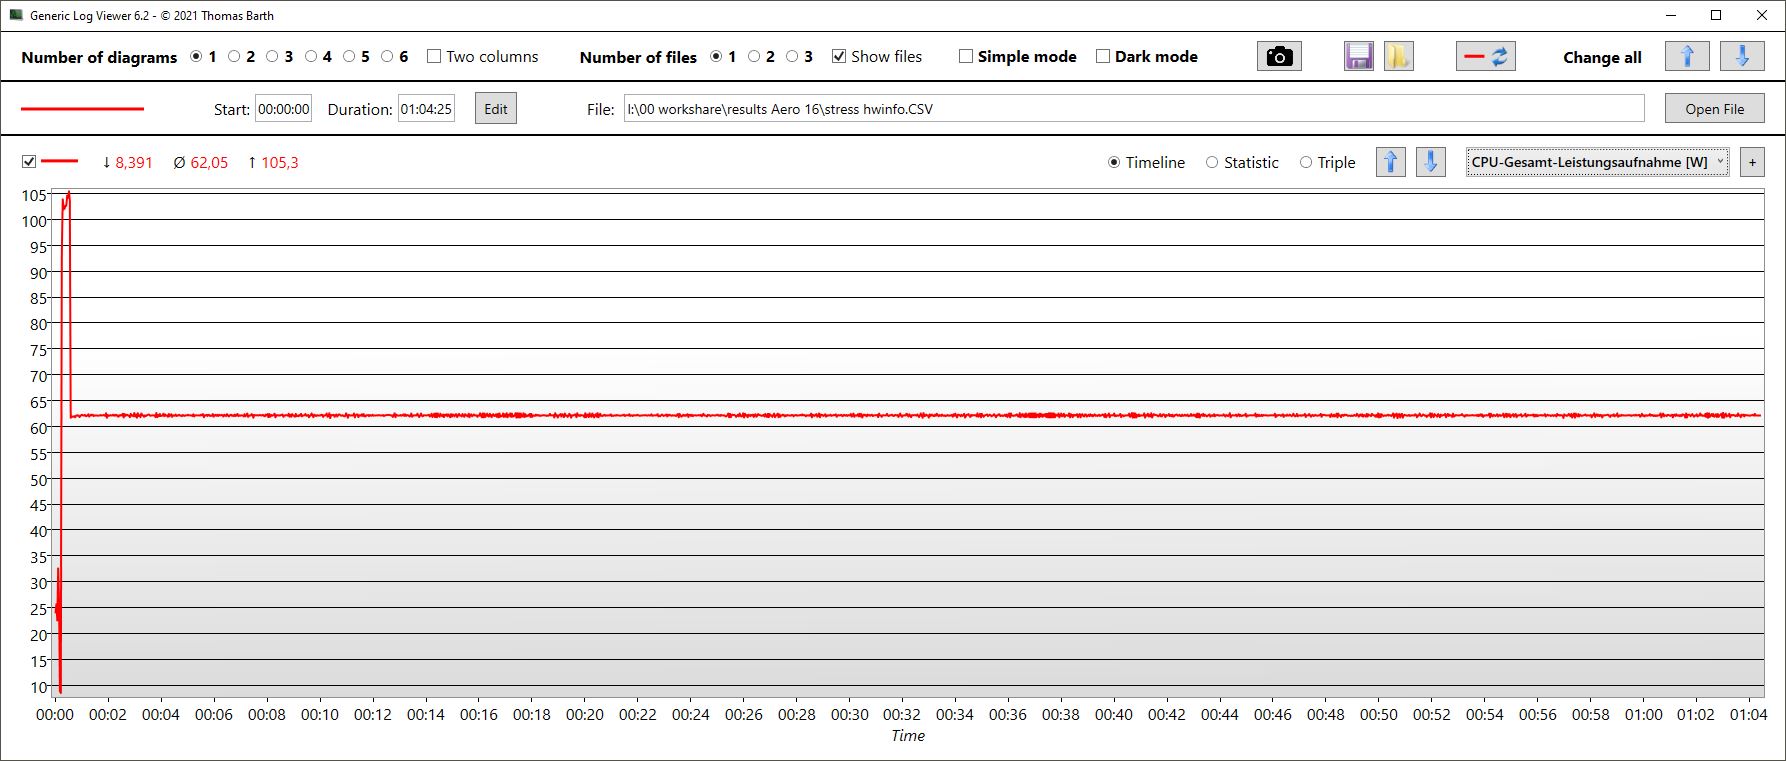
W testach obciążeniowych procesor jest w stanie zużywać 105 W w krótkich zrywach, zanim po kilku sekundach spadnie do stałego poziomu 62 W. Jednocześnie taktowanie zaczyna się na krótko od 4,1 GHz, po czym spada do około 2,9 GHz. Nie pozostaje to jednak stałe, ale zmienia się wraz z temperaturą. Kiedy temperatury rdzenia osiągają 90°C, zegar jest lekko dławiony, po czym temperatury ponownie spadają. Przy nieco ponad 80 °C częstotliwość taktowania znów lekko wzrasta itd.
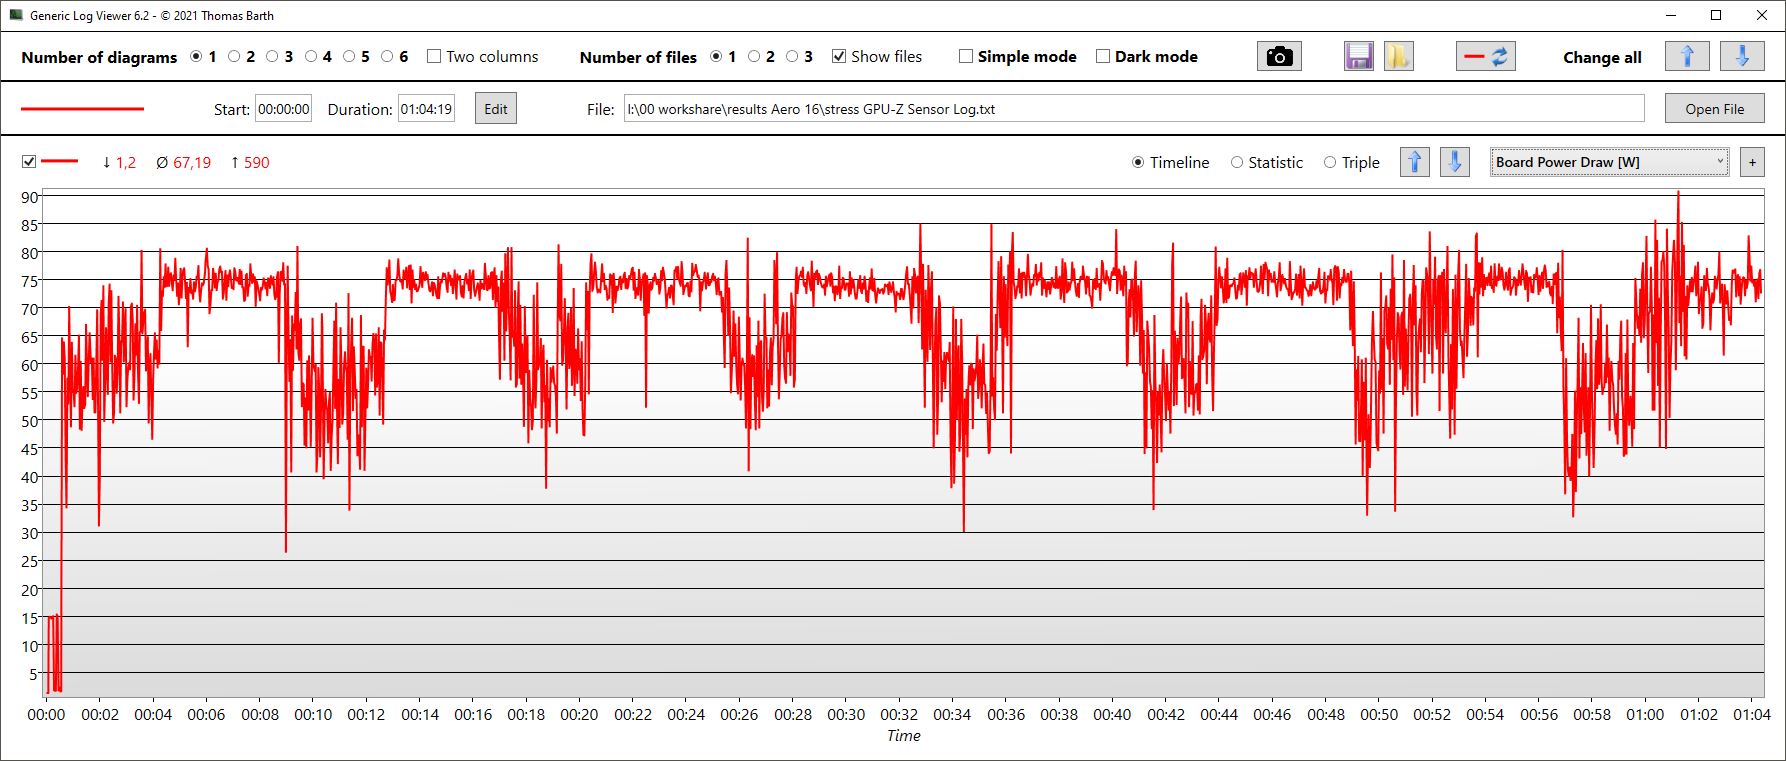
Taktowanie GPU również waha się stale między 1,7 a 2,4 GHz. Z kolei taktowanie pamięci wzrasta i spada z 2 GHz do 1,75 GHz. Ten sam przebieg widoczny jest w temperaturze GPU, która waha się mniej więcej między 70 a 80°C. Pobór mocy nigdy nie osiąga w teście obciążeniowym maksimum, ale oscyluje tylko wokół 67 W.
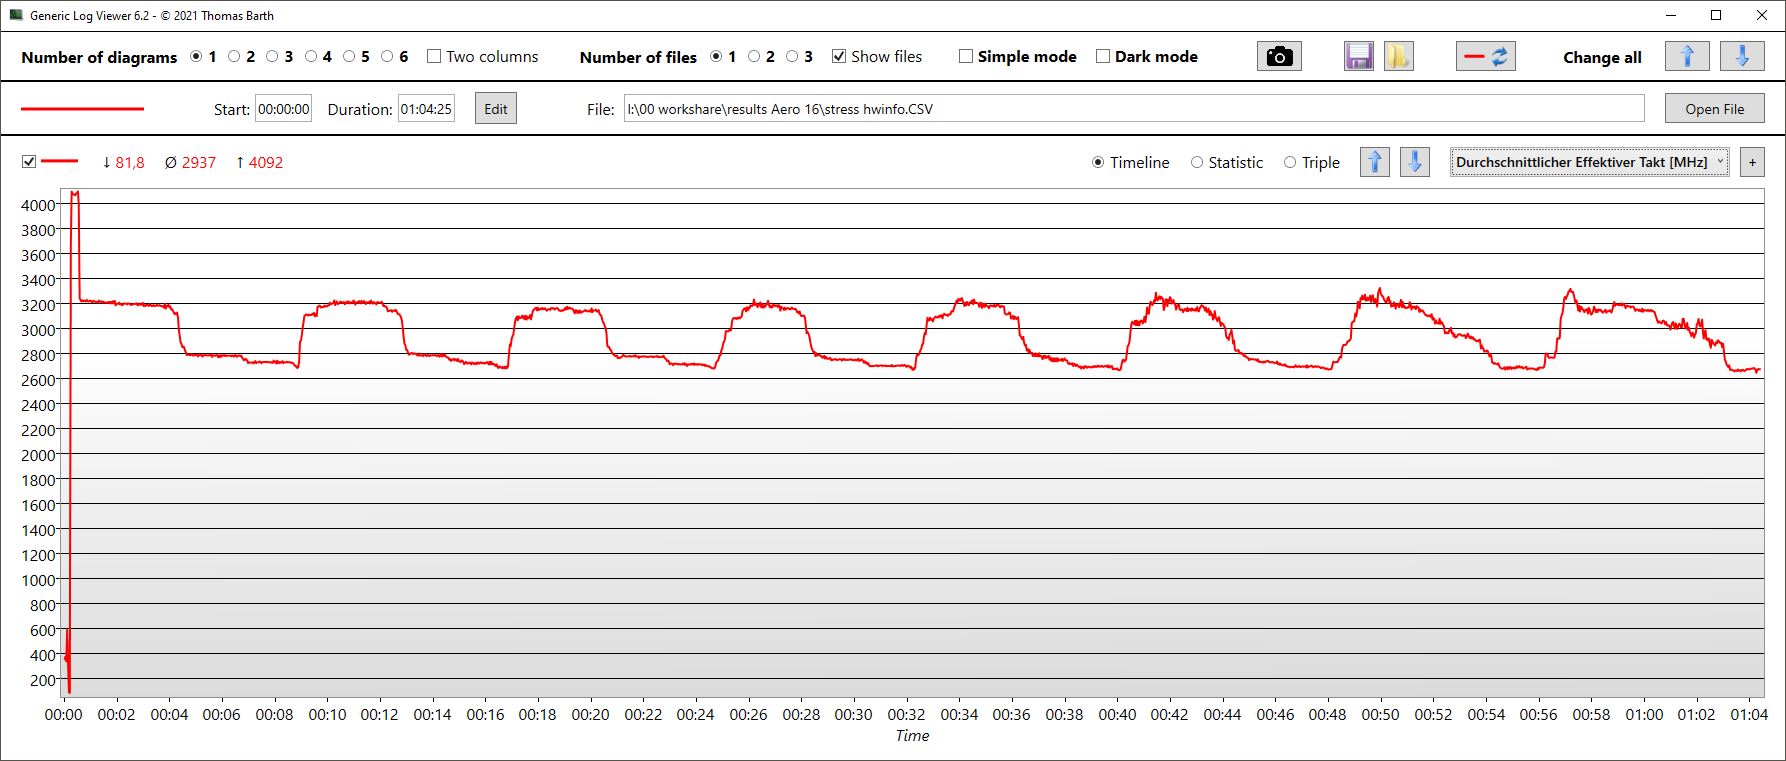
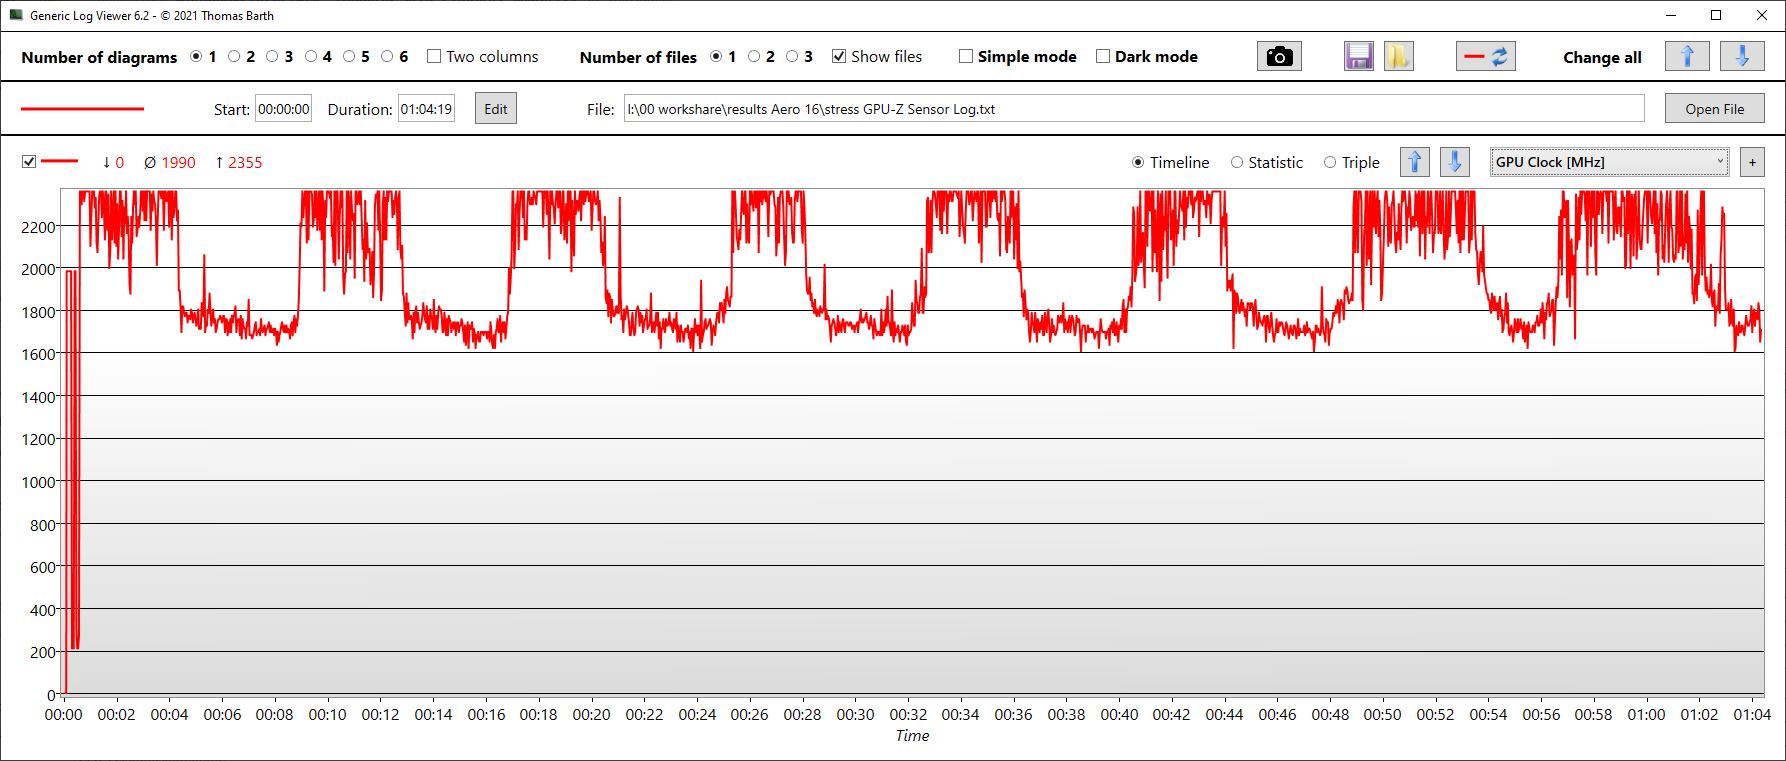
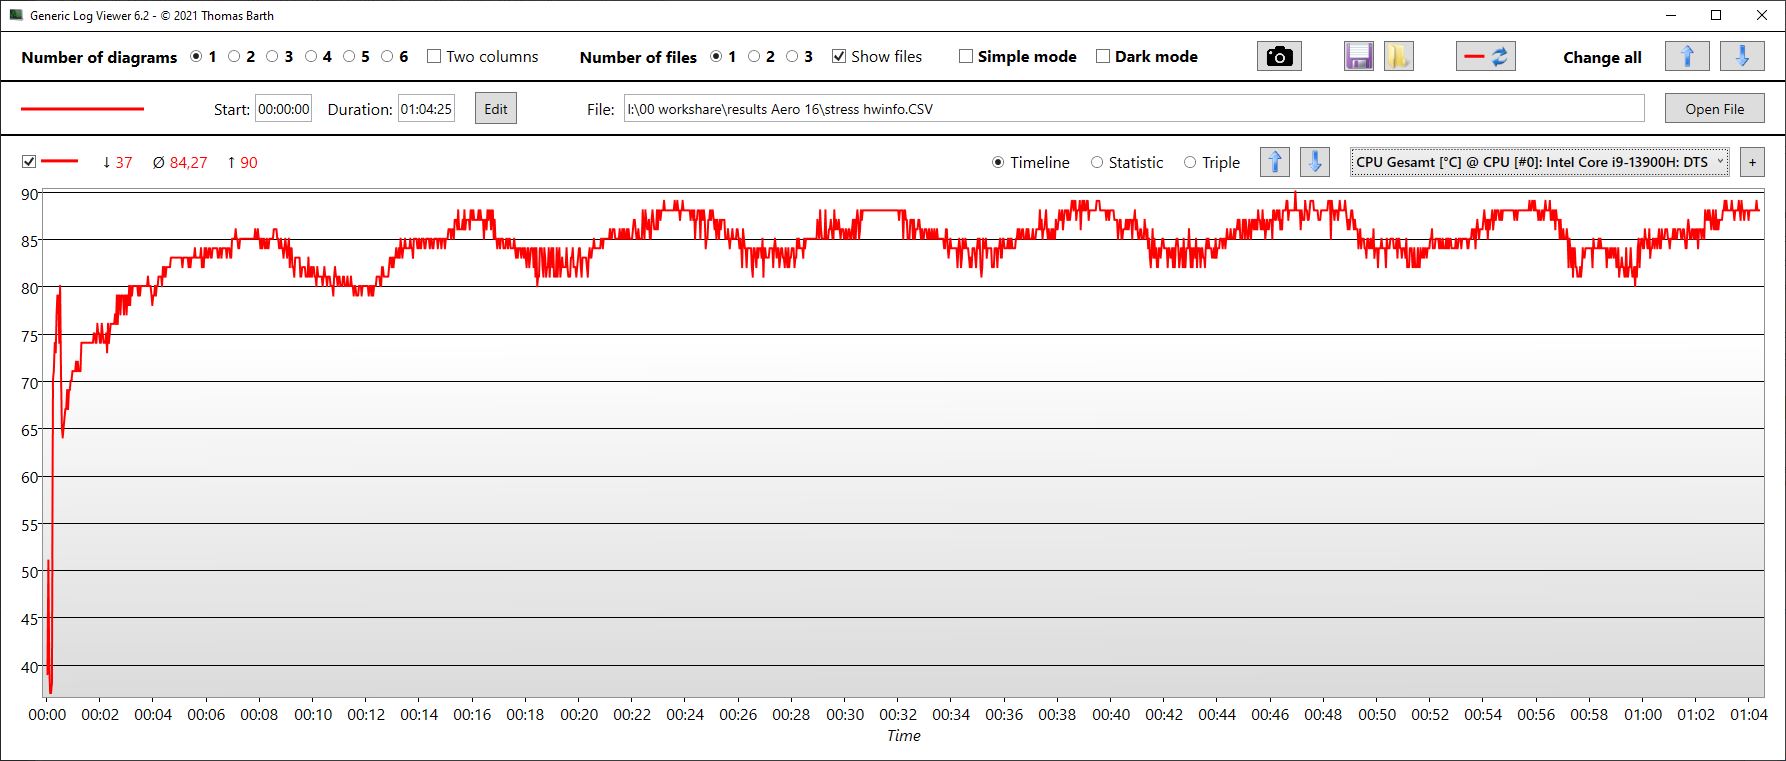
| ZegarCPU (GHz) | Zegar GPU (MHz) | Średnia temperatura CPU (°C) | Średnia temperatura GPU (°C) | |
| Prime95 + FurMark Stress | 2,9 | 1,990 | 84 | 76 |
| Witcher 3 Stress | 1,8 | 2,350 | 69 | 80 |
Mówcy
Gigabyte zainstalował dwa głośniki stereo o mocy 2 W każdy, co jest generalnie standardem. Niestety głośniki nie przekonują w żadnej dyscyplinie: są w miarę głośne, ale nie są w stanie zapewnić dobrze zbalansowanych średnich i wysokich tonów.
Oprócz wyjść cyfrowych można skorzystać z gniazda słuchawkowego 3,5 mm dla urządzeń zewnętrznych.
Gigabyte AERO 16 OLED BSF analiza dźwięku
(±) | głośność głośnika jest średnia, ale dobra (81.68 dB)
Bas 100 - 315 Hz
(-) | prawie brak basu - średnio 15.6% niższa od mediany
(±) | liniowość basu jest średnia (14.3% delta do poprzedniej częstotliwości)
Średnie 400 - 2000 Hz
(±) | wyższe średnie - średnio 12.8% wyższe niż mediana
(-) | średnie nie są liniowe (16.8% delta do poprzedniej częstotliwości)
Wysokie 2–16 kHz
(±) | wyższe maksima - średnio 11% wyższe od mediany
(-) | wzloty nie są liniowe (16.3% delta do poprzedniej częstotliwości)
Ogólnie 100 - 16.000 Hz
(-) | ogólny dźwięk nie jest liniowy (48.4% różnicy w stosunku do mediany)
W porównaniu do tej samej klasy
» 100% wszystkich testowanych urządzeń w tej klasie było lepszych, 0% podobnych, 0% gorszych
» Najlepszy miał deltę 6%, średnia wynosiła ###średnia###%, najgorsza wynosiła 132%
W porównaniu do wszystkich testowanych urządzeń
» 96% wszystkich testowanych urządzeń było lepszych, 0% podobnych, 4% gorszych
» Najlepszy miał deltę 4%, średnia wynosiła ###średnia###%, najgorsza wynosiła 134%
Asus ZenBook Pro 16X OLED UX7602ZM-ME115W analiza dźwięku
(+) | głośniki mogą odtwarzać stosunkowo głośno (94.7 dB)
Bas 100 - 315 Hz
(-) | prawie brak basu - średnio 16% niższa od mediany
(±) | liniowość basu jest średnia (7.9% delta do poprzedniej częstotliwości)
Średnie 400 - 2000 Hz
(+) | zbalansowane środki średnie - tylko 1.8% od mediany
(+) | średnie są liniowe (3.8% delta do poprzedniej częstotliwości)
Wysokie 2–16 kHz
(±) | wyższe maksima - średnio 6.2% wyższe od mediany
(+) | wzloty są liniowe (2.8% delta do poprzedniej częstotliwości)
Ogólnie 100 - 16.000 Hz
(+) | ogólny dźwięk jest liniowy (13.3% różnicy w stosunku do mediany)
W porównaniu do tej samej klasy
» 28% wszystkich testowanych urządzeń w tej klasie było lepszych, 4% podobnych, 68% gorszych
» Najlepszy miał deltę 5%, średnia wynosiła ###średnia###%, najgorsza wynosiła 45%
W porównaniu do wszystkich testowanych urządzeń
» 14% wszystkich testowanych urządzeń było lepszych, 3% podobnych, 83% gorszych
» Najlepszy miał deltę 4%, średnia wynosiła ###średnia###%, najgorsza wynosiła 134%
Zarządzanie energią - wydajny RTX 4070 w Aero 16
Pobór mocy
Zużycie energii jest bardzo dobre, zwłaszcza w porównaniu z poprzednią generacją. W poprzedniku, żądny mocy RTX 3080 Ti również był dławiony na poziomie 105 W. W benchmarkach gamingowych widać, że stara karta radzi sobie zauważalnie gorzej, jednocześnie zużywając znacznie więcej. Nowa generacja RTX 40x jest wyraźnie dużo wydajniejsza. Więcej informacji na temat wydajności nowej generacji RTX 40x można znaleźć tutaj.
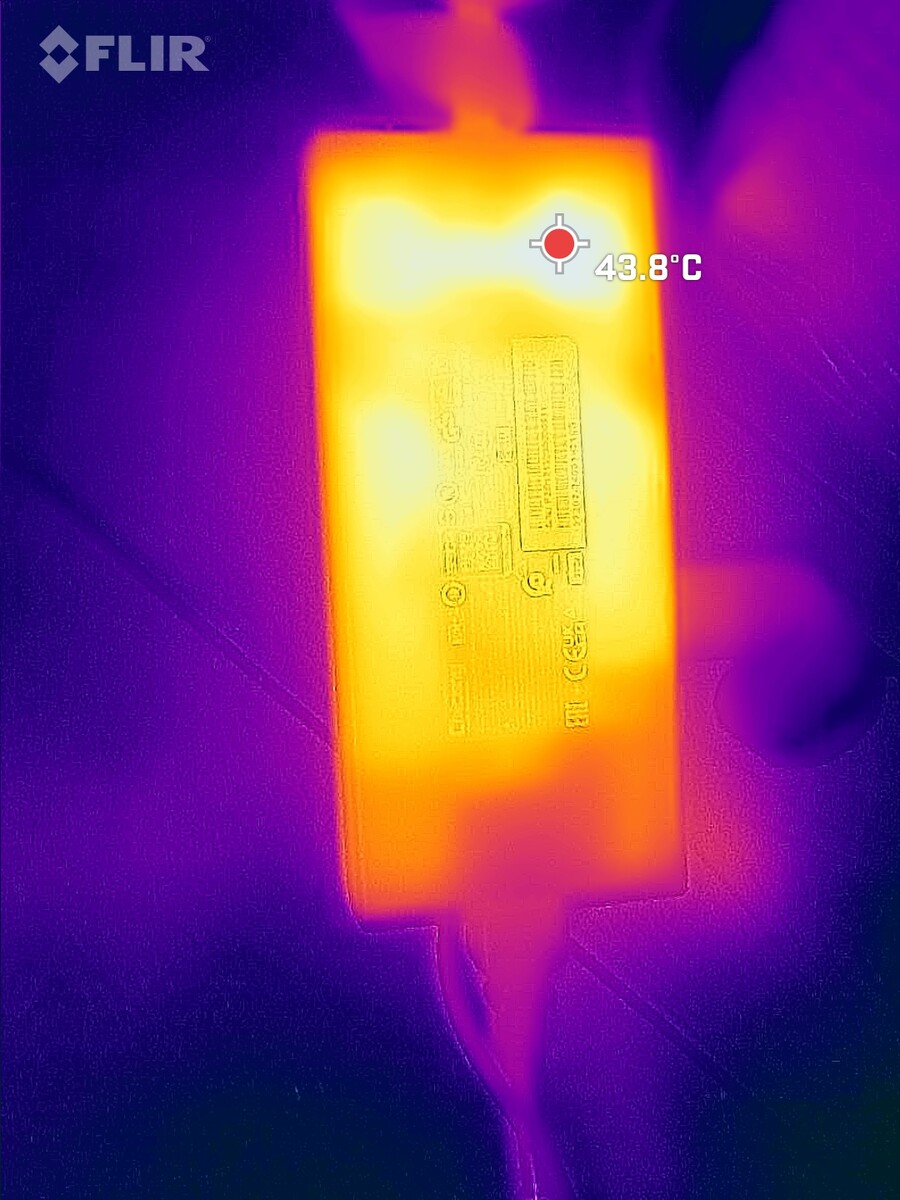
Podczas gry z Witcher 3, średnie zużycie wynosi około 158 W. Średniej wielkości standardowy zasilacz od Chicony ma moc znamionową 240 W i dobrze radzi sobie ze szczytami obciążenia do 192 W w testach stresowych.
| wyłączony / stan wstrzymania | |
| luz | |
| obciążenie |
|
Legenda:
min: | |
| Gigabyte AERO 16 OLED BSF i9-13900H, GeForce RTX 4070 Laptop GPU, Gigabyte AG470S1TB-SI B10, OLED, 3840x2400, 16" | Gigabyte Aero 16 YE5 i9-12900HK, GeForce RTX 3080 Ti Laptop GPU, Phison ESR01TBMFCT, AMOLED, 3840x2400, 16" | Razer Blade 18 RTX 4070 i9-13950HX, GeForce RTX 4070 Laptop GPU, SSSTC CA6-8D1024, IPS, 2560x1600, 18" | Asus ZenBook Pro 16X OLED UX7602ZM-ME115W i9-12900H, GeForce RTX 3060 Laptop GPU, Samsung PM9A1 MZVL21T0HCLR, OLED, 3840x2400, 16" | Asus TUF Gaming A16 FA617 R7 7735HS, Radeon RX 7600S, Micron 2400 MTFDKBA1T0QFM, IPS-Level, 1920x1200, 16" | MSI CreatorPro Z16P B12UKST i7-12700H, RTX A3000 Laptop GPU, Samsung PM9A1 MZVL21T0HCLR, IPS, 2560x1600, 16" | Przeciętny NVIDIA GeForce RTX 4070 Laptop GPU | Średnia w klasie Gaming | |
|---|---|---|---|---|---|---|---|---|
| Power Consumption | -64% | -84% | 4% | 14% | 2% | -16% | -22% | |
| Idle Minimum * (Watt) | 11.8 | 26 -120% | 24.5 -108% | 11.1 6% | 8 32% | 10.8 8% | 13.2 ? -12% | 13.2 ? -12% |
| Idle Average * (Watt) | 16.1 | 30 -86% | 34.1 -112% | 11.4 29% | 11 32% | 16.3 -1% | 18.2 ? -13% | 18.9 ? -17% |
| Idle Maximum * (Watt) | 17 | 37 -118% | 47.7 -181% | 14.4 15% | 16 6% | 16.9 1% | 24.6 ? -45% | 24.3 ? -43% |
| Load Average * (Watt) | 100.6 | 127 -26% | 140 -39% | 137.4 -37% | 97 4% | 111.7 -11% | 97 ? 4% | 108 ? -7% |
| Witcher 3 ultra * (Watt) | 158 | 176 -11% | 202 -28% | 136 14% | 161.5 -2% | 152.1 4% | ||
| Load Maximum * (Watt) | 192 | 236 -23% | 261 -36% | 197 -3% | 168 12% | 177.4 8% | 221 ? -15% | 254 ? -32% |
* ... im mniej tym lepiej
Power Consumption Witcher 3 / Stress Test
Power Consumption with an External Monitor
Czas pracy na baterii
Czas pracy na akumulatorze zależy w dużej mierze od wybranego trybu, a jasny ekran OLED również drenuje sporo soku. Omawiany laptop posiada jeszcze akumulator o pojemności 88 Wh. Ze względu na ogólnie niższe zużycie energii dłuższe czasy pracy można uzyskać przy dobrze dobranym trybie oszczędzania energii.
Podczas oglądania filmu czy przeglądania stron internetowych przy zmniejszonej jasności uzyskujemy nieco poniżej 7,5 godziny każdy, co jest dobrą wartością. Gigabyte automatycznie włączył tutaj tryb oszczędzania energii. Przy maksymalnej jasności czas pracy spada do 5,5 godziny.
| Gigabyte AERO 16 OLED BSF i9-13900H, GeForce RTX 4070 Laptop GPU, 88 Wh | Alienware x15 R2 P111F i9-12900H, GeForce RTX 3080 Ti Laptop GPU, 87 Wh | MSI Creator Z16P B12UHST i9-12900H, GeForce RTX 3080 Ti Laptop GPU, 90 Wh | Asus ROG Zephyrus Duo 16 GX650RX R9 6900HX, GeForce RTX 3080 Ti Laptop GPU, 90 Wh | Acer Predator Triton 500 SE PT516-52s-70KX i7-12700H, GeForce RTX 3080 Ti Laptop GPU, 99.98 Wh | Gigabyte Aero 16 YE5 i9-12900HK, GeForce RTX 3080 Ti Laptop GPU, 99 Wh | Średnia w klasie Gaming | |
|---|---|---|---|---|---|---|---|
| Czasy pracy | -20% | -35% | -7% | -3% | -13% | -8% | |
| H.264 (h) | 7.4 | 5.8 -22% | 9.3 26% | 8.2 11% | 7.5 1% | 8.26 ? 12% | |
| WiFi v1.3 (h) | 7.5 | 6 -20% | 5.2 -31% | 7.8 4% | 5.7 -24% | 6.4 -15% | 7.02 ? -6% |
| Load (h) | 2.1 | 1 -52% | 1 -52% | 2.2 5% | 1.6 -24% | 1.47 ? -30% | |
| Reader / Idle (h) | 12.5 | 8.9 | 8.71 ? |
Za
Przeciw
Werdykt - O krok bliżej do celu

Do tej pory wydajne laptopy były często duże, głośne i gorące, przez co w zależności od konstrukcji nadawały się dla graczy lub twórców. W przyszłości najlepiej byłoby, gdybyśmy chcieli cichych, chłodnych, a w razie potrzeby małych, mobilnych laptopów. Aero jest dobrym krokiem w tym kierunku, nawet jeśli obecna technologia jest daleka od ideału.
Aero wypada lepiej od swojego grubszego poprzednika z RTX 3080 Ti (również tylko 105 W), ale jego wydajny RTX 4070 zużywa zauważalnie mniej i pozostaje chłodniejszy, choć nie cichszy. Jeśli zależy Ci na dyskrecji, skorzystasz z wielu trybów zasilania i opcji ustawień ręcznych w Control Center. Dzięki temu można dostosować wydajność i emisję Aero do danej sytuacji lub otoczenia. Ponieważ obecny Aero uzyskał lepsze wyniki w kategorii oceny "Gaming" (88%) niż w kategorii "Multimedia" (86%), oceniamy go jako notebook do gier.
Graczom może przeszkadzać fakt, że świetny skądinąd wyświetlacz OLED może pracować tylko z częstotliwością 60 Hz. Poza tym wszystkie inne punkty krytyki, jak np. niezrównoważone głośniki, są stosunkowo łagodne.
Aero 16 OLED ma nie tylko świetny ekran, ale jest także szczególnie cienki, a dzięki wydajnemu RTX 4070 także potężny, a przy tym stosunkowo oszczędny i chłodny.
Konkurencja nigdy nie śpi i także bada możliwości nowej generacji RTX 40x. Do tej pory zrecenzowaliśmy jedynie kilka sztuk, więc alternatywy są jeszcze rzadkością.
Cena i dostępność
Zainteresowani kupujący mogą sprawdzić bezpośrednio przez oficjalną stronę produktu Gigabyte'a tutajgdzie należy kliknąć na Buy i wybrać z listy rozwijanej odpowiedni region i kraj. Następnie zostaniesz przekierowany do listy sklepów internetowych, które mogą wystawić laptopa w Twoim kraju.
Na przykład w USA Amazon wymienia dwie konfiguracje Gigabyte Aero 16 OLED, a mianowicie jedną z procesorem i9-13900H i 32 GB RAM oraz drugą z procesorem i7-13700H i 16 GB RAM. Ceny obu to US$ 2.299,00 i 2.099,00 USD, odpowiednio. Oczywiście nie jest to reprezentatywne dla globalnej dostępności, która prawdopodobnie będzie się wahać w zależności od czynników regionalnych i wysyłkowych.
Ceny są na dzień 12.03.2023 i mogą ulec zmianie.
Gigabyte AERO 16 OLED BSF
- 13/03/2023 v7 (old)
Christian Hintze
Przezroczystość
Wyboru urządzeń do recenzji dokonuje nasza redakcja. Próbka testowa została udostępniona autorowi jako pożyczka od producenta lub sprzedawcy detalicznego na potrzeby tej recenzji. Pożyczkodawca nie miał wpływu na tę recenzję, producent nie otrzymał też kopii tej recenzji przed publikacją. Nie było obowiązku publikowania tej recenzji. Jako niezależna firma medialna, Notebookcheck nie podlega władzy producentów, sprzedawców detalicznych ani wydawców.
Tak testuje Notebookcheck
Każdego roku Notebookcheck niezależnie sprawdza setki laptopów i smartfonów, stosując standardowe procedury, aby zapewnić porównywalność wszystkich wyników. Od około 20 lat stale rozwijamy nasze metody badawcze, ustanawiając przy tym standardy branżowe. W naszych laboratoriach testowych doświadczeni technicy i redaktorzy korzystają z wysokiej jakości sprzętu pomiarowego. Testy te obejmują wieloetapowy proces walidacji. Nasz kompleksowy system ocen opiera się na setkach uzasadnionych pomiarów i benchmarków, co pozwala zachować obiektywizm.Price comparison

