Recenzje laptopów Intel Graphics 4-Core iGPU (Meteor / Arrow Lake) z kartą graficzną
Recenzja Ninkear S13: Tablet z systemem Windows i procesorem Core Ultra 5 w obudowie Surface Pro
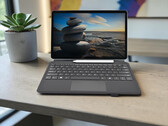
Ninkear S13 to wszechstronny tablet z systemem Windows, odłączaną klawiaturą i procesorem Intel Core Ultra 5 115U. Urządzenie łączy w sobie wydajną 13-calową obudowę z nowoczesnym sprzętem i jest skierowane przede wszystkim do użytkowników, którzy chcą elastycznie pracować w podróży. Ale jak urządzenie 2 w 1 sprawdza się w codziennym użytkowaniu pod względem wydajności, wyświetlacza, mobilności i żywotności baterii? Nasz test dostarczy Państwu odpowiedzi.
Intel Core Ultra 5 115U, Graphics 4-Core iGPU (Arrow Lake), 13", 870 gRecenzja laptopa LG Gram Book 15U55T: Zbyt wiele cięć narożników
Celując w kategorię budżetową, Gram Book 15 traci wszystkie punkty sprzedaży, które sprawiają, że seria Gram jest tak wyjątkowa. Nieliczne zalety nie są wystarczające, aby system był łatwy do polecenia.
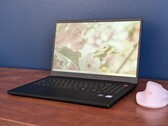
Intel Core Ultra 7 255U, Graphics 4-Core iGPU (Arrow Lake), 15.6", 1.6 kgRecenzja GMK NucBox K15: Niedrogi mini PC o ponadwymiarowej konstrukcji
Intel Core Ultra 5 125U nie wymaga dużego chłodzenia, ale w połączeniu z większą niż zwykle konstrukcją obudowy, otrzymany system ledwo wydaje z siebie dźwięk.
Intel Core Ultra 5 125U, Graphics 4-Core iGPU (Arrow Lake), 885 gRecenzja Minisforum MS-02 Ultra: Stacja robocza jako mini PC z Intel Core Ultra, PCIe i szybką siecią
Minisforum MS-02 Ultra łączy w sobie potężny sprzęt Intel Core Ultra z wyjątkowo szerokim zakresem funkcji w kompaktowym formacie. Dzięki dużej mocy obliczeniowej, zintegrowanej akceleracji AI oraz wszechstronnym opcjom rozszerzeń i sieci, jest on skierowany do wymagających użytkowników. Czy MS-02 Ultra 2025 należy do najwyższej klasy mini PC? Nasz test dostarczy Państwu odpowiedzi.
Intel Core Ultra 9 285HX, Graphics 4-Core iGPU (Arrow Lake), 3.5 kgWymiana wydajności na opcjonalne 5G i Lunar Lake na Arrow Lake: Recenzja laptopa Lenovo ThinkPad X1 Carbon Gen 13
Testowaliśmy już Lenovo ThinkPad X1 Carbon Gen 13, ale tylko model z procesorem Intel Lunar Lake i ekranem OLED. Wielu klientów pyta: A co z wersją Arrow Lake z wyświetlaczem IPS, która często jest tańsza i łatwiej dostępna? Przetestowaliśmy ją, aby zobaczyć, jakie są różnice.
Intel Core Ultra 5 225U, Graphics 4-Core iGPU (Arrow Lake), 14", 1.2 kgHP Omnibook 5 16-af1037nr: Intel Core Ultra 7 255U, 16.00", 1.7 kg
Recenzja » Recenzja laptopa HP Omnibook 5 16: Tylko podstawy za niską cenę
HP 17t-cn500: Intel Core Ultra 7 255U, 17.30", 2.1 kg
Recenzja » Recenzja laptopa HP 17t-cn500: Duży ekran dla podstawowych multimediów
HP EliteBook 8 Flip G1i 13: Intel Core Ultra 7 265U, 13.30", 1.4 kg
Recenzja » Recenzja konwertowalnego HP EliteBook 8 Flip G1i 13: Wygodny i superwydajny
Lenovo ThinkPad T14s 2in1 Gen1: Intel Core Ultra 7 255U, 14.00", 1.4 kg
Recenzja » Recenzja Lenovo ThinkPad T14s 2-w-1 Gen1 - Nowy biznesowy kabriolet rodzi pytania
Lenovo IdeaPad 5 2-in-1 16IAL10: Intel Core Ultra 7 255U, 16.00", 2.1 kg
Recenzja » Recenzja Lenovo IdeaPad 5 2 w 1 16IAL10: Kabriolet z dużym ekranem i procesorem Intel Arrow Lake
Asus ExpertBook B5 B5404CMA: Intel Core Ultra 7 155U, 14.00", 1.3 kg
Recenzja » Recenzja laptopa Asus ExpertBook B5 B5404CMA: Atrakcyjny laptop biznesowy z całodziennym czasem pracy na baterii, który pomija jeden ważny aspekt
Lenovo ThinkPad E16 G3-21SSS00F00: Intel Core Ultra 5 225U, 16.00", 1.7 kg
Recenzja » Recenzja Lenovo ThinkPad E16 G3 - niedrogi laptop biurowy jest jeszcze lepszy dzięki wyświetlaczowi 120 Hz
Durabook S14I G3: Intel Core Ultra 7 165U, 14.00", 2.7 kg
Recenzja » Stworzony do ekstremalnych zastosowań - recenzja laptopa przemysłowego Durabook S14I
HP Envy x360 15 fe1071cl: Intel Core Ultra 7 155U, 15.60", 1.9 kg
Recenzja » Recenzja konwertowalnego HP Envy x360 15 Core Ultra 7: Rozczarowujący jak na swoją cenę
Lenovo ThinkPad L13 2in1 G5 21LNS4AM00: Intel Core Ultra 5 125U, 13.30", 1.3 kg
Recenzja » Recenzja Lenovo ThinkPad L13 2 w 1 G5 - biznesowy tablet 2 w 1 z matowym ekranem dotykowym
Acer Aspire Spin 14 ASP14-52MTN-51V5: Intel Core Ultra 5 115U, 14.00", 1.6 kg
Recenzja » Recenzja Acer Aspire Spin 14: Szalony świat laptopów 2 w 1
Lenovo ThinkPad X12 Detachable G2: Intel Core Ultra 5 134U, 12.30", 1.1 kg
Recenzja » Recenzja Lenovo ThinkPad X12 Detachable G2: Wszechstronna hybryda laptopa i tabletu do codziennego użytku biznesowego
Lenovo ThinkBook 16 G7 IML: Intel Core Ultra 5 125U, 16.00", 1.8 kg
Recenzja » Recenzja laptopa Lenovo ThinkBook 16 G7 IML: Niedrogi, ale profesjonalny
Lenovo ThinkPad X13 2-in-1 Gen 5: Intel Core Ultra 7 165U, 13.30", 1.3 kg
Recenzja » Recenzja laptopa Lenovo ThinkPad X13 2-w-1 Gen 5: Wydajny następca konwertowalnej Yogi
Lenovo ThinkPad E14 G6: Intel Core Ultra 7 155U, 14.00", 1.5 kg
Recenzja » Recenzja laptopa Lenovo ThinkPad E14 G6: Naprawiono wiele problemów z E14 G5
Lenovo ThinkPad T16 Gen 3 21MN005XGE: Intel Core Ultra 5 125U, 16.00", 2 kg
Recenzja » Recenzja laptopa Lenovo ThinkPad T16 Gen 3: Duży ekran, duża bateria, ale niska wydajność
Dell Latitude 7450 2-in-1: Intel Core Ultra 7 165U, 14.00", 1.5 kg
Recenzja » Recenzja laptopa 2 w 1 Dell Latitude 7450: Wszechstronny biznesowy laptop konwertowalny, który sprawdza się na większości frontów
Dell Latitude 7350 Detachable: Intel Core Ultra 7 164U, 13.00", 0.9 kg
Recenzja » Debiut wydajności Core Ultra 7 164U: Recenzja Dell Latitude 7350 Detachable
Lenovo ThinkPad T14 G5 21ML005JGE: Intel Core Ultra 7 155U, 14.00", 1.5 kg
Recenzja » Recenzja laptopa Lenovo ThinkPad T14 Gen 5 Intel: Rozszerzalna pamięć RAM powraca do serii T
Lenovo Yoga 7 2-in-1 14IML9: Intel Core Ultra 5 125U, 14.00", 1.6 kg
Recenzja » Recenzja konwertowalnego Lenovo Yoga 7 2-w-1 14IML9: Klasa za mniej niż 700 dolarów
Lenovo ThinkPad T14s Gen 5 21LS001PGE: Intel Core Ultra 5 125U, 14.00", 1.3 kg
Recenzja » Recenzja laptopa Lenovo ThinkPad T14s Gen 5: ThinkPad T klasy premium z procesorem Intel Core Ultra
Dell Latitude 13 7350: Intel Core Ultra 5 135U, 13.30", 1.1 kg
Recenzja » Debiut wydajności Core Ultra 5 135U: Recenzja laptopa Dell Latitude 13 7350
HP Envy x360 2-in-1 14-fc0078TU: Intel Core Ultra 5 125U, 14.00", 1.4 kg
Recenzja » Recenzja laptopa HP Envy x360 2-w-1 14 (2024): Konwertowalny laptop klasy niemal premium, który sprawia, że chcemy więcej
Lenovo ThinkPad X1 2in1 G9 21KE004AGE: Intel Core Ultra 7 165U, 14.00", 1.3 kg
Recenzja » Recenzja Lenovo ThinkPad X1 2in1 G9 - Wysokiej klasy biznesowy kabriolet z wyświetlaczem OLED 120 Hz i bez przycisków TrackPoint
Lenovo ThinkBook 14 2-in-1 G4 IML: Intel Core Ultra 5 125U, 14.00", 1.6 kg
Recenzja » Recenzja Lenovo ThinkBook 14 2-w-1 G4 IML: Nowy elegancki wygląd z Meteor Lake-U
Lenovo Yoga 7 2-in-1 16IML9: Intel Core Ultra 5 125U, 16.00", 2.1 kg
Recenzja » Debiut wydajności Core Ultra 5 125U: Recenzja konwertowalnego Lenovo Yoga 7 2-w-1 16IML9
Lenovo Yoga Book 9 13IMU9: Intel Core Ultra 7 155U, 13.30", 1.4 kg
Recenzja » Recenzja Lenovo Yoga Book 9 13IMU9 2 w 1 z dwoma ekranami: Core Ultra 7 155U i Arc 4 to mieszana torba
Dell Latitude 9450 2-in-1: Intel Core Ultra 7 165U, 14.00", 1.6 kg
Recenzja » Debiut wydajności Core Ultra 7 165U: Recenzja Dell Latitude 9450 2-w-1
Lenovo ThinkPad E16 G3-21SSS00F00: Intel Core Ultra 5 225U, 16.00", 1.7 kg
Zewnętrzna recenzja » Lenovo ThinkPad E16 G3-21SSS00F00 - Recenzje i Specyfikacja
Lenovo ThinkPad X13 G6, Core 7 255U: Intel Core Ultra 7 255U, 13.30", 1 kg
Zewnętrzna recenzja » Lenovo ThinkPad X13 G6, Core 7 255U
Lenovo ThinkPad T14 G6 Intel: Intel Core Ultra 5 225U, 14.00", 1.4 kg
Zewnętrzna recenzja » Lenovo ThinkPad T14 G6 Intel
HP ProBook 4 G1i 16: Intel Core Ultra 5 225U, 16.00", 1.7 kg
Zewnętrzna recenzja » HP ProBook 4 G1i 16
Samsung Galaxy Book5 15 NP750XHD: Intel Core Ultra 7 255U, 15.60", 1.6 kg
Zewnętrzna recenzja » Samsung Galaxy Book5 15 NP750XHD
HP Elitebook 6 G1i 13: Intel Core Ultra 5 225U, 13.30", 1.3 kg
Zewnętrzna recenzja » HP Elitebook 6 G1i 13
HP Omnibook 5 16-af1037nr: Intel Core Ultra 7 255U, 16.00", 1.7 kg
Zewnętrzna recenzja » HP Omnibook 5 16-af1037nr
Lenovo ThinkPad T14s 2in1 Gen1: Intel Core Ultra 7 255U, 14.00", 1.4 kg
Zewnętrzna recenzja » Lenovo ThinkPad T14s 2in1 Gen1
Lenovo ThinkPad X13 G6 Intel: Intel Core Ultra 5 225U, 13.30", 1 kg
Zewnętrzna recenzja » Lenovo ThinkPad X13 G6 Intel
Dell Pro 14 PC14250: Intel Core Ultra 7 255U, 14.00", 1.4 kg
Zewnętrzna recenzja » Dell Pro 14 PC14250
HP EliteBook 8 Flip G1i 13: Intel Core Ultra 7 265U, 13.30", 1.4 kg
Zewnętrzna recenzja » HP EliteBook 8 Flip G1i 13
Dynabook Portégé X40-M: Intel Core Ultra 5 225U, 14.00", 1.4 kg
Zewnętrzna recenzja » Dynabook Portégé X40-M
Lenovo IdeaPad 5 2-in-1 16IAL10: Intel Core Ultra 7 255U, 16.00", 2.1 kg
Zewnętrzna recenzja » Lenovo IdeaPad 5 2-in-1 16IAL10
HP OmniBook 7 AI 14-fr0000: Intel Core Ultra 5 225U, 14.00", 2.5 kg
Zewnętrzna recenzja » HP OmniBook 7 AI 14-fr0000
Dell Pro 16 PC16250: Intel Core Ultra 7 265U, 16.00", 1.9 kg
Zewnętrzna recenzja » Dell Pro 16 PC16250
Lenovo ThinkPad X13 2-in-1 Gen 5: Intel Core Ultra 7 165U, 13.30", 1.3 kg
Zewnętrzna recenzja » Lenovo ThinkPad X13 2-in-1 Gen 5
Acer Swift Neo AI 14 SFN14-54H: Intel Core Ultra 5 115U, 14.00", 1.3 kg
Zewnętrzna recenzja » Acer Swift Neo AI 14 SFN14-54H
Acer Swift Lite 14 AI SFL14-51M, Ultra 5 115U: Intel Core Ultra 5 115U, 14.00", 1.3 kg
Zewnętrzna recenzja » Acer Swift Lite 14 AI SFL14-51M, Ultra 5 115U
Lenovo ThinkPad T14s Gen 5 21LS001PGE: Intel Core Ultra 5 125U, 14.00", 1.3 kg
Zewnętrzna recenzja » Lenovo ThinkPad T14s Gen 5 21LS001PGE
Acer Swift Lite 16 AI SFL16-51M: Intel Core Ultra 7 155U, 16.00", 1.2 kg
Zewnętrzna recenzja » Acer Swift Lite 16 AI SFL16-51M
Acer Swift Go 14 OLED SFG14-73, Ultra 5 125U: Intel Core Ultra 5 125U, 14.00", 1.3 kg
Zewnętrzna recenzja » Acer Swift Go 14 OLED SFG14-73, Ultra 5 125U
Lenovo ThinkPad L13 G5: Intel Core Ultra 5 125U, 13.30", 1.2 kg
Zewnętrzna recenzja » Lenovo ThinkPad L13 G5
HP EliteBook 640 G11: Intel Core Ultra 7 155U, 14.00", 1.4 kg
Zewnętrzna recenzja » HP EliteBook 640 G11
HP Pavilion 16-af0075ng: Intel Core Ultra 5 125U, 16.00", 1.8 kg
Zewnętrzna recenzja » HP Pavilion 16-af0075ng
Lenovo ThinkPad E14 G6: Intel Core Ultra 7 155U, 14.00", 1.5 kg
Zewnętrzna recenzja » Lenovo ThinkPad E14 G6
Acer Chromebook Plus Spin 714-1H, Ultra 5 115U: Intel Core Ultra 5 115U, 14.00", 1.5 kg
Zewnętrzna recenzja » Acer Chromebook Plus Spin 714-1H, Ultra 5 115U
Asus ExpertBook CX5403, Ultra 5 115U: Intel Core Ultra 5 115U, 14.00", 1.4 kg
Zewnętrzna recenzja » Asus ExpertBook CX5403, Ultra 5 115U
Acer Swift Lite 14 AI SFL14-51M, Ultra 5 125U: Intel Core Ultra 5 125U, 14.00", 1.3 kg
Zewnętrzna recenzja » Acer Swift Lite 14 AI SFL14-51M, Ultra 5 125U
HP Probook 440 G11: Intel Core Ultra 5 125U, 14.00", 1.4 kg
Zewnętrzna recenzja » HP Probook 440 G11
HP Pavilion 16-af0000ng: Intel Core Ultra 5 125U, 16.00", 1.8 kg
Zewnętrzna recenzja » HP Pavilion 16-af0000ng
HP EliteBook 830 G11: Intel Core Ultra 7 155U, 13.30", 1.3 kg
Zewnętrzna recenzja » HP EliteBook 830 G11
HP EliteBook 840 G11: Intel Core Ultra 7 155U, 14.00", 1.4 kg
Zewnętrzna recenzja » HP EliteBook 840 G11
HP EliteBook 660 G11: Intel Core Ultra 7 155U, 16.00", 1.7 kg
Zewnętrzna recenzja » HP EliteBook 660 G11
Lenovo ThinkPad T14 G5, Ultra 5 125U: Intel Core Ultra 5 125U, 14.00", 1.4 kg
Zewnętrzna recenzja » Lenovo ThinkPad T14 G5, Ultra 5 125U
Lenovo ThinkPad X12 Detachable G2: Intel Core Ultra 5 134U, 12.30", 1.1 kg
Zewnętrzna recenzja » Lenovo ThinkPad X12 Detachable G2
Acer TravelMate P4 Spin 14 TMP414RN-54: Intel Core Ultra 5 125U, 14.00", 1.5 kg
Zewnętrzna recenzja » Acer TravelMate P4 Spin 14 TMP414RN-54
Lenovo ThinkPad T16 Gen 3 21MN005XGE: Intel Core Ultra 5 125U, 16.00", 2 kg
Zewnętrzna recenzja » Lenovo ThinkPad T16 Gen 3 21MN005XGE
Lenovo ThinkBook 14 G7 IML, Ultra 5 125U: Intel Core Ultra 5 125U, 14.00", 1.4 kg
Zewnętrzna recenzja » Lenovo ThinkBook 14 G7 IML, Ultra 5 125U
HP ProBook 460 G11: Intel Core Ultra 5 125U, 16.00", 1.7 kg
Zewnętrzna recenzja » HP ProBook 460 G11
Lenovo ThinkPad L14 G5: Intel Core Ultra 7 155U, 14.00", 1.4 kg
Zewnętrzna recenzja » Lenovo ThinkPad L14 G5
HP EliteBook 860 G11: Intel Core Ultra 7 155U, 16.00", 1.7 kg
Zewnętrzna recenzja » HP EliteBook 860 G11
Acer Swift Lite 14 AI SFL14-51M: Intel Core Ultra 7 155U, 14.00", 1.3 kg
Zewnętrzna recenzja » Acer Swift Lite 14 AI SFL14-51M
Dell Latitude 7450 2-in-1: Intel Core Ultra 7 155U, 14.00", 1.1 kg
Zewnętrzna recenzja » Dell Latitude 7450 2-in-1
Asus ExpertBook CX5403, Ultra 5 125U: Intel Core Ultra 5 125U, 14.00", 1.4 kg
Zewnętrzna recenzja » Asus ExpertBook CX5403, Core 5 125U
Lenovo ThinkBook 14 IML G4: Intel Core Ultra 5 125U, 14.00", 1.6 kg
Zewnętrzna recenzja » Lenovo ThinkBook 14 IML G4
Lenovo ThinkBook 14 2-in-1 G4 IML, Ultra 7 155U: Intel Core Ultra 7 155U, 14.00", 1.6 kg
Zewnętrzna recenzja » Lenovo ThinkBook 14 2-in-1 G4 IML, Ultra 7 155U
Lenovo ThinkPad L16 G1, Ultra 5 125U: Intel Core Ultra 5 125U, 16.00", 1.8 kg
Zewnętrzna recenzja » Lenovo ThinkPad L16 G1, Ultra 5 125U
HP Pavilion 16-af0000: Intel Core Ultra 7 155U, 16.00", 1.8 kg
Zewnętrzna recenzja » HP Pavilion 16-af0000
Asus ExpertBook B5404CMA: Intel Core Ultra 7 155U, 14.00", 1.4 kg
Zewnętrzna recenzja » Asus ExpertBook B5404CMA
HP Envy x360 14-fc0000: Intel Core Ultra 5 125U, 14.00", 1.4 kg
Zewnętrzna recenzja » HP Envy x360 14-fc0000
Asus Zenbook S 13 UX5304MA: Intel Core Ultra 7 155U, 13.30", 1 kg
Zewnętrzna recenzja » Asus Zenbook S 13 UX5304MA
Lenovo ThinkPad X13 2-in-1 G5: Intel Core Ultra 7 155U, 13.30", 1.3 kg
Zewnętrzna recenzja » Lenovo ThinkPad X13 2-in-1 G5
Lenovo ThinkPad T14 G5 21ML005JGE: Intel Core Ultra 7 155U, 14.00", 1.5 kg
Zewnętrzna recenzja » Lenovo ThinkPad T14 G5 21ML005JGE
Dell Latitude 5450: Intel Core Ultra 7 155U, 14.00", 1.4 kg
Zewnętrzna recenzja » Dell Latitude 5450
Dell Latitude 5550: Intel Core Ultra 7 155U, 15.60", 1.6 kg
Zewnętrzna recenzja » Dell Latitude 5550
Dell Latitude 9450 2-in-1: Intel Core Ultra 7 165U, 14.00", 1.6 kg
Zewnętrzna recenzja » Dell Latitude 9450 2-in-1
Asus ExpertBook CX5403: Intel Core Ultra 7 155U, 14.00", 1.4 kg
Zewnętrzna recenzja » Asus ExpertBook CX5403
Dell Latitude 7350 Detachable 2024: Intel Core Ultra 7 164U, 13.30", 0.9 kg
Zewnętrzna recenzja » Dell Latitude 7350 Detachable 2024
Dell Latitude 13 7350, Ultra 7 165U: Intel Core Ultra 7 165U, 13.30", 1.3 kg
Zewnętrzna recenzja » Dell Latitude 13 7350, Ultra 7 165U
Lenovo ThinkBook 14 2-in-1 G4 IML: Intel Core Ultra 5 125U, 14.00", 1.6 kg
Zewnętrzna recenzja » Lenovo ThinkBook 14 2-in-1 G4 IML
Acer Aspire Vero AV16-51P, Ultra 5 125U: Intel Core Ultra 5 125U, 16.00", 1.8 kg
Zewnętrzna recenzja » Acer Aspire Vero AV16-51P, Ultra 5 125U
Dell Latitude 7450: Intel Core Ultra 7 165U, 14.00", 1.5 kg
Zewnętrzna recenzja » Dell Latitude 7450
Acer Chromebook Plus Spin 714-1H: Intel Core Ultra 5 125U, 14.00", 1.5 kg
Zewnętrzna recenzja » Acer Chromebook Plus Spin 714-1H
Dell Latitude 13 7350: Intel Core Ultra 5 135U, 13.30", 1.1 kg
Zewnętrzna recenzja » Dell Latitude 13 7350
Lenovo ThinkPad X1 2in1 G9 21KE004AGE: Intel Core Ultra 7 165U, 14.00", 1.3 kg
Zewnętrzna recenzja » Lenovo ThinkPad X1 2in1 G9 21KE004AGE
HP Envy x360 14-fc: Intel Core Ultra 7 155U, 14.00", 1.4 kg
Zewnętrzna recenzja » HP Envy x360 14-fc
Acer Aspire Vero AV16-51P: Intel Core Ultra 7 155U, 16.00", 1.8 kg
Zewnętrzna recenzja » Acer Aspire Vero AV16-51P
Asus ZenBook S13 OLED UX5304MA: Intel Core Ultra 7 155U, 13.30", 1 kg
Zewnętrzna recenzja » Asus ZenBook S13 OLED UX5304MA
Lenovo Yoga 7 16IML9: Intel Core Ultra 5 125U, 16.00", 2 kg
Zewnętrzna recenzja » Lenovo Yoga 7 16IML9
Lenovo Yoga Book 9 13IMU9: Intel Core Ultra 7 155U, 13.30", 1.4 kg
Zewnętrzna recenzja » Lenovo Yoga Book 9 13IMU9
Microsoft Surface Pro 10: Intel Core Ultra 5 135U, 13.00", 0.9 kg
Zewnętrzna recenzja » Microsoft Surface Pro 10
Ninkear S13, 16+1TB: Intel Core Ultra 5 115U, 13.00", 0.9 kg
» Nowa perspektywa dla pracy mobilnej: Ninkear S13 jako tablet i laptop 2 w 1
LG Gram 15U55T: Intel Core Ultra 7 255U, 15.60", 1.6 kg
» LG Gram Book 15 poświęca wydajność procesora na rzecz znacznie cichszego wentylatora
» LG Gram Book 15 ma jeden z najgorszych wyświetlaczy IPS w serii
GMK NucBox K15: Intel Core Ultra 5 125U, 0.9 kg
» Minikomputer GMKtec K15 przełożył kompaktowość na cichszą pracę
Minisforum MS-02 Ultra: Intel Core Ultra 9 285HX, 3.5 kg
» Recenzja Minisforum MS-02 Ultra: Wysokowydajny mini PC dla profesjonalistów z do 256 GB RAM, 25G LAN i PCIe
Lenovo ThinkPad X1 Carbon Gen 13 21NX008PGE: Intel Core Ultra 5 225U, 14.00", 1.2 kg
» Zbyt wiele opcji zamieszania: Dlaczego Lenovo powinno uprościć ofertę ThinkPad X1 Carbon?
HP Omnibook 5 16-af1037nr: Intel Core Ultra 7 255U, 16.00", 1.7 kg
» HP OmniBook 5 16 vs. Dell 16 Plus: Lunar Lake-V robi różnicę
» HP OmniBook 5 16 nie oferuje nic szczególnego, ale to prawdopodobnie najlepiej
HP 17t-cn500: Intel Core Ultra 7 255U, 17.30", 2.1 kg
» Budżetowa seria HP 17t jest teraz w sprzedaży o ponad połowę taniej, zaczynając od zaledwie 420 USD
» Core Ultra 7 255U może działać znacznie wolniej niż Core Ultra 7 155U w zależności od laptopa
HP EliteBook 8 Flip G1i 13: Intel Core Ultra 7 265U, 13.30", 1.4 kg
» Core Ultra 7 265U vs Core Ultra 7 165U: Prawie brak różnic w wydajności między nimi
» HP EliteBook 8 Flip G1i 13 jest lepszy od EliteBooka x360 830 G10 pod niemal każdym względem
Lenovo ThinkPad T14s 2in1 Gen1: Intel Core Ultra 7 255U, 14.00", 1.4 kg
» Procesor Intel Arrow Lake to najgorszy wybór dla Lenovo ThinkPad T14s 2-w-1
» Nowy biznesowy konwertowalny ThinkPad T14s 2 w 1 firmy Lenovo cierpi z powodu wyświetlacza 60 Hz
Lenovo IdeaPad 5 2-in-1 16IAL10: Intel Core Ultra 7 255U, 16.00", 2.1 kg
» Core Ultra 7 255U vs. Core Ultra 155U: Wczesne testy porównawcze pokazują dobrą poprawę wydajności wielowątkowej
» Lenovo IdeaPad 2 w 1 16 z Intel Arrow Lake oferuje zbyt mało w stosunku do ceny
Lenovo ThinkPad E16 G3-21SSS00F00: Intel Core Ultra 5 225U, 16.00", 1.7 kg
» Nowy ThinkPad E16 G3 firmy Lenovo to obecnie najlepszy budżetowy laptop biurowy
Lenovo ThinkPad T14 G5 21ML005JGE: Intel Core Ultra 7 155U, 14.00", 1.5 kg
» Lenovo ThinkPad T14 G5: niemal idealny laptop biznesowy