Intel UHD Graphics 605
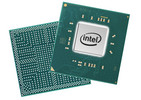
UHD Graphics 605 to układ grafiki z procesorów Gemini Lake (jak np. Pentirum Silver N5000).
Gen. 9 Rodzina Nazwa robocza Gemini Lake Architektura Gen. 9 Apollo Lake Potoki 18 - ZJC Zegar rdzenia 300 - 750 (Boost) MHz Magistrala 64/128 bit Typ pamięci DDR4 / LPDDR4 Pamięć współdzielona tak API DirectX 12_1, OpenGL 4.4 Technologia 14 nm Technologie QuickSync Data premiery 11.12.2017 Witryna producenta https://ark.intel.com/de/products/128990...
Testy Performance Rating - 3DMark 11 + Fire Strike + Time Spy
1.7 pt (2%)
...
Intel UHD Graphics (Elkhart Lake 16 EU) -7%
...
3DMark - 3DMark Time Spy Score
129 Points (0%)
Intel UHD Graphics (Jasper Lake 16 EU) 47%
Intel UHD Graphics 610 72%
...
AMD Radeon RX 6850M XT 8931%
3DMark - 3DMark Time Spy Graphics
113 Points (0%)
Intel UHD Graphics (Jasper Lake 16 EU) 46%
Intel UHD Graphics 610 72%
...
3DMark - 3DMark Ice Storm Unlimited Graphics
min: 32770 avg: 43574 median: 45008 (5%) max: 55453 Points
...
Intel UHD Graphics 610 -2%
Intel UHD Graphics (Jasper Lake 16 EU) 2%
...
3DMark - 3DMark Ice Storm Extreme Graphics
min: 13350 avg: 16118 median: 16553.5 (2%) max: 18016 Points
...
Intel UHD Graphics (Elkhart Lake 16 EU) -9%
Intel UHD Graphics (Jasper Lake 16 EU) 19%
Intel UHD Graphics 610 27%
...
NVIDIA GeForce RTX 3080 Laptop GPU 2477%
3DMark - 3DMark Cloud Gate Score
min: 2670 avg: 3247 median: 3154 (3%) max: 4294 Points
...
Intel UHD Graphics (Elkhart Lake 16 EU) -12%
AMD Radeon HD 7550M 10%
...
AMD Radeon RX 6500M 2750%
3DMark - 3DMark Cloud Gate Graphics
min: 2874 avg: 3518 median: 3359.5 (1%) max: 4485 Points
...
Intel UHD Graphics (Elkhart Lake 16 EU) 7%
...
AMD Radeon RX 6850M XT 4817%
3DMark - 3DMark Fire Strike Standard Score
min: 376 avg: 450.1 median: 419 (1%) max: 620 Points
...
Intel UHD Graphics (Elkhart Lake 16 EU) 9%
AMD Radeon HD 7550M 21%
...
AMD Radeon RX 6850M XT 6106%
3DMark - 3DMark Fire Strike Standard Graphics
min: 411 avg: 473.4 median: 454 (1%) max: 576 Points
...
Intel UHD Graphics (Elkhart Lake 16 EU) 10%
...
3DMark - 3DMark Ice Storm Graphics
min: 20859 avg: 25930 median: 26031 (3%) max: 30797 Points
...
Intel UHD Graphics (Elkhart Lake 16 EU) -12%
...
AMD Radeon RX 6800S 1915%
3DMark - 3DMark Sling Shot (ES 3.0) Unlimited
2870 Points (17%)
Apple M1 8-Core GPU 271%
Intel Iris Xe Graphics G7 96EUs 485%
3DMark - 3DMark Sling Shot (ES 3.0) Unlimited Graphics
2805 Points (7%)
Intel Iris Xe Graphics G7 96EUs 930%
Apple M1 8-Core GPU 1303%
3DMark - 3DMark Sling Shot Extreme (ES 3.1) Unlimited
1628 Points (12%)
Intel UHD Graphics Xe G4 48EUs 488%
Apple M1 8-Core GPU 490%
...
Intel UHD Graphics Xe G4 48EUs 488%
3DMark - 3DMark Sling Shot Extreme (ES 3.1) Unlimited Graphics
1450 Points (6%)
Intel UHD Graphics Xe G4 48EUs 738%
Apple M1 8-Core GPU 1673%
3DMark - 3DMark Wild Life Unlimited
882 Points (0%)
Intel UHD Graphics (Jasper Lake 32 EU) 184%
AMD Radeon RX Vega 7 526%
AMD Radeon RX Vega 6 (Ryzen 4000/5000) 533%
...
Apple M1 Max 32-Core GPU 8076%
3DMark - 3DMark Wild Life Extreme Unlimited
281 Points (0%)
Intel UHD Graphics (Jasper Lake 32 EU) 142%
AMD Radeon RX Vega 7 532%
Intel UHD Graphics Xe G4 48EUs 534%
Intel UHD Graphics 770 573%
Intel Iris Xe Graphics G7 80EUs 728%
AMD Radeon RX Vega 8 (Ryzen 4000/5000) 798%
...
NVIDIA GeForce RTX 3080 Laptop GPU 7963%
3DMark - 3DMark Night Raid
min: 1614 avg: 1751 median: 1619 (2%) max: 2019 Points
...
Intel UHD Graphics 610 50%
AMD Radeon RX Vega 2 78%
Intel UHD Graphics (Jasper Lake 32 EU) 96%
Intel UHD Graphics G7 (Lakefield GT2 64 EU) 108%
...
NVIDIA GeForce RTX 3080 Ti Laptop GPU 3352%
3DMark - 3DMark Night Raid Graphics Score
min: 1849 avg: 2059 median: 1893 (1%) max: 2434 Points
Intel UHD Graphics 610 38%
AMD Radeon RX Vega 2 68%
Intel UHD Graphics (Jasper Lake 32 EU) 123%
...
NVIDIA GeForce RTX 3080 Ti Laptop GPU 5994%
3DMark 11 - 3DM11 Performance Score
min: 655 avg: 795 median: 748 (1%) max: 1009 Points
...
AMD Radeon HD 7550M 4%
...
AMD Radeon RX 6850M XT 3781%
3DMark 11 - 3DM11 Performance GPU
min: 588 avg: 701 median: 648 (1%) max: 902 Points
...
Intel UHD Graphics (Elkhart Lake 16 EU) -7%
AMD Radeon HD 7550M 7%
...
AMD Radeon RX 6850M XT 5894%
3DMark Vantage 3DM Vant. Perf. total + 3DMark Vantage - 3DM Vant. Perf. total
2162 Points (1%)
...
...
NVIDIA GeForce RTX 3080 Ti Laptop GPU 4283%
3DM Vant. Perf. GPU no PhysX + 3DMark Vantage - 3DM Vant. Perf. GPU no PhysX
1785 Points (1%)
...
...
NVIDIA GeForce RTX 3080 Ti Laptop GPU 5638%
3DMark 03 - 3DMark 03 - Standard
8388 Points (4%)
...
...
3DMark 05 - 3DMark 05 - Standard
5802 Points (6%)
...
...
NVIDIA GeForce RTX 3060 Laptop GPU 740%
3DMark 06 3DMark 06 - Standard 1280x1024 +
min: 2882 avg: 4208 median: 4171 (6%) max: 5570 Points
...
...
NVIDIA GeForce RTX 3080 Ti Laptop GPU 1256%
Unigine Valley 1.0 - Unigine Valley 1.0 DX
1.7 fps (1%)
Intel UHD Graphics 610 97%
Intel UHD Graphics (Jasper Lake 32 EU) 106%
...
Unigine Heaven 3.0 - Unigine Heaven 3.0 DX 11
6.5 fps (2%)
AMD Radeon HD 7550M 14%
...
Unigine Heaven 3.0 - Unigine Heaven 3.0 OpenGL
7.2 fps (3%)
...
Unigine Heaven 2.1 - Heaven 2.1 high
9 fps (2%)
...
AMD Radeon HD 7550M -10%
...
Cinebench R10 Cinebench R10 Shading (32bit) + Cinebench R10 - Cinebench R10 Shading (32bit)
min: 3505 avg: 3812 median: 3773 (3%) max: 4366 pkt.
...
...
Cinebench R11.5 Cinebench R11.5 OpenGL 64 Bit + Cinebench R11.5 - Cinebench R11.5 OpenGL 64 Bit
min: 15.24 avg: 17.9 median: 17.9 (7%) max: 20.5 fps
...
Intel UHD Graphics 610 -3%
Intel UHD Graphics (Jasper Lake 32 EU) 9%
Intel UHD Graphics (Jasper Lake 16 EU) 10%
...
NVIDIA RTX A2000 Laptop GPU 891%
Cinebench R15 Cinebench R15 OpenGL 64 Bit + Cinebench R15 - Cinebench R15 OpenGL 64 Bit
min: 13.37 avg: 18.2 median: 18.1 (5%) max: 25.6 fps
...
...
NVIDIA RTX A5500 Laptop GPU 1913%
Cinebench R15 OpenGL Ref. Match 64 Bit + Cinebench R15 - Cinebench R15 OpenGL Ref. Match 64 Bit
97.8 % (98%)
...
Intel UHD Graphics (Jasper Lake 24 EU) 0%
Intel Iris Xe MAX Graphics 0%
Intel UHD Graphics 610 0%
Intel Iris Xe Graphics G7 96EUs 0%
Intel UHD Graphics (Elkhart Lake 16 EU) 0%
...
NVIDIA Quadro M1200 2%
GFXBench (DX / GLBenchmark) 2.7 GFXBench 2.7 T-Rex HD Onscreen C24Z16 + GFXBench (DX / GLBenchmark) 2.7 - GFXBench 2.7 T-Rex HD Onscreen C24Z16
min: 24 avg: 44.8 median: 42.9 (1%) max: 67.5 fps
...
...
GFXBench T-Rex HD Offscreen C24Z16 + GFXBench (DX / GLBenchmark) 2.7 - GFXBench T-Rex HD Offscreen C24Z16
min: 32 avg: 43.1 median: 45.5 (0%) max: 51.9 fps
...
...
NVIDIA GeForce RTX 3080 Ti Laptop GPU 5379%
GFXBench 3.0 - GFXBench 3.0 Manhattan
min: 14 avg: 25.4 median: 19.9 (5%) max: 42.2 fps
...
Qualcomm Adreno 685 -3%
...
GFXBench 3.0 - GFXBench 3.0 Manhattan Offscreen
min: 16 avg: 23.8 median: 22.1 (2%) max: 33.4 fps
...
...
Apple M1 Max 32-Core GPU 5049%
GFXBench - GFXBench 5.0 Aztec Ruins High Tier Onscreen
min: 4 avg: 11.3 median: 11.3 (7%) max: 18.5 fps
Intel Iris Plus Graphics G7 (Ice Lake 64 EU) -41%
Intel UHD Graphics 610 -13%
Intel UHD Graphics 770 -8%
Intel UHD Graphics (Jasper Lake 32 EU) 59%
Intel UHD Graphics G7 (Lakefield GT2 64 EU) 62%
Intel UHD Graphics Xe 16EUs (Tiger Lake-H) 69%
...
AMD Radeon RX 6700S 1347%
GFXBench - GFXBench 5.0 Aztec Ruins High Tier Offscreen
min: 5.9 avg: 6.4 median: 6.4 (2%) max: 6.8 fps
Intel UHD Graphics 610 -15%
Intel UHD Graphics (Jasper Lake 16 EU) 2%
Intel Iris Plus Graphics G7 (Ice Lake 64 EU) 46%
Intel UHD Graphics (Jasper Lake 32 EU) 65%
Intel UHD Graphics G7 (Lakefield GT2 64 EU) 73%
Intel UHD Graphics Xe 16EUs (Tiger Lake-H) 80%
...
Apple M1 Max 32-Core GPU 4772%
GFXBench - GFXBench 5.0 Aztec Ruins Normal Tier Onscreen
min: 11 avg: 19.2 median: 19.2 (8%) max: 27.3 fps
Intel Iris Plus Graphics G7 (Ice Lake 64 EU) -47%
Intel UHD Graphics 610 -23%
Intel UHD Graphics 770 -13%
Intel UHD Graphics (Jasper Lake 32 EU) 27%
Intel UHD Graphics G7 (Lakefield GT2 64 EU) 35%
Intel UHD Graphics Xe 16EUs (Tiger Lake-H) 58%
...
AMD Radeon RX 6700S 1139%
GFXBench - GFXBench 5.0 Aztec Ruins Normal Tier Offscreen
min: 9.9 avg: 12.8 median: 12.8 (2%) max: 15.7 fps
Intel UHD Graphics 610 20%
Intel UHD Graphics (Jasper Lake 16 EU) 37%
Intel Iris Plus Graphics G7 (Ice Lake 64 EU) 84%
Intel UHD Graphics (Jasper Lake 32 EU) 107%
Intel UHD Graphics G7 (Lakefield GT2 64 EU) 124%
...
Apple M1 Max 32-Core GPU 5642%
GFXBench - GFXBench Car Chase Onscreen
min: 7.7 avg: 14.7 median: 11.2 (0%) max: 25.1 fps
Intel UHD Graphics 770 -13%
Intel UHD Graphics 610 4%
Intel UHD Graphics (Jasper Lake 32 EU) 57%
...
NVIDIA GeForce RTX 3070 Laptop GPU 24058%
GFXBench - GFXBench Car Chase Offscreen
min: 7.1 avg: 11 median: 11.3 (0%) max: 14.6 fps
...
Intel UHD Graphics 610 52%
Intel UHD Graphics (Jasper Lake 16 EU) 66%
...
NVIDIA GeForce RTX 3070 Laptop GPU 219500%
Basemark GPU 1.2 - Basemark GPU 1.2 Vulkan Official Medium Offscreen 1080
23.3 fps (1%)
Intel UHD Graphics 610 9%
Intel UHD Graphics Xe G4 48EUs 133%
AMD Radeon RX Vega 6 (Ryzen 4000/5000) 255%
Intel Iris Plus Graphics G7 (Ice Lake 64 EU) 338%
...
Basemark GPU 1.2 - Basemark GPU 1.2 Vulkan Official High Offscreen 2160
2 fps (0%)
LuxMark v2.0 64Bit - LuxMark v2.0 Room GPU
min: 67 avg: 93.5 median: 93.5 (0%) max: 120 Samples/s
...
Intel UHD Graphics (Elkhart Lake 16 EU) -13%
Intel UHD Graphics (Jasper Lake 16 EU) 19%
...
NVIDIA GeForce GTX 1650 Ti Mobile 10349%
LuxMark v2.0 64Bit - LuxMark v2.0 Sala GPU
min: 96 avg: 142 median: 142 (0%) max: 188 Samples/s
...
Intel UHD Graphics (Elkhart Lake 16 EU) 4%
...
AMD Radeon RX 6800M 10301%
ComputeMark v2.1 - ComputeMark v2.1 Result
min: 432 avg: 490.5 median: 490.5 (1%) max: 549 pkt.
...
Intel UHD Graphics (Elkhart Lake 16 EU) -3%
Intel UHD Graphics 610 -2%
...
NVIDIA GeForce RTX 3080 Ti Laptop GPU 6162%
Power Consumption - Furmark Stress Test Power Consumption - external Monitor *
min: 10.3 avg: 11 median: 11 (2%) max: 11.6 Watt
Intel UHD Graphics (Elkhart Lake 16 EU) 3%
Qualcomm Adreno 680 15%
Intel UHD Graphics (Jasper Lake 16 EU) 29%
Intel UHD Graphics (Jasper Lake 32 EU) 42%
Intel UHD Graphics (Jasper Lake 24 EU) 82%
...
AMD Radeon RX 6850M XT 1941%
0 1 2 3 4 5 6 7 8 9 10 11 12 13 14 15 Tooltip Acer TravelMate Spin B3 TMB311RN-31-P5KK: Ø10.3 (9.78-16)
Power Consumption - Witcher 3 Power Consumption *
11.8 Watt (3%)
Intel UHD Graphics (Jasper Lake 16 EU) 11%
Intel UHD Graphics (Jasper Lake 32 EU) 21%
Intel UHD Graphics (Jasper Lake 24 EU) 62%
Intel UHD Graphics 610 117%
Apple M2 8-Core GPU 132%
...
0 1 2 3 4 5 6 7 8 9 10 11 12 13 14 Tooltip Acer TravelMate Spin B3 TMB311RN-31-P5KK: Ø11.8 (10.5-14.7)
Power Consumption - Witcher 3 ultra Power Efficiency
0.1 Points per Watt (14%)
Intel Iris Plus Graphics 655 40%
Intel UHD Graphics Xe 16EUs (Tiger Lake-H) 61%
...
AMD Radeon RX 6800S 554%
0 1 2 3 4 5 6 7 8 9 10 11 Tooltip Acer TravelMate Spin B3 TMB311RN-31-P5KK: Ø8.8 (7.55-11.5)
Clock Speed - GPU Clock Speed Furmark
515 MHz (20%)
...
- Zakres wyników testów referencyjnych dla tej karty graficznej
- Średnia wartość wyników testów referencyjnych dla tej karty graficzne
* Smaller numbers mean a higher performance
Testy gier Zamieszczone niżej wyniki pochodzą z testów zrecenzowanych laptopów. Należy pamiętać, że osiągi poszczególnych konfiguracji zależą od zastosowanej pamięci własnej karty (VRAM), zegarów karty (mogą być różne), procesora, ustawień systemu, sterowników i wersji systemu operacyjnego. Tym samym uzyskane wyniki nie muszą być reprezentatywne dla wszystkich laptopów wyposażonych w daną kartę graficzną. By uzyskać szczegółowe informacje o wynikach testów, należy kliknąć na podaną wartość liczbową (fps, czyli kl/s).
» Niegrywalna na większości testowanych laptopów.
7 [X] Medion Akoya E4253-30025387 Intel Pentium Silver N5000 1.1GHz
UHD Graphics 605
8.2 [X] Topjoy Falcon Intel Pentium Silver N5000 1.1GHz
UHD Graphics 605
min:
6 fps, max:
11 fps
~ 8 fps
+ Porównaj
- Ukryj porównanie
Intel UHD Graphics 610 108%
...
» Niegrywalna na większości testowanych laptopów.
...
...
...
...
» Na wszystkich testowanych laptopach grywalna przy ustawieniach med..
6.5 [X] Topjoy Falcon Intel Pentium Silver N5000 1.1GHz
UHD Graphics 605
max:
7 fps
10.9 [X] Medion Akoya E4253-30025387 Intel Pentium Silver N5000 1.1GHz
UHD Graphics 605
min:
7 fps, max:
13 fps
~ 9 fps
+ Porównaj
- Ukryj porównanie
Intel UHD Graphics (Jasper Lake 16 EU) 69%
Intel UHD Graphics 610 88%
...
NVIDIA GeForce RTX 3080 Laptop GPU 2902%
» Niegrywalna na większości testowanych laptopów.
Intel UHD Graphics 610 79%
...
NVIDIA GeForce RTX 2080 Super Max-Q 2641%
» Niegrywalna na większości testowanych laptopów.
...
» Niegrywalna na większości testowanych laptopów.
11.7 (!) [X] Topjoy Falcon Intel Pentium Silver N5000 1.1GHz
UHD Graphics 605
Problem during benchmarking occured: too slowmin:
9 fps, max:
15 fps
17.6 [X] Medion Akoya E4253-30025387 Intel Pentium Silver N5000 1.1GHz
UHD Graphics 605
~ 15 fps
+ Porównaj
- Ukryj porównanie
Intel UHD Graphics 610 61%
...
» Niegrywalna na większości testowanych laptopów.
...
Intel UHD Graphics 610 650%
...
NVIDIA RTX A3000 Laptop GPU 12600%
» Niegrywalna na większości testowanych laptopów.
Intel UHD Graphics (Jasper Lake 32 EU) -28%
...
NVIDIA GeForce RTX 2080 Super Max-Q 4053%
» Niegrywalna na większości testowanych laptopów.
...
» Niegrywalna na większości testowanych laptopów.
...
AMD Radeon RX 6600M 5400%
» Niegrywalna na większości testowanych laptopów.
Intel UHD Graphics (Jasper Lake 16 EU) 75%
Intel UHD Graphics 610 125%
...
NVIDIA GeForce RTX 3080 Ti Laptop GPU 4280%
» Niegrywalna na większości testowanych laptopów.
8.5 [X] Acer TravelMate Spin B3 TMB311RN-31-P5KK 1.47.22.14 D3D12
Intel Pentium Silver N5030 2GHz
UHD Graphics 605
min:
5 fps, P1:
5 fps, max:
98 fps
fps
+ Porównaj
- Ukryj porównanie
Intel UHD Graphics (Elkhart Lake 16 EU) 8%
Intel UHD Graphics (Jasper Lake 16 EU) 91%
Intel UHD Graphics (Jasper Lake 32 EU) 111%
Intel UHD Graphics 610 115%
...
NVIDIA GeForce RTX 2080 Super Mobile 5959%
» Niegrywalna na większości testowanych laptopów.
...
...
» Niegrywalna na większości testowanych laptopów.
...
» Niegrywalna na większości testowanych laptopów.
...
» Niegrywalna na większości testowanych laptopów.
Intel UHD Graphics (Jasper Lake 16 EU) 133%
Intel UHD Graphics 610 150%
...
» Niegrywalna na większości testowanych laptopów.
Intel UHD Graphics (Jasper Lake 32 EU) 72%
...
Intel UHD Graphics (Jasper Lake 32 EU) 49%
...
» Na wszystkich testowanych laptopach grywalna przy ustawieniach low.
5 [X] Acer TravelMate Spin B3 TMB311RN-31-P5KK Intel Pentium Silver N5030 2GHz
UHD Graphics 605
6.4 [X] Acer Swift 1 SF114-32-P8GG Intel Pentium Silver N5000 1.1GHz
UHD Graphics 605
7.2 [X] Lenovo IdeaPad 1-14IGL05 Intel Pentium Silver N5030 2GHz
UHD Graphics 605
8.6 [X] Intel NUC7PJYHN Intel Pentium Silver J5040 2GHz
UHD Graphics 605
9.1 [X] Topjoy Falcon Intel Pentium Silver N5000 1.1GHz
UHD Graphics 605
~ 7 fps
+ Porównaj
- Ukryj porównanie
Intel UHD Graphics (Elkhart Lake 16 EU) 11%
Intel UHD Graphics 610 46%
Intel UHD Graphics (Jasper Lake 16 EU) 72%
...
NVIDIA RTX A5500 Laptop GPU 1989%
3.5 [X] Acer TravelMate Spin B3 TMB311RN-31-P5KK Intel Pentium Silver N5030 2GHz
UHD Graphics 605
5.9 [X] Lenovo IdeaPad 1-14IGL05 Intel Pentium Silver N5030 2GHz
UHD Graphics 605
6 [X] Topjoy Falcon Intel Pentium Silver N5000 1.1GHz
UHD Graphics 605
6.1 [X] Intel NUC7PJYHN Intel Pentium Silver J5040 2GHz
UHD Graphics 605
~ 5 fps
+ Porównaj
- Ukryj porównanie
Intel UHD Graphics (Elkhart Lake 16 EU) -1%
Intel UHD Graphics (Jasper Lake 16 EU) 70%
Intel UHD Graphics 610 80%
...
NVIDIA RTX A5500 Laptop GPU 2586%
3.1 [X] Acer TravelMate Spin B3 TMB311RN-31-P5KK Intel Pentium Silver N5030 2GHz
UHD Graphics 605
5.3 [X] Lenovo IdeaPad 1-14IGL05 Intel Pentium Silver N5030 2GHz
UHD Graphics 605
5.5 [X] Topjoy Falcon Intel Pentium Silver N5000 1.1GHz
UHD Graphics 605
5.5 [X] Intel NUC7PJYHN Intel Pentium Silver J5040 2GHz
UHD Graphics 605
~ 5 fps
+ Porównaj
- Ukryj porównanie
Intel UHD Graphics (Elkhart Lake 16 EU) -7%
Intel UHD Graphics 610 42%
Intel UHD Graphics (Jasper Lake 16 EU) 60%
Intel UHD Graphics G7 (Lakefield GT2 64 EU) 85%
Intel UHD Graphics (Jasper Lake 32 EU) 117%
...
NVIDIA RTX A5500 Laptop GPU 2056%
» Niegrywalna na większości testowanych laptopów.
...
NVIDIA GeForce GTX 1660 Ti Max-Q 2184%
» Niegrywalna na większości testowanych laptopów.
3.4 [X] Lenovo Yoga 330-11IGM Intel Pentium Silver N5000 1.1GHz
UHD Graphics 605
4.2 [X] Acer TravelMate Spin B3 TMB311RN-31-P5KK 1.3
Intel Pentium Silver N5030 2GHz
UHD Graphics 605
4.4 [X] Topjoy Falcon Intel Pentium Silver N5000 1.1GHz
UHD Graphics 605
max:
9 fps
5.2 [X] Topjoy Falcon 1.3
Intel Pentium Silver N5000 1.1GHz
UHD Graphics 605
7.5 [X] Intel NUC7PJYHN 1.3
Intel Pentium Silver J5040 2GHz
UHD Graphics 605
~ 5 fps
+ Porównaj
- Ukryj porównanie
Intel UHD Graphics (Elkhart Lake 16 EU) -31%
Intel UHD Graphics (Jasper Lake 16 EU) 21%
Intel UHD Graphics 610 55%
...
NVIDIA GeForce RTX 2080 Super Mobile 3790%
Intel UHD Graphics (Elkhart Lake 16 EU) -49%
Intel UHD Graphics (Jasper Lake 16 EU) 0%
Intel UHD Graphics 610 8%
Intel UHD Graphics (Jasper Lake 32 EU) 32%
...
AMD Radeon RX 6850M XT 4441%
» Niegrywalna na większości testowanych laptopów.
...
» Niegrywalna na większości testowanych laptopów.
Intel UHD Graphics 610 100%
...
» Niegrywalna na większości testowanych laptopów.
...
...
» Niegrywalna na większości testowanych laptopów.
38 [X] Acer Swift 1 SF114-32-P8GG Intel Pentium Silver N5000 1.1GHz
UHD Graphics 605
41.4 [X] Lenovo Ideapad D330-10IGM Intel Pentium Silver N5000 1.1GHz
UHD Graphics 605
~ 40 fps
+ Porównaj
- Ukryj porównanie
...
...
34.5 [X] Acer Swift 1 SF114-32-P8GG Intel Pentium Silver N5000 1.1GHz
UHD Graphics 605
36.5 [X] Lenovo Ideapad D330-10IGM Intel Pentium Silver N5000 1.1GHz
UHD Graphics 605
~ 36 fps
+ Porównaj
- Ukryj porównanie
...
...
17 [X] Acer Swift 1 SF114-32-P8GG Intel Pentium Silver N5000 1.1GHz
UHD Graphics 605
18.4 [X] Lenovo Ideapad D330-10IGM Intel Pentium Silver N5000 1.1GHz
UHD Graphics 605
~ 18 fps
+ Porównaj
- Ukryj porównanie