Recenzja laptopa HP Omen 16: Dobry wybór dla graczy nawet z Zen 4
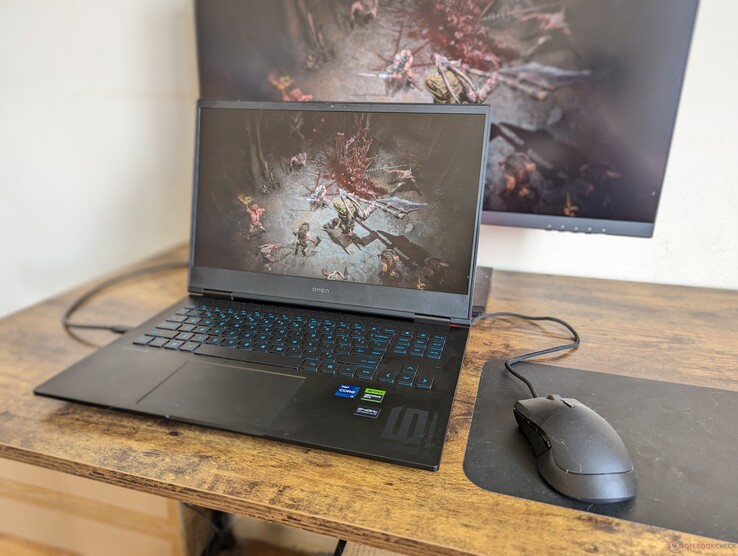
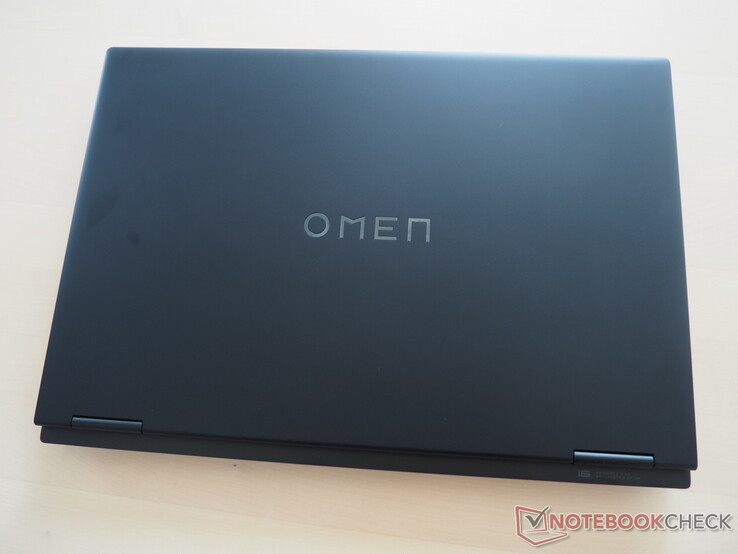
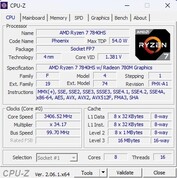
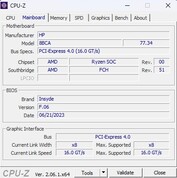
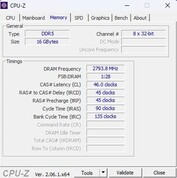
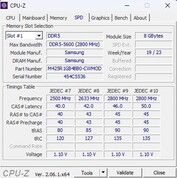
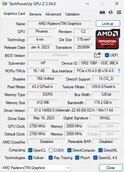
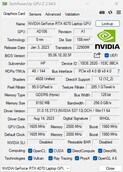
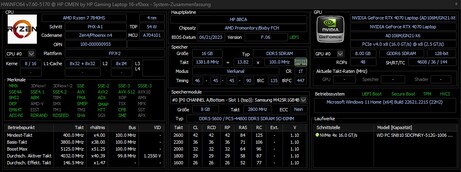
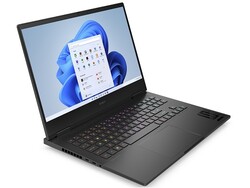
Omen 16-xf0376ng jest obecnie dostępny za niecałe 1900 euro (~2026 USD). Za tę cenę kupujący otrzymują najnowocześniejszy procesor Zen 4 od AMD: Ryzen 7 7840HS Ryzen 7 7840HS oferuje nie tylko wysoką wydajność procesora, ale także kartę graficzną Radeon 780M ma również całkiem szybkie iGPU. Jednak wymagającymi obliczeniami graficznymi zajmuje się karta GeForce RTX 4070 od Nvidii. Akcelerator Ada-Lovelace plasuje się bardziej w wyższej klasie średniej niż w segmencie high-end ze względu na nieco skromną pamięć wideo (tylko 8 GB GDDR6). Dysk SSD M.2 również mógłby być większy, biorąc pod uwagę tylko 512 GB pojemności. Jednak 16 GB pamięci RAM DDR5-5600 jest nadal odpowiednie dla notebooka do gier z 2023 roku. Wyświetlacz to matowy panel IPS o przekątnej 16,1 cala, rozdzielczości 1920 x 1080 pikseli i odświeżaniu 165 Hz.
Konkurentami Omen 16 są inne 16-calowe karty graficzne z RTX 4070, takie jak MSI Stealth 16 Studio A13VGi Gigabyte Aero 16 OLED BSFi Acer Nitro 16 AN16-41 oraz Lenovo Legion Pro 5 16ARX8które jednak kosztują więcej.
Potencjalni konkurenci w porównaniu
Ocena | Data | Model | Waga | Wysokość | Rozmiar | Rezolucja | Cena |
|---|---|---|---|---|---|---|---|
| 86.6 % v7 (old) | 09/2023 | HP Omen 16-xf0376ng R7 7840HS, GeForce RTX 4070 Laptop GPU | 2.4 kg | 23.5 mm | 16.10" | 1920x1080 | |
| 87.4 % v7 (old) | 07/2023 | HP Omen 16-wf000 i7-13700HX, GeForce RTX 4080 Laptop GPU | 2.4 kg | 23.6 mm | 16.10" | 2560x1440 | |
| 88.8 % v7 (old) | 07/2023 | MSI Stealth 16 Studio A13VG i7-13700H, GeForce RTX 4070 Laptop GPU | 2 kg | 19.95 mm | 16.00" | 2560x1600 | |
| 86.2 % v7 (old) | 03/2023 | Gigabyte AERO 16 OLED BSF i9-13900H, GeForce RTX 4070 Laptop GPU | 2.1 kg | 18 mm | 16.00" | 3840x2400 | |
| 88.1 % v7 (old) | 06/2023 | Acer Nitro 16 AN16-41 R7 7735HS, GeForce RTX 4070 Laptop GPU | 2.7 kg | 27.9 mm | 16.00" | 2560x1600 | |
| 88.4 % v7 (old) | 05/2023 | Lenovo Legion Pro 5 16ARX8 R7 7745HX, GeForce RTX 4070 Laptop GPU | 2.5 kg | 26.8 mm | 16.00" | 2560x1600 |
Ponieważ obudowa jest w dużej mierze identyczna z już przetestowanym modelem 16-wf000 z Core i7-13700HX i GeForce RTX 4080 (wersja AMD niestety musi obejść się bez Thunderbolt 4), oszczędzimy sobie ponownej analizy obudowy, wyposażenia i urządzeń wejściowych w tym artykule i odniesiemy się w tym miejscu do istniejącego Raport z testów.
Komunikacja
Kamera internetowa
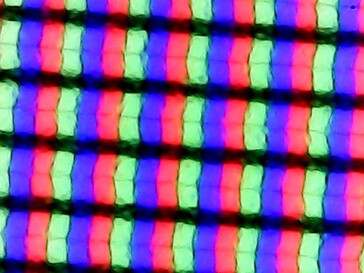
Wyświetlacz
Podczas gdy recenzowana przez nas wersja Intela opiera się na wyświetlaczu QHD (2560 x 1440 pikseli), wariant AMD wykorzystuje klasyczny panel Full HD.
| |||||||||||||||||||||||||
rozświetlenie: 91 %
na akumulatorze: 350 cd/m²
kontrast: 1000:1 (czerń: 0.35 cd/m²)
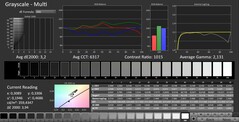
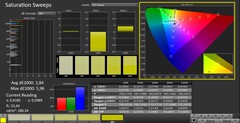
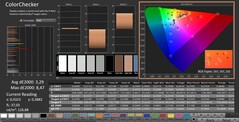
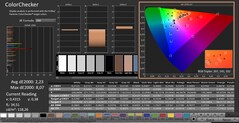
ΔE ColorChecker Calman: 3.29 | ∀{0.5-29.43 Ø4.76}
calibrated: 2.23
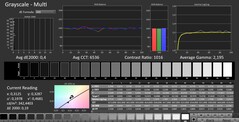
ΔE Greyscale Calman: 3.2 | ∀{0.09-98 Ø5}
72.3% AdobeRGB 1998 (Argyll 3D)
99.6% sRGB (Argyll 3D)
72.1% Display P3 (Argyll 3D)
Gamma: 2.131
CCT: 6317 K
| HP Omen 16-xf0376ng BOE0B81, IPS, 1920x1080, 16.1" | HP Omen 16-wf000 BOE0B7D, IPS, 2560x1440, 16.1" | MSI Stealth 16 Studio A13VG AUO26A9, IPS, 2560x1600, 16" | Gigabyte AERO 16 OLED BSF Samsung SDC4191 (ATNA60YV09-0, OLED, 3840x2400, 16" | Acer Nitro 16 AN16-41 BOE CQ NE16QDM-NY1, IPS, 2560x1600, 16" | Lenovo Legion Pro 5 16ARX8 CSOT T3 MNG007DA1-Q, IPS, 2560x1600, 16" | |
|---|---|---|---|---|---|---|
| Display | -2% | 17% | 24% | -3% | -1% | |
| Display P3 Coverage (%) | 72.1 | 69 -4% | 96.4 34% | 99.9 39% | 67.9 -6% | 70.4 -2% |
| sRGB Coverage (%) | 99.6 | 99.2 0% | 99.7 0% | 100 0% | 99.1 -1% | 99.6 0% |
| AdobeRGB 1998 Coverage (%) | 72.3 | 71.2 -2% | 84.8 17% | 96.4 33% | 69.9 -3% | 72.6 0% |
| Response Times | 14% | 43% | 79% | 21% | 9% | |
| Response Time Grey 50% / Grey 80% * (ms) | 12.3 ? | 4.6 ? 63% | 4.4 ? 64% | 2 ? 84% | 11 ? 11% | 7 ? 43% |
| Response Time Black / White * (ms) | 7.2 ? | 9.7 ? -35% | 5.6 ? 22% | 1.98 ? 73% | 5 ? 31% | 9.1 ? -26% |
| PWM Frequency (Hz) | 60 | |||||
| Screen | 16% | -0% | 164% | 30% | 33% | |
| Brightness middle (cd/m²) | 350 | 310.9 -11% | 424 21% | 389.97 11% | 520 49% | 355.3 2% |
| Brightness (cd/m²) | 338 | 296 -12% | 411 22% | 395 17% | 494 46% | 340 1% |
| Brightness Distribution (%) | 91 | 91 0% | 88 -3% | 97 7% | 91 0% | 91 0% |
| Black Level * (cd/m²) | 0.35 | 0.35 -0% | 0.37 -6% | 0.03 91% | 0.39 -11% | 0.32 9% |
| Contrast (:1) | 1000 | 888 -11% | 1146 15% | 12999 1200% | 1333 33% | 1110 11% |
| Colorchecker dE 2000 * | 3.29 | 2.18 34% | 3.04 8% | 2 39% | 1.94 41% | 1.13 66% |
| Colorchecker dE 2000 max. * | 8.47 | 3.58 58% | 7.5 11% | 4.1 52% | 5.62 34% | 2.78 67% |
| Colorchecker dE 2000 calibrated * | 2.23 | 0.52 77% | 3.04 -36% | 1.68 25% | 0.74 67% | 0.32 86% |
| Greyscale dE 2000 * | 3.2 | 2.8 13% | 4.34 -36% | 2.23 30% | 2.94 8% | 1.4 56% |
| Gamma | 2.131 103% | 2.18 101% | 2.32 95% | 2.41 91% | 2.37 93% | 2.24 98% |
| CCT | 6317 103% | 6002 108% | 6952 93% | 6323 103% | 6443 101% | 6372 102% |
| Całkowita średnia (program / ustawienia) | 9% /
12% | 20% /
10% | 89% /
122% | 16% /
21% | 14% /
22% |
* ... im mniej tym lepiej
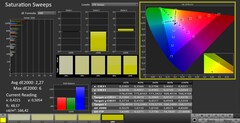
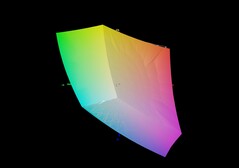
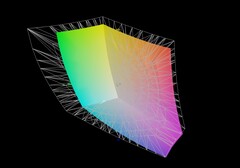
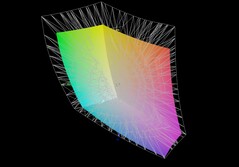
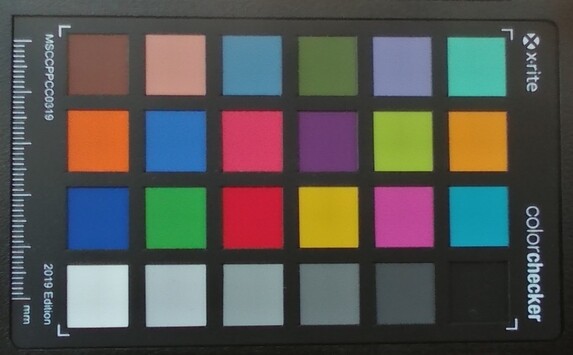
Określone wartości obrazu są jednak podobne. Oba modele mogą pokryć prawie 100% przestrzeni kolorów sRGB i około 70% przestrzeni kolorów AdobeRGB i DCI-P3, chociaż niektórzy konkurenci (MSI, Gigabyte) osiągają tutaj lepsze wyniki. Czas reakcji również nie jest zły i powinien zaspokoić większość wymagań.
Podświetlenie (91%) i wartość czerni (0,35 cd/m²) są całkowicie takie same, ale edycja AMD ma nieco lepszy kontrast (1000:1 vs 888:1) ze względu na nieco wyższą jasność (średnio 338 zamiast 296 cd/m²). Oba urządzenia nie są jednak w stanie dorównać konkurencji. Przede wszystkim panel OLED w Aero 16 ustępuje w wielu dziedzinach, o ile można pogodzić się z błyszczącą powierzchnią i migotaniem wyświetlacza.
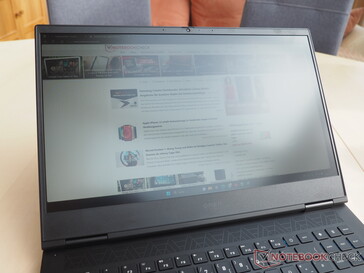
Wracając jednak do Omena 16: kąty widzenia są dobre, typowe dla IPS, więc obraz pozostaje dość stabilny nawet z pochylonej pozycji. Nawiasem mówiąc, jeśli potrzebujesz możliwie najdokładniejszych kolorów, powinieneś przeprowadzić kalibrację lub pobrać i użyć pliku ICC, który połączyliśmy obok grafiki podświetlenia (zakładając, że jest to ten sam panel Full HD).
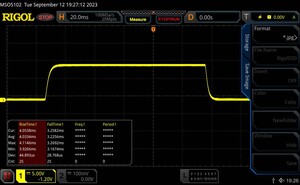
Wyświetl czasy reakcji
| ↔ Czas reakcji od czerni do bieli | ||
|---|---|---|
| 7.2 ms ... wzrost ↗ i spadek ↘ łącznie | ↗ 4 ms wzrost | |
| ↘ 3.2 ms upadek | ||
| W naszych testach ekran wykazuje bardzo szybką reakcję i powinien bardzo dobrze nadawać się do szybkich gier. Dla porównania, wszystkie testowane urządzenia wahają się od 0.1 (minimum) do 240 (maksimum) ms. » 20 % wszystkich urządzeń jest lepszych. Oznacza to, że zmierzony czas reakcji jest lepszy od średniej wszystkich testowanych urządzeń (20.1 ms). | ||
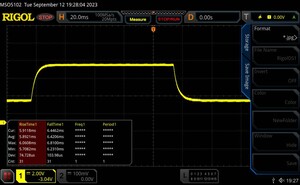
| ↔ Czas reakcji 50% szarości do 80% szarości | ||
| 12.3 ms ... wzrost ↗ i spadek ↘ łącznie | ↗ 5.9 ms wzrost | |
| ↘ 6.4 ms upadek | ||
| W naszych testach ekran wykazuje dobry współczynnik reakcji, ale może być zbyt wolny dla graczy rywalizujących ze sobą. Dla porównania, wszystkie testowane urządzenia wahają się od 0.165 (minimum) do 636 (maksimum) ms. » 25 % wszystkich urządzeń jest lepszych. Oznacza to, że zmierzony czas reakcji jest lepszy od średniej wszystkich testowanych urządzeń (31.5 ms). | ||
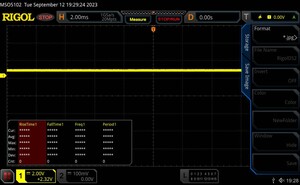
Migotanie ekranu / PWM (modulacja szerokości impulsu)
| Migotanie ekranu/nie wykryto PWM | |||
Dla porównania: 53 % wszystkich testowanych urządzeń nie używa PWM do przyciemniania wyświetlacza. Jeśli wykryto PWM, zmierzono średnio 8039 (minimum: 5 - maksimum: 343500) Hz. | |||
Moc
Omen 16 jest dostępny w wielu różnych konfiguracjach. Paleta sięga od GeForce RTX 4050 aż do GeForce RTX 4080. Jak już wspomniano, HP wykorzystuje aktualne modele procesorów od AMD i Intela. Nasz egzemplarz testowy plasuje się w (górnej) połowie stawki pod względem ceny i wydajności.
Warunki testowe
Jak przystało na notebooka gamingowego, producent dołącza do komputera rozbudowane oprogramowanie systemowe i tuningowe. W Omen Gaming Hub można między innymi dostosować podświetlenie klawiatury, przełączanie grafiki (hybrydowa lub osobna) oraz profil wydajności (patrz zrzuty ekranu). Ponieważ poziom hałasu podczas korzystania z trybu wydajności jest nieproporcjonalny do (nieco) lepszej wydajności 3D, a urządzenie jest już dość obecne w trybie bezczynności, wszystkie pomiary przeprowadziliśmy w trybie "Zrównoważonym". Istnieje również tryb "Eco", ale jest on bardzo podobny do testowanego ustawienia pod względem wydajności i emisji.
| Witcher 3 (FHD/Ultra) | Eco | Zrównoważony | Wydajność |
|---|---|---|---|
| Liczba klatek na sekundę | ~110 fps | ~112 fps | ~120 fps |
| Hałas | ~44 dB(A) | ~44 dB(A) | ~55 dB(A) |
Procesor
Ryzen 7 7840HS pochodzi z generacji AMD Phoenix i dysponuje 16 MB pamięci podręcznej L3, maksymalnym taktowaniem 5,1 GHz i 8 rdzeniami, które dzięki technologii SMT mogą równolegle obsługiwać do 16 wątków. Model 4 nm plasuje się pośrodku pola benchmarków pomiędzy Ryzen 7 7735HS z Acer Nitro 16 (wciąż oparty na Zen 3+) i Ryzen 7 7745HX z Lenovo Legion Pro 5. Komputer na Core i7-13700H(X) są zazwyczaj nieco szybsze. To samo dotyczy Core i9-13900H w Gigabyte Aero 16. Przede wszystkim musimy pochwalić stałą wydajność. W naszej pętli Cinebench, Ryzen 7 7840HS również zapewnił bardzo podobne wskaźniki na dłuższą metę.
Cinebench R15 Multi-Endurance test
* ... im mniej tym lepiej
AIDA64: FP32 Ray-Trace | FPU Julia | CPU SHA3 | CPU Queen | FPU SinJulia | FPU Mandel | CPU AES | CPU ZLib | FP64 Ray-Trace | CPU PhotoWorxx
| Performance rating | |
| Średnia w klasie Gaming | |
| Lenovo Legion Pro 5 16ARX8 | |
| Przeciętny AMD Ryzen 7 7840HS | |
| HP Omen 16-xf0376ng | |
| Gigabyte AERO 16 OLED BSF | |
| HP Omen 16-wf000 | |
| MSI Stealth 16 Studio A13VG | |
| Acer Nitro 16 AN16-41 | |
| AIDA64 / FP32 Ray-Trace | |
| Lenovo Legion Pro 5 16ARX8 | |
| Średnia w klasie Gaming (7192 - 85542, n=133, ostatnie 2 lata) | |
| Przeciętny AMD Ryzen 7 7840HS (22845 - 28921, n=21) | |
| HP Omen 16-xf0376ng | |
| HP Omen 16-wf000 | |
| Gigabyte AERO 16 OLED BSF | |
| MSI Stealth 16 Studio A13VG | |
| Acer Nitro 16 AN16-41 | |
| AIDA64 / FPU Julia | |
| Średnia w klasie Gaming (35040 - 238426, n=133, ostatnie 2 lata) | |
| Lenovo Legion Pro 5 16ARX8 | |
| Przeciętny AMD Ryzen 7 7840HS (97164 - 123167, n=21) | |
| HP Omen 16-xf0376ng | |
| Acer Nitro 16 AN16-41 | |
| HP Omen 16-wf000 | |
| Gigabyte AERO 16 OLED BSF | |
| MSI Stealth 16 Studio A13VG | |
| AIDA64 / CPU SHA3 | |
| Średnia w klasie Gaming (1728 - 9817, n=133, ostatnie 2 lata) | |
| Lenovo Legion Pro 5 16ARX8 | |
| Przeciętny AMD Ryzen 7 7840HS (4293 - 5155, n=21) | |
| HP Omen 16-xf0376ng | |
| HP Omen 16-wf000 | |
| Gigabyte AERO 16 OLED BSF | |
| MSI Stealth 16 Studio A13VG | |
| Acer Nitro 16 AN16-41 | |
| AIDA64 / CPU Queen | |
| Lenovo Legion Pro 5 16ARX8 | |
| Średnia w klasie Gaming (49785 - 173351, n=133, ostatnie 2 lata) | |
| HP Omen 16-xf0376ng | |
| Przeciętny AMD Ryzen 7 7840HS (102271 - 125820, n=21) | |
| Acer Nitro 16 AN16-41 | |
| MSI Stealth 16 Studio A13VG | |
| HP Omen 16-wf000 | |
| Gigabyte AERO 16 OLED BSF | |
| AIDA64 / FPU SinJulia | |
| Lenovo Legion Pro 5 16ARX8 | |
| HP Omen 16-xf0376ng | |
| Przeciętny AMD Ryzen 7 7840HS (13767 - 15525, n=21) | |
| Średnia w klasie Gaming (4424 - 33636, n=133, ostatnie 2 lata) | |
| Acer Nitro 16 AN16-41 | |
| HP Omen 16-wf000 | |
| MSI Stealth 16 Studio A13VG | |
| Gigabyte AERO 16 OLED BSF | |
| AIDA64 / FPU Mandel | |
| Średnia w klasie Gaming (17585 - 128721, n=133, ostatnie 2 lata) | |
| Lenovo Legion Pro 5 16ARX8 | |
| Przeciętny AMD Ryzen 7 7840HS (52084 - 65812, n=21) | |
| HP Omen 16-xf0376ng | |
| Acer Nitro 16 AN16-41 | |
| HP Omen 16-wf000 | |
| Gigabyte AERO 16 OLED BSF | |
| MSI Stealth 16 Studio A13VG | |
| AIDA64 / CPU AES | |
| Gigabyte AERO 16 OLED BSF | |
| Przeciętny AMD Ryzen 7 7840HS (67389 - 177158, n=21) | |
| Średnia w klasie Gaming (19065 - 247074, n=133, ostatnie 2 lata) | |
| HP Omen 16-wf000 | |
| MSI Stealth 16 Studio A13VG | |
| Lenovo Legion Pro 5 16ARX8 | |
| HP Omen 16-xf0376ng | |
| Acer Nitro 16 AN16-41 | |
| AIDA64 / CPU ZLib | |
| Średnia w klasie Gaming (373 - 2531, n=133, ostatnie 2 lata) | |
| HP Omen 16-wf000 | |
| Gigabyte AERO 16 OLED BSF | |
| Lenovo Legion Pro 5 16ARX8 | |
| HP Omen 16-xf0376ng | |
| Przeciętny AMD Ryzen 7 7840HS (944 - 1123, n=21) | |
| MSI Stealth 16 Studio A13VG | |
| Acer Nitro 16 AN16-41 | |
| AIDA64 / FP64 Ray-Trace | |
| Lenovo Legion Pro 5 16ARX8 | |
| Średnia w klasie Gaming (3856 - 45446, n=133, ostatnie 2 lata) | |
| Przeciętny AMD Ryzen 7 7840HS (12248 - 15599, n=21) | |
| HP Omen 16-xf0376ng | |
| HP Omen 16-wf000 | |
| Gigabyte AERO 16 OLED BSF | |
| MSI Stealth 16 Studio A13VG | |
| Acer Nitro 16 AN16-41 | |
| AIDA64 / CPU PhotoWorxx | |
| MSI Stealth 16 Studio A13VG | |
| Gigabyte AERO 16 OLED BSF | |
| Średnia w klasie Gaming (10805 - 62916, n=133, ostatnie 2 lata) | |
| HP Omen 16-wf000 | |
| Przeciętny AMD Ryzen 7 7840HS (17615 - 41516, n=21) | |
| HP Omen 16-xf0376ng | |
| Lenovo Legion Pro 5 16ARX8 | |
| Acer Nitro 16 AN16-41 | |
Wydajność systemu
Pod względem wydajności systemu, Omen 16 zajmuje drugie miejsce wśród porównywanych urządzeń, tuż za Lenovo Legion Pro 5. Podczas gdy inni producenci dają swoim notebookom do gier tylko DDR5-4,800 RAM, HP daje swojemu 16-calowcowi DDR5-5,600 RAM.
CrossMark: Overall | Productivity | Creativity | Responsiveness
| PCMark 10 / Score | |
| Lenovo Legion Pro 5 16ARX8 | |
| Przeciętny AMD Ryzen 7 7840HS, NVIDIA GeForce RTX 4070 Laptop GPU (8167 - 8183, n=2) | |
| HP Omen 16-xf0376ng | |
| Średnia w klasie Gaming (5776 - 10060, n=112, ostatnie 2 lata) | |
| Gigabyte AERO 16 OLED BSF | |
| HP Omen 16-wf000 | |
| MSI Stealth 16 Studio A13VG | |
| Acer Nitro 16 AN16-41 | |
| PCMark 10 / Essentials | |
| Gigabyte AERO 16 OLED BSF | |
| HP Omen 16-xf0376ng | |
| Przeciętny AMD Ryzen 7 7840HS, NVIDIA GeForce RTX 4070 Laptop GPU (10934 - 11250, n=2) | |
| Lenovo Legion Pro 5 16ARX8 | |
| Średnia w klasie Gaming (8810 - 12600, n=116, ostatnie 2 lata) | |
| Acer Nitro 16 AN16-41 | |
| HP Omen 16-wf000 | |
| MSI Stealth 16 Studio A13VG | |
| PCMark 10 / Productivity | |
| Przeciętny AMD Ryzen 7 7840HS, NVIDIA GeForce RTX 4070 Laptop GPU (10179 - 10526, n=2) | |
| Lenovo Legion Pro 5 16ARX8 | |
| HP Omen 16-xf0376ng | |
| Średnia w klasie Gaming (6662 - 16716, n=114, ostatnie 2 lata) | |
| MSI Stealth 16 Studio A13VG | |
| Gigabyte AERO 16 OLED BSF | |
| Acer Nitro 16 AN16-41 | |
| HP Omen 16-wf000 | |
| PCMark 10 / Digital Content Creation | |
| Średnia w klasie Gaming (7440 - 19351, n=114, ostatnie 2 lata) | |
| Gigabyte AERO 16 OLED BSF | |
| HP Omen 16-wf000 | |
| Lenovo Legion Pro 5 16ARX8 | |
| Przeciętny AMD Ryzen 7 7840HS, NVIDIA GeForce RTX 4070 Laptop GPU (12908 - 12920, n=2) | |
| HP Omen 16-xf0376ng | |
| MSI Stealth 16 Studio A13VG | |
| Acer Nitro 16 AN16-41 | |
| CrossMark / Overall | |
| Lenovo Legion Pro 5 16ARX8 | |
| Średnia w klasie Gaming (1247 - 2344, n=112, ostatnie 2 lata) | |
| Gigabyte AERO 16 OLED BSF | |
| MSI Stealth 16 Studio A13VG | |
| HP Omen 16-wf000 | |
| Przeciętny AMD Ryzen 7 7840HS, NVIDIA GeForce RTX 4070 Laptop GPU (n=1) | |
| Acer Nitro 16 AN16-41 | |
| CrossMark / Productivity | |
| Lenovo Legion Pro 5 16ARX8 | |
| Średnia w klasie Gaming (1299 - 2211, n=112, ostatnie 2 lata) | |
| Gigabyte AERO 16 OLED BSF | |
| MSI Stealth 16 Studio A13VG | |
| Przeciętny AMD Ryzen 7 7840HS, NVIDIA GeForce RTX 4070 Laptop GPU (n=1) | |
| HP Omen 16-wf000 | |
| Acer Nitro 16 AN16-41 | |
| CrossMark / Creativity | |
| Lenovo Legion Pro 5 16ARX8 | |
| Średnia w klasie Gaming (1275 - 2729, n=112, ostatnie 2 lata) | |
| Gigabyte AERO 16 OLED BSF | |
| HP Omen 16-wf000 | |
| MSI Stealth 16 Studio A13VG | |
| Przeciętny AMD Ryzen 7 7840HS, NVIDIA GeForce RTX 4070 Laptop GPU (n=1) | |
| Acer Nitro 16 AN16-41 | |
| CrossMark / Responsiveness | |
| Gigabyte AERO 16 OLED BSF | |
| Lenovo Legion Pro 5 16ARX8 | |
| Średnia w klasie Gaming (1030 - 2330, n=112, ostatnie 2 lata) | |
| MSI Stealth 16 Studio A13VG | |
| Przeciętny AMD Ryzen 7 7840HS, NVIDIA GeForce RTX 4070 Laptop GPU (n=1) | |
| HP Omen 16-wf000 | |
| Acer Nitro 16 AN16-41 | |
| PCMark 10 Score | 8167 pkt. | |
Pomoc | ||
| AIDA64 / Memory Copy | |
| Średnia w klasie Gaming (21750 - 108104, n=133, ostatnie 2 lata) | |
| MSI Stealth 16 Studio A13VG | |
| Przeciętny AMD Ryzen 7 7840HS (30937 - 72158, n=21) | |
| Gigabyte AERO 16 OLED BSF | |
| HP Omen 16-wf000 | |
| HP Omen 16-xf0376ng | |
| Lenovo Legion Pro 5 16ARX8 | |
| Acer Nitro 16 AN16-41 | |
| AIDA64 / Memory Read | |
| MSI Stealth 16 Studio A13VG | |
| Średnia w klasie Gaming (22956 - 104349, n=133, ostatnie 2 lata) | |
| Gigabyte AERO 16 OLED BSF | |
| HP Omen 16-wf000 | |
| HP Omen 16-xf0376ng | |
| Przeciętny AMD Ryzen 7 7840HS (30497 - 62147, n=21) | |
| Lenovo Legion Pro 5 16ARX8 | |
| Acer Nitro 16 AN16-41 | |
| AIDA64 / Memory Write | |
| Przeciętny AMD Ryzen 7 7840HS (34590 - 93323, n=21) | |
| HP Omen 16-xf0376ng | |
| Średnia w klasie Gaming (22297 - 133486, n=133, ostatnie 2 lata) | |
| MSI Stealth 16 Studio A13VG | |
| Gigabyte AERO 16 OLED BSF | |
| HP Omen 16-wf000 | |
| Acer Nitro 16 AN16-41 | |
| Lenovo Legion Pro 5 16ARX8 | |
| AIDA64 / Memory Latency | |
| Średnia w klasie Gaming (59.5 - 259, n=133, ostatnie 2 lata) | |
| Gigabyte AERO 16 OLED BSF | |
| Acer Nitro 16 AN16-41 | |
| Przeciętny AMD Ryzen 7 7840HS (85.1 - 112, n=21) | |
| HP Omen 16-xf0376ng | |
| MSI Stealth 16 Studio A13VG | |
| HP Omen 16-wf000 | |
| Lenovo Legion Pro 5 16ARX8 | |
* ... im mniej tym lepiej
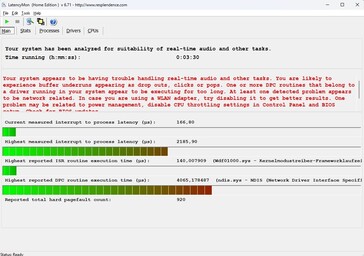
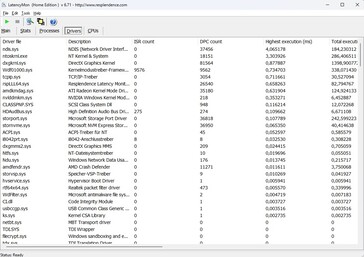
Opóźnienia DPC
| DPC Latencies / LatencyMon - interrupt to process latency (max), Web, Youtube, Prime95 | |
| MSI Stealth 16 Studio A13VG | |
| HP Omen 16-wf000 | |
| HP Omen 16-xf0376ng | |
| Acer Nitro 16 AN16-41 | |
| Gigabyte AERO 16 OLED BSF | |
| Lenovo Legion Pro 5 16ARX8 | |
* ... im mniej tym lepiej
Pamięć masowa
Dysk SSD jest dość mało spektakularny. Zainstalowany model 512 GB od WDC osiąga więcej niż solidne prędkości i poza drobnymi wahaniami (porównaj pętlę DiskSpd) również stabilną wydajność długoterminową, ale Omen 16 nie może konkurować z dyskami SSD konkurencji w benchmarku AS SSD, różnica w wydajności rzadko zauważana w codziennym użytkowaniu.
* ... im mniej tym lepiej
Continuous read: DiskSpd Read Loop, Queue Depth 8
Karta graficzna
Karta GeForce RTX 4070 nie wykazuje żadnych słabości w syntetycznych testach porównawczych. Według naszej oceny wydajności, prędkość jest nieco wyższa niż wcześniej ustalona średnia RTX 4070. Nic dziwnego, skoro HP przyznaje modelowi Ada-Lovelace maksymalne 140 W TGP. To, czy dopłata do RTX 4080 jest tego warta, zależy od użytkownika: Omen 16-wf000 sprintuje prawie 40% obok 16-xf0376ng w 3DMarks. Dzięki 12 GB pamięci VRAM GDDR6, która nie jest szczególnie duża, RTX 4080 jest bardziej przyszłościowy.
| 3DMark 11 Performance | 34584 pkt. | |
| 3DMark Ice Storm Standard Score | 189312 pkt. | |
| 3DMark Cloud Gate Standard Score | 66071 pkt. | |
| 3DMark Fire Strike Score | 27559 pkt. | |
| 3DMark Time Spy Score | 11726 pkt. | |
Pomoc | ||
* ... im mniej tym lepiej
Wydajność w grach
Zgodnie z oczekiwaniami, karta GeForce RTX 4070 okazuje się być dobrą podstawą dla panelu Full HD. 1920 x 1080 pikseli i maksymalne detale nie stanowią problemu dla większości gier. Tylko bardzo obciążające procesor lub słabo zaprogramowane/zoptymalizowane tytuły, takie jak Immortals of Aveum lub A Plague Tale Requiem są odpalane z mniej niż 60 FPS.
| Performance rating - Percent | |
| HP Omen 16-wf000 | |
| Średnia w klasie Gaming | |
| Lenovo Legion Pro 5 16ARX8 | |
| Gigabyte AERO 16 OLED BSF | |
| MSI Stealth 16 Studio A13VG | |
| HP Omen 16-xf0376ng | |
| Acer Nitro 16 AN16-41 | |
| The Witcher 3 - 1920x1080 Ultra Graphics & Postprocessing (HBAO+) | |
| HP Omen 16-wf000 | |
| Średnia w klasie Gaming (80.2 - 240, n=37, ostatnie 2 lata) | |
| Lenovo Legion Pro 5 16ARX8 | |
| MSI Stealth 16 Studio A13VG | |
| Gigabyte AERO 16 OLED BSF | |
| Acer Nitro 16 AN16-41 | |
| HP Omen 16-xf0376ng | |
| GTA V - 1920x1080 Highest AA:4xMSAA + FX AF:16x | |
| Średnia w klasie Gaming (47.9 - 186.9, n=118, ostatnie 2 lata) | |
| Gigabyte AERO 16 OLED BSF | |
| Lenovo Legion Pro 5 16ARX8 | |
| MSI Stealth 16 Studio A13VG | |
| HP Omen 16-wf000 | |
| HP Omen 16-xf0376ng | |
| Acer Nitro 16 AN16-41 | |
| Final Fantasy XV Benchmark - 1920x1080 High Quality | |
| HP Omen 16-wf000 | |
| Średnia w klasie Gaming (37.9 - 215, n=127, ostatnie 2 lata) | |
| Lenovo Legion Pro 5 16ARX8 | |
| Gigabyte AERO 16 OLED BSF | |
| MSI Stealth 16 Studio A13VG | |
| Acer Nitro 16 AN16-41 | |
| HP Omen 16-xf0376ng | |
| Strange Brigade - 1920x1080 ultra AA:ultra AF:16 | |
| HP Omen 16-wf000 | |
| Średnia w klasie Gaming (76.3 - 456, n=117, ostatnie 2 lata) | |
| Lenovo Legion Pro 5 16ARX8 | |
| Gigabyte AERO 16 OLED BSF | |
| MSI Stealth 16 Studio A13VG | |
| Acer Nitro 16 AN16-41 | |
| HP Omen 16-xf0376ng | |
| Dota 2 Reborn - 1920x1080 ultra (3/3) best looking | |
| Lenovo Legion Pro 5 16ARX8 | |
| Średnia w klasie Gaming (65.1 - 248, n=133, ostatnie 2 lata) | |
| MSI Stealth 16 Studio A13VG | |
| HP Omen 16-wf000 | |
| Gigabyte AERO 16 OLED BSF | |
| HP Omen 16-xf0376ng | |
| Acer Nitro 16 AN16-41 | |
| Immortals of Aveum - 1920x1080 Ultra AF:16x | |
| XMG Pro 15 E23 | |
| Przeciętny NVIDIA GeForce RTX 4070 Laptop GPU (46.1 - 49.9, n=4) | |
| Acer Nitro 17 AN17-41-R9LN | |
| HP Omen 16-xf0376ng | |
| Średnia w klasie Gaming (26.5 - 37.8, n=2, ostatnie 2 lata) | |
| Armored Core 6 - 1920x1080 Maximum Preset | |
| HP Omen 16-xf0376ng | |
| XMG Pro 15 E23 | |
| Przeciętny NVIDIA GeForce RTX 4070 Laptop GPU (87.2 - 107, n=4) | |
| Acer Nitro 17 AN17-41-R9LN | |
| Średnia w klasie Gaming (23 - 103.5, n=5, ostatnie 2 lata) | |
| Atlas Fallen - 1920x1080 Very High Preset | |
| HP Omen 16-xf0376ng | |
| Przeciętny NVIDIA GeForce RTX 4070 Laptop GPU (105.3 - 111.1, n=4) | |
| XMG Pro 15 E23 | |
| Acer Nitro 17 AN17-41-R9LN | |
| Średnia w klasie Gaming (40.2 - 161, n=4, ostatnie 2 lata) | |
| Sons of the Forest - 1920x1080 Ultra Preset AA:T | |
| HP Omen 16-xf0376ng | |
| Przeciętny NVIDIA GeForce RTX 4070 Laptop GPU (71.1 - 87.5, n=4) | |
| Acer Nitro 17 AN17-41-R9LN | |
| Średnia w klasie Gaming (54 - 61.3, n=2, ostatnie 2 lata) | |
| A Plague Tale Requiem - 1920x1080 Ultra Preset | |
| Przeciętny NVIDIA GeForce RTX 4070 Laptop GPU (54.9 - 57.5, n=2) | |
| HP Omen 16-xf0376ng | |
| Średnia w klasie Gaming (n=1ostatnie 2 lata) | |
Przetestowaliśmy wydajność w grach po około 60 minutach (FHD/Ultra) Witcher 3 (FHD/Ultra). Nie zaobserwowaliśmy żadnych spadków liczby klatek na sekundę ani innych niespójności.
Witcher 3 FPS-Diagram
| low | med. | high | ultra | |
|---|---|---|---|---|
| GTA V (2015) | 177.7 | 166.8 | 105.9 | |
| The Witcher 3 (2015) | 112 | |||
| Dota 2 Reborn (2015) | 164.1 | 149.2 | 144.1 | 137.8 |
| Final Fantasy XV Benchmark (2018) | 141.1 | 108.7 | ||
| X-Plane 11.11 (2018) | 121 | 103.8 | 84.8 | |
| Strange Brigade (2018) | 277 | 221 | 190.3 | |
| A Plague Tale Requiem (2022) | 67.2 | 58.9 | 54.9 | |
| Sons of the Forest (2023) | 88.1 | 85.8 | 85.4 | |
| Atlas Fallen (2023) | 143.1 | 132.4 | 111.1 | |
| Immortals of Aveum (2023) | 57.3 | 46.9 | ||
| Armored Core 6 (2023) | 110.1 | 109.4 | 107 |
Emisje
Emisja hałasu
Podczas gdy Omen 16 osiąga bardzo głośne ~55 dB(A) podczas grania w trybie wydajności, rozwój hałasu jest utrzymywany w granicach w trybie zrównoważonym. 44 dB(A) to w żadnym wypadku nie jest cichy poziom, ale akceptowalny w świetle danej wydajności. W sytuacjach bezczynności wentylatory są czasami całkowicie wyłączone. Przez większość czasu pracują na całkiem przyzwoitym poziomie, który jak na nasz gust mógłby być nawet niższy - konkurencja często radzi sobie tutaj lepiej.
Hałas
| luz |
| 25 / 29 / 32 dB |
| obciążenie |
| 44 / 46 dB |
 | ||
30 dB cichy 40 dB(A) słyszalny 50 dB(A) irytujący |
||
min: | ||
| HP Omen 16-xf0376ng R7 7840HS, GeForce RTX 4070 Laptop GPU | HP Omen 16-wf000 i7-13700HX, GeForce RTX 4080 Laptop GPU | MSI Stealth 16 Studio A13VG i7-13700H, GeForce RTX 4070 Laptop GPU | Gigabyte AERO 16 OLED BSF i9-13900H, GeForce RTX 4070 Laptop GPU | Acer Nitro 16 AN16-41 R7 7735HS, GeForce RTX 4070 Laptop GPU | Lenovo Legion Pro 5 16ARX8 R7 7745HX, GeForce RTX 4070 Laptop GPU | |
|---|---|---|---|---|---|---|
| Noise | -7% | 8% | -5% | 1% | 7% | |
| wyłączone / środowisko * (dB) | 24 | 23 4% | 24 -0% | 23 4% | 25.7 -7% | 23.2 3% |
| Idle Minimum * (dB) | 25 | 29.6 -18% | 24 4% | 23 8% | 25.7 -3% | 23.2 7% |
| Idle Average * (dB) | 29 | 29.8 -3% | 24 17% | 23 21% | 25.7 11% | 23.2 20% |
| Idle Maximum * (dB) | 32 | 30.4 5% | 24 25% | 33.64 -5% | 26.3 18% | 26.2 18% |
| Load Average * (dB) | 44 | 33.8 23% | 34.81 21% | 51.49 -17% | 33.9 23% | 31.4 29% |
| Witcher 3 ultra * (dB) | 44 | 57 -30% | 44.05 -0% | 55.27 -26% | 48.4 -10% | |
| Load Maximum * (dB) | 46 | 58.3 -27% | 51.57 -12% | 55.24 -20% | 62 -35% | 53.8 -17% |
* ... im mniej tym lepiej
Temperatura
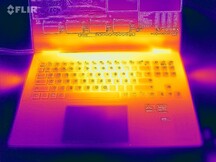
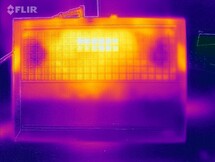
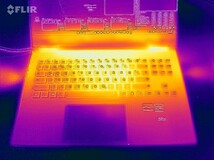
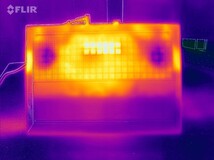
Laptop nagrzewa się w sytuacjach stresowych, szczególnie spód obudowy. Maksymalnie 57 °C (~135 °F) po godzinie gry w FurMark i Prime95 przemawia przeciwko sesjom grania na kolanach. Górna strona również robi się dość ciepła, osiągając maksymalnie 49 °C (~120 °F), ale ponieważ obszar podparcia dłoni zawsze pozostaje poniżej 40 °C (104 °F), wartość ta jest nadal w połowie akceptowalna. Niemniej jednak, Omen 16 pozostaje w tyle za konkurencją w tej kategorii - z wyjątkiem jeszcze cieplejszego MSI Stealth 16.
(-) Maksymalna temperatura w górnej części wynosi 49 °C / 120 F, w porównaniu do średniej 40.4 °C / 105 F , począwszy od 21.2 do 68.8 °C dla klasy Gaming.
(-) Dno nagrzewa się maksymalnie do 57 °C / 135 F, w porównaniu do średniej 43.3 °C / 110 F
(+) W stanie bezczynności średnia temperatura górnej części wynosi 28.7 °C / 84 F, w porównaniu ze średnią temperaturą urządzenia wynoszącą 33.9 °C / ### class_avg_f### F.
(-) Podczas gry w Wiedźmina 3 średnia temperatura górnej części wynosi 42.1 °C / 108 F, w porównaniu do średniej temperatury urządzenia wynoszącej 33.9 °C / ## #class_avg_f### F.
(±) Podpórki pod nadgarstki i touchpad mogą się bardzo nagrzać w dotyku, maksymalnie do 37 °C / 98.6 F.
(-) Średnia temperatura obszaru podparcia dłoni w podobnych urządzeniach wynosiła 28.8 °C / 83.8 F (-8.2 °C / -14.8 F).
| HP Omen 16-xf0376ng R7 7840HS, GeForce RTX 4070 Laptop GPU | HP Omen 16-wf000 i7-13700HX, GeForce RTX 4080 Laptop GPU | MSI Stealth 16 Studio A13VG i7-13700H, GeForce RTX 4070 Laptop GPU | Gigabyte AERO 16 OLED BSF i9-13900H, GeForce RTX 4070 Laptop GPU | Acer Nitro 16 AN16-41 R7 7735HS, GeForce RTX 4070 Laptop GPU | Lenovo Legion Pro 5 16ARX8 R7 7745HX, GeForce RTX 4070 Laptop GPU | |
|---|---|---|---|---|---|---|
| Heat | 9% | -19% | 22% | 3% | 13% | |
| Maximum Upper Side * (°C) | 49 | 45 8% | 60 -22% | 41 16% | 41.5 15% | 41.8 15% |
| Maximum Bottom * (°C) | 57 | 48.8 14% | 61 -7% | 47 18% | 51.8 9% | 41.4 27% |
| Idle Upper Side * (°C) | 31 | 29.2 6% | 38.2 -23% | 23 26% | 31.6 -2% | 29 6% |
| Idle Bottom * (°C) | 31 | 28.8 7% | 37.7 -22% | 23 26% | 34.5 -11% | 30.4 2% |
* ... im mniej tym lepiej
Test warunków skrajnych
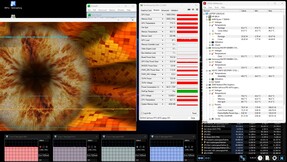
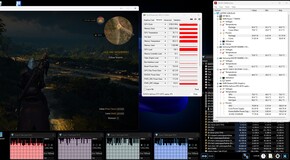
Nie trzeba obawiać się śmierci cieplnej podzespołów. Ryzen 7 7840HS dławi się do 3,3 GHz po dłuższym pełnym obciążeniu, ale około 82 °C (~180 °F) jest akceptowalne. Sytuacja jest porównywalna dla GeForce RTX 4070 z nieco poniżej 78 °C (~172 °F). Taktowanie rdzenia na poziomie około 1700 MHz nie daje powodów do krytyki.
Głośnik
HP Omen 16-xf0376ng analiza dźwięku
(±) | głośność głośnika jest średnia, ale dobra (81 dB)
Bas 100 - 315 Hz
(±) | zredukowany bas - średnio 14.9% niższy od mediany
(±) | liniowość basu jest średnia (13.6% delta do poprzedniej częstotliwości)
Średnie 400 - 2000 Hz
(±) | wyższe średnie - średnio 5.2% wyższe niż mediana
(+) | średnie są liniowe (4.7% delta do poprzedniej częstotliwości)
Wysokie 2–16 kHz
(+) | zrównoważone maksima - tylko 3.7% od mediany
(+) | wzloty są liniowe (6.6% delta do poprzedniej częstotliwości)
Ogólnie 100 - 16.000 Hz
(+) | ogólny dźwięk jest liniowy (14.6% różnicy w stosunku do mediany)
W porównaniu do tej samej klasy
» 27% wszystkich testowanych urządzeń w tej klasie było lepszych, 7% podobnych, 65% gorszych
» Najlepszy miał deltę 6%, średnia wynosiła ###średnia###%, najgorsza wynosiła 132%
W porównaniu do wszystkich testowanych urządzeń
» 18% wszystkich testowanych urządzeń było lepszych, 4% podobnych, 78% gorszych
» Najlepszy miał deltę 4%, średnia wynosiła ###średnia###%, najgorsza wynosiła 134%
Lenovo Legion Pro 5 16ARX8 analiza dźwięku
(±) | głośność głośnika jest średnia, ale dobra (80.9 dB)
Bas 100 - 315 Hz
(-) | prawie brak basu - średnio 24% niższa od mediany
(±) | liniowość basu jest średnia (13.4% delta do poprzedniej częstotliwości)
Średnie 400 - 2000 Hz
(+) | zbalansowane środki średnie - tylko 4.7% od mediany
(+) | średnie są liniowe (6.2% delta do poprzedniej częstotliwości)
Wysokie 2–16 kHz
(+) | zrównoważone maksima - tylko 2.5% od mediany
(+) | wzloty są liniowe (6.2% delta do poprzedniej częstotliwości)
Ogólnie 100 - 16.000 Hz
(±) | liniowość ogólnego dźwięku jest średnia (21.9% różnicy w stosunku do mediany)
W porównaniu do tej samej klasy
» 79% wszystkich testowanych urządzeń w tej klasie było lepszych, 6% podobnych, 16% gorszych
» Najlepszy miał deltę 6%, średnia wynosiła ###średnia###%, najgorsza wynosiła 132%
W porównaniu do wszystkich testowanych urządzeń
» 62% wszystkich testowanych urządzeń było lepszych, 7% podobnych, 31% gorszych
» Najlepszy miał deltę 4%, średnia wynosiła ###średnia###%, najgorsza wynosiła 134%
Zarządzanie energią
Zużycie energii
W kwestii zużycia energii również obyło się bez większych niespodzianek. 84 do maksymalnie 176 watów pod obciążeniem to nawet jak na tak potężnego notebooka stosunkowo niski wynik, który przemawia za wydajnością CPU i GPU. Dołączony do zestawu 280-watowy zasilacz nie jest nawet bliski wyczerpania. W trybie bezczynności Omen 16 zużywa tylko od 9 do 20 watów przy aktywnym przełączaniu grafiki - to umiarkowany wynik.
| wyłączony / stan wstrzymania | |
| luz | |
| obciążenie |
|
Legenda:
min: | |
| HP Omen 16-xf0376ng R7 7840HS, GeForce RTX 4070 Laptop GPU | HP Omen 16-wf000 i7-13700HX, GeForce RTX 4080 Laptop GPU | MSI Stealth 16 Studio A13VG i7-13700H, GeForce RTX 4070 Laptop GPU | Gigabyte AERO 16 OLED BSF i9-13900H, GeForce RTX 4070 Laptop GPU | Acer Nitro 16 AN16-41 R7 7735HS, GeForce RTX 4070 Laptop GPU | Lenovo Legion Pro 5 16ARX8 R7 7745HX, GeForce RTX 4070 Laptop GPU | Średnia w klasie Gaming | |
|---|---|---|---|---|---|---|---|
| Power Consumption | -75% | -13% | -12% | -22% | -31% | -40% | |
| Idle Minimum * (Watt) | 9 | 21.8 -142% | 11 -22% | 11.8 -31% | 11.6 -29% | 8.1 10% | 13.8 ? -53% |
| Idle Average * (Watt) | 14 | 26 -86% | 18 -29% | 16.1 -15% | 15.6 -11% | 15.9 -14% | 19.6 ? -40% |
| Idle Maximum * (Watt) | 20 | 36 -80% | 19 5% | 17 15% | 16.5 17% | 37.2 -86% | 25.8 ? -29% |
| Load Average * (Watt) | 84 | 115.5 -38% | 91 -8% | 100.6 -20% | 155 -85% | 90.9 -8% | 110.5 ? -32% |
| Witcher 3 ultra * (Watt) | 140.9 | 214 -52% | 130 8% | 158 -12% | 154.8 -10% | 189.6 -35% | |
| Load Maximum * (Watt) | 176 | 269.7 -53% | 228 -30% | 192 -9% | 205 -16% | 263.5 -50% | 258 ? -47% |
* ... im mniej tym lepiej
Energy consumption Witcher 3 / Stress test
Energy consumption with external Monitor
Żywotność baterii
Żywotność baterii opiera się na wersji Intela, chociaż odpowiednik AMD działa nieco dłużej w naszym rzeczywistym teście WLAN przy zmniejszonej jasności do 150 cd/m² w widoku od 344 do 307 minut. Nieco poniżej 6 godzin to użyteczna wartość dla laptopa do gier, choć niektórzy rywale osiągają tu nawet więcej.
| HP Omen 16-xf0376ng R7 7840HS, GeForce RTX 4070 Laptop GPU, 83 Wh | HP Omen 16-wf000 i7-13700HX, GeForce RTX 4080 Laptop GPU, 83 Wh | MSI Stealth 16 Studio A13VG i7-13700H, GeForce RTX 4070 Laptop GPU, 99.9 Wh | Gigabyte AERO 16 OLED BSF i9-13900H, GeForce RTX 4070 Laptop GPU, 88 Wh | Acer Nitro 16 AN16-41 R7 7735HS, GeForce RTX 4070 Laptop GPU, 90 Wh | Lenovo Legion Pro 5 16ARX8 R7 7745HX, GeForce RTX 4070 Laptop GPU, 80 Wh | Średnia w klasie Gaming | |
|---|---|---|---|---|---|---|---|
| Czasy pracy | -11% | 37% | 32% | 58% | -30% | 18% | |
| WiFi v1.3 (h) | 5.7 | 5.1 -11% | 7.8 37% | 7.5 32% | 9 58% | 4 -30% | 6.71 ? 18% |
| Reader / Idle (h) | 5.5 | 11 | 12.2 | 6.5 | 9.23 ? | ||
| Load (h) | 1.1 | 2.4 | 2.1 | 1.8 | 1 | 1.472 ? | |
| H.264 (h) | 7.7 | 7.4 | 10.2 | 7.93 ? |
Za
Przeciw
Wnioski
Omen 16 zapewnia dobrą wydajność dziękiRyzen 7 7840HS.
16-calowiec nie popełnia żadnych rażących błędów i uzyskuje co najmniej "zadowalający" wynik w prawie każdej kategorii.
Jest nawet wystarczająco dobry, aby uzyskać ocenę "Dobry" lub "Bardzo dobry" w większości kategorii, więc kończymy z przyzwoitą ogólną oceną 87% - podobnie jak wersja Intela.
Z pozytywów warto wspomnieć o stabilnej pracy ciągłej, szybkim wyświetlaczu 165 Hz, solidnych głośnikach i (przynajmniej w trybie zrównoważonym) akceptowalnej emisji hałasu. Nie polecalibyśmy trybu wydajności ze względu na głośny hałas (bez względu na to, czy jest bezczynny, czy obciążony).
HP mogłoby poprawić łączność (brak czytnika kart, brak USB 4), kamerę internetową i rozwój temperatury obudowy, która jest powyżej średniej.
Porównywalne RTX-4070 laptopy z procesorami AMD można znaleźć np. u Acer (Nitro 16) czy Lenovo (Legion Pro 5).
Cena i dostępność
HP Omen 16-xf0376ng z procesorem Ryzen 7 7840HS, GeForce RTX 4070 i panelem 165 Hz był dostępny za niecałe 1900 euro (~2026 USD) w sklepach Saturn i Mediamarkt w czasie testów.
HP Omen 16-xf0376ng
- 13/09/2023 v7 (old)
Florian Glaser
Przezroczystość
Wyboru urządzeń do recenzji dokonuje nasza redakcja. Próbka testowa została udostępniona autorowi jako pożyczka od producenta lub sprzedawcy detalicznego na potrzeby tej recenzji. Pożyczkodawca nie miał wpływu na tę recenzję, producent nie otrzymał też kopii tej recenzji przed publikacją. Nie było obowiązku publikowania tej recenzji. Jako niezależna firma medialna, Notebookcheck nie podlega władzy producentów, sprzedawców detalicznych ani wydawców.
Tak testuje Notebookcheck
Każdego roku Notebookcheck niezależnie sprawdza setki laptopów i smartfonów, stosując standardowe procedury, aby zapewnić porównywalność wszystkich wyników. Od około 20 lat stale rozwijamy nasze metody badawcze, ustanawiając przy tym standardy branżowe. W naszych laboratoriach testowych doświadczeni technicy i redaktorzy korzystają z wysokiej jakości sprzętu pomiarowego. Testy te obejmują wieloetapowy proces walidacji. Nasz kompleksowy system ocen opiera się na setkach uzasadnionych pomiarów i benchmarków, co pozwala zachować obiektywizm.

