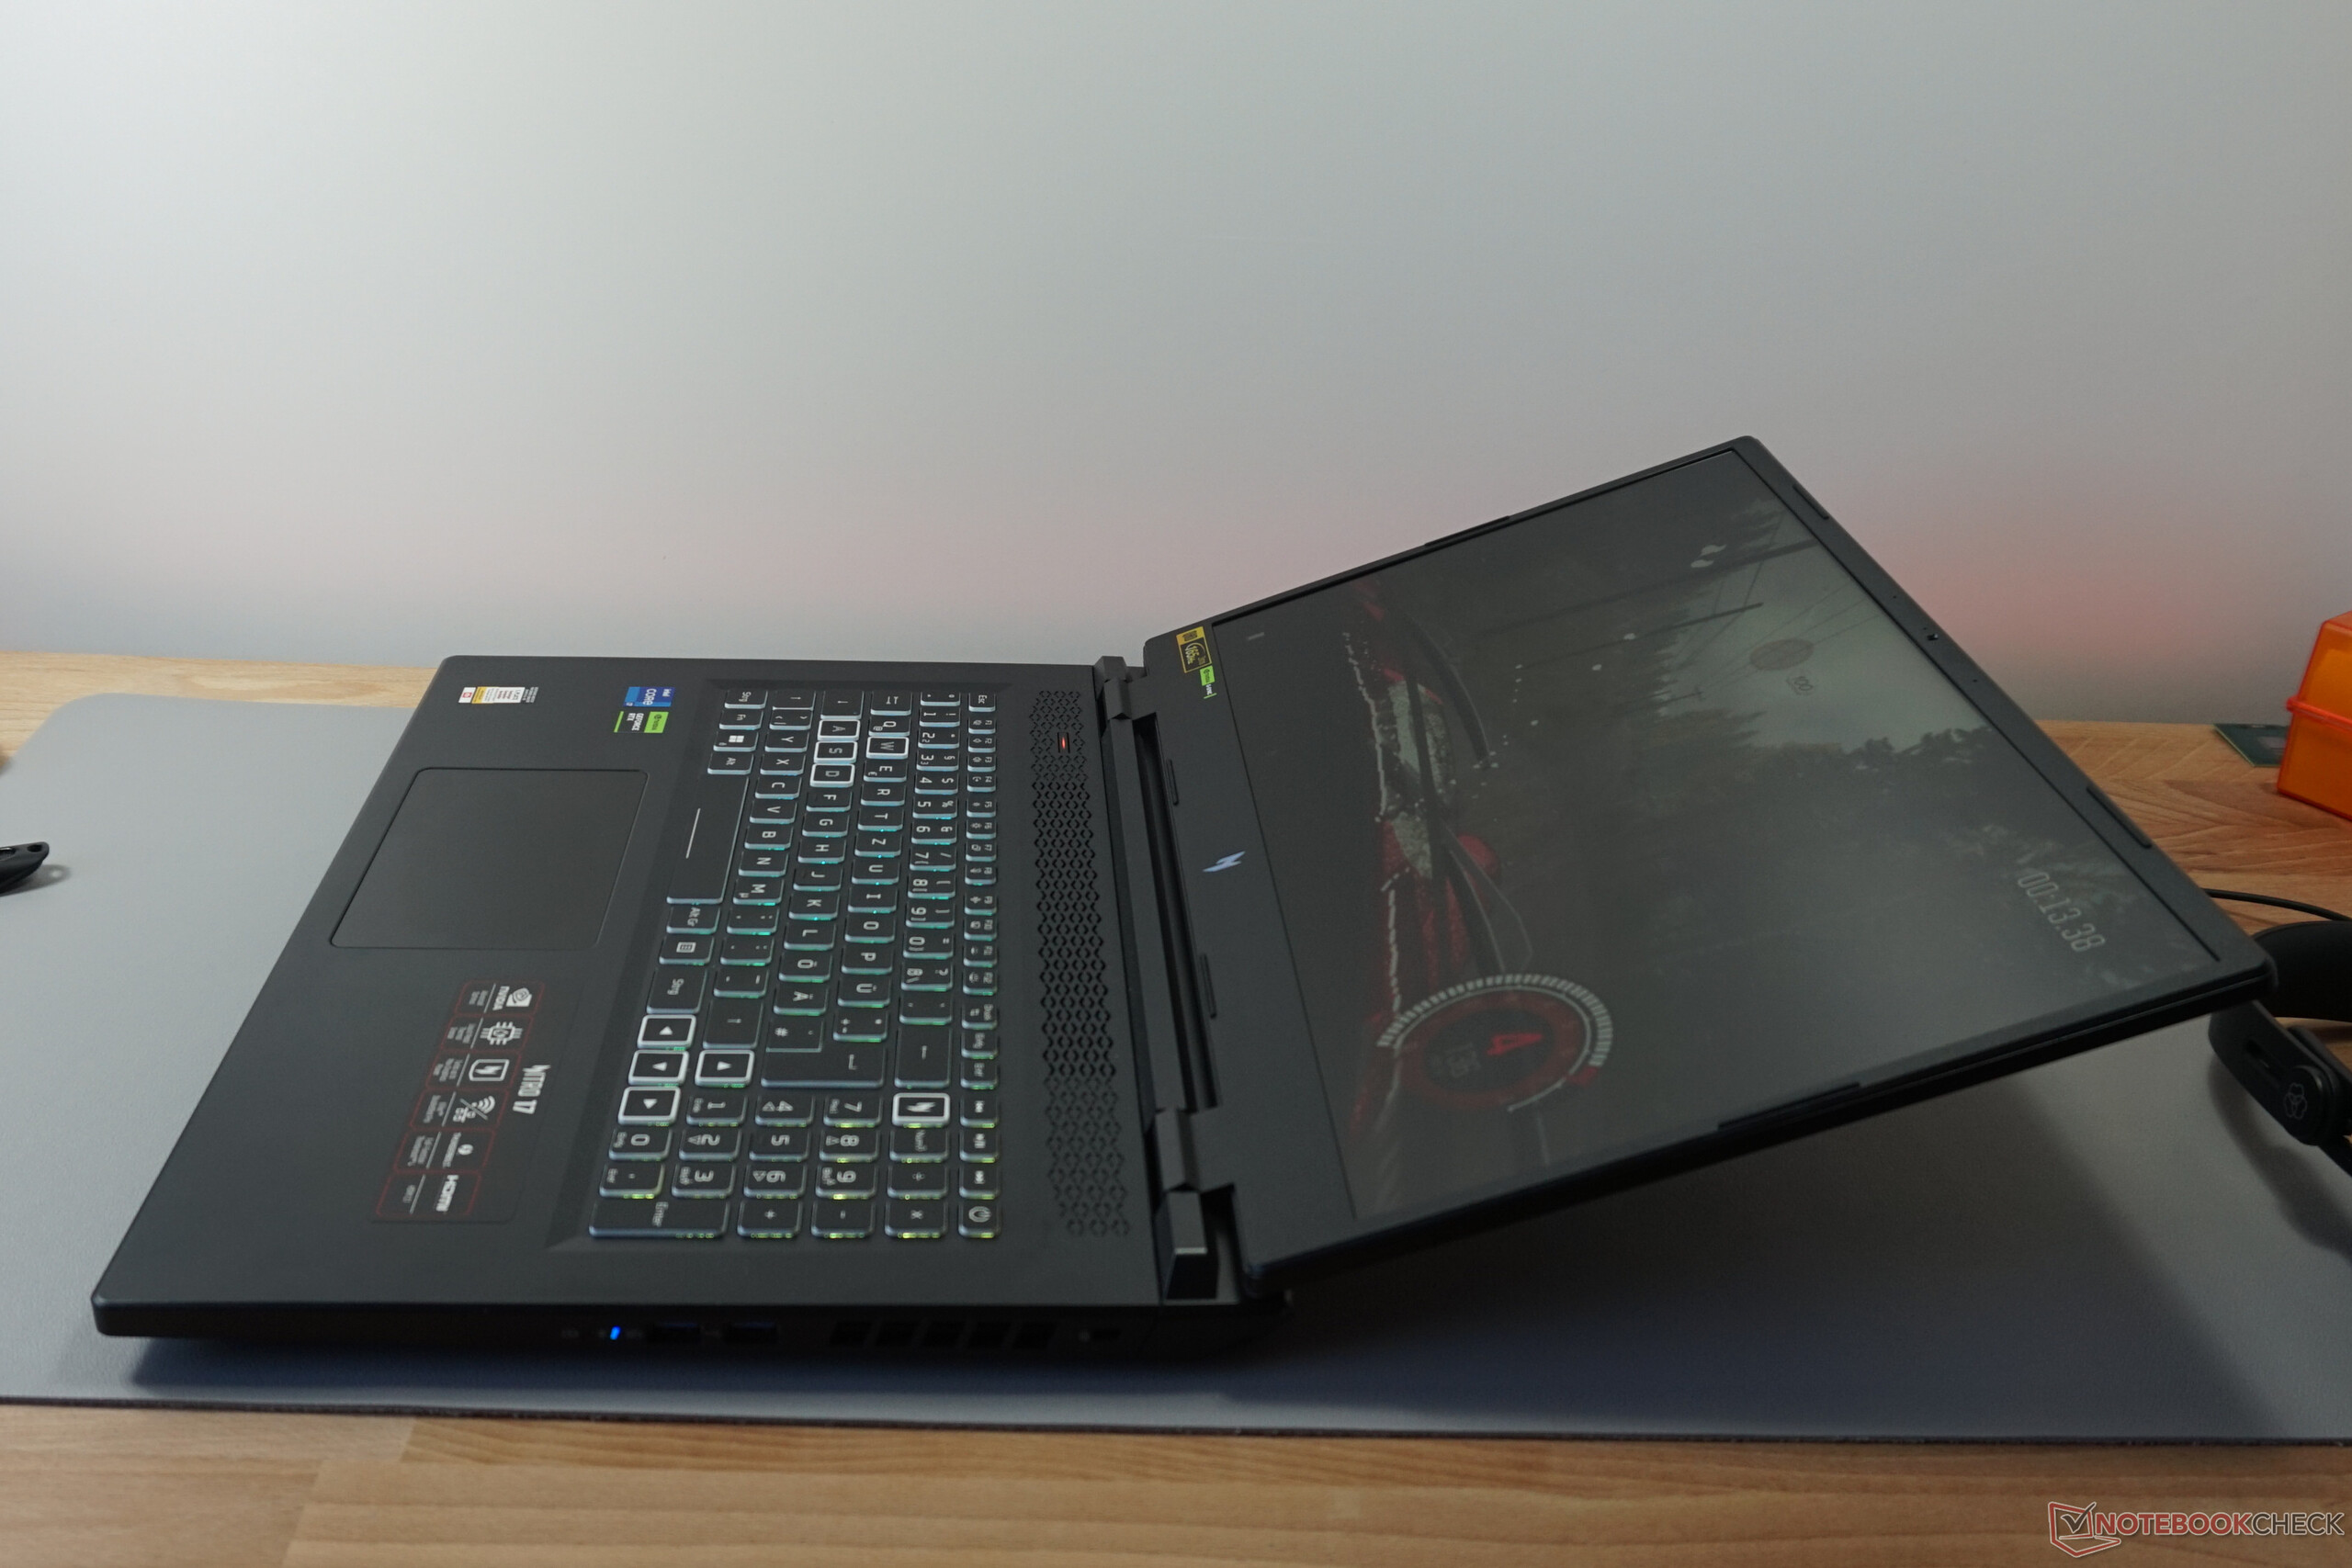
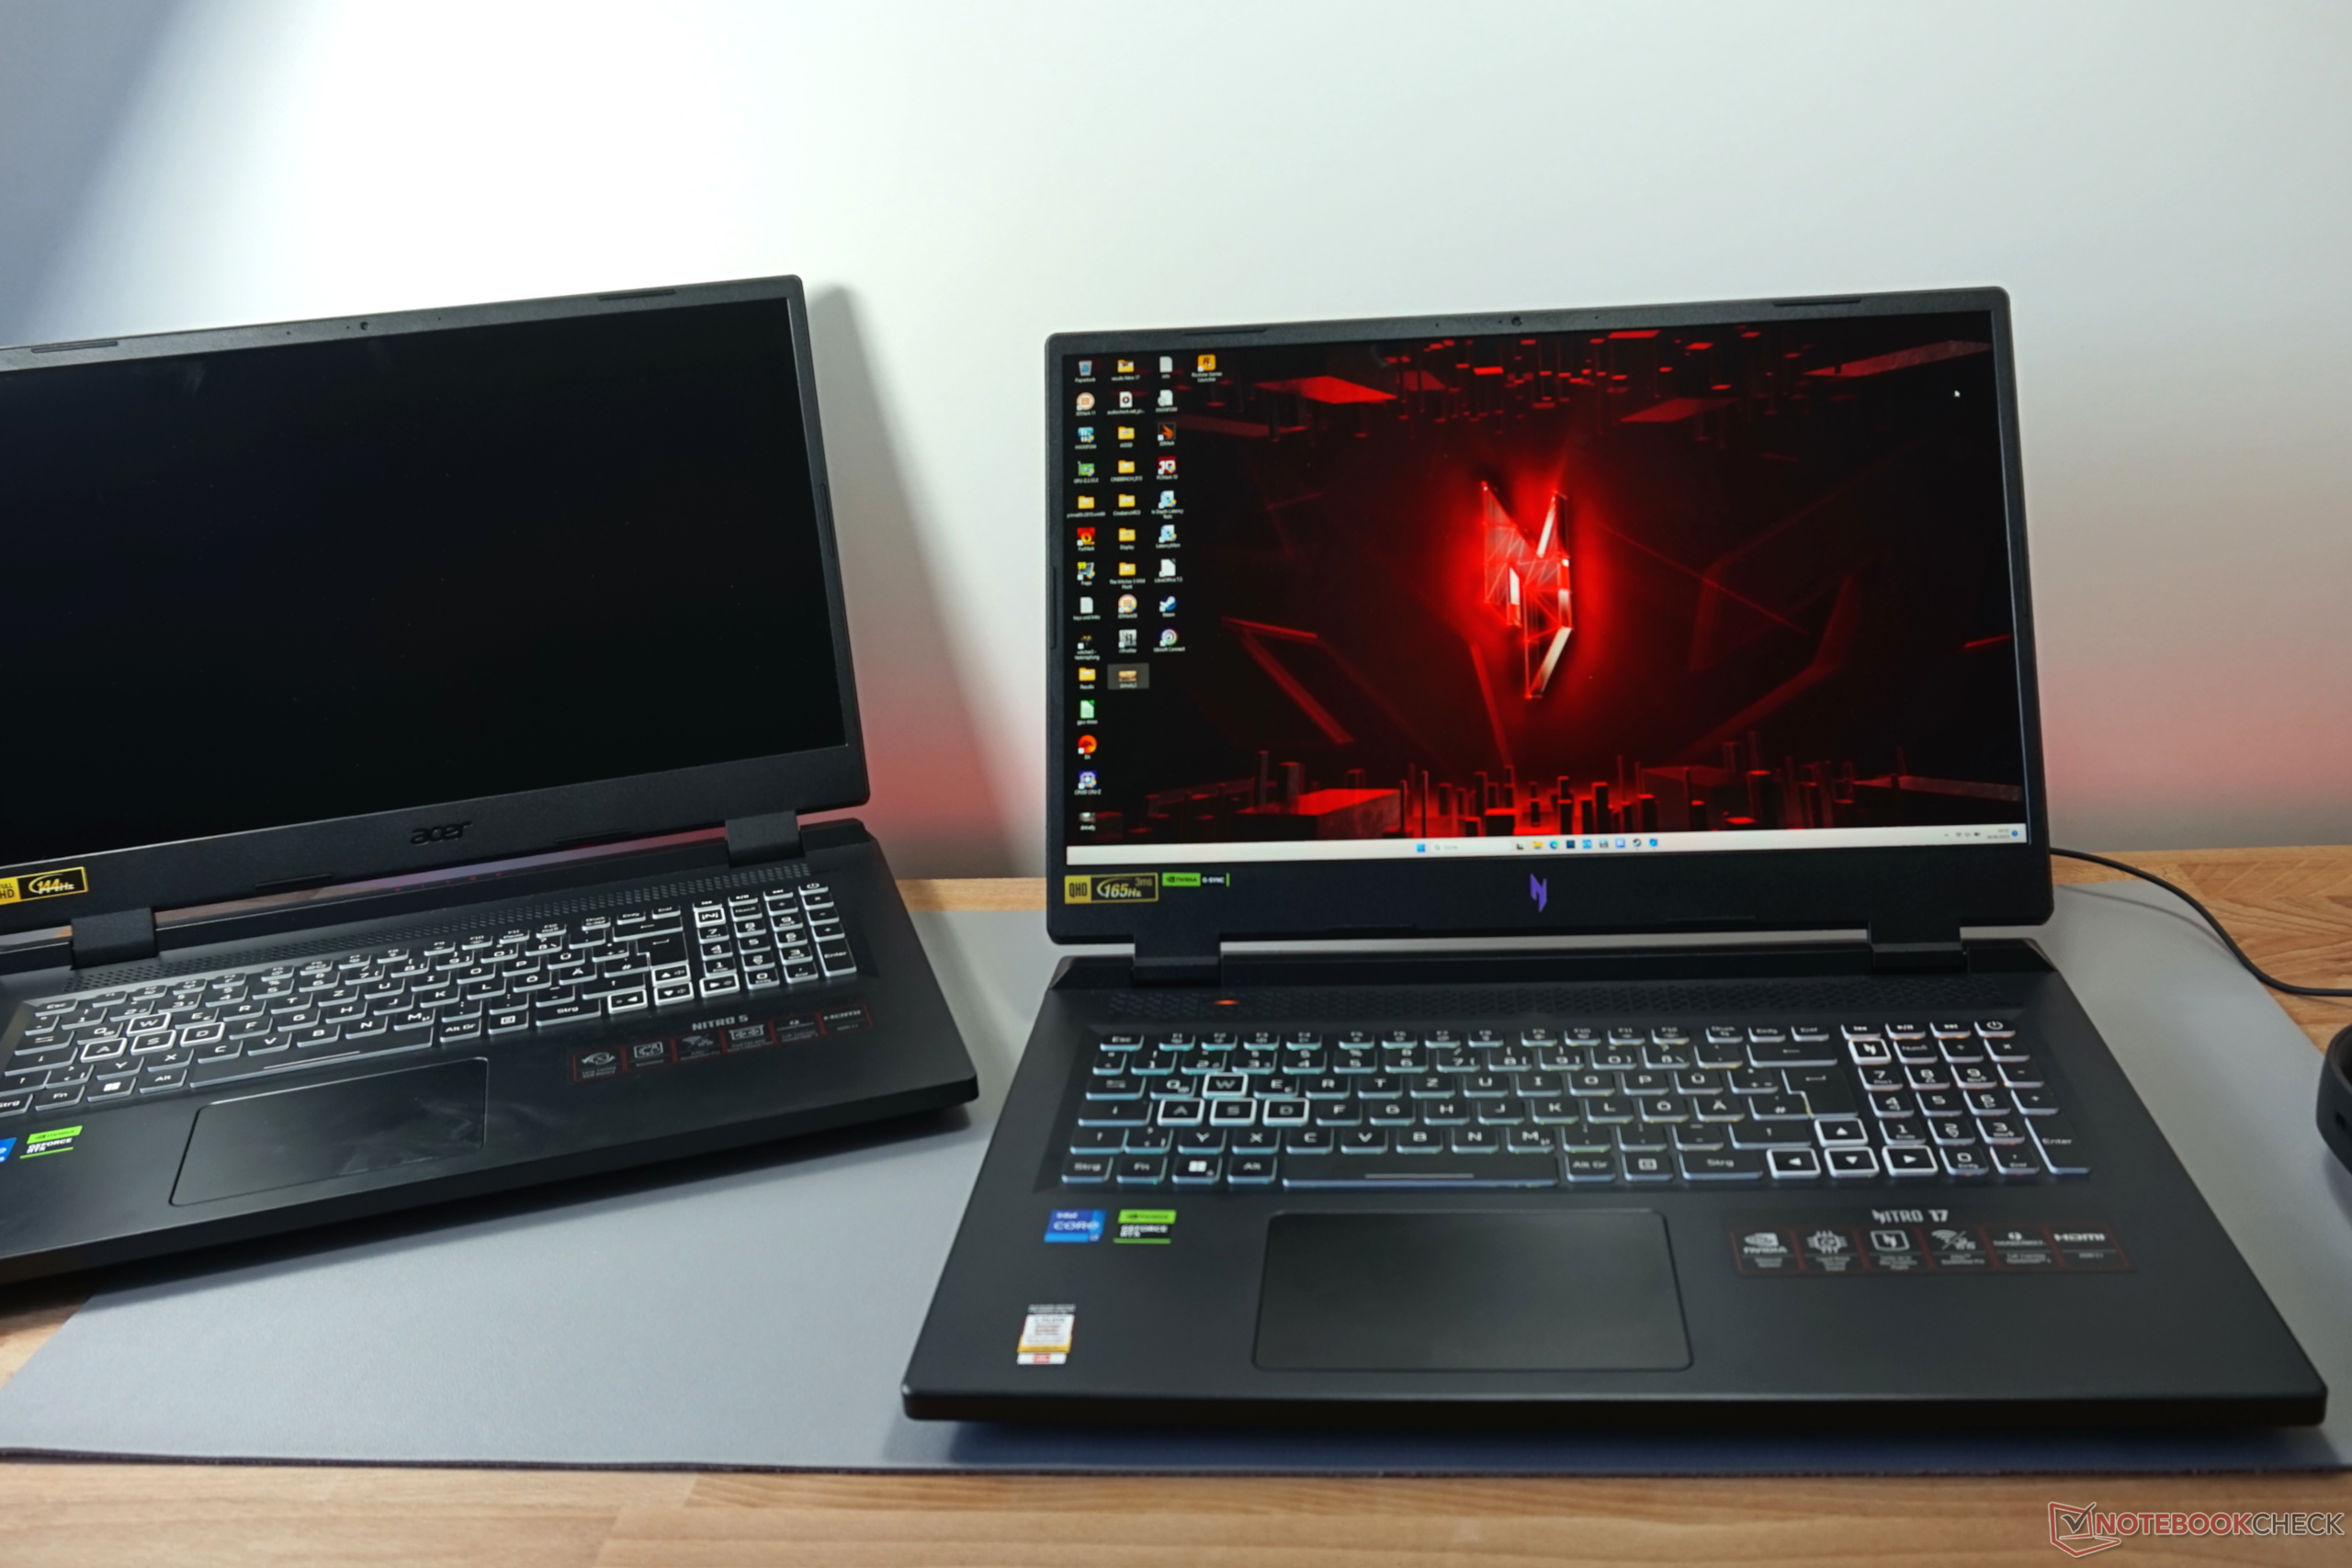
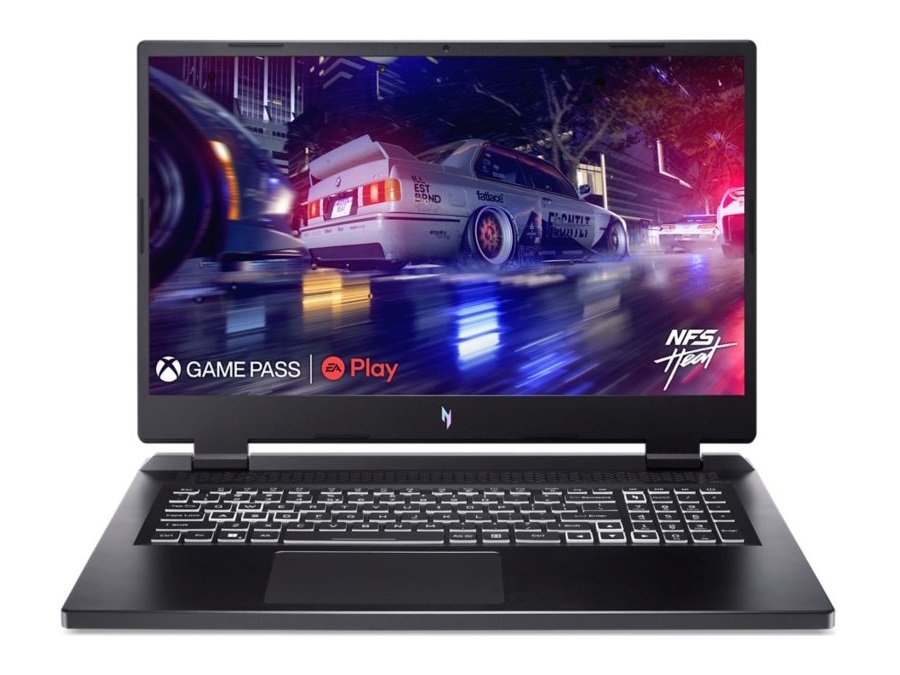
Recenzja Acer Nitro 17 Ryzen Edition: Laptop do gier QHD z RTX 4070
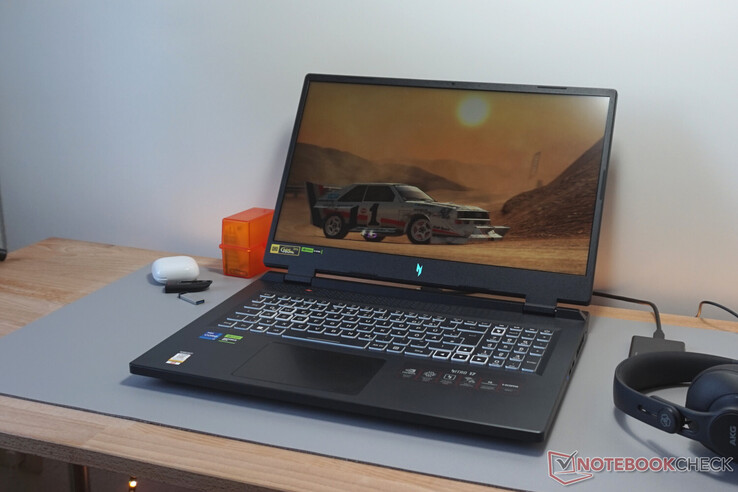
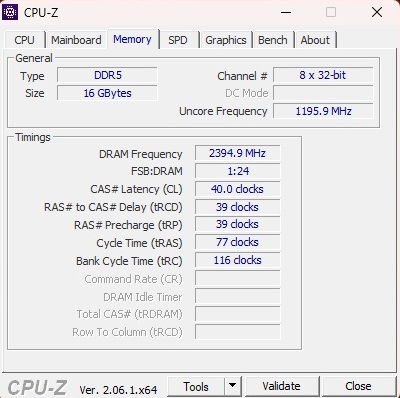
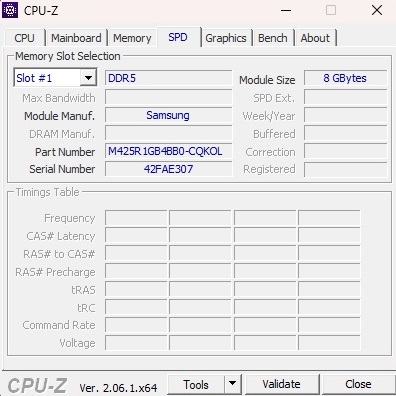
Po wcześniejszych testach modelu zCore i7-13700HiGeForce RTX 4060teraz przyglądamy się bratu tego laptopa w podobnej cenie, AN17-41-R9LN z procesorem AMD i nieco mocniejszymGeForce RTX 4070(Podobnie jak w wersji Intela, jako ekran zastosowano panel QHD 16:9 z częstotliwością odświeżania 165 Hz i rozdzielczością 2560 x 1440 pikseli. Ponadto zainstalowano 2x 8 GB pamięci RAM DDR5-4800 i dysk SSD NVMe o pojemności 1 TB. Nie ma również niespodzianek w systemie operacyjnym, ponieważ laptop ma zainstalowany system Windows 11 Home.
Konkurentami Nitro 17 są inne 17-calowe laptopy do gier z RTX 4070, takie jakMSI Pulse 17 B13VGKiSchenker XMG Focus 17 (E23)lub Asus ROG Strix G17 G713PI- z których wszystkie można znaleźć w tabelach jako urządzenia porównawcze.
Potencjalni konkurenci w porównaniu
Ocena | Data | Model | Waga | Wysokość | Rozmiar | Rezolucja | Cena |
|---|---|---|---|---|---|---|---|
| 86.9 % v7 (old) | 09/2023 | Acer Nitro 17 AN17-41-R9LN R7 7735HS, GeForce RTX 4070 Laptop GPU | 3 kg | 29 mm | 17.30" | 2560x1440 | |
| 87.2 % v7 (old) | 07/2023 | Acer Nitro 17 AN17-51-71ER i7-13700H, GeForce RTX 4060 Laptop GPU | 3 kg | 30.3 mm | 17.30" | 2560x1440 | |
| 86.3 % v7 (old) | 07/2023 | MSI Pulse 17 B13VGK i7-13700H, GeForce RTX 4070 Laptop GPU | 2.7 kg | 27.2 mm | 17.30" | 1920x1080 | |
| 85.9 % v7 (old) | 06/2023 | Schenker XMG Focus 17 (E23) i9-13900HX, GeForce RTX 4070 Laptop GPU | 2.9 kg | 29.3 mm | 17.30" | 2560x1440 | |
| 88.4 % v7 (old) | 04/2023 | Asus ROG Strix G17 G713PI R9 7945HX, GeForce RTX 4070 Laptop GPU | 2.8 kg | 30.7 mm | 17.30" | 2560x1440 |
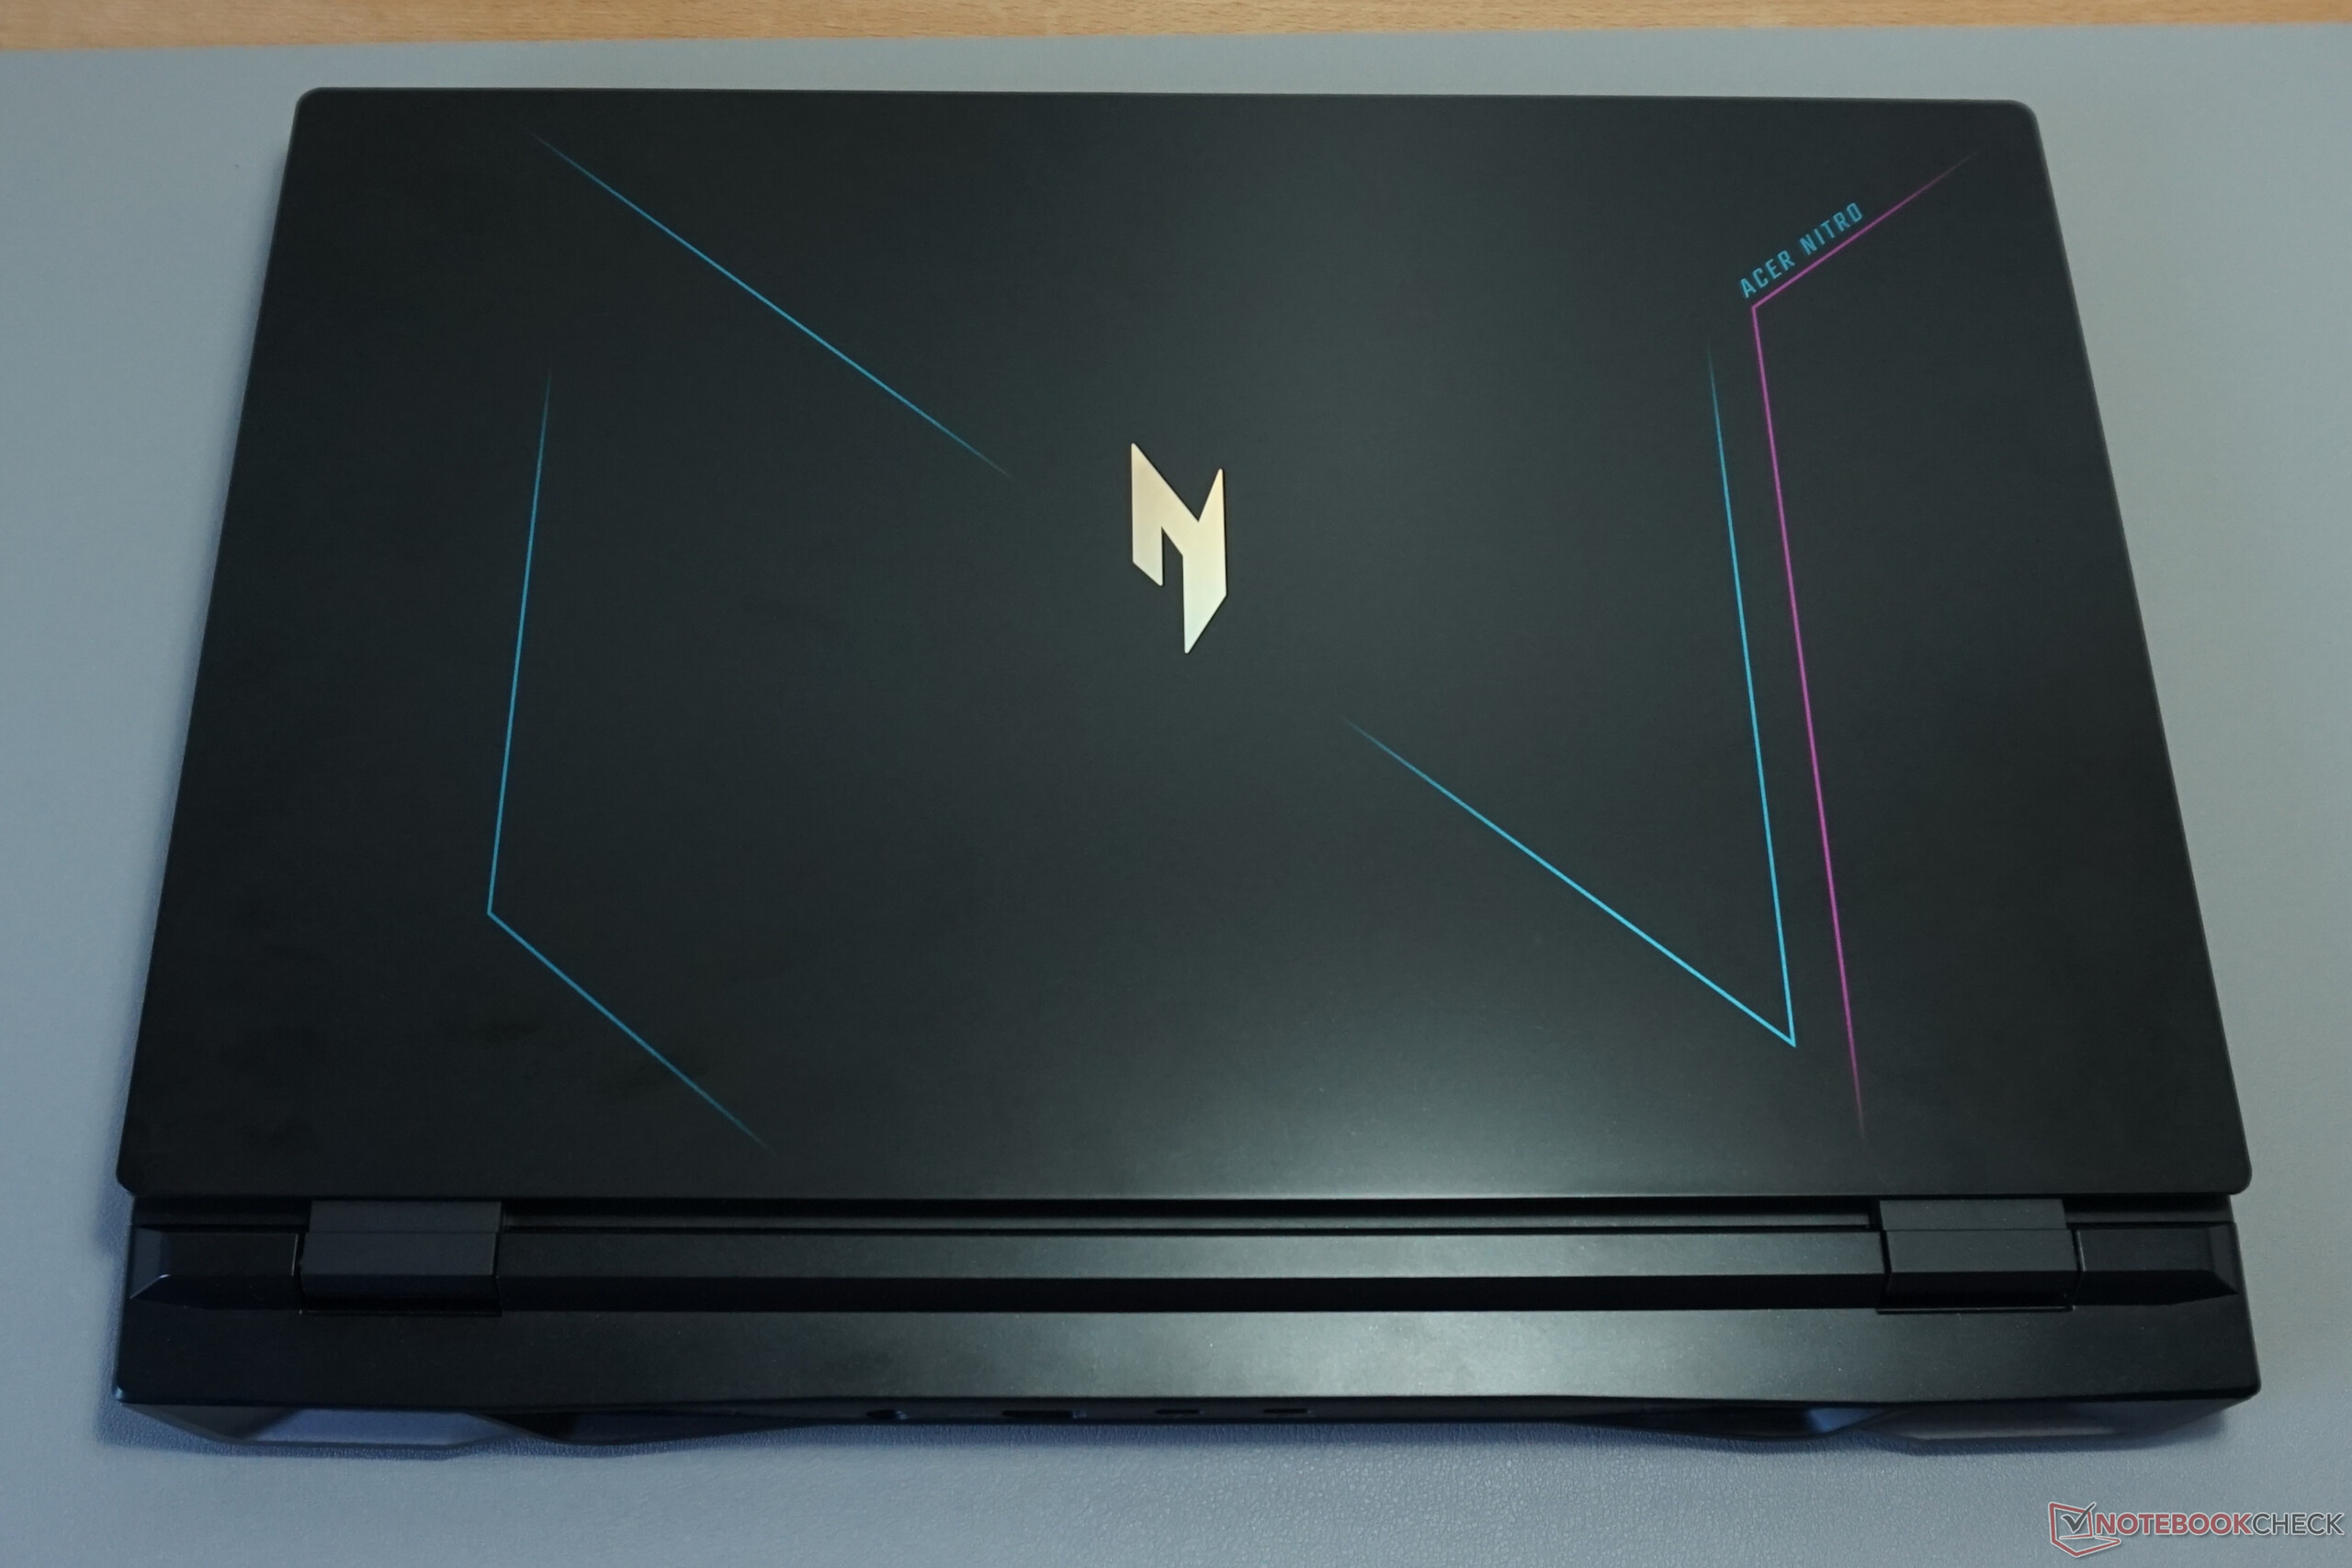
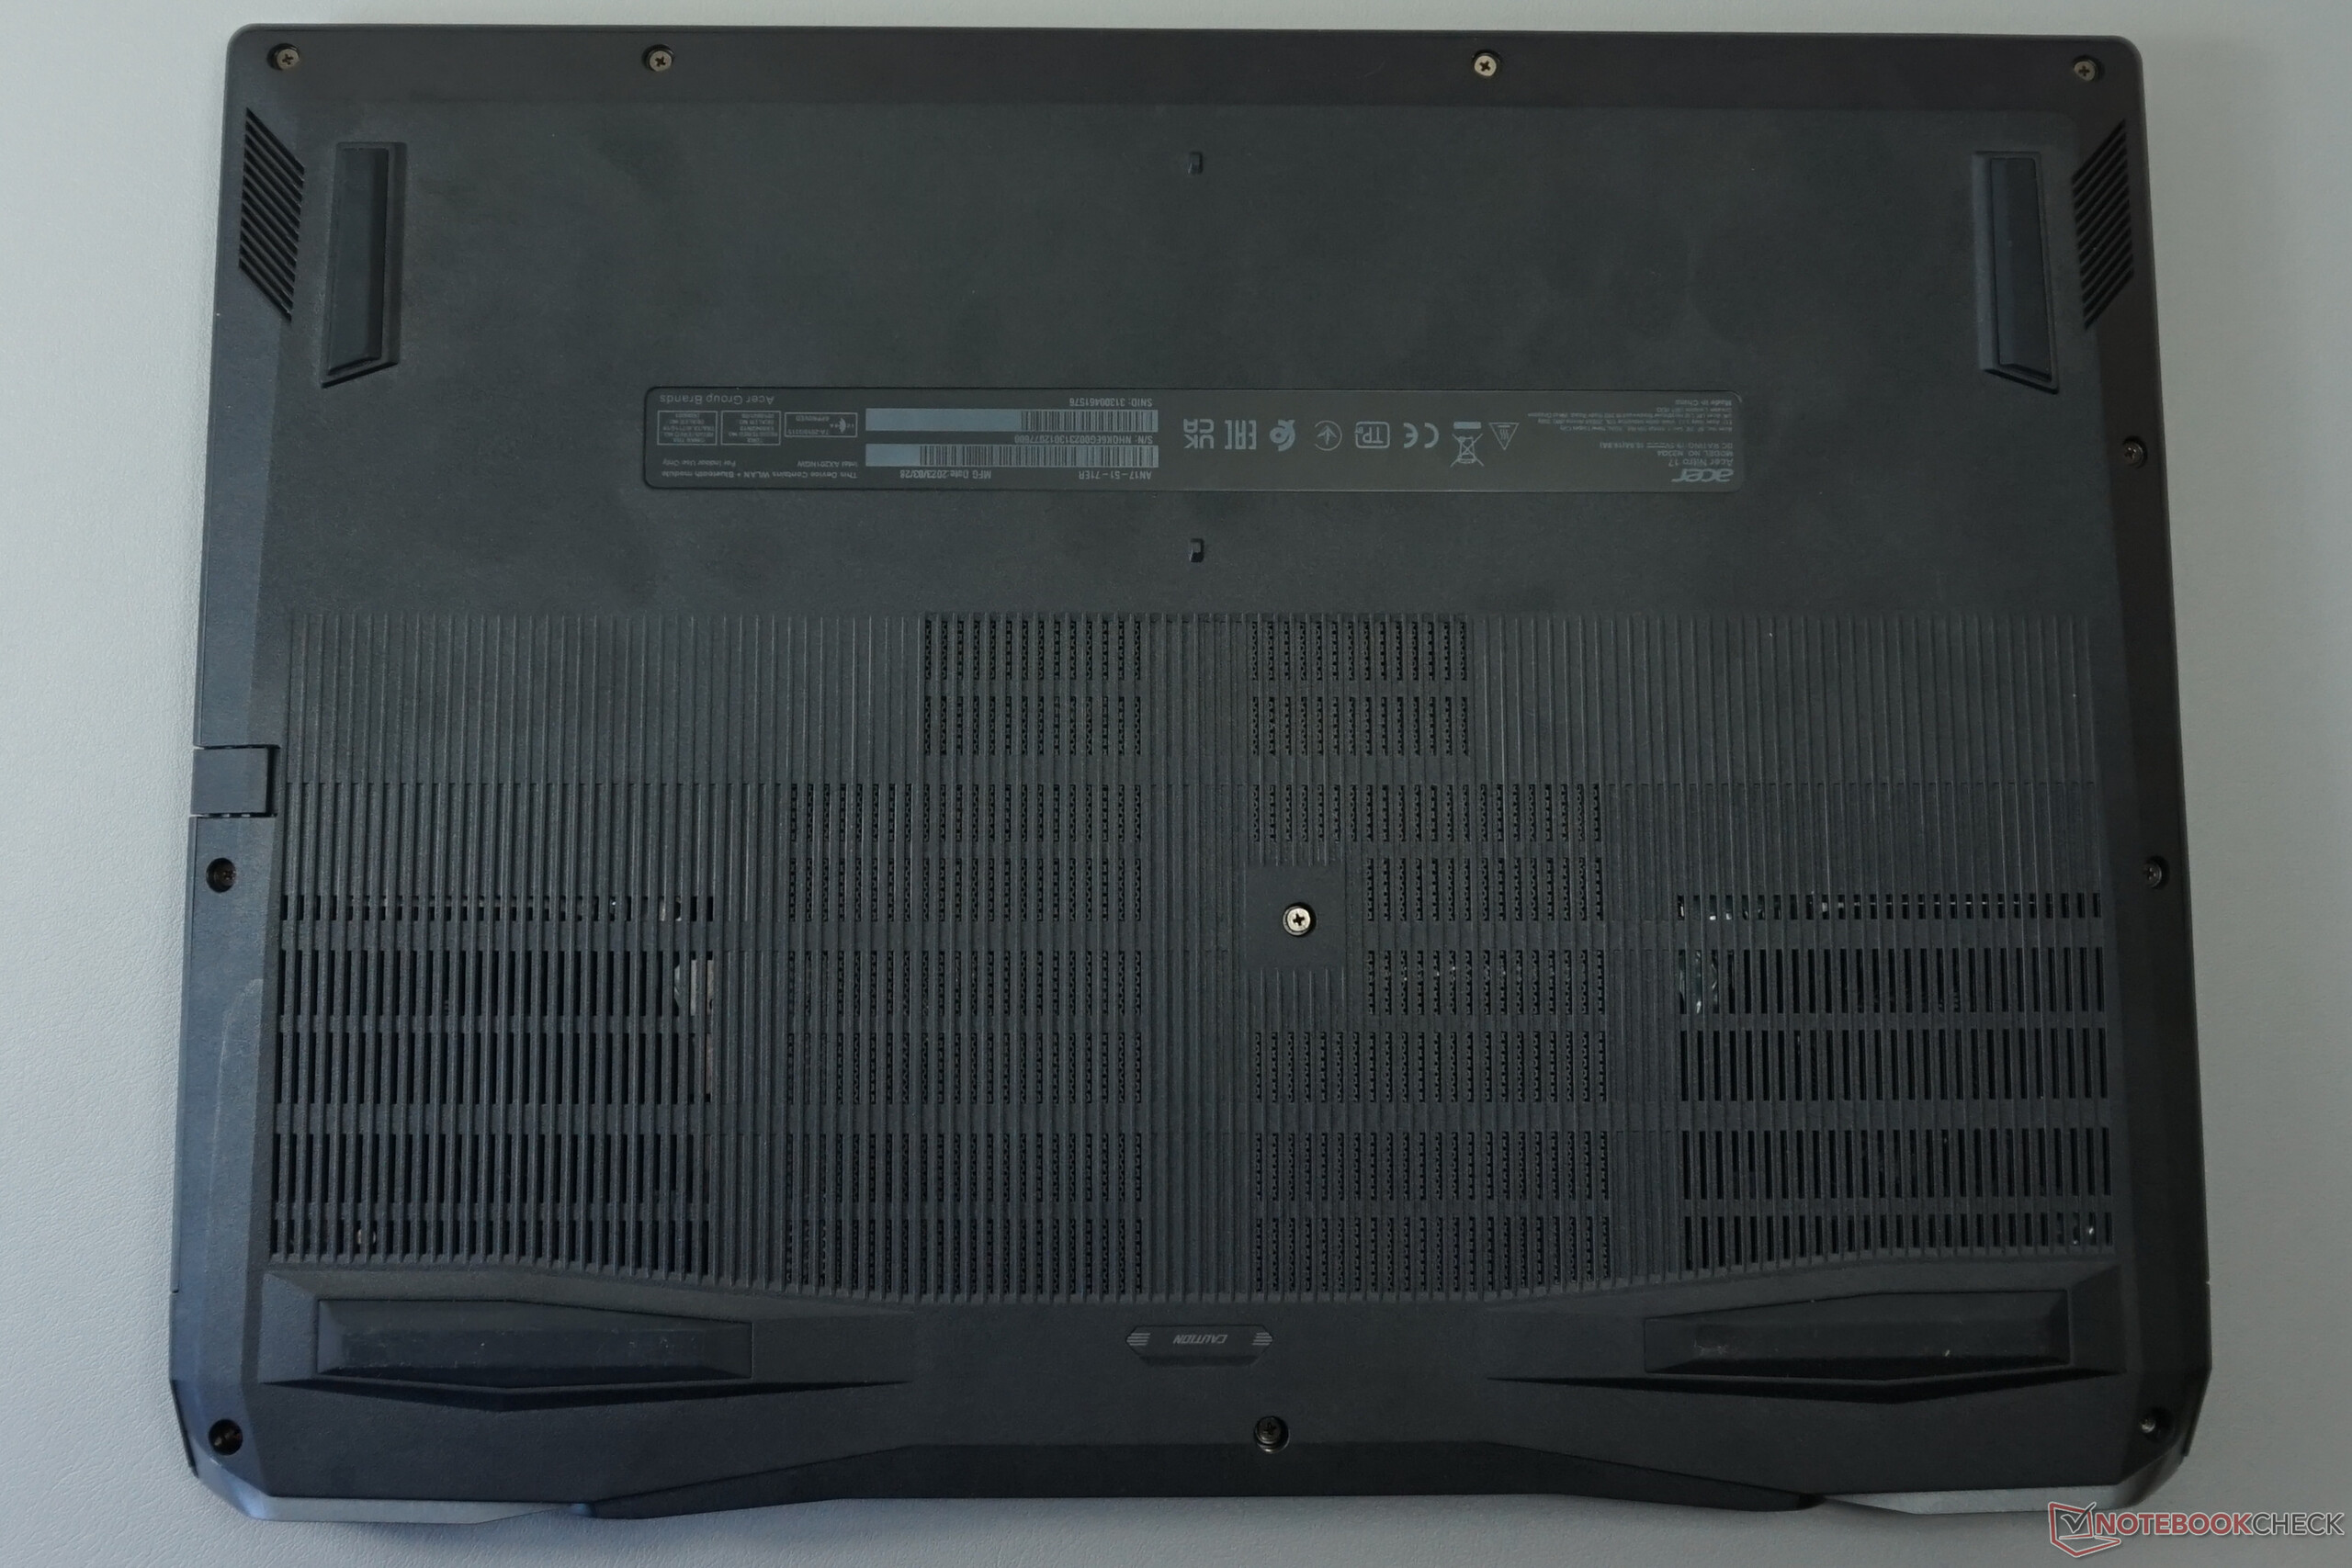
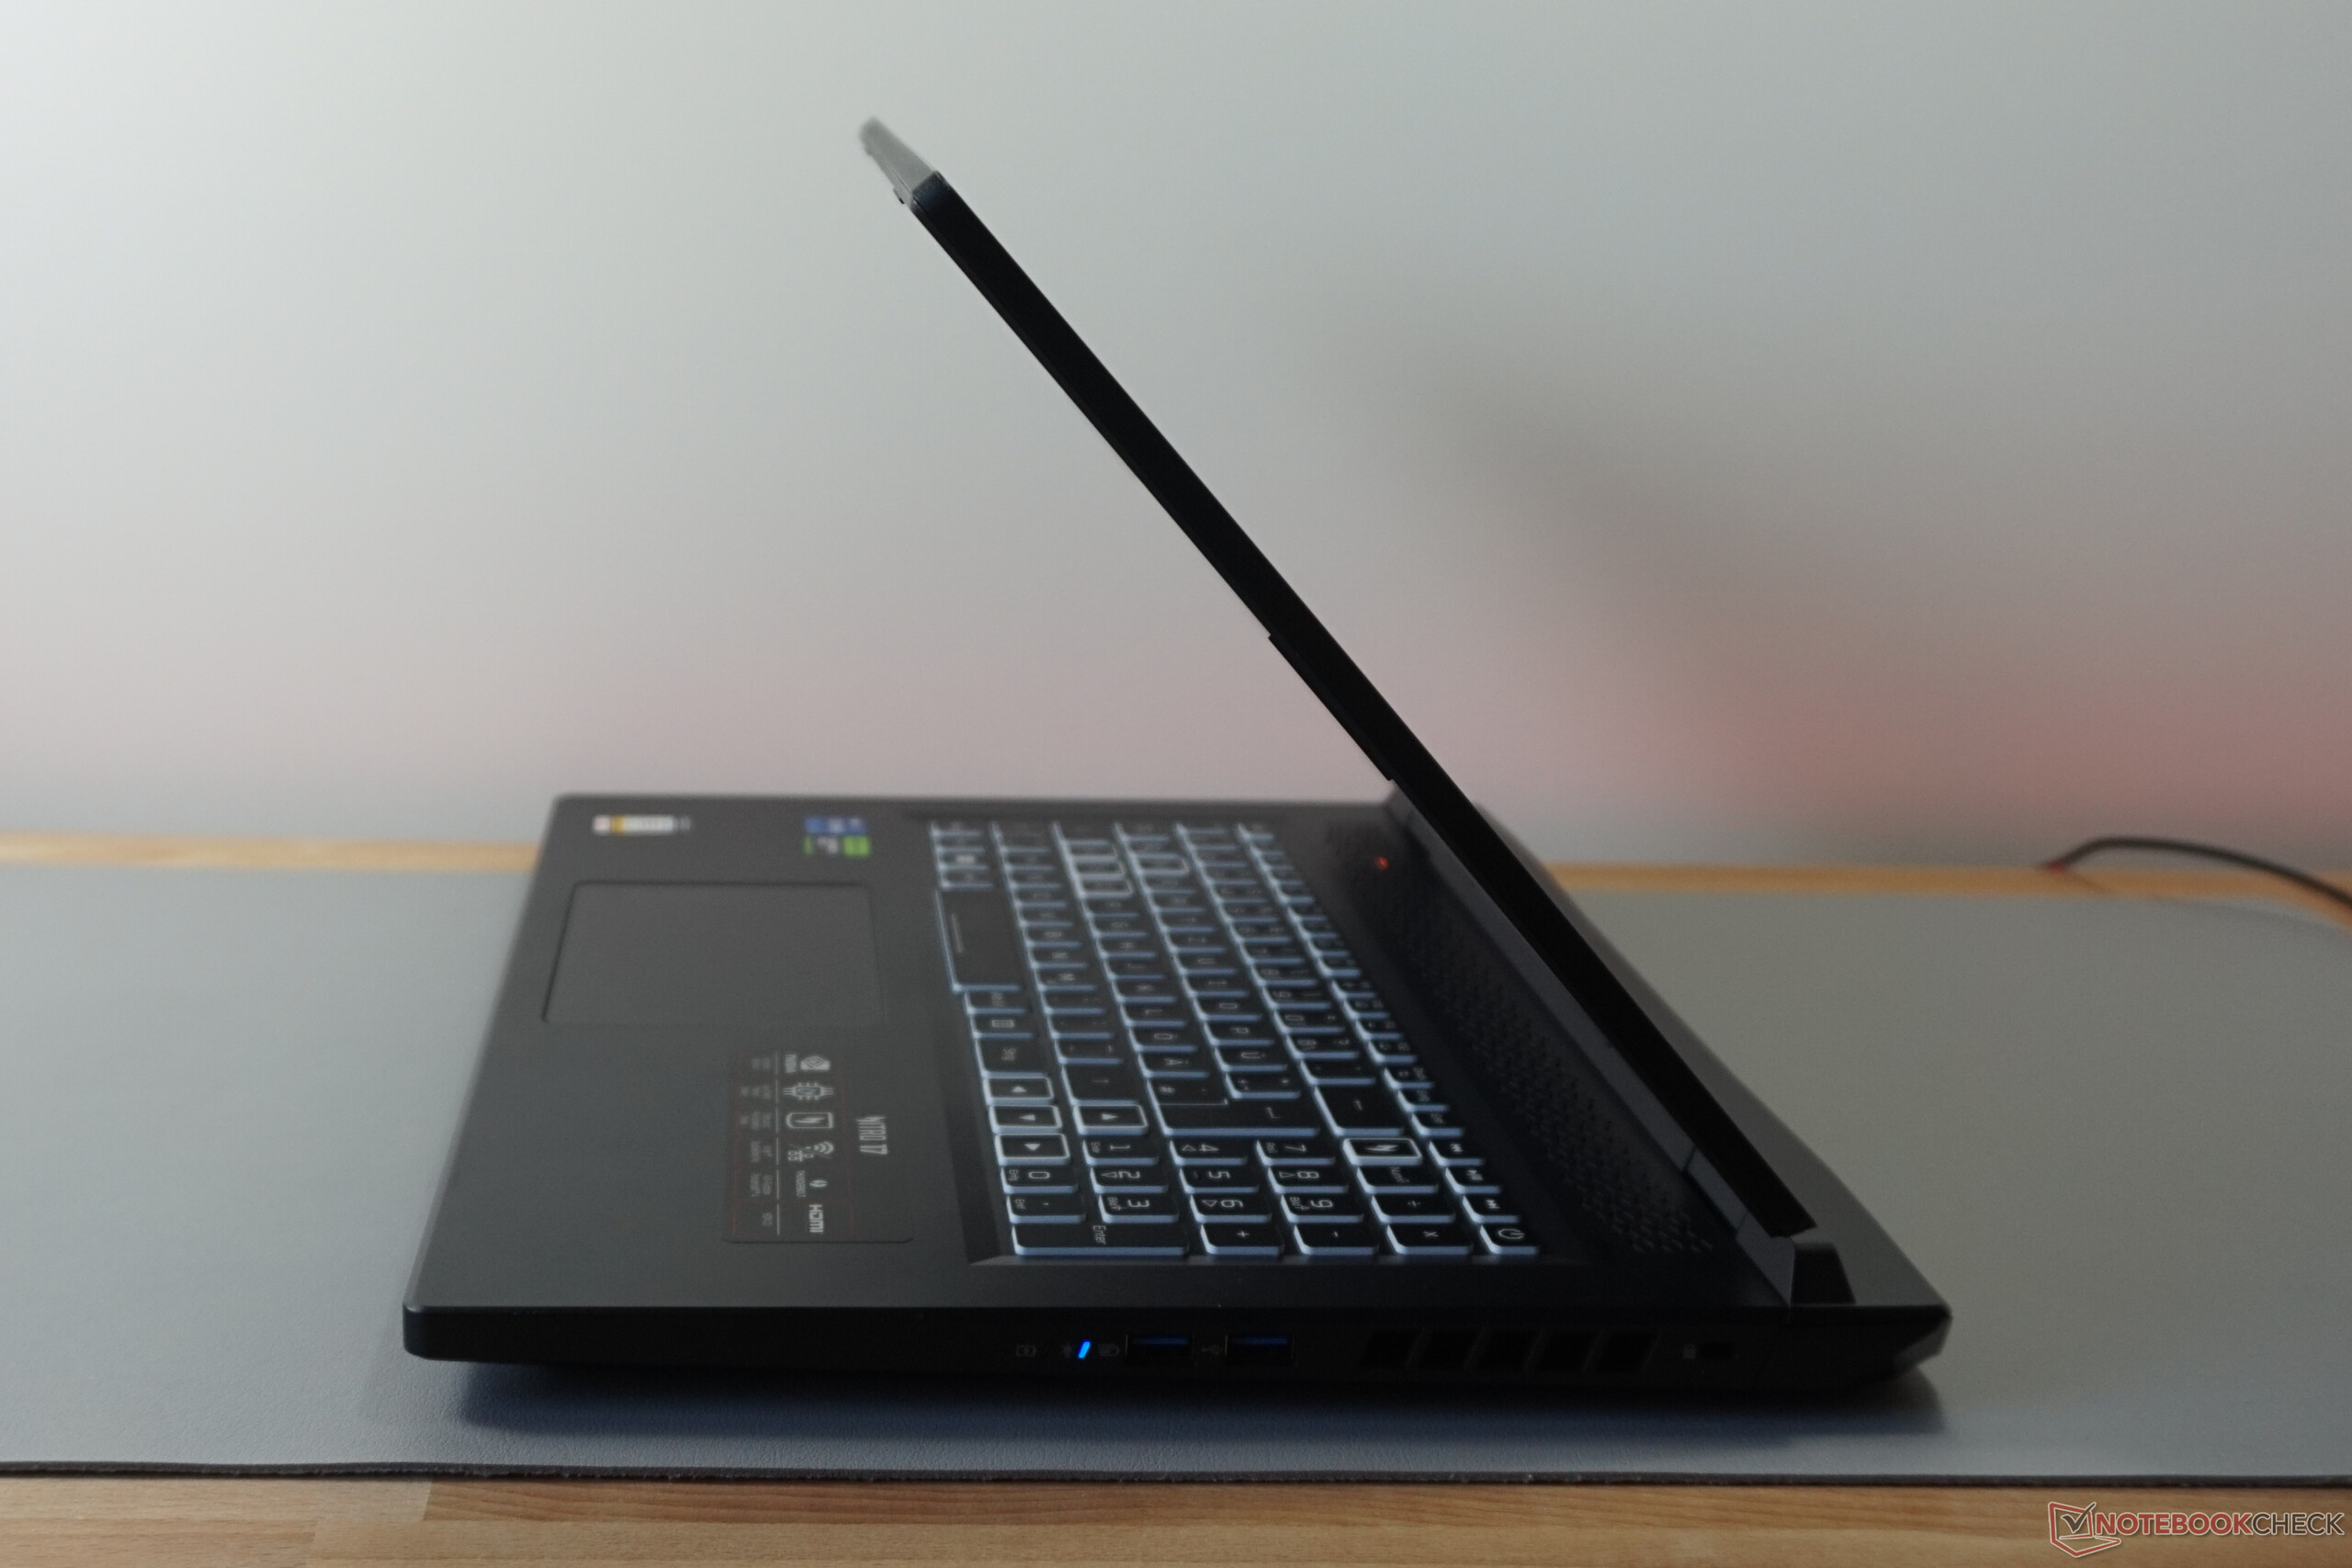
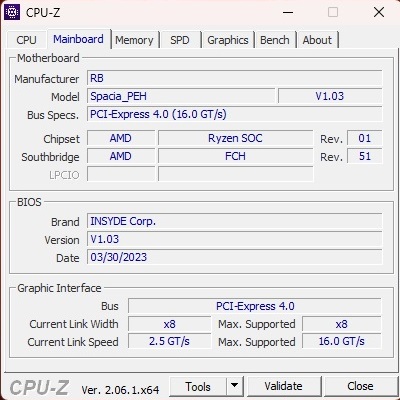
Ponieważ obudowa urządzenia jest identyczna z jego odpowiednikiem Intela, z wyjątkiem opcji łączności (wariant AMD nie ma portu Thunderbolt 4 i zamiast tego ma 2x USB 4), nie będziemy dalej zagłębiać się w jego obudowę, funkcje i urządzenia wejściowe w tym artykule. Odpowiednie informacje można znaleźć w recenzji AN17-51-71ER.

Czytnik kart SD
| SD Card Reader | |
| average JPG Copy Test (av. of 3 runs) | |
| Średnia w klasie Gaming (20.9 - 210, n=54, ostatnie 2 lata) | |
| Schenker XMG Focus 17 (E23) | |
| Acer Nitro 17 AN17-41-R9LN (AV PRO microSD 128 GB V60) | |
| Acer Nitro 17 AN17-51-71ER | |
| maximum AS SSD Seq Read Test (1GB) | |
| Średnia w klasie Gaming (25.5 - 261, n=51, ostatnie 2 lata) | |
| Schenker XMG Focus 17 (E23) | |
| Acer Nitro 17 AN17-41-R9LN (AV PRO microSD 128 GB V60) | |
| Acer Nitro 17 AN17-51-71ER | |
Komunikacja
Kamera internetowa


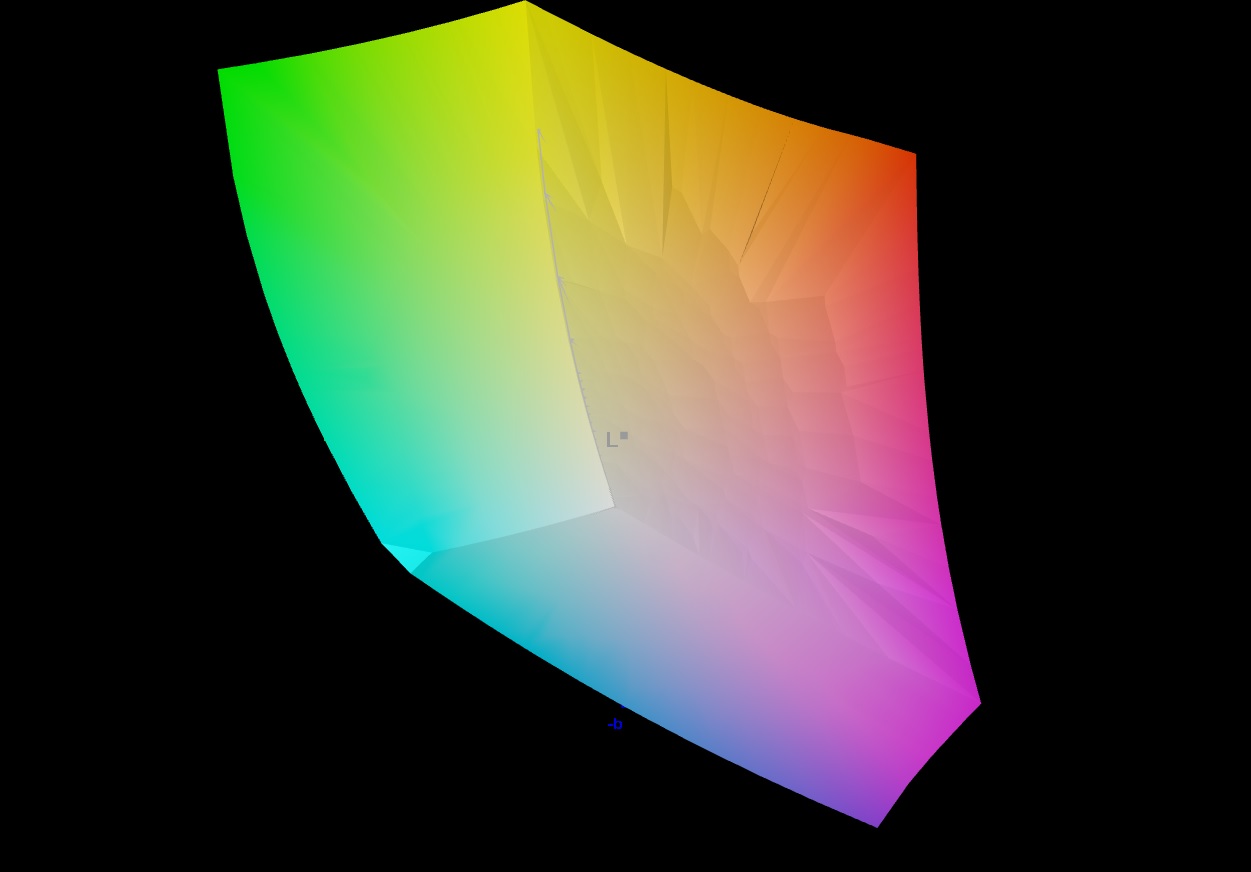
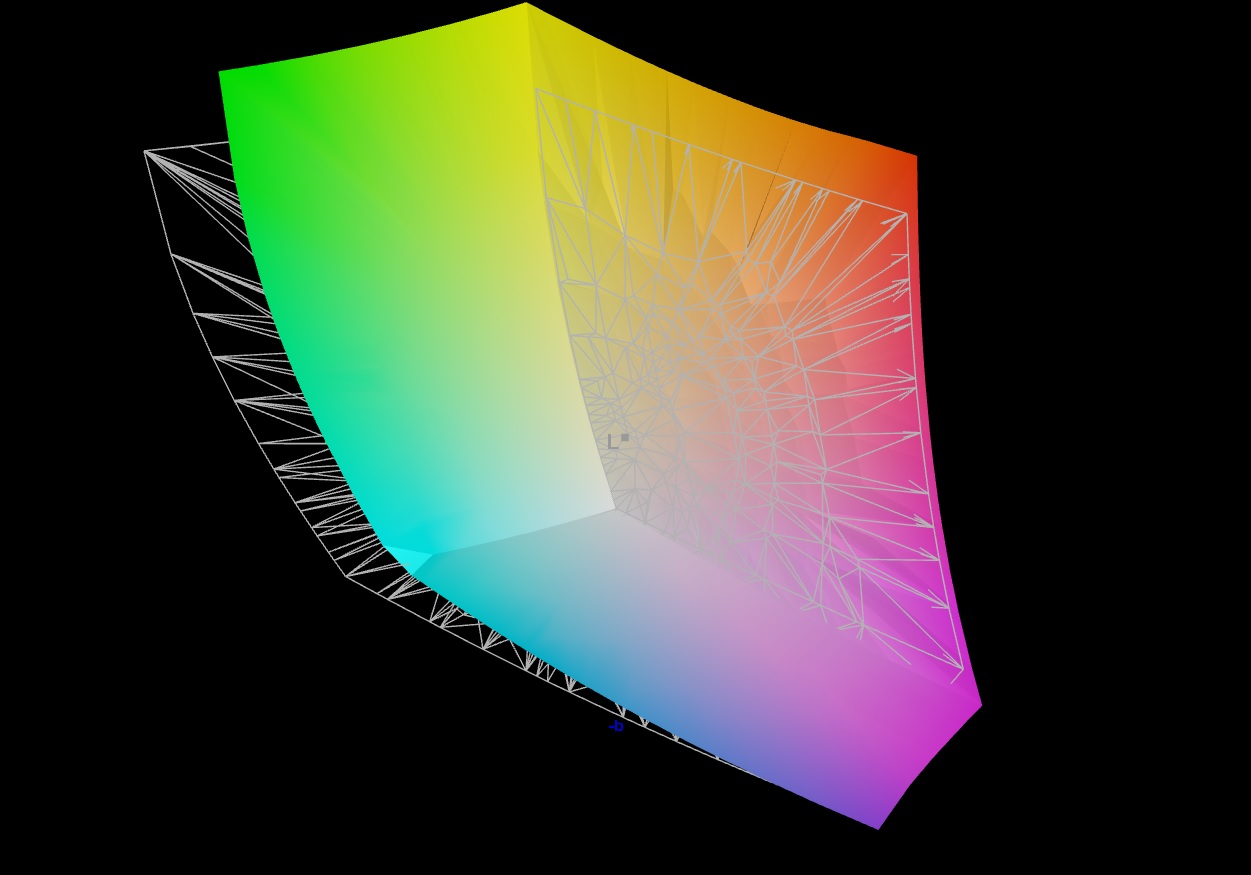
Wyświetlacz
Model AMD jest wyposażony w ten sam wyświetlacz QHD, co wersja Intela, co cieszy nas ze względu na dobre wyniki pomiarów i wartości obrazu.
| |||||||||||||||||||||||||
rozświetlenie: 88 %
na akumulatorze: 350 cd/m²
kontrast: 1000:1 (czerń: 0.35 cd/m²)
ΔE ColorChecker Calman: 2.03 | ∀{0.5-29.43 Ø4.72}
calibrated: 0.56
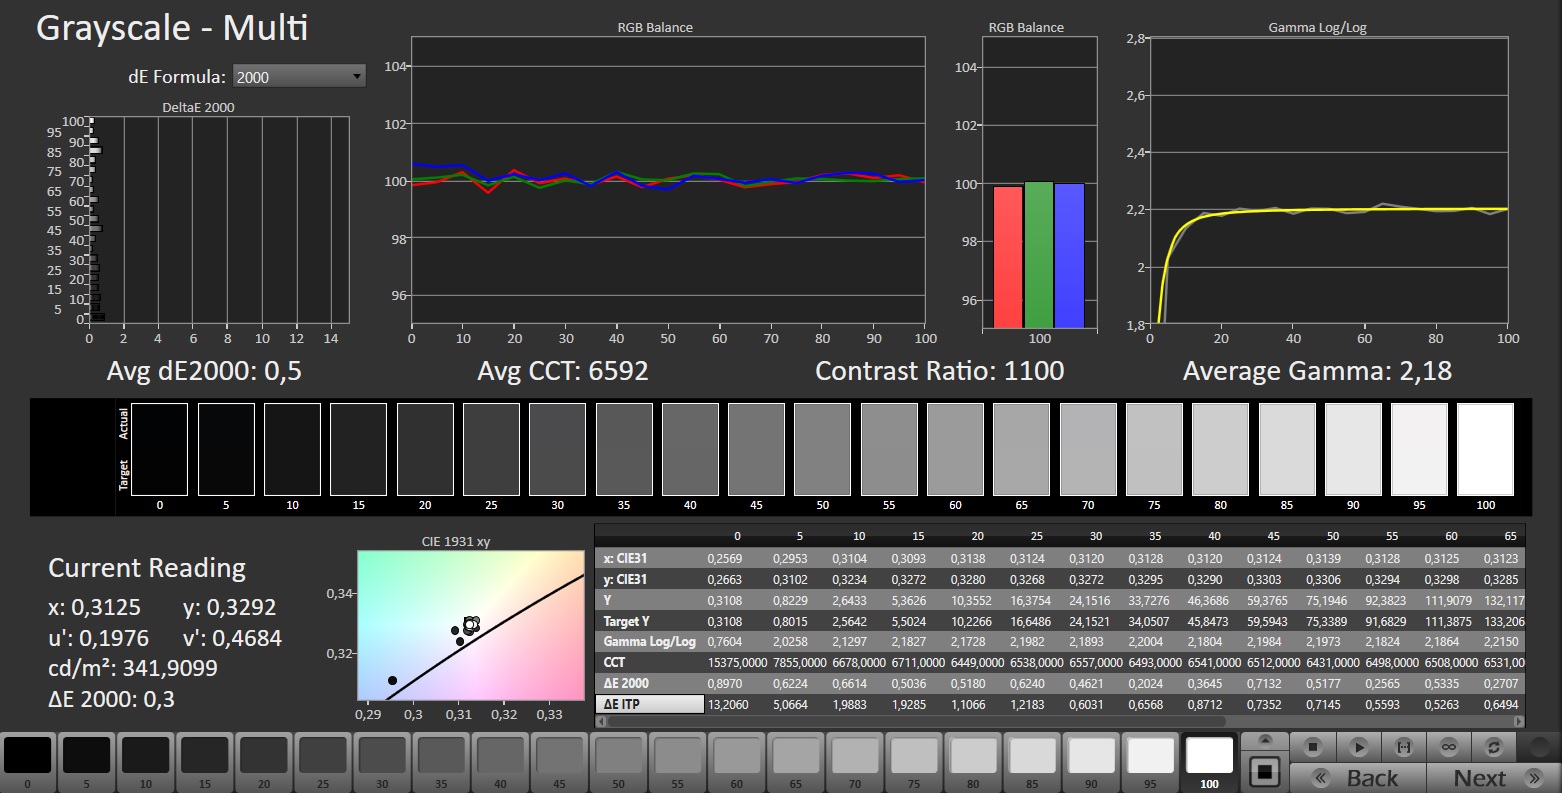
ΔE Greyscale Calman: 2.4 | ∀{0.09-98 Ø4.97}
86% AdobeRGB 1998 (Argyll 3D)
100% sRGB (Argyll 3D)
98% Display P3 (Argyll 3D)
Gamma: 2.071
CCT: 6961 K
| Acer Nitro 17 AN17-41-R9LN NE173QHM-NY6 (BOE0B7C), IPS, 2560x1440, 17.3" | Acer Nitro 17 AN17-51-71ER BOE0B7C NE173QHM-NY6, , 2560x1440, 17.3" | MSI Pulse 17 B13VGK AU Optronics B173HAN04.9, IPS, 1920x1080, 17.3" | Schenker XMG Focus 17 (E23) BOE09F9 NE173QHM-NZ1, IPS, 2560x1440, 17.3" | Asus ROG Strix G17 G713PI BOE0B69, IPS, 2560x1440, 17.3" | |
|---|---|---|---|---|---|
| Display | 0% | -53% | -1% | 0% | |
| Display P3 Coverage (%) | 98 | 98.3 0% | 38.4 -61% | 96.6 -1% | 98.3 0% |
| sRGB Coverage (%) | 100 | 100 0% | 57.5 -43% | 99.9 0% | 100 0% |
| AdobeRGB 1998 Coverage (%) | 86 | 85.7 0% | 39.7 -54% | 84.5 -2% | 85.9 0% |
| Response Times | 2% | -146% | -21% | 32% | |
| Response Time Grey 50% / Grey 80% * (ms) | 14.3 ? | 14.8 ? -3% | 31.2 ? -118% | 16.4 ? -15% | 5.3 ? 63% |
| Response Time Black / White * (ms) | 8.6 ? | 8 ? 7% | 23.6 ? -174% | 10.8 ? -26% | 8.6 ? -0% |
| PWM Frequency (Hz) | |||||
| Screen | -86% | -112% | -7% | 11% | |
| Brightness middle (cd/m²) | 350 | 361 3% | 254 -27% | 349 0% | 327 -7% |
| Brightness (cd/m²) | 337 | 326 -3% | 250 -26% | 318 -6% | 320 -5% |
| Brightness Distribution (%) | 88 | 87 -1% | 91 3% | 82 -7% | 89 1% |
| Black Level * (cd/m²) | 0.35 | 0.6 -71% | 0.14 60% | 0.56 -60% | 0.38 -9% |
| Contrast (:1) | 1000 | 602 -40% | 1814 81% | 623 -38% | 861 -14% |
| Colorchecker dE 2000 * | 2.03 | 3.83 -89% | 4.52 -123% | 1.08 47% | 1.01 50% |
| Colorchecker dE 2000 max. * | 5.02 | 5.71 -14% | 21.22 -323% | 3.05 39% | 4.01 20% |
| Colorchecker dE 2000 calibrated * | 0.56 | 3.48 -521% | 4.52 -707% | 1.08 -93% | 0.41 27% |
| Greyscale dE 2000 * | 2.4 | 3.29 -37% | 1 58% | 1.14 52% | 1.6 33% |
| Gamma | 2.071 106% | 2.29 96% | 2.44 90% | 2.41 91% | 2.168 101% |
| CCT | 6961 93% | 6679 97% | 6502 100% | 6687 97% | 6659 98% |
| Całkowita średnia (program / ustawienia) | -28% /
-55% | -104% /
-104% | -10% /
-8% | 14% /
11% |
* ... im mniej tym lepiej
Jego panel IPS może nie być najjaśniejszy przy średnio 337 cd/m², ale tak długo, jak pozostajesz w pomieszczeniu, jego poziomy jasności są w porządku. Czasy reakcji, wartość czerni (0,35 cd/m²) i kontrast (1.000:1) również okazują się nie być powodem, dla którego laptop ukrywa się przed konkurencją - choć wciąż jest trochę miejsca na poprawę.
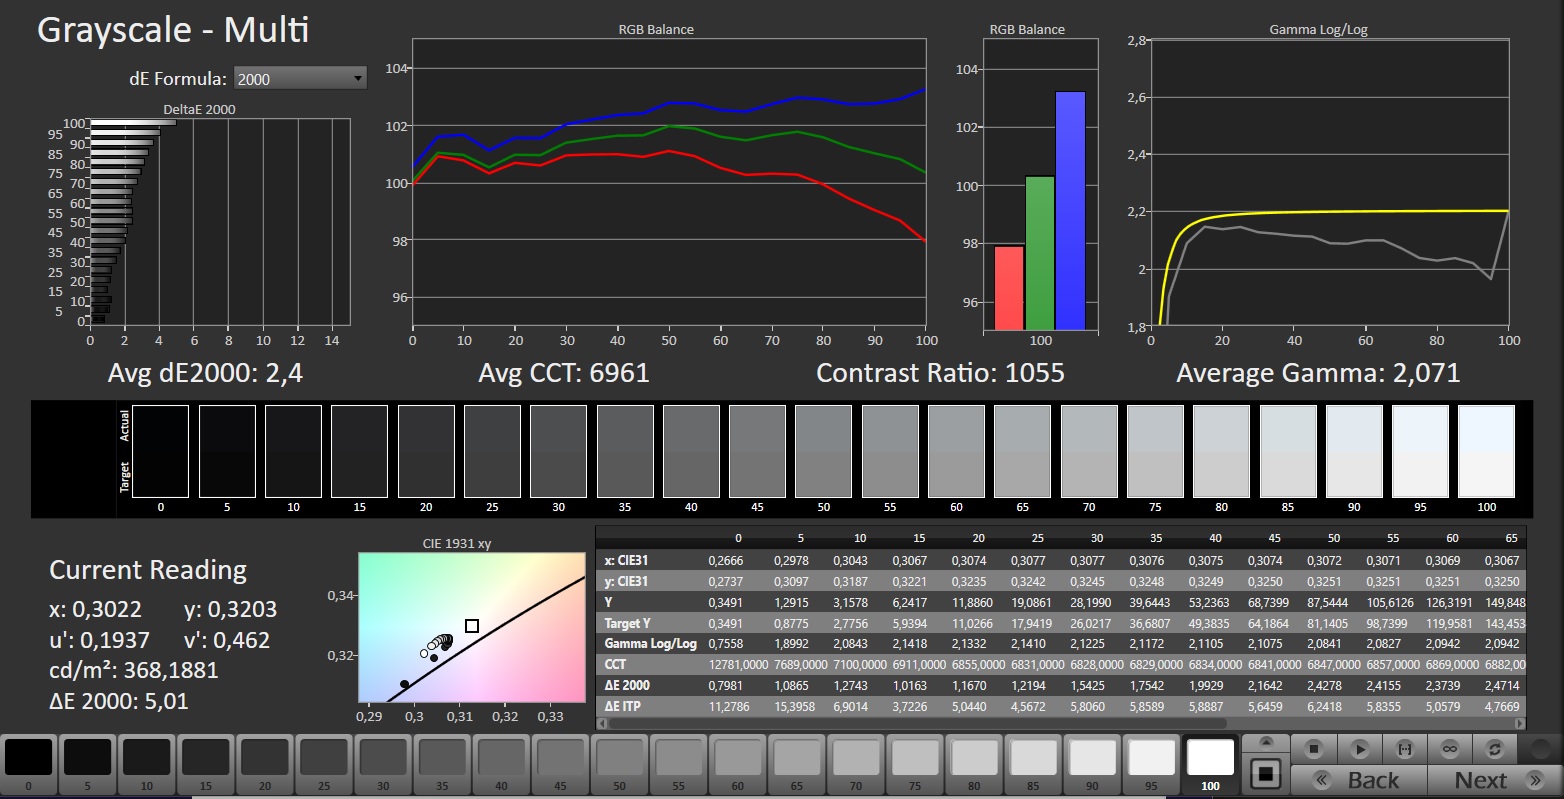
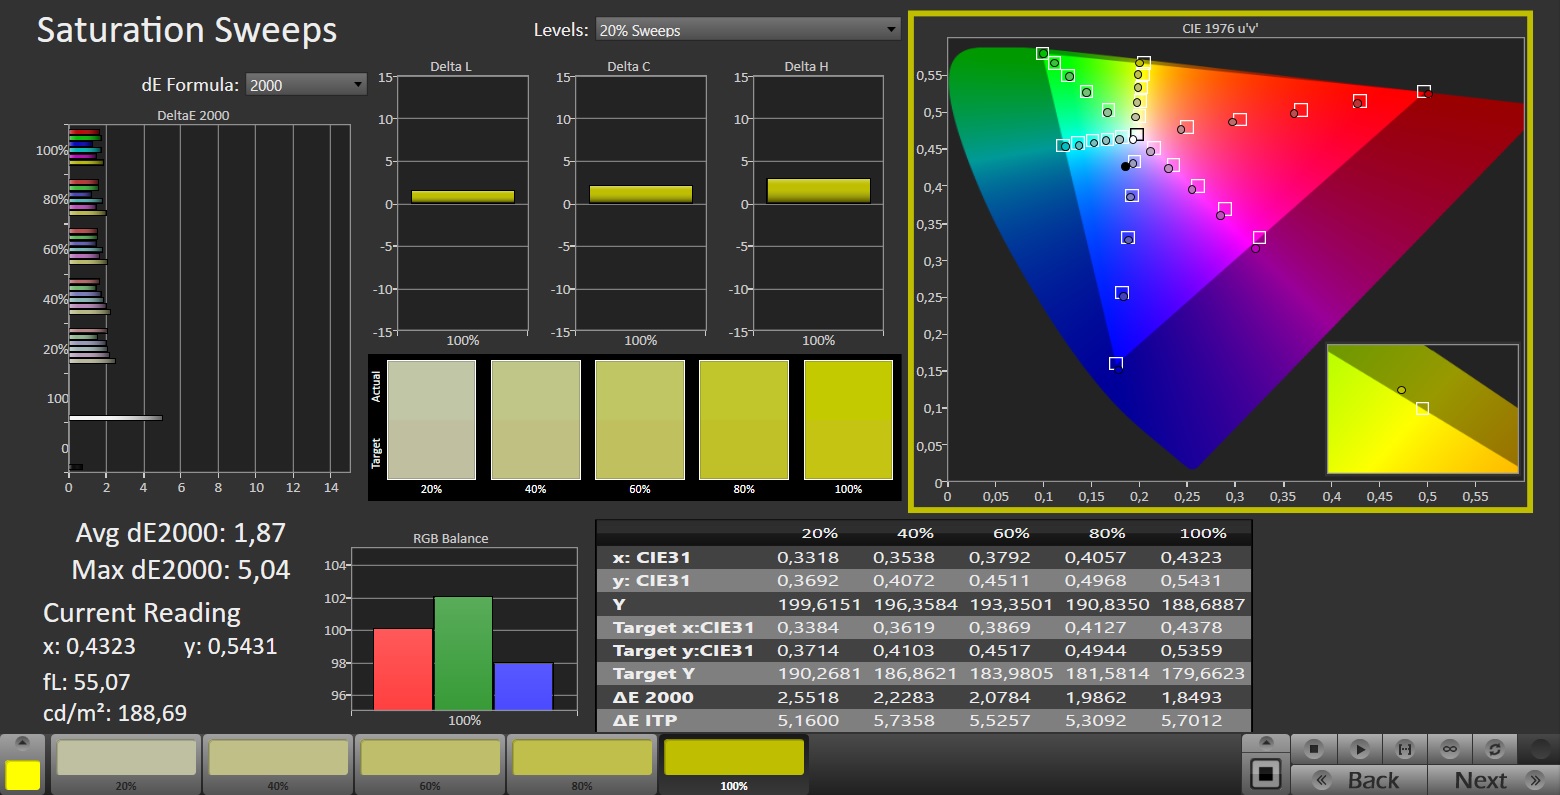
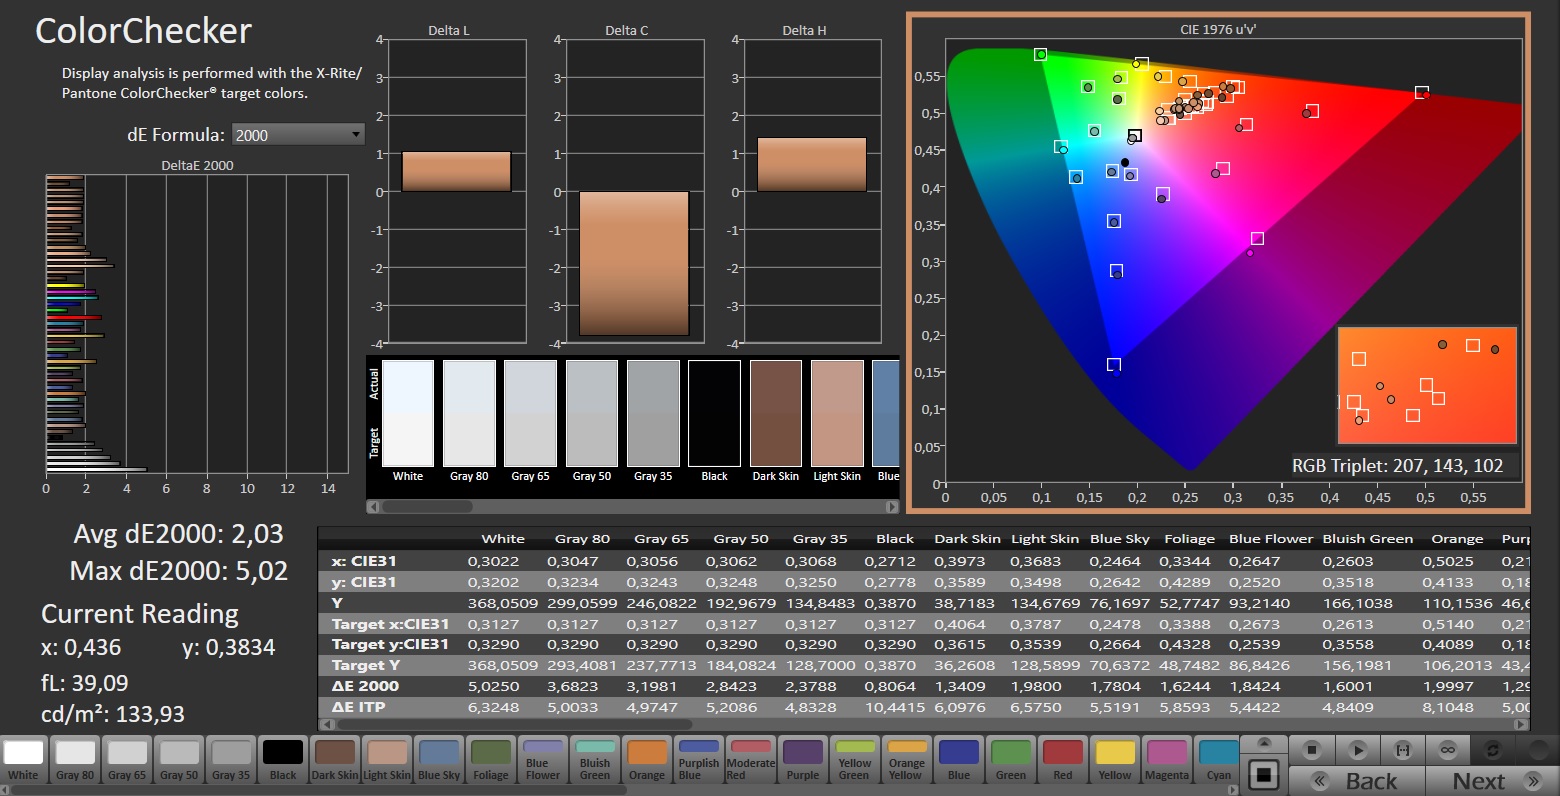
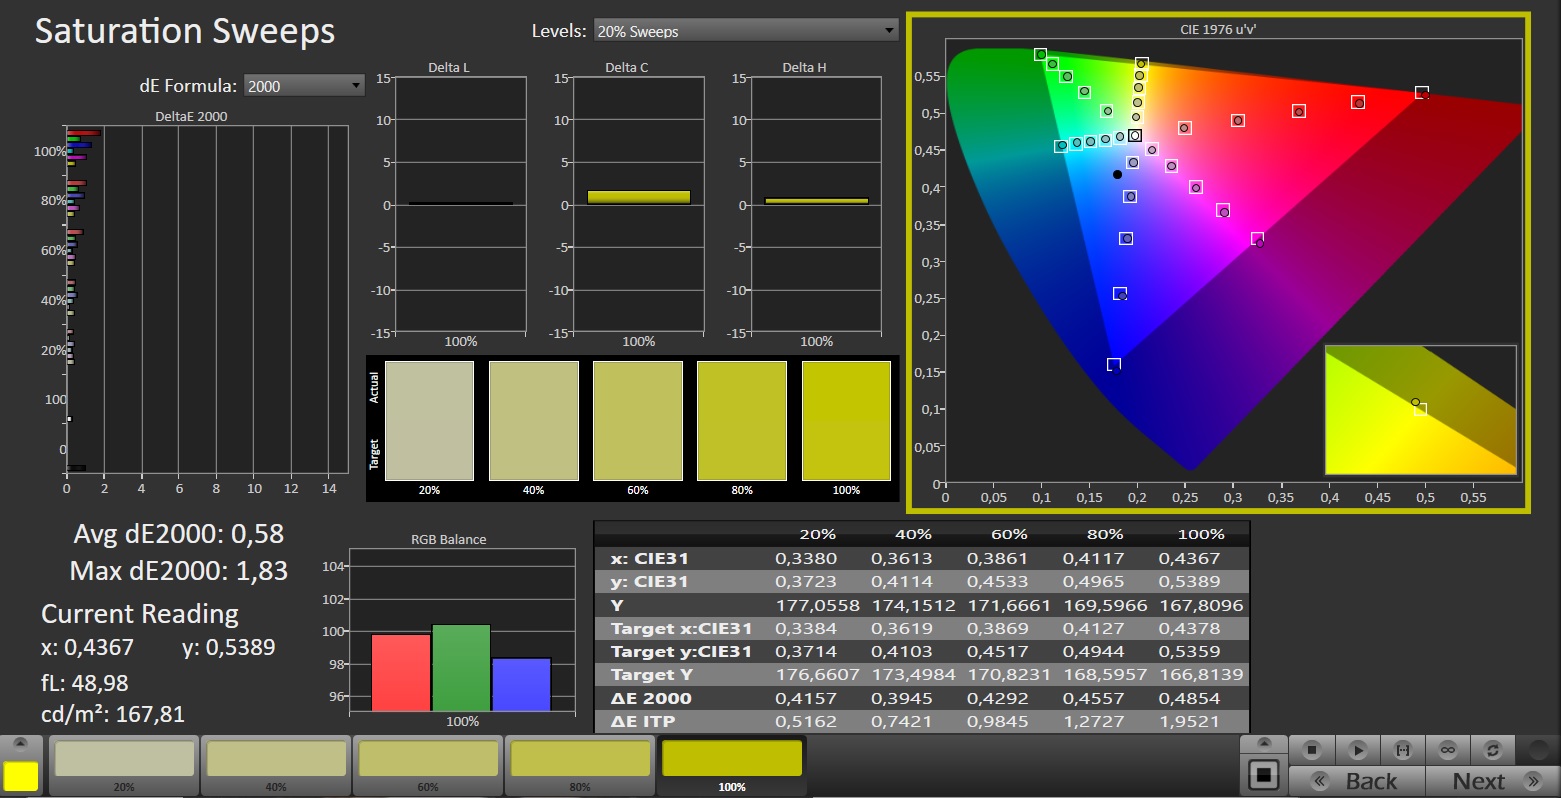
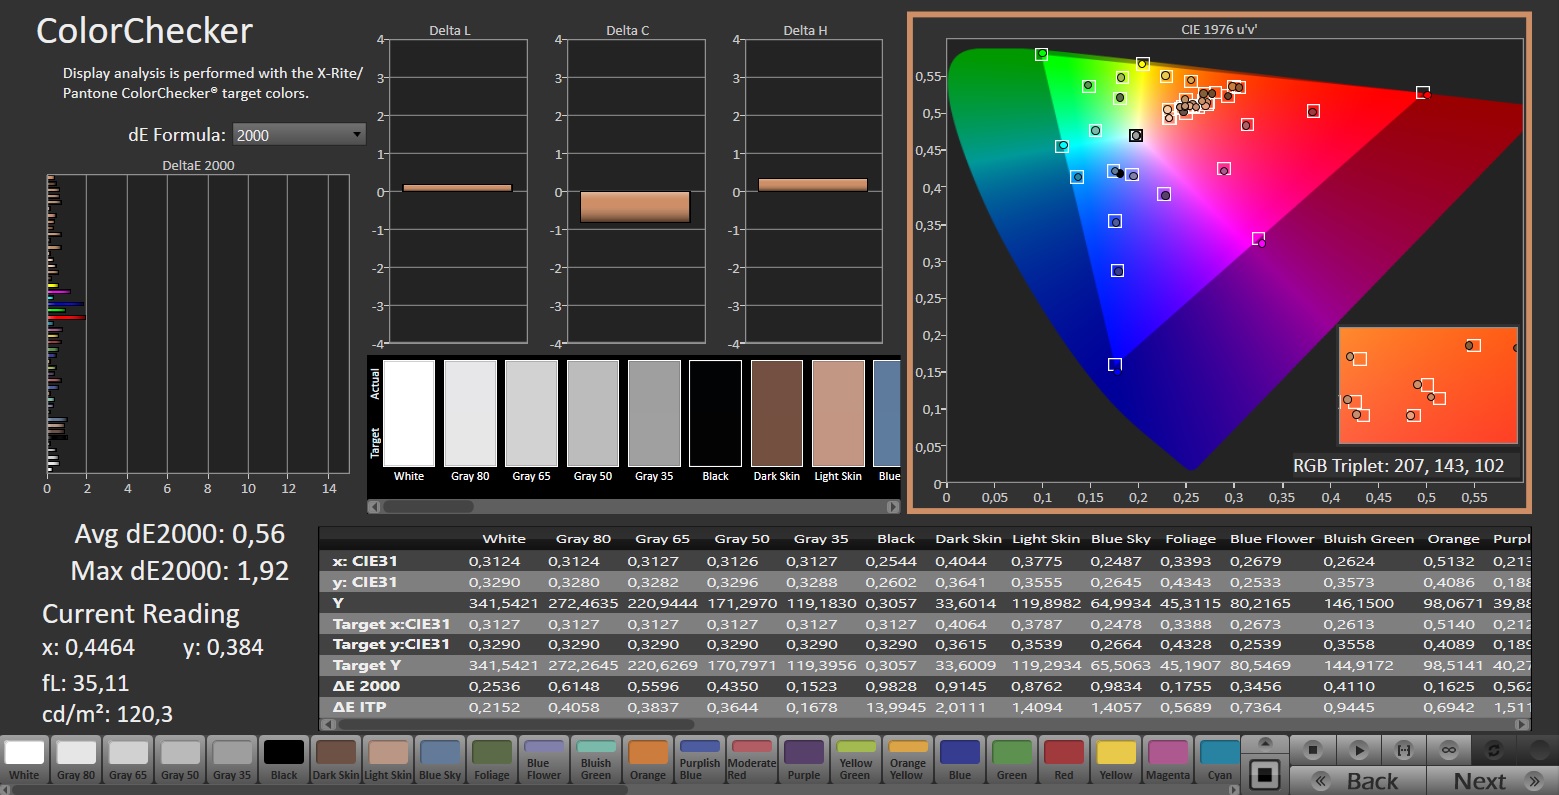
Jak na laptop do gier, jego przestrzenie kolorów (100% sRGB, 98% P3 i 86% AdobeRGB) są niezwykle dobre. Jego dokładność kolorów jest również dobra i nie wymaga dużej kalibracji.

Kąty widzenia laptopa są typowe dla panelu IPS, więc całkiem dobre. Niestety, nasze urządzenie testowe miało pewien problem z krwawieniem ekranu wzdłuż krawędzi wyświetlacza.
Wyświetl czasy reakcji
| ↔ Czas reakcji od czerni do bieli | ||
|---|---|---|
| 8.6 ms ... wzrost ↗ i spadek ↘ łącznie | ↗ 3.8 ms wzrost | 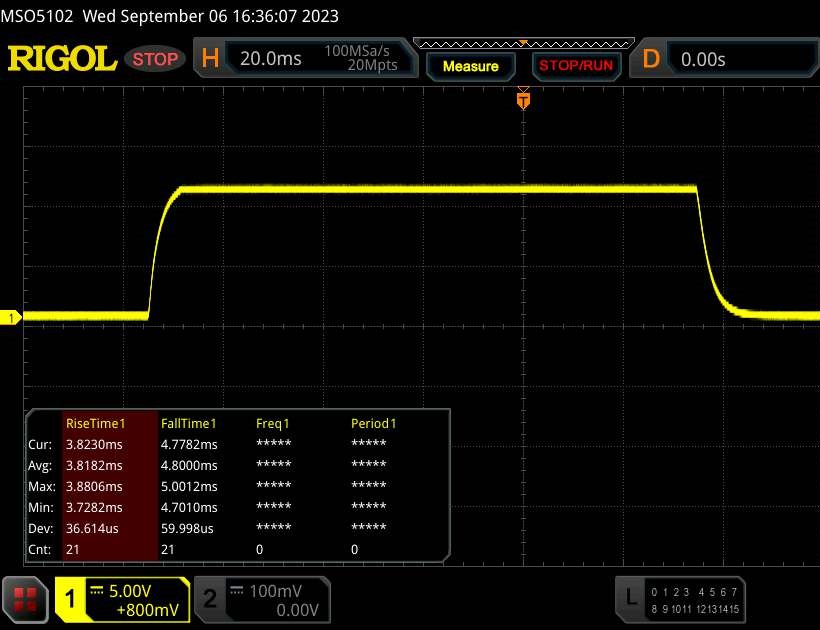 |
| ↘ 4.8 ms upadek | ||
| W naszych testach ekran wykazuje szybki czas reakcji i powinien nadawać się do gier. Dla porównania, wszystkie testowane urządzenia wahają się od 0.1 (minimum) do 240 (maksimum) ms. » 24 % wszystkich urządzeń jest lepszych. Oznacza to, że zmierzony czas reakcji jest lepszy od średniej wszystkich testowanych urządzeń (19.8 ms). | ||
| ↔ Czas reakcji 50% szarości do 80% szarości | ||
| 14.3 ms ... wzrost ↗ i spadek ↘ łącznie | ↗ 7.1 ms wzrost | 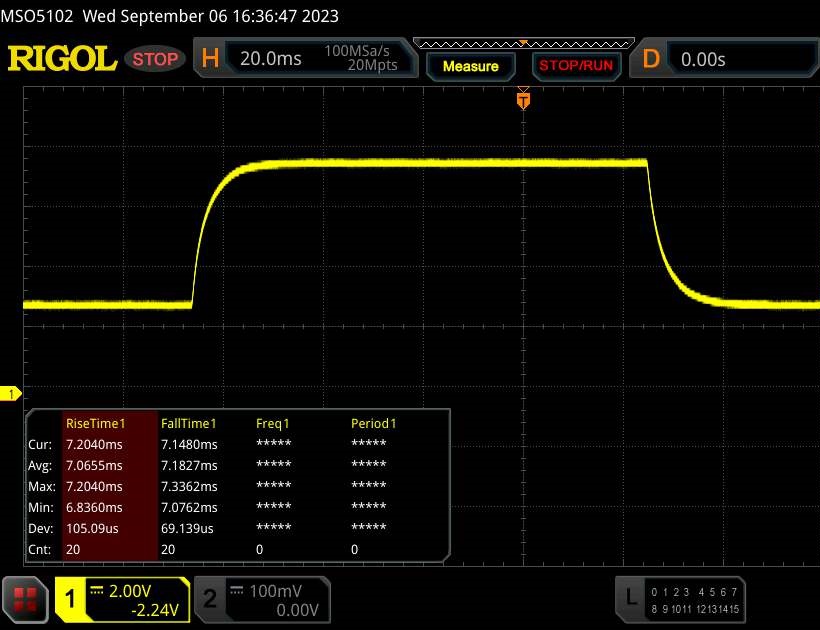 |
| ↘ 7.2 ms upadek | ||
| W naszych testach ekran wykazuje dobry współczynnik reakcji, ale może być zbyt wolny dla graczy rywalizujących ze sobą. Dla porównania, wszystkie testowane urządzenia wahają się od 0.165 (minimum) do 636 (maksimum) ms. » 28 % wszystkich urządzeń jest lepszych. Oznacza to, że zmierzony czas reakcji jest lepszy od średniej wszystkich testowanych urządzeń (31 ms). | ||
Migotanie ekranu / PWM (modulacja szerokości impulsu)
| Migotanie ekranu/nie wykryto PWM |  | ||
Dla porównania: 52 % wszystkich testowanych urządzeń nie używa PWM do przyciemniania wyświetlacza. Jeśli wykryto PWM, zmierzono średnio 7763 (minimum: 5 - maksimum: 343500) Hz. | |||
Wydajność
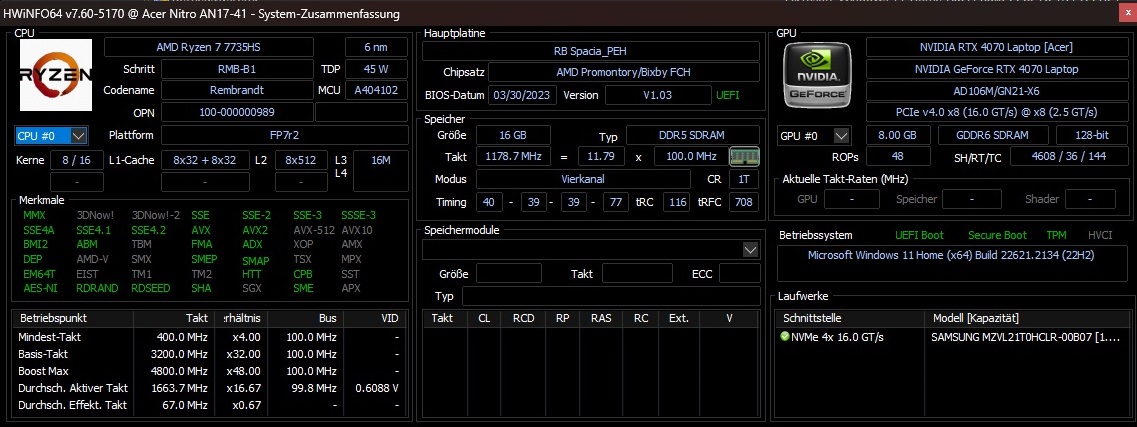
ChociażRyzen 7 7735HSmusi zadowolić się starszą architekturą Zen 3+ (niektóre modele 7000 już polegają na Zen 4), nadal zaliczylibyśmy Nitro 17 AN17-41-R9LN do wyższej klasy średniej. Jego 16 GB pamięci RAM i 1 TB SSD nie są już atrakcją w 2023 roku, ale nadal są wystarczające.
Warunki testowania
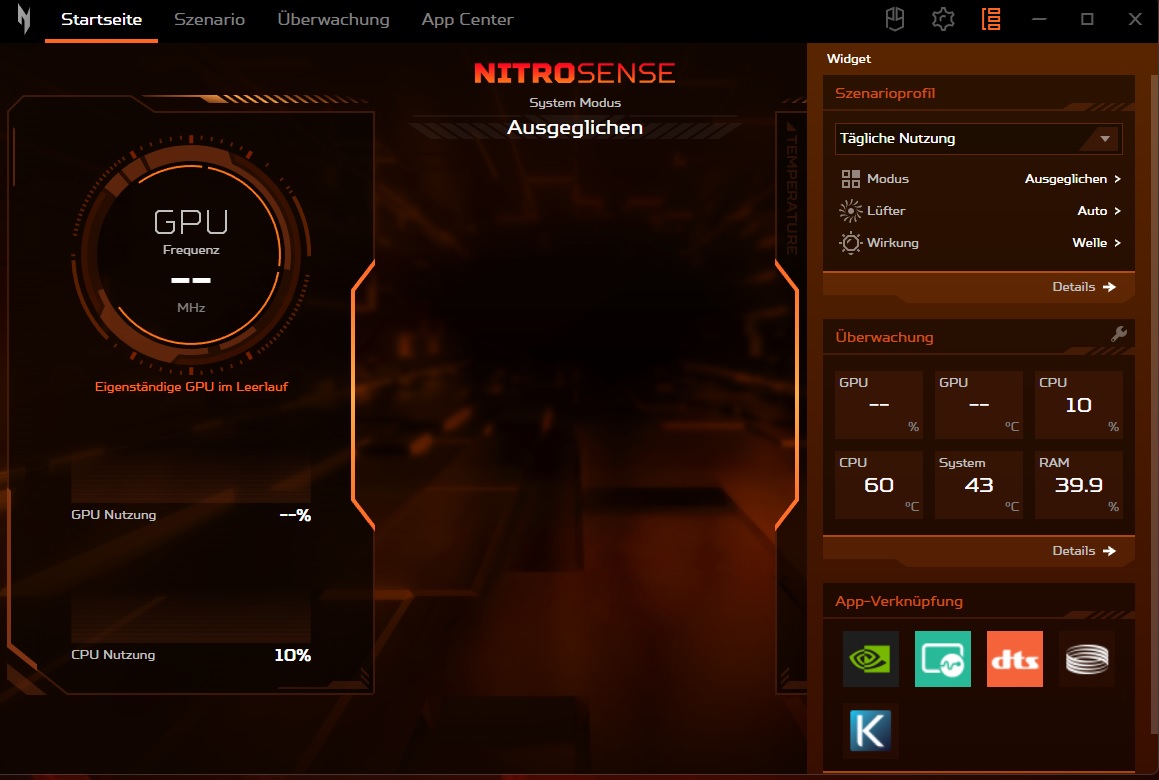
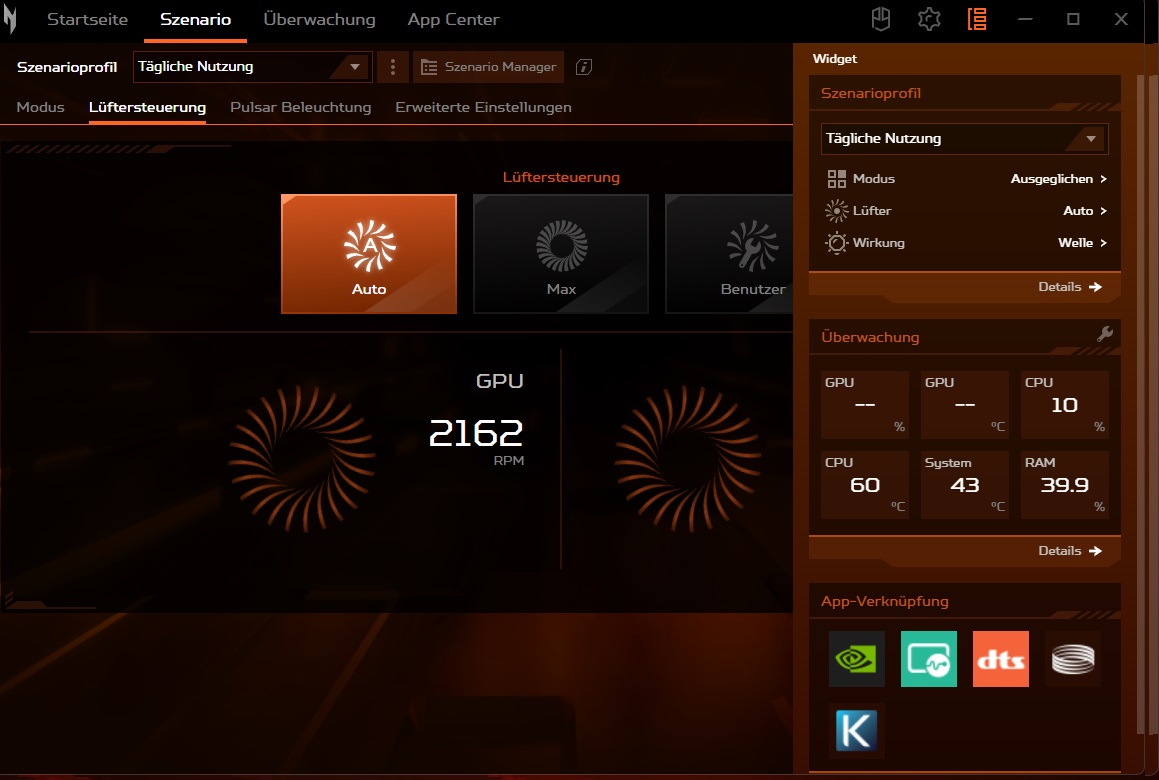
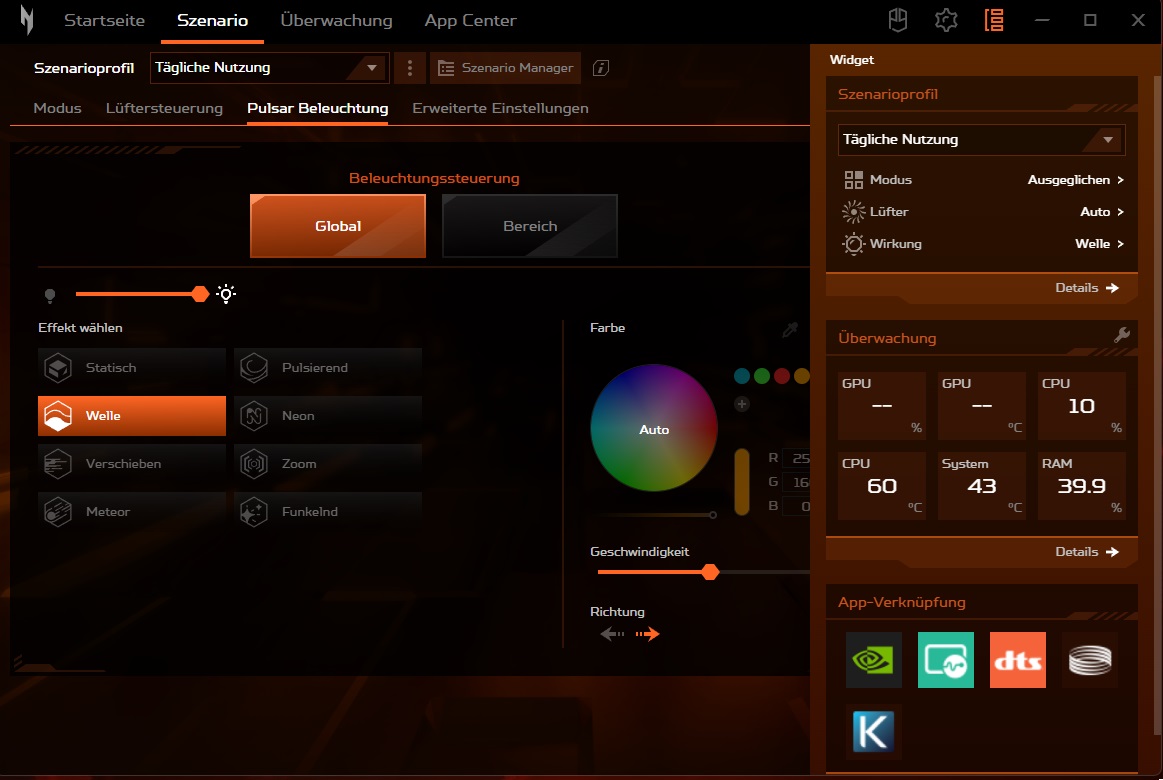
Acer preinstalował narzędzie o nazwie Nitro Sense, za pomocą którego można wprowadzać liczne zmiany w systemie (np. podświetlenie klawiatury). Różne tryby wydajności są szczególnie ważne w codziennym użytkowaniu. Ponieważ nie można było określić rzeczywistego wzrostu liczby klatek na sekundę w aplikacjach 3D, ale emisja hałasu znacznie wzrosła, wszystkie pomiary przeprowadziliśmy w trybie zrównoważonym - który reprezentuje "sweet spot", że tak powiem. Sterowanie wentylatorem zawsze odbywało się w trybie automatycznym.
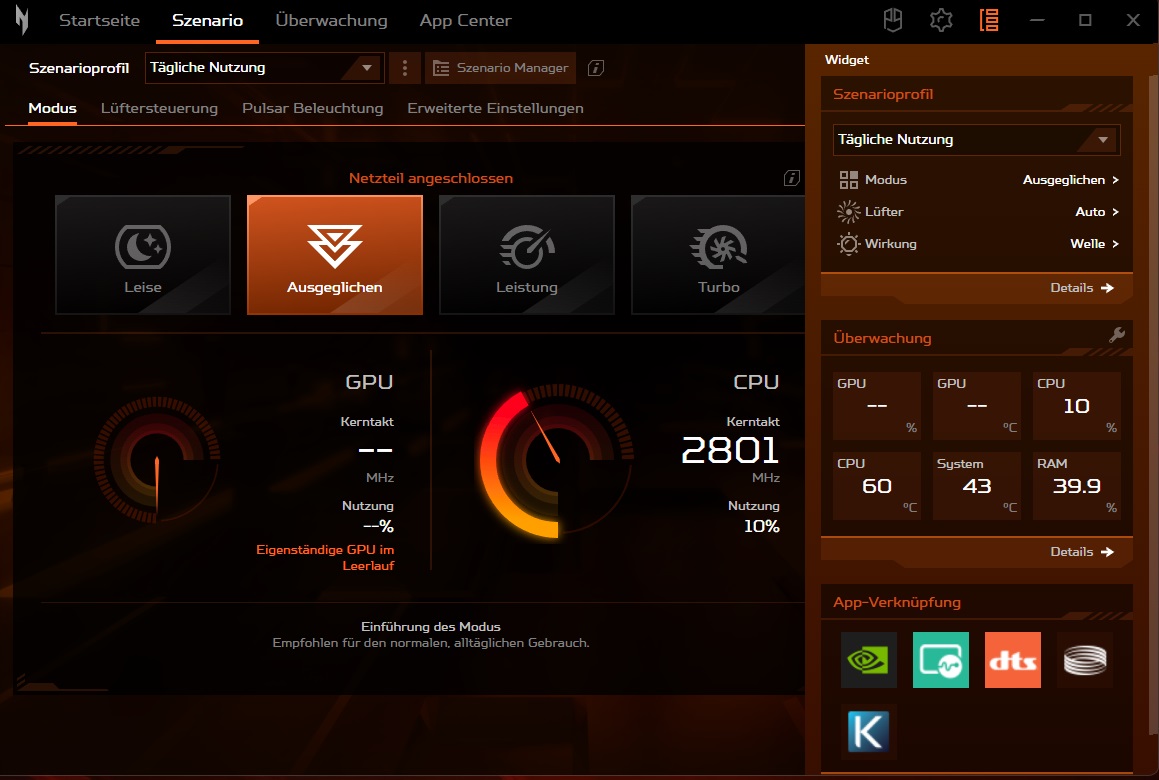
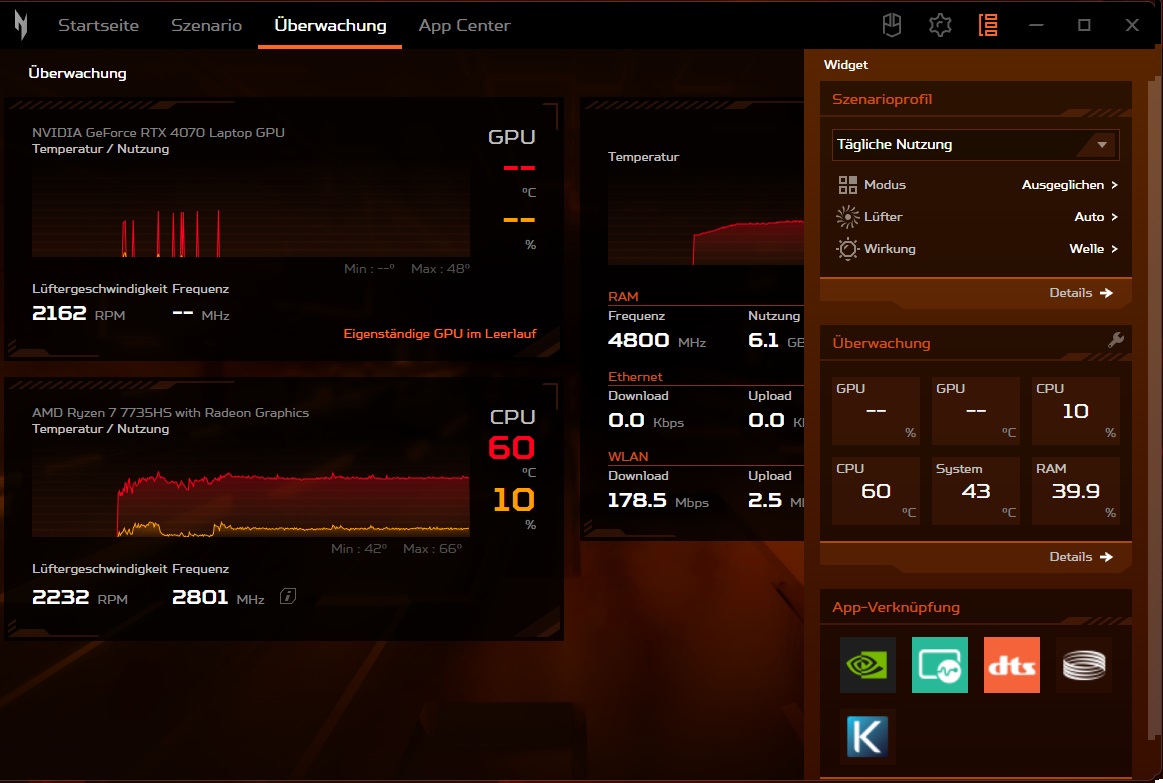
| Witcher 3 (FHD/Ultra) | Cichy | Zrównoważony | Wydajność | Turbo |
|---|---|---|---|---|
| Wydajność | 60-100 fps | ~110 fps | ~111 fps | ~112 fps |
| Hałas | ~38 dB(A) | ~44 dB(A) | ~54 dB(A) | ~61 dB(A) |
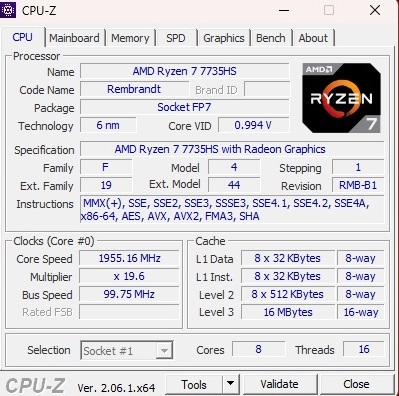
Procesor
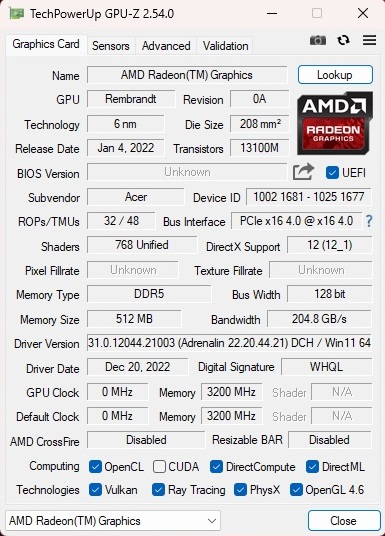
Ryzen 7 7735HS to ośmiordzeniowy procesor, który posiada 16 MB pamięci podręcznej L3 i może przetwarzać do 16 wątków jednocześnie dzięki technologii SMT. AMD wskazało, że model wykonany w technologii 6 nm ma częstotliwość taktowania od 3,2 do 4,75 GHz pod obciążeniem, co nie jest ani mało, ani dużo. Jedną z jego największych zalet jest stosunkowo wydajne iGPU. Podczas niewymagających zadań (urządzenie obsługuje Advanced Optimus), tylkoRadeon 680M wbudowany w procesor, który może konkurować ze starszymi układami graficznymi klasy podstawowej i częściowo średniej.
W benchmarkach Ryzen 7 7735HS wypadł dobrze, ale nie nadzwyczajnie. Jego wydajność była (zgodnie z oczekiwaniami) nieco gorsza od (droższego) konkurenta Intela, Core i7-13700H, który posiada 14 rdzeni i może przetwarzać 20 wątków jednocześnie. W porównaniu doCore i9-13900HXlubRyzen 9 7945HXz architekturą Zen 4, 7735HS nie miał szans i wypadł nieco gorzej. Mimo to wydajność procesora pozostała bardzo spójna zgodnie z naszą pętlą Cinebench - nie można tego powiedzieć o wszystkich innych laptopach.
Cinebench R15 Multi continuous test
* ... im mniej tym lepiej
AIDA64: FP32 Ray-Trace | FPU Julia | CPU SHA3 | CPU Queen | FPU SinJulia | FPU Mandel | CPU AES | CPU ZLib | FP64 Ray-Trace | CPU PhotoWorxx
| Performance rating | |
| Asus ROG Strix G17 G713PI | |
| Średnia w klasie Gaming | |
| Schenker XMG Focus 17 (E23) | |
| Acer Nitro 17 AN17-51-71ER | |
| MSI Pulse 17 B13VGK | |
| Acer Nitro 17 AN17-41-R9LN | |
| Przeciętny AMD Ryzen 7 7735HS | |
| AIDA64 / FP32 Ray-Trace | |
| Asus ROG Strix G17 G713PI | |
| Średnia w klasie Gaming (10227 - 85542, n=106, ostatnie 2 lata) | |
| Schenker XMG Focus 17 (E23) | |
| MSI Pulse 17 B13VGK | |
| Acer Nitro 17 AN17-51-71ER | |
| Acer Nitro 17 AN17-41-R9LN | |
| Przeciętny AMD Ryzen 7 7735HS (11831 - 17161, n=16) | |
| AIDA64 / FPU Julia | |
| Asus ROG Strix G17 G713PI | |
| Średnia w klasie Gaming (51376 - 238426, n=106, ostatnie 2 lata) | |
| Schenker XMG Focus 17 (E23) | |
| Acer Nitro 17 AN17-41-R9LN | |
| Przeciętny AMD Ryzen 7 7735HS (75370 - 105483, n=16) | |
| MSI Pulse 17 B13VGK | |
| Acer Nitro 17 AN17-51-71ER | |
| AIDA64 / CPU SHA3 | |
| Asus ROG Strix G17 G713PI | |
| Średnia w klasie Gaming (2180 - 9817, n=106, ostatnie 2 lata) | |
| Schenker XMG Focus 17 (E23) | |
| Acer Nitro 17 AN17-51-71ER | |
| MSI Pulse 17 B13VGK | |
| Acer Nitro 17 AN17-41-R9LN | |
| Przeciętny AMD Ryzen 7 7735HS (2499 - 3494, n=16) | |
| AIDA64 / CPU Queen | |
| Asus ROG Strix G17 G713PI | |
| Schenker XMG Focus 17 (E23) | |
| Średnia w klasie Gaming (49785 - 173351, n=94, ostatnie 2 lata) | |
| Acer Nitro 17 AN17-41-R9LN | |
| Acer Nitro 17 AN17-51-71ER | |
| Przeciętny AMD Ryzen 7 7735HS (87486 - 108729, n=15) | |
| MSI Pulse 17 B13VGK | |
| AIDA64 / FPU SinJulia | |
| Asus ROG Strix G17 G713PI | |
| Średnia w klasie Gaming (4424 - 33636, n=106, ostatnie 2 lata) | |
| Schenker XMG Focus 17 (E23) | |
| Acer Nitro 17 AN17-41-R9LN | |
| Przeciętny AMD Ryzen 7 7735HS (11233 - 13097, n=16) | |
| MSI Pulse 17 B13VGK | |
| Acer Nitro 17 AN17-51-71ER | |
| AIDA64 / FPU Mandel | |
| Asus ROG Strix G17 G713PI | |
| Średnia w klasie Gaming (25115 - 128721, n=106, ostatnie 2 lata) | |
| Acer Nitro 17 AN17-41-R9LN | |
| Schenker XMG Focus 17 (E23) | |
| Przeciętny AMD Ryzen 7 7735HS (41400 - 58232, n=16) | |
| MSI Pulse 17 B13VGK | |
| Acer Nitro 17 AN17-51-71ER | |
| AIDA64 / CPU AES | |
| Asus ROG Strix G17 G713PI | |
| Acer Nitro 17 AN17-51-71ER | |
| Średnia w klasie Gaming (39258 - 247074, n=106, ostatnie 2 lata) | |
| Schenker XMG Focus 17 (E23) | |
| MSI Pulse 17 B13VGK | |
| Przeciętny AMD Ryzen 7 7735HS (44013 - 137629, n=16) | |
| Acer Nitro 17 AN17-41-R9LN | |
| AIDA64 / CPU ZLib | |
| Asus ROG Strix G17 G713PI | |
| Schenker XMG Focus 17 (E23) | |
| Średnia w klasie Gaming (574 - 2531, n=106, ostatnie 2 lata) | |
| Acer Nitro 17 AN17-51-71ER | |
| MSI Pulse 17 B13VGK | |
| Acer Nitro 17 AN17-41-R9LN | |
| Przeciętny AMD Ryzen 7 7735HS (651 - 906, n=16) | |
| AIDA64 / FP64 Ray-Trace | |
| Asus ROG Strix G17 G713PI | |
| Średnia w klasie Gaming (5509 - 45446, n=106, ostatnie 2 lata) | |
| Schenker XMG Focus 17 (E23) | |
| MSI Pulse 17 B13VGK | |
| Acer Nitro 17 AN17-51-71ER | |
| Acer Nitro 17 AN17-41-R9LN | |
| Przeciętny AMD Ryzen 7 7735HS (1459 - 9094, n=16) | |
| AIDA64 / CPU PhotoWorxx | |
| Schenker XMG Focus 17 (E23) | |
| Średnia w klasie Gaming (12271 - 89891, n=106, ostatnie 2 lata) | |
| MSI Pulse 17 B13VGK | |
| Acer Nitro 17 AN17-51-71ER | |
| Asus ROG Strix G17 G713PI | |
| Acer Nitro 17 AN17-41-R9LN | |
| Przeciętny AMD Ryzen 7 7735HS (17524 - 30542, n=16) | |
Wydajność systemu
Wydajność systemu laptopa była na tyle dobra, że uplasował się on gdzieś pośrodku wśród porównywanych urządzeń. 7 240 punktów w PCMark 10 sprawia, że jest to zwinny i wszechstronny system.
CrossMark: Overall | Productivity | Creativity | Responsiveness
| PCMark 10 / Score | |
| Średnia w klasie Gaming (5828 - 11574, n=94, ostatnie 2 lata) | |
| MSI Pulse 17 B13VGK | |
| Asus ROG Strix G17 G713PI | |
| Acer Nitro 17 AN17-41-R9LN | |
| Przeciętny AMD Ryzen 7 7735HS, NVIDIA GeForce RTX 4070 Laptop GPU (7220 - 7240, n=2) | |
| Acer Nitro 17 AN17-51-71ER | |
| Schenker XMG Focus 17 (E23) | |
| PCMark 10 / Essentials | |
| Asus ROG Strix G17 G713PI | |
| Acer Nitro 17 AN17-41-R9LN | |
| Średnia w klasie Gaming (8810 - 12600, n=98, ostatnie 2 lata) | |
| Przeciętny AMD Ryzen 7 7735HS, NVIDIA GeForce RTX 4070 Laptop GPU (10579 - 10690, n=2) | |
| MSI Pulse 17 B13VGK | |
| Acer Nitro 17 AN17-51-71ER | |
| Schenker XMG Focus 17 (E23) | |
| PCMark 10 / Productivity | |
| Asus ROG Strix G17 G713PI | |
| Średnia w klasie Gaming (6845 - 21327, n=96, ostatnie 2 lata) | |
| MSI Pulse 17 B13VGK | |
| Schenker XMG Focus 17 (E23) | |
| Przeciętny AMD Ryzen 7 7735HS, NVIDIA GeForce RTX 4070 Laptop GPU (8893 - 9146, n=2) | |
| Acer Nitro 17 AN17-41-R9LN | |
| Acer Nitro 17 AN17-51-71ER | |
| PCMark 10 / Digital Content Creation | |
| Średnia w klasie Gaming (7602 - 19657, n=96, ostatnie 2 lata) | |
| Acer Nitro 17 AN17-51-71ER | |
| MSI Pulse 17 B13VGK | |
| Acer Nitro 17 AN17-41-R9LN | |
| Przeciętny AMD Ryzen 7 7735HS, NVIDIA GeForce RTX 4070 Laptop GPU (10558 - 10834, n=2) | |
| Schenker XMG Focus 17 (E23) | |
| Asus ROG Strix G17 G713PI | |
| CrossMark / Overall | |
| Asus ROG Strix G17 G713PI | |
| Schenker XMG Focus 17 (E23) | |
| Średnia w klasie Gaming (1366 - 2409, n=95, ostatnie 2 lata) | |
| MSI Pulse 17 B13VGK | |
| Acer Nitro 17 AN17-51-71ER | |
| Przeciętny AMD Ryzen 7 7735HS, NVIDIA GeForce RTX 4070 Laptop GPU (n=1) | |
| CrossMark / Productivity | |
| Asus ROG Strix G17 G713PI | |
| Schenker XMG Focus 17 (E23) | |
| Średnia w klasie Gaming (1386 - 2254, n=95, ostatnie 2 lata) | |
| MSI Pulse 17 B13VGK | |
| Acer Nitro 17 AN17-51-71ER | |
| Przeciętny AMD Ryzen 7 7735HS, NVIDIA GeForce RTX 4070 Laptop GPU (n=1) | |
| CrossMark / Creativity | |
| Asus ROG Strix G17 G713PI | |
| Schenker XMG Focus 17 (E23) | |
| Średnia w klasie Gaming (1343 - 2729, n=95, ostatnie 2 lata) | |
| MSI Pulse 17 B13VGK | |
| Acer Nitro 17 AN17-51-71ER | |
| Przeciętny AMD Ryzen 7 7735HS, NVIDIA GeForce RTX 4070 Laptop GPU (n=1) | |
| CrossMark / Responsiveness | |
| MSI Pulse 17 B13VGK | |
| Schenker XMG Focus 17 (E23) | |
| Średnia w klasie Gaming (1226 - 2334, n=95, ostatnie 2 lata) | |
| Asus ROG Strix G17 G713PI | |
| Acer Nitro 17 AN17-51-71ER | |
| Przeciętny AMD Ryzen 7 7735HS, NVIDIA GeForce RTX 4070 Laptop GPU (n=1) | |
| PCMark 10 Score | 7240 pkt. | |
Pomoc | ||
| AIDA64 / Memory Copy | |
| Schenker XMG Focus 17 (E23) | |
| Średnia w klasie Gaming (21750 - 129946, n=106, ostatnie 2 lata) | |
| MSI Pulse 17 B13VGK | |
| Acer Nitro 17 AN17-51-71ER | |
| Asus ROG Strix G17 G713PI | |
| Acer Nitro 17 AN17-41-R9LN | |
| Przeciętny AMD Ryzen 7 7735HS (30324 - 52012, n=16) | |
| AIDA64 / Memory Read | |
| Schenker XMG Focus 17 (E23) | |
| Średnia w klasie Gaming (22956 - 118858, n=106, ostatnie 2 lata) | |
| MSI Pulse 17 B13VGK | |
| Acer Nitro 17 AN17-51-71ER | |
| Asus ROG Strix G17 G713PI | |
| Acer Nitro 17 AN17-41-R9LN | |
| Przeciętny AMD Ryzen 7 7735HS (33938 - 51856, n=16) | |
| AIDA64 / Memory Write | |
| Średnia w klasie Gaming (22297 - 135096, n=106, ostatnie 2 lata) | |
| Schenker XMG Focus 17 (E23) | |
| Acer Nitro 17 AN17-51-71ER | |
| MSI Pulse 17 B13VGK | |
| Asus ROG Strix G17 G713PI | |
| Acer Nitro 17 AN17-41-R9LN | |
| Przeciętny AMD Ryzen 7 7735HS (33175 - 55284, n=16) | |
| AIDA64 / Memory Latency | |
| Acer Nitro 17 AN17-51-71ER | |
| Średnia w klasie Gaming (75.3 - 259, n=106, ostatnie 2 lata) | |
| MSI Pulse 17 B13VGK | |
| Przeciętny AMD Ryzen 7 7735HS (78.2 - 109.8, n=16) | |
| Schenker XMG Focus 17 (E23) | |
| Acer Nitro 17 AN17-41-R9LN | |
| Asus ROG Strix G17 G713PI | |
* ... im mniej tym lepiej
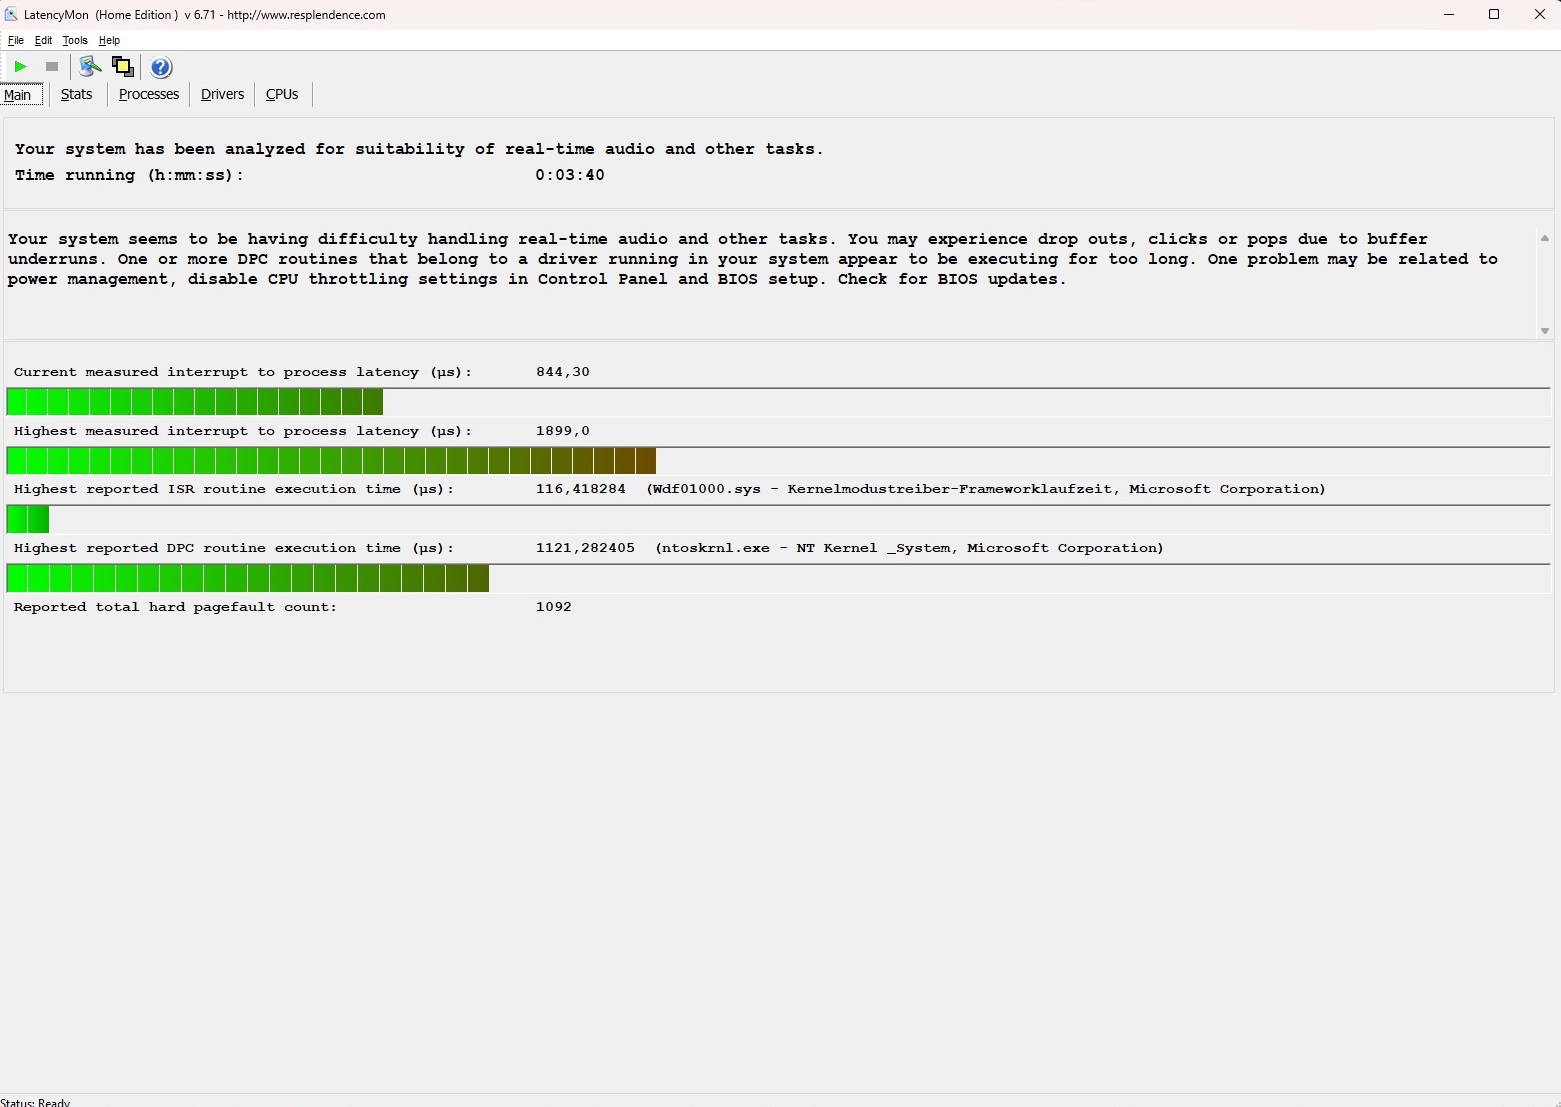
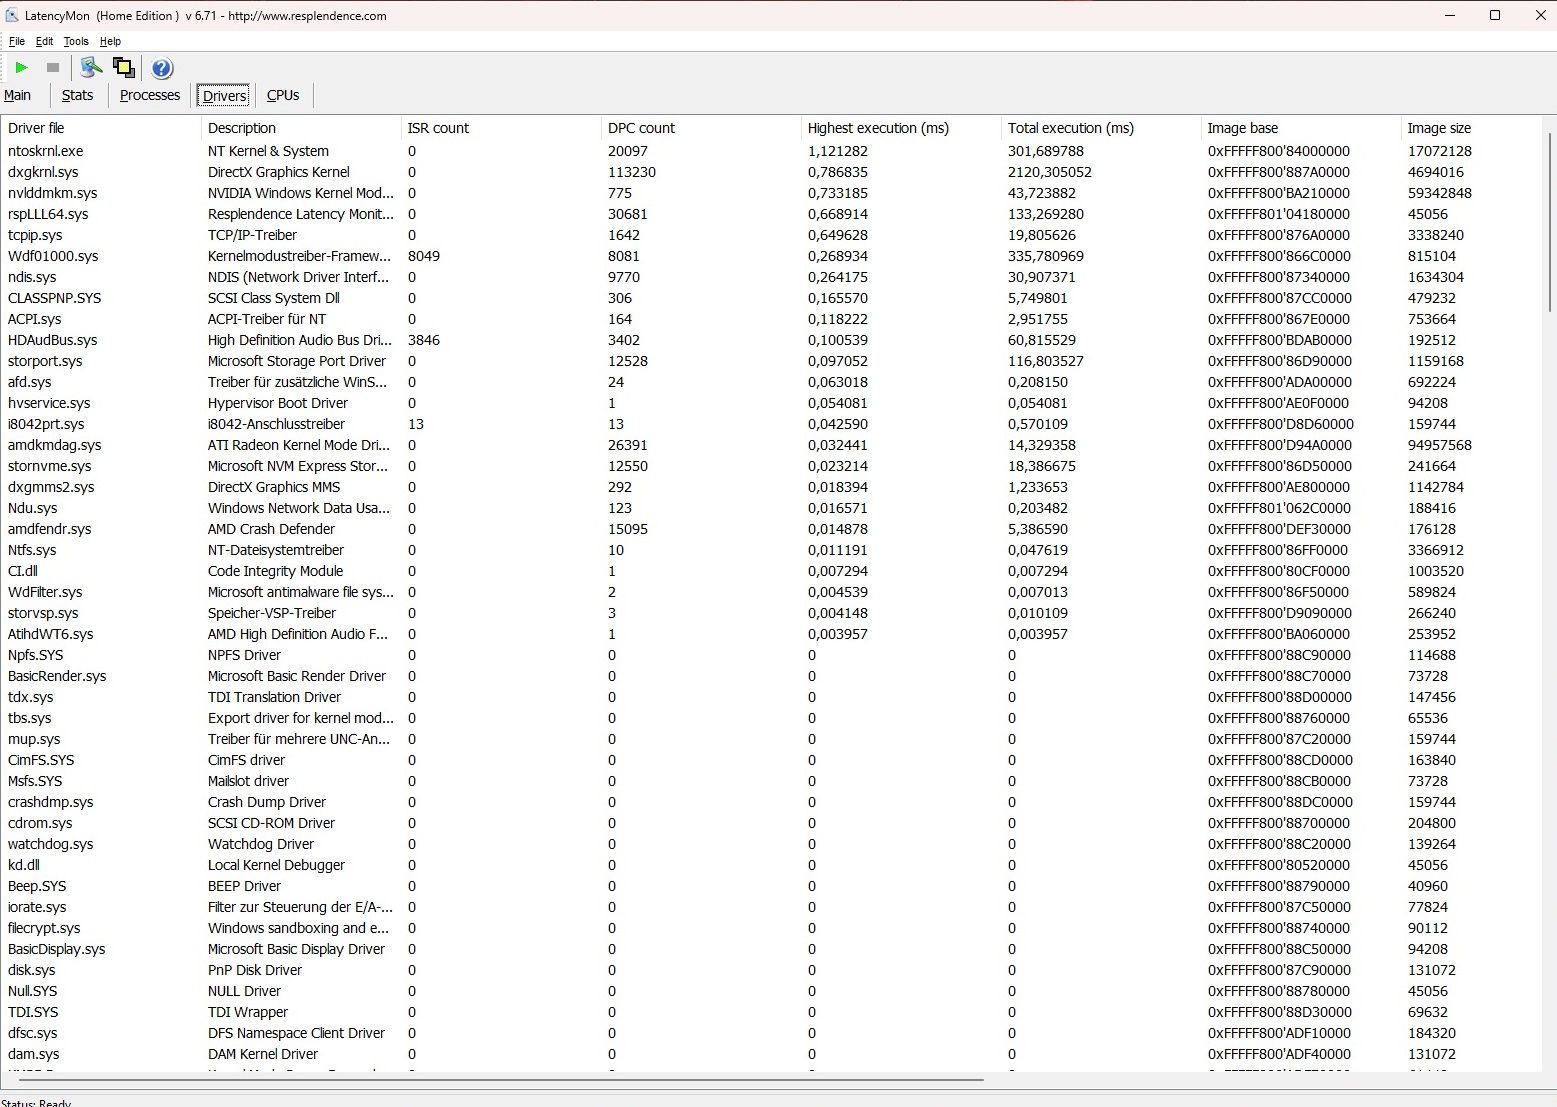
Opóźnienie DPC
Nitro 17 musi zaakceptować krytykę za wysokie opóźnienia. Według narzędzia LatencyMon, laptop tylko warunkowo nadaje się do edycji wideo i audio w czasie rzeczywistym.
| DPC Latencies / LatencyMon - interrupt to process latency (max), Web, Youtube, Prime95 | |
| Acer Nitro 17 AN17-41-R9LN | |
| Asus ROG Strix G17 G713PI | |
| Acer Nitro 17 AN17-51-71ER | |
| MSI Pulse 17 B13VGK | |
| Schenker XMG Focus 17 (E23) | |
* ... im mniej tym lepiej
Urządzenia pamięci masowej
Laptop został wyposażony w dysk NVMe firmy Samsung. Model PM9A1 osiągnął bardzo dobre wyniki w benchmarku AS SSD, a także w szybkości odczytu i zapisu. Niestety, jego wydajność znacznie spadła po pewnym czasie, a następnie pozostała bardzo niestabilna (patrz DiskSpd-Loop).

* ... im mniej tym lepiej
Reading continuous performance: DiskSpd Read Loop, Queue Depth 8
Karta graficzna
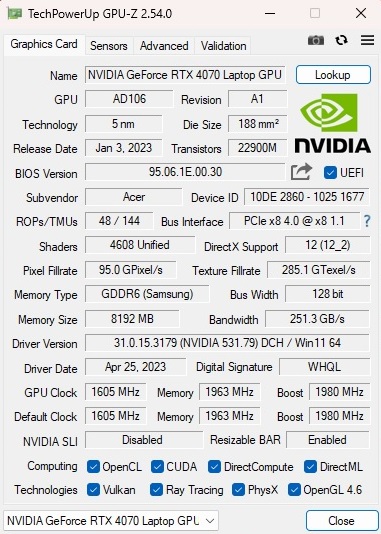
Karta graficzna GeForce RTX 4070 od Nvidii generacji Ada Lovelace zajmuje się złożonymi obliczeniami graficznymi. Ze względu na ograniczoną pamięć RAM (8 GB GDDR6) i stosunkowo wąski interfejs (128 bitów), sklasyfikowalibyśmy ten laptop do gier jako urządzenie z wyższej półki średniej, a nie high-end. RTX 4070 ma TGP na poziomie 140 watów, co jest maksimum dla tego układu graficznego.
Wyniki testów porównawczych były stosunkowo mało spektakularne, ponieważ wydajność GPU Nitro 17 jest mniej więcej taka sama jak średnia RTX 4070. Jego przewaga nad modelem RTX 4060 jest ograniczona, co widać w naszej tabeli.
| 3DMark Performance rating - Percent | |
| Średnia w klasie Gaming | |
| Schenker XMG Focus 17 (E23) -1! | |
| Asus ROG Strix G17 G713PI -1! | |
| MSI Pulse 17 B13VGK | |
| Przeciętny NVIDIA GeForce RTX 4070 Laptop GPU | |
| Acer Nitro 17 AN17-41-R9LN | |
| Acer Nitro 17 AN17-51-71ER -1! | |
| 3DMark 11 Performance | 30265 pkt. | |
| 3DMark Ice Storm Standard Score | 215395 pkt. | |
| 3DMark Cloud Gate Standard Score | 59285 pkt. | |
| 3DMark Fire Strike Score | 25639 pkt. | |
| 3DMark Time Spy Score | 10950 pkt. | |
Pomoc | ||
* ... im mniej tym lepiej
Wydajność w grach
Podobnie sytuacja wygląda w przypadku gier. Tutaj również wydajność była zbliżona do wcześniej ustalonej średniej, a RTX 4070 ledwo radził sobie lepiej niż RTX 4060 w niektórych przypadkach.
| The Witcher 3 - 1920x1080 Ultra Graphics & Postprocessing (HBAO+) | |
| Średnia w klasie Gaming (95 - 240, n=7, ostatnie 2 lata) | |
| Asus ROG Strix G17 G713PI | |
| Schenker XMG Focus 17 (E23) | |
| Przeciętny NVIDIA GeForce RTX 4070 Laptop GPU (69.8 - 133.7, n=57) | |
| Acer Nitro 17 AN17-41-R9LN | |
| MSI Pulse 17 B13VGK | |
| Acer Nitro 17 AN17-51-71ER | |
Jeśli ograniczysz się do rozdzielczości Full HD, tj. 1,920 x 1,080 pikseli, nawet wymagające gry, takie jak Immortals of Aveum, można uruchomić przy maksymalnych detalach i osiągnąć co najmniej 40 FPS. Większość gier działa przy ponad 60 FPS w FHD. RTX 4070 jest również wystarczająco mocny do natywnej rozdzielczości QHD z kilkoma wyjątkami, a częstotliwość odświeżania wyświetlacza 165 Hz jest rzadko wykorzystywana.
| Armored Core 6 - 2560x1440 Maximum Preset | |
| XMG Pro 15 E23 | |
| Przeciętny NVIDIA GeForce RTX 4070 Laptop GPU (76.2 - 85, n=2) | |
| Acer Nitro 17 AN17-41-R9LN | |
| Średnia w klasie Gaming (n=1ostatnie 2 lata) | |
| Immortals of Aveum - 2560x1440 Ultra AF:16x | |
| XMG Pro 15 E23 | |
| Przeciętny NVIDIA GeForce RTX 4070 Laptop GPU (32 - 35, n=2) | |
| Acer Nitro 17 AN17-41-R9LN | |
| Atlas Fallen - 2560x1440 Very High Preset | |
| XMG Pro 15 E23 | |
| Przeciętny NVIDIA GeForce RTX 4070 Laptop GPU (80.6 - 89.5, n=2) | |
| Acer Nitro 17 AN17-41-R9LN | |
| Baldur's Gate 3 - 2560x1440 Ultra Preset AA:T | |
| Średnia w klasie Gaming (56.5 - 175.5, n=84, ostatnie 2 lata) | |
| Przeciętny NVIDIA GeForce RTX 4070 Laptop GPU (54.4 - 89.6, n=25) | |
| XMG Pro 15 E23 | |
| Acer Nitro 17 AN17-41-R9LN | |
| Ratchet & Clank Rift Apart - 2560x1440 Very High Preset AA:T | |
| XMG Pro 15 E23 | |
| Przeciętny NVIDIA GeForce RTX 4070 Laptop GPU (48.7 - 49.1, n=3) | |
| Acer Nitro 17 AN17-41-R9LN | |
| Sons of the Forest - 2560x1440 Ultra Preset AA:T | |
| Przeciętny NVIDIA GeForce RTX 4070 Laptop GPU (61 - 69.5, n=2) | |
| Acer Nitro 17 AN17-41-R9LN | |
| Atomic Heart - 2560x1440 Atomic Preset | |
| Przeciętny NVIDIA GeForce RTX 4070 Laptop GPU (51.6 - 58.9, n=3) | |
| Acer Nitro 17 AN17-41-R9LN | |
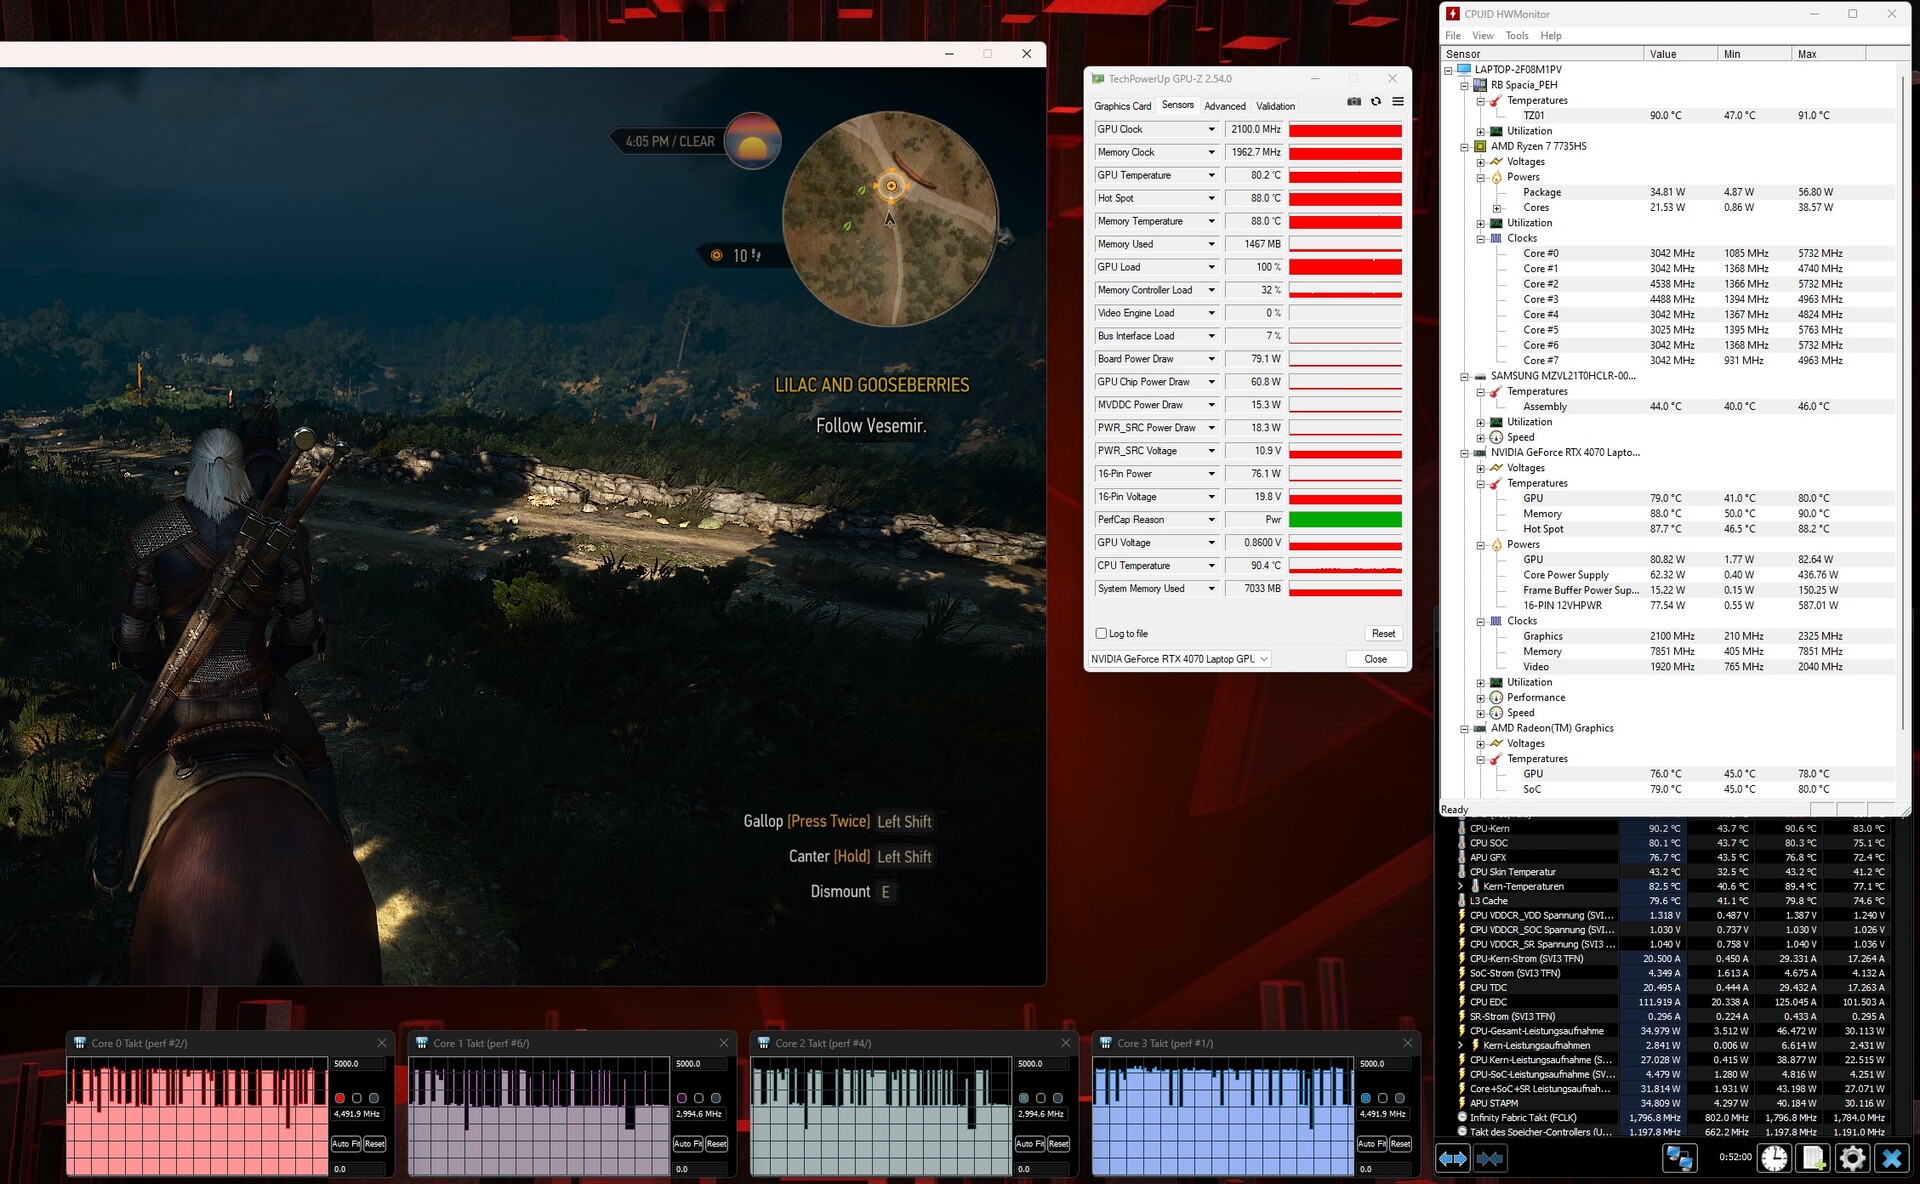
Przetestowaliśmy wydajność 3D przez okres około 60 minut z pomocą The Witcher 3 (FHD/Ultra). Z poniższej tabeli widać, że nie było żadnych spadków liczby klatek na sekundę.
Witcher 3 FPS diagram
| low | med. | high | ultra | QHD | |
|---|---|---|---|---|---|
| GTA V (2015) | 168.5 | 152.8 | 94.4 | ||
| The Witcher 3 (2015) | 110 | ||||
| Dota 2 Reborn (2015) | 135.8 | 122.8 | 114.5 | 108.3 | |
| Final Fantasy XV Benchmark (2018) | 144.4 | 106.3 | |||
| X-Plane 11.11 (2018) | 106.3 | 98 | 78.4 | ||
| Strange Brigade (2018) | 278 | 225 | 195 | ||
| Atomic Heart (2023) | 132.5 | 95 | 74.2 | 51.6 | |
| Sons of the Forest (2023) | 73.3 | 71.9 | 71.1 | 61 | |
| Ratchet & Clank Rift Apart (2023) | 72.3 | 60.2 | 56.3 | 48.7 | |
| Atlas Fallen (2023) | 124.7 | 119.9 | 105.3 | 80.6 | |
| Immortals of Aveum (2023) | 57.1 | 46.9 | 32 | ||
| Armored Core 6 (2023) | 92.1 | 91.1 | 87.2 | 76.2 | |
| Baldur's Gate 3 (2023) | 113.9 | 95.3 | 94.4 | 62.5 |
Emisje
Emisja hałasu
Podczas gdy poziomy emisji hałasu były dość niekomfortowe w trybie Performance (54 dB) i Turbo (61 dB), wentylatory były nadal słyszalne w trybie Balanced (44 dB), ale nie było to niekomfortowe. Oznacza to, że zalecamy korzystanie z tego ustawienia. W trybie bezczynności 17-calowy laptop generalnie zachowuje się dość cicho. Wentylatory są całkowicie wyłączone lub słychać tylko subtelny szum. Wentylatory rzadko obracają się irytująco szybko.
Hałas
| luz |
| 25 / 27 / 29 dB |
| obciążenie |
| 42 / 45 dB |
 | ||
30 dB cichy 40 dB(A) słyszalny 50 dB(A) irytujący |
||
min: | ||
| Acer Nitro 17 AN17-41-R9LN R7 7735HS, GeForce RTX 4070 Laptop GPU | Acer Nitro 17 AN17-51-71ER i7-13700H, GeForce RTX 4060 Laptop GPU | MSI Pulse 17 B13VGK i7-13700H, GeForce RTX 4070 Laptop GPU | Schenker XMG Focus 17 (E23) i9-13900HX, GeForce RTX 4070 Laptop GPU | Asus ROG Strix G17 G713PI R9 7945HX, GeForce RTX 4070 Laptop GPU | |
|---|---|---|---|---|---|
| Noise | -4% | 7% | -10% | -5% | |
| wyłączone / środowisko * (dB) | 24 | 24 -0% | 24 -0% | 24 -0% | 25 -4% |
| Idle Minimum * (dB) | 25 | 24 4% | 24 4% | 24 4% | 26 -4% |
| Idle Average * (dB) | 27 | 24 11% | 24 11% | 24 11% | 29 -7% |
| Idle Maximum * (dB) | 29 | 32.32 -11% | 24 17% | 26.47 9% | 30 -3% |
| Load Average * (dB) | 42 | 35.18 16% | 32.49 23% | 55.72 -33% | 46 -10% |
| Witcher 3 ultra * (dB) | 44 | 54.78 -25% | 46.51 -6% | 57.94 -32% | 46 -5% |
| Load Maximum * (dB) | 45 | 54.78 -22% | 46.51 -3% | 57.94 -29% | 47 -4% |
* ... im mniej tym lepiej
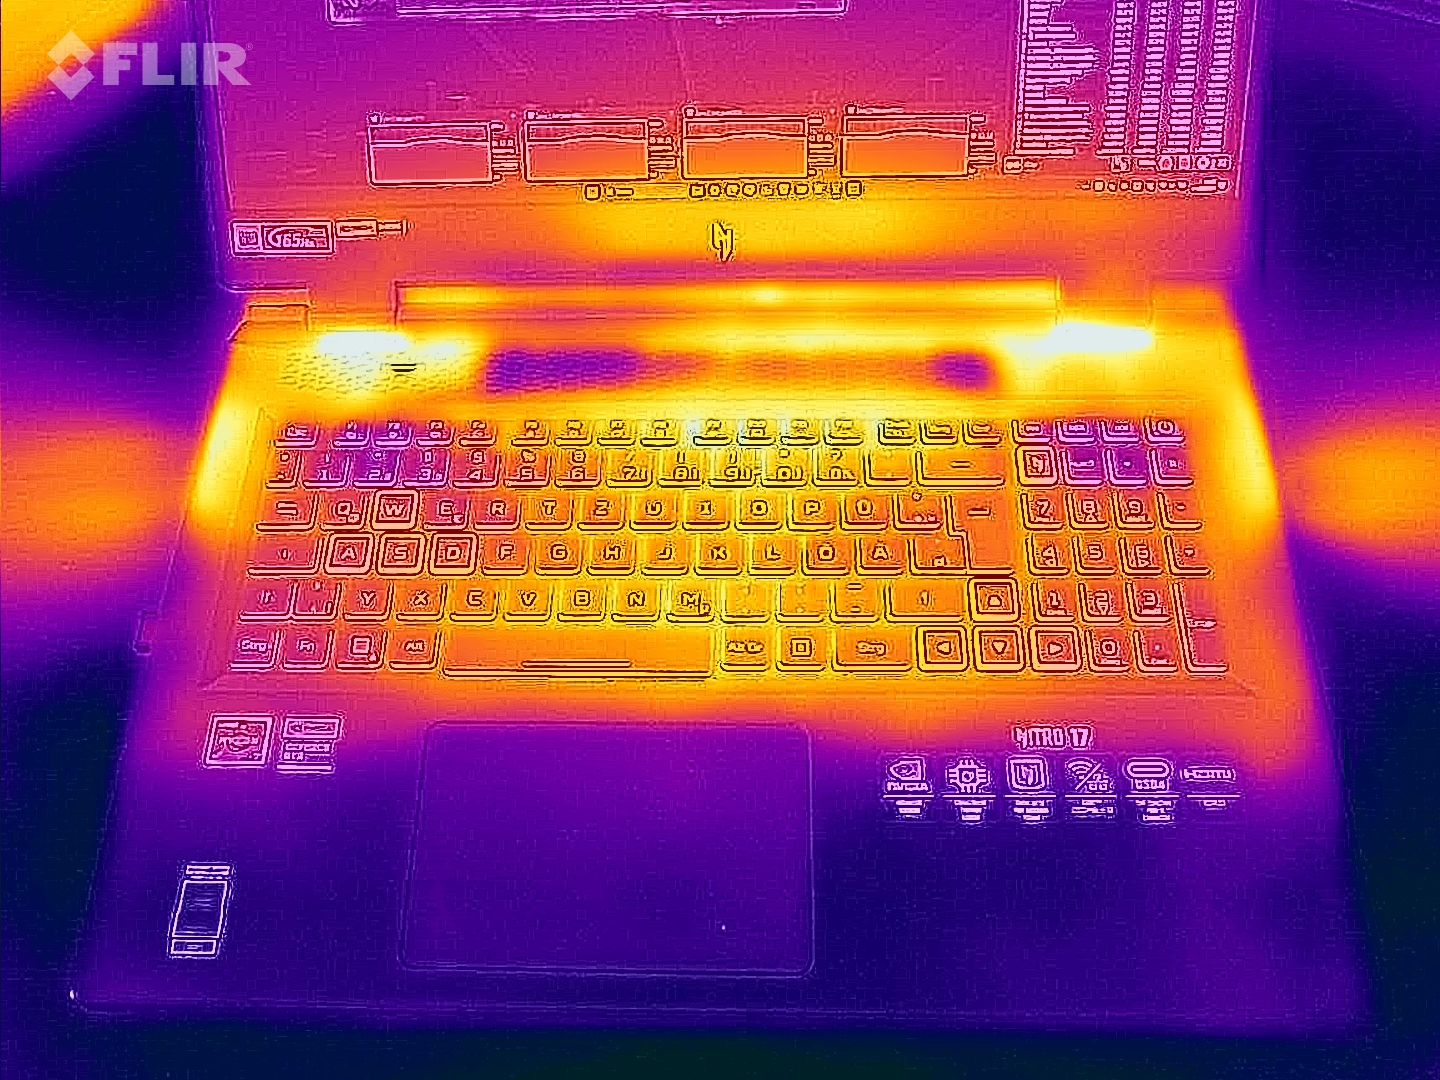
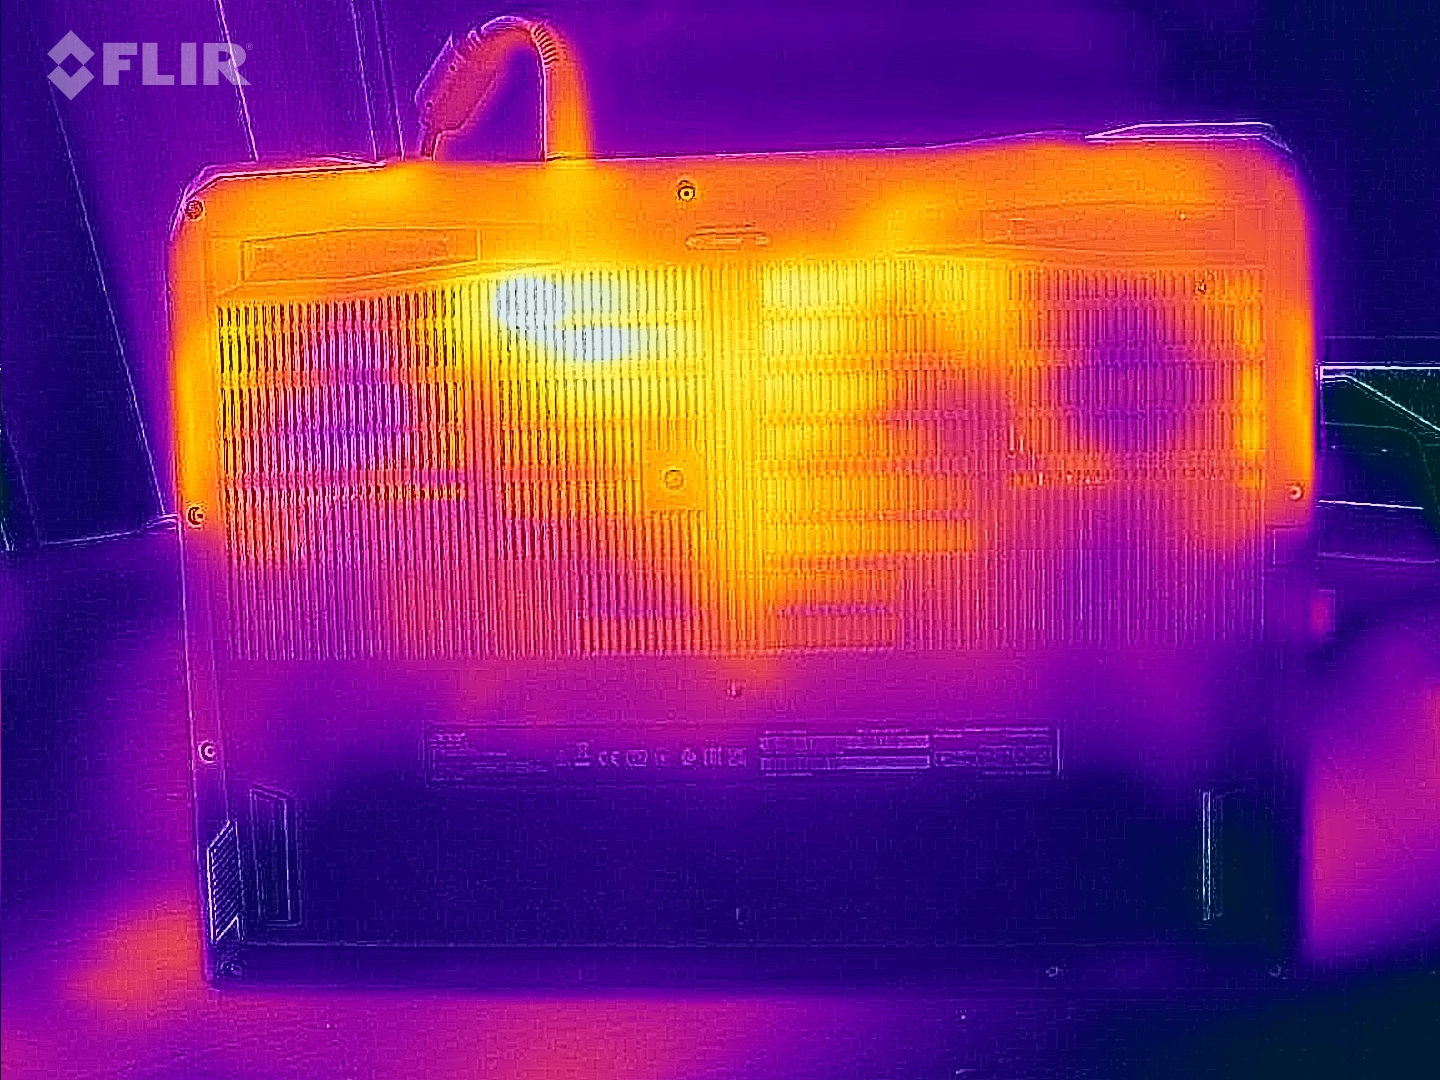
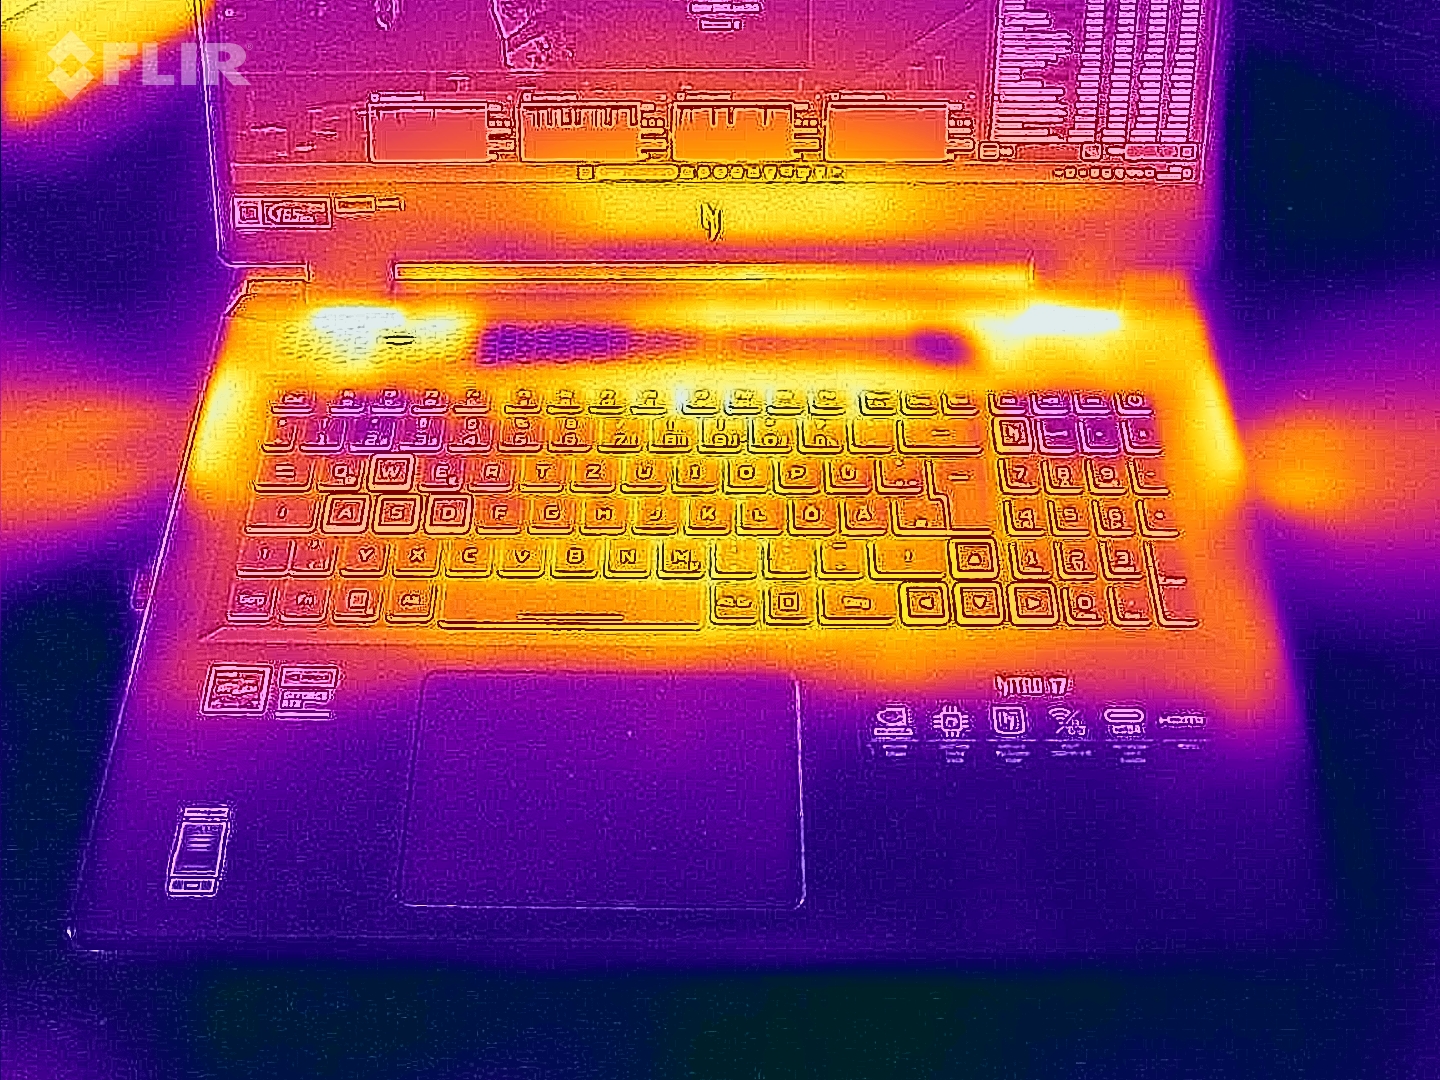
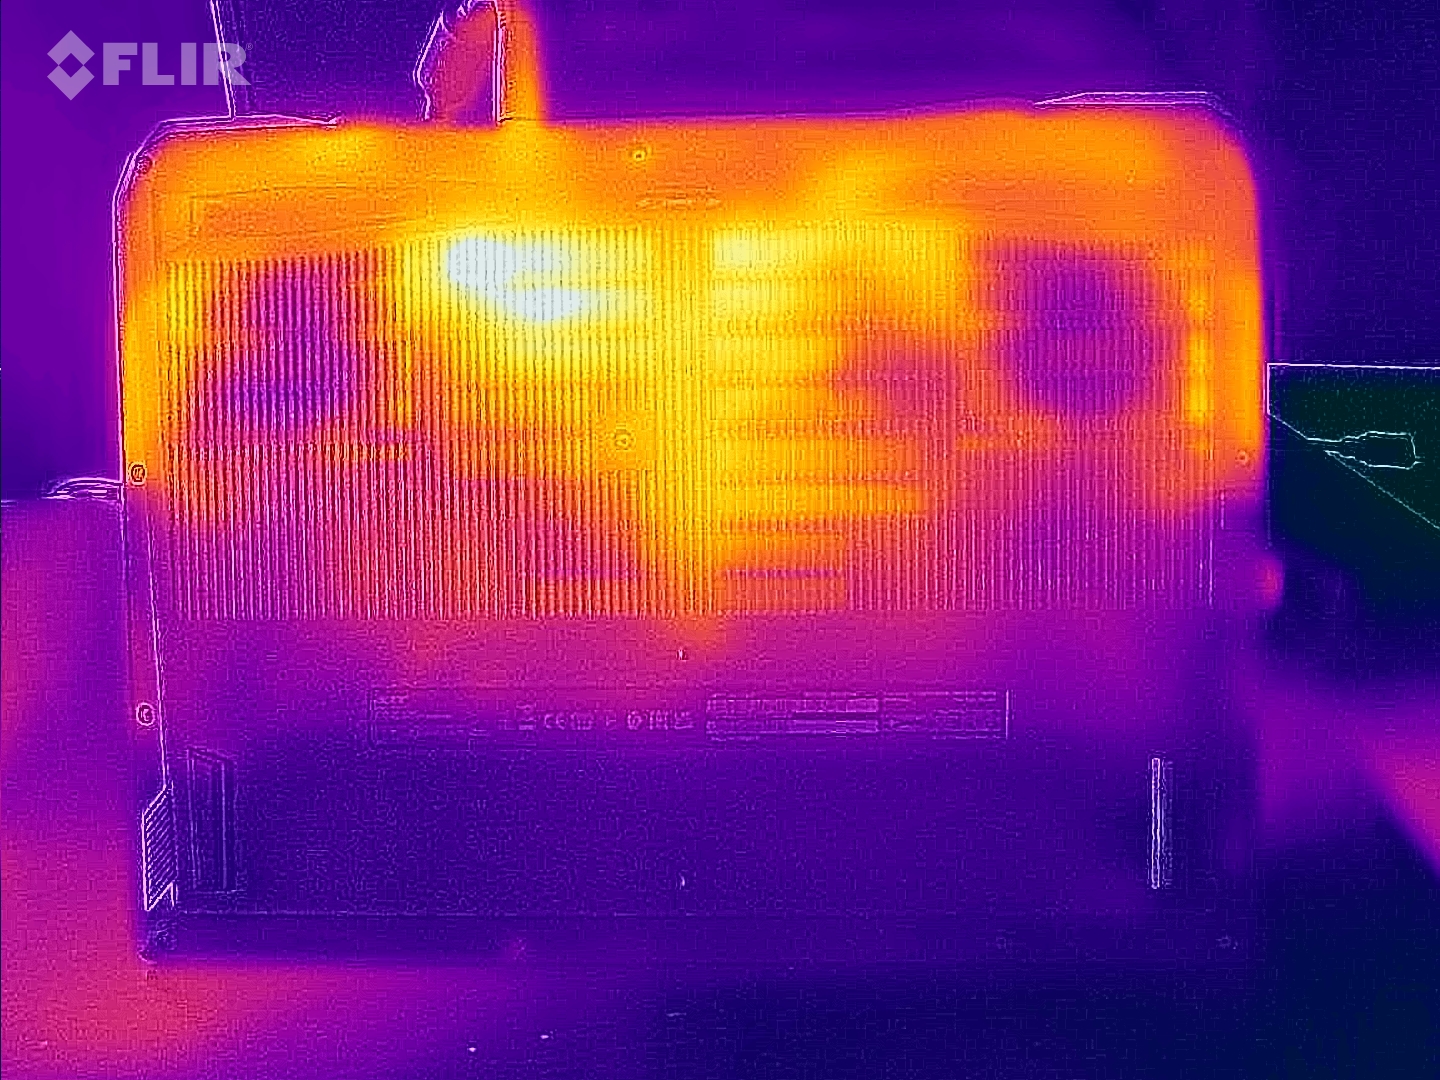
Temperatura
Temperatury laptopa są podobne do tych osiąganych przez jego konkurentów. Podczas Witcher 3 podczas testu w grach odnotowaliśmy maksymalnie 46 °C na górze obudowy i maksymalnie 55 °C na dole. W trybie bezczynności cała obudowa pozostaje dość chłodna. Najczęściej mierzyliśmy temperatury poniżej 30 °C.
(-) Maksymalna temperatura w górnej części wynosi 47 °C / 117 F, w porównaniu do średniej 40.4 °C / 105 F , począwszy od 21.2 do 68.8 °C dla klasy Gaming.
(-) Dno nagrzewa się maksymalnie do 53 °C / 127 F, w porównaniu do średniej 43.2 °C / 110 F
(+) W stanie bezczynności średnia temperatura górnej części wynosi 28.4 °C / 83 F, w porównaniu ze średnią temperaturą urządzenia wynoszącą 33.9 °C / ### class_avg_f### F.
(-) Podczas gry w Wiedźmina 3 średnia temperatura górnej części wynosi 38.1 °C / 101 F, w porównaniu do średniej temperatury urządzenia wynoszącej 33.9 °C / ## #class_avg_f### F.
(+) Podparcia dłoni i touchpad osiągają maksymalną temperaturę skóry (34 °C / 93.2 F) i dlatego nie są gorące.
(-) Średnia temperatura obszaru podparcia dłoni w podobnych urządzeniach wynosiła 28.8 °C / 83.8 F (-5.2 °C / -9.4 F).
| Acer Nitro 17 AN17-41-R9LN AMD Ryzen 7 7735HS, NVIDIA GeForce RTX 4070 Laptop GPU | Acer Nitro 17 AN17-51-71ER Intel Core i7-13700H, NVIDIA GeForce RTX 4060 Laptop GPU | MSI Pulse 17 B13VGK Intel Core i7-13700H, NVIDIA GeForce RTX 4070 Laptop GPU | Schenker XMG Focus 17 (E23) Intel Core i9-13900HX, NVIDIA GeForce RTX 4070 Laptop GPU | Asus ROG Strix G17 G713PI AMD Ryzen 9 7945HX, NVIDIA GeForce RTX 4070 Laptop GPU | |
|---|---|---|---|---|---|
| Heat | -3% | -1% | -13% | 4% | |
| Maximum Upper Side * (°C) | 47 | 46 2% | 48 -2% | 50 -6% | 42 11% |
| Maximum Bottom * (°C) | 53 | 51 4% | 50 6% | 56 -6% | 41 23% |
| Idle Upper Side * (°C) | 30 | 34 -13% | 30 -0% | 37 -23% | 33 -10% |
| Idle Bottom * (°C) | 31 | 33 -6% | 33 -6% | 36 -16% | 34 -10% |
* ... im mniej tym lepiej
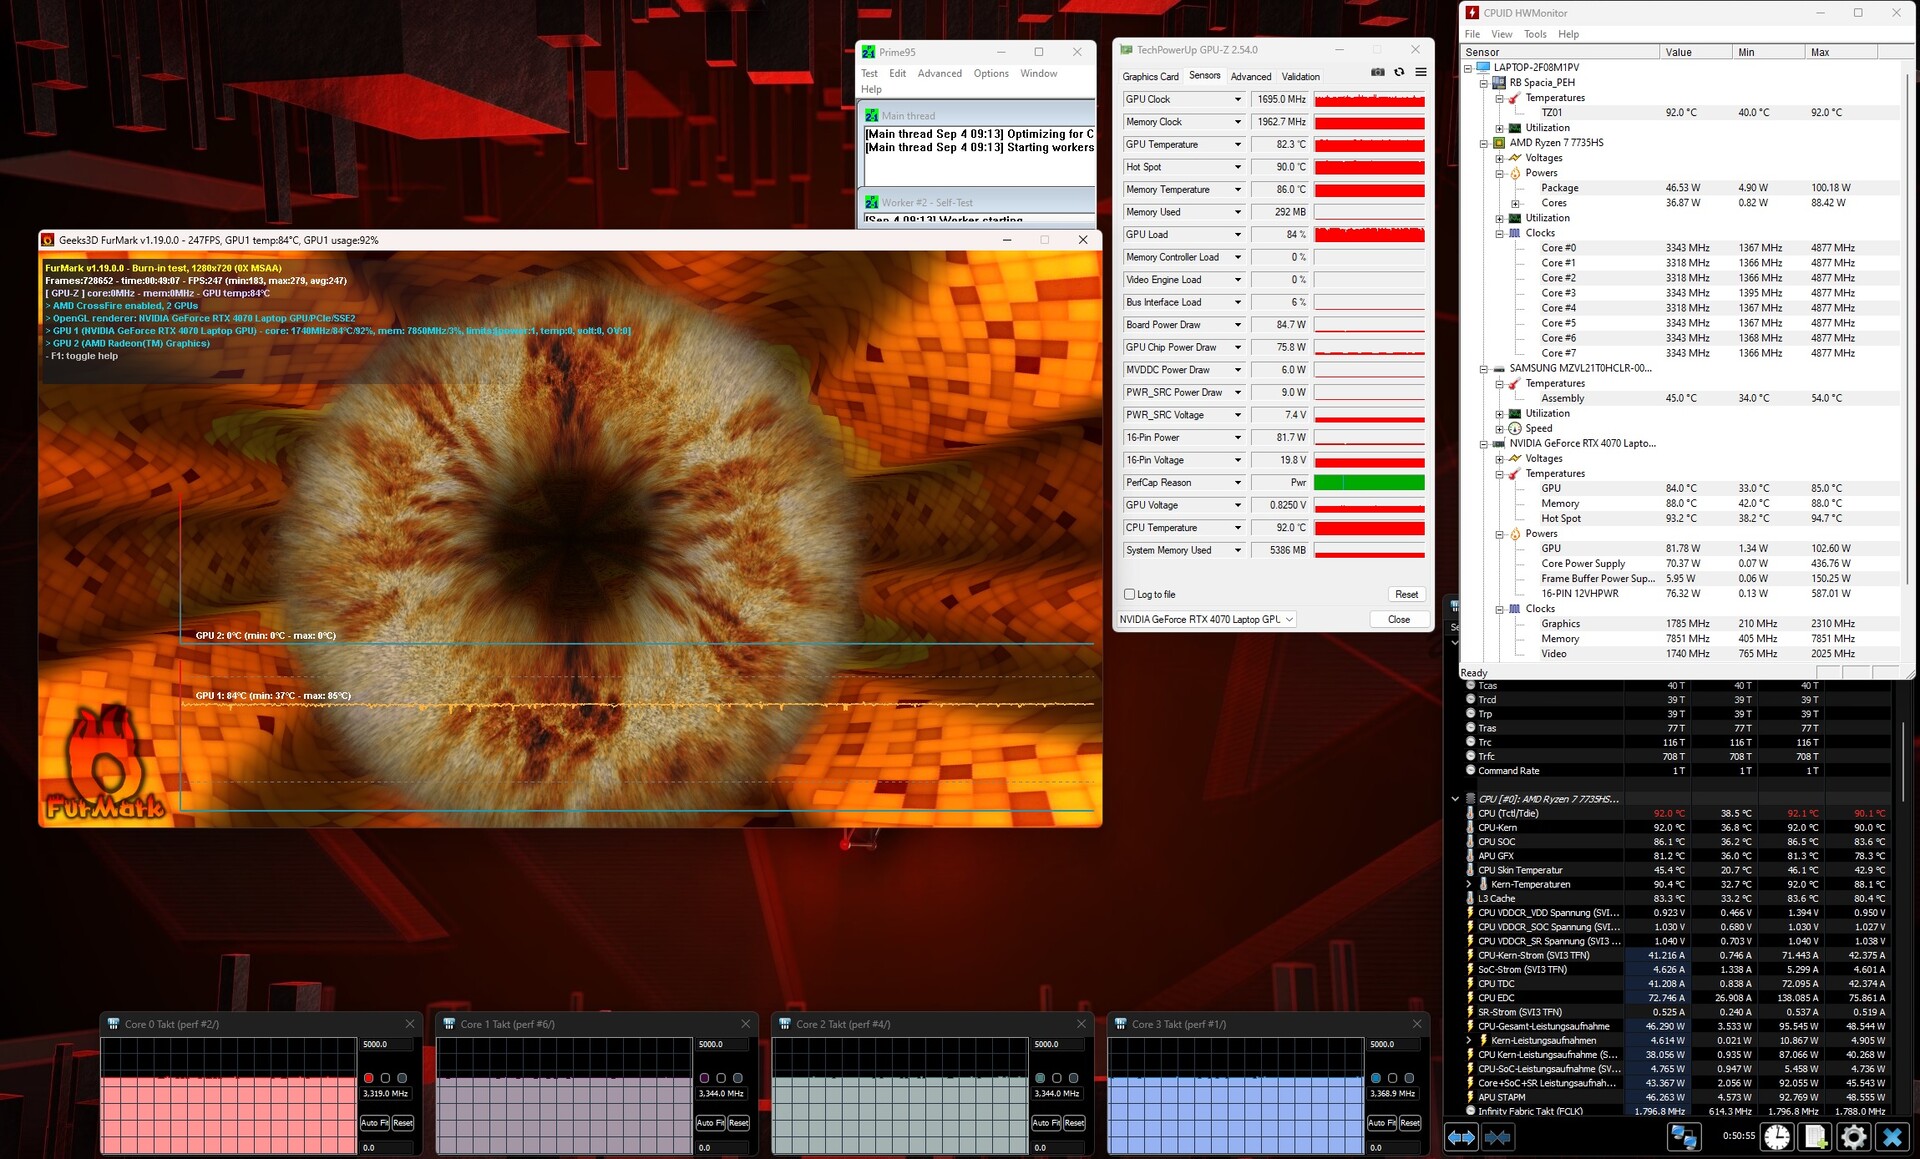
Test warunków skrajnych
Test obciążeniowy przy użyciu narzędzi Furmark i Prime95 zakończył się bez przykrych niespodzianek. Podczas gdy Ryzen 7 7735HS zrównał się z częstotliwością około 3,3 GHz (ale stał się dość ciepły przy około 90 °C), RTX 4070 czuł się komfortowo przy 1700 MHz i nieco ponad 80 °C.
Głośniki
Acer Nitro 17 AN17-41-R9LN analiza dźwięku
(+) | głośniki mogą odtwarzać stosunkowo głośno (83 dB)
Bas 100 - 315 Hz
(-) | prawie brak basu - średnio 28.6% niższa od mediany
(±) | liniowość basu jest średnia (14.2% delta do poprzedniej częstotliwości)
Średnie 400 - 2000 Hz
(+) | zbalansowane środki średnie - tylko 1.4% od mediany
(+) | średnie są liniowe (4% delta do poprzedniej częstotliwości)
Wysokie 2–16 kHz
(+) | zrównoważone maksima - tylko 4.3% od mediany
(+) | wzloty są liniowe (3.3% delta do poprzedniej częstotliwości)
Ogólnie 100 - 16.000 Hz
(±) | liniowość ogólnego dźwięku jest średnia (17.7% różnicy w stosunku do mediany)
W porównaniu do tej samej klasy
» 52% wszystkich testowanych urządzeń w tej klasie było lepszych, 10% podobnych, 38% gorszych
» Najlepszy miał deltę 6%, średnia wynosiła ###średnia###%, najgorsza wynosiła 132%
W porównaniu do wszystkich testowanych urządzeń
» 35% wszystkich testowanych urządzeń było lepszych, 8% podobnych, 57% gorszych
» Najlepszy miał deltę 4%, średnia wynosiła ###średnia###%, najgorsza wynosiła 134%
MSI Pulse 17 B13VGK analiza dźwięku
(+) | głośniki mogą odtwarzać stosunkowo głośno (85.01 dB)
Bas 100 - 315 Hz
(±) | zredukowany bas - średnio 13.2% niższy od mediany
(±) | liniowość basu jest średnia (12.3% delta do poprzedniej częstotliwości)
Średnie 400 - 2000 Hz
(±) | wyższe średnie - średnio 9.4% wyższe niż mediana
(+) | średnie są liniowe (5.7% delta do poprzedniej częstotliwości)
Wysokie 2–16 kHz
(+) | zrównoważone maksima - tylko 2.9% od mediany
(+) | wzloty są liniowe (6.7% delta do poprzedniej częstotliwości)
Ogólnie 100 - 16.000 Hz
(±) | liniowość ogólnego dźwięku jest średnia (15.8% różnicy w stosunku do mediany)
W porównaniu do tej samej klasy
» 37% wszystkich testowanych urządzeń w tej klasie było lepszych, 7% podobnych, 56% gorszych
» Najlepszy miał deltę 6%, średnia wynosiła ###średnia###%, najgorsza wynosiła 132%
W porównaniu do wszystkich testowanych urządzeń
» 24% wszystkich testowanych urządzeń było lepszych, 5% podobnych, 71% gorszych
» Najlepszy miał deltę 4%, średnia wynosiła ###średnia###%, najgorsza wynosiła 134%
Zarządzanie energią
Zużycie energii
Wskaźniki poboru mocy laptopa były takie, jak można się było spodziewać. 10 do 16 watów bezczynności i 79 do 220 watów obciążenia może również pochodzić z urządzenia z i7-13700H. Nie możemy zrozumieć, dlaczego Acer dołącza do laptopa nieporęczny 330-watowy zasilacz. Bardziej kompaktowy 230-watowy model sprawdziłby się równie dobrze.
| wyłączony / stan wstrzymania | |
| luz | |
| obciążenie |
|
Legenda:
min: | |
| Acer Nitro 17 AN17-41-R9LN R7 7735HS, GeForce RTX 4070 Laptop GPU | Acer Nitro 17 AN17-51-71ER i7-13700H, GeForce RTX 4060 Laptop GPU | MSI Pulse 17 B13VGK i7-13700H, GeForce RTX 4070 Laptop GPU | Schenker XMG Focus 17 (E23) i9-13900HX, GeForce RTX 4070 Laptop GPU | Asus ROG Strix G17 G713PI R9 7945HX, GeForce RTX 4070 Laptop GPU | Średnia w klasie Gaming | |
|---|---|---|---|---|---|---|
| Power Consumption | -3% | 12% | -71% | -50% | -42% | |
| Idle Minimum * (Watt) | 10 | 8.3 17% | 9 10% | 17 -70% | 15 -50% | 13.1 ? -31% |
| Idle Average * (Watt) | 11 | 13.5 -23% | 10.2 7% | 18 -64% | 20 -82% | 18.8 ? -71% |
| Idle Maximum * (Watt) | 16 | 14.8 7% | 10.8 32% | 25.8 -61% | 29 -81% | 24.4 ? -53% |
| Load Average * (Watt) | 79 | 77 3% | 72 9% | 178 -125% | 121 -53% | 108.6 ? -37% |
| Witcher 3 ultra * (Watt) | 147.5 | 154 -4% | 130 12% | 265 -80% | 179.8 -22% | |
| Load Maximum * (Watt) | 220 | 263 -20% | 221 -0% | 275 -25% | 246 -12% | 255 ? -16% |
* ... im mniej tym lepiej
Power consumption Witcher 3 / stress test
Power consumption with external monitor
Czas trwania
Bateria o pojemności 90 Wh konkuruje z rywalami od MSI (Pulse 17) i Asusa (Strix G17). Dzięki wydajnej baterii i wbudowanemu przełączaniu grafiki, można oczekiwać od tego laptopa dobrych czasów pracy. Co ciekawe, wskaźniki te są znacznie niższe niż w przypadku odpowiednika Intela. W naszym rzeczywistym teście WLAN z jasnością wyświetlacza zmniejszoną do 150 cd/m², edycja AMD wytrzymała tylko niecałe 5 godzin zamiast 8 (podejrzewamy wadliwe lub nieoptymalne mechanizmy oszczędzania energii w trybie baterii).
| Acer Nitro 17 AN17-41-R9LN R7 7735HS, GeForce RTX 4070 Laptop GPU, 90 Wh | Acer Nitro 17 AN17-51-71ER i7-13700H, GeForce RTX 4060 Laptop GPU, 90 Wh | MSI Pulse 17 B13VGK i7-13700H, GeForce RTX 4070 Laptop GPU, 90 Wh | Schenker XMG Focus 17 (E23) i9-13900HX, GeForce RTX 4070 Laptop GPU, 73 Wh | Asus ROG Strix G17 G713PI R9 7945HX, GeForce RTX 4070 Laptop GPU, 90 Wh | Średnia w klasie Gaming | |
|---|---|---|---|---|---|---|
| Czasy pracy | 58% | 73% | -25% | -17% | 34% | |
| WiFi v1.3 (h) | 5.2 | 8.2 58% | 9 73% | 3.9 -25% | 4.3 -17% | 6.98 ? 34% |
| H.264 (h) | 6.9 | 3.1 | 2.8 | 8.9 ? | ||
| Witcher 3 ultra (h) | 2.5 | 1 | 1.1 | |||
| Load (h) | 2.2 | 1 | 1.51 ? |
Za
Przeciw
Werdykt
W przeważającej części, Acer Nitro 17 AN17-41-R9LN to imponujący 17-calowy laptop do gier. Połączenie procesora AMD (Ryzen 7 7735HS) i procesora graficznego Nvidia (GeForce RTX 4070) tworzy całkiem niezłą harmonię, która wystarcza do uruchomienia większości gier w natywnej rozdzielczości 2560 x 1440 przy maksymalnych ustawieniach. Nie jest to jednak najbardziej przyszłościowy sprzęt ze względu na skromne 8 GB pamięci VRAM.
Pod wieloma innymi względami producent dostarczył dobry laptop do gier. Jego opcje łączności i urządzenia wejściowe powinny być wystarczające dla większości kupujących. Kolorowy i stosunkowo szybki wyświetlacz QHD uzupełnia konfigurację.
Emisja hałasu laptopa jest, jak zawsze, wysoce zależna od używanego trybu. W naszym teście ustawienie "zrównoważone" wykazało najlepszy kompromis między wydajnością a hałasem.
Acer mógłby nieco poprawić obudowę i jakość dźwięku Nitro 17. Jego zintegrowanemu systemowi 2.0 brakuje dużo basu. Opóźnienia laptopa i czas pracy na baterii (znacznie krótszy niż w wersji z procesorem Intela) również okazują się problemami, które producent mógłby rozwiązać.
Pomimo słabszej wydajności procesora i ledwo lepszej wydajności 3D w porównaniu do modelu RTX 4060 opartego na Intelu, nadal zalecamy wybranie modelu AMD, ponieważ większość gier jest ograniczona przez GPU.
Równą lub nieco lepszą alternatywą może być Asus ROG Strix G17 G713PI, który również posiada RTX 4070 - ale ma również zainstalowany Ryzen 9 7945HX, który jest nowocześniejszym i znacznie szybszym procesorem. To z kolei wiąże się z wyższą ceną.
Cena i dostępność
Acer Nitro 17 AN17-41-R9LN z procesorem Ryzen 7 7735HS, GeForce RTX 4070 i wyświetlaczem QHD można znaleźć na Amazon za około 1900 USD.
Acer Nitro 17 AN17-41-R9LN
- 07/09/2023 v7 (old)
Florian Glaser
Przezroczystość
Wyboru urządzeń do recenzji dokonuje nasza redakcja. Próbka testowa została udostępniona autorowi jako pożyczka od producenta lub sprzedawcy detalicznego na potrzeby tej recenzji. Pożyczkodawca nie miał wpływu na tę recenzję, producent nie otrzymał też kopii tej recenzji przed publikacją. Nie było obowiązku publikowania tej recenzji. Jako niezależna firma medialna, Notebookcheck nie podlega władzy producentów, sprzedawców detalicznych ani wydawców.
Tak testuje Notebookcheck
Każdego roku Notebookcheck niezależnie sprawdza setki laptopów i smartfonów, stosując standardowe procedury, aby zapewnić porównywalność wszystkich wyników. Od około 20 lat stale rozwijamy nasze metody badawcze, ustanawiając przy tym standardy branżowe. W naszych laboratoriach testowych doświadczeni technicy i redaktorzy korzystają z wysokiej jakości sprzętu pomiarowego. Testy te obejmują wieloetapowy proces walidacji. Nasz kompleksowy system ocen opiera się na setkach uzasadnionych pomiarów i benchmarków, co pozwala zachować obiektywizm.Price comparison

