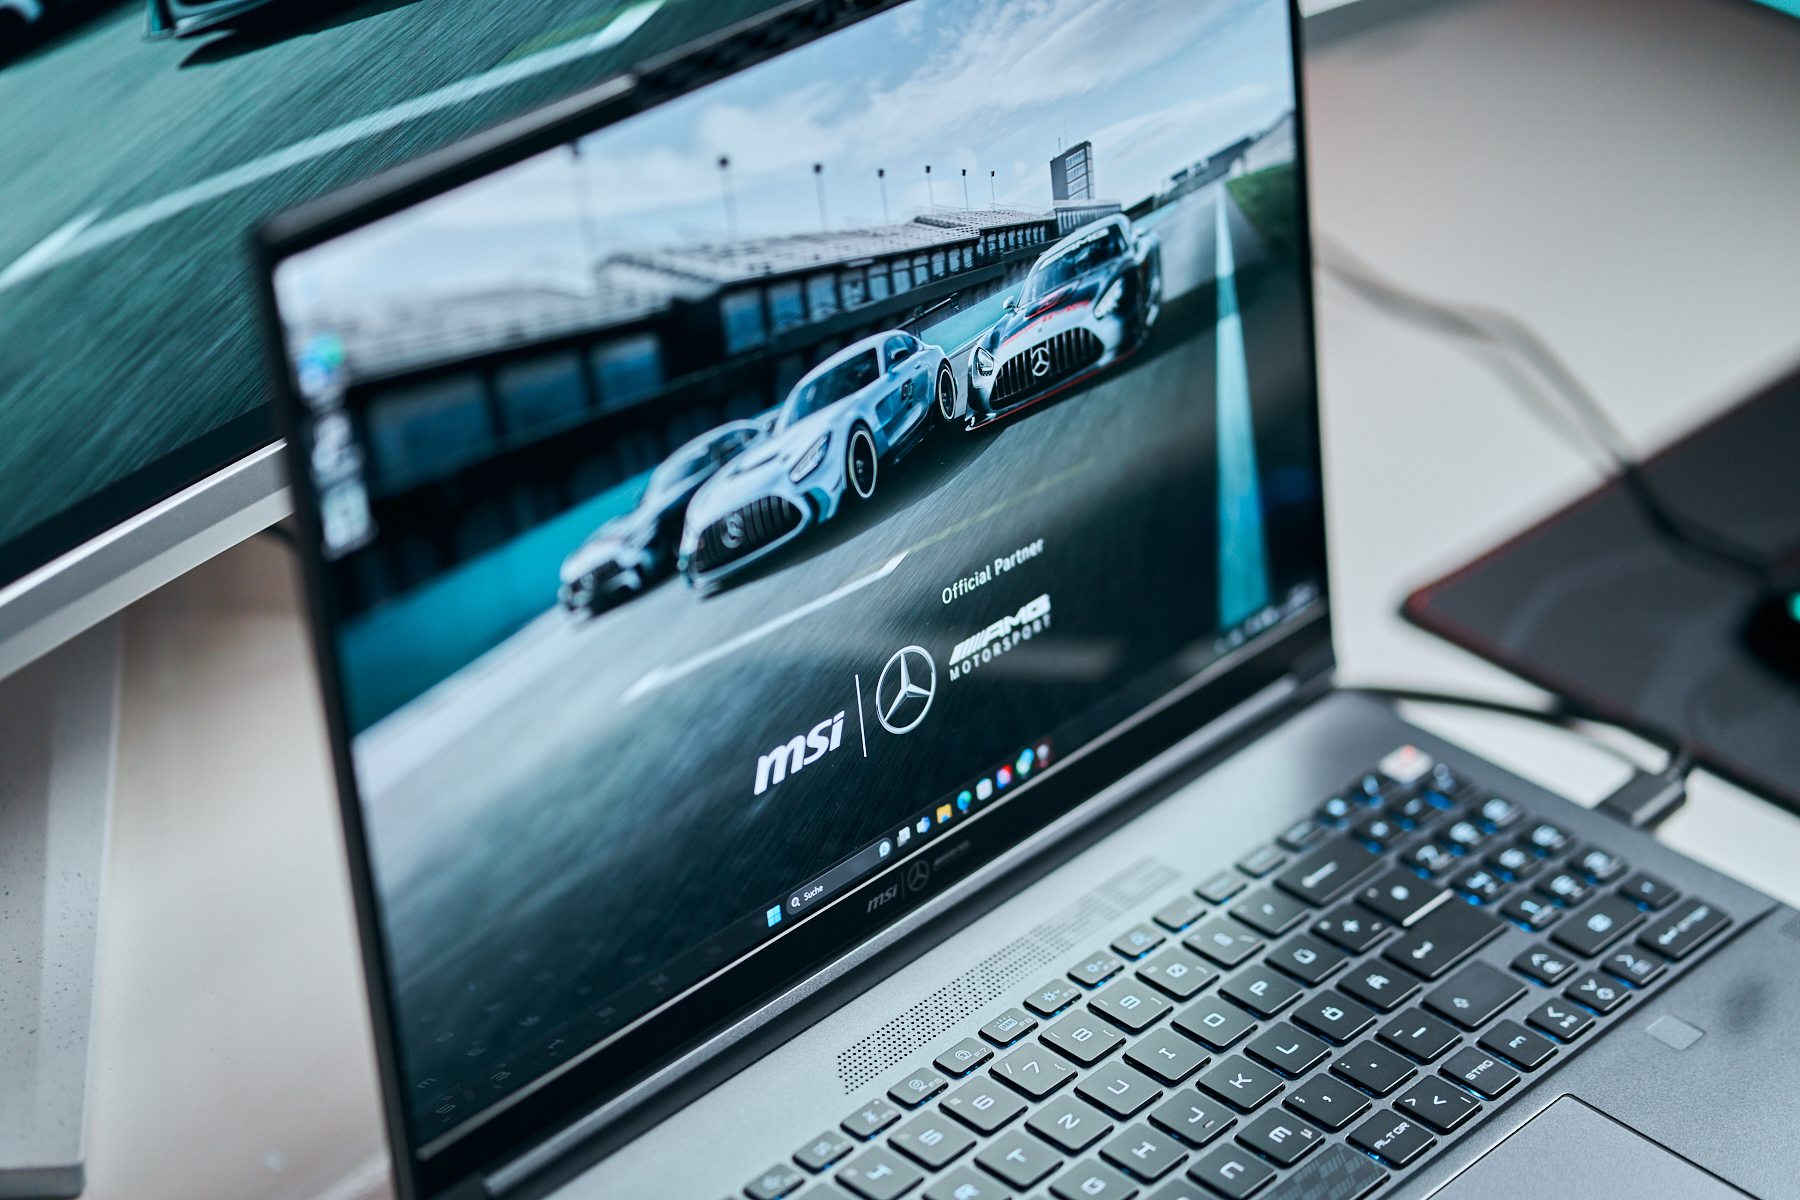
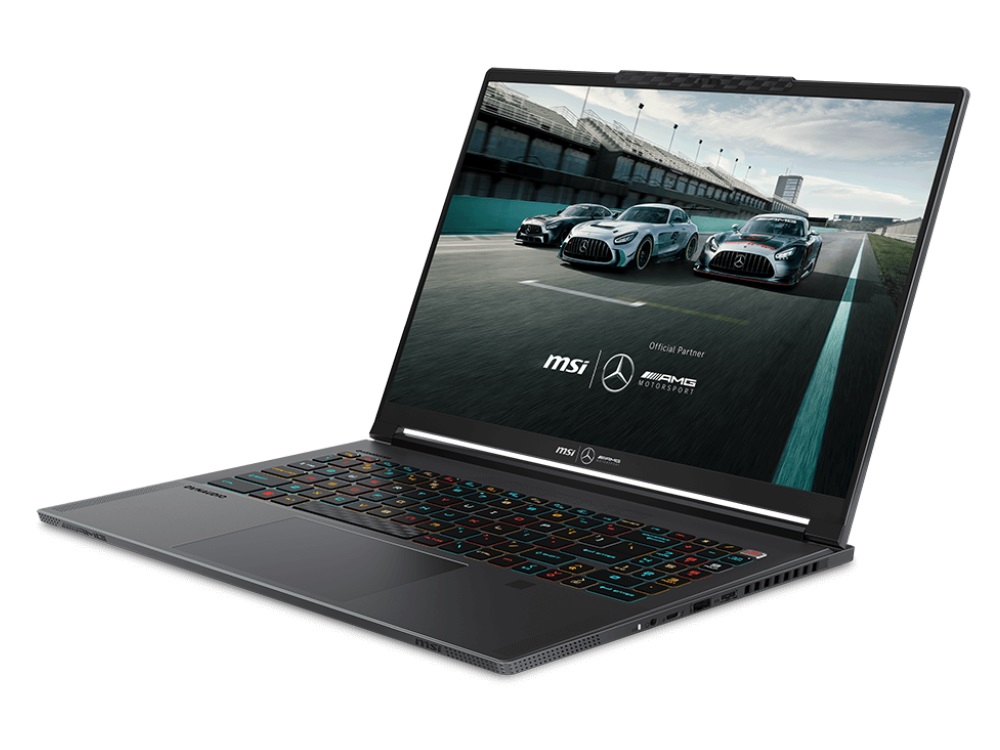
Recenzja laptopa MSI Stealth 16 Mercedes-AMG Motorsport: Mobilny samochód wyścigowy z wyświetlaczem OLED

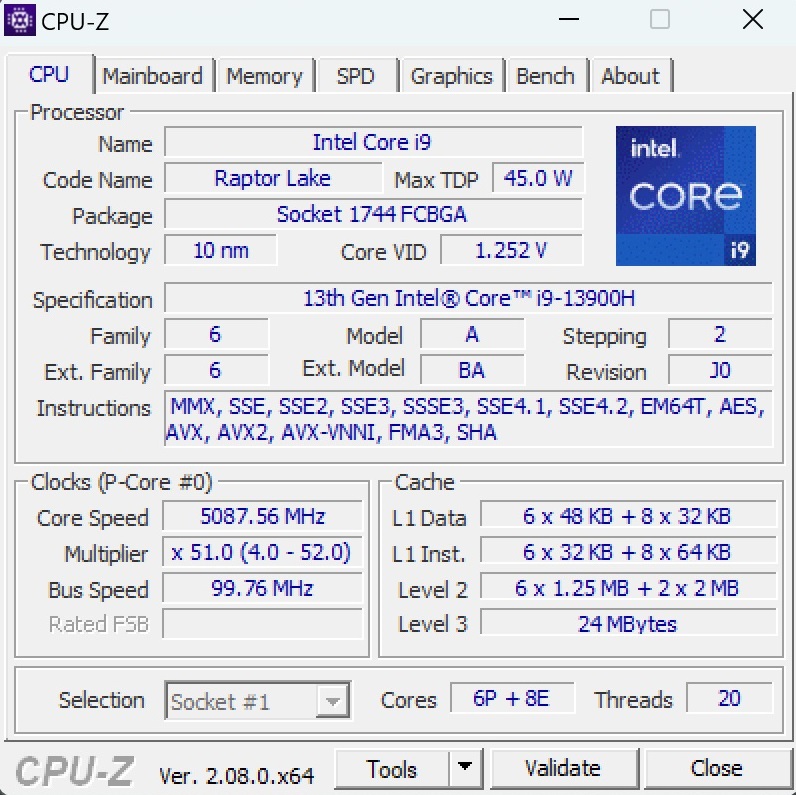
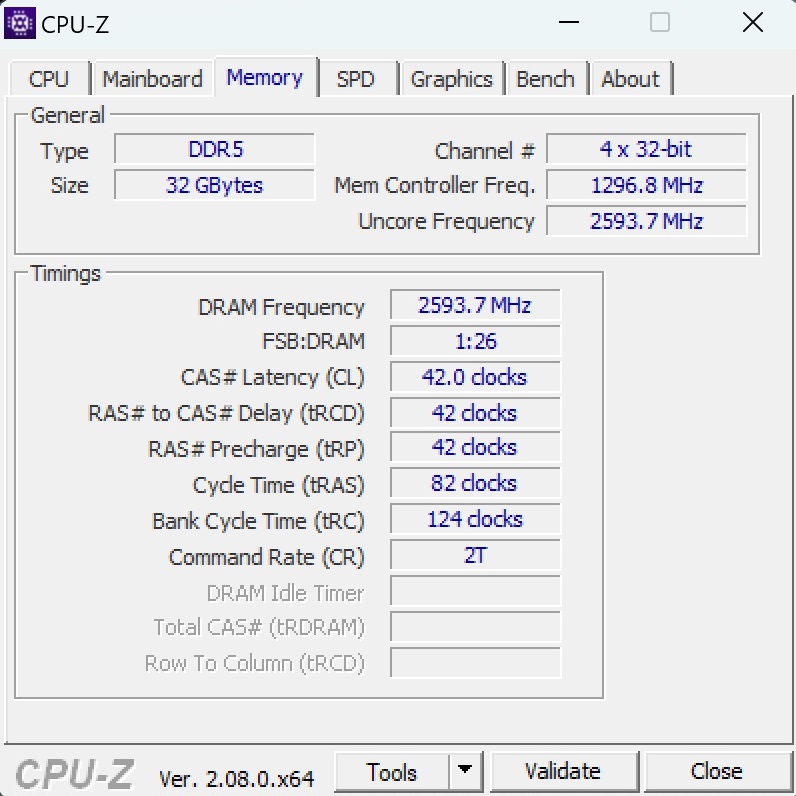
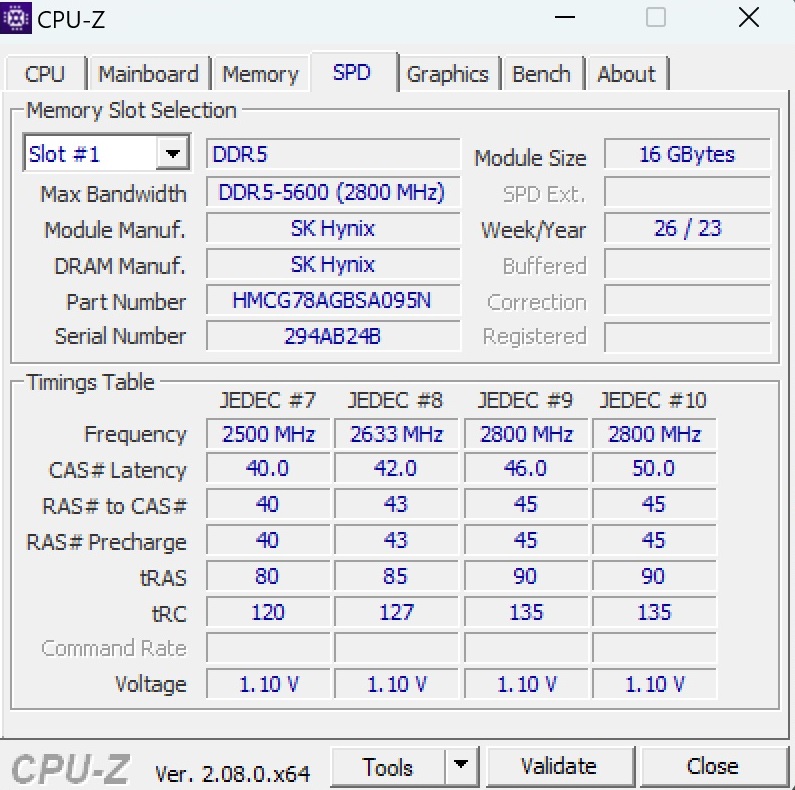
Podczas gdy "standardowy" Stealth 16 jest wyposażony w Core i7-13700Hmodel Mercedes-AMG Motorsport jest wyposażony w nieco szybszy procesor Core i9-13900H. Zamiast matowego panelu QHD+ IPS działającego z częstotliwością 240 Hz, Motorsport Edition może pochwalić się błyszczącym wyświetlaczem UHD+ OLED z częstotliwością odświeżania 60 Hz. Karta graficzna (RTX 4070), pamięć RAM (2x 16 GB DDR5) i pojemność dysku SSD (2 TB) pozostają identyczne jak w topowym modelu. Biorąc pod uwagę, że obudowa, urządzenia wejściowe i połączenia są takie same, a różni je tylko kilka szczegółów optycznych, nie będziemy wracać do konkretnych kategorii w tym artykule. Mogą Państwo zapoznać się z odpowiednimi informacjami w recenzji Stealth 16 Studio. Cena Motorsport Edition wynosi obecnie 2 899 USD, co jest godną uwagi inwestycją w notebooka z RTX 4070.
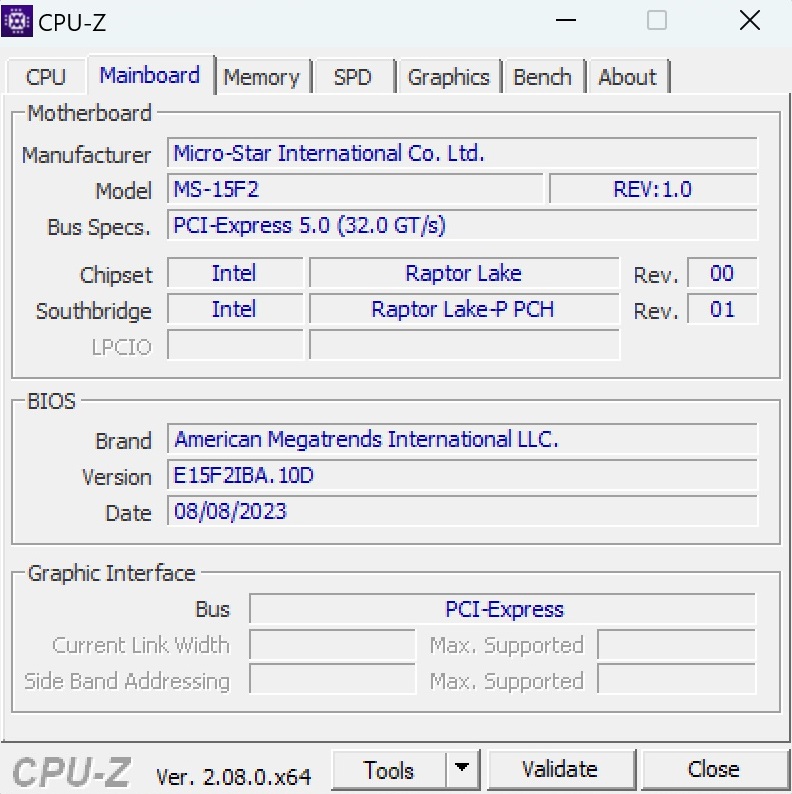
Konkurentami dla Stealth 16 są inne 16-calowe laptopy do gier wyposażone w RTX 4070, takie jak HP Omen Transcend 16, Lenovo Lenovo Legion Pro 5 16ARX8oraz laptopy Schenker XMG Pro 16 Studio i XMG Core 16. Modele te są wymienione w tabelach dla porównania
Potencjalni konkurenci w porównaniu
Ocena | Data | Model | Waga | Wysokość | Rozmiar | Rezolucja | Cena |
|---|---|---|---|---|---|---|---|
| 89.1 % v7 (old) | 11/2023 | MSI Stealth 16 Mercedes-AMG Motorsport A13VG i9-13900H, GeForce RTX 4070 Laptop GPU | 1.9 kg | 20 mm | 16.00" | 3840x2400 | |
| 88.8 % v7 (old) | 07/2023 | MSI Stealth 16 Studio A13VG i7-13700H, GeForce RTX 4070 Laptop GPU | 2 kg | 19.95 mm | 16.00" | 2560x1600 | |
| 87.9 % v7 (old) | 10/2023 | Schenker XMG Pro 16 Studio (Mid 23) i9-13900H, GeForce RTX 4070 Laptop GPU | 2.6 kg | 19.9 mm | 16.00" | 2560x1600 | |
| 87.9 % v7 (old) | 08/2023 | HP Omen Transcend 16 i9-13900HX, GeForce RTX 4070 Laptop GPU | 2.3 kg | 19.8 mm | 16.00" | 2560x1600 | |
| 88.4 % v7 (old) | 05/2023 | Lenovo Legion Pro 5 16ARX8 R7 7745HX, GeForce RTX 4070 Laptop GPU | 2.5 kg | 26.8 mm | 16.00" | 2560x1600 | |
| 89.2 % v7 (old) | 10/2023 | Schenker XMG CORE 16 (L23) R7 7840HS, GeForce RTX 4070 Laptop GPU | 2.4 kg | 26.1 mm | 16.00" | 2560x1600 |
Sprawa
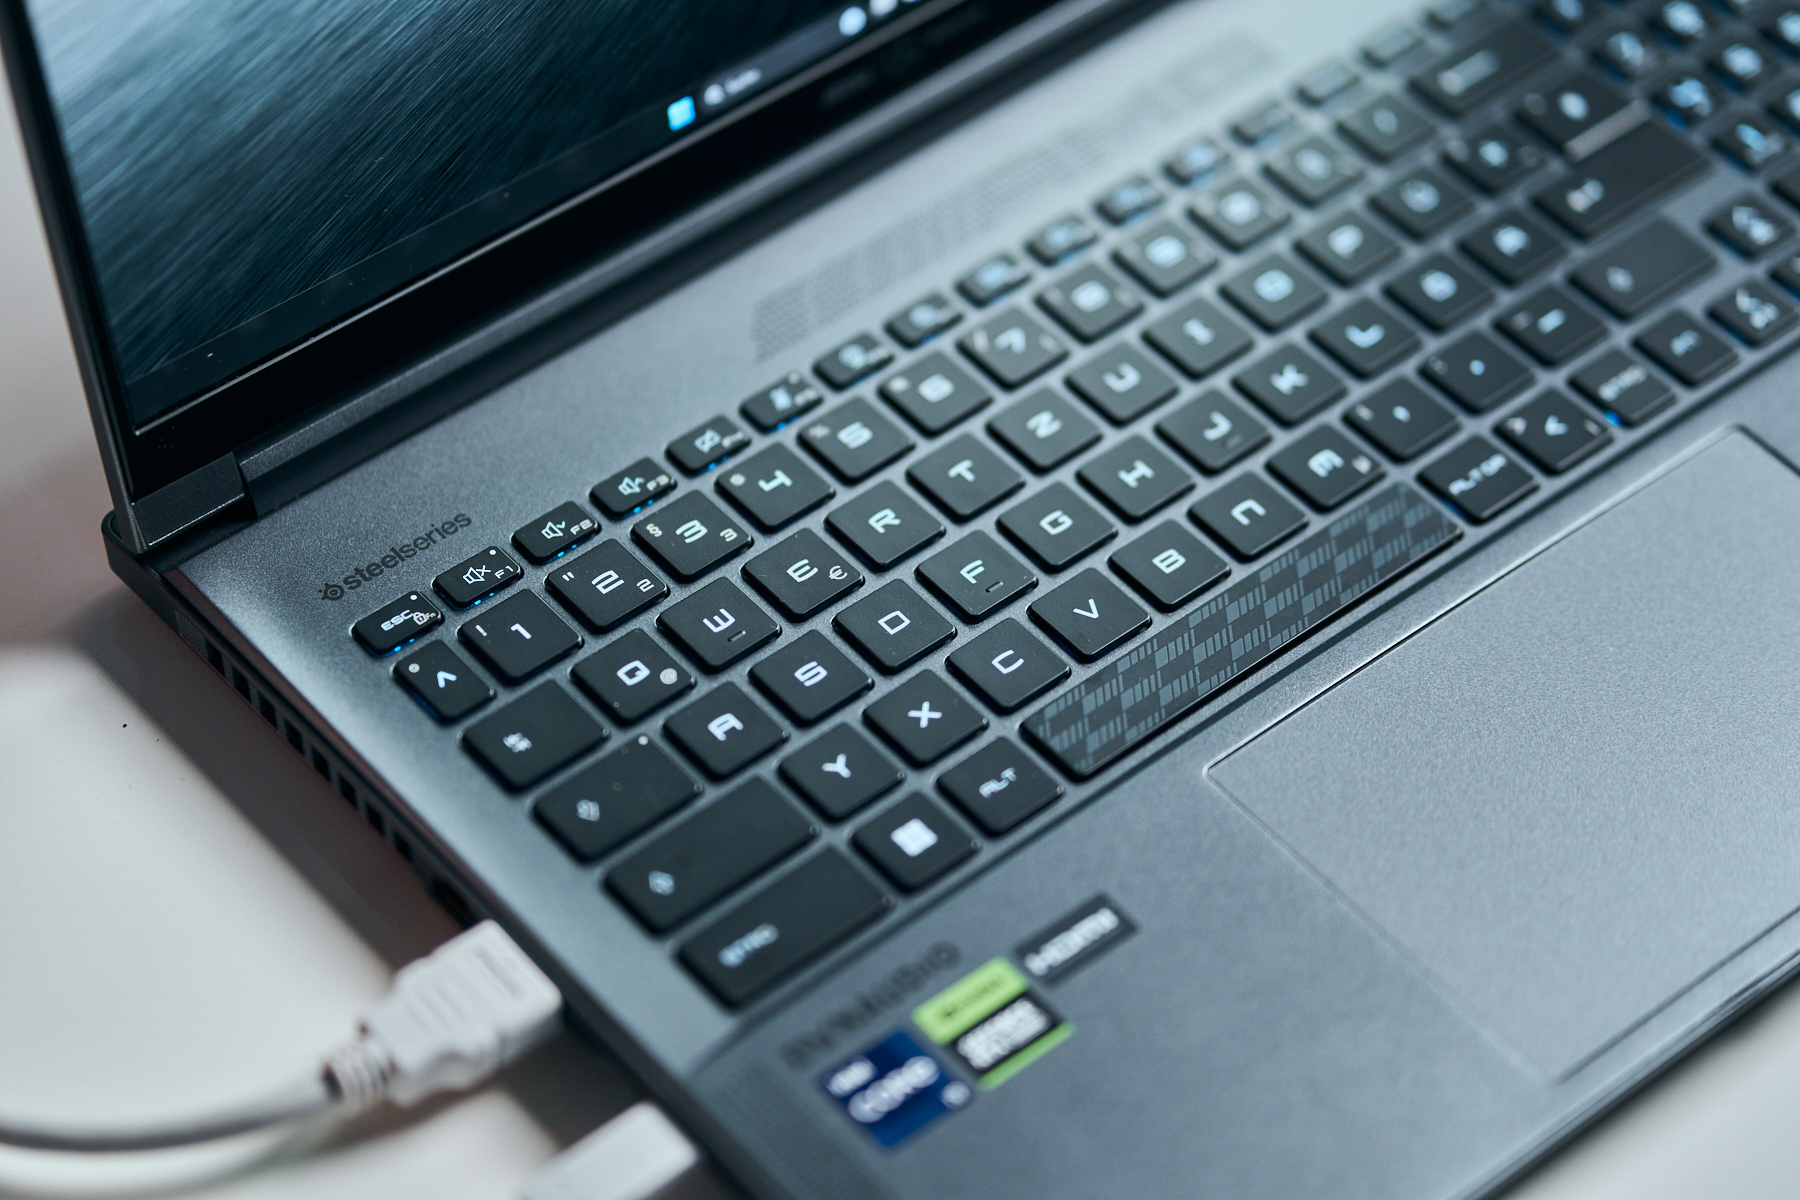
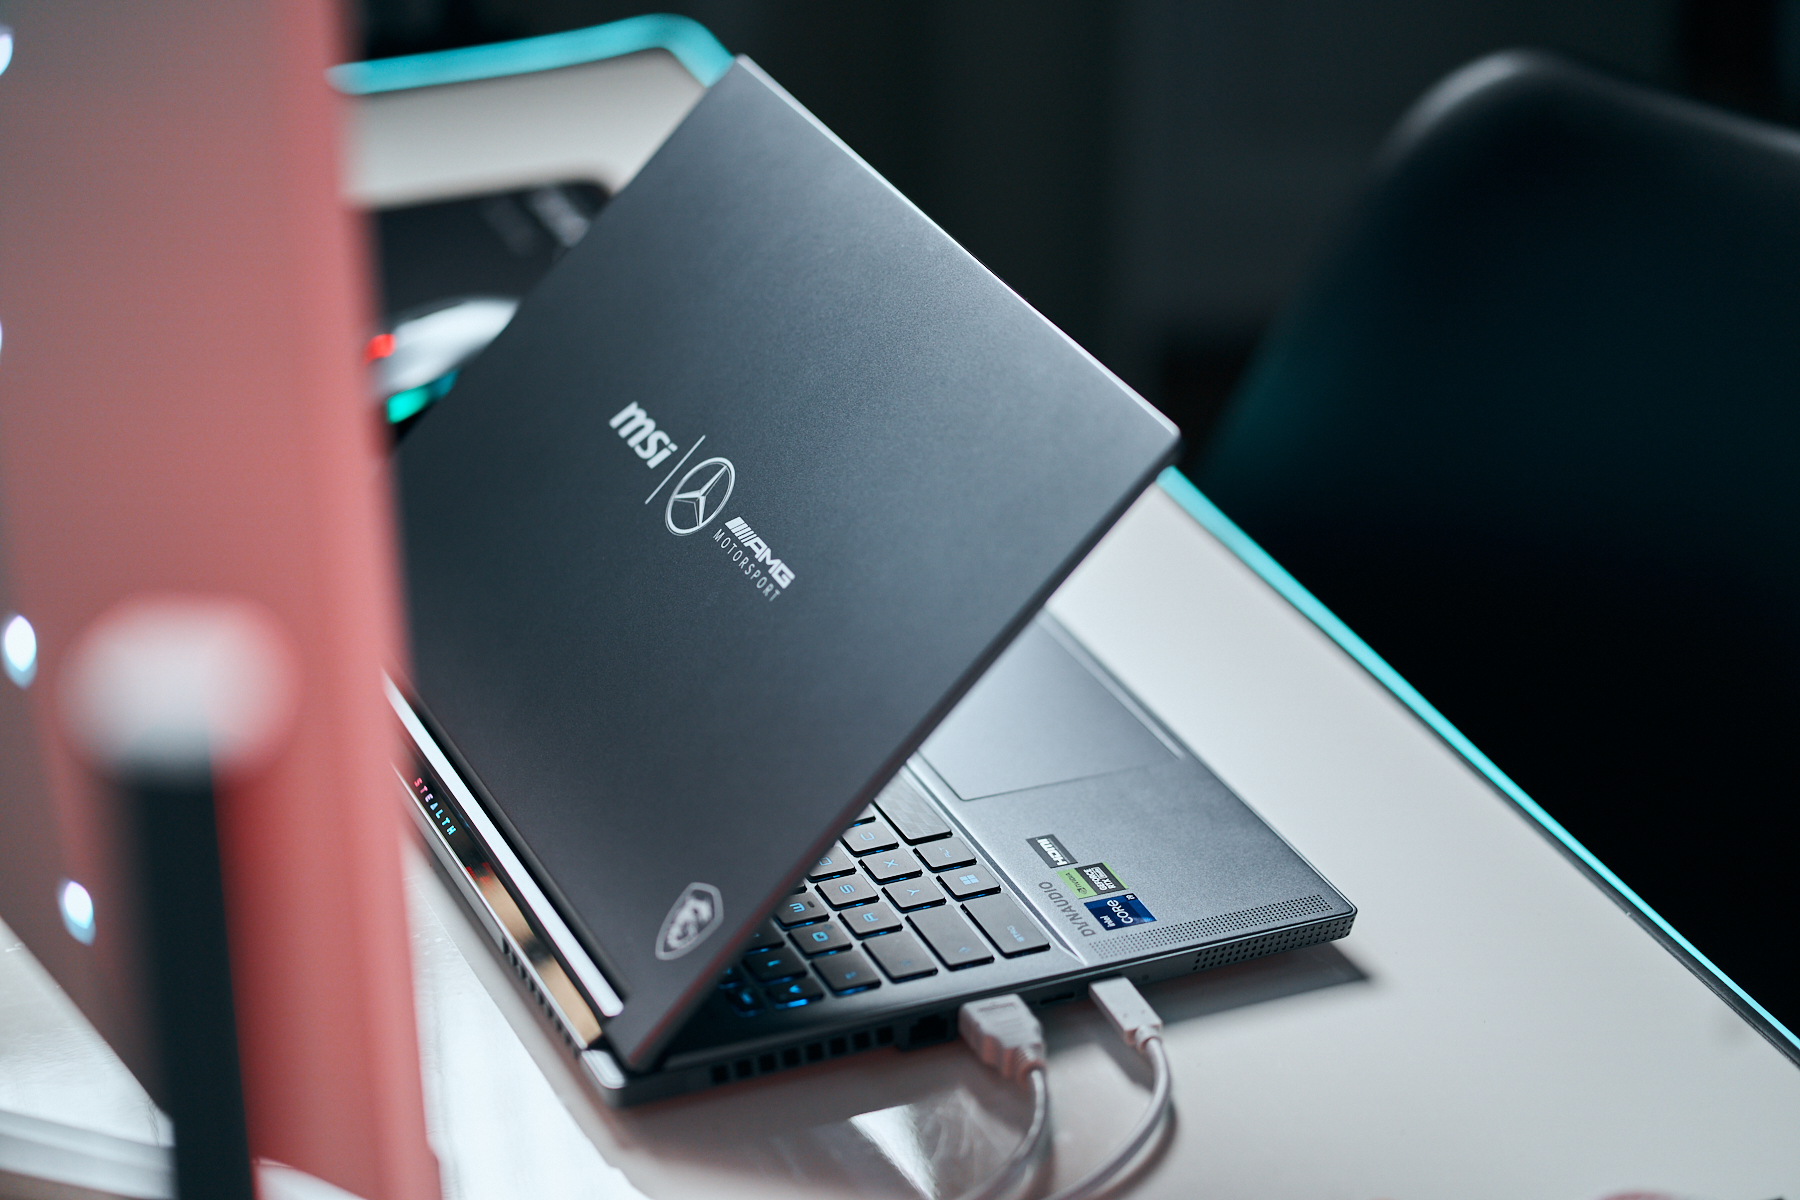
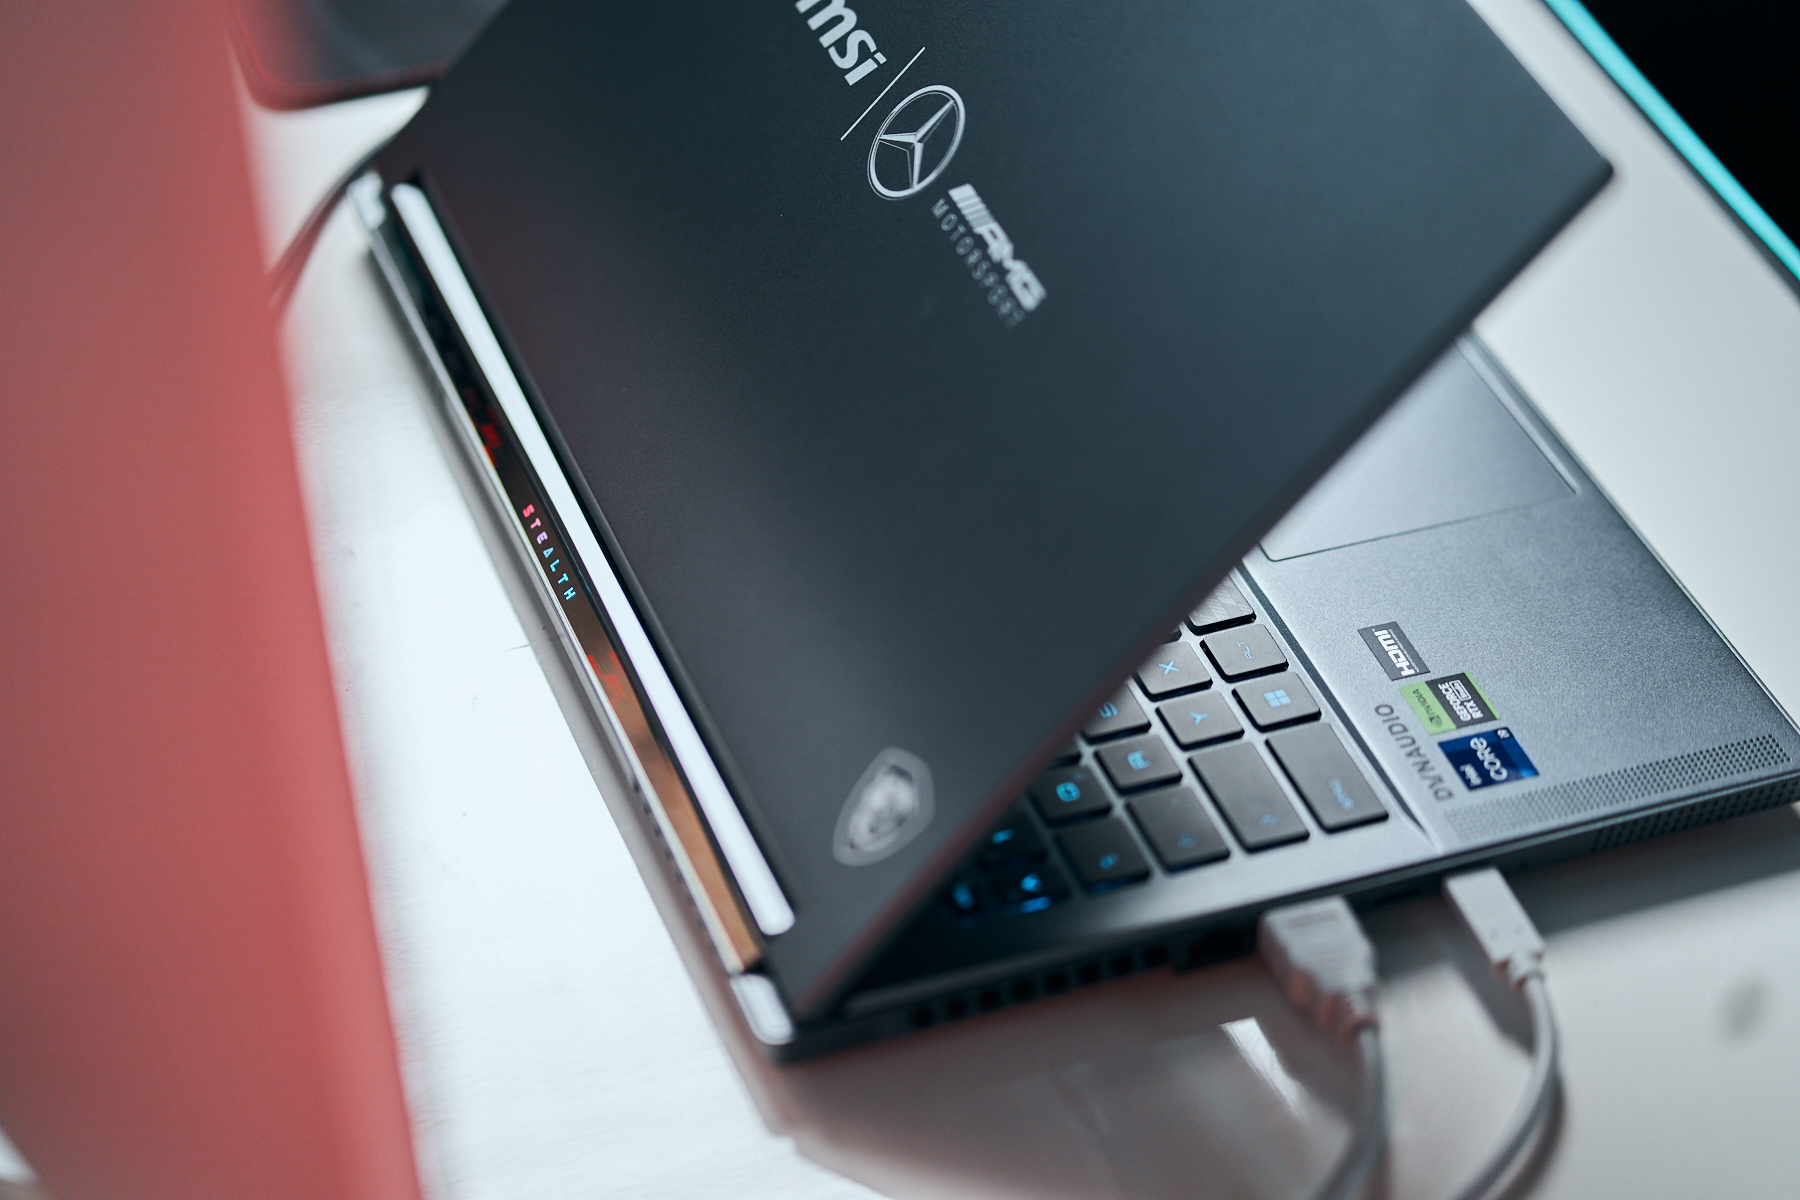
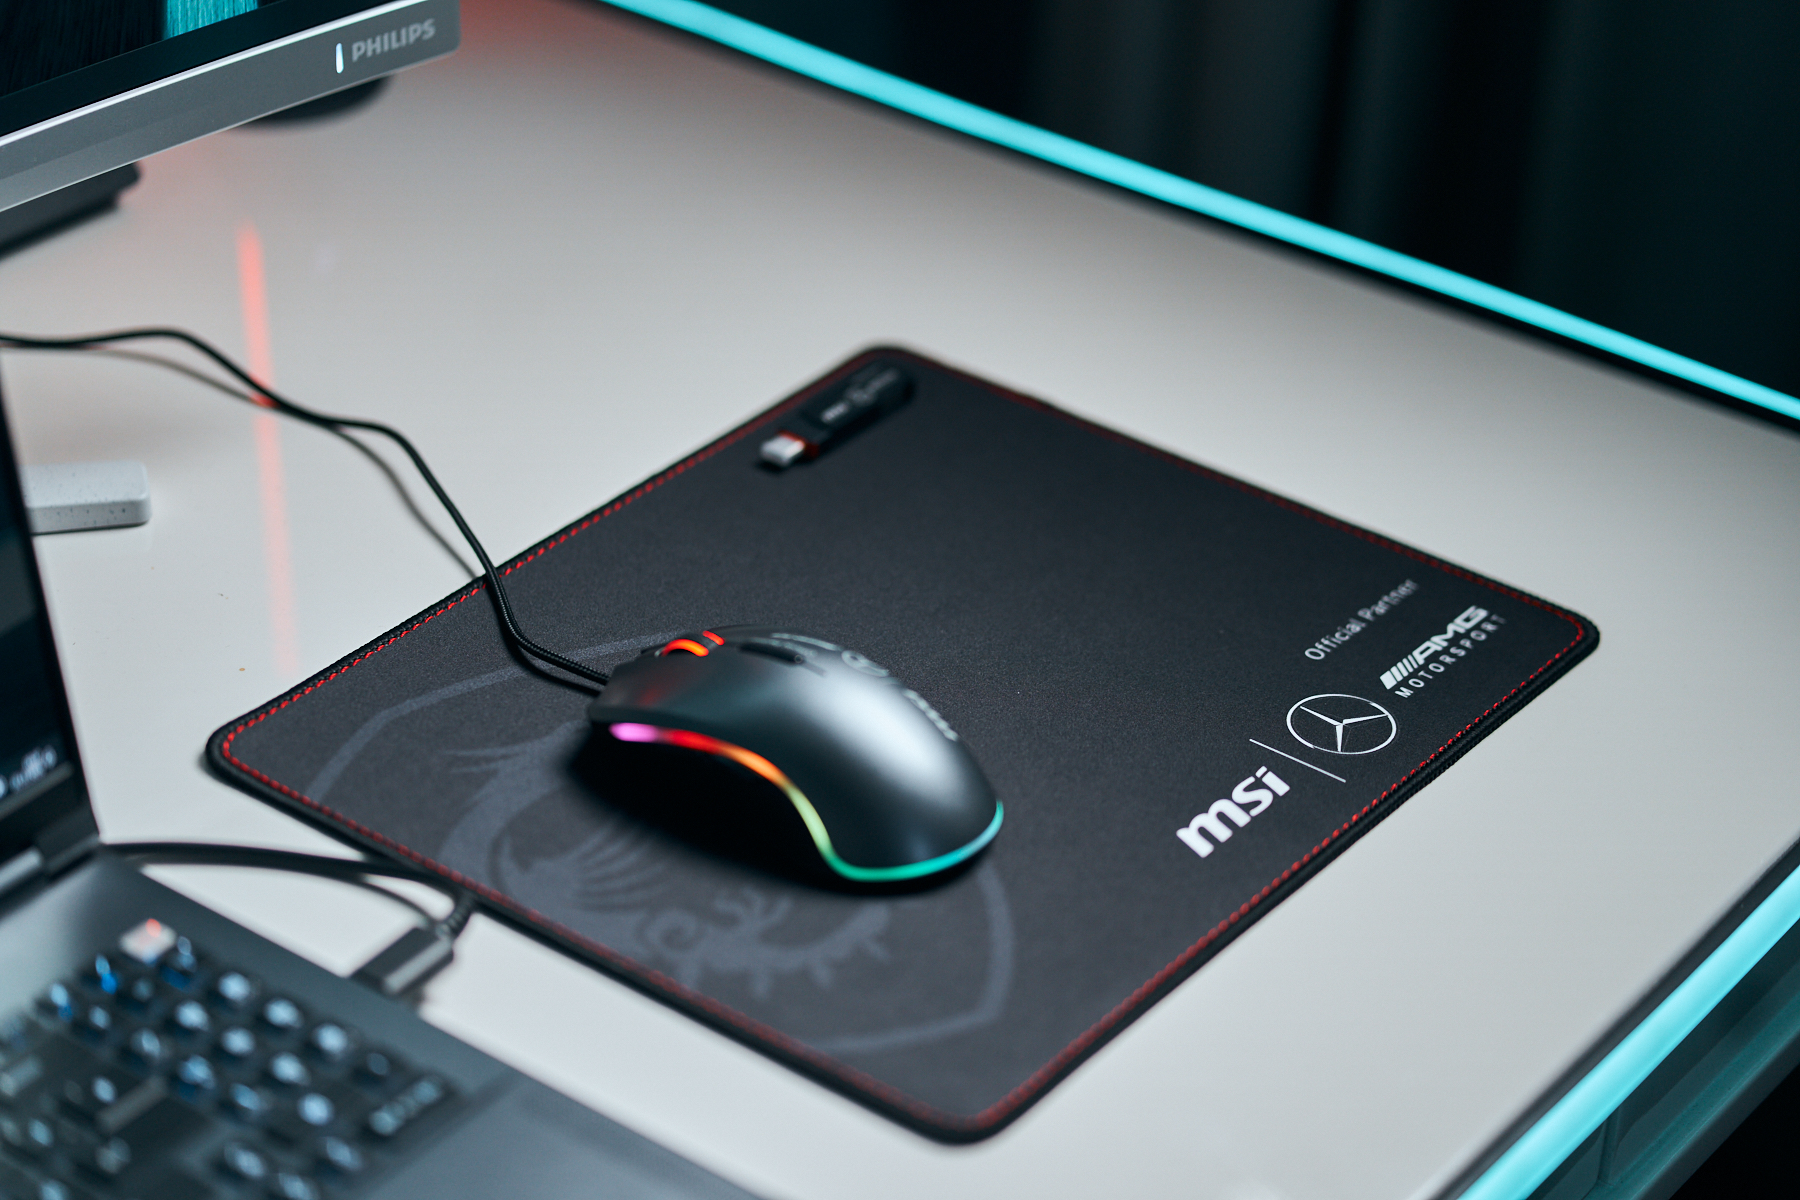
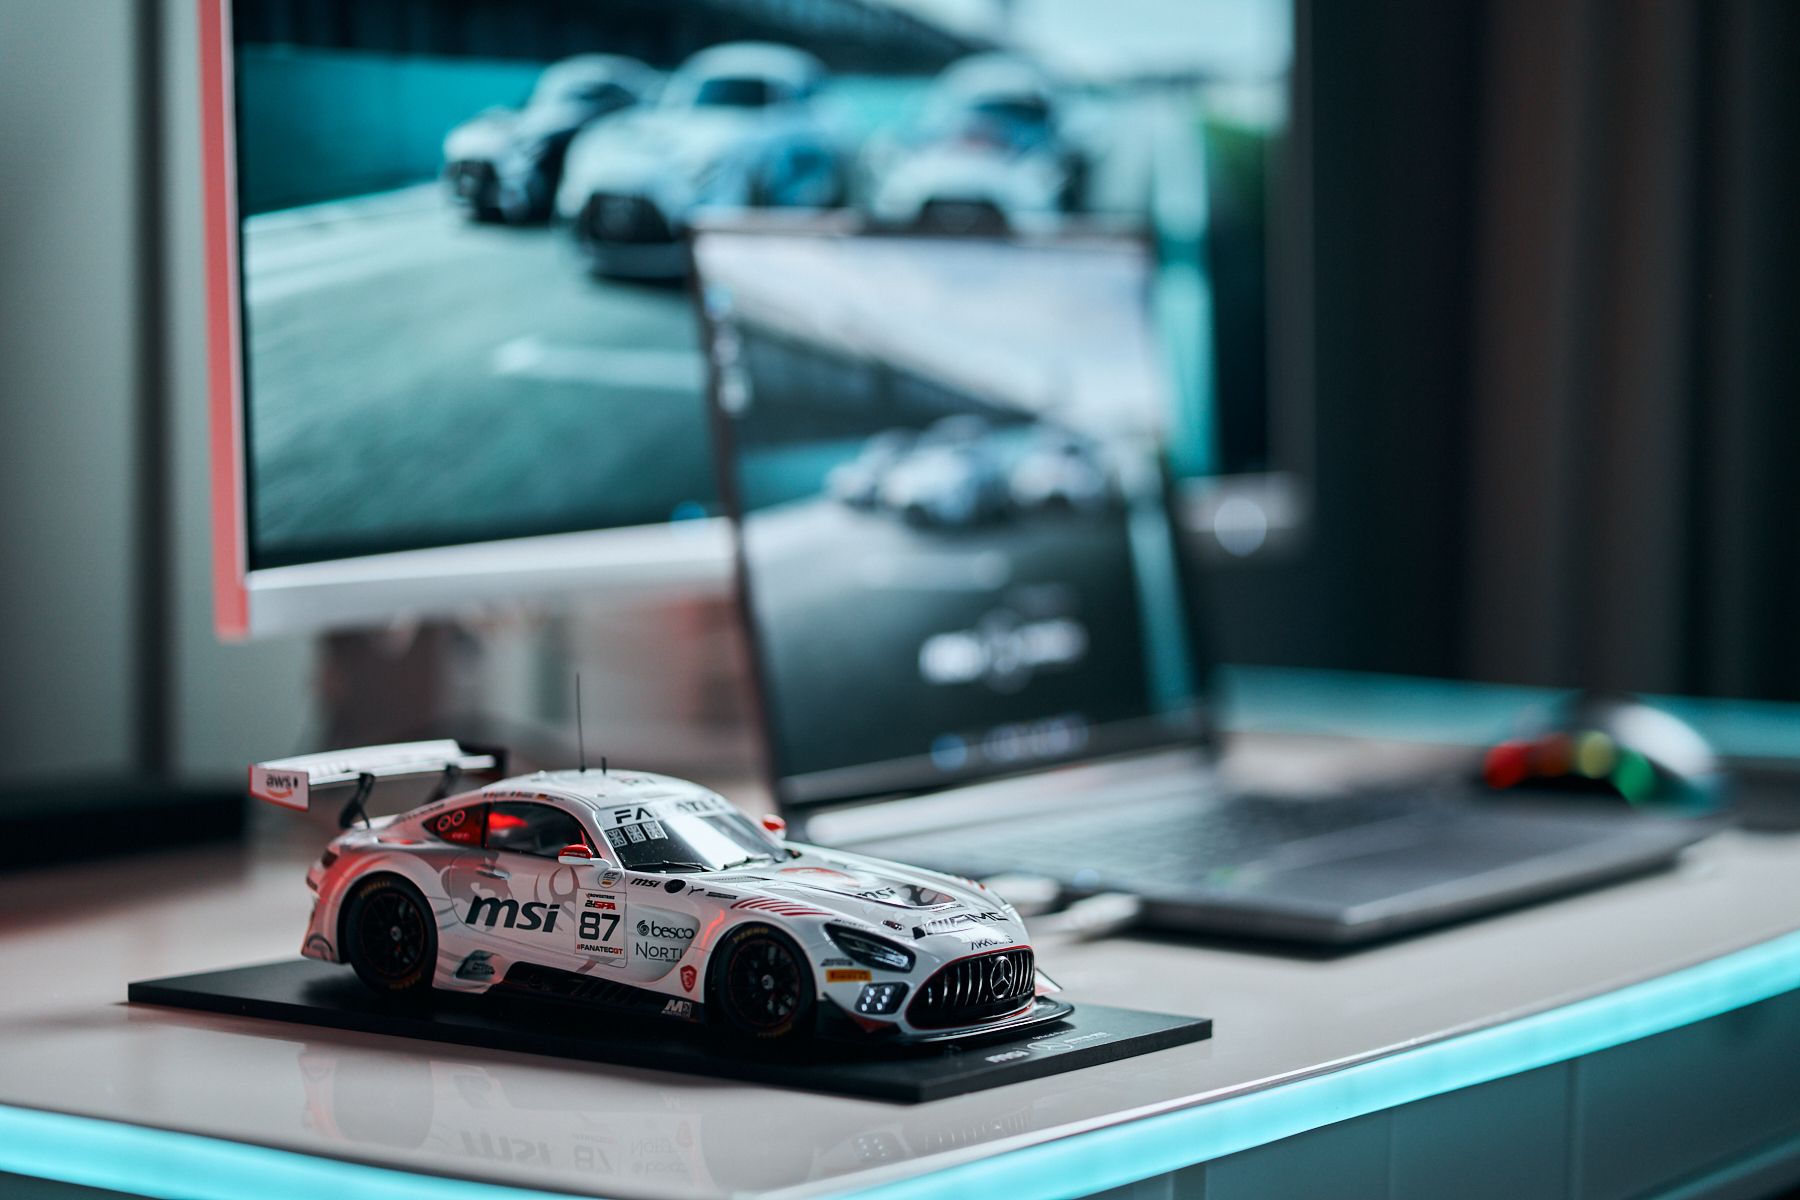
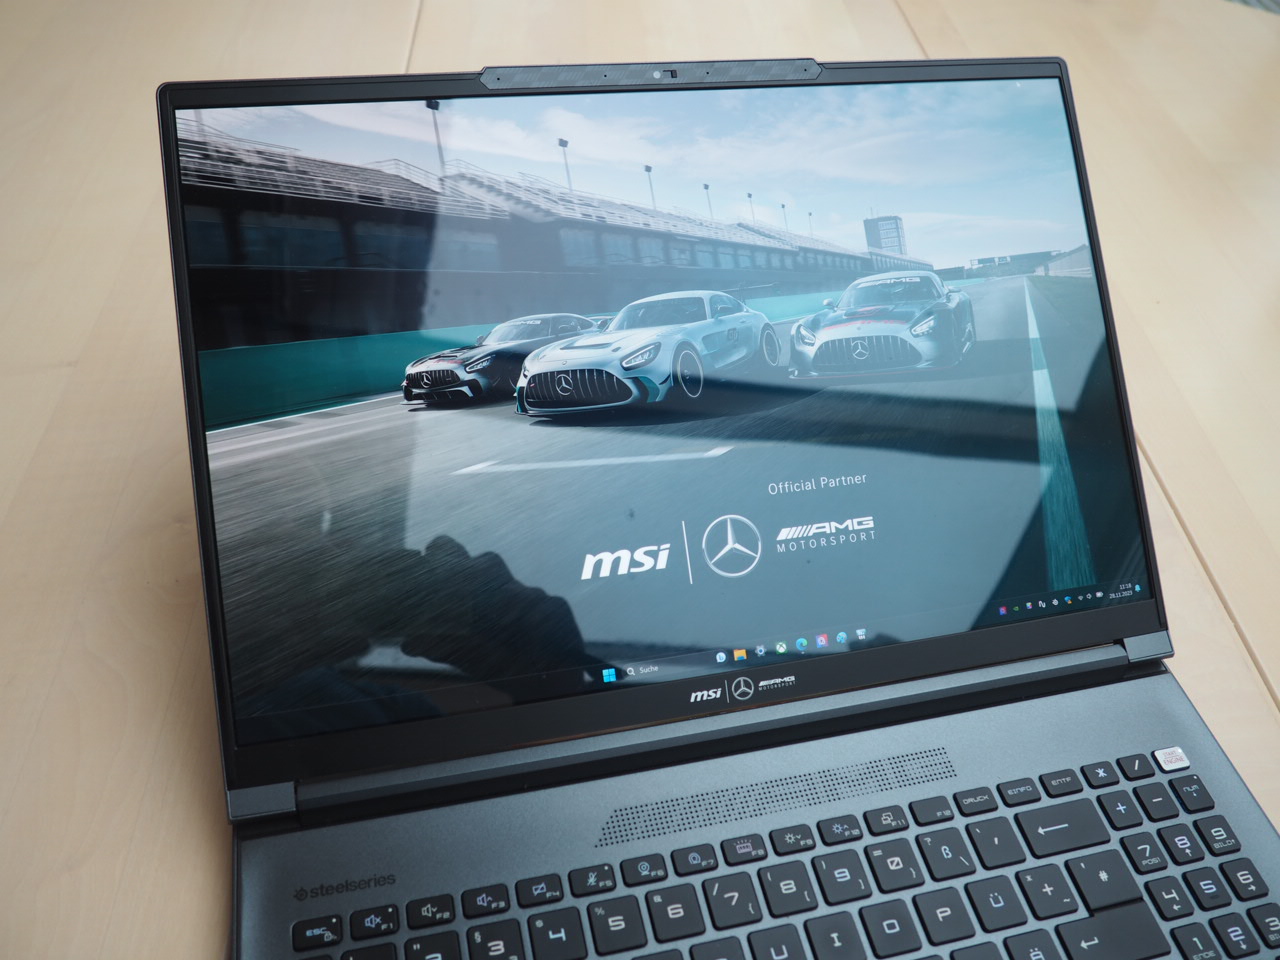
MSI włożyło wiele wysiłku w projekt wizualny specjalnej edycji, włączając odniesienia do producenta motoryzacyjnego w całej obudowie. Obejmują one różne rozmieszczenia napisów AMG (pokrywa, przód, ramka wyświetlacza, kratka wentylacyjna, podstawa), a także inne elementy wzornictwa nawiązujące do sportów motorowych. Przykłady obejmują wzór przypominający flagę na pasku kamery internetowej, klawisz spacji i gumowe nóżki, a także przycisk zasilania z napisem "Start Engine".


Łączność
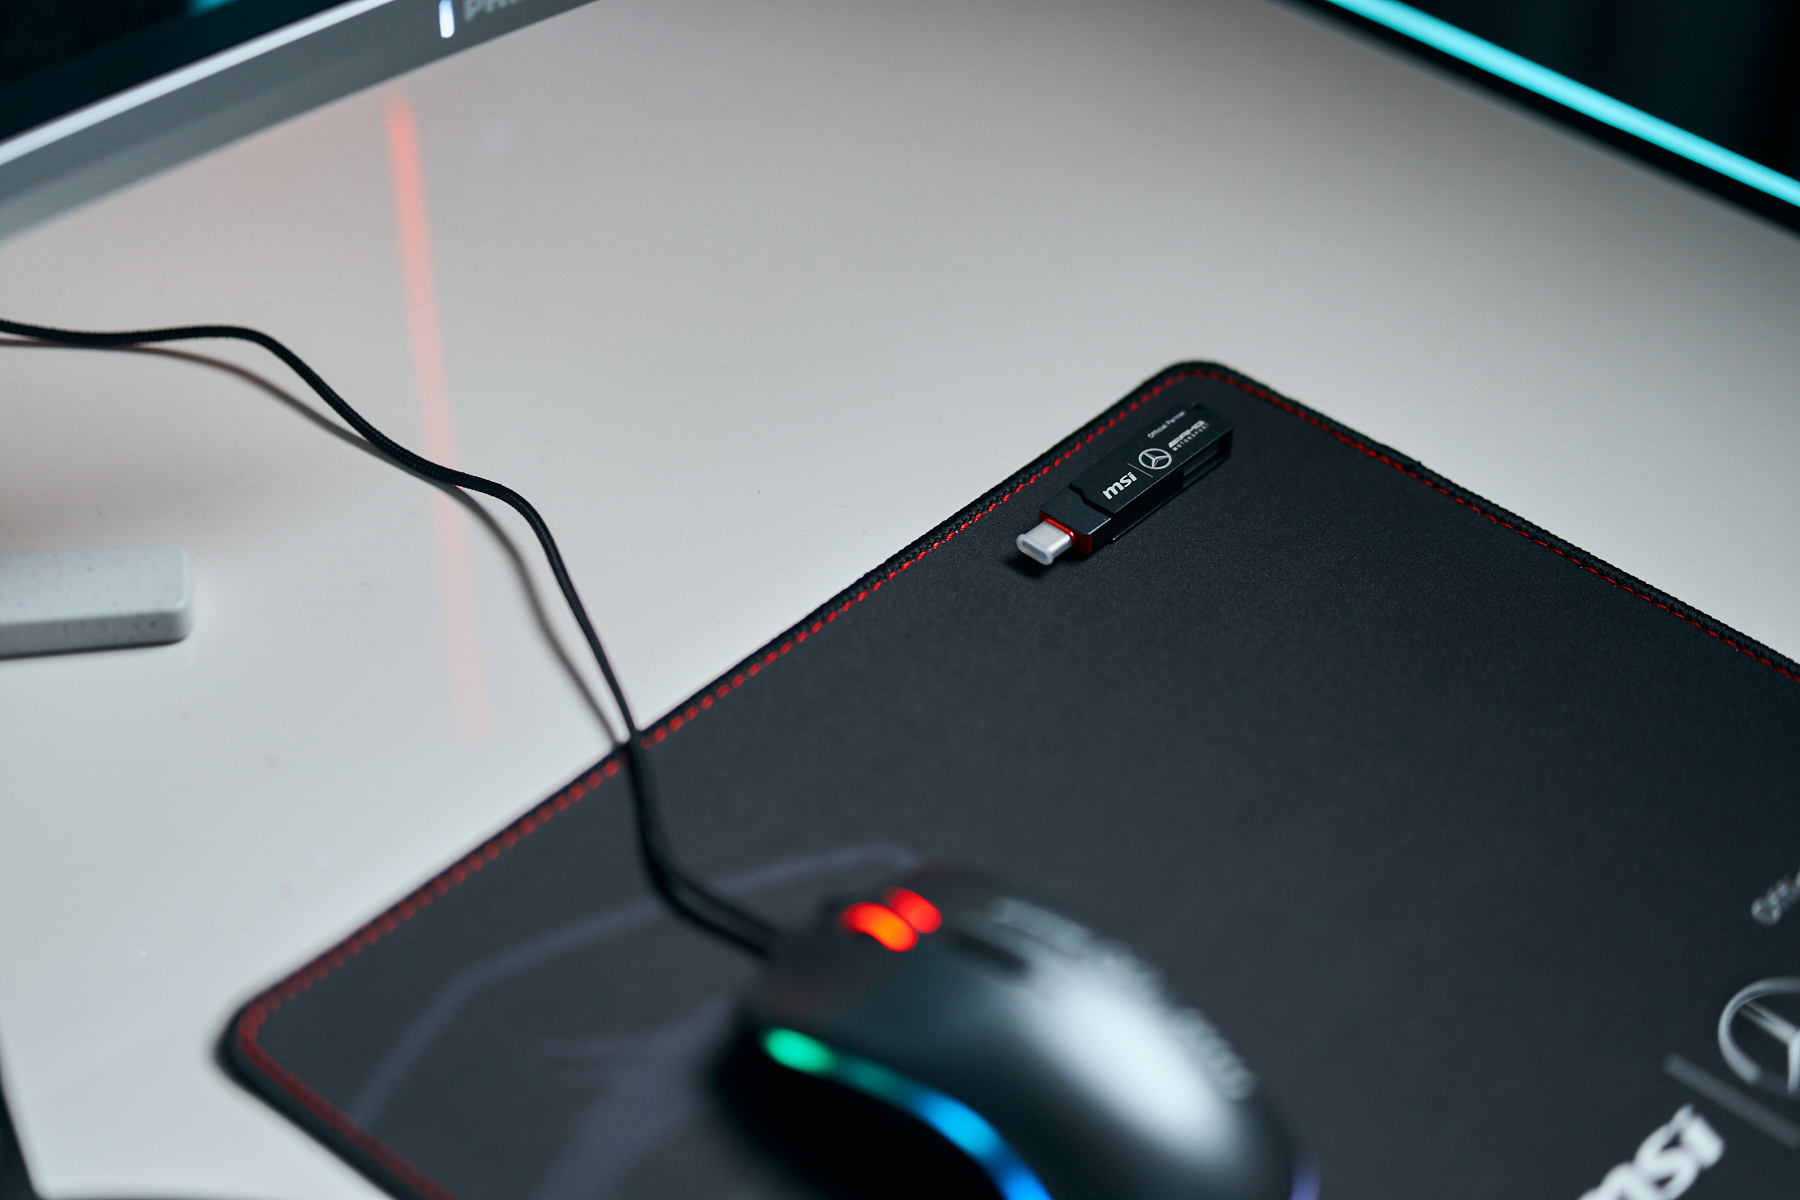
Pod względem wyposażenia na szczególną uwagę zasługuje bogaty zakres dostawy. Oprócz notebooka i 240-watowego zasilacza, wersja Mercedes zawiera mysz, podkładkę pod mysz, pamięć USB i torbę na akcesoria.
Czytnik kart SD
| SD Card Reader | |
| average JPG Copy Test (av. of 3 runs) | |
| MSI Stealth 16 Mercedes-AMG Motorsport A13VG (AV PRO microSD 128 GB V60) | |
| MSI Stealth 16 Studio A13VG | |
| Średnia w klasie Gaming (20.9 - 210, n=53, ostatnie 2 lata) | |
| Schenker XMG Pro 16 Studio (Mid 23) (AV PRO microSD 128 GB V60) | |
| Schenker XMG CORE 16 (L23) | |
| maximum AS SSD Seq Read Test (1GB) | |
| MSI Stealth 16 Mercedes-AMG Motorsport A13VG (AV PRO microSD 128 GB V60) | |
| MSI Stealth 16 Studio A13VG | |
| Średnia w klasie Gaming (25.5 - 261, n=50, ostatnie 2 lata) | |
| Schenker XMG Pro 16 Studio (Mid 23) (AV PRO microSD 128 GB V60) | |
| Schenker XMG CORE 16 (L23) | |
Komunikacja
Kamera internetowa


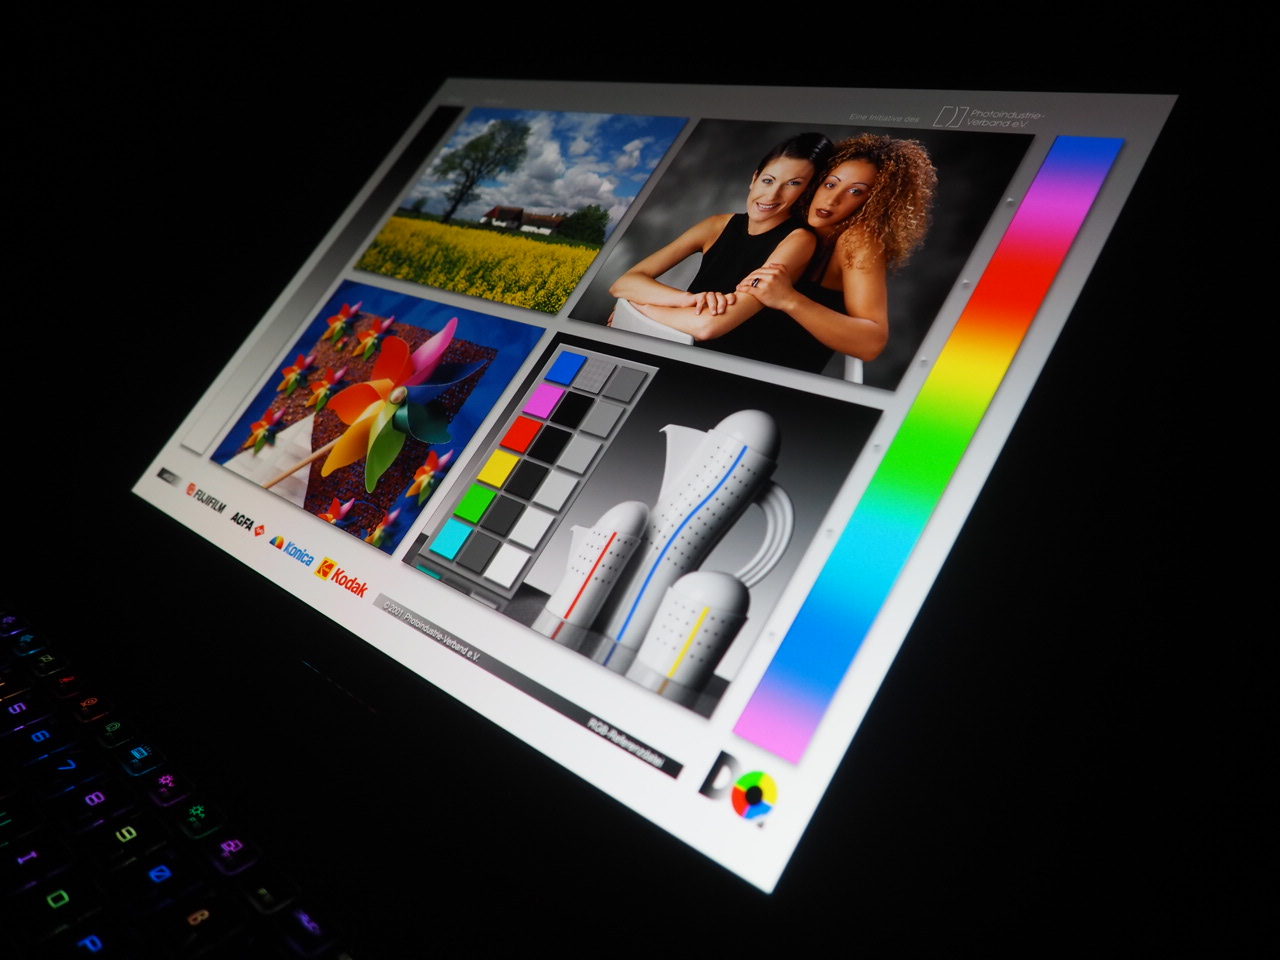
Wyświetlacz
Jak wspomniano wcześniej, specjalna edycja posiada panel OLED, który zapewnia niezwykle ostry obraz, dzięki wysokiej rozdzielczości 3,840 x 2,400 pikseli w formacie 16:10.
| |||||||||||||||||||||||||
rozświetlenie: 96 %
na akumulatorze: 382 cd/m²
kontrast: ∞:1 (czerń: 0 cd/m²)
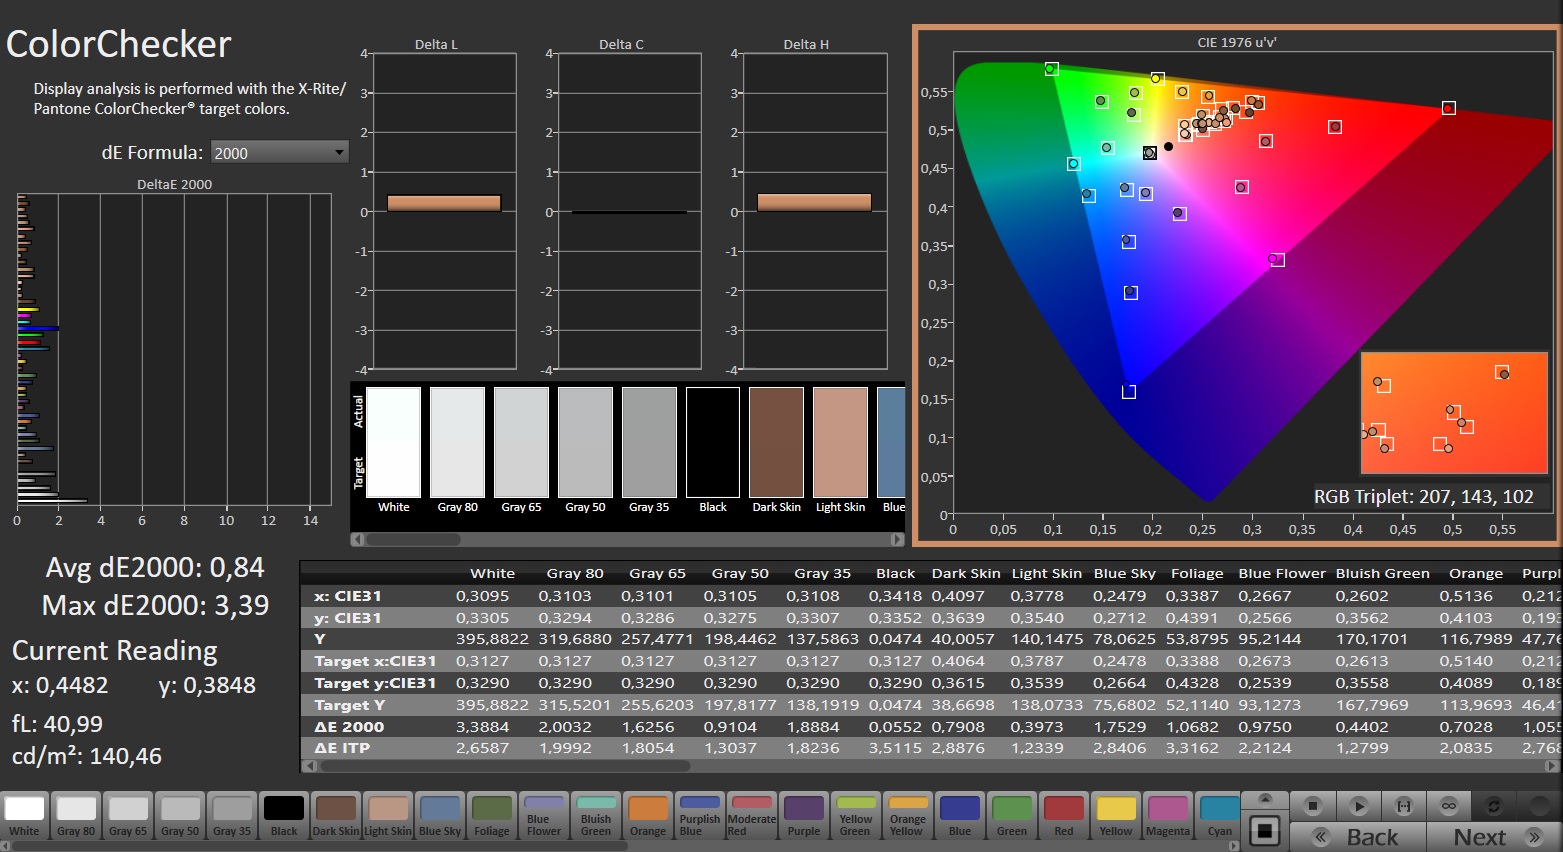
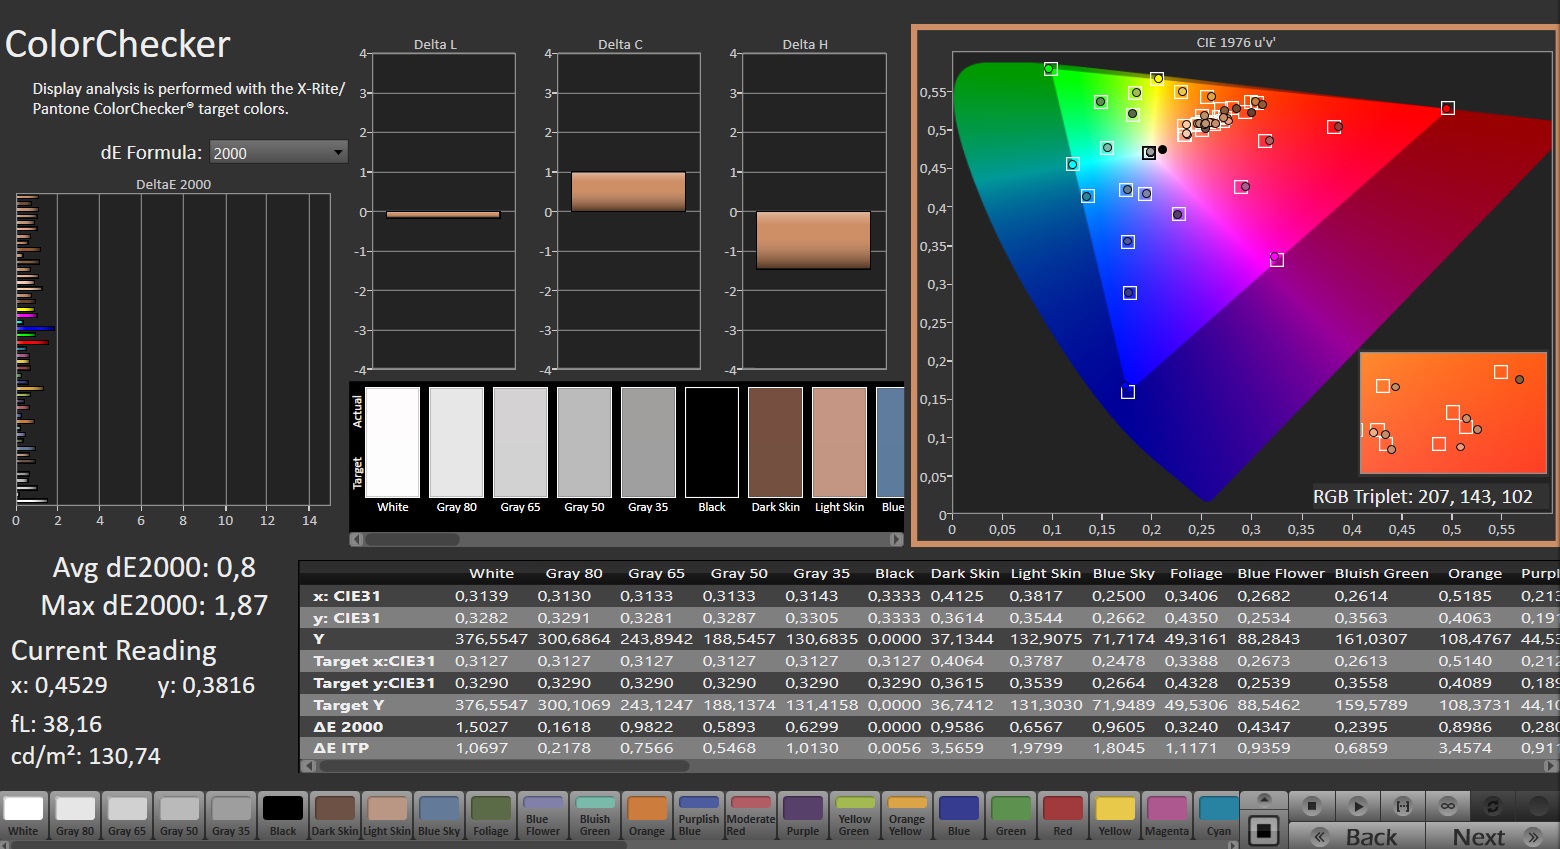
ΔE ColorChecker Calman: 0.84 | ∀{0.5-29.43 Ø4.72}
calibrated: 0.8
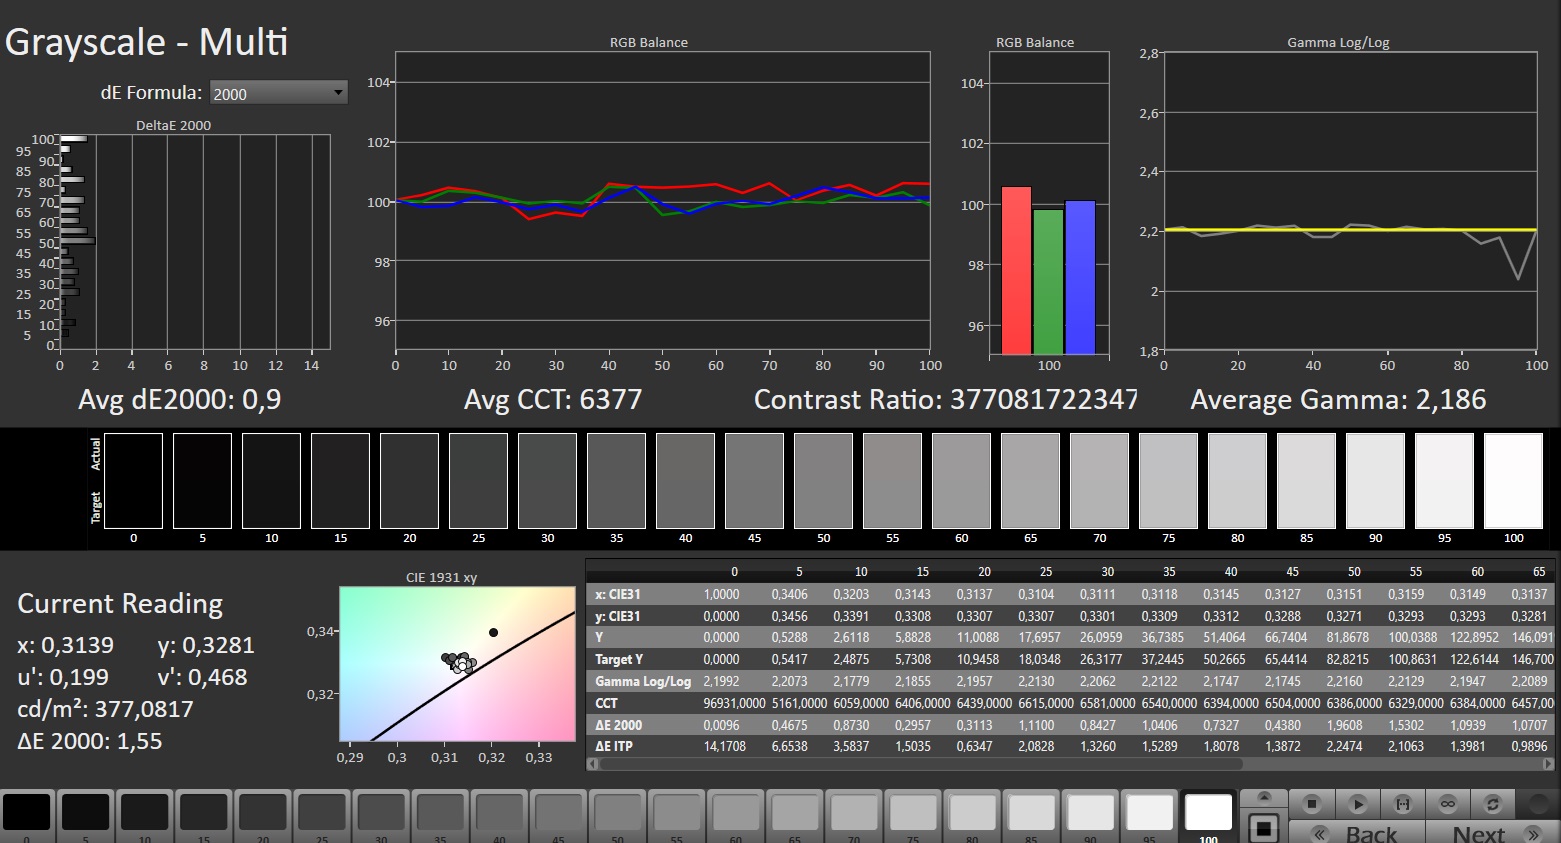
ΔE Greyscale Calman: 1.3 | ∀{0.09-98 Ø4.97}
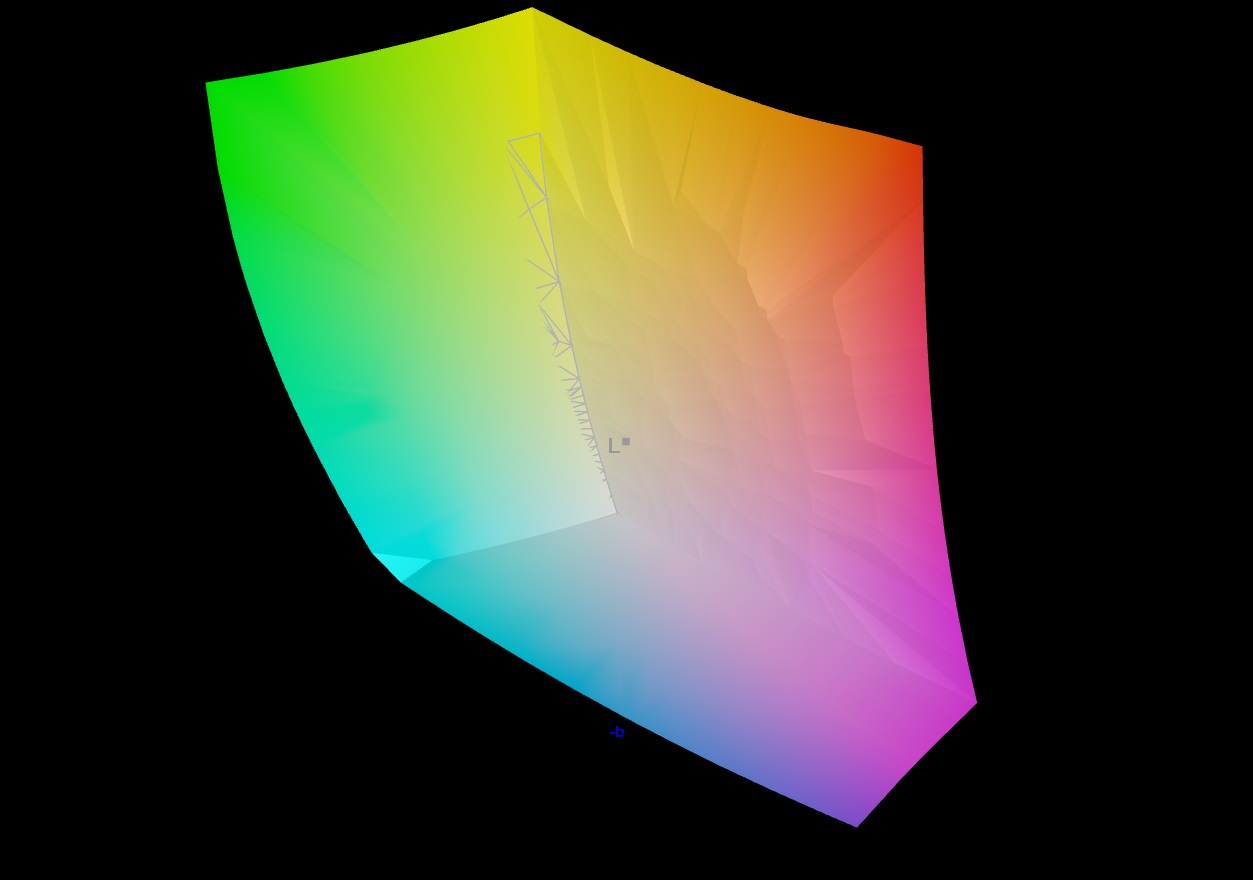
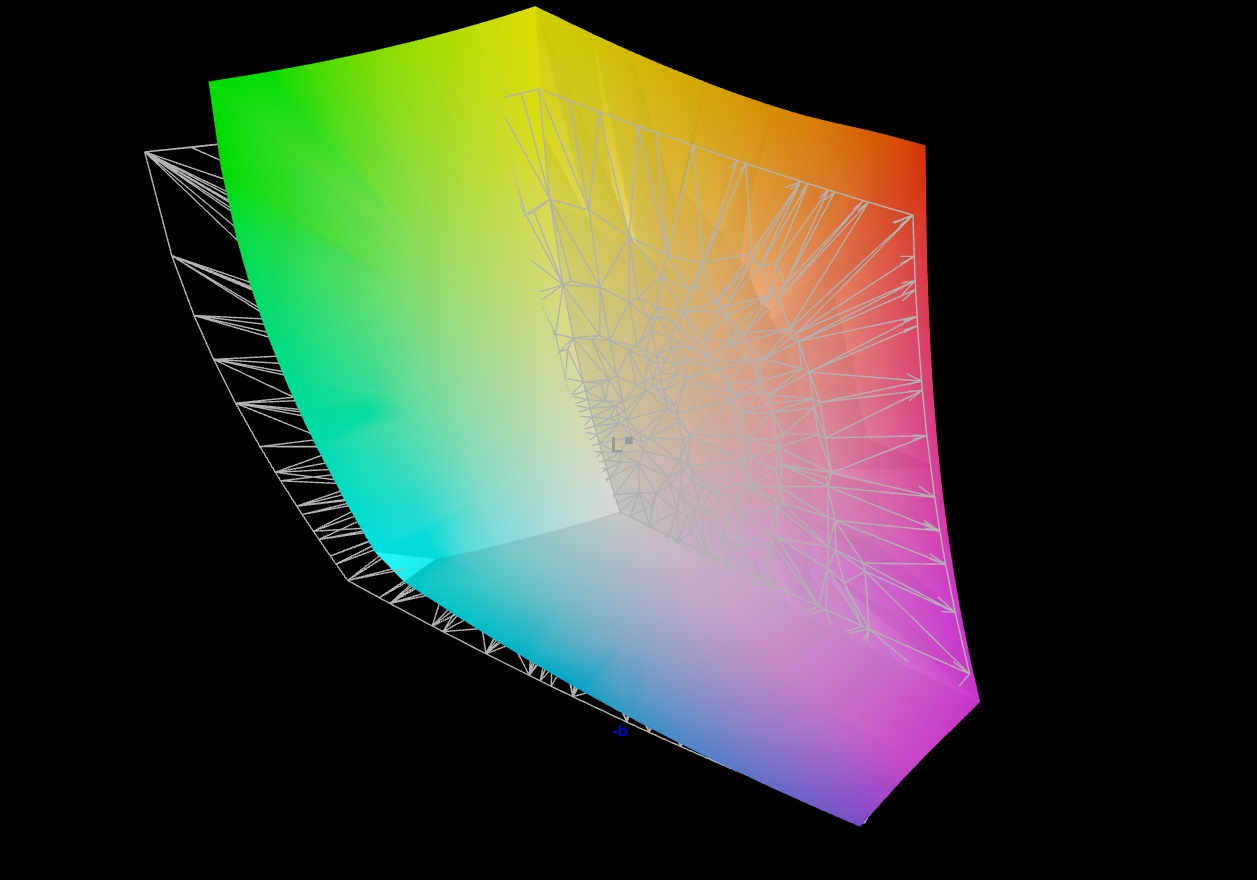
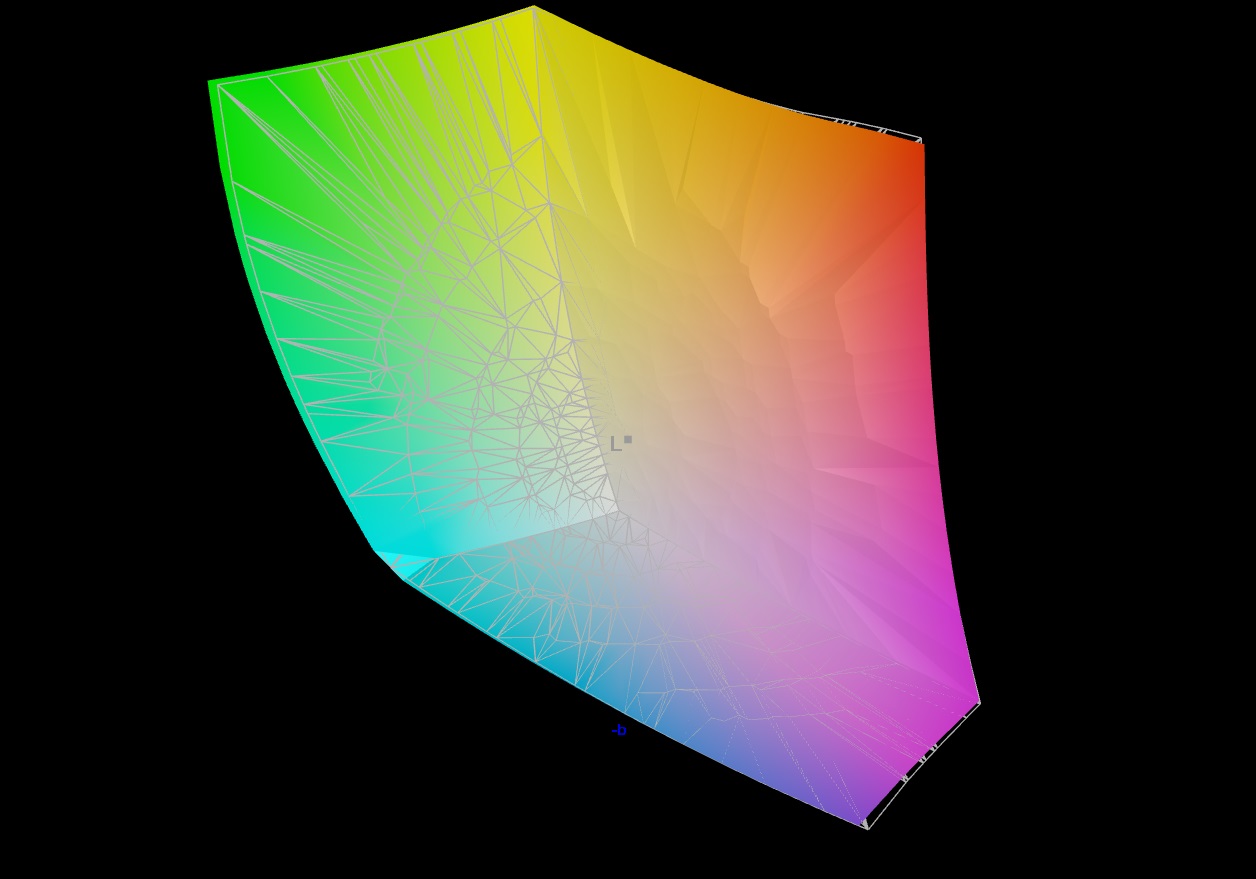
88.4% AdobeRGB 1998 (Argyll 3D)
99.9% sRGB (Argyll 3D)
99.2% Display P3 (Argyll 3D)
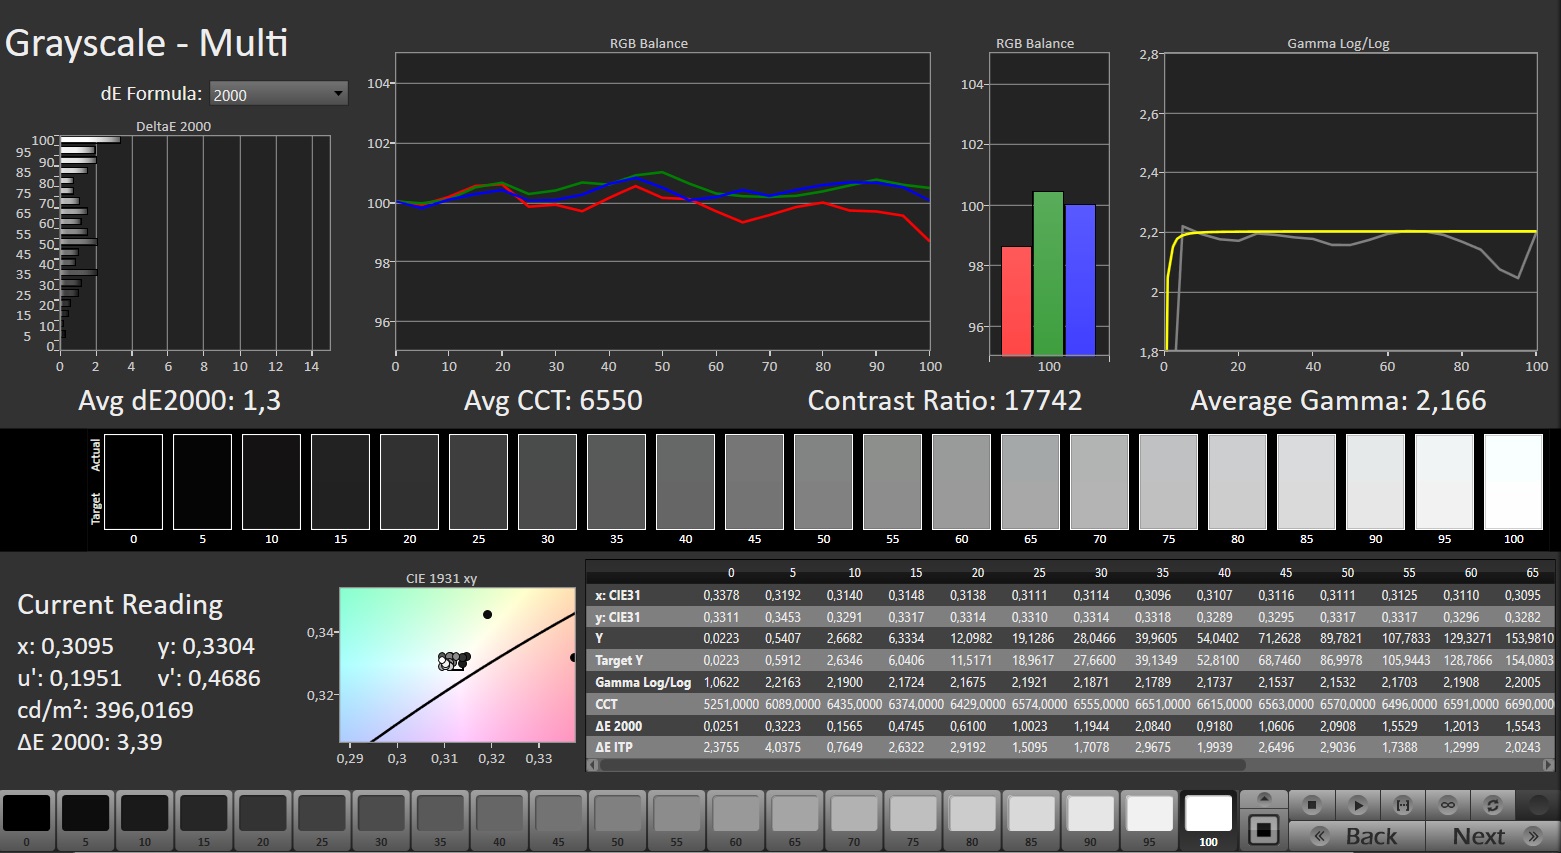
Gamma: 2.166
CCT: 6550 K
| MSI Stealth 16 Mercedes-AMG Motorsport A13VG ATNA60YV09-0 (SDC4191), OLED, 3840x2400, 16" | MSI Stealth 16 Studio A13VG AUO26A9, IPS, 2560x1600, 16" | Schenker XMG Pro 16 Studio (Mid 23) BOE CQ NE160QDM-NZ1, IPS, 2560x1600, 16" | HP Omen Transcend 16 AUOA3A6, Mini-LED, 2560x1600, 16" | Lenovo Legion Pro 5 16ARX8 CSOT T3 MNG007DA1-Q, IPS, 2560x1600, 16" | Schenker XMG CORE 16 (L23) BOE0AF0 (), IPS, 2560x1600, 16" | |
|---|---|---|---|---|---|---|
| Display | -2% | -18% | -0% | -16% | -18% | |
| Display P3 Coverage (%) | 99.2 | 96.4 -3% | 69.4 -30% | 99.2 0% | 70.4 -29% | 68.3 -31% |
| sRGB Coverage (%) | 99.9 | 99.7 0% | 98.2 -2% | 100 0% | 99.6 0% | 98.6 -1% |
| AdobeRGB 1998 Coverage (%) | 88.4 | 84.8 -4% | 70.1 -21% | 87.6 -1% | 72.6 -18% | 69.6 -21% |
| Response Times | -280% | -628% | -1955% | -513% | -615% | |
| Response Time Grey 50% / Grey 80% * (ms) | 1.5 ? | 4.4 ? -193% | 12.2 ? -713% | 26.4 ? -1660% | 7 ? -367% | 13.2 ? -780% |
| Response Time Black / White * (ms) | 1.2 ? | 5.6 ? -367% | 7.7 ? -542% | 28.2 ? -2250% | 9.1 ? -658% | 6.6 ? -450% |
| PWM Frequency (Hz) | 60 ? | 3506 ? | ||||
| Screen | -127% | -74% | -120% | 2% | -75% | |
| Brightness middle (cd/m²) | 382 | 424 11% | 349 -9% | 791.1 107% | 355.3 -7% | 376 -2% |
| Brightness (cd/m²) | 383 | 411 7% | 348 -9% | 800 109% | 340 -11% | 358 -7% |
| Brightness Distribution (%) | 96 | 88 -8% | 93 -3% | 95 -1% | 91 -5% | 88 -8% |
| Black Level * (cd/m²) | 0.37 | 0.32 | 0.04 | 0.32 | 0.33 | |
| Colorchecker dE 2000 * | 0.84 | 3.04 -262% | 1.98 -136% | 4.37 -420% | 1.13 -35% | 2.74 -226% |
| Colorchecker dE 2000 max. * | 3.39 | 7.5 -121% | 7.56 -123% | 10.39 -206% | 2.78 18% | 6.78 -100% |
| Colorchecker dE 2000 calibrated * | 0.8 | 3.04 -280% | 1.45 -81% | 1.04 -30% | 0.32 60% | 0.88 -10% |
| Greyscale dE 2000 * | 1.3 | 4.34 -234% | 3.3 -154% | 6.5 -400% | 1.4 -8% | 3.57 -175% |
| Gamma | 2.166 102% | 2.32 95% | 2.137 103% | 2.28 96% | 2.24 98% | 2.4 92% |
| CCT | 6550 99% | 6952 93% | 6672 97% | 6000 108% | 6372 102% | 7246 90% |
| Contrast (:1) | 1146 | 1091 | 19778 | 1110 | 1139 | |
| Całkowita średnia (program / ustawienia) | -136% /
-121% | -240% /
-152% | -692% /
-396% | -176% /
-88% | -236% /
-151% |
* ... im mniej tym lepiej
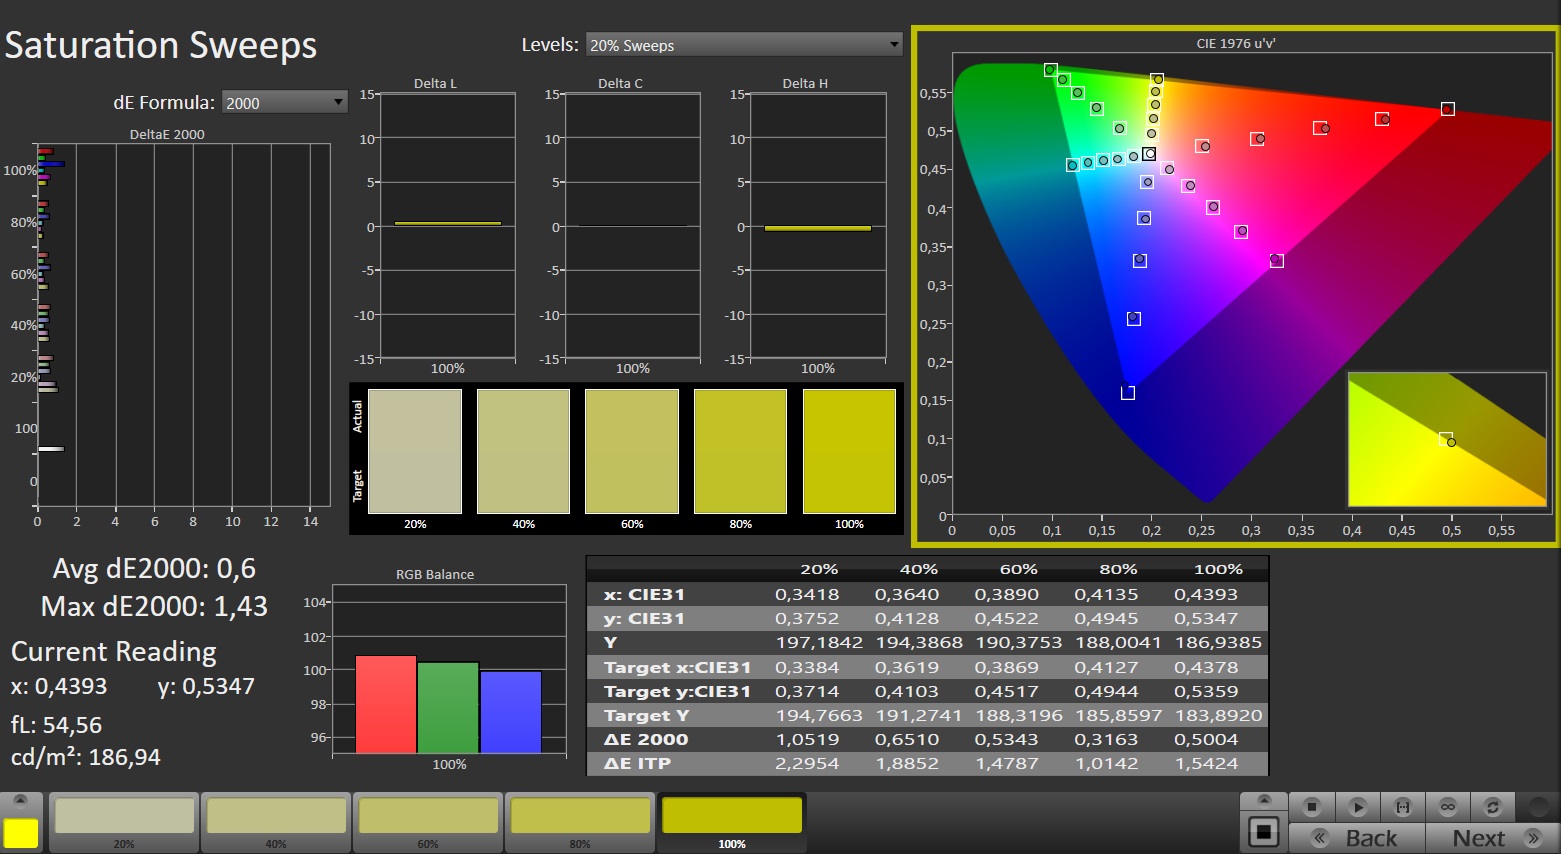
Ekran zapewnia również dobrą lub bardzo dobrą wydajność w różnych aspektach. Z prawie 100% pokryciem sRGB lub DCI-P3 i 88% pokryciem AdobeRGB, wyróżnia się w przestrzeni kolorów. Dodatkowo, dokładność odwzorowania kolorów jest pierwszorzędna, eliminując potrzebę kalibracji, w przeciwieństwie do niektórych konkurentów. Wyjątkowy poziom czerni wyświetlacza, prawie 0,0 cd/m², przyczynia się do imponującego kontrastu charakterystycznego dla OLED-ów, przewyższając tradycyjne panele IPS. Ta sama przewaga rozciąga się na stabilność kąta widzenia i czas reakcji, dzięki czemu notebooki OLED są obecnie punktem odniesienia w tych aspektach.

Niemniej jednak kupujący muszą zmagać się z typowymi wadami, w tym niską częstotliwością i migotaniem. Wyświetlacz migocze przy 60 Hz poniżej 90% jasności i przy 240 Hz poniżej 50%. Wartości te mogą stanowić problem dla osób wrażliwych na takie czynniki.
Błyszcząca powierzchnia, czasami powodująca znaczne odbicia, może być problemem dla wielu użytkowników w codziennym użytkowaniu. Pomimo przyzwoitej średniej jasności wynoszącej 383 cd/m², przydatność Stealth 16 na zewnątrz lub w dobrze oświetlonym otoczeniu jest nieco ograniczona.
Wyświetl czasy reakcji
| ↔ Czas reakcji od czerni do bieli | ||
|---|---|---|
| 1.2 ms ... wzrost ↗ i spadek ↘ łącznie | ↗ 0.6 ms wzrost | 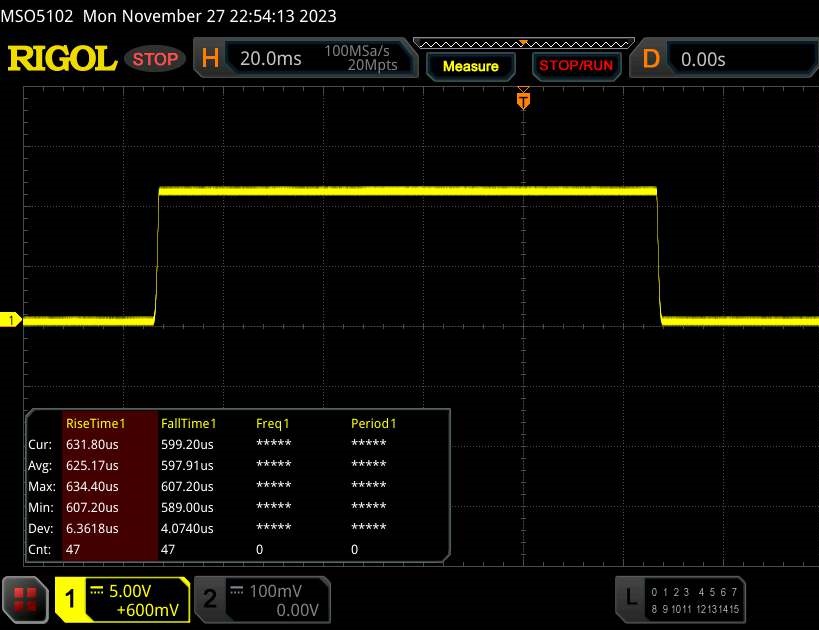 |
| ↘ 0.6 ms upadek | ||
| W naszych testach ekran wykazuje bardzo szybką reakcję i powinien bardzo dobrze nadawać się do szybkich gier. Dla porównania, wszystkie testowane urządzenia wahają się od 0.1 (minimum) do 240 (maksimum) ms. » 6 % wszystkich urządzeń jest lepszych. Oznacza to, że zmierzony czas reakcji jest lepszy od średniej wszystkich testowanych urządzeń (19.8 ms). | ||
| ↔ Czas reakcji 50% szarości do 80% szarości | ||
| 1.5 ms ... wzrost ↗ i spadek ↘ łącznie | ↗ 0.8 ms wzrost | 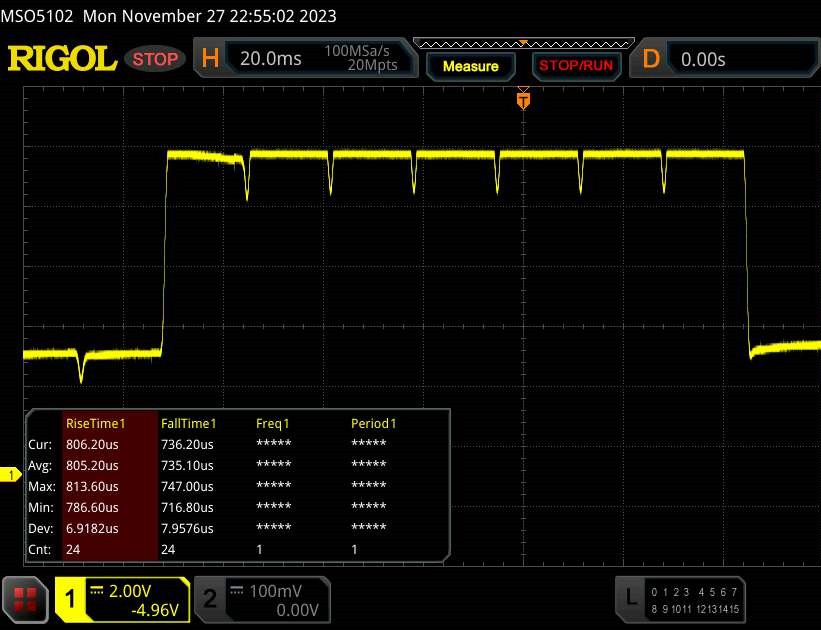 |
| ↘ 0.7 ms upadek | ||
| W naszych testach ekran wykazuje bardzo szybką reakcję i powinien bardzo dobrze nadawać się do szybkich gier. Dla porównania, wszystkie testowane urządzenia wahają się od 0.165 (minimum) do 636 (maksimum) ms. » 7 % wszystkich urządzeń jest lepszych. Oznacza to, że zmierzony czas reakcji jest lepszy od średniej wszystkich testowanych urządzeń (31 ms). | ||
Migotanie ekranu / PWM (modulacja szerokości impulsu)
| Wykryto migotanie ekranu/wykryto PWM | 60 Hz | ≤ 90 % ustawienia jasności | 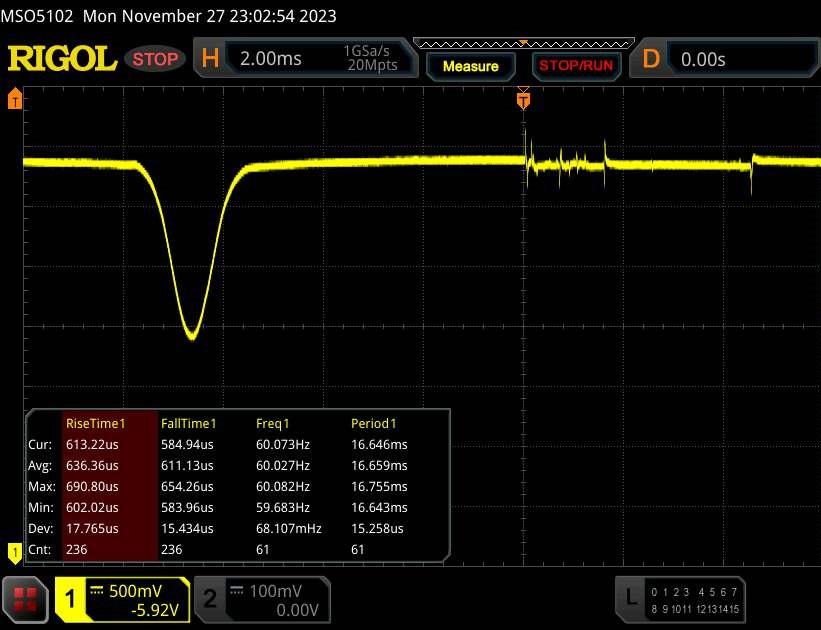 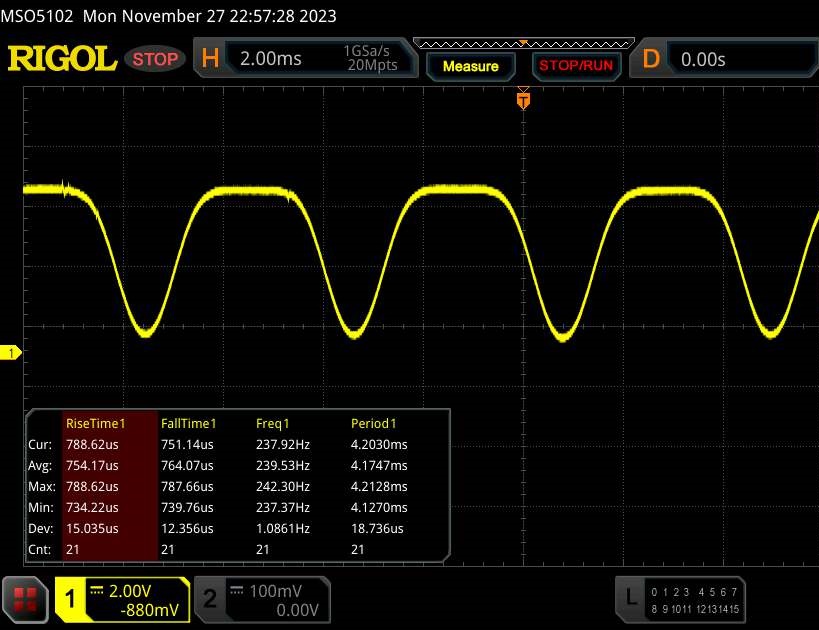 |
Podświetlenie wyświetlacza miga z częstotliwością 60 Hz (najgorszy przypadek, np. przy użyciu PWM) Wykryto migotanie przy ustawieniu jasności 90 % i poniżej. Powyżej tego ustawienia jasności nie powinno być żadnego migotania ani PWM. Częstotliwość 60 Hz jest bardzo niska, więc migotanie może powodować zmęczenie oczu i bóle głowy po dłuższym użytkowaniu. Dla porównania: 52 % wszystkich testowanych urządzeń nie używa PWM do przyciemniania wyświetlacza. Jeśli wykryto PWM, zmierzono średnio 7763 (minimum: 5 - maksimum: 343500) Hz. | |||
Wydajność
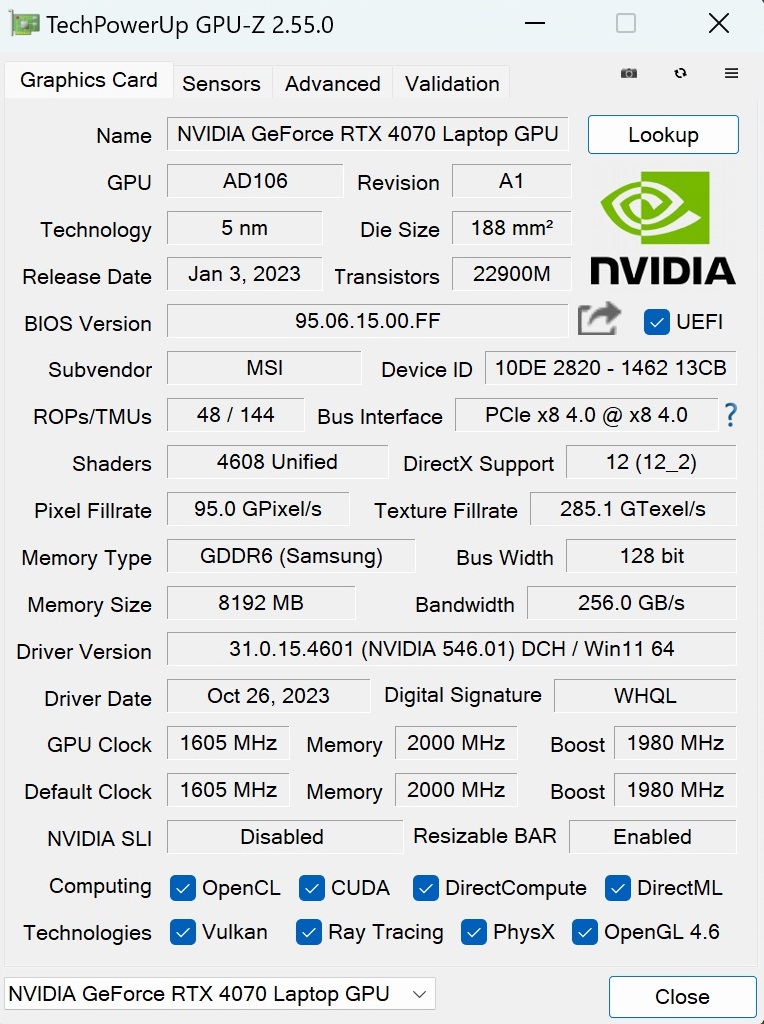
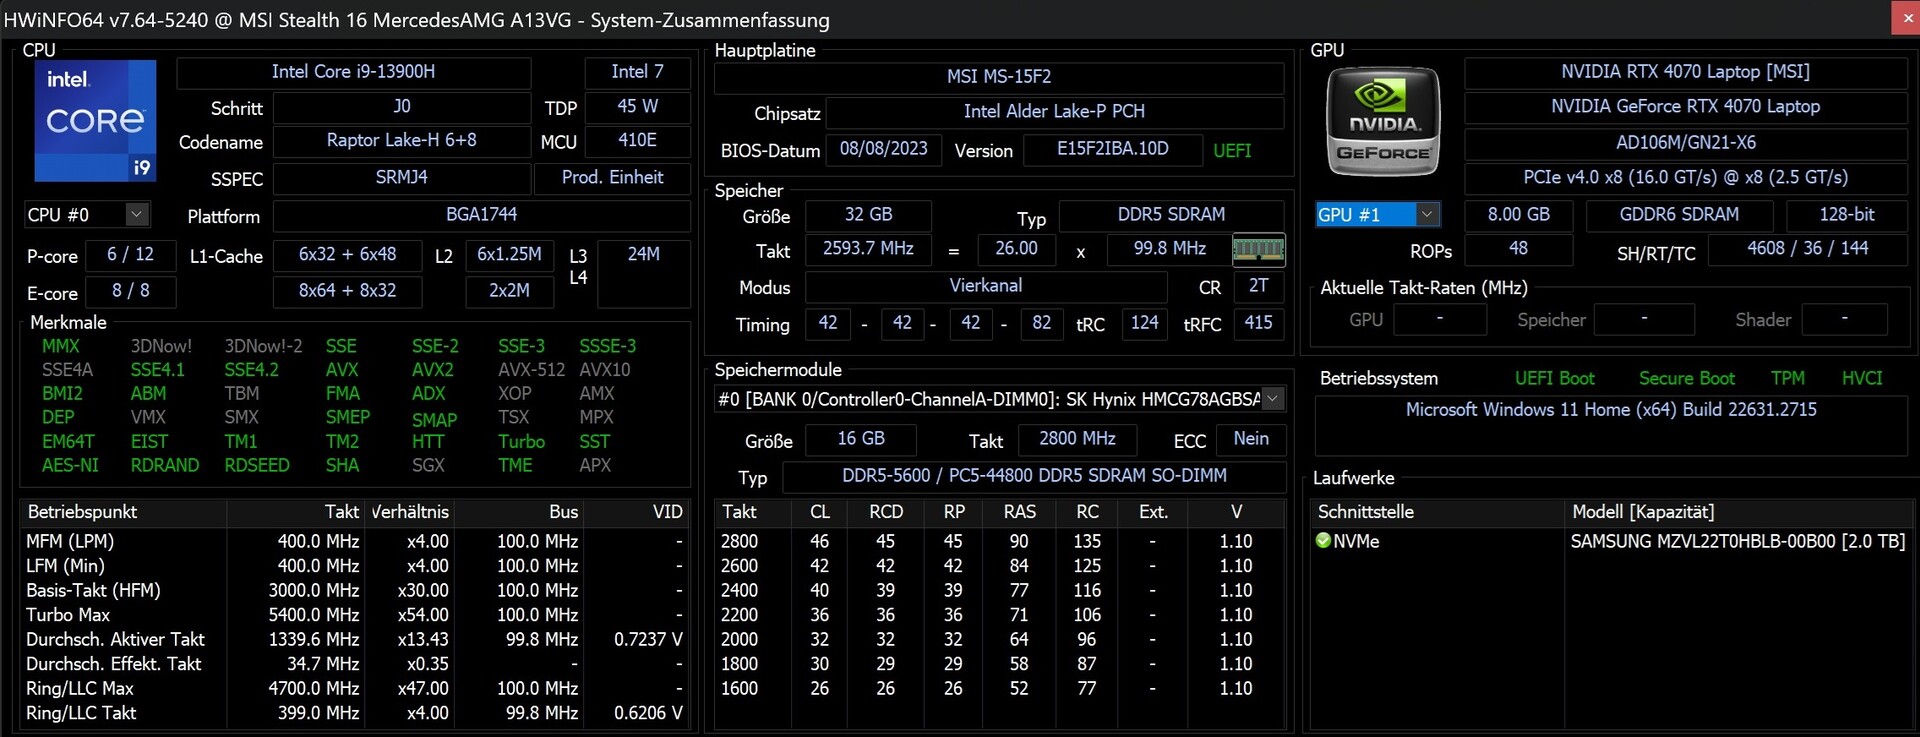
Z zaledwie 8 GB pamięci VRAM dla karty GeForce RTX 4070, która w momencie premiery została uznana za przestarzałą w tym segmencie cenowym, 16-calowy komputer plasuje się w górnej części średniej półki, szczególnie pod względem wydajności GPU. Wydajność procesora jest na najwyższym poziomie, Stealth 16 jest na samym szczycie, a duża ilość pamięci RAM i konfiguracja SSD powinny zapewnić wystarczające rezerwy dla większości użytkowników.
Warunki testowania
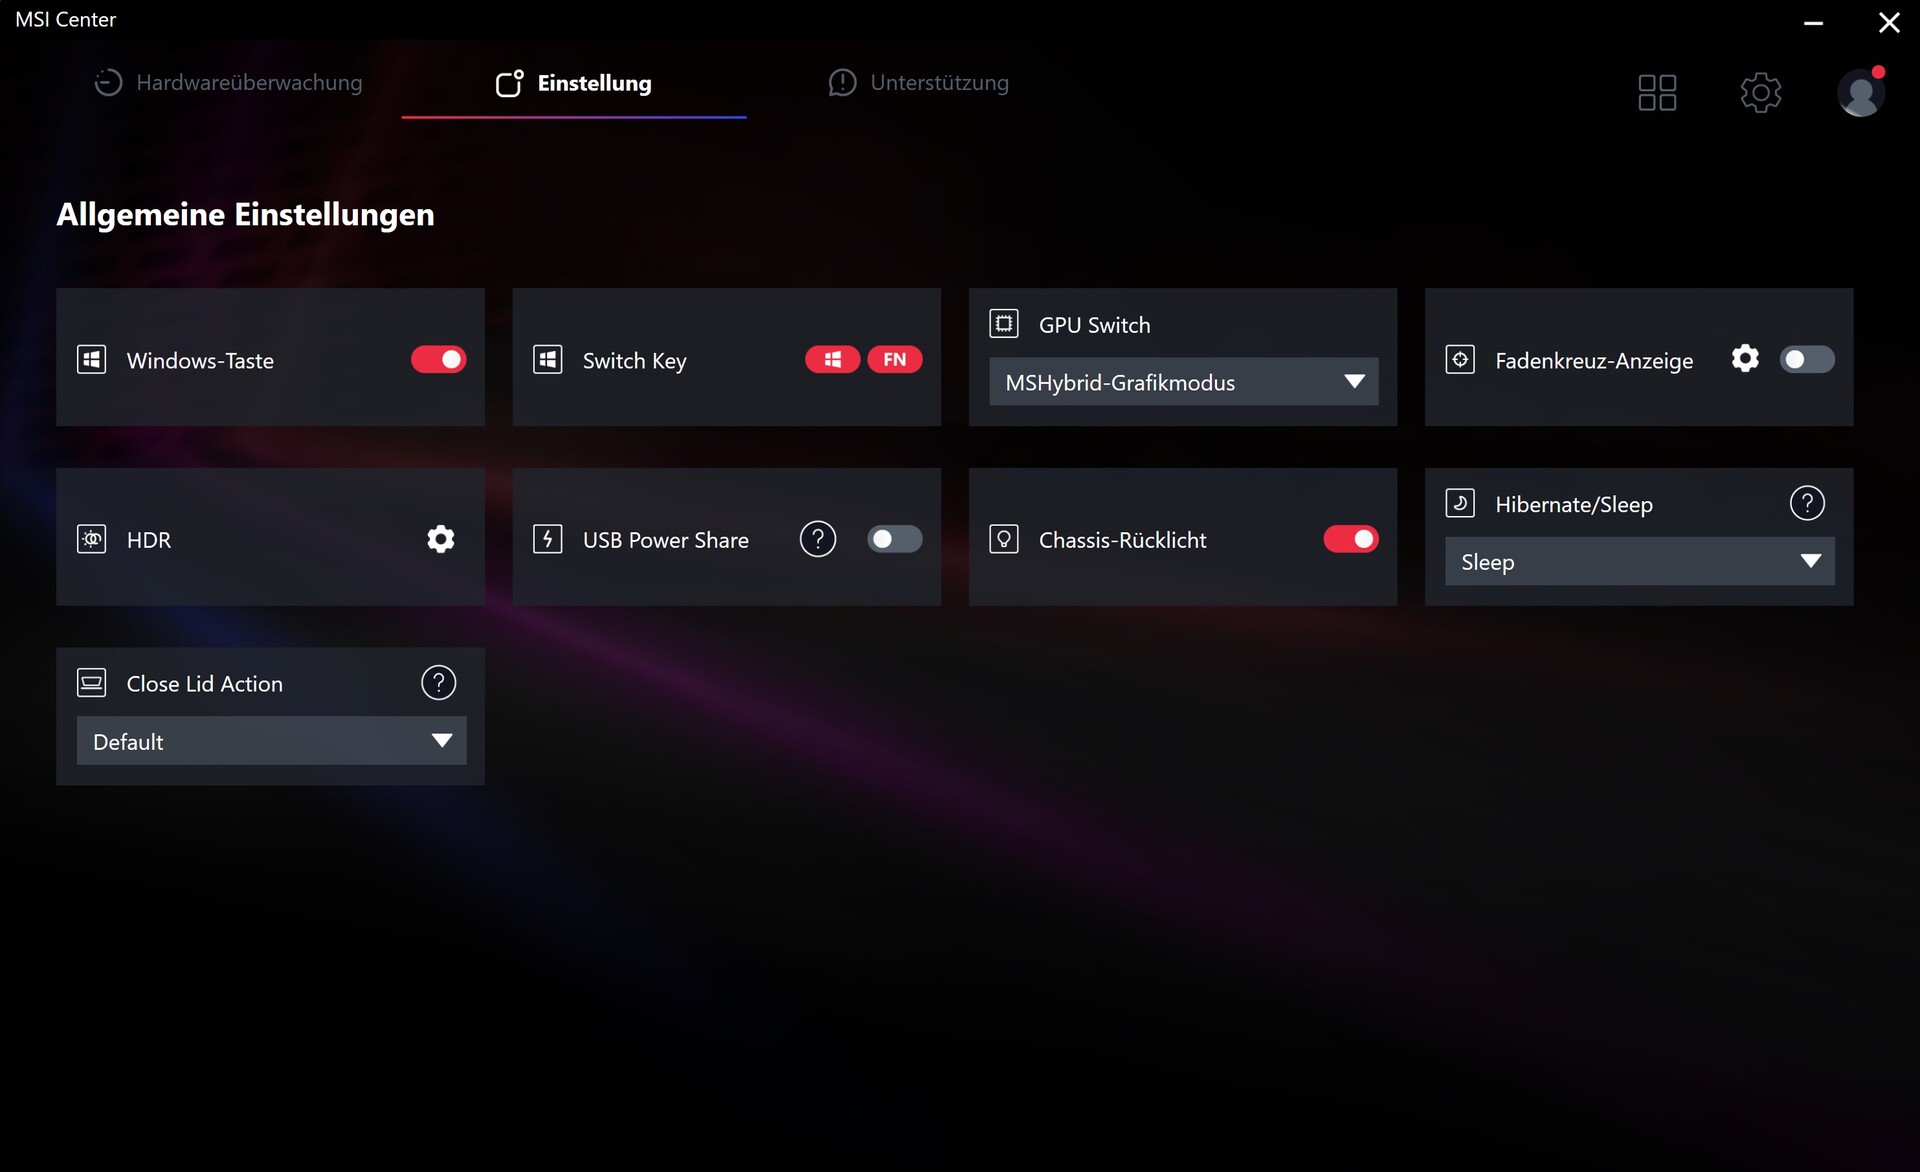
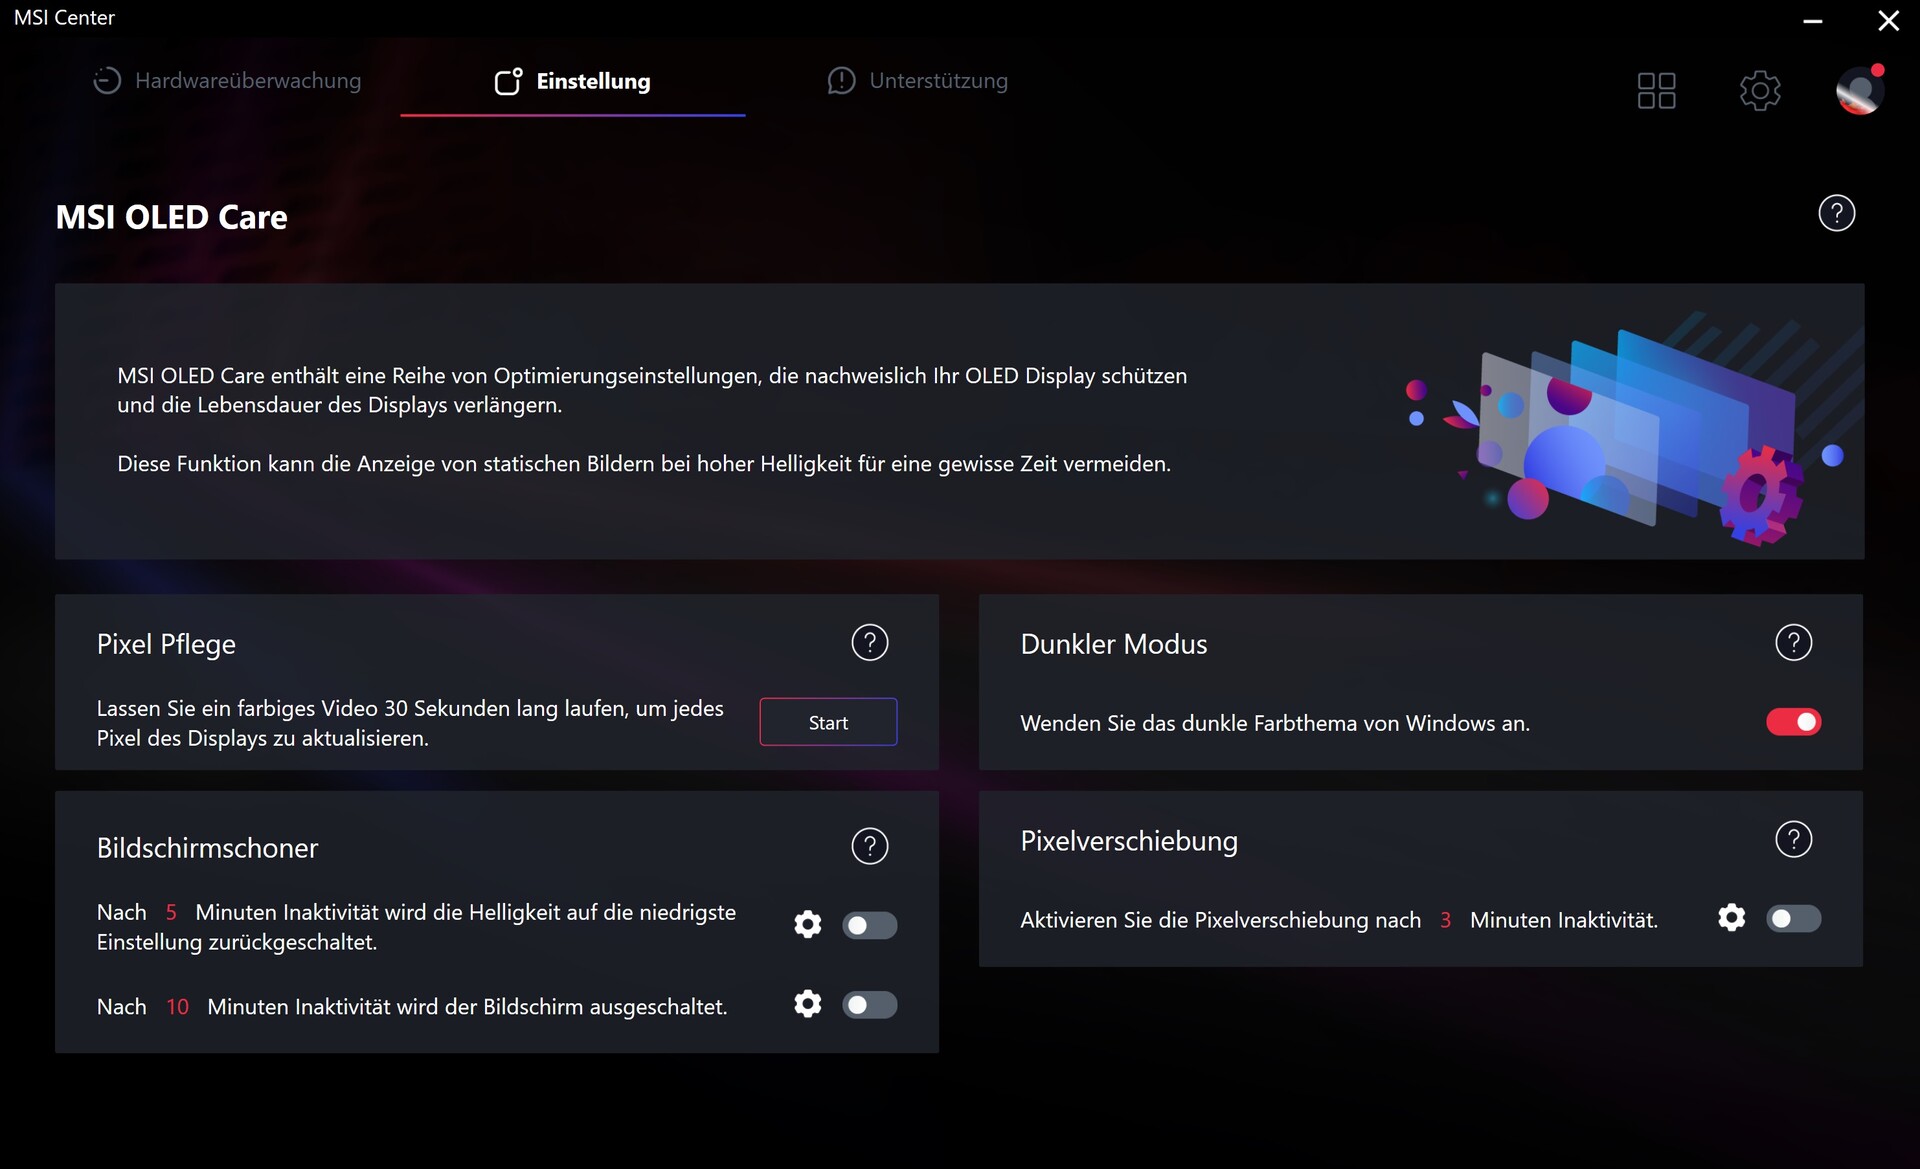
Preinstalowany MSI Center oferuje różne tryby pracy, od Eco do Sport. Wszystkie pomiary zostały przeprowadzone w trybie Smart Auto, w którym system automatycznie dostosowuje ustawienia. Przełączanie grafiki (MSHybrid) było domyślnie aktywowane.
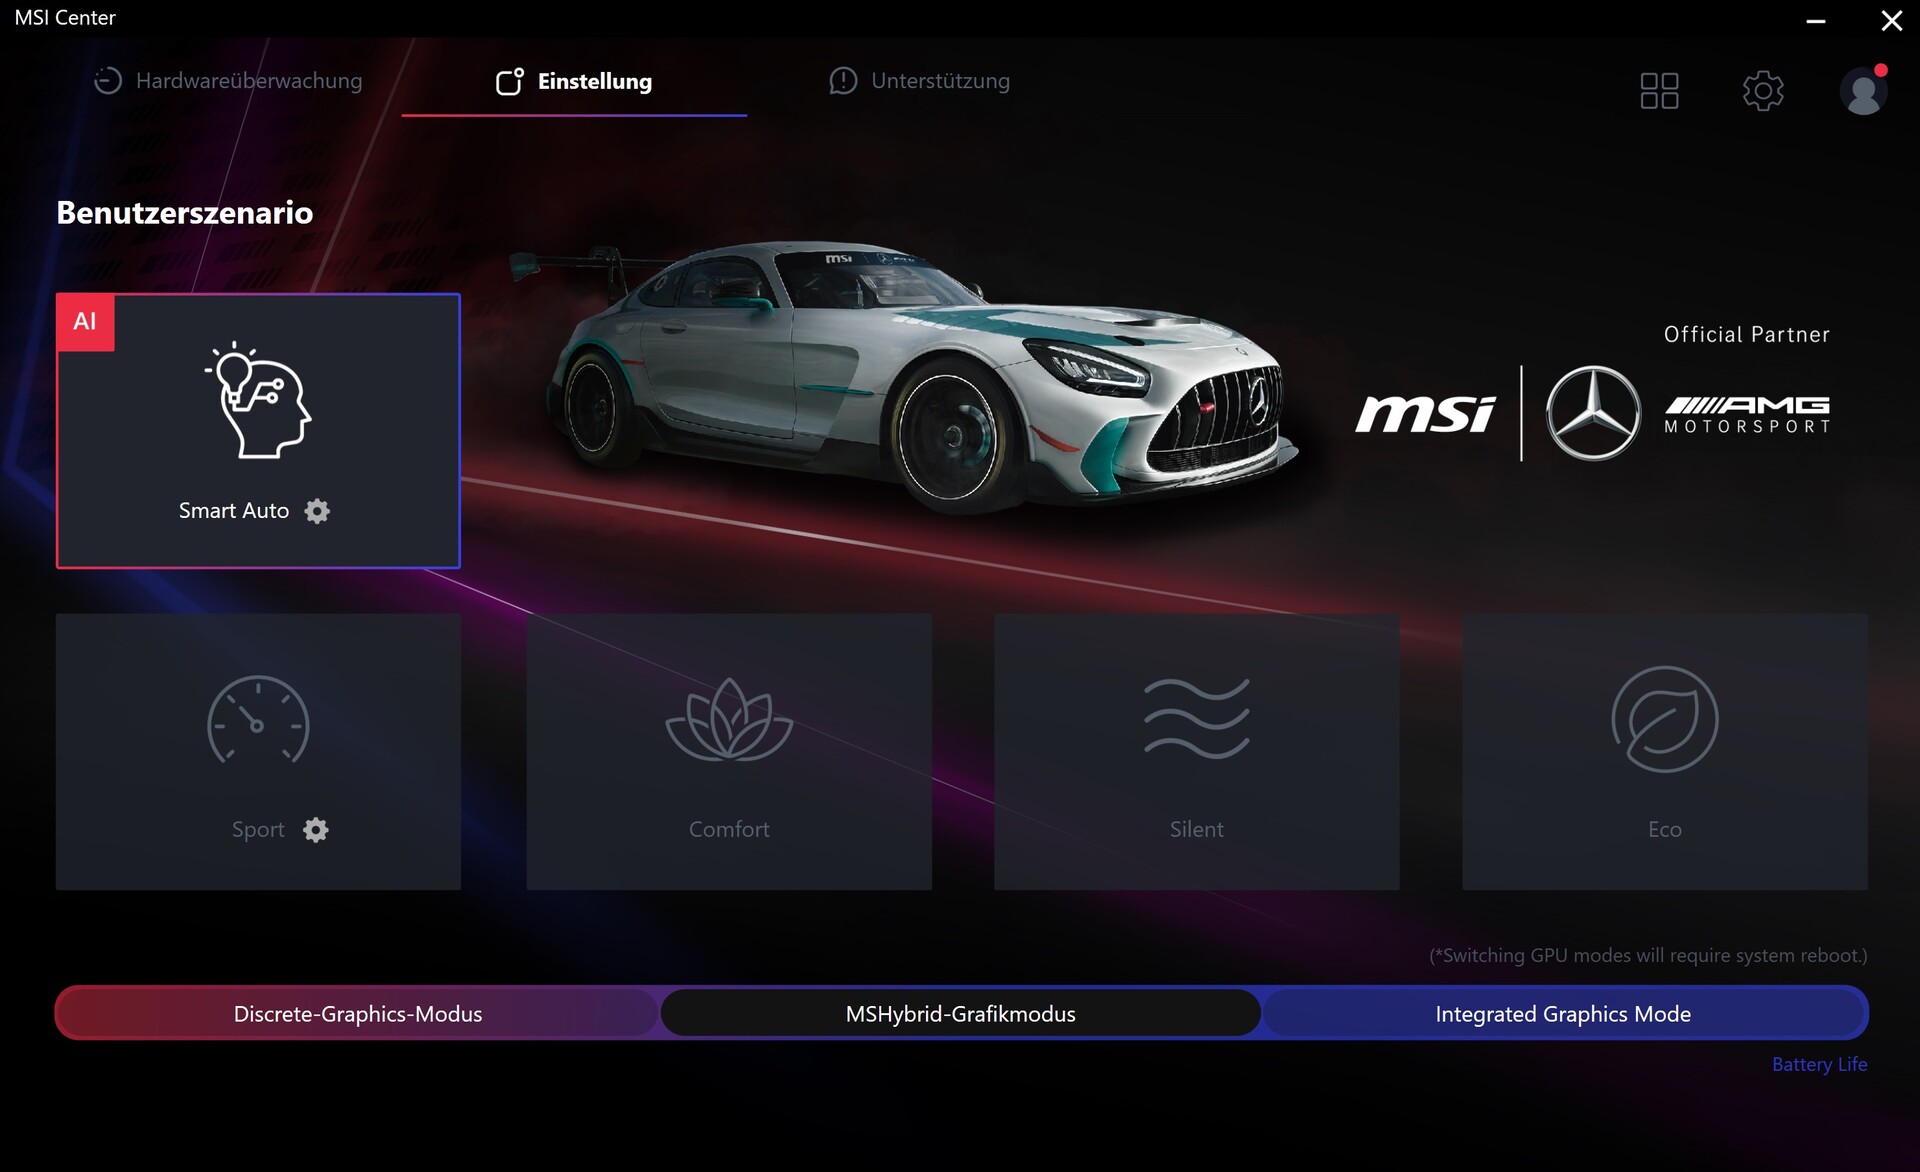
| Sport | Comfort | Silent | Eco | |
|---|---|---|---|---|
| Wydajność (Witcher 3, FHD/Ultra) | 120 fps | 110 fps | 90 fps | 90 fps |
| Hałas (Witcher 3, FHD/Ultra) | 49 dB(A) | 45 dB(A) | 36 dB(A) | 34 dB(A) |
| Limit mocy 1 (HWInfo) | 100 w | 45 w | 25 w | 15 w |
| Limit mocy 2 (HWInfo) | 160 w | 45 w | 45 w | 15 w |
Procesor
Aktualizacja z i7-13700H do i9-13900H w naszych testach procesora wykazała marginalną poprawę wydajności. Wyniki benchmarków pozostały podobne do wersji standardowej. Podczas pętli Cinebench wystąpiły dwa chwilowe spadki, w przeciwieństwie do konkurencji. Core i9-13900H to potężny, ale energochłonny układ high-end z 6 wydajnymi rdzeniami z funkcją Hyper-Threading i 8 wydajnymi rdzeniami bez HT (łącznie 20 wątków).
Cinebench R15 Multi Loop
* ... im mniej tym lepiej
AIDA64: FP32 Ray-Trace | FPU Julia | CPU SHA3 | CPU Queen | FPU SinJulia | FPU Mandel | CPU AES | CPU ZLib | FP64 Ray-Trace | CPU PhotoWorxx
| Performance rating | |
| Średnia w klasie Gaming | |
| HP Omen Transcend 16 | |
| Lenovo Legion Pro 5 16ARX8 | |
| Schenker XMG CORE 16 (L23) | |
| MSI Stealth 16 Mercedes-AMG Motorsport A13VG | |
| Schenker XMG Pro 16 Studio (Mid 23) | |
| MSI Stealth 16 Studio A13VG | |
| Przeciętny Intel Core i9-13900H | |
| AIDA64 / FP32 Ray-Trace | |
| Średnia w klasie Gaming (10227 - 85542, n=106, ostatnie 2 lata) | |
| Lenovo Legion Pro 5 16ARX8 | |
| Schenker XMG CORE 16 (L23) | |
| HP Omen Transcend 16 | |
| MSI Stealth 16 Mercedes-AMG Motorsport A13VG | |
| MSI Stealth 16 Studio A13VG | |
| Schenker XMG Pro 16 Studio (Mid 23) | |
| Przeciętny Intel Core i9-13900H (6788 - 19557, n=25) | |
| AIDA64 / FPU Julia | |
| Średnia w klasie Gaming (51376 - 238426, n=106, ostatnie 2 lata) | |
| Lenovo Legion Pro 5 16ARX8 | |
| Schenker XMG CORE 16 (L23) | |
| HP Omen Transcend 16 | |
| MSI Stealth 16 Mercedes-AMG Motorsport A13VG | |
| Schenker XMG Pro 16 Studio (Mid 23) | |
| MSI Stealth 16 Studio A13VG | |
| Przeciętny Intel Core i9-13900H (22551 - 95579, n=25) | |
| AIDA64 / CPU SHA3 | |
| Średnia w klasie Gaming (2180 - 9817, n=106, ostatnie 2 lata) | |
| HP Omen Transcend 16 | |
| Lenovo Legion Pro 5 16ARX8 | |
| Schenker XMG CORE 16 (L23) | |
| MSI Stealth 16 Mercedes-AMG Motorsport A13VG | |
| MSI Stealth 16 Studio A13VG | |
| Schenker XMG Pro 16 Studio (Mid 23) | |
| Przeciętny Intel Core i9-13900H (2491 - 4270, n=25) | |
| AIDA64 / CPU Queen | |
| Lenovo Legion Pro 5 16ARX8 | |
| HP Omen Transcend 16 | |
| Średnia w klasie Gaming (49785 - 173351, n=93, ostatnie 2 lata) | |
| MSI Stealth 16 Mercedes-AMG Motorsport A13VG | |
| MSI Stealth 16 Studio A13VG | |
| Przeciętny Intel Core i9-13900H (65121 - 120936, n=25) | |
| Schenker XMG CORE 16 (L23) | |
| Schenker XMG Pro 16 Studio (Mid 23) | |
| AIDA64 / FPU SinJulia | |
| Lenovo Legion Pro 5 16ARX8 | |
| Schenker XMG CORE 16 (L23) | |
| Średnia w klasie Gaming (4424 - 33636, n=106, ostatnie 2 lata) | |
| HP Omen Transcend 16 | |
| MSI Stealth 16 Mercedes-AMG Motorsport A13VG | |
| MSI Stealth 16 Studio A13VG | |
| Schenker XMG Pro 16 Studio (Mid 23) | |
| Przeciętny Intel Core i9-13900H (6108 - 11631, n=25) | |
| AIDA64 / FPU Mandel | |
| Średnia w klasie Gaming (25115 - 128721, n=106, ostatnie 2 lata) | |
| Lenovo Legion Pro 5 16ARX8 | |
| Schenker XMG CORE 16 (L23) | |
| HP Omen Transcend 16 | |
| MSI Stealth 16 Mercedes-AMG Motorsport A13VG | |
| MSI Stealth 16 Studio A13VG | |
| Schenker XMG Pro 16 Studio (Mid 23) | |
| Przeciętny Intel Core i9-13900H (11283 - 48474, n=25) | |
| AIDA64 / CPU AES | |
| Schenker XMG Pro 16 Studio (Mid 23) | |
| HP Omen Transcend 16 | |
| Średnia w klasie Gaming (39258 - 247074, n=106, ostatnie 2 lata) | |
| Schenker XMG CORE 16 (L23) | |
| Przeciętny Intel Core i9-13900H (3691 - 149377, n=25) | |
| MSI Stealth 16 Mercedes-AMG Motorsport A13VG | |
| MSI Stealth 16 Studio A13VG | |
| Lenovo Legion Pro 5 16ARX8 | |
| AIDA64 / CPU ZLib | |
| HP Omen Transcend 16 | |
| Średnia w klasie Gaming (574 - 2531, n=106, ostatnie 2 lata) | |
| MSI Stealth 16 Mercedes-AMG Motorsport A13VG | |
| Lenovo Legion Pro 5 16ARX8 | |
| Schenker XMG CORE 16 (L23) | |
| Schenker XMG Pro 16 Studio (Mid 23) | |
| Przeciętny Intel Core i9-13900H (789 - 1254, n=25) | |
| MSI Stealth 16 Studio A13VG | |
| AIDA64 / FP64 Ray-Trace | |
| Średnia w klasie Gaming (5509 - 45446, n=106, ostatnie 2 lata) | |
| Lenovo Legion Pro 5 16ARX8 | |
| Schenker XMG CORE 16 (L23) | |
| HP Omen Transcend 16 | |
| MSI Stealth 16 Mercedes-AMG Motorsport A13VG | |
| MSI Stealth 16 Studio A13VG | |
| Schenker XMG Pro 16 Studio (Mid 23) | |
| Przeciętny Intel Core i9-13900H (3655 - 10716, n=25) | |
| AIDA64 / CPU PhotoWorxx | |
| HP Omen Transcend 16 | |
| Schenker XMG Pro 16 Studio (Mid 23) | |
| MSI Stealth 16 Mercedes-AMG Motorsport A13VG | |
| MSI Stealth 16 Studio A13VG | |
| Średnia w klasie Gaming (12271 - 89891, n=106, ostatnie 2 lata) | |
| Schenker XMG CORE 16 (L23) | |
| Przeciętny Intel Core i9-13900H (10871 - 50488, n=25) | |
| Lenovo Legion Pro 5 16ARX8 | |
Wydajność systemu
Pomimo zastosowania bardzo szybkich komponentów, wydajność systemowa Stealth 16 plasuje się na przedostatnim miejscu w polu porównawczym, tuż przed standardową wersją Studio. Różnice są niewielkie, a w praktyce użytkownicy raczej nie zauważą znaczących różnic.
CrossMark: Overall | Productivity | Creativity | Responsiveness
| PCMark 10 / Score | |
| Średnia w klasie Gaming (5828 - 11574, n=94, ostatnie 2 lata) | |
| Lenovo Legion Pro 5 16ARX8 | |
| Schenker XMG CORE 16 (L23) | |
| HP Omen Transcend 16 | |
| Schenker XMG Pro 16 Studio (Mid 23) | |
| Przeciętny Intel Core i9-13900H, NVIDIA GeForce RTX 4070 Laptop GPU (5855 - 8538, n=8) | |
| MSI Stealth 16 Mercedes-AMG Motorsport A13VG | |
| MSI Stealth 16 Studio A13VG | |
| PCMark 10 / Essentials | |
| Schenker XMG Pro 16 Studio (Mid 23) | |
| HP Omen Transcend 16 | |
| Lenovo Legion Pro 5 16ARX8 | |
| Schenker XMG CORE 16 (L23) | |
| MSI Stealth 16 Mercedes-AMG Motorsport A13VG | |
| Przeciętny Intel Core i9-13900H, NVIDIA GeForce RTX 4070 Laptop GPU (8835 - 11940, n=8) | |
| Średnia w klasie Gaming (8810 - 11935, n=98, ostatnie 2 lata) | |
| MSI Stealth 16 Studio A13VG | |
| PCMark 10 / Productivity | |
| Średnia w klasie Gaming (6845 - 21327, n=96, ostatnie 2 lata) | |
| Schenker XMG CORE 16 (L23) | |
| Schenker XMG Pro 16 Studio (Mid 23) | |
| Lenovo Legion Pro 5 16ARX8 | |
| Przeciętny Intel Core i9-13900H, NVIDIA GeForce RTX 4070 Laptop GPU (7967 - 10991, n=8) | |
| HP Omen Transcend 16 | |
| MSI Stealth 16 Mercedes-AMG Motorsport A13VG | |
| MSI Stealth 16 Studio A13VG | |
| PCMark 10 / Digital Content Creation | |
| Średnia w klasie Gaming (7602 - 19657, n=96, ostatnie 2 lata) | |
| HP Omen Transcend 16 | |
| Lenovo Legion Pro 5 16ARX8 | |
| Schenker XMG CORE 16 (L23) | |
| Przeciętny Intel Core i9-13900H, NVIDIA GeForce RTX 4070 Laptop GPU (7738 - 13575, n=8) | |
| Schenker XMG Pro 16 Studio (Mid 23) | |
| MSI Stealth 16 Studio A13VG | |
| MSI Stealth 16 Mercedes-AMG Motorsport A13VG | |
| CrossMark / Overall | |
| Lenovo Legion Pro 5 16ARX8 | |
| Średnia w klasie Gaming (1366 - 2409, n=95, ostatnie 2 lata) | |
| HP Omen Transcend 16 | |
| Schenker XMG Pro 16 Studio (Mid 23) | |
| Przeciętny Intel Core i9-13900H, NVIDIA GeForce RTX 4070 Laptop GPU (1104 - 1974, n=7) | |
| MSI Stealth 16 Studio A13VG | |
| Schenker XMG CORE 16 (L23) | |
| CrossMark / Productivity | |
| Lenovo Legion Pro 5 16ARX8 | |
| Schenker XMG Pro 16 Studio (Mid 23) | |
| Średnia w klasie Gaming (1386 - 2254, n=95, ostatnie 2 lata) | |
| HP Omen Transcend 16 | |
| Przeciętny Intel Core i9-13900H, NVIDIA GeForce RTX 4070 Laptop GPU (1058 - 1914, n=7) | |
| MSI Stealth 16 Studio A13VG | |
| Schenker XMG CORE 16 (L23) | |
| CrossMark / Creativity | |
| HP Omen Transcend 16 | |
| Średnia w klasie Gaming (1343 - 2729, n=95, ostatnie 2 lata) | |
| Lenovo Legion Pro 5 16ARX8 | |
| Schenker XMG Pro 16 Studio (Mid 23) | |
| Przeciętny Intel Core i9-13900H, NVIDIA GeForce RTX 4070 Laptop GPU (1178 - 2254, n=7) | |
| MSI Stealth 16 Studio A13VG | |
| Schenker XMG CORE 16 (L23) | |
| CrossMark / Responsiveness | |
| Schenker XMG Pro 16 Studio (Mid 23) | |
| Lenovo Legion Pro 5 16ARX8 | |
| Średnia w klasie Gaming (1226 - 2334, n=95, ostatnie 2 lata) | |
| Przeciętny Intel Core i9-13900H, NVIDIA GeForce RTX 4070 Laptop GPU (1037 - 1952, n=7) | |
| MSI Stealth 16 Studio A13VG | |
| HP Omen Transcend 16 | |
| Schenker XMG CORE 16 (L23) | |
| PCMark 10 Score | 7334 pkt. | |
Pomoc | ||
| AIDA64 / Memory Copy | |
| HP Omen Transcend 16 | |
| Średnia w klasie Gaming (21750 - 129946, n=106, ostatnie 2 lata) | |
| Schenker XMG Pro 16 Studio (Mid 23) | |
| MSI Stealth 16 Studio A13VG | |
| MSI Stealth 16 Mercedes-AMG Motorsport A13VG | |
| Schenker XMG CORE 16 (L23) | |
| Przeciętny Intel Core i9-13900H (37448 - 74486, n=25) | |
| Lenovo Legion Pro 5 16ARX8 | |
| AIDA64 / Memory Read | |
| HP Omen Transcend 16 | |
| Schenker XMG Pro 16 Studio (Mid 23) | |
| MSI Stealth 16 Studio A13VG | |
| MSI Stealth 16 Mercedes-AMG Motorsport A13VG | |
| Średnia w klasie Gaming (22956 - 118858, n=106, ostatnie 2 lata) | |
| Przeciętny Intel Core i9-13900H (41599 - 75433, n=25) | |
| Schenker XMG CORE 16 (L23) | |
| Lenovo Legion Pro 5 16ARX8 | |
| AIDA64 / Memory Write | |
| Schenker XMG CORE 16 (L23) | |
| HP Omen Transcend 16 | |
| Średnia w klasie Gaming (22297 - 135096, n=106, ostatnie 2 lata) | |
| MSI Stealth 16 Mercedes-AMG Motorsport A13VG | |
| Schenker XMG Pro 16 Studio (Mid 23) | |
| MSI Stealth 16 Studio A13VG | |
| Przeciętny Intel Core i9-13900H (36152 - 88505, n=25) | |
| Lenovo Legion Pro 5 16ARX8 | |
| AIDA64 / Memory Latency | |
| Średnia w klasie Gaming (75.3 - 259, n=106, ostatnie 2 lata) | |
| Przeciętny Intel Core i9-13900H (75.8 - 102.3, n=25) | |
| MSI Stealth 16 Mercedes-AMG Motorsport A13VG | |
| Schenker XMG CORE 16 (L23) | |
| HP Omen Transcend 16 | |
| MSI Stealth 16 Studio A13VG | |
| Schenker XMG Pro 16 Studio (Mid 23) | |
| Lenovo Legion Pro 5 16ARX8 | |
* ... im mniej tym lepiej
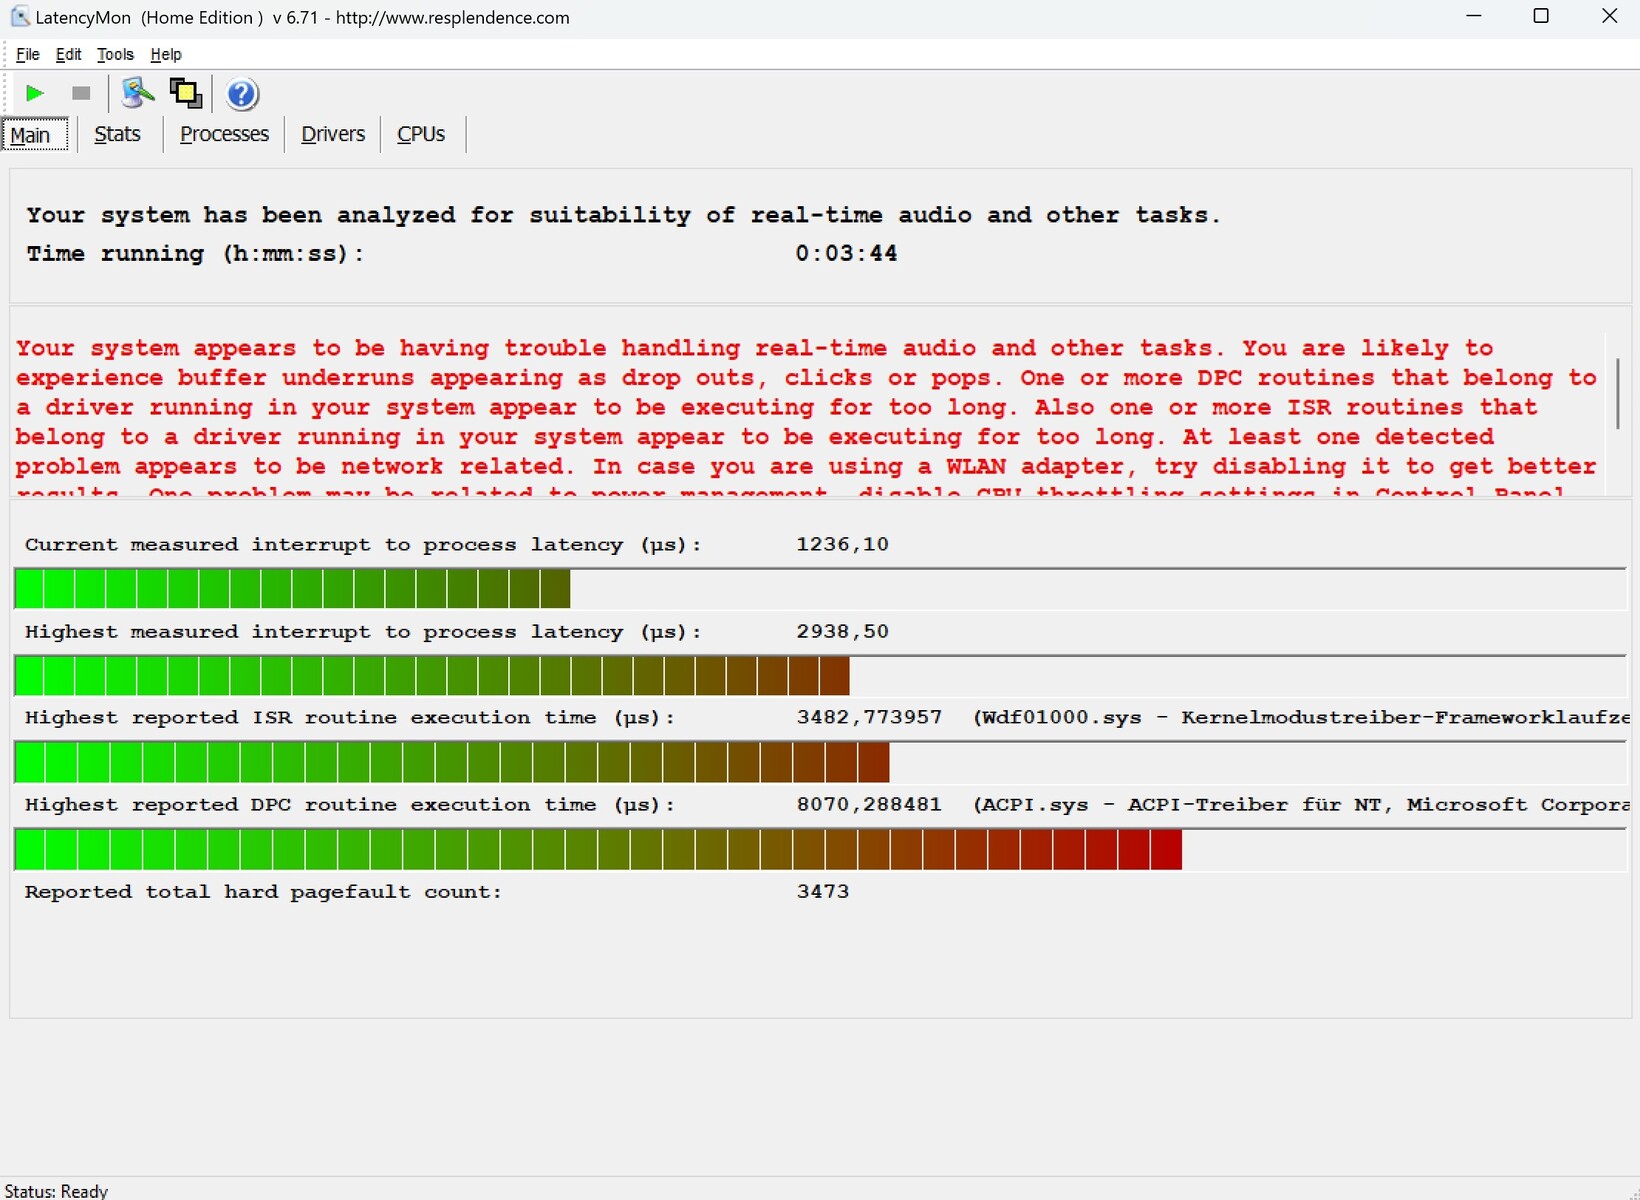
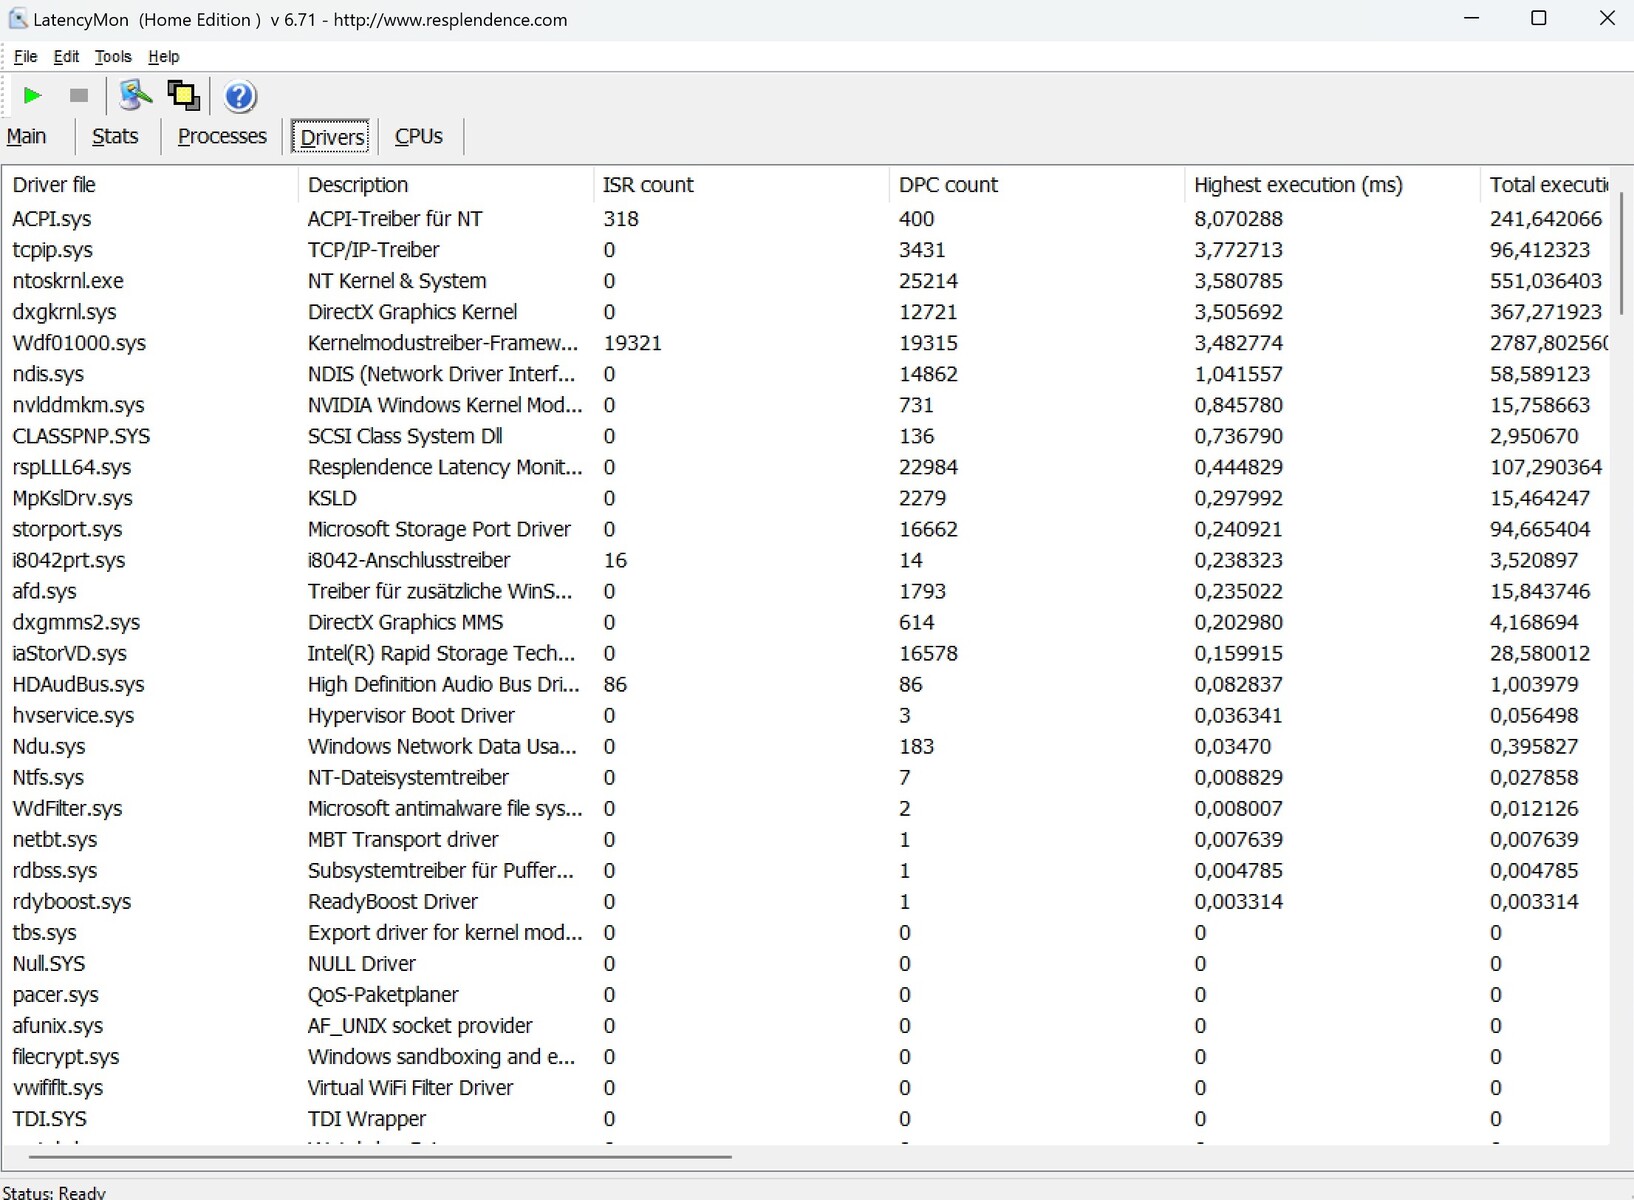
Opóźnienie DPC
MSI mogłoby poprawić opóźnienia w Stealth 16. W dostarczonym stanie, LatencyMon wskazuje na potencjalne zakłócenia w przetwarzaniu audio i wideo w czasie rzeczywistym. Zjawisko to dotyczy jednak wielu notebooków.
| DPC Latencies / LatencyMon - interrupt to process latency (max), Web, Youtube, Prime95 | |
| MSI Stealth 16 Studio A13VG | |
| MSI Stealth 16 Mercedes-AMG Motorsport A13VG | |
| Schenker XMG Pro 16 Studio (Mid 23) | |
| HP Omen Transcend 16 | |
| Schenker XMG CORE 16 (L23) | |
| Lenovo Legion Pro 5 16ARX8 | |
* ... im mniej tym lepiej
Urządzenia pamięci masowej
Dysk SSD Samsung o pojemności 2 TB (model PM9A1) w testowanym urządzeniu początkowo działał dobrze, ale doświadczył poważnych spadków wydajności lub throttlingu przy dłuższym obciążeniu. Niestety, MSI nie rozwiązało jeszcze tego problemu, podobnie jak w przypadku standardowego Stealth 16. Większość konkurencji wypada pod tym względem lepiej, z wyjątkiem Lenovo Legion Pro 5.

* ... im mniej tym lepiej
Continuous power read: DiskSpd Read Loop, Queue Depth 8
Karta graficzna
Pomimo TGP GPU wynoszącego 105 W, wydajność RTX 4070 w Stealth 16 jest zgodna ze średnią dla tej karty graficznej.
| 3DMark Ice Storm Standard Score | 99001 pkt. | |
| 3DMark Cloud Gate Standard Score | 52847 pkt. | |
| 3DMark Fire Strike Score | 22419 pkt. | |
| 3DMark Time Spy Score | 11694 pkt. | |
Pomoc | ||
* ... im mniej tym lepiej
Wydajność w grach
Ponieważ wyświetlacz OLED nie obsługuje klasycznej rozdzielczości UHD (3840 x 2160 pikseli), w testach porównawczych dla gier wykorzystaliśmy maksymalną rozdzielczość 2560 x 1440 pikseli. Wyższe rozdzielczości często nadmiernie obciążają RTX 4070, zwłaszcza przy wyższych ustawieniach, co widać na stronieStrona GPU. Niemniej jednak, Stealth 16 radzi sobie znakomicie w rozdzielczości QHD, w pełni wykorzystując możliwości 60 Hz panelu OLED w większości tytułów, z wyjątkiem wymagających i mniej zoptymalizowanych, takich jak Alan Wake 2.
| Counter-Strike 2 - 2560x1440 Very High Preset | |
| Średnia w klasie Gaming (15.7 - 224, n=5, ostatnie 2 lata) | |
| XMG Pro 15 E23 | |
| Przeciętny NVIDIA GeForce RTX 4070 Laptop GPU (87.9 - 100.6, n=2) | |
| MSI Stealth 16 Mercedes-AMG Motorsport A13VG | |
| Alan Wake 2 - 2560x1440 High Preset | |
| Średnia w klasie Gaming (31.2 - 93.1, n=33, ostatnie 2 lata) | |
| Przeciętny NVIDIA GeForce RTX 4070 Laptop GPU (40.2 - 44.5, n=7) | |
| MSI Stealth 16 Mercedes-AMG Motorsport A13VG | |
| XMG Pro 15 E23 | |
| EA Sports WRC - 2560x1440 Ultra Preset AA:Epic AF:16x | |
| XMG Pro 15 E23 | |
| Przeciętny NVIDIA GeForce RTX 4070 Laptop GPU (59.6 - 68.8, n=3) | |
| MSI Stealth 16 Mercedes-AMG Motorsport A13VG | |
Podczas 60-minutowego testu The Witcher 3 przy ustawieniach FHD/Ultra, nie odnotowano spadków liczby klatek na sekundę, ale prędkość spadła o prawie 10% w trakcie testu.
Witcher 3 FPS chart
| low | med. | high | ultra | QHD | |
|---|---|---|---|---|---|
| GTA V (2015) | 176 | 164.9 | 100.3 | 87.6 | |
| The Witcher 3 (2015) | 317 | 205 | 110 | 77.7 | |
| Dota 2 Reborn (2015) | 178.3 | 144.5 | 135.9 | 126.9 | |
| Final Fantasy XV Benchmark (2018) | 138 | 101.4 | 74.1 | ||
| X-Plane 11.11 (2018) | 144.7 | 118.1 | 98 | ||
| Strange Brigade (2018) | 276 | 220 | 190.6 | 126.3 | |
| Counter-Strike 2 (2023) | 160.2 | 151.5 | 121.5 | 87.9 | |
| Alan Wake 2 (2023) | 66.9 | 65.1 | 42.3 | ||
| EA Sports WRC (2023) | 90.6 | 85 | 77.1 | 59.6 |
Emisje
Hałas systemowy
Podczas gdy poziom hałasu w spoczynku jest podobny do standardowego Stealth 16, Motorsport Edition jest nieco głośniejszy pod obciążeniem. Jednak w porównaniu do konkurencji, zmierzone wartości pozostają w rozsądnych granicach, przy czym HP Omen Transcend 16 jest bardziej zauważalny w trybie 3D.
Hałas
| luz |
| 25 / 26 / 27 dB |
| obciążenie |
| 39 / 51 dB |
 | ||
30 dB cichy 40 dB(A) słyszalny 50 dB(A) irytujący |
||
min: | ||
| MSI Stealth 16 Mercedes-AMG Motorsport A13VG i9-13900H, GeForce RTX 4070 Laptop GPU | MSI Stealth 16 Studio A13VG i7-13700H, GeForce RTX 4070 Laptop GPU | Schenker XMG Pro 16 Studio (Mid 23) i9-13900H, GeForce RTX 4070 Laptop GPU | HP Omen Transcend 16 i9-13900HX, GeForce RTX 4070 Laptop GPU | Lenovo Legion Pro 5 16ARX8 R7 7745HX, GeForce RTX 4070 Laptop GPU | Schenker XMG CORE 16 (L23) R7 7840HS, GeForce RTX 4070 Laptop GPU | |
|---|---|---|---|---|---|---|
| Noise | 6% | -8% | -10% | 5% | -0% | |
| wyłączone / środowisko * (dB) | 25 | 24 4% | 25 -0% | 22.9 8% | 23.2 7% | 23 8% |
| Idle Minimum * (dB) | 25 | 24 4% | 26 -4% | 29.1 -16% | 23.2 7% | 23 8% |
| Idle Average * (dB) | 26 | 24 8% | 29 -12% | 29.1 -12% | 23.2 11% | 28.48 -10% |
| Idle Maximum * (dB) | 27 | 24 11% | 34 -26% | 29.1 -8% | 26.2 3% | 28.48 -5% |
| Load Average * (dB) | 39 | 34.81 11% | 43 -10% | 45.7 -17% | 31.4 19% | 30 23% |
| Witcher 3 ultra * (dB) | 45 | 44.05 2% | 48 -7% | 54.3 -21% | 48.4 -8% | 54.12 -20% |
| Load Maximum * (dB) | 51 | 51.57 -1% | 48 6% | 54.3 -6% | 53.8 -5% | 54.12 -6% |
* ... im mniej tym lepiej
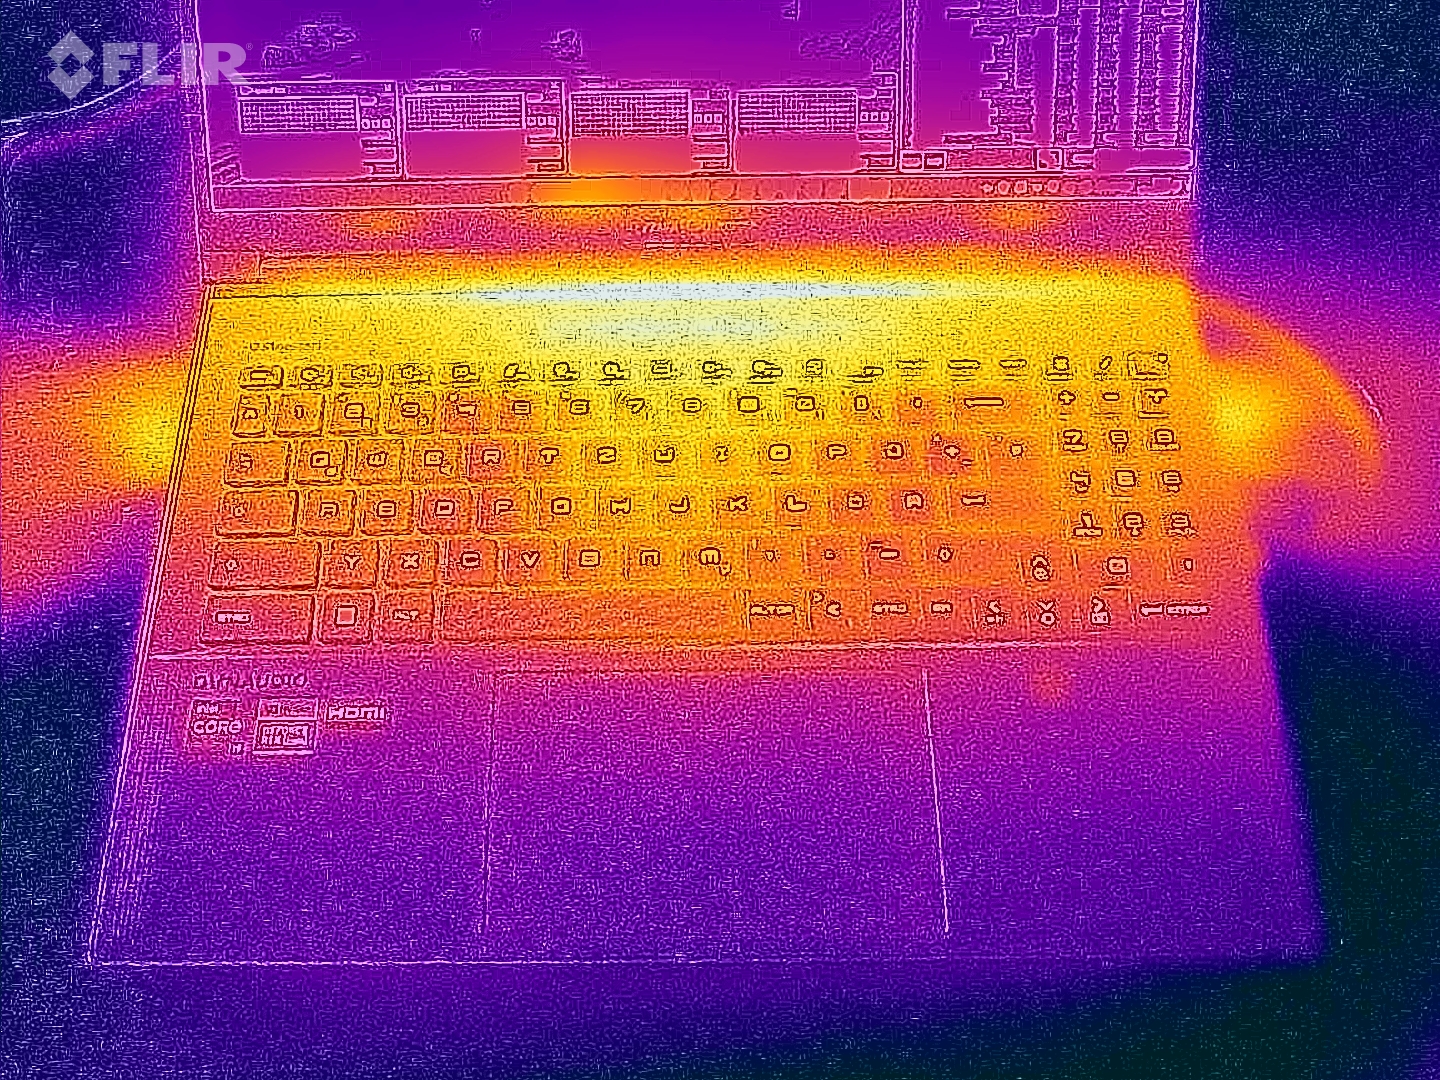
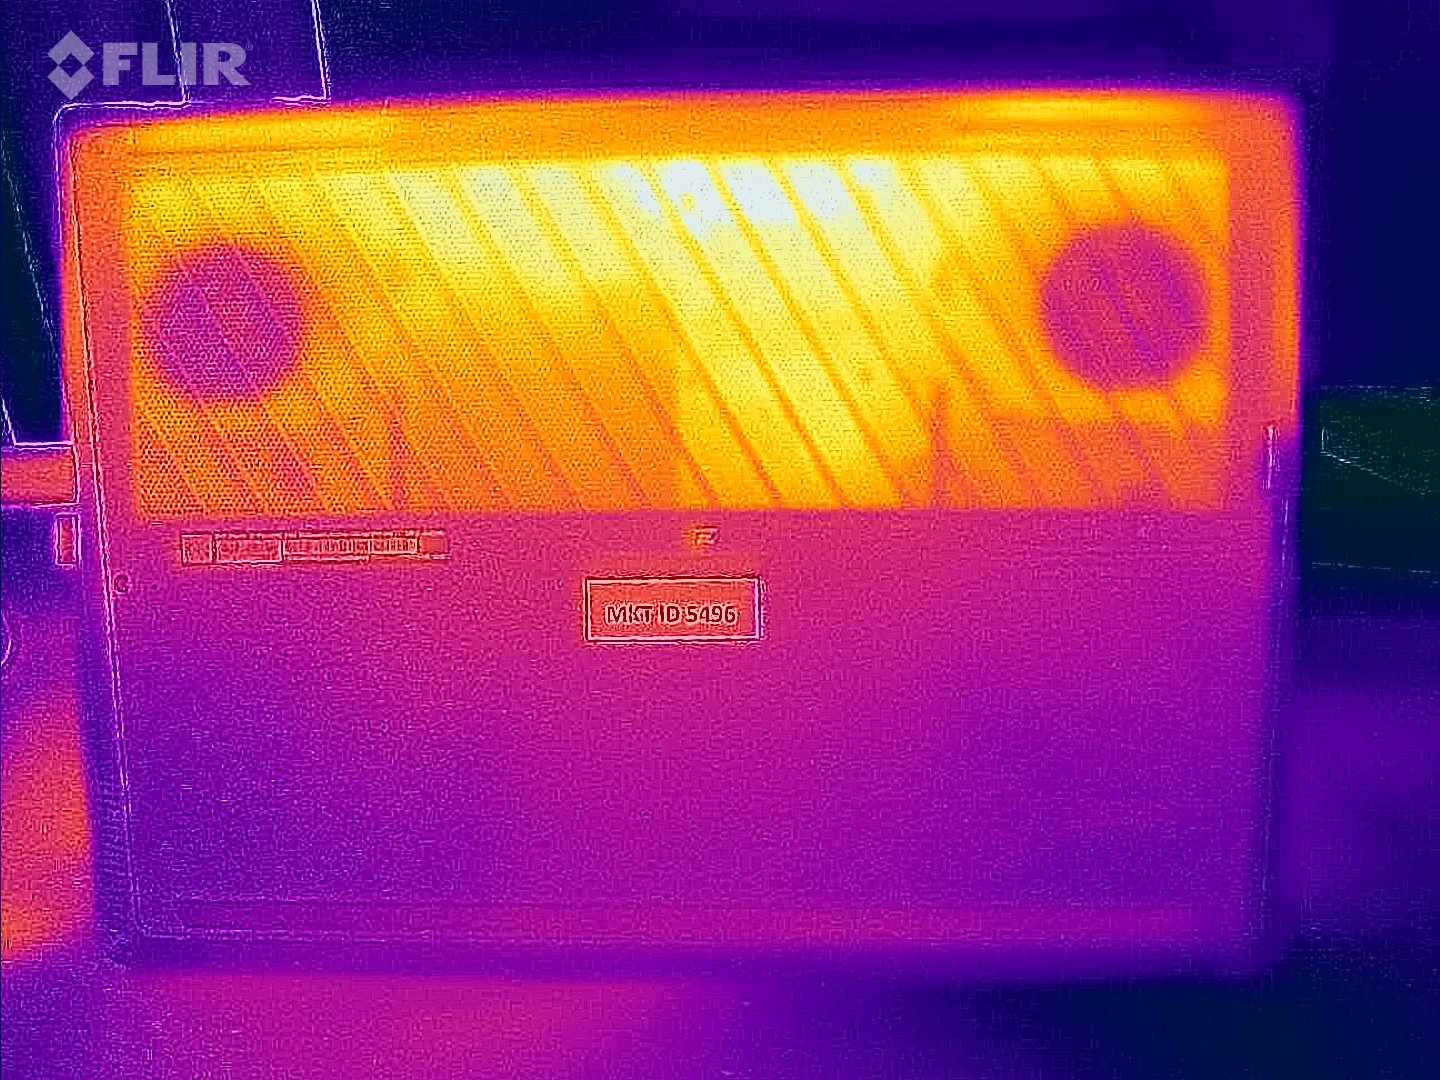
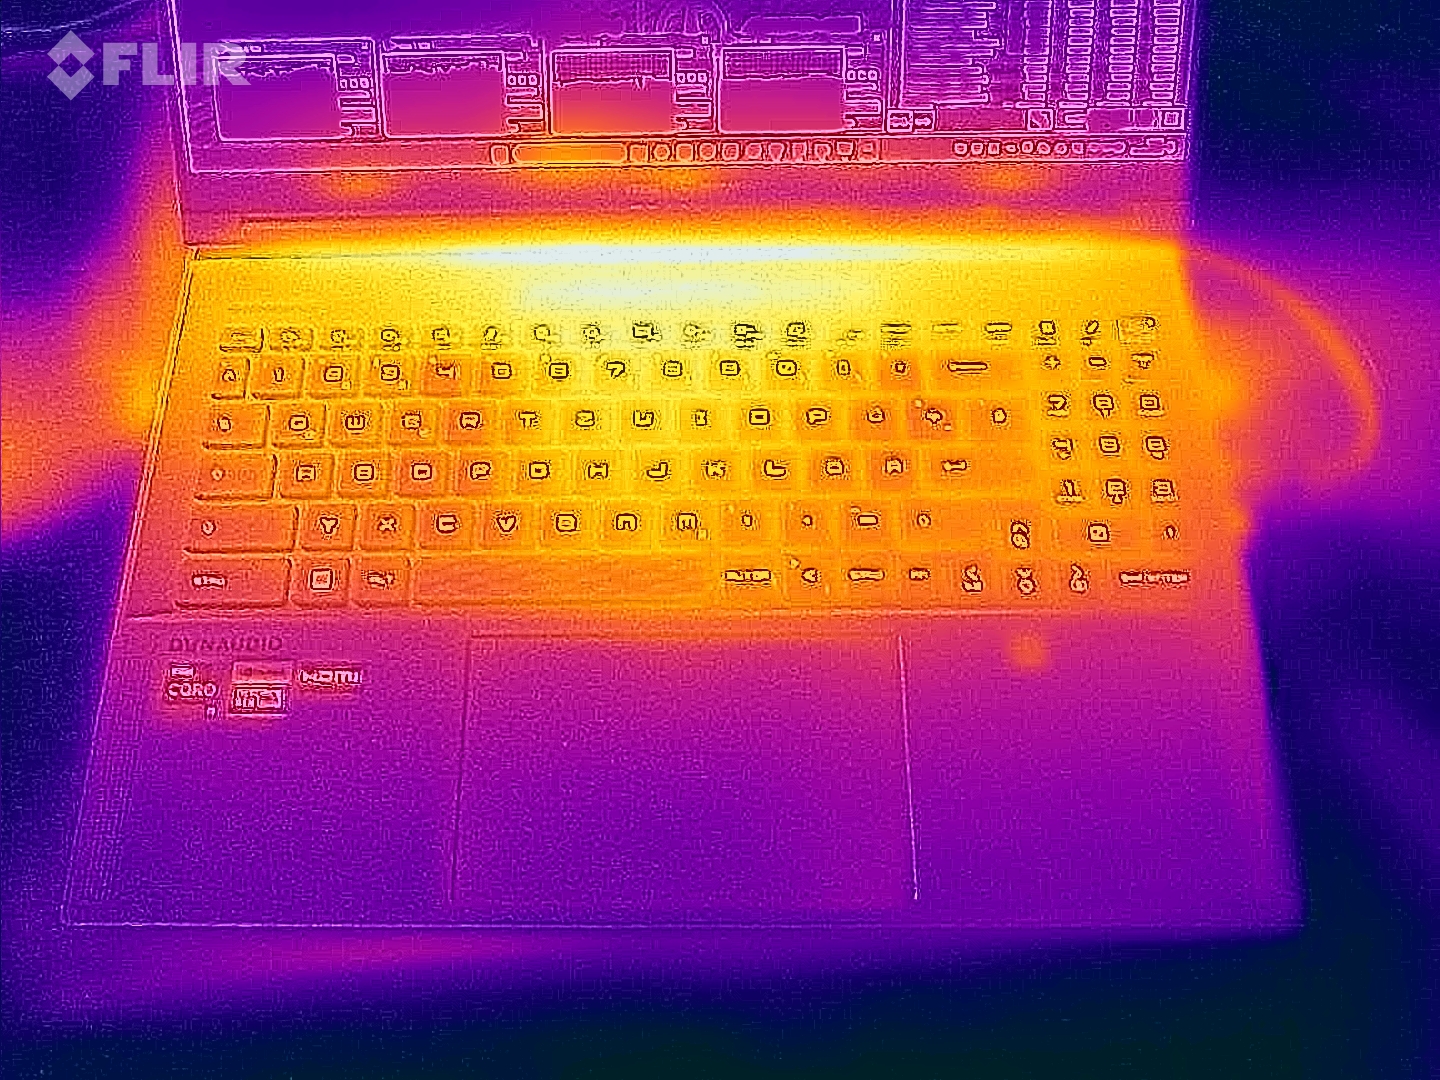
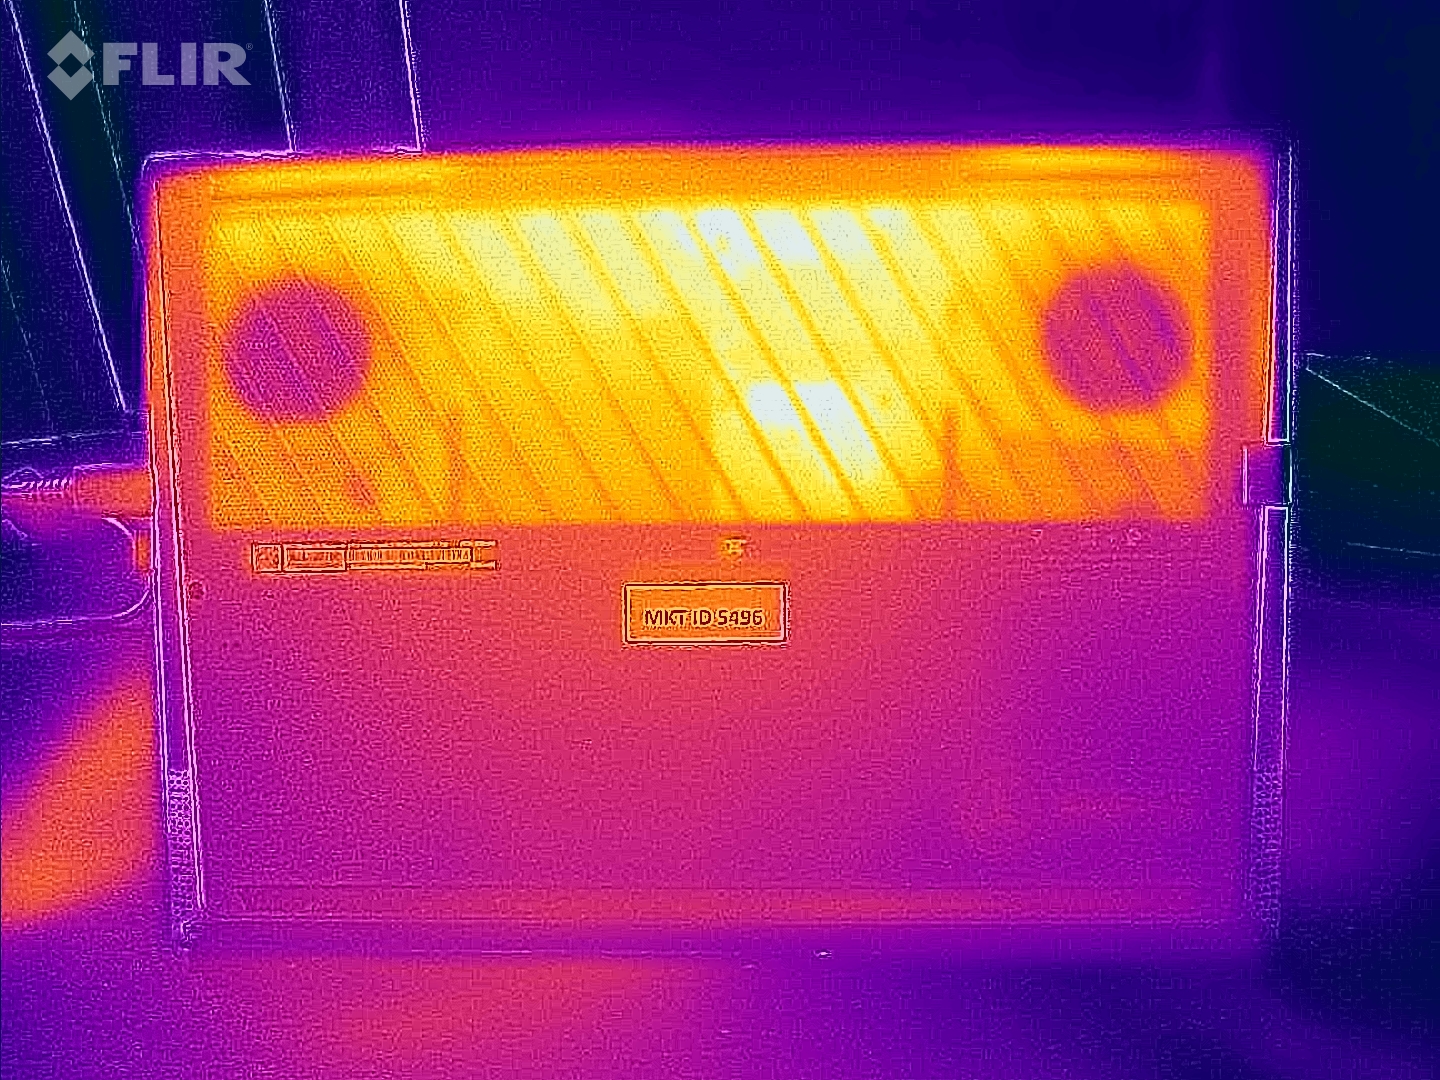
Temperatura
Temperatury mieszczą się w średnim zakresie, z maksymalną wartością 120,2 ° F na górze i 125,6 ° F na dole. Chociaż nie są to niskie wartości, nadal są w miarę akceptowalne dla zainstalowanego sprzętu, zwłaszcza że obszar dłoni pozostaje przyjemnie chłodny.
(-) Maksymalna temperatura w górnej części wynosi 49 °C / 120 F, w porównaniu do średniej 40.4 °C / 105 F , począwszy od 21.2 do 68.8 °C dla klasy Gaming.
(-) Dno nagrzewa się maksymalnie do 52 °C / 126 F, w porównaniu do średniej 43.2 °C / 110 F
(+) W stanie bezczynności średnia temperatura górnej części wynosi 29.1 °C / 84 F, w porównaniu ze średnią temperaturą urządzenia wynoszącą 33.9 °C / ### class_avg_f### F.
(-) Podczas gry w Wiedźmina 3 średnia temperatura górnej części wynosi 40 °C / 104 F, w porównaniu do średniej temperatury urządzenia wynoszącej 33.9 °C / ## #class_avg_f### F.
(+) Podparcia dłoni i touchpad osiągają maksymalną temperaturę skóry (32 °C / 89.6 F) i dlatego nie są gorące.
(-) Średnia temperatura obszaru podparcia dłoni w podobnych urządzeniach wynosiła 28.8 °C / 83.8 F (-3.2 °C / -5.8 F).
| MSI Stealth 16 Mercedes-AMG Motorsport A13VG i9-13900H, GeForce RTX 4070 Laptop GPU | MSI Stealth 16 Studio A13VG i7-13700H, GeForce RTX 4070 Laptop GPU | Schenker XMG Pro 16 Studio (Mid 23) i9-13900H, GeForce RTX 4070 Laptop GPU | HP Omen Transcend 16 i9-13900HX, GeForce RTX 4070 Laptop GPU | Lenovo Legion Pro 5 16ARX8 R7 7745HX, GeForce RTX 4070 Laptop GPU | Schenker XMG CORE 16 (L23) R7 7840HS, GeForce RTX 4070 Laptop GPU | |
|---|---|---|---|---|---|---|
| Heat | -17% | -11% | 6% | 14% | 6% | |
| Maximum Upper Side * (°C) | 49 | 60 -22% | 55 -12% | 47.4 3% | 41.8 15% | 46 6% |
| Maximum Bottom * (°C) | 52 | 61 -17% | 66 -27% | 54.4 -5% | 41.4 20% | 44 15% |
| Idle Upper Side * (°C) | 32 | 38.2 -19% | 33 -3% | 28.4 11% | 29 9% | 32 -0% |
| Idle Bottom * (°C) | 34 | 37.7 -11% | 35 -3% | 29.2 14% | 30.4 11% | 33 3% |
* ... im mniej tym lepiej
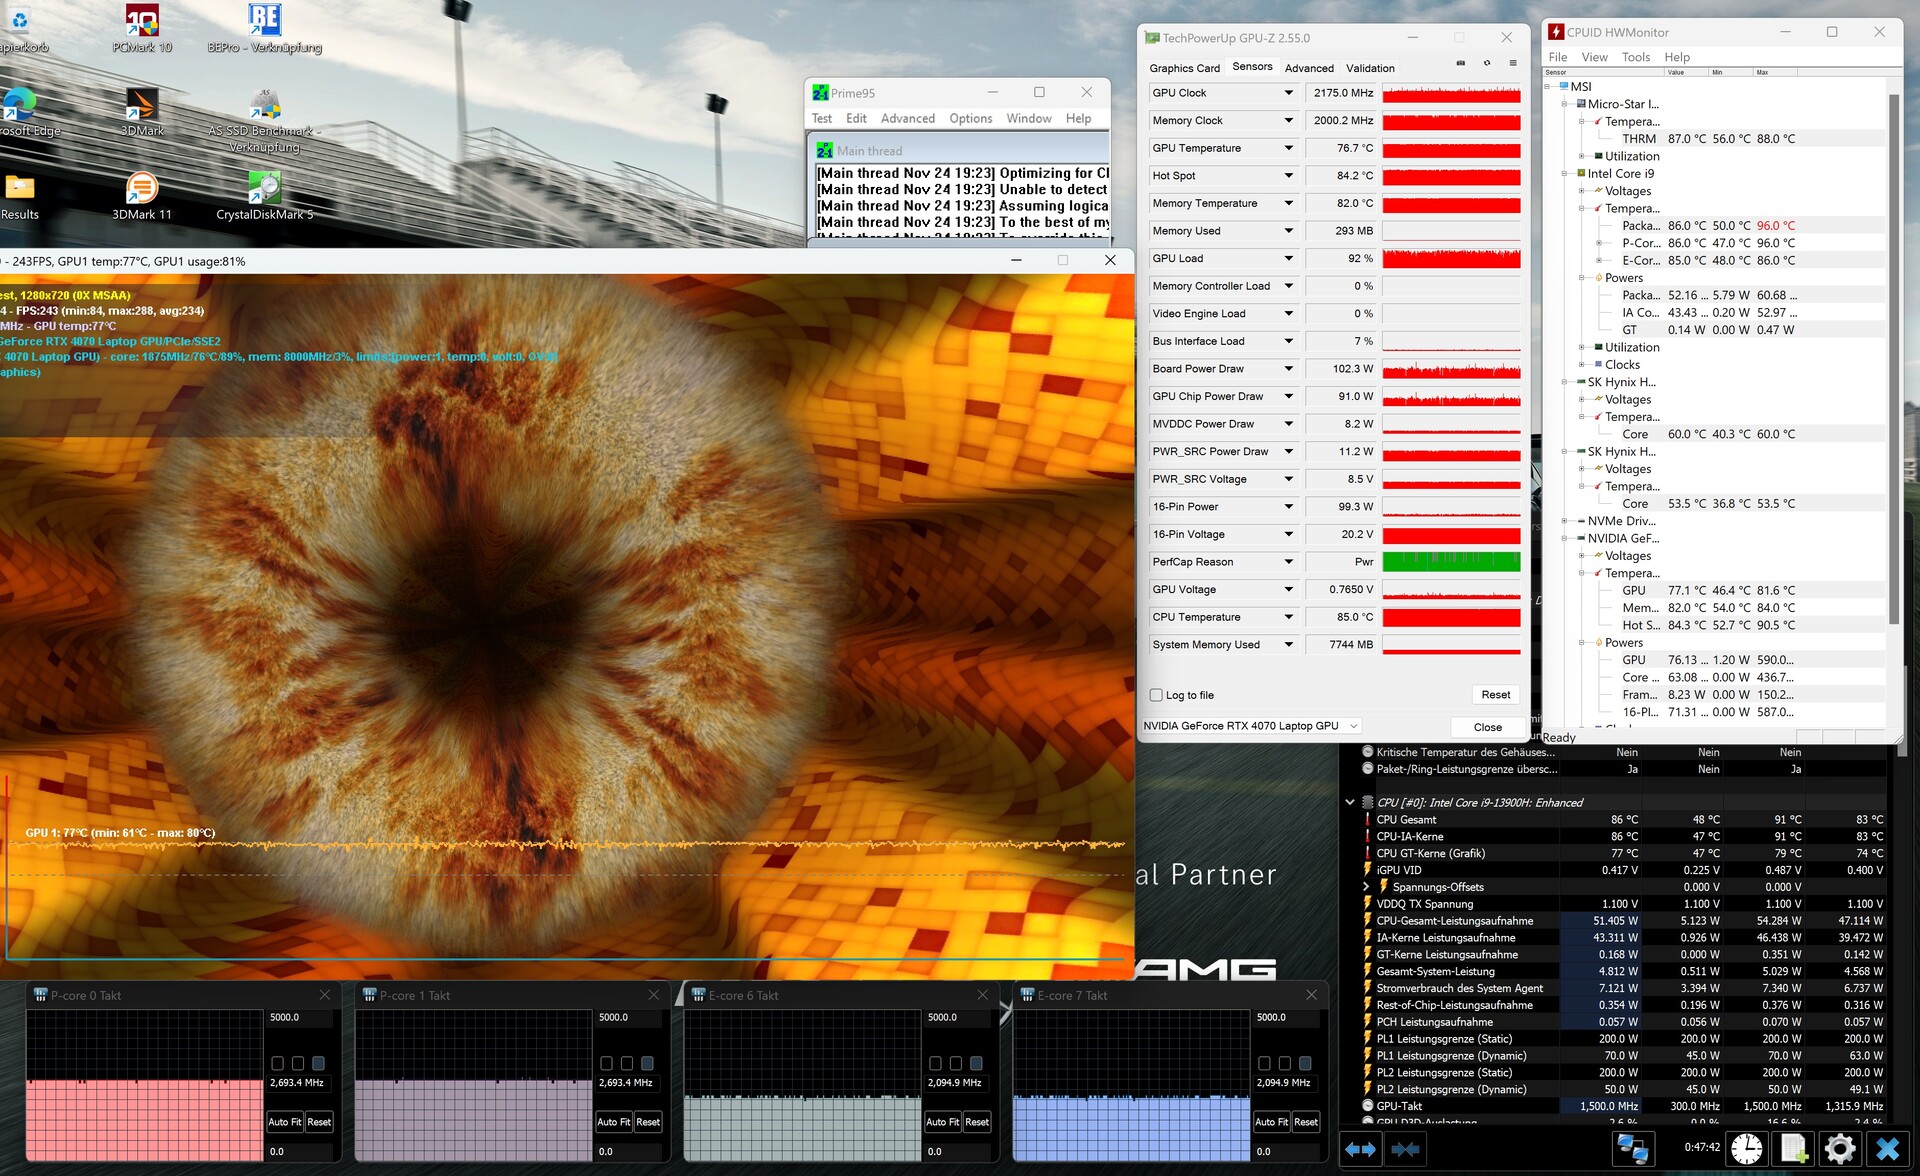
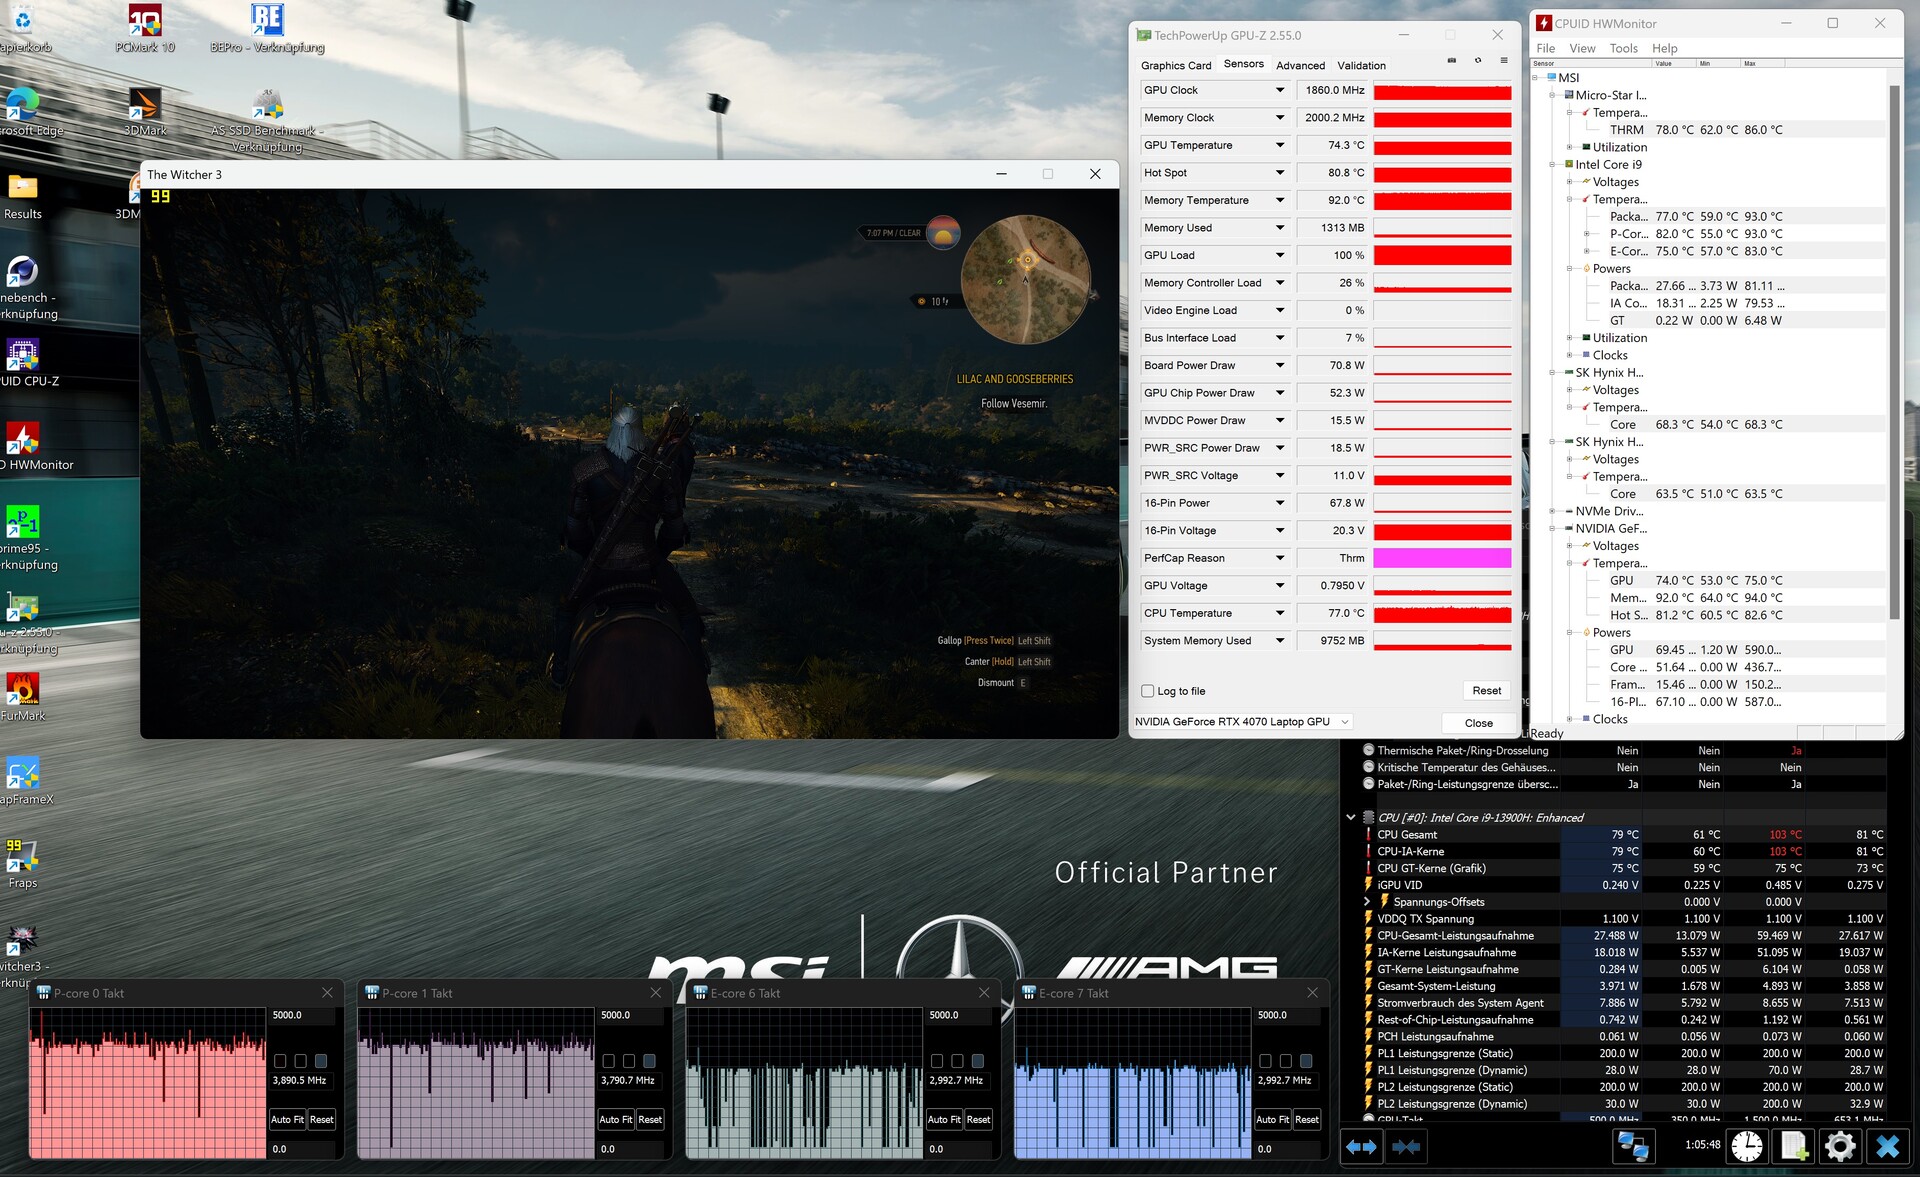
Test warunków skrajnych
Podczas testu obciążeniowego z Furmark i Prime95, RTX 4070 utrzymywał około 183,2 °F (zegar GPU ~ 2175 MHz), a Core i9-13900H osiągnął około 186,8 °F (rdzenie P ~ 2,7 GHz, rdzenie E ~ 2,1 GHz), co w obu przypadkach jest akceptowalne.
Głośniki
MSI Stealth 16 Mercedes-AMG Motorsport A13VG analiza dźwięku
(+) | głośniki mogą odtwarzać stosunkowo głośno (91 dB)
Bas 100 - 315 Hz
(-) | prawie brak basu - średnio 18.1% niższa od mediany
(±) | liniowość basu jest średnia (7.3% delta do poprzedniej częstotliwości)
Średnie 400 - 2000 Hz
(+) | zbalansowane środki średnie - tylko 1.6% od mediany
(+) | średnie są liniowe (3.7% delta do poprzedniej częstotliwości)
Wysokie 2–16 kHz
(+) | zrównoważone maksima - tylko 3.2% od mediany
(+) | wzloty są liniowe (2.6% delta do poprzedniej częstotliwości)
Ogólnie 100 - 16.000 Hz
(+) | ogólny dźwięk jest liniowy (11.8% różnicy w stosunku do mediany)
W porównaniu do tej samej klasy
» 11% wszystkich testowanych urządzeń w tej klasie było lepszych, 4% podobnych, 85% gorszych
» Najlepszy miał deltę 6%, średnia wynosiła ###średnia###%, najgorsza wynosiła 132%
W porównaniu do wszystkich testowanych urządzeń
» 8% wszystkich testowanych urządzeń było lepszych, 3% podobnych, 89% gorszych
» Najlepszy miał deltę 4%, średnia wynosiła ###średnia###%, najgorsza wynosiła 134%
HP Omen Transcend 16 analiza dźwięku
(+) | głośniki mogą odtwarzać stosunkowo głośno (82.3 dB)
Bas 100 - 315 Hz
(-) | prawie brak basu - średnio 20% niższa od mediany
(±) | liniowość basu jest średnia (14.3% delta do poprzedniej częstotliwości)
Średnie 400 - 2000 Hz
(±) | wyższe średnie - średnio 5.2% wyższe niż mediana
(+) | średnie są liniowe (3.7% delta do poprzedniej częstotliwości)
Wysokie 2–16 kHz
(+) | zrównoważone maksima - tylko 2% od mediany
(+) | wzloty są liniowe (6.7% delta do poprzedniej częstotliwości)
Ogólnie 100 - 16.000 Hz
(±) | liniowość ogólnego dźwięku jest średnia (17% różnicy w stosunku do mediany)
W porównaniu do tej samej klasy
» 45% wszystkich testowanych urządzeń w tej klasie było lepszych, 12% podobnych, 43% gorszych
» Najlepszy miał deltę 6%, średnia wynosiła ###średnia###%, najgorsza wynosiła 132%
W porównaniu do wszystkich testowanych urządzeń
» 30% wszystkich testowanych urządzeń było lepszych, 8% podobnych, 62% gorszych
» Najlepszy miał deltę 4%, średnia wynosiła ###średnia###%, najgorsza wynosiła 134%
Zarządzanie energią
Zużycie energii
Dzięki przełączaniu grafiki 16-calowe urządzenie działa wydajnie w trybie bezczynności, zużywając od 11 do 28 watów (średnio 14 watów), co jest zgodne z większością konkurentów. Pod obciążeniem edycja AMG pobierała moc od 83 watów (średnia wartość w 3DMark 06) do 204 watów (maksymalna wartość w teście warunków skrajnych). Dostarczony 240-watowy zasilacz, ozdobiony logo sportów motorowych, jest odpowiednio dobrany do tych wymagań.
| wyłączony / stan wstrzymania | |
| luz | |
| obciążenie |
|
Legenda:
min: | |
| MSI Stealth 16 Mercedes-AMG Motorsport A13VG i9-13900H, GeForce RTX 4070 Laptop GPU | MSI Stealth 16 Studio A13VG i7-13700H, GeForce RTX 4070 Laptop GPU | Schenker XMG Pro 16 Studio (Mid 23) i9-13900H, GeForce RTX 4070 Laptop GPU | HP Omen Transcend 16 i9-13900HX, GeForce RTX 4070 Laptop GPU | Lenovo Legion Pro 5 16ARX8 R7 7745HX, GeForce RTX 4070 Laptop GPU | Schenker XMG CORE 16 (L23) R7 7840HS, GeForce RTX 4070 Laptop GPU | Średnia w klasie Gaming | |
|---|---|---|---|---|---|---|---|
| Power Consumption | -2% | 2% | -63% | -16% | -1% | -18% | |
| Idle Minimum * (Watt) | 11 | 11 -0% | 8 27% | 19.2 -75% | 8.1 26% | 11 -0% | 12.8 ? -16% |
| Idle Average * (Watt) | 14 | 18 -29% | 12 14% | 22.7 -62% | 15.9 -14% | 15.2 -9% | 18.5 ? -32% |
| Idle Maximum * (Watt) | 28 | 19 32% | 23 18% | 55.4 -98% | 37.2 -33% | 16 43% | 24 ? 14% |
| Load Average * (Watt) | 83 | 91 -10% | 94 -13% | 128.4 -55% | 90.9 -10% | 64 23% | 108.2 ? -30% |
| Witcher 3 ultra * (Watt) | 140 | 130 7% | 181.5 -30% | 206 -47% | 189.6 -35% | 179 -28% | |
| Load Maximum * (Watt) | 204 | 228 -12% | 215 -5% | 292 -43% | 263.5 -29% | 280 -37% | 254 ? -25% |
* ... im mniej tym lepiej
Power consumption Witcher 3 / stress test
Power consumption with external monitor
Żywotność baterii
Ze względu na procesor Core i9-13900H i panel OLED, czasy pracy Motorsport Edition są nieco słabsze w porównaniu do standardowej wersji. Osiągnięcie nieco poniżej 6,5 godziny surfowania po Internecie przy jasności zredukowanej do 150 cd/m² to wciąż więcej niż przyzwoity wynik jak na notebooka do gier. Bateria o dużej pojemności 99 Wh przyczynia się do tych godnych szacunku wyników.
| MSI Stealth 16 Mercedes-AMG Motorsport A13VG i9-13900H, GeForce RTX 4070 Laptop GPU, 99.99 Wh | MSI Stealth 16 Studio A13VG i7-13700H, GeForce RTX 4070 Laptop GPU, 99.9 Wh | Schenker XMG Pro 16 Studio (Mid 23) i9-13900H, GeForce RTX 4070 Laptop GPU, 73 Wh | HP Omen Transcend 16 i9-13900HX, GeForce RTX 4070 Laptop GPU, 97 Wh | Lenovo Legion Pro 5 16ARX8 R7 7745HX, GeForce RTX 4070 Laptop GPU, 80 Wh | Schenker XMG CORE 16 (L23) R7 7840HS, GeForce RTX 4070 Laptop GPU, 99 Wh | Średnia w klasie Gaming | |
|---|---|---|---|---|---|---|---|
| Czasy pracy | 20% | 5% | -35% | -38% | 29% | 9% | |
| WiFi v1.3 (h) | 6.5 | 7.8 20% | 6.8 5% | 4.2 -35% | 4 -38% | 8.4 29% | 7.09 ? 9% |
| Reader / Idle (h) | 11 | 6.3 | 6.5 | 8.71 ? | |||
| H.264 (h) | 7.7 | 10.2 | 8.9 ? | ||||
| Load (h) | 2.4 | 1.2 | 1 | 2.4 | 1.51 ? |
Za
Przeciw
Werdykt
Poza udanymi elementami konstrukcyjnymi, Mercedes-AMG Motorsport Edition Stealth 16 ma prawie takie same mocne i słabe strony jak wersja standardowa (proszę zapoznać się z pełnym testem). Na szczęście pozytywne aspekty przeważają nad negatywnymi.
Po stronie pozytywów laptop może pochwalić się przyjemnie lekką i kompaktową, a jednocześnie solidną obudową, mocnym dźwiękiem i stosunkowo dobrymi urządzeniami wejściowymi. Minusy to głównie ocena B ze względu na dławienie dysku SSD w miarę upływu czasu i nieco ograniczoną łączność USB (tylko jeden port typu A).
Wybór pomiędzy panelem OLED w wersji Motorsport a wyświetlaczem IPS zależy od osobistych preferencji.
Podczas gdy panel OLED oferuje znakomite wartości obrazu (poziom czerni, kontrast, przestrzeń kolorów, kąt widzenia, czas reakcji), ma on odblaskową powierzchnię, skromną częstotliwość (60 Hz) i potencjalne migotanie.
Ogólnie rzecz biorąc, nadal zasługuje na ocenę "bardzo dobrą". Alternatywy obejmują laptopy z procesorami Intela, takie jak HP Omen Transcend 16 i Schenker XMG Pro 16 wspomniane w artykule. Dla entuzjastów AMD warto rozważyć Lenovo Legion Pro 5 i Schenker XMG Core 16, oba otrzymując ocenę "bardzo dobrą".
Cena i dostępność
Cena MSI Stealth 16 Mercedes-AMG Motorsport A13VG wynosi 2 899 USD i można ją nabyć bezpośrednio na stronie MSI.
MSI Stealth 16 Mercedes-AMG Motorsport A13VG
- 28/11/2023 v7 (old)
Florian Glaser
Przezroczystość
Wyboru urządzeń do recenzji dokonuje nasza redakcja. Próbka testowa została udostępniona autorowi jako pożyczka od producenta lub sprzedawcy detalicznego na potrzeby tej recenzji. Pożyczkodawca nie miał wpływu na tę recenzję, producent nie otrzymał też kopii tej recenzji przed publikacją. Nie było obowiązku publikowania tej recenzji. Jako niezależna firma medialna, Notebookcheck nie podlega władzy producentów, sprzedawców detalicznych ani wydawców.
Tak testuje Notebookcheck
Każdego roku Notebookcheck niezależnie sprawdza setki laptopów i smartfonów, stosując standardowe procedury, aby zapewnić porównywalność wszystkich wyników. Od około 20 lat stale rozwijamy nasze metody badawcze, ustanawiając przy tym standardy branżowe. W naszych laboratoriach testowych doświadczeni technicy i redaktorzy korzystają z wysokiej jakości sprzętu pomiarowego. Testy te obejmują wieloetapowy proces walidacji. Nasz kompleksowy system ocen opiera się na setkach uzasadnionych pomiarów i benchmarków, co pozwala zachować obiektywizm.Price comparison

