Notebookcheck Logo

AMD Radeon RX Vega 6 (Ryzen 2000/3000)
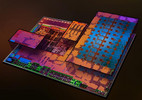
AMD Vega 6

-

RX Vega 2000/3000 Rodzina

Vega 10 640 @ 1.3 GHz
Vega 9 576 @ 1.3 GHz
Vega 8 512 @ 1.2 GHz
Vega 6 384 @ 1.1 GHz
Vega 3 192 @ 0.6 - 1.2 GHz
Vega 2 128 @ 1.1 GHz
Nazwa roboczaVega Raven Ridge
ArchitekturaVega
Potoki384 - ZJC
Zegar rdzenia1100 (Boost) MHz
Pamięć współdzielonanie
APIDirectX 12_1
Pobór prądu15 W
Liczba tranzystorów4.5 Billion
Technologia14 nm
TechnologieTiled Rasterization, pamięć współdzielona
Data premiery07.01.2018
CPU in Vega 6GPU Base SpeedGPU Boost / Turbo
AMD Ryzen 3 3350U4 x 2100 MHz, 15 W? MHz1200 MHz
AMD Ryzen 3 3300U4 x 2100 MHz, 15 W? MHz1200 MHz
AMD Ryzen 3 PRO 3300U4 x 2100 MHz, 15 W? MHz1200 MHz
min. - max.? MHz1100 - 1200 MHz

Testy

Performance Rating - 3DMark 11 + Fire Strike + Time Spy
6.1 pt (6%)
0.88 -86%
...
5.79 -5%
5.81 -4%
AMD Radeon 610M
5.85 -4%
5.88 -3%
5.93 -2%
5.95 -2%
5.95 -2%
6.01 -1%
Intel Iris Plus Graphics G7 (Ice Lake 64 EU)
6.08 0%
AMD Radeon RX Vega 6 (Ryzen 2000/3000)
6.08
6.09 0%
6.15 1%
NVIDIA GeForce MX230
6.19 2%
6.22 2%
6.23 2%
6.37 5%
6.45 6%
6.48 7%
6.52 7%
...
NVIDIA GeForce RTX 4090 Laptop GPU
68.2 1022%
0%
100%
3DMark - 3DMark Time Spy Score
min: 585     avg: 618     median: 617.5 (2%)     max: 650 Points
3DMark - 3DMark Time Spy Graphics
min: 522     avg: 552     median: 551.5 (1%)     max: 581 Points
113 -80%
...
410 -26%
417 -24%
419.6 -24%
442.5 -20%
450.5 -18%
452.3 -18%
471 -15%
493 -11%
550 0%
AMD Radeon RX Vega 6 (Ryzen 2000/3000)
552
555 1%
555 1%
Intel Iris Plus Graphics 655
570 3%
577 5%
614 11%
631 14%
Intel UHD Graphics Xe 750 32EUs (Rocket Lake)
638 16%
639 16%
650 18%
...
NVIDIA GeForce RTX 4090 Laptop GPU
20857 3678%
0%
100%
3DMark - 3DMark Ice Storm Unlimited Graphics
94451 Points (11%)
3DMark - 3DMark Ice Storm Extreme Graphics
65778 Points (9%)
3DMark - 3DMark Cloud Gate Score
min: 9963     avg: 10224     median: 10091 (11%)     max: 10619 Points
3DMark - 3DMark Cloud Gate Graphics
min: 15850     avg: 16926     median: 16787 (4%)     max: 18140 Points
3DMark - 3DMark Fire Strike Standard Score
min: 1878     avg: 2000     median: 2025 (1%)     max: 2096 Points
3DMark - 3DMark Fire Strike Standard Graphics
min: 2064     avg: 2207     median: 2245 (3%)     max: 2312 Points
3DMark - 3DMark Ice Storm Graphics
min: 87019     avg: 87377     median: 87377 (11%)     max: 87735 Points
3DMark - 3DMark Night Raid
6191 Points (6%)
3DMark - 3DMark Night Raid Graphics Score
7661 Points (3%)
3DMark 11 - 3DM11 Performance Score
min: 3049     avg: 3195     median: 3111 (4%)     max: 3425 Points
3DMark 11 - 3DM11 Performance GPU
min: 2986     avg: 3101     median: 2991 (3%)     max: 3325 Points
171.8 -94%
...
2872 -7%
2911 -6%
Qualcomm Adreno 690
2939 -5%
2941 -5%
2965 -4%
2967 -4%
2973 -4%
2985 -4%
3022 -3%
AMD Radeon RX Vega 6 (Ryzen 2000/3000)
3101
3106 0%
3131 1%
3220 4%
Intel UHD Graphics Xe G4 48EUs
3226 4%
3238 4%
3249 5%
3261 5%
Intel UHD Graphics Xe 32EUs (Tiger Lake-H)
3272 6%
3310 7%
...
NVIDIA GeForce RTX 4090 Laptop GPU
65603 2016%
0%
100%
3DMark Vantage
3DM Vant. Perf. total +
3DMark Vantage - 3DM Vant. Perf. total
8189 Points (2%)
3DM Vant. Perf. GPU no PhysX +
3DMark Vantage - 3DM Vant. Perf. GPU no PhysX
7387 Points (4%)
3DMark 06 3DMark 06 - Standard 1366x768 +
3DMark 06
11313 Points (16%)
3DMark 06 - Standard 1280x1024 +
3DMark 06
12132 Points (17%)
3DMark 06 - Standard 1280x720 +
3DMark 06
11264 Points (16%)
3DMark 06 - Standard 1024x768 +
3DMark 06
10132 Points (14%)
Cinebench R10 Cinebench R10 Shading (32bit) +
Cinebench R10 - Cinebench R10 Shading (32bit)
7146 pkt. (5%)
Cinebench R11.5 Cinebench R11.5 OpenGL 64 Bit +
Cinebench R11.5 - Cinebench R11.5 OpenGL 64 Bit
min: 39.43     avg: 41.2     median: 41.1 (15%)     max: 42.86 fps
Cinebench R15
Cinebench R15 OpenGL 64 Bit +
Cinebench R15 - Cinebench R15 OpenGL 64 Bit
min: 36.26     avg: 44.5     median: 46.4 (12%)     max: 50.7 fps
Cinebench R15 OpenGL Ref. Match 64 Bit +
Cinebench R15 - Cinebench R15 OpenGL Ref. Match 64 Bit
98 % (98%)
GFXBench (DX / GLBenchmark) 2.7
GFXBench 2.7 T-Rex HD Onscreen C24Z16 +
GFXBench (DX / GLBenchmark) 2.7 - GFXBench 2.7 T-Rex HD Onscreen C24Z16
59.8 fps (2%)
GFXBench T-Rex HD Offscreen C24Z16 +
GFXBench (DX / GLBenchmark) 2.7 - GFXBench T-Rex HD Offscreen C24Z16
164.6 fps (1%)
LuxMark v2.0 64Bit - LuxMark v2.0 Room GPU
241 Samples/s (1%)
LuxMark v2.0 64Bit - LuxMark v2.0 Sala GPU
558 Samples/s (1%)
ComputeMark v2.1 - ComputeMark v2.1 Result
1790 pkt. (2%)
- Zakres wyników testów referencyjnych dla tej karty graficznej
- Średnia wartość wyników testów referencyjnych dla tej karty graficzne
* Smaller numbers mean a higher performance

Testy gier

Zamieszczone niżej wyniki pochodzą z testów zrecenzowanych laptopów. Należy pamiętać, że osiągi poszczególnych konfiguracji zależą od zastosowanej pamięci własnej karty (VRAM), zegarów karty (mogą być różne), procesora, ustawień systemu, sterowników i wersji systemu operacyjnego. Tym samym uzyskane wyniki nie muszą być reprezentatywne dla wszystkich laptopów wyposażonych w daną kartę graficzną. By uzyskać szczegółowe informacje o wynikach testów, należy kliknąć na podaną wartość liczbową (fps, czyli kl/s).

low 1280x720
49.5  fps    + Porównaj + 📈 Graph
med. 1920x1080
10.2  fps    + Porównaj + 📈 Graph
» Na wszystkich testowanych laptopach grywalna przy ustawieniach low.
Additional Benchmarks
Low Preset (DX12) 1920x1080
18
Far Cry 6

Far Cry 6

2021
low 1280x720
18  fps    + Porównaj
» Niegrywalna na większości testowanych laptopów.
Additional Benchmarks
Low Graphics Quality 1920x1080
11
low 1280x720
19.8  fps    + Porównaj + 📈 Graph
med. 1920x1080
8.4  fps    + Porównaj + 📈 Graph
» Niegrywalna na większości testowanych laptopów.
Additional Benchmarks
Low Preset 1920x1080
10.4
FIFA 22

FIFA 22

2021
low 1280x720
44.4  fps    + Porównaj + 📈 Graph
med. 1920x1080
26.2  fps    + Porównaj + 📈 Graph
high 1920x1080
24.6  fps    + Porównaj + 📈 Graph
ultra 1920x1080
21.3  fps    + Porównaj + 📈 Graph
» Na wszystkich testowanych laptopach grywalna przy ustawieniach low.
Additional Benchmarks
Low Rendering Quality 1920x1080
31.5
New World

New World

2021
low 1280x720
10.2  fps    + Porównaj + 📈 Graph
» Niegrywalna na większości testowanych laptopów.
Deathloop

Deathloop

2021
low 1280x720
11.6  fps    + Porównaj + 📈 Graph
» Niegrywalna na większości testowanych laptopów.
Additional Benchmarks
Low Preset 1920x1080
9.3
F1 2021

F1 2021

2021
low 1280x720
43  fps    + Porównaj
med. 1920x1080
18.8  fps    + Porównaj
high 1920x1080
15.8  fps    + Porównaj
» Na wszystkich testowanych laptopach grywalna przy ustawieniach low.
low 1280x720
40.5  fps    + Porównaj + 📈 Graph
med. 1920x1080
21.9  fps    + Porównaj + 📈 Graph
high 1920x1080
18.1  fps    + Porównaj + 📈 Graph
» Na wszystkich testowanych laptopach grywalna przy ustawieniach low.
Additional Benchmarks
Low Preset 1920x1080
25.3
Days Gone

Days Gone

2021
low 1280x720
11.4  fps    + Porównaj + 📈 Graph
» Niegrywalna na większości testowanych laptopów.
Additional Benchmarks
Low Preset 1920x1080
7.7
low 1280x720
23.7  fps    + Porównaj + 📈 Graph
ultra 1920x1080
15.3  fps    + Porównaj + 📈 Graph
» Niegrywalna na większości testowanych laptopów.
low 1280x720
19  fps    + Porównaj + 📈 Graph
» Niegrywalna na większości testowanych laptopów.
Additional Benchmarks
Prioritize Performance Preset 1920x1080
11.5
Outriders

Outriders

2021
low 1280x720
20.9  fps    + Porównaj + 📈 Graph
med. 1920x1080
11.7  fps    + Porównaj + 📈 Graph
high 1920x1080
8.2  fps    + Porównaj + 📈 Graph
» Niegrywalna na większości testowanych laptopów.
Additional Benchmarks
Low Preset 1920x1080
14.1
Hitman 3

Hitman 3

2021
low 1280x720
33.5  fps    + Porównaj