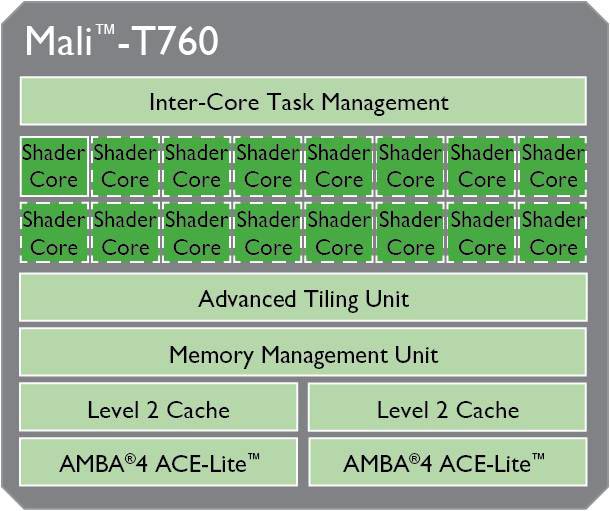
ARM Mali-T720 MP2
-
Mali-T700 Rodzina
| ||||||||||||||||||||||
| Nazwa robocza | Midgard (3rd Generation) | |||||||||||||||||||||
| Architektura | Midgard (3rd-gen) | |||||||||||||||||||||
| iGPU | Integrated Graphics | |||||||||||||||||||||
| Potoki | 2 - ZJC | |||||||||||||||||||||
| Zegar rdzenia | 650 MHz | |||||||||||||||||||||
| Pamięć współdzielona | nie | |||||||||||||||||||||
| API | DirectX 9.3, OpenGL ES 3.1 | |||||||||||||||||||||
| Technologie | OpenGL ES 3.1, OpenCL 1.1, DirectX 11.1, Renderscript, FSAA/MSAA | |||||||||||||||||||||
| Data premiery | 01.03.2015 | |||||||||||||||||||||
| Witryna producenta | www.arm.com | |||||||||||||||||||||
| ||||||||||||||||||||||||||||||||||||||||||||||||
Testy
| Model | CPU | GPU | RAM | Wartość |
|---|---|---|---|---|
Lenovo Tab 2 A8-50F  | MT8161 | Mali-T720 MP2 | 1 GB | 2739 |
| Ulefone Paris | MT6735 | Mali-T720 MP2 | 2 GB | 5240 |
| Wileyfox Spark X | MT6735 | Mali-T720 MP2 | 2 GB | 5291 |
| Wileyfox Spark Plus | MT6735 | Mali-T720 MP2 | 2 GB | 5374 |
| Allview P8 Energy | MT6735 | Mali-T720 MP2 | 2 GB | 5532 |
| Acer Liquid Z630 | MT6735 | Mali-T720 MP2 | 2 GB | 5540 |
| ZTE Blade V6 | MT6735 | Mali-T720 MP2 | 2 GB | 5677 |
| Bluboo Xtouch | MT6753 | Mali-T720 MP2 | 3 GB | 6673 |
| Archos 50 Saphir | MT6737T | Mali-T720 MP2 | 2 GB | 6734 |
| Nomu M6 | MT6737T | Mali-T720 MP2 | 2 GB | 7208 |
| Samsung Galaxy A3 2016 | 7578 | Mali-T720 MP2 | 1.5 GB | 7644 |
| Samsung Galaxy S5 Neo | 7580 Octa | Mali-T720 MP2 | 2 GB | 8304 |
| Samsung Galaxy A5 2016 | 7580 Octa | Mali-T720 MP2 | 2 GB | 8329 |
| Model | CPU | GPU | RAM | Wartość |
|---|---|---|---|---|
| Huawei Y5 II | MT6735 | Mali-T720 MP2 | 1 GB | |
| Oukitel U16 Max | MT6753 | Mali-T720 MP2 1300 MHz | 3 GB | |
| Coolpad Modena 2 | MT6735 | Mali-T720 MP2 | 2 GB | 2789 |
| Alcatel Shine Lite | MT6737 | Mali-T720 MP2 | 2 GB | 3116 |
| Gigaset GS170 | MT6737 | Mali-T720 MP2 | 2 GB | 3167 |
| Lenovo Moto E4 | MT6737 | Mali-T720 MP2 | 2 GB | 3168 |
| Lenovo Moto E4 Plus | MT6737 | Mali-T720 MP2 | 3 GB | 3183 |
| Lenovo Moto E4 Plus | MT6737 | Mali-T720 MP2 | 3 GB | 3183 |
| Lenovo Moto C Plus | MT6737 | Mali-T720 MP2 | 1 GB | 3226 |
| Gretel A9 | MT6737 | Mali-T720 MP2 | 2 GB | 3235 |
| Gigaset GS180 | MT6737 | Mali-T720 MP2 550 MHz | 2 GB | 3235 |
| Gigaset GS160 | MT6737 | Mali-T720 MP2 | 1 GB | 3291 |
| Asus Zenfone 3 Max ZC520TL | MT6737 | Mali-T720 MP2 | 3 GB | 3369 |
| Samsung Galaxy J3 2017 | Exynos 7570 | Mali-T720 MP2 | 2 GB | 3725 |
| TP-Link Neffos C5 | MT6735 | Mali-T720 MP2 | 2 GB | 4223 |
| Huawei Y6 II Compact | MT6735 | Mali-T720 MP2 | 2 GB | 4296 |
| LG X Power K220 | MT6735 | Mali-T720 MP2 | 2 GB | 4330 |
| Acer Liquid Zest Plus | MT6735 | Mali-T720 MP2 | 2 GB | 4333 |
| Lenovo Tab 2 A8-50F | MT8161 | Mali-T720 MP2 | 1 GB | 4340 |
| Allview P8 Energy | MT6735 | Mali-T720 MP2 | 2 GB | 4392 |
| Acer Liquid Z630 | MT6735 | Mali-T720 MP2 | 2 GB | 4408 |
| ZTE Blade V6 | MT6735 | Mali-T720 MP2 | 2 GB | 4415 |
| Ulefone Paris | MT6735 | Mali-T720 MP2 | 2 GB | 4527 |
| Sony Xperia E5 | MT6735 | Mali-T720 MP2 | 1.5 GB | 4615 |
| Asus ZenPad 10 (Z301ML) | MT8735 | Mali-T720 MP2 | 2 GB | 4622 |
| Wileyfox Spark Plus | MT6735 | Mali-T720 MP2 | 2 GB | 4659 |
| Wileyfox Spark X | MT6735 | Mali-T720 MP2 | 2 GB | 4680 |
| Lenovo Tab 3 10 Business TB3-X70L | MT8735 | Mali-T720 MP2 | 2 GB | 4681 |
| Leagoo Shark 1 | MT6753 | Mali-T720 MP2 | 3 GB | 4920 |
| Trekstor SurfTab B10 | MT8163 V/A 1.5 GHz | Mali-T720 MP2 | 2 GB | 5144 |
| Asus ZenPad 8.0 Z380M-6B026A | MT8163 V/B 1.3 GHz | Mali-T720 MP2 | 2 GB | 5326 |
| Blackview R6 | MT6737T | Mali-T720 MP2 | 3 GB | 5380 |
| Asus ZenPad 10.0 Z300M-6A039A | MT8163 V/B 1.3 GHz | Mali-T720 MP2 | 2 GB | 5490 |
| Amazon Fire 7 2019 | MT8163 V/B 1.3 GHz | Mali-T720 MP2 | 1 GB | 5562 |
| Amazon Fire 7 Kids Edition 2019 | MT8163 V/B 1.3 GHz | Mali-T720 MP2 | 1 GB | 5562 |
| Sony Xperia L2 | MT6737T | Mali-T720 MP2 600 MHz | 3 GB | 5960 |
| Archos Sense 50x | MT6737T | Mali-T720 MP2 | 3 GB | 5976 |
| Alcatel 3V | MT8735 | Mali-T720 MP2 | 2 GB | 6006 |
| Cyrus CS24 | MT6737T | Mali-T720 MP2 | 2 GB | 6014 |
| Sony Xperia L1 | MT6737T | Mali-T720 MP2 | 2 GB | 6015 |
| Nomu M6 | MT6737T | Mali-T720 MP2 | 2 GB | 6036 |
| Trekstor Surftab Theatre L15 | MT8163 V/A 1.5 GHz | Mali-T720 MP2 | 2 GB | 6067 |
| Doogee Shoot 1 | MT6737T | Mali-T720 MP2 | 2 GB | 6115 |
| Archos 50 Saphir | MT6737T | Mali-T720 MP2 | 2 GB | 6138 |
| Bluboo Xtouch | MT6753 | Mali-T720 MP2 | 3 GB | 6183 |
| Huawei Y6 2017 | MT6737T | Mali-T720 MP2 | 2 GB | 6184 |
| Trekstor Surftab Theatre S11 | MT8163 V/A 1.5 GHz | Mali-T720 MP2 | 3 GB | 6199 |
| Acer Liquid Z6 Plus | MT6753 | Mali-T720 MP2 | 3 GB | 6456 |
| Samsung Galaxy A3 2016 | 7578 | Mali-T720 MP2 | 1.5 GB | 6522 |
| Samsung Galaxy View | 7580 Octa | Mali-T720 MP2 | 2 GB | 7457 |
| Samsung Galaxy S5 Neo | 7580 Octa | Mali-T720 MP2 | 2 GB | 7536 |
| Samsung Galaxy A5 2016 | 7580 Octa | Mali-T720 MP2 | 2 GB | 7542 |
| Model | CPU | GPU | RAM | Wartość |
|---|---|---|---|---|
| Ulefone Paris | MT6735 | Mali-T720 MP2 | 2 GB | 2646 |
| Wileyfox Spark X | MT6735 | Mali-T720 MP2 | 2 GB | 2704 |
| Allview P8 Energy | MT6735 | Mali-T720 MP2 | 2 GB | 2724 |
| Acer Liquid Z630 | MT6735 | Mali-T720 MP2 | 2 GB | 2726 |
| Wileyfox Spark Plus | MT6735 | Mali-T720 MP2 | 2 GB | 2731 |
| Lenovo Tab 2 A8-50F | MT8161 | Mali-T720 MP2 | 1 GB | 2734 |
| ZTE Blade V6 | MT6735 | Mali-T720 MP2 | 2 GB | 2753 |
| Archos 50 Saphir | MT6737T | Mali-T720 MP2 | 2 GB | 3580 |
| Nomu M6 | MT6737T | Mali-T720 MP2 | 2 GB | 3706 |
| Bluboo Xtouch | MT6753 | Mali-T720 MP2 | 3 GB | 3783 |
| Samsung Galaxy A3 2016 | 7578 | Mali-T720 MP2 | 1.5 GB | 3937 |
| Samsung Galaxy S5 Neo | 7580 Octa | Mali-T720 MP2 | 2 GB | 4449 |
| Samsung Galaxy A5 2016 | 7580 Octa | Mali-T720 MP2 | 2 GB | 4451 |
| Model | CPU | GPU | RAM | Wartość |
|---|---|---|---|---|
| Huawei Y5 II | MT6735 | Mali-T720 MP2 | 1 GB | |
| Alcatel Shine Lite | MT6737 | Mali-T720 MP2 | 2 GB | 88 |
| Gretel A9 | MT6737 | Mali-T720 MP2 | 2 GB | 126 |
| Nokia 1 | MT6737 | Mali-T720 MP2 | 1 GB | 129 |
| Asus Zenfone 3 Max ZC520TL | MT6737 | Mali-T720 MP2 | 3 GB | 146 |
| Gigaset GS180 | MT6737 | Mali-T720 MP2 550 MHz | 2 GB | 150 |
| Gigaset GS170 | MT6737 | Mali-T720 MP2 | 2 GB | 152 |
| Lenovo Moto E4 | MT6737 | Mali-T720 MP2 | 2 GB | 153 |
| Lenovo Moto E4 Plus | MT6737 | Mali-T720 MP2 | 3 GB | 159 |
| Samsung Galaxy J3 2017 | Exynos 7570 | Mali-T720 MP2 | 2 GB | 182 |
| Huawei Y6 II Compact | MT6735 | Mali-T720 MP2 | 2 GB | 192 |
| Acer Liquid Zest Plus | MT6735 | Mali-T720 MP2 | 2 GB | 201 |
| Lenovo Tab 3 10 Business TB3-X70L | MT8735 | Mali-T720 MP2 | 2 GB | 207 |
| Asus ZenPad 10 (Z301ML) | MT8735 | Mali-T720 MP2 | 2 GB | 207 |
| Asus ZenPad 10.0 Z300M-6A039A | MT8163 V/B 1.3 GHz | Mali-T720 MP2 | 2 GB | 233 |
| Trekstor SurfTab B10 | MT8163 V/A 1.5 GHz | Mali-T720 MP2 | 2 GB | 233 |
| Asus ZenPad 8.0 Z380M-6B026A | MT8163 V/B 1.3 GHz | Mali-T720 MP2 | 2 GB | 234 |
| Huawei Y6 2017 | MT6737T | Mali-T720 MP2 | 2 GB | 242 |
| Amazon Fire 7 2019 | MT8163 V/B 1.3 GHz | Mali-T720 MP2 | 1 GB | 242 |
| Amazon Fire 7 Kids Edition 2019 | MT8163 V/B 1.3 GHz | Mali-T720 MP2 | 1 GB | 242 |
| Blackview R6 | MT6737T | Mali-T720 MP2 | 3 GB | 246 |
| Sony Xperia L1 | MT6737T | Mali-T720 MP2 | 2 GB | 260 |
| Doogee Shoot 1 | MT6737T | Mali-T720 MP2 | 2 GB | 261 |
| Trekstor Surftab Theatre S11 | MT8163 V/A 1.5 GHz | Mali-T720 MP2 | 3 GB | 261 |
| Archos 50 Saphir | MT6737T | Mali-T720 MP2 | 2 GB | 265 |
| Nomu M6 | MT6737T | Mali-T720 MP2 | 2 GB | 271 |
| Alcatel 3V | MT8735 | Mali-T720 MP2 | 2 GB | 271 |
| Archos Sense 50x | MT6737T | Mali-T720 MP2 | 3 GB | 272 |
| Trekstor Surftab Theatre L15 | MT8163 V/A 1.5 GHz | Mali-T720 MP2 | 2 GB | 273 |
| Cyrus CS24 | MT6737T | Mali-T720 MP2 | 2 GB | 273 |
| Acer Liquid Z6 Plus | MT6753 | Mali-T720 MP2 | 3 GB | 278 |
| Oukitel U16 Max | MT6753 | Mali-T720 MP2 1300 MHz | 3 GB | 293 |
| Samsung Galaxy View | 7580 Octa | Mali-T720 MP2 | 2 GB | 333 |
| Model | CPU | GPU | RAM | Wartość |
|---|---|---|---|---|
| Huawei Y5 II | MT6735 | Mali-T720 MP2 | 1 GB | |
| Alcatel Shine Lite | MT6737 | Mali-T720 MP2 | 2 GB | 70 |
| Gretel A9 | MT6737 | Mali-T720 MP2 | 2 GB | 102 |
| Nokia 1 | MT6737 | Mali-T720 MP2 | 1 GB | 105 |
| Lenovo Moto E4 | MT6737 | Mali-T720 MP2 | 2 GB | 118 |
| Asus Zenfone 3 Max ZC520TL | MT6737 | Mali-T720 MP2 | 3 GB | 119 |
| Gigaset GS180 | MT6737 | Mali-T720 MP2 550 MHz | 2 GB | 123 |
| Gigaset GS170 | MT6737 | Mali-T720 MP2 | 2 GB | 124 |
| Lenovo Moto E4 Plus | MT6737 | Mali-T720 MP2 | 3 GB | 129 |
| Samsung Galaxy J3 2017 | Exynos 7570 | Mali-T720 MP2 | 2 GB | 148 |
| Huawei Y6 II Compact | MT6735 | Mali-T720 MP2 | 2 GB | 157 |
| Acer Liquid Zest Plus | MT6735 | Mali-T720 MP2 | 2 GB | 165 |
| Lenovo Tab 3 10 Business TB3-X70L | MT8735 | Mali-T720 MP2 | 2 GB | 165 |
| Asus ZenPad 10 (Z301ML) | MT8735 | Mali-T720 MP2 | 2 GB | 171 |
| Asus ZenPad 8.0 Z380M-6B026A | MT8163 V/B 1.3 GHz | Mali-T720 MP2 | 2 GB | 193 |
| Asus ZenPad 10.0 Z300M-6A039A | MT8163 V/B 1.3 GHz | Mali-T720 MP2 | 2 GB | 193 |
| Trekstor SurfTab B10 | MT8163 V/A 1.5 GHz | Mali-T720 MP2 | 2 GB | 194 |
| Huawei Y6 2017 | MT6737T | Mali-T720 MP2 | 2 GB | 199 |
| Amazon Fire 7 2019 | MT8163 V/B 1.3 GHz | Mali-T720 MP2 | 1 GB | 201 |
| Amazon Fire 7 Kids Edition 2019 | MT8163 V/B 1.3 GHz | Mali-T720 MP2 | 1 GB | 201 |
| Blackview R6 | MT6737T | Mali-T720 MP2 | 3 GB | 209 |
| Sony Xperia L1 | MT6737T | Mali-T720 MP2 | 2 GB | 211 |
| Archos 50 Saphir | MT6737T | Mali-T720 MP2 | 2 GB | 219 |
| Trekstor Surftab Theatre S11 | MT8163 V/A 1.5 GHz | Mali-T720 MP2 | 3 GB | 219 |
| Doogee Shoot 1 | MT6737T | Mali-T720 MP2 | 2 GB | 220 |
| Alcatel 3V | MT8735 | Mali-T720 MP2 | 2 GB | 225 |
| Archos Sense 50x | MT6737T | Mali-T720 MP2 | 3 GB | 226 |
| Nomu M6 | MT6737T | Mali-T720 MP2 | 2 GB | 226 |
| Trekstor Surftab Theatre L15 | MT8163 V/A 1.5 GHz | Mali-T720 MP2 | 2 GB | 227 |
| Cyrus CS24 | MT6737T | Mali-T720 MP2 | 2 GB | 227 |
| Acer Liquid Z6 Plus | MT6753 | Mali-T720 MP2 | 3 GB | 238 |
| Oukitel U16 Max | MT6753 | Mali-T720 MP2 1300 MHz | 3 GB | 244 |
| Samsung Galaxy View | 7580 Octa | Mali-T720 MP2 | 2 GB | 273 |
| Model | CPU | GPU | RAM | Wartość |
|---|---|---|---|---|
| Huawei Y5 II | MT6735 | Mali-T720 MP2 | 1 GB | |
| Asus Zenfone 3 Max ZC520TL | MT6737 | Mali-T720 MP2 | 3 GB | |
| Trekstor SurfTab B10 | MT8163 V/A 1.5 GHz | Mali-T720 MP2 | 2 GB | |
| Amazon Fire 7 2019 | MT8163 V/B 1.3 GHz | Mali-T720 MP2 | 1 GB | |
| Amazon Fire 7 Kids Edition 2019 | MT8163 V/B 1.3 GHz | Mali-T720 MP2 | 1 GB | |
| Alcatel Shine Lite | MT6737 | Mali-T720 MP2 | 2 GB | 38 |
| Nokia 1 | MT6737 | Mali-T720 MP2 | 1 GB | 78 |
| Gretel A9 | MT6737 | Mali-T720 MP2 | 2 GB | 89 |
| Lenovo Moto E4 Plus | MT6737 | Mali-T720 MP2 | 3 GB | 93 |
| Lenovo Moto E4 | MT6737 | Mali-T720 MP2 | 2 GB | 99 |
| Samsung Galaxy J3 2017 | Exynos 7570 | Mali-T720 MP2 | 2 GB | 109 |
| Acer Liquid Zest Plus | MT6735 | Mali-T720 MP2 | 2 GB | 122 |
| LG X Power K220 | MT6735 | Mali-T720 MP2 | 2 GB | 123 |
| Asus ZenPad 10 (Z301ML) | MT8735 | Mali-T720 MP2 | 2 GB | 129 |
| Lenovo Tab 3 10 Business TB3-X70L | MT8735 | Mali-T720 MP2 | 2 GB | 133 |
| Asus ZenPad 10.0 Z300M-6A039A | MT8163 V/B 1.3 GHz | Mali-T720 MP2 | 2 GB | 142 |
| Asus ZenPad 8.0 Z380M-6B026A | MT8163 V/B 1.3 GHz | Mali-T720 MP2 | 2 GB | 143 |
| Gigaset GS180 | MT6737 | Mali-T720 MP2 550 MHz | 2 GB | 151 |
| Blackview R6 | MT6737T | Mali-T720 MP2 | 3 GB | 162 |
| Archos 50 Saphir | MT6737T | Mali-T720 MP2 | 2 GB | 163 |
| Doogee Shoot 1 | MT6737T | Mali-T720 MP2 | 2 GB | 163 |
| Huawei Y6 2017 | MT6737T | Mali-T720 MP2 | 2 GB | 163 |
| Trekstor Surftab Theatre S11 | MT8163 V/A 1.5 GHz | Mali-T720 MP2 | 3 GB | 167 |
| Alcatel 3V | MT8735 | Mali-T720 MP2 | 2 GB | 168 |
| Archos Sense 50x | MT6737T | Mali-T720 MP2 | 3 GB | 169 |
| Cyrus CS24 | MT6737T | Mali-T720 MP2 | 2 GB | 170 |
| Sony Xperia L1 | MT6737T | Mali-T720 MP2 | 2 GB | 171 |
| Acer Liquid Z6 Plus | MT6753 | Mali-T720 MP2 | 3 GB | 183 |
| Samsung Galaxy View | 7580 Octa | Mali-T720 MP2 | 2 GB | 187 |
| Oukitel U16 Max | MT6753 | Mali-T720 MP2 1300 MHz | 3 GB | 190 |
| Model | CPU | GPU | RAM | Wartość |
|---|---|---|---|---|
| Huawei Y5 II | MT6735 | Mali-T720 MP2 | 1 GB | |
| Trekstor SurfTab B10 | MT8163 V/A 1.5 GHz | Mali-T720 MP2 | 2 GB | |
| Amazon Fire 7 2019 | MT8163 V/B 1.3 GHz | Mali-T720 MP2 | 1 GB | |
| Amazon Fire 7 Kids Edition 2019 | MT8163 V/B 1.3 GHz | Mali-T720 MP2 | 1 GB | |
| Nokia 1 | MT6737 | Mali-T720 MP2 | 1 GB | 62 |
| Gretel A9 | MT6737 | Mali-T720 MP2 | 2 GB | 66 |
| Alcatel Shine Lite | MT6737 | Mali-T720 MP2 | 2 GB | 70 |
| Lenovo Moto E4 Plus | MT6737 | Mali-T720 MP2 | 3 GB | 74 |
| Lenovo Moto E4 | MT6737 | Mali-T720 MP2 | 2 GB | 85 |
| Samsung Galaxy J3 2017 | Exynos 7570 | Mali-T720 MP2 | 2 GB | 87 |
| Acer Liquid Zest Plus | MT6735 | Mali-T720 MP2 | 2 GB | 98 |
| LG X Power K220 | MT6735 | Mali-T720 MP2 | 2 GB | 99 |
| Lenovo Tab 3 10 Business TB3-X70L | MT8735 | Mali-T720 MP2 | 2 GB | 99 |
| Asus ZenPad 10 (Z301ML) | MT8735 | Mali-T720 MP2 | 2 GB | 104 |
| Asus ZenPad 8.0 Z380M-6B026A | MT8163 V/B 1.3 GHz | Mali-T720 MP2 | 2 GB | 115 |
| Asus ZenPad 10.0 Z300M-6A039A | MT8163 V/B 1.3 GHz | Mali-T720 MP2 | 2 GB | 115 |
| Gigaset GS180 | MT6737 | Mali-T720 MP2 550 MHz | 2 GB | 123 |
| Doogee Shoot 1 | MT6737T | Mali-T720 MP2 | 2 GB | 131 |
| Archos 50 Saphir | MT6737T | Mali-T720 MP2 | 2 GB | 132 |
| Blackview R6 | MT6737T | Mali-T720 MP2 | 3 GB | 132 |
| Huawei Y6 2017 | MT6737T | Mali-T720 MP2 | 2 GB | 132 |
| Trekstor Surftab Theatre S11 | MT8163 V/A 1.5 GHz | Mali-T720 MP2 | 3 GB | 136 |
| Archos Sense 50x | MT6737T | Mali-T720 MP2 | 3 GB | 137 |
| Alcatel 3V | MT8735 | Mali-T720 MP2 | 2 GB | 137 |
| Sony Xperia L1 | MT6737T | Mali-T720 MP2 | 2 GB | 138 |
| Cyrus CS24 | MT6737T | Mali-T720 MP2 | 2 GB | 138 |
| Acer Liquid Z6 Plus | MT6753 | Mali-T720 MP2 | 3 GB | 145 |
| Samsung Galaxy View | 7580 Octa | Mali-T720 MP2 | 2 GB | 150 |
| Oukitel U16 Max | MT6753 | Mali-T720 MP2 1300 MHz | 3 GB | 154 |
| Model | CPU | GPU | RAM | Wartość |
|---|---|---|---|---|
| Huawei Y5 II | MT6735 | Mali-T720 MP2 | 1 GB | |
| Lenovo C2 | MT6735 | Mali-T720 MP2 | 1 GB | |
| Nokia 1 | MT6737 | Mali-T720 MP2 | 1 GB | 76 |
| Gigaset GS180 | MT6737 | Mali-T720 MP2 550 MHz | 2 GB | 96 |
| Trekstor SurfTab B10 | MT8163 V/A 1.5 GHz | Mali-T720 MP2 | 2 GB | 101 |
| Samsung Galaxy J3 2017 | Exynos 7570 | Mali-T720 MP2 | 2 GB | 115 |
| Coolpad Modena 2 | MT6735 | Mali-T720 MP2 | 2 GB | 130 |
| Gretel A9 | MT6737 | Mali-T720 MP2 | 2 GB | 152 |
| Gigaset GS170 | MT6737 | Mali-T720 MP2 | 2 GB | 152 |
| Alcatel Shine Lite | MT6737 | Mali-T720 MP2 | 2 GB | 155 |
| Lenovo Moto E4 | MT6737 | Mali-T720 MP2 | 2 GB | 155 |
| Asus Zenfone 3 Max ZC520TL | MT6737 | Mali-T720 MP2 | 3 GB | 157 |
| Lenovo Moto E4 Plus | MT6737 | Mali-T720 MP2 | 3 GB | 163 |
| LG X Power K220 | MT6735 | Mali-T720 MP2 | 2 GB | 201 |
| Allview P8 Energy | MT6735 | Mali-T720 MP2 | 2 GB | 203 |
| TP-Link Neffos C5 | MT6735 | Mali-T720 MP2 | 2 GB | 203 |
| Huawei Y6 II Compact | MT6735 | Mali-T720 MP2 | 2 GB | 203 |
| Asus ZenPad 10 (Z301ML) | MT8735 | Mali-T720 MP2 | 2 GB | 203 |
| Lenovo Tab 3 10 Business TB3-X70L | MT8735 | Mali-T720 MP2 | 2 GB | 208 |
| Acer Liquid Zest Plus | MT6735 | Mali-T720 MP2 | 2 GB | 209 |
| Wileyfox Spark Plus | MT6735 | Mali-T720 MP2 | 2 GB | 209 |
| Wileyfox Spark X | MT6735 | Mali-T720 MP2 | 2 GB | 209 |
| Amazon Fire 7 2019 | MT8163 V/B 1.3 GHz | Mali-T720 MP2 | 1 GB | 210 |
| Amazon Fire 7 Kids Edition 2019 | MT8163 V/B 1.3 GHz | Mali-T720 MP2 | 1 GB | 210 |
| Alcatel 3V | MT8735 | Mali-T720 MP2 | 2 GB | 211 |
| Sony Xperia E5 | MT6735 | Mali-T720 MP2 | 1.5 GB | 212 |
| Trekstor Surftab Theatre L15 | MT8163 V/A 1.5 GHz | Mali-T720 MP2 | 2 GB | 241 |
| Asus ZenPad 10.0 Z300M-6A039A | MT8163 V/B 1.3 GHz | Mali-T720 MP2 | 2 GB | 245 |
| Asus ZenPad 8.0 Z380M-6B026A | MT8163 V/B 1.3 GHz | Mali-T720 MP2 | 2 GB | 246 |
| Trekstor Surftab Theatre S11 | MT8163 V/A 1.5 GHz | Mali-T720 MP2 | 3 GB | 252 |
| Blackview R6 | MT6737T | Mali-T720 MP2 | 3 GB | 258 |
| Archos 50 Saphir | MT6737T | Mali-T720 MP2 | 2 GB | 266 |
| Huawei Y6 2017 | MT6737T | Mali-T720 MP2 | 2 GB | 267 |
| Leagoo Shark 1 | MT6753 | Mali-T720 MP2 | 3 GB | 278 |
| Nomu M6 | MT6737T | Mali-T720 MP2 | 2 GB | 279 |
| Samsung Galaxy A3 2016 | 7578 | Mali-T720 MP2 | 1.5 GB | 281 |
| Doogee Shoot 1 | MT6737T | Mali-T720 MP2 | 2 GB | 282 |
| Archos Sense 50x | MT6737T | Mali-T720 MP2 | 3 GB | 283 |
| Sony Xperia L1 | MT6737T | Mali-T720 MP2 | 2 GB | 285 |
| Sony Xperia L2 | MT6737T | Mali-T720 MP2 600 MHz | 3 GB | 285 |
| Cyrus CS24 | MT6737T | Mali-T720 MP2 | 2 GB | 285 |
| Acer Liquid Z6 Plus | MT6753 | Mali-T720 MP2 | 3 GB | 291 |
| Oukitel U16 Max | MT6753 | Mali-T720 MP2 1300 MHz | 3 GB | 300 |
| Samsung Galaxy S5 Neo | 7580 Octa | Mali-T720 MP2 | 2 GB | 332 |
| Samsung Galaxy View | 7580 Octa | Mali-T720 MP2 | 2 GB | 333 |
| Samsung Galaxy A5 2016 | 7580 Octa | Mali-T720 MP2 | 2 GB | 336 |
| Model | CPU | GPU | RAM | Wartość |
|---|---|---|---|---|
| Huawei Y5 II | MT6735 | Mali-T720 MP2 | 1 GB | |
| Nokia 1 | MT6737 | Mali-T720 MP2 | 1 GB | 61 |
| Gigaset GS180 | MT6737 | Mali-T720 MP2 550 MHz | 2 GB | 77 |
| Trekstor SurfTab B10 | MT8163 V/A 1.5 GHz | Mali-T720 MP2 | 2 GB | 81 |
| Samsung Galaxy J3 2017 | Exynos 7570 | Mali-T720 MP2 | 2 GB | 92 |
| Coolpad Modena 2 | MT6735 | Mali-T720 MP2 | 2 GB | 106 |
| Gretel A9 | MT6737 | Mali-T720 MP2 | 2 GB | 124 |
| Alcatel Shine Lite | MT6737 | Mali-T720 MP2 | 2 GB | 126 |
| Lenovo Moto E4 | MT6737 | Mali-T720 MP2 | 2 GB | 126 |
| Asus Zenfone 3 Max ZC520TL | MT6737 | Mali-T720 MP2 | 3 GB | 128 |
| Lenovo Moto E4 Plus | MT6737 | Mali-T720 MP2 | 3 GB | 133 |
| LG X Power K220 | MT6735 | Mali-T720 MP2 | 2 GB | 165 |
| Allview P8 Energy | MT6735 | Mali-T720 MP2 | 2 GB | 167 |
| TP-Link Neffos C5 | MT6735 | Mali-T720 MP2 | 2 GB | 167 |
| Huawei Y6 II Compact | MT6735 | Mali-T720 MP2 | 2 GB | 167 |
| Asus ZenPad 10 (Z301ML) | MT8735 | Mali-T720 MP2 | 2 GB | 167 |
| Trekstor Surftab Theatre L15 | MT8163 V/A 1.5 GHz | Mali-T720 MP2 | 2 GB | 168 |
| Lenovo Tab 3 10 Business TB3-X70L | MT8735 | Mali-T720 MP2 | 2 GB | 171 |
| Acer Liquid Zest Plus | MT6735 | Mali-T720 MP2 | 2 GB | 172 |
| Wileyfox Spark Plus | MT6735 | Mali-T720 MP2 | 2 GB | 172 |
| Wileyfox Spark X | MT6735 | Mali-T720 MP2 | 2 GB | 172 |
| Amazon Fire 7 2019 | MT8163 V/B 1.3 GHz | Mali-T720 MP2 | 1 GB | 172 |
| Amazon Fire 7 Kids Edition 2019 | MT8163 V/B 1.3 GHz | Mali-T720 MP2 | 1 GB | 172 |
| Alcatel 3V | MT8735 | Mali-T720 MP2 | 2 GB | 173 |
| Sony Xperia E5 | MT6735 | Mali-T720 MP2 | 1.5 GB | 175 |
| Asus ZenPad 8.0 Z380M-6B026A | MT8163 V/B 1.3 GHz | Mali-T720 MP2 | 2 GB | 203 |
| Asus ZenPad 10.0 Z300M-6A039A | MT8163 V/B 1.3 GHz | Mali-T720 MP2 | 2 GB | 203 |
| Trekstor Surftab Theatre S11 | MT8163 V/A 1.5 GHz | Mali-T720 MP2 | 3 GB | 211 |
| Blackview R6 | MT6737T | Mali-T720 MP2 | 3 GB | 217 |
| Doogee Shoot 1 | MT6737T | Mali-T720 MP2 | 2 GB | 218 |
| Archos 50 Saphir | MT6737T | Mali-T720 MP2 | 2 GB | 220 |
| Huawei Y6 2017 | MT6737T | Mali-T720 MP2 | 2 GB | 221 |
| Gigaset GS170 | MT6737 | Mali-T720 MP2 | 2 GB | 227 |
| Leagoo Shark 1 | MT6753 | Mali-T720 MP2 | 3 GB | 232 |
| Samsung Galaxy A3 2016 | 7578 | Mali-T720 MP2 | 1.5 GB | 235 |
| Archos Sense 50x | MT6737T | Mali-T720 MP2 | 3 GB | 236 |
| Sony Xperia L1 | MT6737T | Mali-T720 MP2 | 2 GB | 238 |
| Sony Xperia L2 | MT6737T | Mali-T720 MP2 600 MHz | 3 GB | 238 |
| Cyrus CS24 | MT6737T | Mali-T720 MP2 | 2 GB | 238 |
| Acer Liquid Z6 Plus | MT6753 | Mali-T720 MP2 | 3 GB | 241 |
| Oukitel U16 Max | MT6753 | Mali-T720 MP2 1300 MHz | 3 GB | 248 |
| Nomu M6 | MT6737T | Mali-T720 MP2 | 2 GB | 262 |
| Samsung Galaxy S5 Neo | 7580 Octa | Mali-T720 MP2 | 2 GB | 272 |
| Samsung Galaxy View | 7580 Octa | Mali-T720 MP2 | 2 GB | 273 |
| Samsung Galaxy A5 2016 | 7580 Octa | Mali-T720 MP2 | 2 GB | 275 |
| Model | CPU | GPU | RAM | Wartość |
|---|---|---|---|---|
| Huawei Y5 II | MT6735 | Mali-T720 MP2 | 1 GB | |
| Lenovo C2 | MT6735 | Mali-T720 MP2 | 1 GB | |
| Trekstor SurfTab B10 | MT8163 V/A 1.5 GHz | Mali-T720 MP2 | 2 GB | |
| Trekstor Surftab Theatre L15 | MT8163 V/A 1.5 GHz | Mali-T720 MP2 | 2 GB | |
| Amazon Fire 7 2019 | MT8163 V/B 1.3 GHz | Mali-T720 MP2 | 1 GB | |
| Amazon Fire 7 Kids Edition 2019 | MT8163 V/B 1.3 GHz | Mali-T720 MP2 | 1 GB | |
| Nokia 1 | MT6737 | Mali-T720 MP2 | 1 GB | 75 |
| Samsung Galaxy J3 2017 | Exynos 7570 | Mali-T720 MP2 | 2 GB | 79 |
| Gigaset GS170 | MT6737 | Mali-T720 MP2 | 2 GB | 93 |
| Gigaset GS180 | MT6737 | Mali-T720 MP2 550 MHz | 2 GB | 94 |
| Lenovo Moto E4 Plus | MT6737 | Mali-T720 MP2 | 3 GB | 99 |
| Alcatel Shine Lite | MT6737 | Mali-T720 MP2 | 2 GB | 101 |
| Gretel A9 | MT6737 | Mali-T720 MP2 | 2 GB | 102 |
| Asus Zenfone 3 Max ZC520TL | MT6737 | Mali-T720 MP2 | 3 GB | 103 |
| Lenovo Moto E4 | MT6737 | Mali-T720 MP2 | 2 GB | 106 |
| Allview P8 Energy | MT6735 | Mali-T720 MP2 | 2 GB | 124 |
| Sony Xperia E5 | MT6735 | Mali-T720 MP2 | 1.5 GB | 124 |
| Huawei Y6 II Compact | MT6735 | Mali-T720 MP2 | 2 GB | 124 |
| TP-Link Neffos C5 | MT6735 | Mali-T720 MP2 | 2 GB | 125 |
| Acer Liquid Zest Plus | MT6735 | Mali-T720 MP2 | 2 GB | 127 |
| LG X Power K220 | MT6735 | Mali-T720 MP2 | 2 GB | 127 |
| Lenovo Tab 3 10 Business TB3-X70L | MT8735 | Mali-T720 MP2 | 2 GB | 127 |
| Wileyfox Spark Plus | MT6735 | Mali-T720 MP2 | 2 GB | 128 |
| Wileyfox Spark X | MT6735 | Mali-T720 MP2 | 2 GB | 129 |
| Asus ZenPad 10 (Z301ML) | MT8735 | Mali-T720 MP2 | 2 GB | 134 |
| Asus ZenPad 8.0 Z380M-6B026A | MT8163 V/B 1.3 GHz | Mali-T720 MP2 | 2 GB | 143 |
| Asus ZenPad 10.0 Z300M-6A039A | MT8163 V/B 1.3 GHz | Mali-T720 MP2 | 2 GB | 152 |
| Alcatel 3V | MT8735 | Mali-T720 MP2 | 2 GB | 160 |
| Blackview R6 | MT6737T | Mali-T720 MP2 | 3 GB | 169 |
| Trekstor Surftab Theatre S11 | MT8163 V/A 1.5 GHz | Mali-T720 MP2 | 3 GB | 169 |
| Leagoo Shark 1 | MT6753 | Mali-T720 MP2 | 3 GB | 172 |
| Doogee Shoot 1 | MT6737T | Mali-T720 MP2 | 2 GB | 173 |
| Archos 50 Saphir | MT6737T | Mali-T720 MP2 | 2 GB | 175 |
| Huawei Y6 2017 | MT6737T | Mali-T720 MP2 | 2 GB | 176 |
| Archos Sense 50x | MT6737T | Mali-T720 MP2 | 3 GB | 176 |
| Nomu M6 | MT6737T | Mali-T720 MP2 | 2 GB | 183 |
| Sony Xperia L1 | MT6737T | Mali-T720 MP2 | 2 GB | 184 |
| Cyrus CS24 | MT6737T | Mali-T720 MP2 | 2 GB | 184 |
| Sony Xperia L2 | MT6737T | Mali-T720 MP2 600 MHz | 3 GB | 186 |
| Acer Liquid Z6 Plus | MT6753 | Mali-T720 MP2 | 3 GB | 197 |
| Samsung Galaxy View | 7580 Octa | Mali-T720 MP2 | 2 GB | 208 |
| Oukitel U16 Max | MT6753 | Mali-T720 MP2 1300 MHz | 3 GB | 208 |
| Samsung Galaxy S5 Neo | 7580 Octa | Mali-T720 MP2 | 2 GB | 211 |
| Model | CPU | GPU | RAM | Wartość |
|---|---|---|---|---|
| Huawei Y5 II | MT6735 | Mali-T720 MP2 | 1 GB | |
| Trekstor SurfTab B10 | MT8163 V/A 1.5 GHz | Mali-T720 MP2 | 2 GB | |
| Amazon Fire 7 2019 | MT8163 V/B 1.3 GHz | Mali-T720 MP2 | 1 GB | |
| Amazon Fire 7 Kids Edition 2019 | MT8163 V/B 1.3 GHz | Mali-T720 MP2 | 1 GB | |
| Nokia 1 | MT6737 | Mali-T720 MP2 | 1 GB | 60 |
| Samsung Galaxy J3 2017 | Exynos 7570 | Mali-T720 MP2 | 2 GB | 63 |
| Gigaset GS170 | MT6737 | Mali-T720 MP2 | 2 GB | 74 |
| Gigaset GS180 | MT6737 | Mali-T720 MP2 550 MHz | 2 GB | 75 |
| Lenovo Moto E4 Plus | MT6737 | Mali-T720 MP2 | 3 GB | 79 |
| Alcatel Shine Lite | MT6737 | Mali-T720 MP2 | 2 GB | 81 |
| Gretel A9 | MT6737 | Mali-T720 MP2 | 2 GB | 82 |
| Asus Zenfone 3 Max ZC520TL | MT6737 | Mali-T720 MP2 | 3 GB | 83 |
| Lenovo Moto E4 | MT6737 | Mali-T720 MP2 | 2 GB | 85 |
| Allview P8 Energy | MT6735 | Mali-T720 MP2 | 2 GB | 100 |
| Sony Xperia E5 | MT6735 | Mali-T720 MP2 | 1.5 GB | 100 |
| Huawei Y6 II Compact | MT6735 | Mali-T720 MP2 | 2 GB | 100 |
| TP-Link Neffos C5 | MT6735 | Mali-T720 MP2 | 2 GB | 101 |
| Acer Liquid Zest Plus | MT6735 | Mali-T720 MP2 | 2 GB | 102 |
| LG X Power K220 | MT6735 | Mali-T720 MP2 | 2 GB | 102 |
| Lenovo Tab 3 10 Business TB3-X70L | MT8735 | Mali-T720 MP2 | 2 GB | 102 |
| Wileyfox Spark Plus | MT6735 | Mali-T720 MP2 | 2 GB | 103 |
| Wileyfox Spark X | MT6735 | Mali-T720 MP2 | 2 GB | 104 |
| Asus ZenPad 10 (Z301ML) | MT8735 | Mali-T720 MP2 | 2 GB | 108 |
| Asus ZenPad 8.0 Z380M-6B026A | MT8163 V/B 1.3 GHz | Mali-T720 MP2 | 2 GB | 116 |
| Asus ZenPad 10.0 Z300M-6A039A | MT8163 V/B 1.3 GHz | Mali-T720 MP2 | 2 GB | 123 |
| Alcatel 3V | MT8735 | Mali-T720 MP2 | 2 GB | 130 |
| Blackview R6 | MT6737T | Mali-T720 MP2 | 3 GB | 138 |
| Trekstor Surftab Theatre S11 | MT8163 V/A 1.5 GHz | Mali-T720 MP2 | 3 GB | 139 |
| Leagoo Shark 1 | MT6753 | Mali-T720 MP2 | 3 GB | 140 |
| Doogee Shoot 1 | MT6737T | Mali-T720 MP2 | 2 GB | 141 |
| Archos 50 Saphir | MT6737T | Mali-T720 MP2 | 2 GB | 142 |
| Huawei Y6 2017 | MT6737T | Mali-T720 MP2 | 2 GB | 143 |
| Archos Sense 50x | MT6737T | Mali-T720 MP2 | 3 GB | 143 |
| Sony Xperia L1 | MT6737T | Mali-T720 MP2 | 2 GB | 149 |
| Nomu M6 | MT6737T | Mali-T720 MP2 | 2 GB | 149 |
| Cyrus CS24 | MT6737T | Mali-T720 MP2 | 2 GB | 150 |
| Sony Xperia L2 | MT6737T | Mali-T720 MP2 600 MHz | 3 GB | 151 |
| Acer Liquid Z6 Plus | MT6753 | Mali-T720 MP2 | 3 GB | 160 |
| Samsung Galaxy View | 7580 Octa | Mali-T720 MP2 | 2 GB | 168 |
| Samsung Galaxy S5 Neo | 7580 Octa | Mali-T720 MP2 | 2 GB | 169 |
| Oukitel U16 Max | MT6753 | Mali-T720 MP2 1300 MHz | 3 GB | 169 |
| Model | CPU | GPU | RAM | Wartość |
|---|---|---|---|---|
| Amazon Fire 7 2019 | MT8163 V/B 1.3 GHz | Mali-T720 MP2 | 1 GB | |
| Amazon Fire 7 Kids Edition 2019 | MT8163 V/B 1.3 GHz | Mali-T720 MP2 | 1 GB | |
| Trekstor Surftab Theatre S11 | MT8163 V/A 1.5 GHz | Mali-T720 MP2 | 3 GB |
| Model | CPU | GPU | RAM | Wartość |
|---|---|---|---|---|
| Amazon Fire 7 2019 | MT8163 V/B 1.3 GHz | Mali-T720 MP2 | 1 GB | |
| Amazon Fire 7 Kids Edition 2019 | MT8163 V/B 1.3 GHz | Mali-T720 MP2 | 1 GB | |
| Trekstor Surftab Theatre S11 | MT8163 V/A 1.5 GHz | Mali-T720 MP2 | 3 GB |
| Model | CPU | GPU | RAM | Wartość |
|---|---|---|---|---|
| Huawei Y6 2017 | MT6737T | Mali-T720 MP2 | 2 GB | |
| Alcatel 3V | MT8735 | Mali-T720 MP2 | 2 GB | |
| Trekstor SurfTab B10 | MT8163 V/A 1.5 GHz | Mali-T720 MP2 | 2 GB | |
| Trekstor Surftab Theatre L15 | MT8163 V/A 1.5 GHz | Mali-T720 MP2 | 2 GB | |
| Amazon Fire 7 Kids Edition 2019 | MT8163 V/B 1.3 GHz | Mali-T720 MP2 | 1 GB | |
| Trekstor Surftab Theatre S11 | MT8163 V/A 1.5 GHz | Mali-T720 MP2 | 3 GB |
| Model | CPU | GPU | RAM | Wartość |
|---|---|---|---|---|
| Huawei Y5 II | MT6735 | Mali-T720 MP2 | 1 GB | |
| Lenovo C2 | MT6735 | Mali-T720 MP2 | 1 GB | 1.2 |
| Nokia 1 | MT6737 | Mali-T720 MP2 | 1 GB | 1.2 |
| Acer Liquid Z630 | MT6735 | Mali-T720 MP2 | 2 GB | 1.4 |
| Asus Zenfone 3 Max ZC520TL | MT6737 | Mali-T720 MP2 | 3 GB | 1.4 |
| Alcatel Shine Lite | MT6737 | Mali-T720 MP2 | 2 GB | 1.4 |
| Gigaset GS160 | MT6737 | Mali-T720 MP2 | 1 GB | 1.4 |
| Gretel A9 | MT6737 | Mali-T720 MP2 | 2 GB | 1.4 |
| Lenovo Moto E4 | MT6737 | Mali-T720 MP2 | 2 GB | 1.4 |
| Lenovo Moto E4 Plus | MT6737 | Mali-T720 MP2 | 3 GB | 1.4 |
| Gigaset GS170 | MT6737 | Mali-T720 MP2 | 2 GB | 1.4 |
| Lenovo Moto C Plus | MT6737 | Mali-T720 MP2 | 1 GB | 1.4 |
| Gigaset GS180 | MT6737 | Mali-T720 MP2 550 MHz | 2 GB | 1.4 |
| Huawei Y6 II Compact | MT6735 | Mali-T720 MP2 | 2 GB | 1.7 |
| Samsung Galaxy J3 2017 | Exynos 7570 | Mali-T720 MP2 | 2 GB | 1.7 |
| Sony Xperia E5 | MT6735 | Mali-T720 MP2 | 1.5 GB | 1.9 |
| Lenovo Tab 3 10 Business TB3-X70L | MT8735 | Mali-T720 MP2 | 2 GB | 1.9 |
| Wileyfox Spark X | MT6735 | Mali-T720 MP2 | 2 GB | 1.9 |
| LG X Power K220 | MT6735 | Mali-T720 MP2 | 2 GB | 2 |
| Wileyfox Spark Plus | MT6735 | Mali-T720 MP2 | 2 GB | 2 |
| Asus ZenPad 10 (Z301ML) | MT8735 | Mali-T720 MP2 | 2 GB | 2 |
| Trekstor SurfTab B10 | MT8163 V/A 1.5 GHz | Mali-T720 MP2 | 2 GB | 2.2 |
| Asus ZenPad 8.0 Z380M-6B026A | MT8163 V/B 1.3 GHz | Mali-T720 MP2 | 2 GB | 2.3 |
| Asus ZenPad 10.0 Z300M-6A039A | MT8163 V/B 1.3 GHz | Mali-T720 MP2 | 2 GB | 2.3 |
| Amazon Fire 7 2019 | MT8163 V/B 1.3 GHz | Mali-T720 MP2 | 1 GB | 2.4 |
| Amazon Fire 7 Kids Edition 2019 | MT8163 V/B 1.3 GHz | Mali-T720 MP2 | 1 GB | 2.4 |
| Leagoo Shark 1 | MT6753 | Mali-T720 MP2 | 3 GB | 2.5 |
| Blackview R6 | MT6737T | Mali-T720 MP2 | 3 GB | 2.5 |
| Huawei Y6 2017 | MT6737T | Mali-T720 MP2 | 2 GB | 2.5 |
| Nomu M6 | MT6737T | Mali-T720 MP2 | 2 GB | 2.5 |
| Alcatel 3V | MT8735 | Mali-T720 MP2 | 2 GB | 2.5 |
| Archos 50 Saphir | MT6737T | Mali-T720 MP2 | 2 GB | 2.6 |
| Doogee Shoot 1 | MT6737T | Mali-T720 MP2 | 2 GB | 2.6 |
| Sony Xperia L1 | MT6737T | Mali-T720 MP2 | 2 GB | 2.6 |
| Archos Sense 50x | MT6737T | Mali-T720 MP2 | 3 GB | 2.6 |
| Sony Xperia L2 | MT6737T | Mali-T720 MP2 600 MHz | 3 GB | 2.6 |
| Trekstor Surftab Theatre L15 | MT8163 V/A 1.5 GHz | Mali-T720 MP2 | 2 GB | 2.6 |
| Cyrus CS24 | MT6737T | Mali-T720 MP2 | 2 GB | 2.6 |
| Trekstor Surftab Theatre S11 | MT8163 V/A 1.5 GHz | Mali-T720 MP2 | 3 GB | 2.6 |
| Coolpad Modena 2 | MT6735 | Mali-T720 MP2 | 2 GB | 2.9 |
| Oukitel U16 Max | MT6753 | Mali-T720 MP2 1300 MHz | 3 GB | 2.9 |
| Samsung Galaxy S5 Neo | 7580 Octa | Mali-T720 MP2 | 2 GB | 3.1 |
| Samsung Galaxy View | 7580 Octa | Mali-T720 MP2 | 2 GB | 3.1 |
| Acer Liquid Z6 Plus | MT6753 | Mali-T720 MP2 | 3 GB | 3.1 |
| Acer Liquid Zest Plus | MT6735 | Mali-T720 MP2 | 2 GB | 4.4 |
| Model | CPU | GPU | RAM | Wartość |
|---|---|---|---|---|
| Huawei Y5 II | MT6735 | Mali-T720 MP2 | 1 GB | |
| Lenovo C2 | MT6735 | Mali-T720 MP2 | 1 GB | |
| Ulefone Paris | MT6735 | Mali-T720 MP2 | 2 GB | 1.6 |
| Coolpad Modena 2 | MT6735 | Mali-T720 MP2 | 2 GB | 1.8 |
| Nokia 1 | MT6737 | Mali-T720 MP2 | 1 GB | 1.9 |
| Alcatel Shine Lite | MT6737 | Mali-T720 MP2 | 2 GB | 2.1 |
| Gigaset GS160 | MT6737 | Mali-T720 MP2 | 1 GB | 2.1 |
| Asus Zenfone 3 Max ZC520TL | MT6737 | Mali-T720 MP2 | 3 GB | 2.2 |
| Gretel A9 | MT6737 | Mali-T720 MP2 | 2 GB | 2.2 |
| Lenovo Moto E4 | MT6737 | Mali-T720 MP2 | 2 GB | 2.2 |
| Lenovo Moto E4 Plus | MT6737 | Mali-T720 MP2 | 3 GB | 2.2 |
| Gigaset GS170 | MT6737 | Mali-T720 MP2 | 2 GB | 2.2 |
| Acer Liquid Z630 | MT6735 | Mali-T720 MP2 | 2 GB | 2.3 |
| Gigaset GS180 | MT6737 | Mali-T720 MP2 550 MHz | 2 GB | 2.3 |
| Samsung Galaxy J3 2017 | Exynos 7570 | Mali-T720 MP2 | 2 GB | 2.6 |
| ZTE Blade V6 | MT6735 | Mali-T720 MP2 | 2 GB | 2.8 |
| Allview P8 Energy | MT6735 | Mali-T720 MP2 | 2 GB | 2.8 |
| Huawei Y6 II Compact | MT6735 | Mali-T720 MP2 | 2 GB | 2.8 |
| Oukitel U16 Max | MT6753 | Mali-T720 MP2 1300 MHz | 3 GB | 2.9 |
| Sony Xperia E5 | MT6735 | Mali-T720 MP2 | 1.5 GB | 3 |
| Lenovo Tab 3 10 Business TB3-X70L | MT8735 | Mali-T720 MP2 | 2 GB | 3 |
| Wileyfox Spark Plus | MT6735 | Mali-T720 MP2 | 2 GB | 3 |
| Wileyfox Spark X | MT6735 | Mali-T720 MP2 | 2 GB | 3 |
| LG X Power K220 | MT6735 | Mali-T720 MP2 | 2 GB | 3.1 |
| Asus ZenPad 10 (Z301ML) | MT8735 | Mali-T720 MP2 | 2 GB | 3.1 |
| Asus ZenPad 10.0 Z300M-6A039A | MT8163 V/B 1.3 GHz | Mali-T720 MP2 | 2 GB | 3.5 |
| Asus ZenPad 8.0 Z380M-6B026A | MT8163 V/B 1.3 GHz | Mali-T720 MP2 | 2 GB | 3.6 |
| Trekstor SurfTab B10 | MT8163 V/A 1.5 GHz | Mali-T720 MP2 | 2 GB | 3.6 |
| Samsung Galaxy A5 2016 | 7580 Octa | Mali-T720 MP2 | 2 GB | 3.8 |
| Amazon Fire 7 2019 | MT8163 V/B 1.3 GHz | Mali-T720 MP2 | 1 GB | 3.8 |
| Amazon Fire 7 Kids Edition 2019 | MT8163 V/B 1.3 GHz | Mali-T720 MP2 | 1 GB | 3.8 |
| Huawei Y6 2017 | MT6737T | Mali-T720 MP2 | 2 GB | 3.9 |
| Archos 50 Saphir | MT6737T | Mali-T720 MP2 | 2 GB | 4 |
| Blackview R6 | MT6737T | Mali-T720 MP2 | 3 GB | 4 |
| Doogee Shoot 1 | MT6737T | Mali-T720 MP2 | 2 GB | 4 |
| Samsung Galaxy A3 2016 | 7578 | Mali-T720 MP2 | 1.5 GB | 4.1 |
| Sony Xperia L1 | MT6737T | Mali-T720 MP2 | 2 GB | 4.1 |
| Archos Sense 50x | MT6737T | Mali-T720 MP2 | 3 GB | 4.1 |
| Sony Xperia L2 | MT6737T | Mali-T720 MP2 600 MHz | 3 GB | 4.1 |
| Nomu M6 | MT6737T | Mali-T720 MP2 | 2 GB | 4.1 |
| Cyrus CS24 | MT6737T | Mali-T720 MP2 | 2 GB | 4.1 |
| Bluboo Xtouch | MT6753 | Mali-T720 MP2 | 3 GB | 4.2 |
| Leagoo Shark 1 | MT6753 | Mali-T720 MP2 | 3 GB | 4.2 |
| Trekstor Surftab Theatre S11 | MT8163 V/A 1.5 GHz | Mali-T720 MP2 | 3 GB | 4.2 |
| Alcatel 3V | MT8735 | Mali-T720 MP2 | 2 GB | 4.3 |
| Trekstor Surftab Theatre L15 | MT8163 V/A 1.5 GHz | Mali-T720 MP2 | 2 GB | 4.3 |
| Acer Liquid Z6 Plus | MT6753 | Mali-T720 MP2 | 3 GB | 4.5 |
| Lenovo Moto C Plus | MT6737 | Mali-T720 MP2 | 1 GB | 4.5 |
| Samsung Galaxy View | 7580 Octa | Mali-T720 MP2 | 2 GB | 4.7 |
| Samsung Galaxy S5 Neo | 7580 Octa | Mali-T720 MP2 | 2 GB | 4.8 |
| Acer Liquid Zest Plus | MT6735 | Mali-T720 MP2 | 2 GB | 6 |
| TP-Link Neffos C5 | MT6735 | Mali-T720 MP2 | 2 GB | 6.1 |
GFXBench T-Rex HD Offscreen C24Z16 +
| Model | CPU | GPU | RAM | Wartość |
|---|---|---|---|---|
| Coolpad Modena 2 | MT6735 | Mali-T720 MP2 | 2 GB | 5 |
| Lenovo C2 | MT6735 | Mali-T720 MP2 | 1 GB | 5 |
| Nokia 1 | MT6737 | Mali-T720 MP2 | 1 GB | 5.1 |
| Asus Zenfone 3 Max ZC520TL | MT6737 | Mali-T720 MP2 | 3 GB | 5.9 |
| Alcatel Shine Lite | MT6737 | Mali-T720 MP2 | 2 GB | 5.9 |
| Gigaset GS160 | MT6737 | Mali-T720 MP2 | 1 GB | 6 |
| Gretel A9 | MT6737 | Mali-T720 MP2 | 2 GB | 6 |
| Lenovo Moto E4 | MT6737 | Mali-T720 MP2 | 2 GB | 6 |
| Lenovo Moto E4 Plus | MT6737 | Mali-T720 MP2 | 3 GB | 6 |
| Gigaset GS170 | MT6737 | Mali-T720 MP2 | 2 GB | 6 |
| Gigaset GS180 | MT6737 | Mali-T720 MP2 550 MHz | 2 GB | 6 |
| Samsung Galaxy J3 2017 | Exynos 7570 | Mali-T720 MP2 | 2 GB | 6.8 |
| Lenovo Tab 3 10 Business TB3-X70L | MT8735 | Mali-T720 MP2 | 2 GB | 8.3 |
| Allview P8 Energy | MT6735 | Mali-T720 MP2 | 2 GB | 8.4 |
| Sony Xperia E5 | MT6735 | Mali-T720 MP2 | 1.5 GB | 8.4 |
| Huawei Y5 II | MT6735 | Mali-T720 MP2 | 1 GB | 8.4 |
| Huawei Y6 II Compact | MT6735 | Mali-T720 MP2 | 2 GB | 8.4 |
| LG X Power K220 | MT6735 | Mali-T720 MP2 | 2 GB | 8.4 |
| Wileyfox Spark X | MT6735 | Mali-T720 MP2 | 2 GB | 8.4 |
| ZTE Blade V6 | MT6735 | Mali-T720 MP2 | 2 GB | 8.5 |
| Acer Liquid Z630 | MT6735 | Mali-T720 MP2 | 2 GB | 8.5 |
| Asus ZenPad 10 (Z301ML) | MT8735 | Mali-T720 MP2 | 2 GB | 8.6 |
| Leagoo Shark 1 | MT6753 | Mali-T720 MP2 | 3 GB | 8.9 |
| Wileyfox Spark Plus | MT6735 | Mali-T720 MP2 | 2 GB | 9 |
| Trekstor SurfTab B10 | MT8163 V/A 1.5 GHz | Mali-T720 MP2 | 2 GB | 9.3 |
| Blackview R6 | MT6737T | Mali-T720 MP2 | 3 GB | 9.8 |
| Asus ZenPad 8.0 Z380M-6B026A | MT8163 V/B 1.3 GHz | Mali-T720 MP2 | 2 GB | 10 |
| Asus ZenPad 10.0 Z300M-6A039A | MT8163 V/B 1.3 GHz | Mali-T720 MP2 | 2 GB | 10 |
| Lenovo Moto C Plus | MT6737 | Mali-T720 MP2 | 1 GB | 10 |
| Amazon Fire 7 2019 | MT8163 V/B 1.3 GHz | Mali-T720 MP2 | 1 GB | 10 |
| Amazon Fire 7 Kids Edition 2019 | MT8163 V/B 1.3 GHz | Mali-T720 MP2 | 1 GB | 10 |
| Trekstor Surftab Theatre S11 | MT8163 V/A 1.5 GHz | Mali-T720 MP2 | 3 GB | 10 |
| Archos 50 Saphir | MT6737T | Mali-T720 MP2 | 2 GB | 11 |
| Doogee Shoot 1 | MT6737T | Mali-T720 MP2 | 2 GB | 11 |
| Sony Xperia L1 | MT6737T | Mali-T720 MP2 | 2 GB | 11 |
| Huawei Y6 2017 | MT6737T | Mali-T720 MP2 | 2 GB | 11 |
| Archos Sense 50x | MT6737T | Mali-T720 MP2 | 3 GB | 11 |
| Sony Xperia L2 | MT6737T | Mali-T720 MP2 600 MHz | 3 GB | 11 |
| Nomu M6 | MT6737T | Mali-T720 MP2 | 2 GB | 11 |
| Alcatel 3V | MT8735 | Mali-T720 MP2 | 2 GB | 11 |
| Cyrus CS24 | MT6737T | Mali-T720 MP2 | 2 GB | 11 |
| Samsung Galaxy A3 2016 | 7578 | Mali-T720 MP2 | 1.5 GB | 12 |
| Acer Liquid Z6 Plus | MT6753 | Mali-T720 MP2 | 3 GB | 12 |
| Oukitel U16 Max | MT6753 | Mali-T720 MP2 1300 MHz | 3 GB | 12 |
| Trekstor Surftab Theatre L15 | MT8163 V/A 1.5 GHz | Mali-T720 MP2 | 2 GB | 12 |
| Samsung Galaxy View | 7580 Octa | Mali-T720 MP2 | 2 GB | 13 |
| Samsung Galaxy S5 Neo | 7580 Octa | Mali-T720 MP2 | 2 GB | 14 |
| Samsung Galaxy A5 2016 | 7580 Octa | Mali-T720 MP2 | 2 GB | 14 |
| Acer Liquid Zest Plus | MT6735 | Mali-T720 MP2 | 2 GB | 14 |
| TP-Link Neffos C5 | MT6735 | Mali-T720 MP2 | 2 GB | 14 |
| Model | CPU | GPU | RAM | Wartość |
|---|---|---|---|---|
| Bluboo Xtouch | MT6753 | Mali-T720 MP2 | 3 GB | 25.17 |
| Ulefone Paris | MT6735 | Mali-T720 MP2 | 2 GB | 32.49 |
| Lenovo Tab 2 A8-50F | MT8161 | Mali-T720 MP2 | 1 GB | 34.29 |
| Model | CPU | GPU | RAM | Wartość |
|---|---|---|---|---|
| Ulefone Paris | MT6735 | Mali-T720 MP2 | 2 GB | 2852 |
| Blackview R6 | MT6737T | Mali-T720 MP2 | 3 GB | 4159 |
| Bluboo Xtouch | MT6753 | Mali-T720 MP2 | 3 GB | 4224 |
| Model | CPU | GPU | RAM | Wartość |
|---|---|---|---|---|
| Ulefone Paris | MT6735 | Mali-T720 MP2 | 2 GB | 6359 |
| Lenovo Tab 2 A8-50F | MT8161 | Mali-T720 MP2 | 1 GB | 6778 |
| Blackview R6 | MT6737T | Mali-T720 MP2 | 3 GB | 7842 |
| Bluboo Xtouch | MT6753 | Mali-T720 MP2 | 3 GB | 8343 |
| Model | CPU | GPU | RAM | Wartość |
|---|---|---|---|---|
| Bluboo Xtouch | MT6753 | Mali-T720 MP2 | 3 GB | 53.3 |
| Lenovo Tab 2 A8-50F | MT8161 | Mali-T720 MP2 | 1 GB | 59.6 |
| Ulefone Paris | MT6735 | Mali-T720 MP2 | 2 GB | 60.3 |
| Model | CPU | GPU | RAM | Wartość |
|---|---|---|---|---|
| Blackview R6 | MT6737T | Mali-T720 MP2 | 3 GB | 2830 |
| Bluboo Xtouch | MT6753 | Mali-T720 MP2 | 3 GB | 2835 |
| Ulefone Paris | MT6735 | Mali-T720 MP2 | 2 GB | 2994 |
| Lenovo Tab 2 A8-50F | MT8161 | Mali-T720 MP2 | 1 GB | 3140 |
| Model | CPU | GPU | RAM | Wartość |
|---|---|---|---|---|
| Lenovo Tab 2 A8-50F | MT8161 | Mali-T720 MP2 | 1 GB | 894 |
| Ulefone Paris | MT6735 | Mali-T720 MP2 | 2 GB | 902 |
| Blackview R6 | MT6737T | Mali-T720 MP2 | 3 GB | 1011 |
| Bluboo Xtouch | MT6753 | Mali-T720 MP2 | 3 GB | 1128 |
| Model | CPU | GPU | RAM | Wartość |
|---|---|---|---|---|
| Bluboo Xtouch | MT6753 | Mali-T720 MP2 | 3 GB | 2948 |
| Samsung Galaxy S5 Neo | 7580 Octa | Mali-T720 MP2 | 2 GB | 3500 |
| ZTE Blade V6 | MT6735 | Mali-T720 MP2 | 2 GB | 3985 |
| Acer Liquid Z630 | MT6735 | Mali-T720 MP2 | 2 GB | 3999 |
| Allview P8 Energy | MT6735 | Mali-T720 MP2 | 2 GB | 4015 |
| Lenovo Tab 2 A8-50F | MT8161 | Mali-T720 MP2 | 1 GB | 4037 |
| Ulefone Paris | MT6735 | Mali-T720 MP2 | 2 GB | 4170 |
| Samsung Galaxy A3 2016 | 7578 | Mali-T720 MP2 | 1.5 GB | 4368 |
* Mniejsze liczby oznaczają wyższą wydajność
Testy gier
Zamieszczone niżej wyniki pochodzą z testów zrecenzowanych laptopów. Należy pamiętać, że osiągi poszczególnych konfiguracji zależą od zastosowanej pamięci własnej karty (VRAM), zegarów karty (mogą być różne), procesora, ustawień systemu, sterowników i wersji systemu operacyjnego. Tym samym uzyskane wyniki nie muszą być reprezentatywne dla wszystkich laptopów wyposażonych w daną kartę graficzną. By uzyskać szczegółowe informacje o wynikach testów, należy kliknąć na podaną wartość liczbową (fps, czyli kl/s).

Arena of Valor
2018Dead Trigger 2
2013
Asphalt 8: Airborne
2013Mediatek MT6737 1.3GHz
Mali-T720 MP2
Wystąpił problem podczas benchmarkingu: gra nie chce się uruchomić
Mediatek MT6737 1.3GHz
Mali-T720 MP2
Wystąpił problem podczas benchmarkingu: gra nie chce się uruchomić

Real Racing 3
2013
Temple Run 2
2013| low | med. | high | ultra | QHD | 4K | |
|---|---|---|---|---|---|---|
| Arena of Valor | 32 | |||||
| Dead Trigger 2 | 33 | |||||
| Asphalt 8: Airborne | 27 | 22 | ||||
| Real Racing 3 | 58 | 35 | ||||
| Temple Run 2 | 60 | |||||
| low | med. | high | ultra | QHD | 4K | < 30 fps < 60 fps < 120 fps ≥ 120 fps | 1 2 | | 1 2 1 | | | |
Więcej informacji w rankingu płynności w grach
#0 ran 0s before starting gpusingle class +0s ... 0s
#1 no ids found in url (should be separated by "_") +0s ... 0s
#2 not redirecting to Ajax server +0s ... 0s
#3 did not recreate cache, as it is less than 5 days old! Created at Tue, 16 Jun 2026 19:30:27 +0200 +0.006s ... 0.006s
#4 no comparison url found in template nbc.compare_page_1 needed +0.013s ... 0.019s
#5 no comparison url found in template nbc.compare_page_1 needed +0s ... 0.019s
#6 no comparison url found in template nbc.compare_page_1 needed +0s ... 0.019s
#7 no comparison url found in template nbc.compare_page_1 needed +0s ... 0.02s
#8 no comparison url found in template nbc.compare_page_1 needed +0s ... 0.02s
#9 no comparison url found in template nbc.compare_page_1 needed +0s ... 0.02s
#10 composed specs +0s ... 0.02s
#11 did output specs +0s ... 0.02s
#12 start showIntegratedCPUs +0s ... 0.02s
#13 getting avg benchmarks for device 6399 +0.026s ... 0.046s
#14 got single benchmarks 6399 +0.138s ... 0.184s
#15 got avg benchmarks for devices +0s ... 0.184s
#16 No cached benchmark found, getting uncached values +0.611s ... 0.795s
#17 No cached benchmark found, getting uncached values +0.036s ... 0.831s
#18 No cached benchmark found, getting uncached values +0.034s ... 0.865s
#19 min, max, avg, median took s +0.444s ... 1.309s
#20 before gaming benchmark output +0s ... 1.309s
#21 Got 39 rows for game benchmarks. +0.009s ... 1.318s
#22 composed SQL query for gamebenchmarks +0s ... 1.318s
#23 got data and put it in $dataArray +0.002s ... 1.321s
#24 benchmarks composed for output. +0.041s ... 1.362s
#25 no comparison url found in template nbc.compare_page_1 needed +0.379s ... 1.74s
#26 return log +0s ... 1.74s
Brak recenzji dla tej karty graficznej.