Intel HD Graphics 6000
-
HD Graphics Rodzina
| ||||||||||||||||||||||||||||||||||||||||||||||||||||||||||||||||||||||
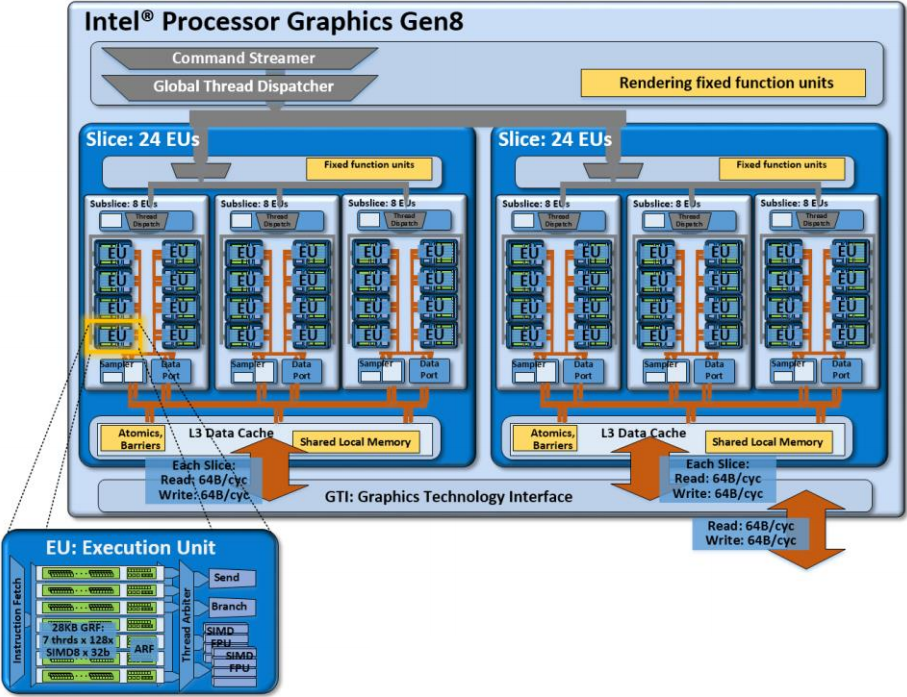
| Nazwa robocza | Broadwell GT3 | |||||||||||||||||||||||||||||||||||||||||||||||||||||||||||||||||||||
| Architektura | Gen. 8 Broadwell | |||||||||||||||||||||||||||||||||||||||||||||||||||||||||||||||||||||
| iGPU | Integrated Graphics | |||||||||||||||||||||||||||||||||||||||||||||||||||||||||||||||||||||
| Potoki | 48 - ZJC | |||||||||||||||||||||||||||||||||||||||||||||||||||||||||||||||||||||
| Zegar rdzenia | 300 - 1000 (Boost) MHz | |||||||||||||||||||||||||||||||||||||||||||||||||||||||||||||||||||||
| Magistrala | 64/128 bit | |||||||||||||||||||||||||||||||||||||||||||||||||||||||||||||||||||||
| Pamięć współdzielona | tak | |||||||||||||||||||||||||||||||||||||||||||||||||||||||||||||||||||||
| API | DirectX 12 (FL 11_1), OpenGL 4.3 | |||||||||||||||||||||||||||||||||||||||||||||||||||||||||||||||||||||
| Liczba tranzystorów | 1.9 Billion | |||||||||||||||||||||||||||||||||||||||||||||||||||||||||||||||||||||
| Technologia | 14 nm | |||||||||||||||||||||||||||||||||||||||||||||||||||||||||||||||||||||
| Technologie | QuickSync | |||||||||||||||||||||||||||||||||||||||||||||||||||||||||||||||||||||
| Data premiery | 05.01.2015 | |||||||||||||||||||||||||||||||||||||||||||||||||||||||||||||||||||||
| ||||||||||||||||||||||||
Testy
Performance Rating - 3DMark 11 + Fire Strike + Time Spy
0.4 pt (1%)
...
Intel HD Graphics 6000
Intel UHD Graphics (Jasper Lake 32 EU)
...
max:
0%
100%
3DMark - 3DMark Fire Strike Standard Score
min: 844 przeciętny: 906 mediana: 903 (1%) maks: 971 Points

3DMark - 3DMark Fire Strike Standard Graphics
min: 858 przeciętny: 947 mediana: 951 (1%) maks: 1033 Points
3DMark - 3DMark Ice Storm Graphics
min: 61674 przeciętny: 62508 mediana: 61979 (7%) maks: 63871 Points
3DMark - 3DMark Time Spy Graphics
334 Points (1%)
...
Intel UHD Graphics (Jasper Lake 24 EU)
Intel UHD Graphics (Jasper Lake 32 EU)
Intel HD Graphics 6000
Intel UHD Graphics 24EUs (Alder Lake-N)
Intel UHD Graphics Xe 16EUs
Intel UHD Graphics G7 (Lakefield GT2 64 EU)
...
NVIDIA RTX PRO 5000 Blackwell Generation Laptop
max:
NVIDIA GeForce RTX 5090
0%
100%
3DMark - 3DMark Cloud Gate Score
min: 5425 przeciętny: 5737 mediana: 5872 (6%) maks: 6061 Points
3DMark - 3DMark Cloud Gate Graphics
min: 7378 przeciętny: 7700 mediana: 7660 (2%) maks: 8102 Points
3DMark 11 - 3DM11 Performance Score
min: 1328 przeciętny: 1487 mediana: 1513.5 (2%) maks: 1591 Points
3DMark 11 - 3DM11 Performance GPU
min: 1210 przeciętny: 1372 mediana: 1395.5 (1%) maks: 1487 Points
...
Intel HD Graphics 6000
Intel UHD Graphics (Jasper Lake 24 EU)
...
NVIDIA RTX PRO 5000 Blackwell Generation Laptop
max:
NVIDIA GeForce RTX 5090
0%
100%
3DM Vant. Perf. total +
3DM Vant. Perf. GPU no PhysX +
3DMark 06 3DMark 06 - Standard 1280x1024 +
Unigine Heaven 2.1 - Heaven 2.1 high
min: 18.6 przeciętny: 19 mediana: 18.7 (4%) maks: 19.8 fps
...
Intel HD Graphics 6000
...
0%
100%
specvp12 sw-03 +
specvp12 snx-02 +
specvp12 showcase-01 +
specvp12 mediacal-01 +
specvp12 maya-04 +
specvp12 energy-01 +
specvp12 creo-01 +
specvp12 catia-04 +
Windows 7 Experience Index - Win7 Gaming graphics
6.9 Points (87%)
Windows 7 Experience Index - Win7 Graphics
5.9 Points (75%)
Cinebench R11.5 Cinebench R11.5 OpenGL 64 Bit +
Cinebench R15
Cinebench R15 OpenGL 64 Bit +
Cinebench R15 OpenGL Ref. Match 64 Bit +
GFXBench 3.0 - GFXBench 3.0 Manhattan Offscreen
min: 34.22 przeciętny: 39.5 mediana: 39.5 (2%) maks: 44.7 fps
LuxMark v2.0 64Bit - LuxMark v2.0 Room GPU
min: 127 przeciętny: 136 mediana: 135 (0%) maks: 146 Samples/s
LuxMark v2.0 64Bit - LuxMark v2.0 Sala GPU
min: 342 przeciętny: 357 mediana: 350 (1%) maks: 379 Samples/s
ComputeMark v2.1 - ComputeMark v2.1 Result
min: 941 przeciętny: 1032 mediana: 1021 (1%) maks: 1134 pkt.
Power Consumption - Furmark Stress Test Power Consumption - external Monitor *
32.9 Watt (4%)
Power Consumption - The Witcher 3 Power Consumption - external Monitor *
32.1 Watt (4%)
- Zakres wyników testów referencyjnych dla tej karty graficznej
 - Średnia wartość wyników testów referencyjnych dla tej karty graficzne
* Mniejsze liczby oznaczają wyższą wydajność
* Mniejsze liczby oznaczają wyższą wydajność
Testy gier
Zamieszczone niżej wyniki pochodzą z testów zrecenzowanych laptopów. Należy pamiętać, że osiągi poszczególnych konfiguracji zależą od zastosowanej pamięci własnej karty (VRAM), zegarów karty (mogą być różne), procesora, ustawień systemu, sterowników i wersji systemu operacyjnego. Tym samym uzyskane wyniki nie muszą być reprezentatywne dla wszystkich laptopów wyposażonych w daną kartę graficzną. By uzyskać szczegółowe informacje o wynikach testów, należy kliknąć na podaną wartość liczbową (fps, czyli kl/s).


X-Plane 11.11
2018low 1280x720
18.2 fps
+ Porównaj
med. 1920x1080
12.9 fps
+ Porównaj
high 1920x1080
11.6 fps
+ Porównaj
» Niegrywalna na większości testowanych laptopów.

Team Fortress 2
2017low 1280x720
64.2 fps
+ Porównaj
high 1920x1080
37.4 (!) fps
+ Porównaj
» Na wszystkich testowanych laptopach grywalna przy ustawieniach high.
Dirt 4
2017low 1280x720
41.3 fps
+ Porównaj
» Na wszystkich testowanych laptopach grywalna przy ustawieniach low.
Rocket League
2017Farming Simulator 17
2016low 1280x720
med. 1366x768
32.7 fps
+ Porównaj
high 1920x1080
18.9 fps
+ Porównaj
» Na wszystkich testowanych laptopach grywalna przy ustawieniach low.


Overwatch
2016
Rainbow Six Siege
2015low 1024x768
28.9 fps
+ Porównaj
med. 1366x768
18.2 fps
+ Porównaj
high 1920x1080
10.9 fps
+ Porównaj
ultra 1920x1080
9.1 fps
+ Porównaj
» Niegrywalna na większości testowanych laptopów.

Just Cause 3
2015low 1024x768
18.6 fps
+ Porównaj
med. 1366x768
14 fps
+ Porównaj
» Niegrywalna na większości testowanych laptopów.

low 1024x768
24.6 fps
+ Porównaj
med. 1366x768
16.6 fps
+ Porównaj
» Niegrywalna na większości testowanych laptopów.

FIFA 16
2015low 1280x720
53 (!) fps
+ Porównaj
high 1366x768
39 (!) fps
+ Porównaj
ultra 1920x1080
21.3 fps
+ Porównaj
» Na wszystkich testowanych laptopach grywalna przy ustawieniach high.

World of Warships
2015low 1366x768
52.3 fps
+ Porównaj
ultra 1920x1080
16 fps
+ Porównaj
» Na wszystkich testowanych laptopach grywalna przy ustawieniach low.

Metal Gear Solid V
2015low 1024x768
35 fps
+ Porównaj
med. 1366x768
24.8 fps
+ Porównaj
high 1920x1080
9.5 fps
+ Porównaj
» Niegrywalna na większości testowanych laptopów.

Mad Max
2015Dota 2 Reborn
2015low 1280x720
54.7 fps
+ Porównaj
med. 1366x768
33.9 fps
+ Porównaj
high 1920x1080
16.7 fps
+ Porównaj
ultra 1920x1080
15.4 fps
+ Porównaj
» Na wszystkich testowanych laptopach grywalna przy ustawieniach low.

low 1280x720
11 fps
+ Porównaj
med. 1366x768
10 fps
+ Porównaj
» Niegrywalna na większości testowanych laptopów.

The Witcher 3
2015
Dirt Rally
2015low 1024x768
93 fps
+ Porównaj
med. 1366x768
22.8 fps
+ Porównaj
high 1920x1080
12.9 fps
+ Porównaj
» Na wszystkich testowanych laptopach grywalna przy ustawieniach low.

Battlefield Hardline
2015low 1024x768
35.3 fps
+ Porównaj
med. 1366x768
26.9 fps
+ Porównaj
high 1920x1080
9.1 fps
+ Porównaj
» Na wszystkich testowanych laptopach grywalna przy ustawieniach low.

Evolve
2015low 1024x768
18.7 fps
+ Porównaj
med. 1366x768
13.5 fps
+ Porównaj
» Niegrywalna na większości testowanych laptopów.
low 1024x768
20.9 fps
+ Porównaj
med. 1366x768
16.8 fps
+ Porównaj
high 1920x1080
6.1 fps
+ Porównaj
» Niegrywalna na większości testowanych laptopów.

low 1024x768
0 (!) fps
+ Porównaj

low 1024x768
33 fps
+ Porównaj
med. 1366x768
17.6 fps
+ Porównaj
» Niegrywalna na większości testowanych laptopów.

low 1024x768
40.9 fps
+ Porównaj
med. 1366x768
20.8 fps
+ Porównaj
high 1920x1080
13.3 fps
+ Porównaj
ultra 1920x1080
10.7 fps
+ Porównaj
» Na wszystkich testowanych laptopach grywalna przy ustawieniach low.

F1 2014
2014low 1024x768
55 fps
+ Porównaj
med. 1366x768
37 fps
+ Porównaj
high 1920x1080
21 fps
+ Porównaj
ultra 1920x1080
13 fps
+ Porównaj
» Na wszystkich testowanych laptopach grywalna przy ustawieniach med..

Ryse: Son of Rome
2014low 1024x768
19 fps
+ Porównaj
med. 1366x768
12 fps
+ Porównaj
» Niegrywalna na większości testowanych laptopów.

Alien: Isolation
2014low 1024x768
34 fps
+ Porównaj
med. 1366x768
26.4 fps
+ Porównaj
» Niegrywalna na większości testowanych laptopów.

Fifa 15
2014low 1280x720
50 fps
+ Porównaj
high 1366x768
35.7 fps
+ Porównaj
ultra 1920x1080
23.3 fps
+ Porównaj
» Na wszystkich testowanych laptopach grywalna przy ustawieniach high.

Sims 4
2014low 1024x768
144 fps
+ Porównaj
med. 1366x768
45.4 fps
+ Porównaj
high 1920x1080
21.8 fps
+ Porównaj
ultra 1920x1080
14.1 fps
+ Porównaj
» Na wszystkich testowanych laptopach grywalna przy ustawieniach med..

GRID: Autosport
2014low 1024x768
94 fps
+ Porównaj
med. 1366x768
32 fps
+ Porównaj
high 1920x1080
22 fps
+ Porównaj
ultra 1920x1080
13 fps
+ Porównaj
» Na wszystkich testowanych laptopach grywalna przy ustawieniach low.

Thief
2014low 1024x768
18 fps
+ Porównaj
med. 1366x768
12 fps
+ Porównaj
» Niegrywalna na większości testowanych laptopów.

X-Plane 10.25
2013low 1024x768
40 fps
+ Porównaj
med. 1366x768
13 fps
+ Porównaj
high 1366x768
6.9 fps
+ Porównaj
» Na wszystkich testowanych laptopach grywalna przy ustawieniach low.

Battlefield 4
2013low 1024x768
32 fps
+ Porównaj
med. 1366x768
22.2 fps
+ Porównaj
high 1366x768
15.6 fps
+ Porównaj
ultra 1920x1080
5.6 fps
+ Porównaj
» Niegrywalna na większości testowanych laptopów.

Total War: Rome II
2013low 1024x768
48 fps
+ Porównaj
med. 1366x768
36 fps
+ Porównaj
high 1366x768
28 fps
+ Porównaj
» Na wszystkich testowanych laptopach grywalna przy ustawieniach med..

Company of Heroes 2
2013
Metro: Last Light
2013low 1024x768
19 fps
+ Porównaj
med. 1366x768
15.7 fps
+ Porównaj
high 1366x768
12 fps
+ Porównaj
ultra 1920x1080
6 fps
+ Porównaj
» Niegrywalna na większości testowanych laptopów.
BioShock Infinite
2013low 1280x720
med. 1366x768
high 1366x768
22.1 fps
+ Porównaj
» Na wszystkich testowanych laptopach grywalna przy ustawieniach low.

Tomb Raider
2013low 1024x768
med. 1366x768
high 1366x768
» Na wszystkich testowanych laptopach grywalna przy ustawieniach low.
Crysis 3
2013low 1024x768
20.9 fps
+ Porównaj
med. 1366x768
13.9 fps
+ Porównaj
» Niegrywalna na większości testowanych laptopów.
Dirt Showdown
2012low 1024x768
57 fps
+ Porównaj
med. 1366x768
36 fps
+ Porównaj
high 1366x768
23 fps
+ Porównaj
ultra 1920x1080
10 fps
+ Porównaj
» Na wszystkich testowanych laptopach grywalna przy ustawieniach med..

Diablo III
2012low 1024x768
68 fps
+ Porównaj
med. 1366x768
39 fps
+ Porównaj
high 1366x768
31 fps
+ Porównaj
ultra 1920x1080
24 fps
+ Porównaj
» Na wszystkich testowanych laptopach grywalna przy ustawieniach med..

StarCraft 2
2010low 1024x768
118 fps
+ Porównaj
med. 1360x768
43 fps
+ Porównaj
high 1360x768
21 fps
+ Porównaj
ultra 1920x1080
14 fps
+ Porównaj
» Na wszystkich testowanych laptopach grywalna przy ustawieniach med..

World of Warcraft
2005low 800x600
123 fps
+ Porównaj
med. 1024x768
47 fps
+ Porównaj
high 1280x1024
18 fps
+ Porównaj
ultra 1920x1080
10 fps
+ Porównaj
» Na wszystkich testowanych laptopach grywalna przy ustawieniach med..
Więcej informacji w rankingu płynności w grach
- $445.00HP 15.6" Touchscreen Laptop, Intel Core i5 Processor, 16GB RAM, 512GB SSD, Numeric Keypad, Bluetooth, Wi-Fi, Long Battery Life, Windows 11 Home, Alpacatec Accessories, Silver
- $269.99NIMO 15.6" IPS FHD-Student-Laptop, Intel Twin Lake N150 (4 Cores Up to 3.6GHz) with 2-Years-Warranty, 65W Type-C, Fingerprint, Backlit Keyboard, 53.58Wh Battery 4GB RAM 128GB SSD for Office and Home
- $194.81Dell Latitude E7470 14-Inch Display Laptop, Intel Core i5-6300U, 8GB RAM, 256GB SSD, Camera, Windows 11 Pro (Renewed)
- $148.70Odyson - Logic Board 1.6GHz i5-5250U, 8GB RAM Replacement for Apple MacBook Air 13" A1466 (2015-2017)
- $192.61Dell Latitude 14 5000 5480 Business Laptop: 14in HD (1366x768), Intel Core i7-6600U, 500GB HDD, 8GB DDR4, NVIDIA 930MX 2GB GDDR5 vRAM, WiFi + Bluetooth, Windows 11 Professional (Renewed)
v1.35
Brak recenzji dla tej karty graficznej.