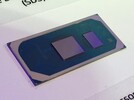
Intel UHD Graphics G1 (Ice Lake 32 EU)
-
Gen. 11 Rodzina Iris Plus Graphics G7 (Ice Lake 64 EU) 64 @ 0.3 - 1.1 GHz Iris Plus Graphics G4 (Ice Lake 48 EU) 48 @ 0.3 - 1.1 GHz UHD Graphics G1 (Ice Lake 32 EU) 32 @ 0.3 - 1.1 GHz UHD Graphics G7 (Lakefield GT2 64 EU) 64 @ 0.2 - 0.5 GHz UHD Graphics G4 (Lakefield GT1 48 EU) 48 @ 0.2 - 0.5 GHz UHD Graphics (Jasper Lake 32 EU) 32 @ 0.35 - 0.9 GHz UHD Graphics (Elkhart Lake 32 EU) 32 @ 0.4 - 0.85 GHz UHD Graphics (Jasper Lake 24 EU) 24 @ 0.35 - 0.8 GHz UHD Graphics (Elkhart Lake 16 EU) 16 @ 0.25 - 0.85 GHz UHD Graphics (Jasper Lake 16 EU) 24 @ 0.35 - 0.8 GHz
Nazwa robocza Ice Lake G1 Gen. 11 Architektura Gen. 11 Ice Lake Potoki 32 - ZJC Zegar rdzenia 300 - 1100 (Boost) MHz Typ pamięci DDR4 Pamięć współdzielona tak API DirectX 12_1, OpenGL 4.5 Pobór prądu 12-25 W Technologia 10 nm Technologie QuickSync Data premiery 28.05.2019
Testy Performance Rating - 3DMark 11 + Fire Strike + Time Spy
4.3 pt (4%)
...
Intel UHD Graphics G1 (Ice Lake 32 EU)
...
3DMark - 3DMark Time Spy Score
min: 367 avg: 479.1 median: 482 (1%) max: 547 Points
...
Intel UHD Graphics Xe 16EUs (Tiger Lake-H) -10%
Intel UHD Graphics G1 (Ice Lake 32 EU)
...
AMD Radeon RX 6850M XT 2332%
3DMark - 3DMark Time Spy Graphics
min: 320 avg: 419.6 median: 424.5 (1%) max: 476 Points
...
Intel UHD Graphics Xe 16EUs (Tiger Lake-H) -11%
Intel UHD Graphics G1 (Ice Lake 32 EU)
...
3DMark - 3DMark Ice Storm Unlimited Graphics
min: 84440 avg: 96849 median: 94938 (11%) max: 114658 Points
...
Intel UHD Graphics G7 (Lakefield GT2 64 EU) -9%
Intel UHD Graphics G1 (Ice Lake 32 EU)
Intel UHD Graphics Xe G4 48EUs 1%
...
3DMark - 3DMark Ice Storm Extreme Graphics
min: 38038 avg: 42578 median: 41959 (6%) max: 49814 Points
...
NVIDIA Quadro M1200 -1%
Intel UHD Graphics G1 (Ice Lake 32 EU)
...
NVIDIA GeForce RTX 3080 Laptop GPU 875%
3DMark - 3DMark Cloud Gate Score
min: 6363 avg: 8806 median: 8380.5 (9%) max: 11182 Points
...
Intel HD Graphics P630 -6%
Intel UHD Graphics G1 (Ice Lake 32 EU)
Intel UHD Graphics Xe G4 48EUs 3%
...
AMD Radeon RX 6500M 951%
3DMark - 3DMark Cloud Gate Graphics
min: 7448 avg: 10795 median: 11096.5 (4%) max: 12698 Points
...
Intel UHD Graphics Xe 16EUs (Tiger Lake-H) -6%
Intel UHD Graphics G1 (Ice Lake 32 EU)
...
AMD Radeon RX 6850M XT 1502%
3DMark - 3DMark Fire Strike Standard Score
min: 871 avg: 1391 median: 1444.5 (3%) max: 1673 Points
...
Intel UHD Graphics Xe 16EUs (Tiger Lake-H) -7%
Intel UHD Graphics G1 (Ice Lake 32 EU)
...
AMD Radeon RX 6850M XT 1908%
3DMark - 3DMark Fire Strike Standard Graphics
min: 960 avg: 1480 median: 1521 (2%) max: 1755 Points
...
Intel UHD Graphics G1 (Ice Lake 32 EU)
...
3DMark - 3DMark Ice Storm Graphics
min: 55710 avg: 61120 median: 61207 (8%) max: 64355 Points
...
NVIDIA GeForce MX450 -7%
Intel UHD Graphics 770 -4%
Intel UHD Graphics G1 (Ice Lake 32 EU)
Intel UHD Graphics Xe G4 48EUs 2%
...
AMD Radeon RX 6800S 755%
3DMark - 3DMark Wild Life Unlimited
min: 3004 avg: 3118 median: 3117.5 (2%) max: 3231 Points
Intel UHD Graphics (Jasper Lake 32 EU) -20%
Intel UHD Graphics G1 (Ice Lake 32 EU)
AMD Radeon RX Vega 7 77%
AMD Radeon RX Vega 6 (Ryzen 4000/5000) 79%
Intel UHD Graphics Xe G4 48EUs 111%
Intel UHD Graphics 770 127%
NVIDIA GeForce MX250 155%
AMD Radeon RX Vega 8 (Ryzen 4000/5000) 166%
...
Apple M1 Max 32-Core GPU 2213%
3DMark - 3DMark Wild Life Extreme Unlimited
min: 799 avg: 904 median: 924 (1%) max: 990 Points
Intel UHD Graphics (Jasper Lake 32 EU) -25%
Intel UHD Graphics G1 (Ice Lake 32 EU)
AMD Radeon RX Vega 7 96%
Intel UHD Graphics Xe G4 48EUs 97%
Intel UHD Graphics 770 109%
Intel Iris Xe Graphics G7 80EUs 157%
AMD Radeon RX Vega 8 (Ryzen 4000/5000) 179%
Intel UHD Graphics 64EUs (Alder Lake 12th Gen) 228%
Intel Iris Xe Graphics G7 96EUs 278%
AMD Radeon 680M 292%
...
NVIDIA GeForce RTX 3080 Laptop GPU 2406%
3DMark - 3DMark Night Raid
min: 5274 avg: 5805 median: 5623 (6%) max: 6738 Points
...
AMD Radeon RX Vega 2 -46%
Intel UHD Graphics (Jasper Lake 32 EU) -41%
Intel UHD Graphics G7 (Lakefield GT2 64 EU) -37%
Intel UHD Graphics G1 (Ice Lake 32 EU)
Intel UHD Graphics Xe G4 48EUs 34%
Intel Iris Plus Graphics G7 (Ice Lake 64 EU) 41%
AMD Radeon RX Vega 11 47%
AMD Radeon RX Vega 5 55%
...
NVIDIA GeForce RTX 3080 Ti Laptop GPU 941%
3DMark - 3DMark Night Raid Graphics Score
min: 5834 avg: 6343 median: 6024 (2%) max: 7201 Points
...
AMD Radeon RX Vega 2 -46%
Intel UHD Graphics (Jasper Lake 32 EU) -28%
Intel UHD Graphics G7 (Lakefield GT2 64 EU) -24%
Intel UHD Graphics G1 (Ice Lake 32 EU)
Intel Iris Plus Graphics G7 (Ice Lake 64 EU) 47%
AMD Radeon RX Vega 11 47%
AMD Radeon RX Vega 5 61%
Intel UHD Graphics Xe G4 48EUs 63%
...
NVIDIA GeForce RTX 3080 Ti Laptop GPU 1878%
3DMark 11 - 3DM11 Performance Score
min: 1791 avg: 2394 median: 2329 (3%) max: 2875 Points
...
Intel UHD Graphics G1 (Ice Lake 32 EU)
...
AMD Radeon RX 6850M XT 1189%
3DMark 11 - 3DM11 Performance GPU
min: 1684 avg: 2171 median: 2127 (2%) max: 2578 Points
...
Intel UHD Graphics G1 (Ice Lake 32 EU)
...
AMD Radeon RX 6850M XT 1835%
3DMark Vantage 3DM Vant. Perf. total + 3DMark Vantage - 3DM Vant. Perf. total
8750 Points (3%)
...
Intel UHD Graphics G1 (Ice Lake 32 EU)
...
NVIDIA GeForce RTX 3080 Ti Laptop GPU 983%
3DM Vant. Perf. GPU no PhysX + 3DMark Vantage - 3DM Vant. Perf. GPU no PhysX
7444 Points (4%)
...
Intel UHD Graphics G1 (Ice Lake 32 EU)
...
NVIDIA GeForce RTX 3080 Ti Laptop GPU 1276%
3DMark 06 3DMark 06 - Standard 1366x768 +
11912 Points (17%)
...
Intel UHD Graphics G1 (Ice Lake 32 EU)
AMD Radeon RX Vega 8 (Ryzen 4000/5000) 193%
3DMark 06 - Standard 1280x1024 +
min: 10157 avg: 10955 median: 10955 (15%) max: 11753 Points
...
Intel UHD Graphics Xe G4 48EUs -2%
Intel UHD Graphics G1 (Ice Lake 32 EU)
...
NVIDIA GeForce RTX 3080 Ti Laptop GPU 421%
3DMark 06 - Standard 1280x800 +
12136 Points (17%)
...
Intel UHD Graphics G1 (Ice Lake 32 EU)
3DMark 06 - Standard 1280x768 +
12211 Points (17%)
...
Intel UHD Graphics G1 (Ice Lake 32 EU)
3DMark 06 - Standard 1280x720 +
12362 Points (17%)
...
Intel UHD Graphics G1 (Ice Lake 32 EU)
3DMark 06 - Standard 1152x864 +
12100 Points (17%)
Intel UHD Graphics G1 (Ice Lake 32 EU)
3DMark 06 - Standard 1024x768 +
12622 Points (18%)
...
Intel UHD Graphics G1 (Ice Lake 32 EU)
AMD Radeon RX Vega 6 (Ryzen 4000/5000) 38%
NVIDIA GeForce GTX 1650 Mobile 236%
Cinebench R10 Cinebench R10 Shading (32bit) + Cinebench R10 - Cinebench R10 Shading (32bit)
min: 9110 avg: 9383 median: 9382.5 (7%) max: 9655 pkt.
...
Intel Iris Plus Graphics 655 -2%
NVIDIA GeForce GTX 1660 Ti Max-Q -1%
Intel UHD Graphics G1 (Ice Lake 32 EU)
...
Cinebench R11.5 Cinebench R11.5 OpenGL 64 Bit + Cinebench R11.5 - Cinebench R11.5 OpenGL 64 Bit
min: 36.17 avg: 36.4 median: 36.4 (13%) max: 36.61 fps
...
Intel UHD Graphics Xe G4 48EUs -2%
Intel UHD Graphics G1 (Ice Lake 32 EU)
...
NVIDIA RTX A2000 Laptop GPU 387%
Cinebench R15 Cinebench R15 OpenGL 64 Bit + Cinebench R15 - Cinebench R15 OpenGL 64 Bit
min: 35.1 avg: 46.3 median: 46.5 (12%) max: 53.5 fps
...
Intel UHD Graphics G1 (Ice Lake 32 EU)
Intel UHD Graphics Xe 16EUs (Tiger Lake-H) 6%
...
NVIDIA RTX A5500 Laptop GPU 690%
Cinebench R15 OpenGL Ref. Match 64 Bit + Cinebench R15 - Cinebench R15 OpenGL Ref. Match 64 Bit
97.8 % (98%)
...
Intel UHD Graphics G1 (Ice Lake 32 EU)
Intel UHD Graphics (Jasper Lake 32 EU) 0%
Intel Iris Xe MAX Graphics 0%
Intel Iris Xe Graphics G7 96EUs 0%
Intel Arc A370M 0%
Intel UHD Graphics G7 (Lakefield GT2 64 EU) 0%
...
NVIDIA GeForce MX250 2%
GFXBench (DX / GLBenchmark) 2.7 GFXBench 2.7 T-Rex HD Onscreen C24Z16 + GFXBench (DX / GLBenchmark) 2.7 - GFXBench 2.7 T-Rex HD Onscreen C24Z16
169.7 fps (5%)
...
NVIDIA GeForce RTX 3050 Ti Laptop GPU -29%
Intel UHD Graphics Xe 16EUs (Tiger Lake-H) -27%
AMD Radeon 540X -22%
AMD Radeon RX Vega 5 -13%
Intel Iris Xe Graphics G7 80EUs -7%
Intel UHD Graphics G1 (Ice Lake 32 EU)
Intel Iris Xe Graphics G7 96EUs 7%
NVIDIA GeForce MX450 15%
AMD Radeon RX Vega 7 24%
Intel Arc A350M 34%
NVIDIA GeForce GTX 1660 Ti Max-Q 70%
NVIDIA GeForce GTX 1650 Mobile 74%
...
GFXBench T-Rex HD Offscreen C24Z16 + GFXBench (DX / GLBenchmark) 2.7 - GFXBench T-Rex HD Offscreen C24Z16
157.8 fps (1%)
...
Qualcomm Adreno 680 -11%
Intel UHD Graphics G1 (Ice Lake 32 EU)
AMD Radeon RX Vega 5 4%
Intel Iris Plus Graphics G7 (Ice Lake 64 EU) 5%
AMD Radeon RX Vega 6 (Ryzen 4000/5000) 5%
Qualcomm Adreno 685 6%
NVIDIA GeForce MX230 12%
...
NVIDIA GeForce RTX 3080 Ti Laptop GPU 1397%
GFXBench 3.0 - GFXBench 3.0 Manhattan
85 fps (23%)
...
AMD Radeon Pro Vega 20 -19%
Intel UHD Graphics Xe 16EUs (Tiger Lake-H) -19%
NVIDIA GeForce MX250 -6%
Apple M1 8-Core GPU -3%
Intel UHD Graphics G1 (Ice Lake 32 EU)
Intel Iris Xe Graphics G7 80EUs 2%
AMD Radeon RX Vega 7 4%
Apple M1 Max 32-Core GPU 6%
Apple M2 10-Core GPU 6%
Intel Iris Xe Graphics G7 96EUs 12%
...
GFXBench 3.0 - GFXBench 3.0 Manhattan Offscreen
84.4 fps (7%)
...
Intel UHD Graphics Xe 16EUs (Tiger Lake-H) -8%
AMD Radeon 540X -8%
Intel UHD Graphics G1 (Ice Lake 32 EU)
AMD Radeon RX Vega 7 7%
NVIDIA GeForce MX230 8%
...
Apple M1 Max 32-Core GPU 1354%
GFXBench - GFXBench 5.0 Aztec Ruins High Tier Onscreen
29.5 fps (18%)
...
Intel UHD Graphics G7 (Lakefield GT2 64 EU) -38%
Intel UHD Graphics Xe 16EUs (Tiger Lake-H) -36%
NVIDIA T600 Laptop GPU -8%
Intel UHD Graphics G1 (Ice Lake 32 EU)
Intel Iris Xe Graphics G7 80EUs 10%
AMD Radeon RX Vega 5 17%
NVIDIA GeForce MX250 36%
AMD Radeon 540X 42%
...
AMD Radeon RX 6700S 452%
GFXBench - GFXBench 5.0 Aztec Ruins High Tier Offscreen
16.3 fps (5%)
...
Intel Iris Plus Graphics G7 (Ice Lake 64 EU) -43%
Intel UHD Graphics (Jasper Lake 32 EU) -36%
Intel UHD Graphics G7 (Lakefield GT2 64 EU) -33%
Intel UHD Graphics Xe 16EUs (Tiger Lake-H) -30%
Intel UHD Graphics G1 (Ice Lake 32 EU)
AMD Radeon RX Vega 5 30%
Intel UHD Graphics Xe G4 48EUs 47%
Intel UHD Graphics Xe 32EUs (Tiger Lake-H) 49%
AMD Radeon 540X 53%
...
Apple M1 Max 32-Core GPU 1798%
GFXBench - GFXBench 5.0 Aztec Ruins Normal Tier Onscreen
43.5 fps (18%)
...
Intel UHD Graphics Xe 16EUs (Tiger Lake-H) -30%
NVIDIA T600 Laptop GPU -3%
Intel UHD Graphics G1 (Ice Lake 32 EU)
Intel Iris Xe Graphics G7 80EUs 16%
AMD Radeon RX Vega 5 22%
AMD Radeon RX Vega 7 33%
Intel UHD Graphics Xe G4 48EUs 36%
AMD Radeon 540X 36%
...
AMD Radeon RX 6700S 445%
GFXBench - GFXBench 5.0 Aztec Ruins Normal Tier Offscreen
42.3 fps (6%)
...
Intel Iris Plus Graphics G7 (Ice Lake 64 EU) -44%
Intel UHD Graphics (Jasper Lake 32 EU) -37%
Intel UHD Graphics G7 (Lakefield GT2 64 EU) -32%
Intel UHD Graphics Xe 16EUs (Tiger Lake-H) -21%
Intel UHD Graphics G1 (Ice Lake 32 EU)
AMD Radeon RX Vega 5 32%
Intel UHD Graphics Xe G4 48EUs 54%
AMD Radeon 540X 56%
AMD Radeon RX Vega 7 59%
...
Apple M1 Max 32-Core GPU 1638%
GFXBench - GFXBench Car Chase Onscreen
min: 21.49 avg: 28.3 median: 28.2 (1%) max: 35 fps
...
Intel Iris Plus Graphics G7 (Ice Lake 64 EU) -15%
Intel UHD Graphics Xe 16EUs (Tiger Lake-H) -1%
Intel UHD Graphics G1 (Ice Lake 32 EU)
...
NVIDIA GeForce RTX 3070 Laptop GPU 12445%
GFXBench - GFXBench Car Chase Offscreen
min: 32.07 avg: 32.9 median: 32.9 (0%) max: 33.7 fps
...
Intel UHD Graphics Xe 16EUs (Tiger Lake-H) -5%
Intel UHD Graphics G1 (Ice Lake 32 EU)
AMD Radeon RX Vega 6 (Ryzen 4000/5000) 19%
...
NVIDIA GeForce RTX 3070 Laptop GPU 73345%
LuxMark v2.0 64Bit - LuxMark v2.0 Room GPU
min: 330 avg: 347 median: 347 (2%) max: 364 Samples/s
...
AMD Radeon 540X -1%
Intel UHD Graphics G1 (Ice Lake 32 EU)
...
NVIDIA GeForce GTX 1650 Ti Mobile 2716%
LuxMark v2.0 64Bit - LuxMark v2.0 Sala GPU
min: 724 avg: 747 median: 747 (1%) max: 770 Samples/s
...
Intel UHD Graphics G1 (Ice Lake 32 EU)
AMD Radeon RX Vega 6 (Ryzen 4000/5000) 0%
AMD Radeon 680M 7%
...
AMD Radeon RX 6800M 1877%
ComputeMark v2.1 - ComputeMark v2.1 Result
min: 1204 avg: 1288 median: 1288 (1%) max: 1372 pkt.
...
Intel UHD Graphics G1 (Ice Lake 32 EU)
Intel UHD Graphics Xe 750 32EUs (Rocket Lake) 5%
...
NVIDIA GeForce RTX 3080 Ti Laptop GPU 2285%
Power Consumption - Furmark Stress Test Power Consumption - external Monitor *
min: 17.2 avg: 21.1 median: 21.6 (3%) max: 23.8 Watt
...
Qualcomm Adreno 680 -40%
Intel UHD Graphics (Jasper Lake 16 EU) -33%
Intel UHD Graphics (Jasper Lake 32 EU) -26%
Intel UHD Graphics (Jasper Lake 24 EU) -5%
Intel UHD Graphics G1 (Ice Lake 32 EU)
Intel UHD Graphics 610 10%
Intel UHD Graphics Xe 16EUs (Tiger Lake-H) 11%
Intel UHD Graphics Xe G4 48EUs 29%
Intel UHD Graphics Xe 32EUs (Tiger Lake-H) 35%
...
AMD Radeon RX 6850M XT 962%
0 5 10 15 20 25 30 Tooltip Lenovo V17-IIL 82GX008TGE: Ø17.2 (15.2-26.5)
Fujitsu Lifebook A3510 (FPC04905BP): Ø21.3 (19.8-33.7)
Power Consumption - Witcher 3 Power Consumption *
min: 23.3 avg: 26.9 median: 26.8 (6%) max: 30.7 Watt
Intel UHD Graphics (Jasper Lake 16 EU) -51%
Intel UHD Graphics (Jasper Lake 32 EU) -47%
Intel UHD Graphics (Jasper Lake 24 EU) -29%
Intel UHD Graphics 610 -5%
Intel UHD Graphics G1 (Ice Lake 32 EU)
Apple M2 8-Core GPU 2%
Intel UHD Graphics Xe 16EUs (Tiger Lake-H) 14%
Intel UHD Graphics Xe G4 48EUs 16%
Intel UHD Graphics 64EUs (Alder Lake 12th Gen) 28%
...
0 5 10 15 20 25 30 35 Tooltip Teclast TBOLT F15 Pro: Ø23.3 (18.9-27.6)
Lenovo V17-IIL 82GX008TGE: Ø26.8 (24.7-37.8)
Fujitsu Lifebook A3510 (FPC04905BP): Ø30.7 (28.5-33.1)
Power Consumption - Witcher 3 ultra Power Efficiency
0.2 Points per Watt (20%)
Intel Iris Plus Graphics 655 -5%
Intel UHD Graphics G1 (Ice Lake 32 EU)
Intel UHD Graphics Xe 16EUs (Tiger Lake-H) 9%
Intel UHD Graphics Xe 32EUs (Tiger Lake-H) 14%
Intel UHD Graphics (Jasper Lake 32 EU) 14%
NVIDIA Quadro M1200 16%
...
AMD Radeon RX 6800S 343%
Clock Speed - GPU Clock Speed Furmark
1526 MHz (60%)
...
NVIDIA GeForce RTX 3050 Laptop GPU -14%
NVIDIA RTX A5000 Laptop GPU -12%
NVIDIA GeForce RTX 3060 Laptop GPU -12%
AMD Radeon RX Vega 5 -8%
NVIDIA GeForce MX330 -8%
AMD Radeon RX Vega 6 (Ryzen 4000/5000) -2%
AMD Radeon RX 5500M 0%
Intel UHD Graphics G1 (Ice Lake 32 EU)
AMD Radeon RX Vega 7 6%
AMD Radeon RX Vega 8 (Ryzen 4000/5000) 7%
...
- Zakres wyników testów referencyjnych dla tej karty graficznej
- Średnia wartość wyników testów referencyjnych dla tej karty graficzne
* Smaller numbers mean a higher performance
Testy gier Zamieszczone niżej wyniki pochodzą z testów zrecenzowanych laptopów. Należy pamiętać, że osiągi poszczególnych konfiguracji zależą od zastosowanej pamięci własnej karty (VRAM), zegarów karty (mogą być różne), procesora, ustawień systemu, sterowników i wersji systemu operacyjnego. Tym samym uzyskane wyniki nie muszą być reprezentatywne dla wszystkich laptopów wyposażonych w daną kartę graficzną. By uzyskać szczegółowe informacje o wynikach testów, należy kliknąć na podaną wartość liczbową (fps, czyli kl/s).
0 Tooltip Lifebook A3510 (FPC04905BP): Ø40.7 (33-55.2)
Intel UHD Graphics (Jasper Lake 32 EU) -47%
Intel UHD Graphics G1 (Ice Lake 32 EU)
Intel UHD Graphics Xe 32EUs (Tiger Lake-H) 51%
Intel Iris Xe Graphics G7 80EUs 56%
Intel UHD Graphics Xe G4 48EUs 63%
AMD Radeon RX Vega 6 (Ryzen 4000/5000) 81%
...
NVIDIA GeForce RTX 3070 Laptop GPU 434%
0 Tooltip Lifebook A3510 (FPC04905BP): Ø18.4 (11.548-65.9)
Intel UHD Graphics G1 (Ice Lake 32 EU)
Intel UHD Graphics Xe G4 48EUs 33%
Intel UHD Graphics Xe 32EUs (Tiger Lake-H) 59%
AMD Radeon RX Vega 5 65%
AMD Radeon RX Vega 6 (Ryzen 4000/5000) 65%
AMD Radeon 540X 73%
...
NVIDIA GeForce RTX 3080 Ti Laptop GPU 1240%
» Na wszystkich testowanych laptopach grywalna przy ustawieniach low.
Additional Benchmarks
Low Preset 1920x1080
25.8 [X] Fujitsu Lifebook A3510 (FPC04905BP) Intel Core i3-1005G1 1.2GHz
UHD Graphics G1 (Ice Lake 32 EU)
min:
9.98 fps, P0.1:
12.4 fps, P1:
21.3 fps, max:
130 fps
Intel UHD Graphics G1 (Ice Lake 32 EU)
Intel UHD Graphics Xe 16EUs (Tiger Lake-H) 15%
AMD Radeon RX Vega 6 (Ryzen 4000/5000) 30%
Intel UHD Graphics Xe G4 48EUs 90%
...
NVIDIA GeForce RTX 3080 Laptop GPU 970%
» Niegrywalna na większości testowanych laptopów.
Additional Benchmarks
Low Preset 1920x1080
11 [X] Fujitsu Lifebook A3510 (FPC04905BP) Intel Core i3-1005G1 1.2GHz
UHD Graphics G1 (Ice Lake 32 EU)
Intel UHD Graphics G1 (Ice Lake 32 EU)
Intel UHD Graphics Xe G4 48EUs 46%
Intel UHD Graphics Xe 32EUs (Tiger Lake-H) 62%
Intel Iris Xe Graphics G7 80EUs 92%
...
NVIDIA GeForce RTX 3080 Ti Laptop GPU 1473%
» Niegrywalna na większości testowanych laptopów.
Additional Benchmarks
Low Preset 1920x1080
10 [X] Fujitsu Lifebook A3510 (FPC04905BP) Intel Core i3-1005G1 1.2GHz
UHD Graphics G1 (Ice Lake 32 EU)
min:
8 fps, max:
12 fps
0 Tooltip Lifebook A3510 (FPC04905BP): Ø28.5 (19.072-52.4)
Intel UHD Graphics (Jasper Lake 32 EU) -49%
Intel UHD Graphics Xe 16EUs (Tiger Lake-H) -25%
Intel UHD Graphics G1 (Ice Lake 32 EU)
Intel UHD Graphics Xe 32EUs (Tiger Lake-H) 30%
Intel UHD Graphics Xe G4 48EUs 34%
Intel Iris Xe Graphics G7 80EUs 81%
...
NVIDIA GeForce RTX 3060 Laptop GPU 1063%
0 Tooltip Lifebook A3510 (FPC04905BP): Ø16.6 (10.051-59.1)
Intel UHD Graphics Xe 16EUs (Tiger Lake-H) -17%
Intel UHD Graphics G1 (Ice Lake 32 EU)
Intel UHD Graphics Xe 32EUs (Tiger Lake-H) 39%
Intel UHD Graphics Xe G4 48EUs 63%
AMD Radeon RX Vega 5 63%
AMD Radeon 540X 96%
...
NVIDIA GeForce RTX 3080 Ti Laptop GPU 2525%
» Niegrywalna na większości testowanych laptopów.
Additional Benchmarks
Low Preset (DX12) 1920x1080
16.4 [X] Fujitsu Lifebook A3510 (FPC04905BP) Intel Core i3-1005G1 1.2GHz
UHD Graphics G1 (Ice Lake 32 EU)
min:
6.9 fps, P0.1:
6.91 fps, P1:
7.01 fps, max:
216 fps
0 Tooltip Lifebook A3510 (FPC04905BP): Ø26.3 (15.035-78)
Intel UHD Graphics (Jasper Lake 32 EU) -52%
NVIDIA GeForce MX250 -28%
Intel UHD Graphics Xe 16EUs (Tiger Lake-H) -2%
Intel UHD Graphics G1 (Ice Lake 32 EU)
AMD Radeon RX Vega 5 54%
Intel UHD Graphics Xe G4 48EUs 57%
Intel UHD Graphics Xe 32EUs (Tiger Lake-H) 74%
AMD Radeon RX Vega 7 86%
Intel Iris Xe Graphics G7 80EUs 120%
AMD Radeon 660M 141%
...
NVIDIA GeForce RTX 3070 Ti Laptop GPU 663%
0 Tooltip Lifebook A3510 (FPC04905BP): Ø12.6 (10.004-33.7)
NVIDIA GeForce MX250 -3%
NVIDIA GeForce MX450 -2%
Intel UHD Graphics G1 (Ice Lake 32 EU)
AMD Radeon RX Vega 5 30%
Intel UHD Graphics Xe G4 48EUs 55%
Intel UHD Graphics Xe 32EUs (Tiger Lake-H) 69%
AMD Radeon RX Vega 7 82%
Intel Iris Xe Graphics G7 80EUs 99%
...
AMD Radeon RX 6800S 1243%
» Niegrywalna na większości testowanych laptopów.
Additional Benchmarks
Low Preset 1920x1080
12.9 [X] Fujitsu Lifebook A3510 (FPC04905BP) Intel Core i3-1005G1 1.2GHz
UHD Graphics G1 (Ice Lake 32 EU)
min:
10.8 fps, P0.1:
10.8 fps, P1:
11.5 fps, max:
15.8 fps
33.9 [X] Fujitsu Lifebook A3510 (FPC04905BP) 840701
Intel Core i3-1005G1 1.2GHz
UHD Graphics G1 (Ice Lake 32 EU)
min:
27 fps, P1:
25 fps, max:
39 fps
39.5 [X] Fujitsu Lifebook A3510 (FPC04905BP) 840701, Dual-Channel
Intel Core i3-1005G1 1.2GHz
UHD Graphics G1 (Ice Lake 32 EU)
min:
26 fps, P1:
22 fps, max:
47 fps
~ 37 fps
+ Porównaj