Intel HD Graphics (Broadwell)
-
HD Graphics Rodzina
| ||||||||||||||||||||||||||||||||||||||||||||||||||||||||||||||||||||||
| Nazwa robocza | Broadwell GT1 | |||||||||||||||||||||||||||||||||||||||||||||||||||||||||||||||||||||
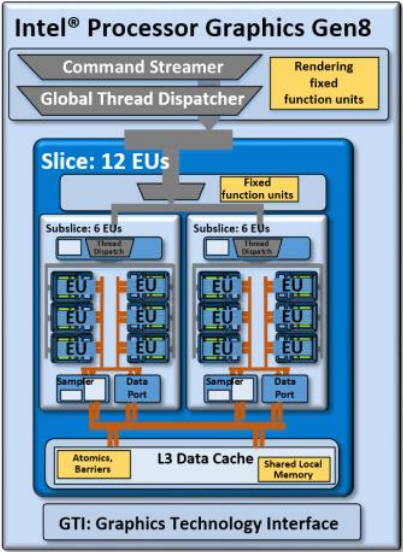
| Architektura | Gen. 8 Broadwell | |||||||||||||||||||||||||||||||||||||||||||||||||||||||||||||||||||||
| iGPU | Integrated Graphics | |||||||||||||||||||||||||||||||||||||||||||||||||||||||||||||||||||||
| Potoki | 12 - ZJC | |||||||||||||||||||||||||||||||||||||||||||||||||||||||||||||||||||||
| Zegar rdzenia | 100 - 850 (Boost) MHz | |||||||||||||||||||||||||||||||||||||||||||||||||||||||||||||||||||||
| Magistrala | 64/128 bit | |||||||||||||||||||||||||||||||||||||||||||||||||||||||||||||||||||||
| Pamięć współdzielona | tak | |||||||||||||||||||||||||||||||||||||||||||||||||||||||||||||||||||||
| API | DirectX 12 (FL 11_1), OpenGL 4.3 | |||||||||||||||||||||||||||||||||||||||||||||||||||||||||||||||||||||
| Technologia | 14 nm | |||||||||||||||||||||||||||||||||||||||||||||||||||||||||||||||||||||
| Technologie | QuickSync | |||||||||||||||||||||||||||||||||||||||||||||||||||||||||||||||||||||
| Data premiery | 05.01.2015 | |||||||||||||||||||||||||||||||||||||||||||||||||||||||||||||||||||||
| ||||||||||||||||||||||||
Testy
Performance Rating - 3DMark 11 + Fire Strike + Time Spy
0.2 pt (1%)
...
Intel HD Graphics (Broadwell)
Intel UHD Graphics (Elkhart Lake 16 EU)
...
max:
0%
100%
3DMark - 3DMark Fire Strike Standard Score
428 Points (1%)

3DMark - 3DMark Fire Strike Standard Graphics
463 Points (0%)
3DMark 11 - 3DM11 Performance GPU
641 Points (0%)
...
Intel HD Graphics (Broadwell)
Intel UHD Graphics (Elkhart Lake 16 EU)
...
NVIDIA RTX PRO 5000 Blackwell Generation Laptop
max:
NVIDIA GeForce RTX 5090
0%
100%
3DM Vant. Perf. total +
3DM Vant. Perf. GPU no PhysX +
3DMark 06 3DMark 06 - Standard 1280x1024 +
Unigine Heaven 2.1 - Heaven 2.1 high
10.9 fps (2%)
...
Intel HD Graphics (Broadwell)
...
0%
100%
Cinebench R11.5 Cinebench R11.5 OpenGL 64 Bit +
Cinebench R15
Cinebench R15 OpenGL 64 Bit +
Cinebench R15 OpenGL Ref. Match 64 Bit +
GFXBench 3.1 - GFXBench Manhattan ES 3.1 Offscreen
17.4 fps (0%)
GFXBench 3.0 - GFXBench 3.0 Manhattan Offscreen
21.5 fps (1%)
GFXBench T-Rex HD Offscreen C24Z16 +
LuxMark v2.0 64Bit - LuxMark v2.0 Room GPU
86 Samples/s (0%)
LuxMark v2.0 64Bit - LuxMark v2.0 Sala GPU
182 Samples/s (0%)
ComputeMark v2.1 - ComputeMark v2.1 Result
374 pkt. (0%)
- Zakres wyników testów referencyjnych dla tej karty graficznej
 - Średnia wartość wyników testów referencyjnych dla tej karty graficzne
* Mniejsze liczby oznaczają wyższą wydajność
* Mniejsze liczby oznaczają wyższą wydajność
Testy gier
Zamieszczone niżej wyniki pochodzą z testów zrecenzowanych laptopów. Należy pamiętać, że osiągi poszczególnych konfiguracji zależą od zastosowanej pamięci własnej karty (VRAM), zegarów karty (mogą być różne), procesora, ustawień systemu, sterowników i wersji systemu operacyjnego. Tym samym uzyskane wyniki nie muszą być reprezentatywne dla wszystkich laptopów wyposażonych w daną kartę graficzną. By uzyskać szczegółowe informacje o wynikach testów, należy kliknąć na podaną wartość liczbową (fps, czyli kl/s).

low 1024x768
15.3 fps
+ Porównaj
med. 1366x768
8.5 fps
+ Porównaj
» Niegrywalna na większości testowanych laptopów.

FIFA 16
2015low 1280x720
38.1 fps
+ Porównaj
high 1366x768
20.6 fps
+ Porównaj
» Na wszystkich testowanych laptopach grywalna przy ustawieniach low.

World of Warships
2015low 1366x768
29 fps
+ Porównaj
med. 1366x768
20.8 fps
+ Porównaj
» Niegrywalna na większości testowanych laptopów.

Dirt Rally
2015low 1024x768
50 fps
+ Porównaj
med. 1366x768
13.5 fps
+ Porównaj
» Na wszystkich testowanych laptopach grywalna przy ustawieniach low.

Battlefield Hardline
2015low 1024x768
23.9 fps
+ Porównaj
med. 1366x768
16.4 fps
+ Porównaj
» Niegrywalna na większości testowanych laptopów.
low 1024x768
13.9 fps
+ Porównaj
med. 1366x768
9.4 fps
+ Porównaj
» Niegrywalna na większości testowanych laptopów.

F1 2014
2014low 1024x768
34 fps
+ Porównaj
med. 1366x768
24 fps
+ Porównaj
» Niegrywalna na większości testowanych laptopów.

Sims 4
2014low 1024x768
113.6 fps
+ Porównaj
med. 1366x768
26.3 fps
+ Porównaj
» Na wszystkich testowanych laptopach grywalna przy ustawieniach low.

GRID: Autosport
2014low 1024x768
57.6 fps
+ Porównaj
med. 1366x768
22.6 fps
+ Porównaj
» Na wszystkich testowanych laptopach grywalna przy ustawieniach low.

Metro: Last Light
2013low 1024x768
13.7 fps
+ Porównaj
med. 1366x768
10.7 fps
+ Porównaj
high 1366x768
7 fps
+ Porównaj
» Niegrywalna na większości testowanych laptopów.
BioShock Infinite
2013low 1280x720
25.3 fps
+ Porównaj
med. 1366x768
14.1 fps
+ Porównaj
high 1366x768
11.7 fps
+ Porównaj
» Niegrywalna na większości testowanych laptopów.

Tomb Raider
2013low 1024x768
34.7 fps
+ Porównaj
med. 1366x768
17.7 fps
+ Porównaj
high 1366x768
11.7 fps
+ Porównaj
» Niegrywalna na większości testowanych laptopów.

Hitman: Absolution
2012low 1024x768
15.6 fps
+ Porównaj
med. 1366x768
11.4 fps
+ Porównaj
high 1366x768
5.3 fps
+ Porównaj
» Niegrywalna na większości testowanych laptopów.
Counter-Strike: GO
2012low 1024x768
43.7 fps
+ Porównaj
med. 1366x768
31.5 fps
+ Porównaj
high 1366x768
23.9 fps
+ Porównaj
» Na wszystkich testowanych laptopach grywalna przy ustawieniach low.

Diablo III
2012low 1024x768
38.4 fps
+ Porównaj
med. 1366x768
24.9 fps
+ Porównaj
high 1366x768
19.7 fps
+ Porównaj
» Na wszystkich testowanych laptopach grywalna przy ustawieniach low.
| low | med. | high | ultra | QHD | 4K | |
|---|---|---|---|---|---|---|
| Star Wars Battlefront | 15.3 | 8.5 | ||||
| FIFA 16 | 38.1 | 20.6 | ||||
| World of Warships | 29 | 20.8 | ||||
| Dirt Rally | 50 | 13.5 | ||||
| Battlefield Hardline | 23.9 | 16.4 | ||||
| Dragon Age: Inquisition | 13.9 | 9.4 | ||||
| F1 2014 | 34 | 24 | ||||
| Sims 4 | 113.6 | 26.3 | ||||
| GRID: Autosport | 57.6 | 22.6 | ||||
| Metro: Last Light | 13.7 | 10.7 | 7 | |||
| BioShock Infinite | 25.3 | 14.1 | 11.7 | |||
| Tomb Raider | 34.7 | 17.7 | 11.7 | |||
| Hitman: Absolution | 15.6 | 11.4 | 5.3 | |||
| Counter-Strike: GO | 43.7 | 31.5 | 23.9 | |||
| Diablo III | 38.4 | 24.9 | 19.7 | |||
| low | med. | high | ultra | QHD | 4K | < 30 fps < 60 fps < 120 fps ≥ 120 fps | 7 7 1 | 13 1 | 7 | | | |
Więcej informacji w rankingu płynności w grach
- $319.99Dell Latitude 14 5000 5480 Business Laptop: 14in HD (1366x768), Intel Core i7-6600U, 500GB HDD, 8GB DDR4, NVIDIA 930MX 2GB GDDR5 vRAM, WiFi + Bluetooth, Windows 11 Professional (Renewed)
- $169.00HP 15.6" HD Display Laptop | Intel Processor N200 | Intel UHD Graphics | Microsoft 365 Included | Black| 4GB RAM | 128GB SSD | Windows 11 S | Bundle with Wireless Mouse
- $296.96Dell Latitude 5490 14" FHD Business Laptop, Intel i5-8350U Processor, 16GB RAM, 512GB PCIe SSD, Intel UHD Graphics, Backlit Keyboard, HD Webcam, Win 11 Pro, Black(Renewed)
- $389.99HP 14 inch Laptop, HD Display, Intel Core i3-1215U, 8 GB RAM, 256 GB SSD, Intel UHD Graphics, Windows 11 Home in S Mode, Natural Silver, 14-dq5009nr
- $399.00HP Pavilion Laptop, 15.6" Full HD IPS Touchscreen, 10th Gen Intel Core i5-1035G1 Processor up to 3.60GHz, 12GB RAM, 512GB PCIe NVMe SSD, Backlit Keyboard, HDMI, Wireless-AC, Bluetooth, Windows 10 Home
v1.35
Brak recenzji dla tej karty graficznej.