Notebookcheck Logo

Intel Iris Plus Graphics G4 (Ice Lake 48 EU)
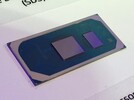
Intel Iris Plus Graphics G4 (Ice Lake 48 EU)

-

Gen. 11 Rodzina

Iris Plus Graphics G7 (Ice Lake 64 EU) 64 @ 0.3 - 1.1 GHz
Iris Plus Graphics G4 (Ice Lake 48 EU) 48 @ 0.3 - 1.1 GHz
UHD Graphics G1 (Ice Lake 32 EU) 32 @ 0.3 - 1.1 GHz
UHD Graphics G7 (Lakefield GT2 64 EU) 64 @ 0.2 - 0.5 GHz
UHD Graphics G4 (Lakefield GT1 48 EU) 48 @ 0.2 - 0.5 GHz
UHD Graphics (Jasper Lake 32 EU) 32 @ 0.35 - 0.9 GHz
UHD Graphics (Elkhart Lake 32 EU) 32 @ 0.4 - 0.85 GHz
UHD Graphics (Jasper Lake 24 EU) 24 @ 0.35 - 0.8 GHz
UHD Graphics (Elkhart Lake 16 EU) 16 @ 0.25 - 0.85 GHz
UHD Graphics (Jasper Lake 16 EU) 24 @ 0.35 - 0.8 GHz
Nazwa roboczaIce Lake G4 Gen. 11
ArchitekturaGen. 11 Ice Lake
Potoki48 - ZJC
Zegar rdzenia300 - 1100 (Boost) MHz
Typ pamięciDDR4
Pamięć współdzielonatak
APIDirectX 12_1, OpenGL 4.5
Pobór prądu12-25 W
Technologia10 nm
TechnologieQuickSync
Data premiery28.05.2019
CPU in Iris Plus Graphics G4 (Ice Lake 48 EU)GPU Base SpeedGPU Boost / Turbo
Intel Core i5-1035G44 x 1100 MHz, 15 W300 MHz1050 MHz
Intel Core i5-1030G44 x 700 MHz, 9 W300 MHz1050 MHz
Intel Core i3-1000NG42 x 1100 MHz, 9 W300 MHz900 MHz
Intel Core i3-1000G42 x 1100 MHz, 9 W300 MHz900 MHz
min. - max.300 MHz900 - 1050 MHz

Testy

Performance Rating - 3DMark 11 + Fire Strike + Time Spy
0.9 pt (3%)
0.06416 -93%
...
0.855 -9%
0.863 -8%
AMD Radeon 610M
0.869 -8%
Intel Iris Plus Graphics 655
0.877 -7%
0.883 -6%
0.884 -6%
0.918 -2%
0.932 -1%
0.934 -1%
Intel Iris Plus Graphics G4 (Ice Lake 48 EU)
0.94
0.959 2%
Intel UHD Graphics Xe 750 32EUs (Rocket Lake)
0.962 2%
0.973 4%
0.977 4%
0.993 6%
1.005 7%
1.005 7%
Intel UHD Graphics Xe G4 48EUs
1.027 9%
1.03 10%
...
20.4 2070%
max:
33.3 3443%
0%
100%
3DMark - 3DMark Time Spy Score
min: 699     avg: 724     median: 732 (2%)     max: 741 Points
3DMark - 3DMark Time Spy Graphics
min: 619     avg: 639     median: 646 (2%)     max: 652 Points
113 -82%
...
Intel UHD Graphics Xe 750 32EUs (Rocket Lake)
539 -16%
550 -14%
552 -14%
555 -13%
558 -13%
Intel Iris Plus Graphics 655
570 -11%
577 -10%
614 -4%
631 -1%
Intel Iris Plus Graphics G4 (Ice Lake 48 EU)
639
650 2%
Intel UHD Graphics Xe 32EUs (Tiger Lake-H)
670 5%
673 5%
724 13%
AMD Radeon RX Vega 5
733 15%
744 16%
Intel Iris Plus Graphics G7 (Ice Lake 64 EU)
744 16%
NVIDIA GeForce MX230
758 19%
Intel UHD Graphics Xe G4 48EUs
763 19%
...
19434 2941%
max:
36520 5615%
0%
100%
3DMark - 3DMark Ice Storm Unlimited Graphics
min: 50243     avg: 82914     median: 82913.5 (8%)     max: 115584 Points
3DMark - 3DMark Ice Storm Extreme Graphics
48559 Points (6%)
3DMark - 3DMark Cloud Gate Score
min: 10992     avg: 11496     median: 11495.5 (12%)     max: 11999 Points
3DMark - 3DMark Cloud Gate Graphics
min: 14903     avg: 14910     median: 14910 (4%)     max: 14917 Points
3DMark - 3DMark Fire Strike Standard Score
min: 839     avg: 1793     median: 1988 (4%)     max: 2071 Points
3DMark - 3DMark Fire Strike Standard Graphics
min: 922     avg: 1934     median: 2124 (2%)     max: 2230 Points
3DMark - 3DMark Ice Storm Graphics
74346 Points (9%)
3DMark - 3DMark Night Raid
8216 Points (8%)
3DMark - 3DMark Night Raid Graphics Score
9179 Points (4%)
3DMark 11 - 3DM11 Performance Score
min: 1980     avg: 3160     median: 3461 (5%)     max: 3544 Points
3DMark 11 - 3DM11 Performance GPU
min: 1941     avg: 2965     median: 3225 (3%)     max: 3334 Points
171.8 -94%
...
2762 -7%
2766 -7%
2801 -6%
2817 -5%
2821 -5%
2872 -3%
2911 -2%
Qualcomm Adreno 690
2930 -1%
2941 -1%
Intel Iris Plus Graphics G4 (Ice Lake 48 EU)
2965
2967 0%
2973 0%
2985 1%
3022 2%
3101 5%
3106 5%
3131 6%
Intel UHD Graphics Xe 32EUs (Tiger Lake-H)
3180 7%
3220 9%
...
59943 1922%
max:
105674 3464%
0%
100%
3DMark Vantage
3DM Vant. Perf. total +
3DMark Vantage - 3DM Vant. Perf. total
min: 5516     avg: 8812     median: 8812 (3%)     max: 12108 Points
3DM Vant. Perf. GPU no PhysX +
3DMark Vantage - 3DM Vant. Perf. GPU no PhysX
min: 4925     avg: 7610     median: 7610 (4%)     max: 10295 Points
3DMark 05 - 3DMark 05 - Standard
19383 Points (21%)
3DMark 06 3DMark 06 - Standard 1280x1024 +
3DMark 06
min: 6413     avg: 10836     median: 13031 (17%)     max: 13065 Points
Unigine Valley 1.0 - Unigine Valley 1.0 DX
8.5 fps (3%)
Unigine Heaven 3.0 - Unigine Heaven 3.0 DX 11
30.5 fps (10%)
Unigine Heaven 3.0 - Unigine Heaven 3.0 OpenGL
33.5 fps (15%)
Unigine Heaven 2.1 - Heaven 2.1 high
36.4 fps (7%)
0.6 -98%
...
32.6 -10%
33.3 -9%
33.55 -8%
33.7 -7%
34.1 -6%
35 -4%
36 -1%
36.1 -1%
AMD Radeon RX Vega 5
36.2 -1%
Intel Iris Plus Graphics G4 (Ice Lake 48 EU)
36.4
36.8 1%
AMD Radeon RX Vega 6 (Ryzen 4000/5000)
36.8 1%
37 2%
37.4 3%
37.5 3%
37.81 4%
39.1 7%
39.5 9%
39.75 9%
...
532 1362%
0%
100%
Cinebench R10 Cinebench R10 Shading (32bit) +
Cinebench R10 - Cinebench R10 Shading (32bit)
min: 9615     avg: 9932     median: 9931.5 (7%)     max: 10248 pkt.
Cinebench R11.5 Cinebench R11.5 OpenGL 64 Bit +
Cinebench R11.5 - Cinebench R11.5 OpenGL 64 Bit
min: 31.45     avg: 37.3     median: 37.3 (12%)     max: 43.07 fps
Cinebench R15
Cinebench R15 OpenGL 64 Bit +
Cinebench R15 - Cinebench R15 OpenGL 64 Bit
min: 39.25     avg: 53.4     median: 55.5 (3%)     max: 62 fps
Cinebench R15 OpenGL Ref. Match 64 Bit +
Cinebench R15 - Cinebench R15 OpenGL Ref. Match 64 Bit
min: 97.8     avg: 98.1     median: 97.8 (98%)     max: 99.3 %
GFXBench - GFXBench 5.0 Aztec Ruins High Tier Offscreen
22.1 fps (4%)
GFXBench - GFXBench 5.0 Aztec Ruins Normal Tier Offscreen
57.4 fps (4%)
GFXBench - GFXBench Car Chase Offscreen
57.5 fps (6%)
GFXBench 3.1 - GFXBench Manhattan ES 3.1 Offscreen
78.1 fps (2%)
GFXBench 3.0 - GFXBench 3.0 Manhattan Offscreen
130.1 fps (8%)
GFXBench (DX / GLBenchmark) 2.7
GFXBench T-Rex HD Offscreen C24Z16 +
GFXBench (DX / GLBenchmark) 2.7 - GFXBench T-Rex HD Offscreen C24Z16
210.6 fps (2%)
LuxMark v2.0 64Bit - LuxMark v2.0 Room GPU
min: 219     avg: 332.7     median: 384 (2%)     max: 395 Samples/s
LuxMark v2.0 64Bit - LuxMark v2.0 Sala GPU
min: 524     avg: 828     median: 875 (2%)     max: 1084 Samples/s
ComputeMark v2.1 - ComputeMark v2.1 Result
min: 1292     avg: 1691     median: 1784 (2%)     max: 1998 pkt.
Power Consumption - Furmark Stress Test Power Consumption - external Monitor *
27.4 Watt (4%)
Power Consumption - Witcher 3 Power Consumption *
28 Watt (6%)
Emissions Witcher 3 Fan Noise +
Emissions - Witcher 3 Fan Noise
34.5 dB(A) (55%)
- Zakres wyników testów referencyjnych dla tej karty graficznej
- Średnia wartość wyników testów referencyjnych dla tej karty graficzne
* Smaller numbers mean a higher performance

Testy gier

Zamieszczone niżej wyniki pochodzą z testów zrecenzowanych laptopów. Należy pamiętać, że osiągi poszczególnych konfiguracji zależą od zastosowanej pamięci własnej karty (VRAM), zegarów karty (mogą być różne), procesora, ustawień systemu, sterowników i wersji systemu operacyjnego. Tym samym uzyskane wyniki nie muszą być reprezentatywne dla wszystkich laptopów wyposażonych w daną kartę graficzną. By uzyskać szczegółowe informacje o wynikach testów, należy kliknąć na podaną wartość liczbową (fps, czyli kl/s).

low 1280x720
26.5  fps    + Porównaj
med. 1920x1080
11.5  fps    + Porównaj
» Niegrywalna na większości testowanych laptopów.
low 1280x720
36.1  fps    + Porównaj
med. 1920x1080
19  fps    + Porównaj
high 1920x1080
15.1  fps    + Porównaj
» Na wszystkich testowanych laptopach grywalna przy ustawieniach low.
med. 1920x1080
10  fps    + Porównaj
high 1920x1080
8.9  fps    + Porównaj
» Niegrywalna na większości testowanych laptopów.
low 1280x720
20.3  fps    + Porównaj
med. 1920x1080
10  fps    + Porównaj
» Niegrywalna na większości testowanych laptopów.
GRID 2019

GRID 2019

2019
low 1280x720
36.7  fps    + Porównaj
med. 1920x1080
17.1  fps    + Porównaj
high 1920x1080
15.2  fps    + Porównaj
ultra 1920x1080
9.1  fps    + Porównaj
» Na wszystkich testowanych laptopach grywalna przy ustawieniach low.
low 1280x720
10  fps    + Porównaj
med. 1920x1080
9  fps    + Porównaj
» Niegrywalna na większości testowanych laptopów.
FIFA 20

FIFA 20

2019
low 1280x720
69.7  fps    + Porównaj
med. 1920x1080
43.8  fps    + Porównaj
high 1920x1080
39.8  fps    + Porównaj
ultra 1920x1080
30.2  fps    + Porównaj
» Na wszystkich testowanych laptopach grywalna przy ustawieniach high.
low 1280x720
25.3 25.5 ~ 25 fps    + Porównaj
med. 1920x1080
8.3 10.5 ~ 9 fps    + Porównaj
high 1920x1080
5.1 7.3 ~ 6 fps    + Porównaj
ultra 1920x1080
3.5  fps    + Porównaj
» Niegrywalna na większości testowanych laptopów.
Control

Control

2019
low 1280x720
22.6  fps    + Porównaj
med. 1920x1080
7.6  fps    + Porównaj
» Niegrywalna na większości testowanych laptopów.
F1 2019

F1 2019

2019
low 1280x720
50  fps    + Porównaj
med. 1920x1080
22  fps    + Porównaj
high 1920x1080
19  fps    + Porównaj
ultra 1920x1080
14  fps    + Porównaj
» Na wszystkich testowanych laptopach grywalna przy ustawieniach low.
low 1280x720
43.7  fps    + Porównaj
med. 1920x1080
13.8  fps    + Porównaj
high 1920x1080
7.8  fps    + Porównaj
» Na wszystkich testowanych laptopach grywalna przy ustawieniach low.
Rage 2

Rage 2

2019
low 1280x720
22.4  fps    + Porównaj
med. 1920x1080
11.7  fps    + Porównaj
» Niegrywalna na większości testowanych laptopów.
Anno 1800

Anno 1800

2019
low 1280x720
31.4  fps    + Porównaj
med. 1920x1080
11.5  fps    + Porównaj