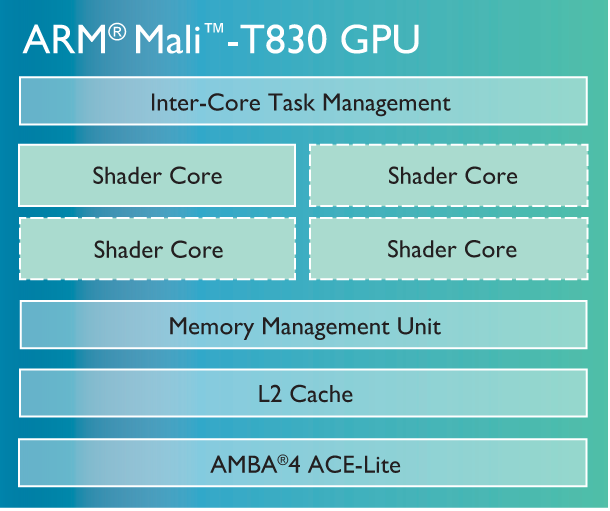
ARM Mali-T830 MP2
-
Mali-T800 Rodzina
| ||||||||||||||||||||||
| iGPU | Integrated Graphics | |||||||||||||||||||||
| Potoki | 2 - ZJC | |||||||||||||||||||||
| Zegar rdzenia | 600 (Boost) MHz | |||||||||||||||||||||
| Pamięć współdzielona | nie | |||||||||||||||||||||
| API | DirectX 11 (FL 9_3), OpenGL ES 3.2 | |||||||||||||||||||||
| Technologia | 16 nm | |||||||||||||||||||||
| Technologie | OpenGL ES 3.2, OpenCL 1.2, DirectX 11 (FL 9_3) | |||||||||||||||||||||
| Data premiery | 01.04.2016 | |||||||||||||||||||||
| Witryna producenta | www.arm.com | |||||||||||||||||||||
| ||||||||||||||||||||||||
Testy
3DMark - 3DMark Ice Storm Unlimited Graphics
min: 9936 przeciętny: 11116 mediana: 11318.5 (1%) maks: 11713 Points

3DMark - 3DMark Ice Storm Extreme Graphics
min: 6960 przeciętny: 7178 mediana: 7177.5 (1%) maks: 7395 Points
3DMark - 3DMark Sling Shot (ES 3.0) Unlimited
min: 559 przeciętny: 652 mediana: 665 (3%) maks: 721 Points
3DMark - 3DMark Sling Shot (ES 3.0) Unlimited Graphics
min: 477 przeciętny: 559 mediana: 567.5 (1%) maks: 618 Points
3DMark - 3DMark Sling Shot Extreme (ES 3.1) Unlimited
min: 363 przeciętny: 432.9 mediana: 409 (2%) maks: 483 Points
3DMark - 3DMark Sling Shot Extreme (ES 3.1) Unlimited Graphics
min: 299 przeciętny: 358 mediana: 336 (1%) maks: 401 Points
ARM Mali-T830 MP2
IMG BXM-4-64 MC1
ARM Mali-G52 MP1
...
0%
100%
3DMark - 3DMark Sling Shot (ES 3.0)
min: 125 przeciętny: 435 mediana: 554 (5%) maks: 627 Points
3DMark - 3DMark Sling Shot (ES 3.0) Graphics
min: 99 przeciętny: 366.5 mediana: 473 (3%) maks: 532 Points
3DMark - 3DMark Sling Shot Extreme (ES 3.1)
min: 176 przeciętny: 337.5 mediana: 369 (2%) maks: 409 Points
3DMark - 3DMark Sling Shot Extreme (ES 3.1) Graphics
min: 140 przeciętny: 276.4 mediana: 305 (1%) maks: 338 Points
GFXBench - GFXBench 5.0 Aztec Ruins High Tier Offscreen
min: 0.96 przeciętny: 1 mediana: 1 (0%) maks: 1.1 fps
ARM Mali-T830 MP2
IMG BXM-4-64 MC1
ARM Mali-G57 MP1
...
max:
0%
100%
GFXBench - GFXBench 5.0 Aztec Ruins Normal Tier Offscreen
min: 2.6 przeciętny: 2.7 mediana: 2.8 (0%) maks: 2.8 fps
GFXBench - GFXBench Car Chase Offscreen
min: 2.8 przeciętny: 3 mediana: 2.9 (0%) maks: 3.2 fps
GFXBench 3.1 - GFXBench Manhattan ES 3.1 Offscreen
min: 2.5 przeciętny: 4.5 mediana: 4.7 (0%) maks: 5.4 fps
GFXBench 3.0 - GFXBench 3.0 Manhattan Offscreen
min: 4.6 przeciętny: 7.8 mediana: 7.9 (0%) maks: 8.8 fps
GFXBench T-Rex HD Offscreen C24Z16 +
Basemark X 1.1 - Basemark X 1.1 High Quality
min: 8323 przeciętny: 8545 mediana: 8542 (19%) maks: 8774 Points
Basemark X 1.1 - Basemark X 1.1 Medium Quality
min: 15988 przeciętny: 16554 mediana: 16613 (37%) maks: 17001 Points
PassMark PerformanceTest Mobile V1 - PerformanceTest Mobile V1 2D Graphics Tests
min: 3565 przeciętny: 3703 mediana: 3639 (1%) maks: 3967 Points
PassMark PerformanceTest Mobile V1 - PerformanceTest Mobile V1 3D Graphics Tests
min: 1076 przeciętny: 1184 mediana: 1160.5 (2%) maks: 1339 Points
- Zakres wyników testów referencyjnych dla tej karty graficznej
 - Średnia wartość wyników testów referencyjnych dla tej karty graficzne
* Mniejsze liczby oznaczają wyższą wydajność
* Mniejsze liczby oznaczają wyższą wydajność
Testy gier
Zamieszczone niżej wyniki pochodzą z testów zrecenzowanych laptopów. Należy pamiętać, że osiągi poszczególnych konfiguracji zależą od zastosowanej pamięci własnej karty (VRAM), zegarów karty (mogą być różne), procesora, ustawień systemu, sterowników i wersji systemu operacyjnego. Tym samym uzyskane wyniki nie muszą być reprezentatywne dla wszystkich laptopów wyposażonych w daną kartę graficzną. By uzyskać szczegółowe informacje o wynikach testów, należy kliknąć na podaną wartość liczbową (fps, czyli kl/s).

Arena of Valor
2018low
ultra
» Niegrywalna na większości testowanych laptopów.
Dead Trigger 2
2013
Asphalt 8: Airborne
2013
Real Racing 3
2013
Subway Surfers
2012| low | med. | high | ultra | QHD | 4K | |
|---|---|---|---|---|---|---|
| Arena of Valor | 31 | 31 | ||||
| Dead Trigger 2 | 40 | |||||
| Asphalt 8: Airborne | 30 | 24 | ||||
| Real Racing 3 | 26 | |||||
| Subway Surfers | 58 | |||||
| low | med. | high | ultra | QHD | 4K | < 30 fps < 60 fps < 120 fps ≥ 120 fps | 2 | | 2 2 | 1 | | |
Więcej informacji w rankingu płynności w grach
v1.35
Brak recenzji dla tej karty graficznej.