Intel Iris Graphics 6100
-
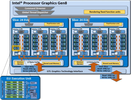
Iris Rodzina Nazwa robocza Broadwell GT3 Architektura Gen. 8 Broadwell Potoki 48 - ZJC Zegar rdzenia 300 - 1100 (Boost) MHz Magistrala 64/128 bit Pamięć współdzielona tak API DirectX 12 (FL 11_1), OpenGL 4.3 Pobór prądu 28 W Liczba tranzystorów 1.9 Billion Technologia 14 nm Technologie QuickSync Data premiery 05.01.2015
Testy Performance Rating - 3DMark 11 + Fire Strike + Time Spy
3.9 pt (4%)
...
Intel UHD Graphics Xe 16EUs (Tiger Lake-H) -3%
...
3DMark - 3DMark Time Spy Score
425 Points (1%)
...
Intel UHD Graphics (Jasper Lake 24 EU) -16%
Intel UHD Graphics (Jasper Lake 32 EU) -12%
Intel UHD Graphics G7 (Lakefield GT2 64 EU) -8%
Intel HD Graphics P630 -6%
Intel UHD Graphics Xe 16EUs (Tiger Lake-H) 2%
...
AMD Radeon RX 6850M XT 2641%
3DMark - 3DMark Time Spy Graphics
377 Points (1%)
...
Intel UHD Graphics (Jasper Lake 32 EU) -12%
Intel UHD Graphics G7 (Lakefield GT2 64 EU) -7%
Intel UHD Graphics Xe 16EUs (Tiger Lake-H) -1%
...
3DMark - 3DMark Ice Storm Unlimited Graphics
89341 Points (10%)
...
Intel UHD Graphics G7 (Lakefield GT2 64 EU) -2%
Intel UHD Graphics Xe G4 48EUs 9%
...
3DMark - 3DMark Ice Storm Extreme Graphics
min: 43469 avg: 46800 median: 46800 (6%) max: 50131 Points
...
Intel UHD Graphics 770 -1%
Intel UHD Graphics Xe G4 48EUs 1%
NVIDIA GeForce MX330 6%
NVIDIA GeForce MX450 7%
Intel Iris Xe Graphics G7 80EUs 10%
...
NVIDIA GeForce RTX 3080 Laptop GPU 787%
3DMark - 3DMark Cloud Gate Score
min: 5746 avg: 6119 median: 6141 (7%) max: 6637 Points
...
...
AMD Radeon RX 6500M 1413%
3DMark - 3DMark Cloud Gate Graphics
min: 7175 avg: 7743 median: 7798 (3%) max: 8199 Points
...
Intel UHD Graphics (Jasper Lake 32 EU) -8%
...
AMD Radeon RX 6850M XT 2134%
3DMark - 3DMark Fire Strike Standard Score
min: 811 avg: 880 median: 864.5 (2%) max: 981 Points
...
...
AMD Radeon RX 6850M XT 3074%
3DMark - 3DMark Fire Strike Standard Graphics
min: 857 avg: 917 median: 874 (1%) max: 1020 Points
...
...
3DMark - 3DMark Ice Storm Graphics
min: 60636 avg: 64246 median: 61997 (8%) max: 70106 Points
...
NVIDIA Quadro M1200 -1%
AMD Radeon RX 5500M -1%
NVIDIA GeForce RTX 2070 Super Max-Q 4%
NVIDIA GeForce GTX 1650 Max-Q 6%
...
AMD Radeon RX 6800S 713%
3DMark 11 - 3DM11 Performance Score
min: 1581 avg: 1763 median: 1768 (3%) max: 1884 Points
...
Intel UHD Graphics (Jasper Lake 24 EU) -6%
Intel UHD Graphics (Jasper Lake 32 EU) -5%
Qualcomm Adreno 680 5%
...
AMD Radeon RX 6850M XT 1650%
3DMark 11 - 3DM11 Performance GPU
min: 1471 avg: 1656 median: 1694.5 (2%) max: 1765 Points
...
Intel UHD Graphics Xe 16EUs (Tiger Lake-H) 1%
...
AMD Radeon RX 6850M XT 2437%
3DMark Vantage 3DM Vant. Perf. total + 3DMark Vantage - 3DM Vant. Perf. total
6531 Points (2%)
...
...
NVIDIA GeForce RTX 3080 Ti Laptop GPU 1351%
3DM Vant. Perf. GPU no PhysX + 3DMark Vantage - 3DM Vant. Perf. GPU no PhysX
5717 Points (3%)
...
Intel UHD Graphics Xe 16EUs (Tiger Lake-H) 4%
...
NVIDIA GeForce RTX 3080 Ti Laptop GPU 1692%
3DMark 06 3DMark 06 - Standard 1280x1024 +
min: 7929 avg: 8675 median: 8764 (12%) max: 9332 Points
...
...
NVIDIA GeForce RTX 3080 Ti Laptop GPU 558%
Unigine Heaven 3.0 - Unigine Heaven 3.0 OpenGL
14.6 fps (6%)
...
Intel UHD Graphics (Jasper Lake 32 EU) -6%
...
SPECviewperf 12 specvp12 sw-03 + SPECviewperf 12 - specvp12 sw-03
20.2 fps (6%)
...
NVIDIA GeForce MX250 -17%
Intel Iris Xe MAX Graphics 15%
...
specvp12 snx-02 + SPECviewperf 12 - specvp12 snx-02
2.7 fps (1%)
Intel Iris Xe MAX Graphics -64%
...
NVIDIA GeForce MX250 -22%
...
NVIDIA RTX A5500 Laptop GPU 7852%
specvp12 showcase-01 + SPECviewperf 12 - specvp12 showcase-01
5.8 fps (1%)
...
NVIDIA RTX A5500 Laptop GPU 2226%
specvp12 mediacal-01 + SPECviewperf 12 - specvp12 mediacal-01
1.6 fps (0%)
...
...
specvp12 maya-04 + SPECviewperf 12 - specvp12 maya-04
4.1 fps (1%)
NVIDIA GeForce MX250 -27%
...
NVIDIA RTX A5500 Laptop GPU 3849%
specvp12 energy-01 + SPECviewperf 12 - specvp12 energy-01
0.1 fps (0%)
...
specvp12 creo-01 + SPECviewperf 12 - specvp12 creo-01
12.3 fps (6%)
...
Intel Iris Xe MAX Graphics -17%
NVIDIA GeForce MX250 -14%
NVIDIA GeForce MX330 -1%
NVIDIA GeForce MX350 25%
...
NVIDIA RTX A5500 Laptop GPU 1317%
specvp12 catia-04 + SPECviewperf 12 - specvp12 catia-04
12 fps (2%)
...
NVIDIA GeForce MX250 -24%
...
NVIDIA RTX A5500 Laptop GPU 1643%
Cinebench R10 Cinebench R10 Shading (32bit) + Cinebench R10 - Cinebench R10 Shading (32bit)
min: 7690 avg: 7993 median: 7832.5 (6%) max: 8615 pkt.
...
AMD Radeon RX 5500M 5%
...
Cinebench R11.5 Cinebench R11.5 OpenGL 64 Bit + Cinebench R11.5 - Cinebench R11.5 OpenGL 64 Bit
min: 20.23 avg: 24.9 median: 24.9 (9%) max: 28.68 fps
...
...
NVIDIA RTX A2000 Laptop GPU 612%
Cinebench R15 Cinebench R15 OpenGL 64 Bit + Cinebench R15 - Cinebench R15 OpenGL 64 Bit
min: 29.16 avg: 34.9 median: 36.4 (9%) max: 37.51 fps
...
Intel UHD Graphics G7 (Lakefield GT2 64 EU) -5%
Intel UHD Graphics (Jasper Lake 24 EU) 6%
...
NVIDIA RTX A5500 Laptop GPU 950%
Cinebench R15 OpenGL Ref. Match 64 Bit + Cinebench R15 - Cinebench R15 OpenGL Ref. Match 64 Bit
98 % (98%)
...
Intel UHD Graphics G7 (Lakefield GT2 64 EU) 0%
Intel UHD Graphics (Jasper Lake 32 EU) 0%
Intel Iris Plus Graphics G7 (Ice Lake 64 EU) 0%
AMD Radeon RX 6600M 0%
Intel Iris Plus Graphics 655 0%
...
NVIDIA GeForce MX250 2%
GFXBench (DX / GLBenchmark) 2.7 GFXBench 2.7 T-Rex HD Onscreen C24Z16 + GFXBench (DX / GLBenchmark) 2.7 - GFXBench 2.7 T-Rex HD Onscreen C24Z16
53.1 fps (2%)
...
Intel Iris Plus Graphics G7 (Ice Lake 64 EU) 0%
...
GFXBench T-Rex HD Offscreen C24Z16 + GFXBench (DX / GLBenchmark) 2.7 - GFXBench T-Rex HD Offscreen C24Z16
102.1 fps (1%)
...
Intel UHD Graphics (Jasper Lake 32 EU) -11%
...
NVIDIA GeForce RTX 3080 Ti Laptop GPU 2214%
GFXBench 3.0 - GFXBench 3.0 Manhattan
23.5 fps (6%)
...
Intel Iris Plus Graphics G7 (Ice Lake 64 EU) -7%
Qualcomm Adreno 685 5%
...
GFXBench 3.0 - GFXBench 3.0 Manhattan Offscreen
48.8 fps (4%)
...
Intel UHD Graphics (Jasper Lake 16 EU) -11%
Intel Iris Plus Graphics G7 (Ice Lake 64 EU) -5%
Intel UHD Graphics G7 (Lakefield GT2 64 EU) -1%
Intel UHD Graphics (Jasper Lake 32 EU) 10%
...
Apple M1 Max 32-Core GPU 2414%
LuxMark v2.0 64Bit - LuxMark v2.0 Room GPU
145 Samples/s (1%)
...
Intel UHD Graphics 610 8%
...
NVIDIA GeForce GTX 1650 Ti Mobile 6638%
LuxMark v2.0 64Bit - LuxMark v2.0 Sala GPU
390 Samples/s (1%)
...
Intel UHD Graphics (Jasper Lake 32 EU) -8%
...
AMD Radeon RX 6800M 3687%
ComputeMark v2.1 - ComputeMark v2.1 Result
1115 pkt. (1%)
...
Intel UHD Graphics G7 (Lakefield GT2 64 EU) -3%
...
NVIDIA GeForce RTX 3080 Ti Laptop GPU 2655%
Power Consumption - Furmark Stress Test Power Consumption - external Monitor *
43.2 Watt (6%)
...
AMD Radeon 660M -17%
Intel Iris Plus Graphics 655 -17%
Intel Iris Xe Graphics G7 96EUs -10%
AMD Radeon RX Vega 8 (Ryzen 4000/5000) -4%
AMD Radeon RX Vega 5 -1%
NVIDIA GeForce MX250 0%
Intel Iris Xe MAX Graphics 7%
NVIDIA T500 Laptop GPU 9%
NVIDIA GeForce MX330 16%
...
AMD Radeon RX 6850M XT 417%
Power Consumption - The Witcher 3 Power Consumption - external Monitor *
43 Watt (6%)
Intel UHD Graphics (Jasper Lake 32 EU) -65%
...
Intel Iris Plus Graphics 655 -4%
Apple M1 Max 32-Core GPU -4%
NVIDIA GeForce MX250 -1%
AMD Radeon RX Vega 8 (Ryzen 4000/5000) 0%
NVIDIA T500 Laptop GPU 2%
...
AMD Radeon RX 6850M XT 451%
Clock Speed - GPU Clock Witcher 3 ultra
850 MHz (43%)
Intel Iris Plus Graphics G7 (Ice Lake 64 EU) -28%
...
AMD Radeon 660M 124%
Clock Speed - GPU Clock Speed Furmark
749 MHz (30%)
NVIDIA GeForce RTX 2080 Super Max-Q 9%
NVIDIA GeForce GTX 1660 Ti Mobile 14%
Intel Iris Plus Graphics G7 (Ice Lake 64 EU) 15%
...
- Zakres wyników testów referencyjnych dla tej karty graficznej
- Średnia wartość wyników testów referencyjnych dla tej karty graficzne
* Smaller numbers mean a higher performance
Testy gier Zamieszczone niżej wyniki pochodzą z testów zrecenzowanych laptopów. Należy pamiętać, że osiągi poszczególnych konfiguracji zależą od zastosowanej pamięci własnej karty (VRAM), zegarów karty (mogą być różne), procesora, ustawień systemu, sterowników i wersji systemu operacyjnego. Tym samym uzyskane wyniki nie muszą być reprezentatywne dla wszystkich laptopów wyposażonych w daną kartę graficzną. By uzyskać szczegółowe informacje o wynikach testów, należy kliknąć na podaną wartość liczbową (fps, czyli kl/s).
...
NVIDIA GeForce RTX 3070 Laptop GPU 1678%
» Niegrywalna na większości testowanych laptopów.
...
Intel UHD Graphics (Jasper Lake 16 EU) -27%
Intel UHD Graphics 610 -19%
Intel UHD Graphics Xe G4 48EUs 32%
...
NVIDIA GeForce RTX 3080 Laptop GPU 1199%
» Niegrywalna na większości testowanych laptopów.
Intel UHD Graphics (Elkhart Lake 16 EU) -63%
...
Intel UHD Graphics 610 -18%
Intel UHD Graphics (Jasper Lake 32 EU) -1%
Intel UHD Graphics (Jasper Lake 24 EU) 46%
...
NVIDIA GeForce RTX 2080 Super Mobile 1969%
» Niegrywalna na większości testowanych laptopów.
...
AMD Radeon RX Vega 5 -13%
NVIDIA GeForce GTX 1650 Mobile 7%
NVIDIA GeForce MX230 12%
Intel Iris Plus Graphics G7 (Ice Lake 64 EU) 13%
...
...
AMD Radeon RX Vega 5 -9%
NVIDIA GeForce GTX 1650 Mobile 9%
NVIDIA GeForce MX230 17%
...
...
AMD Radeon 540X 21%
...
...
» Na wszystkich testowanych laptopach grywalna przy ustawieniach high.
...
...
» Na wszystkich testowanych laptopach grywalna przy ustawieniach low.
...
...
...
...
» Na wszystkich testowanych laptopach grywalna przy ustawieniach low.
...
...
» Niegrywalna na większości testowanych laptopów.
...
...
...
...
...
...
» Na wszystkich testowanych laptopach grywalna przy ustawieniach med..
...
...
» Niegrywalna na większości testowanych laptopów.
...
...
...
...
» Niegrywalna na większości testowanych laptopów.
...
...
AMD Radeon RX 6650M 1412%
...
Intel UHD Graphics 610 -29%
...
AMD Radeon RX 6650M 1828%
» Niegrywalna na większości testowanych laptopów.
...
...
...
» Niegrywalna na większości testowanych laptopów.
...
» Niegrywalna na większości testowanych laptopów.
...
...
» Niegrywalna na większości testowanych laptopów.
...
...
...
...
...
...
» Niegrywalna na większości testowanych laptopów.
...
...
...
...
» Niegrywalna na większości testowanych laptopów.
...
...
...
...
9.8 (!) [X] Intel NUC5i7RYH Intel Core i7-5557U 3.1GHz
Iris Graphics 6100
Problem during benchmarking occured: small graphical problems min:
8 fps, max:
13 fps
fps
+ Porównaj
- Ukryj porównanie
...
...
» Niegrywalna na większości testowanych laptopów.
...
...
...
...
» Niegrywalna na większości testowanych laptopów.
...
...
...
...
» Niegrywalna na większości testowanych laptopów.
...
...
37.1 37.2 [X] Medion Akoya E6418-MD99620 Intel Core i5-5257U 2.7GHz
Iris Graphics 6100
42.7 (!) [X] Intel NUC5i7RYH Intel Core i7-5557U 3.1GHz
Iris Graphics 6100
Problem during benchmarking occured: slowmin:
38 fps, max:
48 fps
~ 39 fps
+ Porównaj
- Ukryj porównanie
...
...
19.1 [X] Medion Akoya E6418-MD99620 Intel Core i5-5257U 2.7GHz
Iris Graphics 6100
22.8 [X] Intel NUC5i7RYH Intel Core i7-5557U 3.1GHz
Iris Graphics 6100
min:
19 fps, max:
25 fps
~ 21 fps
+ Porównaj
- Ukryj porównanie
...
...
» Na wszystkich testowanych laptopach grywalna przy ustawieniach high.
45.1 [X] Medion Akoya E6418-MD99620 Intel Core i5-5257U 2.7GHz
Iris Graphics 6100
54 [X] Intel NUC5i7RYH Intel Core i7-5557U 3.1GHz
Iris Graphics 6100
min:
35 fps, max:
64 fps
~ 50 fps
+ Porównaj
- Ukryj porównanie
...