Werdykt - Ponadwymiarowy i cichy
NucBox K15 wyróżnia się dużym rozmiarem w porównaniu do innych komputerów mini PC z podobnymi procesorami Core z serii U. W rezultacie system działa chłodniej i ciszej niż większość innych, oferując jednocześnie więcej zintegrowanych portów, w tym OcuLink i obsługę do trzech wewnętrznych dysków SSD. Te cechy w szczególności pomagają GMK wyróżnić się na tle mniejszych alternatyw, takich jak NucBox M8 lub MSI Cubi NUC AI.
Jeśli jednak powyższe cechy wyróżniające nie mają zastosowania do Państwa scenariuszy użytkowania, wówczas duży rozmiar K15 staje się trudniejszy do uzasadnienia. Szczególnie niefortunne jest to, że model ten nadal wymaga zewnętrznego zasilacza pomimo swojej dużej obudowy. The Beelink GTi15 Ultrajest podobnie duży, ale udało mu się zintegrować zasilacz w celu uproszczenia procesu konfiguracji.
Zaawansowani użytkownicy mogą również uznać Core Ultra 5 125U za zbyt wolny do bardziej zaawansowanych zadań wykraczających poza HTPC lub scenariusze detaliczne. Aby uzyskać większą wydajność, istniejący zasilany przez AMD NucBox K12 jest nadal znacznie szybszą opcją.
Za
Przeciw
Cena i dostępność
Amazon wysyła teraz GMKtec NucBox K15 z 16 GB pamięci RAM i 1 TB SSD za 600 USD. Alternatywnie, GMK oferuje konfigurację konfigurację barebones za jedyne 360 USD.
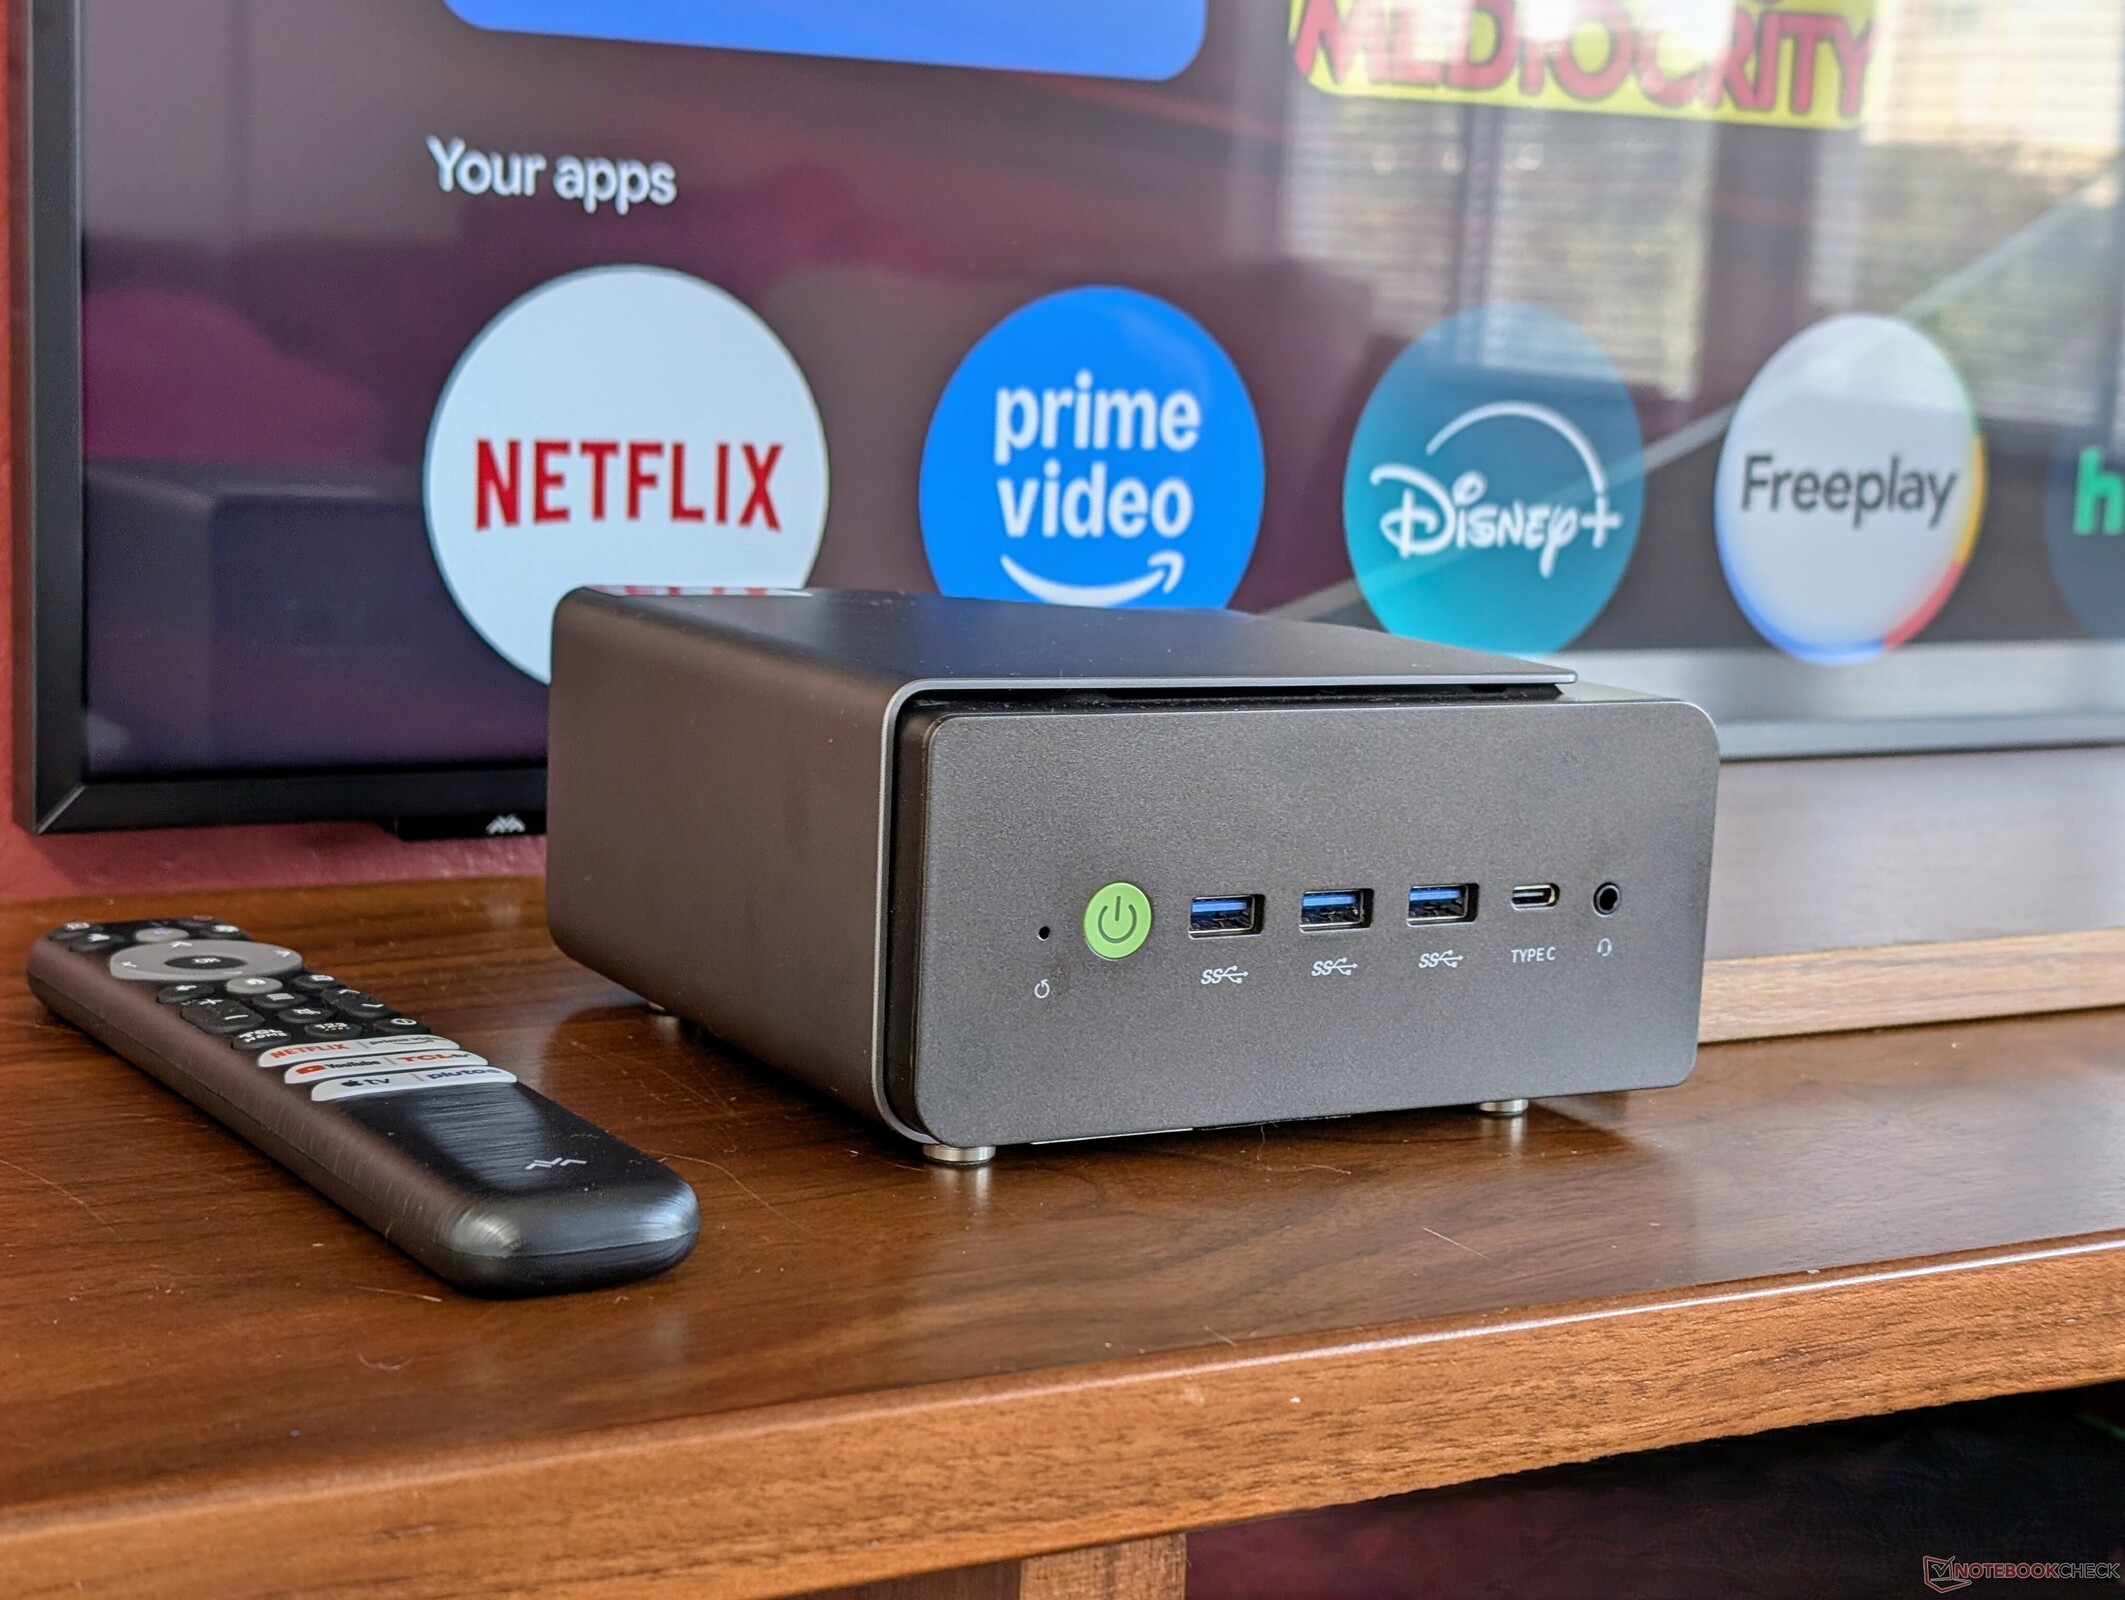
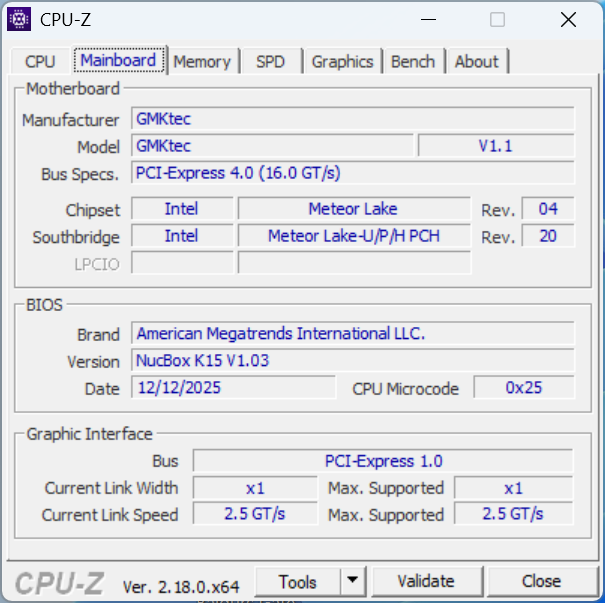
GMKtec NucBox K15 to najnowszy komputer mini PC w zorientowanej na konsumentów linii NucBox K. Odróżnia się on od szybszej linii profesjonalnych mini PC EVO, ale poza tym wszystkie mają podobne materiały obudowy.
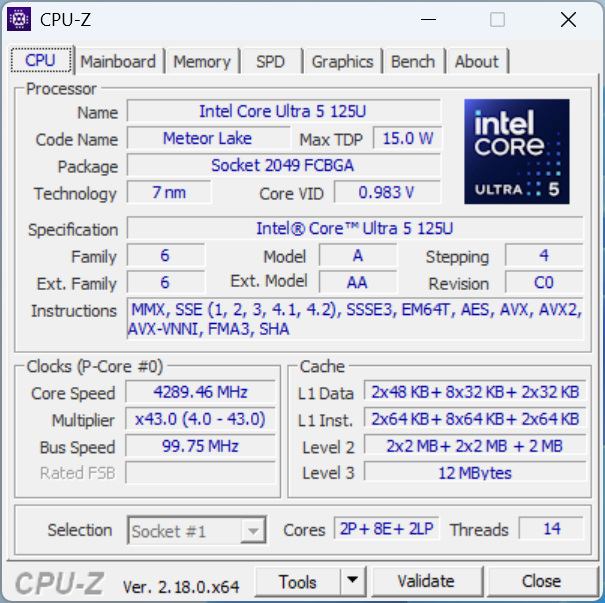
NucBox K15 jest dostarczany ze starszym procesorem Meteor Lake Core Ultra 5 125U. Dostępne są inne opcje procesorów, w tym Core Ultra 9 295H lub Ryzen 7 H 255, które mają tę samą konstrukcję obudowy, ale z inny model nazwami.
Alternatywy dla NucBox K15 obejmują inne mini komputery o niskim poborze mocy, takie jak NiPoGi AM06 Pro, MSI Cubi NUC AI+ 2MGlub Beelink EQ14.
Więcej recenzji GMK:
Specyfikacje
Sprawa
Nasz Intel NucBox K15 wykorzystuje tę samą fizyczną konstrukcję co AMD NucBox K12. Obudowa jest jednak dość duża jak na procesor z serii Core U, aby zapewnić więcej portów, możliwość rozbudowy i łatwiejsze serwisowanie.
Proszę pamiętać, że przycisk "Fan-Mode" na górze jedynie zmienia kolory RGB bez wpływu na prędkość wentylatora lub wydajność. Podświetlenie RGB prawdopodobnie nie pasuje do ogólnego wyglądu zewnętrznego.
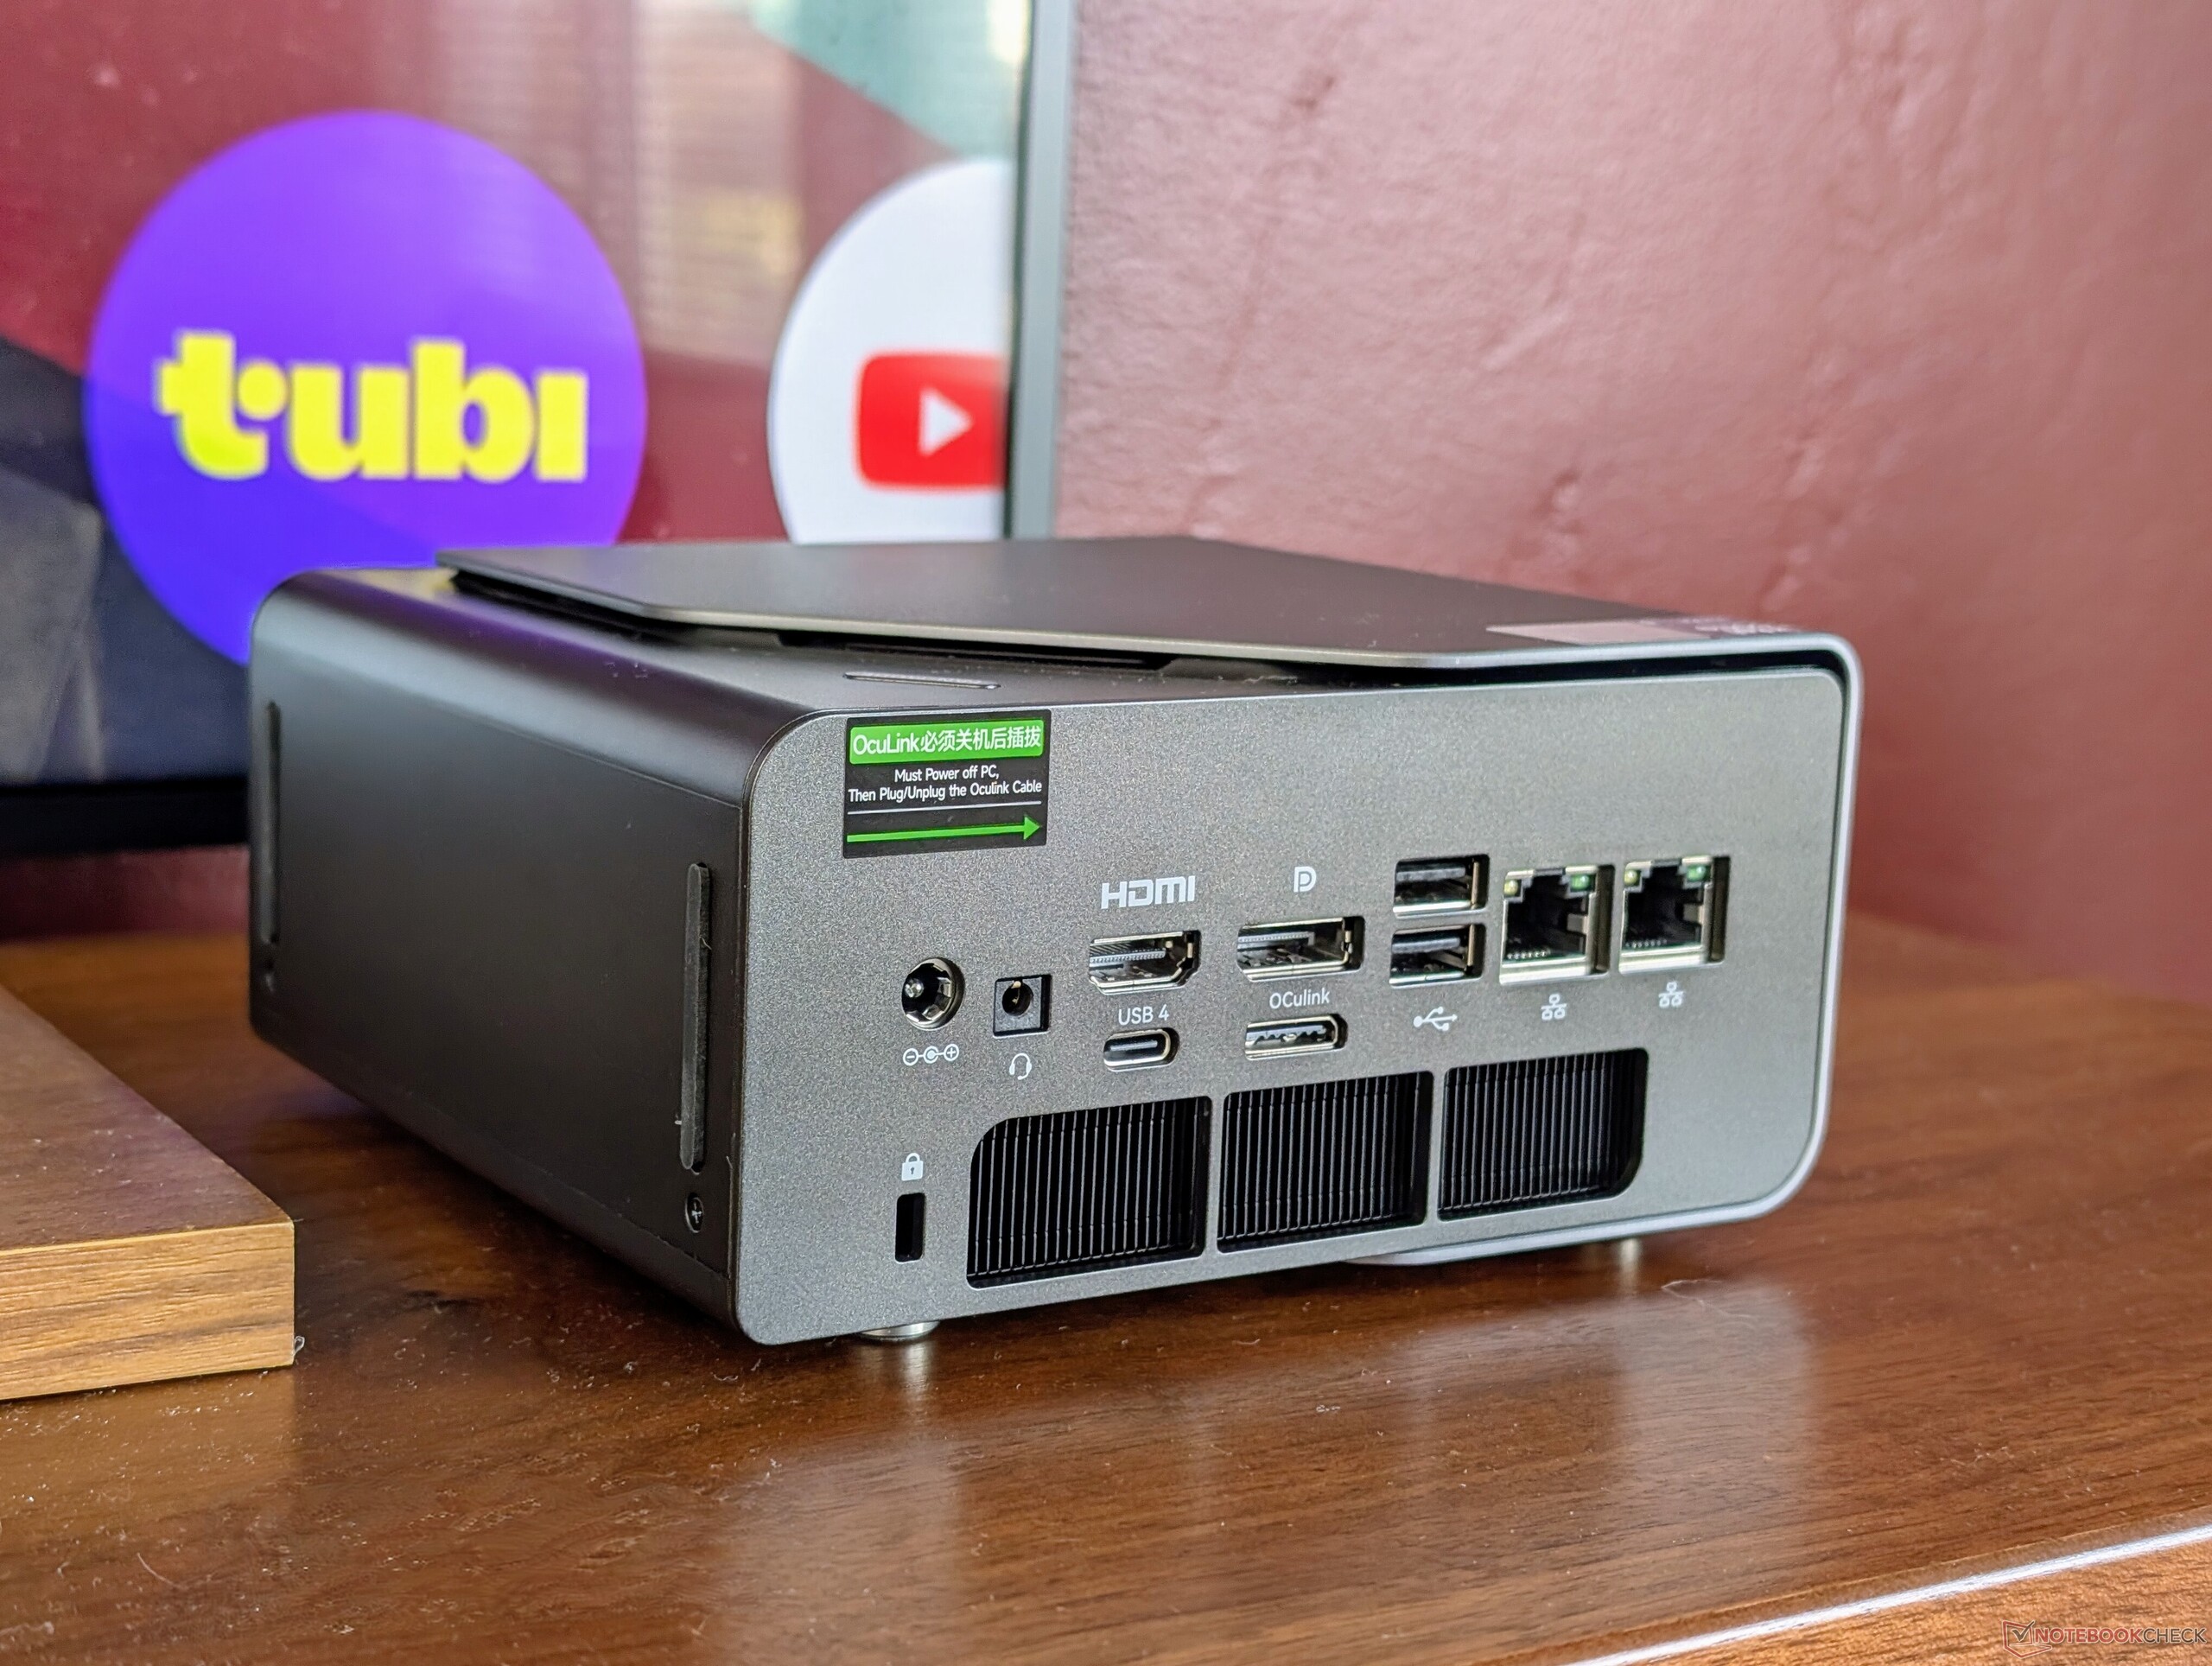
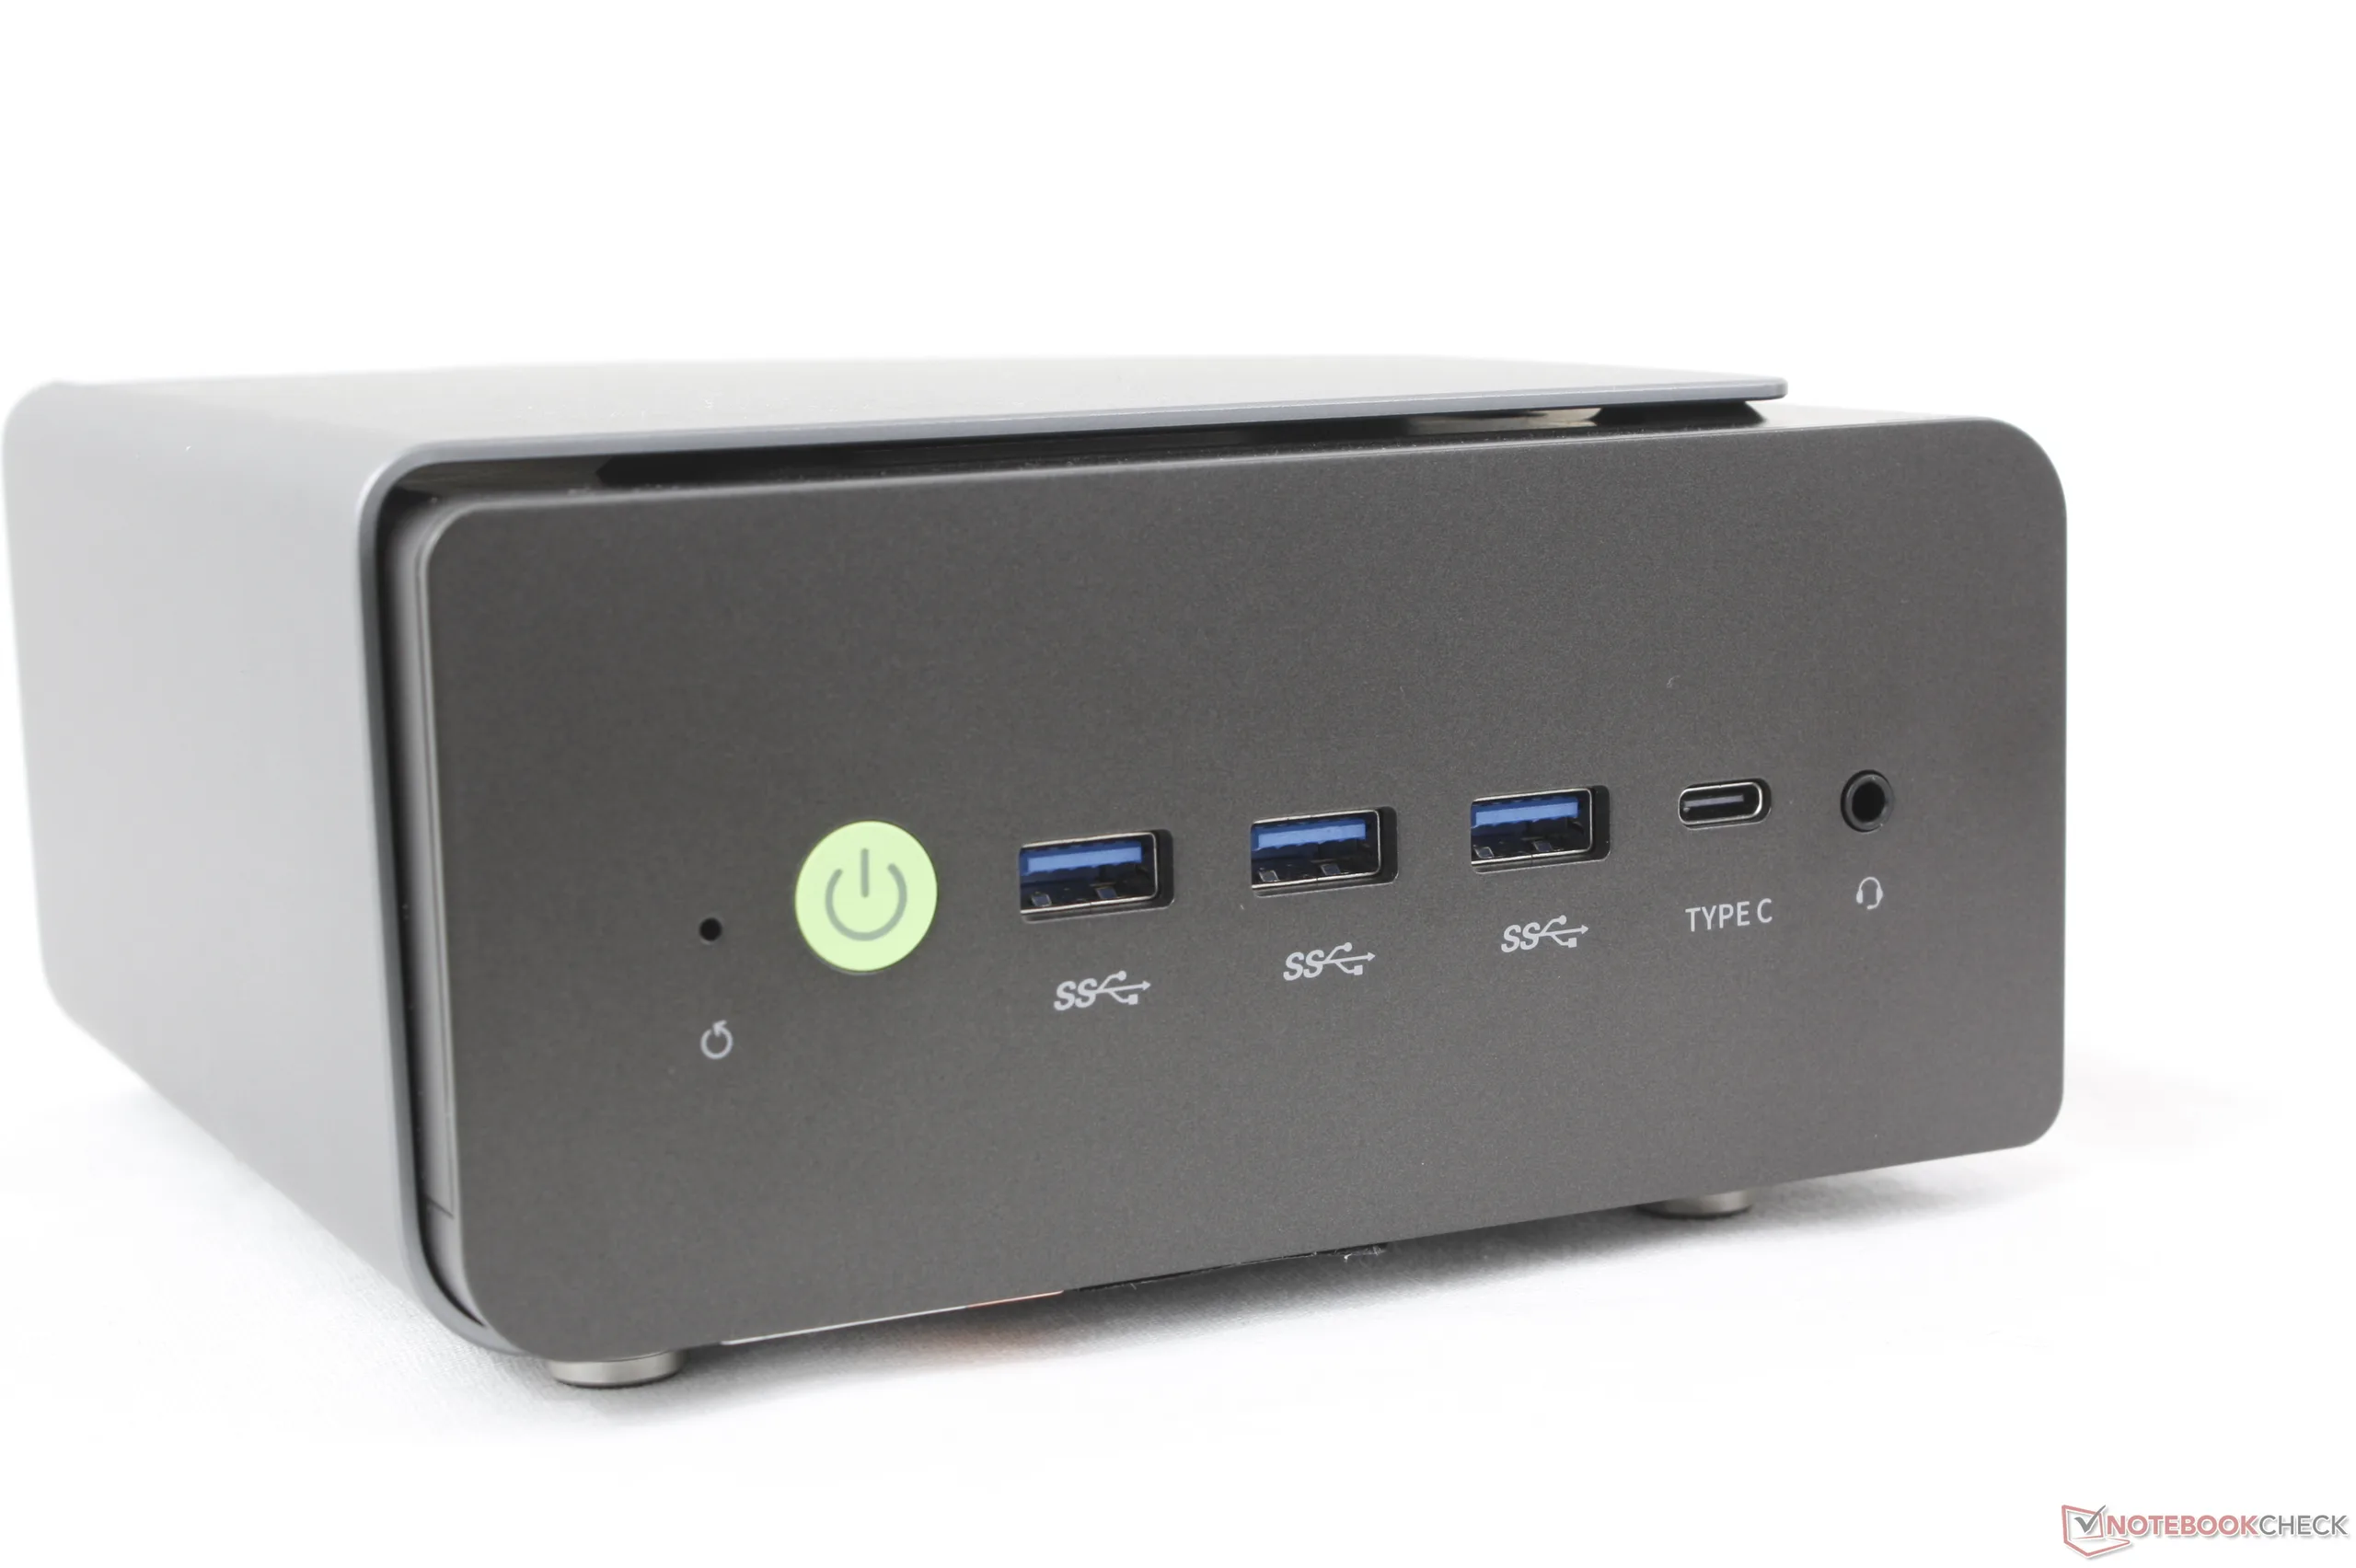
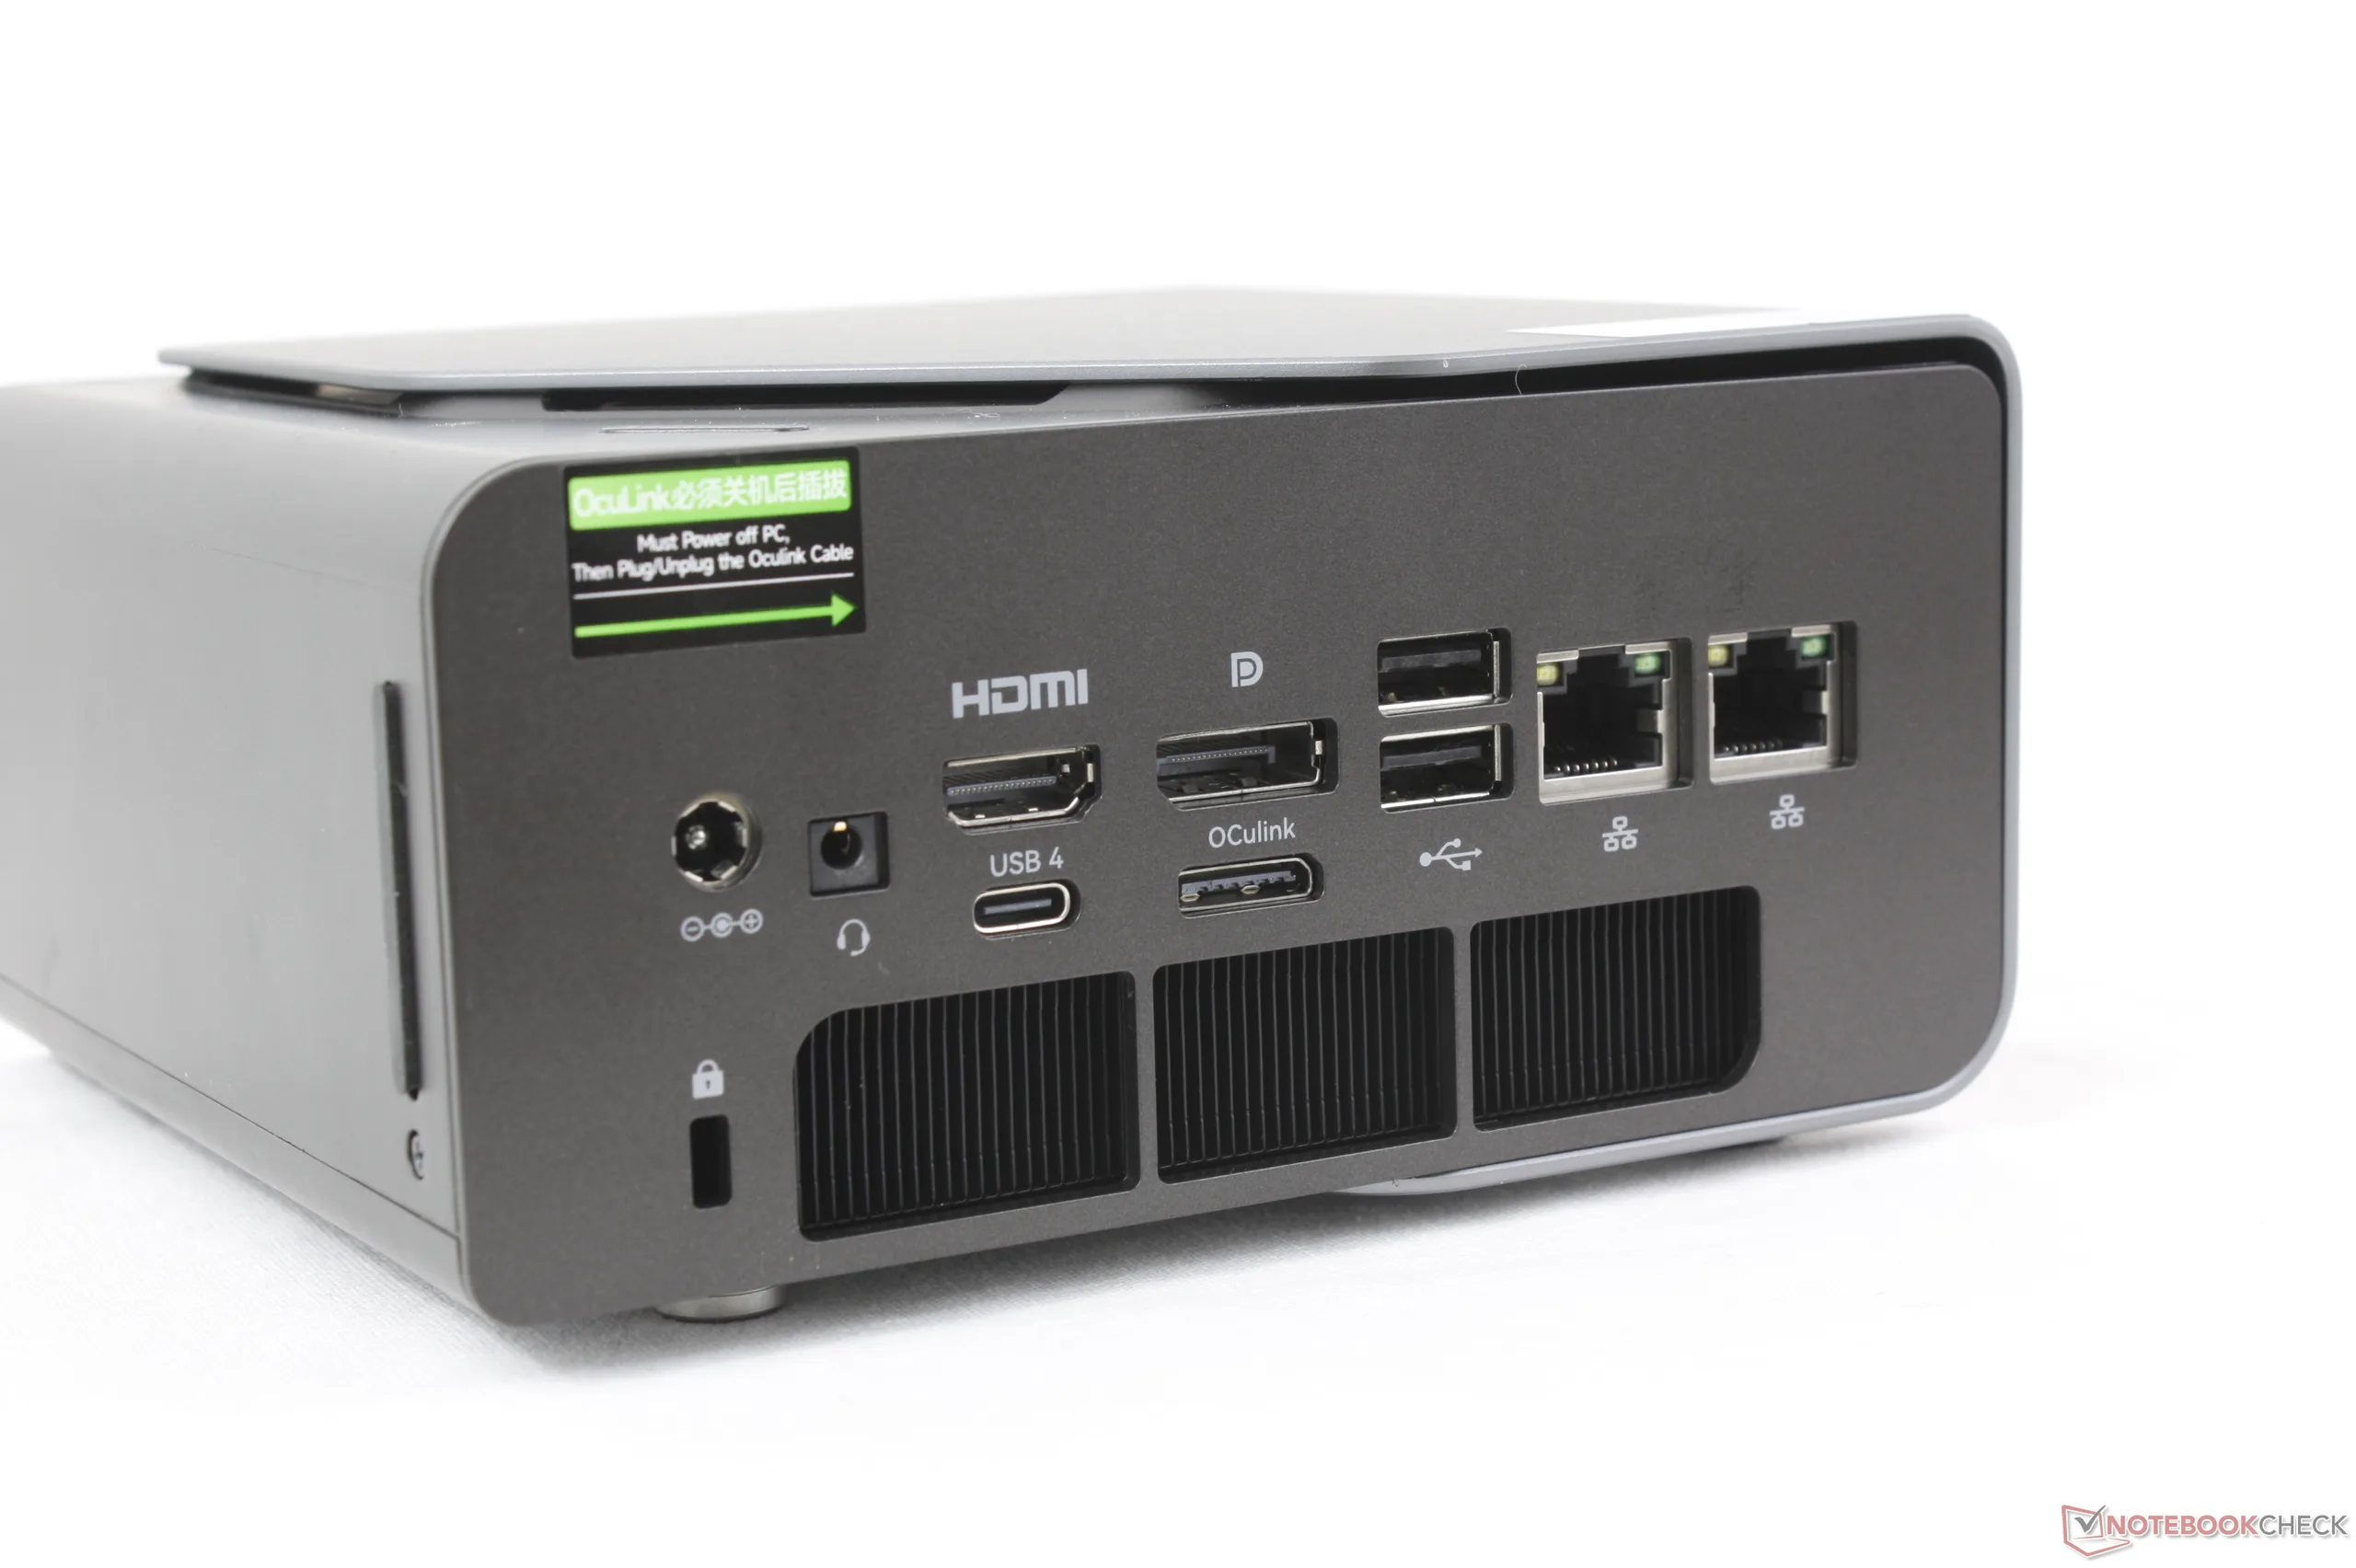
Łączność
Opcje portów są lepsze niż w większości mini PC z serii U ze względu na większy fizyczny rozmiar obudowy. Dwa porty USB-C są godne uwagi, ponieważ wiele konkurencyjnych modeli Beelink oferuje tylko jeden.
Komunikacja
| Networking | |
| iperf3 transmit AXE11000 | |
| MSI Cubi NUC AI+ 2MG | |
| GMK NucBox K12 | |
| BOSGAME M2 | |
| NiPoGi AM06 Pro | |
| GMK NucBox K15 | |
| Beelink SER9 Pro | |
| iperf3 receive AXE11000 | |
| MSI Cubi NUC AI+ 2MG | |
| BOSGAME M2 | |
| NiPoGi AM06 Pro | |
| Beelink SER9 Pro | |
| GMK NucBox K15 | |
| GMK NucBox K12 | |
| iperf3 transmit AXE11000 6GHz | |
| GMK NucBox K15 | |
| MSI Cubi NUC AI+ 2MG | |
| BOSGAME M2 | |
| GMK NucBox K12 | |
| iperf3 receive AXE11000 6GHz | |
| GMK NucBox K15 | |
| MSI Cubi NUC AI+ 2MG | |
| GMK NucBox K12 | |
| BOSGAME M2 | |
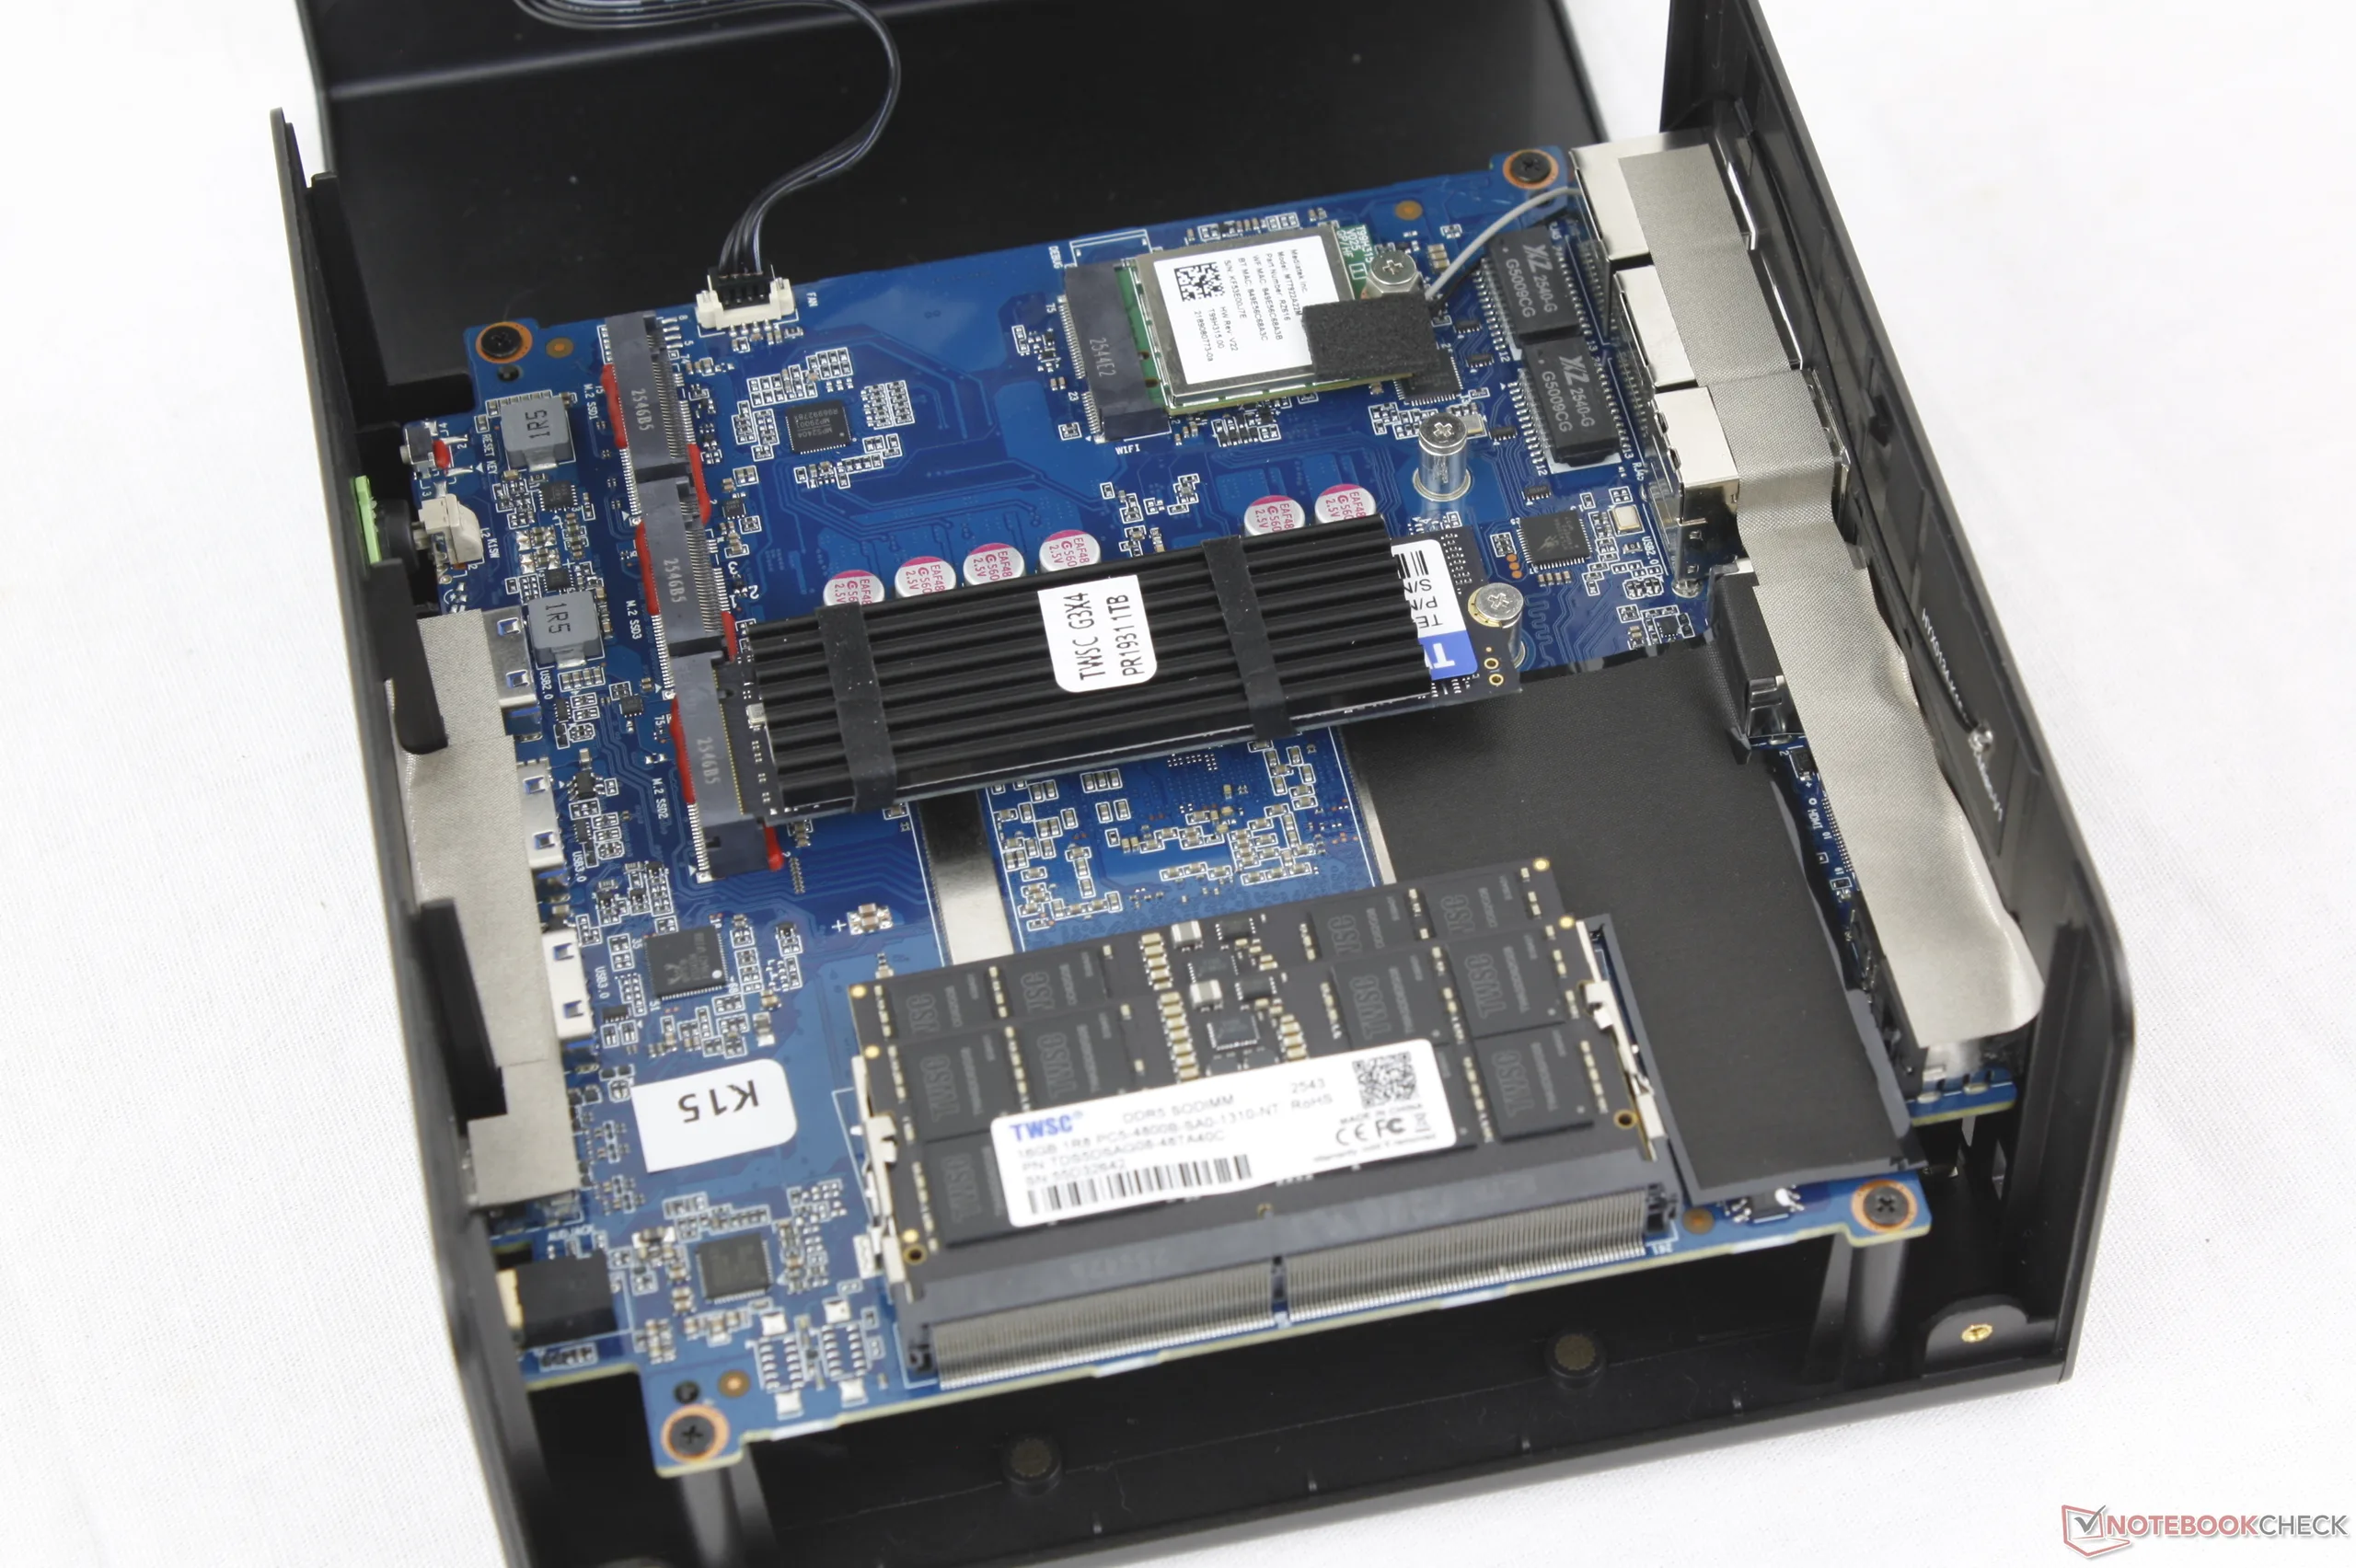
Konserwacja
Serwisowanie wymaga jedynie śrubokręta krzyżakowego, aby uzyskać dostęp do trzech gniazd M.2 SSD i dwóch gniazd DDR5 SODIMM
Zrównoważony rozwój
Producent nie twierdzi, że do produkcji użyto materiałów pochodzących z recyklingu. Samo pudełko detaliczne jest owinięte plastikiem, ale nie ma w nim żadnych dodatkowych tworzyw sztucznych.
Akcesoria i gwarancja
Pudełko detaliczne zawiera kabel HDMI i śruby VESA, a także zwykłą dokumentację i zasilacz. W przypadku zakupu w Stanach Zjednoczonych obowiązuje standardowa roczna ograniczona gwarancja producenta.
Wydajność
Warunki testowania
Przed uruchomieniem poniższych testów porównawczych ustawiliśmy profil zasilania systemu Windows na tryb wydajności.
Procesor
Procesor Core Ultra 5 125U działa bardzo podobnie do Core Ultra 7 258V w droższym MSI Cubi NUC AI+ 2MG, jeśli chodzi o wydajność wielowątkową. W przypadku wydajności jednowątkowej, grafiki lub NPU, procesor Meteor Lake pozostaje jednak dość znacząco w tyle w stosunku do nowszego układu Lunar Lake-V.
Cinebench R15 Multi Loop
Cinebench R23: Multi Core | Single Core
Cinebench R20: CPU (Multi Core) | CPU (Single Core)
Cinebench R15: CPU Multi 64Bit | CPU Single 64Bit
Blender: v2.79 BMW27 CPU
7-Zip 18.03: 7z b 4 | 7z b 4 -mmt1
Geekbench 6.7: Multi-Core | Single-Core
Geekbench 5.5: Multi-Core | Single-Core
HWBOT x265 Benchmark v2.2: 4k Preset
LibreOffice : 20 Documents To PDF
R Benchmark 2.5: Overall mean
| CPU Performance rating | |
| Beelink GTI15 Ultra | |
| Asus ExpertCenter PN54-S70012NN | |
| BOSGAME M2 | |
| Beelink SER9 Pro | |
| GMK NucBox K12 | |
| GMK NucBox M6 Ultra | |
| MSI Cubi NUC AI+ 2MG | |
| GMK NucBox M3 Ultra | |
| GMK NucBox K15 | |
| Przeciętny Intel Core Ultra 5 125U | |
| GMK NucBox M8 | |
| NiPoGi AM06 Pro | |
| Cinebench R23 / Multi Core | |
| Beelink GTI15 Ultra | |
| Asus ExpertCenter PN54-S70012NN | |
| Beelink SER9 Pro | |
| BOSGAME M2 | |
| GMK NucBox K12 | |
| GMK NucBox M6 Ultra | |
| MSI Cubi NUC AI+ 2MG | |
| GMK NucBox M3 Ultra | |
| GMK NucBox K15 | |
| Przeciętny Intel Core Ultra 5 125U (6650 - 10483, n=9) | |
| GMK NucBox M8 | |
| NiPoGi AM06 Pro | |
| Cinebench R23 / Single Core | |
| Beelink GTI15 Ultra | |
| Asus ExpertCenter PN54-S70012NN | |
| MSI Cubi NUC AI+ 2MG | |
| GMK NucBox M3 Ultra | |
| BOSGAME M2 | |
| Beelink SER9 Pro | |
| GMK NucBox M6 Ultra | |
| GMK NucBox K12 | |
| GMK NucBox K15 | |
| Przeciętny Intel Core Ultra 5 125U (1534 - 1595, n=9) | |
| GMK NucBox M8 | |
| NiPoGi AM06 Pro | |
| Cinebench R20 / CPU (Multi Core) | |
| Beelink GTI15 Ultra | |
| Asus ExpertCenter PN54-S70012NN | |
| Beelink SER9 Pro | |
| BOSGAME M2 | |
| GMK NucBox K12 | |
| GMK NucBox M6 Ultra | |
| MSI Cubi NUC AI+ 2MG | |
| GMK NucBox M3 Ultra | |
| GMK NucBox K15 | |
| GMK NucBox M8 | |
| Przeciętny Intel Core Ultra 5 125U (2558 - 4033, n=9) | |
| NiPoGi AM06 Pro | |
| Cinebench R20 / CPU (Single Core) | |
| Beelink GTI15 Ultra | |
| Asus ExpertCenter PN54-S70012NN | |
| MSI Cubi NUC AI+ 2MG | |
| GMK NucBox M3 Ultra | |
| BOSGAME M2 | |
| Beelink SER9 Pro | |
| GMK NucBox M6 Ultra | |
| GMK NucBox K12 | |
| GMK NucBox K15 | |
| Przeciętny Intel Core Ultra 5 125U (592 - 614, n=9) | |
| GMK NucBox M8 | |
| NiPoGi AM06 Pro | |
| Cinebench R15 / CPU Multi 64Bit | |
| Asus ExpertCenter PN54-S70012NN | |
| Beelink GTI15 Ultra | |
| Beelink SER9 Pro | |
| BOSGAME M2 | |
| GMK NucBox K12 | |
| GMK NucBox M6 Ultra | |
| Przeciętny Intel Core Ultra 5 125U (1117 - 1680, n=9) | |
| GMK NucBox M8 | |
| GMK NucBox M3 Ultra | |
| GMK NucBox K15 | |
| MSI Cubi NUC AI+ 2MG | |
| NiPoGi AM06 Pro | |
| Cinebench R15 / CPU Single 64Bit | |
| Beelink GTI15 Ultra | |
| Asus ExpertCenter PN54-S70012NN | |
| MSI Cubi NUC AI+ 2MG | |
| Beelink SER9 Pro | |
| GMK NucBox M6 Ultra | |
| GMK NucBox K12 | |
| BOSGAME M2 | |
| GMK NucBox M3 Ultra | |
| GMK NucBox M8 | |
| GMK NucBox K15 | |
| Przeciętny Intel Core Ultra 5 125U (222 - 231, n=9) | |
| NiPoGi AM06 Pro | |
| Blender / v2.79 BMW27 CPU | |
| NiPoGi AM06 Pro | |
| Przeciętny Intel Core Ultra 5 125U (326 - 485, n=10) | |
| MSI Cubi NUC AI+ 2MG | |
| GMK NucBox M8 | |
| GMK NucBox K15 | |
| GMK NucBox M3 Ultra | |
| GMK NucBox M6 Ultra | |
| GMK NucBox K12 | |
| BOSGAME M2 | |
| Beelink SER9 Pro | |
| Asus ExpertCenter PN54-S70012NN | |
| Beelink GTI15 Ultra | |
| 7-Zip 18.03 / 7z b 4 | |
| Beelink SER9 Pro | |
| BOSGAME M2 | |
| GMK NucBox K12 | |
| Beelink GTI15 Ultra | |
| GMK NucBox M6 Ultra | |
| Asus ExpertCenter PN54-S70012NN | |
| GMK NucBox M3 Ultra | |
| GMK NucBox M8 | |
| GMK NucBox K15 | |
| Przeciętny Intel Core Ultra 5 125U (28563 - 41152, n=9) | |
| NiPoGi AM06 Pro | |
| MSI Cubi NUC AI+ 2MG | |
| 7-Zip 18.03 / 7z b 4 -mmt1 | |
| GMK NucBox M6 Ultra | |
| BOSGAME M2 | |
| GMK NucBox K12 | |
| Beelink SER9 Pro | |
| Beelink GTI15 Ultra | |
| GMK NucBox M3 Ultra | |
| MSI Cubi NUC AI+ 2MG | |
| Asus ExpertCenter PN54-S70012NN | |
| GMK NucBox M8 | |
| Przeciętny Intel Core Ultra 5 125U (4474 - 4659, n=9) | |
| GMK NucBox K15 | |
| NiPoGi AM06 Pro | |
| Geekbench 6.7 / Multi-Core | |
| Beelink GTI15 Ultra | |
| Asus ExpertCenter PN54-S70012NN | |
| BOSGAME M2 | |
| Beelink SER9 Pro | |
| GMK NucBox K12 | |
| GMK NucBox M6 Ultra | |
| Przeciętny Intel Core Ultra 5 125U (8384 - 9601, n=9) | |
| MSI Cubi NUC AI+ 2MG | |
| GMK NucBox K15 | |
| GMK NucBox M3 Ultra | |
| GMK NucBox M8 | |
| NiPoGi AM06 Pro | |
| Geekbench 6.7 / Single-Core | |
| Beelink GTI15 Ultra | |
| Asus ExpertCenter PN54-S70012NN | |
| MSI Cubi NUC AI+ 2MG | |
| BOSGAME M2 | |
| Beelink SER9 Pro | |
| GMK NucBox M6 Ultra | |
| GMK NucBox K12 | |
| GMK NucBox M3 Ultra | |
| GMK NucBox K15 | |
| Przeciętny Intel Core Ultra 5 125U (2129 - 2177, n=9) | |
| GMK NucBox M8 | |
| NiPoGi AM06 Pro | |
| Geekbench 5.5 / Multi-Core | |
| Beelink GTI15 Ultra | |
| BOSGAME M2 | |
| Asus ExpertCenter PN54-S70012NN | |
| Beelink SER9 Pro | |
| GMK NucBox K12 | |
| GMK NucBox M6 Ultra | |
| GMK NucBox M3 Ultra | |
| Przeciętny Intel Core Ultra 5 125U (7417 - 8581, n=9) | |
| GMK NucBox K15 | |
| MSI Cubi NUC AI+ 2MG | |
| GMK NucBox M8 | |
| NiPoGi AM06 Pro | |
| Geekbench 5.5 / Single-Core | |
| Beelink GTI15 Ultra | |
| Asus ExpertCenter PN54-S70012NN | |
| MSI Cubi NUC AI+ 2MG | |
| BOSGAME M2 | |
| GMK NucBox K12 | |
| GMK NucBox M6 Ultra | |
| Beelink SER9 Pro | |
| GMK NucBox M3 Ultra | |
| GMK NucBox K15 | |
| Przeciętny Intel Core Ultra 5 125U (1531 - 1607, n=9) | |
| GMK NucBox M8 | |
| NiPoGi AM06 Pro | |
| HWBOT x265 Benchmark v2.2 / 4k Preset | |
| Beelink GTI15 Ultra | |
| BOSGAME M2 | |
| Asus ExpertCenter PN54-S70012NN | |
| Beelink SER9 Pro | |
| GMK NucBox K12 | |
| GMK NucBox M6 Ultra | |
| MSI Cubi NUC AI+ 2MG | |
| GMK NucBox M8 | |
| GMK NucBox M3 Ultra | |
| GMK NucBox K15 | |
| Przeciętny Intel Core Ultra 5 125U (7.26 - 12, n=9) | |
| NiPoGi AM06 Pro | |
| LibreOffice / 20 Documents To PDF | |
| GMK NucBox M6 Ultra | |
| NiPoGi AM06 Pro | |
| GMK NucBox M8 | |
| GMK NucBox K15 | |
| GMK NucBox M3 Ultra | |
| GMK NucBox K12 | |
| Przeciętny Intel Core Ultra 5 125U (45.5 - 62.8, n=9) | |
| Beelink SER9 Pro | |
| Asus ExpertCenter PN54-S70012NN | |
| MSI Cubi NUC AI+ 2MG | |
| BOSGAME M2 | |
| Beelink GTI15 Ultra | |
| R Benchmark 2.5 / Overall mean | |
| NiPoGi AM06 Pro | |
| Przeciętny Intel Core Ultra 5 125U (0.526 - 0.558, n=9) | |
| GMK NucBox M8 | |
| GMK NucBox K15 | |
| Beelink SER9 Pro | |
| GMK NucBox M3 Ultra | |
| GMK NucBox M6 Ultra | |
| GMK NucBox K12 | |
| MSI Cubi NUC AI+ 2MG | |
| Beelink GTI15 Ultra | |
| BOSGAME M2 | |
| Asus ExpertCenter PN54-S70012NN | |
* ... im mniej tym lepiej
AIDA64: FP32 Ray-Trace | FPU Julia | CPU SHA3 | CPU Queen | FPU SinJulia | FPU Mandel | CPU AES | CPU ZLib | FP64 Ray-Trace | CPU PhotoWorxx
| Performance rating | |
| BOSGAME M2 | |
| Beelink SER9 Pro | |
| GMK NucBox K12 | |
| MSI Cubi NUC AI+ 2MG | |
| NiPoGi AM06 Pro | |
| Przeciętny Intel Core Ultra 5 125U | |
| GMK NucBox K15 | |
| AIDA64 / FP32 Ray-Trace | |
| BOSGAME M2 | |
| Beelink SER9 Pro | |
| GMK NucBox K12 | |
| MSI Cubi NUC AI+ 2MG | |
| NiPoGi AM06 Pro | |
| Przeciętny Intel Core Ultra 5 125U (5784 - 9282, n=9) | |
| GMK NucBox K15 | |
| AIDA64 / FPU Julia | |
| BOSGAME M2 | |
| Beelink SER9 Pro | |
| GMK NucBox K12 | |
| MSI Cubi NUC AI+ 2MG | |
| NiPoGi AM06 Pro | |
| Przeciętny Intel Core Ultra 5 125U (29578 - 47366, n=9) | |
| GMK NucBox K15 | |
| AIDA64 / CPU SHA3 | |
| BOSGAME M2 | |
| Beelink SER9 Pro | |
| GMK NucBox K12 | |
| MSI Cubi NUC AI+ 2MG | |
| Przeciętny Intel Core Ultra 5 125U (1565 - 2669, n=9) | |
| GMK NucBox K15 | |
| NiPoGi AM06 Pro | |
| AIDA64 / CPU Queen | |
| BOSGAME M2 | |
| Beelink SER9 Pro | |
| GMK NucBox K12 | |
| NiPoGi AM06 Pro | |
| MSI Cubi NUC AI+ 2MG | |
| Przeciętny Intel Core Ultra 5 125U (44385 - 47868, n=9) | |
| GMK NucBox K15 | |
| AIDA64 / FPU SinJulia | |
| BOSGAME M2 | |
| Beelink SER9 Pro | |
| GMK NucBox K12 | |
| NiPoGi AM06 Pro | |
| GMK NucBox K15 | |
| Przeciętny Intel Core Ultra 5 125U (4390 - 5507, n=9) | |
| MSI Cubi NUC AI+ 2MG | |
| AIDA64 / FPU Mandel | |
| BOSGAME M2 | |
| Beelink SER9 Pro | |
| GMK NucBox K12 | |
| MSI Cubi NUC AI+ 2MG | |
| NiPoGi AM06 Pro | |
| Przeciętny Intel Core Ultra 5 125U (14563 - 24922, n=9) | |
| GMK NucBox K15 | |
| AIDA64 / CPU AES | |
| BOSGAME M2 | |
| Beelink SER9 Pro | |
| GMK NucBox K12 | |
| Przeciętny Intel Core Ultra 5 125U (33640 - 48114, n=9) | |
| GMK NucBox K15 | |
| MSI Cubi NUC AI+ 2MG | |
| NiPoGi AM06 Pro | |
| AIDA64 / CPU ZLib | |
| Beelink SER9 Pro | |
| BOSGAME M2 | |
| GMK NucBox K12 | |
| Przeciętny Intel Core Ultra 5 125U (457 - 779, n=9) | |
| GMK NucBox K15 | |
| MSI Cubi NUC AI+ 2MG | |
| NiPoGi AM06 Pro | |
| AIDA64 / FP64 Ray-Trace | |
| BOSGAME M2 | |
| Beelink SER9 Pro | |
| GMK NucBox K12 | |
| MSI Cubi NUC AI+ 2MG | |
| NiPoGi AM06 Pro | |
| Przeciętny Intel Core Ultra 5 125U (2904 - 4846, n=9) | |
| GMK NucBox K15 | |
| AIDA64 / CPU PhotoWorxx | |
| MSI Cubi NUC AI+ 2MG | |
| GMK NucBox K15 | |
| Beelink SER9 Pro | |
| BOSGAME M2 | |
| GMK NucBox K12 | |
| Przeciętny Intel Core Ultra 5 125U (24082 - 47875, n=9) | |
| NiPoGi AM06 Pro | |
Wydajność systemu
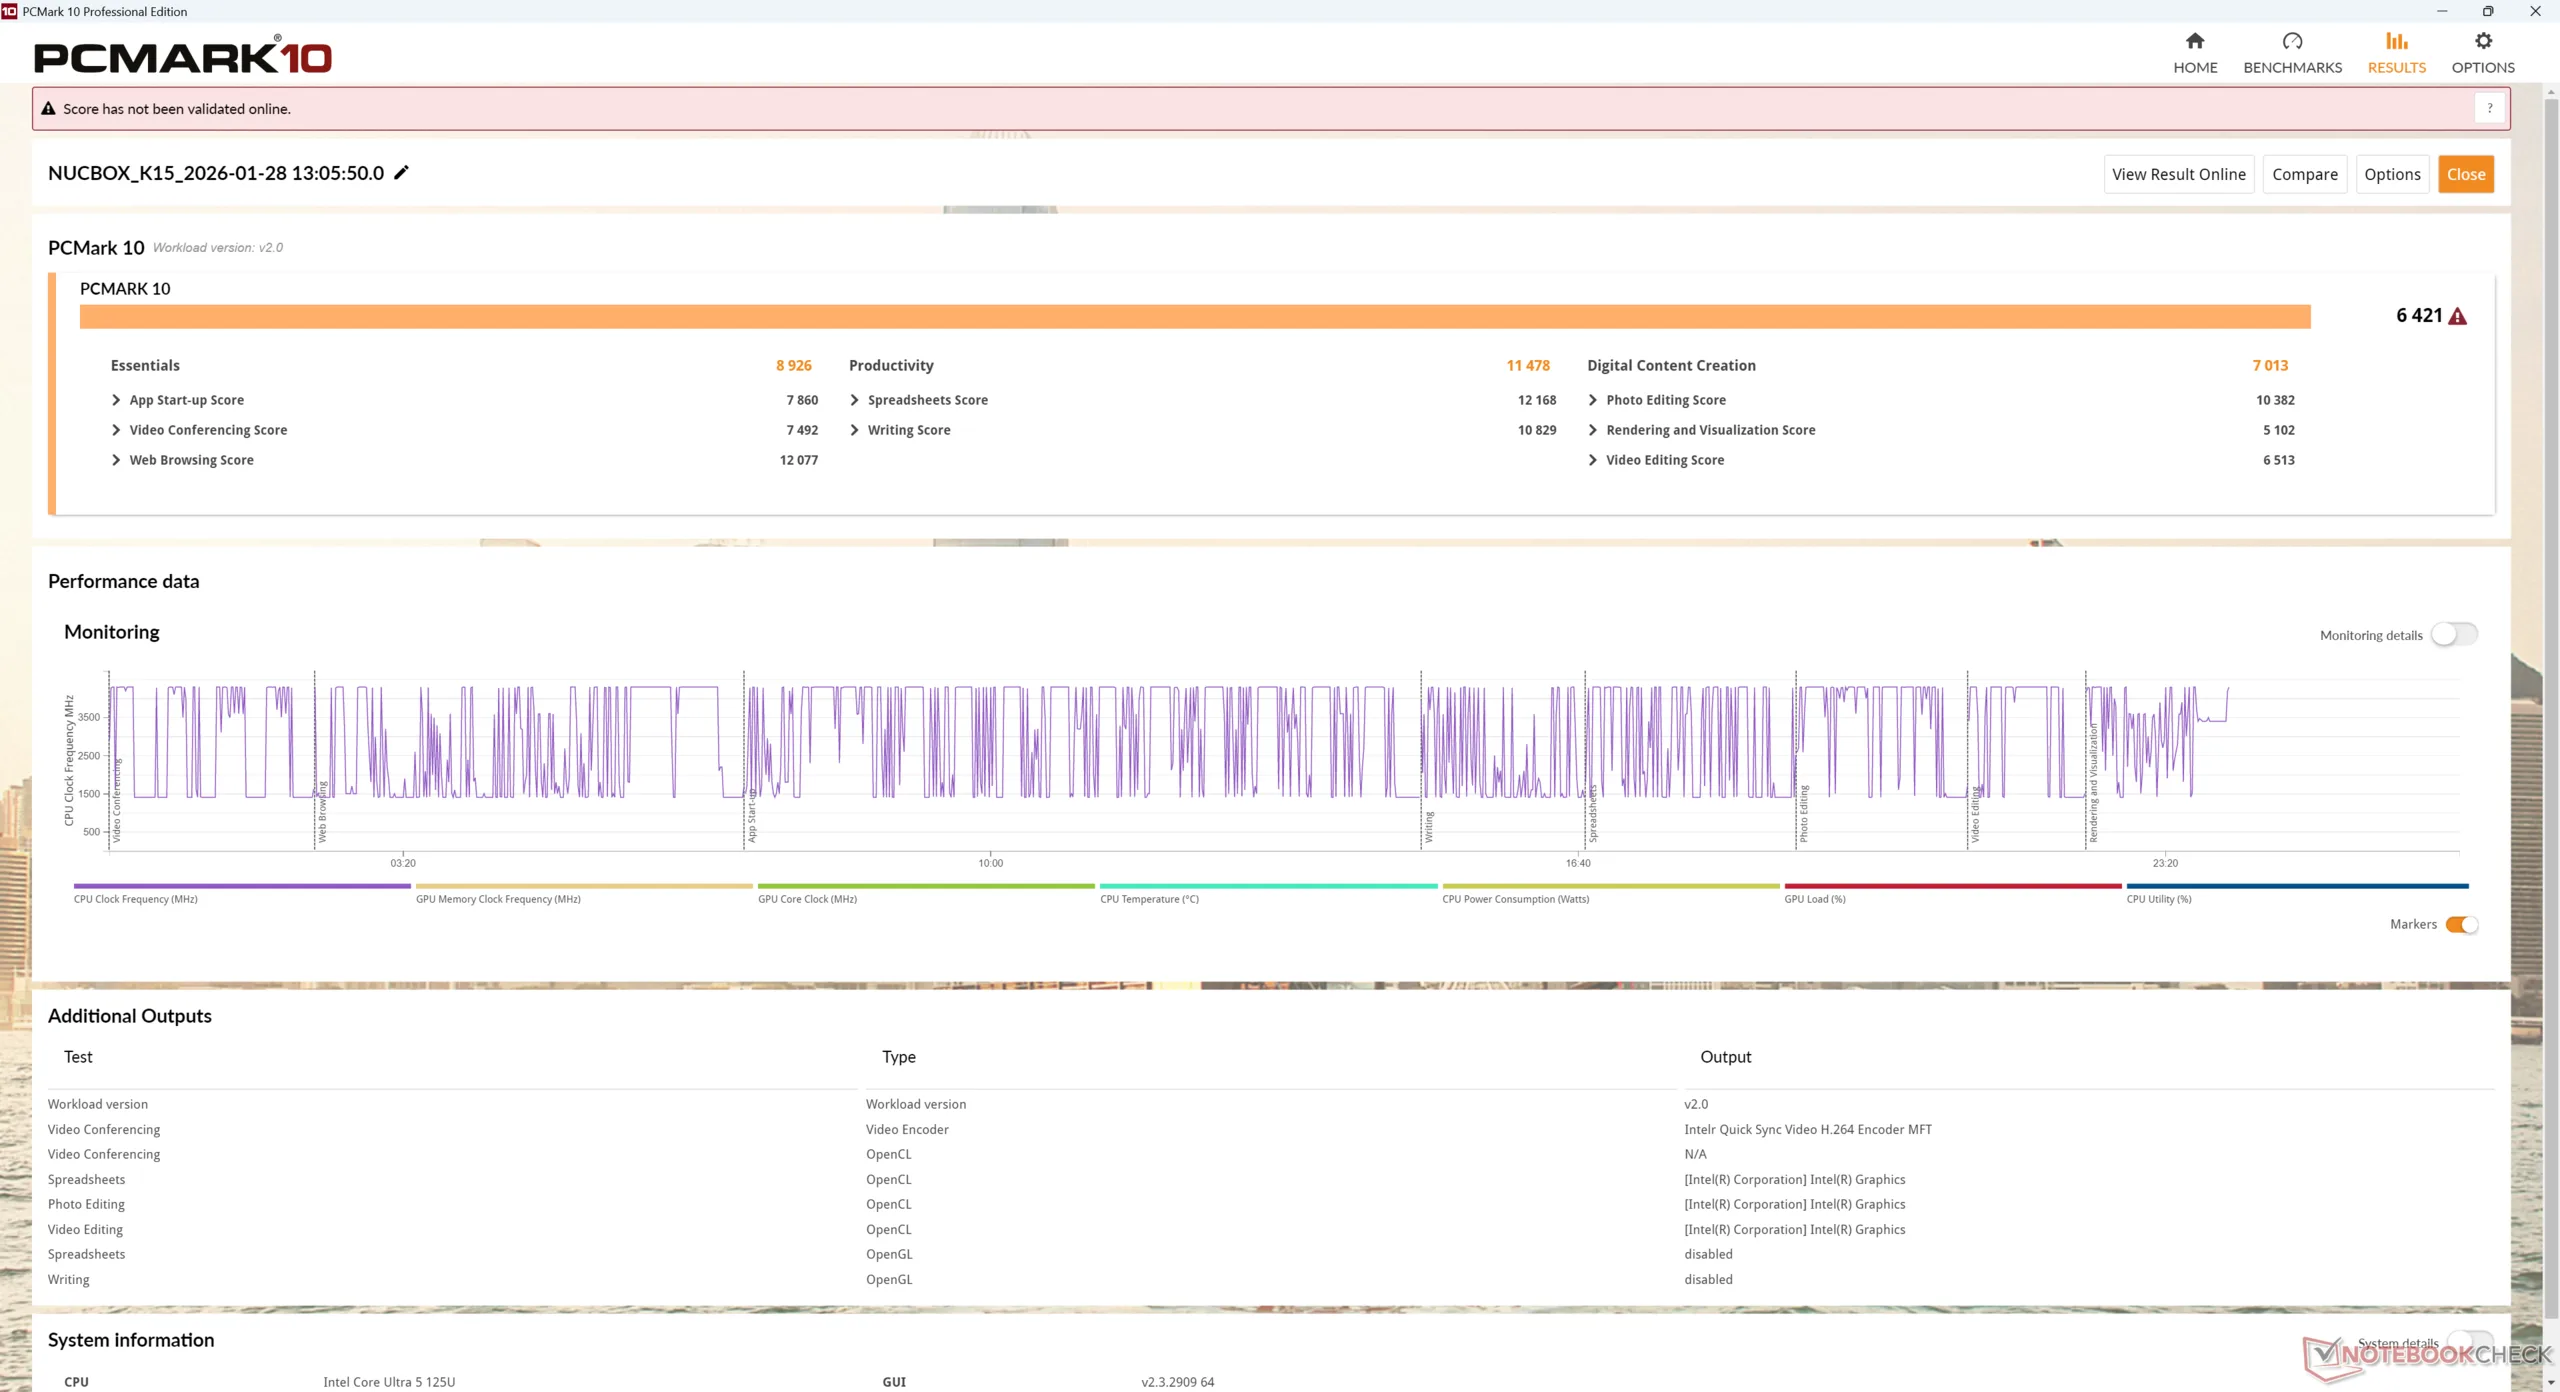
PCMark 10: Score | Essentials | Productivity | Digital Content Creation
CrossMark: Overall | Productivity | Creativity | Responsiveness
WebXPRT 3: Overall
WebXPRT 4: Overall
Mozilla Kraken 1.1: Total
| Performance rating | |
| BOSGAME M2 | |
| Beelink SER9 Pro | |
| GMK NucBox K12 | |
| MSI Cubi NUC AI+ 2MG | |
| GMK NucBox K15 | |
| Przeciętny Intel Core Ultra 5 125U, Intel Graphics 4-Core iGPU (Meteor / Arrow Lake) | |
| NiPoGi AM06 Pro | |
| PCMark 10 / Score | |
| BOSGAME M2 | |
| GMK NucBox K12 | |
| Beelink SER9 Pro | |
| MSI Cubi NUC AI+ 2MG | |
| GMK NucBox K15 | |
| Przeciętny Intel Core Ultra 5 125U, Intel Graphics 4-Core iGPU (Meteor / Arrow Lake) (5639 - 6421, n=9) | |
| NiPoGi AM06 Pro | |
| PCMark 10 / Essentials | |
| BOSGAME M2 | |
| GMK NucBox K12 | |
| Beelink SER9 Pro | |
| MSI Cubi NUC AI+ 2MG | |
| Przeciętny Intel Core Ultra 5 125U, Intel Graphics 4-Core iGPU (Meteor / Arrow Lake) (8926 - 10827, n=9) | |
| GMK NucBox K15 | |
| NiPoGi AM06 Pro | |
| PCMark 10 / Productivity | |
| GMK NucBox K15 | |
| BOSGAME M2 | |
| GMK NucBox K12 | |
| Beelink SER9 Pro | |
| MSI Cubi NUC AI+ 2MG | |
| Przeciętny Intel Core Ultra 5 125U, Intel Graphics 4-Core iGPU (Meteor / Arrow Lake) (7548 - 11478, n=9) | |
| NiPoGi AM06 Pro | |
| PCMark 10 / Digital Content Creation | |
| BOSGAME M2 | |
| MSI Cubi NUC AI+ 2MG | |
| Beelink SER9 Pro | |
| GMK NucBox K12 | |
| GMK NucBox K15 | |
| Przeciętny Intel Core Ultra 5 125U, Intel Graphics 4-Core iGPU (Meteor / Arrow Lake) (6367 - 7087, n=9) | |
| NiPoGi AM06 Pro | |
| CrossMark / Overall | |
| Beelink SER9 Pro | |
| GMK NucBox K12 | |
| BOSGAME M2 | |
| MSI Cubi NUC AI+ 2MG | |
| GMK NucBox K15 | |
| Przeciętny Intel Core Ultra 5 125U, Intel Graphics 4-Core iGPU (Meteor / Arrow Lake) (1363 - 1648, n=9) | |
| NiPoGi AM06 Pro | |
| CrossMark / Productivity | |
| Beelink SER9 Pro | |
| GMK NucBox K12 | |
| BOSGAME M2 | |
| MSI Cubi NUC AI+ 2MG | |
| GMK NucBox K15 | |
| Przeciętny Intel Core Ultra 5 125U, Intel Graphics 4-Core iGPU (Meteor / Arrow Lake) (1310 - 1467, n=9) | |
| NiPoGi AM06 Pro | |
| CrossMark / Creativity | |
| BOSGAME M2 | |
| Beelink SER9 Pro | |
| GMK NucBox K12 | |
| MSI Cubi NUC AI+ 2MG | |
| GMK NucBox K15 | |
| Przeciętny Intel Core Ultra 5 125U, Intel Graphics 4-Core iGPU (Meteor / Arrow Lake) (1433 - 1561, n=9) | |
| NiPoGi AM06 Pro | |
| CrossMark / Responsiveness | |
| Beelink SER9 Pro | |
| GMK NucBox K12 | |
| BOSGAME M2 | |
| GMK NucBox K15 | |
| MSI Cubi NUC AI+ 2MG | |
| Przeciętny Intel Core Ultra 5 125U, Intel Graphics 4-Core iGPU (Meteor / Arrow Lake) (1066 - 1443, n=9) | |
| NiPoGi AM06 Pro | |
| WebXPRT 3 / Overall | |
| BOSGAME M2 | |
| MSI Cubi NUC AI+ 2MG | |
| Beelink SER9 Pro | |
| GMK NucBox K12 | |
| GMK NucBox K15 | |
| Przeciętny Intel Core Ultra 5 125U, Intel Graphics 4-Core iGPU (Meteor / Arrow Lake) (237 - 260, n=9) | |
| NiPoGi AM06 Pro | |
| WebXPRT 4 / Overall | |
| MSI Cubi NUC AI+ 2MG | |
| BOSGAME M2 | |
| Beelink SER9 Pro | |
| GMK NucBox K12 | |
| Przeciętny Intel Core Ultra 5 125U, Intel Graphics 4-Core iGPU (Meteor / Arrow Lake) (224 - 231, n=9) | |
| GMK NucBox K15 | |
| NiPoGi AM06 Pro | |
| Mozilla Kraken 1.1 / Total | |
| NiPoGi AM06 Pro | |
| Przeciętny Intel Core Ultra 5 125U, Intel Graphics 4-Core iGPU (Meteor / Arrow Lake) (579 - 594, n=9) | |
| GMK NucBox K15 | |
| GMK NucBox K12 | |
| Beelink SER9 Pro | |
| BOSGAME M2 | |
| MSI Cubi NUC AI+ 2MG | |
* ... im mniej tym lepiej
| PCMark 10 Score | 6421 pkt. | |
Pomoc | ||
| AIDA64 / Memory Copy | |
| MSI Cubi NUC AI+ 2MG | |
| Beelink SER9 Pro | |
| BOSGAME M2 | |
| GMK NucBox K12 | |
| Przeciętny Intel Core Ultra 5 125U (35467 - 82786, n=9) | |
| GMK NucBox K15 | |
| NiPoGi AM06 Pro | |
| AIDA64 / Memory Read | |
| MSI Cubi NUC AI+ 2MG | |
| BOSGAME M2 | |
| GMK NucBox K12 | |
| GMK NucBox K15 | |
| Beelink SER9 Pro | |
| Przeciętny Intel Core Ultra 5 125U (38849 - 63159, n=9) | |
| NiPoGi AM06 Pro | |
| AIDA64 / Memory Write | |
| MSI Cubi NUC AI+ 2MG | |
| Beelink SER9 Pro | |
| BOSGAME M2 | |
| GMK NucBox K12 | |
| GMK NucBox K15 | |
| Przeciętny Intel Core Ultra 5 125U (36830 - 63484, n=9) | |
| NiPoGi AM06 Pro | |
| AIDA64 / Memory Latency | |
| GMK NucBox K15 | |
| Przeciętny Intel Core Ultra 5 125U (125.5 - 159.1, n=9) | |
| Beelink SER9 Pro | |
| BOSGAME M2 | |
| NiPoGi AM06 Pro | |
| MSI Cubi NUC AI+ 2MG | |
| GMK NucBox K12 | |
* ... im mniej tym lepiej
Opóźnienie DPC
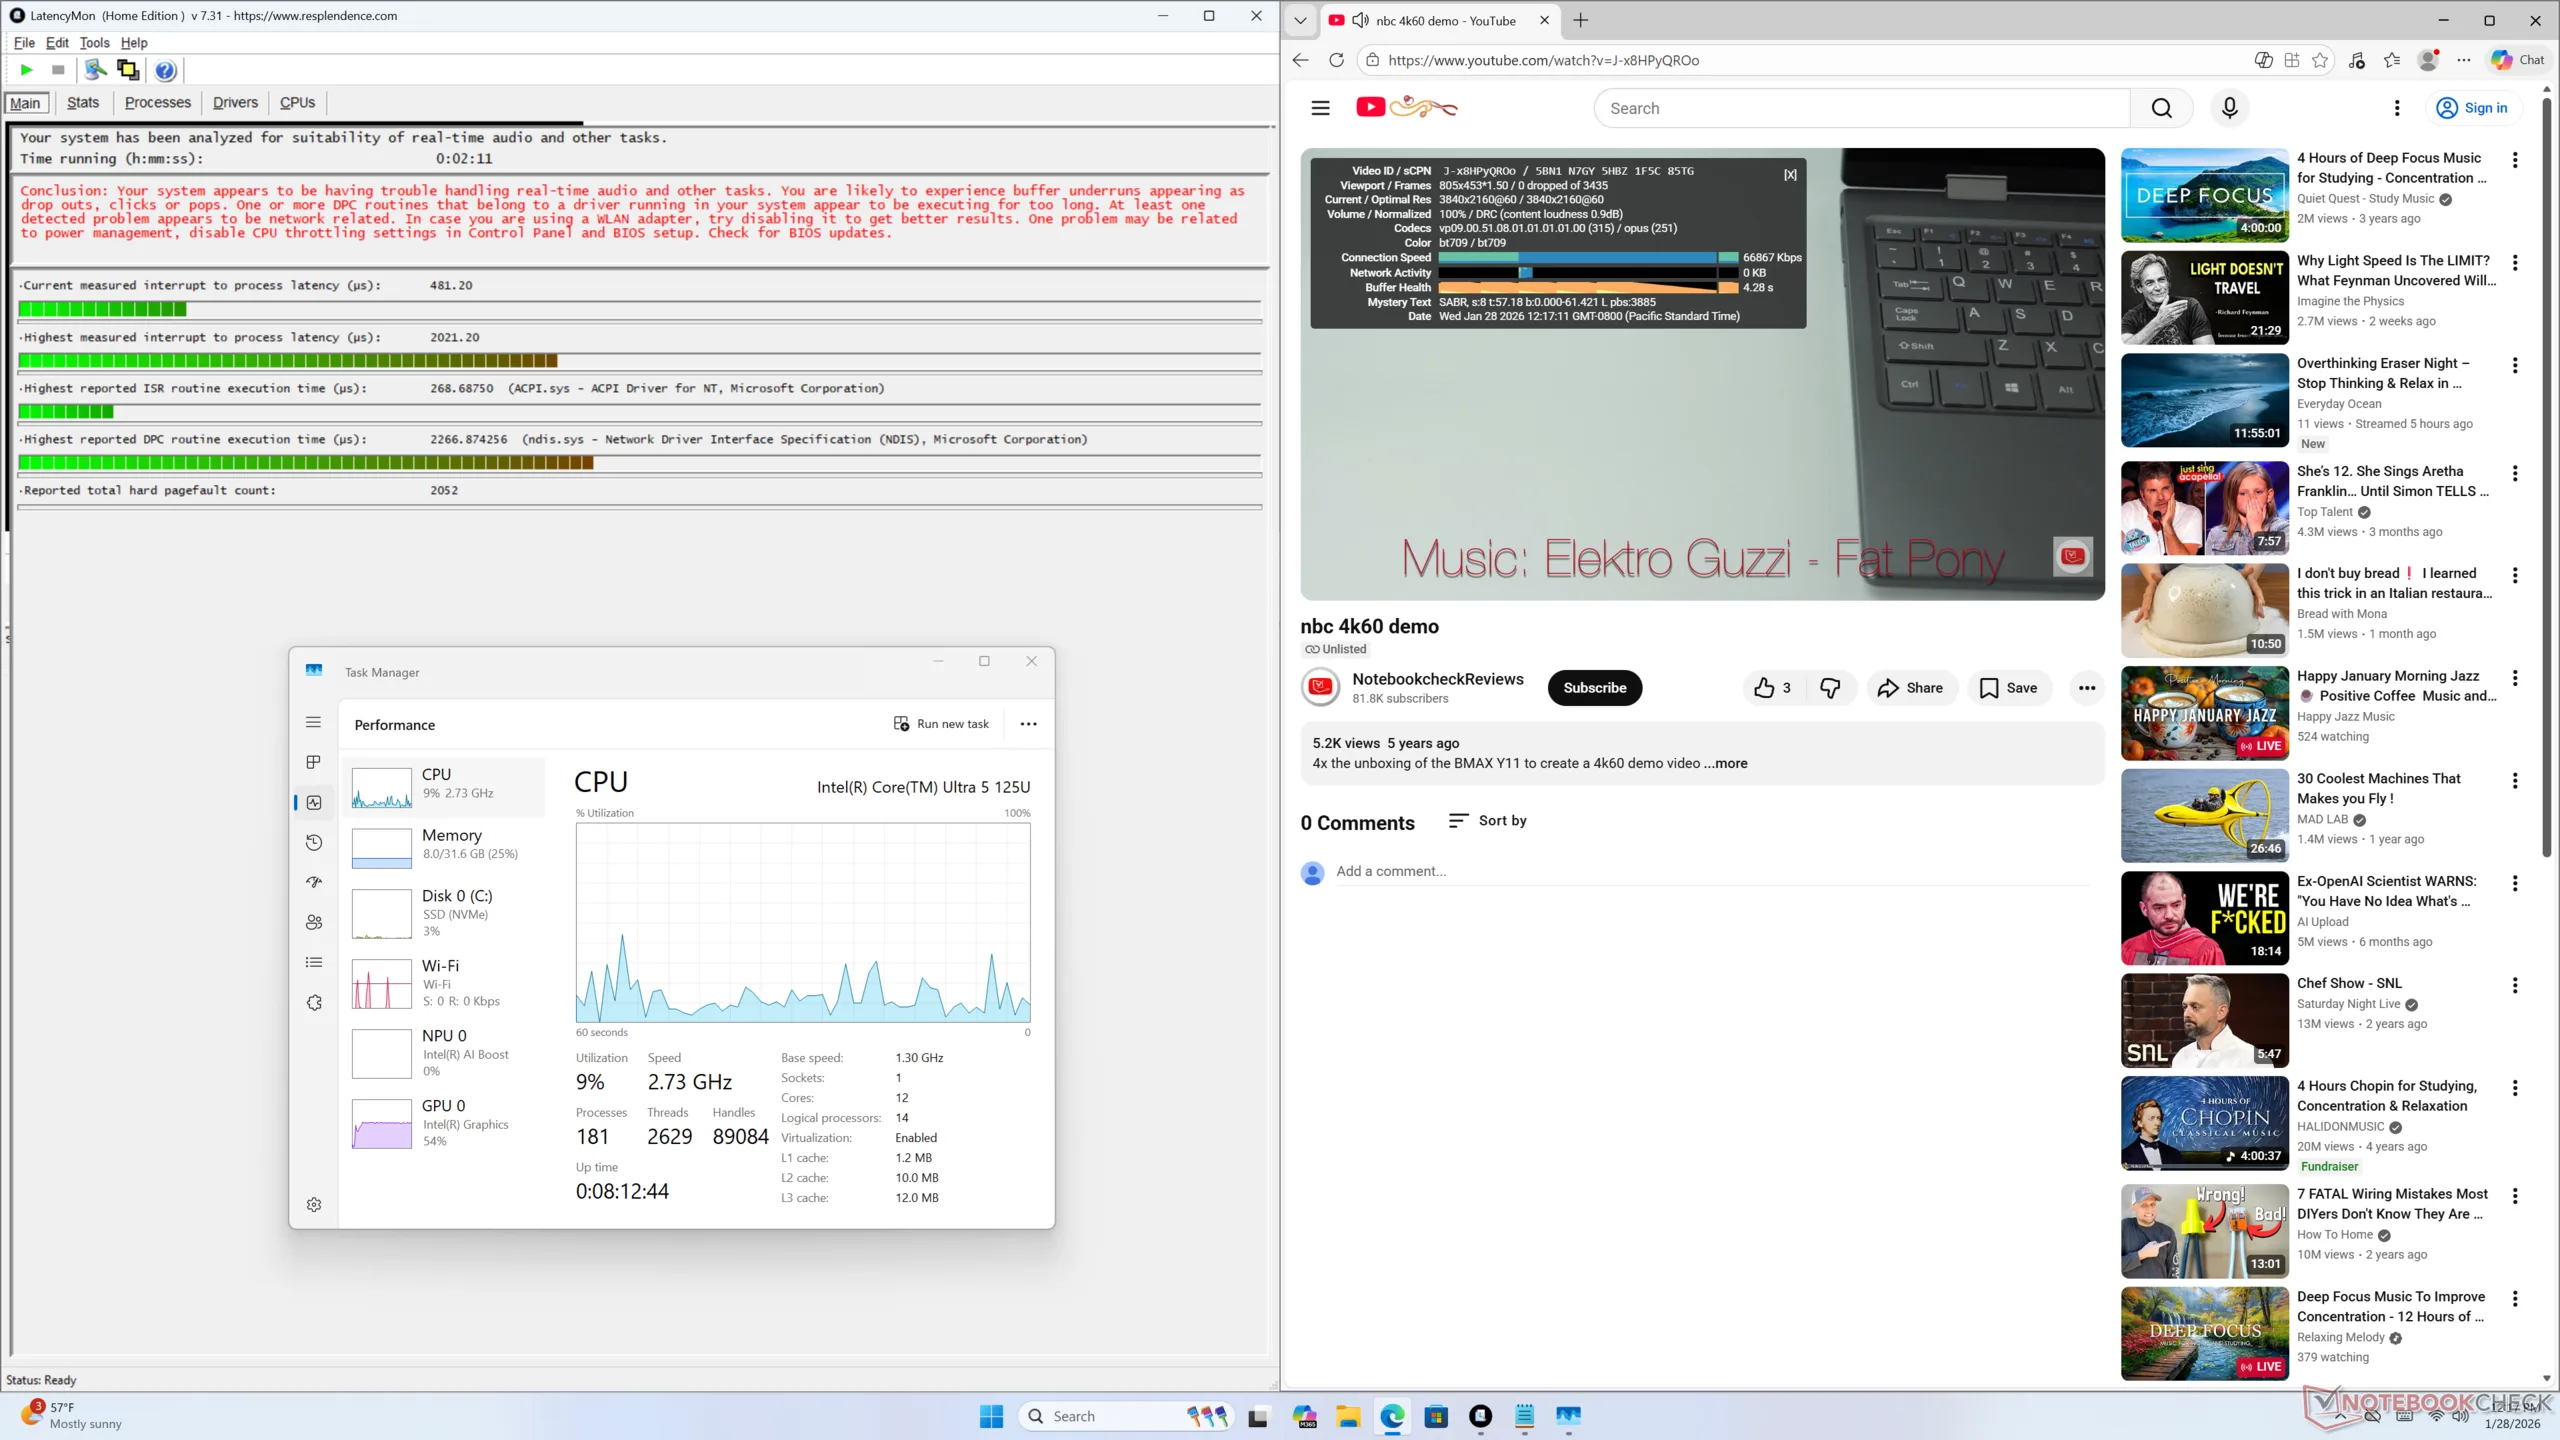
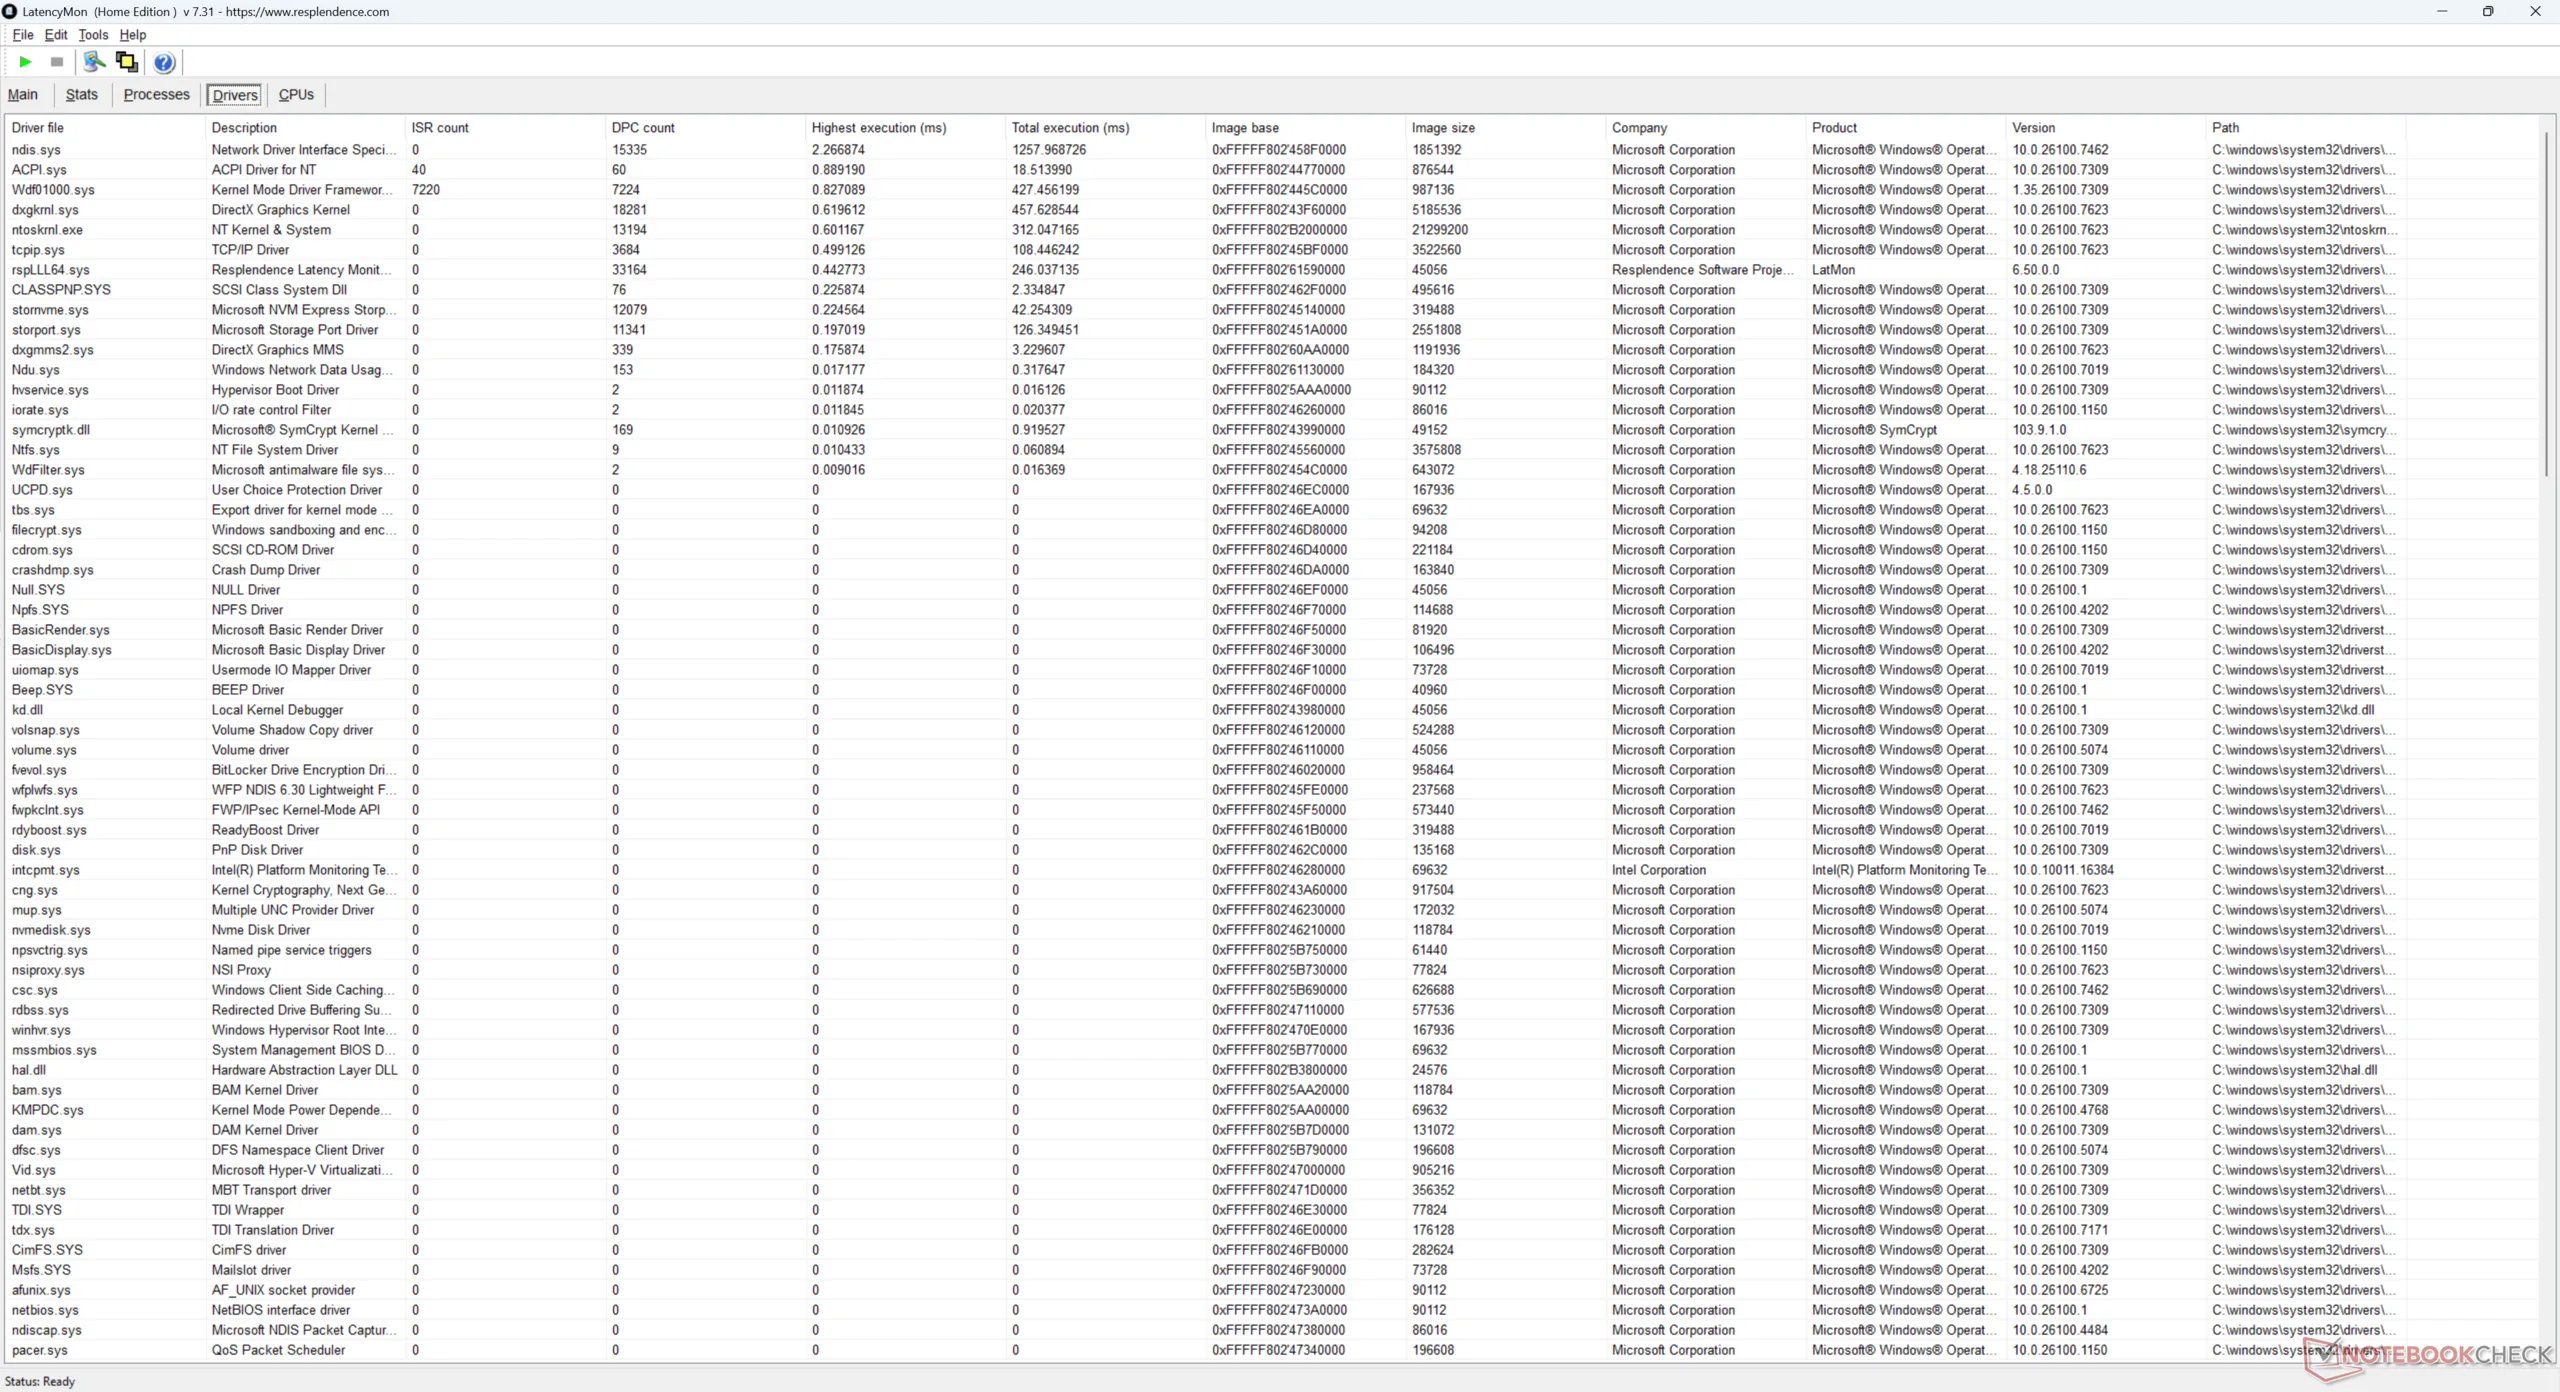
| DPC Latencies / LatencyMon - interrupt to process latency (max), Web, Youtube, Prime95 | |
| GMK NucBox K15 | |
| NiPoGi AM06 Pro | |
| GMK NucBox K12 | |
| MSI Cubi NUC AI+ 2MG | |
| BOSGAME M2 | |
| Beelink SER9 Pro | |
* ... im mniej tym lepiej
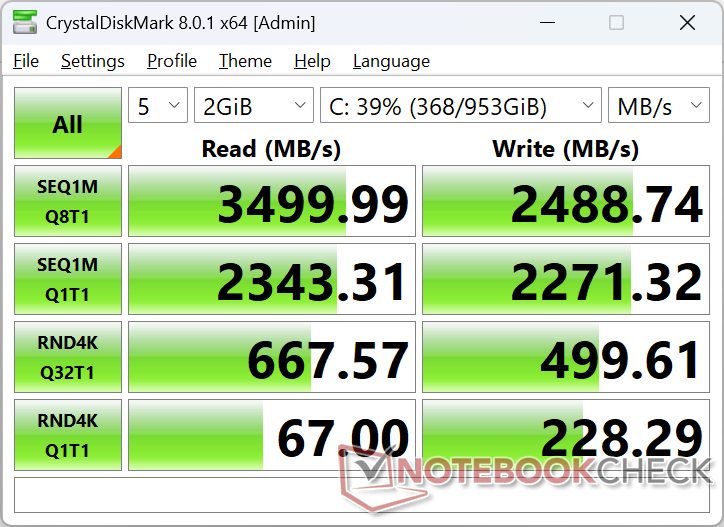
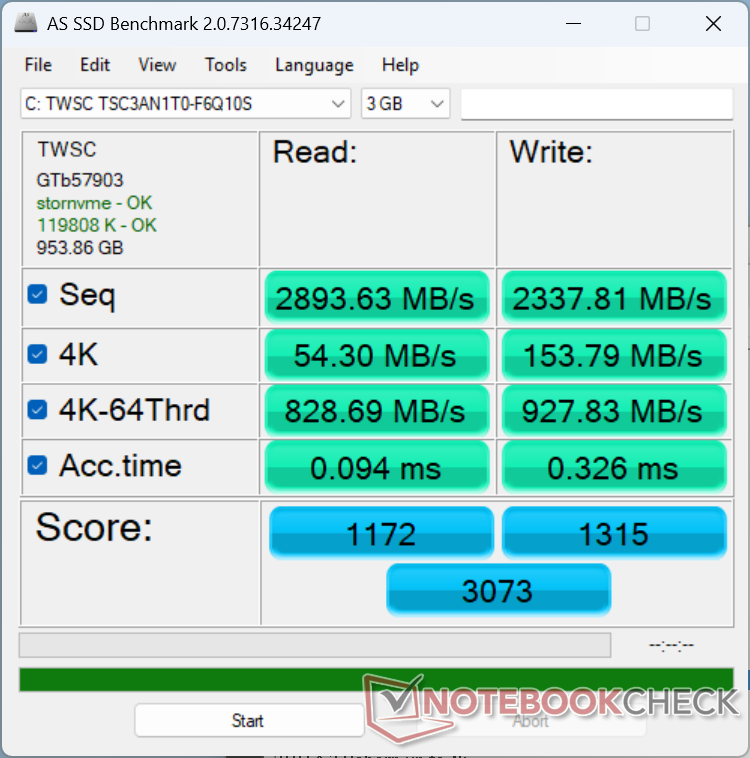
Urządzenia pamięci masowej
GMK dostarcza to samo TWSC TSC3AN1T0-F6Q10S średniej klasy PCIe4 x4 NVMe SSD, który można znaleźć w NucBox M7 Ultra dla NucBox K15.

| Drive Performance rating - Percent | |
| BOSGAME M2 | |
| Beelink SER9 Pro | |
| GMK NucBox K12 | |
| MSI Cubi NUC AI+ 2MG | |
| GMK NucBox K15 | |
| NiPoGi AM06 Pro | |
* ... im mniej tym lepiej
Dławienie dysku: Pętla odczytu DiskSpd, głębokość kolejki 8
Wydajność GPU
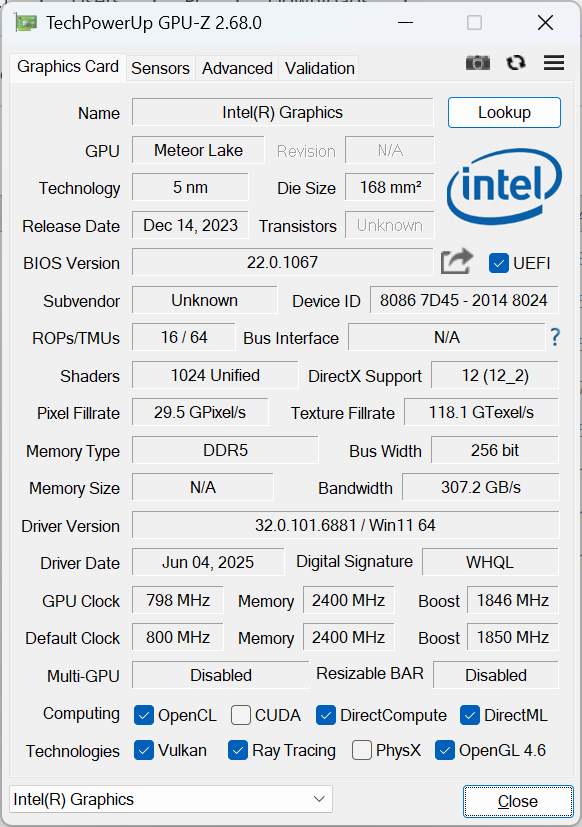
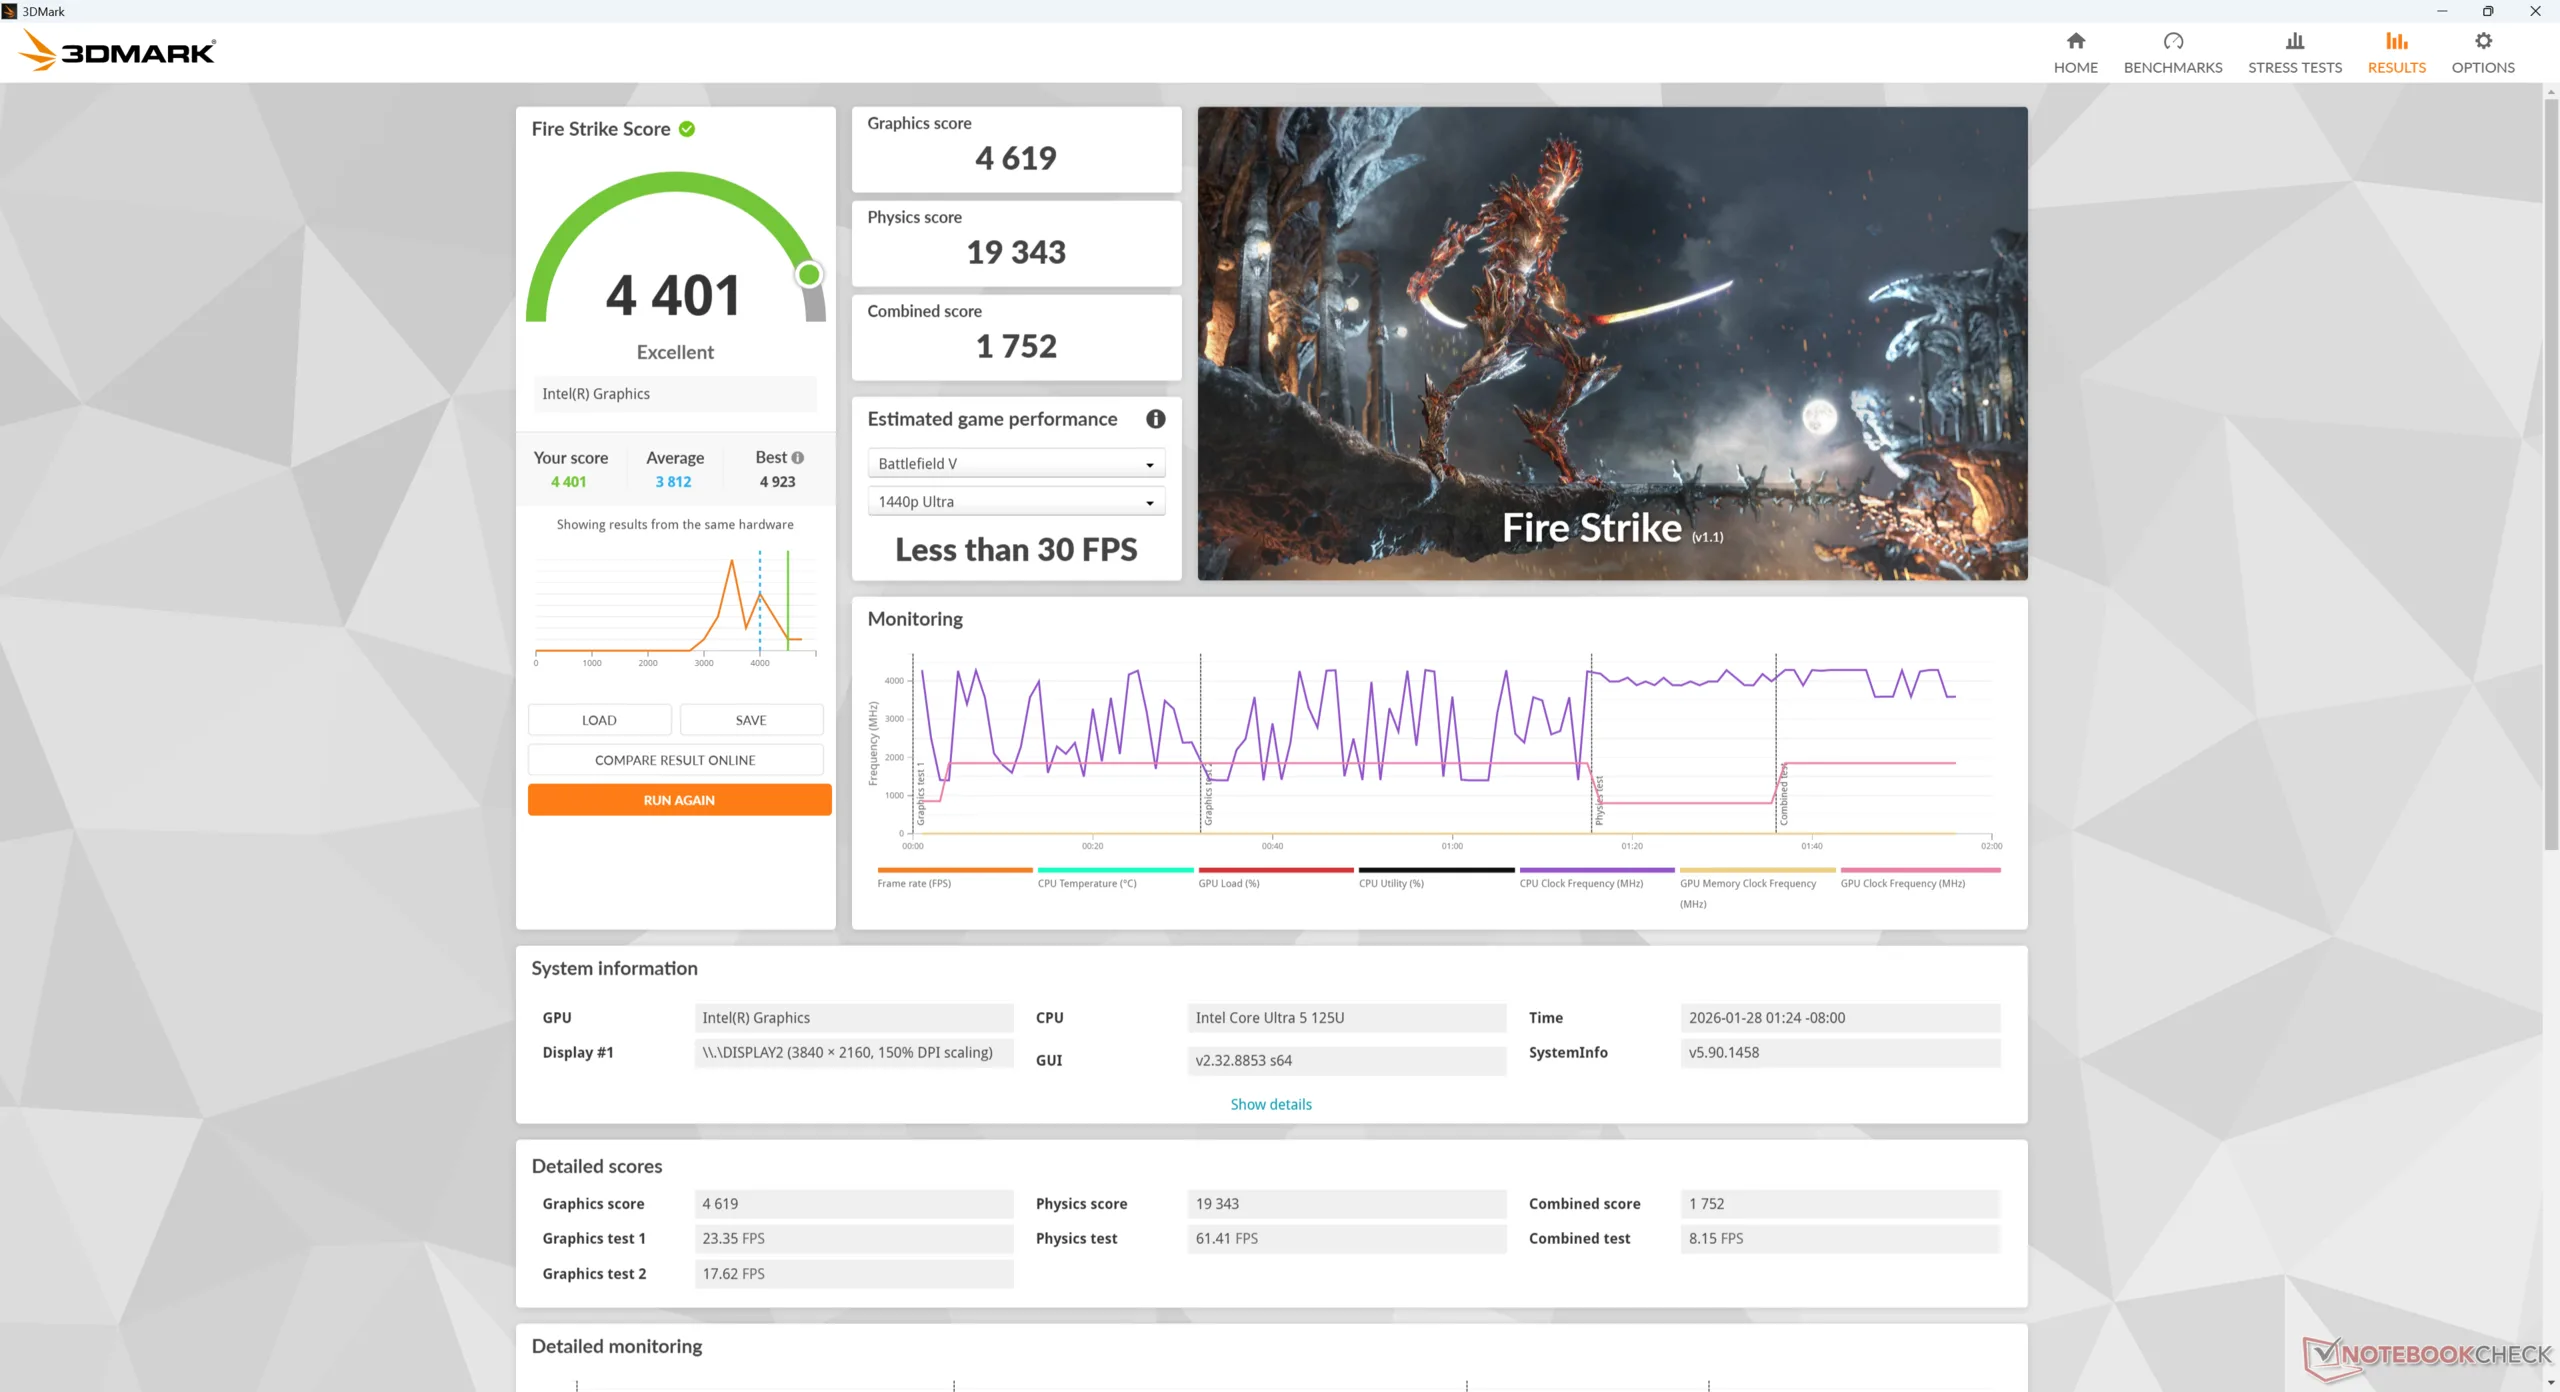
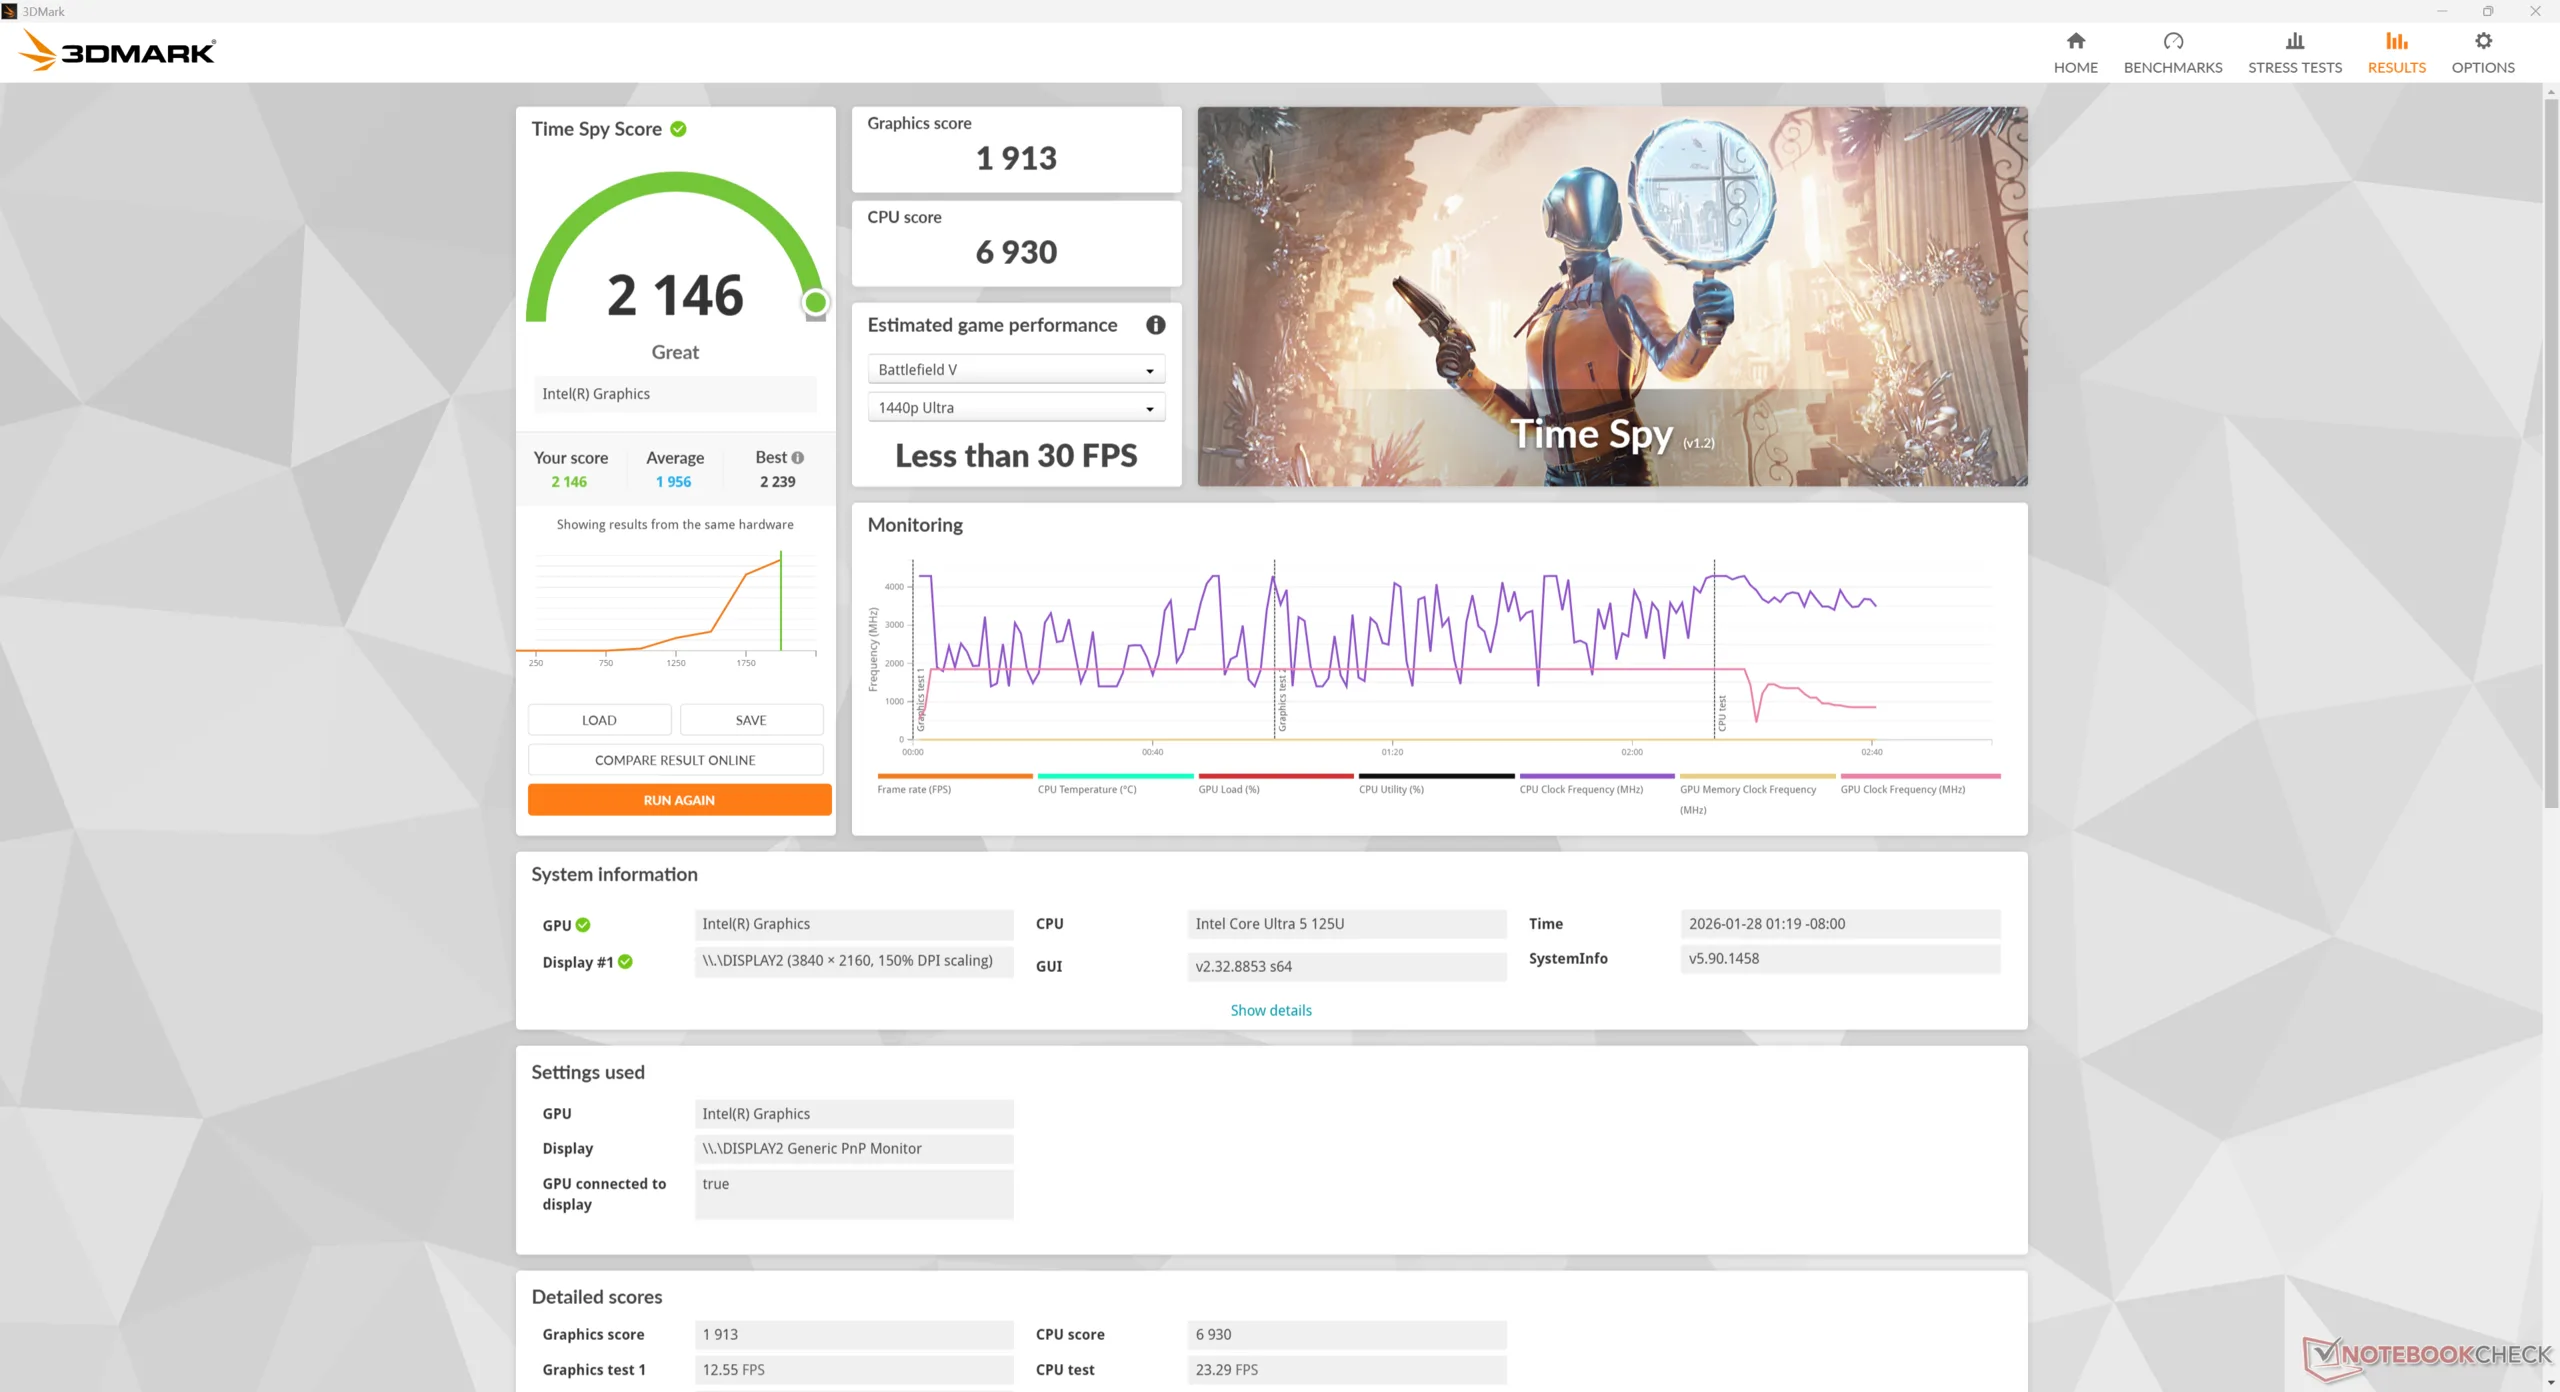
Core Ultra 125U wykorzystuje zintegrowany procesor graficzny Arc 4 dla poziomu wydajności, który jest nawet wolniejszy niż starsze Iris Xe 96 EU powszechnie spotykane w większości laptopów z Alder Lake. Chociaż wyraźnie nie jest przeznaczony do gier, to jednak obsługuje wyjście 4K przy 144 Hz dla płynnego odtwarzania wideo.
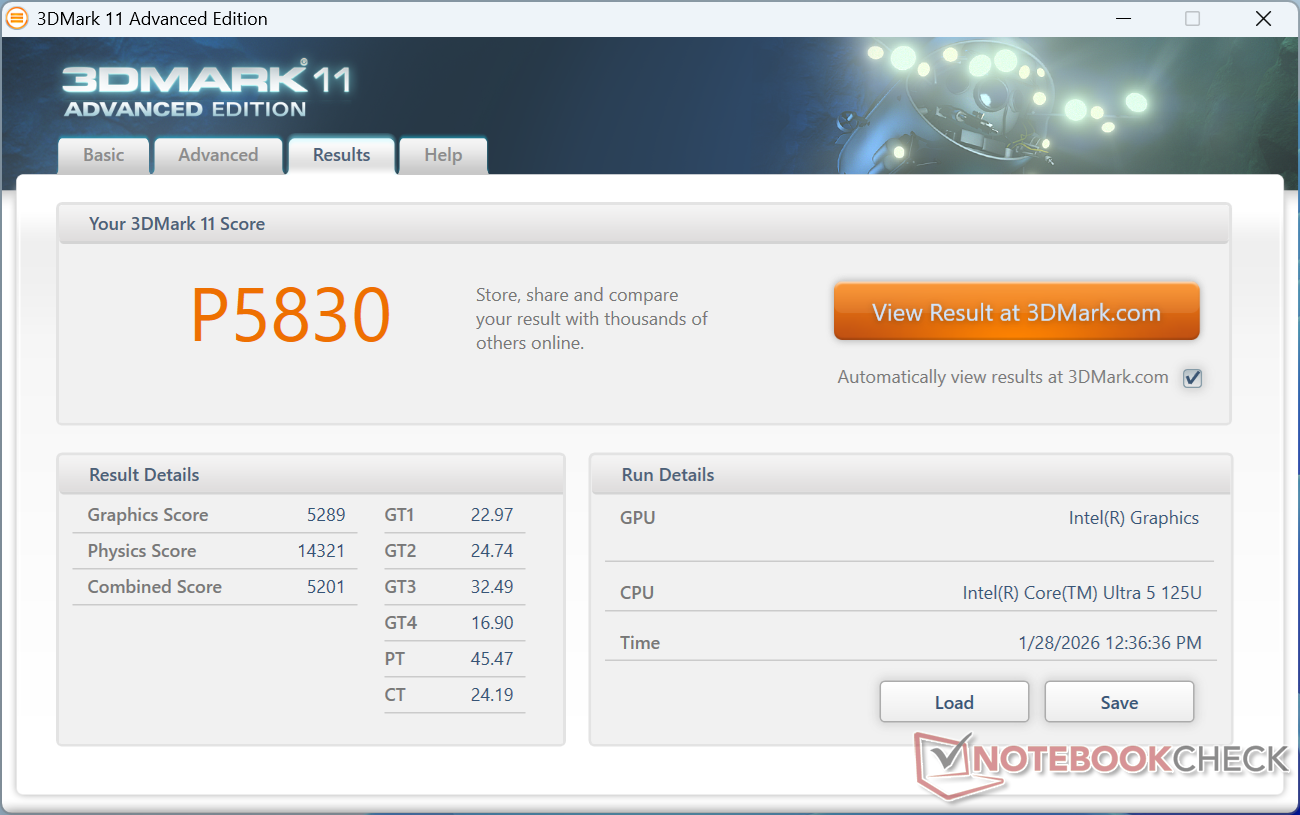
| 3DMark 11 Performance | 5830 pkt. | |
| 3DMark Cloud Gate Standard Score | 22247 pkt. | |
| 3DMark Fire Strike Score | 4401 pkt. | |
| 3DMark Time Spy Score | 2146 pkt. | |
Pomoc | ||
* ... im mniej tym lepiej
| Performance rating - Percent | |
| BOSGAME M2 | |
| Beelink SER9 Pro | |
| GMK NucBox K12 | |
| MSI Cubi NUC AI+ 2MG | |
| GMK NucBox K15 | |
| NiPoGi AM06 Pro -3! | |
| Cyberpunk 2077 - 1920x1080 Ultra Preset (FSR off) | |
| BOSGAME M2 | |
| GMK NucBox K12 | |
| Beelink SER9 Pro | |
| MSI Cubi NUC AI+ 2MG | |
| GMK NucBox K15 | |
| Baldur's Gate 3 - 1920x1080 Ultra Preset AA:T | |
| BOSGAME M2 | |
| Beelink SER9 Pro | |
| GMK NucBox K12 | |
| MSI Cubi NUC AI+ 2MG | |
| GMK NucBox K15 | |
| GTA V - 1920x1080 Highest AA:4xMSAA + FX AF:16x | |
| Beelink SER9 Pro | |
| BOSGAME M2 | |
| GMK NucBox K12 | |
| MSI Cubi NUC AI+ 2MG | |
| GMK NucBox K15 | |
| NiPoGi AM06 Pro | |
| Final Fantasy XV Benchmark - 1920x1080 High Quality | |
| Beelink SER9 Pro | |
| BOSGAME M2 | |
| MSI Cubi NUC AI+ 2MG | |
| GMK NucBox K12 | |
| GMK NucBox K15 | |
| NiPoGi AM06 Pro | |
| Strange Brigade - 1920x1080 ultra AA:ultra AF:16 | |
| MSI Cubi NUC AI+ 2MG | |
| Beelink SER9 Pro | |
| BOSGAME M2 | |
| GMK NucBox K12 | |
| GMK NucBox K15 | |
| Dota 2 Reborn - 1920x1080 ultra (3/3) best looking | |
| BOSGAME M2 | |
| GMK NucBox K12 | |
| Beelink SER9 Pro | |
| MSI Cubi NUC AI+ 2MG | |
| GMK NucBox K15 | |
| NiPoGi AM06 Pro | |
| X-Plane 11.11 - 1920x1080 high (fps_test=3) | |
| BOSGAME M2 | |
| GMK NucBox K12 | |
| Beelink SER9 Pro | |
| MSI Cubi NUC AI+ 2MG | |
| GMK NucBox K15 | |
| NiPoGi AM06 Pro | |
Cyberpunk 2077 ultra FPS Chart
| low | med. | high | ultra | |
|---|---|---|---|---|
| GTA V (2015) | 127.9 | 101.3 | 21.7 | 9.18 |
| Dota 2 Reborn (2015) | 95 | 71.4 | 63.2 | 59.1 |
| Final Fantasy XV Benchmark (2018) | 43.4 | 23.8 | 17.2 | |
| X-Plane 11.11 (2018) | 40.6 | 27.5 | 24.3 | |
| Strange Brigade (2018) | 114.3 | 46.7 | 37.9 | 30.9 |
| Baldur's Gate 3 (2023) | 19.8 | 16.7 | 14.4 | 14.2 |
| Cyberpunk 2077 (2023) | 20.9 | 16.7 | 14.3 | 12.4 |
| F1 24 (2024) | 37.7 | 35.4 | 26.4 |
Emisje
Hałas systemowy
Hałas wentylatorów jest zauważalnie cichszy niż w K12, mimo że K15 ma tę samą konstrukcję obudowy, ponieważ procesor w K15 jest znacznie mniej wymagający.
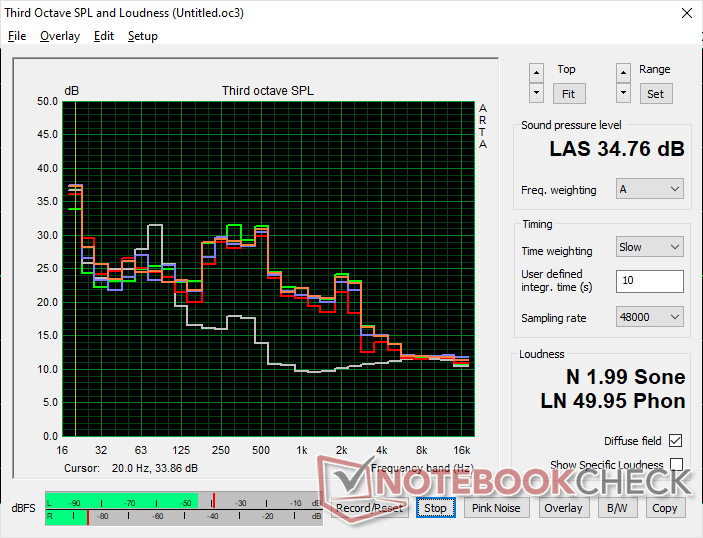
Hałas
| luz |
| 32.9 / 33.3 / 33.3 dB |
| obciążenie |
| 33.8 / 34.6 dB |
 | ||
30 dB cichy 40 dB(A) słyszalny 50 dB(A) irytujący |
||
min: | ||
| GMK NucBox K15 Ultra 5 125U, Graphics 4-Core iGPU (Arrow Lake) | MSI Cubi NUC AI+ 2MG Core Ultra 7 258V, Arc 140V | GMK NucBox K12 Ryzen 7 H 255, Radeon 780M | Beelink SER9 Pro Ryzen 7 H 255, Radeon 780M | BOSGAME M2 R9 7940HS, Radeon 780M | NiPoGi AM06 Pro R7 5700U, Vega 8 | |
|---|---|---|---|---|---|---|
| Noise | -10% | -13% | 4% | -7% | 8% | |
| wyłączone / środowisko * (dB) | 23.8 | 24.8 -4% | 23.5 1% | 23 3% | 23 3% | 24.1 -1% |
| Idle Minimum * (dB) | 32.9 | 28 15% | 35.4 -8% | 29.1 12% | 31.5 4% | 28.3 14% |
| Idle Average * (dB) | 33.3 | 36.1 -8% | 35.4 -6% | 30.1 10% | 32.3 3% | 28.3 15% |
| Idle Maximum * (dB) | 33.3 | 36.1 -8% | 39 -17% | 31.7 5% | 34.9 -5% | 28.4 15% |
| Load Average * (dB) | 33.8 | 38.9 -15% | 42.4 -25% | 33.7 -0% | 39 -15% | 31.7 6% |
| Cyberpunk 2077 ultra * (dB) | 34.3 | 37 -8% | 40.4 -18% | 33.8 1% | 40.3 -17% | 33.3 3% |
| Load Maximum * (dB) | 34.6 | 49.2 -42% | 41.4 -20% | 35.2 -2% | 42.5 -23% | 32.8 5% |
* ... im mniej tym lepiej
Temperatura
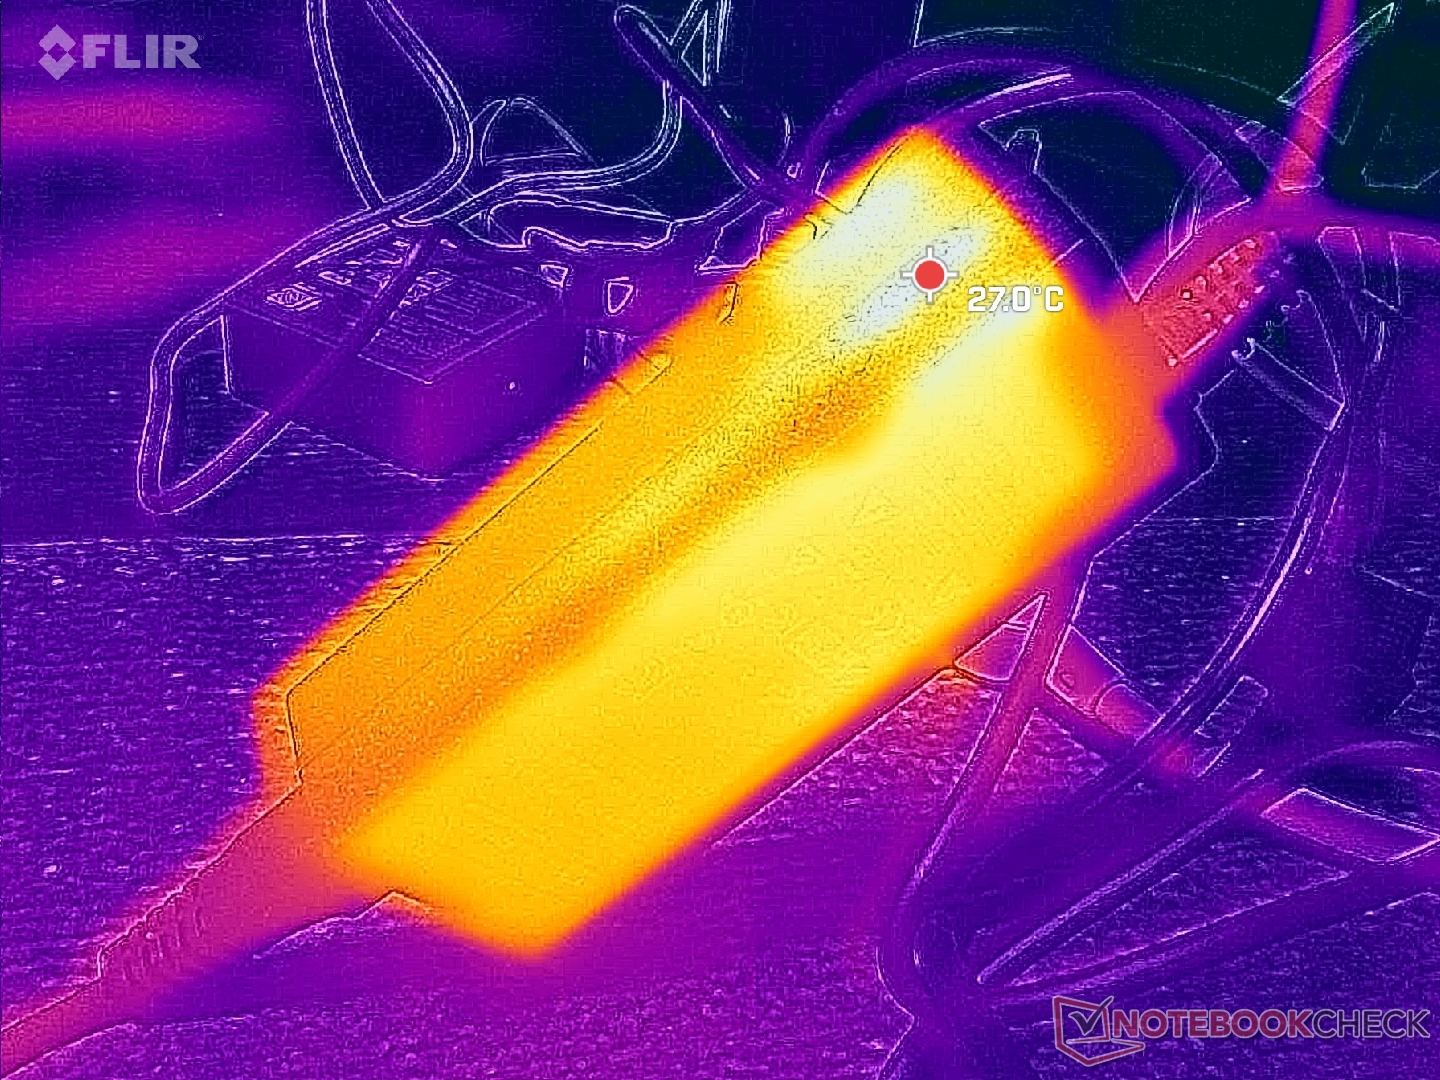
Temperatury powierzchniowe są jednymi z najchłodniejszych spośród wszystkich mini PC dzięki połączeniu procesora Core z serii U z relatywnie grubą i dużą konstrukcją obudowy. Nawet zasilacz jest ponadwymiarowy, a zmiany temperatury pod obciążeniem są ledwo zauważalne.
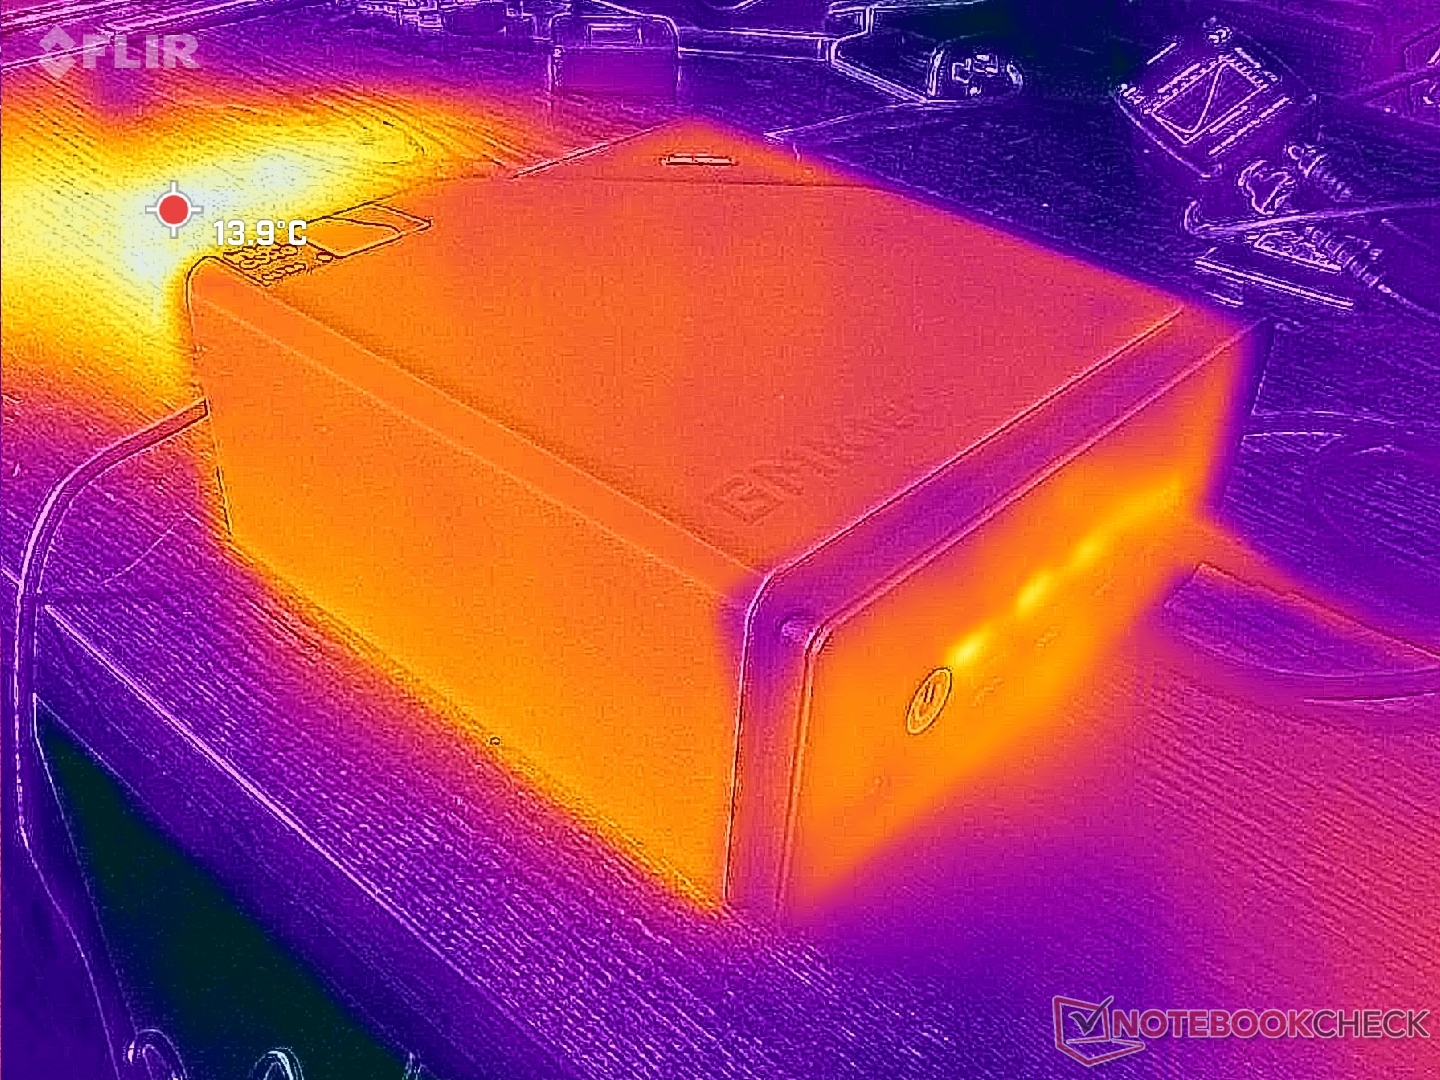
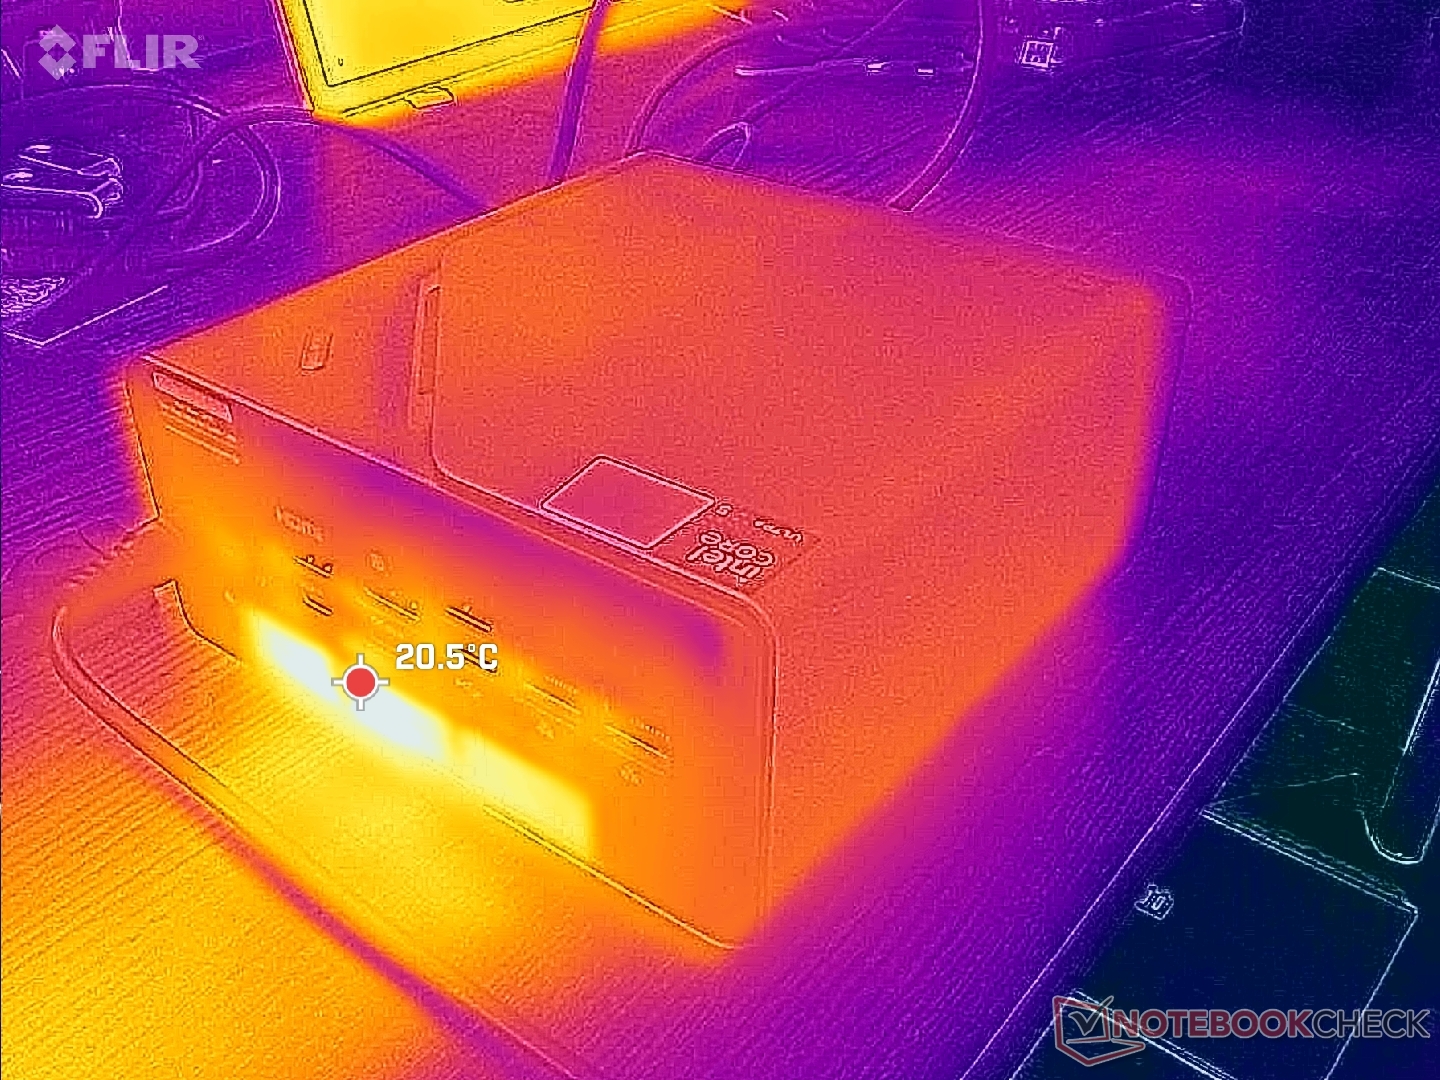
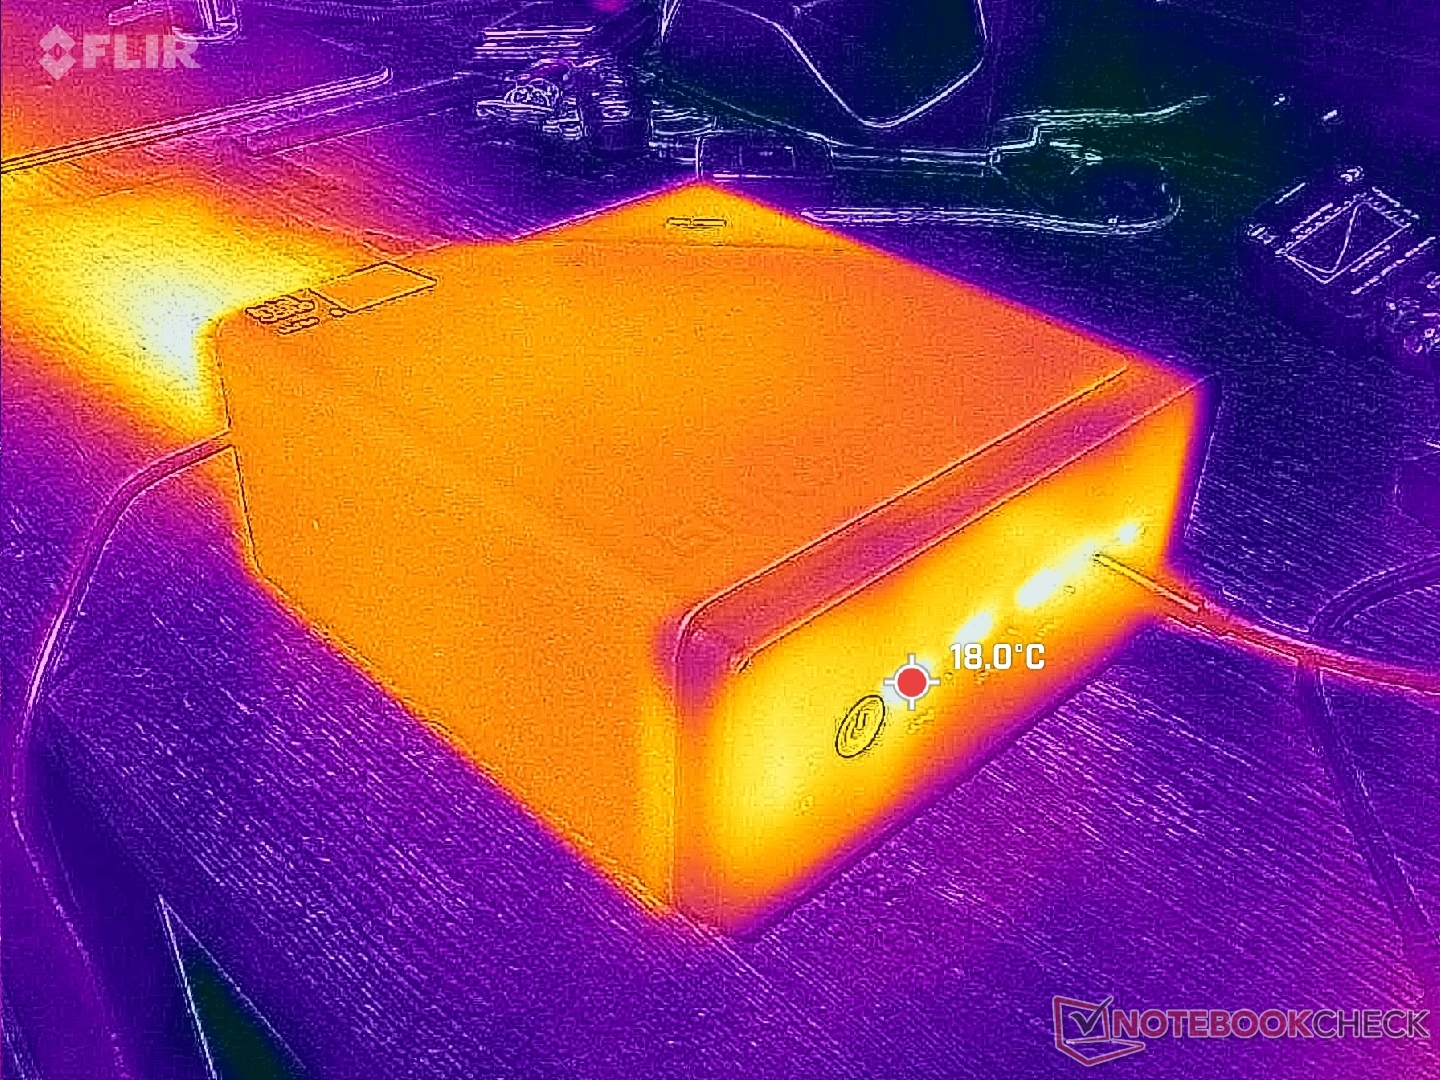
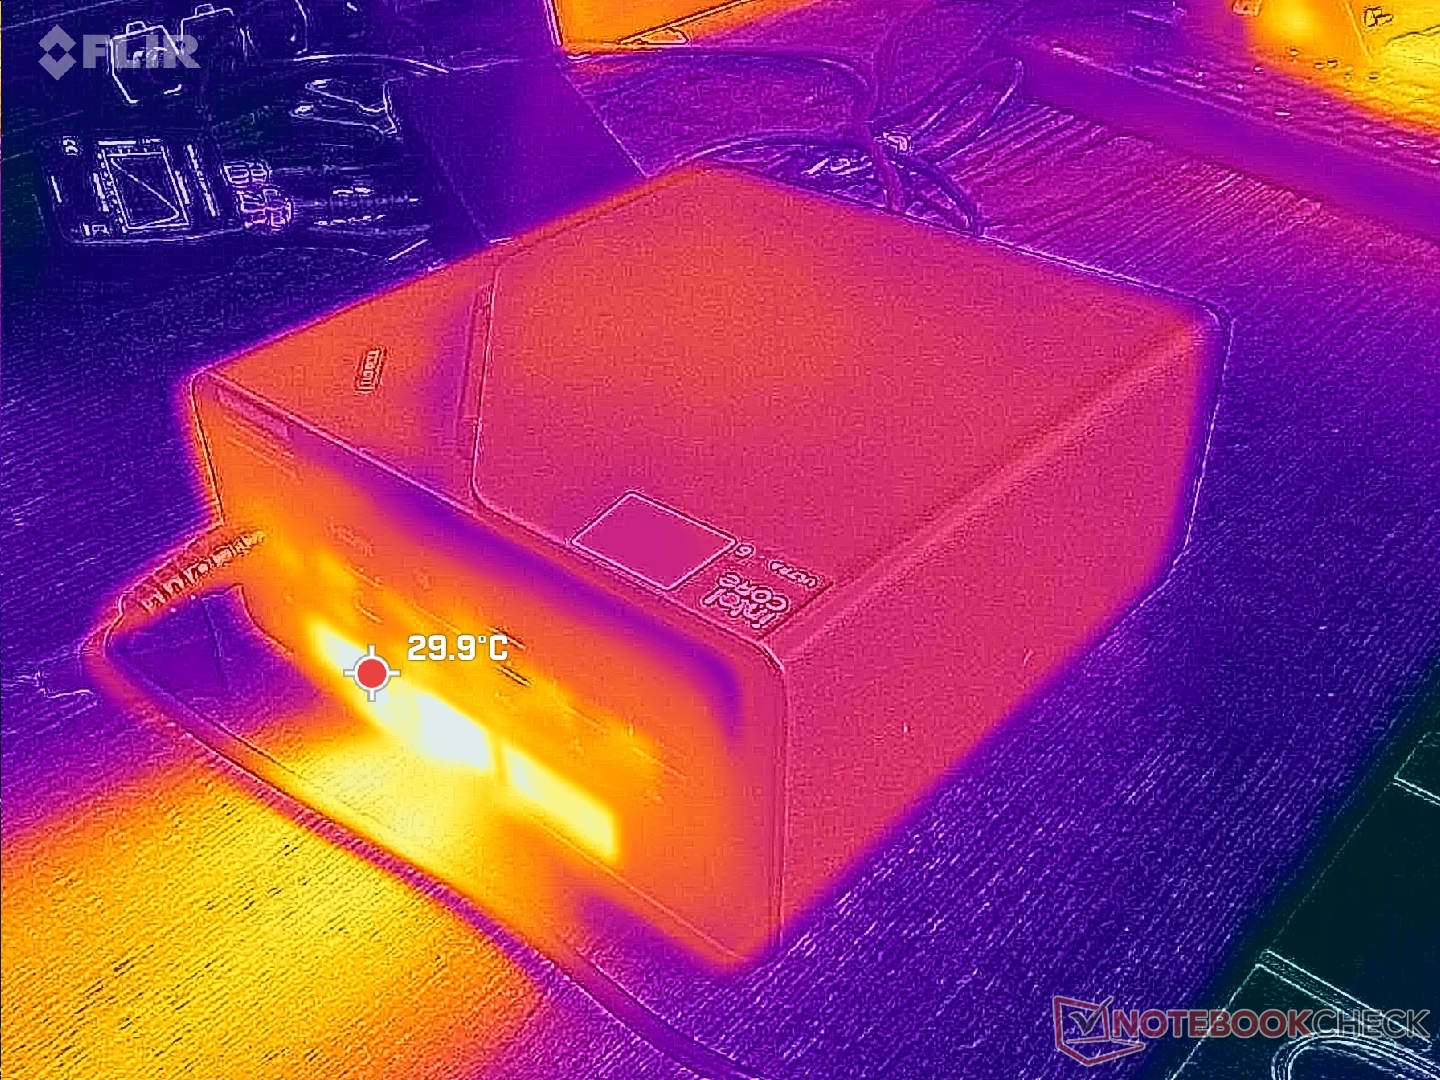
(+) Maksymalna temperatura w górnej części wynosi 24.2 °C / 76 F, w porównaniu do średniej 35.4 °C / 96 F , począwszy od 20.6 do 69.5 °C dla klasy Mini PC.
(+) Dno nagrzewa się maksymalnie do 28 °C / 82 F, w porównaniu do średniej 36.1 °C / 97 F
(+) W stanie bezczynności średnia temperatura górnej części wynosi 20.3 °C / 69 F, w porównaniu ze średnią temperaturą urządzenia wynoszącą 32.1 °C / ### class_avg_f### F.
Test warunków skrajnych
Procesor stabilizuje się na poziomie 2,2 GHz, 57 C i 25 W przy obciążeniu Prime95, w porównaniu do 3,2 GHz, 66 C i 38 W w droższym MSI Cubi NUC AI+ 2MG z procesorem Lunar Lake. Temperatura rdzenia pozostała względnie niska na poziomie poniżej 60 C podczas uruchamiania gry Cyberpunk 2077 w celu obciążenia zintegrowanego procesora graficznego.
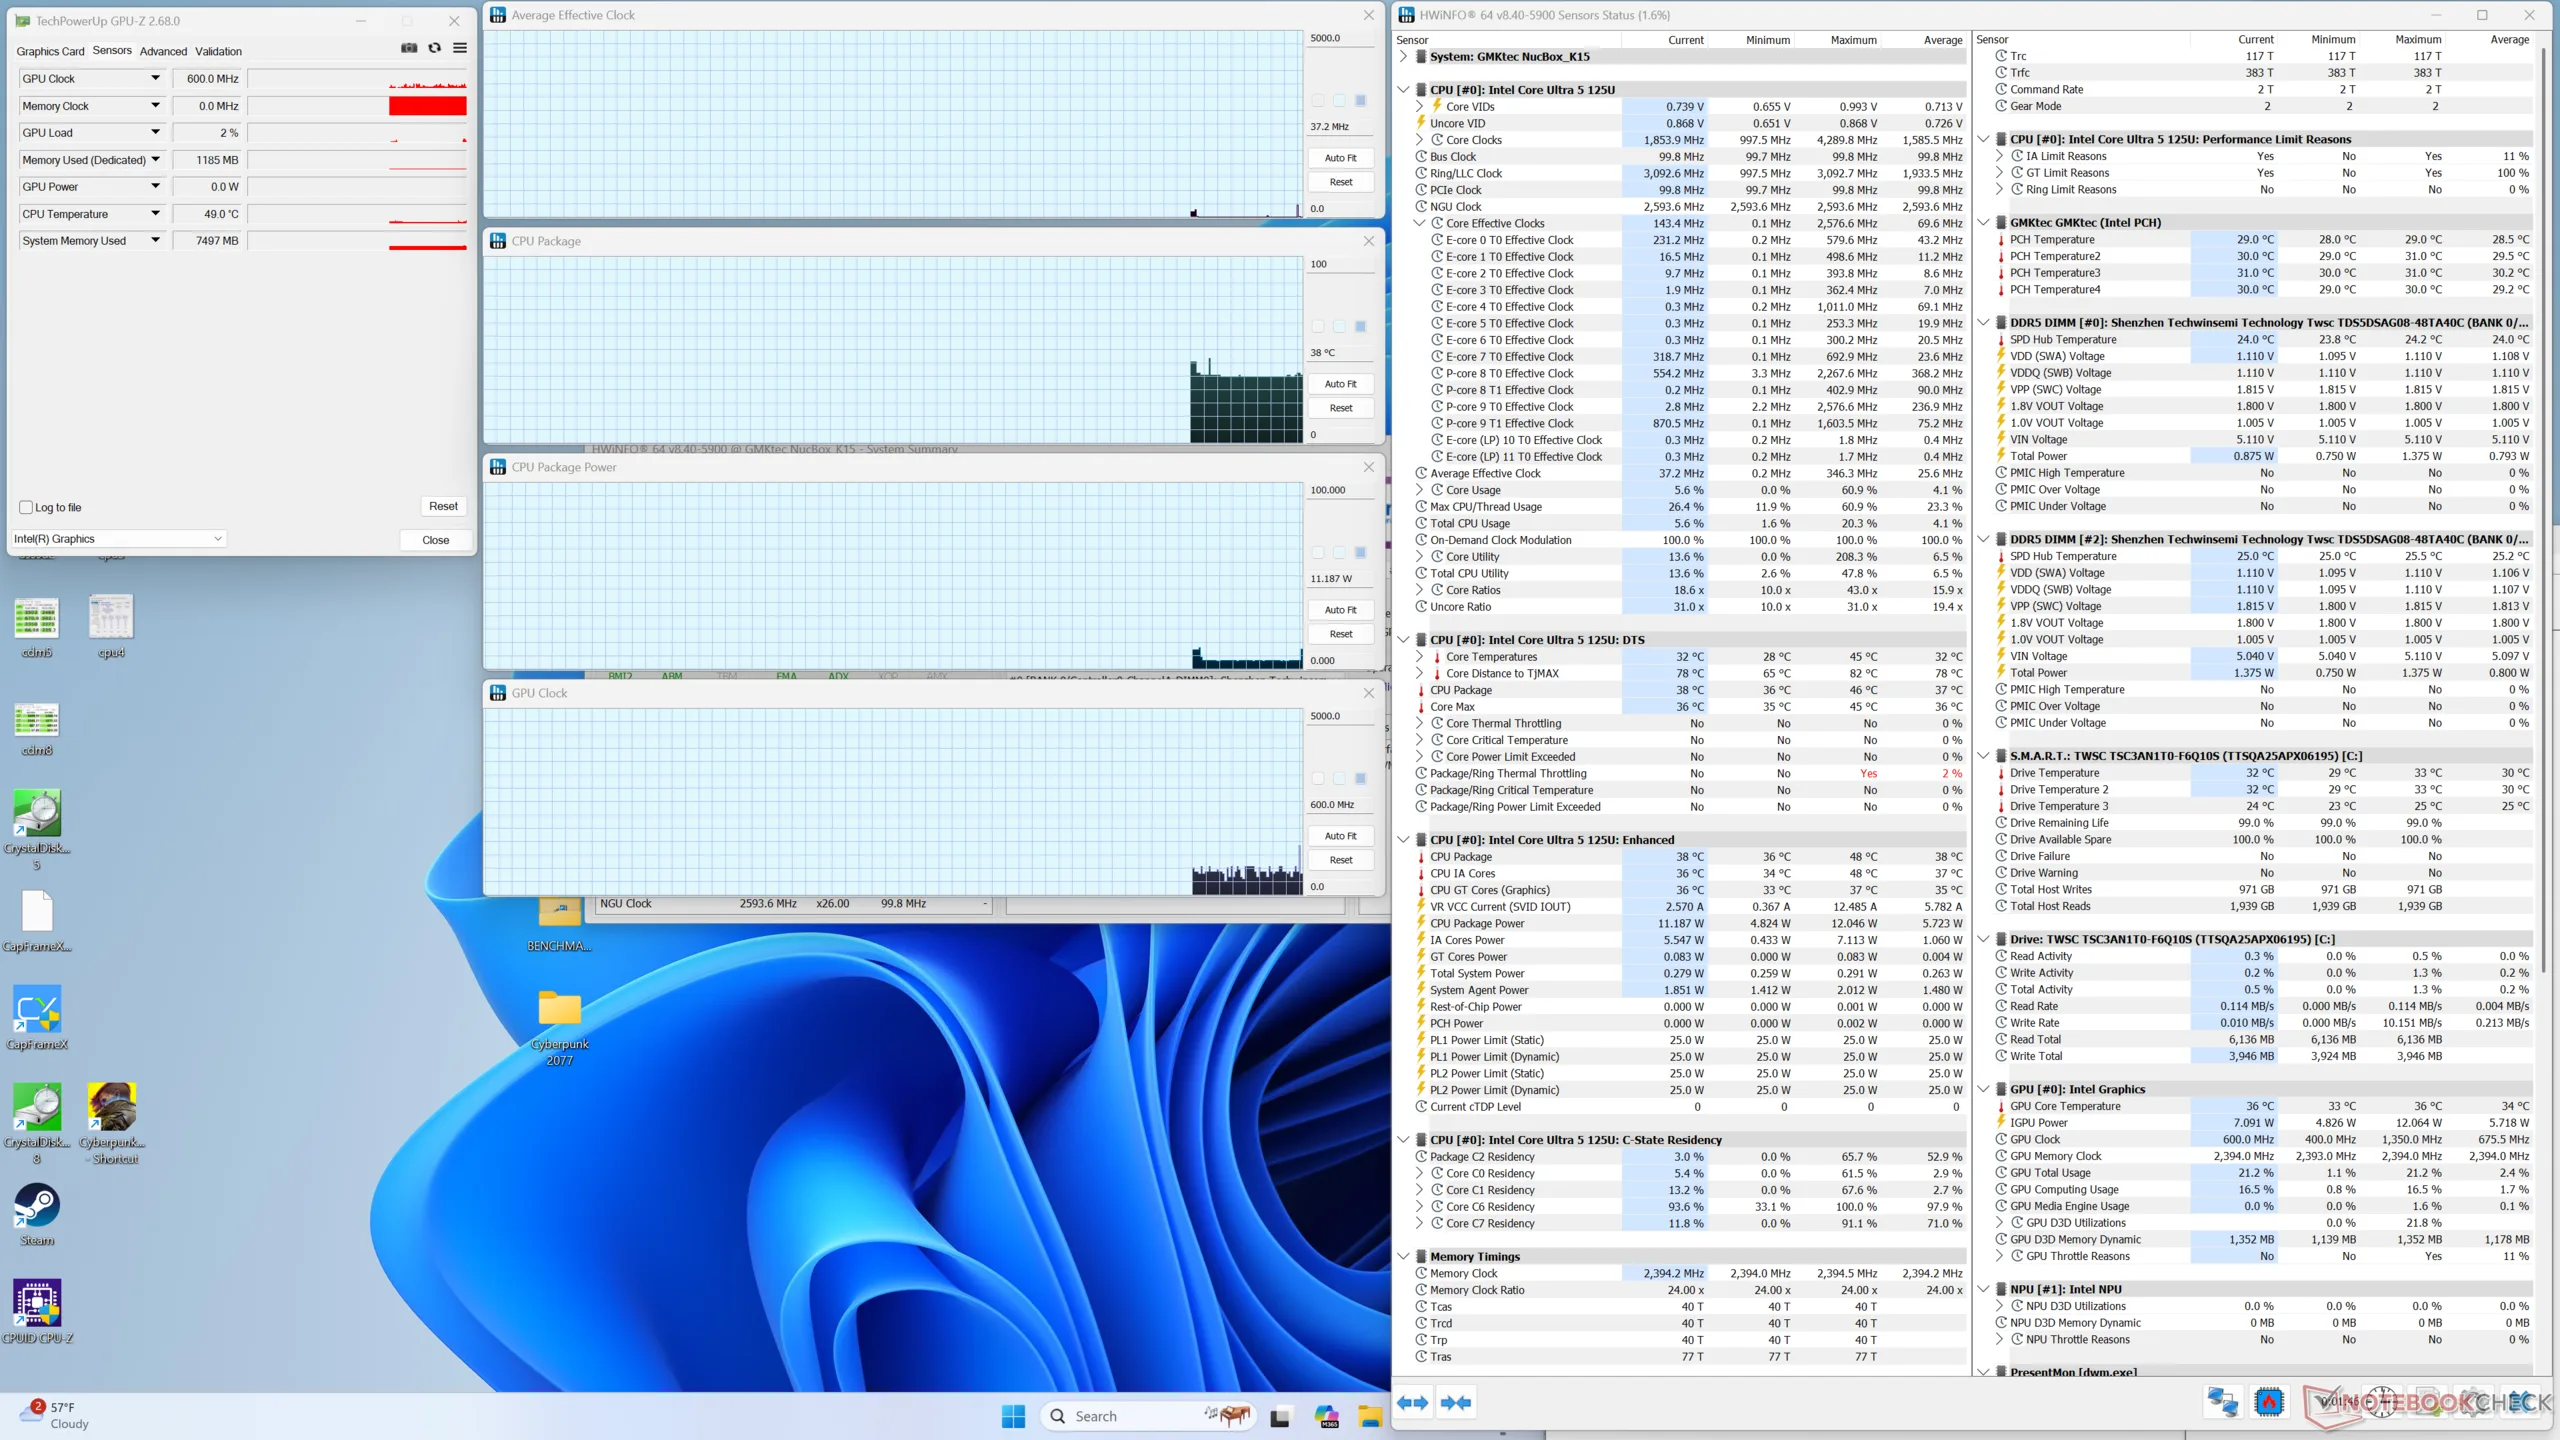
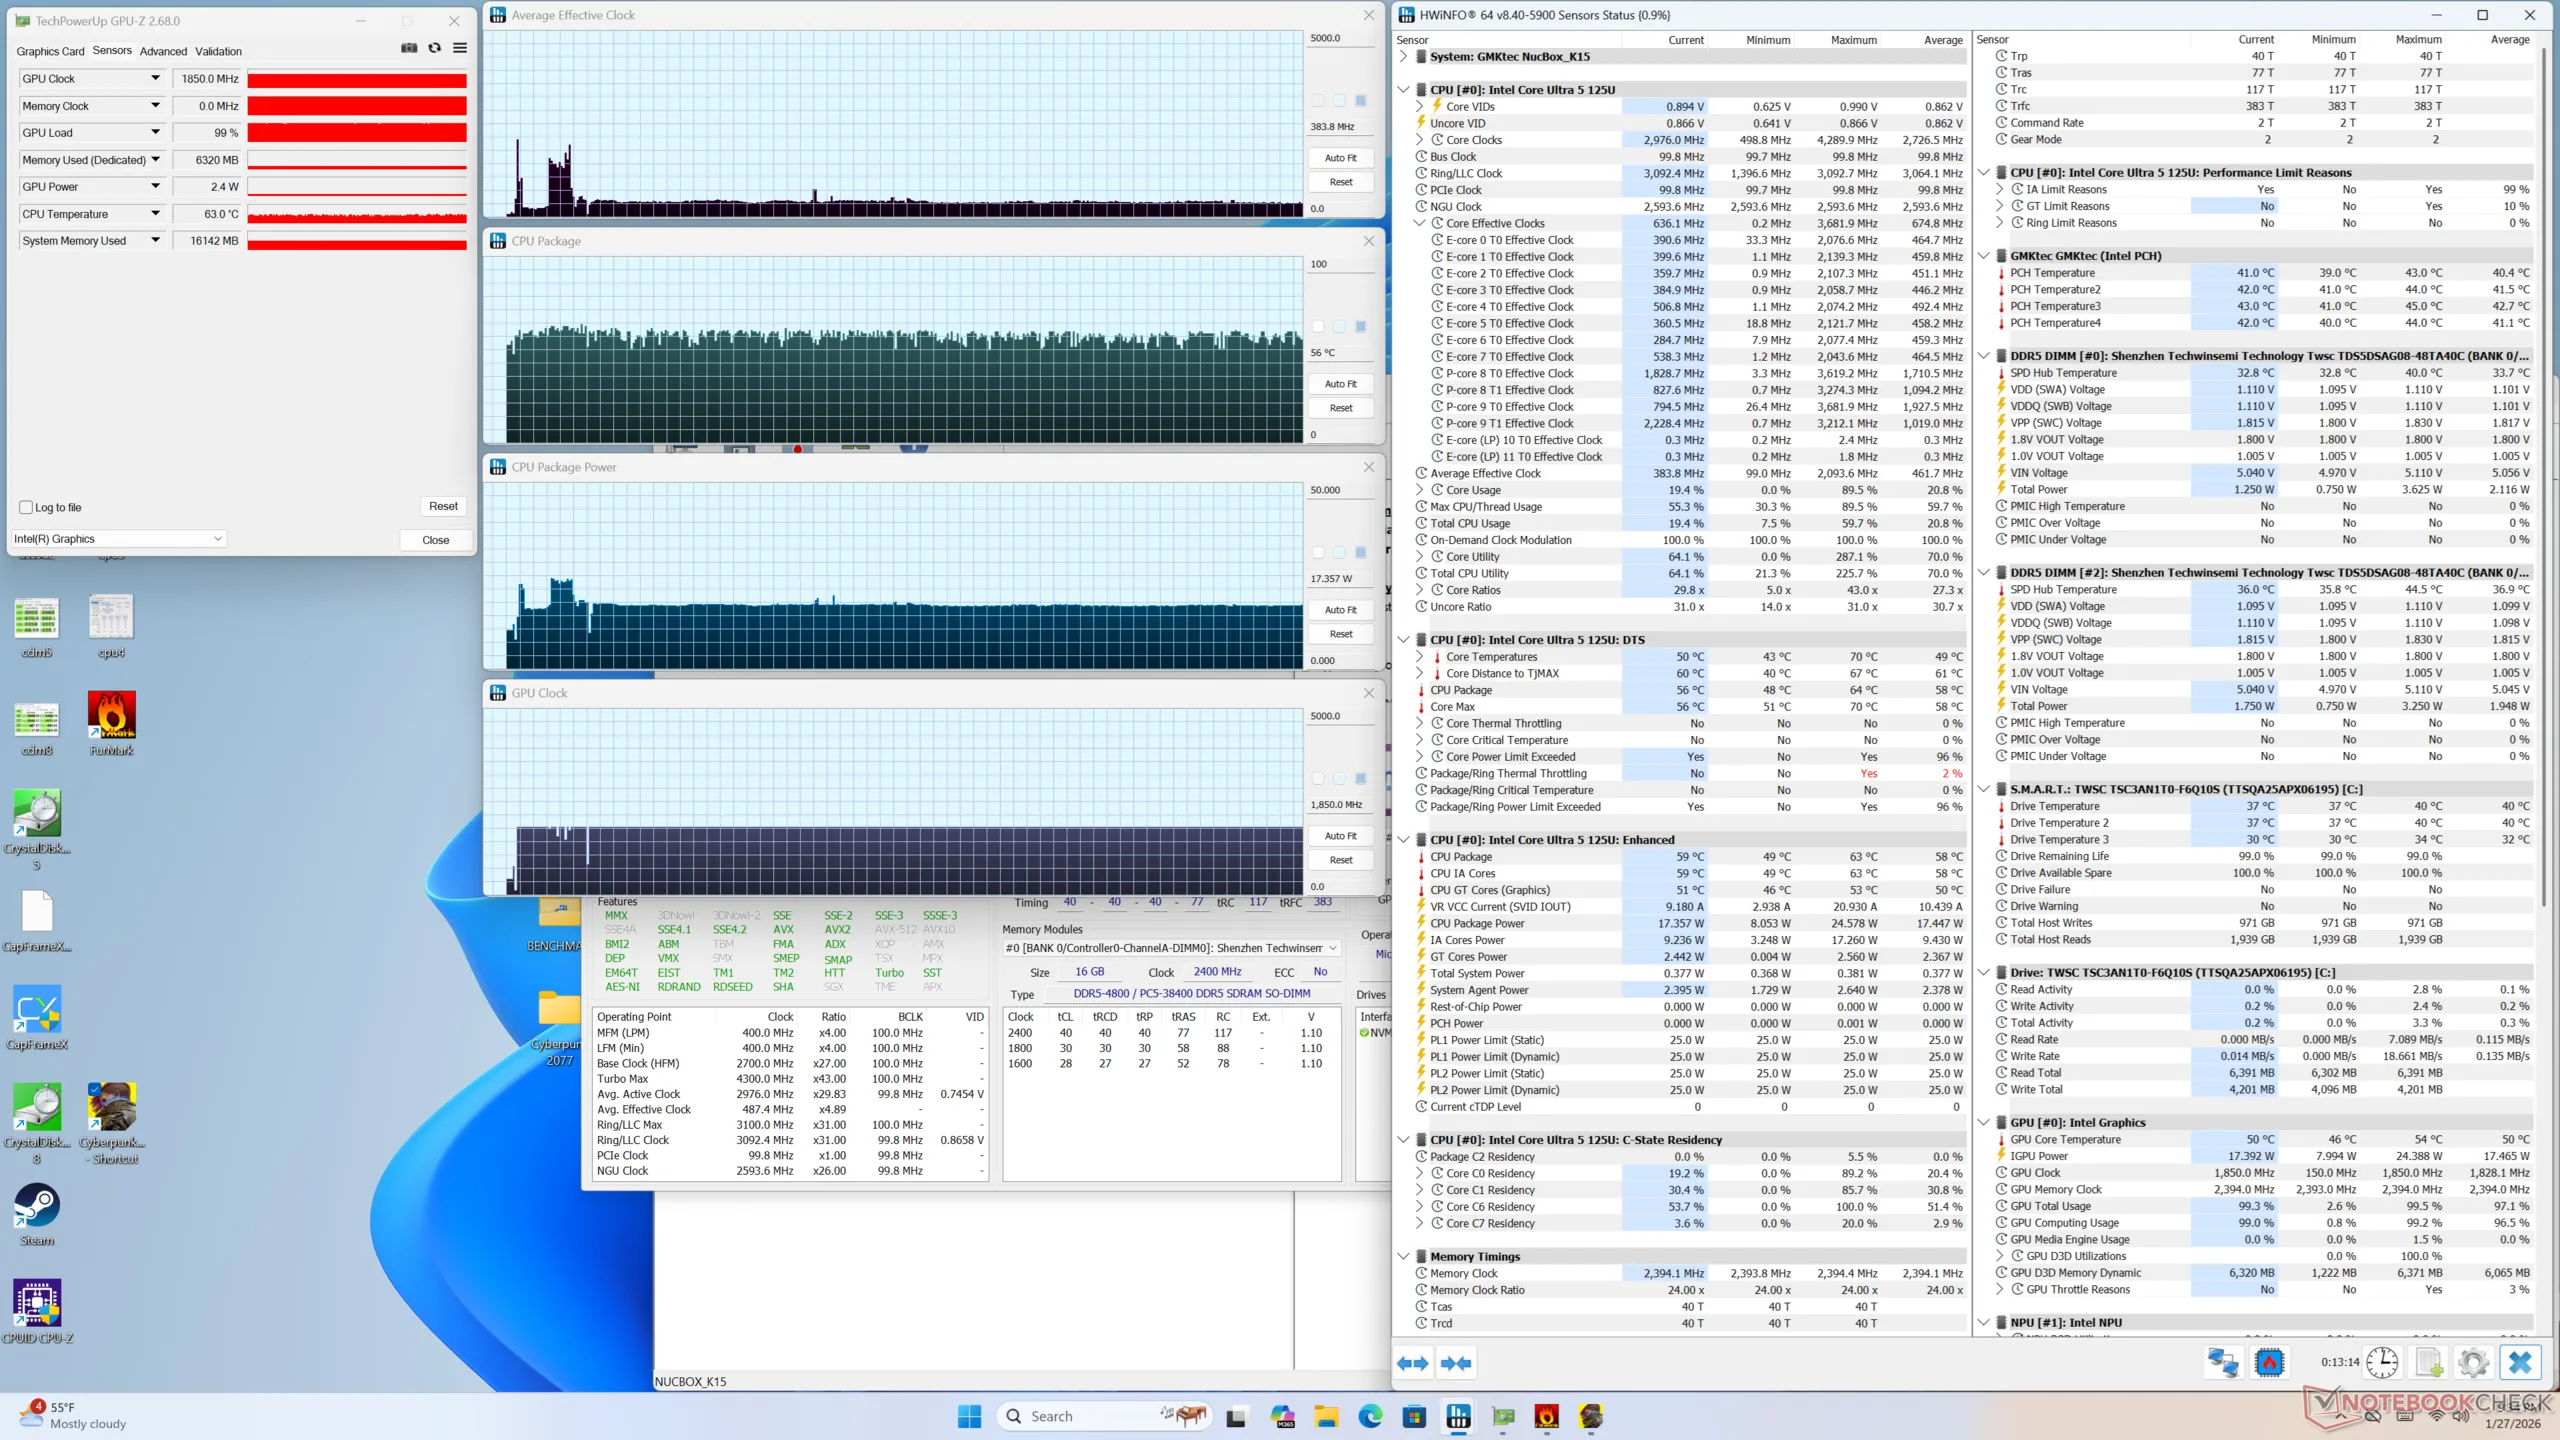
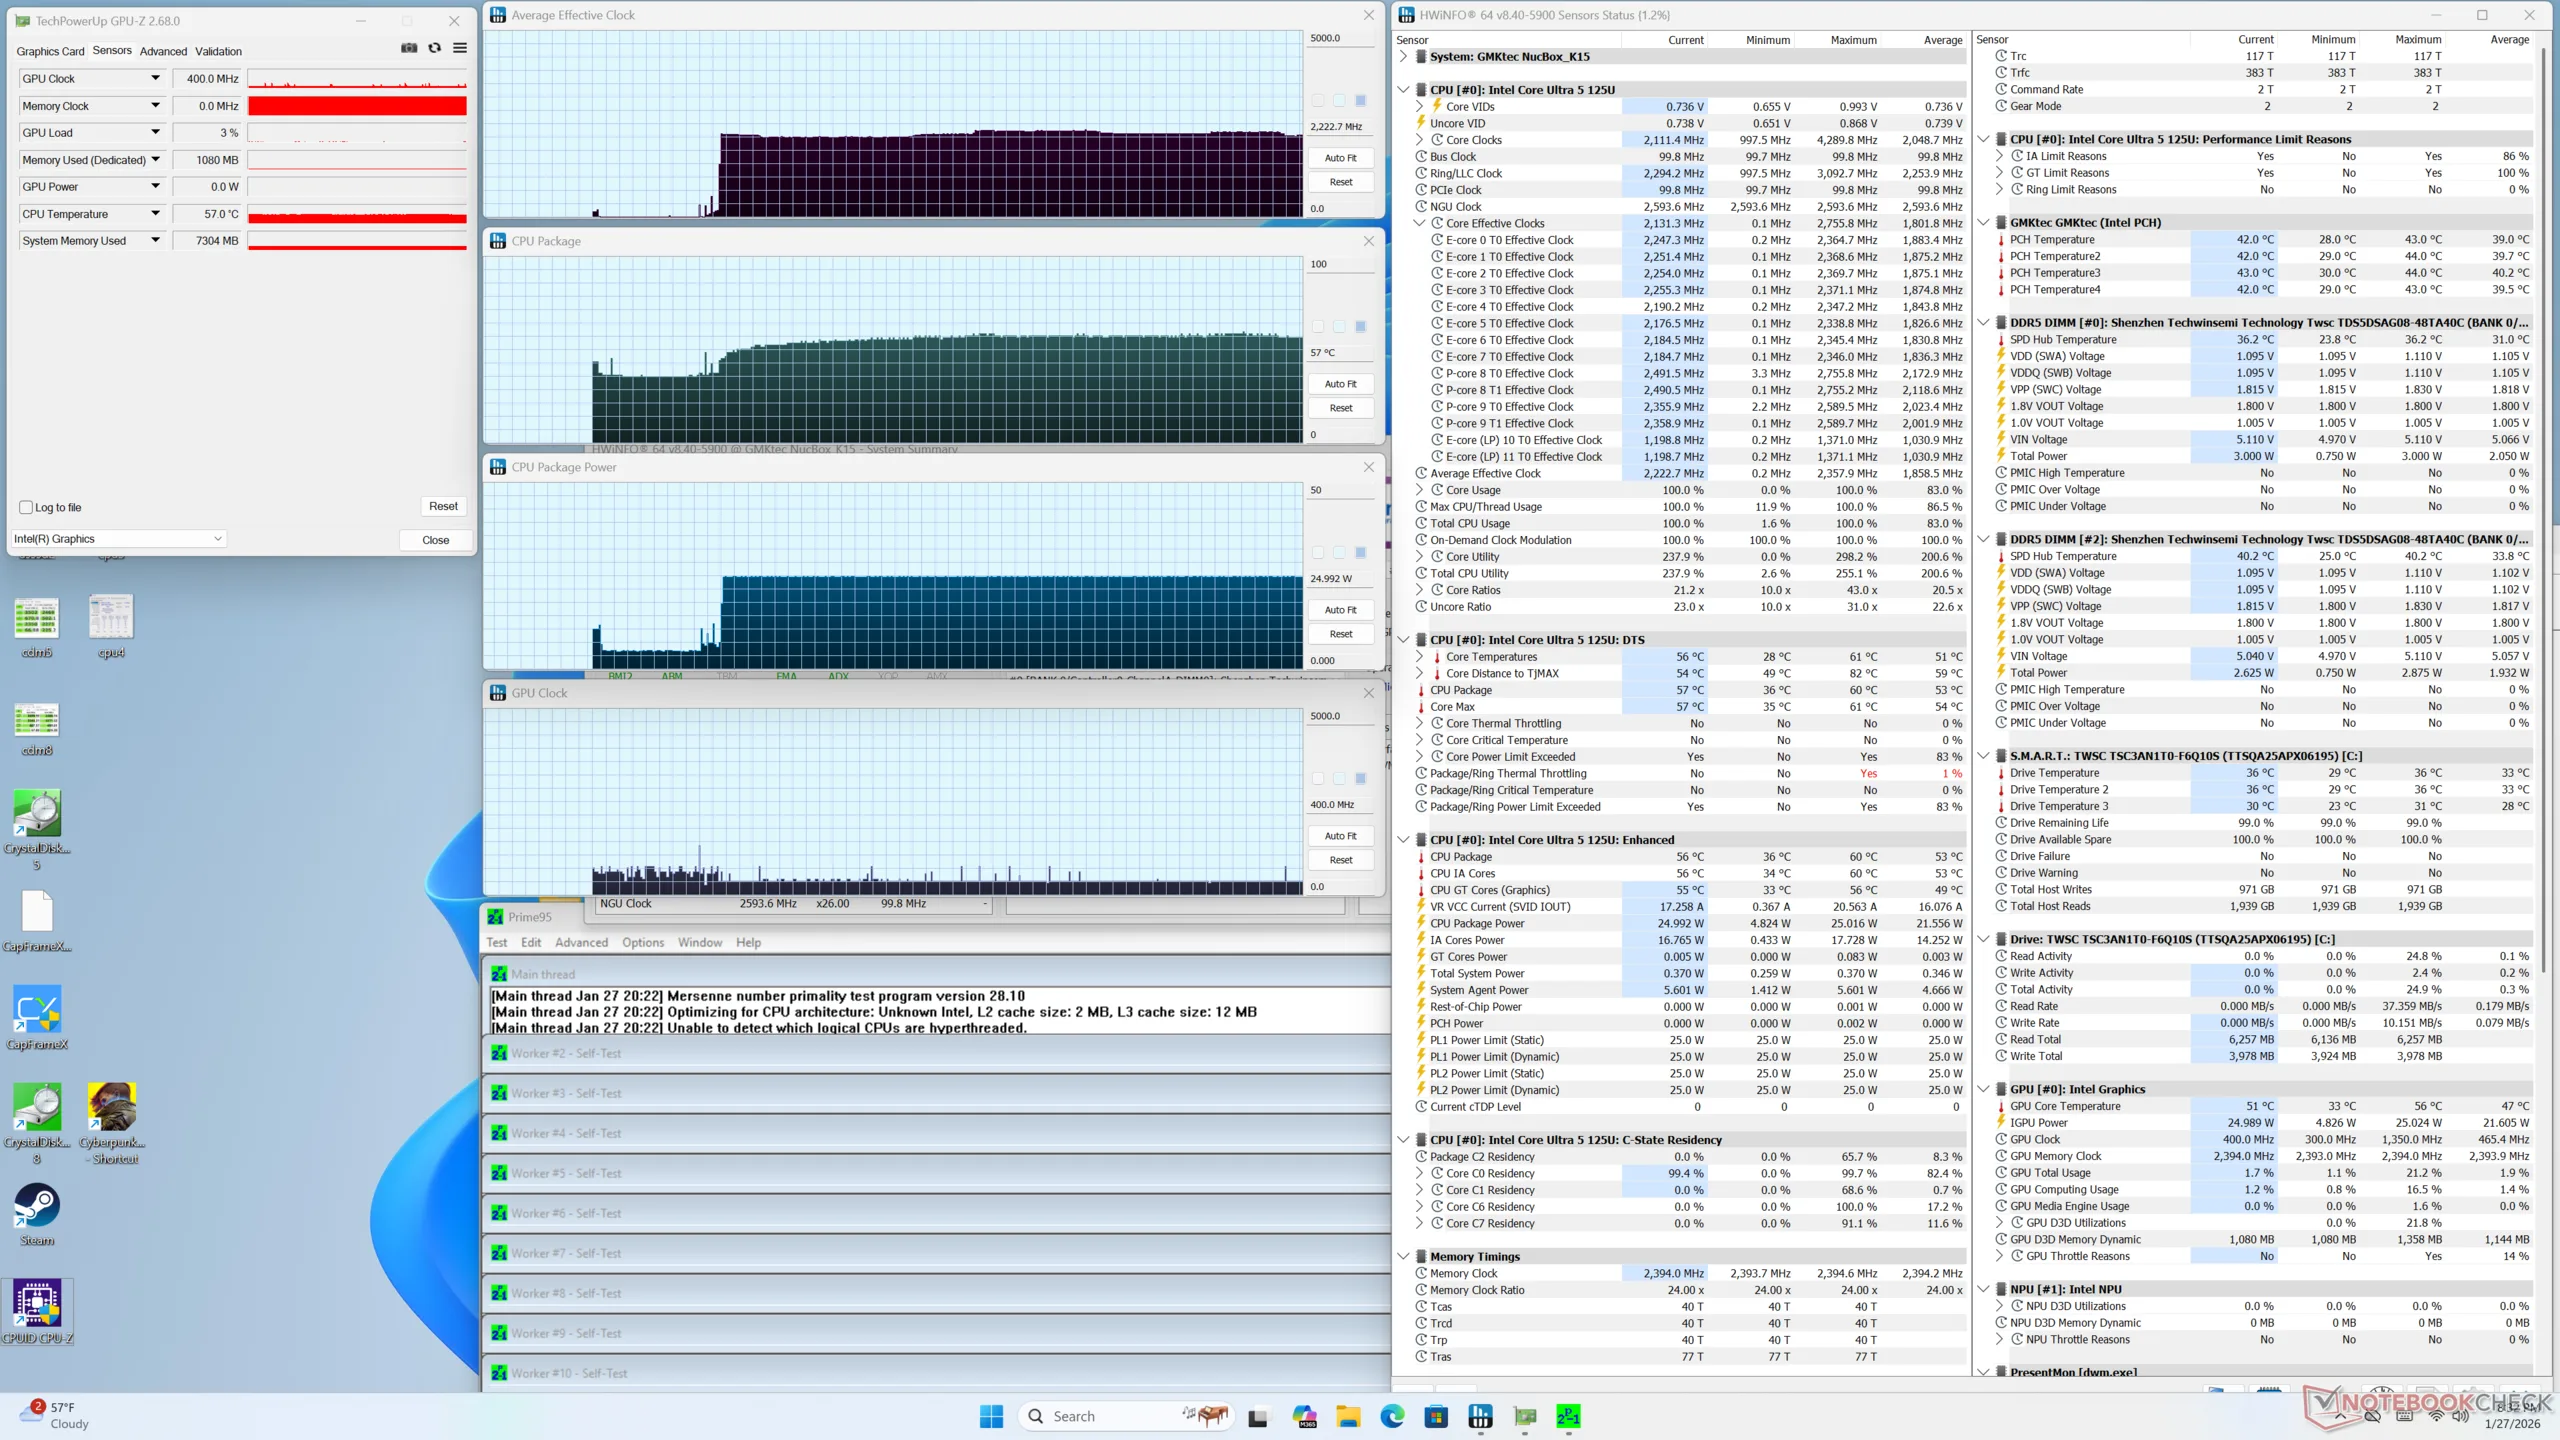
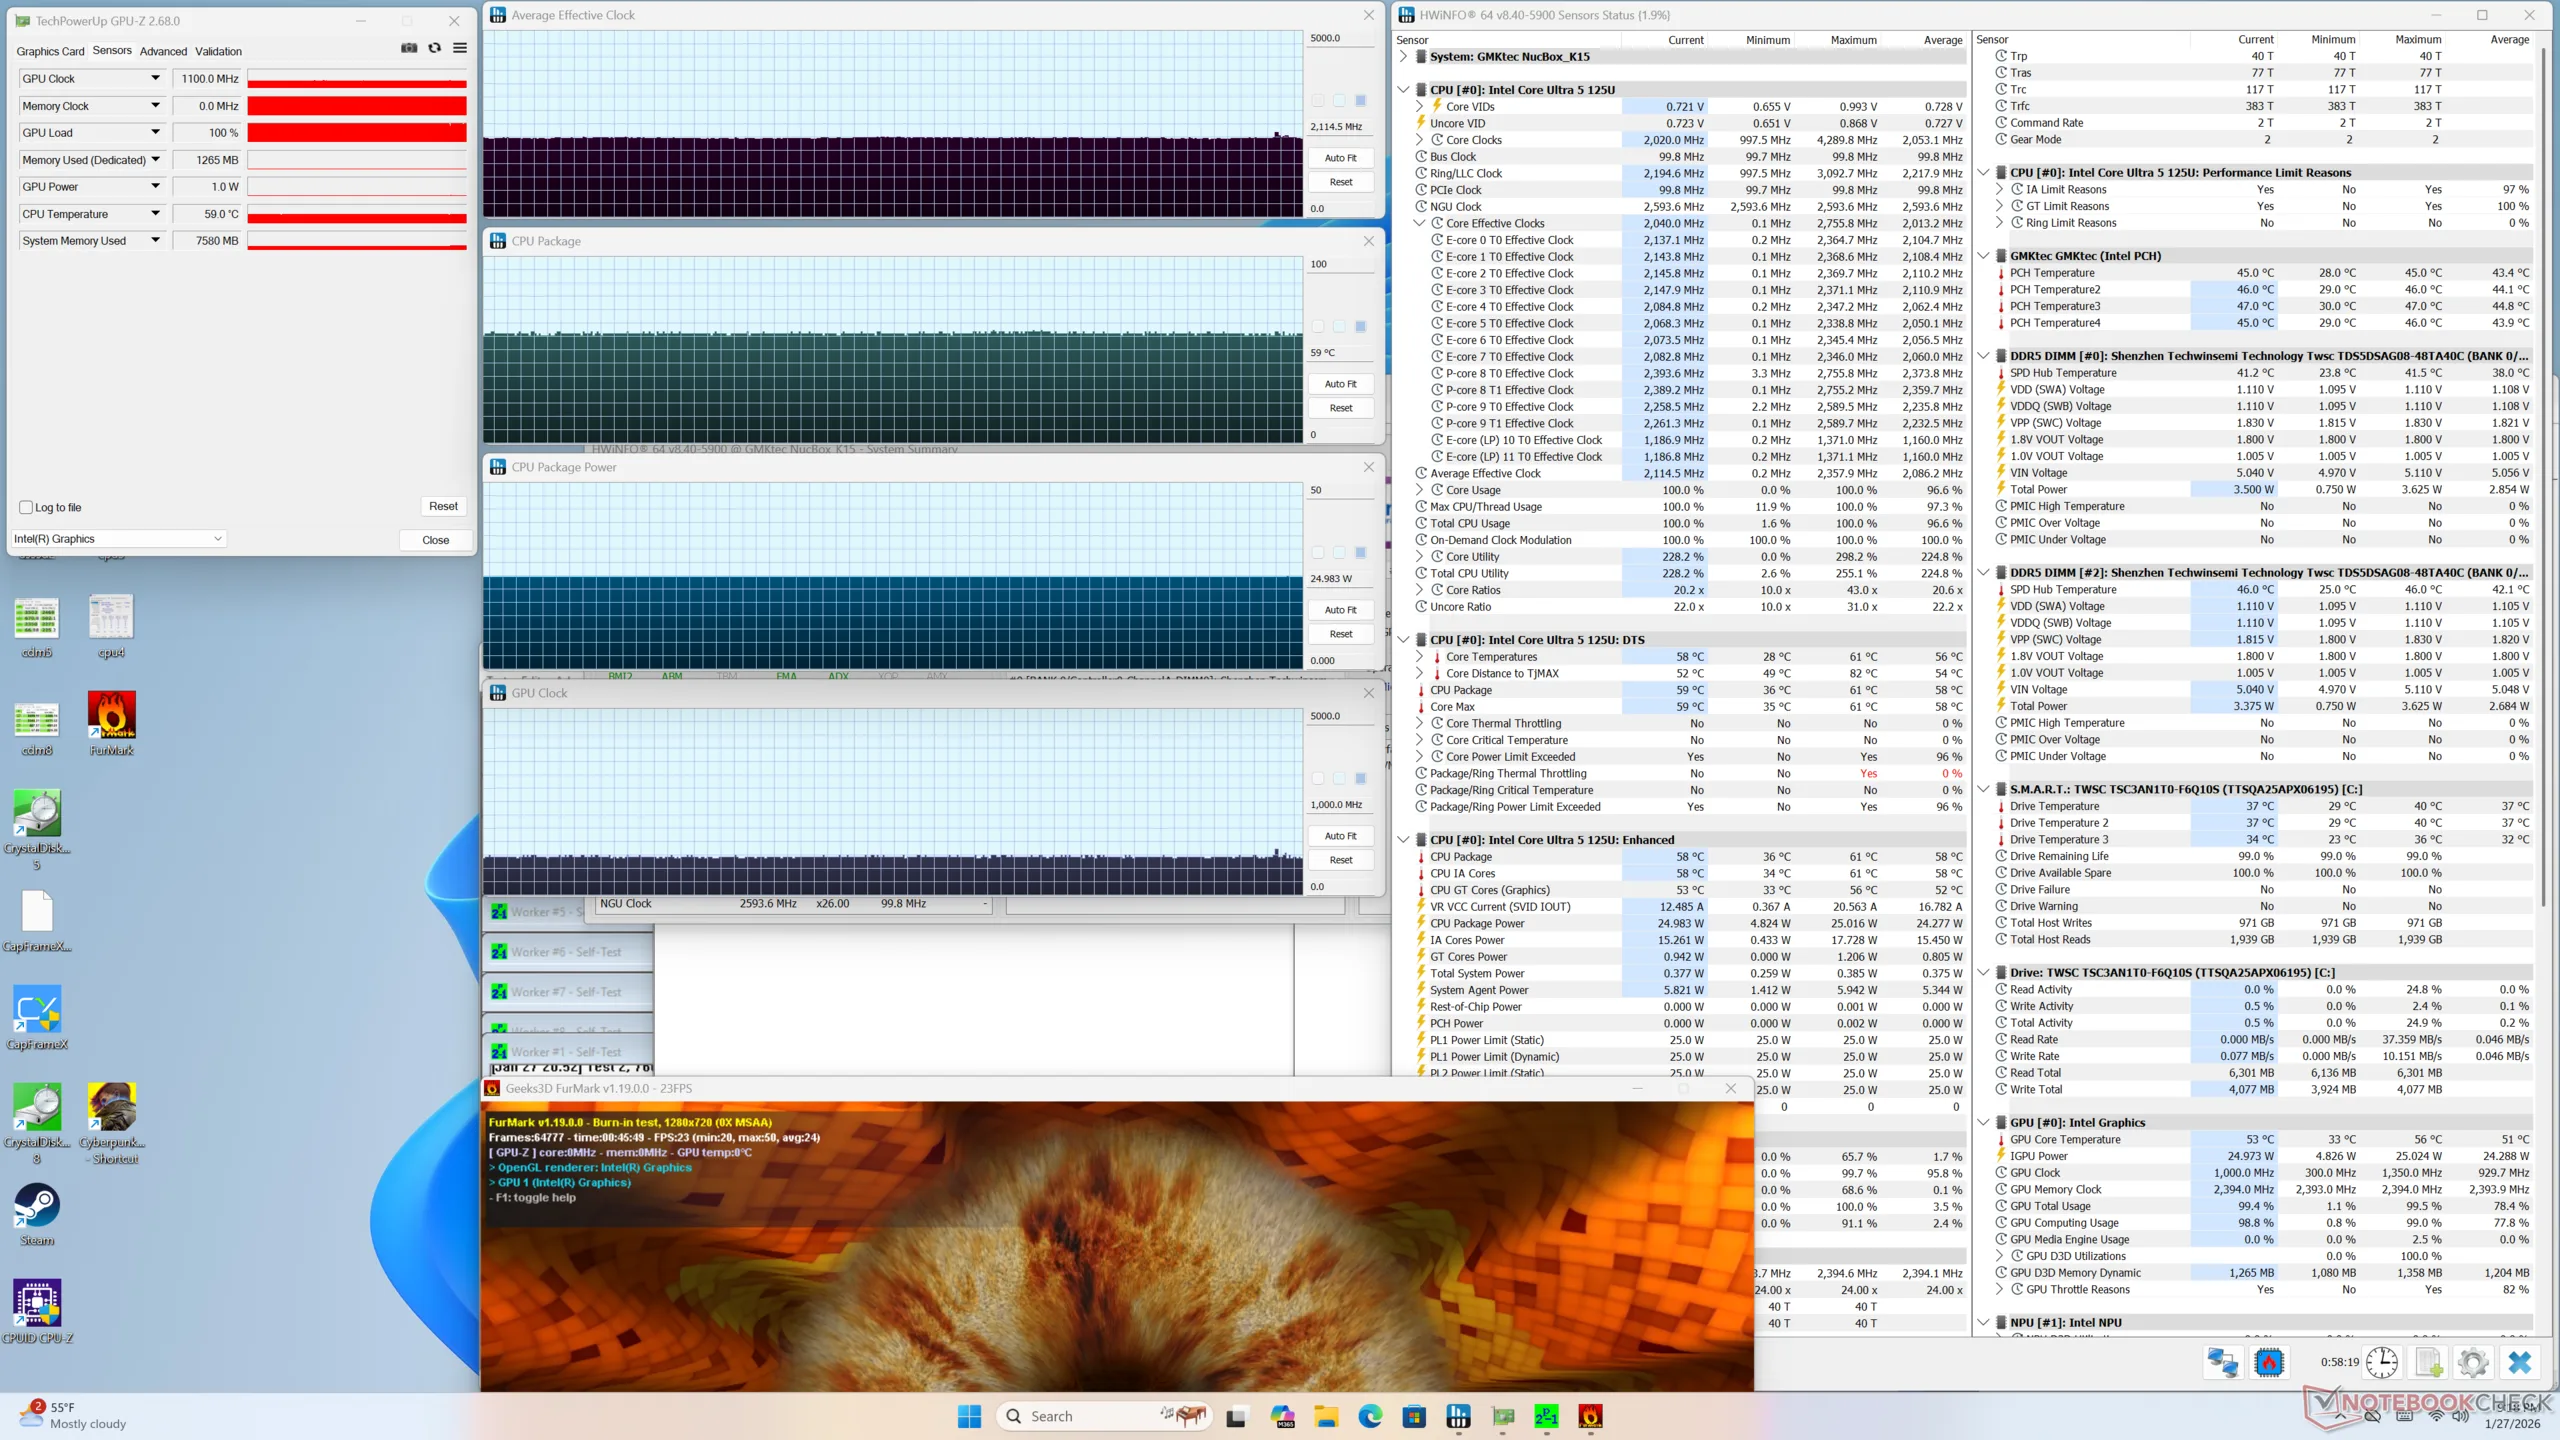
| Taktowanie CPU (GHz) | Taktowanie GPU (MHz) | Średnia temperatura CPU (°C) | |
| System bezczynności | -- | -- | 38 |
| Prime95 Stress | 2.2 | -- | 57 |
| Prime95 + FurMark Stress | 2.1 | 1100 | 59 |
| Cyberpunk 2077 Stress | 0.4 | 1850 | 56 |
Zarządzanie energią
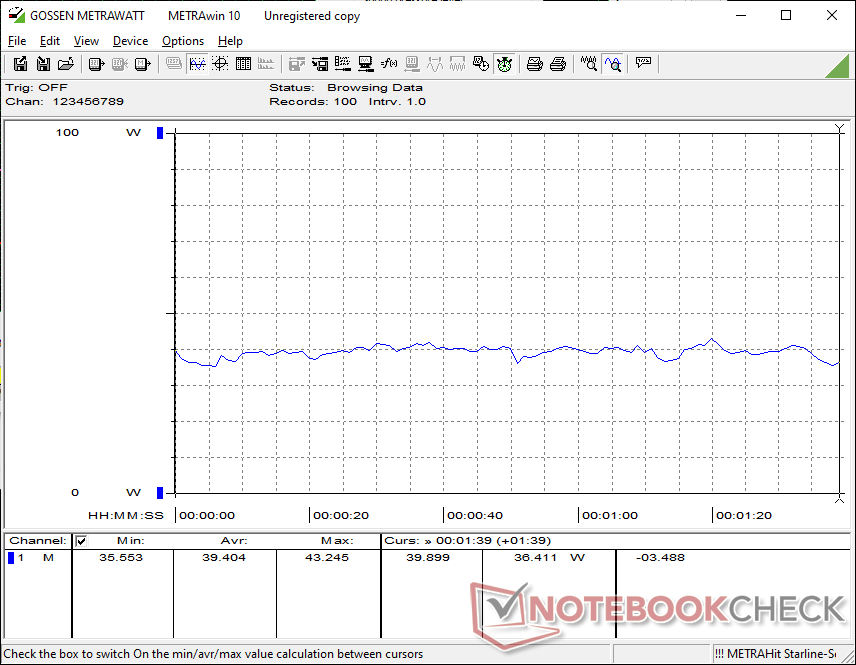
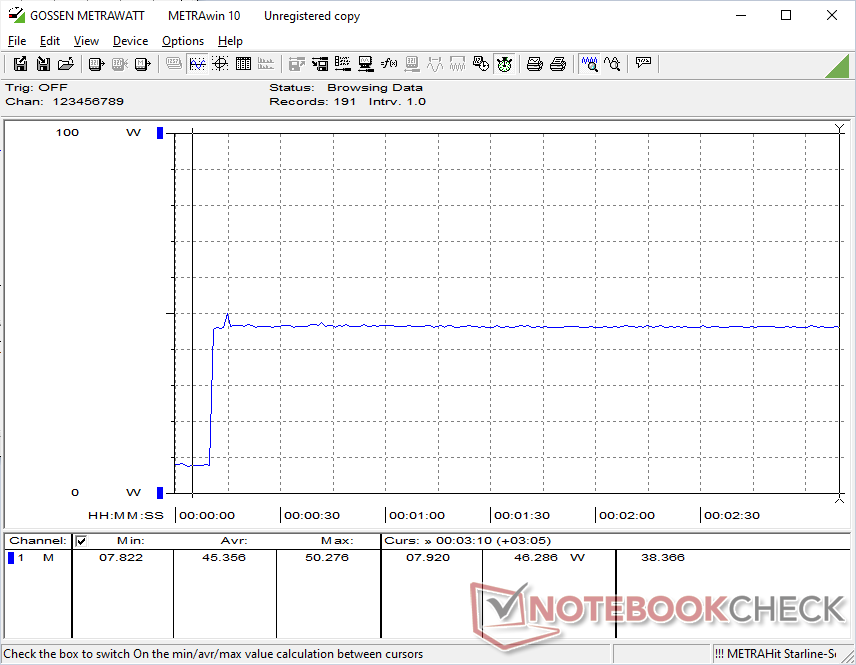
Zużycie energii
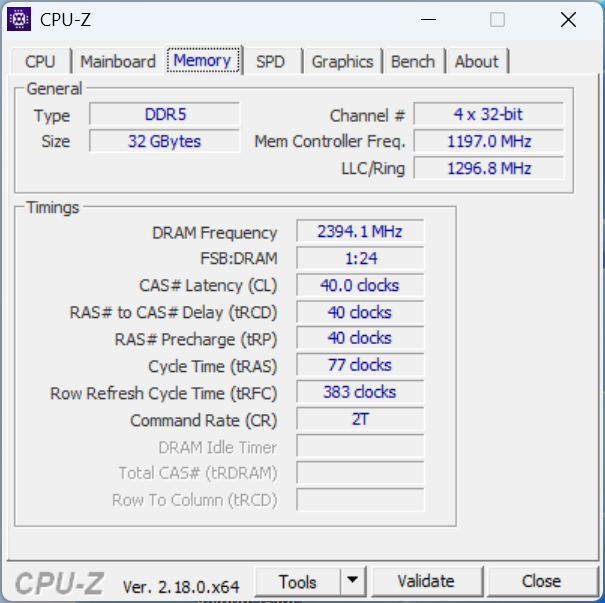
Całkowite zużycie energii jest porównywalne z zasilanym przez Lunar Lake MSI Cubi NUC AI+ 2MG mimo że ten ostatni oferuje znacznie szybszą wydajność graficzną i wyższą wydajność na wat niż nasz GMK. Procesor Meteor Lake-U w NucBox K15, choć nadal bardzo wydajny, zaczyna pokazywać swój wiek w porównaniu z nowszymi architekturami Intela.
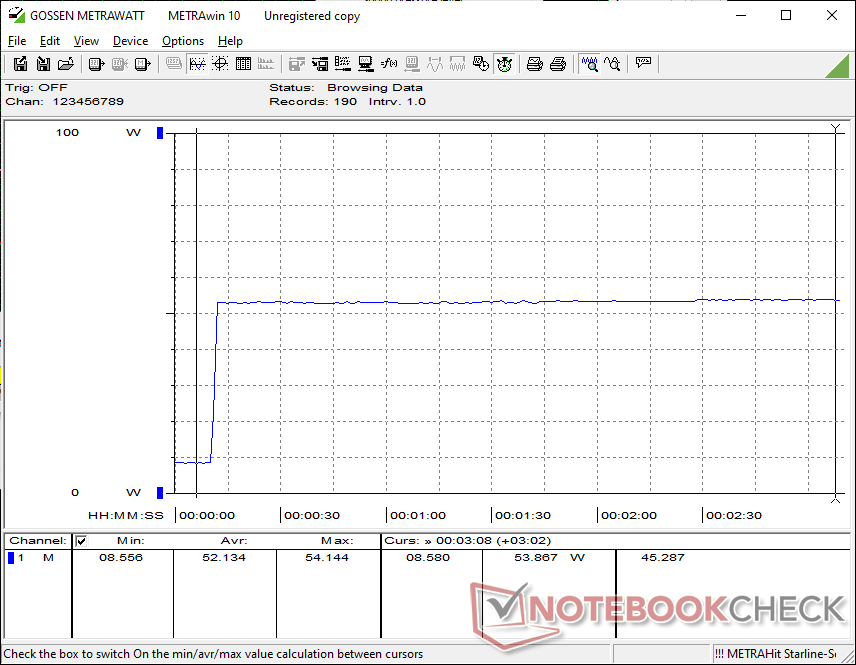
Zużycie energii wyniosłoby maksymalnie 54 W z relatywnie dużego (~13,3 x 5,6 x 3,3 cm) zasilacza sieciowego o mocy 100 W. System może być również zasilany przez zasilacze USB-C innych firm o wystarczającej mocy wyjściowej.

| wyłączony / stan wstrzymania | |
| luz | |
| obciążenie |
|
Legenda:
min: | |
| GMK NucBox K15 Ultra 5 125U, Graphics 4-Core iGPU (Arrow Lake), TWSC TSC3AN1T0-F6Q10S, , x, | MSI Cubi NUC AI+ 2MG Core Ultra 7 258V, Arc 140V, Phison 1 TB ESR01TBTCCZ-27J, , x, | GMK NucBox K12 Ryzen 7 H 255, Radeon 780M, Crucial P3 Plus CT1000P3PSSD8, , x, | Beelink SER9 Pro Ryzen 7 H 255, Radeon 780M, Crucial P3 Plus CT1000P3PSSD8, , x, | BOSGAME M2 R9 7940HS, Radeon 780M, Kingston OM8PGP41024N-A0, , x, | NiPoGi AM06 Pro R7 5700U, Vega 8, AirDisk AFF 10-512G, , x, | |
|---|---|---|---|---|---|---|
| Power Consumption | 12% | -59% | -28% | -39% | 1% | |
| Idle Minimum * (Watt) | 8.1 | 2.9 64% | 9.9 -22% | 7 14% | 6.4 21% | 8.1 -0% |
| Idle Average * (Watt) | 8.2 | 5.7 30% | 10.1 -23% | 7.1 13% | 7.3 11% | 10.1 -23% |
| Idle Maximum * (Watt) | 9.3 | 10.2 -10% | 13.1 -41% | 7.5 19% | 7.5 19% | 12.6 -35% |
| Load Average * (Watt) | 39.4 | 38.7 2% | 69.8 -77% | 62.3 -58% | 75 -90% | 29.7 25% |
| Cyberpunk 2077 ultra external monitor * (Watt) | 40.1 | 41.1 -2% | 86.3 -115% | 80.1 -100% | 83 -107% | 29.7 26% |
| Load Maximum * (Watt) | 53.4 | 60 -12% | 92.8 -74% | 82.9 -55% | 99.9 -87% | 48.2 10% |
* ... im mniej tym lepiej
Pobór mocy Cyberpunk / Test warunków skrajnych
Zużycie energii przez monitor zewnętrzny
Ocena Notebookcheck
Cichy, chłodny i wyposażony w wiele portów, NucBox K15 jest dobrym wyborem do cichej produktywności i scenariuszy HTPC, ale przestarzała wydajność GPU i nieporęczna obudowa "mini" ograniczają jego atrakcyjność.
GMK NucBox K15
- 05/02/2026 v8
Allen Ngo
 Total Sustainability Score:
 Potencjalni konkurenci w porównaniu
Obraz | Model / recenzja | Cena | Waga | Wysokość | Ekran |
|---|---|---|---|---|---|
1. 72.9% 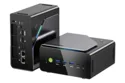 | GMK NucBox K15 Intel Core Ultra 5 125U ⎘ Intel Graphics 4-Core iGPU (Meteor / Arrow Lake) ⎘ 32 GB Pamięć, 1024 GB SSD | Amazon: Cena katalogowa: 600 USD | 885 g | 78 mm | x |
2. 75.2% 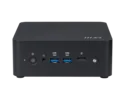 | MSI Cubi NUC AI+ 2MG Intel Core Ultra 7 258V ⎘ Intel Arc Graphics 140V ⎘ 32 GB Pamięć, 1000 GB SSD | Amazon: Cena katalogowa: 900 USD | 669 g | 50.1 mm | x |
3. 73.7% 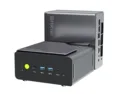 | GMK NucBox K12 AMD Ryzen 7 H 255 ⎘ AMD Radeon 780M ⎘ 32 GB Pamięć, 1024 GB SSD | Amazon: 1. $739.99 GMKtec Gaming Mini PC AMD Ry... 2. $29.99 19V~20V Charger for GMKtec M... | 938 g | 78 mm | x |
4. 80.2% 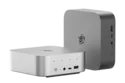 | Beelink SER9 Pro AMD Ryzen 7 H 255 ⎘ AMD Radeon 780M ⎘ 32 GB Pamięć, 1024 GB SSD | Amazon: Cena katalogowa: 520 USD | 812 g | 44.7 mm | x |
5. 79% 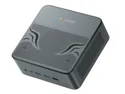 | BOSGAME M2 AMD Ryzen 9 7940HS ⎘ AMD Radeon 780M ⎘ 32 GB Pamięć, 1024 GB SSD | Amazon: 1. $788.95 BOSGAME eGPU Graphic Card Do... 2. $279.99 BOSGAME E2 Mini PC 11 Pro, A... 3. $498.99 BOSGAME P3 Mini PC AMD Ryzen... Cena katalogowa: 600 USD | 819 g | 51 mm | x |
6. 62.9% 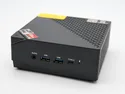 | NiPoGi AM06 Pro AMD Ryzen 7 5700U ⎘ AMD Radeon RX Vega 8 (Ryzen 4000/5000) ⎘ 16 GB Pamięć, 512 GB SSD | Amazon: Cena katalogowa: 459€ | 484 g | 47 mm | x |
Przezroczystość
Wyboru urządzeń do recenzji dokonuje nasza redakcja. Próbka testowa została udostępniona autorowi jako pożyczka od producenta lub sprzedawcy detalicznego na potrzeby tej recenzji. Pożyczkodawca nie miał wpływu na tę recenzję, producent nie otrzymał też kopii tej recenzji przed publikacją. Nie było obowiązku publikowania tej recenzji. Jako niezależna firma medialna, Notebookcheck nie podlega władzy producentów, sprzedawców detalicznych ani wydawców.
Tak testuje Notebookcheck
Każdego roku Notebookcheck niezależnie sprawdza setki laptopów i smartfonów, stosując standardowe procedury, aby zapewnić porównywalność wszystkich wyników. Od około 20 lat stale rozwijamy nasze metody badawcze, ustanawiając przy tym standardy branżowe. W naszych laboratoriach testowych doświadczeni technicy i redaktorzy korzystają z wysokiej jakości sprzętu pomiarowego. Testy te obejmują wieloetapowy proces walidacji. Nasz kompleksowy system ocen opiera się na setkach uzasadnionych pomiarów i benchmarków, co pozwala zachować obiektywizm.
