Werdykt - praktyczny i długotrwały
EliteBook 8 Flip G1i 13 to wielki krok naprzód w stosunku do poprzednika EliteBook x360 830 G10. Oprócz tego, że nowy model jest cieńszy i szybszy, jak można by się spodziewać, jest on znacznie bardziej wydajny dzięki procesorowi Arrow Lake-U, jednocześnie poprawiając wiele aspektów fizycznych, takich jak klawiatura, clickpad i porty. Czas pracy na baterii i głośniki są powyżej średniej i lepsze niż oczekiwano, zwłaszcza biorąc pod uwagę niewielką obudowę. Podstawowe funkcje biznesowe, takie jak WAN, Smart Card i super jasny wyświetlacz Sure View pozostają opcjonalne dla tych, którzy ich potrzebują.
Kluczową wadą nowego modelu jest brak opcji wyświetlania, ponieważ wszystkie obecne konfiguracje są ograniczone do 1200p IPS i 60 Hz. Użytkownicy, którzy wymagają kolorów P3, OLED, obsługi HDR lub płynniejszego GUI, będą zatem musieli rozważyć modele z wyższej półki z serii EliteBook Ultra lub EliteBook X. Procesor graficzny Arc 4, choć przyzwoity dla 13-calowego kabrioletu, jest również słabszy w porównaniu do innych zintegrowanych rozwiązań, takich jak Arc 140T lub seria Radeon 800M/900M. Co więcej, dołączony rysik jest cieńszy lub węższy niż rysik do tabletu Tabletu Surface jest trudniejsze do uchwycenia. Dławienie dysku SSD i stosunkowo wysokie temperatury rdzenia mogą sugerować, że niewielkiemu rozwiązaniu chłodzącemu przydałaby się modernizacja.
Za
Przeciw
Cena i dostępność
HP wysyła teraz EliteBook 8 Flip G1i 13 w cenie od 2315 USD za konfigurację podstawową lub około 3600 USD za wersję recenzowaną. Opcje są również dostępne na Amazon za 2100 USD.
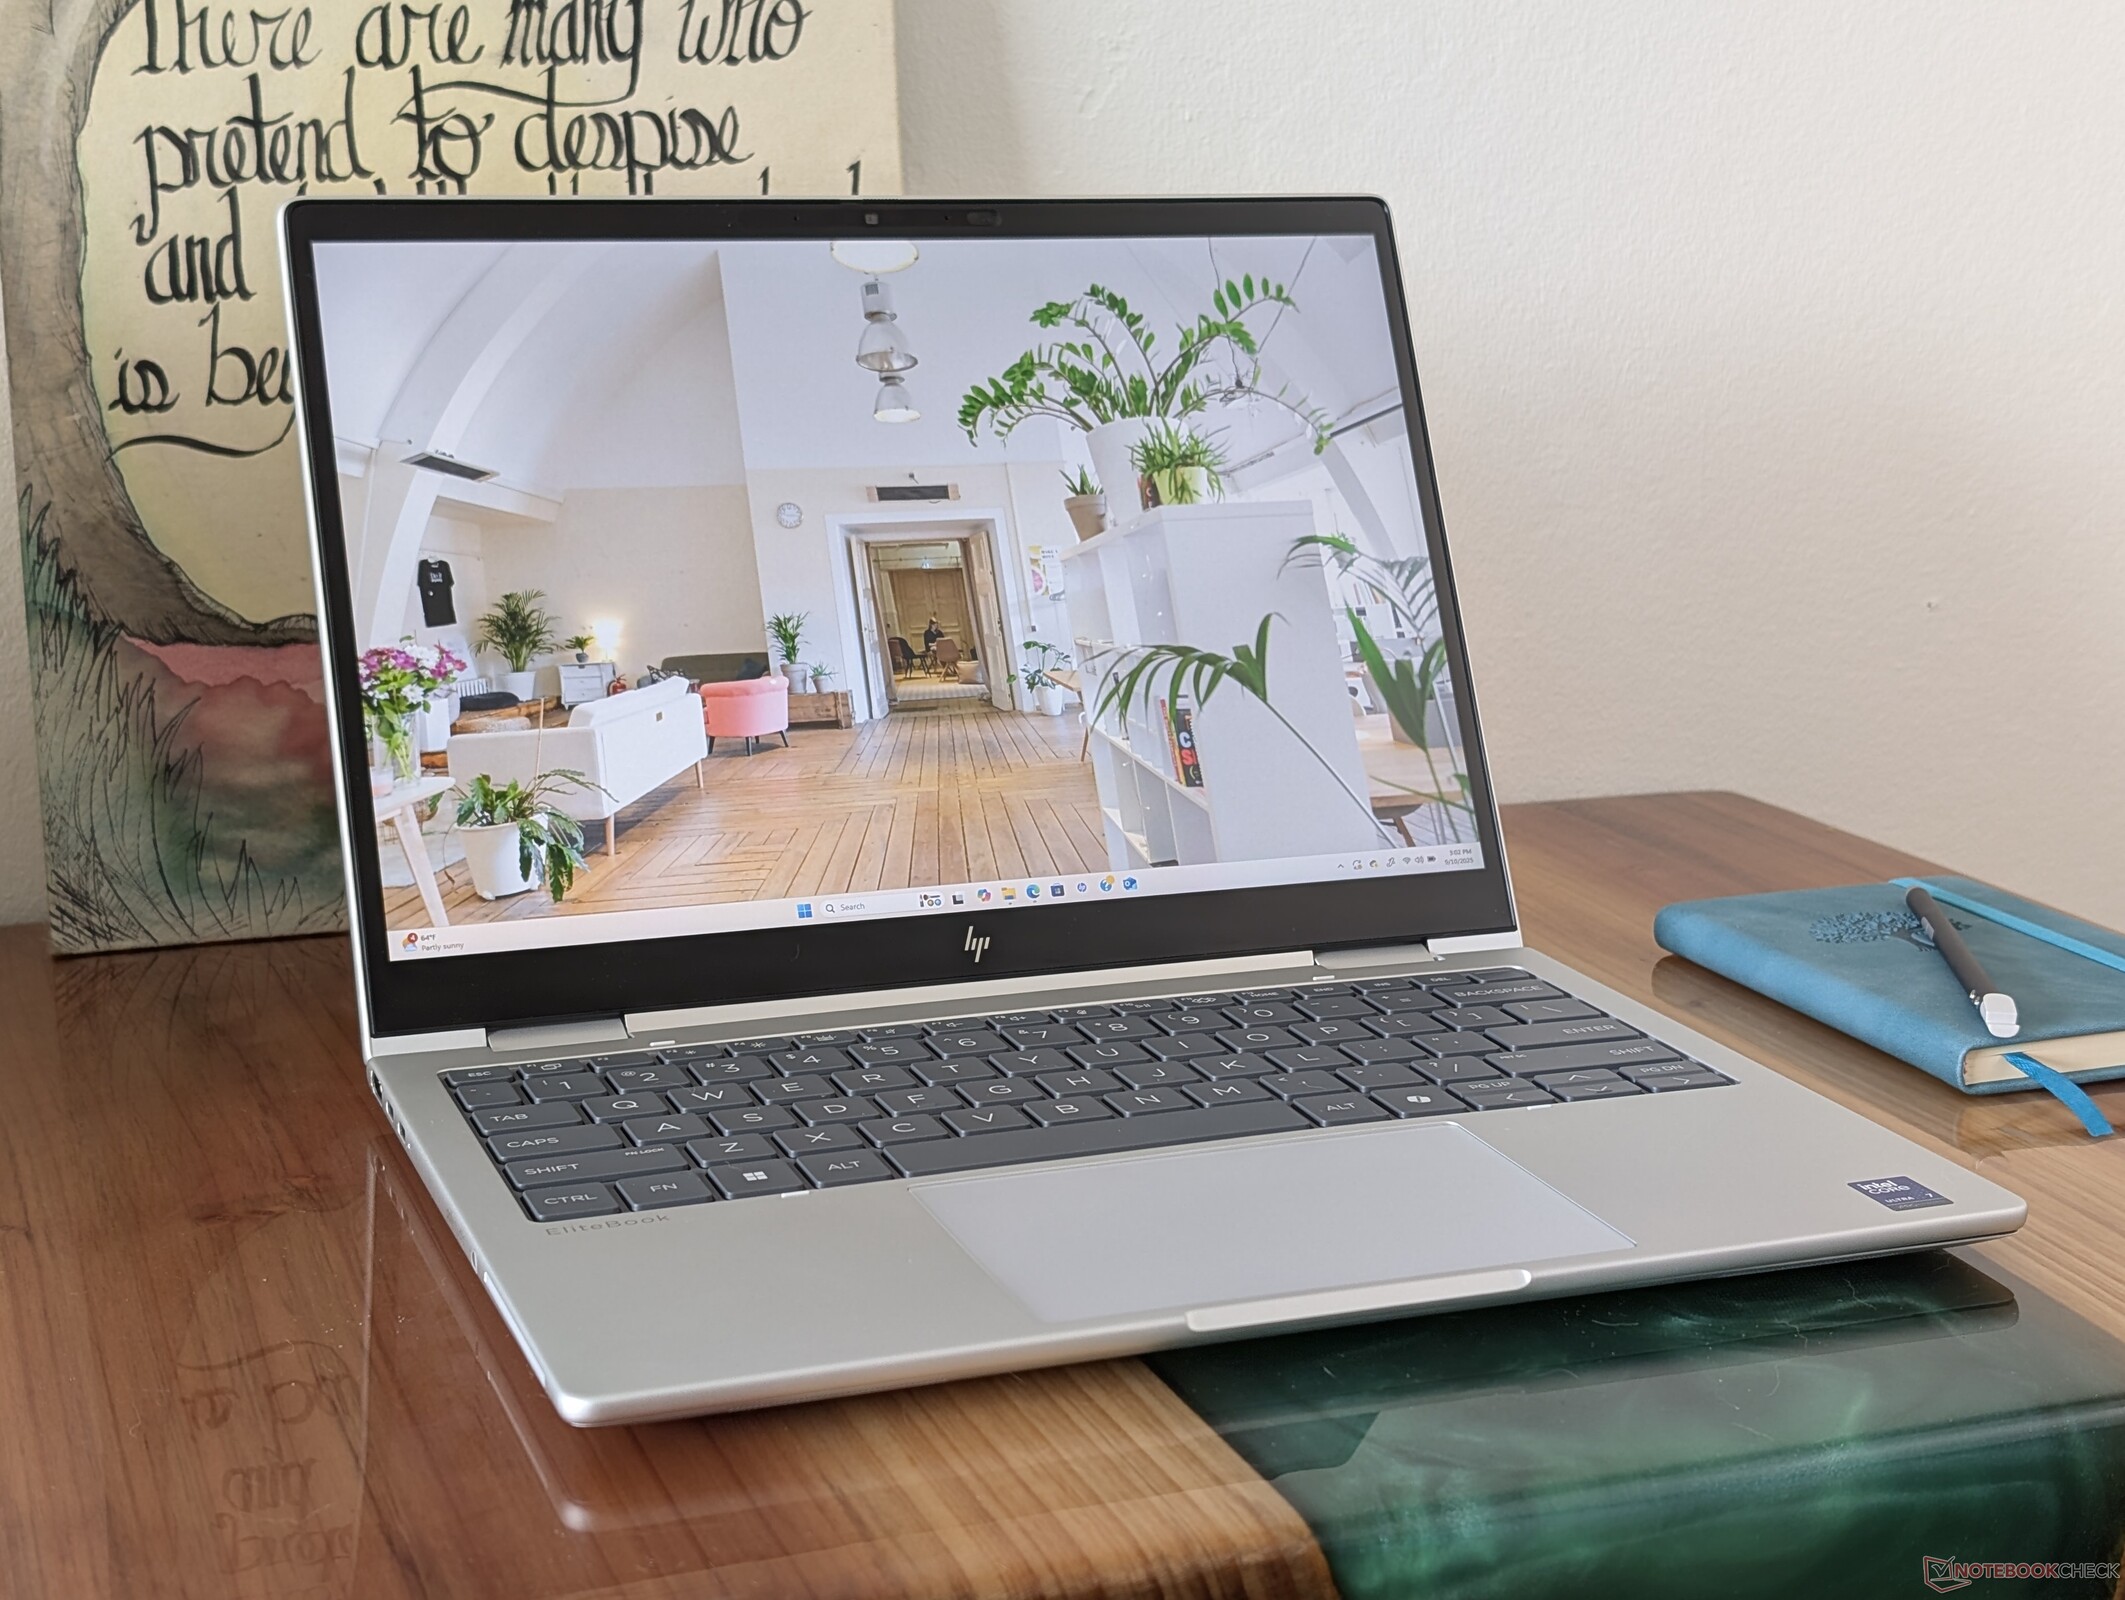
HP EliteBook 8 Flip G1i 13 zastępuje zeszłoroczny model EliteBook x360 830 G10. Wprowadza on zarówno nowy wygląd zewnętrzny, jak i nowe opcje procesorów Arrow Lake-U, które zastępują starszą generację Raptor Lake-U.
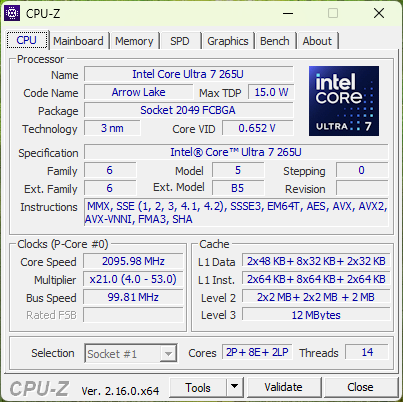
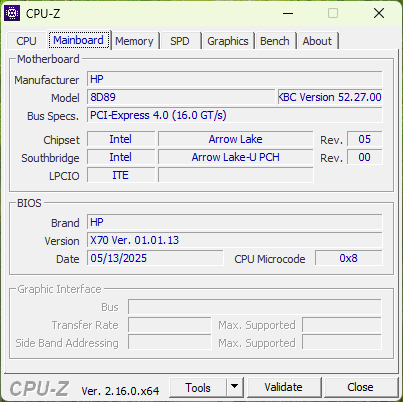
Nasza jednostka testowa została skonfigurowana z procesorem Core Ultra 7 265U, 32 GB pamięci RAM i ekranem dotykowym IPS 1200p za około 3600 USD na HP.com. Konkurenci obejmują inne 13-calowe konwertowalne komputery prosumenckie lub biznesowe, takie jak Lenovo ThinkPad L13 Yoga, Asus ProArt PZ13lub MSI Summit E13 AI Evo.
Więcej recenzji HP:
Specyfikacje
Sprawa
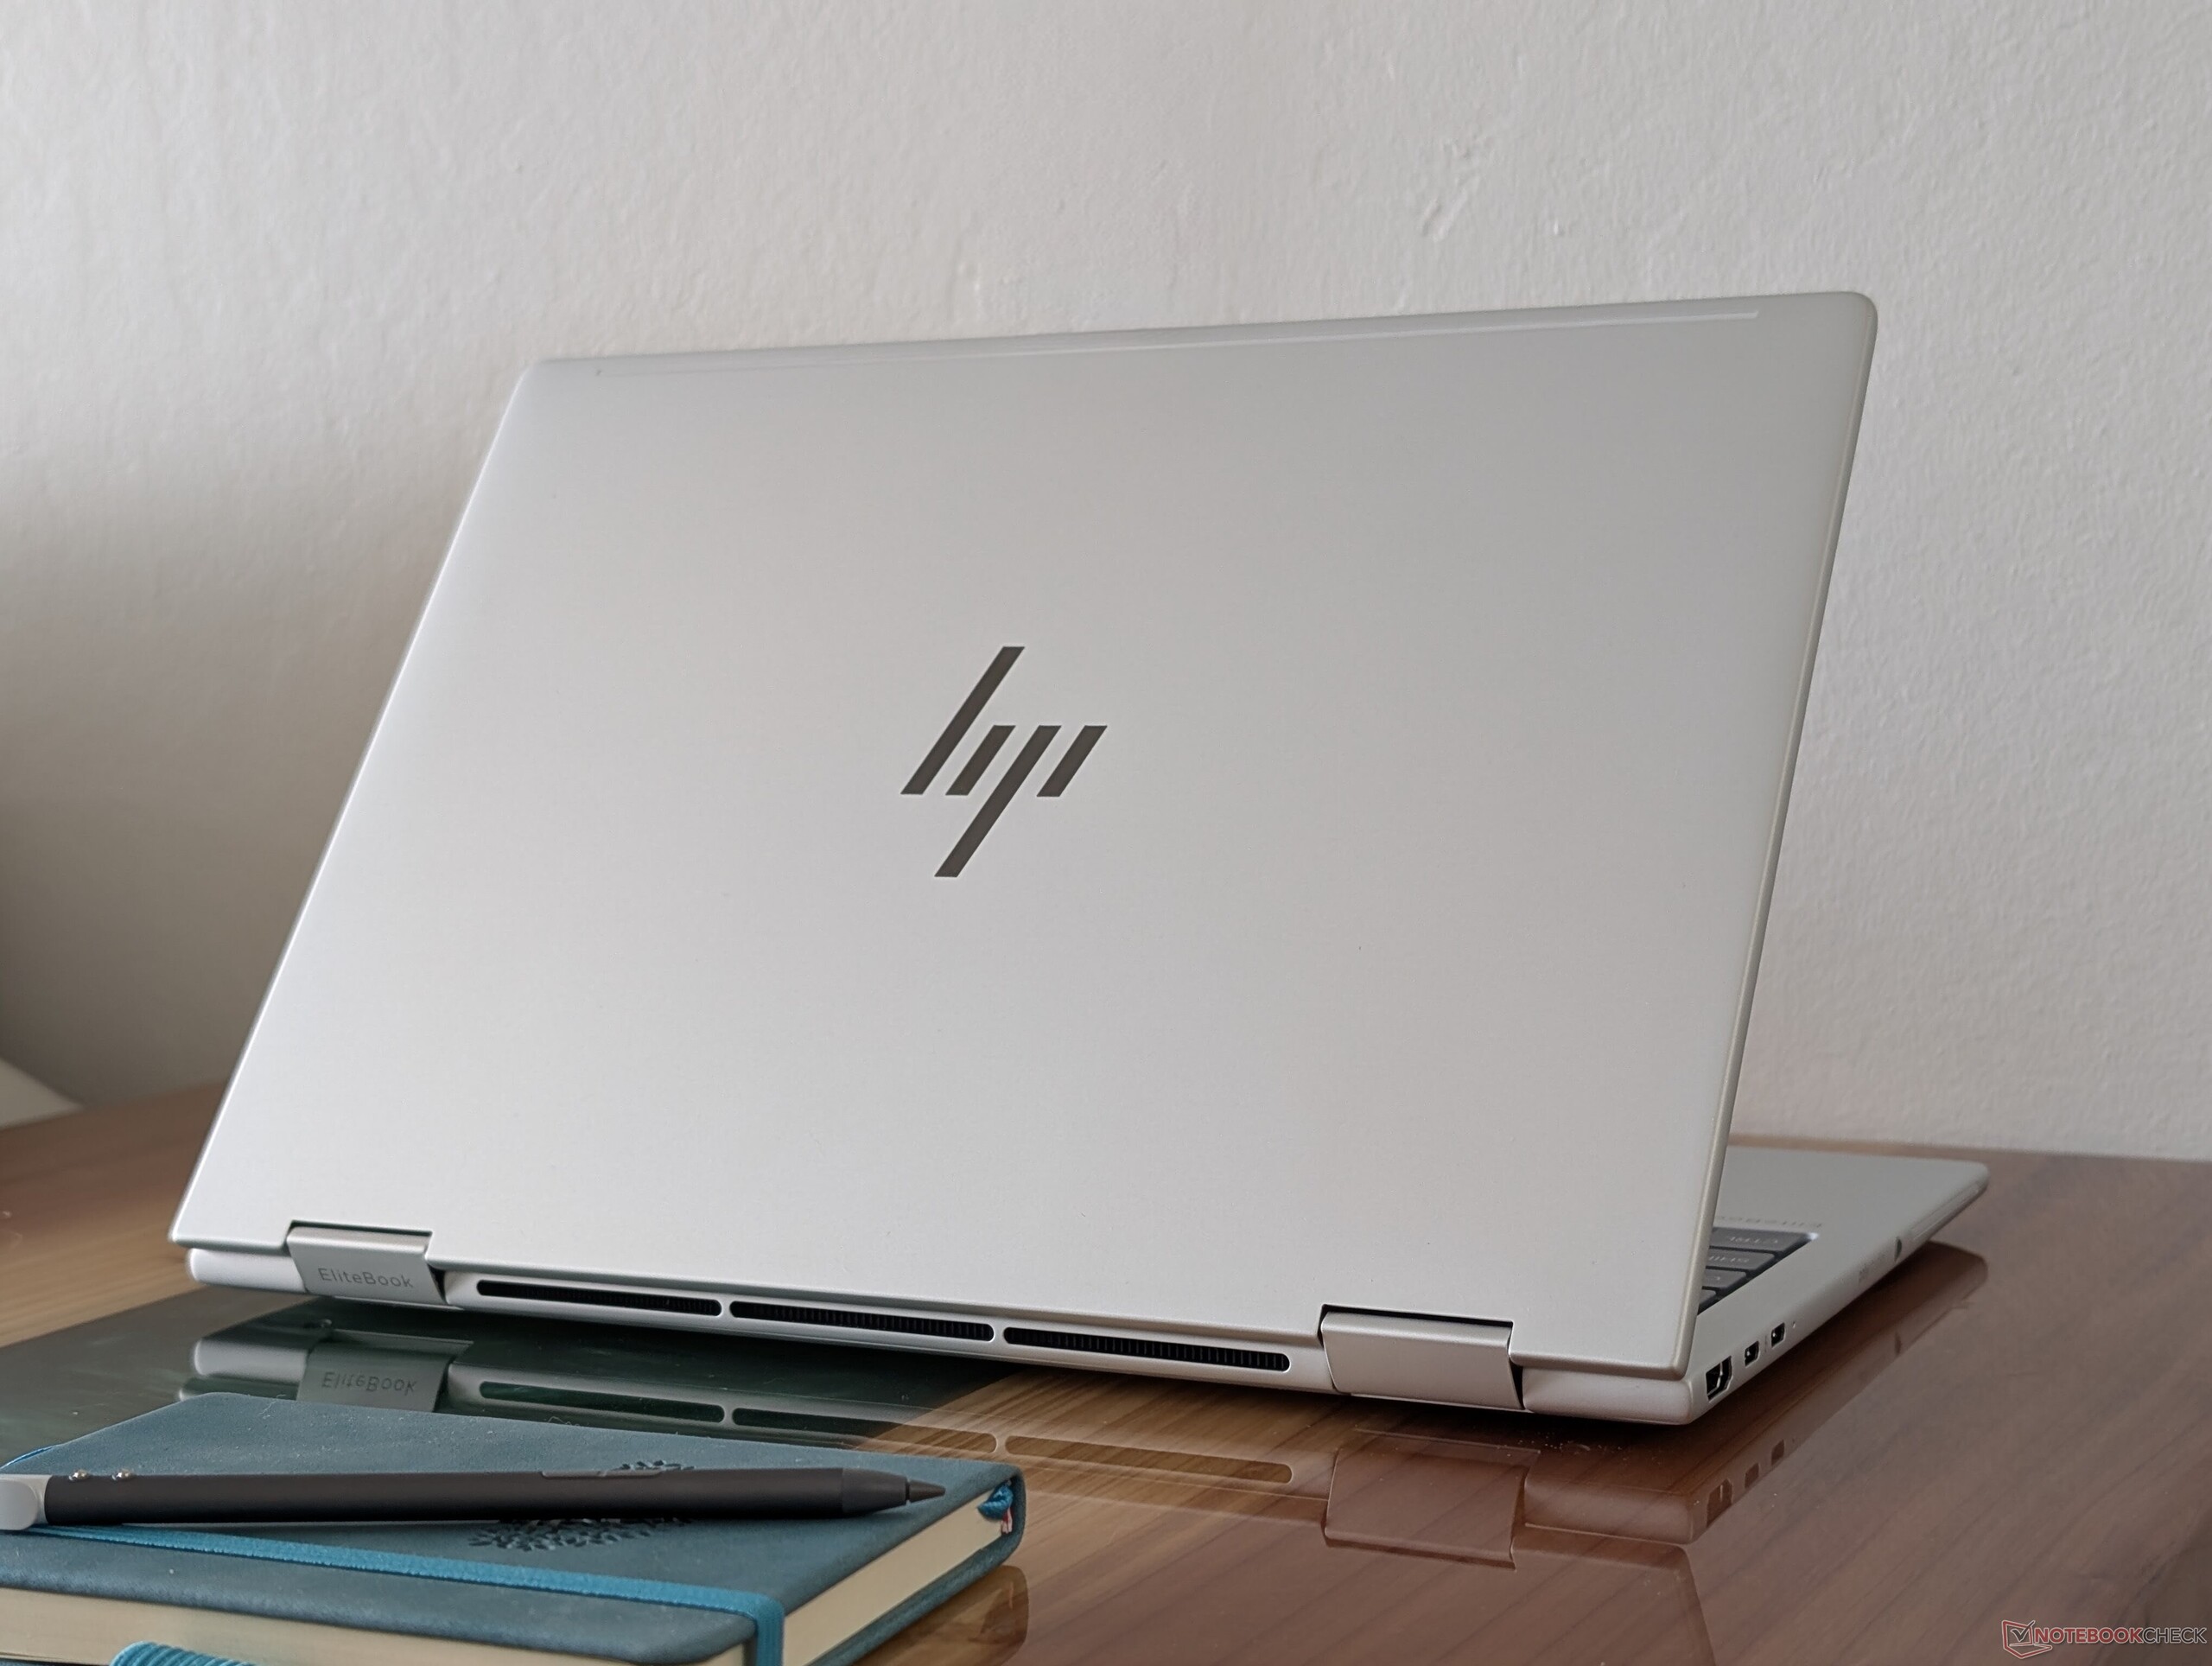
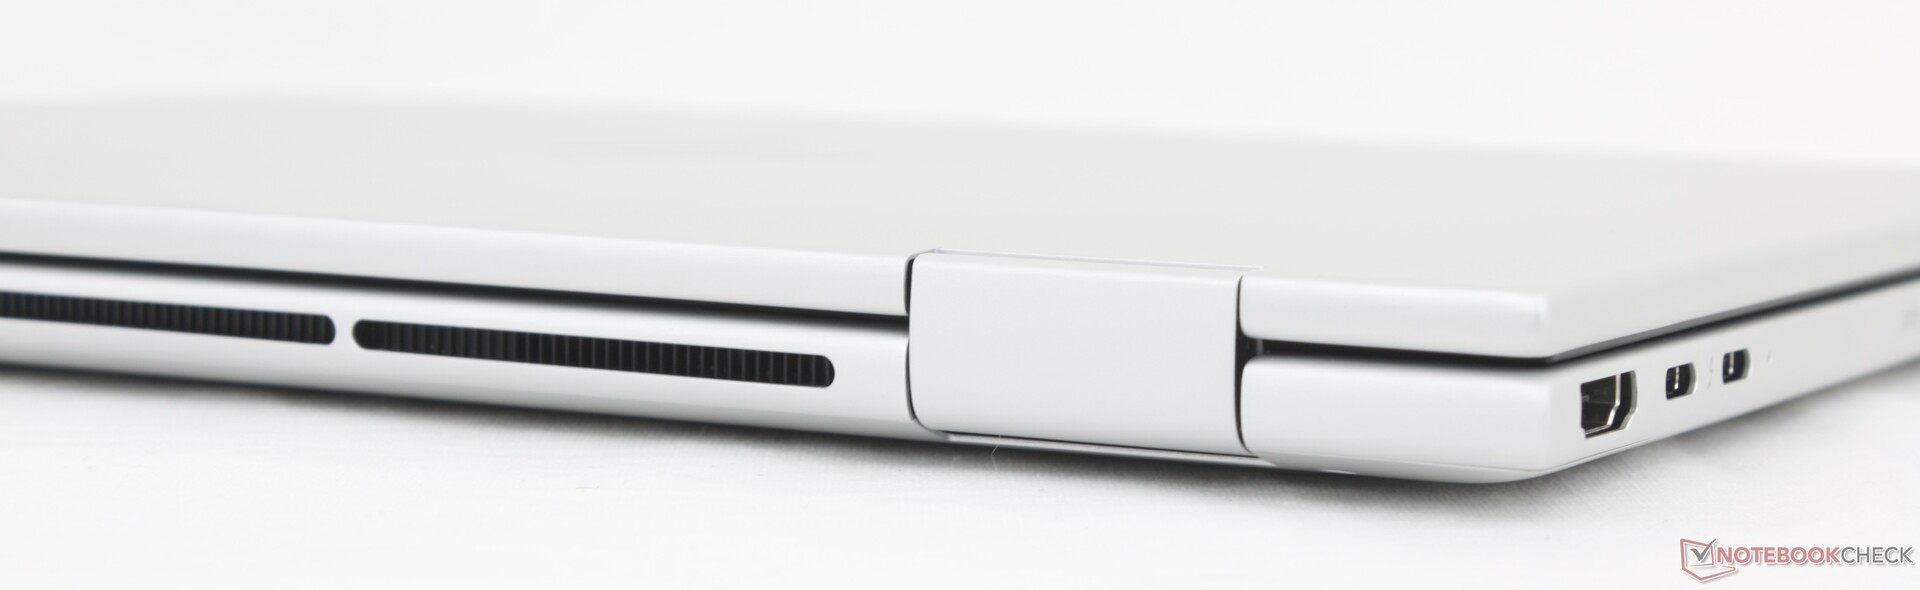
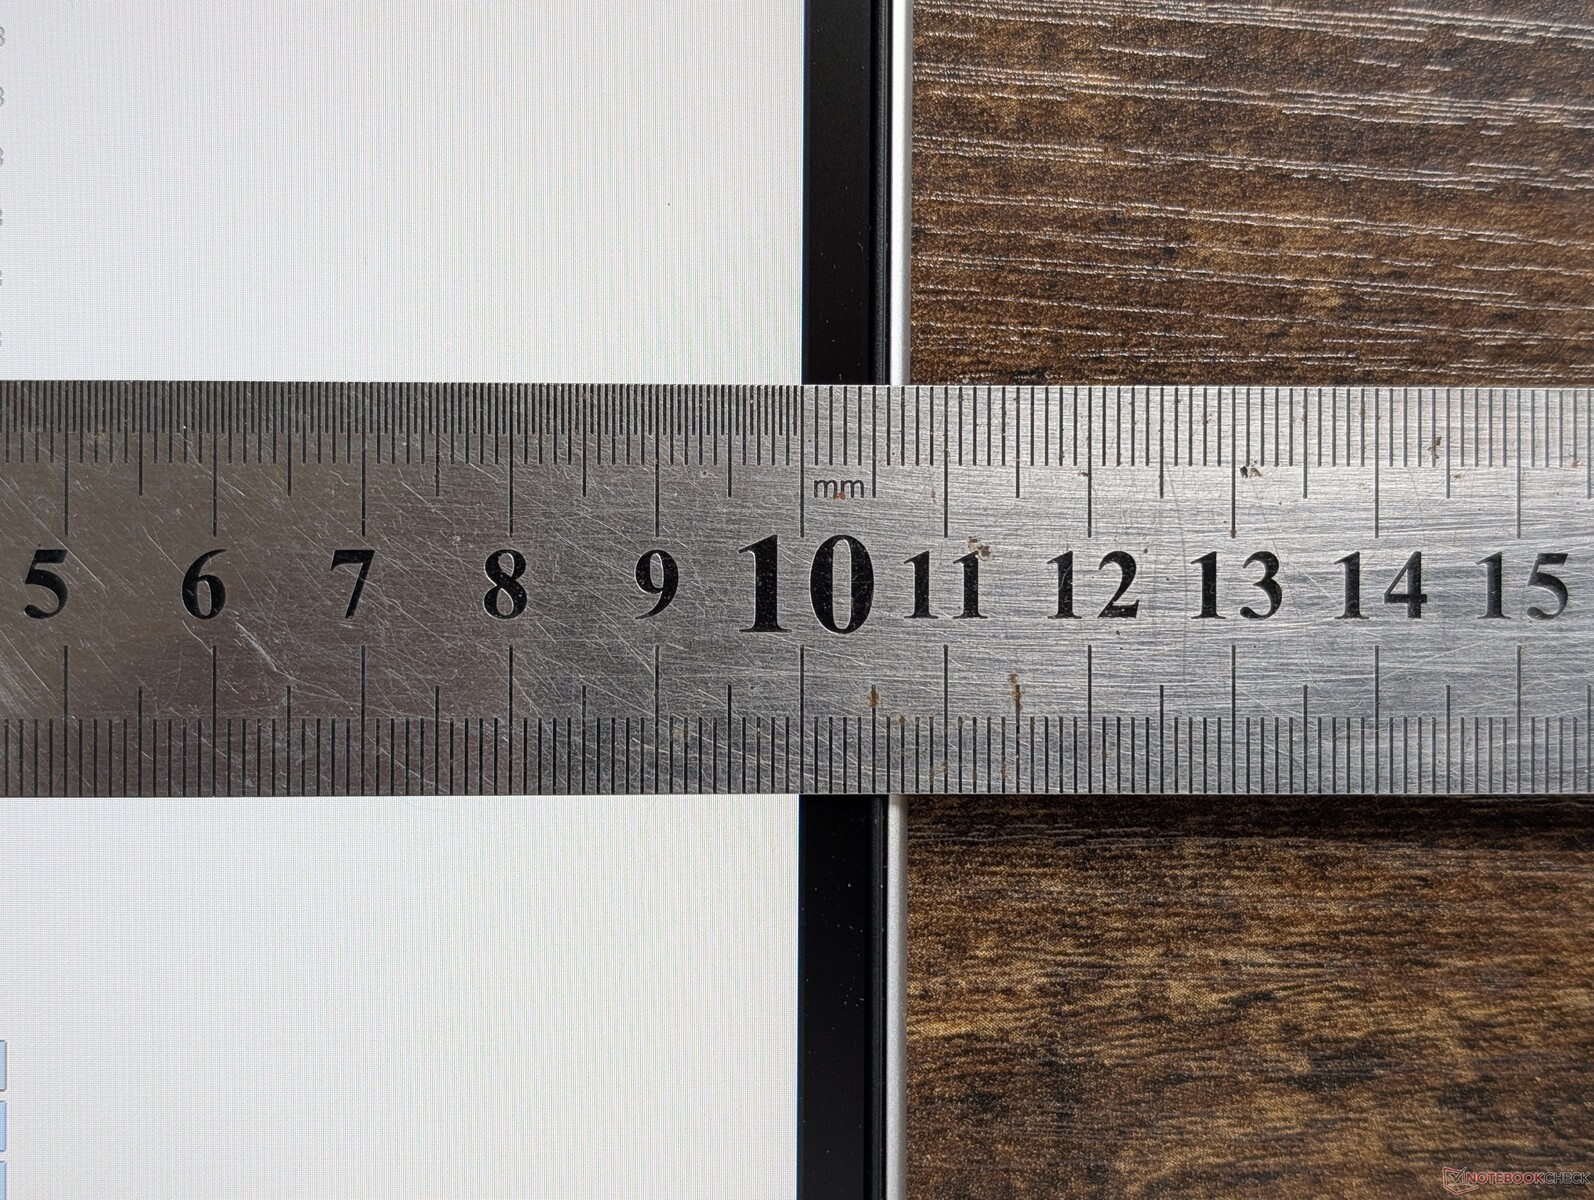
Obudowa składa się z podobnych metalowych materiałów, co większość innych modeli EliteBook, w tym odchodzący EliteBook x360 830 G10, co zapewnia znajomy wygląd i dotyk. W tym roku nowszy szkielet jest cieńszy o kilka milimetrów, zachowując prawie taką samą długość, szerokość i wagę.
Łączność
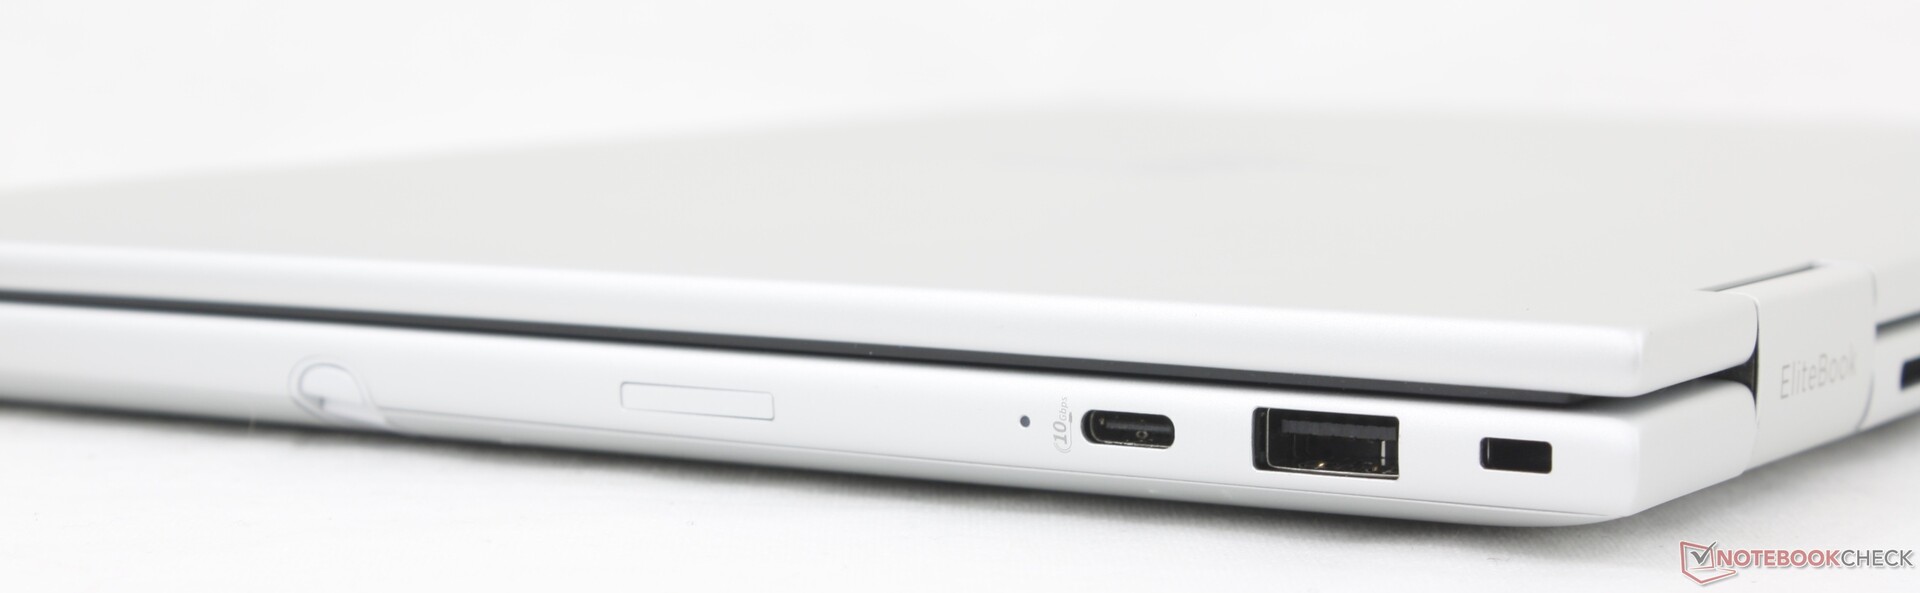
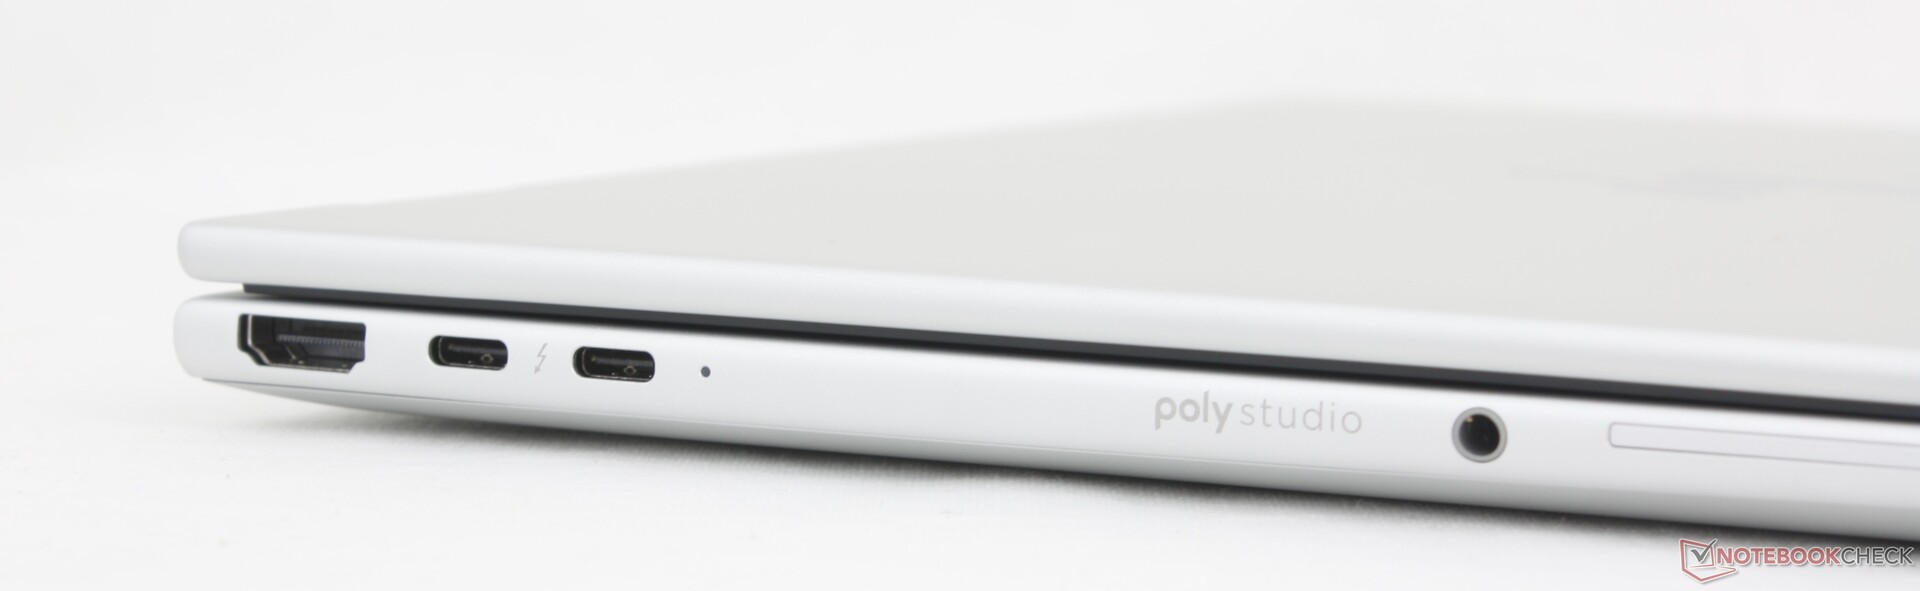
Model ten zamienia jeden port USB-A na trzeci port USB-C w porównaniu do EliteBook x360 830 G10.
Komunikacja
Kamera internetowa
Kamera internetowa 5 MP jest standardowo wyposażona w podczerwień i fizyczną przesłonę prywatności.

, Ultra 7 265U, Samsung PM9A1 MZVL2512HCJQ")
, Ultra 7 265U, Samsung PM9A1 MZVL2512HCJQ")
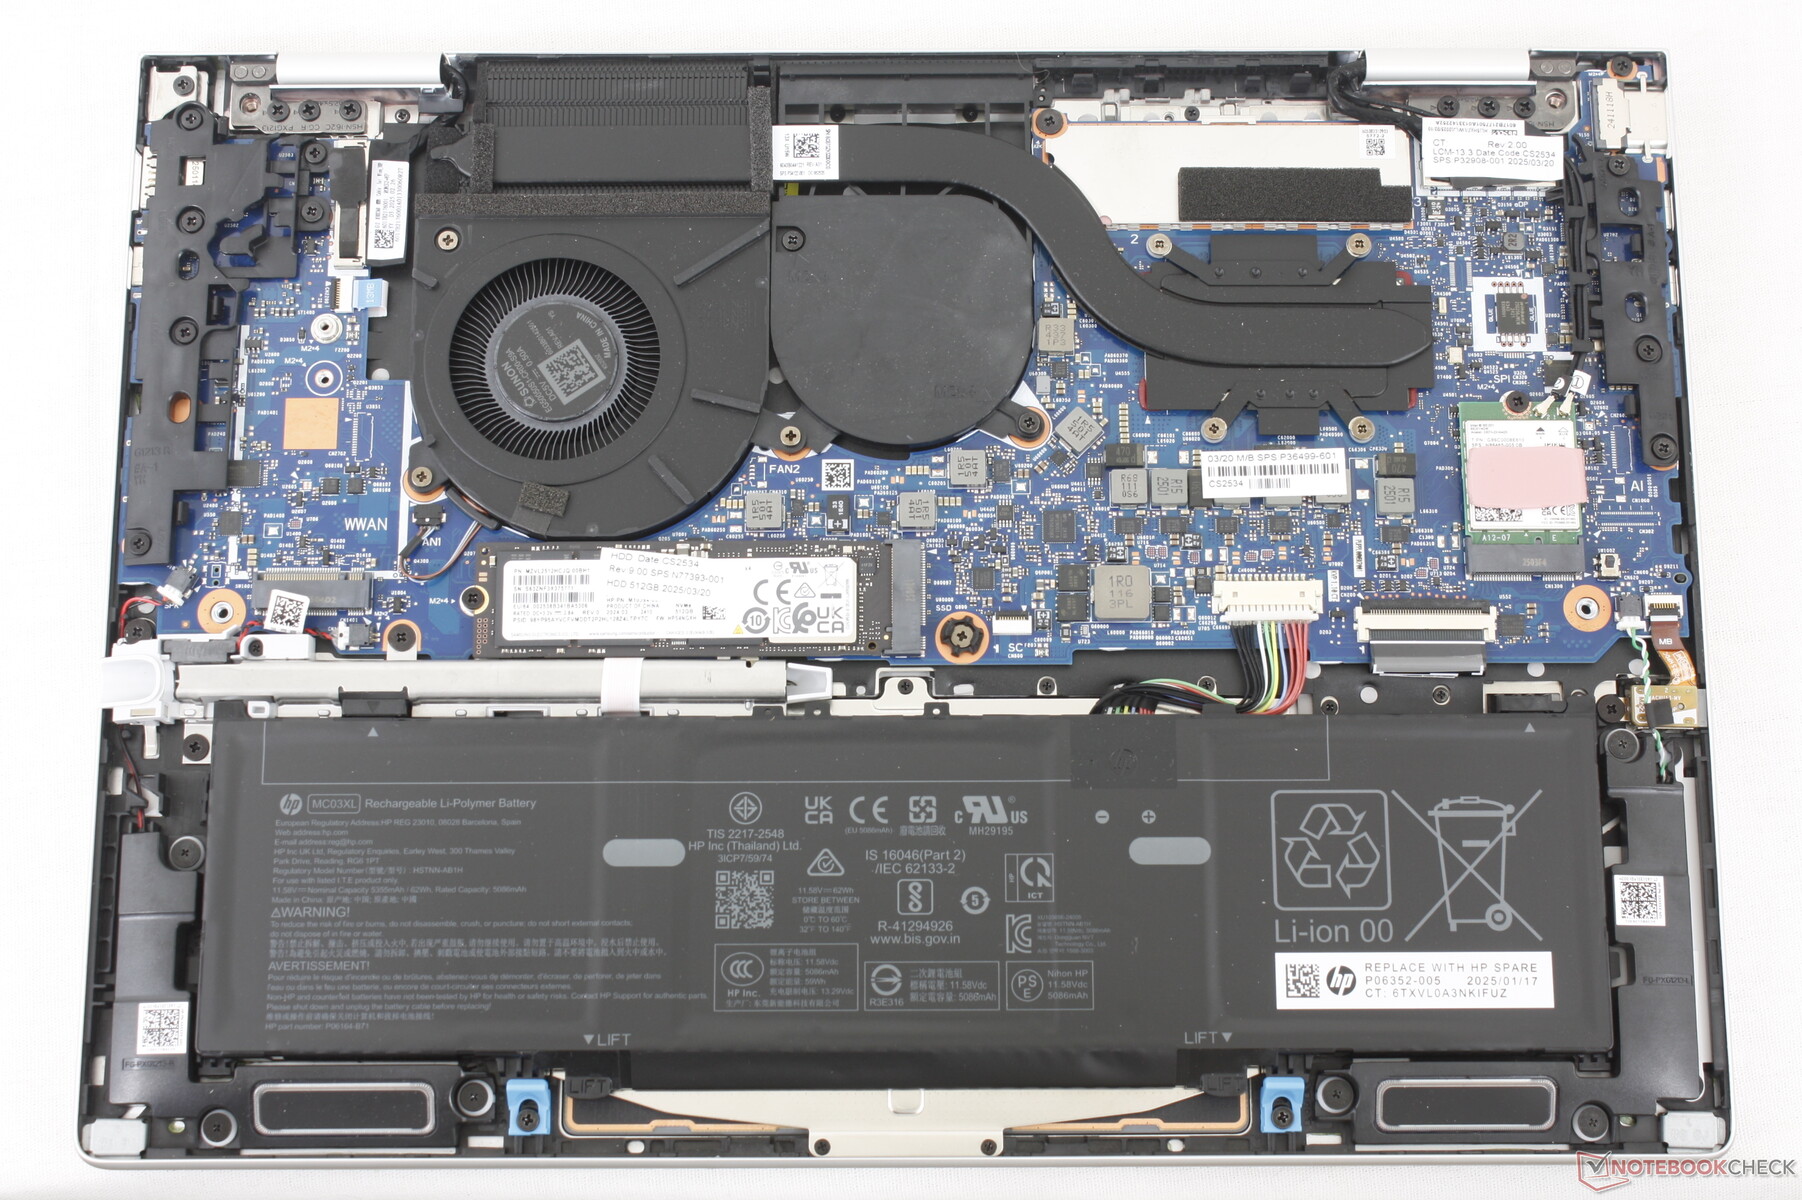
Konserwacja
Dolny panel wymaga jedynie śrubokręta krzyżakowego dla łatwego serwisowania.
Zrównoważony rozwój
Około 50 do 70 procent tworzyw sztucznych i 80 procent metalu użytego podczas produkcji pochodzi z recyklingu. Opakowanie w pełni nadaje się do recyklingu, ale niektóre plastikowe opakowania są obecne na zasilaczu AC.
Akcesoria i gwarancja
W zestawie znajduje się aktywny rysik, który można schować w schowku na pióro wzdłuż prawej krawędzi laptopa. W standardzie otrzymują Państwo roczną ograniczoną gwarancję producenta.
Urządzenia wejściowe
Klawiatura i panel dotykowy
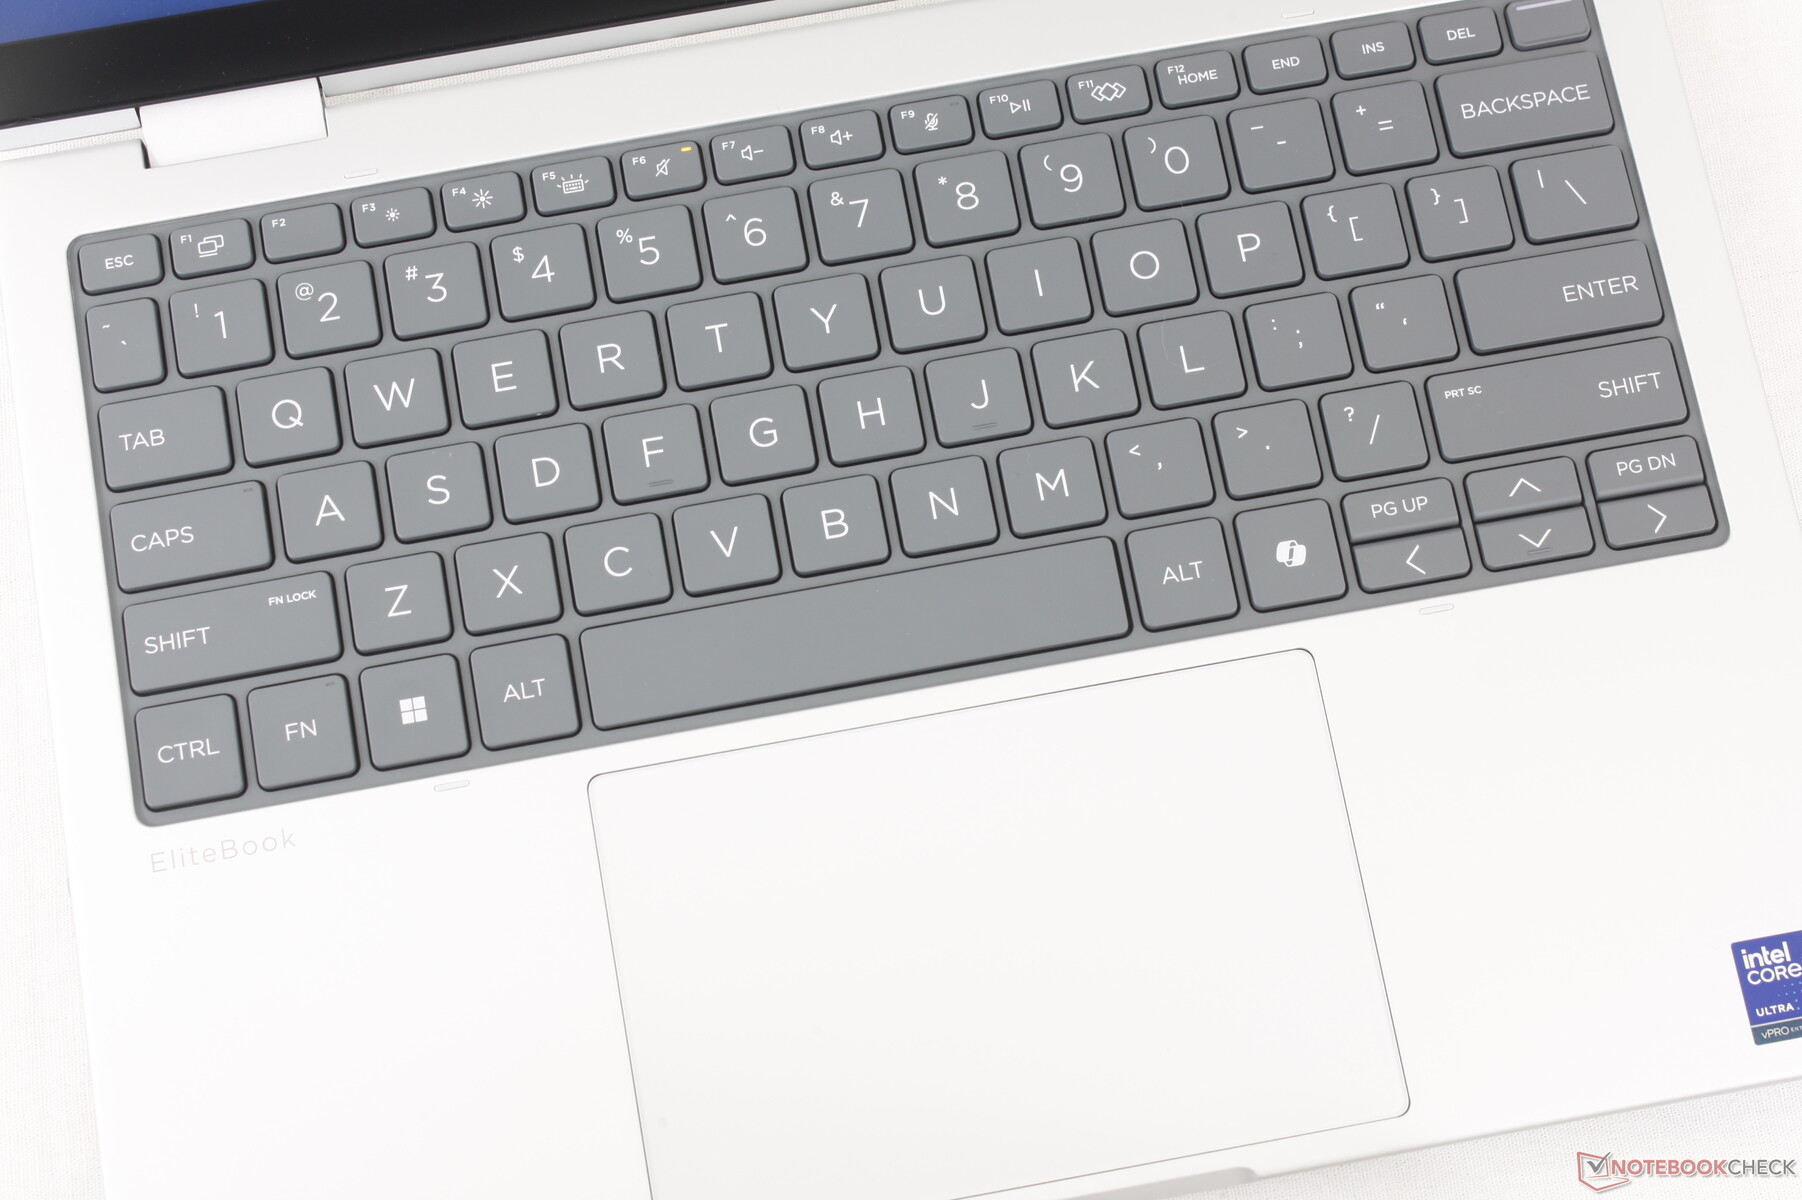
Podobnie jak w najnowszym EliteBook 8 G1a 16klawiatura i clickpad w EliteBook 8 Flip G1i 13 mają odpowiednio zwiększony rozmiar czcionki i powierzchnię, co zapewnia lepszą ergonomię. Doświadczenie pisania jest jednym z najlepszych na każdym 13-calowym konwertowalnym urządzeniu, z wyjątkiem ciasnych klawiszy strzałek.
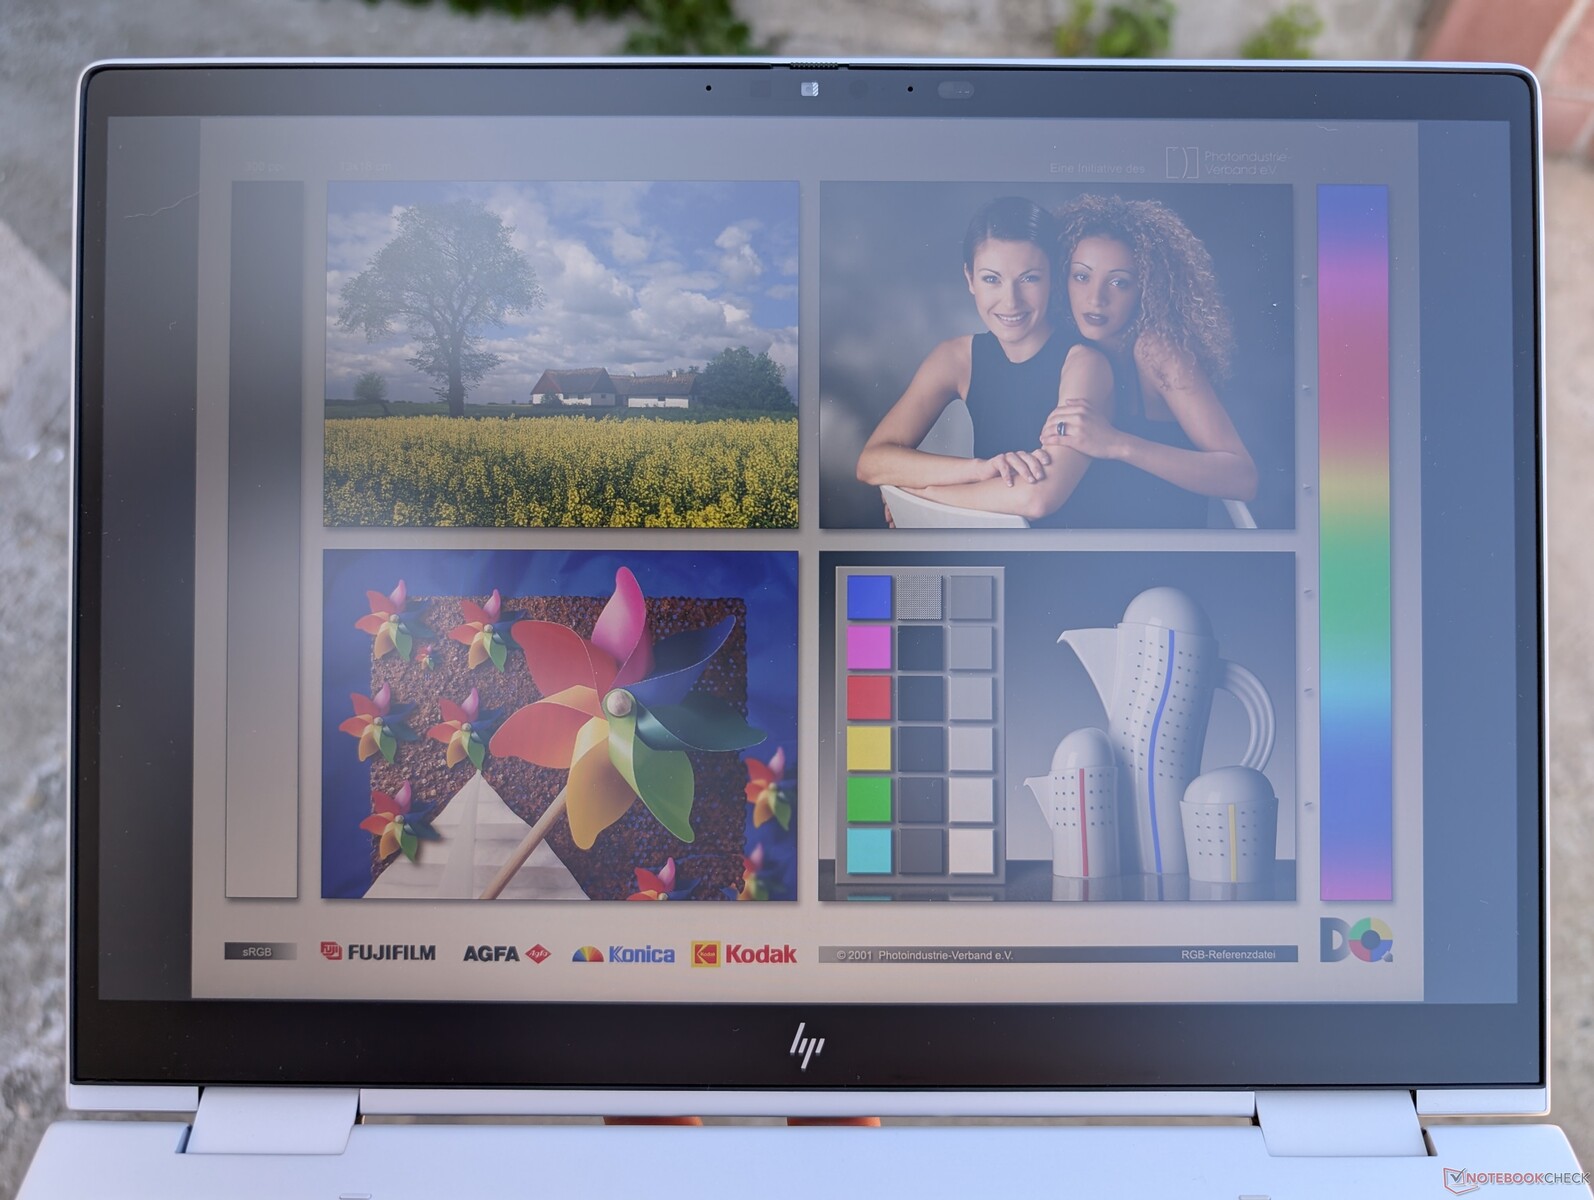
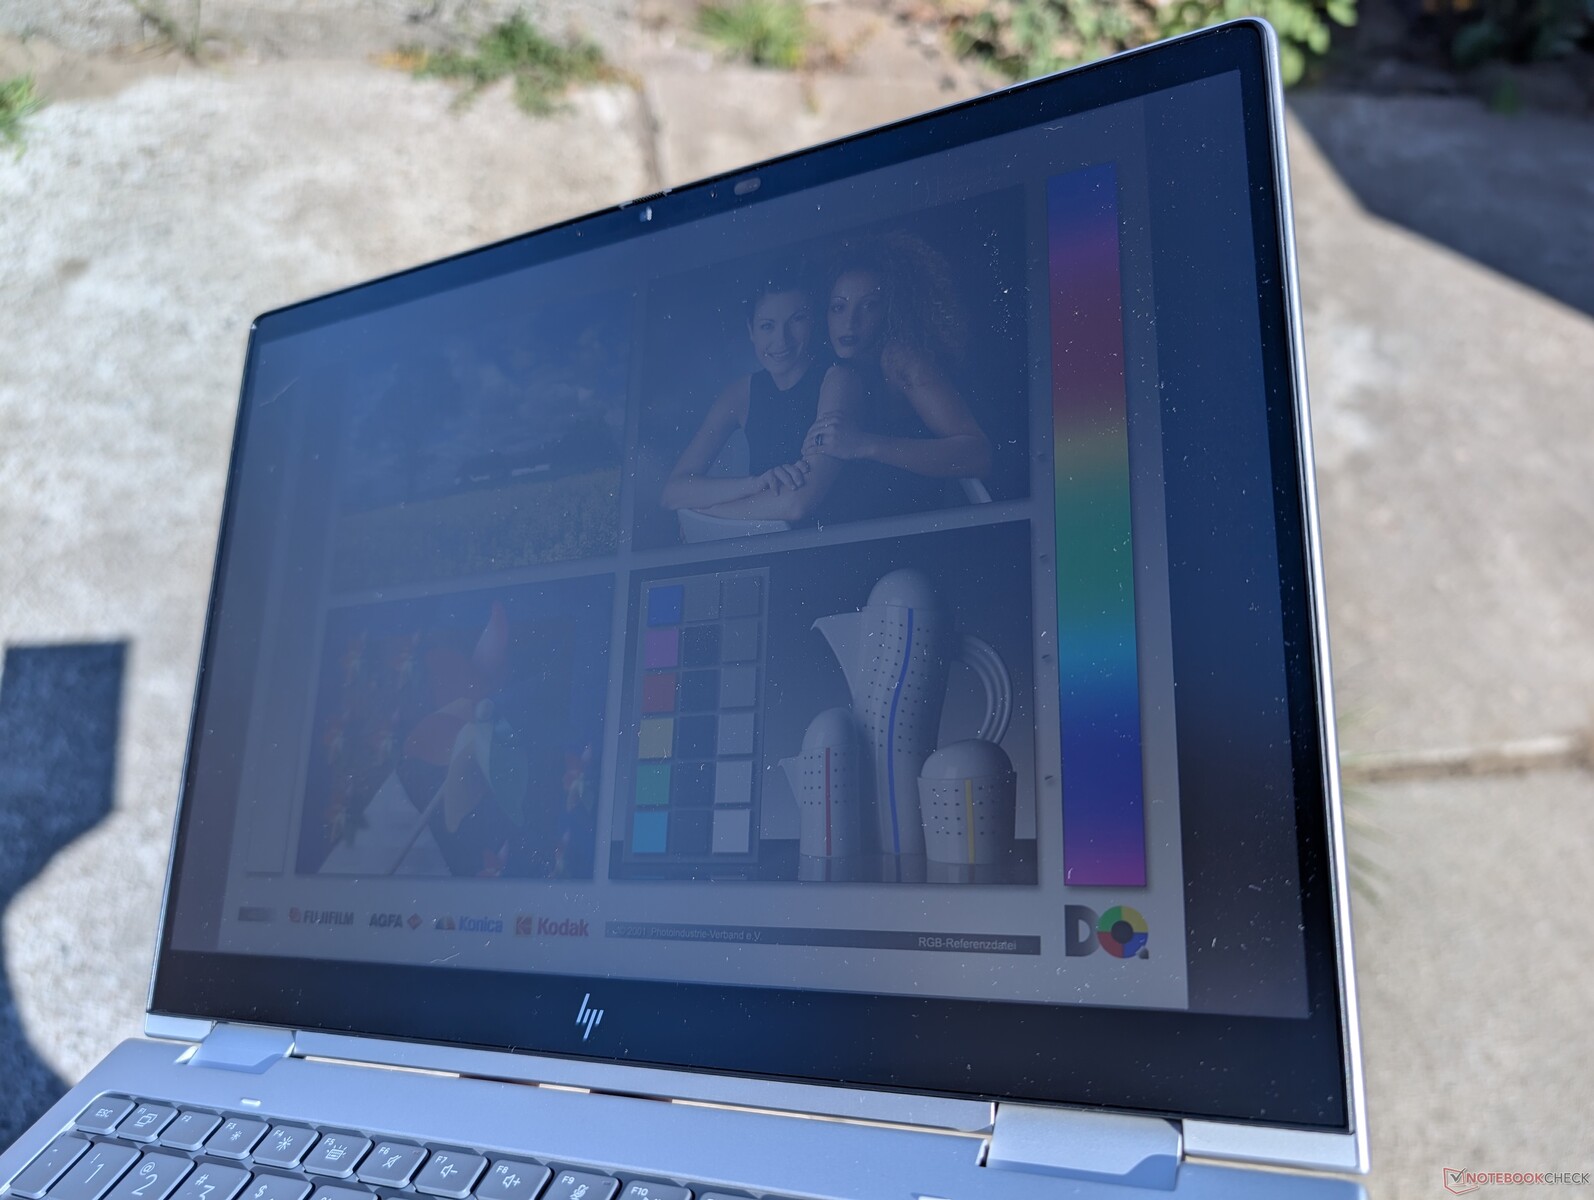
Wyświetlacz
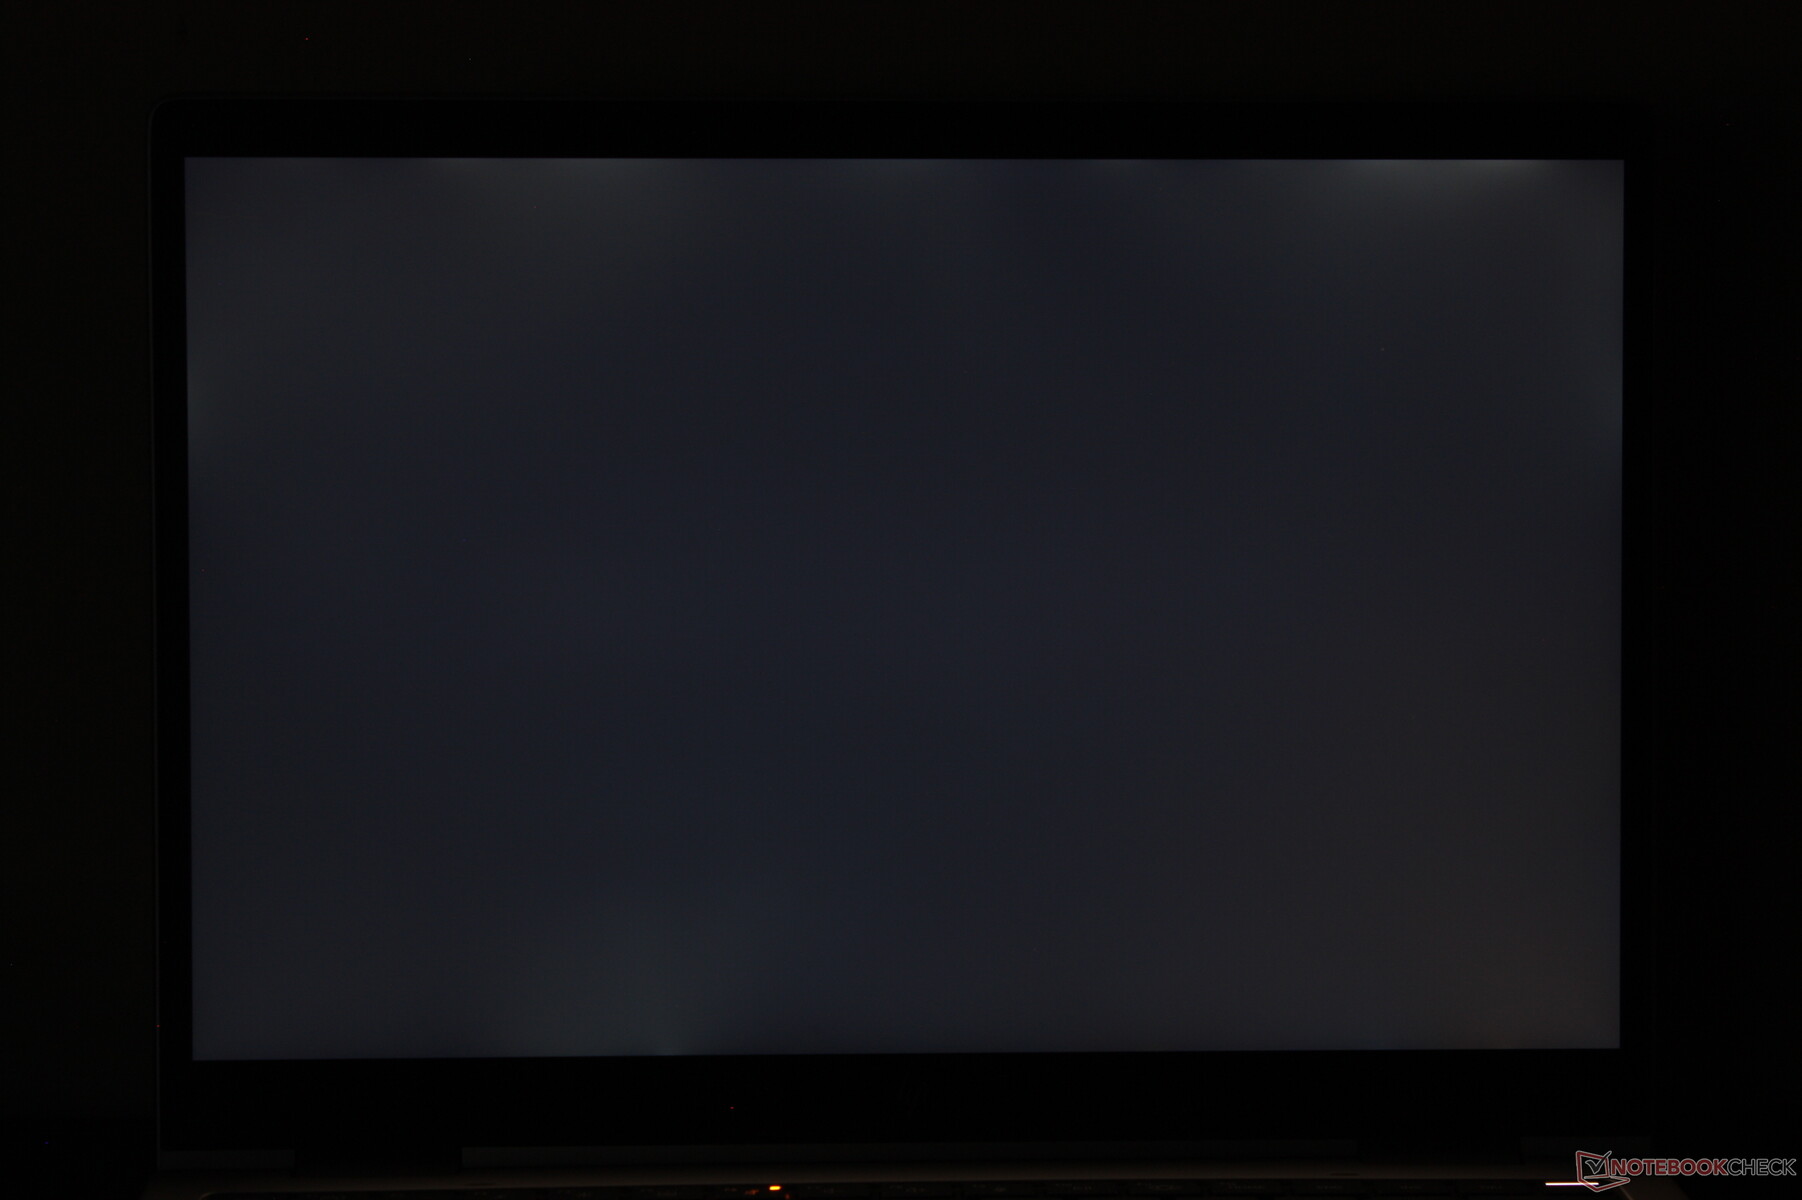
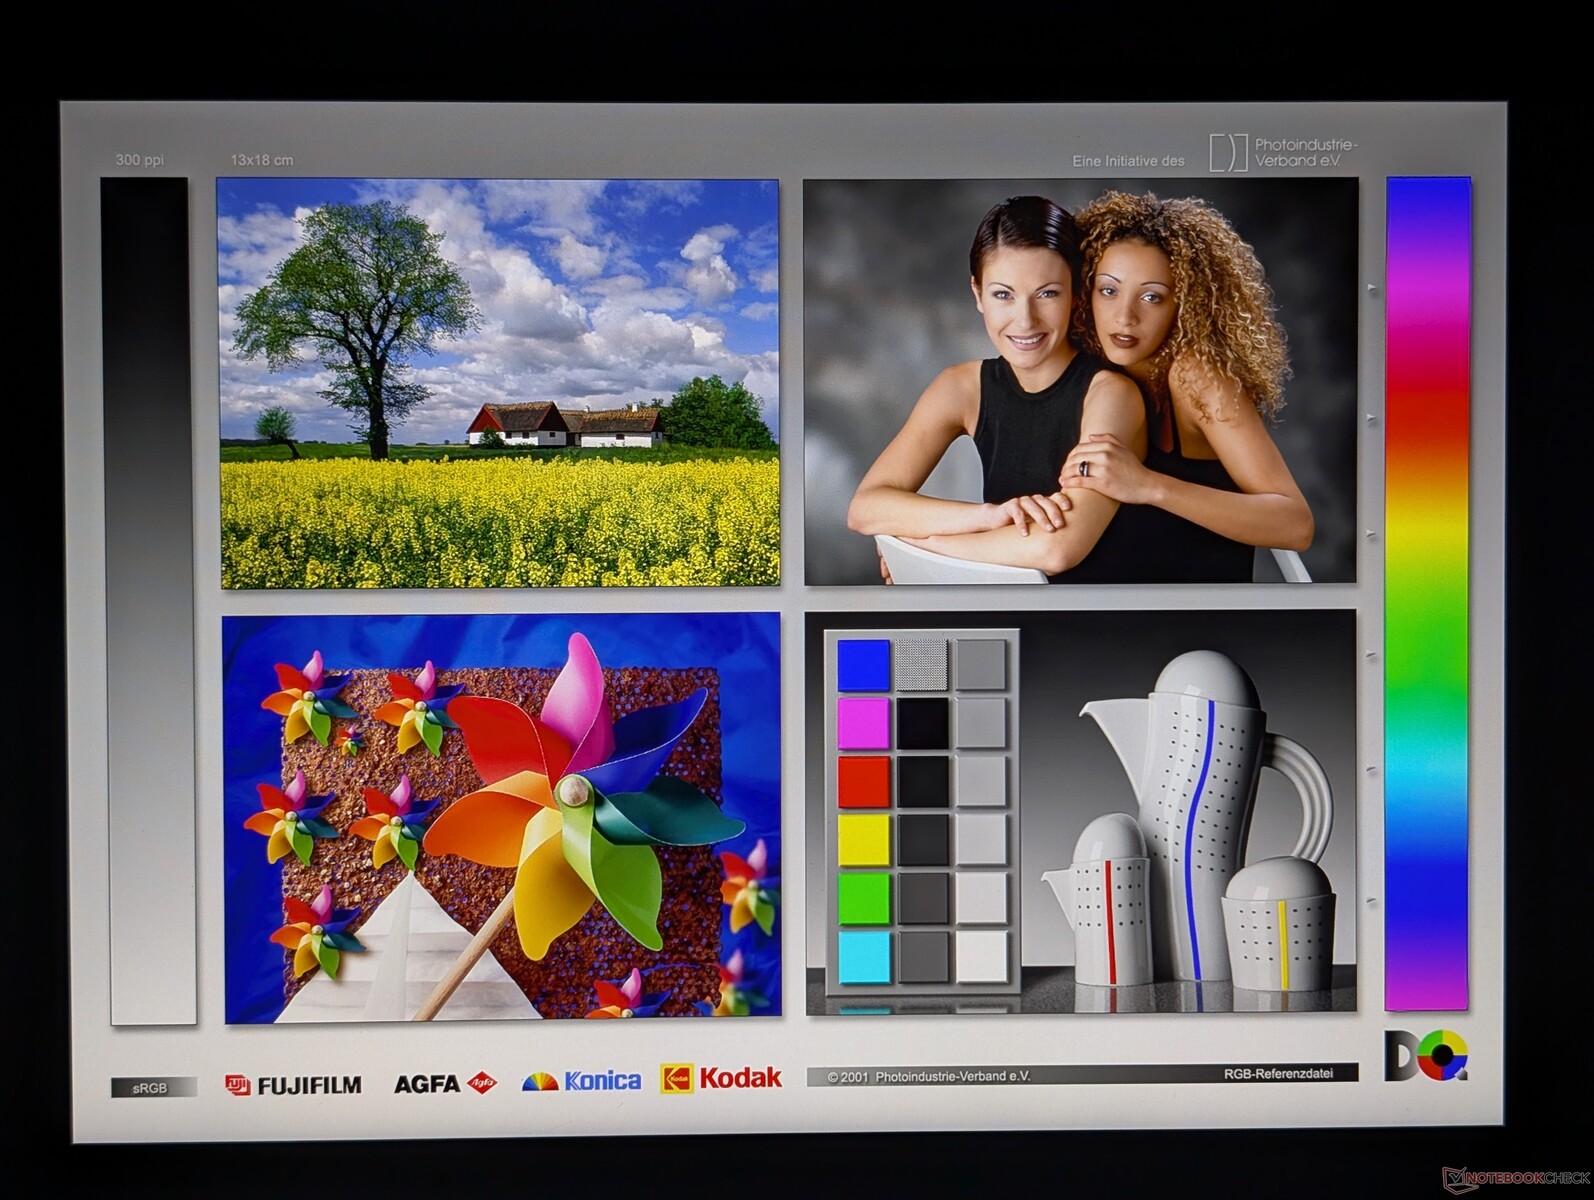
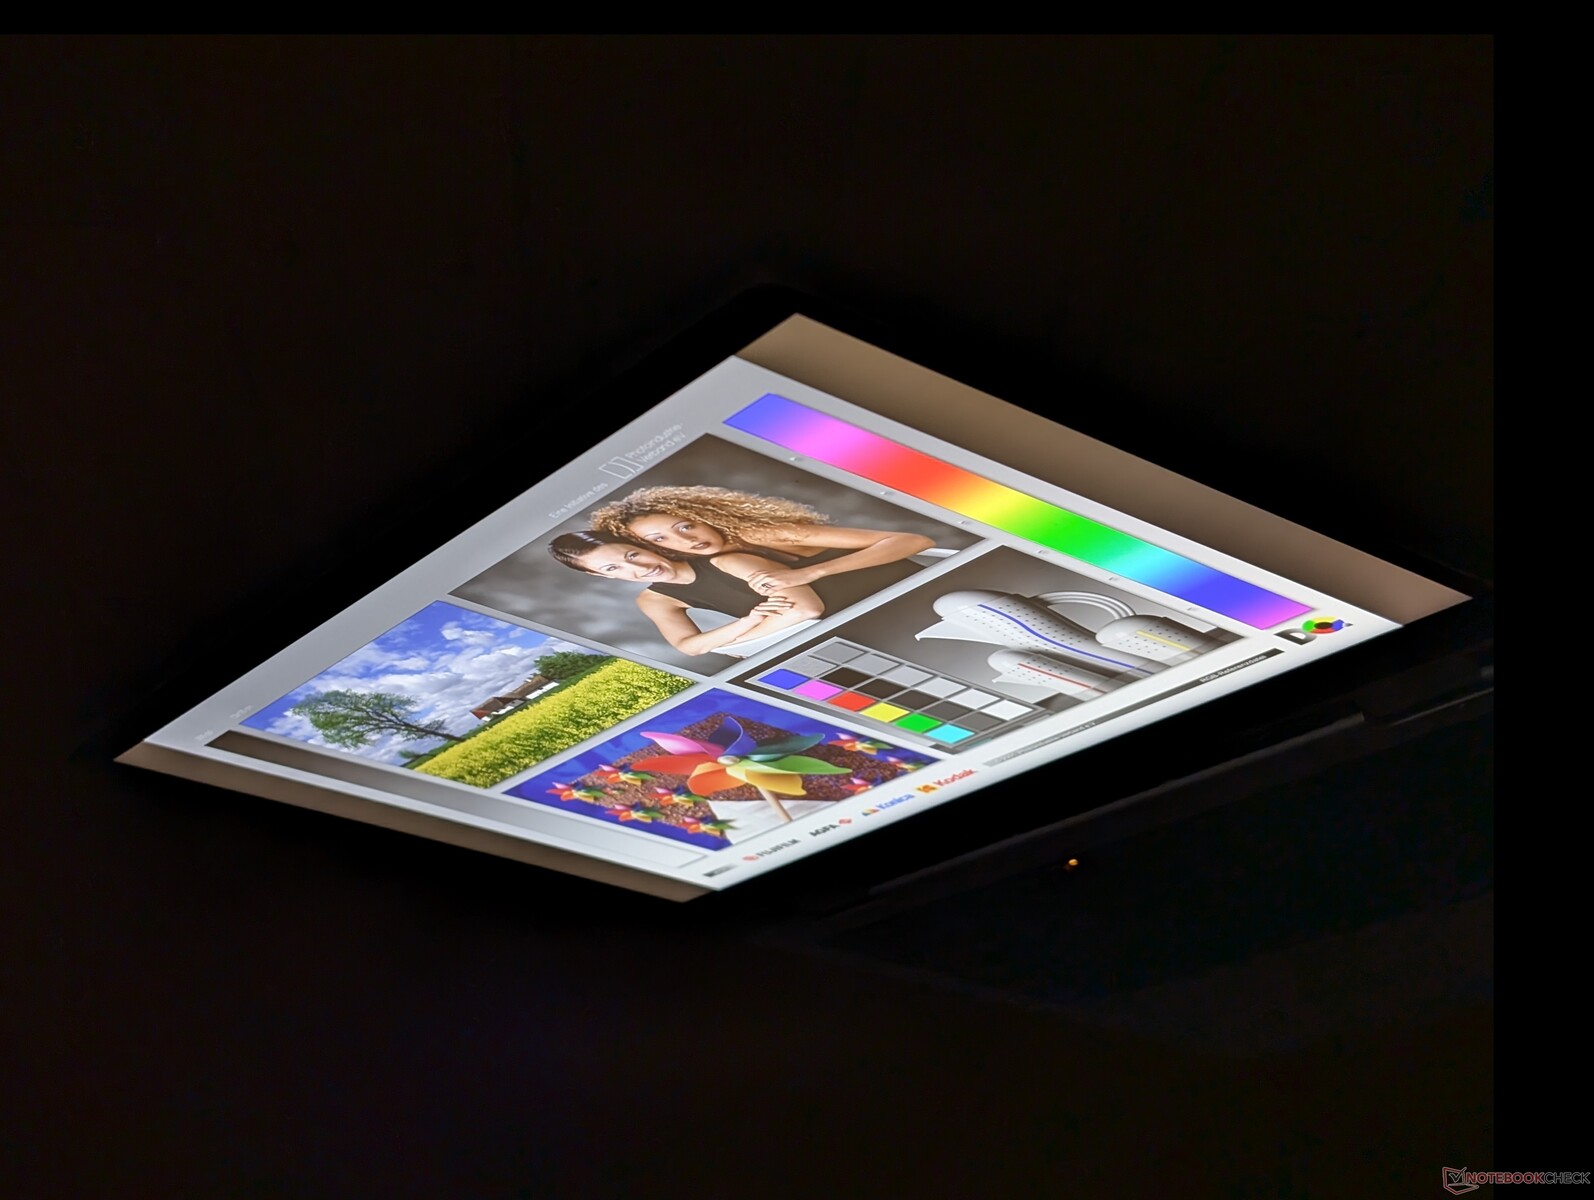
Podczas gdy rozdzielczość 1920 x 1200 i częstotliwość odświeżania 60 Hz są stałe we wszystkich obecnych SKU, HP oferuje trzy opcje jasności, aby to zrekompensować: 300, 400 lub 800 nitów. Konfiguracja z tą ostatnią jest najlepsza dla widoczności na zewnątrz, ale Sure View staje się obowiązkowa na tym poziomie na dobre i na złe. Nasza konkretna jednostka testowa została skonfigurowana z opcją 400 nitów.
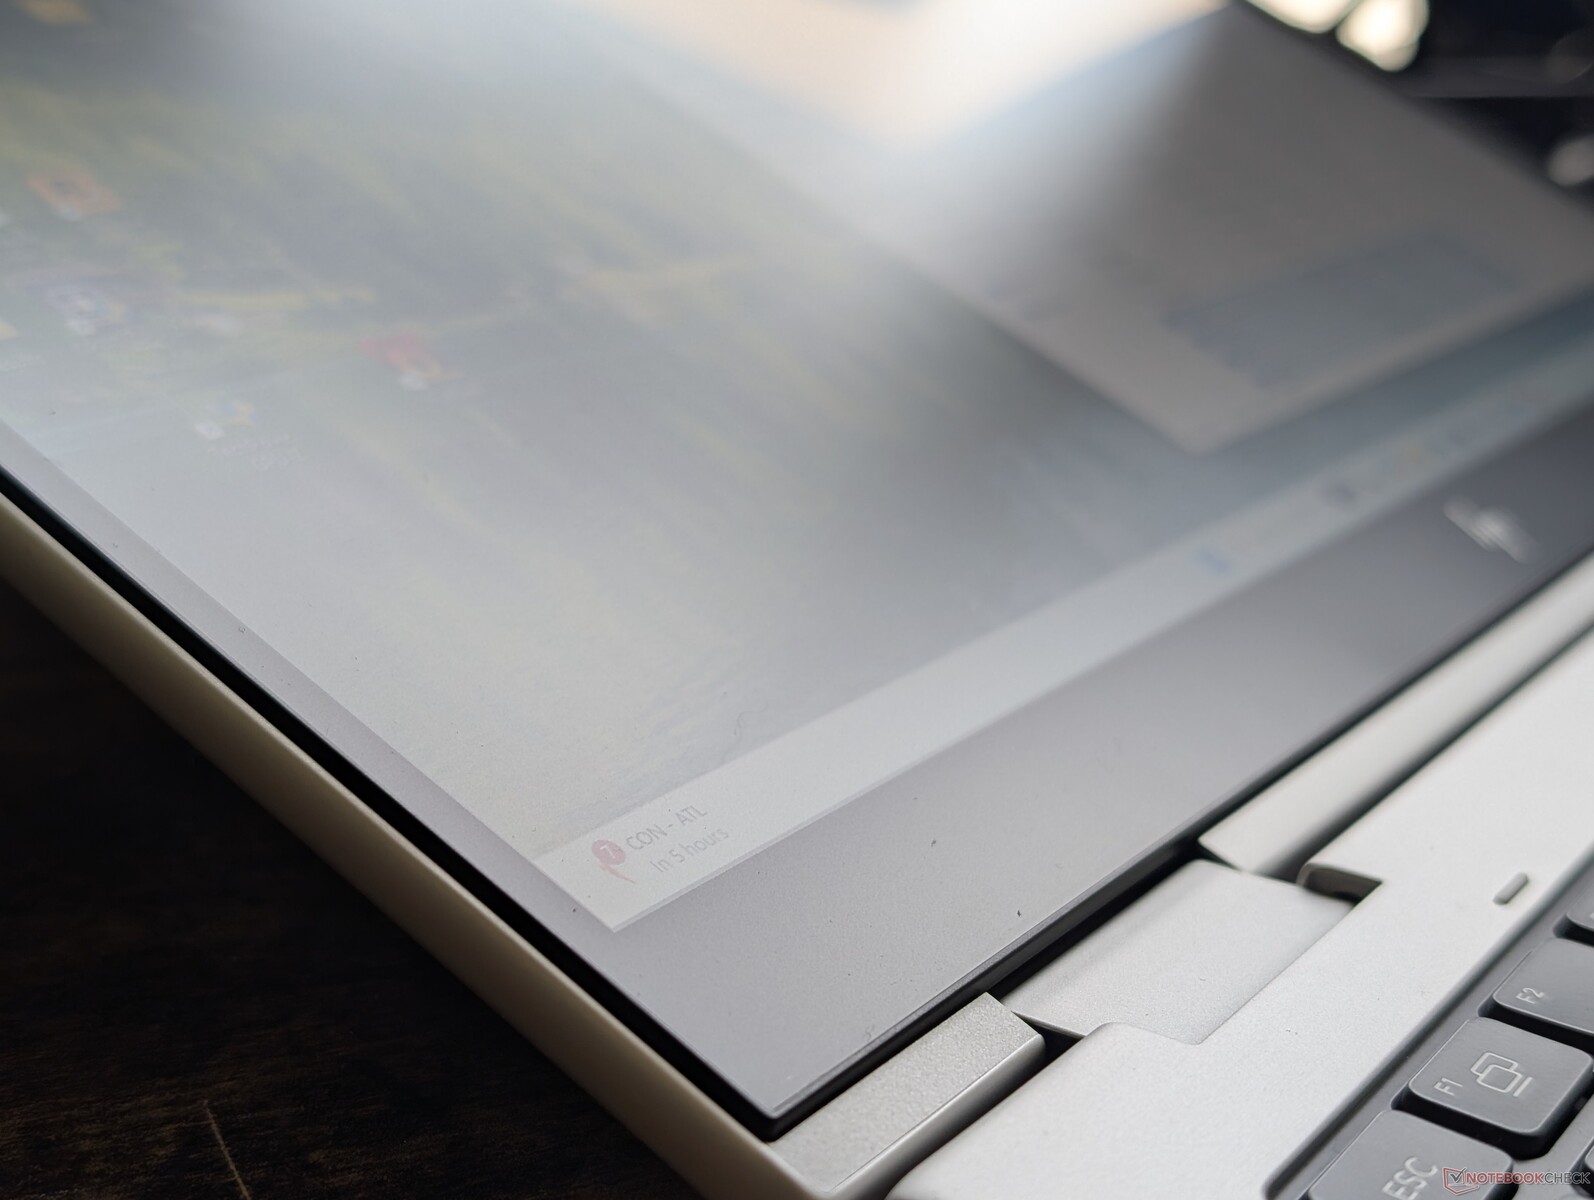
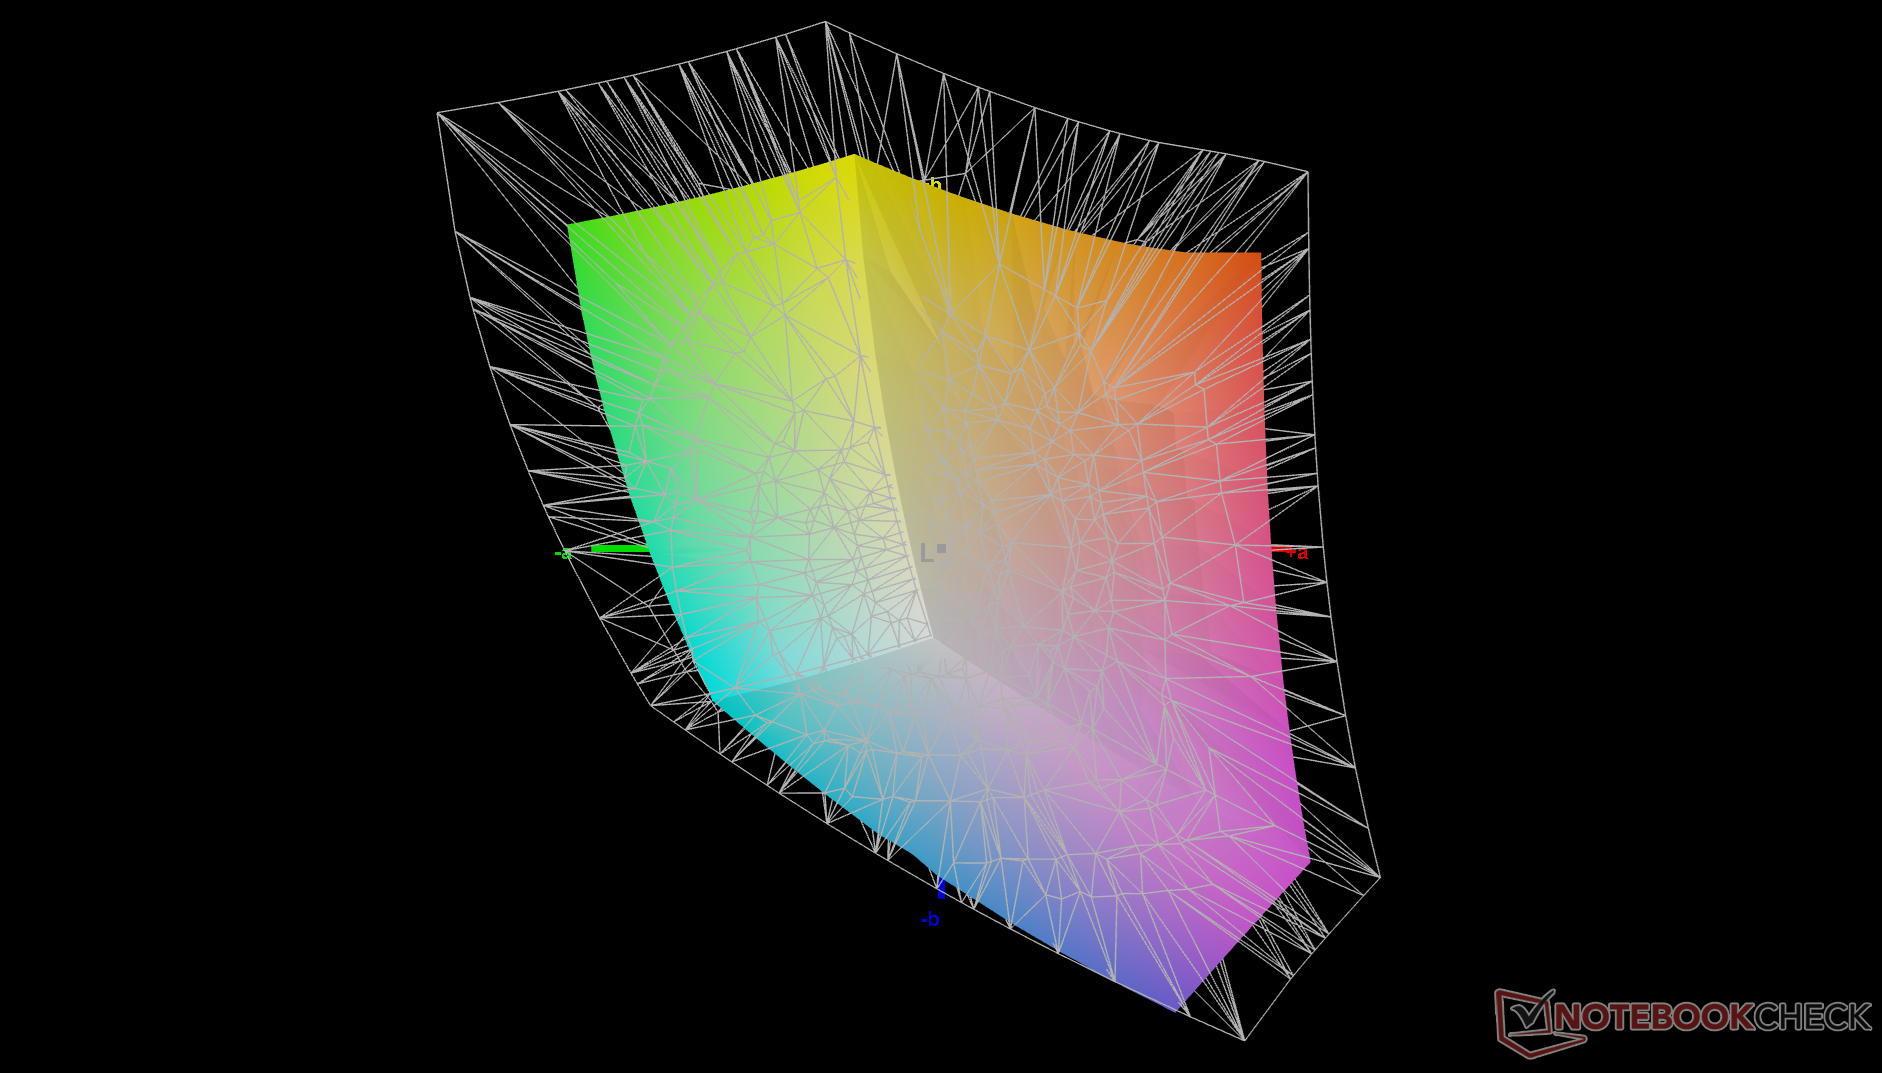
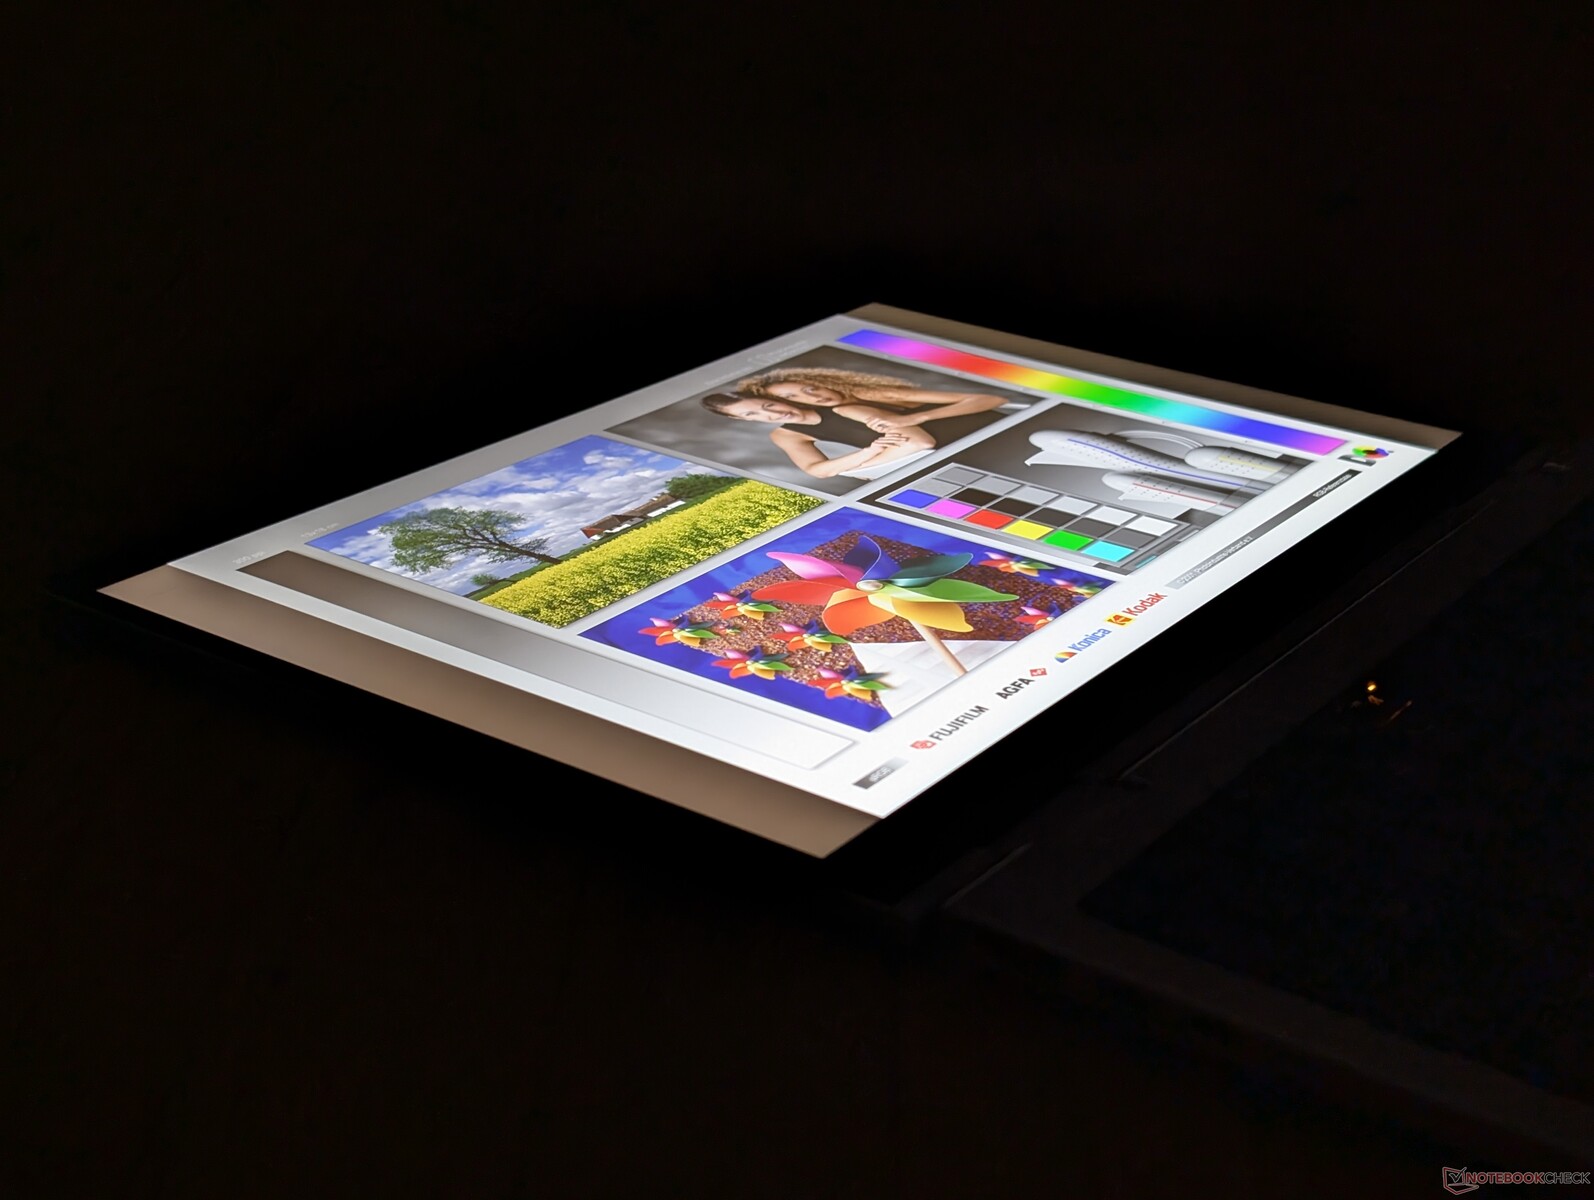
Kolory i kontrast są poza tym dobre dla panelu IPS przy odpowiednio >95% sRGB i ~1500:1. Powolny czas reakcji czerni i bieli oraz lekka ziarnistość matowego panelu to prawdopodobnie jego największe wady.

| |||||||||||||||||||||||||
rozświetlenie: 90 %
na akumulatorze: 390.1 cd/m²
kontrast: 1445:1 (czerń: 0.27 cd/m²)
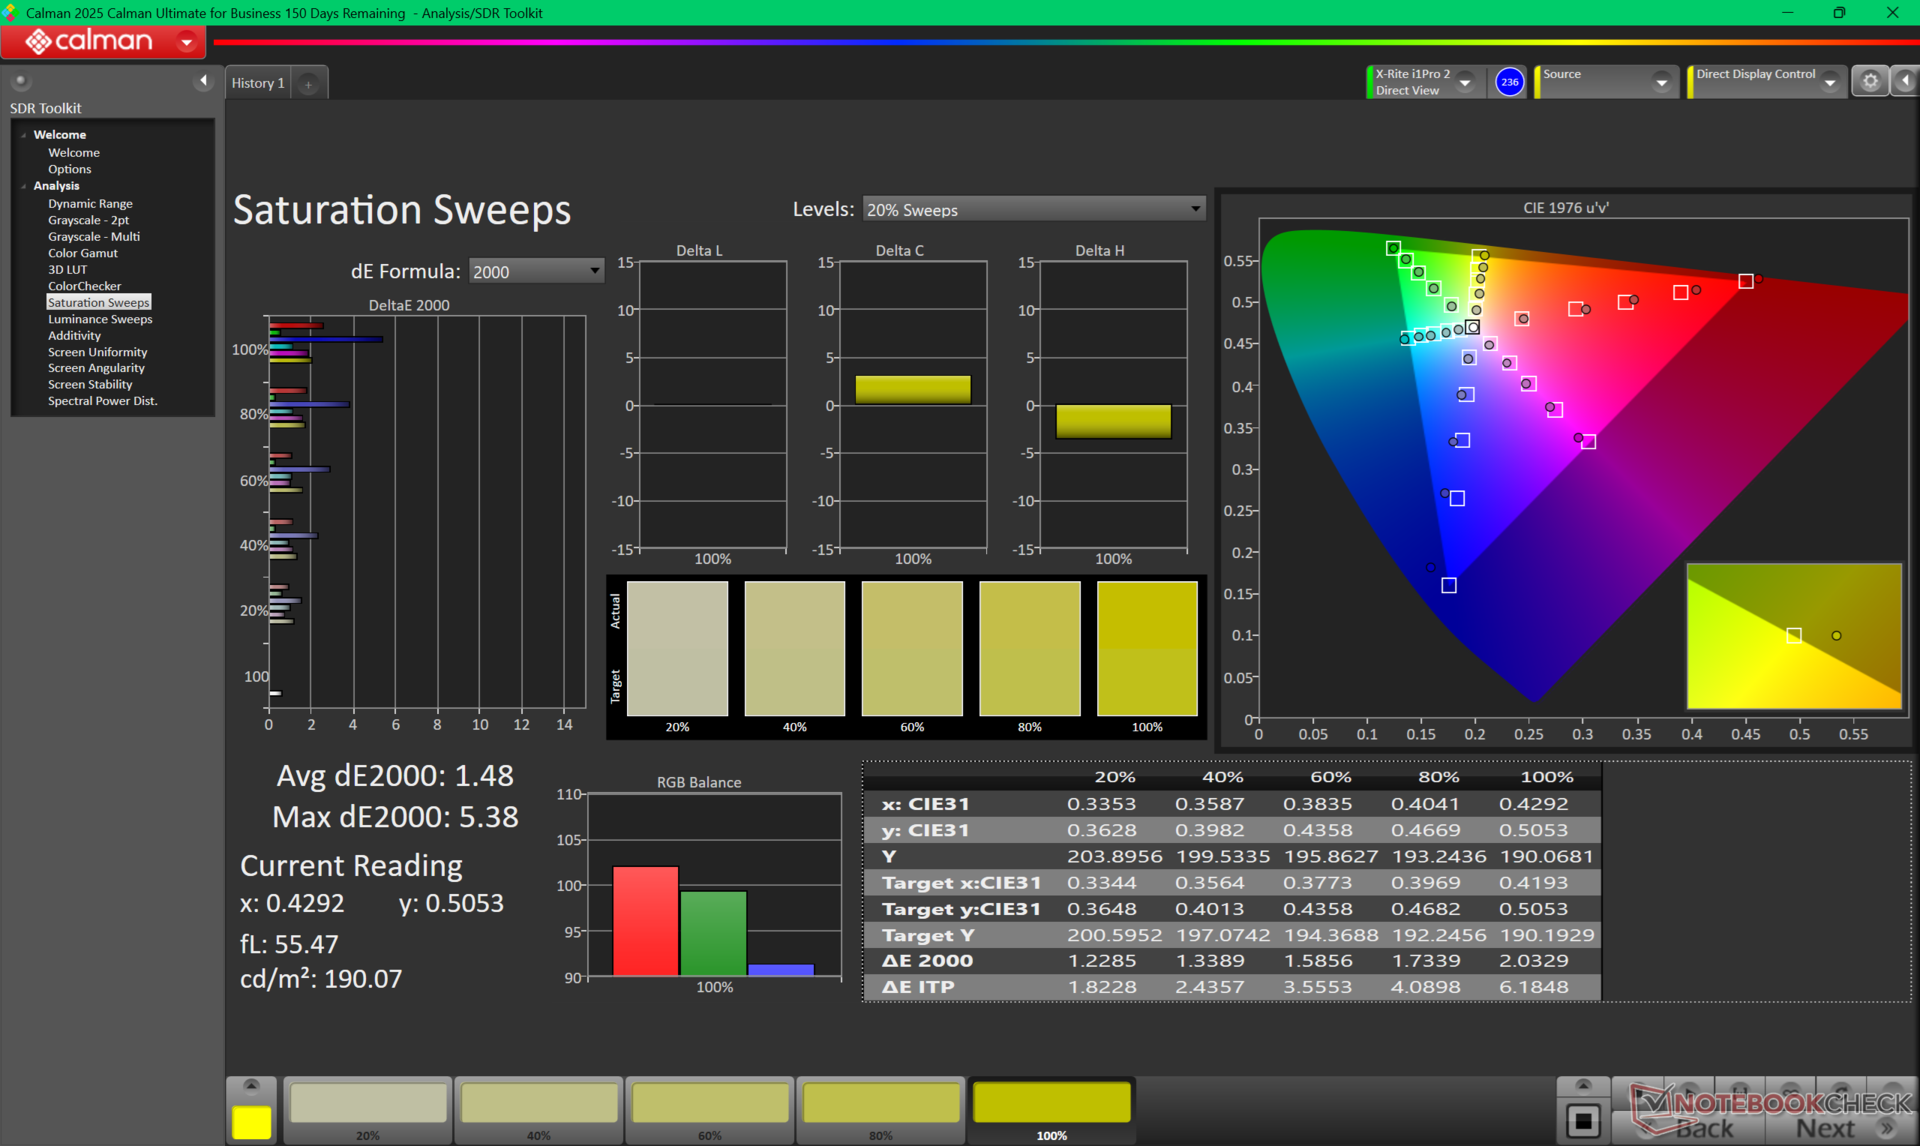
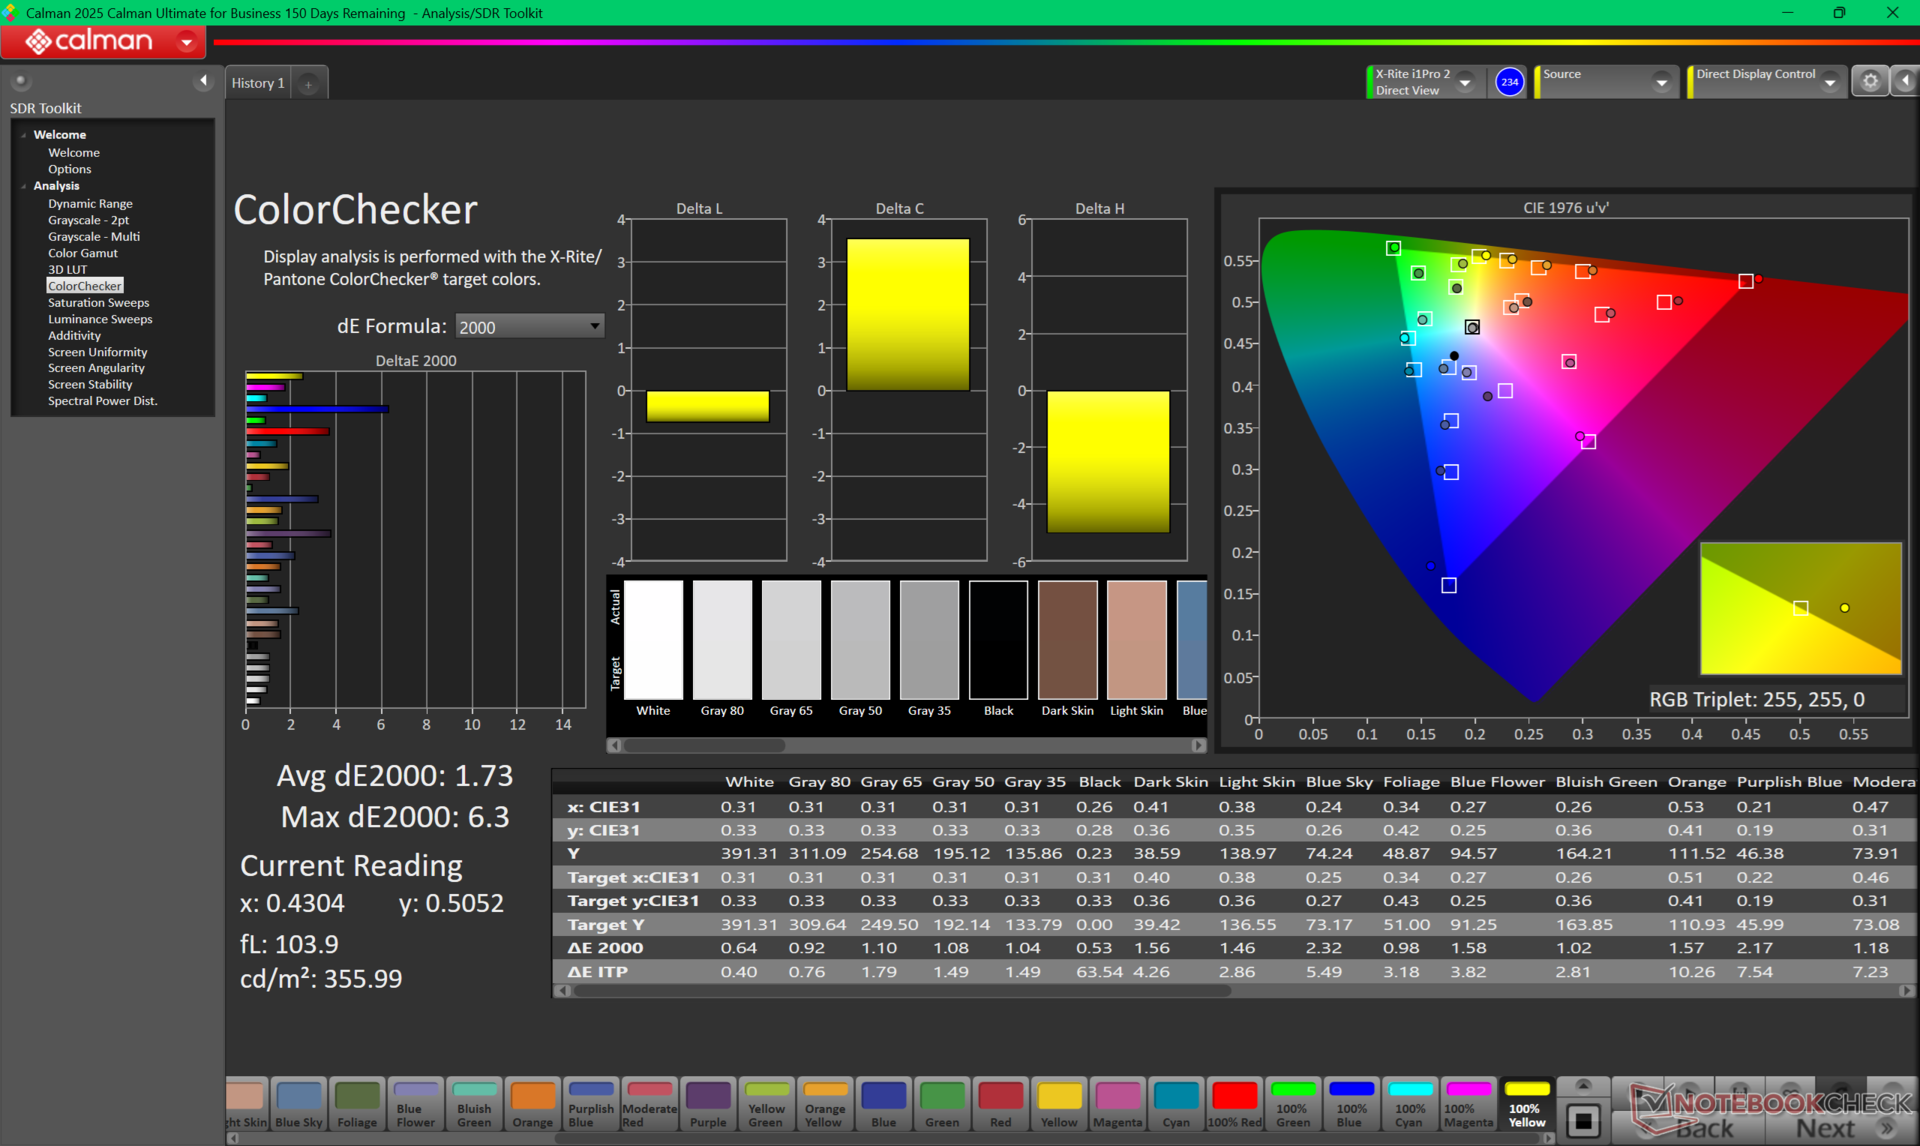
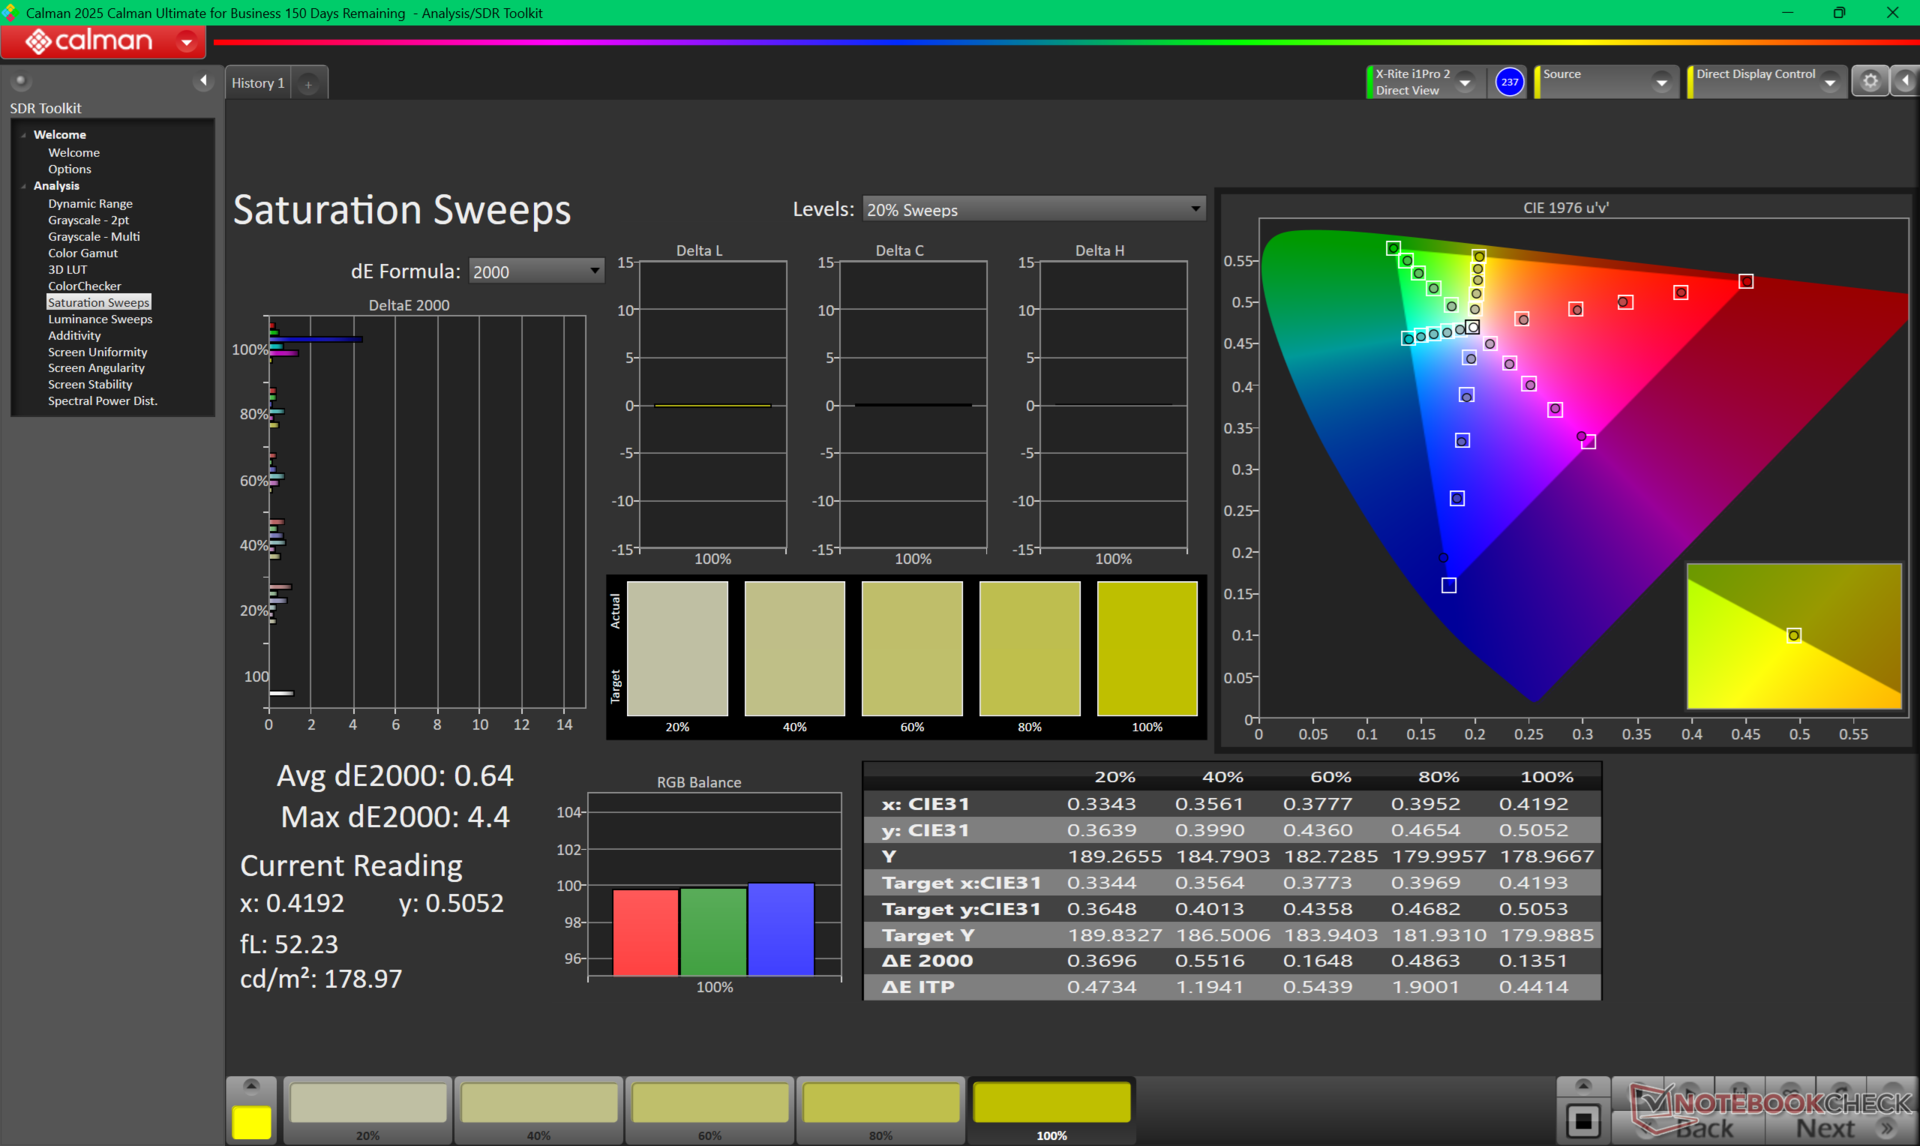
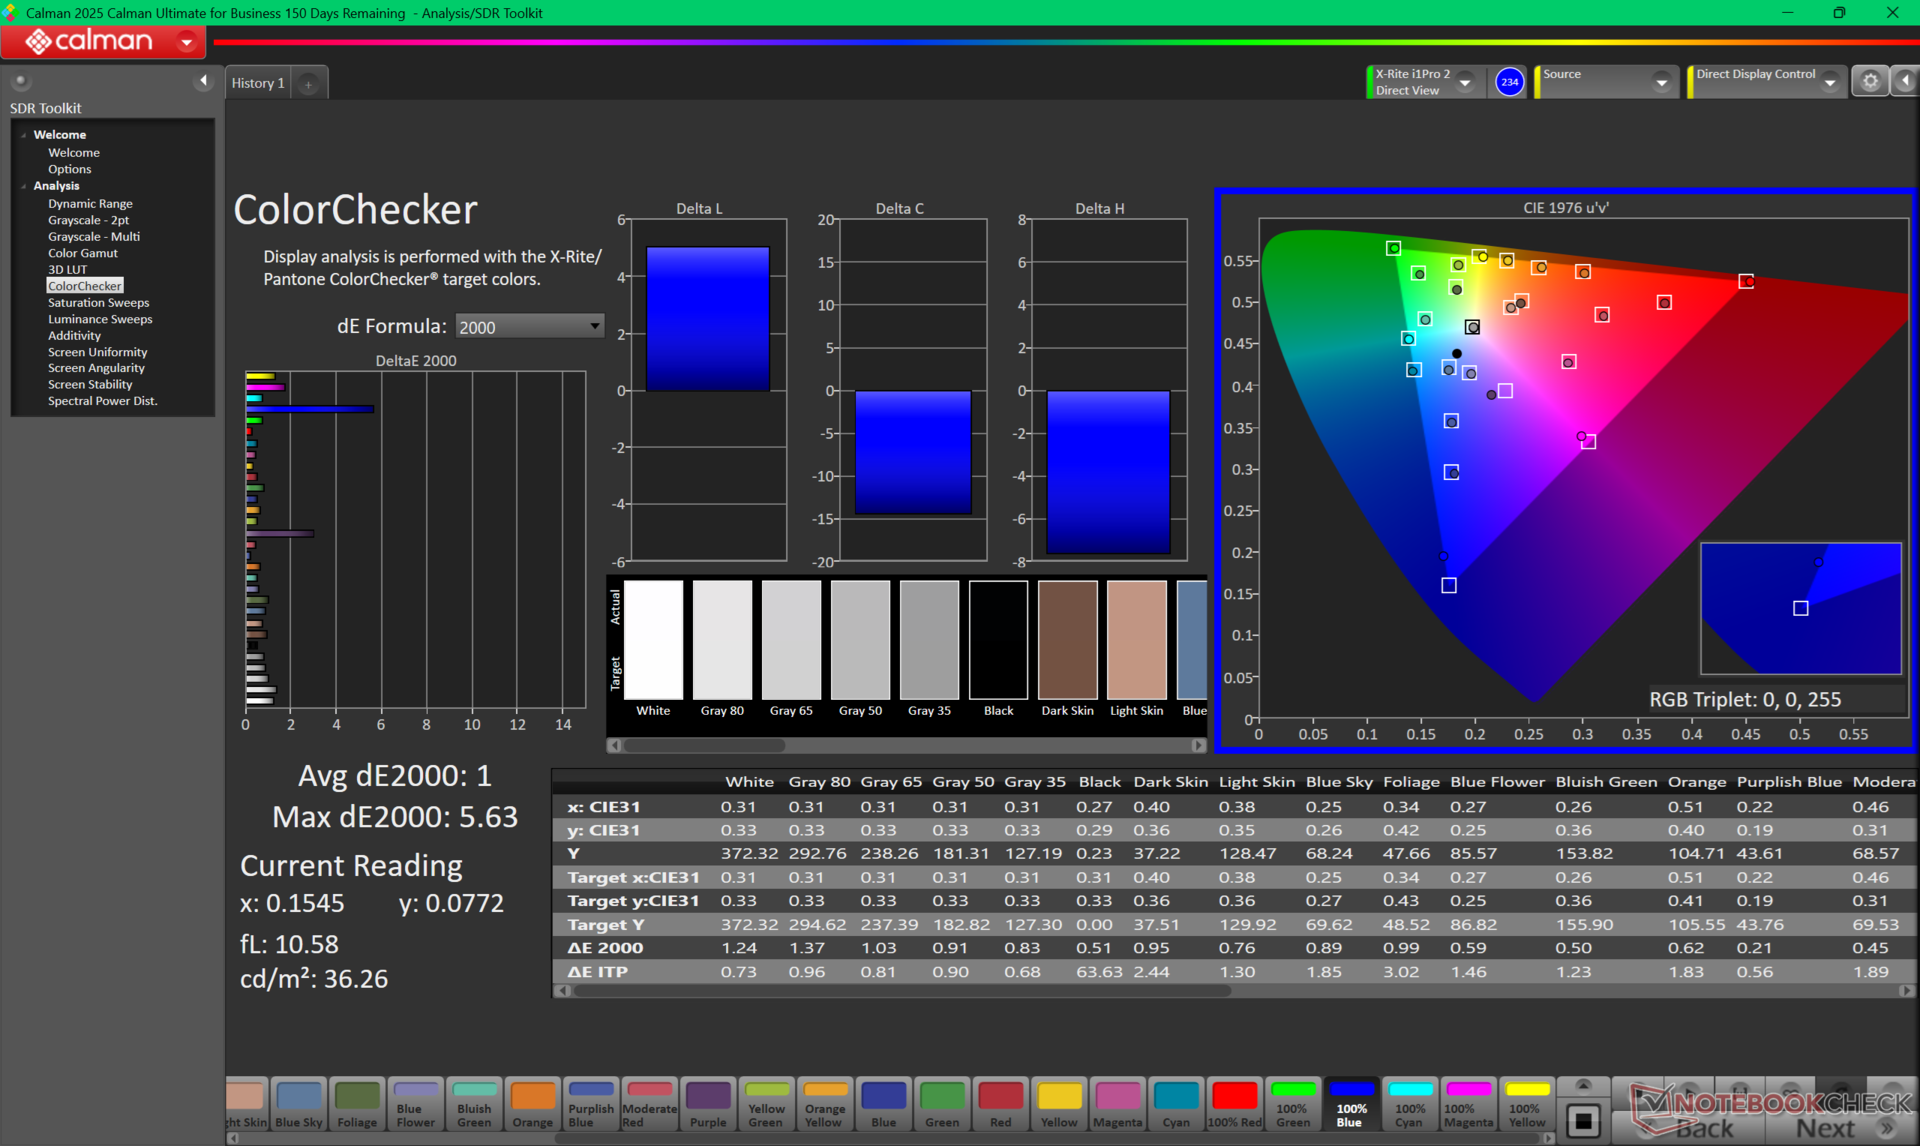
ΔE ColorChecker Calman: 1.73 | ∀{0.5-29.43 Ø4.71}
calibrated: 1
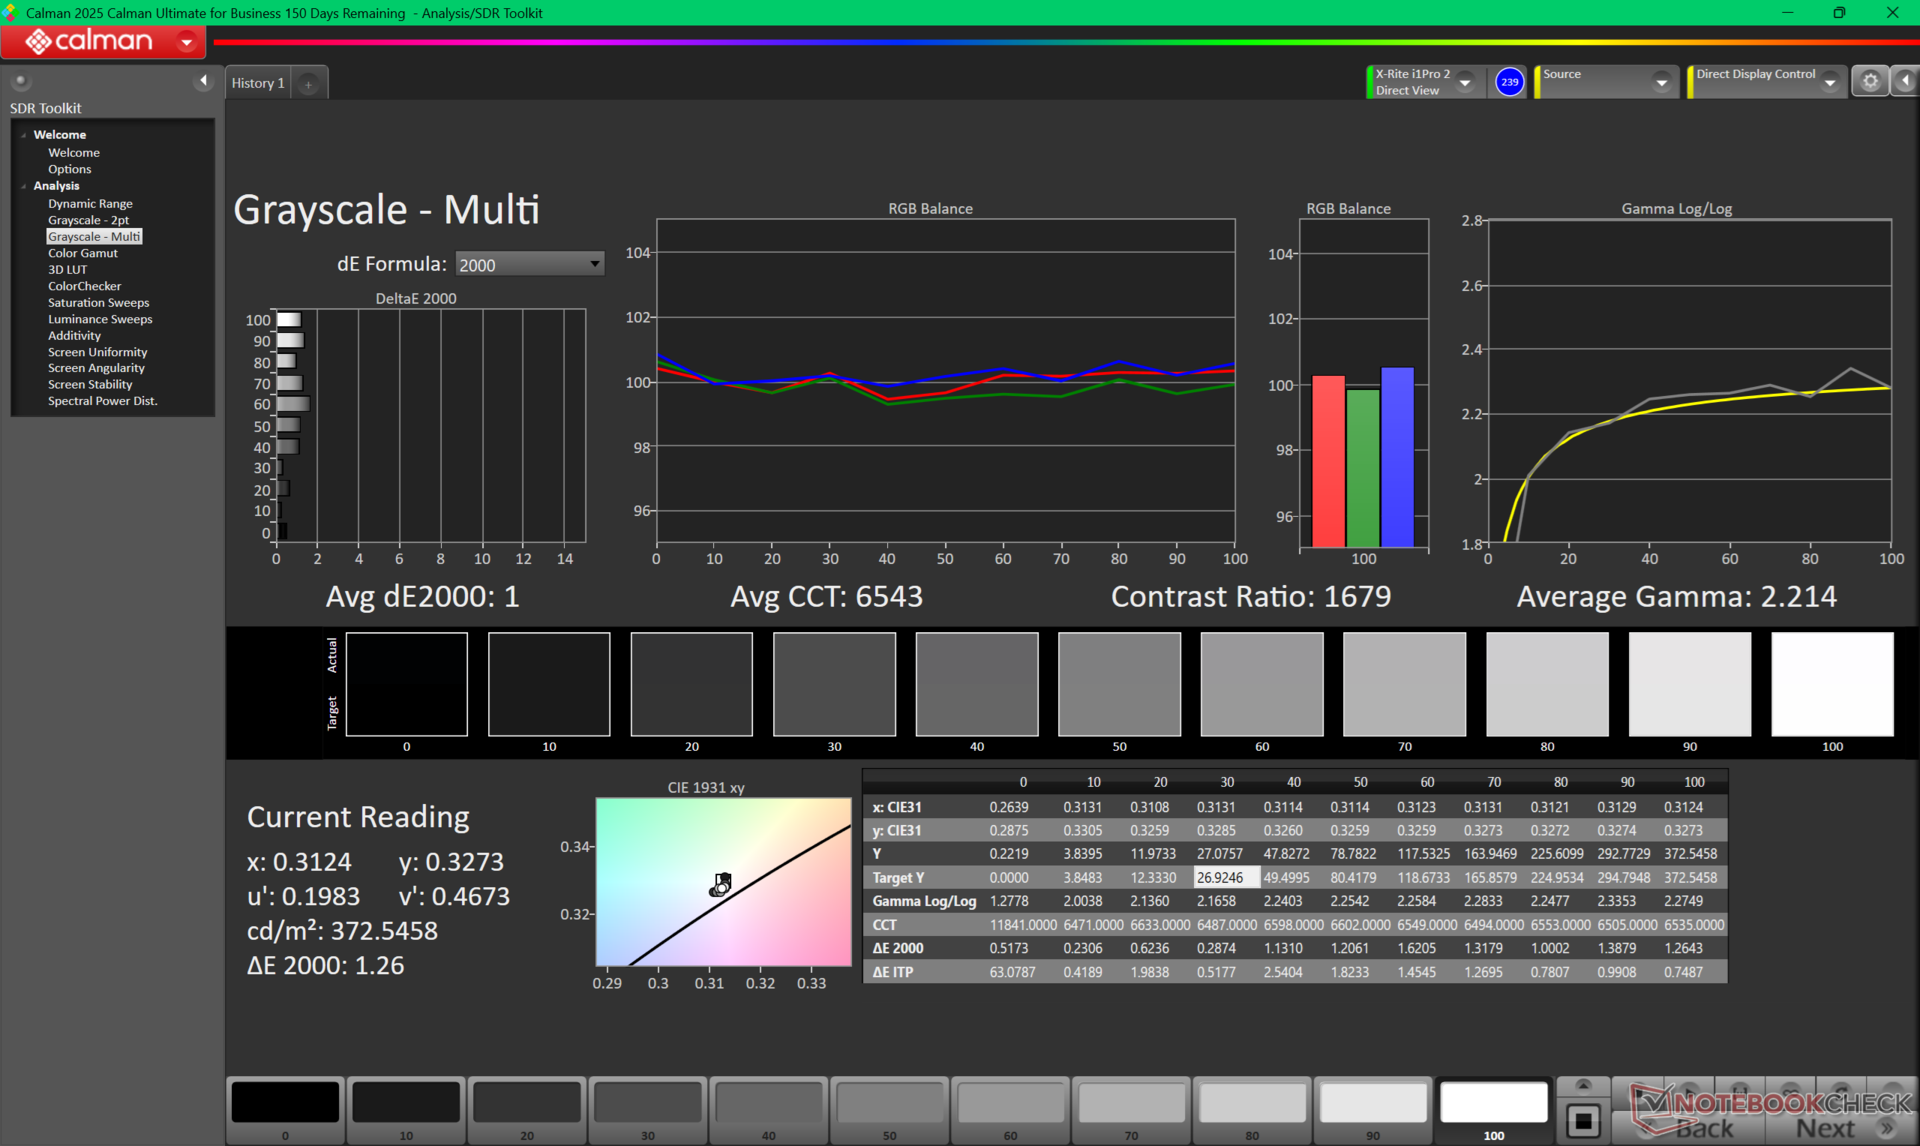
ΔE Greyscale Calman: 1 | ∀{0.09-98 Ø4.96}
70.7% AdobeRGB 1998 (Argyll 3D)
96.4% sRGB (Argyll 3D)
68.9% Display P3 (Argyll 3D)
Gamma: 2.2
CCT: 6627 K
| HP EliteBook 8 Flip G1i 13 Chi Mei CMN13E4, IPS, 1920x1200, 13.3", 60 Hz | HP EliteBook x360 830 G10 7L7U1ET LGD06E5, IPS LED, 1920x1200, 13.3", Hz | Lenovo ThinkPad L13 Yoga G4 21FSS00100 B133UAN01.2 , IPS LED, 1920x1200, 13.3", Hz | MSI Summit E13 AI Evo A1MTG CMN13C6, IPS, 1920x1200, 13.3", 60 Hz | Asus ProArt PZ13 HT5306 ATNA33AA08-0, OLED, 2880x1800, 13.3", 60 Hz | Dell Latitude 9330 AU Optronics B133QAA, IPS, 2560x1600, 13.3", 60 Hz | |
|---|---|---|---|---|---|---|
| Display | -7% | 5% | 3% | 25% | 9% | |
| Display P3 Coverage (%) | 68.9 | 63.2 -8% | 74.1 8% | 71.6 4% | 99.5 44% | 77.8 13% |
| sRGB Coverage (%) | 96.4 | 92.7 -4% | 99.3 3% | 98.6 2% | 99.6 3% | 99.9 4% |
| AdobeRGB 1998 Coverage (%) | 70.7 | 65.1 -8% | 74.5 5% | 73.1 3% | 89.9 27% | 77.5 10% |
| Response Times | 13% | 7% | -22% | 96% | -57% | |
| Response Time Grey 50% / Grey 80% * (ms) | 49.3 ? | 39.8 ? 19% | 43.3 ? 12% | 60 ? -22% | 1.54 ? 97% | 67.6 ? -37% |
| Response Time Black / White * (ms) | 28.7 ? | 26.8 ? 7% | 28 ? 2% | 35.1 ? -22% | 1.41 ? 95% | 50.4 ? -76% |
| PWM Frequency (Hz) | 240 ? | |||||
| PWM Amplitude * (%) | 67 | |||||
| Screen | -80% | -44% | -9% | 314% | -25% | |
| Brightness middle (cd/m²) | 390.1 | 394 1% | 336 -14% | 405.2 4% | 362 -7% | 542.3 39% |
| Brightness (cd/m²) | 365 | 372 2% | 321 -12% | 372 2% | 364 0% | 516 41% |
| Brightness Distribution (%) | 90 | 84 -7% | 88 -2% | 88 -2% | 99 10% | 85 -6% |
| Black Level * (cd/m²) | 0.27 | 0.17 37% | 0.22 19% | 0.34 -26% | 0.01 96% | 0.38 -41% |
| Contrast (:1) | 1445 | 2318 60% | 1527 6% | 1192 -18% | 36200 2405% | 1427 -1% |
| Colorchecker dE 2000 * | 1.73 | 4.1 -137% | 2.8 -62% | 2.4 -39% | 1.5 13% | 3.18 -84% |
| Colorchecker dE 2000 max. * | 6.3 | 8.3 -32% | 6.9 -10% | 3.56 43% | 3.1 51% | 6.05 4% |
| Colorchecker dE 2000 calibrated * | 1 | 1.4 -40% | 0.54 46% | 0.67 33% | ||
| Greyscale dE 2000 * | 1 | 6.6 -560% | 3.8 -280% | 1.9 -90% | 1.6 -60% | 3.1 -210% |
| Gamma | 2.2 100% | 2.17 101% | 2.15 102% | 2 110% | 2.12 104% | 2.08 106% |
| CCT | 6627 98% | 6019 108% | 6664 98% | 6503 100% | 6514 100% | 6140 106% |
| Całkowita średnia (program / ustawienia) | -25% /
-48% | -11% /
-26% | -9% /
-8% | 145% /
213% | -24% /
-22% |
* ... im mniej tym lepiej
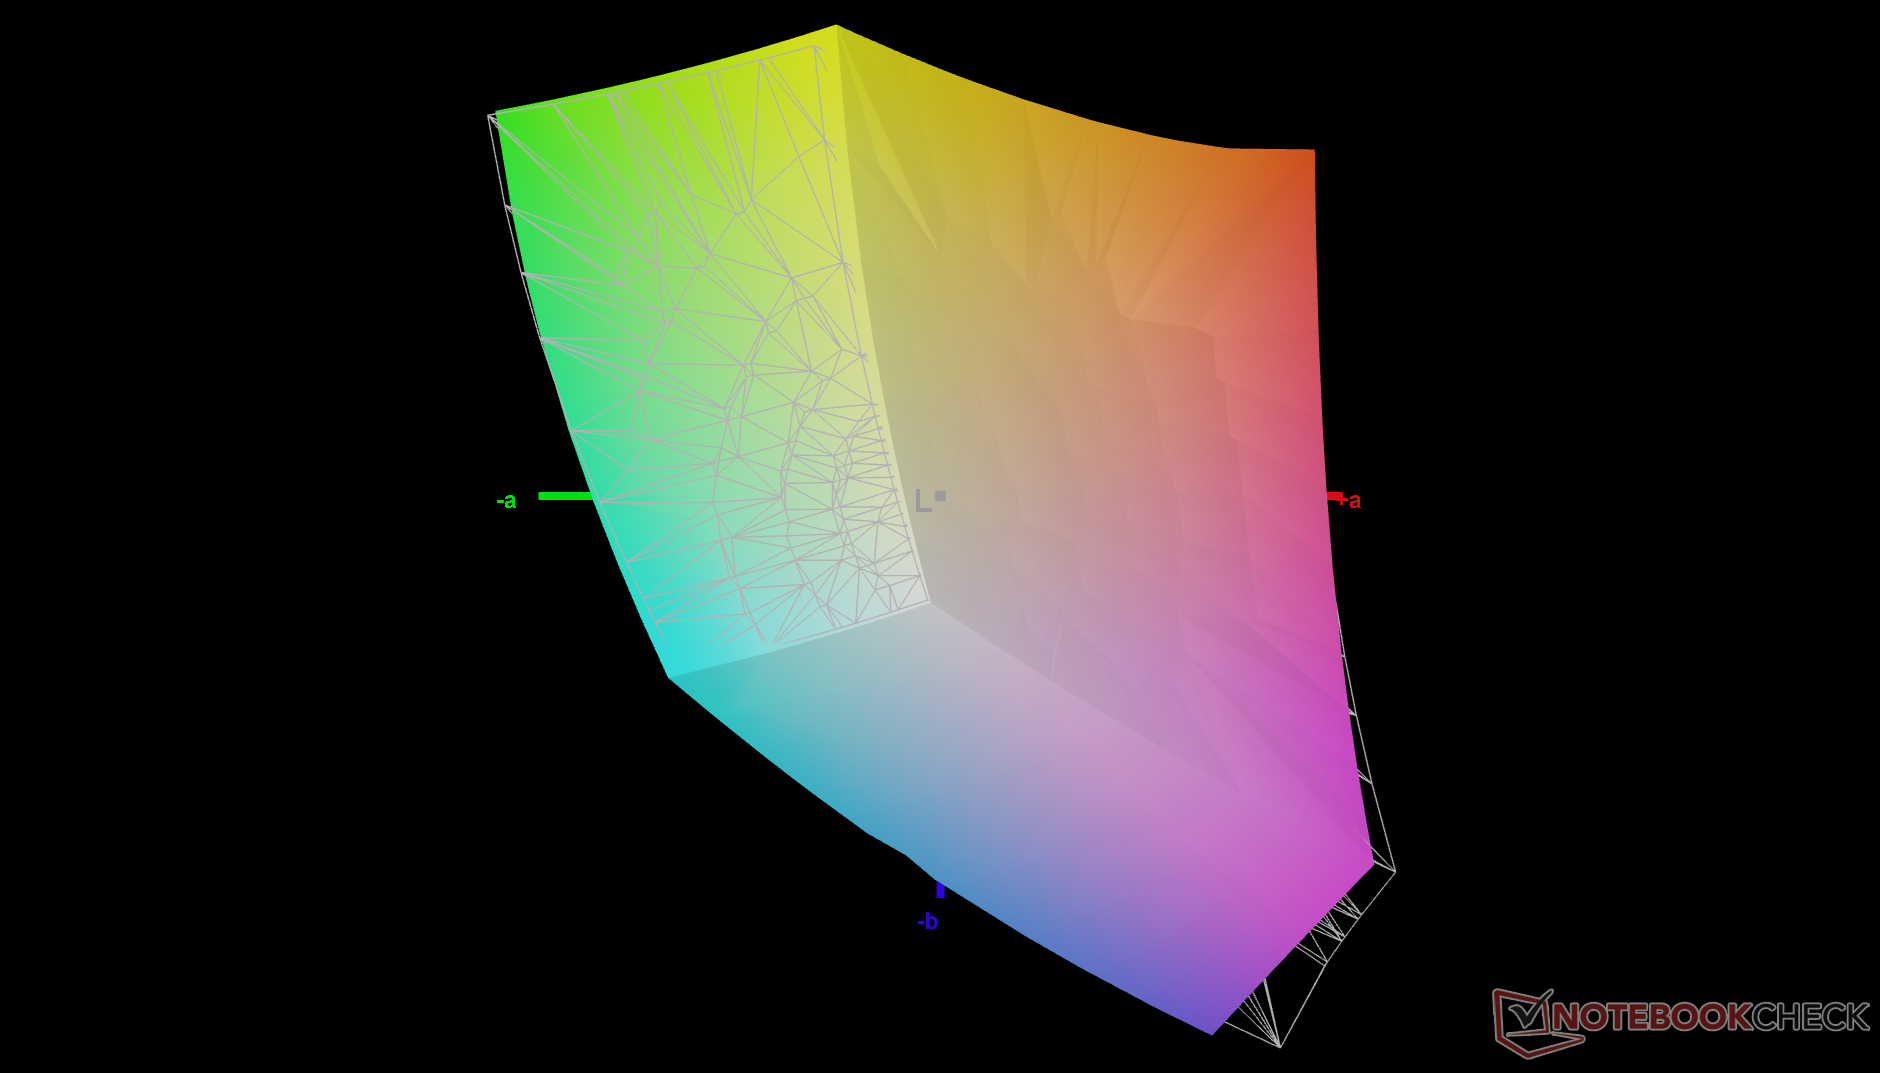
Wyświetlacz jest dobrze skalibrowany po wyjęciu z pudełka, a średnie wartości deltaE dla skali szarości i kolorów wynoszą odpowiednio tylko 1,0 i 1,73. Kalibracja przez użytkownika końcowego nie jest zatem konieczna w większości scenariuszy.

Wyświetl czasy reakcji
| ↔ Czas reakcji od czerni do bieli | ||
|---|---|---|
| 28.7 ms ... wzrost ↗ i spadek ↘ łącznie | ↗ 14.4 ms wzrost | 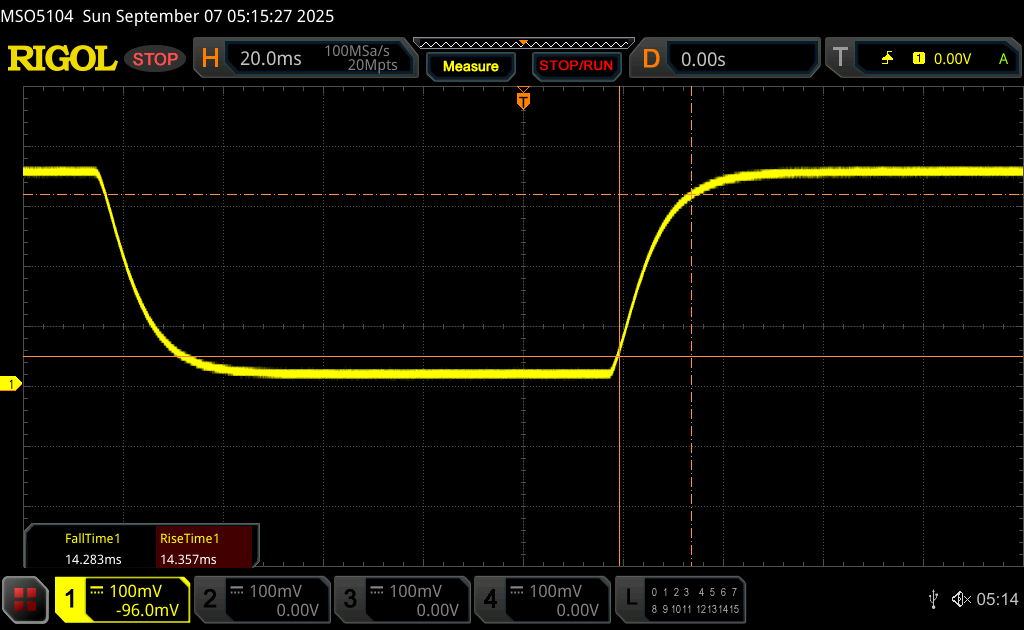 |
| ↘ 14.3 ms upadek | ||
| W naszych testach ekran wykazuje stosunkowo powolne tempo reakcji i może być zbyt wolny dla graczy. Dla porównania, wszystkie testowane urządzenia wahają się od 0.1 (minimum) do 240 (maksimum) ms. » 76 % wszystkich urządzeń jest lepszych. Oznacza to, że zmierzony czas reakcji jest gorszy od średniej wszystkich testowanych urządzeń (19.8 ms). | ||
| ↔ Czas reakcji 50% szarości do 80% szarości | ||
| 49.3 ms ... wzrost ↗ i spadek ↘ łącznie | ↗ 23.1 ms wzrost | 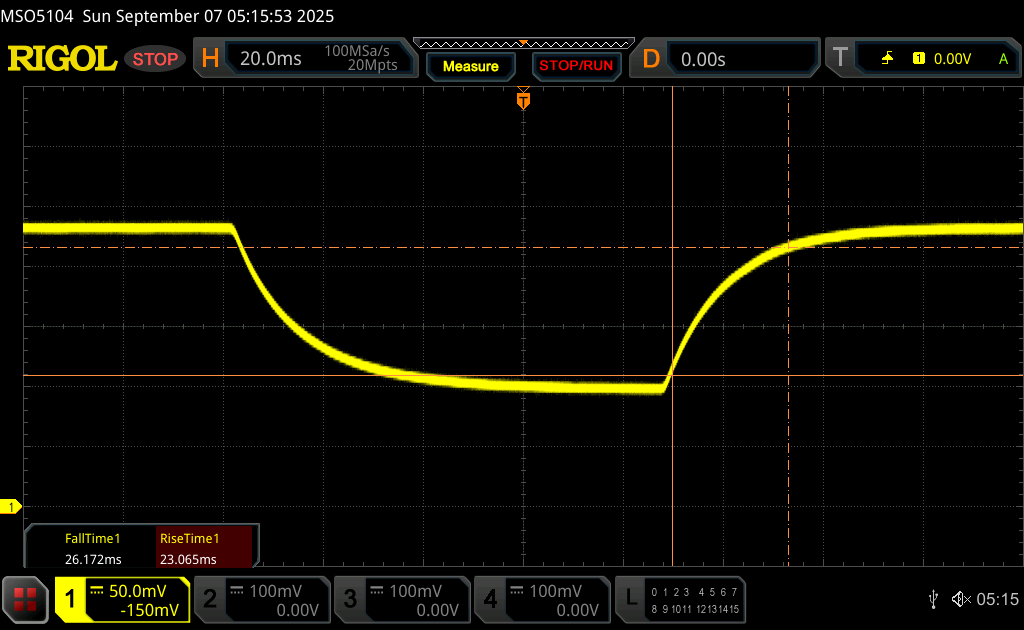 |
| ↘ 26.2 ms upadek | ||
| W naszych testach ekran wykazuje powolne tempo reakcji, co będzie niezadowalające dla graczy. Dla porównania, wszystkie testowane urządzenia wahają się od 0.165 (minimum) do 636 (maksimum) ms. » 85 % wszystkich urządzeń jest lepszych. Oznacza to, że zmierzony czas reakcji jest gorszy od średniej wszystkich testowanych urządzeń (31 ms). | ||
Migotanie ekranu / PWM (modulacja szerokości impulsu)
| Migotanie ekranu/nie wykryto PWM | 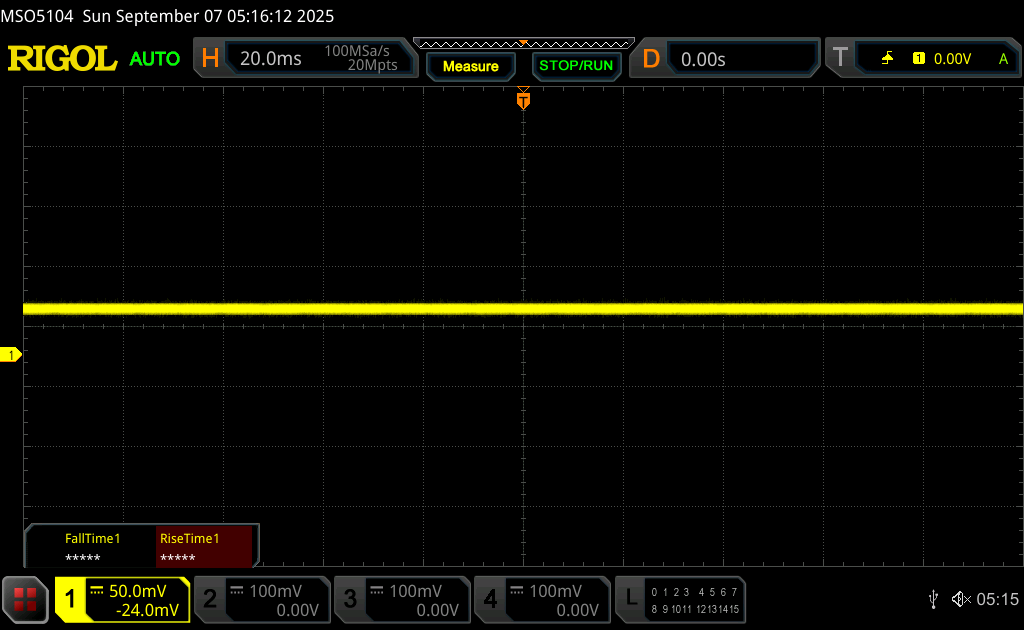 | ||
Dla porównania: 52 % wszystkich testowanych urządzeń nie używa PWM do przyciemniania wyświetlacza. Jeśli wykryto PWM, zmierzono średnio 7747 (minimum: 5 - maksimum: 343500) Hz. | |||

Wydajność
Warunki testowania
Przed uruchomieniem poniższych testów ustawiliśmy MyHP na tryb wydajności.
Procesor
Surowa wydajność procesora Core Ultra 7 265U jest szybsza niż w większości innych 13-calowych laptopów konwertowalnych. Godnym uwagi wyjątkiem jest MSI Summit E13 AI Evo który jest jednym z niewielu 13-calowych laptopów konwertowalnych wyposażonych w procesor Core z serii H, zapewniający od 10 do 25 procent wyższą wydajność wielowątkową.
Wydajność wielowątkowa spadłaby o 25 procent podczas uruchamiania CineBench R15 xT w pętli, jak pokazuje poniższy wykres, który pokrywa się z naszymi obserwacjami dotyczącymi częstotliwości taktowania w teście warunków skrajnych. Takie zachowanie jest powszechne w wielu subnotebookach wyposażonych w procesory z serii U.
Przejście z konfiguracji Core Ultra 7 265U na konfigurację Core Ultra 5 235U powinno wpłynąć na wydajność o 10 do 15 procent w oparciu o nasz czas spędzony z Dell Pro 14 Plus.
Cinebench R15 Multi Loop
Cinebench R23: Multi Core | Single Core
Cinebench R20: CPU (Multi Core) | CPU (Single Core)
Cinebench R15: CPU Multi 64Bit | CPU Single 64Bit
Blender: v2.79 BMW27 CPU
7-Zip 18.03: 7z b 4 | 7z b 4 -mmt1
Geekbench 6.7: Multi-Core | Single-Core
Geekbench 5.5: Multi-Core | Single-Core
HWBOT x265 Benchmark v2.2: 4k Preset
LibreOffice : 20 Documents To PDF
R Benchmark 2.5: Overall mean
| CPU Performance rating | |
| MSI Summit E13 AI Evo A1MTG | |
| HP EliteBook 8 Flip G1i 13 | |
| Przeciętny Intel Core Ultra 7 265U | |
| Lenovo ThinkPad L13 2in1 G5 21LNS4AM00 | |
| HP Spectre x360 13.5 14t-ef000 -2! | |
| Lenovo ThinkPad L13 Yoga G4 i7-1355U | |
| HP ProBook x360 435 G8 R7-5800U -2! | |
| Dell Latitude 7350 Detachable | |
| HP EliteBook x360 830 G10 7L7U1ET | |
| Dell Latitude 9330 -2! | |
| Lenovo ThinkPad L13 Yoga G4 21FSS00100 -2! | |
| Asus ProArt PZ13 HT5306 -2! | |
| Acer Spin 3 SP313-51N-56YV -2! | |
| Lenovo ThinkPad X1 Titanium Yoga G1 20QA001RGE -2! | |
| Cinebench R23 / Multi Core | |
| MSI Summit E13 AI Evo A1MTG | |
| HP EliteBook 8 Flip G1i 13 | |
| Przeciętny Intel Core Ultra 7 265U (n=1) | |
| Lenovo ThinkPad L13 2in1 G5 21LNS4AM00 | |
| HP ProBook x360 435 G8 R7-5800U | |
| Dell Latitude 7350 Detachable | |
| HP Spectre x360 13.5 14t-ef000 | |
| Lenovo ThinkPad L13 Yoga G4 i7-1355U | |
| Dell Latitude 9330 | |
| HP EliteBook x360 830 G10 7L7U1ET | |
| Lenovo ThinkPad L13 Yoga G4 21FSS00100 | |
| Asus ProArt PZ13 HT5306 | |
| Acer Spin 3 SP313-51N-56YV | |
| Lenovo ThinkPad X1 Titanium Yoga G1 20QA001RGE | |
| Cinebench R23 / Single Core | |
| HP Spectre x360 13.5 14t-ef000 | |
| HP EliteBook 8 Flip G1i 13 | |
| Przeciętny Intel Core Ultra 7 265U (n=1) | |
| Lenovo ThinkPad L13 Yoga G4 i7-1355U | |
| MSI Summit E13 AI Evo A1MTG | |
| HP EliteBook x360 830 G10 7L7U1ET | |
| Dell Latitude 7350 Detachable | |
| Lenovo ThinkPad L13 2in1 G5 21LNS4AM00 | |
| Dell Latitude 9330 | |
| HP ProBook x360 435 G8 R7-5800U | |
| Lenovo ThinkPad L13 Yoga G4 21FSS00100 | |
| Acer Spin 3 SP313-51N-56YV | |
| Lenovo ThinkPad X1 Titanium Yoga G1 20QA001RGE | |
| Asus ProArt PZ13 HT5306 | |
| Cinebench R20 / CPU (Multi Core) | |
| MSI Summit E13 AI Evo A1MTG | |
| HP EliteBook 8 Flip G1i 13 | |
| Przeciętny Intel Core Ultra 7 265U (n=1) | |
| Lenovo ThinkPad L13 2in1 G5 21LNS4AM00 | |
| HP ProBook x360 435 G8 R7-5800U | |
| Dell Latitude 7350 Detachable | |
| HP Spectre x360 13.5 14t-ef000 | |
| Lenovo ThinkPad L13 Yoga G4 i7-1355U | |
| Dell Latitude 9330 | |
| Lenovo ThinkPad L13 Yoga G4 21FSS00100 | |
| HP EliteBook x360 830 G10 7L7U1ET | |
| Asus ProArt PZ13 HT5306 | |
| Acer Spin 3 SP313-51N-56YV | |
| Lenovo ThinkPad X1 Titanium Yoga G1 20QA001RGE | |
| Cinebench R20 / CPU (Single Core) | |
| HP EliteBook 8 Flip G1i 13 | |
| Przeciętny Intel Core Ultra 7 265U (n=1) | |
| HP Spectre x360 13.5 14t-ef000 | |
| Lenovo ThinkPad L13 Yoga G4 i7-1355U | |
| MSI Summit E13 AI Evo A1MTG | |
| HP EliteBook x360 830 G10 7L7U1ET | |
| Lenovo ThinkPad L13 2in1 G5 21LNS4AM00 | |
| Dell Latitude 7350 Detachable | |
| Dell Latitude 9330 | |
| HP ProBook x360 435 G8 R7-5800U | |
| Lenovo ThinkPad L13 Yoga G4 21FSS00100 | |
| Acer Spin 3 SP313-51N-56YV | |
| Lenovo ThinkPad X1 Titanium Yoga G1 20QA001RGE | |
| Asus ProArt PZ13 HT5306 | |
| Cinebench R15 / CPU Multi 64Bit | |
| MSI Summit E13 AI Evo A1MTG | |
| HP EliteBook 8 Flip G1i 13 | |
| Przeciętny Intel Core Ultra 7 265U (n=1) | |
| Lenovo ThinkPad L13 2in1 G5 21LNS4AM00 | |
| HP ProBook x360 435 G8 R7-5800U | |
| Asus ProArt PZ13 HT5306 | |
| HP Spectre x360 13.5 14t-ef000 | |
| Dell Latitude 7350 Detachable | |
| Lenovo ThinkPad L13 Yoga G4 21FSS00100 | |
| Lenovo ThinkPad L13 Yoga G4 i7-1355U | |
| Dell Latitude 9330 | |
| HP EliteBook x360 830 G10 7L7U1ET | |
| Acer Spin 3 SP313-51N-56YV | |
| Lenovo ThinkPad X1 Titanium Yoga G1 20QA001RGE | |
| Cinebench R15 / CPU Single 64Bit | |
| HP Spectre x360 13.5 14t-ef000 | |
| HP EliteBook 8 Flip G1i 13 | |
| Przeciętny Intel Core Ultra 7 265U (n=1) | |
| MSI Summit E13 AI Evo A1MTG | |
| Lenovo ThinkPad L13 Yoga G4 i7-1355U | |
| HP EliteBook x360 830 G10 7L7U1ET | |
| Lenovo ThinkPad L13 2in1 G5 21LNS4AM00 | |
| HP ProBook x360 435 G8 R7-5800U | |
| Dell Latitude 7350 Detachable | |
| Dell Latitude 9330 | |
| Lenovo ThinkPad L13 Yoga G4 21FSS00100 | |
| Asus ProArt PZ13 HT5306 | |
| Acer Spin 3 SP313-51N-56YV | |
| Lenovo ThinkPad X1 Titanium Yoga G1 20QA001RGE | |
| Blender / v2.79 BMW27 CPU | |
| Lenovo ThinkPad X1 Titanium Yoga G1 20QA001RGE | |
| Acer Spin 3 SP313-51N-56YV | |
| Asus ProArt PZ13 HT5306 | |
| Lenovo ThinkPad L13 Yoga G4 i7-1355U | |
| Lenovo ThinkPad L13 Yoga G4 21FSS00100 | |
| HP EliteBook x360 830 G10 7L7U1ET | |
| Dell Latitude 9330 | |
| Dell Latitude 7350 Detachable | |
| HP Spectre x360 13.5 14t-ef000 | |
| Lenovo ThinkPad L13 2in1 G5 21LNS4AM00 | |
| HP EliteBook 8 Flip G1i 13 | |
| Przeciętny Intel Core Ultra 7 265U (n=1) | |
| HP ProBook x360 435 G8 R7-5800U | |
| MSI Summit E13 AI Evo A1MTG | |
| 7-Zip 18.03 / 7z b 4 | |
| HP ProBook x360 435 G8 R7-5800U | |
| MSI Summit E13 AI Evo A1MTG | |
| Lenovo ThinkPad L13 2in1 G5 21LNS4AM00 | |
| HP EliteBook 8 Flip G1i 13 | |
| Przeciętny Intel Core Ultra 7 265U (n=1) | |
| HP Spectre x360 13.5 14t-ef000 | |
| Lenovo ThinkPad L13 Yoga G4 i7-1355U | |
| Lenovo ThinkPad L13 Yoga G4 21FSS00100 | |
| Dell Latitude 9330 | |
| Asus ProArt PZ13 HT5306 | |
| HP EliteBook x360 830 G10 7L7U1ET | |
| Dell Latitude 7350 Detachable | |
| Acer Spin 3 SP313-51N-56YV | |
| Lenovo ThinkPad X1 Titanium Yoga G1 20QA001RGE | |
| 7-Zip 18.03 / 7z b 4 -mmt1 | |
| HP Spectre x360 13.5 14t-ef000 | |
| Lenovo ThinkPad L13 Yoga G4 i7-1355U | |
| HP ProBook x360 435 G8 R7-5800U | |
| Lenovo ThinkPad L13 Yoga G4 21FSS00100 | |
| HP EliteBook 8 Flip G1i 13 | |
| Przeciętny Intel Core Ultra 7 265U (n=1) | |
| HP EliteBook x360 830 G10 7L7U1ET | |
| Dell Latitude 9330 | |
| Acer Spin 3 SP313-51N-56YV | |
| Lenovo ThinkPad X1 Titanium Yoga G1 20QA001RGE | |
| Dell Latitude 7350 Detachable | |
| MSI Summit E13 AI Evo A1MTG | |
| Asus ProArt PZ13 HT5306 | |
| Lenovo ThinkPad L13 2in1 G5 21LNS4AM00 | |
| Geekbench 6.7 / Multi-Core | |
| MSI Summit E13 AI Evo A1MTG | |
| Asus ProArt PZ13 HT5306 | |
| HP EliteBook 8 Flip G1i 13 | |
| Przeciętny Intel Core Ultra 7 265U (n=1) | |
| Lenovo ThinkPad L13 2in1 G5 21LNS4AM00 | |
| Lenovo ThinkPad L13 Yoga G4 i7-1355U | |
| HP EliteBook x360 830 G10 7L7U1ET | |
| Dell Latitude 7350 Detachable | |
| Geekbench 6.7 / Single-Core | |
| Lenovo ThinkPad L13 Yoga G4 i7-1355U | |
| HP EliteBook 8 Flip G1i 13 | |
| Przeciętny Intel Core Ultra 7 265U (n=1) | |
| Asus ProArt PZ13 HT5306 | |
| MSI Summit E13 AI Evo A1MTG | |
| HP EliteBook x360 830 G10 7L7U1ET | |
| Lenovo ThinkPad L13 2in1 G5 21LNS4AM00 | |
| Dell Latitude 7350 Detachable | |
| Geekbench 5.5 / Multi-Core | |
| MSI Summit E13 AI Evo A1MTG | |
| HP EliteBook 8 Flip G1i 13 | |
| Przeciętny Intel Core Ultra 7 265U (n=1) | |
| Lenovo ThinkPad L13 2in1 G5 21LNS4AM00 | |
| HP Spectre x360 13.5 14t-ef000 | |
| Lenovo ThinkPad L13 Yoga G4 i7-1355U | |
| Dell Latitude 7350 Detachable | |
| Dell Latitude 9330 | |
| HP ProBook x360 435 G8 R7-5800U | |
| Lenovo ThinkPad L13 Yoga G4 21FSS00100 | |
| Acer Spin 3 SP313-51N-56YV | |
| HP EliteBook x360 830 G10 7L7U1ET | |
| Lenovo ThinkPad X1 Titanium Yoga G1 20QA001RGE | |
| Geekbench 5.5 / Single-Core | |
| Lenovo ThinkPad L13 Yoga G4 i7-1355U | |
| HP EliteBook 8 Flip G1i 13 | |
| Przeciętny Intel Core Ultra 7 265U (n=1) | |
| HP Spectre x360 13.5 14t-ef000 | |
| MSI Summit E13 AI Evo A1MTG | |
| Lenovo ThinkPad L13 2in1 G5 21LNS4AM00 | |
| Dell Latitude 9330 | |
| Dell Latitude 7350 Detachable | |
| HP EliteBook x360 830 G10 7L7U1ET | |
| Lenovo ThinkPad X1 Titanium Yoga G1 20QA001RGE | |
| HP ProBook x360 435 G8 R7-5800U | |
| Acer Spin 3 SP313-51N-56YV | |
| Lenovo ThinkPad L13 Yoga G4 21FSS00100 | |
| HWBOT x265 Benchmark v2.2 / 4k Preset | |
| MSI Summit E13 AI Evo A1MTG | |
| Lenovo ThinkPad L13 2in1 G5 21LNS4AM00 | |
| HP EliteBook 8 Flip G1i 13 | |
| Przeciętny Intel Core Ultra 7 265U (n=1) | |
| HP ProBook x360 435 G8 R7-5800U | |
| HP Spectre x360 13.5 14t-ef000 | |
| Lenovo ThinkPad L13 Yoga G4 i7-1355U | |
| Dell Latitude 7350 Detachable | |
| Dell Latitude 9330 | |
| Lenovo ThinkPad L13 Yoga G4 21FSS00100 | |
| HP EliteBook x360 830 G10 7L7U1ET | |
| Acer Spin 3 SP313-51N-56YV | |
| Asus ProArt PZ13 HT5306 | |
| Lenovo ThinkPad X1 Titanium Yoga G1 20QA001RGE | |
| LibreOffice / 20 Documents To PDF | |
| Asus ProArt PZ13 HT5306 | |
| MSI Summit E13 AI Evo A1MTG | |
| HP ProBook x360 435 G8 R7-5800U | |
| HP EliteBook x360 830 G10 7L7U1ET | |
| Lenovo ThinkPad L13 2in1 G5 21LNS4AM00 | |
| Lenovo ThinkPad L13 Yoga G4 21FSS00100 | |
| HP EliteBook 8 Flip G1i 13 | |
| Przeciętny Intel Core Ultra 7 265U (n=1) | |
| Dell Latitude 9330 | |
| Lenovo ThinkPad X1 Titanium Yoga G1 20QA001RGE | |
| Dell Latitude 7350 Detachable | |
| Acer Spin 3 SP313-51N-56YV | |
| Lenovo ThinkPad L13 Yoga G4 i7-1355U | |
| HP Spectre x360 13.5 14t-ef000 | |
| R Benchmark 2.5 / Overall mean | |
| Asus ProArt PZ13 HT5306 | |
| Lenovo ThinkPad X1 Titanium Yoga G1 20QA001RGE | |
| Acer Spin 3 SP313-51N-56YV | |
| Lenovo ThinkPad L13 Yoga G4 21FSS00100 | |
| Lenovo ThinkPad L13 2in1 G5 21LNS4AM00 | |
| HP ProBook x360 435 G8 R7-5800U | |
| Dell Latitude 7350 Detachable | |
| Dell Latitude 9330 | |
| HP EliteBook x360 830 G10 7L7U1ET | |
| HP EliteBook 8 Flip G1i 13 | |
| Przeciętny Intel Core Ultra 7 265U (n=1) | |
| MSI Summit E13 AI Evo A1MTG | |
| HP Spectre x360 13.5 14t-ef000 | |
| Lenovo ThinkPad L13 Yoga G4 i7-1355U | |
Cinebench R23: Multi Core | Single Core
Cinebench R20: CPU (Multi Core) | CPU (Single Core)
Cinebench R15: CPU Multi 64Bit | CPU Single 64Bit
Blender: v2.79 BMW27 CPU
7-Zip 18.03: 7z b 4 | 7z b 4 -mmt1
Geekbench 6.7: Multi-Core | Single-Core
Geekbench 5.5: Multi-Core | Single-Core
HWBOT x265 Benchmark v2.2: 4k Preset
LibreOffice : 20 Documents To PDF
R Benchmark 2.5: Overall mean
* ... im mniej tym lepiej
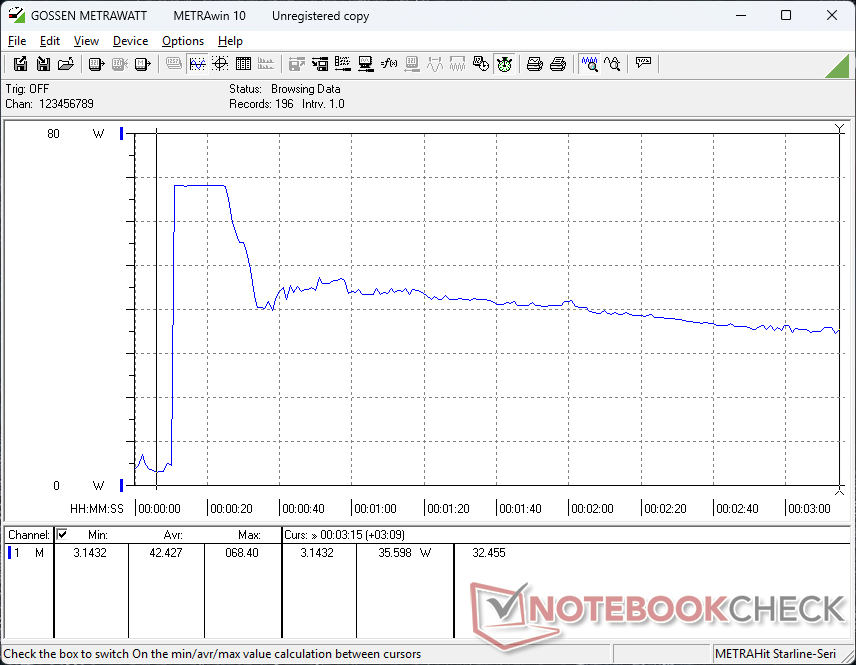
Test warunków skrajnych
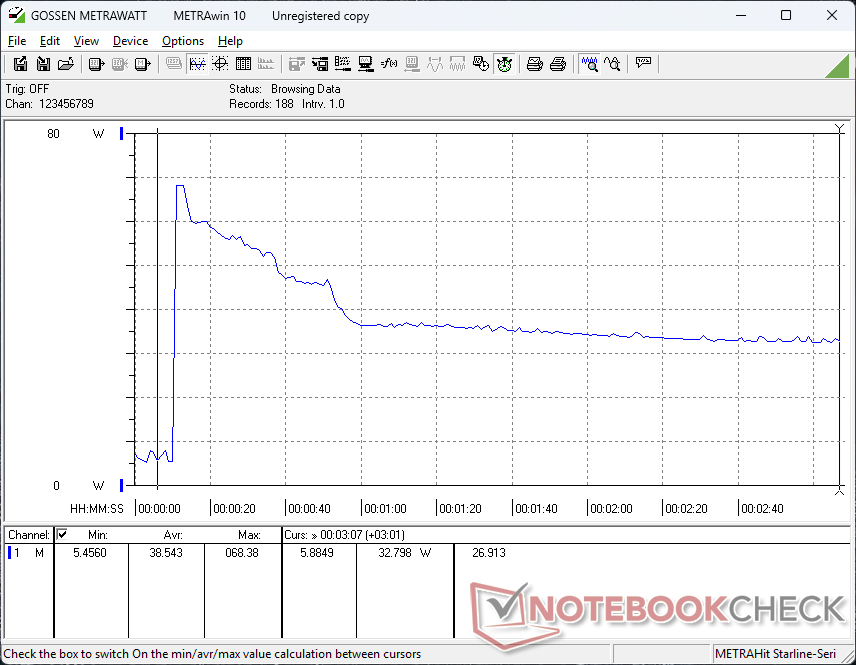
Procesor zwiększał taktowanie do 3,5 GHz, 57 W i 100 C podczas inicjowania stresu Prime95, po czym spadał do 2,1 GHz, 24 W i 94 C zaledwie 15 sekund później, reprezentując ograniczoną trwałość Turbo Boost. Temperatura rdzenia jest bardzo wysoka, szczególnie jak na procesor z serii U.
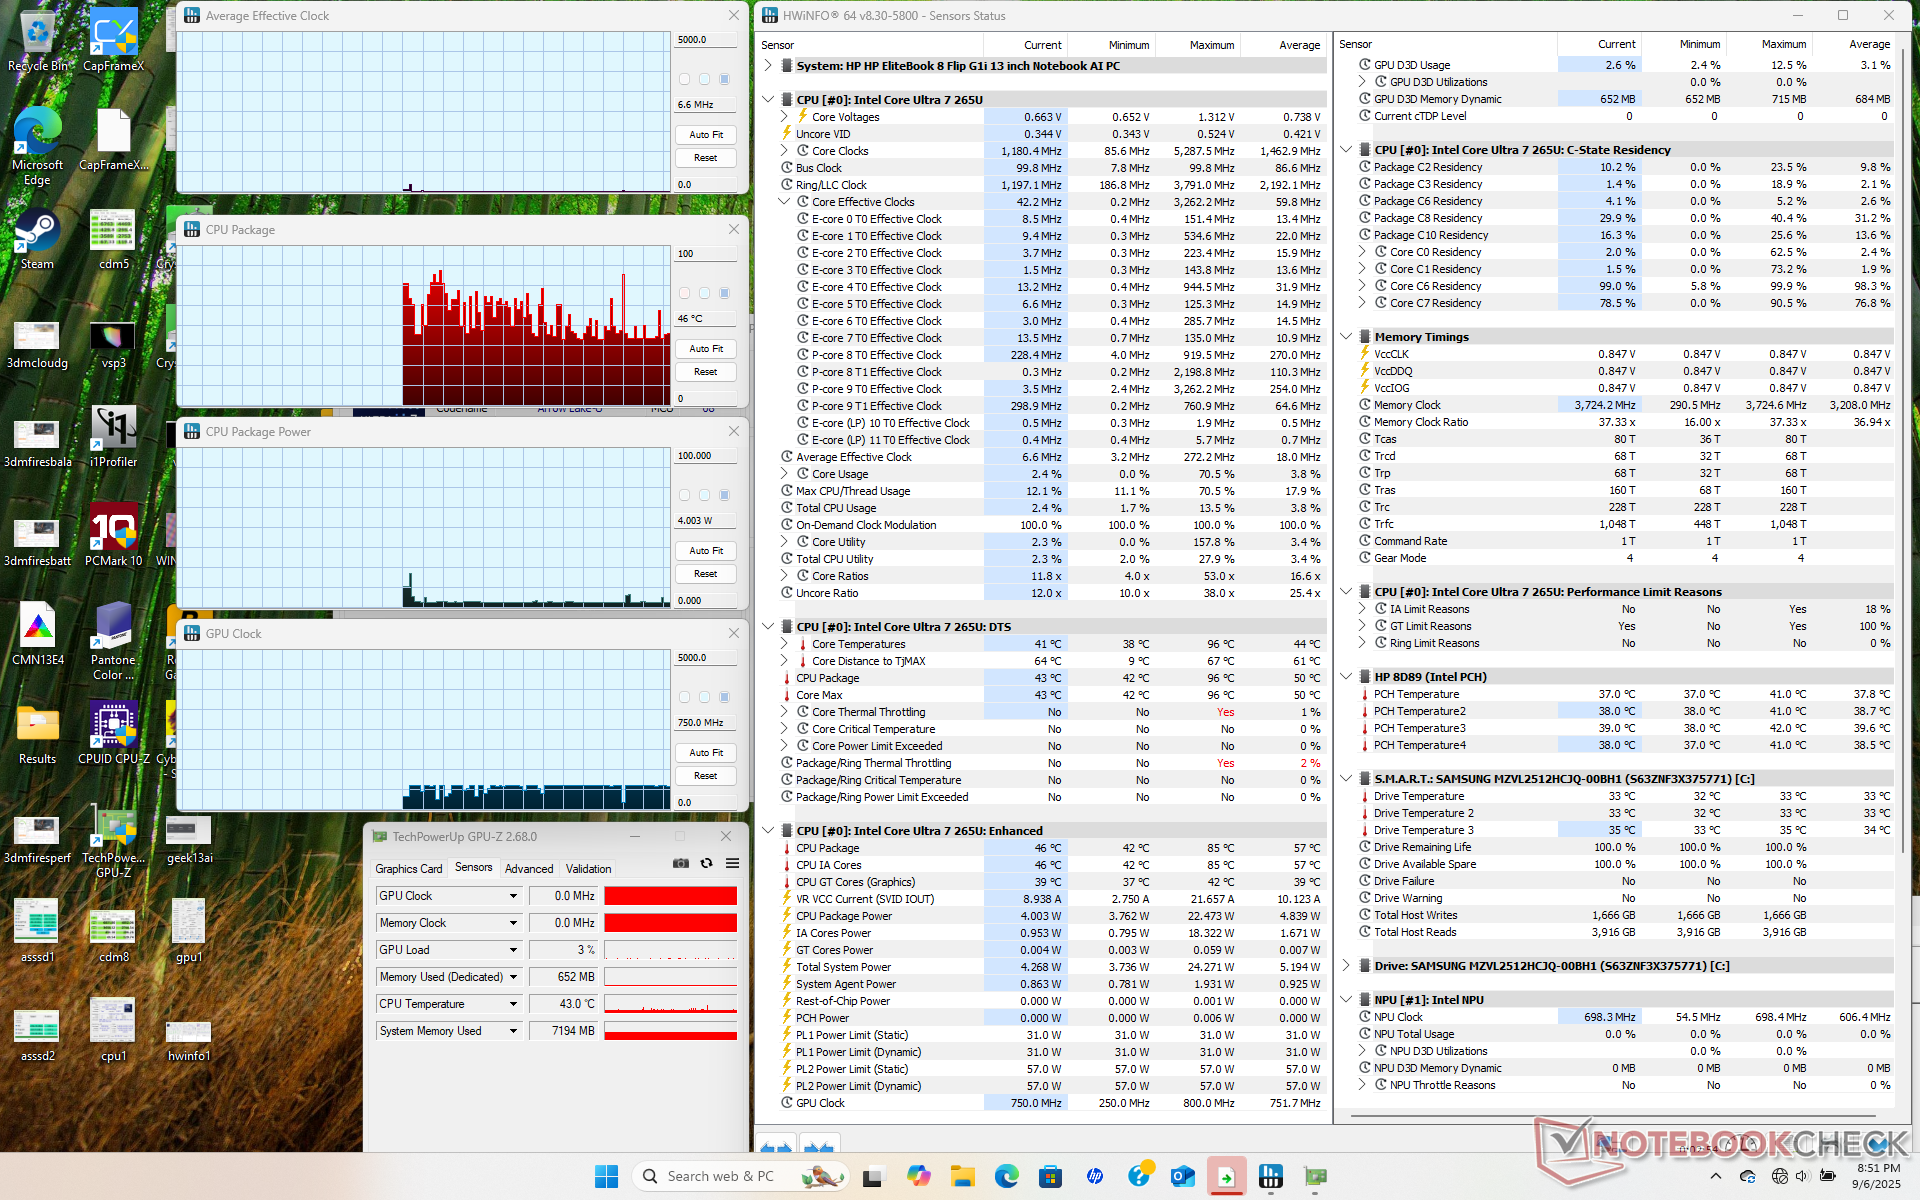
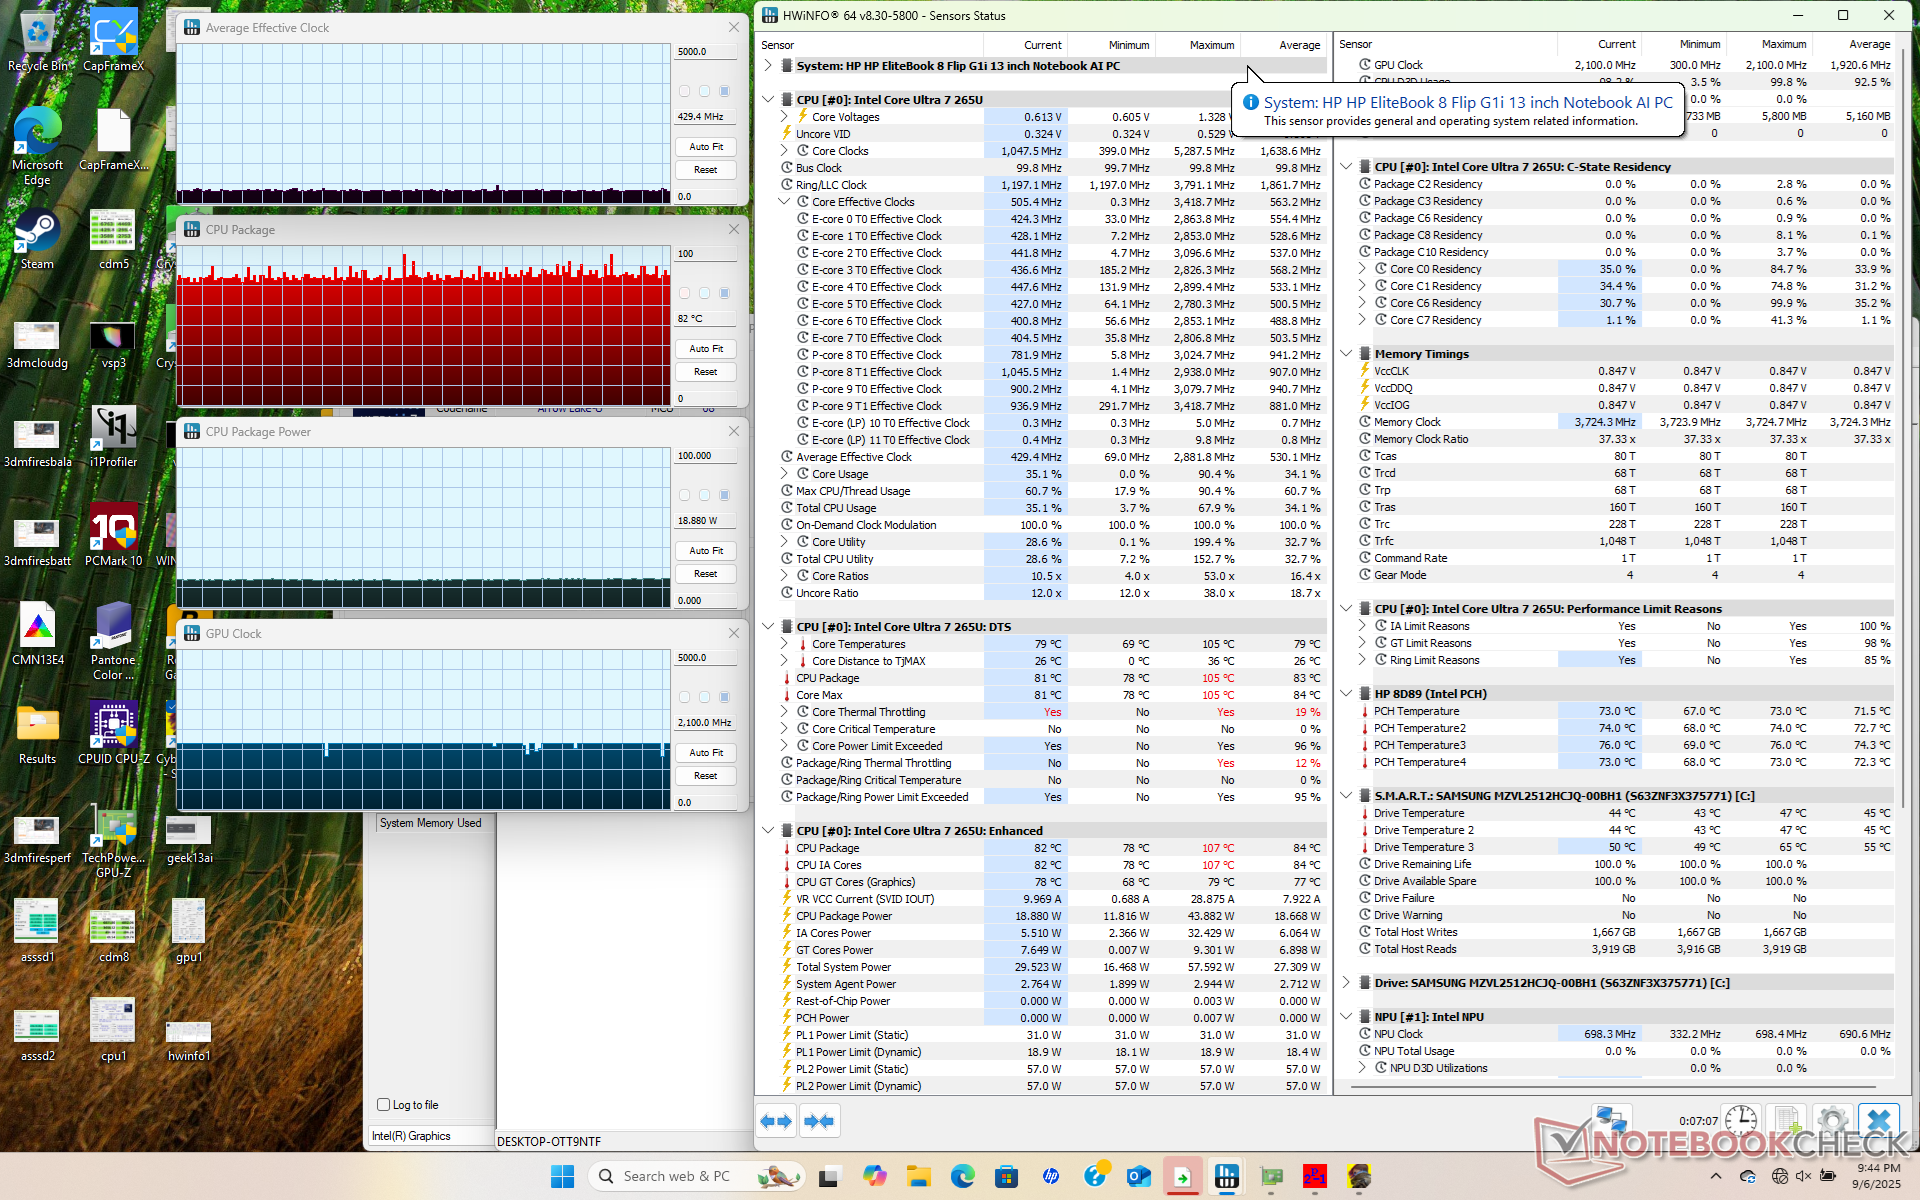
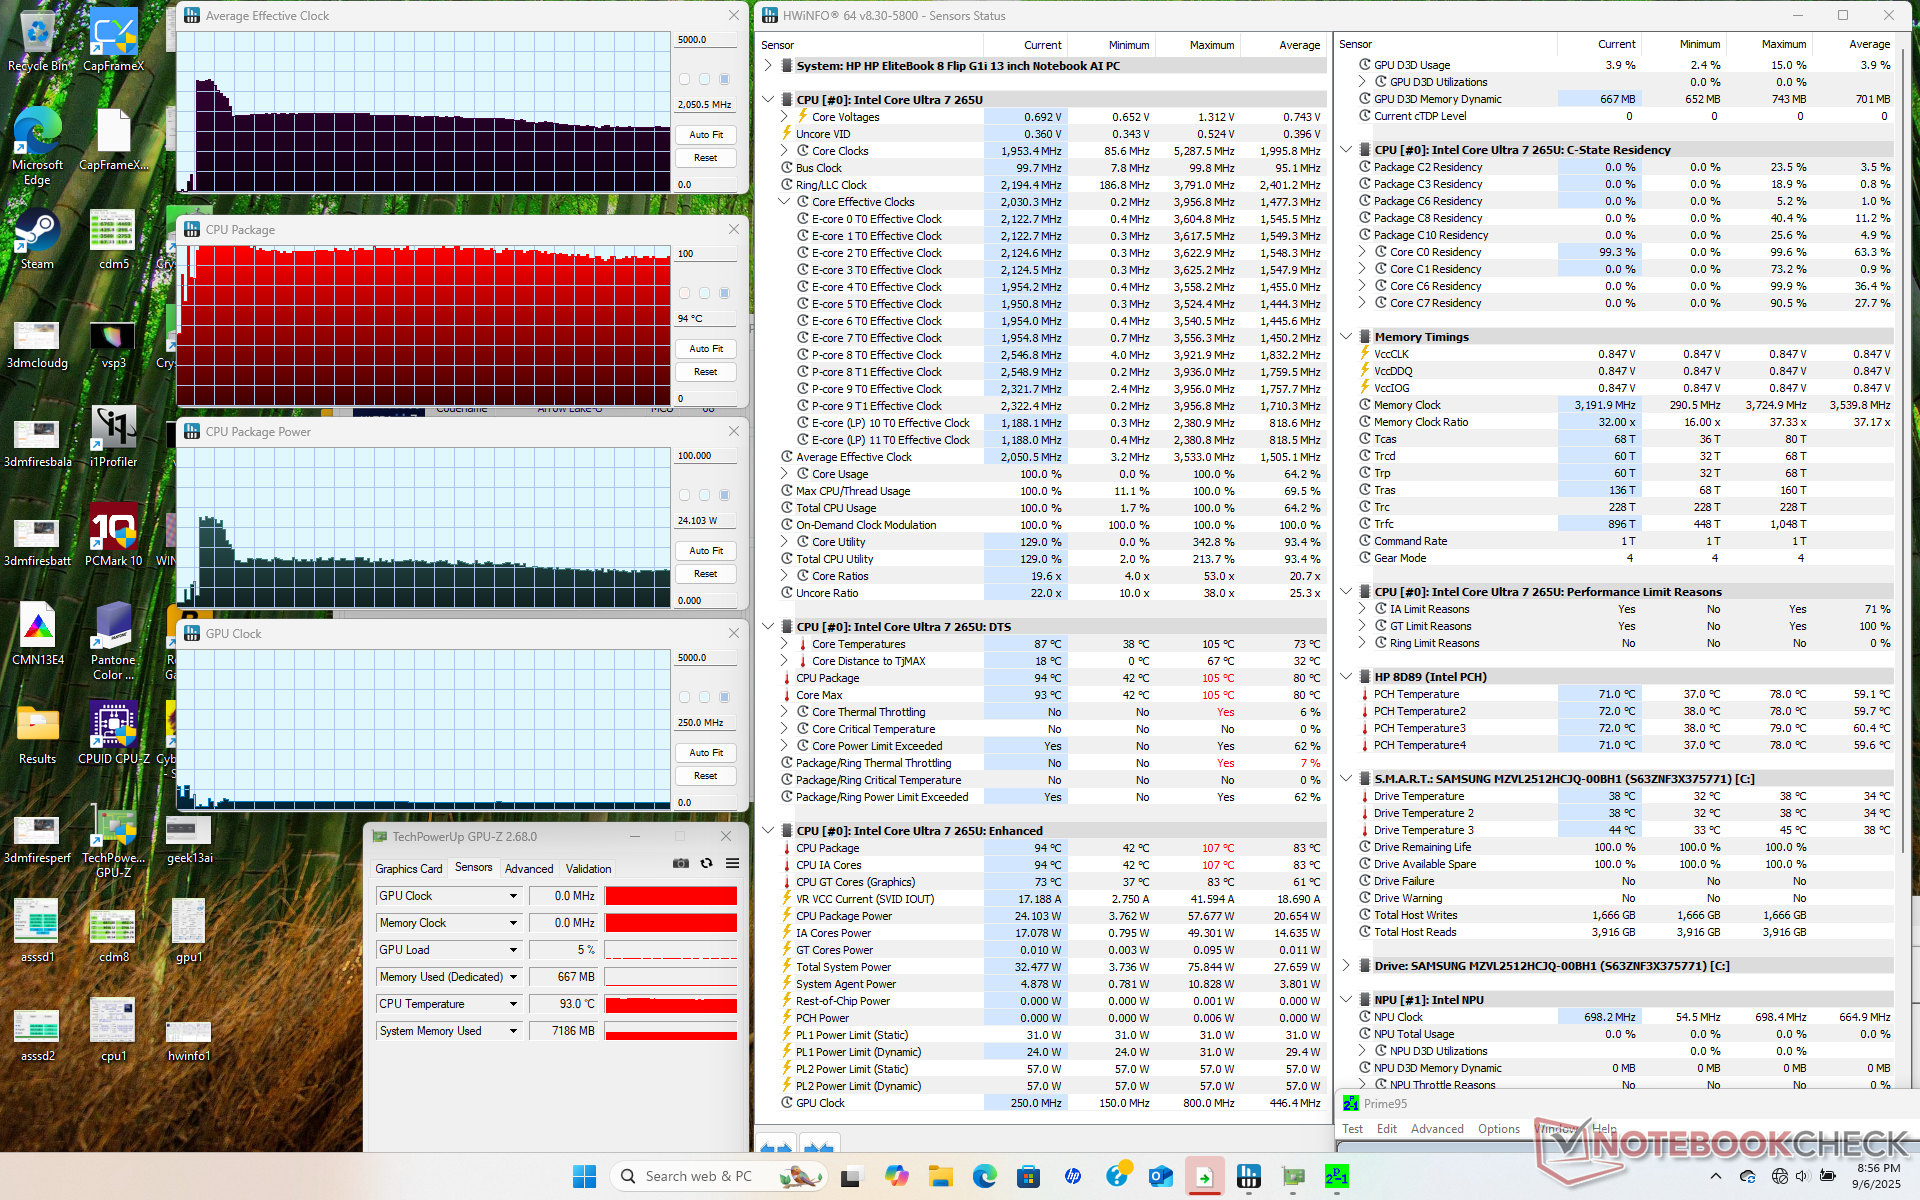
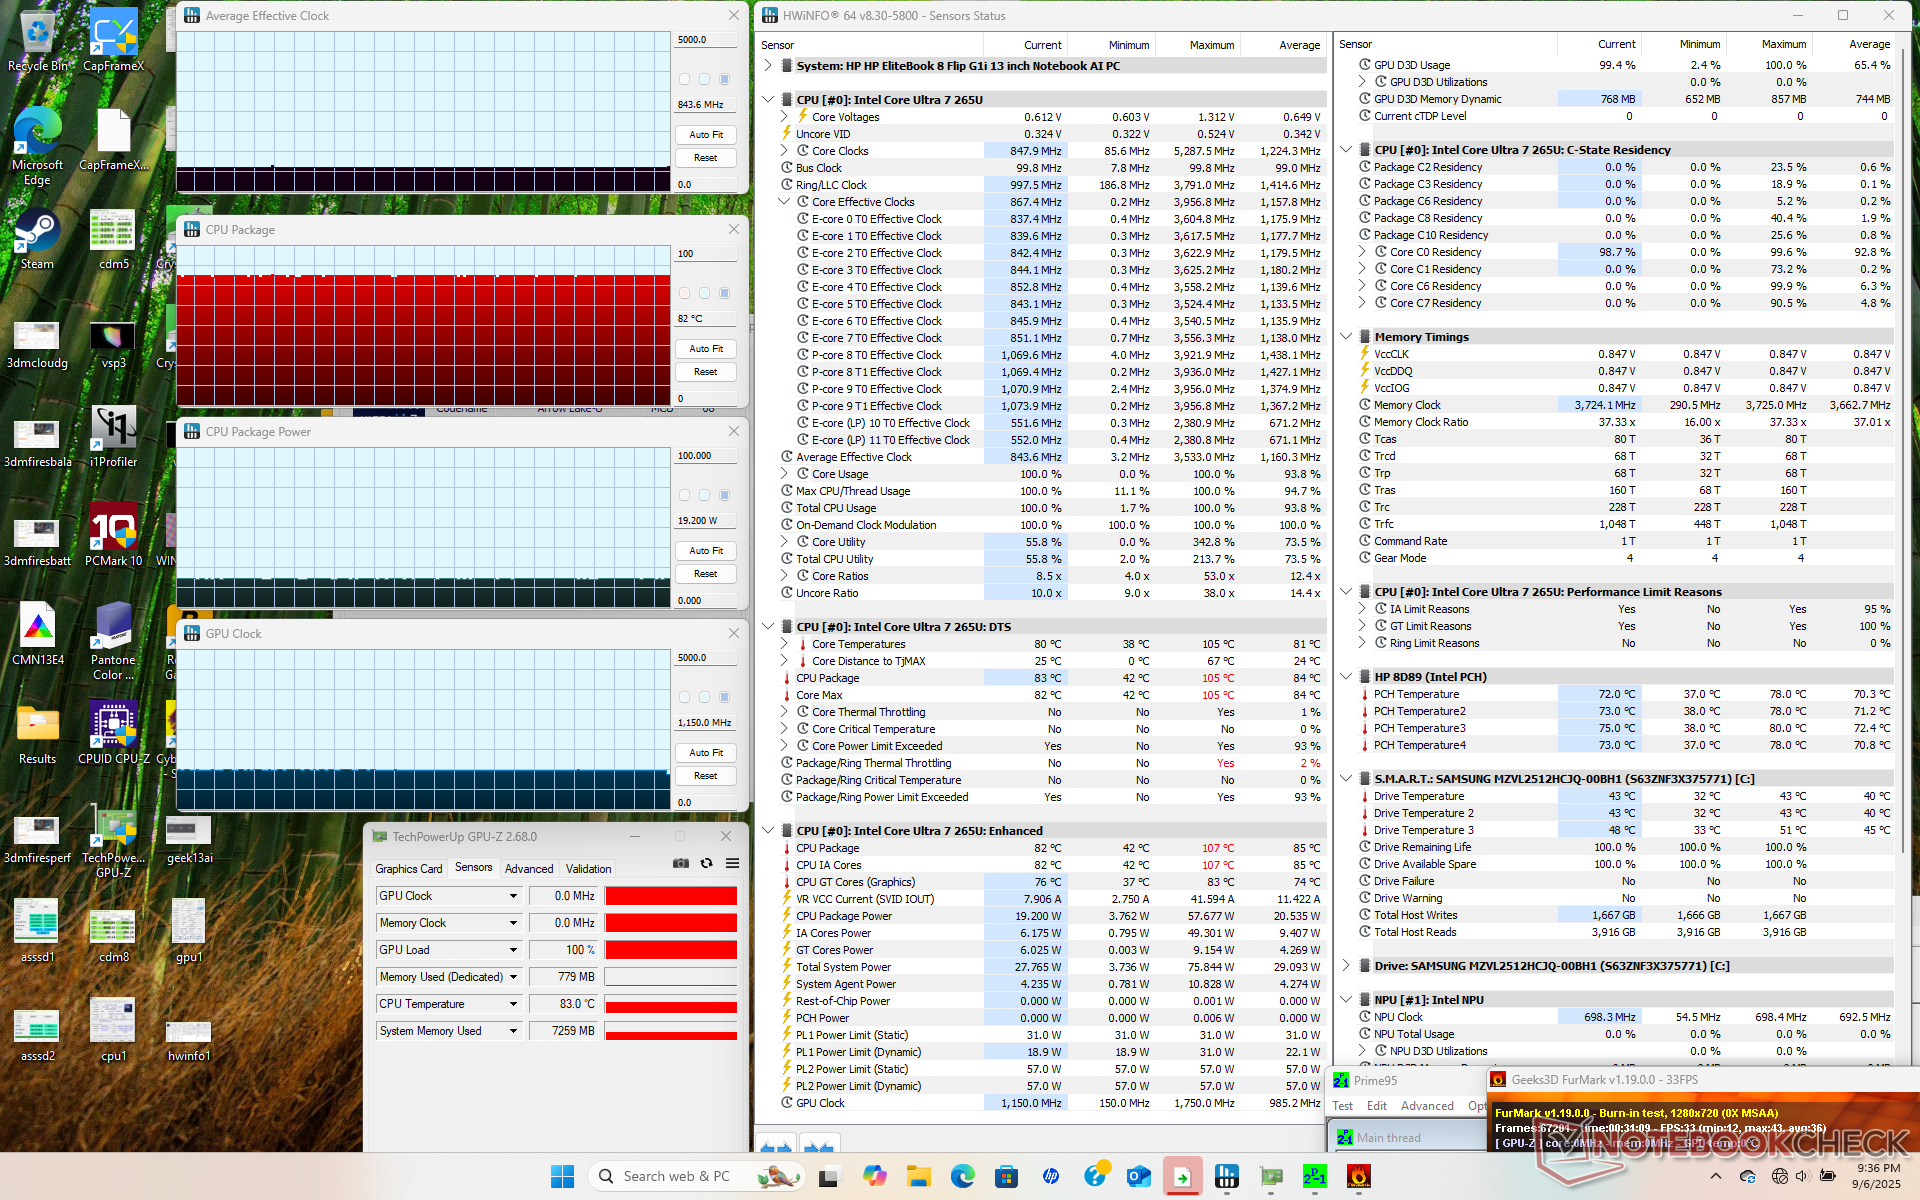
| Średnie taktowanie CPU (GHz) | Taktowanie GPU (MHz) | Średnia temperatura CPU (°C) | |
| System bezczynności | -- | -- | 46 |
| Prime95 Stress | 2.1 | -- | 94 |
| Prime95 + FurMark Stress | 0.8 | 1150 | 82 |
| Cyberpunk 2077 Stress | 0.4 | 2100 | 82 |
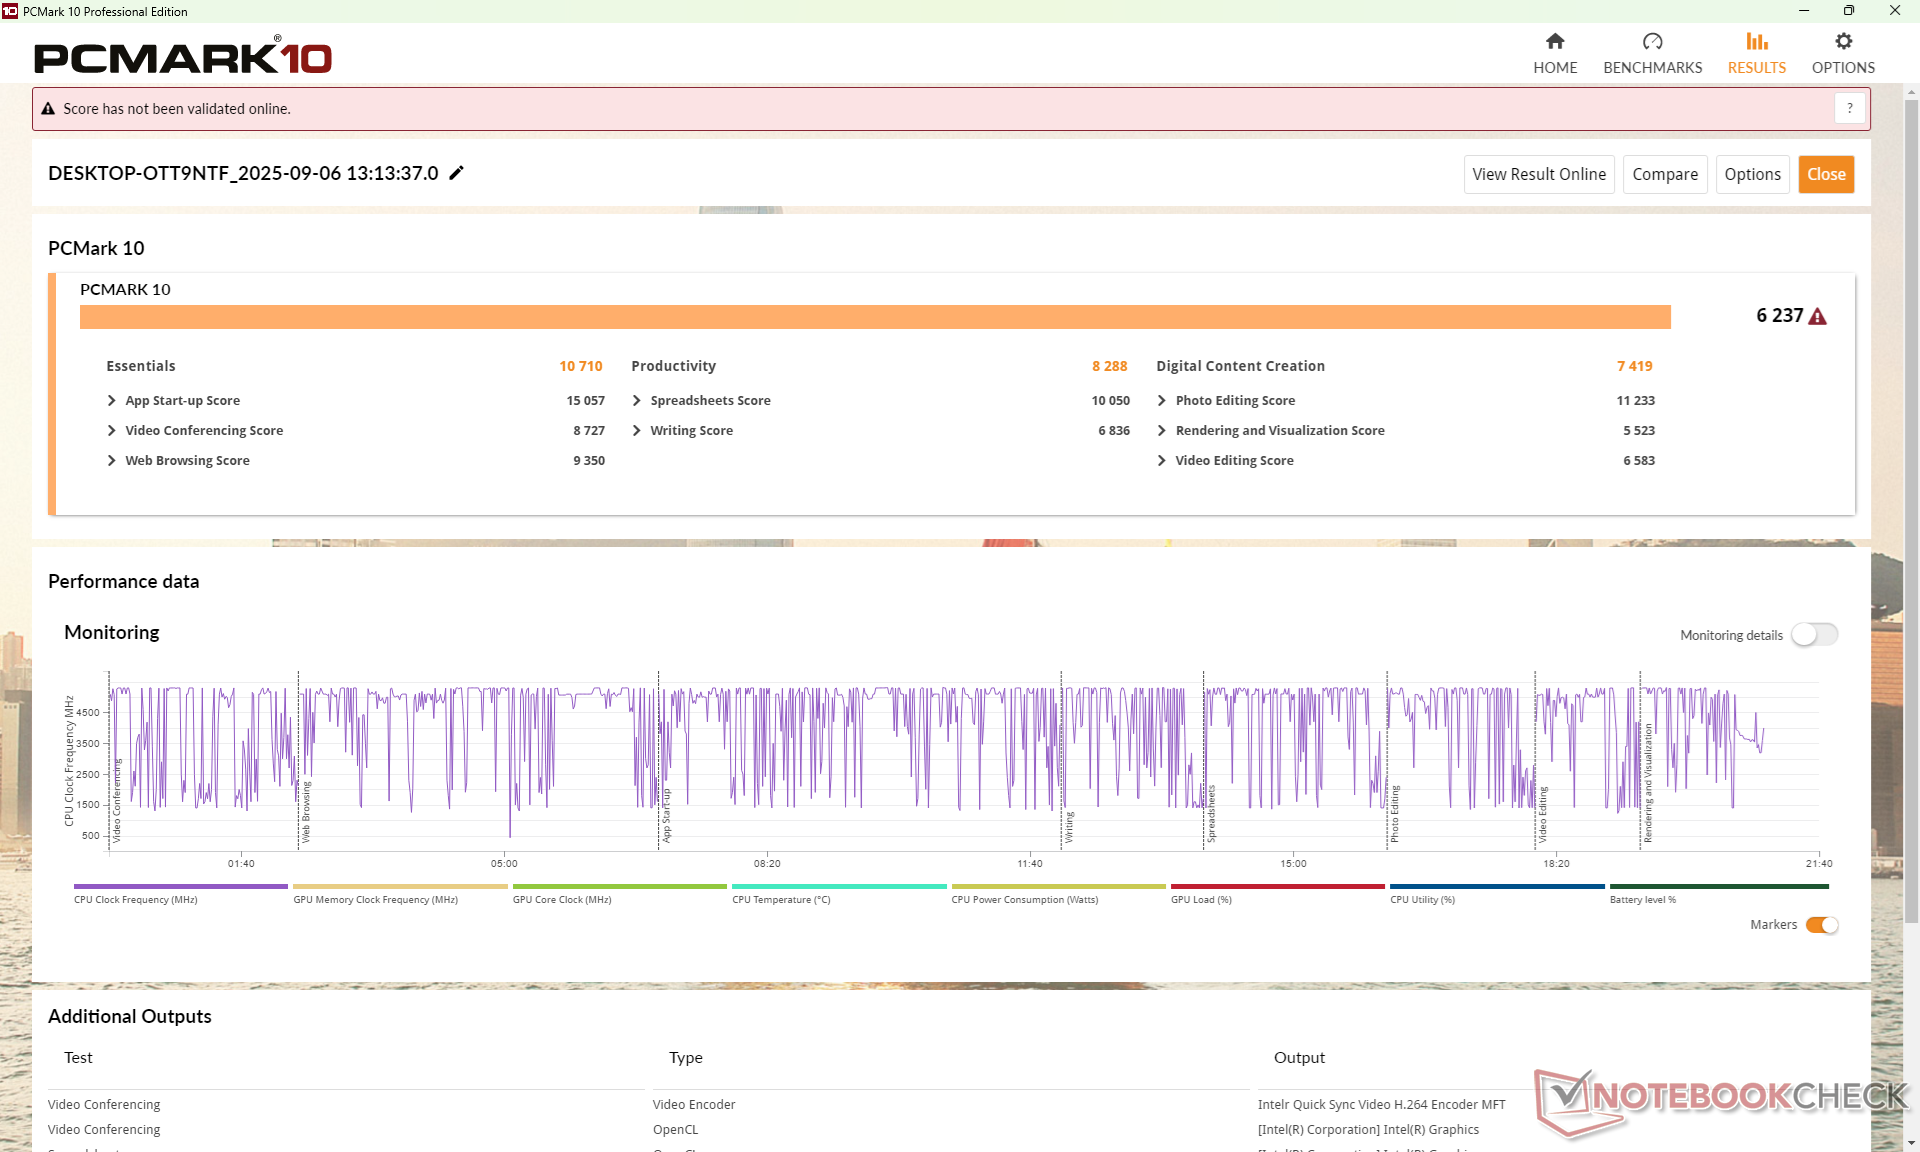
Wydajność systemu
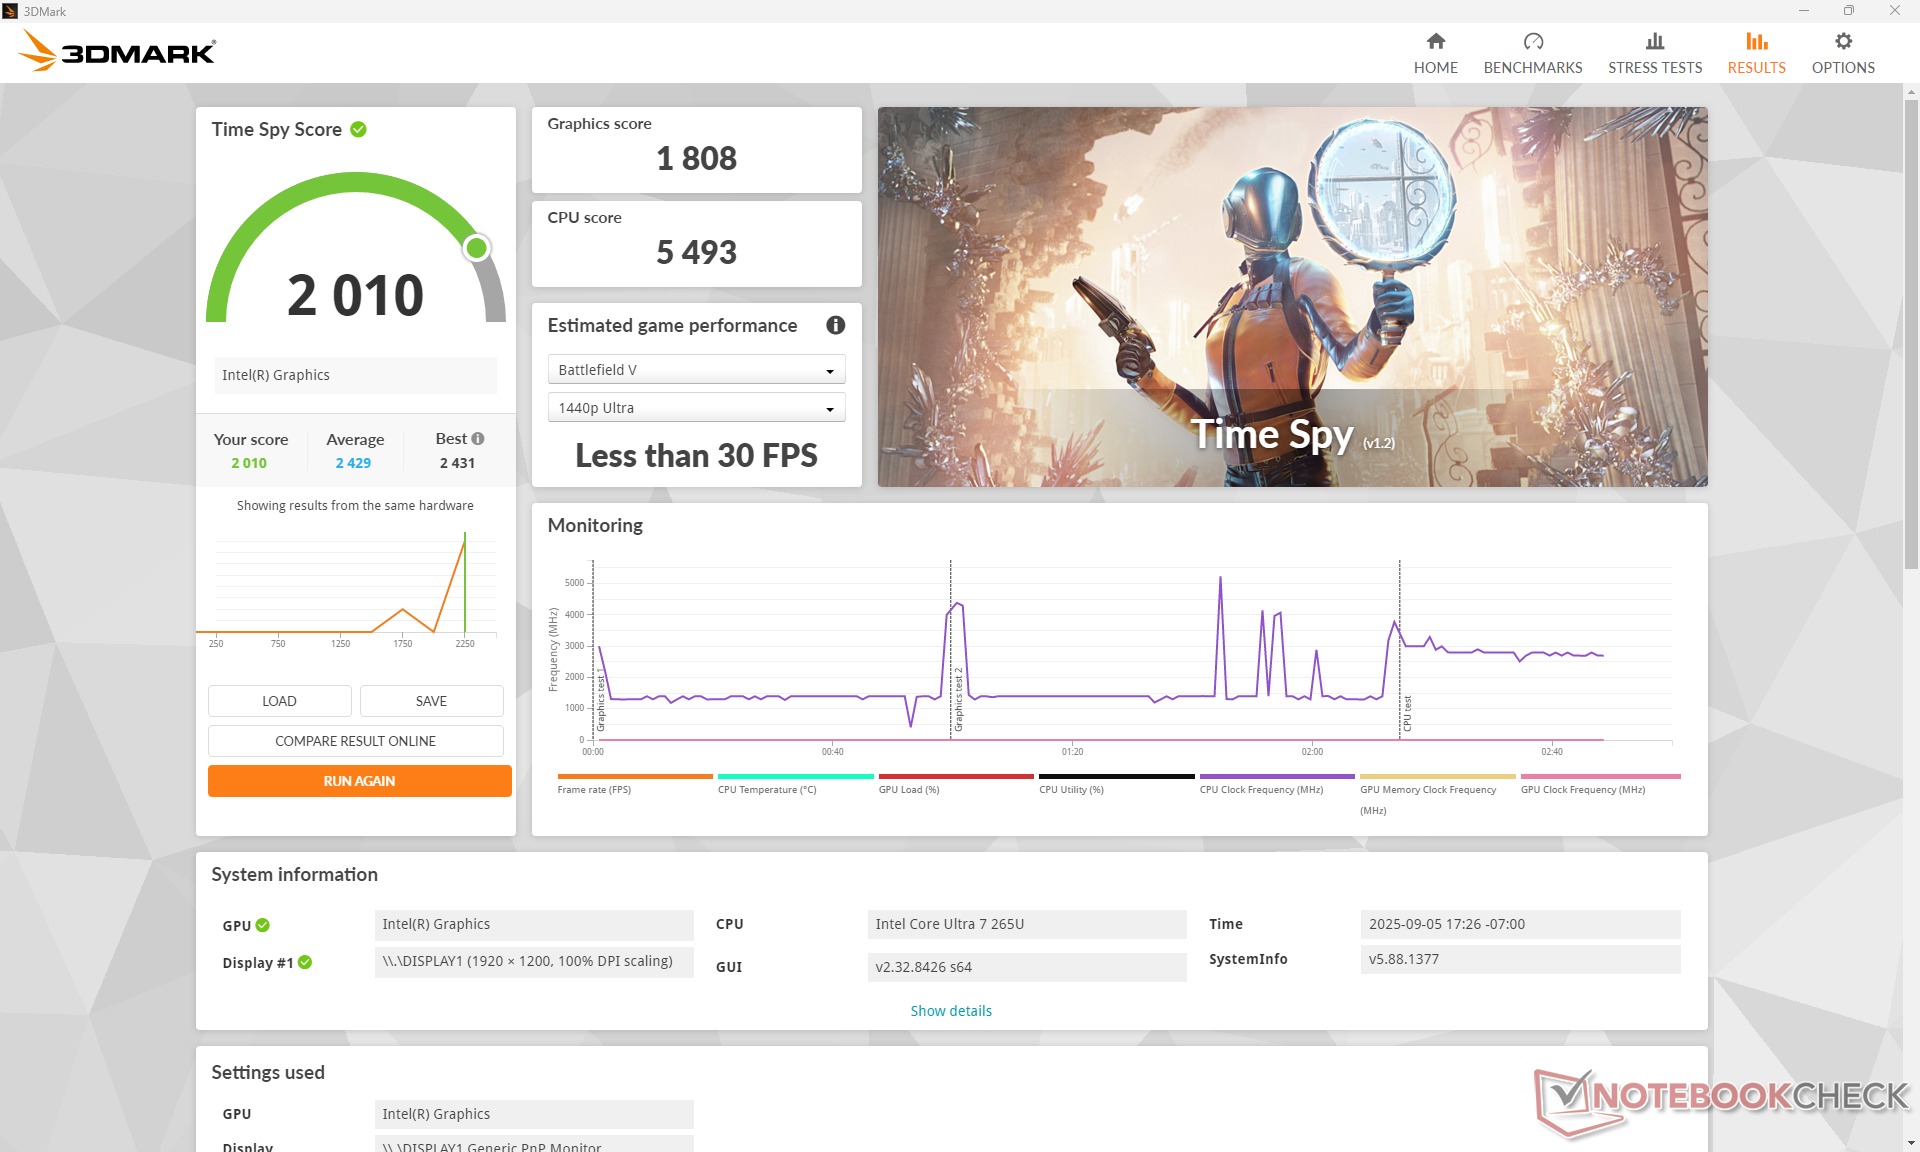
Wyniki PCMark są wyższe niż w przypadku większości 13-calowych laptopów konwertowalnych, w tym nawet MSI Summit E13 AI Evo z serii Core H, w wielu podkategoriach dzięki wydajniejszemu procesorowi Arrow Lake-U.
PCMark 10: Score | Essentials | Productivity | Digital Content Creation
CrossMark: Overall | Productivity | Creativity | Responsiveness
WebXPRT 3: Overall
WebXPRT 4: Overall
Mozilla Kraken 1.1: Total
| Performance rating | |
| HP EliteBook 8 Flip G1i 13 -1! | |
| Przeciętny Intel Core Ultra 7 265U, Intel Graphics 4-Core iGPU (Meteor / Arrow Lake) -1! | |
| MSI Summit E13 AI Evo A1MTG | |
| Asus ProArt PZ13 HT5306 -4! | |
| Lenovo ThinkPad L13 Yoga G4 21FSS00100 | |
| HP EliteBook x360 830 G10 7L7U1ET -1! | |
| Dell Latitude 9330 -4! | |
| PCMark 10 / Score | |
| HP EliteBook 8 Flip G1i 13 | |
| Przeciętny Intel Core Ultra 7 265U, Intel Graphics 4-Core iGPU (Meteor / Arrow Lake) (n=1) | |
| Lenovo ThinkPad L13 Yoga G4 21FSS00100 | |
| Dell Latitude 9330 | |
| HP EliteBook x360 830 G10 7L7U1ET | |
| MSI Summit E13 AI Evo A1MTG | |
| PCMark 10 / Essentials | |
| Lenovo ThinkPad L13 Yoga G4 21FSS00100 | |
| HP EliteBook 8 Flip G1i 13 | |
| Przeciętny Intel Core Ultra 7 265U, Intel Graphics 4-Core iGPU (Meteor / Arrow Lake) (n=1) | |
| Dell Latitude 9330 | |
| HP EliteBook x360 830 G10 7L7U1ET | |
| MSI Summit E13 AI Evo A1MTG | |
| PCMark 10 / Productivity | |
| Lenovo ThinkPad L13 Yoga G4 21FSS00100 | |
| HP EliteBook 8 Flip G1i 13 | |
| Przeciętny Intel Core Ultra 7 265U, Intel Graphics 4-Core iGPU (Meteor / Arrow Lake) (n=1) | |
| Dell Latitude 9330 | |
| HP EliteBook x360 830 G10 7L7U1ET | |
| MSI Summit E13 AI Evo A1MTG | |
| PCMark 10 / Digital Content Creation | |
| HP EliteBook 8 Flip G1i 13 | |
| Przeciętny Intel Core Ultra 7 265U, Intel Graphics 4-Core iGPU (Meteor / Arrow Lake) (n=1) | |
| MSI Summit E13 AI Evo A1MTG | |
| HP EliteBook x360 830 G10 7L7U1ET | |
| Dell Latitude 9330 | |
| Lenovo ThinkPad L13 Yoga G4 21FSS00100 | |
| CrossMark / Overall | |
| MSI Summit E13 AI Evo A1MTG | |
| HP EliteBook 8 Flip G1i 13 | |
| Przeciętny Intel Core Ultra 7 265U, Intel Graphics 4-Core iGPU (Meteor / Arrow Lake) (n=1) | |
| HP EliteBook x360 830 G10 7L7U1ET | |
| Lenovo ThinkPad L13 Yoga G4 21FSS00100 | |
| Asus ProArt PZ13 HT5306 | |
| CrossMark / Productivity | |
| MSI Summit E13 AI Evo A1MTG | |
| HP EliteBook 8 Flip G1i 13 | |
| Przeciętny Intel Core Ultra 7 265U, Intel Graphics 4-Core iGPU (Meteor / Arrow Lake) (n=1) | |
| HP EliteBook x360 830 G10 7L7U1ET | |
| Lenovo ThinkPad L13 Yoga G4 21FSS00100 | |
| Asus ProArt PZ13 HT5306 | |
| CrossMark / Creativity | |
| MSI Summit E13 AI Evo A1MTG | |
| HP EliteBook 8 Flip G1i 13 | |
| Przeciętny Intel Core Ultra 7 265U, Intel Graphics 4-Core iGPU (Meteor / Arrow Lake) (n=1) | |
| HP EliteBook x360 830 G10 7L7U1ET | |
| Asus ProArt PZ13 HT5306 | |
| Lenovo ThinkPad L13 Yoga G4 21FSS00100 | |
| CrossMark / Responsiveness | |
| MSI Summit E13 AI Evo A1MTG | |
| HP EliteBook 8 Flip G1i 13 | |
| Przeciętny Intel Core Ultra 7 265U, Intel Graphics 4-Core iGPU (Meteor / Arrow Lake) (n=1) | |
| Asus ProArt PZ13 HT5306 | |
| HP EliteBook x360 830 G10 7L7U1ET | |
| Lenovo ThinkPad L13 Yoga G4 21FSS00100 | |
| WebXPRT 3 / Overall | |
| Asus ProArt PZ13 HT5306 | |
| MSI Summit E13 AI Evo A1MTG | |
| HP EliteBook x360 830 G10 7L7U1ET | |
| Lenovo ThinkPad L13 Yoga G4 21FSS00100 | |
| Dell Latitude 9330 | |
| WebXPRT 4 / Overall | |
| Asus ProArt PZ13 HT5306 | |
| HP EliteBook 8 Flip G1i 13 | |
| Przeciętny Intel Core Ultra 7 265U, Intel Graphics 4-Core iGPU (Meteor / Arrow Lake) (n=1) | |
| Dell Latitude 9330 | |
| Lenovo ThinkPad L13 Yoga G4 21FSS00100 | |
| MSI Summit E13 AI Evo A1MTG | |
| Mozilla Kraken 1.1 / Total | |
| Lenovo ThinkPad L13 Yoga G4 21FSS00100 | |
| HP EliteBook 8 Flip G1i 13 | |
| Przeciętny Intel Core Ultra 7 265U, Intel Graphics 4-Core iGPU (Meteor / Arrow Lake) (n=1) | |
| Dell Latitude 9330 | |
| HP EliteBook x360 830 G10 7L7U1ET | |
| MSI Summit E13 AI Evo A1MTG | |
| Asus ProArt PZ13 HT5306 | |
* ... im mniej tym lepiej
| PCMark 10 Score | 6237 pkt. | |
Pomoc | ||
Opóźnienie DPC
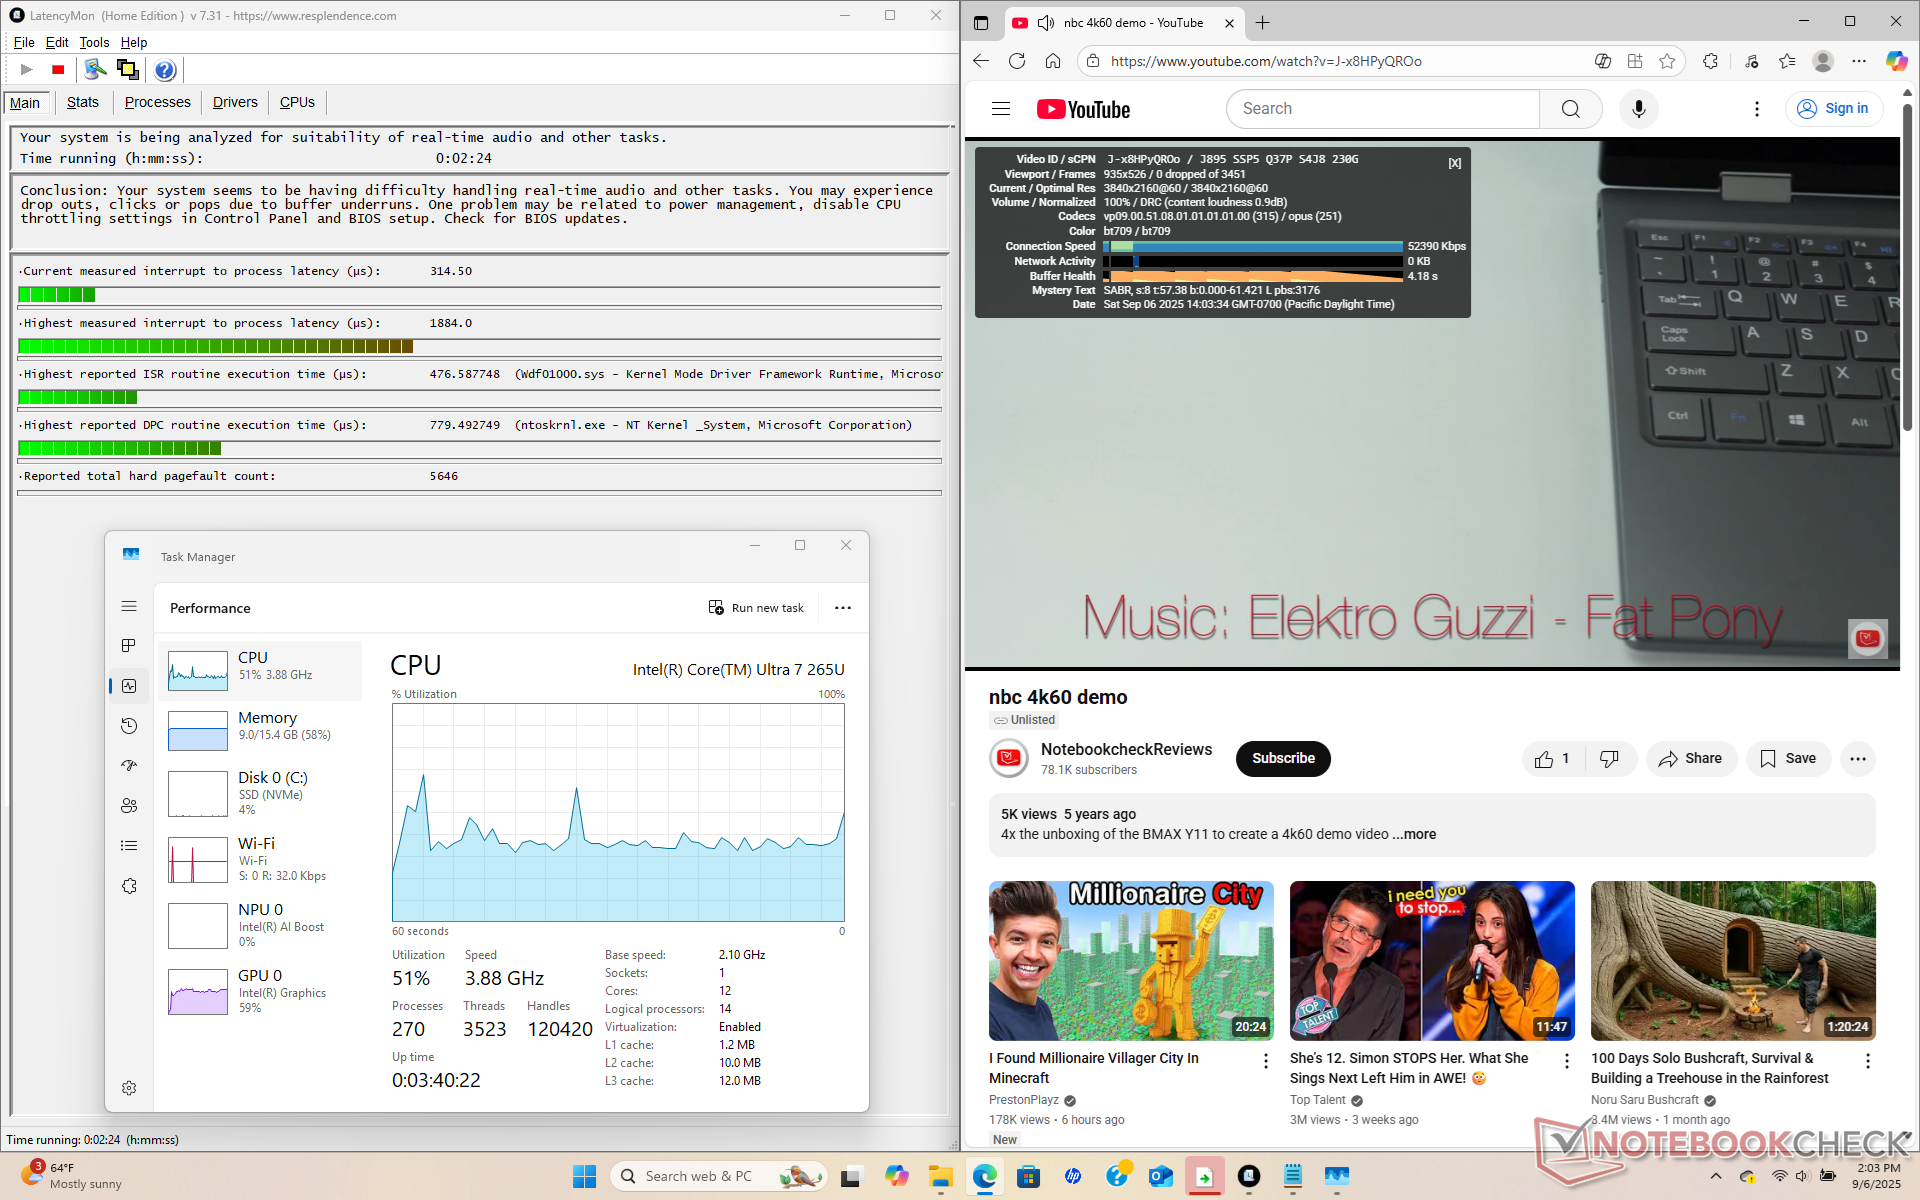
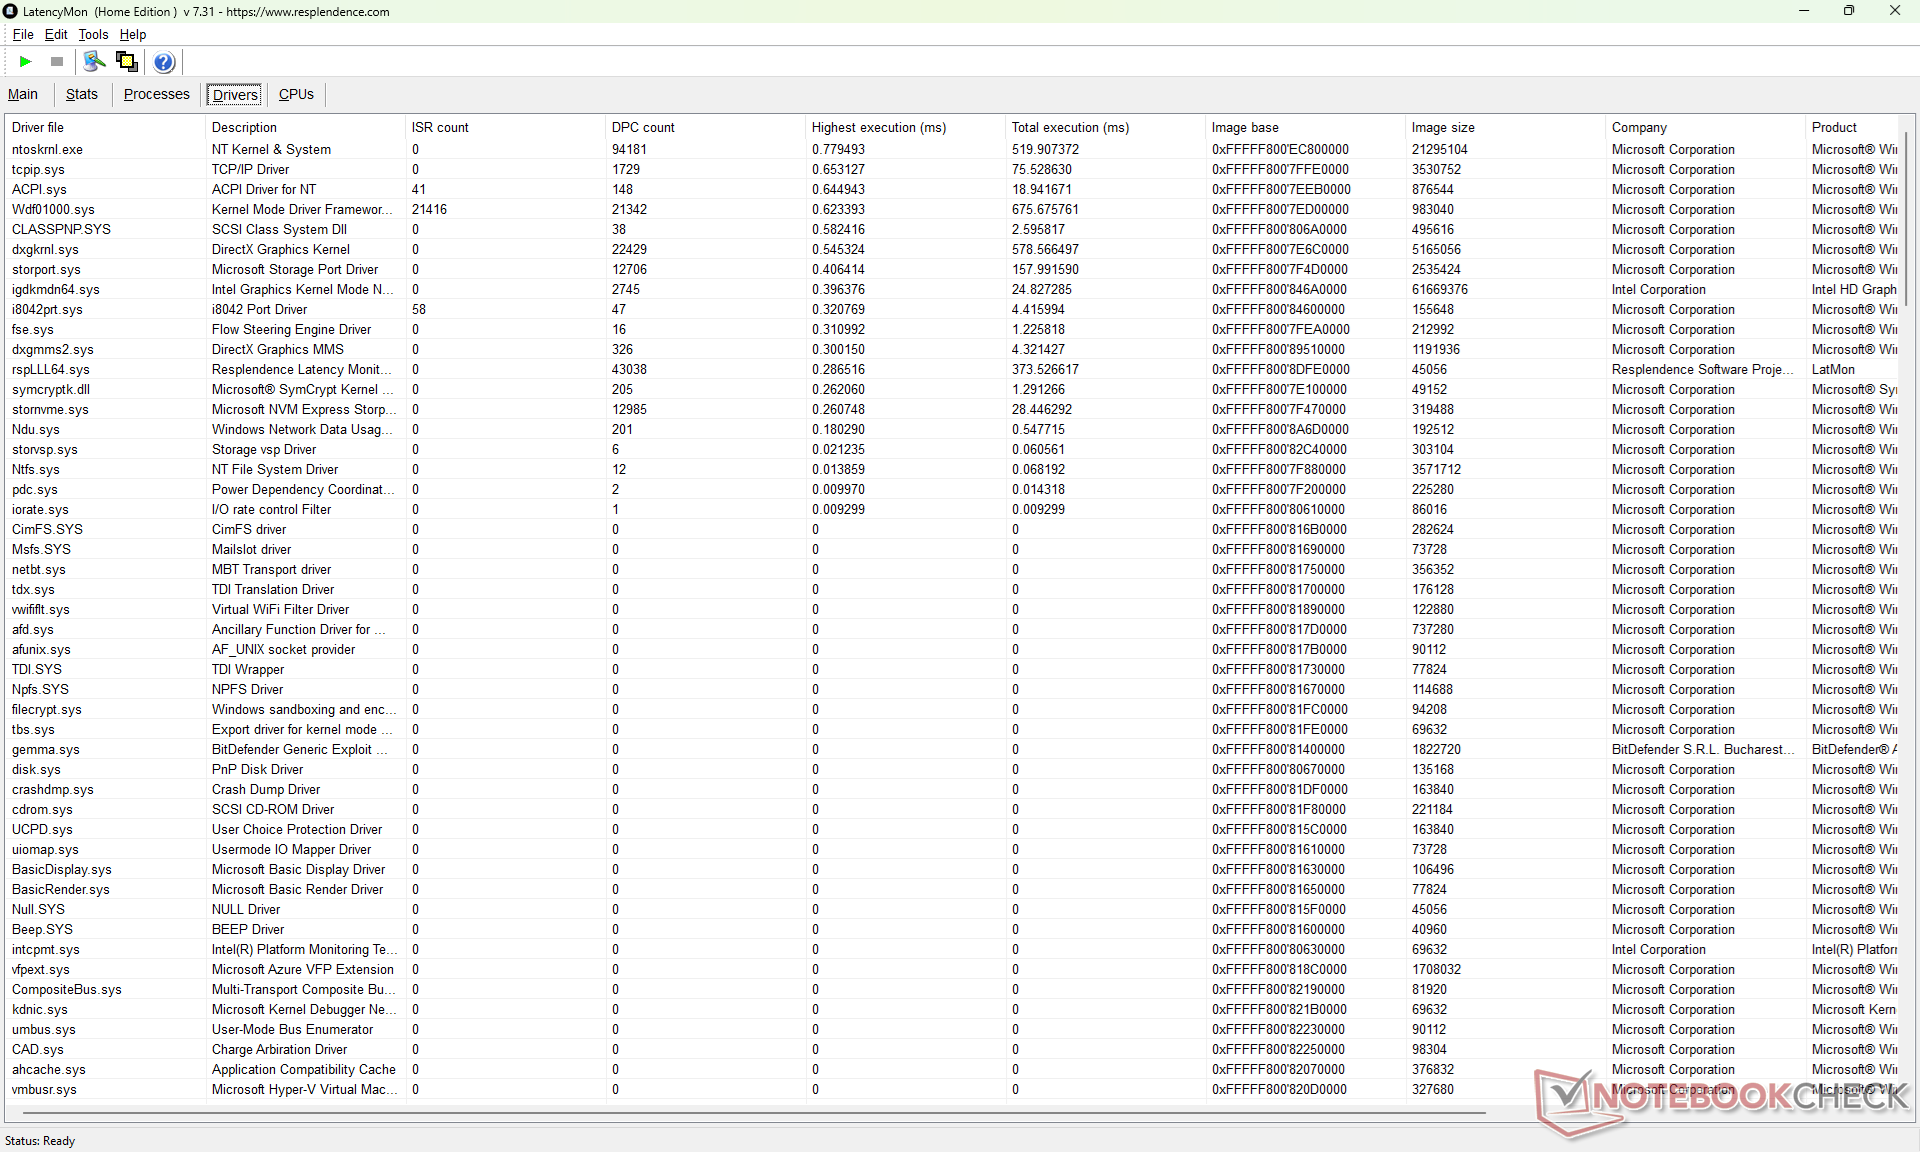
| DPC Latencies / LatencyMon - interrupt to process latency (max), Web, Youtube, Prime95 | |
| Dell Latitude 9330 | |
| MSI Summit E13 AI Evo A1MTG | |
| HP EliteBook 8 Flip G1i 13 | |
| HP EliteBook x360 830 G10 7L7U1ET | |
| Lenovo ThinkPad L13 Yoga G4 21FSS00100 | |
* ... im mniej tym lepiej
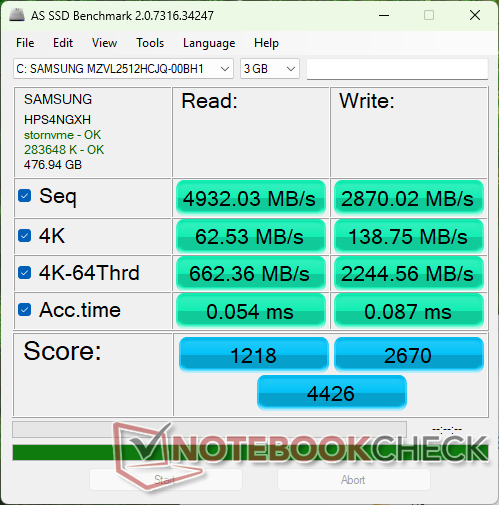
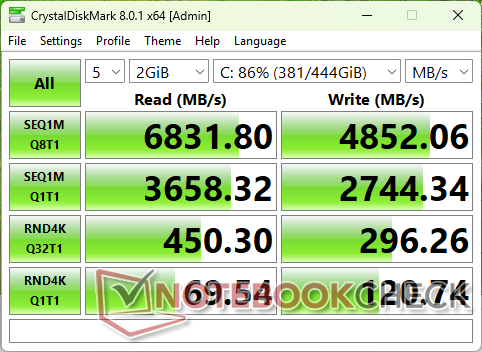
Urządzenia pamięci masowej
Nasz Dysk SSD Samsung wykazywał problemy z dławieniem po kilku minutach w naszym teście pętli DiskSpd, podczas gdy dysk SK Hynix w naszym EliteBook 865 G10 nie wykazywał takich problemów, jak pokazano na poniższym wykresie porównawczym. Nie jest to duży problem, biorąc pod uwagę procesor z serii U i grupę docelową, ale mimo wszystko jest to trochę rozczarowujące.

* ... im mniej tym lepiej
Dławienie dysku: Pętla odczytu DiskSpd, głębokość kolejki 8
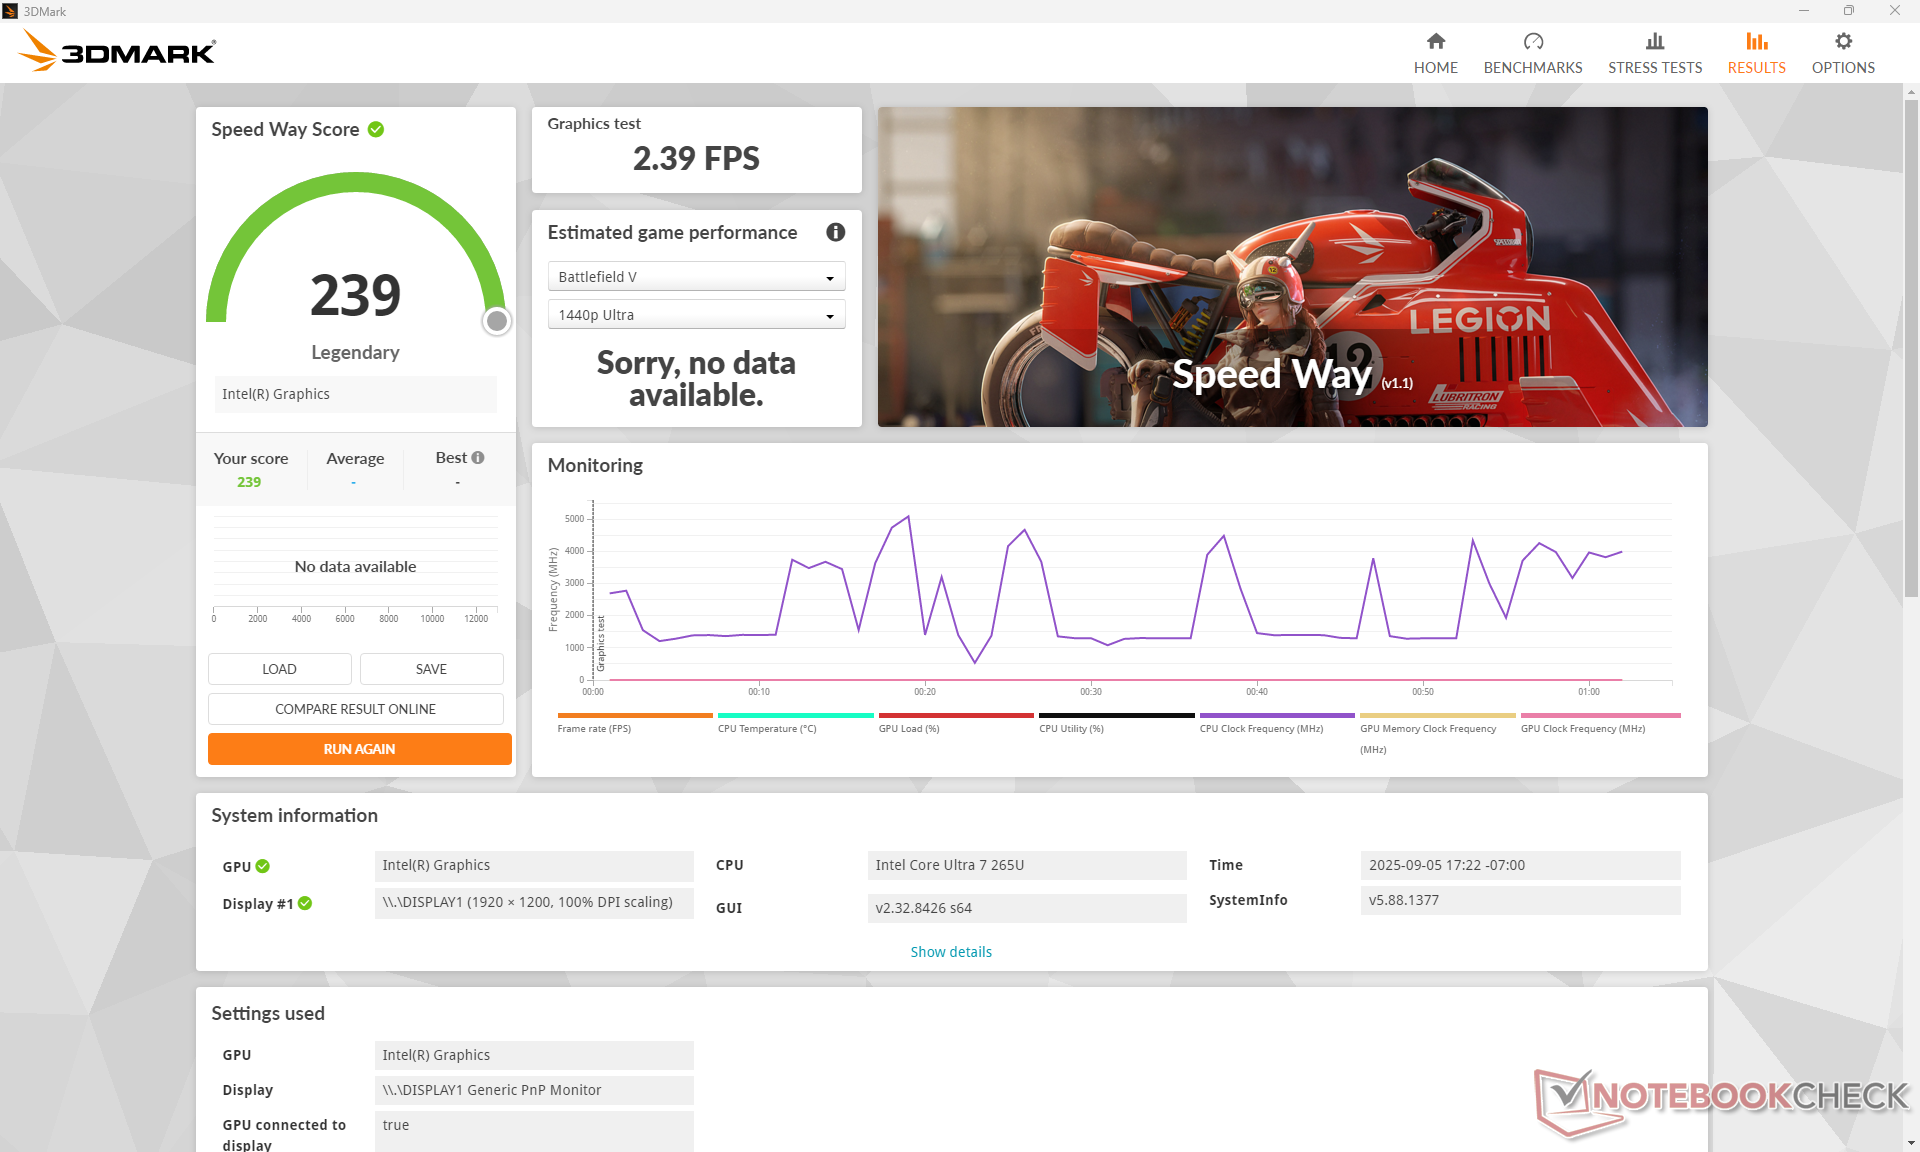
Wydajność GPU
Zintegrowany Arc 4 jest jak równy z równym ze starszymi Iris Xe 96 EUs. Niestety nie ma opcji Arc 8, ponieważ model HP nie jest dostarczany z procesorami Core serii H.
| 3DMark Performance rating - Percent | |
| MSI Summit E13 AI Evo A1MTG | |
| Acer Spin 3 SP313-51N-56YV -2! | |
| HP EliteBook 8 Flip G1i 13 | |
| Przeciętny Intel Graphics 4-Core iGPU (Meteor / Arrow Lake) | |
| Dell Latitude 7350 Detachable | |
| Lenovo ThinkPad L13 2in1 G5 21LNS4AM00 | |
| HP Spectre x360 13.5 14t-ef000 | |
| Lenovo ThinkPad L13 Yoga G4 i7-1355U | |
| Lenovo ThinkPad X1 Titanium Yoga G1 20QA001RGE | |
| HP EliteBook x360 830 G10 7L7U1ET | |
| Dell Latitude 9330 | |
| Lenovo ThinkPad L13 Yoga G4 21FSS00100 | |
| Asus ProArt PZ13 HT5306 | |
| HP ProBook x360 435 G8 R7-5800U | |
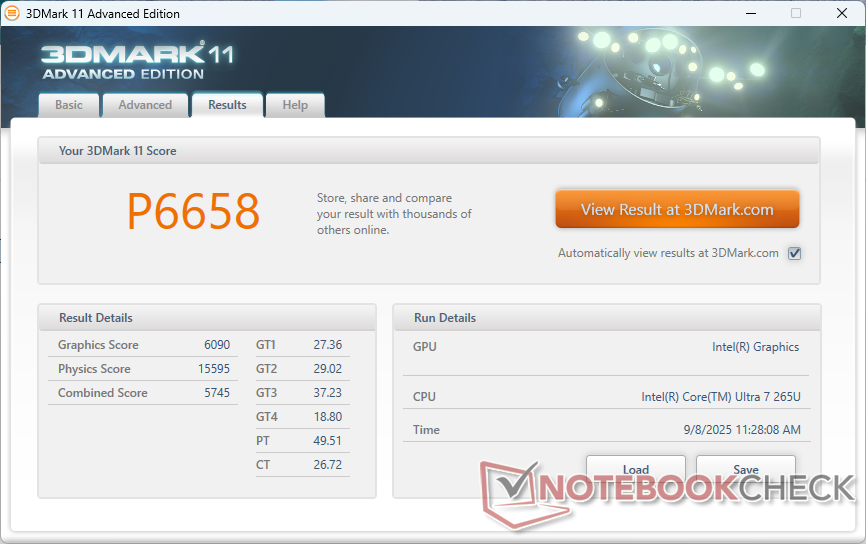
| 3DMark 11 - 1280x720 Performance GPU | |
| MSI Summit E13 AI Evo A1MTG | |
| HP Spectre x360 13.5 14t-ef000 | |
| Lenovo ThinkPad L13 Yoga G4 i7-1355U | |
| Dell Latitude 7350 Detachable | |
| HP EliteBook 8 Flip G1i 13 | |
| Przeciętny Intel Graphics 4-Core iGPU (Meteor / Arrow Lake) (4520 - 7109, n=31) | |
| Acer Spin 3 SP313-51N-56YV | |
| Lenovo ThinkPad X1 Titanium Yoga G1 20QA001RGE | |
| HP EliteBook x360 830 G10 7L7U1ET | |
| Lenovo ThinkPad L13 Yoga G4 21FSS00100 | |
| Lenovo ThinkPad L13 2in1 G5 21LNS4AM00 | |
| Dell Latitude 9330 | |
| HP ProBook x360 435 G8 R7-5800U | |
| Asus ProArt PZ13 HT5306 | |
| 3DMark 11 Performance | 6658 pkt. | |
| 3DMark Cloud Gate Standard Score | 24927 pkt. | |
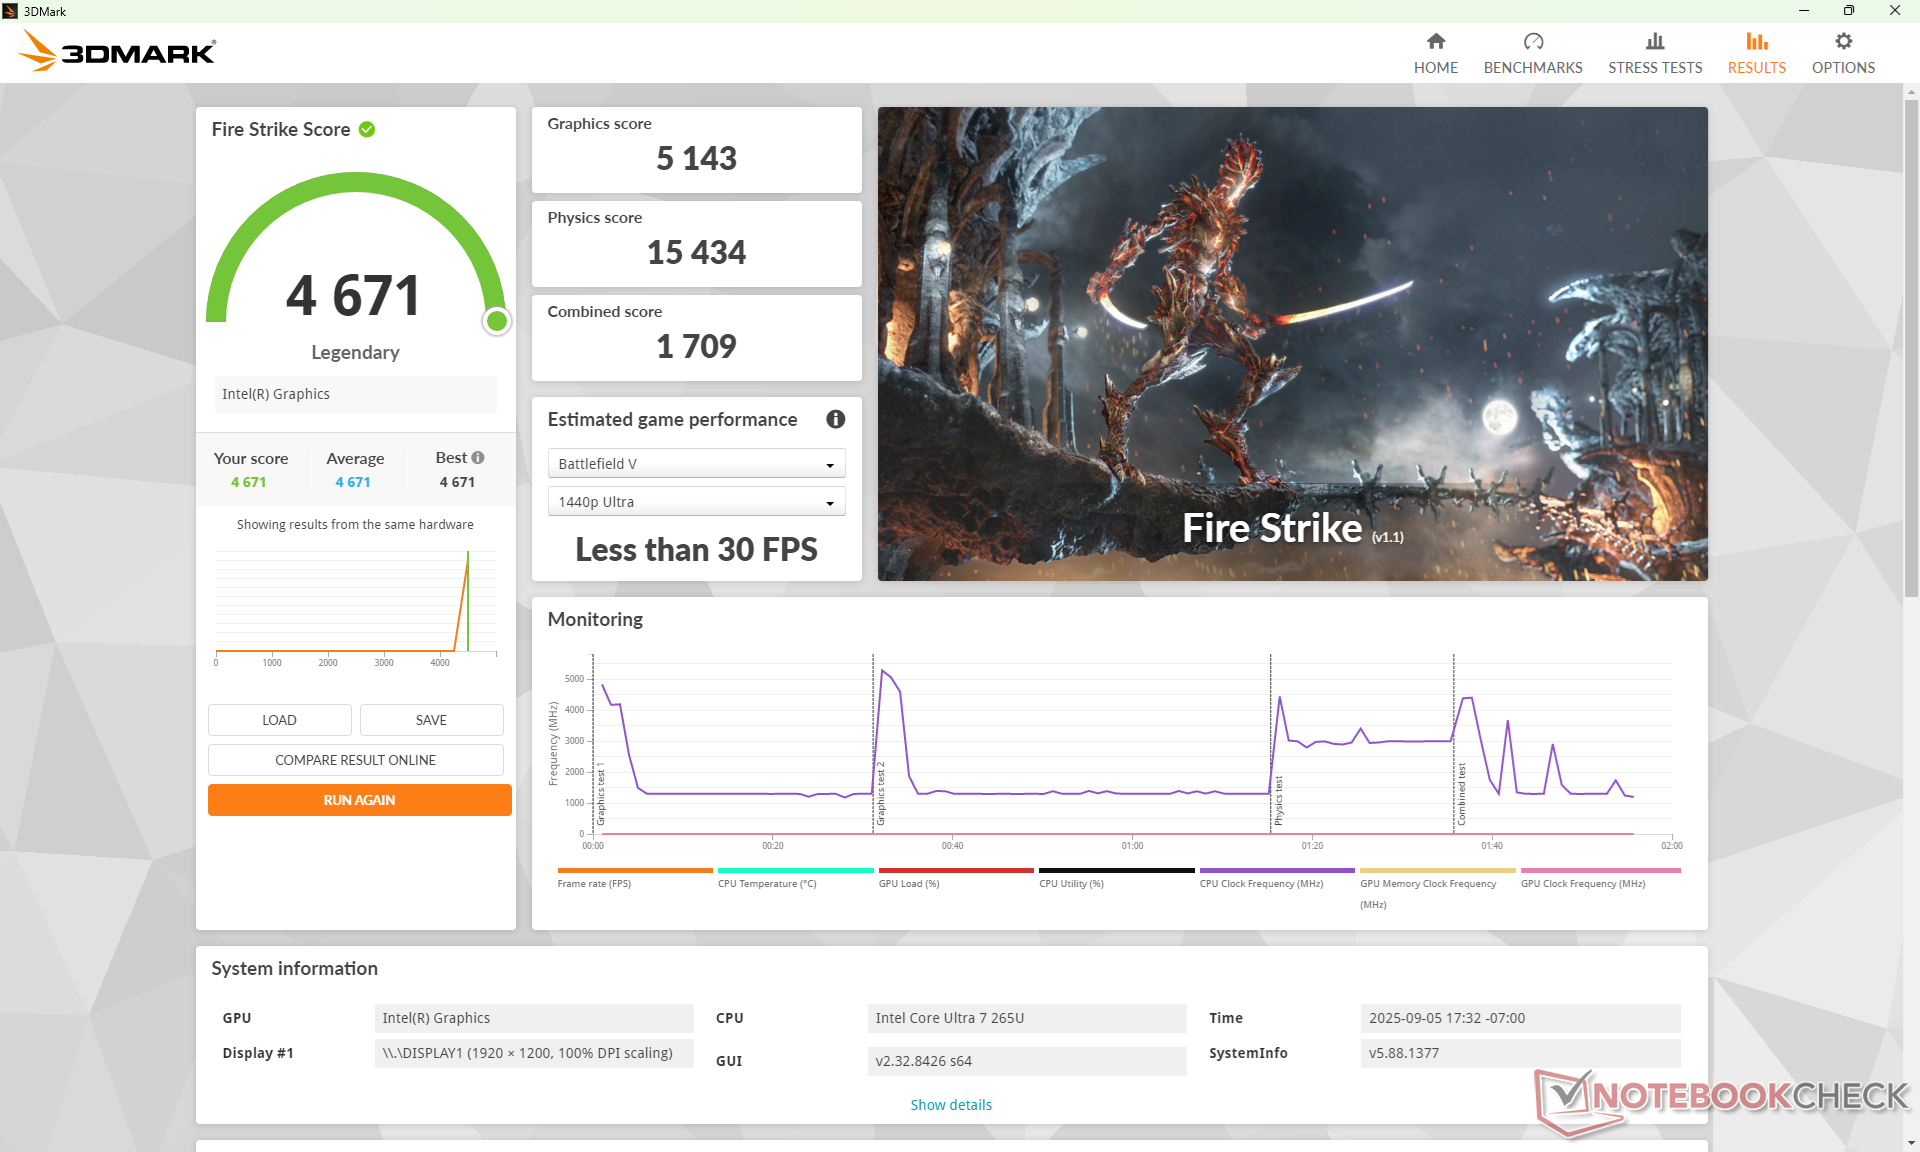
| 3DMark Fire Strike Score | 4671 pkt. | |
| 3DMark Time Spy Score | 2010 pkt. | |
Pomoc | ||
* ... im mniej tym lepiej
| Performance rating - Percent | |
| MSI Summit E13 AI Evo A1MTG -1! | |
| HP EliteBook 8 Flip G1i 13 | |
| Dell Latitude 9330 -2! | |
| HP EliteBook x360 830 G10 7L7U1ET -3! | |
| Asus ProArt PZ13 HT5306 -3! | |
| Lenovo ThinkPad L13 Yoga G4 21FSS00100 -2! | |
| Cyberpunk 2077 - 1920x1080 Ultra Preset (FSR off) | |
| HP EliteBook 8 Flip G1i 13 | |
| Asus ProArt PZ13 HT5306 | |
| Baldur's Gate 3 - 1920x1080 Ultra Preset AA:T | |
| MSI Summit E13 AI Evo A1MTG | |
| HP EliteBook 8 Flip G1i 13 | |
| GTA V - 1920x1080 Highest AA:4xMSAA + FX AF:16x | |
| Asus ProArt PZ13 HT5306 | |
| MSI Summit E13 AI Evo A1MTG | |
| Lenovo ThinkPad L13 Yoga G4 21FSS00100 | |
| HP EliteBook 8 Flip G1i 13 | |
| Dell Latitude 9330 | |
| HP EliteBook x360 830 G10 7L7U1ET | |
| Final Fantasy XV Benchmark - 1920x1080 High Quality | |
| MSI Summit E13 AI Evo A1MTG | |
| HP EliteBook 8 Flip G1i 13 | |
| HP EliteBook x360 830 G10 7L7U1ET | |
| Dell Latitude 9330 | |
| Lenovo ThinkPad L13 Yoga G4 21FSS00100 | |
| Asus ProArt PZ13 HT5306 | |
| Strange Brigade - 1920x1080 ultra AA:ultra AF:16 | |
| MSI Summit E13 AI Evo A1MTG | |
| HP EliteBook 8 Flip G1i 13 | |
| Dell Latitude 9330 | |
| Lenovo ThinkPad L13 Yoga G4 21FSS00100 | |
| Dota 2 Reborn - 1920x1080 ultra (3/3) best looking | |
| MSI Summit E13 AI Evo A1MTG | |
| Dell Latitude 9330 | |
| HP EliteBook 8 Flip G1i 13 | |
| Asus ProArt PZ13 HT5306 | |
| HP EliteBook x360 830 G10 7L7U1ET | |
| Lenovo ThinkPad L13 Yoga G4 21FSS00100 | |
| X-Plane 11.11 - 1920x1080 high (fps_test=3) | |
| MSI Summit E13 AI Evo A1MTG | |
| Dell Latitude 9330 | |
| HP EliteBook x360 830 G10 7L7U1ET | |
| Lenovo ThinkPad L13 Yoga G4 21FSS00100 | |
| HP EliteBook 8 Flip G1i 13 | |
| F1 24 | |
| 1920x1080 Low Preset AA:T AF:16x | |
| Przeciętny Intel Graphics 4-Core iGPU (Meteor / Arrow Lake) (27.4 - 44.7, n=14) | |
| HP EliteBook 8 Flip G1i 13 | |
| 1920x1080 Medium Preset AA:T AF:16x | |
| Przeciętny Intel Graphics 4-Core iGPU (Meteor / Arrow Lake) (25 - 40.1, n=14) | |
| HP EliteBook 8 Flip G1i 13 | |
| 1920x1080 High Preset AA:T AF:16x | |
| Przeciętny Intel Graphics 4-Core iGPU (Meteor / Arrow Lake) (18.3 - 30, n=12) | |
| HP EliteBook 8 Flip G1i 13 | |
| 1920x1080 Ultra High Preset AA:T AF:16x | |
| Przeciętny Intel Graphics 4-Core iGPU (Meteor / Arrow Lake) (6.91 - 8.51, n=7) | |
| HP EliteBook 8 Flip G1i 13 | |
Cyberpunk 2077 ultra FPS Chart
| low | med. | high | ultra | |
|---|---|---|---|---|
| GTA V (2015) | 127.4 | 105.5 | 24.4 | 9.99 |
| Dota 2 Reborn (2015) | 75.4 | 54.9 | 44.6 | 52.4 |
| Final Fantasy XV Benchmark (2018) | 42.6 | 24.9 | 18.2 | |
| X-Plane 11.11 (2018) | 35.3 | 28.1 | 23.7 | |
| Strange Brigade (2018) | 93.9 | 41.7 | 32.4 | 27.1 |
| Baldur's Gate 3 (2023) | 18.1 | 14.9 | 12.8 | 12.7 |
| Cyberpunk 2077 (2023) | 21.1 | 17.1 | 14.6 | 12 |
| F1 24 (2024) | 35.1 | 32.7 | 23.8 | 7.21 |
Emisje
Hałas systemowy
Hałas i zachowanie wentylatora są dość zbliżone do tego, czego doświadczyliśmy na Dell Latitude 9330. Wentylator jest w większości niesłyszalny podczas przeglądania stron internetowych lub przesyłania strumieniowego, ale obroty wzrastają nieco gwałtownie, gdy wprowadzane są bardziej wymagające obciążenia.
Jesteśmy w stanie zauważyć lekkie wycie cewki lub hałas elektroniczny z naszej jednostki testowej na biegu jałowym na pulpicie.
Hałas
| luz |
| 24.8 / 24.8 / 24.9 dB |
| obciążenie |
| 37.1 / 37.4 dB |
 | ||
30 dB cichy 40 dB(A) słyszalny 50 dB(A) irytujący |
||
min: | ||
| HP EliteBook 8 Flip G1i 13 Graphics 4-Core iGPU (Arrow Lake), Ultra 7 265U, Samsung PM9A1 MZVL2512HCJQ | HP EliteBook x360 830 G10 7L7U1ET Iris Xe G7 80EUs, i5-1335U, Samsung PM991 MZVLQ512HBLU | Lenovo ThinkPad L13 Yoga G4 21FSS00100 Vega 7, R5 7530U, Kioxia BG5 KBG5AZNT512G | MSI Summit E13 AI Evo A1MTG Arc 8-Core, Ultra 7 155H, Micron 2400 MTFDKBA1T0QFM | Asus ProArt PZ13 HT5306 Adreno X1-45 1.7 TFLOPS, SD X Plus X1P-42-100, WD PC SN740 SDDPTQD-1T00 | Dell Latitude 9330 Iris Xe G7 96EUs, i7-1260U | |
|---|---|---|---|---|---|---|
| Noise | 5% | 12% | -8% | 6% | 3% | |
| wyłączone / środowisko * (dB) | 23.7 | 23.2 2% | 23.4 1% | 24 -1% | 23.7 -0% | 23 3% |
| Idle Minimum * (dB) | 24.8 | 23.2 6% | 23.4 6% | 24.1 3% | 23.7 4% | 23 7% |
| Idle Average * (dB) | 24.8 | 23.2 6% | 23.4 6% | 24.8 -0% | 23.7 4% | 23.1 7% |
| Idle Maximum * (dB) | 24.9 | 23.2 7% | 23.4 6% | 26.5 -6% | 23.7 5% | 23.1 7% |
| Load Average * (dB) | 37.1 | 29.4 21% | 24 35% | 39.3 -6% | 26.7 28% | 37.1 -0% |
| Cyberpunk 2077 ultra * (dB) | 39.5 | 45 -14% | 35.1 11% | |||
| Load Maximum * (dB) | 37.4 | 42.5 -14% | 30.1 20% | 49.1 -31% | 40 -7% | 40.5 -8% |
| Witcher 3 ultra * (dB) | 42.3 | 30.8 | 40.6 |
* ... im mniej tym lepiej
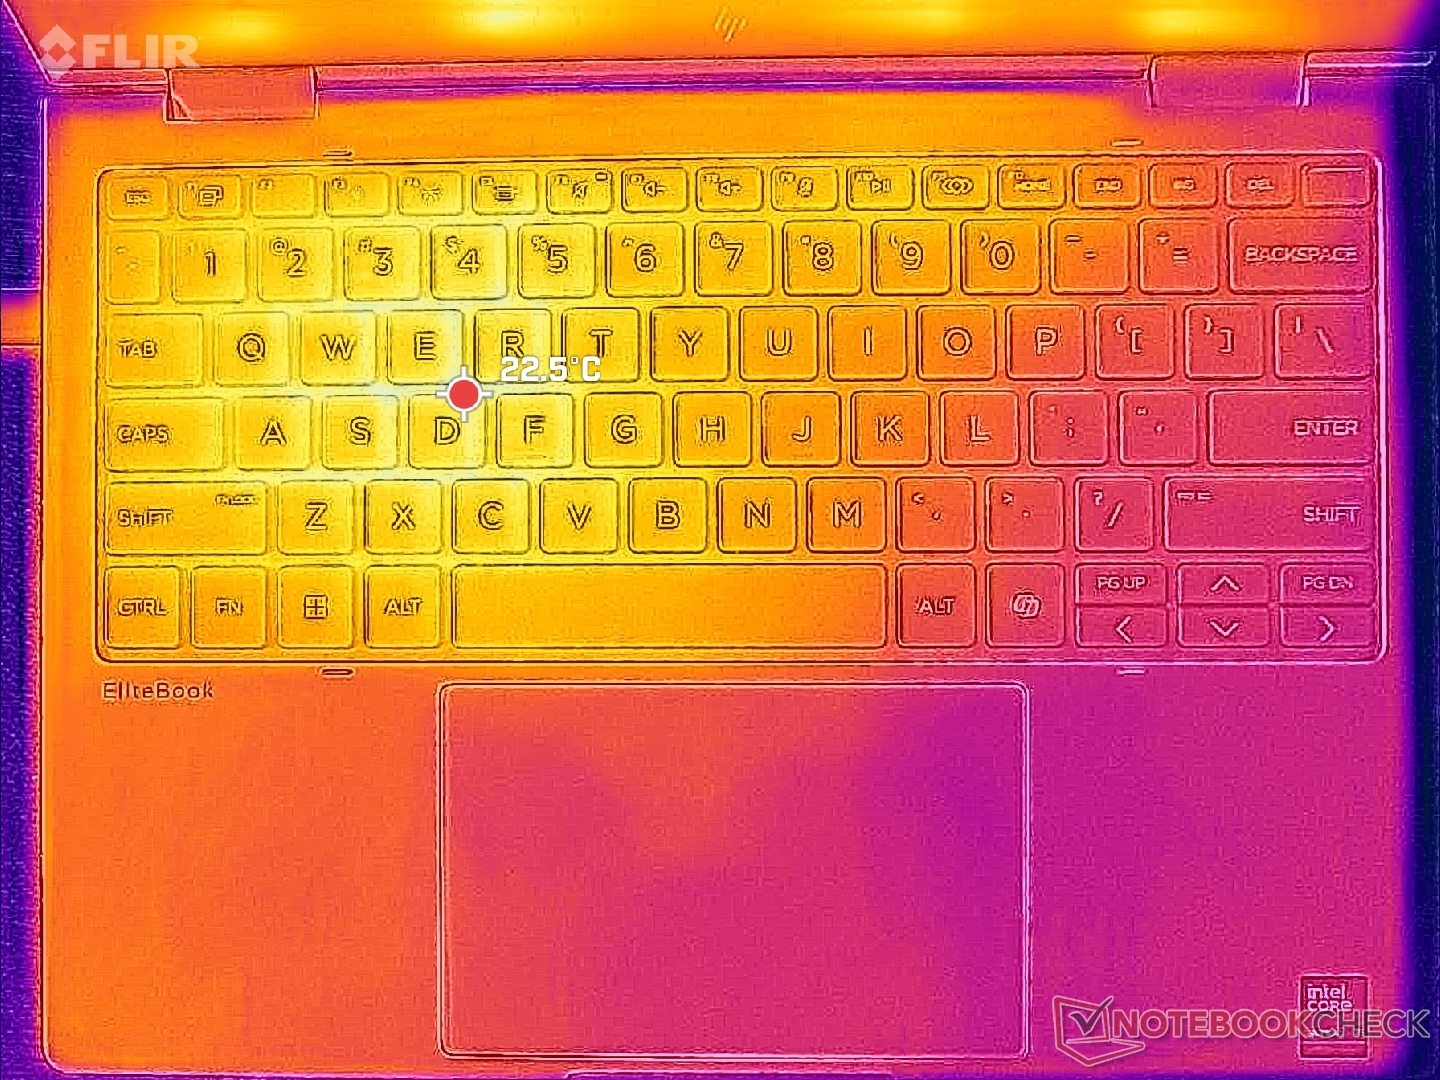
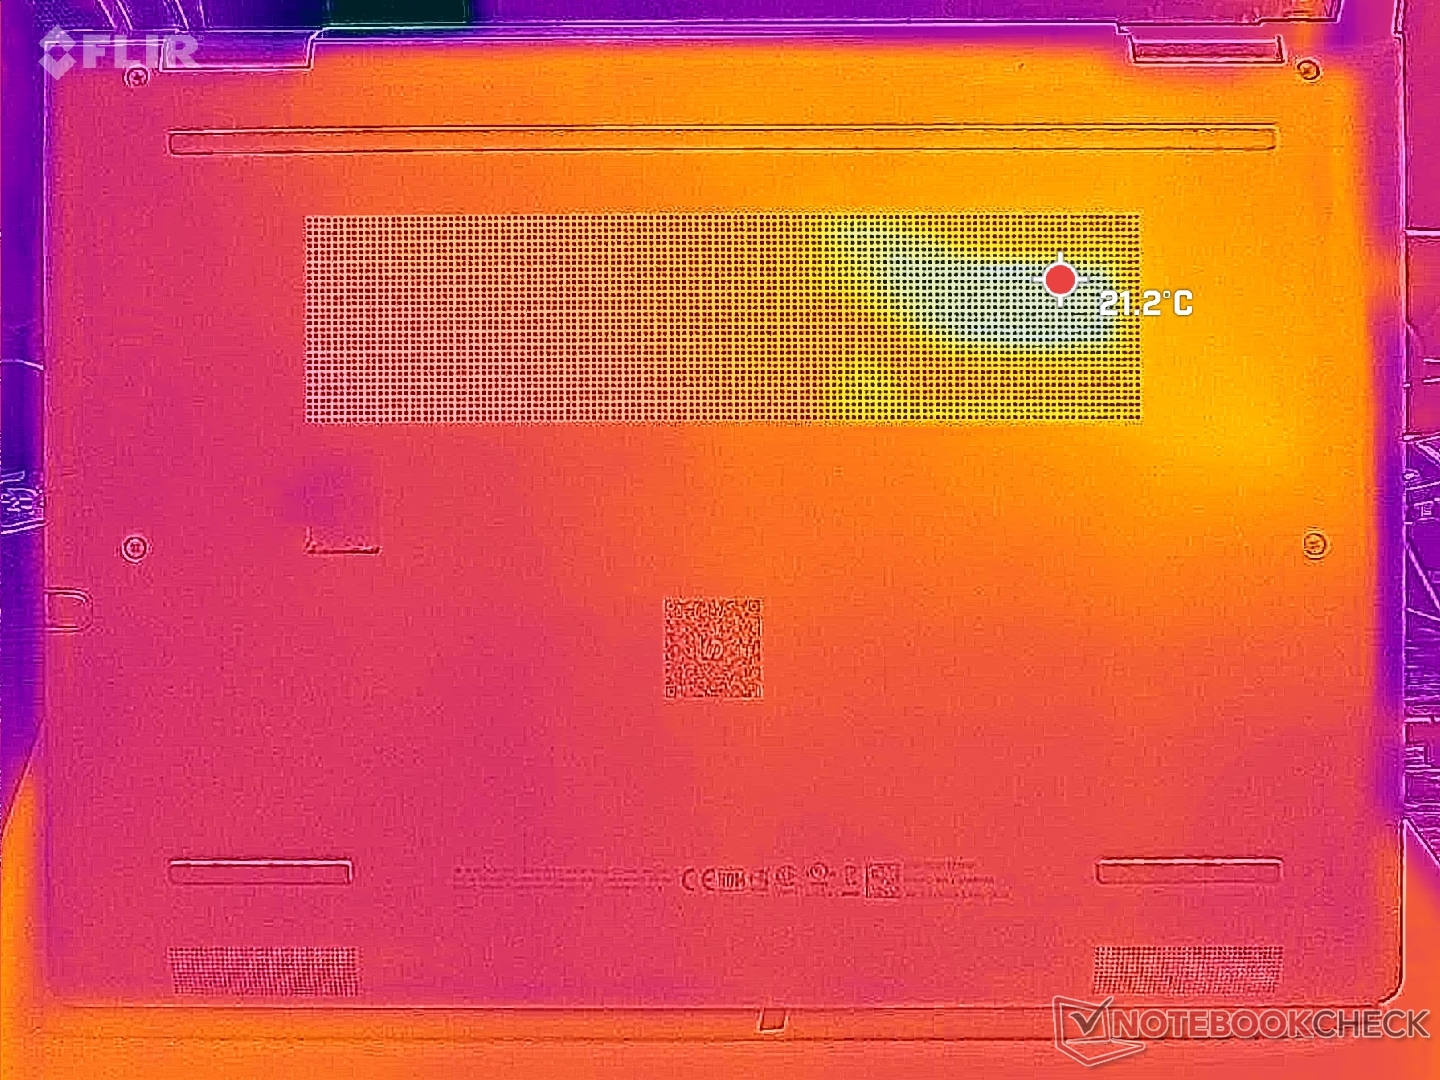
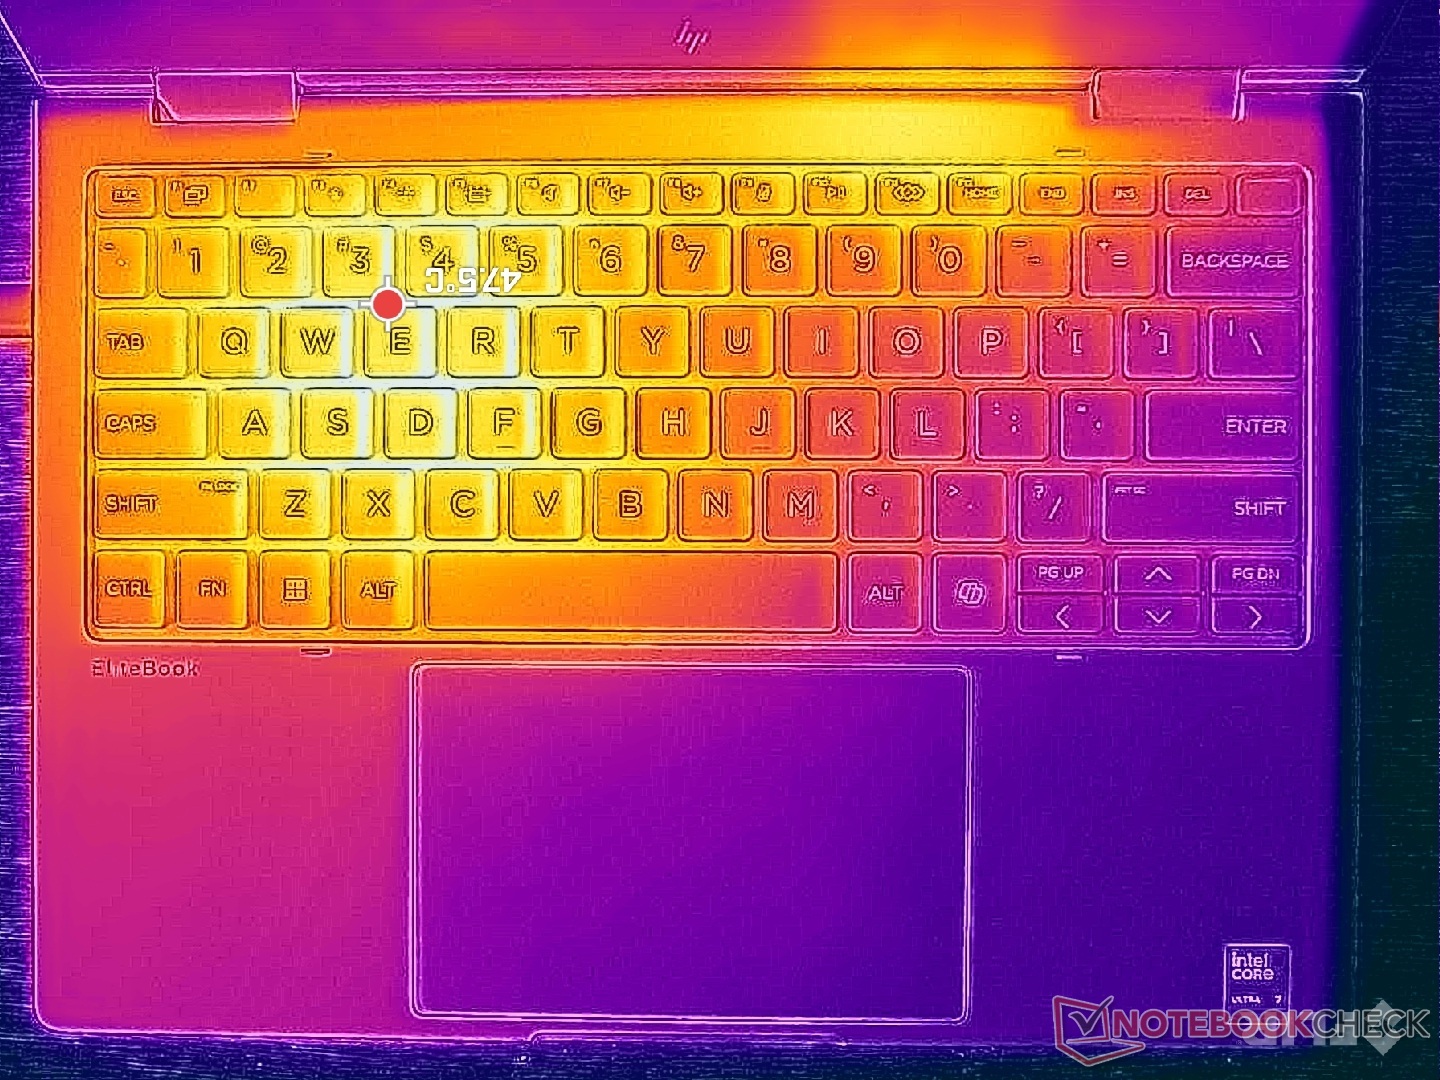
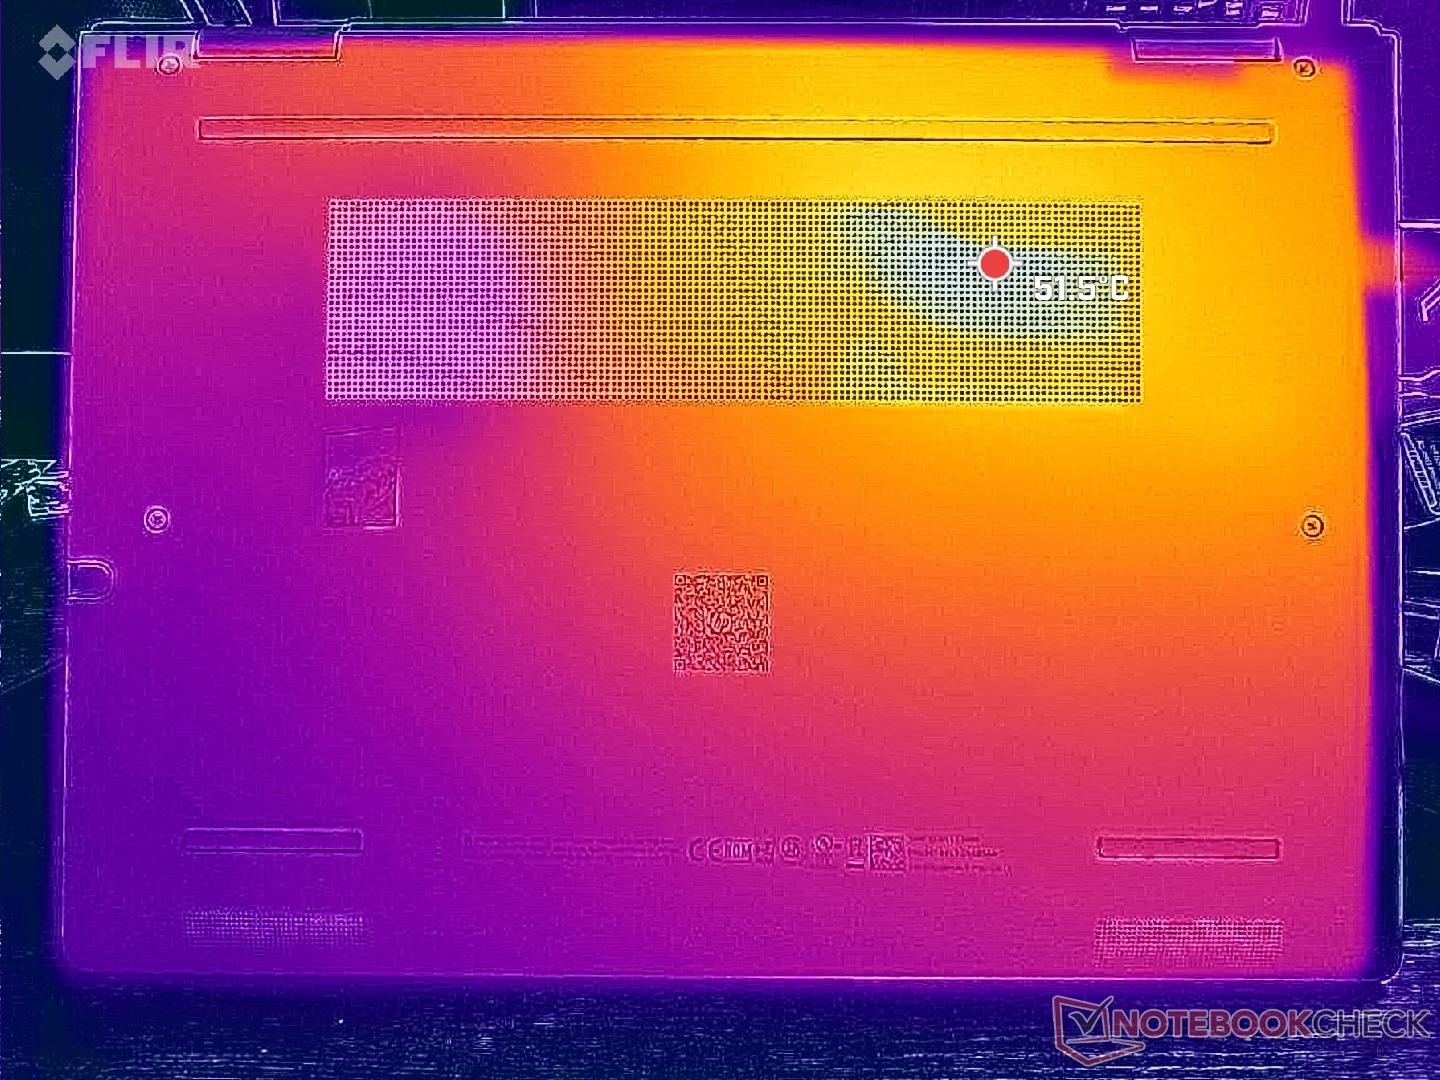
Temperatura
Temperatura powierzchni może stać się bardzo wysoka podczas pracy z wymagającymi obciążeniami, odpowiednio do 47 C i 51 C na podstawie klawiatury i dolnej pokrywie, w porównaniu do 45 C na podstawie klawiatury i dolnej pokrywie Lenovo ThinkPad L13 Yoga G4.
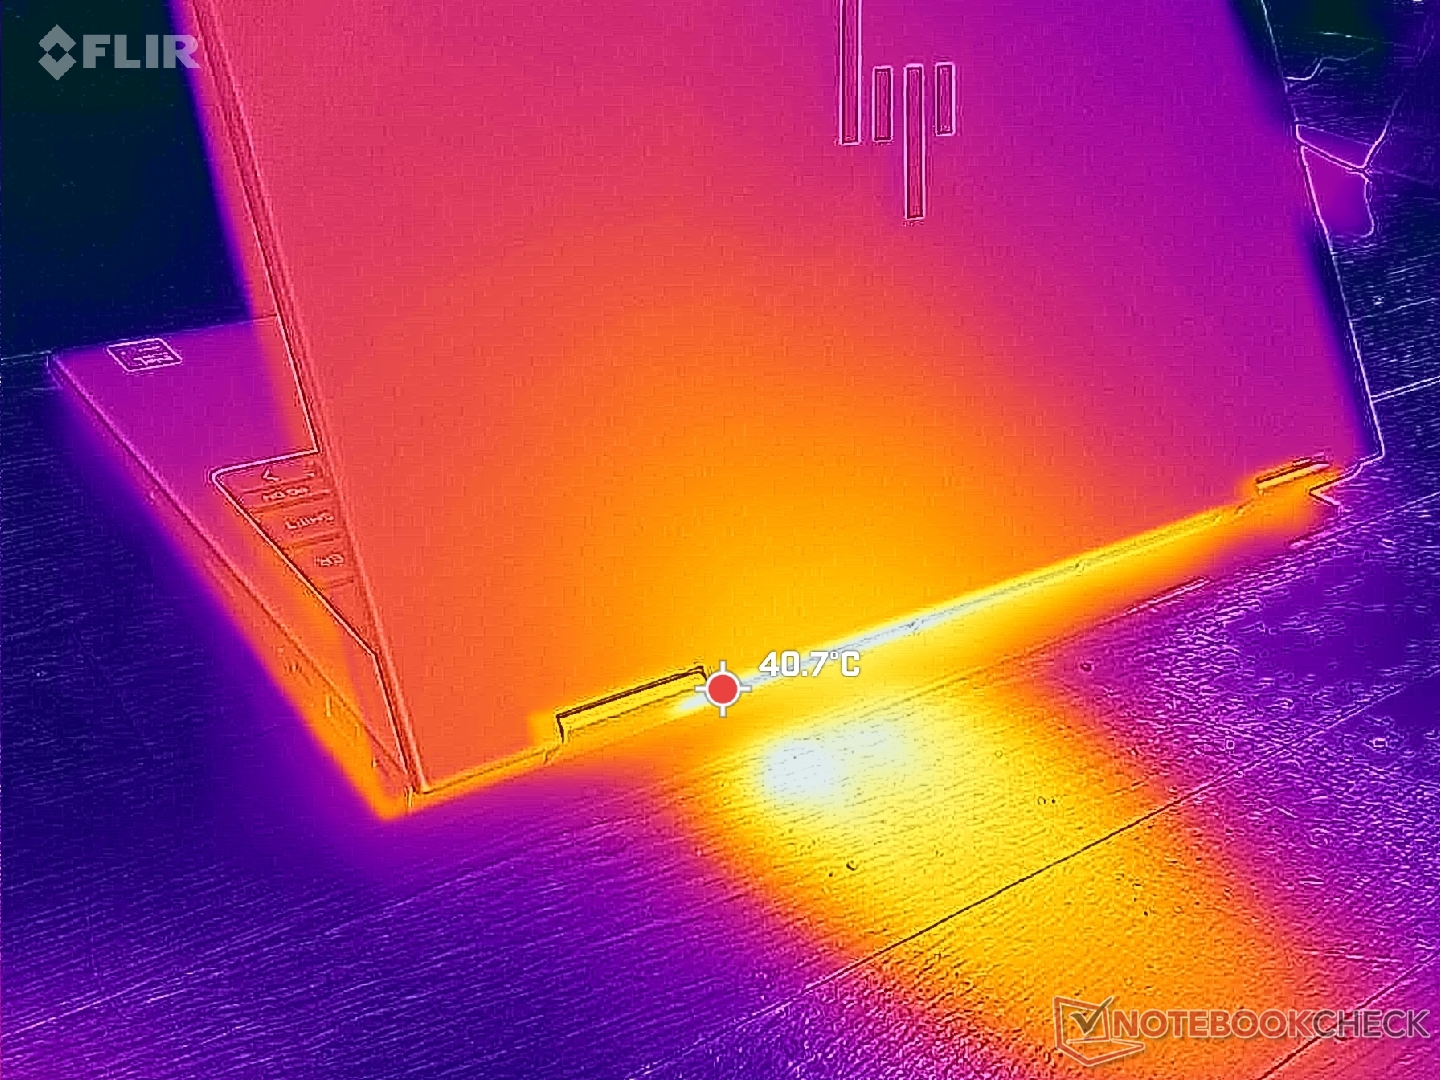
(-) Maksymalna temperatura w górnej części wynosi 46.2 °C / 115 F, w porównaniu do średniej 35.4 °C / 96 F , począwszy od 19.6 do 60 °C dla klasy Convertible.
(-) Dno nagrzewa się maksymalnie do 51 °C / 124 F, w porównaniu do średniej 36.9 °C / 98 F
(+) W stanie bezczynności średnia temperatura górnej części wynosi 25.5 °C / 78 F, w porównaniu ze średnią temperaturą urządzenia wynoszącą 30.3 °C / ### class_avg_f### F.
(+) Podparcia dłoni i touchpad osiągają maksymalną temperaturę skóry (33.6 °C / 92.5 F) i dlatego nie są gorące.
(-) Średnia temperatura obszaru podparcia dłoni w podobnych urządzeniach wynosiła 28 °C / 82.4 F (-5.6 °C / -10.1 F).
| HP EliteBook 8 Flip G1i 13 Intel Core Ultra 7 265U, Intel Graphics 4-Core iGPU (Meteor / Arrow Lake) | HP EliteBook x360 830 G10 7L7U1ET Intel Core i5-1335U, Intel Iris Xe Graphics G7 80EUs | Lenovo ThinkPad L13 Yoga G4 21FSS00100 AMD Ryzen 5 7530U, AMD Radeon RX Vega 7 | MSI Summit E13 AI Evo A1MTG Intel Core Ultra 7 155H, Intel Arc 8-Core iGPU | Asus ProArt PZ13 HT5306 Qualcomm Snapdragon X Plus X1P-42-100, Qualcomm SD X Adreno X1-45 1.7 TFLOPS | Dell Latitude 9330 Intel Core i7-1260U, Intel Iris Xe Graphics G7 96EUs | |
|---|---|---|---|---|---|---|
| Heat | -1% | -7% | -13% | -1% | 4% | |
| Maximum Upper Side * (°C) | 46.2 | 40.2 13% | 43.3 6% | 45.2 2% | 43.7 5% | 40.6 12% |
| Maximum Bottom * (°C) | 51 | 42.4 17% | 46.5 9% | 44.8 12% | 43.9 14% | 50.2 2% |
| Idle Upper Side * (°C) | 26.8 | 30 -12% | 31.9 -19% | 34.8 -30% | 31.9 -19% | 25 7% |
| Idle Bottom * (°C) | 26.4 | 31.8 -20% | 33.1 -25% | 35.8 -36% | 27.6 -5% | 27.6 -5% |
* ... im mniej tym lepiej
Głośniki
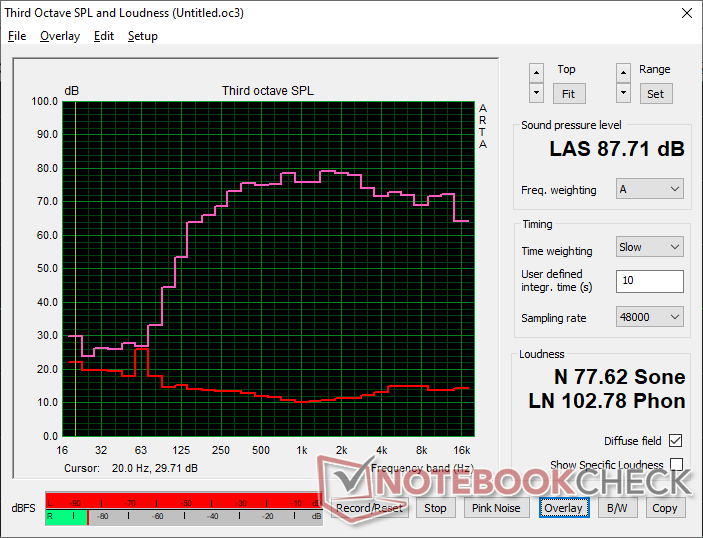
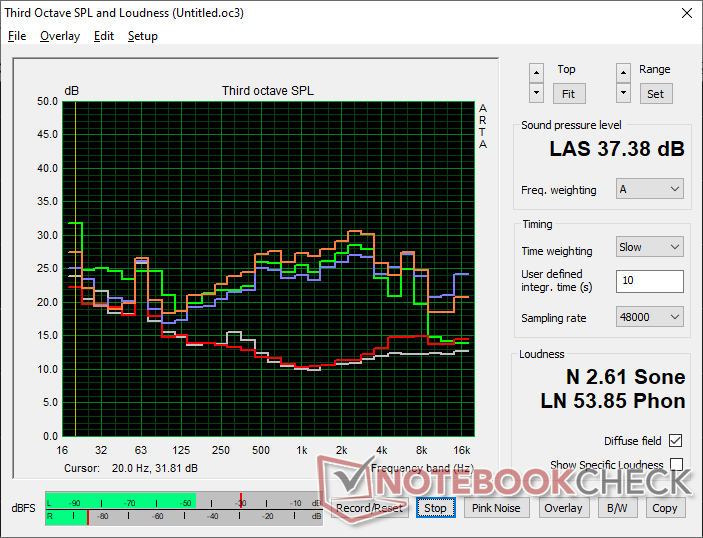
HP EliteBook 8 Flip G1i 13 analiza dźwięku
(+) | głośniki mogą odtwarzać stosunkowo głośno (87.7 dB)
Bas 100 - 315 Hz
(±) | zredukowany bas - średnio 11.7% niższy od mediany
(±) | liniowość basu jest średnia (11.1% delta do poprzedniej częstotliwości)
Średnie 400 - 2000 Hz
(+) | zbalansowane środki średnie - tylko 3.4% od mediany
(+) | średnie są liniowe (2.7% delta do poprzedniej częstotliwości)
Wysokie 2–16 kHz
(+) | zrównoważone maksima - tylko 2.1% od mediany
(+) | wzloty są liniowe (3.6% delta do poprzedniej częstotliwości)
Ogólnie 100 - 16.000 Hz
(+) | ogólny dźwięk jest liniowy (9.4% różnicy w stosunku do mediany)
W porównaniu do tej samej klasy
» 5% wszystkich testowanych urządzeń w tej klasie było lepszych, 1% podobnych, 94% gorszych
» Najlepszy miał deltę 6%, średnia wynosiła ###średnia###%, najgorsza wynosiła 57%
W porównaniu do wszystkich testowanych urządzeń
» 3% wszystkich testowanych urządzeń było lepszych, 1% podobnych, 96% gorszych
» Najlepszy miał deltę 4%, średnia wynosiła ###średnia###%, najgorsza wynosiła 134%
Apple MacBook Pro 16 2021 M1 Pro analiza dźwięku
(+) | głośniki mogą odtwarzać stosunkowo głośno (84.7 dB)
Bas 100 - 315 Hz
(+) | dobry bas - tylko 3.8% od mediany
(+) | bas jest liniowy (5.2% delta do poprzedniej częstotliwości)
Średnie 400 - 2000 Hz
(+) | zbalansowane środki średnie - tylko 1.3% od mediany
(+) | średnie są liniowe (2.1% delta do poprzedniej częstotliwości)
Wysokie 2–16 kHz
(+) | zrównoważone maksima - tylko 1.9% od mediany
(+) | wzloty są liniowe (2.7% delta do poprzedniej częstotliwości)
Ogólnie 100 - 16.000 Hz
(+) | ogólny dźwięk jest liniowy (4.6% różnicy w stosunku do mediany)
W porównaniu do tej samej klasy
» 0% wszystkich testowanych urządzeń w tej klasie było lepszych, 0% podobnych, 100% gorszych
» Najlepszy miał deltę 5%, średnia wynosiła ###średnia###%, najgorsza wynosiła 45%
W porównaniu do wszystkich testowanych urządzeń
» 0% wszystkich testowanych urządzeń było lepszych, 0% podobnych, 100% gorszych
» Najlepszy miał deltę 4%, średnia wynosiła ###średnia###%, najgorsza wynosiła 134%
Zarządzanie energią
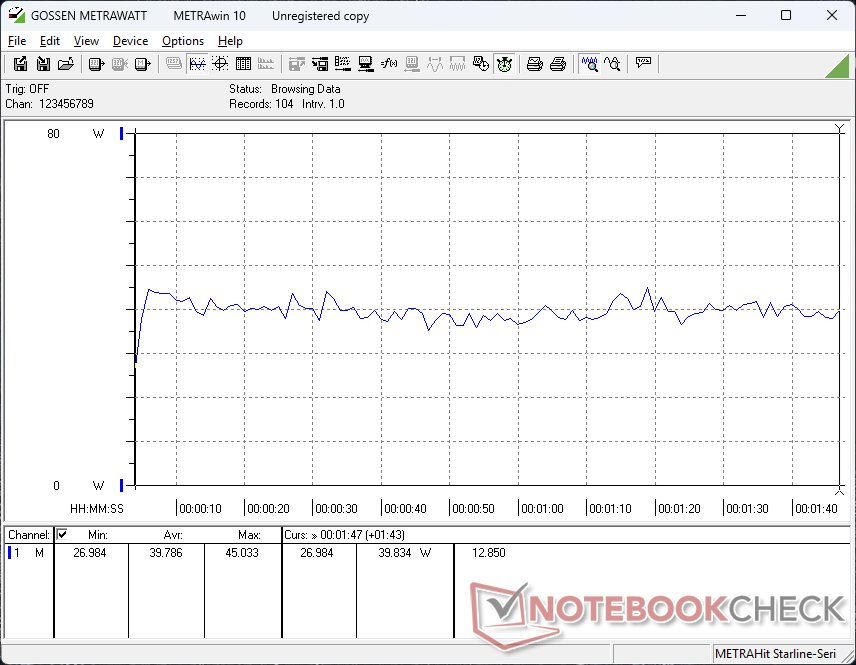
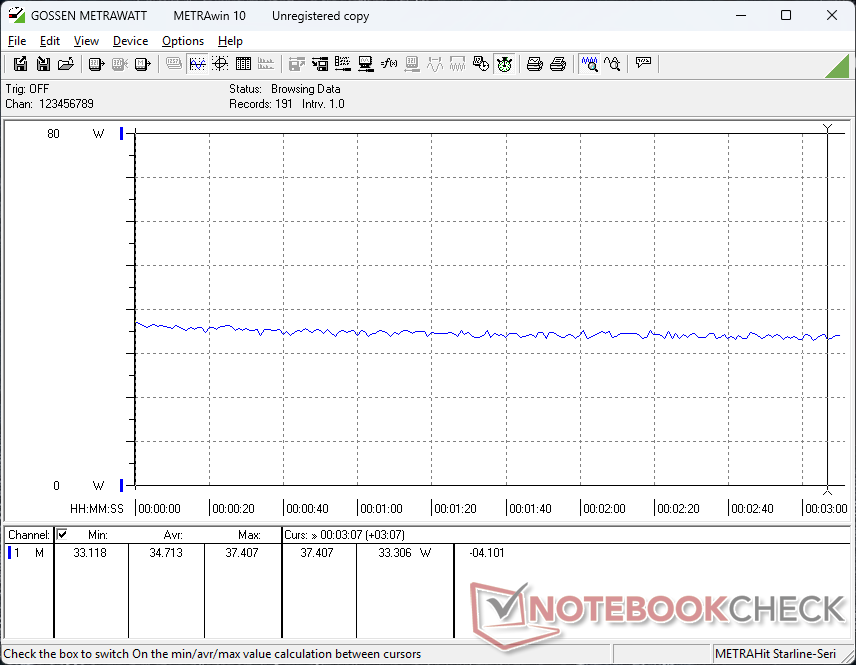
Zużycie energii
Całkowite zużycie energii jest zbliżone do tego, które odnotowaliśmy w zeszłorocznym EliteBook x360 830 G10, zapewniając jednocześnie do 50 procent wyższą wydajność procesora i od 15 do 40 procent wyższą wydajność GPU, co przekłada się na lepszą wydajność w przeliczeniu na wat.
| wyłączony / stan wstrzymania | |
| luz | |
| obciążenie |
|
Legenda:
min: | |
| HP EliteBook 8 Flip G1i 13 Ultra 7 265U, Graphics 4-Core iGPU (Arrow Lake), Samsung PM9A1 MZVL2512HCJQ, IPS, 1920x1200, 13.3" | HP EliteBook x360 830 G10 7L7U1ET i5-1335U, Iris Xe G7 80EUs, Samsung PM991 MZVLQ512HBLU, IPS LED, 1920x1200, 13.3" | Lenovo ThinkPad L13 Yoga G4 21FSS00100 R5 7530U, Vega 7, Kioxia BG5 KBG5AZNT512G, IPS LED, 1920x1200, 13.3" | MSI Summit E13 AI Evo A1MTG Ultra 7 155H, Arc 8-Core, Micron 2400 MTFDKBA1T0QFM, IPS, 1920x1200, 13.3" | Asus ProArt PZ13 HT5306 SD X Plus X1P-42-100, Adreno X1-45 1.7 TFLOPS, WD PC SN740 SDDPTQD-1T00, OLED, 2880x1800, 13.3" | Dell Latitude 9330 i7-1260U, Iris Xe G7 96EUs, , IPS, 2560x1600, 13.3" | |
|---|---|---|---|---|---|---|
| Power Consumption | -16% | -13% | -1% | 17% | -28% | |
| Idle Minimum * (Watt) | 2.8 | 4.5 -61% | 4.4 -57% | 2.3 18% | 3.5 -25% | 4.7 -68% |
| Idle Average * (Watt) | 5.3 | 6 -13% | 7.2 -36% | 4.8 9% | 5.3 -0% | 8.2 -55% |
| Idle Maximum * (Watt) | 5.6 | 6.5 -16% | 8.3 -48% | 5 11% | 6.1 -9% | 8.4 -50% |
| Load Average * (Watt) | 39.8 | 36.7 8% | 21.6 46% | 46.2 -16% | 14.9 63% | 36.8 8% |
| Cyberpunk 2077 ultra * (Watt) | 40.2 | 44.8 -11% | 23.1 43% | |||
| Cyberpunk 2077 ultra external monitor * (Watt) | 34.7 | 41.9 -21% | 23.5 32% | |||
| Load Maximum * (Watt) | 68.4 | 66.3 3% | 49.3 28% | 65 5% | 59.9 12% | 49.9 27% |
| Witcher 3 ultra * (Watt) | 40.2 | 32.1 | 30.4 |
* ... im mniej tym lepiej
Pobór mocy Cyberpunk / Test warunków skrajnych
Zużycie energii przez monitor zewnętrzny
Żywotność baterii
Pojemność baterii wzrosła z 51 W w zeszłorocznym modelu do 62 W, zapewniając dłuższy czas pracy o kilka godzin w naszym teście.
| HP EliteBook 8 Flip G1i 13 Ultra 7 265U, Graphics 4-Core iGPU (Arrow Lake), 62 Wh | HP EliteBook x360 830 G10 7L7U1ET i5-1335U, Iris Xe G7 80EUs, 51.3 Wh | Lenovo ThinkPad L13 Yoga G4 21FSS00100 R5 7530U, Vega 7, 46 Wh | MSI Summit E13 AI Evo A1MTG Ultra 7 155H, Arc 8-Core, 70 Wh | Asus ProArt PZ13 HT5306 SD X Plus X1P-42-100, Adreno X1-45 1.7 TFLOPS, 70 Wh | Dell Latitude 9330 i7-1260U, Iris Xe G7 96EUs, 50 Wh | |
|---|---|---|---|---|---|---|
| Czasy pracy | -33% | -44% | -31% | 4% | -31% | |
| WiFi v1.3 (h) | 13.7 | 9.2 -33% | 7.7 -44% | 9.5 -31% | 14.2 4% | 9.4 -31% |
| Load (h) | 1.9 | 1.5 | 2.5 | 2.3 | ||
| H.264 (h) | 18.4 | |||||
| Reader / Idle (h) | 15.4 |
Ocena Notebookcheck
EliteBook 8 Flip G1i 13 został znacznie ulepszony pod względem wydajności i ergonomii bez wpływu na funkcje lub trwałość.
HP EliteBook 8 Flip G1i 13
- 11/09/2025 v8
Allen Ngo
 Total Sustainability Score:
 Potencjalni konkurenci w porównaniu
Obraz | Model / recenzja | Cena | Waga | Wysokość | Ekran |
|---|---|---|---|---|---|
1. 87.7% 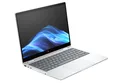 | HP EliteBook 8 Flip G1i 13 Intel Core Ultra 7 265U ⎘ Intel Graphics 4-Core iGPU (Meteor / Arrow Lake) ⎘ 16 GB Pamięć, 512 GB SSD | Amazon: Cena katalogowa: 3600 USD | 1.4 kg | 15.5 mm | 13.30" 1920x1200 170 PPI IPS |
2. 89.4% v7 (old) 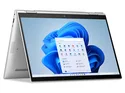 | HP EliteBook x360 830 G10 7L7U1ET Intel Core i5-1335U ⎘ Intel Iris Xe Graphics G7 80EUs ⎘ 16 GB Pamięć, 512 GB SSD | Amazon: Cena katalogowa: 1300 Euro | 1.3 kg | 19.2 mm | 13.30" 1920x1200 170 PPI IPS LED |
3. 88.7% v7 (old) 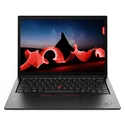 | Lenovo ThinkPad L13 Yoga G4 21FSS00100 AMD Ryzen 5 7530U ⎘ AMD Radeon RX Vega 7 ⎘ 16 GB Pamięć, 512 GB SSD | Amazon: Cena katalogowa: 840 Euro | 1.4 kg | 17.1 mm | 13.30" 1920x1200 170 PPI IPS LED |
4. 78.6% 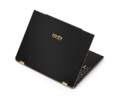 | MSI Summit E13 AI Evo A1MTG Intel Core Ultra 7 155H ⎘ Intel Arc 8-Core iGPU ⎘ 16 GB Pamięć, 1024 GB SSD | Amazon: Cena katalogowa: 1100 USD | 1.3 kg | 16.2 mm | 13.30" 1920x1200 170 PPI IPS |
5. 85.3%  | Asus ProArt PZ13 HT5306 Qualcomm Snapdragon X Plus X1P-42-100 ⎘ Qualcomm SD X Adreno X1-45 1.7 TFLOPS ⎘ 16 GB Pamięć, 1024 GB SSD | Amazon: 1. $2,119.99 ASUS ProArt PX13 (Replace P1... 2. $929.99 ASUS ProArt PZ13 2-in-1 AI C... 3. $1,209.99 ASUS ProArt PZ13 2-in-1 AI L... Cena katalogowa: 1599€ | 874 g | 9 mm | 13.30" 2880x1800 255 PPI OLED |
6. 89% v7 (old)  | Dell Latitude 9330 Intel Core i7-1260U ⎘ Intel Iris Xe Graphics G7 96EUs ⎘ 16 GB Pamięć | Amazon: 1. $999.99 Dell Latitude 9330 2-in-1 La... 2. $569.00 Dell Latitude 7430 14" Lapto... 3. $536.21 Dell Latitude 5530 15.6in FH... | 1.2 kg | 14.1 mm | 13.30" 2560x1600 227 PPI IPS |
Przezroczystość
Wyboru urządzeń do recenzji dokonuje nasza redakcja. Próbka testowa została udostępniona autorowi jako pożyczka od producenta lub sprzedawcy detalicznego na potrzeby tej recenzji. Pożyczkodawca nie miał wpływu na tę recenzję, producent nie otrzymał też kopii tej recenzji przed publikacją. Nie było obowiązku publikowania tej recenzji. Jako niezależna firma medialna, Notebookcheck nie podlega władzy producentów, sprzedawców detalicznych ani wydawców.
Tak testuje Notebookcheck
Każdego roku Notebookcheck niezależnie sprawdza setki laptopów i smartfonów, stosując standardowe procedury, aby zapewnić porównywalność wszystkich wyników. Od około 20 lat stale rozwijamy nasze metody badawcze, ustanawiając przy tym standardy branżowe. W naszych laboratoriach testowych doświadczeni technicy i redaktorzy korzystają z wysokiej jakości sprzętu pomiarowego. Testy te obejmują wieloetapowy proces walidacji. Nasz kompleksowy system ocen opiera się na setkach uzasadnionych pomiarów i benchmarków, co pozwala zachować obiektywizm.
