Werdykt: Proszę pozostać przy wersji X1 Carbon Gen 13 z jeziorem Lunar
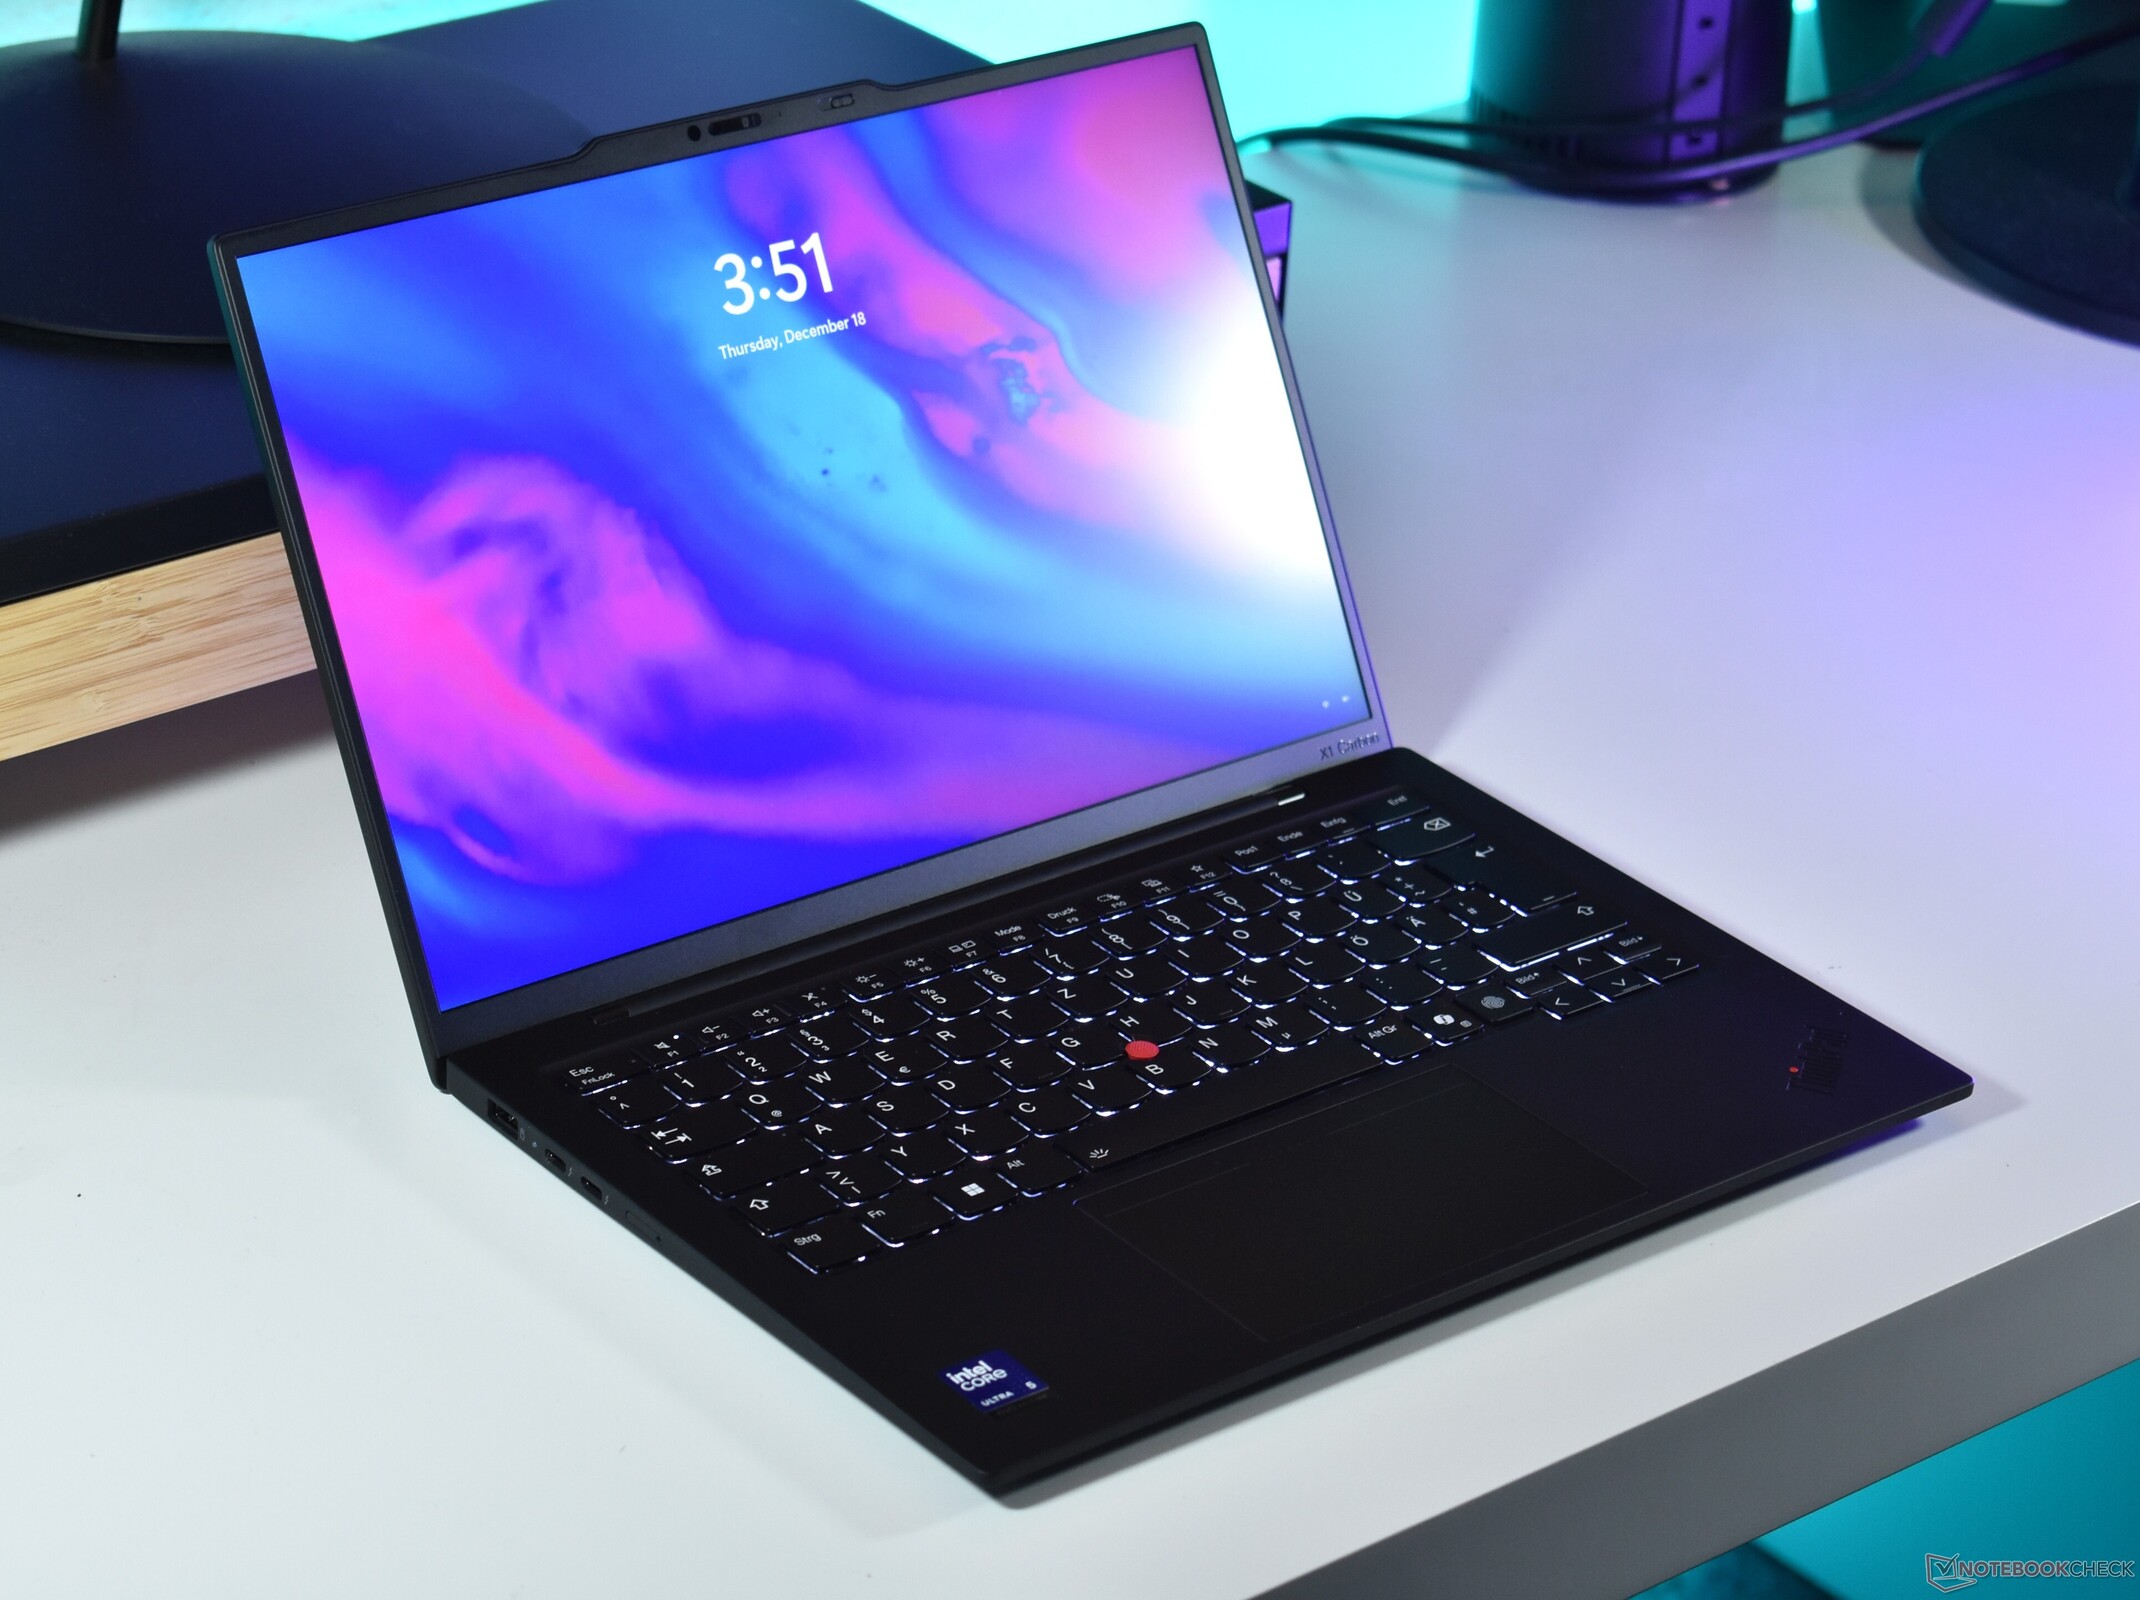
Kiedy po raz pierwszy recenzowaliśmy Lenovo ThinkPad X1 Carbon Gen 13, było wiele do pokochania: Niższa waga, chłodniejsza praca, dłuższa żywotność laptopa i świetny ekran OLED. Niestety, wielu z tych cech brakuje w najnowszej wersji, którą testowaliśmy. Dzięki platformie Intel Arrow Lake U, odświeżonej wersji zeszłorocznego Meteor Lake, X1 Carbon G13 bardziej przypomina X1 Carbon Gen 12.5. Działa goręcej, głośniej, a żywotność baterii jest tylko nieznacznie lepsza niż w modelu wyposażonym w ekran OLED, pomimo znacznie bardziej energooszczędnego, ale także nudnego ekranu IPS.
Nawet waga znacząco wzrosła. Z drugiej strony, użytkownicy otrzymują w tym przypadku opcję WWAN, a Arrow Lake obsługuje 64 GB pamięci RAM zamiast tylko 32 GB. Ale jeśli nie potrzebują Państwo żadnej z tych funkcji, nigdy nie kupujcie wersji Arrow Lake U X1 Carbon zamiast tej z Lunar Lake. To po prostu nie jest to samo doświadczenie użytkownika.
Za
Przeciw
Cena i dostępność
Cena Lenovo ThinkPad X1 Carbon Gen 13 z procesorem Intel Arrow Lake zaczyna się od 1850 USD , czyli o około 300 USD mniej niż w przypadku wersji Lunar Lake tego samego produktu.
Spis treści
- Werdykt: Proszę pozostać przy wersji X1 Carbon Gen 13 z jeziorem Lunar
- Specyfikacje: Intel Arrow Lake U i IPS o niskim poborze mocy
- Obudowa: ThinkPad X1 Carbon wykorzystuje więcej aluminium
- Łączność: Lenovo ThinkPad X1 Carbon G13 z opcjonalną łącznością 5G
- Urządzenia wejściowe pozostają bez zmian
- Wyświetlacz: Ekran IPS zamiast OLED w X1 Carbon Gen 13
- Wydajność: Arrow Lake zapewnia szybszą wydajność wielordzeniową
- Emisje: ThinkPad X1 Carbon Gen 13 nagrzewa się jeszcze bardziej dzięki Arrow Lake
- Zarządzanie energią: Wydajność jest gorsza bez Jeziora Księżycowego
- Ocena Notebookcheck
- Potencjalni konkurenci w porównaniu
Rok temu Lenovo ThinkPad X1 Carbon Gen 13 przywrócił blask serii Lenovo X1 Carbon. Dzięki ekranowi OLED, jeszcze lżejszej konstrukcji i bardzo wydajnemu procesorowi Intel Lunar Lake, cienki i lekki ThinkPad klasy premium przywrócił X1 Carbon jako najbardziej pożądany model ThinkPada, po kilku latach bardziej rozczarowujących iteracji. Oczywiście ta wersja X1 Carbon G13 nie jest jedyną, która istnieje - istnieją również modele z procesorem Intel Arrow Lake i ekranem IPS, które tutaj recenzujemy.
Specyfikacje: Intel Arrow Lake U i IPS o niskim poborze mocy
Obudowa: ThinkPad X1 Carbon wykorzystuje więcej aluminium
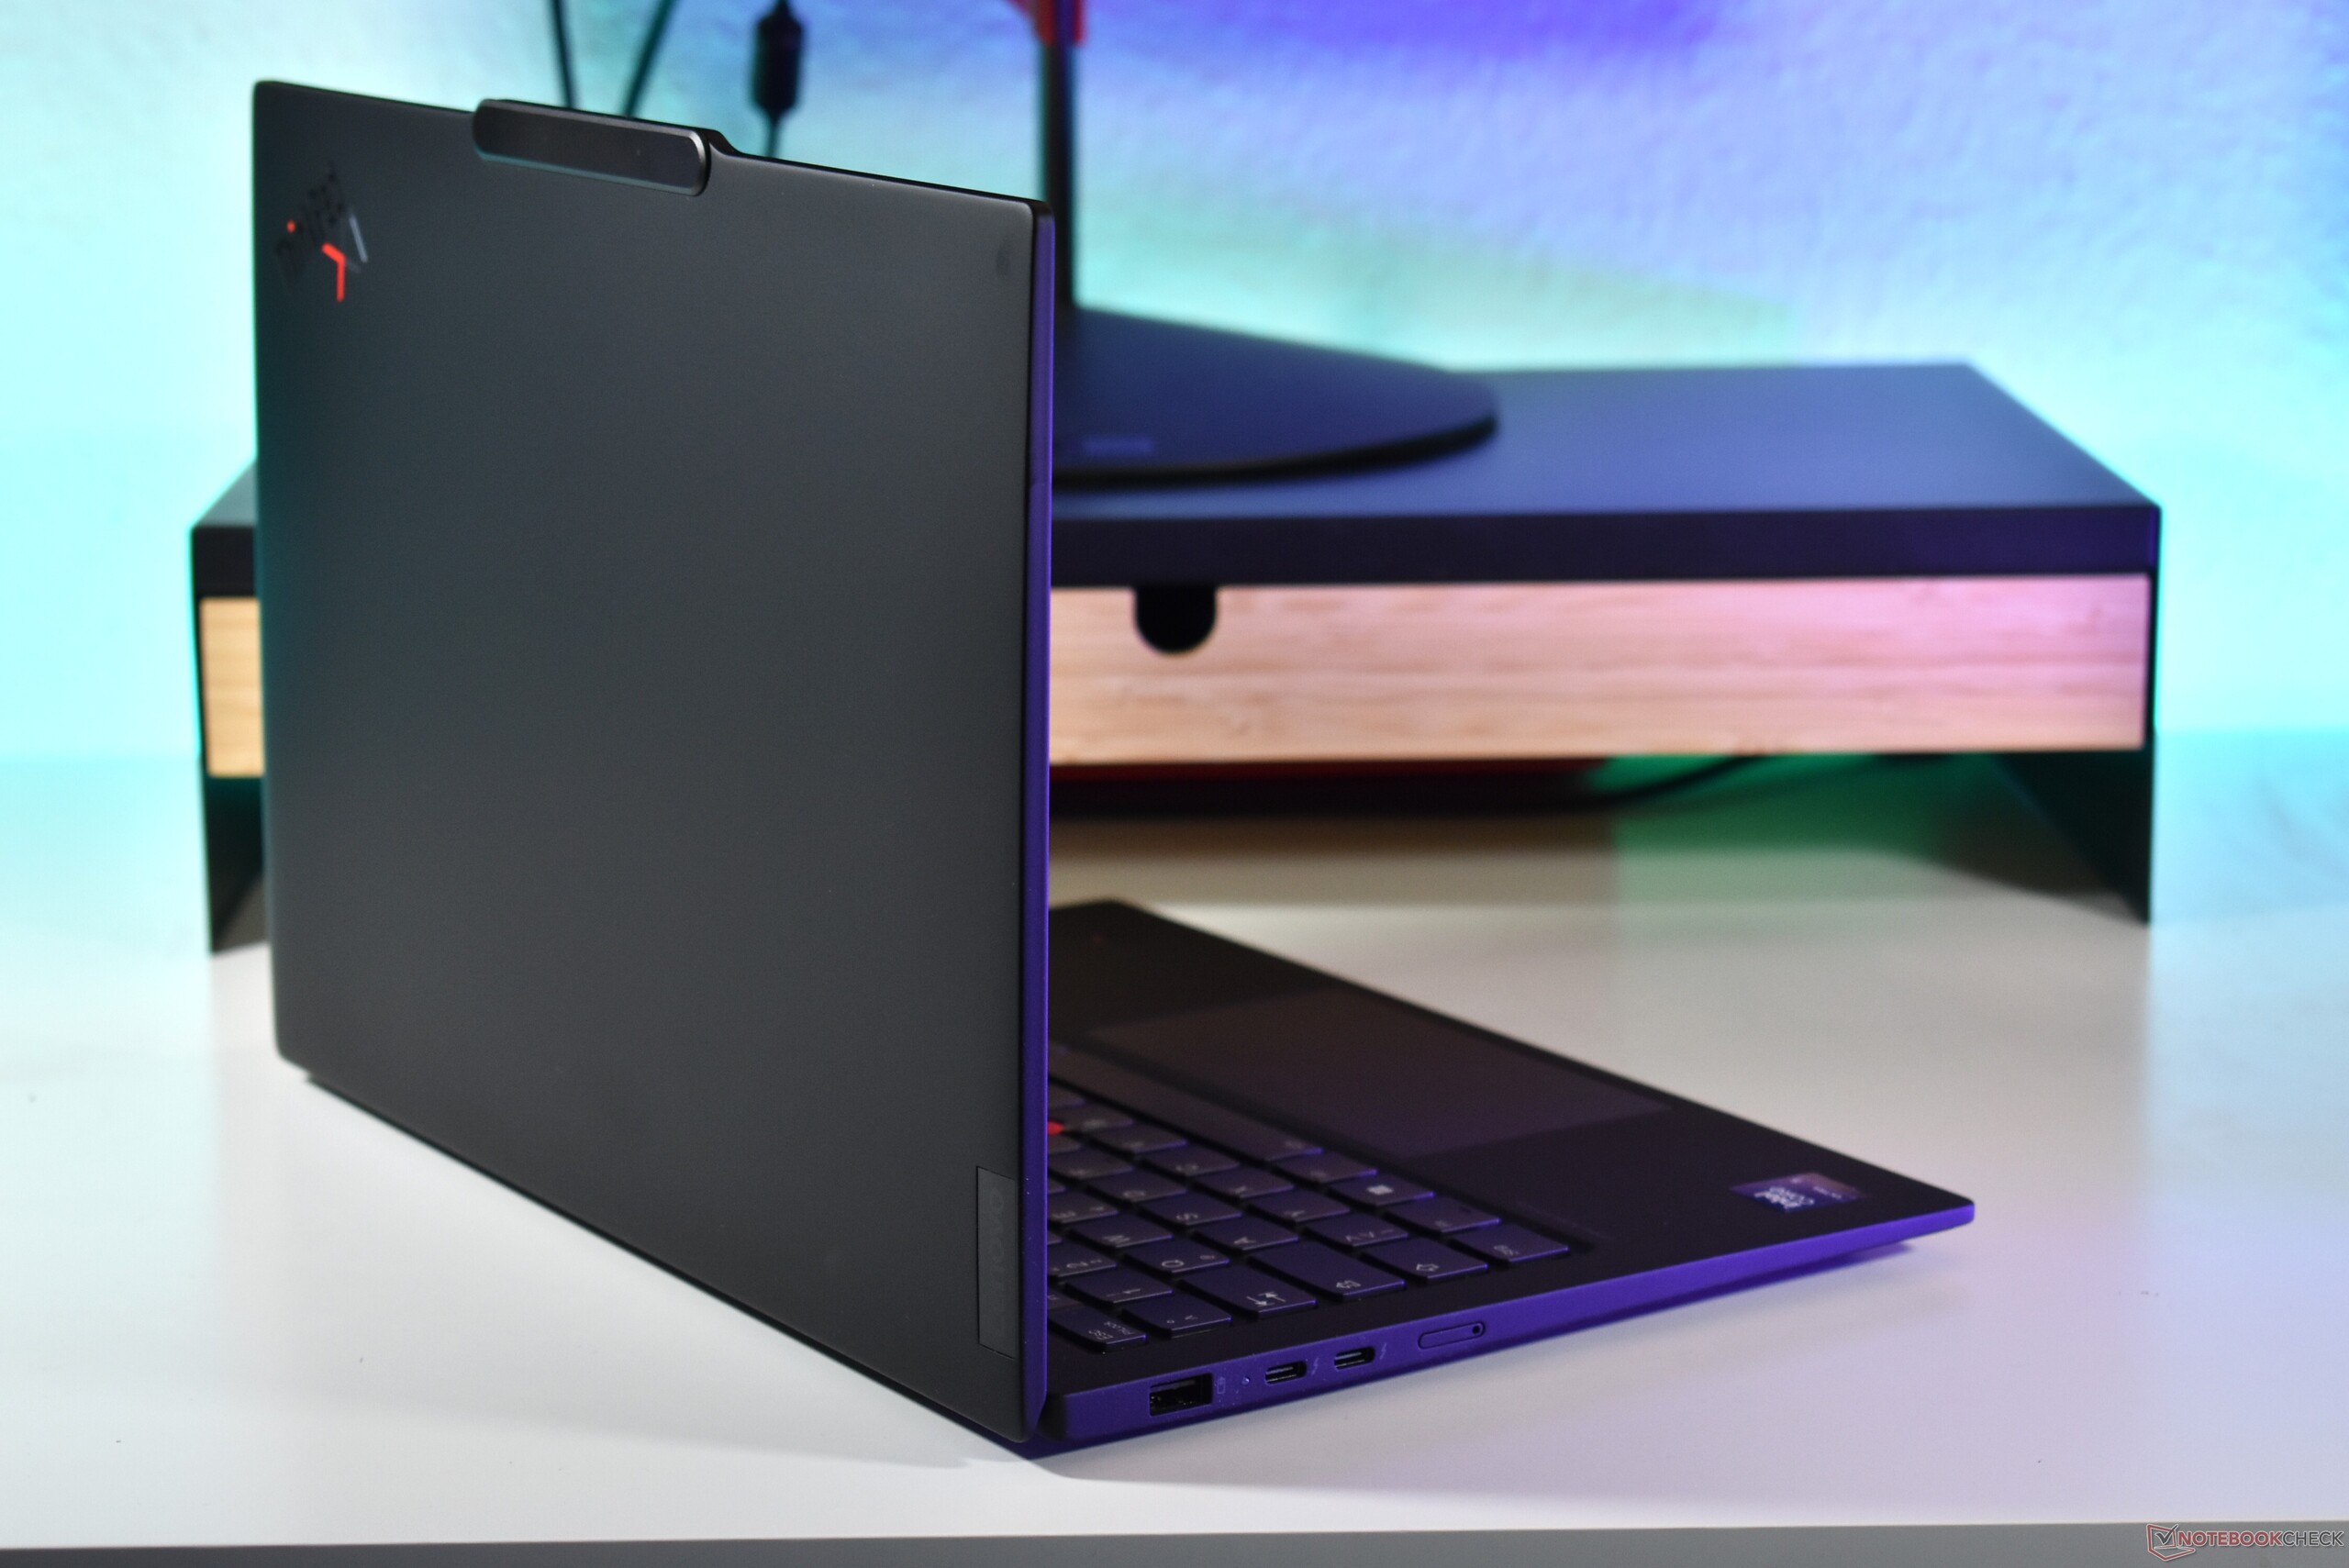
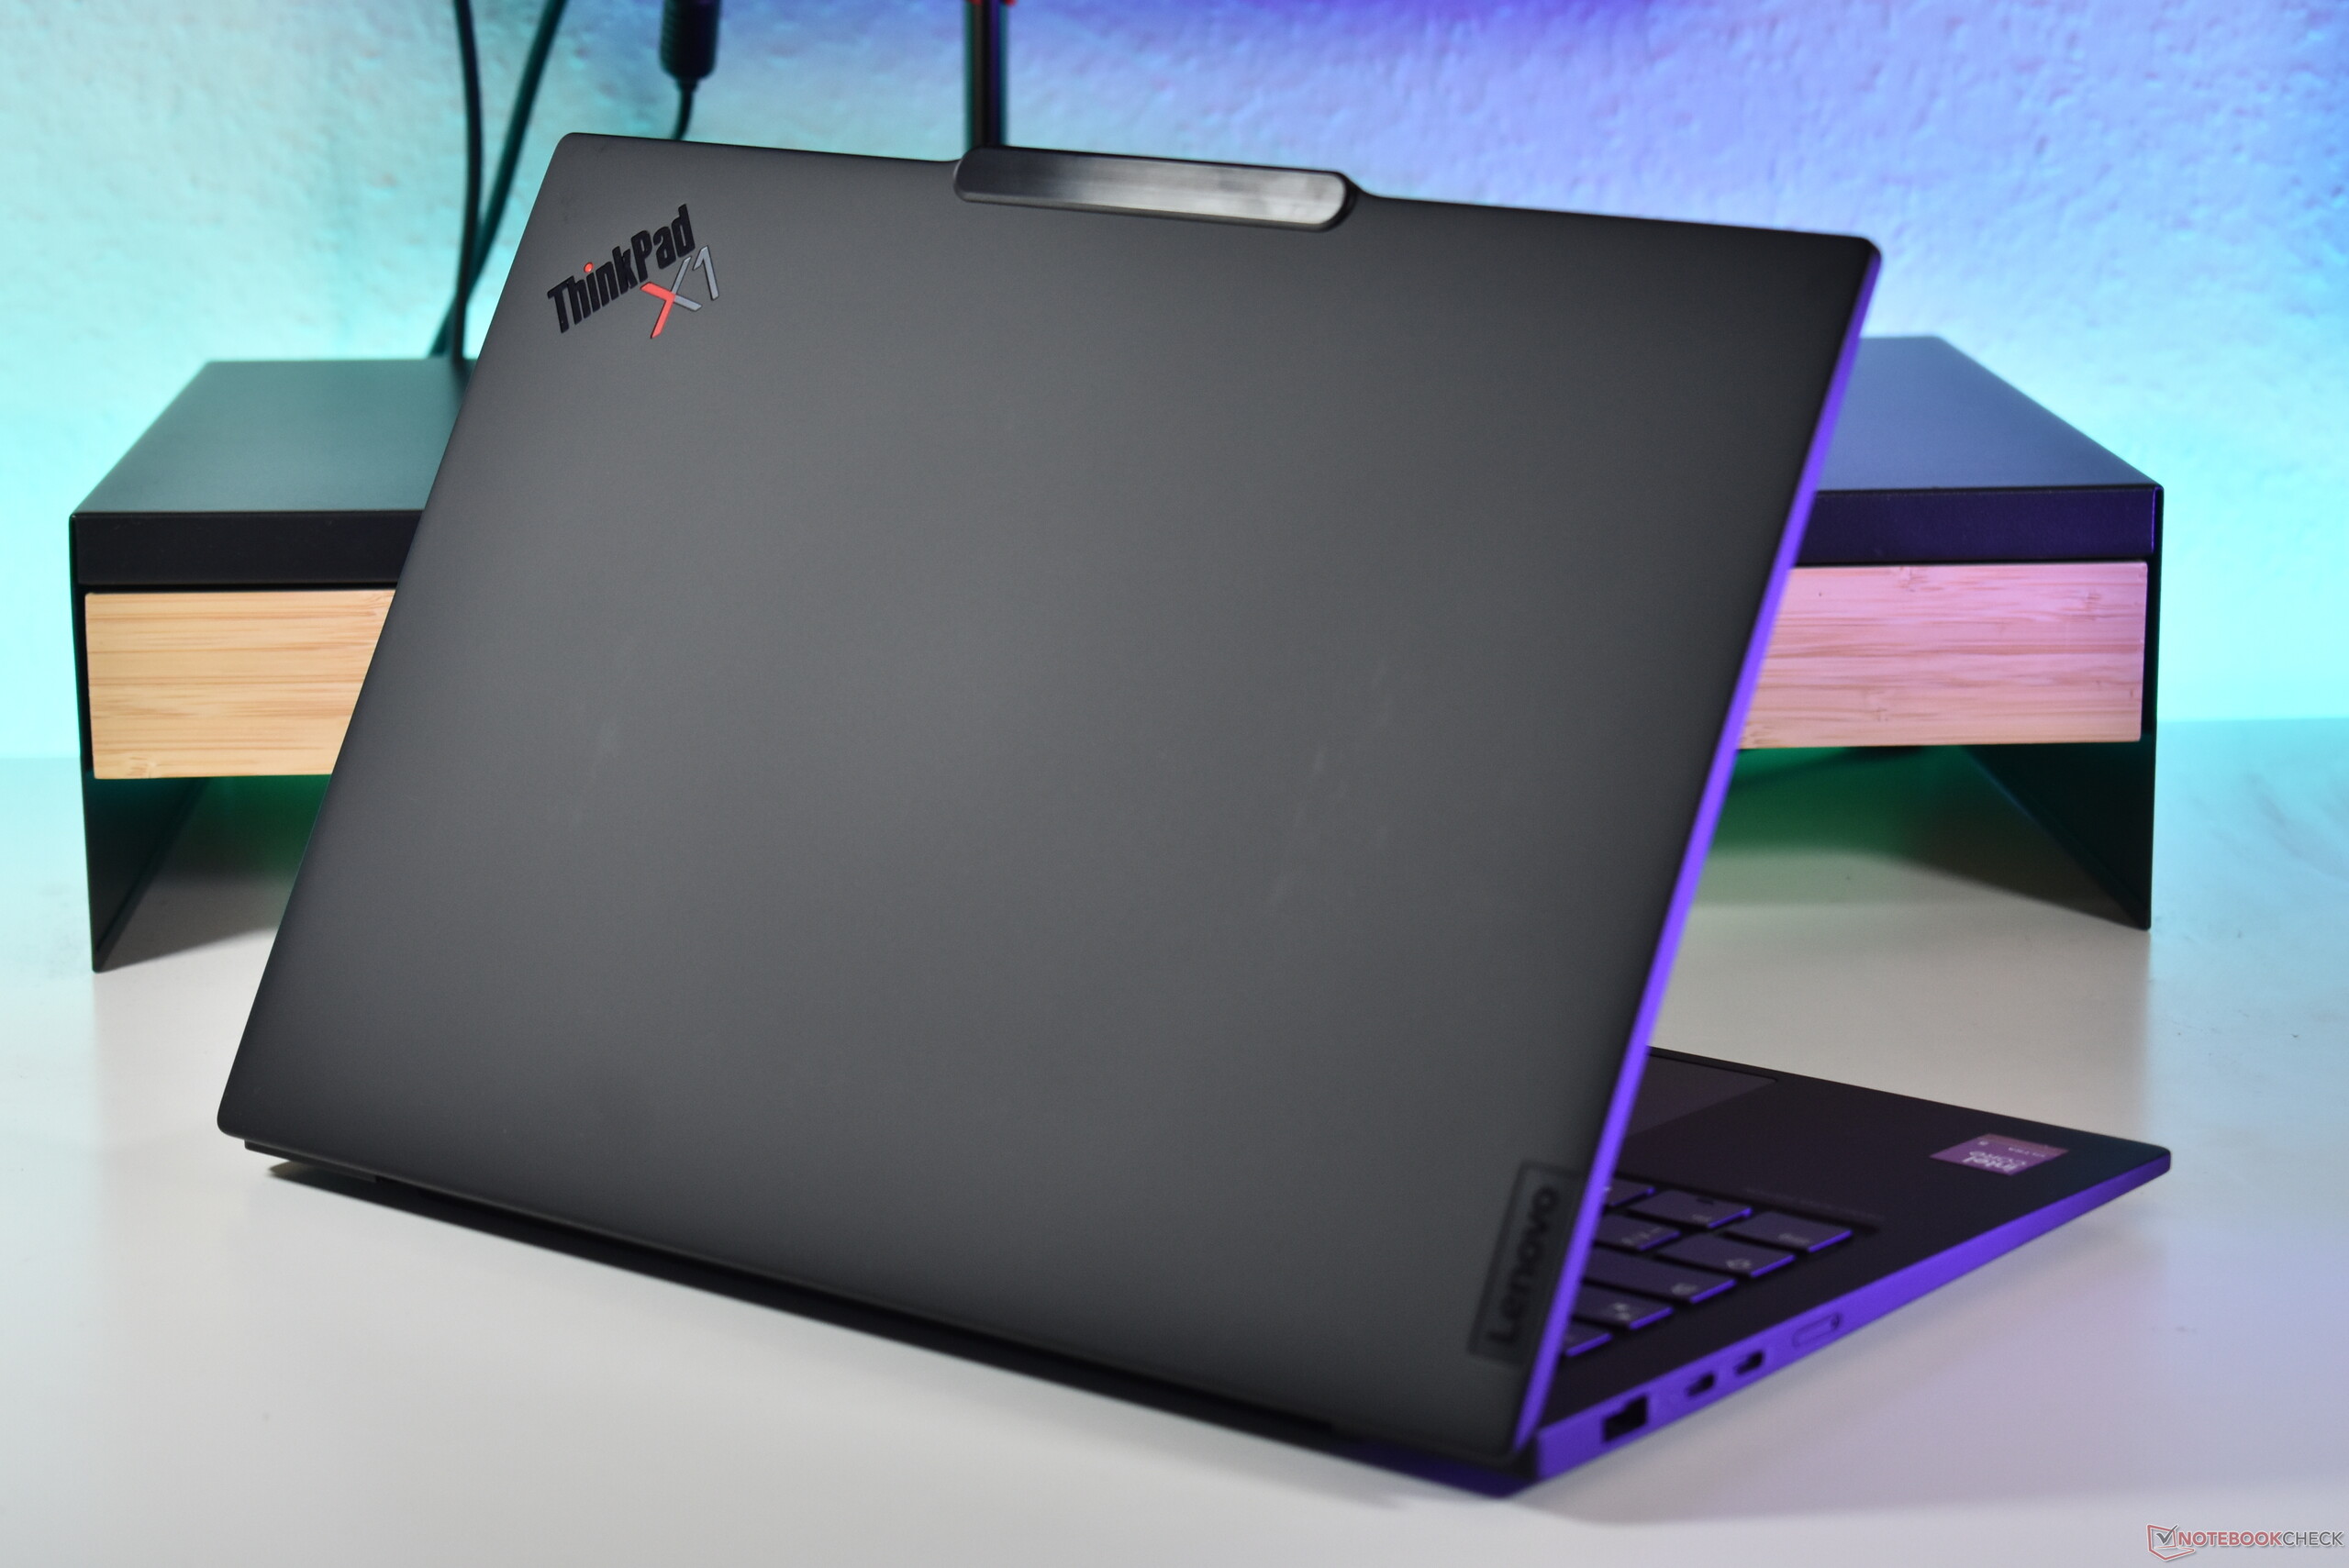
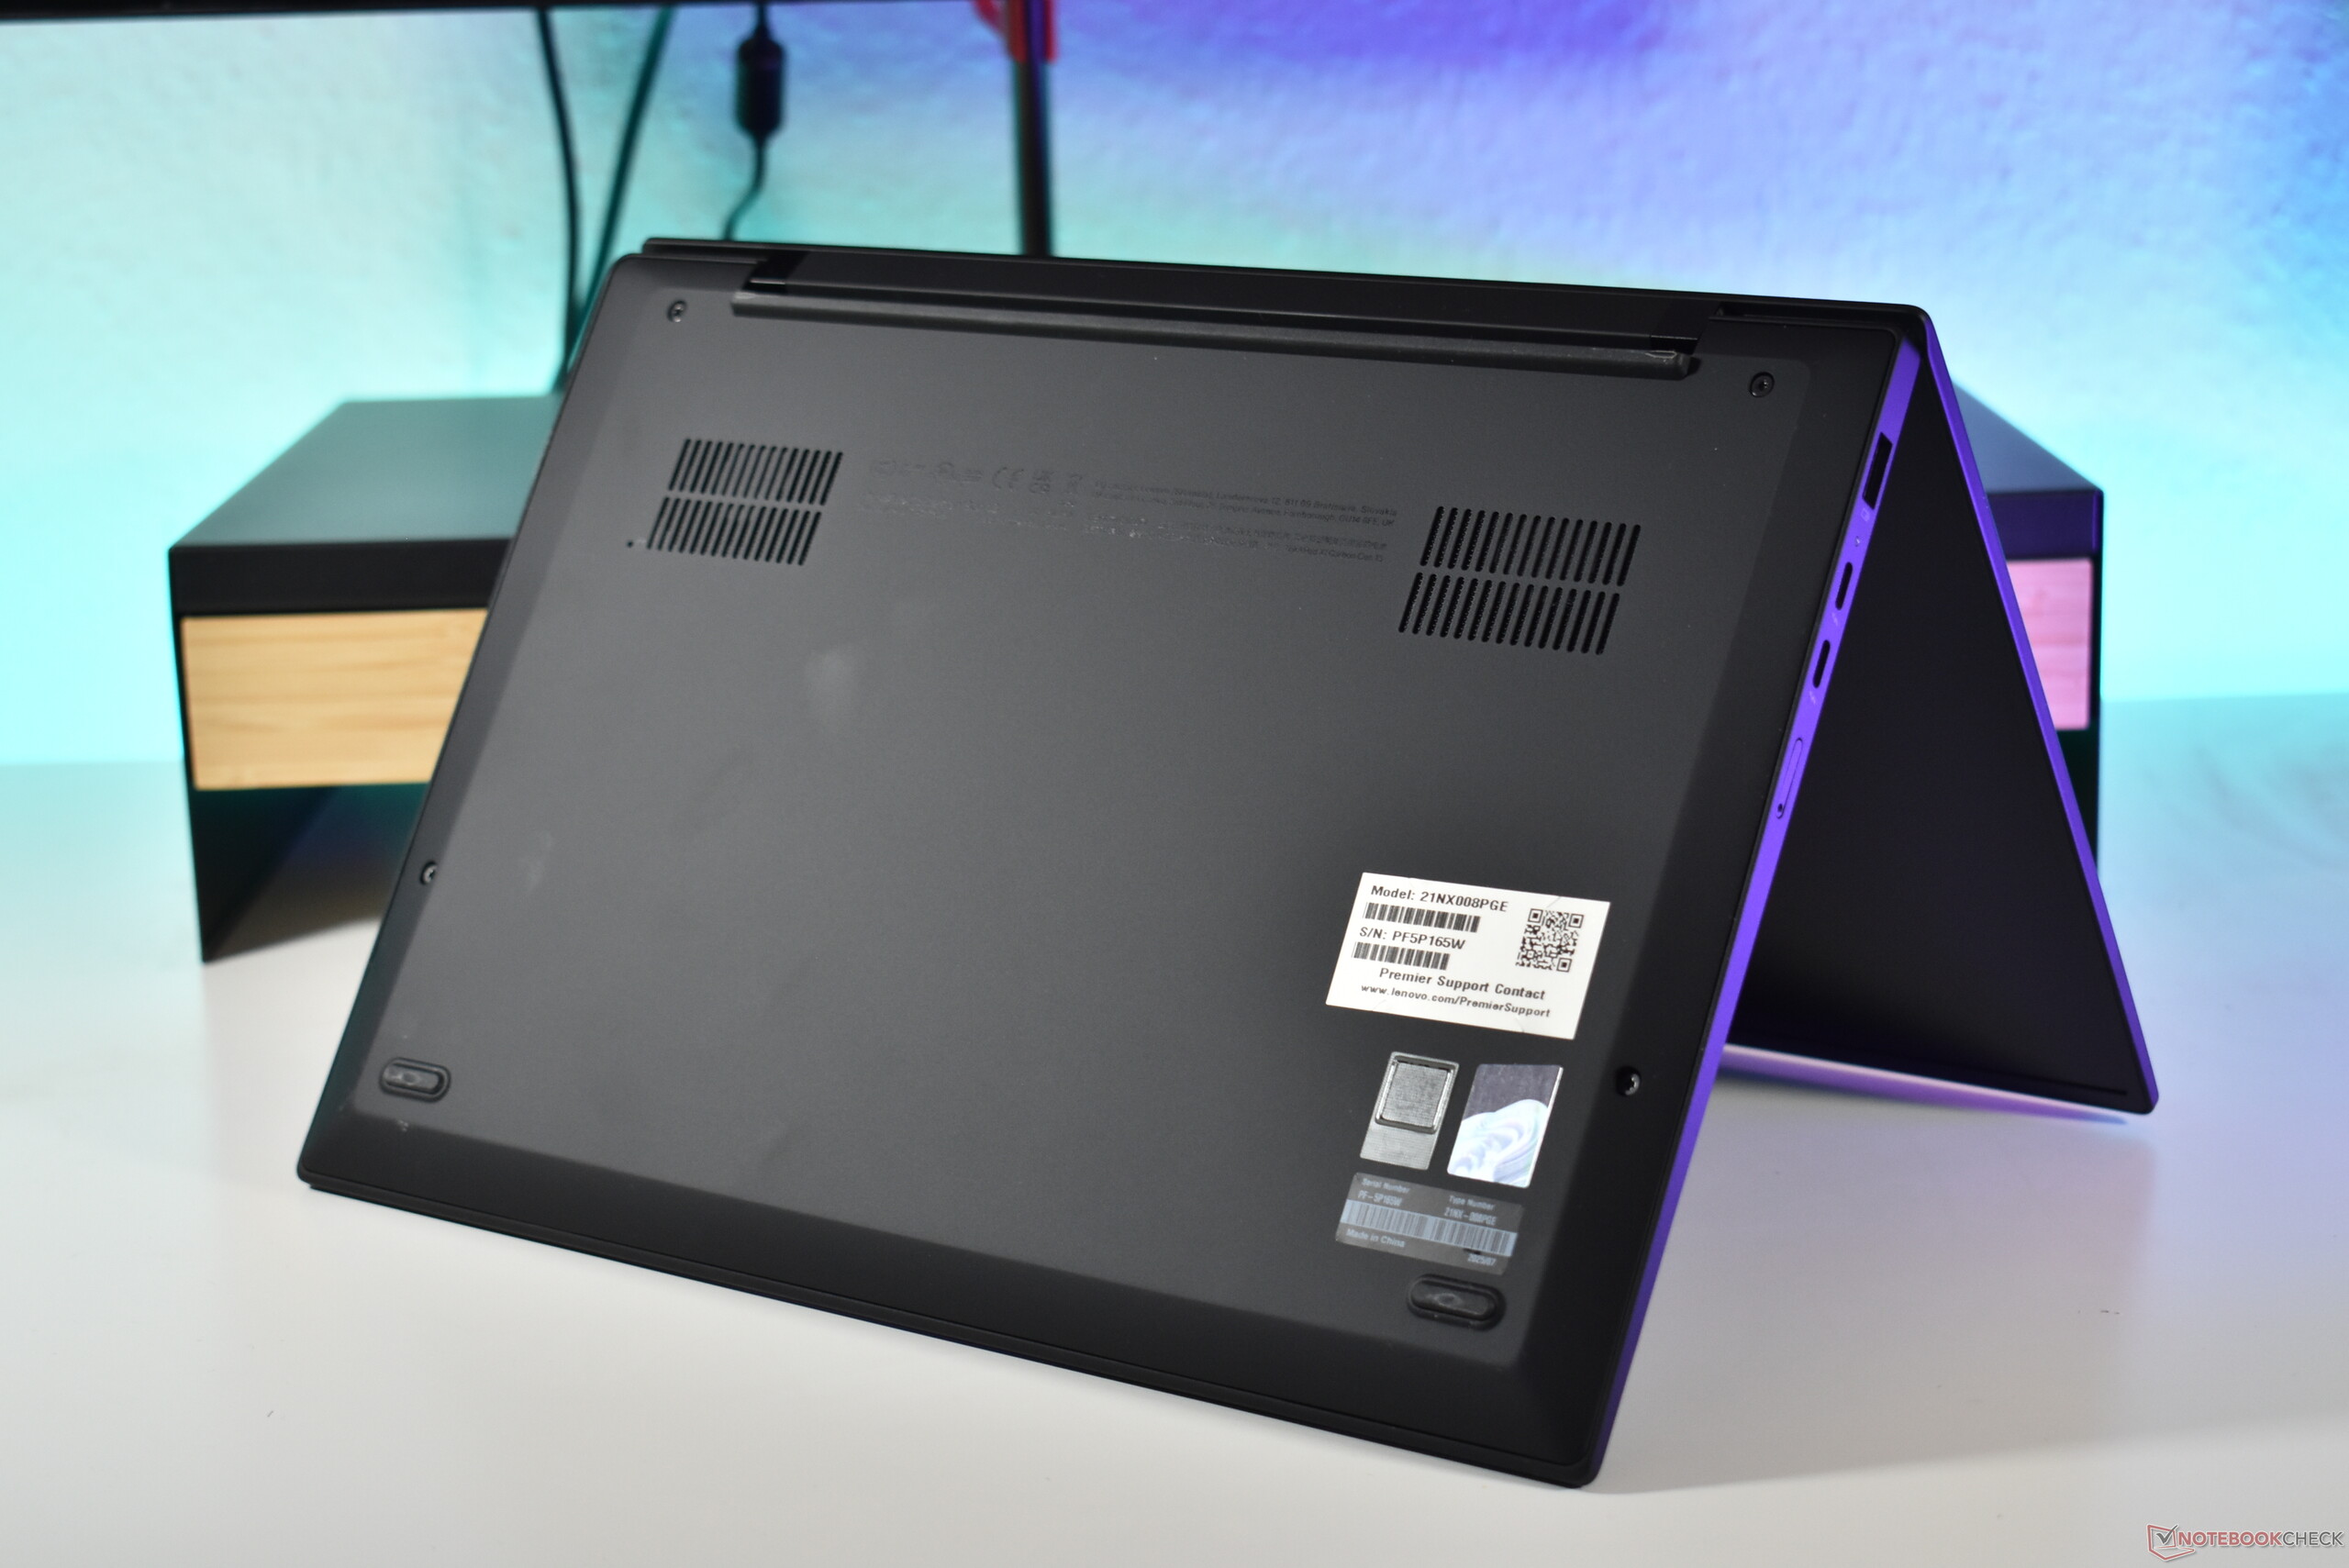
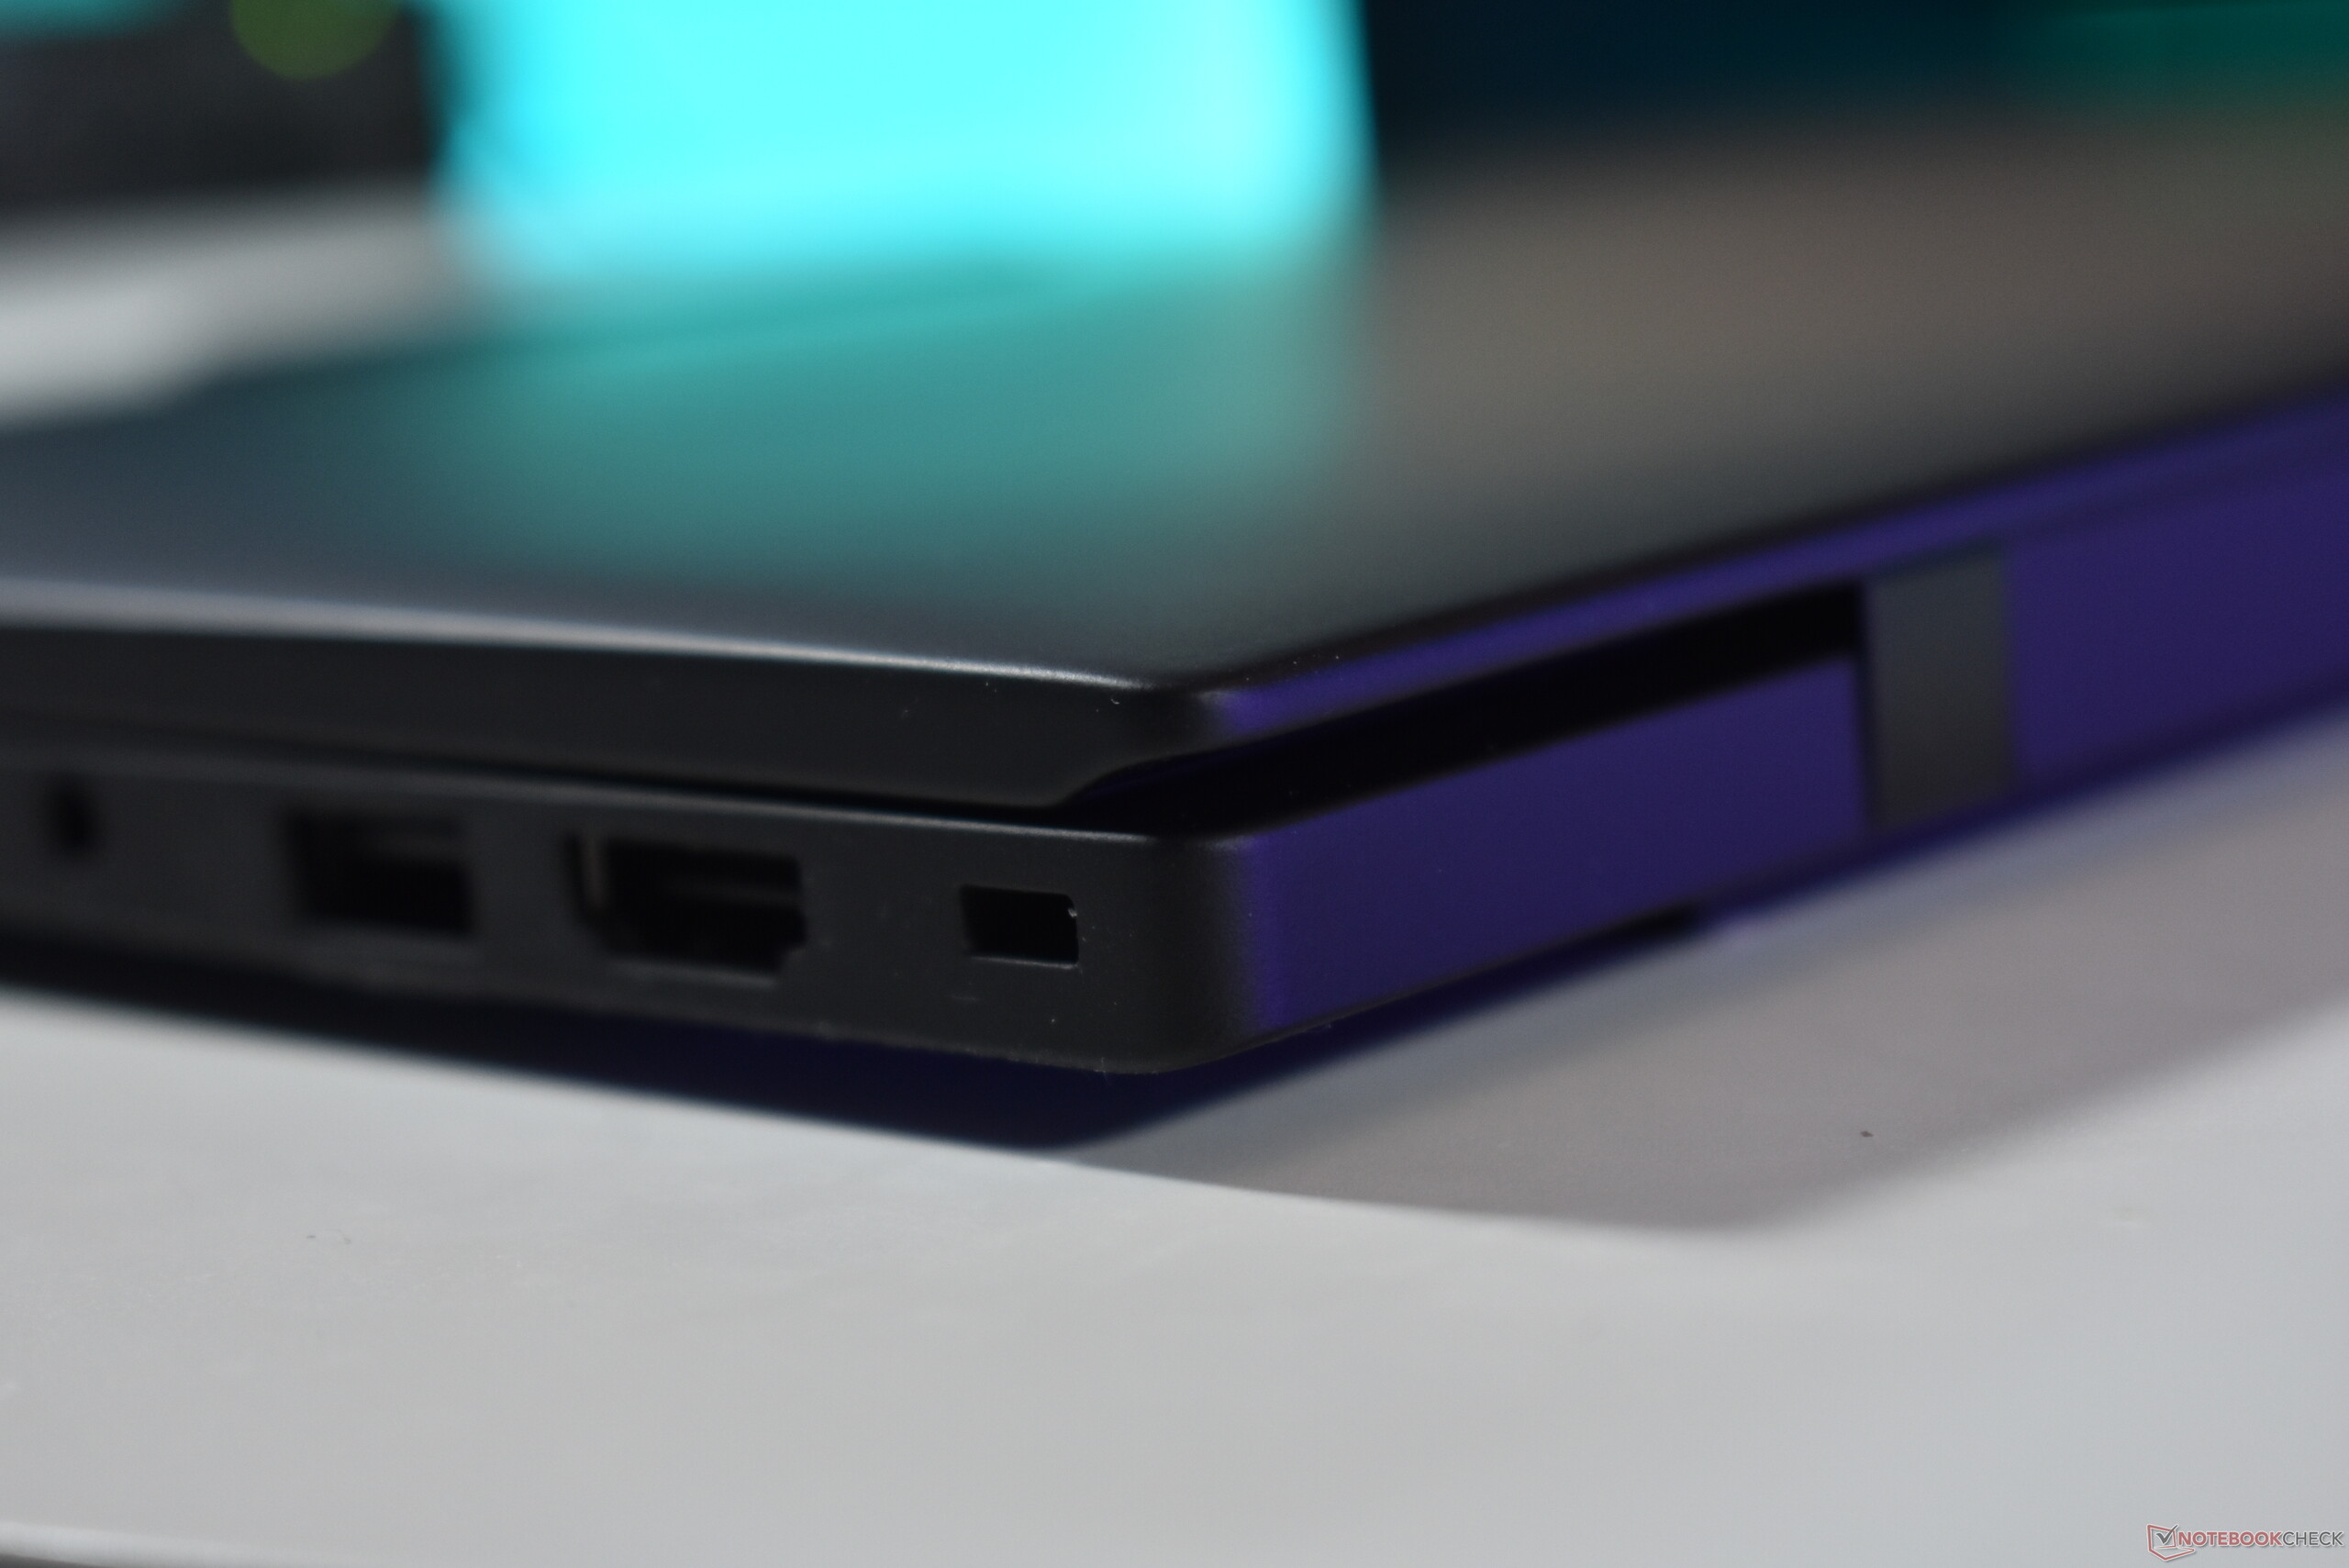
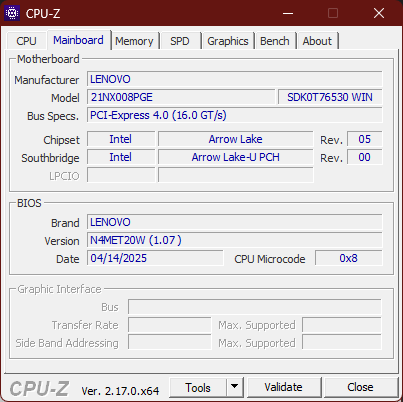
Choć z zewnątrz jest identyczny z wcześniejszej wersji X1 Carbon G13, którą testowaliśmyjest kilka kluczowych różnic. Jedną z nich jest obudowa: W tym Lenovo ThinkPad X1 Carbon Gen 13 wymieniono dolną pokrywę z magnezu na aluminiową. Zaleta: Umożliwia to WWAN, ta próbka testowa ma przygotowane anteny 5G. Wada: Waga jest zauważalnie wyższa. Podczas gdy pierwsza testowana przez nas próbka ważyła zaledwie 982 g, ta waży 1,165 g.
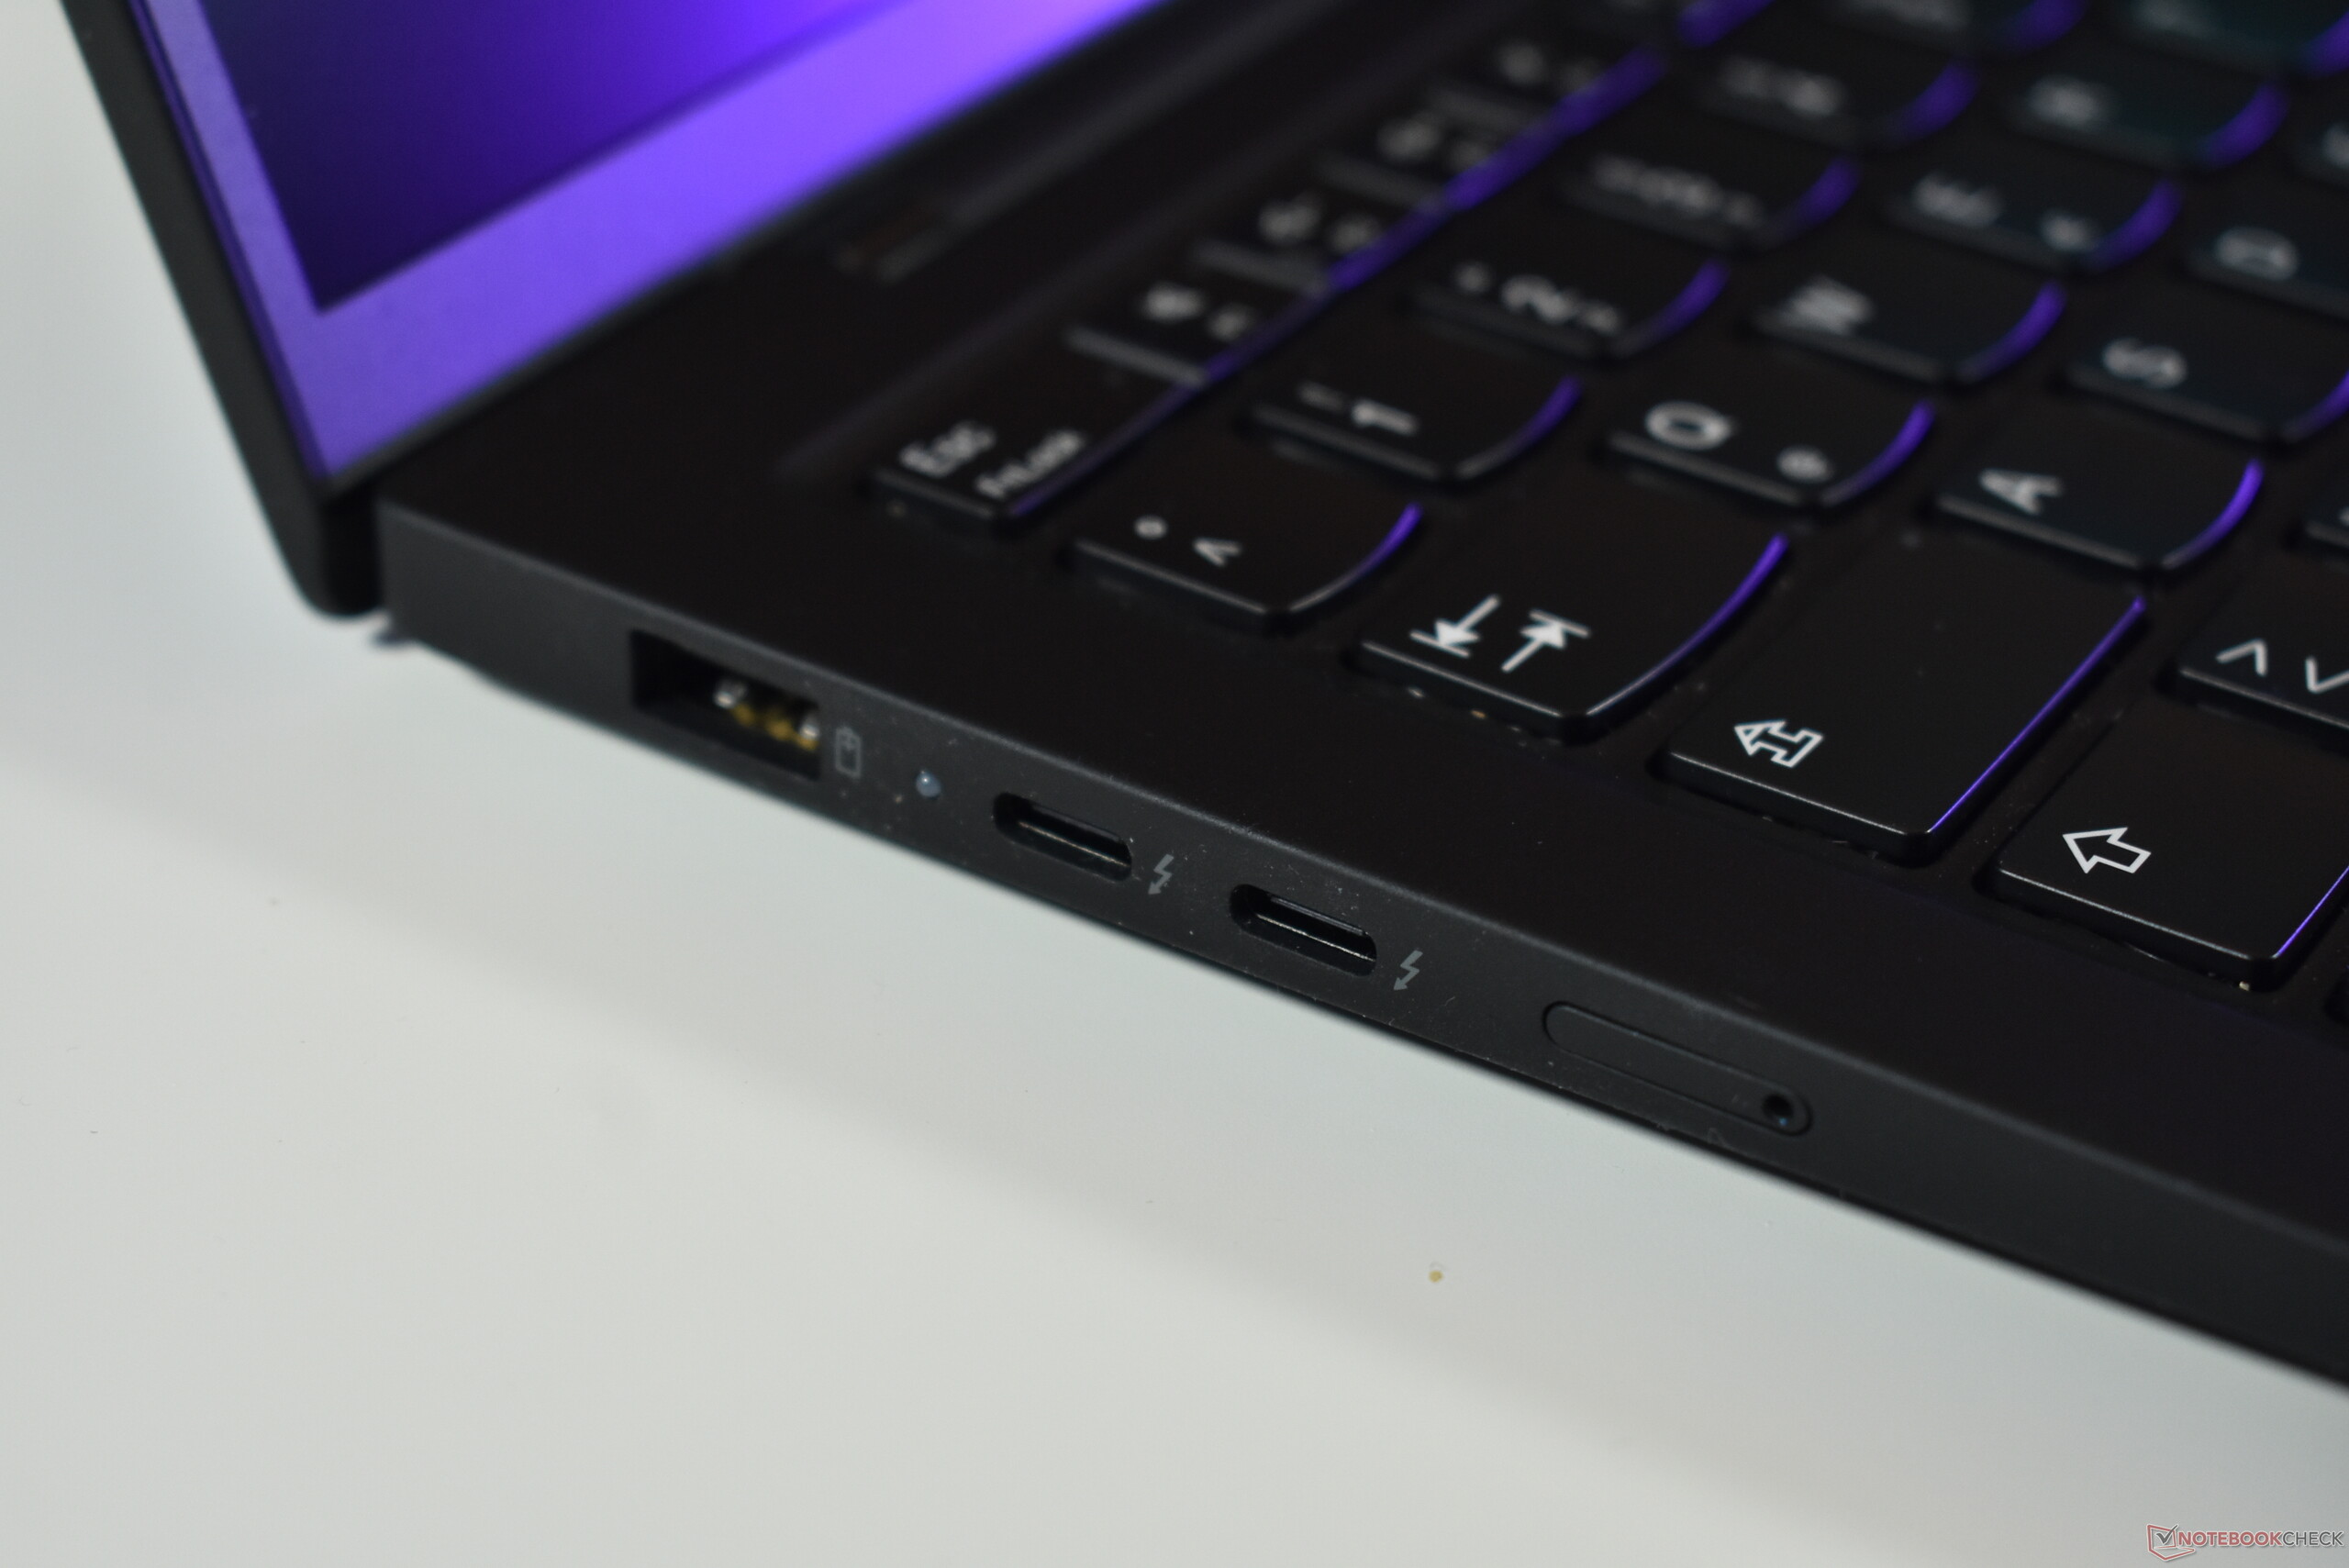

Łączność: Lenovo ThinkPad X1 Carbon G13 z opcjonalną łącznością 5G


, Ultra 5 225U, Samsung PM9E1 MZVLC512HFJD")
, Ultra 5 225U, Samsung PM9E1 MZVLC512HFJD")
Konserwacja


Urządzenia wejściowe pozostają bez zmian
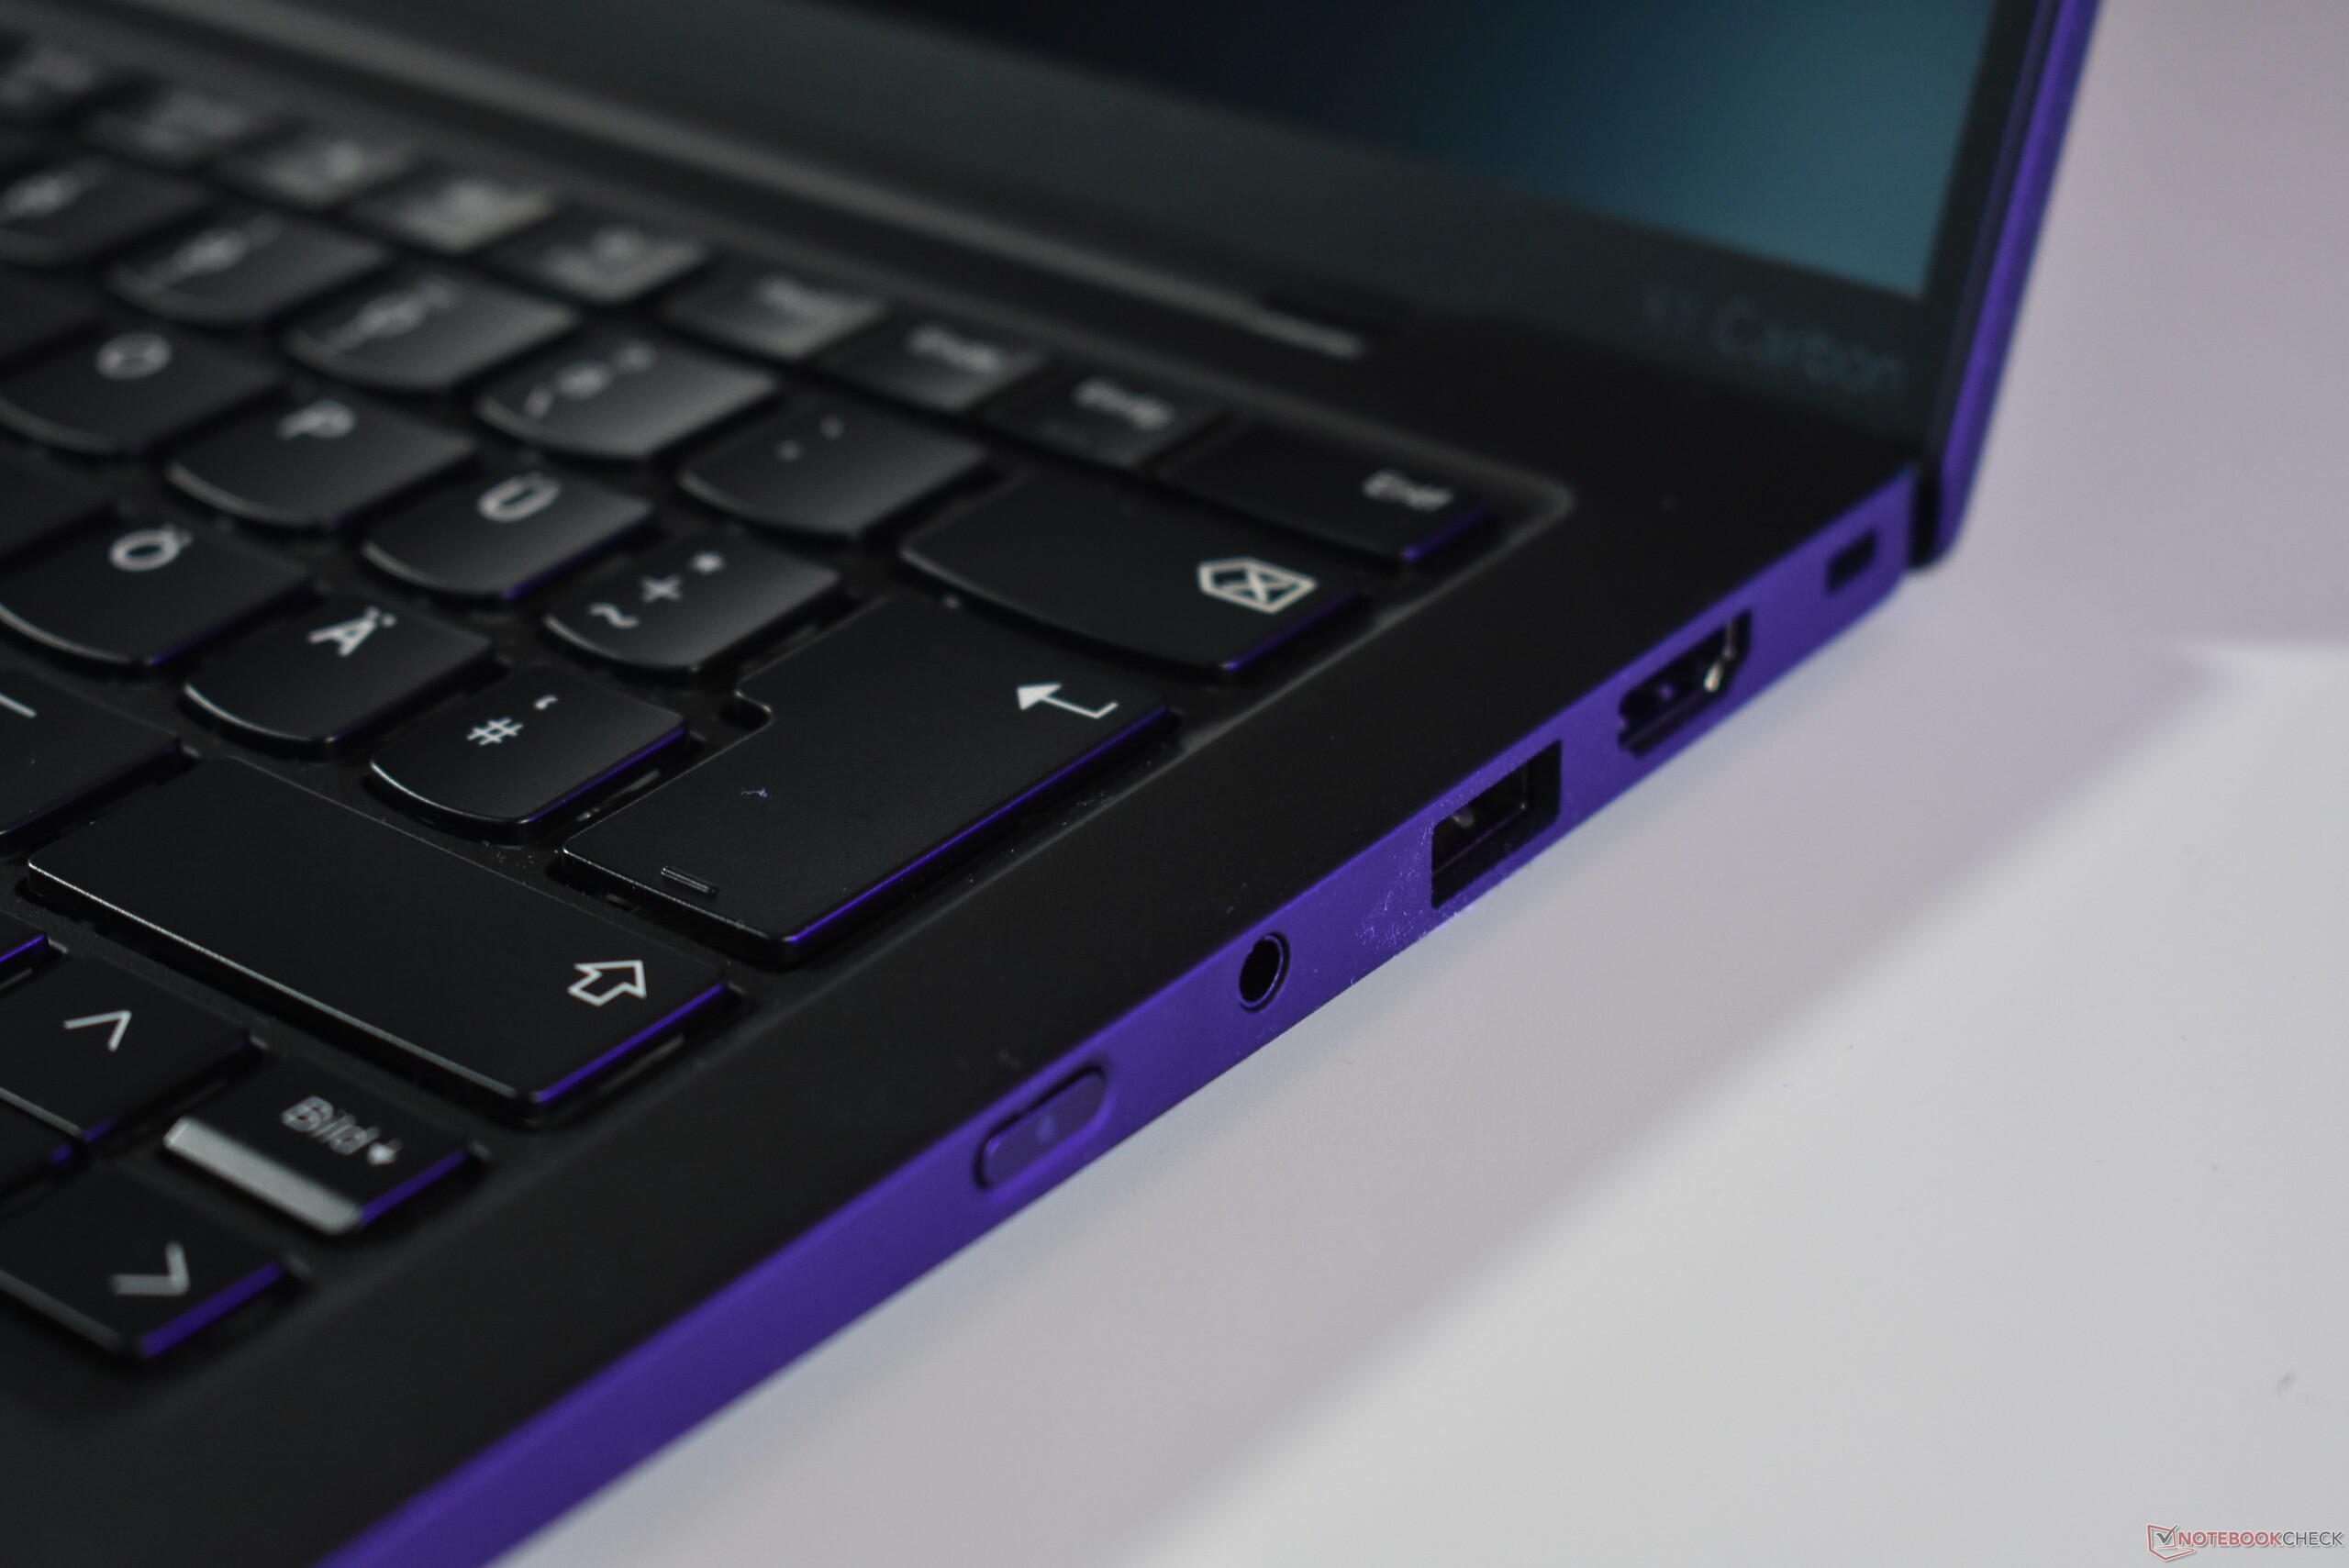
Klawiatura, touchpad i TrackPoint pozostały niezmienione. Pod każdym względem X1 Carbon jest najlepszym z najlepszych ThinkPadów. Tylko TrackPoint nie jest tak dobry jak w innych modelach, ze względu na zintegrowane przyciski TrackPoint, ale dostępna jest wersja z mechanicznymi przyciskami myszy.


Wyświetlacz: Ekran IPS zamiast OLED w X1 Carbon Gen 13


W sumie Lenovo oferuje sześć różnych opcji 14-calowych ekranów 16:10 w ThinkPad X1 Carbon G13:
- WUXGA (1 920 x 1 200), IPS, 500 cd/m², 100% sRGB, matowy, Low Power
- WUXGA (1,920 x 1,200), IPS, 500 cd/m², 100% sRGB, matowy, Low Power, Multitouch
- WUXGA (1,920 x 1,200), IPS, 500 cd/m², 100% sRGB, matowy, PrivacyGuard
- 2.8K (2 880 x 1 800), OLED, 400 cd/m², 100% DCI-P3, półbłyszczący, 120 Hz, HDR
- 2.8K (2,880 x 1,800), OLED, 500 cd/m², 100% DCI-P3, półbłyszczący, 120 Hz VRR, HDR
- 2.8K (2,880 x 1,800), OLED, 500 cd/m², 100% DCI-P3, półbłyszczący, 120 Hz VRR, HDR, Multitouch
Średnia jasność 491 cd/m² w naszej podstawowej wersji Low Power jest nieco poniżej obiecanej wartości. Jest to przyzwoity panel, który przewyższa ekrany WUXGA konkurencji pod względem jasności, ale jest to powolny panel, z długim czasem reakcji i częstotliwością odświeżania wynoszącą zaledwie 60 Hz. Oczywiście panel OLED jest znacznie lepszy, choć być może Lenovo mogłoby również zaoferować nieco lepszy panel IPS niż ten.
| |||||||||||||||||||||||||
rozświetlenie: 86 %
na akumulatorze: 545 cd/m²
kontrast: 2180:1 (czerń: 0.25 cd/m²)
ΔE ColorChecker Calman: 1.8 | ∀{0.5-29.43 Ø4.73}
calibrated: 1
ΔE Greyscale Calman: 2.7 | ∀{0.09-98 Ø4.97}
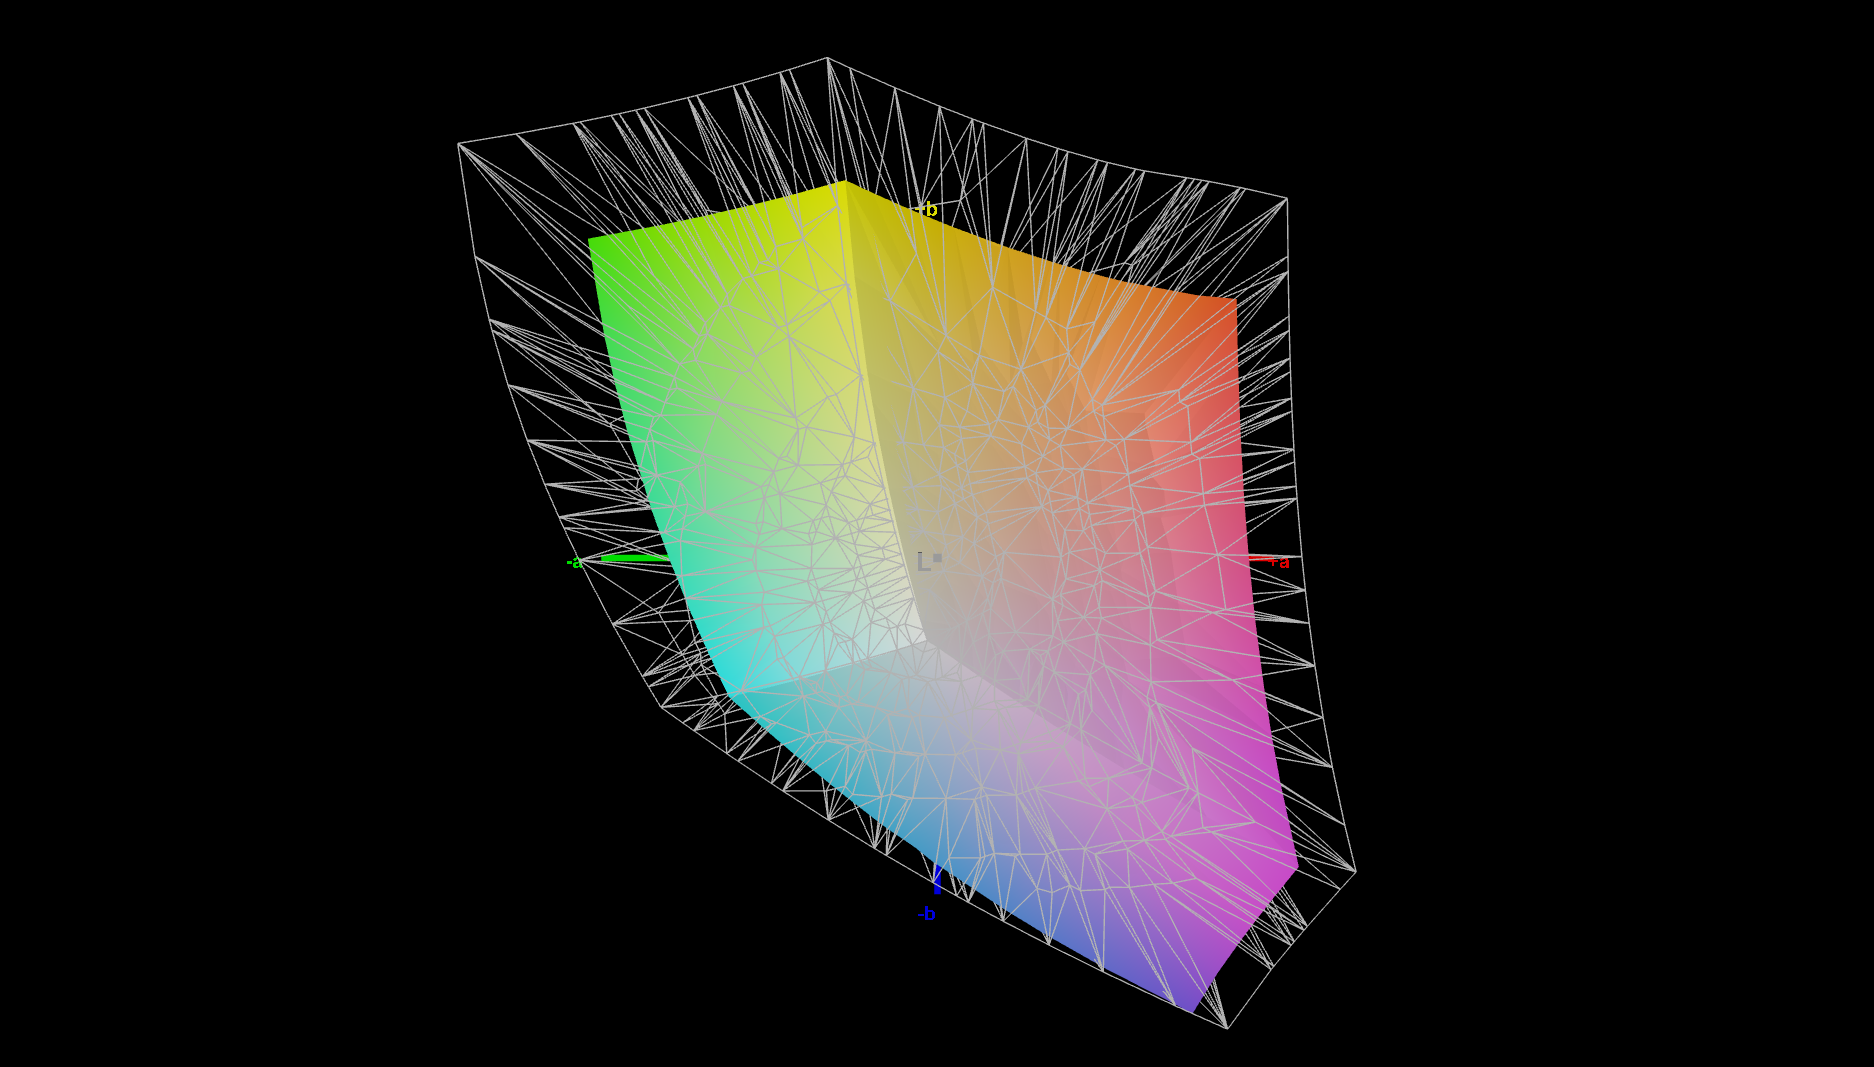
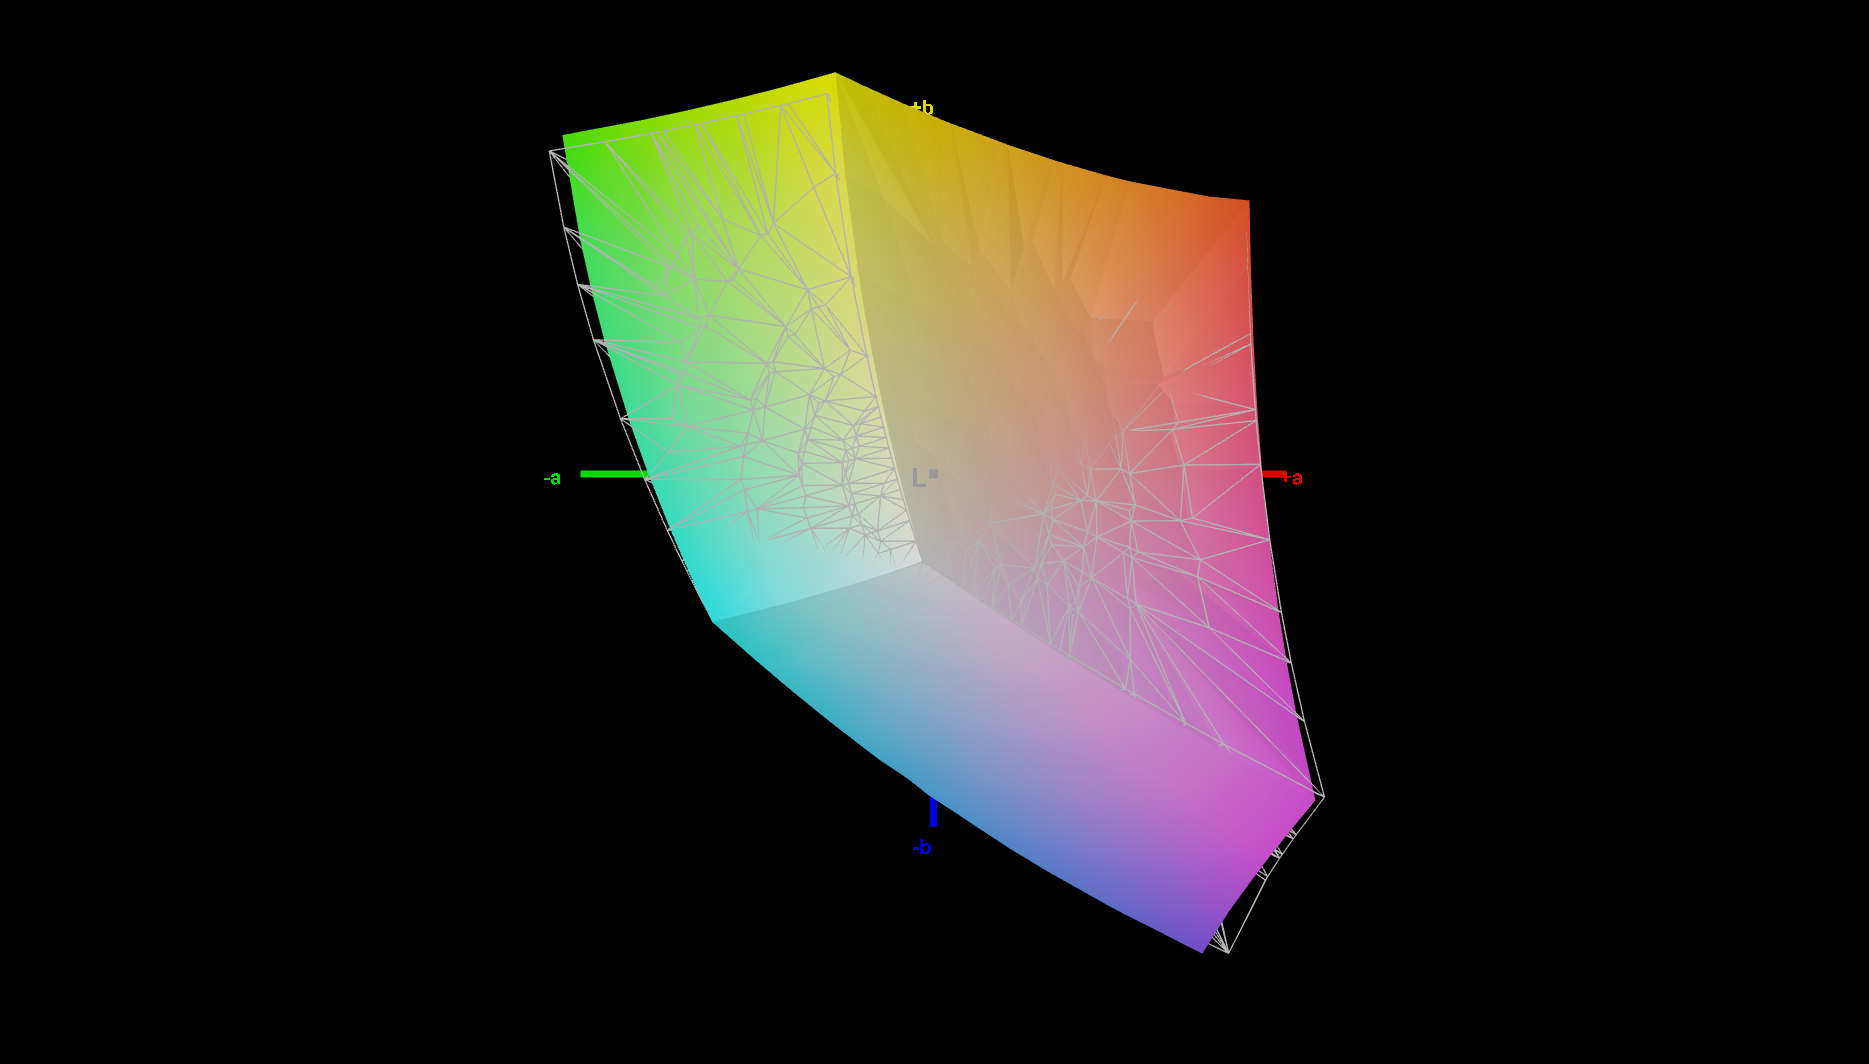
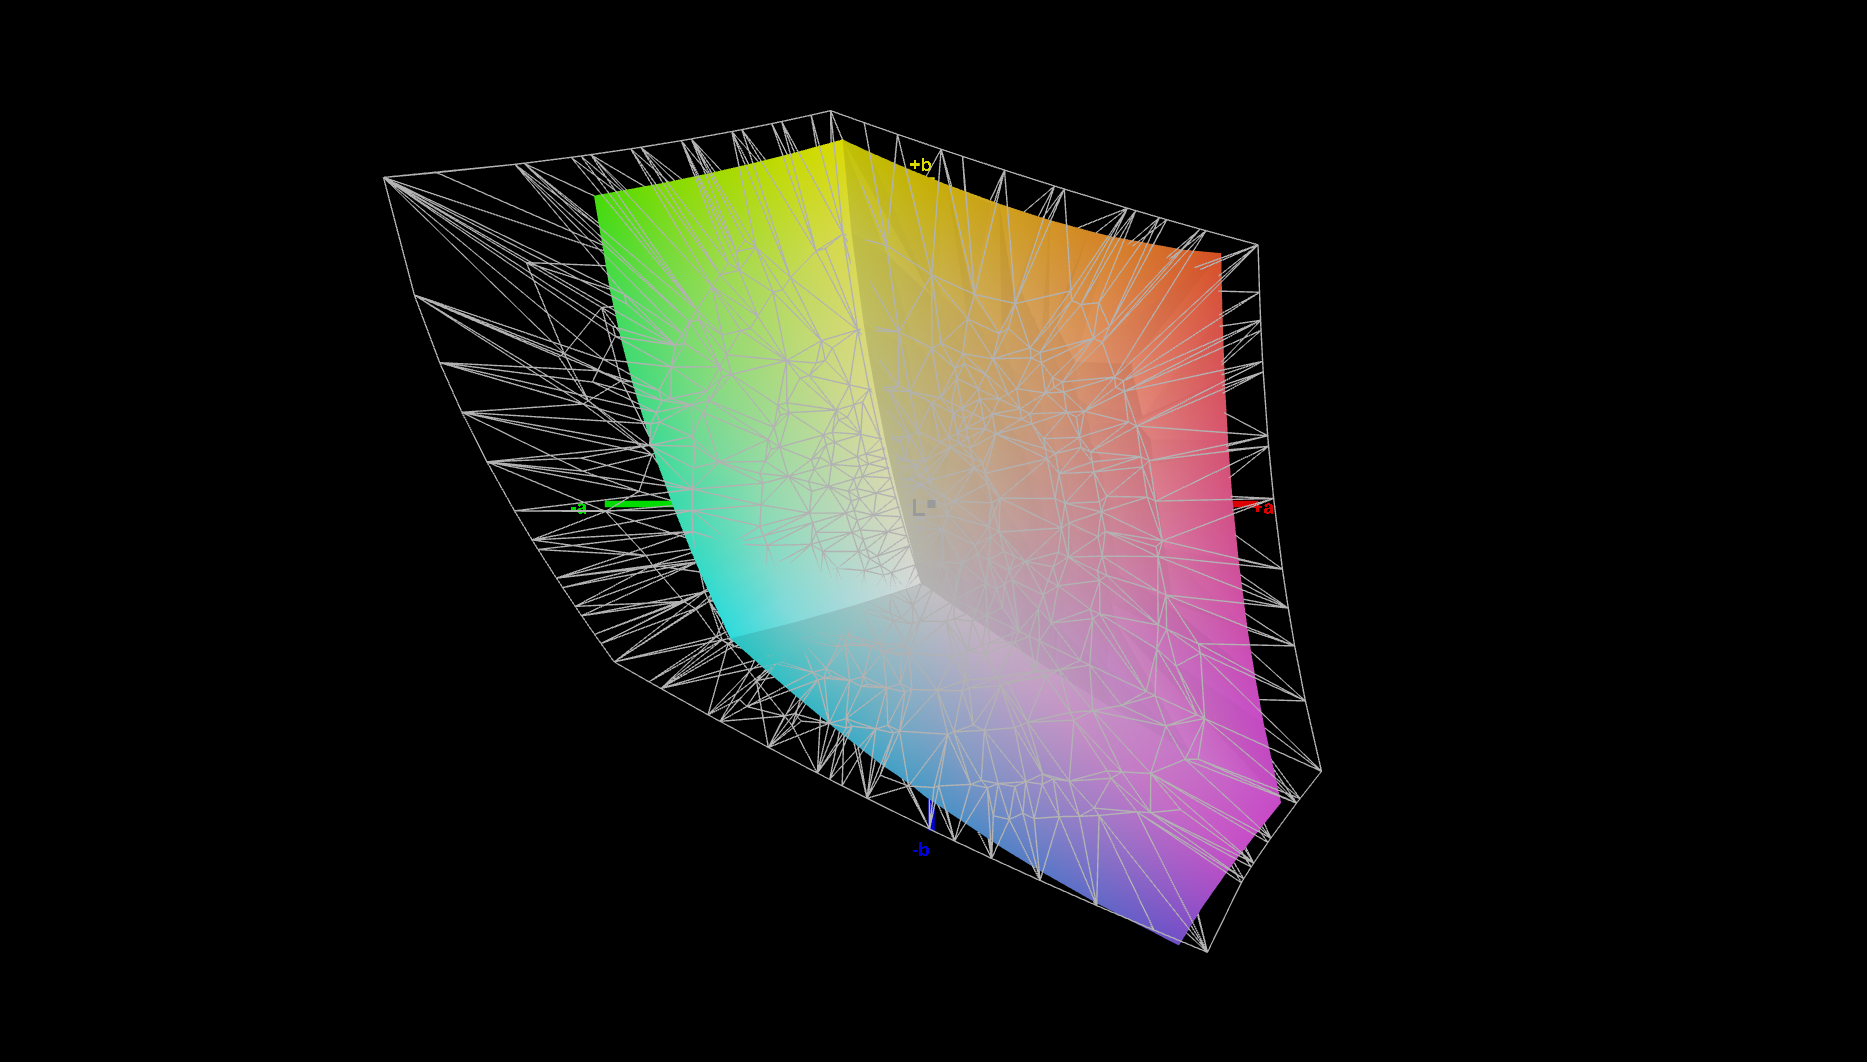
69.8% AdobeRGB 1998 (Argyll 3D)
97.7% sRGB (Argyll 3D)
67.8% Display P3 (Argyll 3D)
Gamma: 2.2
CCT: 6466 K
| Lenovo ThinkPad X1 Carbon Gen 13 21NX008PGE N140JLG-GT3, IPS LED, 1920x1200, 14", 60 Hz | Lenovo ThinkPad X1 Carbon Gen 13 21NS0010GE ATNA40YK20-0, OLED, 2880x1800, 14", 120 Hz | Acer TravelMate P6 TMP614-54-TCO-553Z AUO77B2, IPS, 1920x1200, 14", 60 Hz | HP EliteBook X G1i 14 AI IPS, 1920x1200, 14", 60 Hz | Dell Pro 14 Premium LG Phillips 140WT1, OLED, 2880x1800, 14", 60 Hz | Lenovo ThinkPad X9-14 Gen 1 Aura Edition ATNA40CT04-0 , OLED, 1920x1200, 14", 60 Hz | |
|---|---|---|---|---|---|---|
| Display | 29% | 4% | 2% | 28% | 29% | |
| Display P3 Coverage (%) | 67.8 | 99.5 47% | 73.49 8% | 69.9 3% | 99 46% | 99.2 46% |
| sRGB Coverage (%) | 97.7 | 100 2% | 97.5 0% | 98.4 1% | 100 2% | 99.9 2% |
| AdobeRGB 1998 Coverage (%) | 69.8 | 97.1 39% | 72.95 5% | 71.6 3% | 95.8 37% | 97.8 40% |
| Response Times | 94% | -17% | 3% | 94% | 89% | |
| Response Time Grey 50% / Grey 80% * (ms) | 43.8 ? | 2.4 ? 95% | 54.8 ? -25% | 42.3 ? 3% | 1.4 ? 97% | 3 ? 93% |
| Response Time Black / White * (ms) | 28.6 ? | 1.9 ? 93% | 31.2 ? -9% | 28 ? 2% | 2.7 ? 91% | 4.2 ? 85% |
| PWM Frequency (Hz) | 240 ? | 241.1 ? | 480 | |||
| PWM Amplitude * (%) | 33 | 32 | 22 | |||
| Screen | -98% | -64% | -15% | -19% | -99% | |
| Brightness middle (cd/m²) | 545 | 407 -25% | 465 -15% | 487.5 -11% | 392.3 -28% | 398 -27% |
| Brightness (cd/m²) | 491 | 410 -16% | 449 -9% | 469 -4% | 392 -20% | 399 -19% |
| Brightness Distribution (%) | 86 | 99 15% | 88 2% | 91 6% | 95 10% | 98 14% |
| Black Level * (cd/m²) | 0.25 | 0.2821 -13% | 0.26 -4% | |||
| Contrast (:1) | 2180 | 1648 -24% | 1875 -14% | |||
| Colorchecker dE 2000 * | 1.8 | 4.9 -172% | 3.78 -110% | 2.37 -32% | 3.39 -88% | 4.8 -167% |
| Colorchecker dE 2000 max. * | 3.9 | 9.1 -133% | 7.58 -94% | 5.77 -48% | 6.53 -67% | 9.1 -133% |
| Colorchecker dE 2000 calibrated * | 1 | 4.7 -370% | 3.3 -230% | 0.86 14% | 0.99 1% | 5 -400% |
| Greyscale dE 2000 * | 2.7 | 2.3 15% | 4.9 -81% | 3.8 -41% | 1.1 59% | 1.7 37% |
| Gamma | 2.2 100% | 2.26 97% | 2.278 97% | 2.14 103% | 2.23 99% | 2.2 100% |
| CCT | 6466 101% | 6310 103% | 7594 86% | 6540 99% | 6502 100% | 6485 100% |
| Całkowita średnia (program / ustawienia) | 8% /
-34% | -26% /
-43% | -3% /
-9% | 34% /
12% | 6% /
-36% |
* ... im mniej tym lepiej
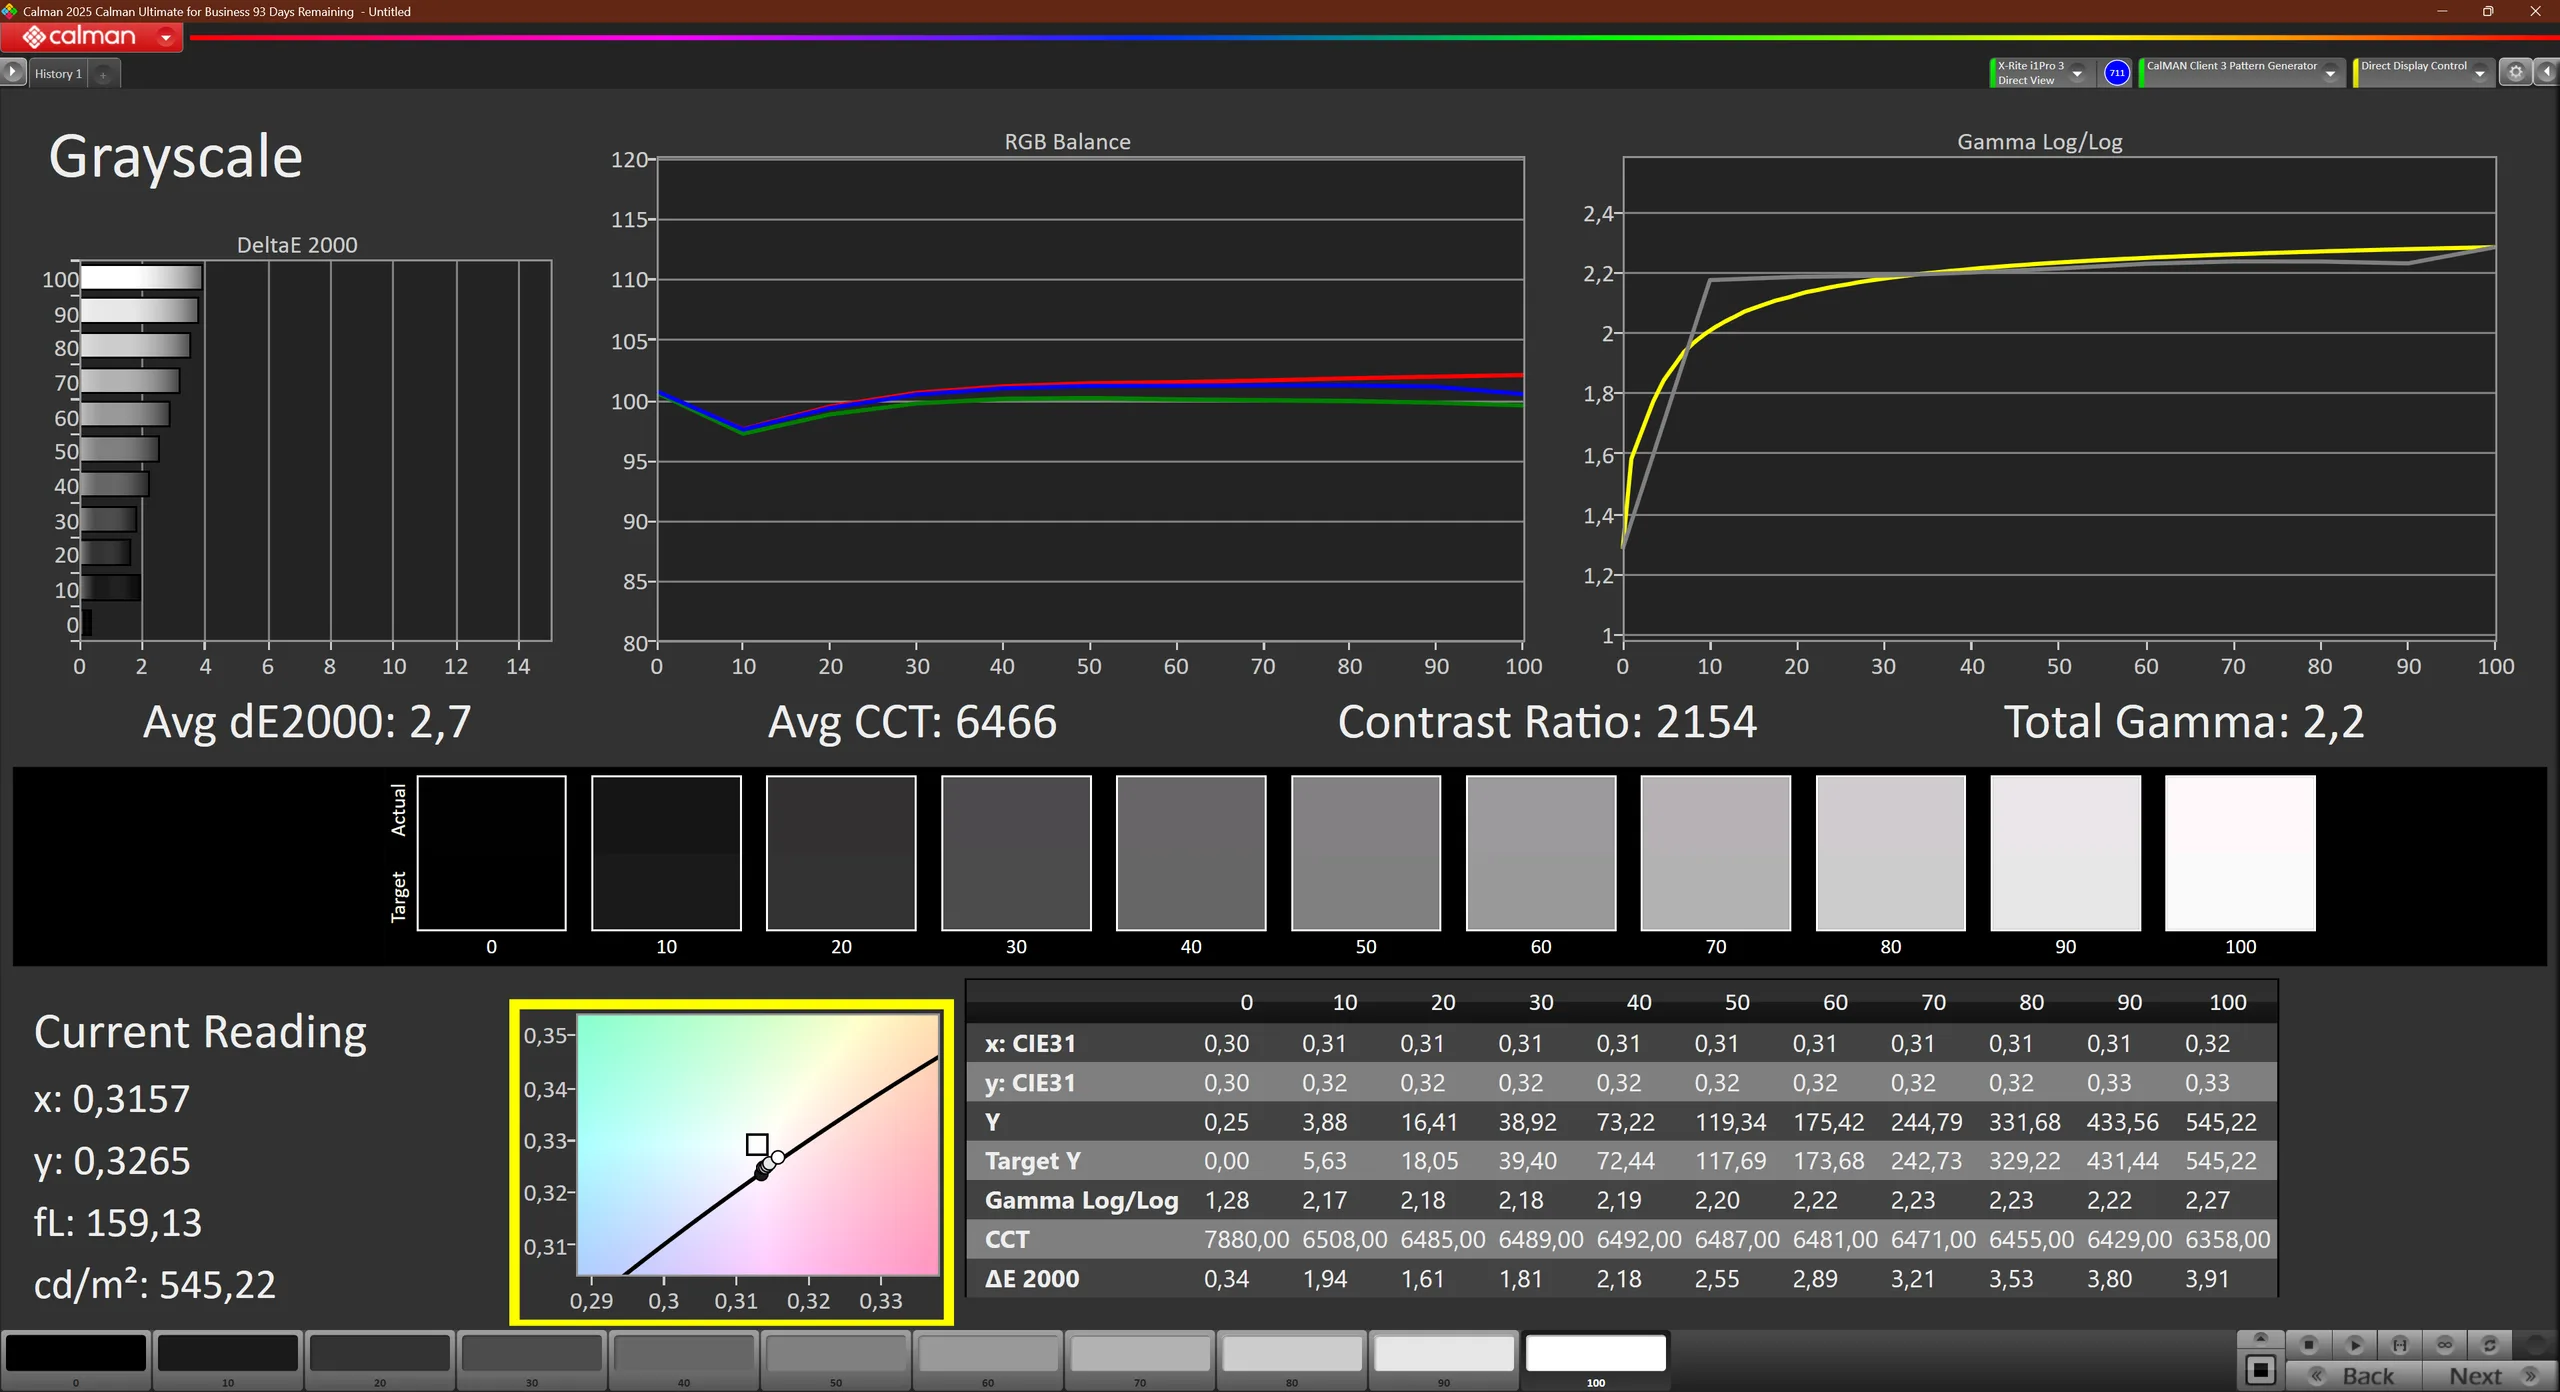
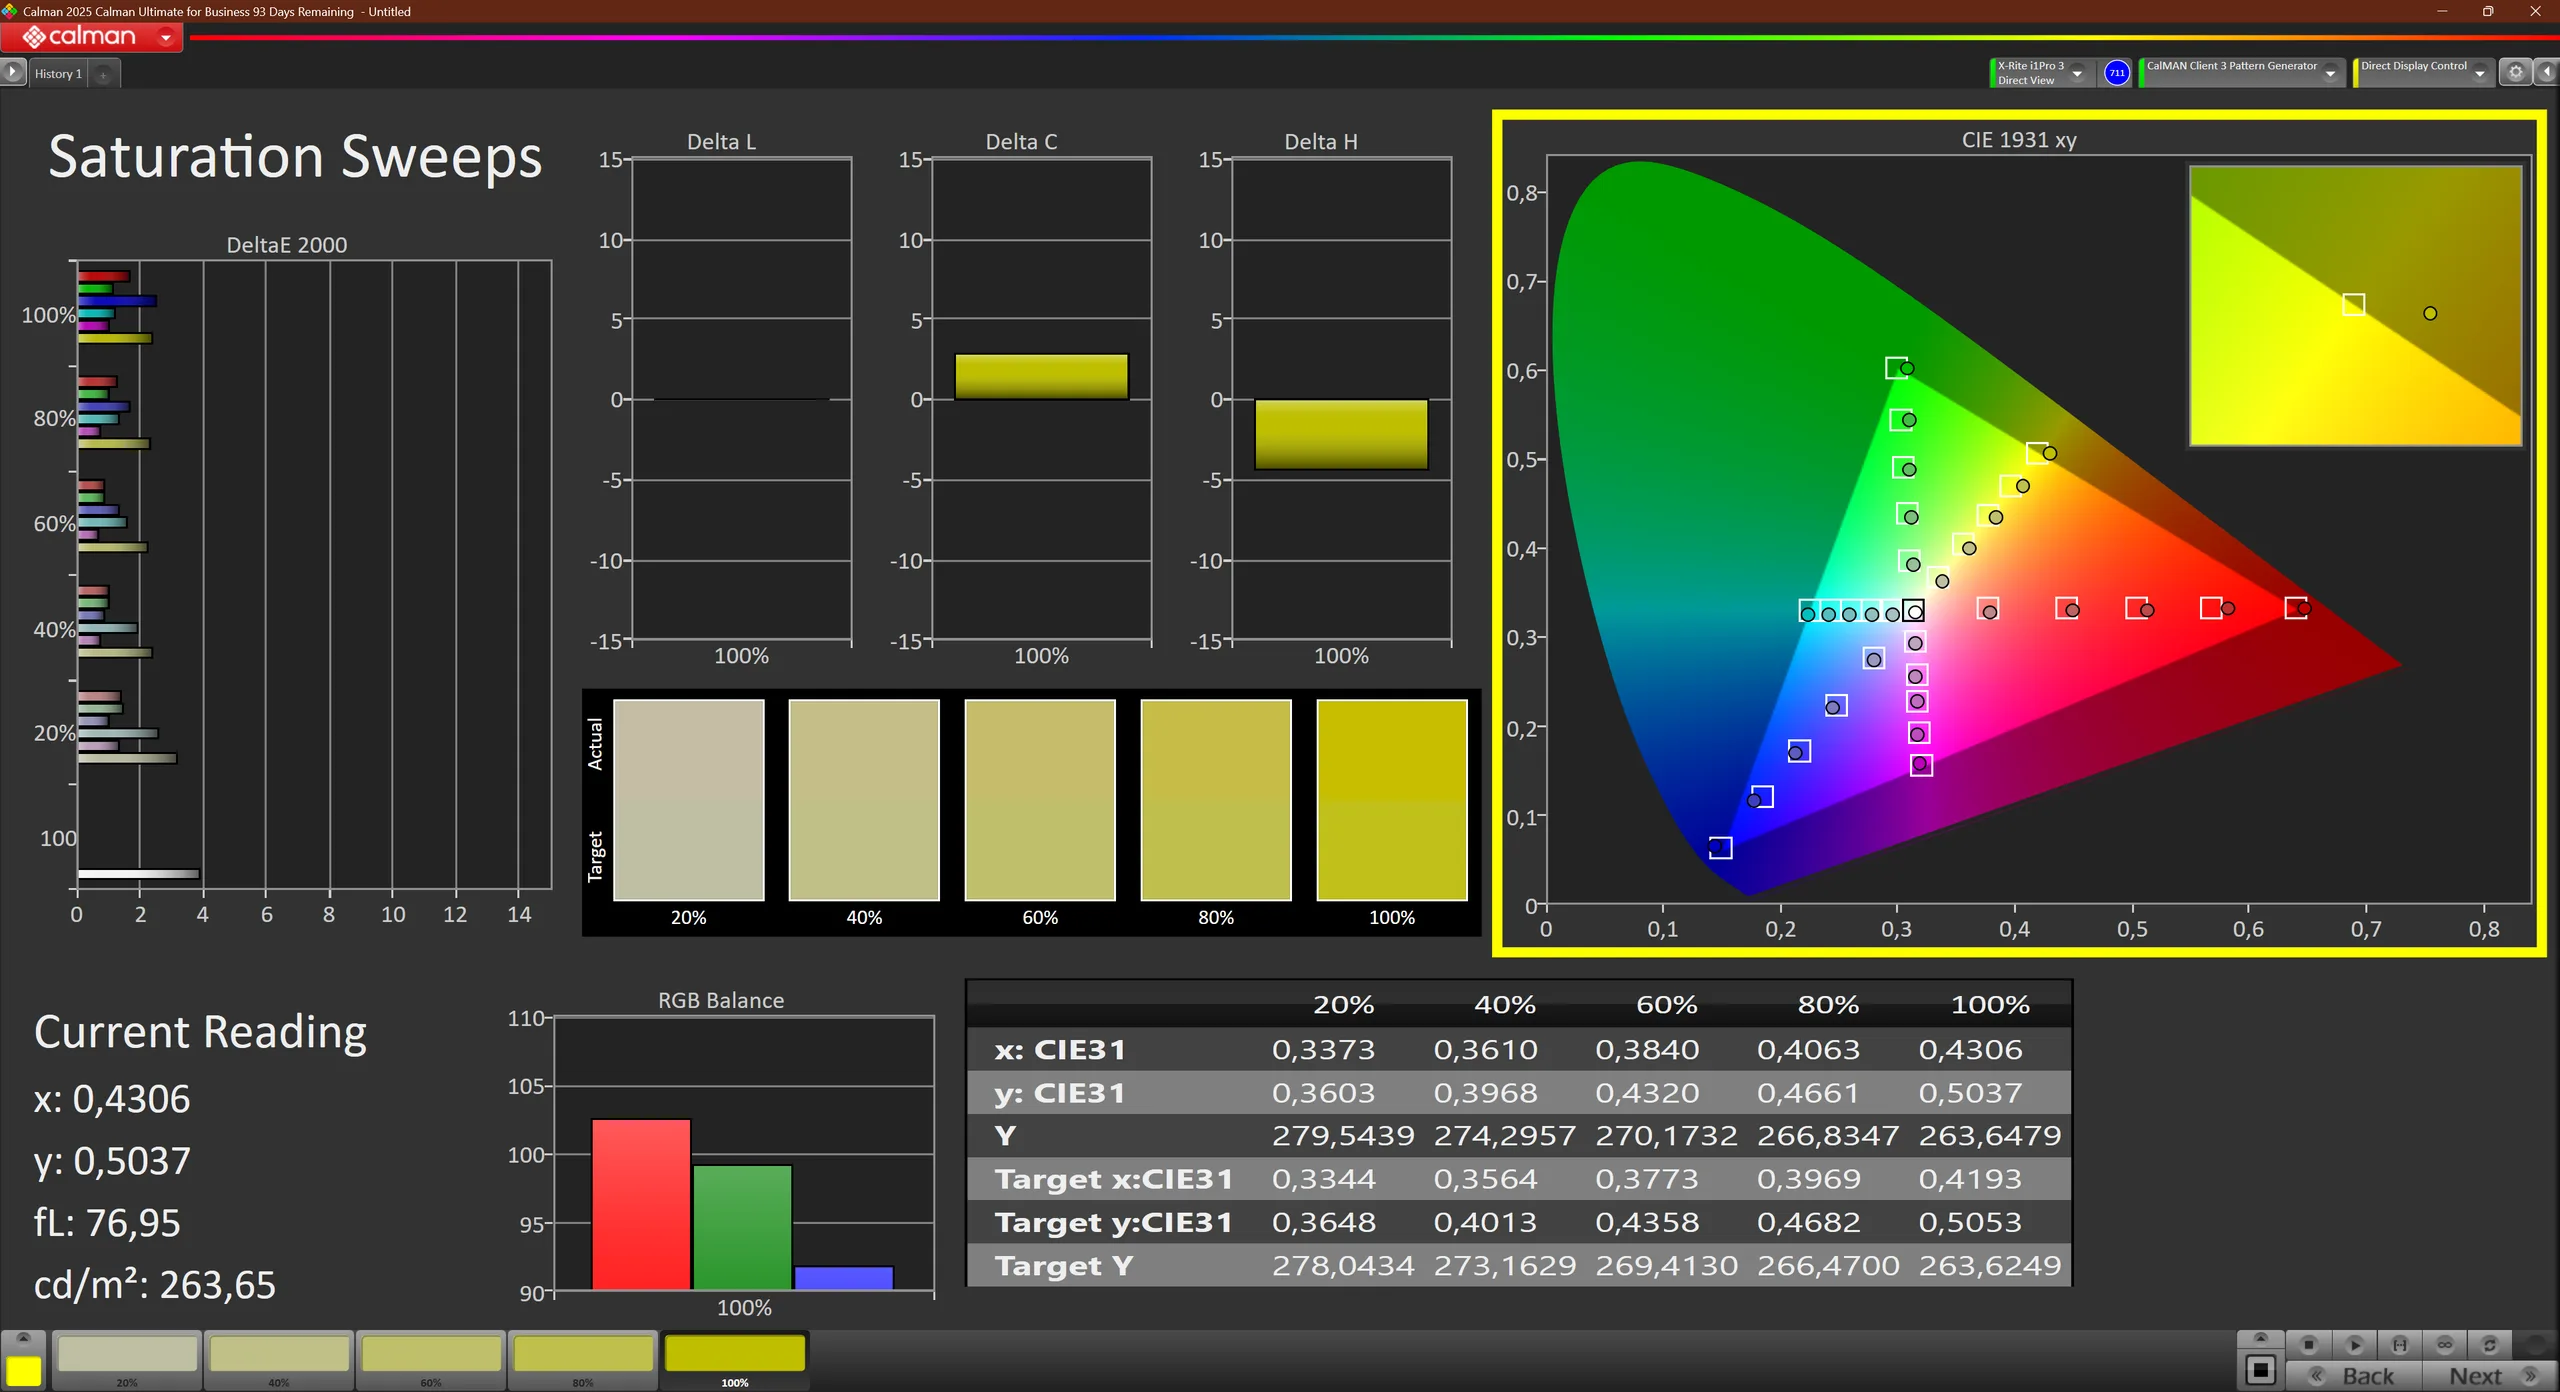


Dokładność odwzorowania kolorów panelu jest dobra, nawet przed kalibracją. Niemal całkowicie pokrywa niewielką gamę kolorów sRGB, dzięki czemu ThinkPad X1 Carbon nadaje się do prostej edycji zdjęć.
Dzięki wysokiej jasności ekranu i matowej powierzchni, korzystanie z ThinkPada X1 Carbon poza biurem jest z pewnością możliwe.

Wyświetl czasy reakcji
| ↔ Czas reakcji od czerni do bieli | ||
|---|---|---|
| 28.6 ms ... wzrost ↗ i spadek ↘ łącznie | ↗ 13.9 ms wzrost | 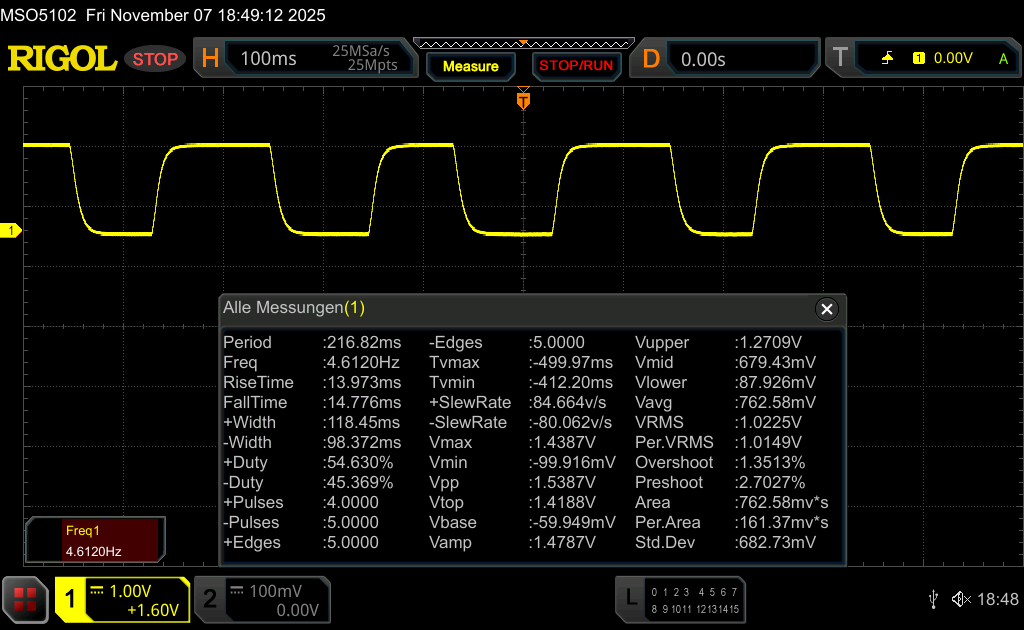 |
| ↘ 14.7 ms upadek | ||
| W naszych testach ekran wykazuje stosunkowo powolne tempo reakcji i może być zbyt wolny dla graczy. Dla porównania, wszystkie testowane urządzenia wahają się od 0.1 (minimum) do 240 (maksimum) ms. » 76 % wszystkich urządzeń jest lepszych. Oznacza to, że zmierzony czas reakcji jest gorszy od średniej wszystkich testowanych urządzeń (19.9 ms). | ||
| ↔ Czas reakcji 50% szarości do 80% szarości | ||
| 43.8 ms ... wzrost ↗ i spadek ↘ łącznie | ↗ 16.6 ms wzrost | 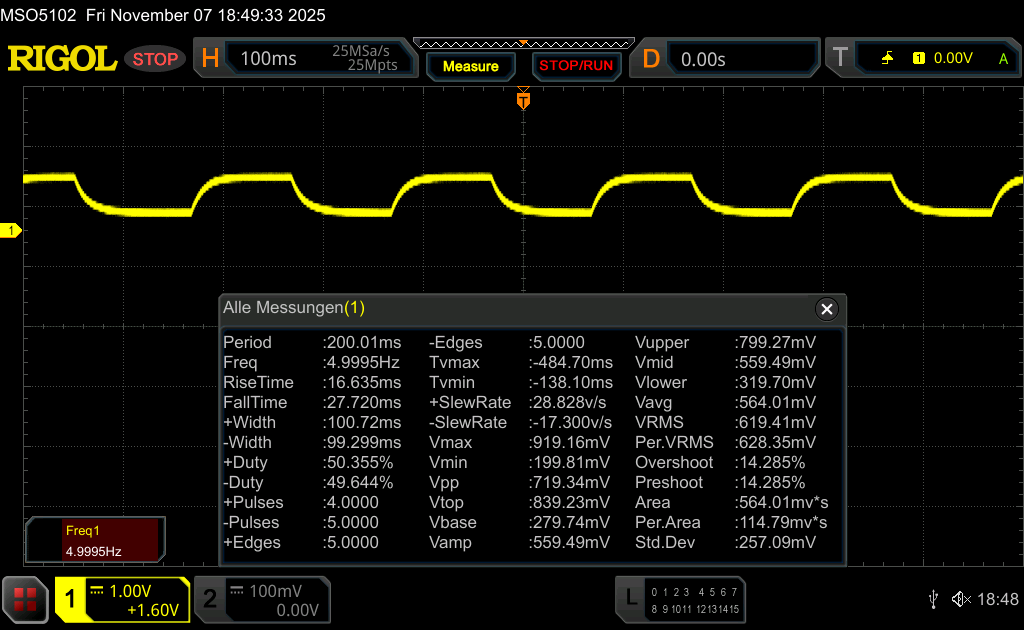 |
| ↘ 27.2 ms upadek | ||
| W naszych testach ekran wykazuje powolne tempo reakcji, co będzie niezadowalające dla graczy. Dla porównania, wszystkie testowane urządzenia wahają się od 0.165 (minimum) do 636 (maksimum) ms. » 73 % wszystkich urządzeń jest lepszych. Oznacza to, że zmierzony czas reakcji jest gorszy od średniej wszystkich testowanych urządzeń (31.1 ms). | ||
Migotanie ekranu / PWM (modulacja szerokości impulsu)
| Migotanie ekranu/nie wykryto PWM |  | ||
Dla porównania: 52 % wszystkich testowanych urządzeń nie używa PWM do przyciemniania wyświetlacza. Jeśli wykryto PWM, zmierzono średnio 7798 (minimum: 5 - maksimum: 343500) Hz. | |||


Wydajność: Arrow Lake zapewnia szybszą wydajność wielordzeniową
Warunki testowania
Profile energetyczne można wybrać w ustawieniach systemu Windows. Profile wpływają na zużycie energii przez procesor, a tym samym na wskaźniki takie jak wydajność, wydzielanie ciepła i żywotność baterii poprzez ustawienie limitów mocy (PL1 = zrównoważony pobór mocy, PL2 = maksymalny pobór mocy):
- Najlepsza żywotność baterii: PL1 10 W / PL2 40 W
- Zrównoważony: PL1 15 W / PL2 45 W
- Najlepsza wydajność: PL1 35 W / PL2 45 W
We wszystkich naszych testach porównawczych zastosowano profil "Najlepsza wydajność".
Procesor
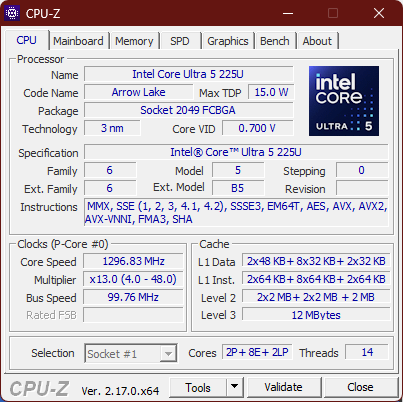
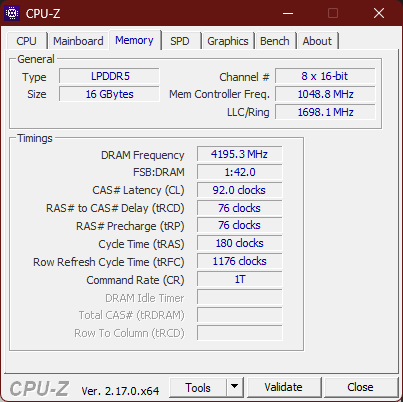
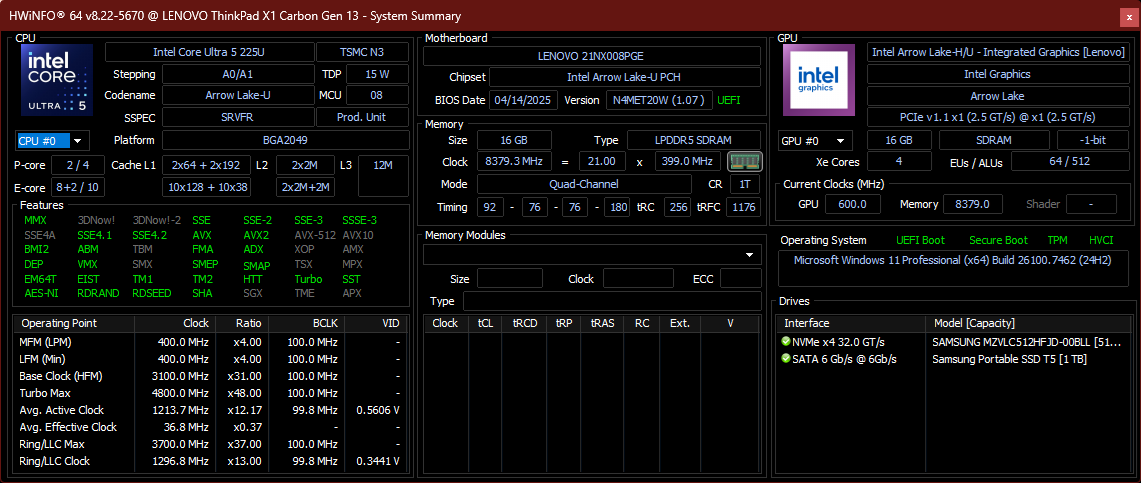
Procesor Intel Core Ultra 5 225U to najbardziej podstawowy procesor z serii U Intel Arrow Lake. Procesor jest odświeżoną wersją Core Ultra Series 1 "Meteor Lake", z dwoma rdzeniami Redwood Cove P (do 4,8 GHz), ośmioma rdzeniami Crestmont E (do 3,8 GHz) i dwoma rdzeniami Crestmont Low-Power E (do 2,4 GHz) - w sumie 12 rdzeni, z 14 wątkami, dzięki hiperwątkowości na dwóch rdzeniach P. Typowy zakres TDP tego procesora wynosi od 15 do 57 W. Nasze Lista procesorów można wykorzystać do porównania go z innymi procesorami.
Limity mocy są znacznie wyższe w tej wersji Arrow Lake w porównaniu do modelu Lunar Lake. Dzięki wyższemu stałemu zużyciu energii wynoszącemu około 35 W zamiast 20 W, 225U X1 jest o około 22 procent szybszy, jeśli chodzi o obciążenia wielordzeniowe. Ta przewaga wydajnościowa nie obejmuje jednak obciążeń jednordzeniowych.
Na zasilaniu bateryjnym wydajność jest nieco mniejsza, o około dwanaście procent (Cinebench R23: 10777 punktów).
Cinebench R15 Multi Loop
Cinebench R23: Multi Core | Single Core
Cinebench R20: CPU (Multi Core) | CPU (Single Core)
Cinebench R15: CPU Multi 64Bit | CPU Single 64Bit
Blender: v2.79 BMW27 CPU
7-Zip 18.03: 7z b 4 | 7z b 4 -mmt1
Geekbench 6.7: Multi-Core | Single-Core
Geekbench 5.5: Multi-Core | Single-Core
HWBOT x265 Benchmark v2.2: 4k Preset
LibreOffice : 20 Documents To PDF
R Benchmark 2.5: Overall mean
| CPU Performance rating | |
| HP EliteBook X G1i 14 AI | |
| Dell Pro 14 Premium | |
| Lenovo ThinkPad X9-14 Gen 1 Aura Edition | |
| Średnia w klasie Subnotebook | |
| Lenovo ThinkPad X1 Carbon Gen 13 21NS0010GE | |
| Lenovo ThinkPad X1 Carbon Gen 13 21NX008PGE | |
| Przeciętny Intel Core Ultra 5 225U | |
| Acer TravelMate P6 TMP614-54-TCO-553Z | |
| Cinebench R23 / Multi Core | |
| Lenovo ThinkPad X1 Carbon Gen 13 21NX008PGE | |
| Średnia w klasie Subnotebook (1555 - 21812, n=61, ostatnie 2 lata) | |
| Przeciętny Intel Core Ultra 5 225U (11612 - 12075, n=2) | |
| HP EliteBook X G1i 14 AI | |
| Dell Pro 14 Premium | |
| Lenovo ThinkPad X9-14 Gen 1 Aura Edition | |
| Lenovo ThinkPad X1 Carbon Gen 13 21NS0010GE | |
| Acer TravelMate P6 TMP614-54-TCO-553Z | |
| Cinebench R23 / Single Core | |
| Dell Pro 14 Premium | |
| Lenovo ThinkPad X1 Carbon Gen 13 21NS0010GE | |
| HP EliteBook X G1i 14 AI | |
| Lenovo ThinkPad X9-14 Gen 1 Aura Edition | |
| Acer TravelMate P6 TMP614-54-TCO-553Z | |
| Lenovo ThinkPad X1 Carbon Gen 13 21NX008PGE | |
| Przeciętny Intel Core Ultra 5 225U (1730 - 1732, n=2) | |
| Średnia w klasie Subnotebook (358 - 2213, n=62, ostatnie 2 lata) | |
| Cinebench R20 / CPU (Multi Core) | |
| Średnia w klasie Subnotebook (579 - 8541, n=58, ostatnie 2 lata) | |
| Lenovo ThinkPad X1 Carbon Gen 13 21NX008PGE | |
| Przeciętny Intel Core Ultra 5 225U (4486 - 4646, n=2) | |
| HP EliteBook X G1i 14 AI | |
| Dell Pro 14 Premium | |
| Lenovo ThinkPad X9-14 Gen 1 Aura Edition | |
| Lenovo ThinkPad X1 Carbon Gen 13 21NS0010GE | |
| Acer TravelMate P6 TMP614-54-TCO-553Z | |
| Cinebench R20 / CPU (Single Core) | |
| Dell Pro 14 Premium | |
| Lenovo ThinkPad X1 Carbon Gen 13 21NS0010GE | |
| HP EliteBook X G1i 14 AI | |
| Lenovo ThinkPad X9-14 Gen 1 Aura Edition | |
| Przeciętny Intel Core Ultra 5 225U (668 - 669, n=2) | |
| Acer TravelMate P6 TMP614-54-TCO-553Z | |
| Lenovo ThinkPad X1 Carbon Gen 13 21NX008PGE | |
| Średnia w klasie Subnotebook (128 - 832, n=58, ostatnie 2 lata) | |
| Cinebench R15 / CPU Multi 64Bit | |
| Średnia w klasie Subnotebook (327 - 3345, n=58, ostatnie 2 lata) | |
| Lenovo ThinkPad X1 Carbon Gen 13 21NX008PGE | |
| Przeciętny Intel Core Ultra 5 225U (1897 - 1909, n=2) | |
| Lenovo ThinkPad X9-14 Gen 1 Aura Edition | |
| HP EliteBook X G1i 14 AI | |
| Dell Pro 14 Premium | |
| Lenovo ThinkPad X1 Carbon Gen 13 21NS0010GE | |
| Acer TravelMate P6 TMP614-54-TCO-553Z | |
| Cinebench R15 / CPU Single 64Bit | |
| Lenovo ThinkPad X1 Carbon Gen 13 21NS0010GE | |
| Lenovo ThinkPad X9-14 Gen 1 Aura Edition | |
| Dell Pro 14 Premium | |
| HP EliteBook X G1i 14 AI | |
| Acer TravelMate P6 TMP614-54-TCO-553Z | |
| Średnia w klasie Subnotebook (72.4 - 322, n=58, ostatnie 2 lata) | |
| Lenovo ThinkPad X1 Carbon Gen 13 21NX008PGE | |
| Przeciętny Intel Core Ultra 5 225U (245 - 249, n=2) | |
| Blender / v2.79 BMW27 CPU | |
| Średnia w klasie Subnotebook (159 - 2271, n=59, ostatnie 2 lata) | |
| Lenovo ThinkPad X1 Carbon Gen 13 21NS0010GE | |
| Acer TravelMate P6 TMP614-54-TCO-553Z | |
| Lenovo ThinkPad X9-14 Gen 1 Aura Edition | |
| Dell Pro 14 Premium | |
| HP EliteBook X G1i 14 AI | |
| Przeciętny Intel Core Ultra 5 225U (284 - 292, n=2) | |
| Lenovo ThinkPad X1 Carbon Gen 13 21NX008PGE | |
| 7-Zip 18.03 / 7z b 4 | |
| Lenovo ThinkPad X1 Carbon Gen 13 21NX008PGE | |
| Przeciętny Intel Core Ultra 5 225U (42793 - 45818, n=2) | |
| Średnia w klasie Subnotebook (11668 - 77867, n=58, ostatnie 2 lata) | |
| Dell Pro 14 Premium | |
| Lenovo ThinkPad X1 Carbon Gen 13 21NS0010GE | |
| HP EliteBook X G1i 14 AI | |
| Lenovo ThinkPad X9-14 Gen 1 Aura Edition | |
| Acer TravelMate P6 TMP614-54-TCO-553Z | |
| 7-Zip 18.03 / 7z b 4 -mmt1 | |
| Lenovo ThinkPad X1 Carbon Gen 13 21NS0010GE | |
| Lenovo ThinkPad X9-14 Gen 1 Aura Edition | |
| HP EliteBook X G1i 14 AI | |
| Dell Pro 14 Premium | |
| Średnia w klasie Subnotebook (2643 - 6699, n=60, ostatnie 2 lata) | |
| Acer TravelMate P6 TMP614-54-TCO-553Z | |
| Przeciętny Intel Core Ultra 5 225U (5031 - 5133, n=2) | |
| Lenovo ThinkPad X1 Carbon Gen 13 21NX008PGE | |
| Geekbench 6.7 / Multi-Core | |
| Średnia w klasie Subnotebook (2244 - 20325, n=64, ostatnie 2 lata) | |
| Lenovo ThinkPad X9-14 Gen 1 Aura Edition | |
| HP EliteBook X G1i 14 AI | |
| Lenovo ThinkPad X1 Carbon Gen 13 21NS0010GE | |
| Dell Pro 14 Premium | |
| Lenovo ThinkPad X1 Carbon Gen 13 21NX008PGE | |
| Przeciętny Intel Core Ultra 5 225U (9276 - 10497, n=2) | |
| Acer TravelMate P6 TMP614-54-TCO-553Z | |
| Geekbench 6.7 / Single-Core | |
| HP EliteBook X G1i 14 AI | |
| Dell Pro 14 Premium | |
| Lenovo ThinkPad X9-14 Gen 1 Aura Edition | |
| Średnia w klasie Subnotebook (960 - 4195, n=63, ostatnie 2 lata) | |
| Lenovo ThinkPad X1 Carbon Gen 13 21NS0010GE | |
| Acer TravelMate P6 TMP614-54-TCO-553Z | |
| Acer TravelMate P6 TMP614-54-TCO-553Z | |
| Przeciętny Intel Core Ultra 5 225U (2355 - 2390, n=2) | |
| Lenovo ThinkPad X1 Carbon Gen 13 21NX008PGE | |
| Geekbench 5.5 / Multi-Core | |
| Średnia w klasie Subnotebook (2557 - 17218, n=49, ostatnie 2 lata) | |
| HP EliteBook X G1i 14 AI | |
| Lenovo ThinkPad X1 Carbon Gen 13 21NX008PGE | |
| Lenovo ThinkPad X1 Carbon Gen 13 21NS0010GE | |
| Dell Pro 14 Premium | |
| Lenovo ThinkPad X9-14 Gen 1 Aura Edition | |
| Przeciętny Intel Core Ultra 5 225U (8738 - 9795, n=2) | |
| Acer TravelMate P6 TMP614-54-TCO-553Z | |
| Geekbench 5.5 / Single-Core | |
| HP EliteBook X G1i 14 AI | |
| Lenovo ThinkPad X1 Carbon Gen 13 21NS0010GE | |
| Lenovo ThinkPad X9-14 Gen 1 Aura Edition | |
| Dell Pro 14 Premium | |
| Średnia w klasie Subnotebook (726 - 2224, n=49, ostatnie 2 lata) | |
| Acer TravelMate P6 TMP614-54-TCO-553Z | |
| Przeciętny Intel Core Ultra 5 225U (1744 - 1779, n=2) | |
| Lenovo ThinkPad X1 Carbon Gen 13 21NX008PGE | |
| HWBOT x265 Benchmark v2.2 / 4k Preset | |
| HP EliteBook X G1i 14 AI | |
| Dell Pro 14 Premium | |
| Lenovo ThinkPad X1 Carbon Gen 13 21NX008PGE | |
| Przeciętny Intel Core Ultra 5 225U (12.8 - 13.2, n=2) | |
| Średnia w klasie Subnotebook (0.97 - 25.1, n=58, ostatnie 2 lata) | |
| Lenovo ThinkPad X9-14 Gen 1 Aura Edition | |
| Lenovo ThinkPad X1 Carbon Gen 13 21NS0010GE | |
| Acer TravelMate P6 TMP614-54-TCO-553Z | |
| LibreOffice / 20 Documents To PDF | |
| Acer TravelMate P6 TMP614-54-TCO-553Z | |
| Lenovo ThinkPad X1 Carbon Gen 13 21NX008PGE | |
| Średnia w klasie Subnotebook (39.9 - 220, n=57, ostatnie 2 lata) | |
| Przeciętny Intel Core Ultra 5 225U (46.3 - 60.9, n=2) | |
| HP EliteBook X G1i 14 AI | |
| Lenovo ThinkPad X1 Carbon Gen 13 21NS0010GE | |
| Dell Pro 14 Premium | |
| Lenovo ThinkPad X9-14 Gen 1 Aura Edition | |
| R Benchmark 2.5 / Overall mean | |
| Średnia w klasie Subnotebook (0.4024 - 1.456, n=59, ostatnie 2 lata) | |
| Lenovo ThinkPad X1 Carbon Gen 13 21NX008PGE | |
| Przeciętny Intel Core Ultra 5 225U (0.4952 - 0.507, n=2) | |
| Acer TravelMate P6 TMP614-54-TCO-553Z | |
| Lenovo ThinkPad X9-14 Gen 1 Aura Edition | |
| Lenovo ThinkPad X1 Carbon Gen 13 21NS0010GE | |
| HP EliteBook X G1i 14 AI | |
| Dell Pro 14 Premium | |
* ... im mniej tym lepiej
AIDA64: FP32 Ray-Trace | FPU Julia | CPU SHA3 | CPU Queen | FPU SinJulia | FPU Mandel | CPU AES | CPU ZLib | FP64 Ray-Trace | CPU PhotoWorxx
| Performance rating | |
| Średnia w klasie Subnotebook | |
| Lenovo ThinkPad X1 Carbon Gen 13 21NX008PGE | |
| HP EliteBook X G1i 14 AI | |
| Dell Pro 14 Premium | |
| Przeciętny Intel Core Ultra 5 225U | |
| Lenovo ThinkPad X9-14 Gen 1 Aura Edition | |
| Acer TravelMate P6 TMP614-54-TCO-553Z | |
| Lenovo ThinkPad X1 Carbon Gen 13 21NS0010GE | |
| AIDA64 / FP32 Ray-Trace | |
| Średnia w klasie Subnotebook (1135 - 32888, n=59, ostatnie 2 lata) | |
| HP EliteBook X G1i 14 AI | |
| Dell Pro 14 Premium | |
| Acer TravelMate P6 TMP614-54-TCO-553Z | |
| Lenovo ThinkPad X9-14 Gen 1 Aura Edition | |
| Lenovo ThinkPad X1 Carbon Gen 13 21NX008PGE | |
| Przeciętny Intel Core Ultra 5 225U (10295 - 10317, n=2) | |
| Lenovo ThinkPad X1 Carbon Gen 13 21NS0010GE | |
| AIDA64 / FPU Julia | |
| HP EliteBook X G1i 14 AI | |
| Dell Pro 14 Premium | |
| Średnia w klasie Subnotebook (5218 - 123315, n=59, ostatnie 2 lata) | |
| Acer TravelMate P6 TMP614-54-TCO-553Z | |
| Lenovo ThinkPad X1 Carbon Gen 13 21NS0010GE | |
| Lenovo ThinkPad X9-14 Gen 1 Aura Edition | |
| Lenovo ThinkPad X1 Carbon Gen 13 21NX008PGE | |
| Przeciętny Intel Core Ultra 5 225U (52424 - 53982, n=2) | |
| AIDA64 / CPU SHA3 | |
| Lenovo ThinkPad X1 Carbon Gen 13 21NX008PGE | |
| Średnia w klasie Subnotebook (444 - 5287, n=59, ostatnie 2 lata) | |
| Przeciętny Intel Core Ultra 5 225U (2810 - 3068, n=2) | |
| HP EliteBook X G1i 14 AI | |
| Dell Pro 14 Premium | |
| Lenovo ThinkPad X1 Carbon Gen 13 21NS0010GE | |
| Lenovo ThinkPad X9-14 Gen 1 Aura Edition | |
| Acer TravelMate P6 TMP614-54-TCO-553Z | |
| AIDA64 / CPU Queen | |
| Średnia w klasie Subnotebook (10579 - 95002, n=52, ostatnie 2 lata) | |
| Lenovo ThinkPad X1 Carbon Gen 13 21NX008PGE | |
| Przeciętny Intel Core Ultra 5 225U (52927 - 53793, n=2) | |
| Lenovo ThinkPad X1 Carbon Gen 13 21NS0010GE | |
| Lenovo ThinkPad X9-14 Gen 1 Aura Edition | |
| Dell Pro 14 Premium | |
| HP EliteBook X G1i 14 AI | |
| Acer TravelMate P6 TMP614-54-TCO-553Z | |
| AIDA64 / FPU SinJulia | |
| Średnia w klasie Subnotebook (744 - 18418, n=59, ostatnie 2 lata) | |
| Przeciętny Intel Core Ultra 5 225U (6157 - 6220, n=2) | |
| Lenovo ThinkPad X1 Carbon Gen 13 21NX008PGE | |
| Lenovo ThinkPad X9-14 Gen 1 Aura Edition | |
| Dell Pro 14 Premium | |
| HP EliteBook X G1i 14 AI | |
| Lenovo ThinkPad X1 Carbon Gen 13 21NS0010GE | |
| Acer TravelMate P6 TMP614-54-TCO-553Z | |
| AIDA64 / FPU Mandel | |
| HP EliteBook X G1i 14 AI | |
| Dell Pro 14 Premium | |
| Acer TravelMate P6 TMP614-54-TCO-553Z | |
| Średnia w klasie Subnotebook (3341 - 65433, n=59, ostatnie 2 lata) | |
| Lenovo ThinkPad X1 Carbon Gen 13 21NS0010GE | |
| Lenovo ThinkPad X9-14 Gen 1 Aura Edition | |
| Lenovo ThinkPad X1 Carbon Gen 13 21NX008PGE | |
| Przeciętny Intel Core Ultra 5 225U (26094 - 26381, n=2) | |
| AIDA64 / CPU AES | |
| Lenovo ThinkPad X1 Carbon Gen 13 21NX008PGE | |
| Przeciętny Intel Core Ultra 5 225U (52738 - 53639, n=2) | |
| Średnia w klasie Subnotebook (638 - 96917, n=59, ostatnie 2 lata) | |
| Lenovo ThinkPad X9-14 Gen 1 Aura Edition | |
| Dell Pro 14 Premium | |
| HP EliteBook X G1i 14 AI | |
| Lenovo ThinkPad X1 Carbon Gen 13 21NS0010GE | |
| Acer TravelMate P6 TMP614-54-TCO-553Z | |
| AIDA64 / CPU ZLib | |
| Przeciętny Intel Core Ultra 5 225U (861 - 882, n=2) | |
| Lenovo ThinkPad X1 Carbon Gen 13 21NX008PGE | |
| Średnia w klasie Subnotebook (164.9 - 1379, n=59, ostatnie 2 lata) | |
| HP EliteBook X G1i 14 AI | |
| Dell Pro 14 Premium | |
| Lenovo ThinkPad X1 Carbon Gen 13 21NS0010GE | |
| Lenovo ThinkPad X9-14 Gen 1 Aura Edition | |
| Acer TravelMate P6 TMP614-54-TCO-553Z | |
| AIDA64 / FP64 Ray-Trace | |
| Średnia w klasie Subnotebook (610 - 17495, n=59, ostatnie 2 lata) | |
| HP EliteBook X G1i 14 AI | |
| Dell Pro 14 Premium | |
| Acer TravelMate P6 TMP614-54-TCO-553Z | |
| Lenovo ThinkPad X9-14 Gen 1 Aura Edition | |
| Lenovo ThinkPad X1 Carbon Gen 13 21NX008PGE | |
| Przeciętny Intel Core Ultra 5 225U (5272 - 5475, n=2) | |
| Lenovo ThinkPad X1 Carbon Gen 13 21NS0010GE | |
| AIDA64 / CPU PhotoWorxx | |
| HP EliteBook X G1i 14 AI | |
| Dell Pro 14 Premium | |
| Lenovo ThinkPad X1 Carbon Gen 13 21NS0010GE | |
| Lenovo ThinkPad X1 Carbon Gen 13 21NX008PGE | |
| Lenovo ThinkPad X9-14 Gen 1 Aura Edition | |
| Acer TravelMate P6 TMP614-54-TCO-553Z | |
| Średnia w klasie Subnotebook (6569 - 85600, n=59, ostatnie 2 lata) | |
| Przeciętny Intel Core Ultra 5 225U (24639 - 54368, n=2) | |
Wydajność systemu
PCMark 10: Score | Essentials | Productivity | Digital Content Creation
CrossMark: Overall | Productivity | Creativity | Responsiveness
WebXPRT 3: Overall
WebXPRT 4: Overall
Mozilla Kraken 1.1: Total
| Performance rating | |
| Dell Pro 14 Premium | |
| Lenovo ThinkPad X1 Carbon Gen 13 21NS0010GE -1! | |
| Lenovo ThinkPad X9-14 Gen 1 Aura Edition -1! | |
| HP EliteBook X G1i 14 AI | |
| Średnia w klasie Subnotebook | |
| Acer TravelMate P6 TMP614-54-TCO-553Z | |
| Przeciętny Intel Core Ultra 5 225U, Intel Graphics 4-Core iGPU (Meteor / Arrow Lake) | |
| Lenovo ThinkPad X1 Carbon Gen 13 21NX008PGE | |
| PCMark 10 / Score | |
| Dell Pro 14 Premium | |
| HP EliteBook X G1i 14 AI | |
| Lenovo ThinkPad X9-14 Gen 1 Aura Edition | |
| Lenovo ThinkPad X1 Carbon Gen 13 21NS0010GE | |
| Średnia w klasie Subnotebook (4920 - 9939, n=45, ostatnie 2 lata) | |
| Acer TravelMate P6 TMP614-54-TCO-553Z | |
| Lenovo ThinkPad X1 Carbon Gen 13 21NX008PGE | |
| Przeciętny Intel Core Ultra 5 225U, Intel Graphics 4-Core iGPU (Meteor / Arrow Lake) (6156 - 6204, n=2) | |
| PCMark 10 / Essentials | |
| Lenovo ThinkPad X9-14 Gen 1 Aura Edition | |
| Lenovo ThinkPad X1 Carbon Gen 13 21NS0010GE | |
| Dell Pro 14 Premium | |
| HP EliteBook X G1i 14 AI | |
| Średnia w klasie Subnotebook (8552 - 11646, n=45, ostatnie 2 lata) | |
| Lenovo ThinkPad X1 Carbon Gen 13 21NX008PGE | |
| Przeciętny Intel Core Ultra 5 225U, Intel Graphics 4-Core iGPU (Meteor / Arrow Lake) (10004 - 10061, n=2) | |
| Acer TravelMate P6 TMP614-54-TCO-553Z | |
| PCMark 10 / Productivity | |
| Średnia w klasie Subnotebook (5435 - 16606, n=45, ostatnie 2 lata) | |
| Dell Pro 14 Premium | |
| Lenovo ThinkPad X9-14 Gen 1 Aura Edition | |
| HP EliteBook X G1i 14 AI | |
| Lenovo ThinkPad X1 Carbon Gen 13 21NS0010GE | |
| Acer TravelMate P6 TMP614-54-TCO-553Z | |
| Lenovo ThinkPad X1 Carbon Gen 13 21NX008PGE | |
| Przeciętny Intel Core Ultra 5 225U, Intel Graphics 4-Core iGPU (Meteor / Arrow Lake) (8354 - 8623, n=2) | |
| PCMark 10 / Digital Content Creation | |
| HP EliteBook X G1i 14 AI | |
| Dell Pro 14 Premium | |
| Lenovo ThinkPad X1 Carbon Gen 13 21NS0010GE | |
| Lenovo ThinkPad X9-14 Gen 1 Aura Edition | |
| Średnia w klasie Subnotebook (5722 - 13779, n=45, ostatnie 2 lata) | |
| Acer TravelMate P6 TMP614-54-TCO-553Z | |
| Przeciętny Intel Core Ultra 5 225U, Intel Graphics 4-Core iGPU (Meteor / Arrow Lake) (7471 - 7574, n=2) | |
| Lenovo ThinkPad X1 Carbon Gen 13 21NX008PGE | |
| CrossMark / Overall | |
| Dell Pro 14 Premium | |
| Lenovo ThinkPad X1 Carbon Gen 13 21NS0010GE | |
| Lenovo ThinkPad X9-14 Gen 1 Aura Edition | |
| HP EliteBook X G1i 14 AI | |
| Średnia w klasie Subnotebook (365 - 2356, n=61, ostatnie 2 lata) | |
| Lenovo ThinkPad X1 Carbon Gen 13 21NX008PGE | |
| Przeciętny Intel Core Ultra 5 225U, Intel Graphics 4-Core iGPU (Meteor / Arrow Lake) (1494 - 1584, n=2) | |
| Acer TravelMate P6 TMP614-54-TCO-553Z | |
| CrossMark / Productivity | |
| Dell Pro 14 Premium | |
| Lenovo ThinkPad X9-14 Gen 1 Aura Edition | |
| Lenovo ThinkPad X1 Carbon Gen 13 21NS0010GE | |
| HP EliteBook X G1i 14 AI | |
| Średnia w klasie Subnotebook (364 - 2277, n=61, ostatnie 2 lata) | |
| Lenovo ThinkPad X1 Carbon Gen 13 21NX008PGE | |
| Przeciętny Intel Core Ultra 5 225U, Intel Graphics 4-Core iGPU (Meteor / Arrow Lake) (1495 - 1509, n=2) | |
| Acer TravelMate P6 TMP614-54-TCO-553Z | |
| CrossMark / Creativity | |
| Dell Pro 14 Premium | |
| Lenovo ThinkPad X1 Carbon Gen 13 21NS0010GE | |
| Lenovo ThinkPad X9-14 Gen 1 Aura Edition | |
| HP EliteBook X G1i 14 AI | |
| Średnia w klasie Subnotebook (372 - 2743, n=61, ostatnie 2 lata) | |
| Lenovo ThinkPad X1 Carbon Gen 13 21NX008PGE | |
| Acer TravelMate P6 TMP614-54-TCO-553Z | |
| Przeciętny Intel Core Ultra 5 225U, Intel Graphics 4-Core iGPU (Meteor / Arrow Lake) (1574 - 1759, n=2) | |
| CrossMark / Responsiveness | |
| Średnia w klasie Subnotebook (312 - 1854, n=61, ostatnie 2 lata) | |
| Lenovo ThinkPad X1 Carbon Gen 13 21NX008PGE | |
| Lenovo ThinkPad X1 Carbon Gen 13 21NS0010GE | |
| Dell Pro 14 Premium | |
| Przeciętny Intel Core Ultra 5 225U, Intel Graphics 4-Core iGPU (Meteor / Arrow Lake) (1279 - 1339, n=2) | |
| Lenovo ThinkPad X9-14 Gen 1 Aura Edition | |
| HP EliteBook X G1i 14 AI | |
| Acer TravelMate P6 TMP614-54-TCO-553Z | |
| WebXPRT 3 / Overall | |
| Średnia w klasie Subnotebook (156 - 530, n=57, ostatnie 2 lata) | |
| Dell Pro 14 Premium | |
| HP EliteBook X G1i 14 AI | |
| Acer TravelMate P6 TMP614-54-TCO-553Z | |
| Przeciętny Intel Core Ultra 5 225U, Intel Graphics 4-Core iGPU (Meteor / Arrow Lake) (262 - 285, n=2) | |
| Lenovo ThinkPad X1 Carbon Gen 13 21NX008PGE | |
| WebXPRT 4 / Overall | |
| Dell Pro 14 Premium | |
| Lenovo ThinkPad X9-14 Gen 1 Aura Edition | |
| Lenovo ThinkPad X1 Carbon Gen 13 21NS0010GE | |
| HP EliteBook X G1i 14 AI | |
| Średnia w klasie Subnotebook (132 - 378, n=62, ostatnie 2 lata) | |
| Acer TravelMate P6 TMP614-54-TCO-553Z | |
| Przeciętny Intel Core Ultra 5 225U, Intel Graphics 4-Core iGPU (Meteor / Arrow Lake) (232 - 258, n=2) | |
| Lenovo ThinkPad X1 Carbon Gen 13 21NX008PGE | |
| Mozilla Kraken 1.1 / Total | |
| Lenovo ThinkPad X1 Carbon Gen 13 21NX008PGE | |
| Przeciętny Intel Core Ultra 5 225U, Intel Graphics 4-Core iGPU (Meteor / Arrow Lake) (519 - 571, n=2) | |
| Acer TravelMate P6 TMP614-54-TCO-553Z | |
| Średnia w klasie Subnotebook (234 - 1104, n=62, ostatnie 2 lata) | |
| HP EliteBook X G1i 14 AI | |
| Lenovo ThinkPad X1 Carbon Gen 13 21NS0010GE | |
| Lenovo ThinkPad X9-14 Gen 1 Aura Edition | |
| Dell Pro 14 Premium | |
* ... im mniej tym lepiej
| PCMark 10 Score | 6204 pkt. | |
Pomoc | ||
| AIDA64 / Memory Copy | |
| Lenovo ThinkPad X1 Carbon Gen 13 21NS0010GE | |
| Lenovo ThinkPad X9-14 Gen 1 Aura Edition | |
| Dell Pro 14 Premium | |
| HP EliteBook X G1i 14 AI | |
| Acer TravelMate P6 TMP614-54-TCO-553Z | |
| Lenovo ThinkPad X1 Carbon Gen 13 21NX008PGE | |
| Średnia w klasie Subnotebook (14554 - 131023, n=59, ostatnie 2 lata) | |
| Przeciętny Intel Core Ultra 5 225U (36358 - 89955, n=2) | |
| AIDA64 / Memory Read | |
| Dell Pro 14 Premium | |
| Lenovo ThinkPad X1 Carbon Gen 13 21NS0010GE | |
| Lenovo ThinkPad X9-14 Gen 1 Aura Edition | |
| HP EliteBook X G1i 14 AI | |
| Średnia w klasie Subnotebook (15948 - 127174, n=59, ostatnie 2 lata) | |
| Acer TravelMate P6 TMP614-54-TCO-553Z | |
| Lenovo ThinkPad X1 Carbon Gen 13 21NX008PGE | |
| Przeciętny Intel Core Ultra 5 225U (42106 - 75257, n=2) | |
| AIDA64 / Memory Write | |
| Lenovo ThinkPad X1 Carbon Gen 13 21NS0010GE | |
| Lenovo ThinkPad X9-14 Gen 1 Aura Edition | |
| Dell Pro 14 Premium | |
| Acer TravelMate P6 TMP614-54-TCO-553Z | |
| HP EliteBook X G1i 14 AI | |
| Średnia w klasie Subnotebook (15709 - 135141, n=59, ostatnie 2 lata) | |
| Lenovo ThinkPad X1 Carbon Gen 13 21NX008PGE | |
| Przeciętny Intel Core Ultra 5 225U (38213 - 69271, n=2) | |
| AIDA64 / Memory Latency | |
| Lenovo ThinkPad X1 Carbon Gen 13 21NX008PGE | |
| Przeciętny Intel Core Ultra 5 225U (124.3 - 134.2, n=2) | |
| Dell Pro 14 Premium | |
| HP EliteBook X G1i 14 AI | |
| Lenovo ThinkPad X9-14 Gen 1 Aura Edition | |
| Lenovo ThinkPad X1 Carbon Gen 13 21NS0010GE | |
| Acer TravelMate P6 TMP614-54-TCO-553Z | |
| Średnia w klasie Subnotebook (6.1 - 159.9, n=57, ostatnie 2 lata) | |
* ... im mniej tym lepiej
Opóźnienie DPC


| DPC Latencies / LatencyMon - interrupt to process latency (max), Web, Youtube, Prime95 | |
| Dell Pro 14 Premium | |
| Lenovo ThinkPad X1 Carbon Gen 13 21NX008PGE | |
| Acer TravelMate P6 TMP614-54-TCO-553Z | |
| Lenovo ThinkPad X1 Carbon Gen 13 21NS0010GE | |
| Lenovo ThinkPad X9-14 Gen 1 Aura Edition | |
| HP EliteBook X G1i 14 AI | |
* ... im mniej tym lepiej
Urządzenia pamięci masowej
Lenovo wykorzystuje dysk SSD NVMe PCIe 5.0 w ThinkPadzie X1 Carbon Gen 13. Jednak ten model ThinkPada ogranicza M.2 2280 Samsung PM9E1 (pojemność 512 GB) z prędkością PCIe 4.0, ponieważ Arrow Lake U nie obsługuje nowszego standardu PCIe 5.0. W codziennym użytkowaniu nie jest to jednak coś, co można zauważyć, ponieważ dysk SSD jest nadal bardzo szybki.

* ... im mniej tym lepiej
Dławienie dysku: Pętla odczytu DiskSpd, głębokość kolejki 8
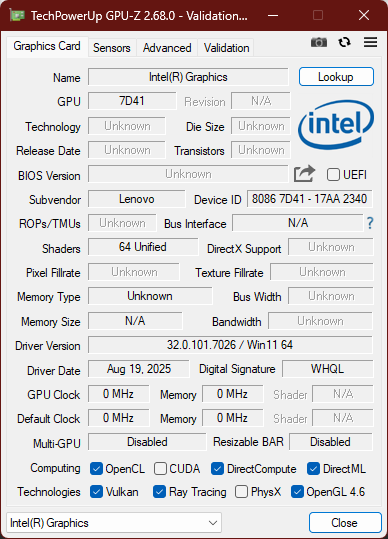
Wydajność GPU
Wydajność graficzna jest wyraźnie słabym punktem platformy Arrow Lake. Wydajność GPU jest o połowę niższa w porównaniu do laptopów Lunar Lake. GPU nadaje się tylko do podstawowych zadań.
| 3DMark 11 Performance | 6589 pkt. | |
| 3DMark Fire Strike Score | 4867 pkt. | |
| 3DMark Time Spy Score | 2340 pkt. | |
Pomoc | ||
* ... im mniej tym lepiej
| Strange Brigade - 1920x1080 ultra AA:ultra AF:16 | |
| HP EliteBook X G1i 14 AI | |
| Dell Pro 14 Premium | |
| Średnia w klasie Subnotebook (19 - 101.3, n=51, ostatnie 2 lata) | |
| Acer TravelMate P6 TMP614-54-TCO-553Z | |
Cyberpunk 2077 ultra FPS Chart
| low | med. | high | ultra | |
|---|---|---|---|---|
| GTA V (2015) | 135 | 118.1 | 25.8 | 10.7 |
| Dota 2 Reborn (2015) | 96 | 72.4 | 65.4 | 60.8 |
| Final Fantasy XV Benchmark (2018) | 49.5 | 25.4 | 18.3 | |
| X-Plane 11.11 (2018) | 35.4 | 28.4 | 24.2 | |
| Baldur's Gate 3 (2023) | 17.8 | 10.7 | ||
| Cyberpunk 2077 (2023) | 21.7 | 17.5 | 15.2 | 13.4 |
| F1 25 (2025) | 30.2 | 26.2 | 20.5 |
Emisje: ThinkPad X1 Carbon Gen 13 nagrzewa się jeszcze bardziej dzięki Arrow Lake
Hałas systemowy
Podczas gdy pozostaje on przeważnie cichy, kiedy i jeśli wentylator laptopa ThinkPad włącza się, robi się nieco głośniej niż na wersji Lunar Lake laptopa Lenovo ThinkPad X1 Carbon Gen 13.
Nie wykryliśmy żadnego wycie cewki.
Hałas
| luz |
| 25.2 / 25.2 / 27.3 dB |
| obciążenie |
| 27.8 / 44.3 dB |
 | ||
30 dB cichy 40 dB(A) słyszalny 50 dB(A) irytujący |
||
min: | ||
| Lenovo ThinkPad X1 Carbon Gen 13 21NX008PGE Ultra 5 225U, Graphics 4-Core iGPU (Arrow Lake) | Lenovo ThinkPad X1 Carbon Gen 13 21NS0010GE Core Ultra 7 258V, Arc 140V | Acer TravelMate P6 TMP614-54-TCO-553Z Core Ultra 5 226V, Arc 130V | HP EliteBook X G1i 14 AI Core Ultra 7 268V, Arc 140V | Dell Pro 14 Premium Core Ultra 7 268V, Arc 140V | Lenovo ThinkPad X9-14 Gen 1 Aura Edition Core Ultra 7 258V, Arc 140V | |
|---|---|---|---|---|---|---|
| Noise | 5% | -2% | -7% | -1% | 3% | |
| wyłączone / środowisko * (dB) | 25.2 | 23.2 8% | 25.4 -1% | 28.2 -12% | 23.1 8% | 24.9 1% |
| Idle Minimum * (dB) | 25.2 | 23.2 8% | 25.4 -1% | 28.4 -13% | 23.1 8% | 24.9 1% |
| Idle Average * (dB) | 25.2 | 23.2 8% | 25.4 -1% | 28.4 -13% | 23.1 8% | 24.9 1% |
| Idle Maximum * (dB) | 27.3 | 23.2 15% | 25.7 6% | 28.8 -5% | 23.1 15% | 24.9 9% |
| Load Average * (dB) | 27.8 | 29.9 -8% | 33.5 -21% | 38.2 -37% | 26.5 5% | |
| Cyberpunk 2077 ultra * (dB) | 40.9 | 43.3 -6% | 44.72 -9% | 39.1 4% | 44.2 -8% | 40.5 1% |
| Load Maximum * (dB) | 44.3 | 40.5 9% | 47.4 -7% | 40.4 9% | 44.2 -0% | 43.6 2% |
* ... im mniej tym lepiej
Temperatura
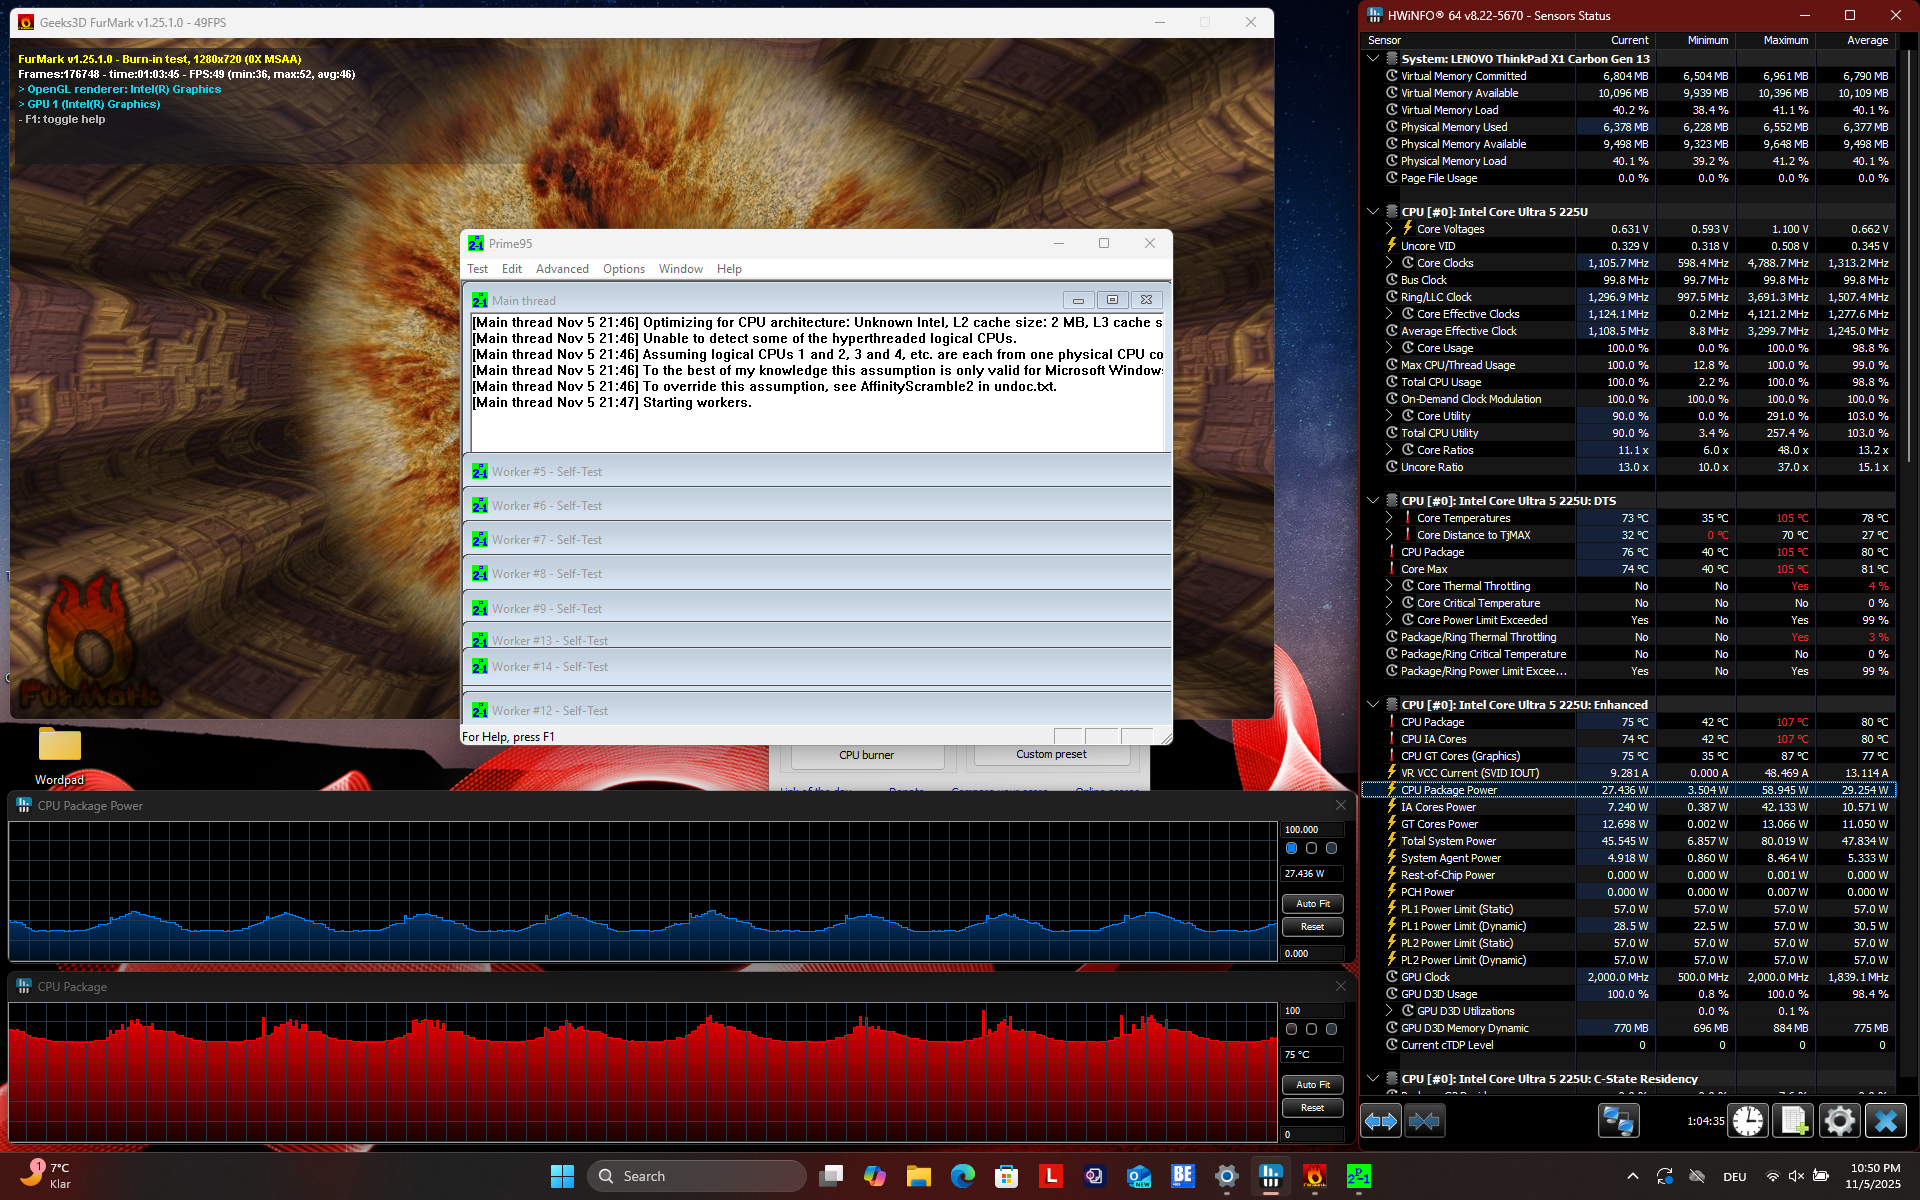
Głośniejszy, a także gorętszy! Wersja Arrow Lake U laptopa ThinkPad nagrzewa się bardziej niż model Lunar Lake. 47.2 stopnie Celsjusza lub 117 F nad klawiaturą, czyli prawie pięć stopni więcej niż w drugiej wersji.
Podczas testu obciążeniowego pobór mocy waha się między 20 a 35 W. Nie ma dławienia, ale wynik wyraźnie pokazuje, że X1 Carbon nie jest w stanie utrzymać limitu mocy powyżej 20 W przez długi czas.
(-) Maksymalna temperatura w górnej części wynosi 47.2 °C / 117 F, w porównaniu do średniej 35.9 °C / 97 F , począwszy od 21.4 do 59 °C dla klasy Subnotebook.
(±) Dno nagrzewa się maksymalnie do 44.1 °C / 111 F, w porównaniu do średniej 39.2 °C / 103 F
(+) W stanie bezczynności średnia temperatura górnej części wynosi 24.3 °C / 76 F, w porównaniu ze średnią temperaturą urządzenia wynoszącą 30.8 °C / ### class_avg_f### F.
(+) 3: The average temperature for the upper side is 31.1 °C / 88 F, compared to the average of 30.8 °C / 87 F for the class Subnotebook.
(+) Podpórki pod nadgarstki i touchpad są chłodniejsze niż temperatura skóry i maksymalnie 27.6 °C / 81.7 F i dlatego są chłodne w dotyku.
(±) Średnia temperatura obszaru podparcia dłoni w podobnych urządzeniach wynosiła 28.2 °C / 82.8 F (+0.6 °C / 1.1 F).
| Lenovo ThinkPad X1 Carbon Gen 13 21NX008PGE Ultra 5 225U, Graphics 4-Core iGPU (Arrow Lake) | Lenovo ThinkPad X1 Carbon Gen 13 21NS0010GE Core Ultra 7 258V, Arc 140V | Acer TravelMate P6 TMP614-54-TCO-553Z Core Ultra 5 226V, Arc 130V | HP EliteBook X G1i 14 AI Core Ultra 7 268V, Arc 140V | Dell Pro 14 Premium Core Ultra 7 268V, Arc 140V | Lenovo ThinkPad X9-14 Gen 1 Aura Edition Core Ultra 7 258V, Arc 140V | |
|---|---|---|---|---|---|---|
| Heat | 5% | -2% | 20% | 16% | -4% | |
| Maximum Upper Side * (°C) | 47.2 | 42.3 10% | 39.7 16% | 35 26% | 33 30% | 45.4 4% |
| Maximum Bottom * (°C) | 44.1 | 40.1 9% | 38.9 12% | 33.4 24% | 28 37% | 46.4 -5% |
| Idle Upper Side * (°C) | 27.1 | 27.3 -1% | 32.5 -20% | 23.8 12% | 28 -3% | 30.2 -11% |
| Idle Bottom * (°C) | 28.7 | 28.3 1% | 33.5 -17% | 24.2 16% | 28.8 -0% | 29.9 -4% |
* ... im mniej tym lepiej
Głośniki
Lenovo ThinkPad X1 Carbon Gen 13 21NX008PGE analiza dźwięku
(+) | głośniki mogą odtwarzać stosunkowo głośno (89.6 dB)
Bas 100 - 315 Hz
(±) | zredukowany bas - średnio 10.2% niższy od mediany
(±) | liniowość basu jest średnia (8.9% delta do poprzedniej częstotliwości)
Średnie 400 - 2000 Hz
(±) | wyższe średnie - średnio 7.2% wyższe niż mediana
(+) | średnie są liniowe (4.9% delta do poprzedniej częstotliwości)
Wysokie 2–16 kHz
(+) | zrównoważone maksima - tylko 2.9% od mediany
(±) | liniowość wysokich wartości jest średnia (7.6% delta do poprzedniej częstotliwości)
Ogólnie 100 - 16.000 Hz
(+) | ogólny dźwięk jest liniowy (12.9% różnicy w stosunku do mediany)
W porównaniu do tej samej klasy
» 19% wszystkich testowanych urządzeń w tej klasie było lepszych, 5% podobnych, 76% gorszych
» Najlepszy miał deltę 5%, średnia wynosiła ###średnia###%, najgorsza wynosiła 53%
W porównaniu do wszystkich testowanych urządzeń
» 12% wszystkich testowanych urządzeń było lepszych, 3% podobnych, 85% gorszych
» Najlepszy miał deltę 4%, średnia wynosiła ###średnia###%, najgorsza wynosiła 134%
HP EliteBook X G1i 14 AI analiza dźwięku
(+) | głośniki mogą odtwarzać stosunkowo głośno (90.3 dB)
Bas 100 - 315 Hz
(±) | zredukowany bas - średnio 11% niższy od mediany
(±) | liniowość basu jest średnia (12.1% delta do poprzedniej częstotliwości)
Średnie 400 - 2000 Hz
(+) | zbalansowane środki średnie - tylko 3.9% od mediany
(±) | liniowość środka jest średnia (8.9% delta do poprzedniej częstotliwości)
Wysokie 2–16 kHz
(+) | zrównoważone maksima - tylko 4% od mediany
(+) | wzloty są liniowe (6.5% delta do poprzedniej częstotliwości)
Ogólnie 100 - 16.000 Hz
(+) | ogólny dźwięk jest liniowy (12% różnicy w stosunku do mediany)
W porównaniu do tej samej klasy
» 14% wszystkich testowanych urządzeń w tej klasie było lepszych, 4% podobnych, 82% gorszych
» Najlepszy miał deltę 5%, średnia wynosiła ###średnia###%, najgorsza wynosiła 53%
W porównaniu do wszystkich testowanych urządzeń
» 9% wszystkich testowanych urządzeń było lepszych, 2% podobnych, 88% gorszych
» Najlepszy miał deltę 4%, średnia wynosiła ###średnia###%, najgorsza wynosiła 134%
Zarządzanie energią: Wydajność jest gorsza bez Jeziora Księżycowego
Zużycie energii
Podczas gdy ekran IPS pomaga w utrzymaniu niskiego zużycia energii, wyniki nie są świetne - pod obciążeniem wersja Lunar Lake jest wyraźnie bardziej energooszczędna, pomimo ekranu OLED.
Zużycie energii osiąga maksymalny poziom 65,2 W, czyli nieco więcej niż może dostarczyć ładowarka 65 W. Ponieważ pobór mocy szybko spada, urządzeniu nie grozi utrata naładowania podczas użytkowania.
| wyłączony / stan wstrzymania | |
| luz | |
| obciążenie |
|
Legenda:
min: | |
| Lenovo ThinkPad X1 Carbon Gen 13 21NX008PGE Ultra 5 225U, Graphics 4-Core iGPU (Arrow Lake), Samsung PM9E1 MZVLC512HFJD, IPS LED, 1920x1200, 14" | Lenovo ThinkPad X1 Carbon Gen 13 21NS0010GE Core Ultra 7 258V, Arc 140V, SK hynix PCB01 HFS001TFM9X179N GL, OLED, 2880x1800, 14" | Acer TravelMate P6 TMP614-54-TCO-553Z Core Ultra 5 226V, Arc 130V, WDC PC SN810 512GB, IPS, 1920x1200, 14" | HP EliteBook X G1i 14 AI Core Ultra 7 268V, Arc 140V, Kioxia XG8 KXG80ZNV512G, IPS, 1920x1200, 14" | Dell Pro 14 Premium Core Ultra 7 268V, Arc 140V, Kioxia BG6 KBG6AZNV1T02, OLED, 2880x1800, 14" | Lenovo ThinkPad X9-14 Gen 1 Aura Edition Core Ultra 7 258V, Arc 140V, WD PC SN740 SDDQMQD-1T00, OLED, 1920x1200, 14" | Przeciętny Intel Graphics 4-Core iGPU (Meteor / Arrow Lake) | Średnia w klasie Subnotebook | |
|---|---|---|---|---|---|---|---|---|
| Power Consumption | -6% | -12% | -4% | -8% | -6% | -39% | -26% | |
| Idle Minimum * (Watt) | 2.8 | 4.7 -68% | 4.21 -50% | 2.5 11% | 3.5 -25% | 3.6 -29% | 4.58 ? -64% | 3.79 ? -35% |
| Idle Average * (Watt) | 5.1 | 5.7 -12% | 5.365 -5% | 5.4 -6% | 4.3 16% | 4.6 10% | 7.54 ? -48% | 6.57 ? -29% |
| Idle Maximum * (Watt) | 6 | 6.1 -2% | 6.7 -12% | 5.8 3% | 7.9 -32% | 5.2 13% | 8.87 ? -48% | 7.94 ? -32% |
| Load Average * (Watt) | 30.49 | 29.8 2% | 36.9 -21% | 38.9 -28% | 31.2 -2% | 40.7 ? -33% | 41.8 ? -37% | |
| Cyberpunk 2077 ultra external monitor * (Watt) | 39.8 | 34.1 14% | 46 -16% | 44.9 -13% | 38.7 3% | 48.4 -22% | ||
| Cyberpunk 2077 ultra * (Watt) | 40.9 | 35.3 14% | 40.5 1% | 48.5 -19% | 39 5% | 47.3 -16% | ||
| Load Maximum * (Watt) | 65.2 | 60.1 8% | 57 13% | 54.6 16% | 60.7 7% | 61.8 5% | 67.4 ? -3% | 64.1 ? 2% |
* ... im mniej tym lepiej
Pobór mocy Cyberpunk / Test warunków skrajnych
Zużycie energii przez monitor zewnętrzny
Żywotność baterii
14.1 godzina pracy na baterii w teście przeglądania Internetu przez Wi-Fi (150 cd/m²) nie jest wcale złym wynikiem, ale po prostu rozczarowującym. Jest nieco lepszy niż w przypadku X1 Carbon Gen 13 OLEDpomimo tego, że ekran pobiera znacznie mniej energii.
| Lenovo ThinkPad X1 Carbon Gen 13 21NX008PGE Ultra 5 225U, Graphics 4-Core iGPU (Arrow Lake), 57 Wh | Lenovo ThinkPad X1 Carbon Gen 13 21NS0010GE Core Ultra 7 258V, Arc 140V, 57 Wh | Acer TravelMate P6 TMP614-54-TCO-553Z Core Ultra 5 226V, Arc 130V, 65 Wh | HP EliteBook X G1i 14 AI Core Ultra 7 268V, Arc 140V, 68 Wh | Dell Pro 14 Premium Core Ultra 7 268V, Arc 140V, 60 Wh | Lenovo ThinkPad X9-14 Gen 1 Aura Edition Core Ultra 7 258V, Arc 140V, 55 Wh | Średnia w klasie Subnotebook | |
|---|---|---|---|---|---|---|---|
| Czasy pracy | -20% | 57% | 31% | 8% | -12% | 7% | |
| WiFi v1.3 (h) | 14.1 | 11 -22% | 22.1 57% | 18.5 31% | 15.2 8% | 14.2 1% | 14 ? -1% |
| Load (h) | 1.7 | 1.4 -18% | 1.3 -24% | 1.946 ? 14% | |||
| Cyberpunk 2077 ultra 150cd (h) | 1.6 |
Ocena Notebookcheck
Lenovo ThinkPad X1 Carbon Gen 13 21NX008PGE
- 23/12/2025 v8
Benjamin Herzig
 Total Sustainability Score:
 Potencjalni konkurenci w porównaniu
Obraz | Model / recenzja | Cena | Waga | Wysokość | Ekran |
|---|---|---|---|---|---|
1. 89.1%  | Lenovo ThinkPad X1 Carbon Gen 13 21NX008PGE Intel Core Ultra 5 225U ⎘ Intel Graphics 4-Core iGPU (Meteor / Arrow Lake) ⎘ 16 GB Pamięć, 512 GB SSD | Amazon: Cena katalogowa: 1955 Euro | 1.2 kg | 17.5 mm | 14.00" 1920x1200 162 PPI IPS LED |
2. 85.7%  | Acer TravelMate P6 TMP614-54-TCO-553Z Intel Core Ultra 5 226V ⎘ Intel Arc Graphics 130V ⎘ 16 GB Pamięć, 512 GB SSD | Amazon: Cena katalogowa: 1420€ | 1 kg | 17 mm | 14.00" 1920x1200 162 PPI IPS |
3. 85.1%  | HP EliteBook X G1i 14 AI Intel Core Ultra 7 268V ⎘ Intel Arc Graphics 140V ⎘ 32 GB Pamięć, 512 GB SSD | Amazon: Cena katalogowa: 3300 USD | 1.2 kg | 15 mm | 14.00" 1920x1200 162 PPI IPS |
4. 86.4%  | Dell Pro 14 Premium Intel Core Ultra 7 268V ⎘ Intel Arc Graphics 140V ⎘ 32 GB Pamięć, 1024 GB SSD | Cena katalogowa: 2500 USD | 1.3 kg | 17.95 mm | 14.00" 2880x1800 243 PPI OLED |
5. 88.8%  | Lenovo ThinkPad X9-14 Gen 1 Aura Edition Intel Core Ultra 7 258V ⎘ Intel Arc Graphics 140V ⎘ 32 GB Pamięć, 1024 GB SSD | Amazon: Cena katalogowa: 1800 Euro | 1.2 kg | 17.8 mm | 14.00" 1920x1200 162 PPI OLED |
6. 89.9%  | Lenovo ThinkPad X1 Carbon Gen 13 21NS0010GE Intel Core Ultra 7 258V ⎘ Intel Arc Graphics 140V ⎘ 32 GB Pamięć, 1024 GB SSD | Amazon: 1. $1,499.00 Lenovo Gen 13 ThinkPad X1 Ca... 2. $1,649.99 Lenovo ThinkPad X1 Carbon Ge... 3. $1,699.99 Lenovo Gen 13 ThinkPad X1 Ca... Cena katalogowa: 2700 Euro | 982 g | 16 mm | 14.00" 2880x1800 243 PPI OLED |
Przezroczystość
Wyboru urządzeń do recenzji dokonuje nasza redakcja. Próbka testowa została udostępniona autorowi jako pożyczka od producenta lub sprzedawcy detalicznego na potrzeby tej recenzji. Pożyczkodawca nie miał wpływu na tę recenzję, producent nie otrzymał też kopii tej recenzji przed publikacją. Nie było obowiązku publikowania tej recenzji. Jako niezależna firma medialna, Notebookcheck nie podlega władzy producentów, sprzedawców detalicznych ani wydawców.
Tak testuje Notebookcheck
Każdego roku Notebookcheck niezależnie sprawdza setki laptopów i smartfonów, stosując standardowe procedury, aby zapewnić porównywalność wszystkich wyników. Od około 20 lat stale rozwijamy nasze metody badawcze, ustanawiając przy tym standardy branżowe. W naszych laboratoriach testowych doświadczeni technicy i redaktorzy korzystają z wysokiej jakości sprzętu pomiarowego. Testy te obejmują wieloetapowy proces walidacji. Nasz kompleksowy system ocen opiera się na setkach uzasadnionych pomiarów i benchmarków, co pozwala zachować obiektywizm.
