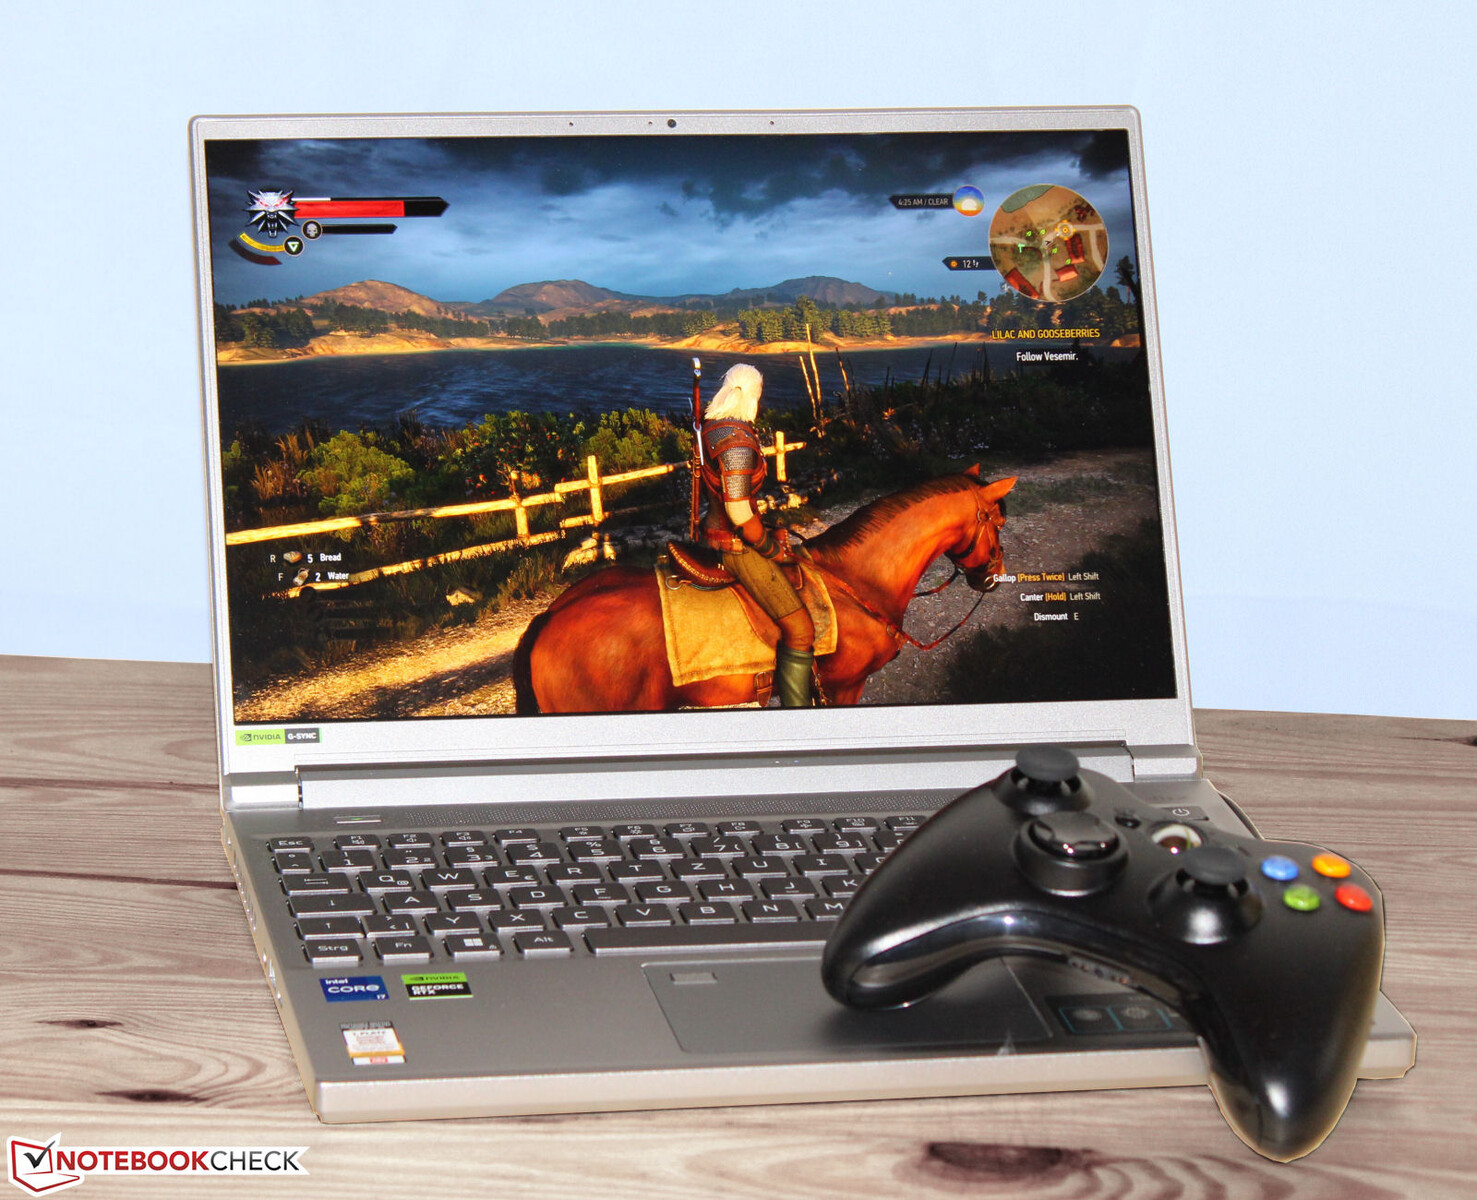
Recenzja Acer Predator Triton 14: 14-calowy laptop do gier z jasnym wyświetlaczem i RTX 4050
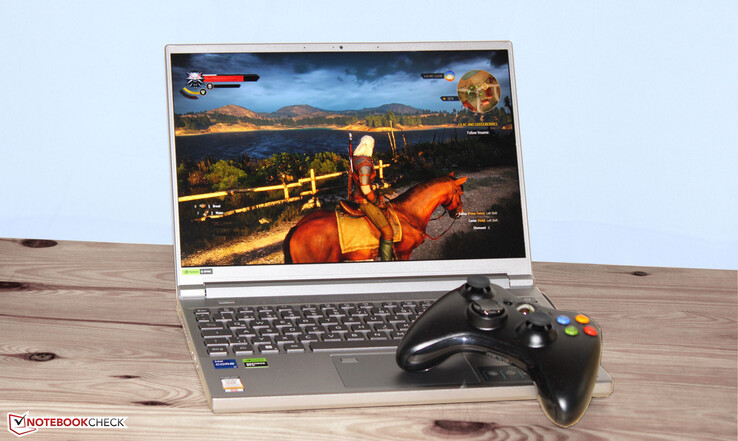
Kompaktowy laptop do gier reprezentuje obecny stan techniki: Raptor Lake, Ada Lovelace, LPDDR5, PCIe 4, Thunderbolt 4. Mamy tu do czynienia z niemal identycznym następcą recenzowanego już modelu Acer Predator Triton 300 SE. Konkurencyjne urządzenia to Razer Blade 14iMSI Stealth 14 Studio A13Vgigabyte Aero 14Gigabyte Aero 14 OLED BMF,Apple MacBook Pro 14 2023 M2 Pro EntryorazAsus ROG Zephyrus G14 GA402RJ.
Potencjalni konkurenci w porównaniu
Ocena | Data | Model | Waga | Wysokość | Rozmiar | Rezolucja | Cena |
|---|---|---|---|---|---|---|---|
| 87.3 % v7 (old) | 07/2023 | Acer Predator Triton 14 PT14-51 i7-13700H, GeForce RTX 4050 Laptop GPU | 1.7 kg | 19.81 mm | 14.00" | 2560x1600 | |
| 88.7 % v7 (old) | 06/2023 | Razer Blade 14 RTX 4070 R9 7940HS, GeForce RTX 4070 Laptop GPU | 1.8 kg | 17.99 mm | 14.00" | 2560x1600 | |
| 86.4 % v7 (old) | 10/2022 | Asus ROG Zephyrus G14 GA402RJ R7 6800HS, Radeon RX 6700S | 1.7 kg | 19.5 mm | 14.00" | 2560x1600 | |
| 85.4 % v7 (old) | 07/2023 | MSI Stealth 14 Studio A13V i7-13700H, GeForce RTX 4050 Laptop GPU | 1.7 kg | 19 mm | 14.00" | 2560x1600 | |
| 89.4 % v7 (old) | 05/2023 | Gigabyte Aero 14 OLED BMF i7-13700H, GeForce RTX 4050 Laptop GPU | 1.4 kg | 17 mm | 14.00" | 2880x1800 | |
| 93.4 % v7 (old) | 03/2023 | Apple MacBook Pro 14 2023 M2 Pro Entry M2 Pro 10-Core, M2 Pro 16-Core GPU | 1.6 kg | 15.5 mm | 14.20" | 3024x1964 |
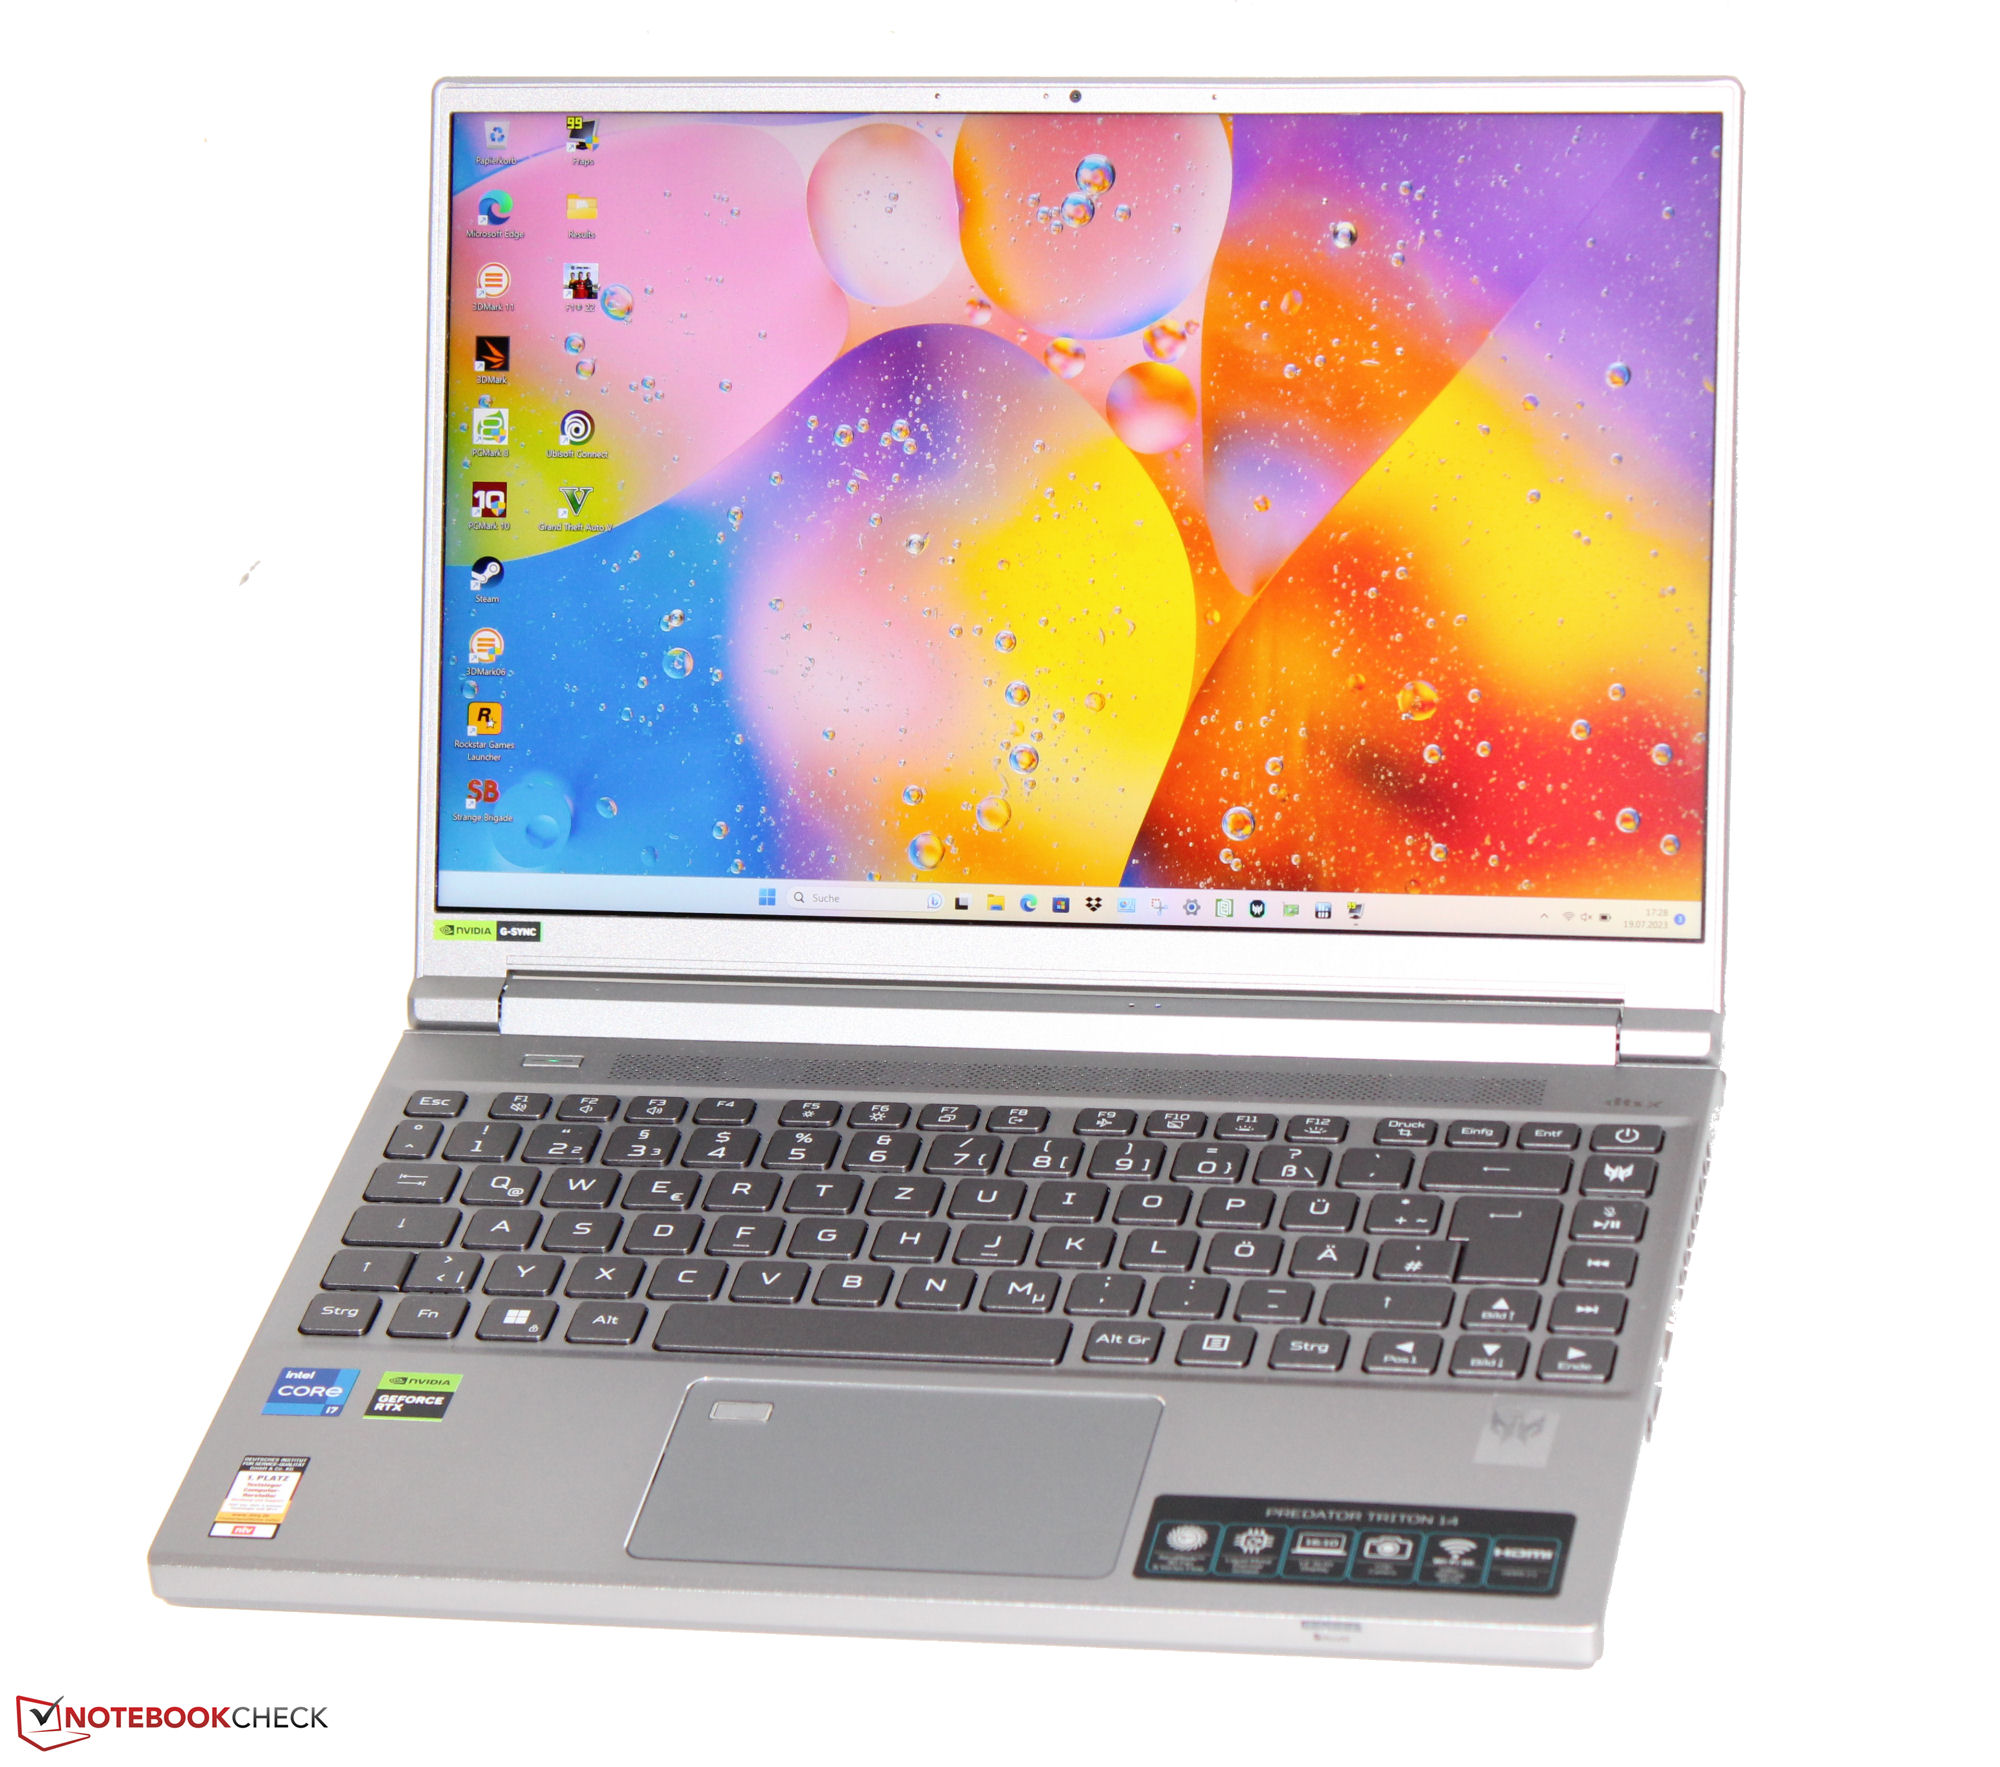
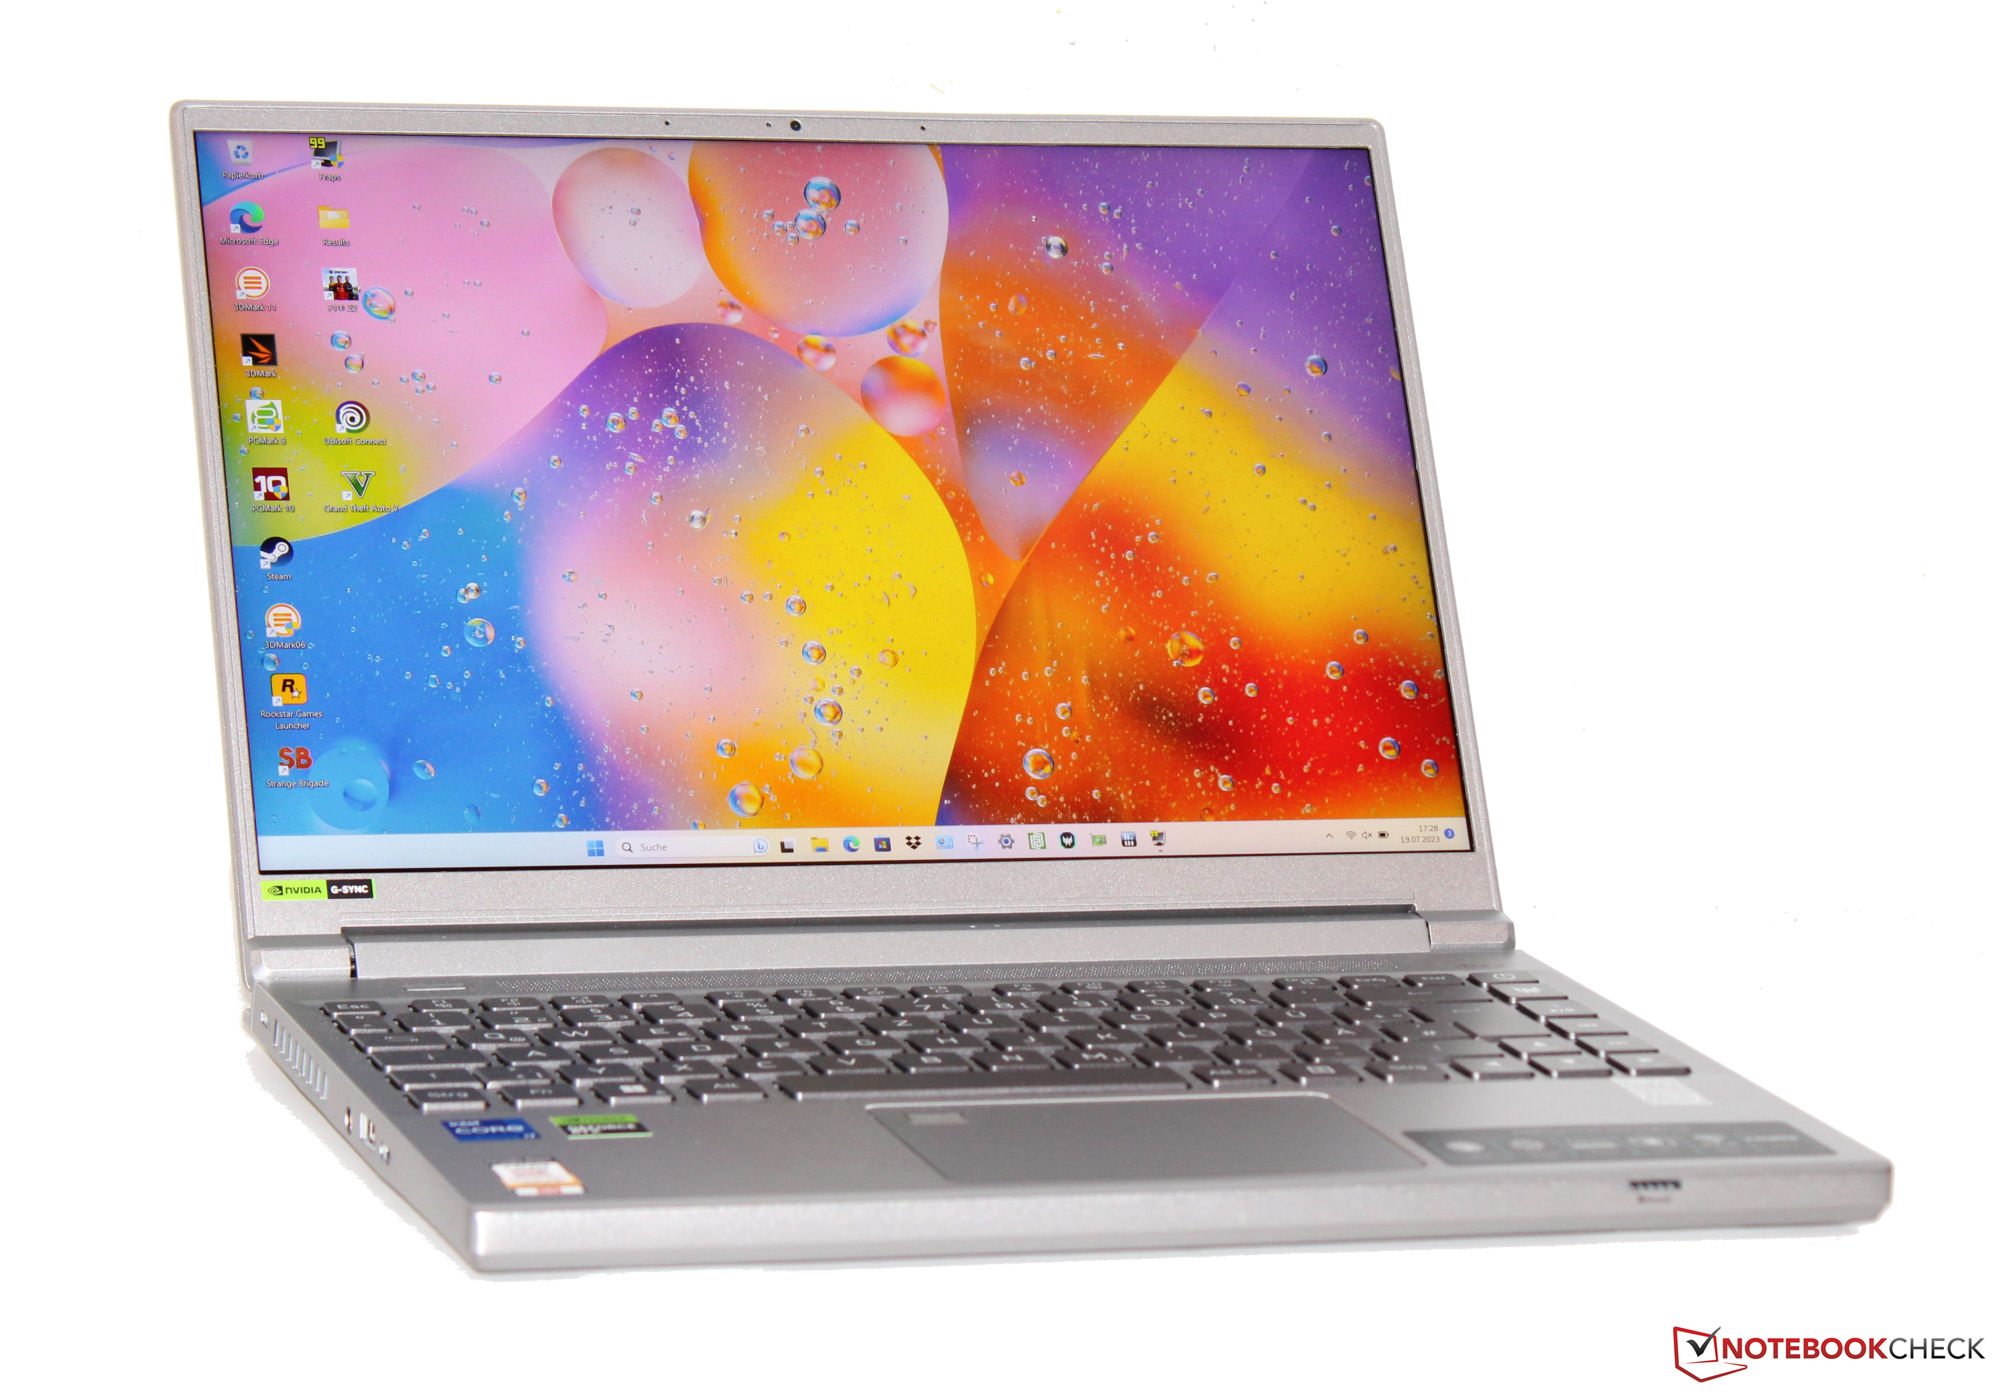
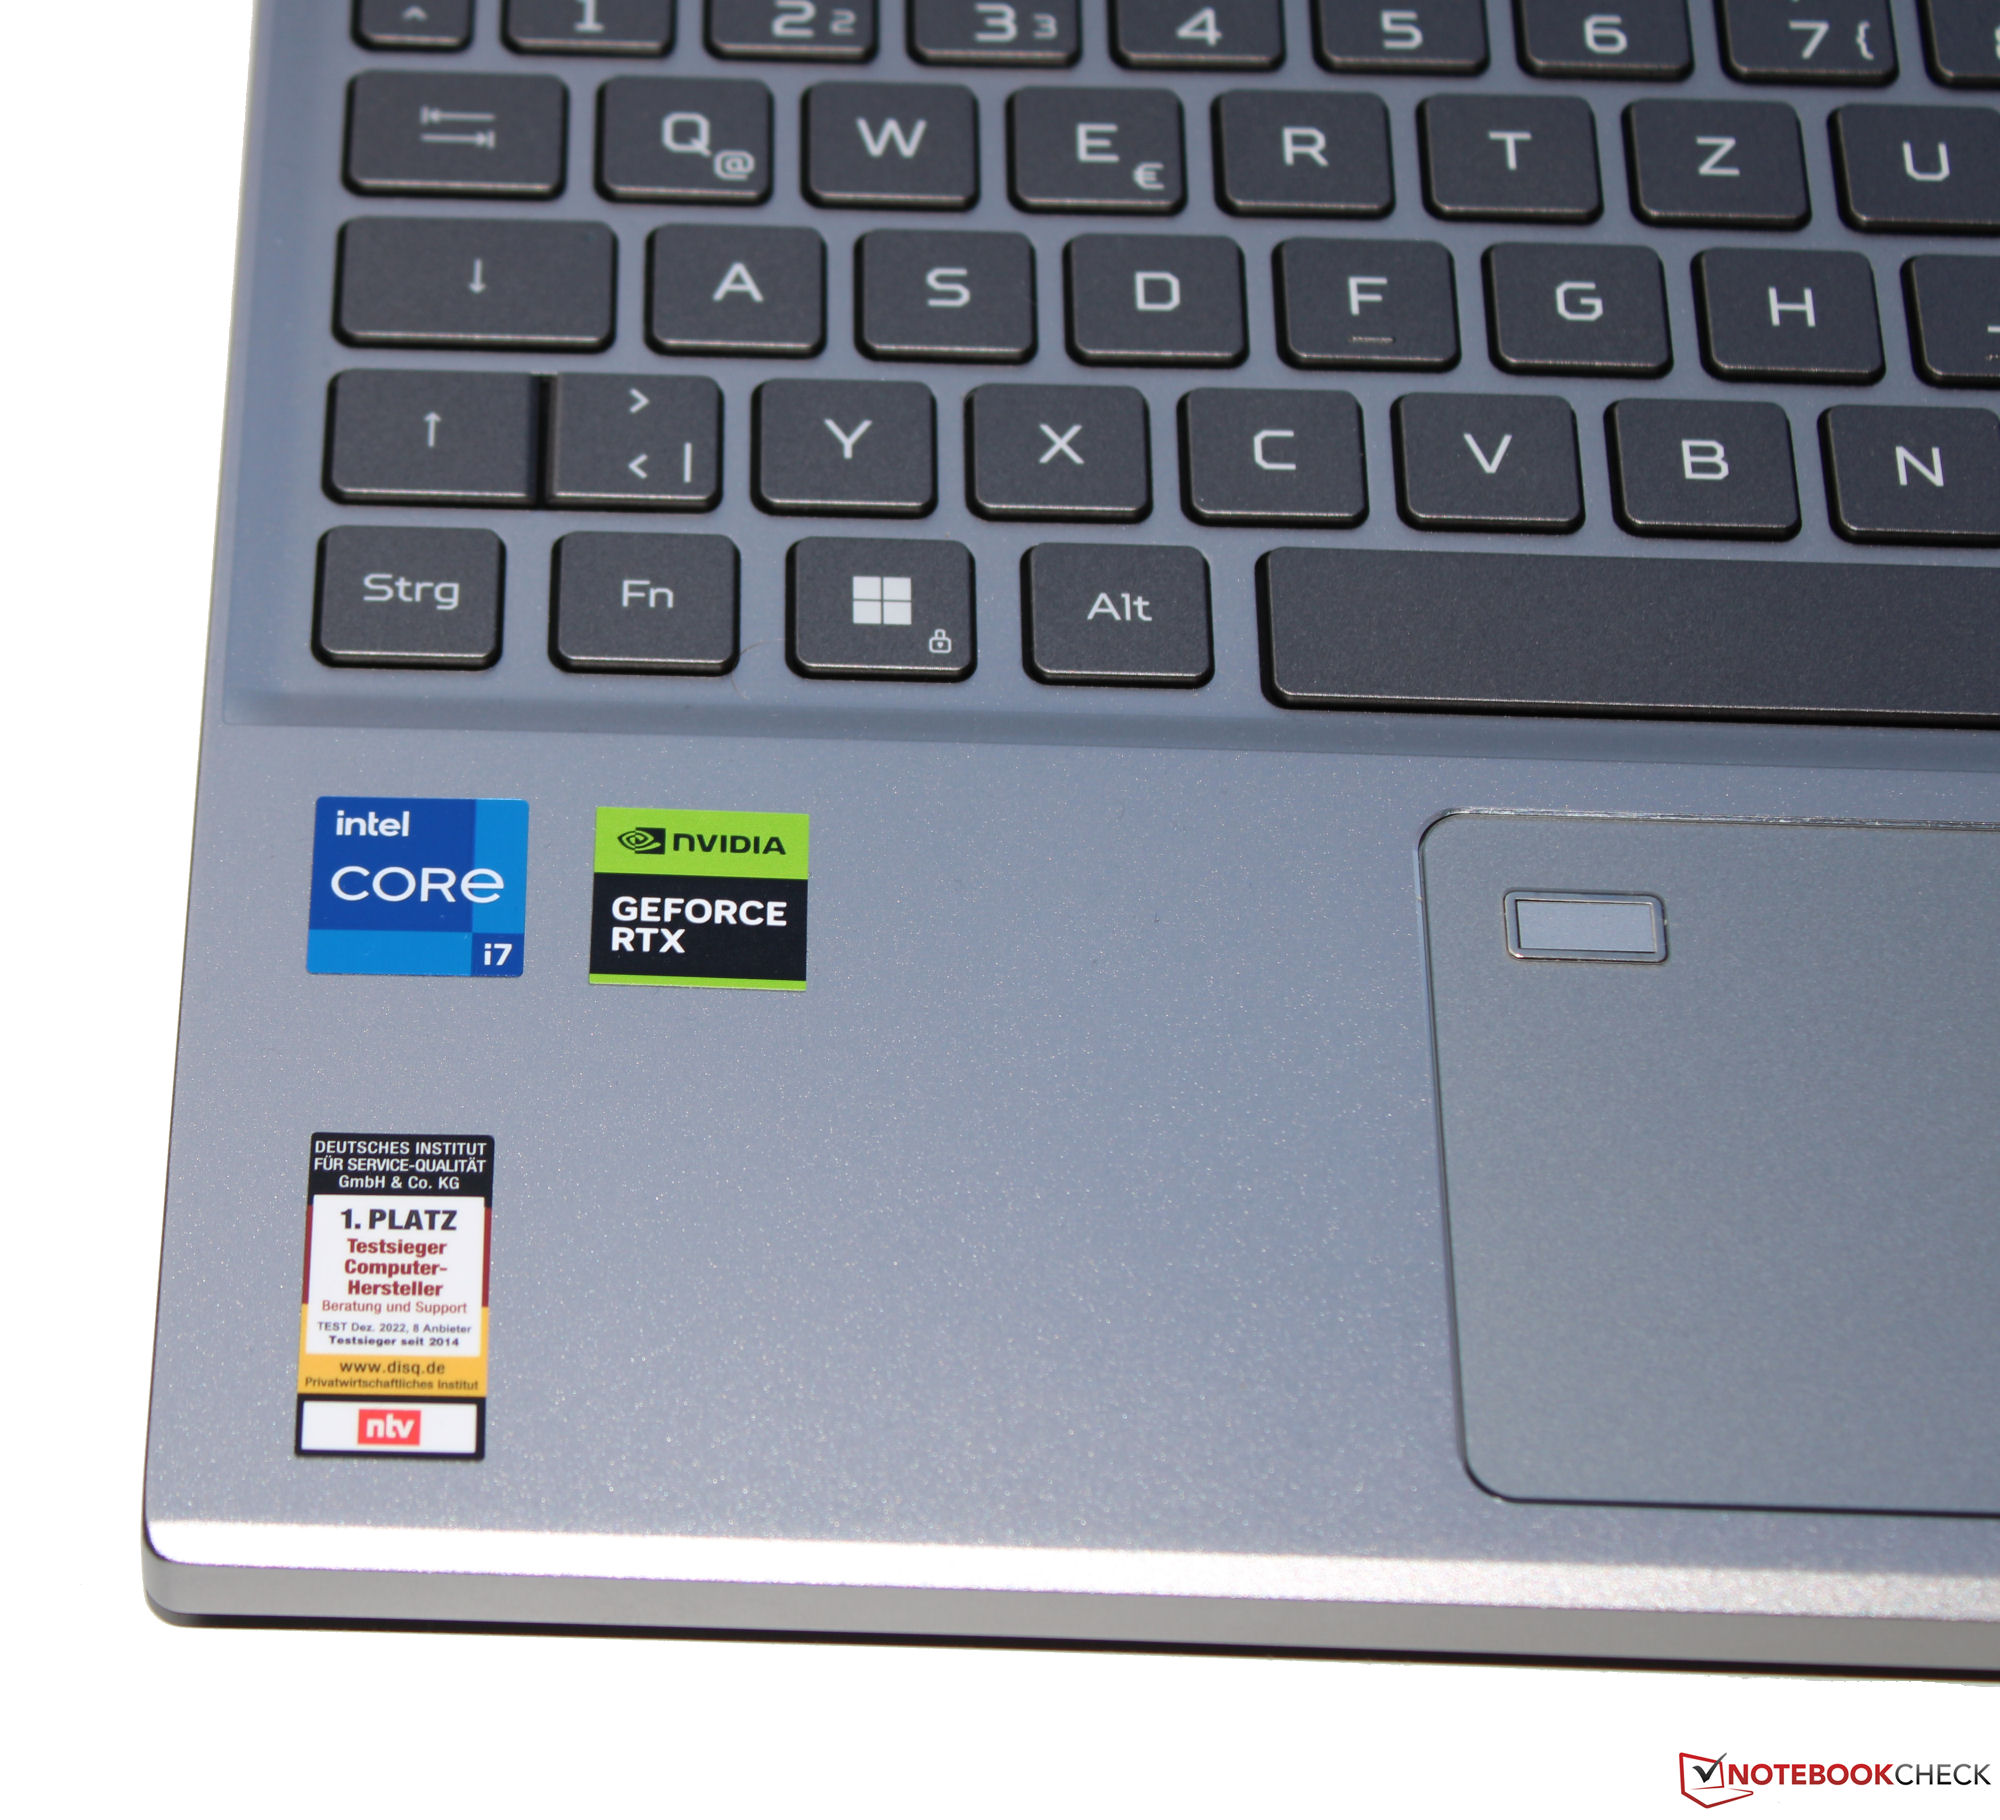
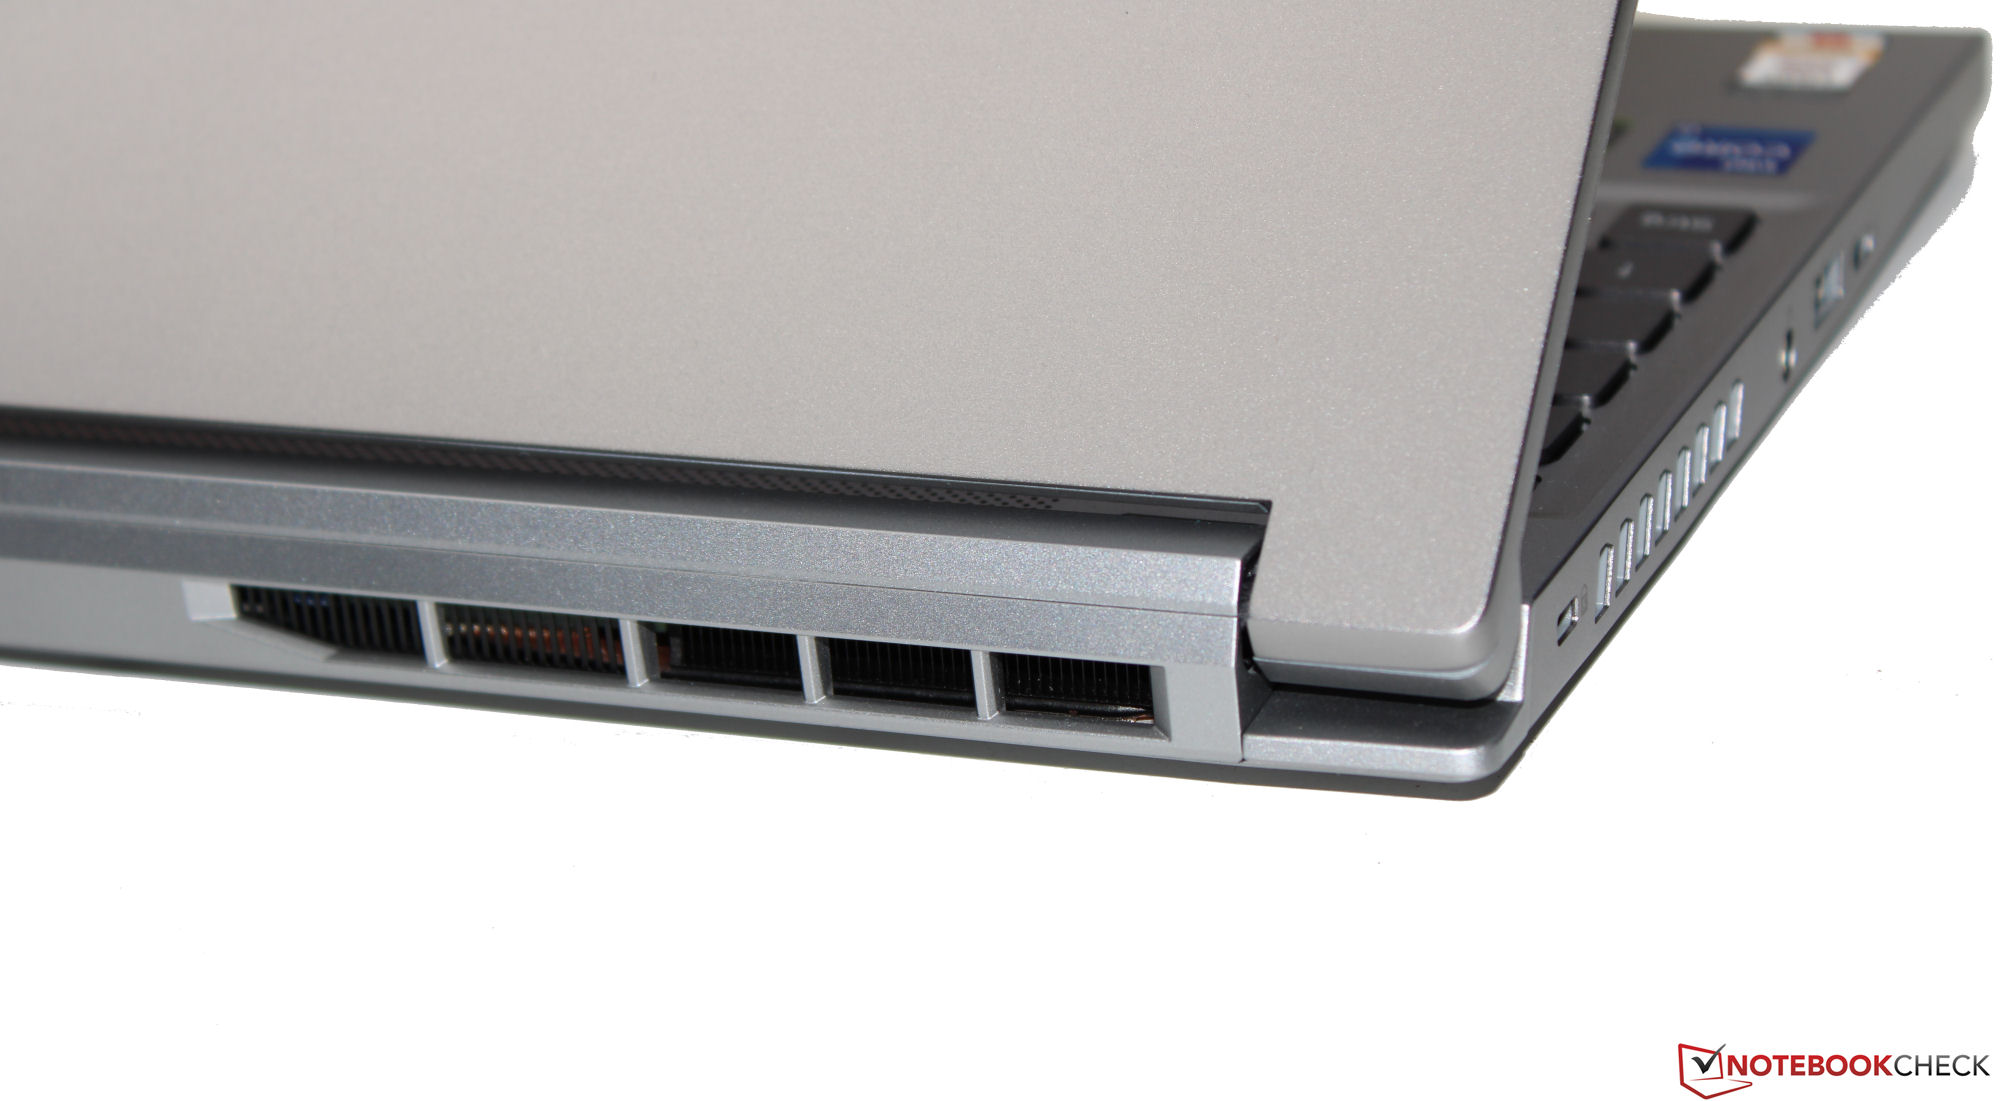
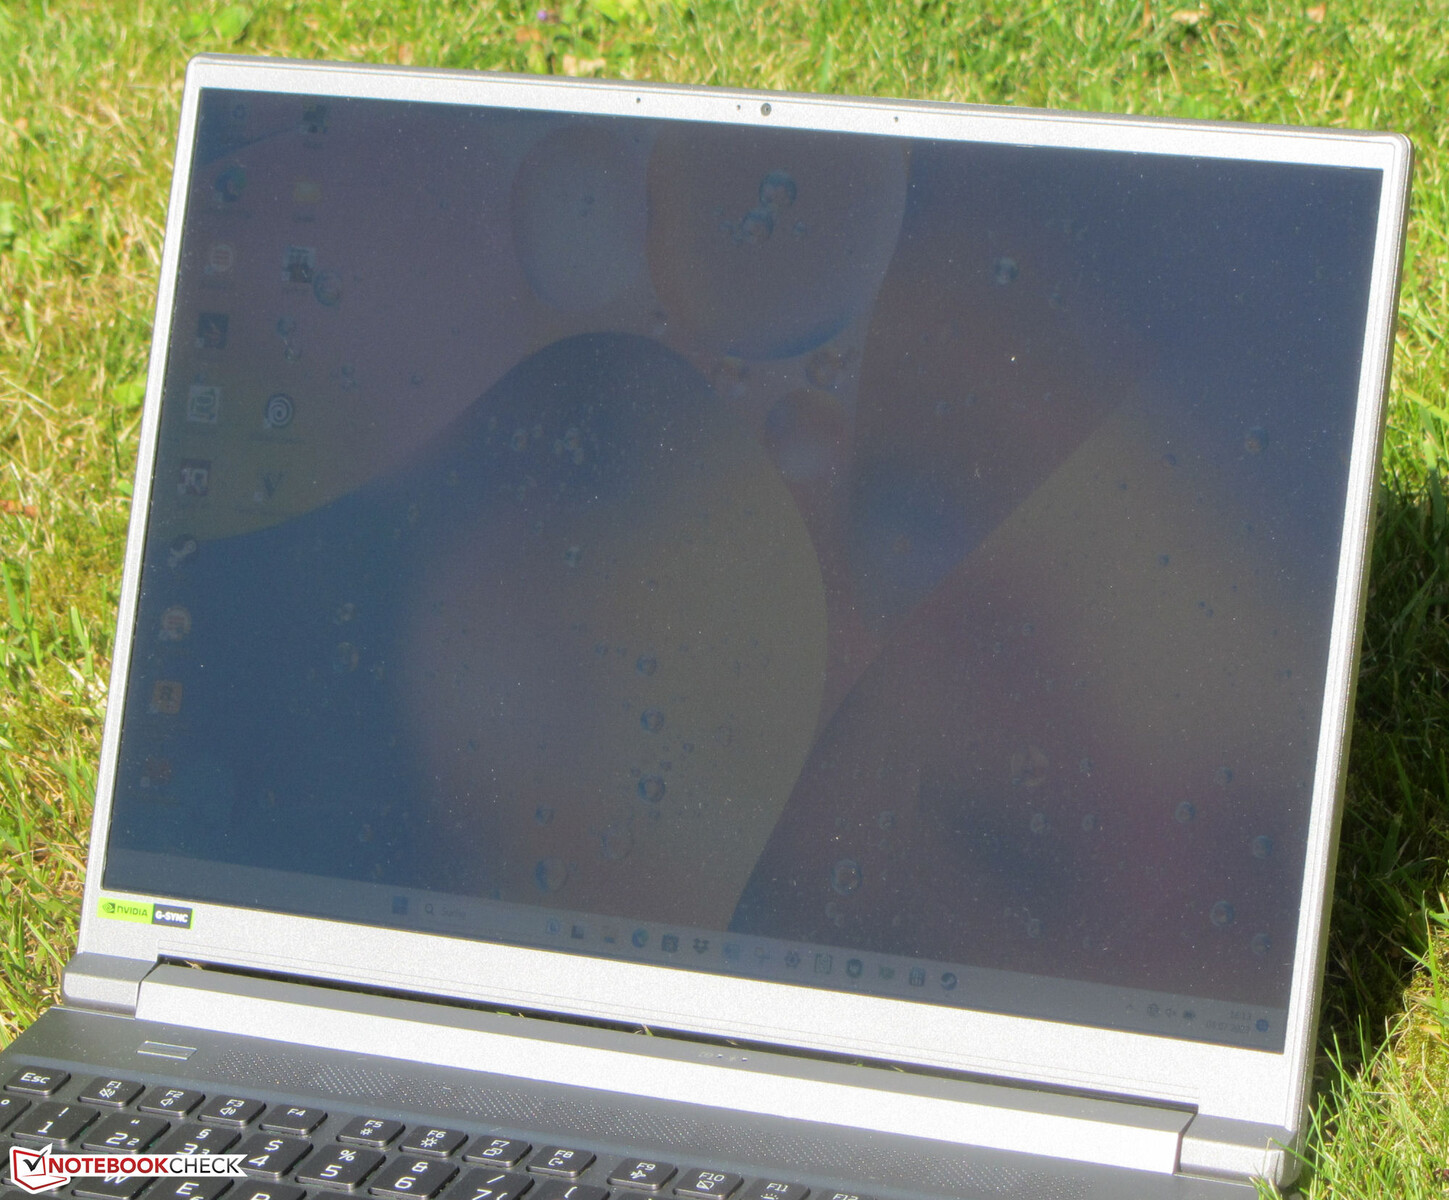
Obudowa - Acer wyposażył Tritona w metalową obudowę
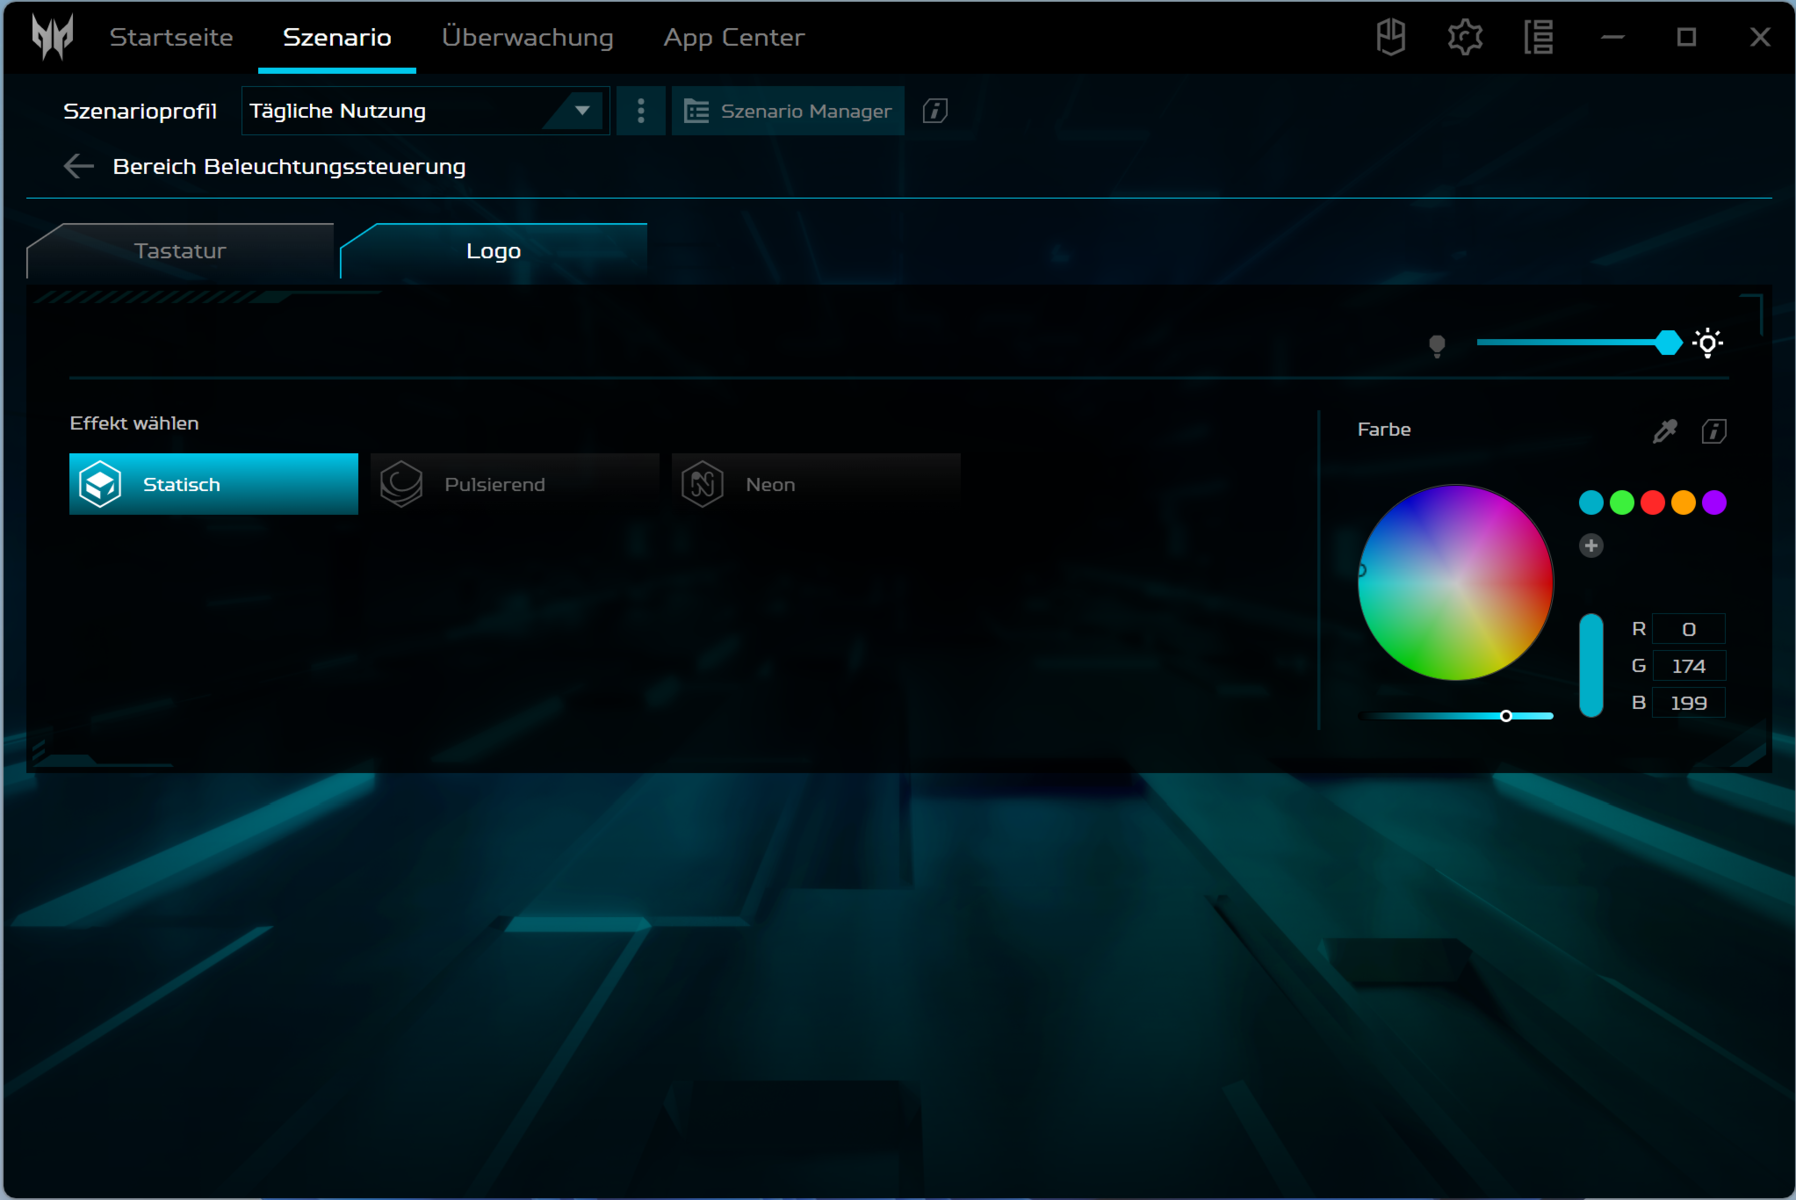
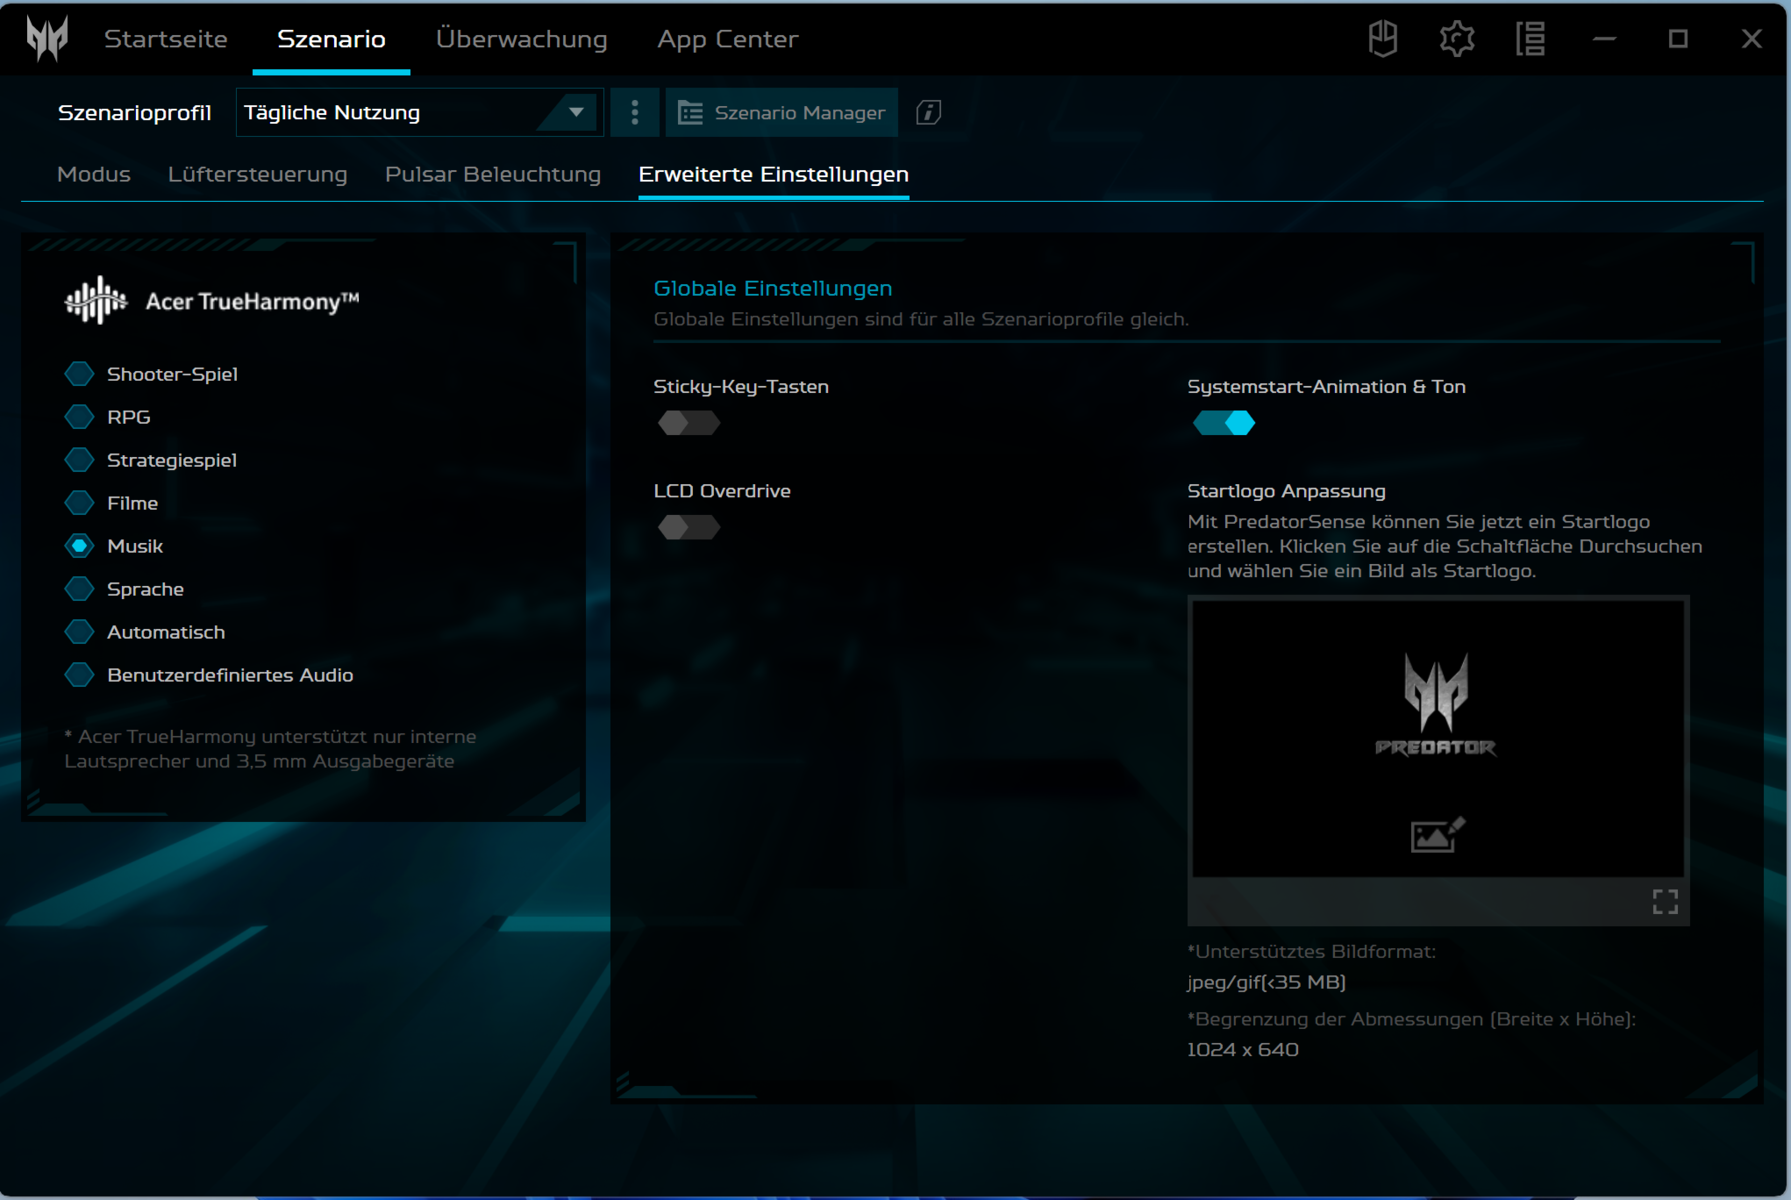
Technologia laptopa jest umieszczona w srebrno-szarej metalowej obudowie. Acer zdecydował się na gładkie, matowe powierzchnie. Kompaktowy komputer nie oferuje żadnych przyciągających wzrok elementów konstrukcyjnych, co oznacza, że może również służyć jako laptop biurowy. Podobnie, ekstrawaganckie paski LED są również nieobecne. Oprócz podświetlenia klawiszy, małe podświetlane logo Predator na podpórce pod nadgarstki urozmaica kolorystykę.
Triton nie wykazuje żadnych oznak wad produkcyjnych. Wymiary szczeliny są prawidłowe i żaden nadmiar materiału nie wystaje z urządzenia. Podstawa i pokrywa mogą być lekko skręcone, ale wszystko w akceptowalnym zakresie. Nacisk na tylną część pokrywy nie powoduje żadnych zniekształceń obrazu. Zawiasy mocno trzymają pokrywę w miejscu, a maksymalny kąt otwarcia wynosi około 175 stopni. Możliwe jest otwarcie urządzenia jedną ręką.
Jeśli chodzi o wymiary, nie ma zbyt wiele do wyboru między większością konkurencyjnych urządzeń. TheMSI Stealth 14 Studio A13Vjest wyjątkiem od reguły: zajmuje więcej miejsca niż konkurencja. Jeśli chodzi o wagę, laptop Acer plasuje się w środku stawki.
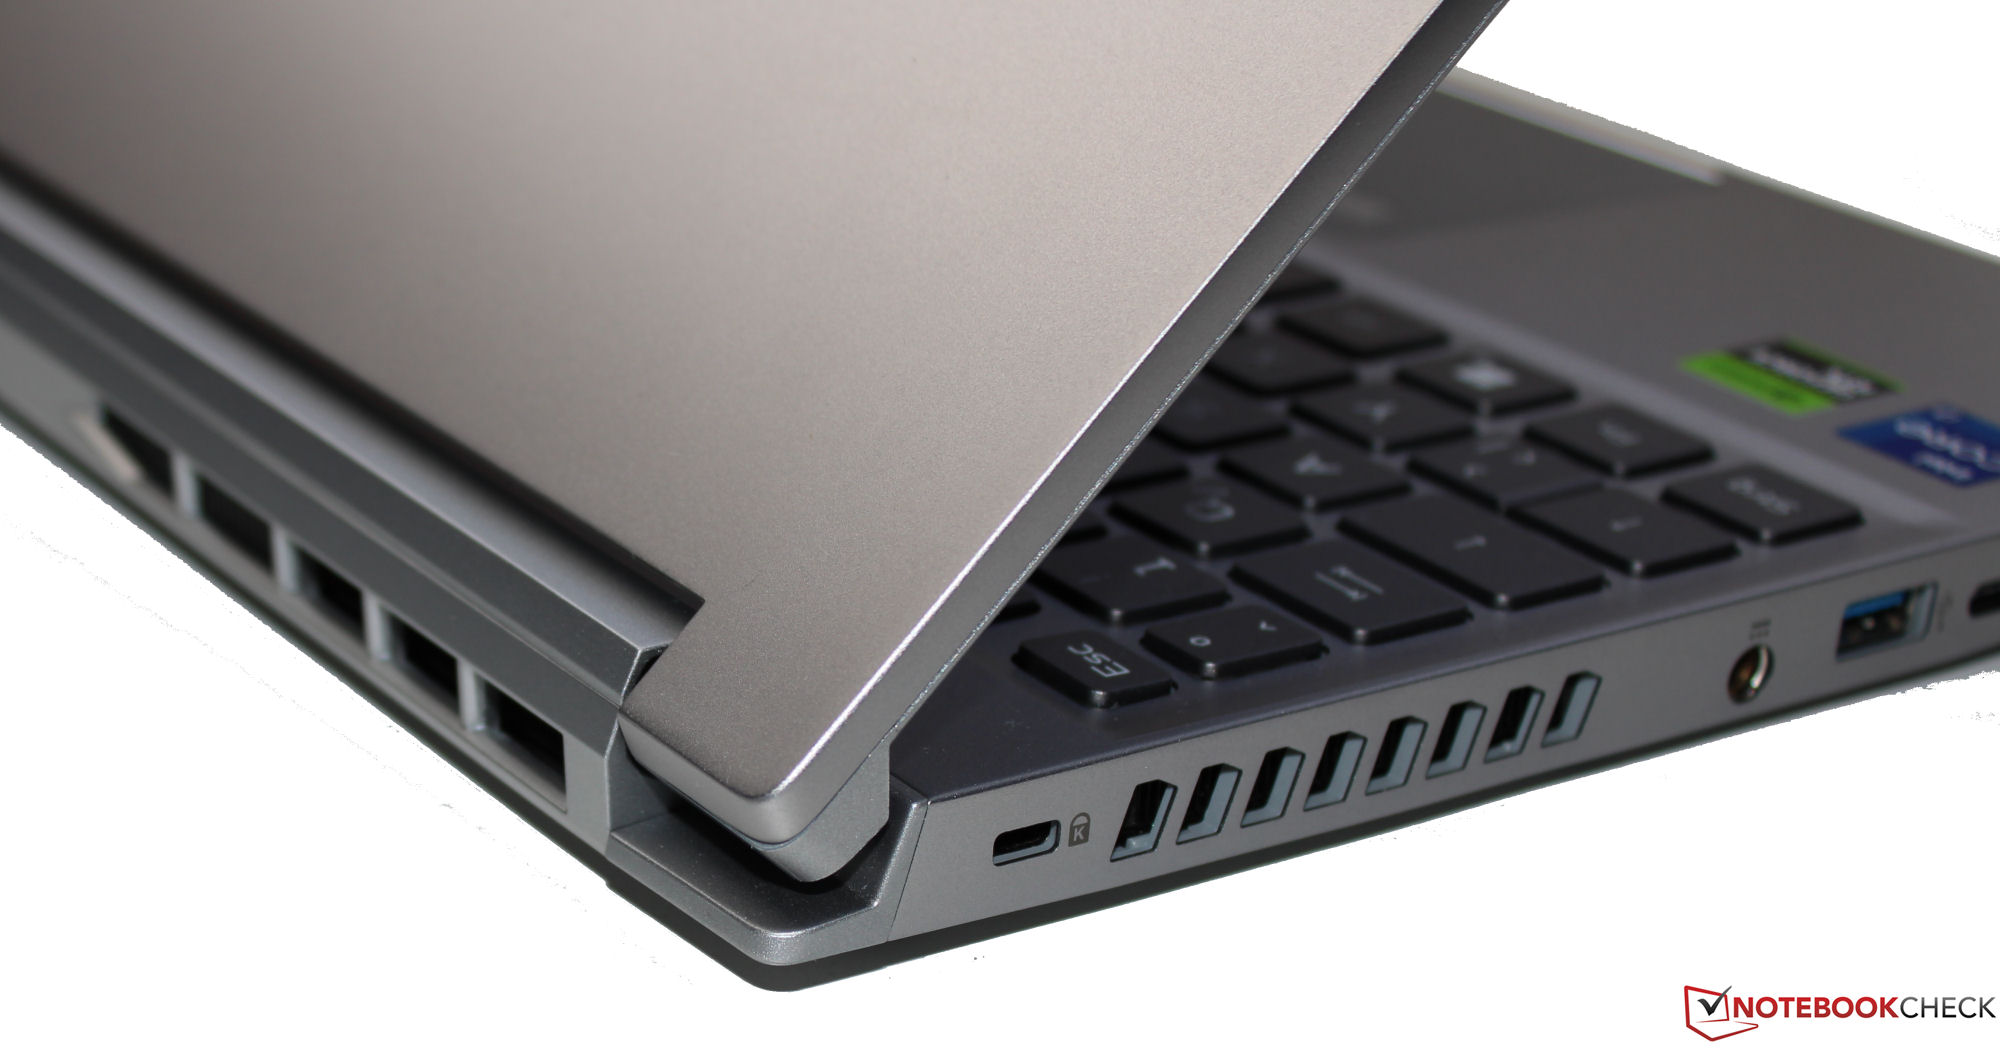
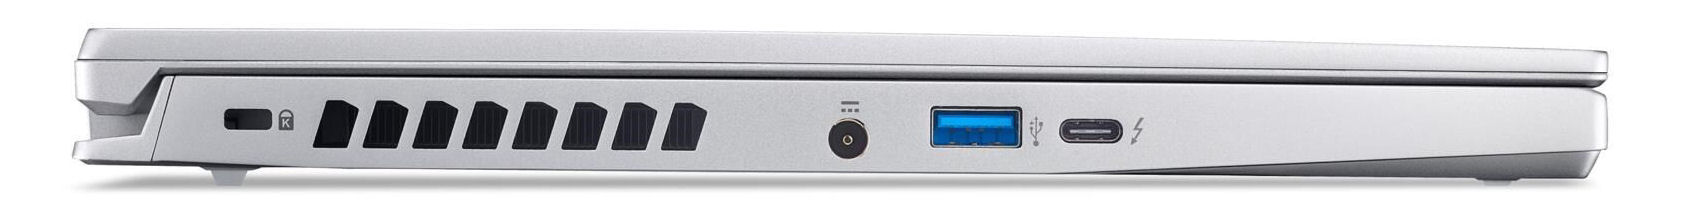
Funkcje - PT14 oferuje Thunderbolt 4
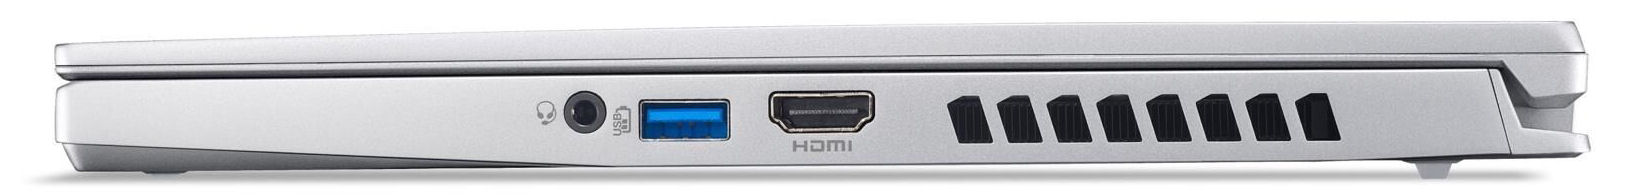
Wybór portów jest dość ograniczony: PT14 może korzystać z dwóch portów USB-A (USB 3.2 Gen 2) i portu USB-C (Thunderbolt 4). Port USB-C obsługuje funkcję Power Delivery i może wysyłać sygnał Displayport. Łącznie dostępne są dwa wyjścia wideo (HDMI 2.1, DP). Pakiet uzupełnia gniazdo audio.
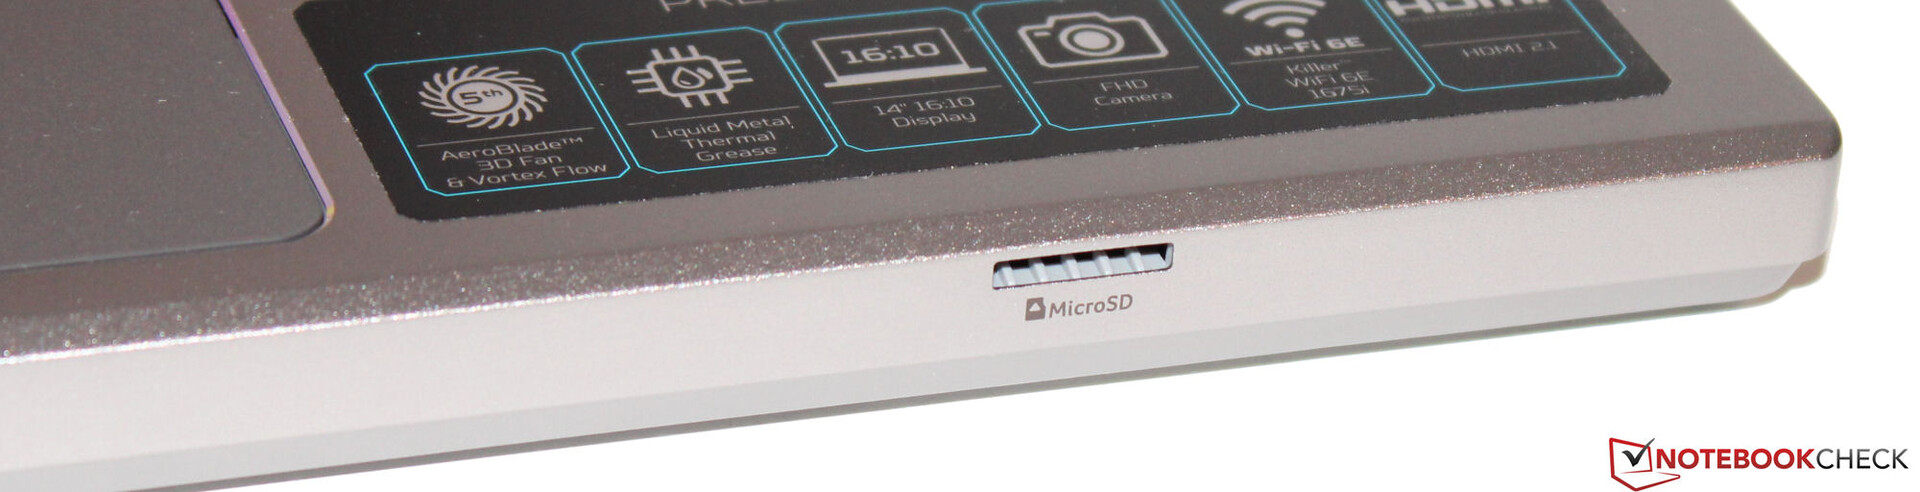
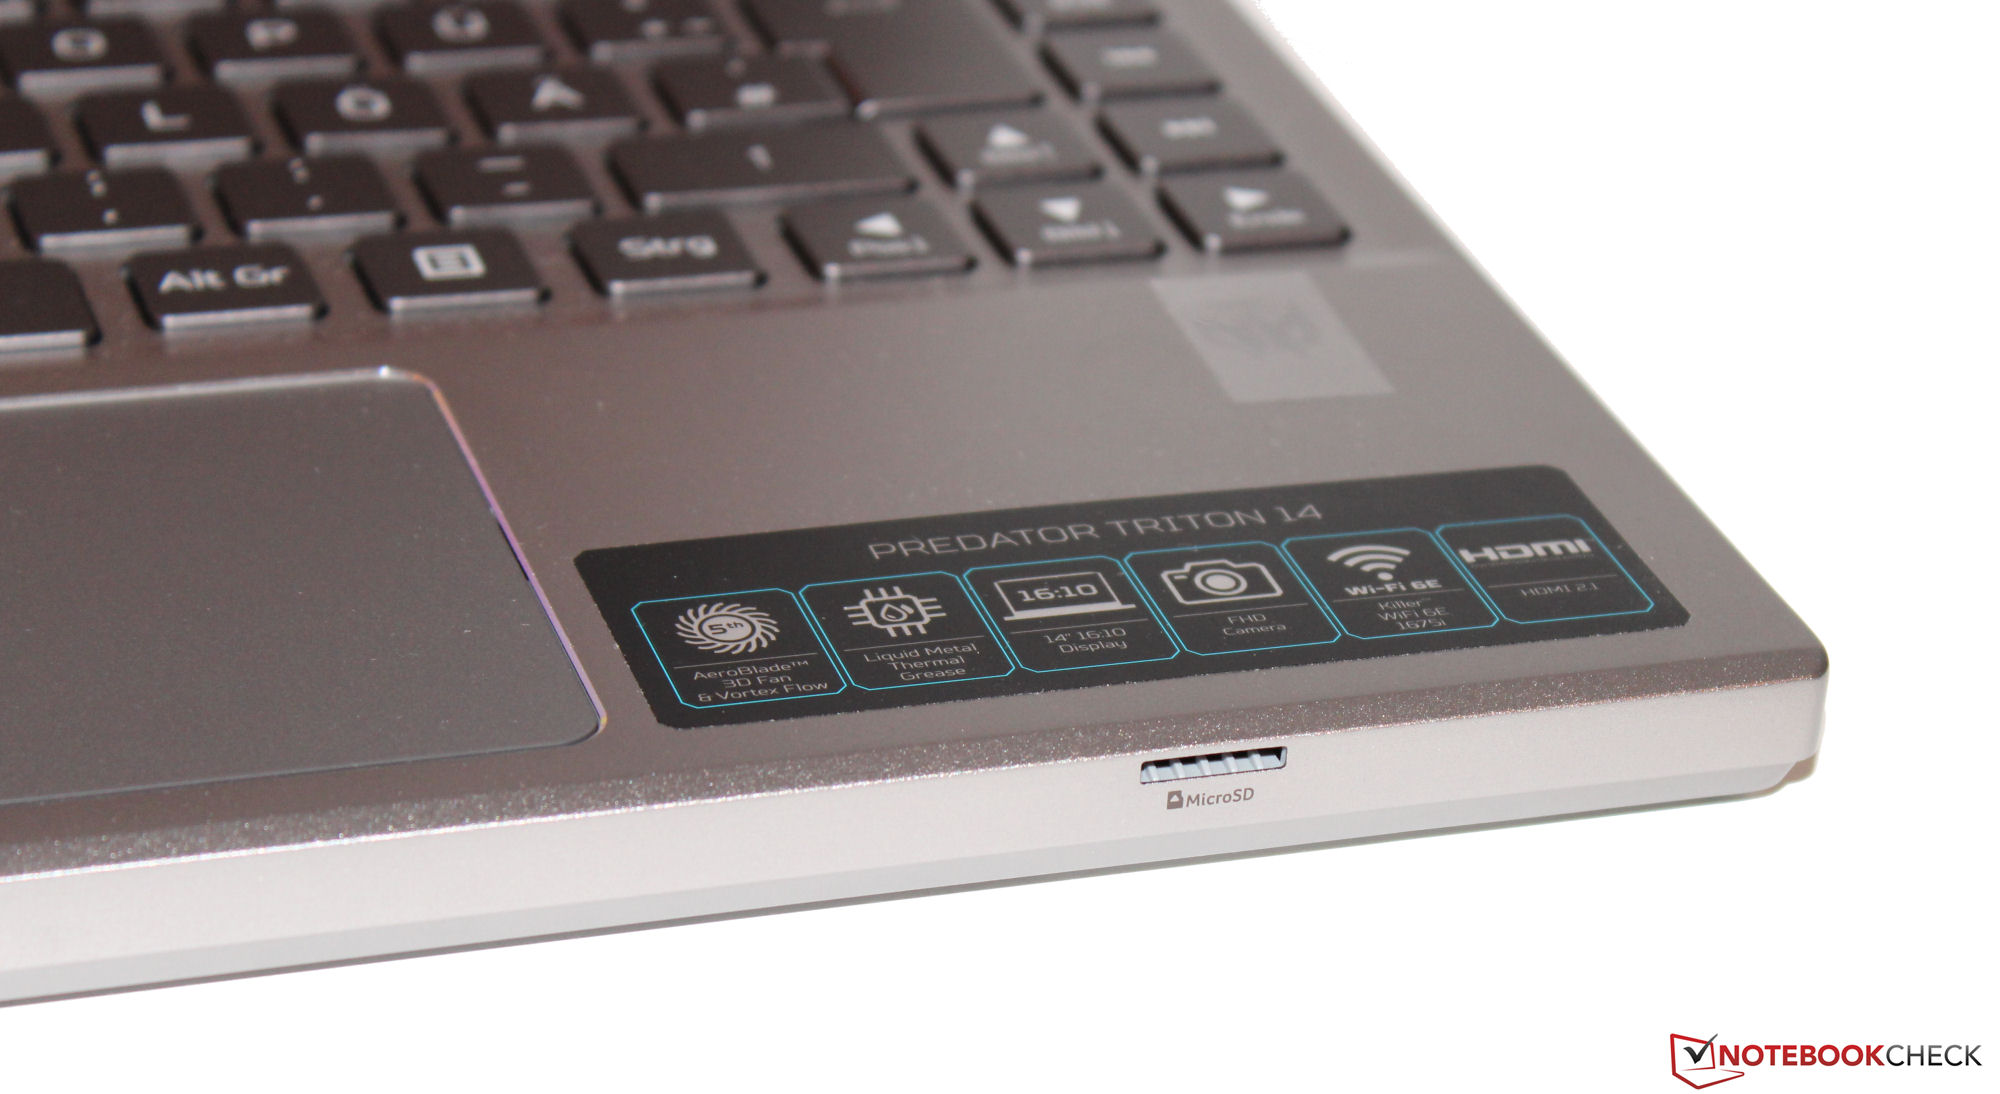
Czytnik kart SD
Czytnik kart pamięci microSD (karta referencyjna: AV PRO microSD 128 GB V60) należy do najwolniejszych modeli z maksymalnymi prędkościami transferu na poziomie 19 MB/s (transfer 250 plików graficznych jpg po około 5 MB każdy) i 26 MB/s (kopiowanie dużych bloków danych).
| SD Card Reader | |
| average JPG Copy Test (av. of 3 runs) | |
| Gigabyte Aero 14 OLED BMF | |
| Asus ROG Zephyrus G14 GA402RJ (AV PRO microSD 128 GB V60) | |
| Średnia w klasie Gaming (20.9 - 210, n=55, ostatnie 2 lata) | |
| Acer Predator Triton 14 PT14-51 (AV PRO microSD 128 GB V60) | |
| maximum AS SSD Seq Read Test (1GB) | |
| Gigabyte Aero 14 OLED BMF | |
| Asus ROG Zephyrus G14 GA402RJ (AV PRO microSD 128 GB V60) | |
| Średnia w klasie Gaming (25.5 - 261, n=52, ostatnie 2 lata) | |
| Acer Predator Triton 14 PT14-51 (AV PRO microSD 128 GB V60) | |
Komunikacja
W optymalnych warunkach (brak urządzeń Wi-Fi w pobliżu, niewielka odległość między laptopem a komputerem serwera) można osiągnąć wspaniałe prędkości transmisji danych Wi-Fi. Laptop ma na pokładzie układ Wi-Fi 6E (Killer AX1675i). Port Ethernet nie jest dostępny.
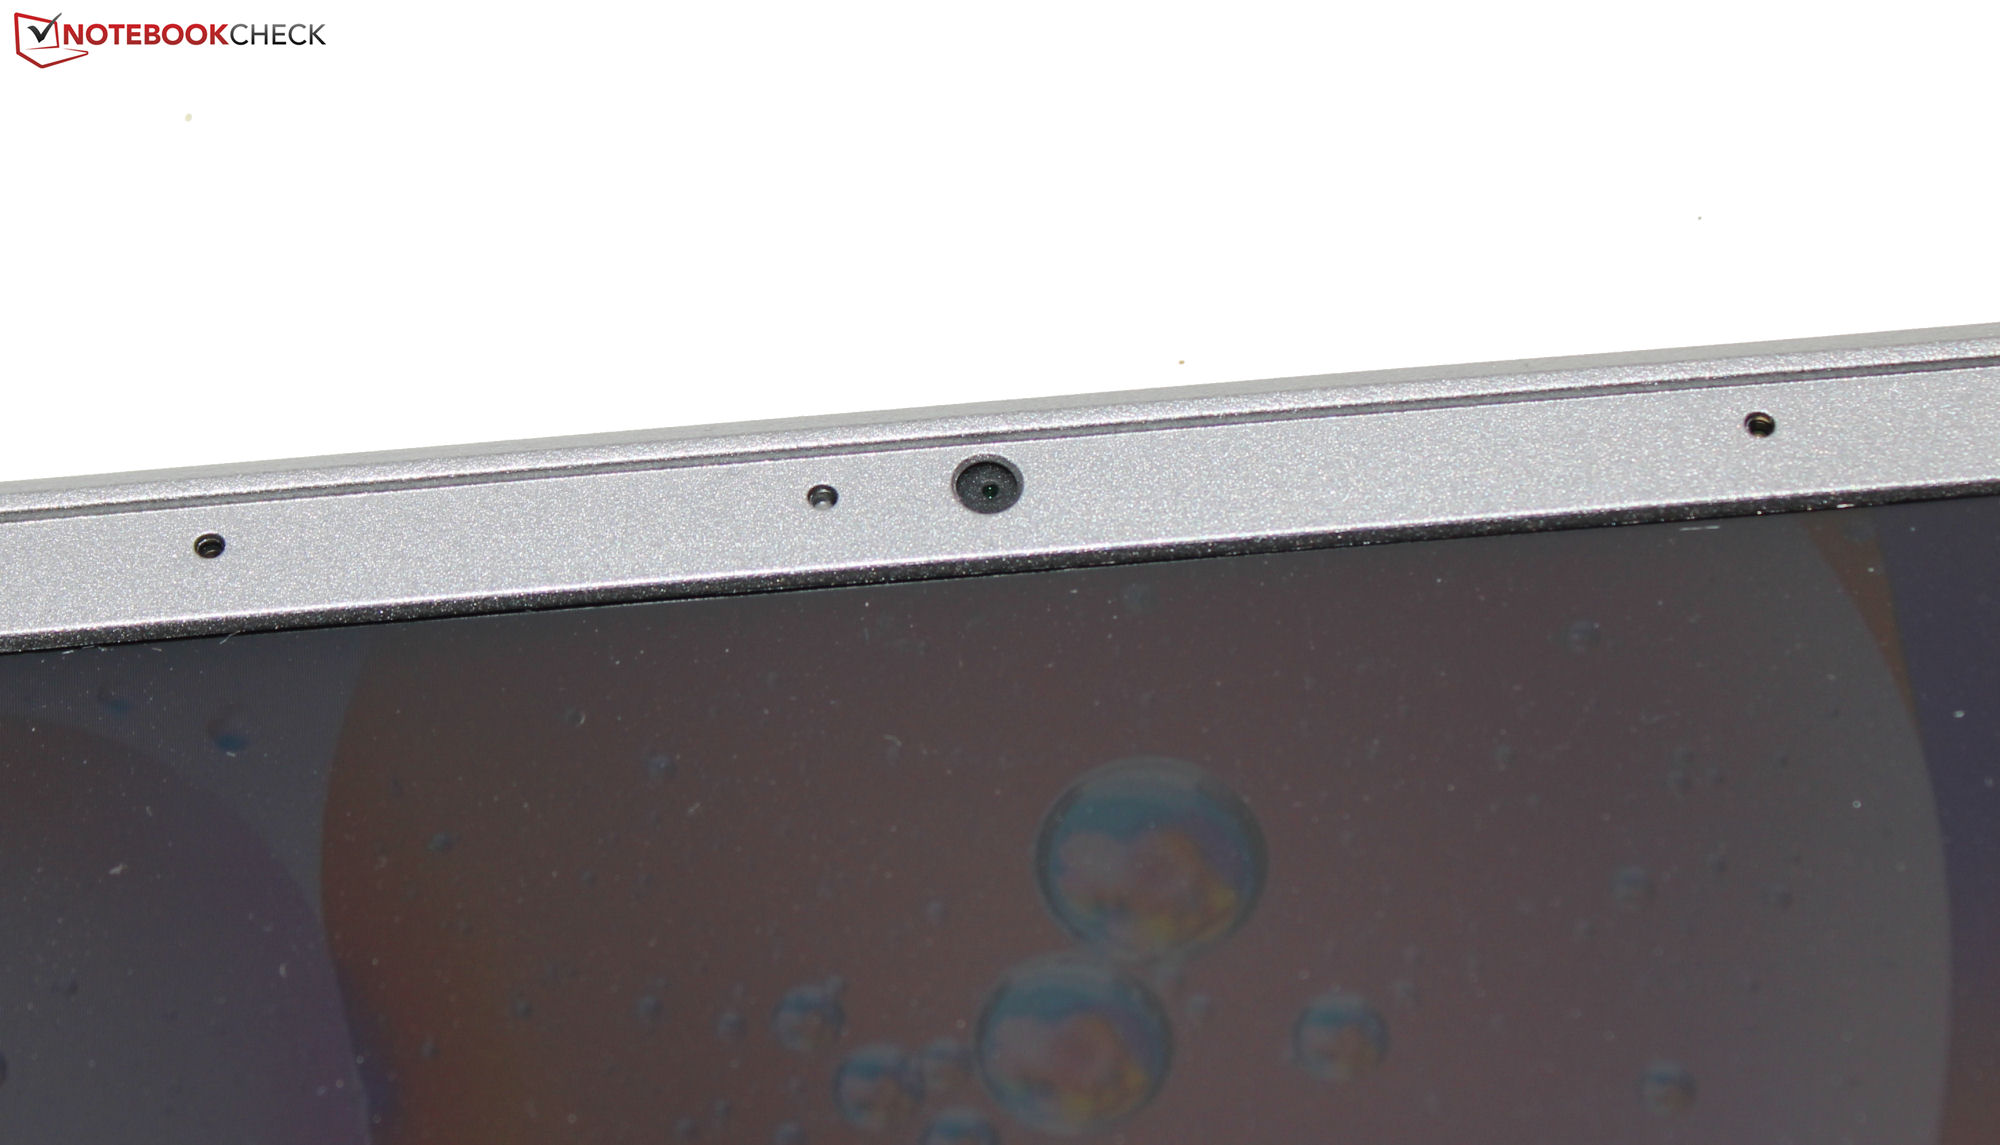
Kamera internetowa
Kamera internetowa (2,1 MP, maks. 1 920 x 1 080 pikseli) nie jest wyposażona w mechaniczną migawkę. Jednak pod względem jakości nie może wyróżnić się na tle konkurencji. Zawodzi w obszarze dokładności odwzorowania kolorów, które odbiegają od wartości docelowych.


Akcesoria
Oprócz zwykłych dokumentów (skrócona instrukcja obsługi i informacje o gwarancji), do laptopa nie dołączono żadnych dodatkowych akcesoriów.
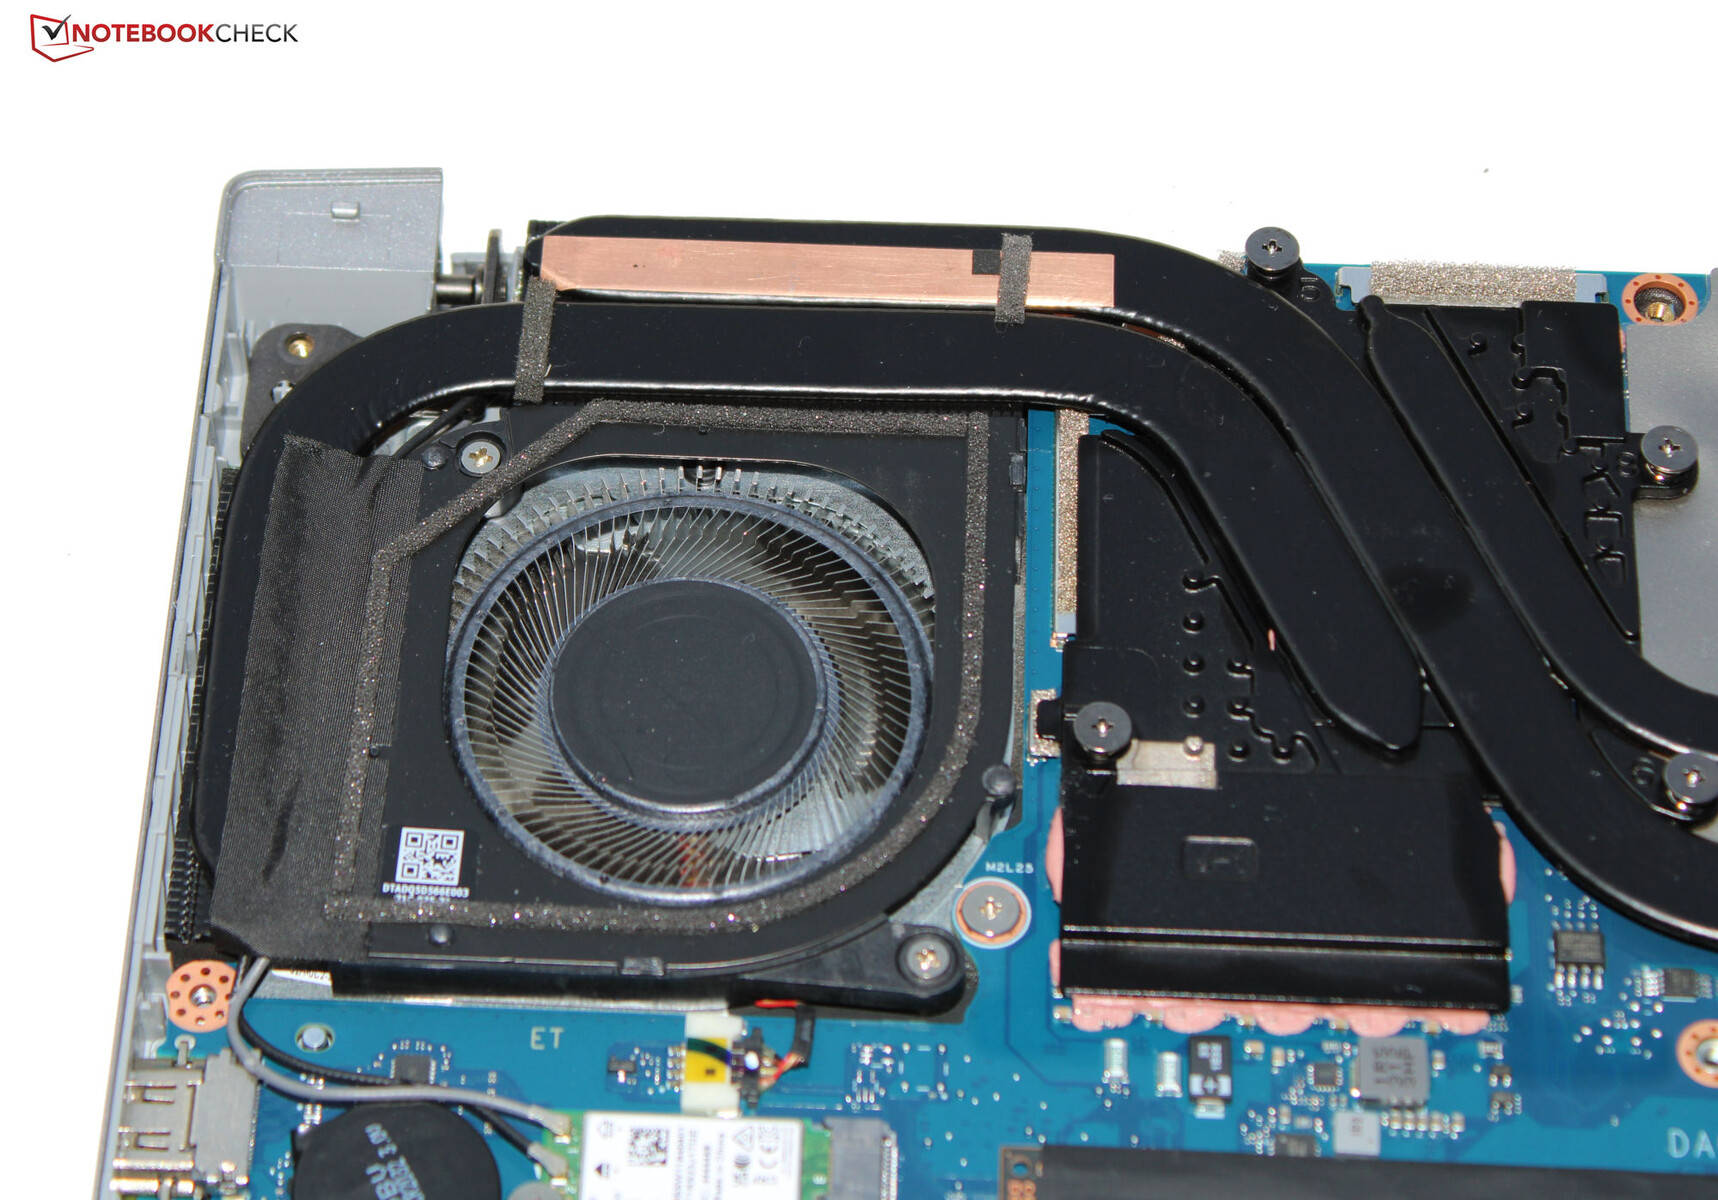
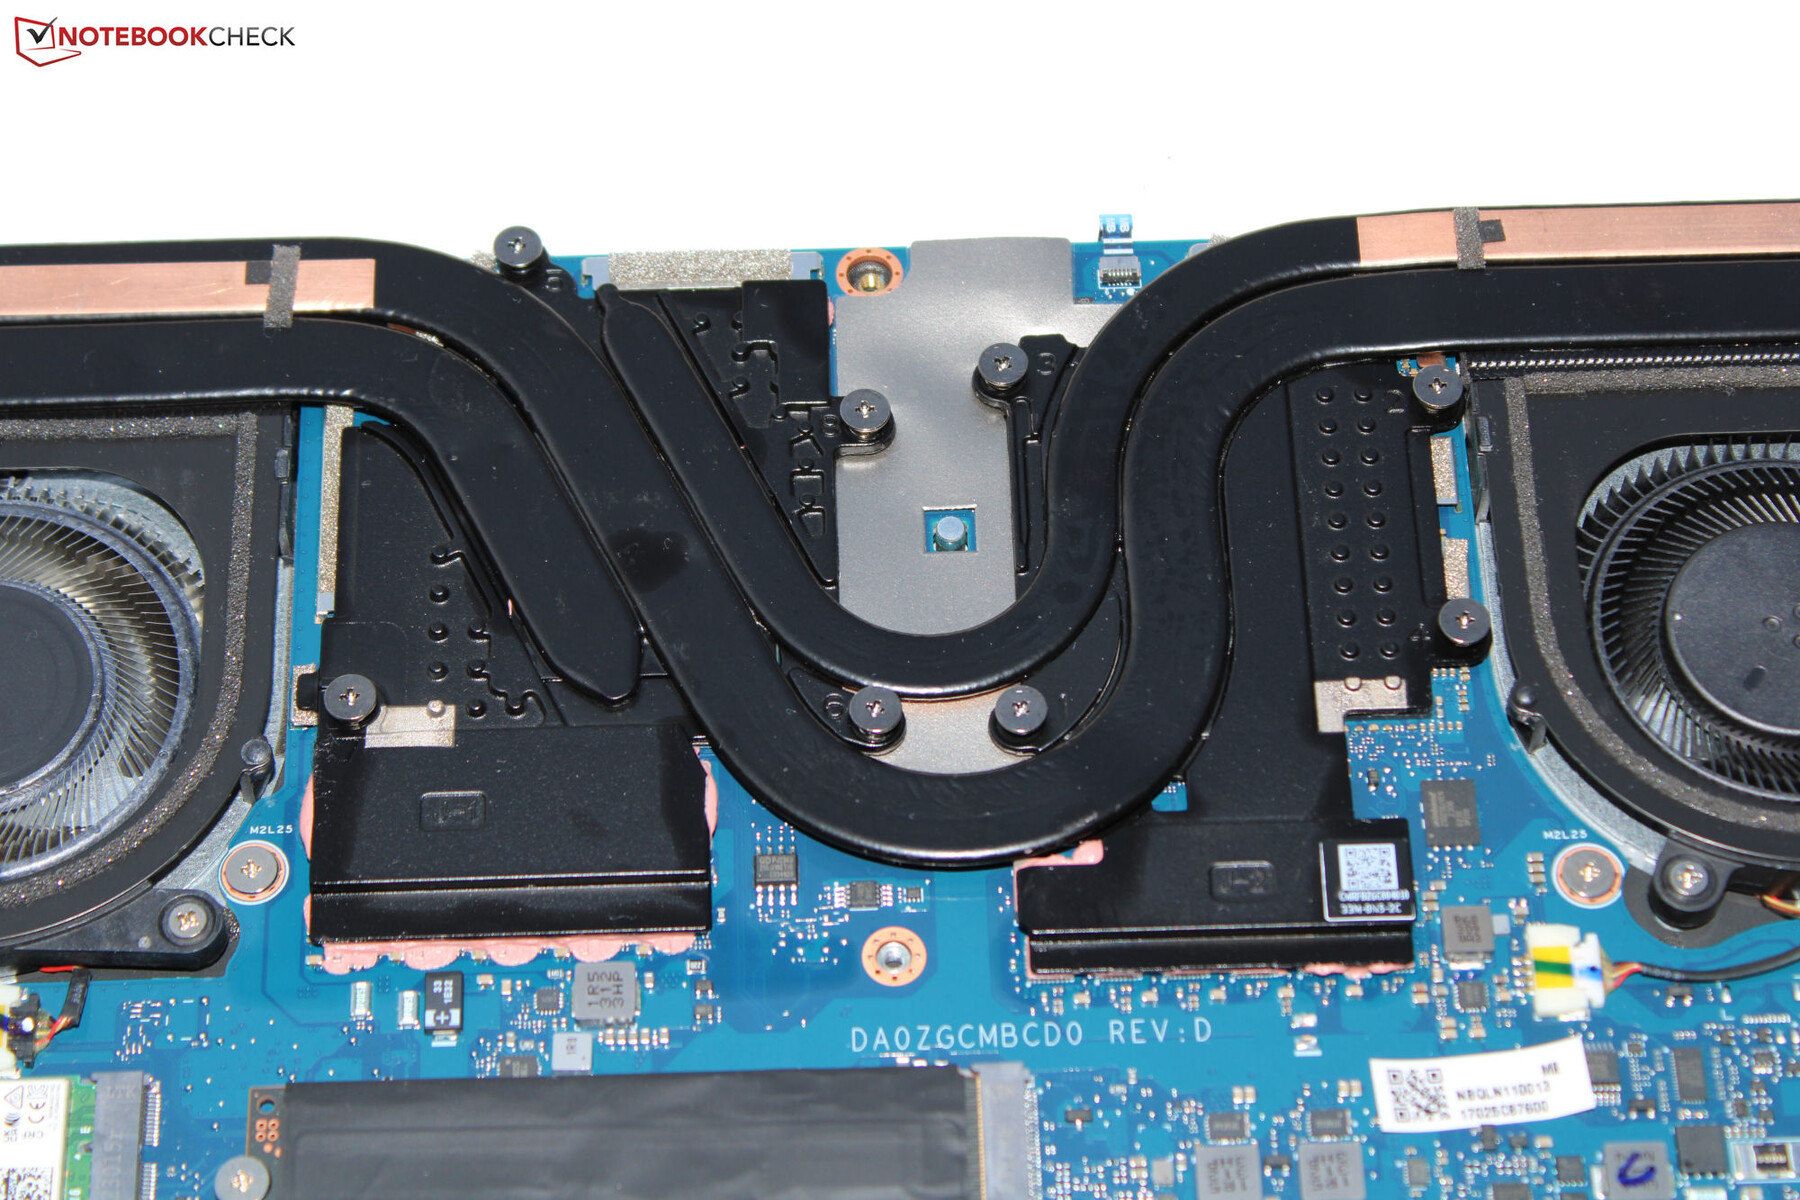
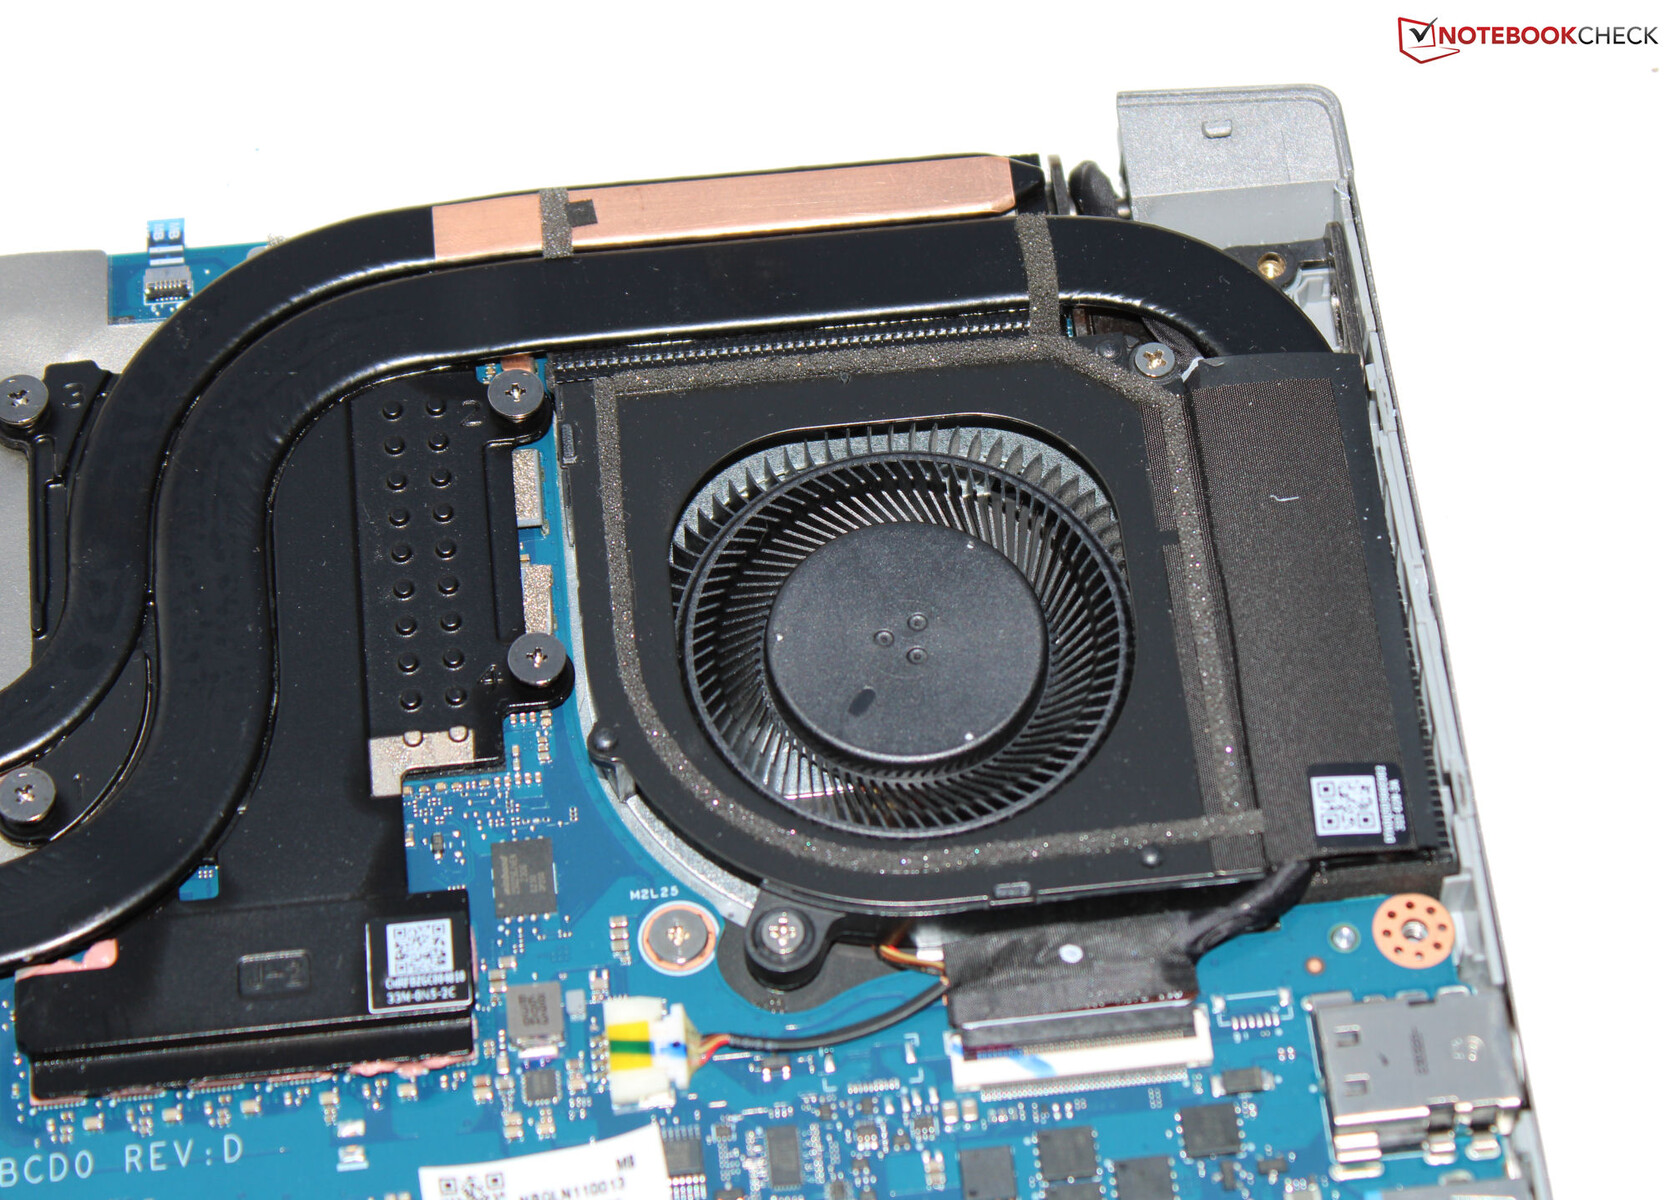
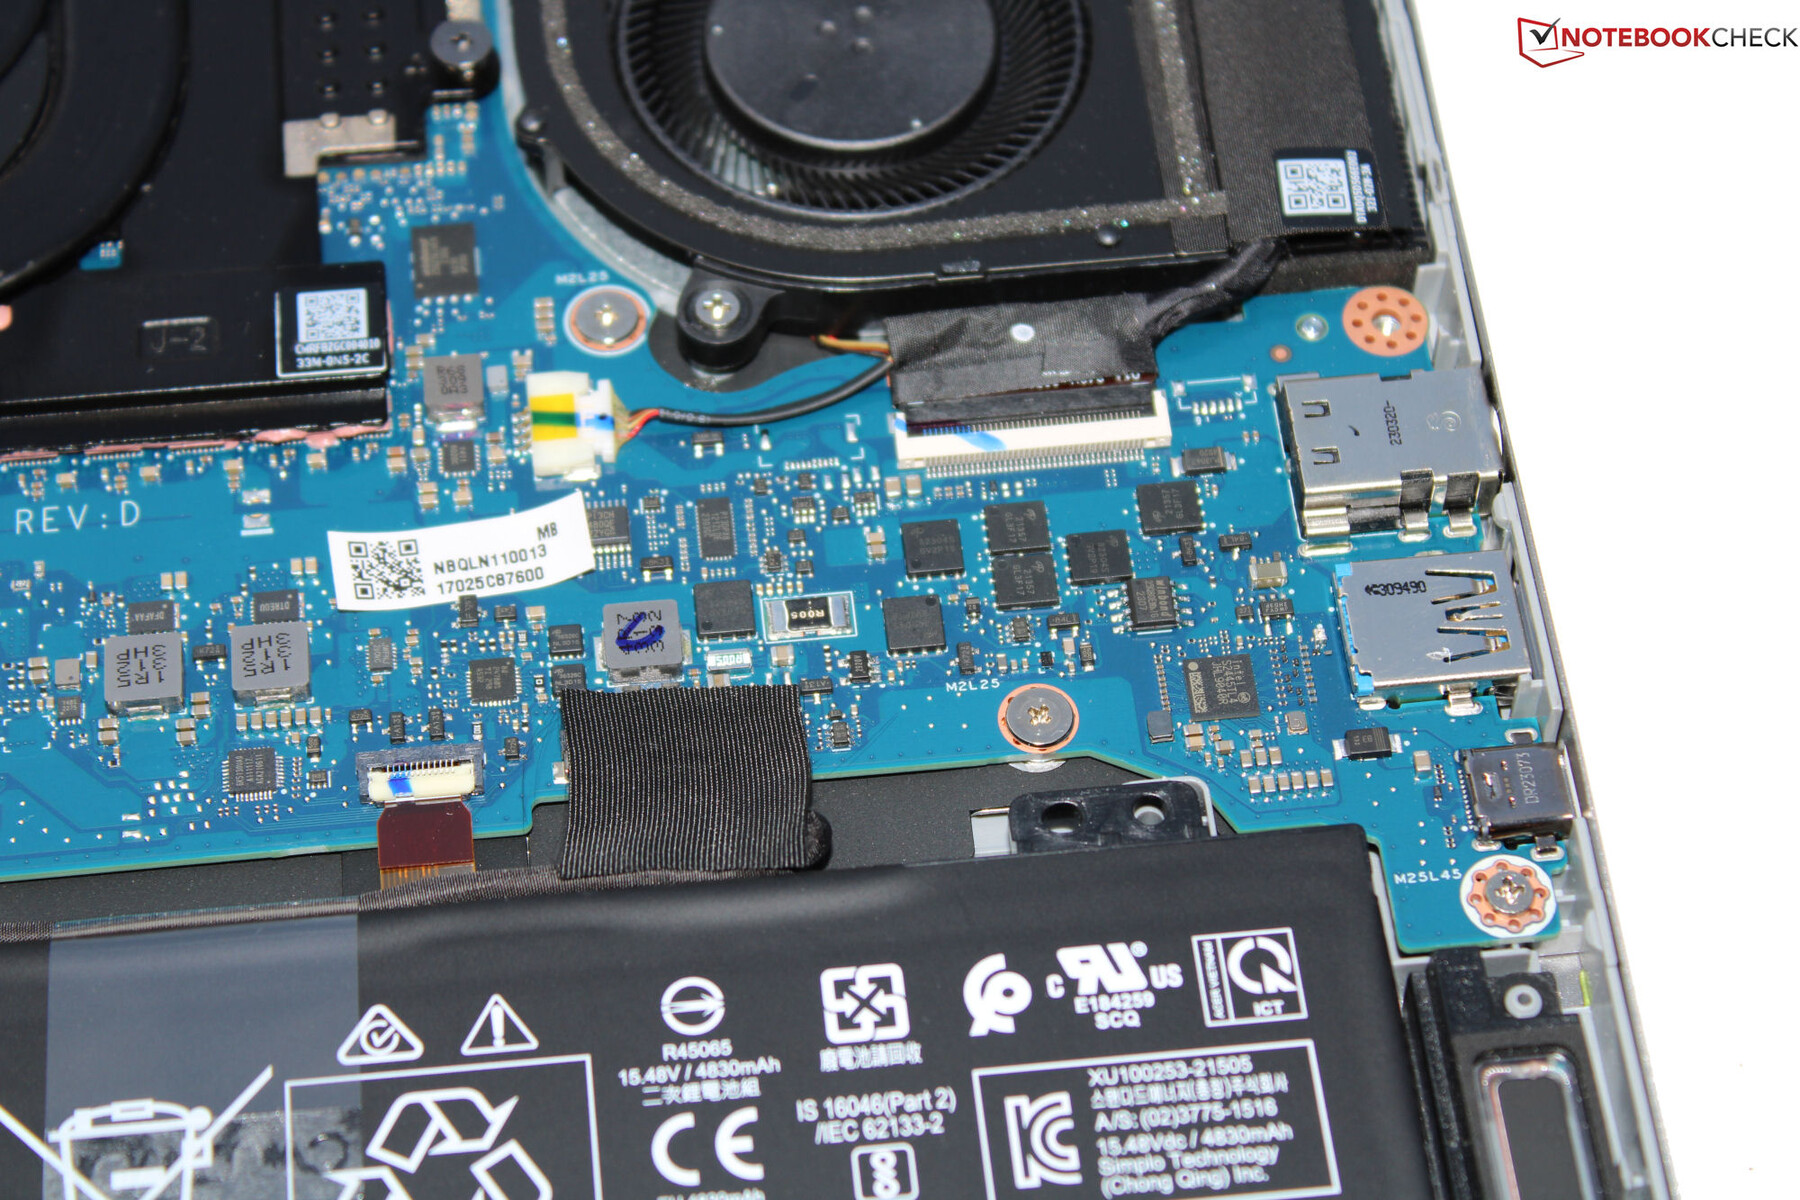
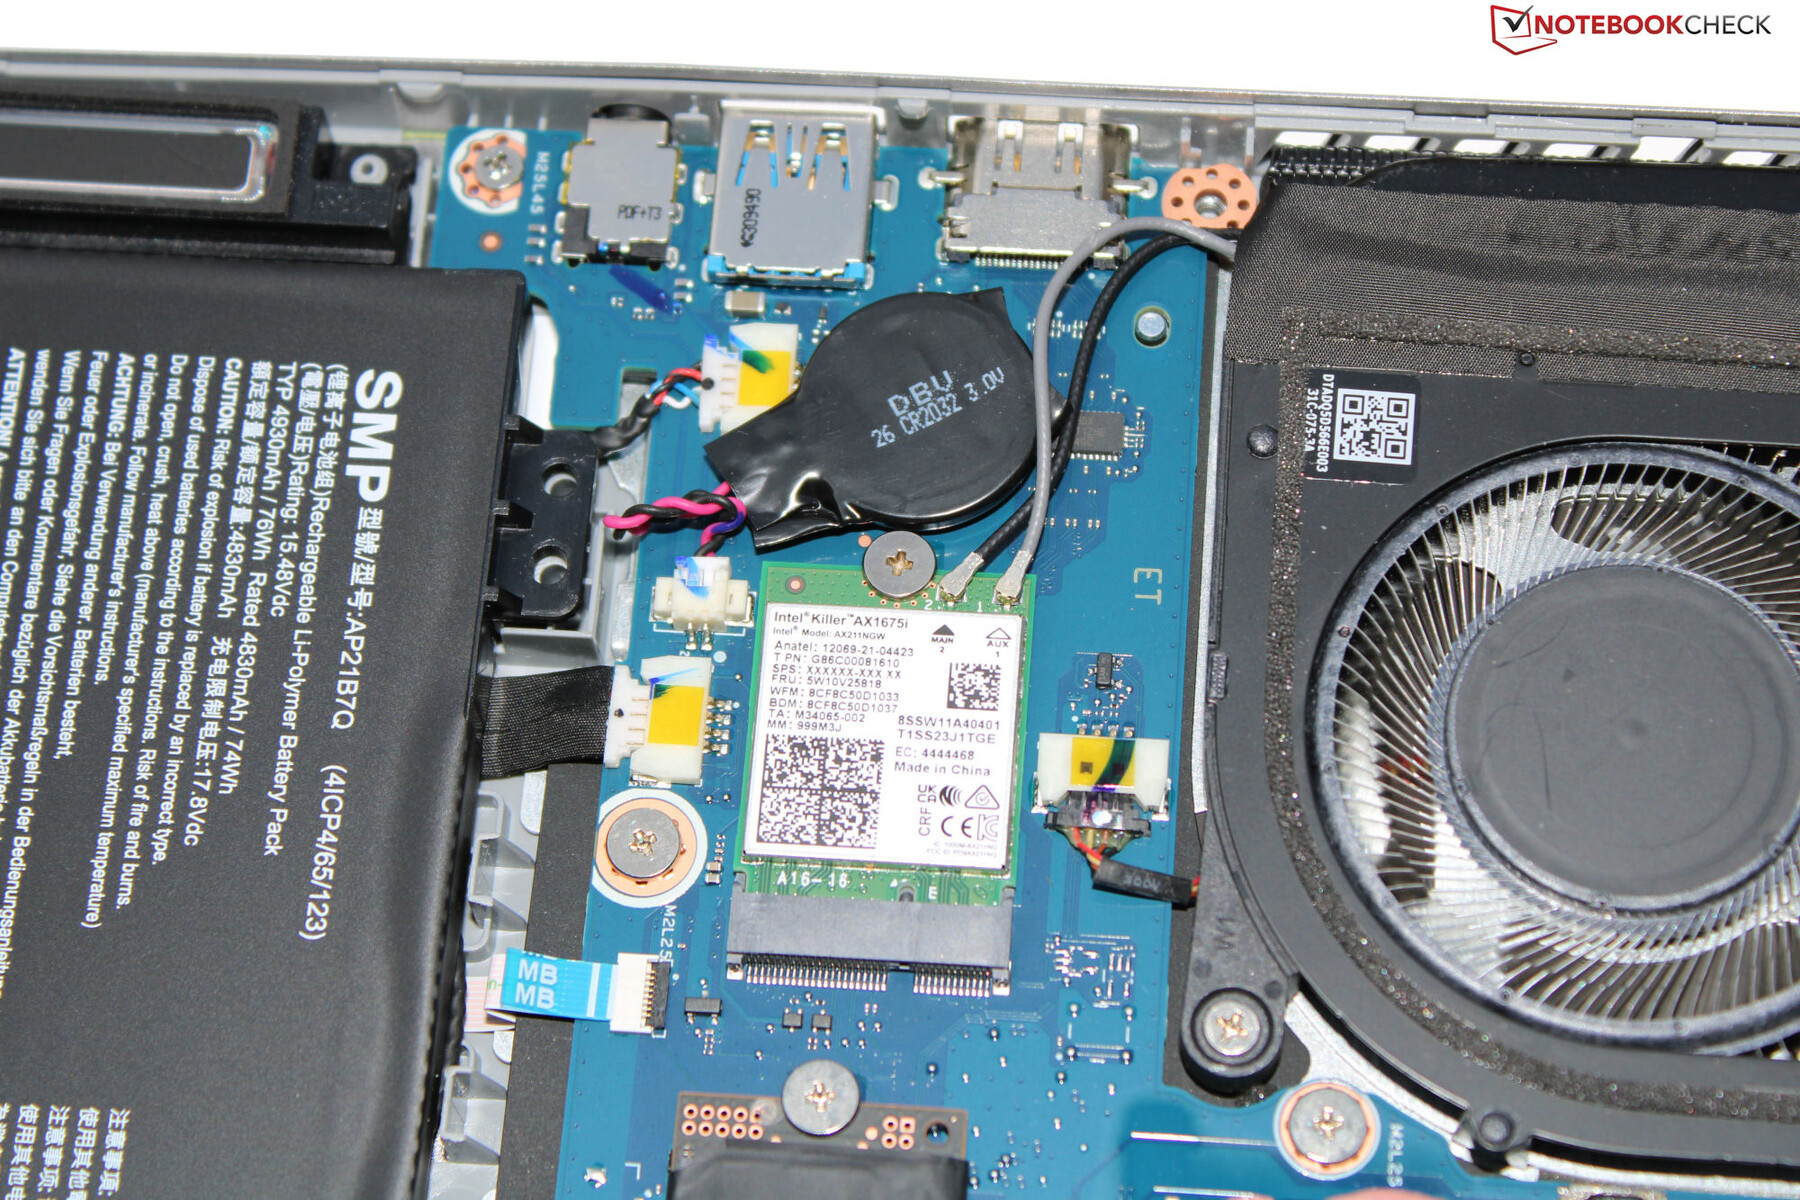
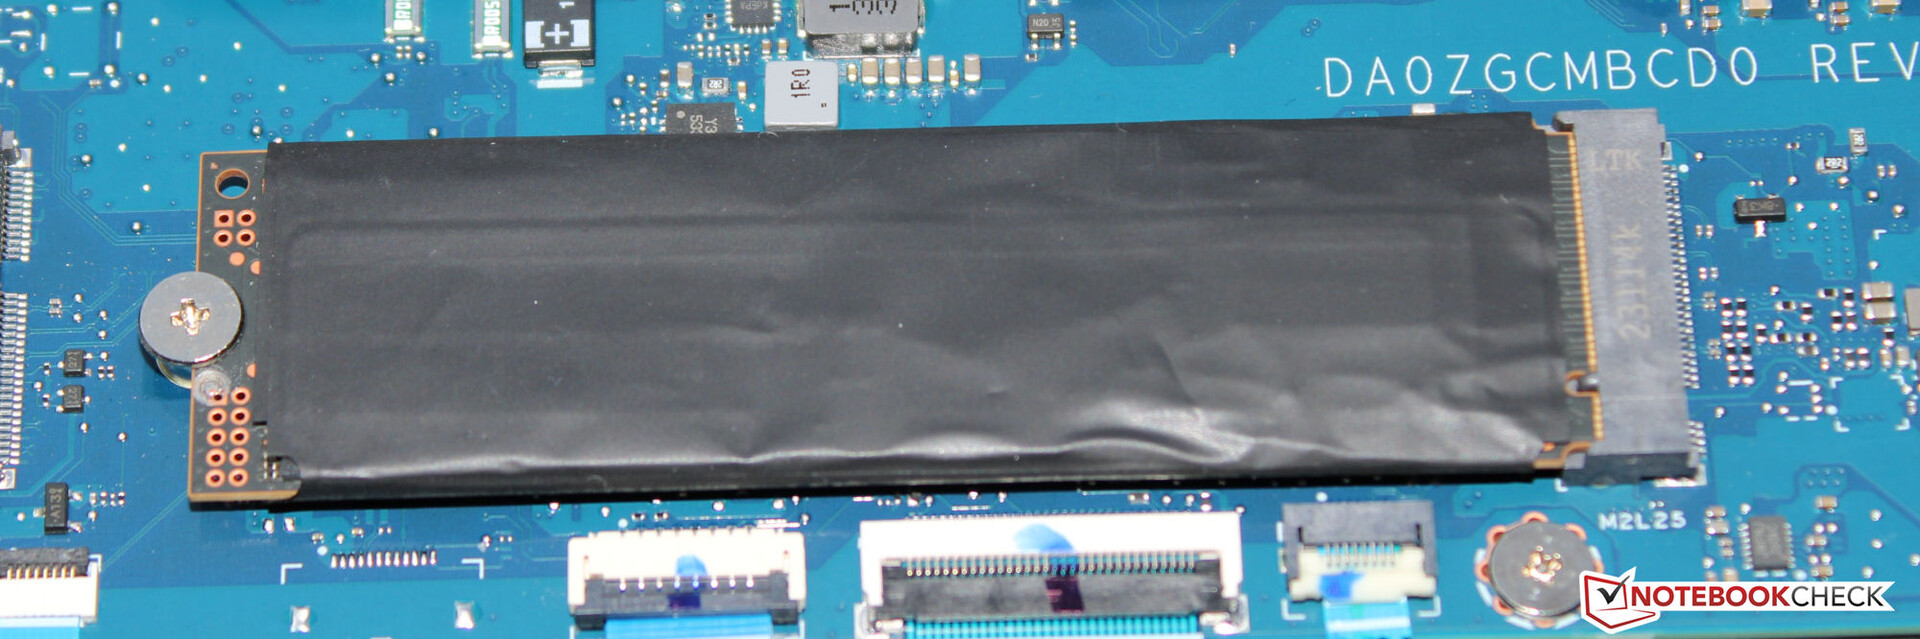
Konserwacja
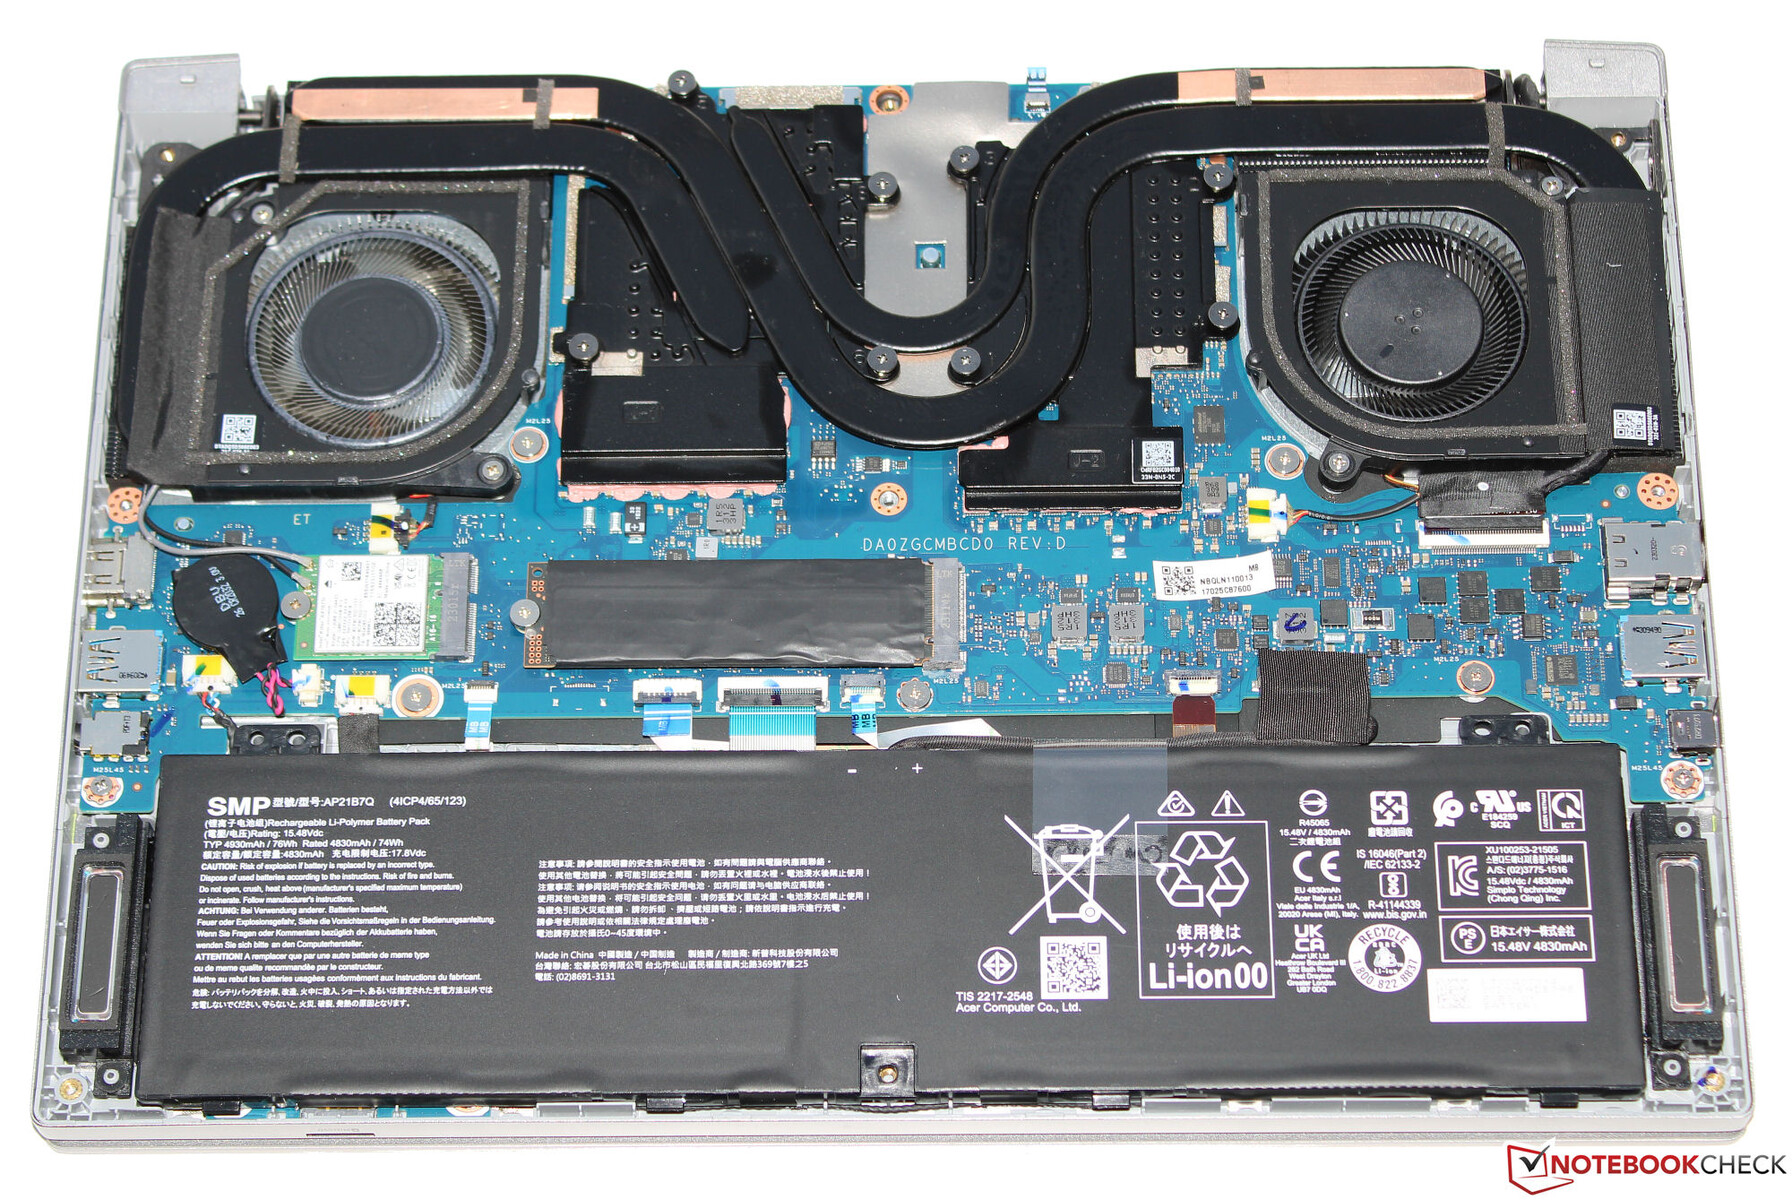
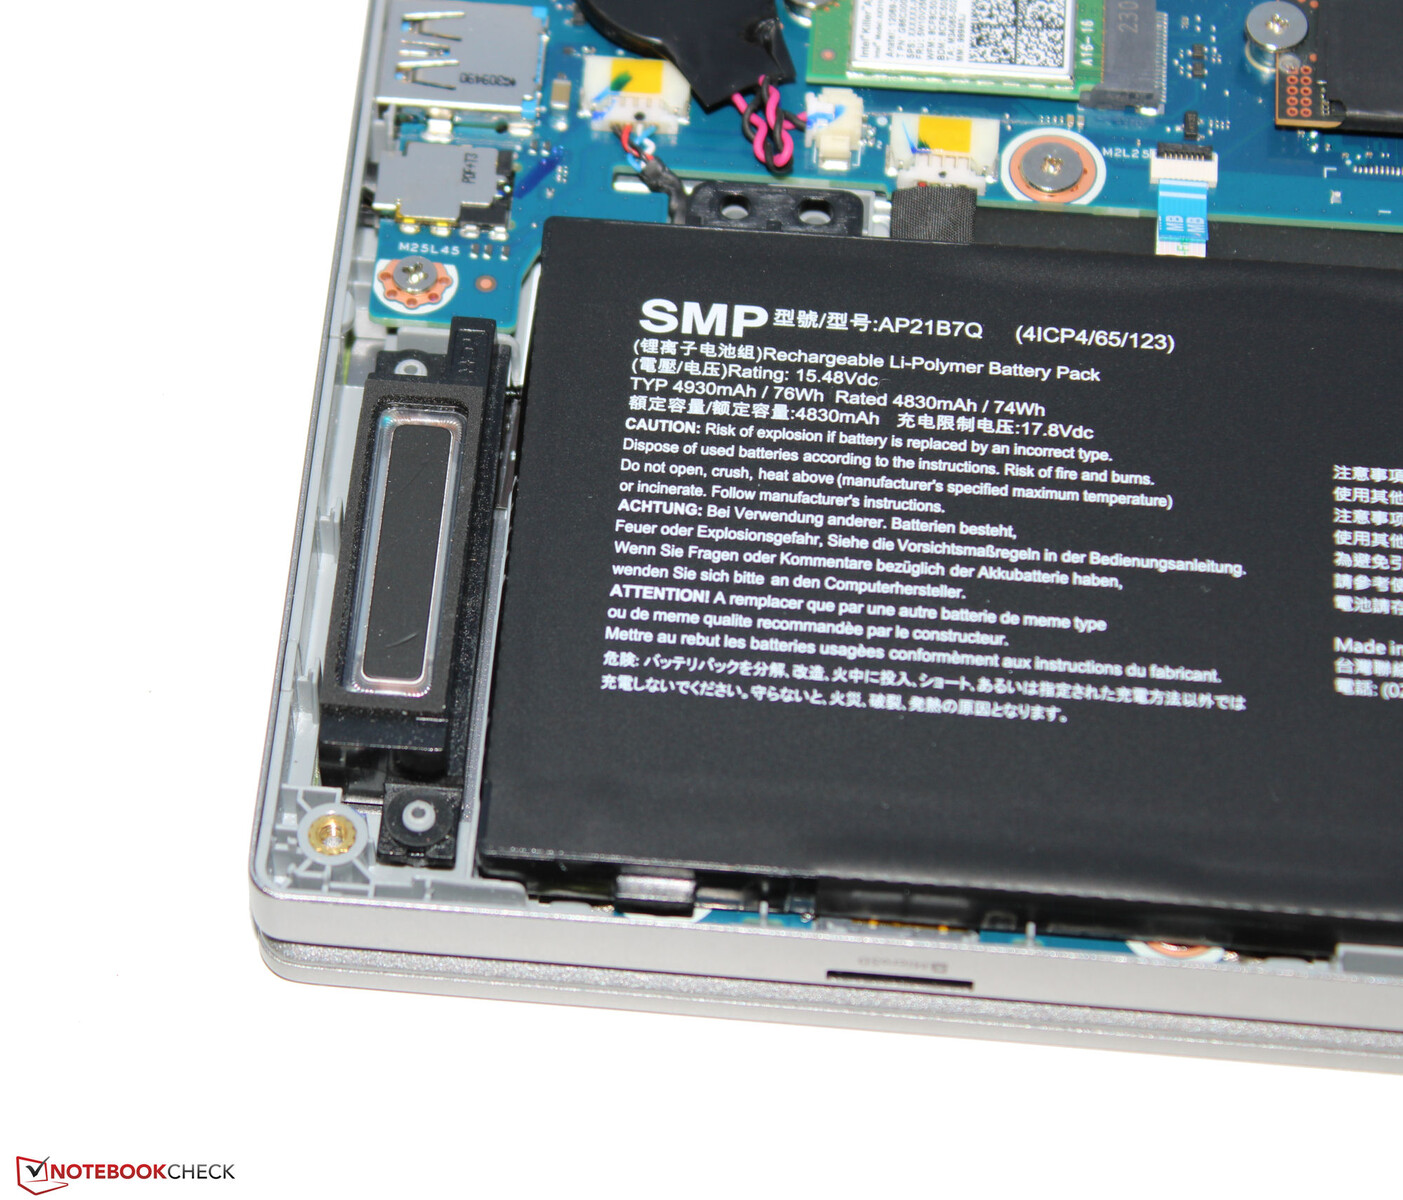
Po odkręceniu wszystkich śrub na podstawie urządzenia, dolną część obudowy można zdjąć za pomocą plektronu. Pozwala to uzyskać dostęp do dysku SSD (PCIe 4, M.2 2280), baterii BIOS, modułu Wi-Fi, wentylatorów, głośników i akumulatora.
Gwarancja
Acer objął 14-calowe urządzenie dwuletnią gwarancją. Przedłużenie jej do trzech lat kosztuje prawie 100 dolarów.
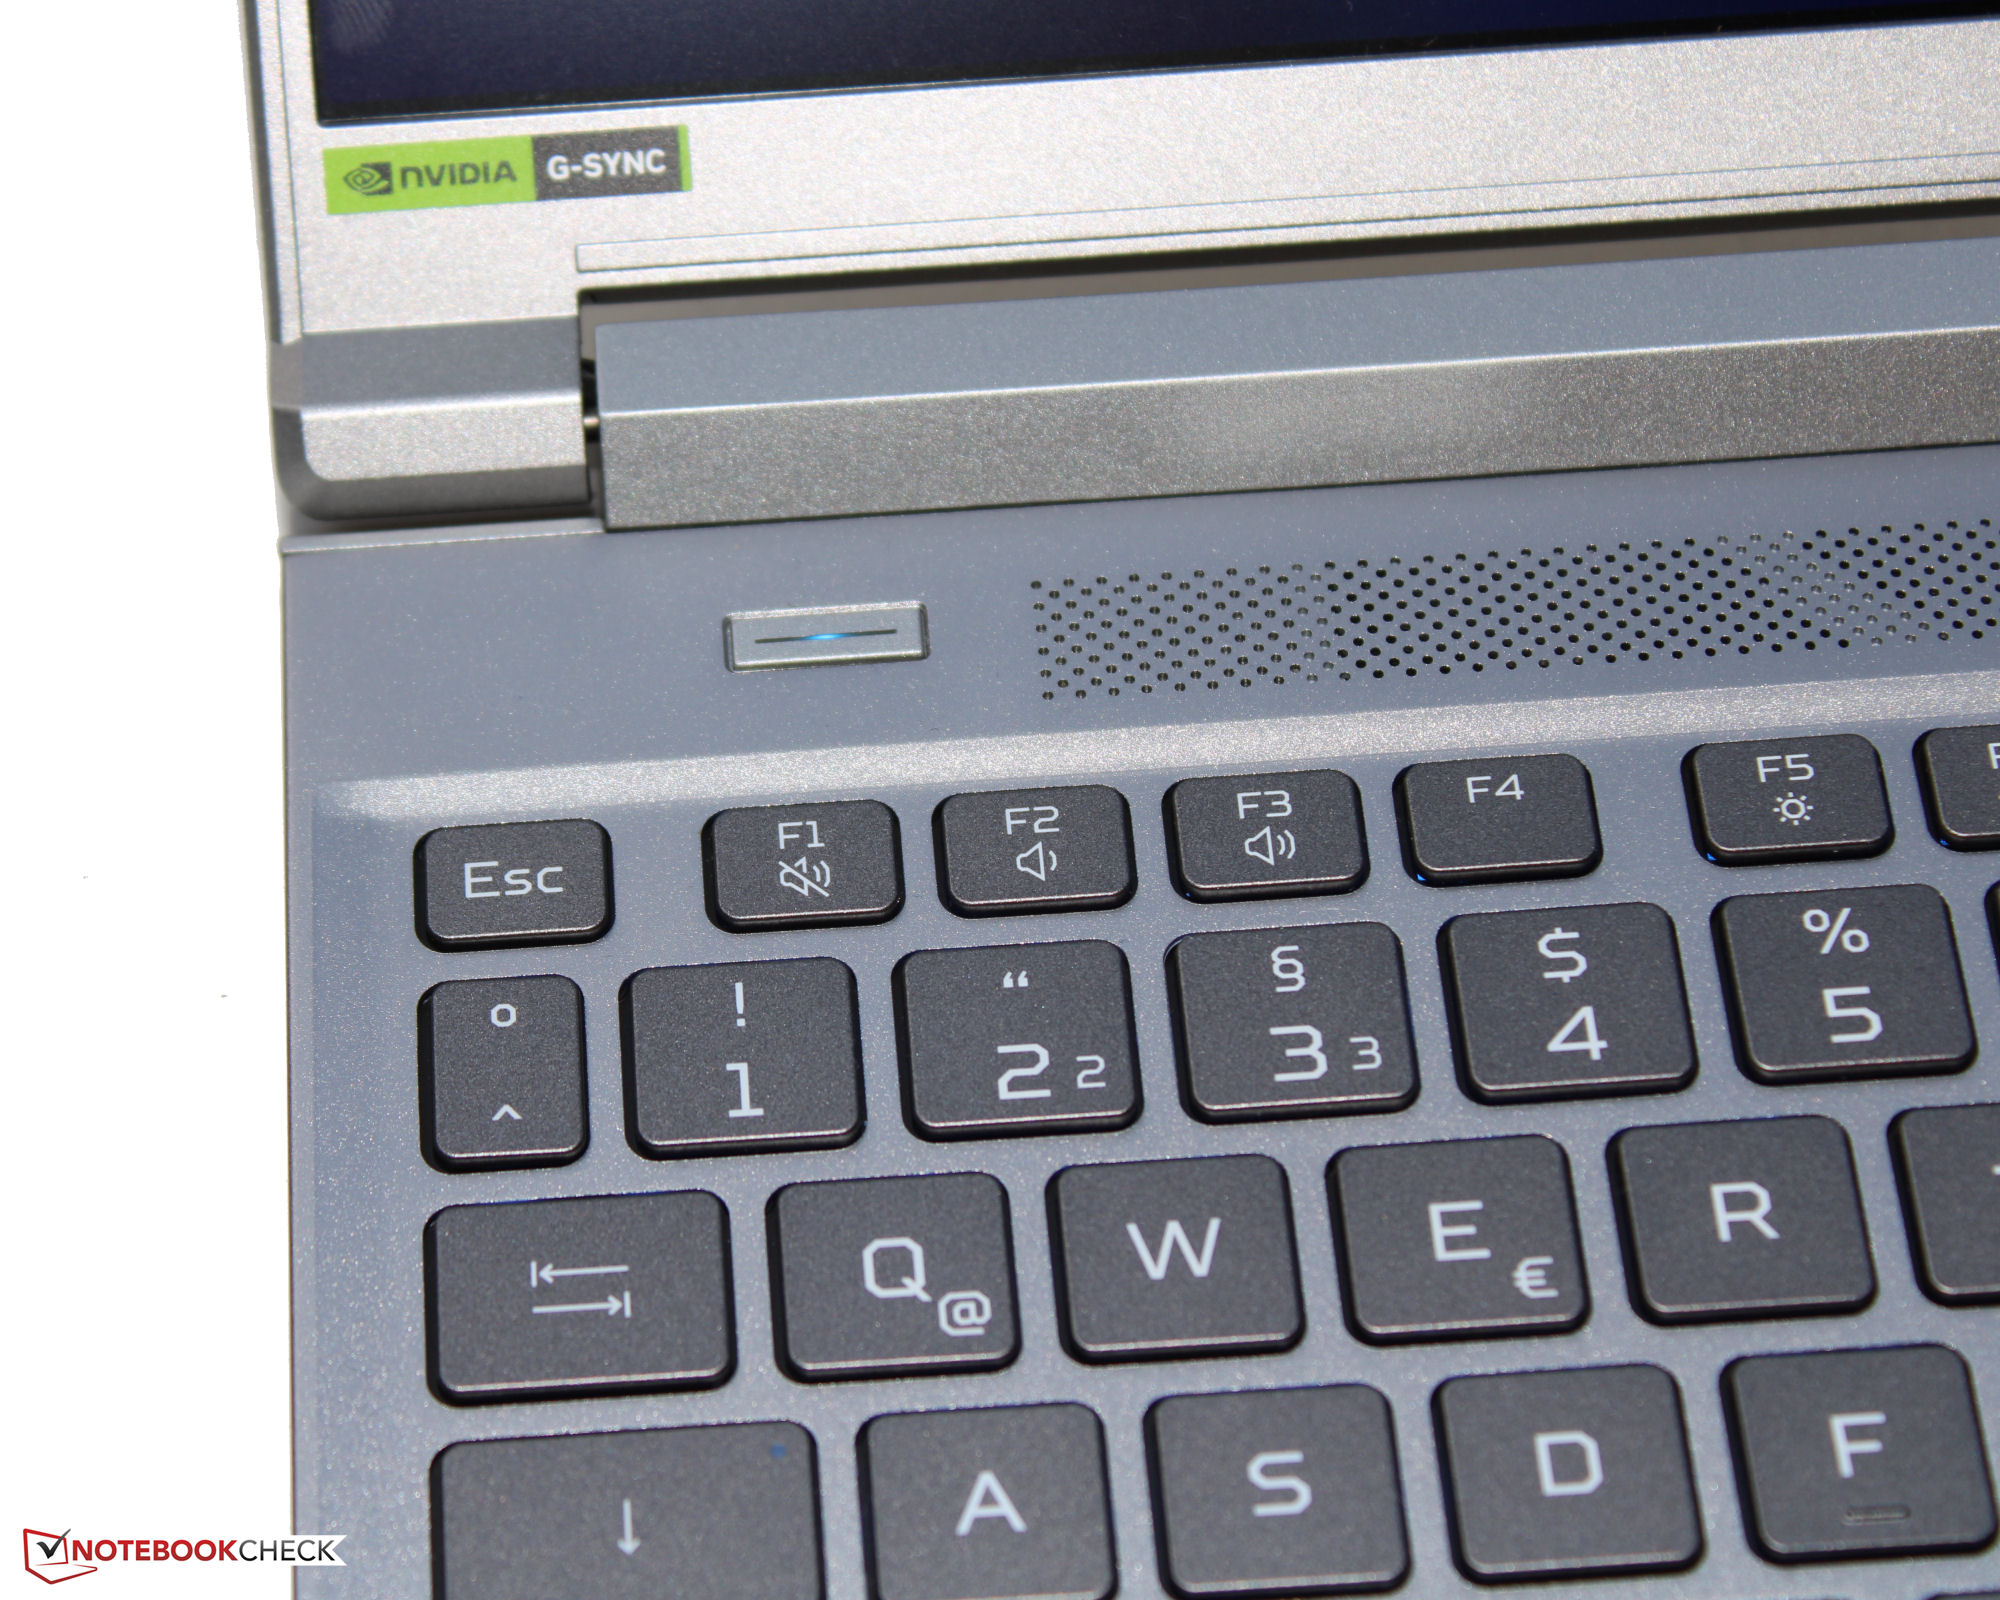
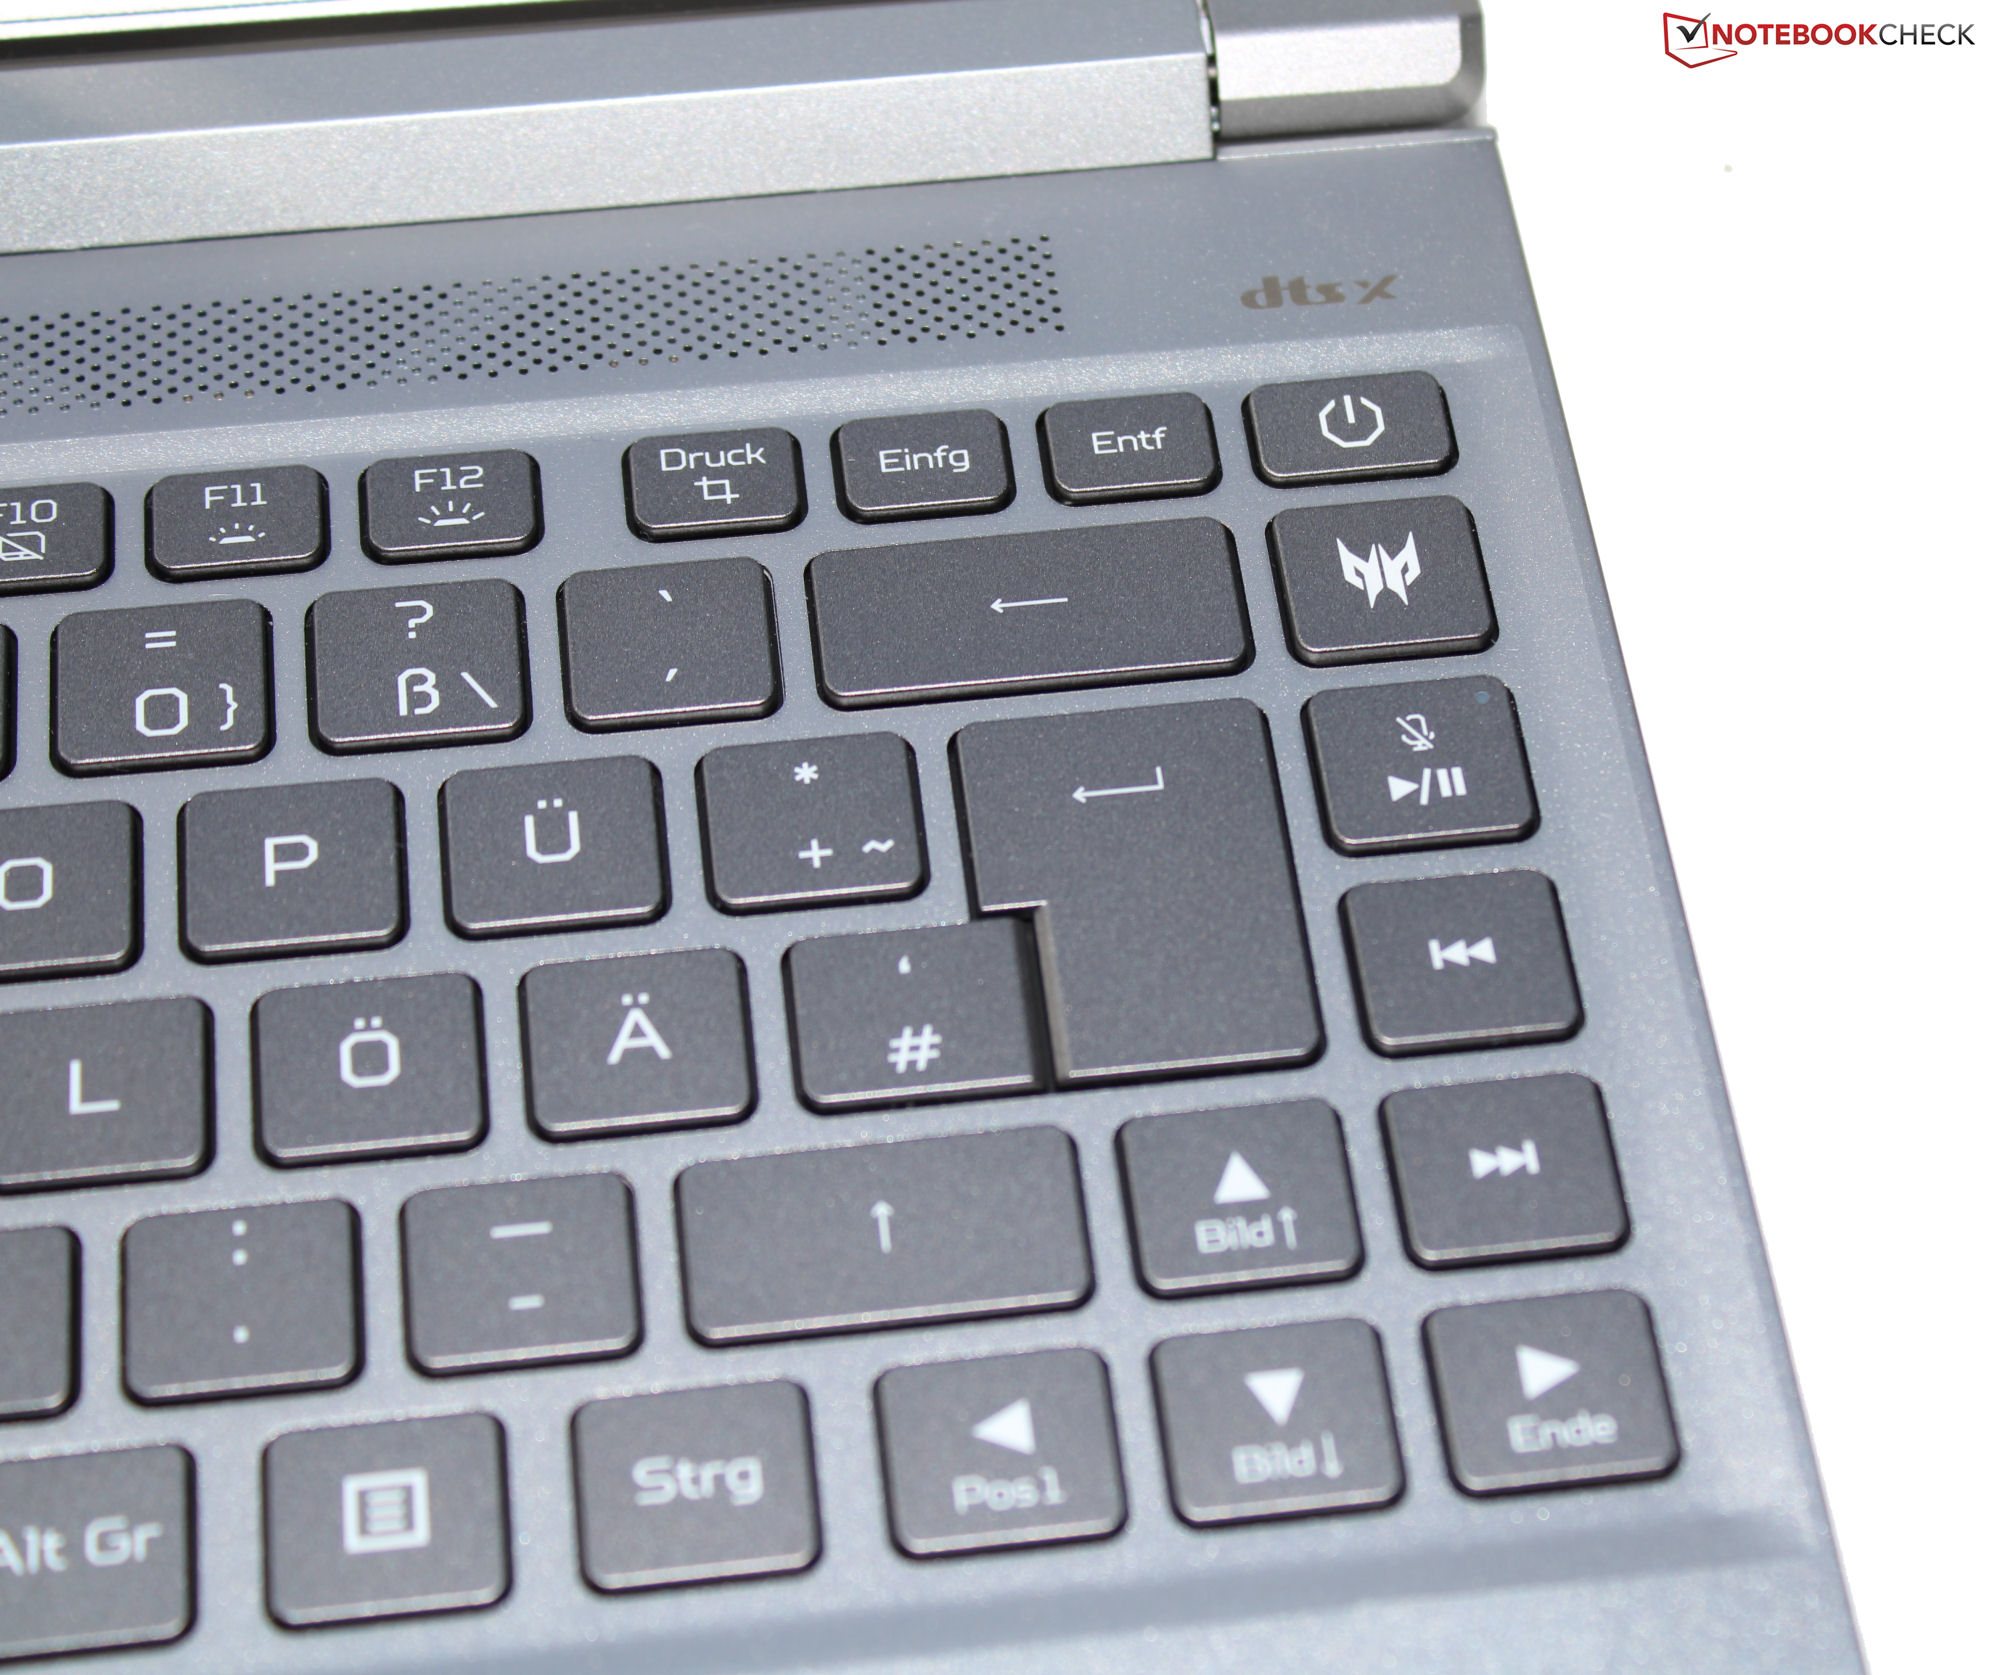
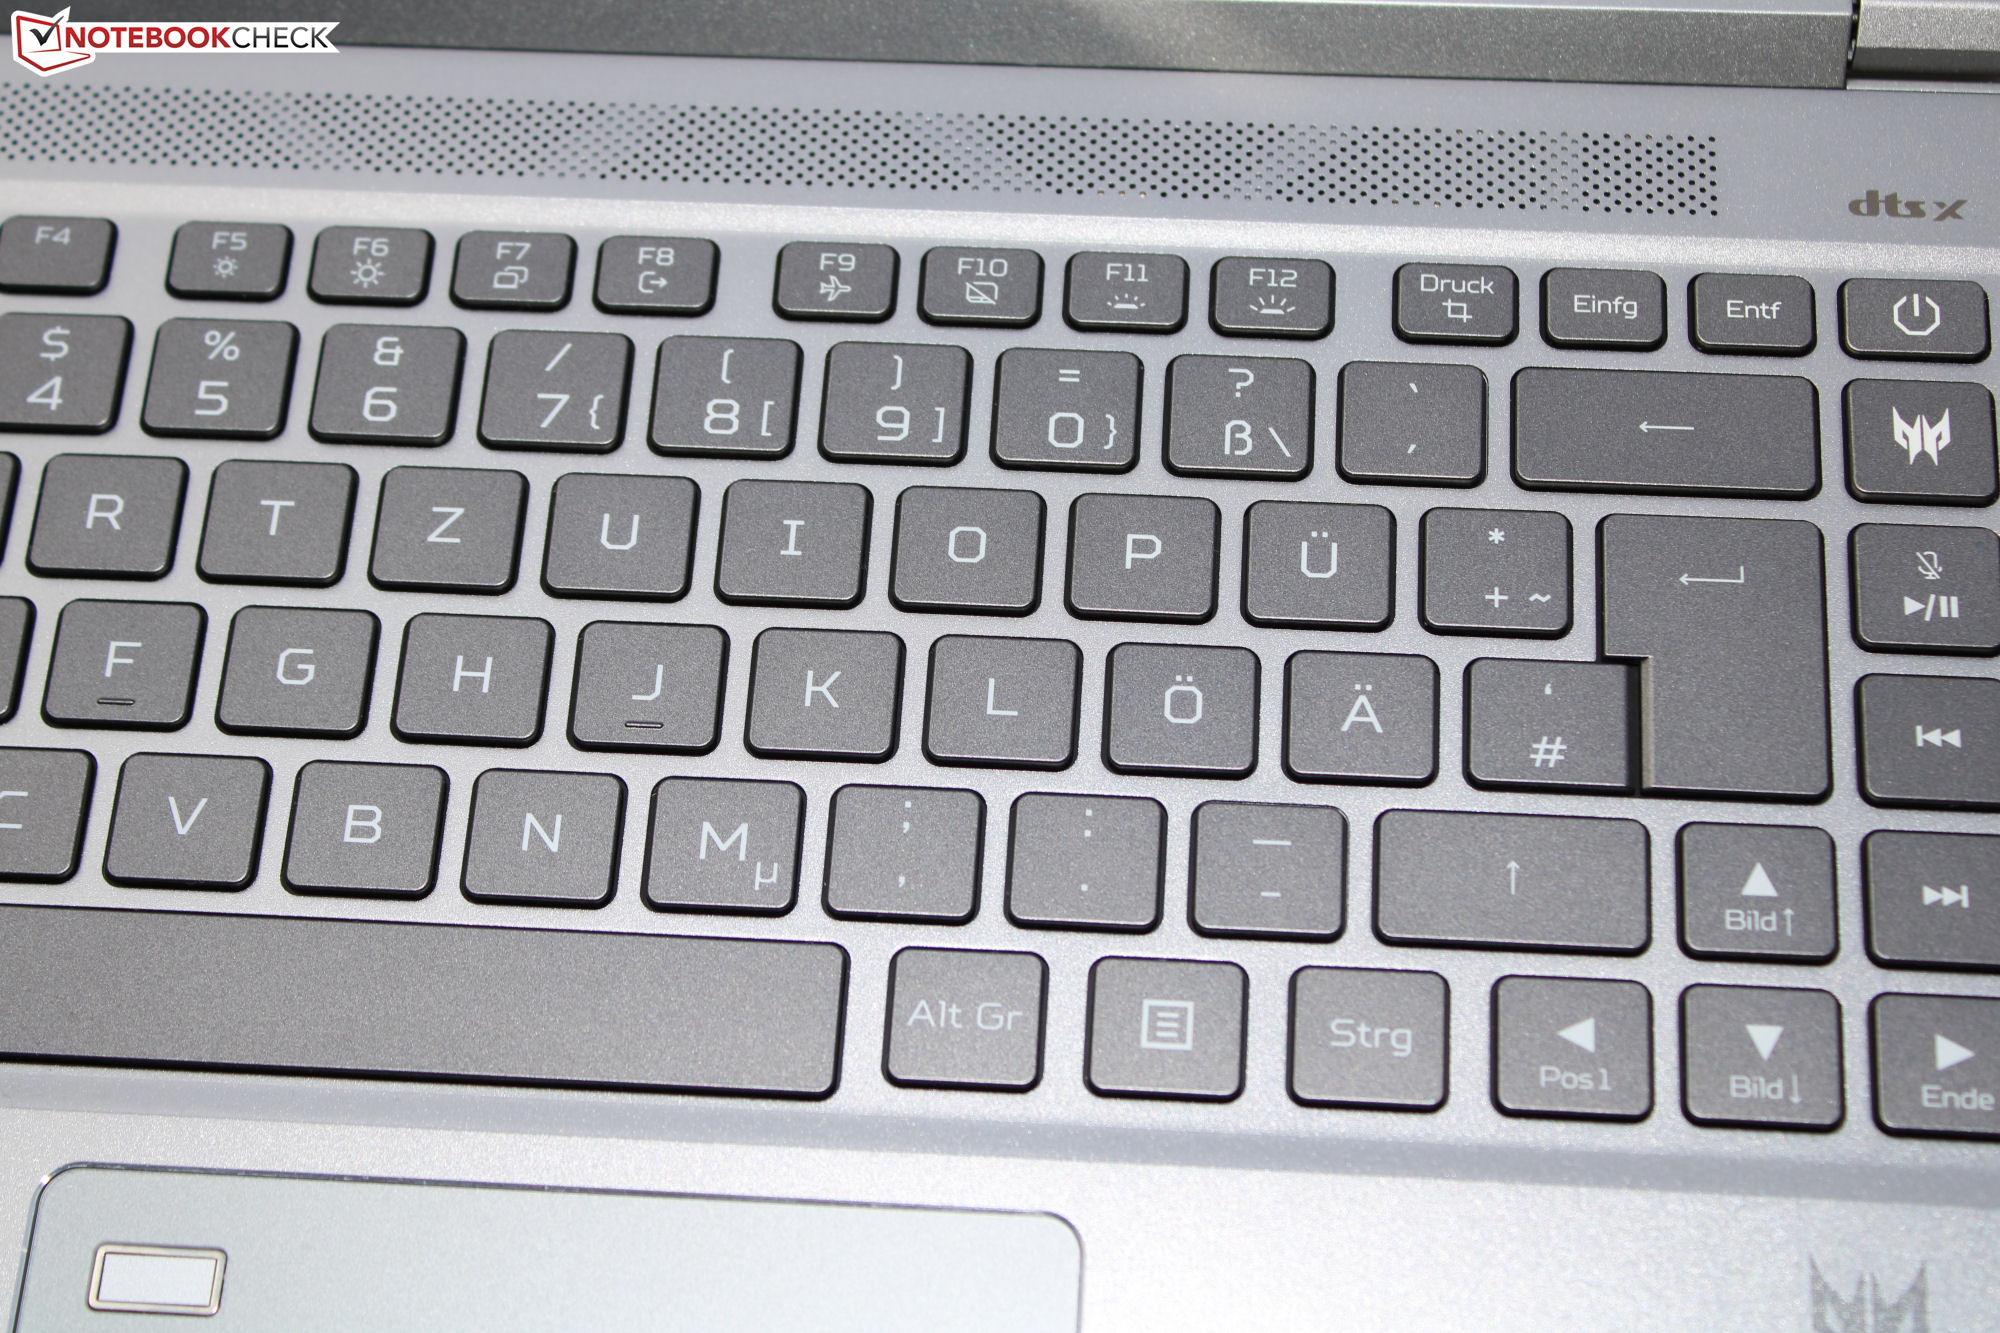
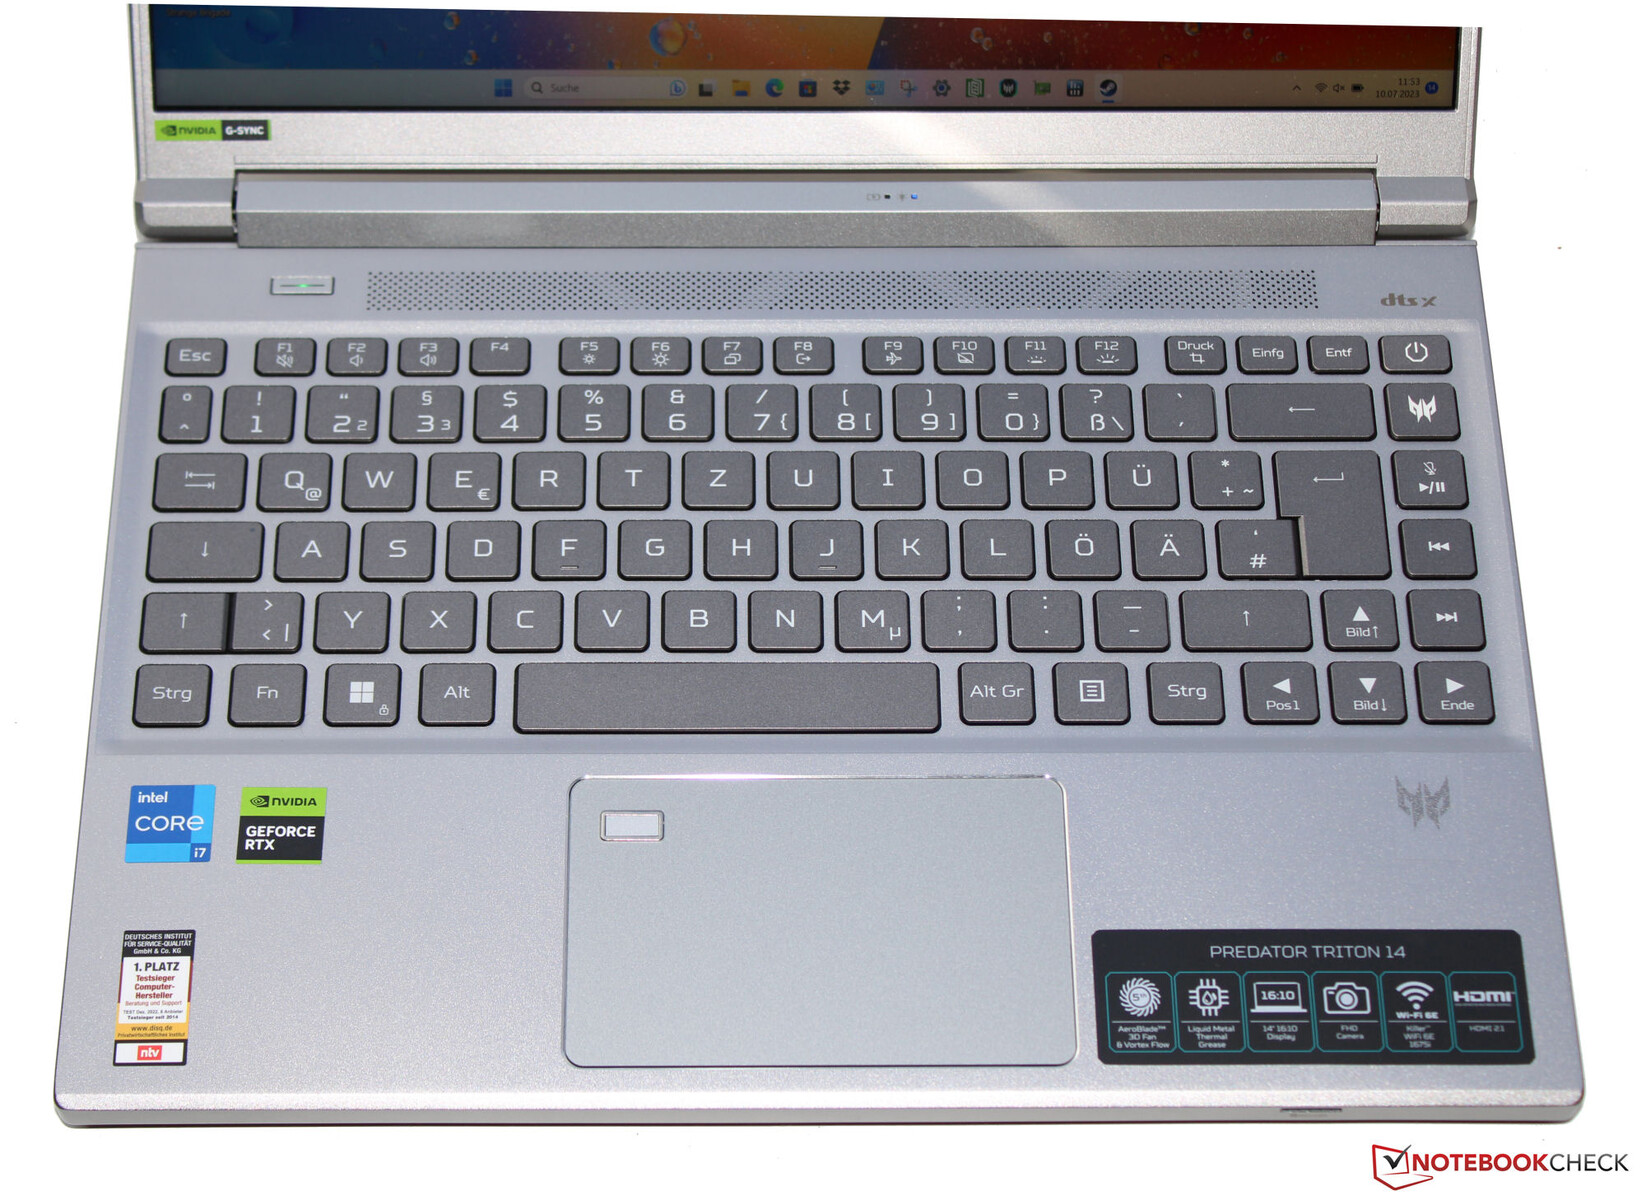
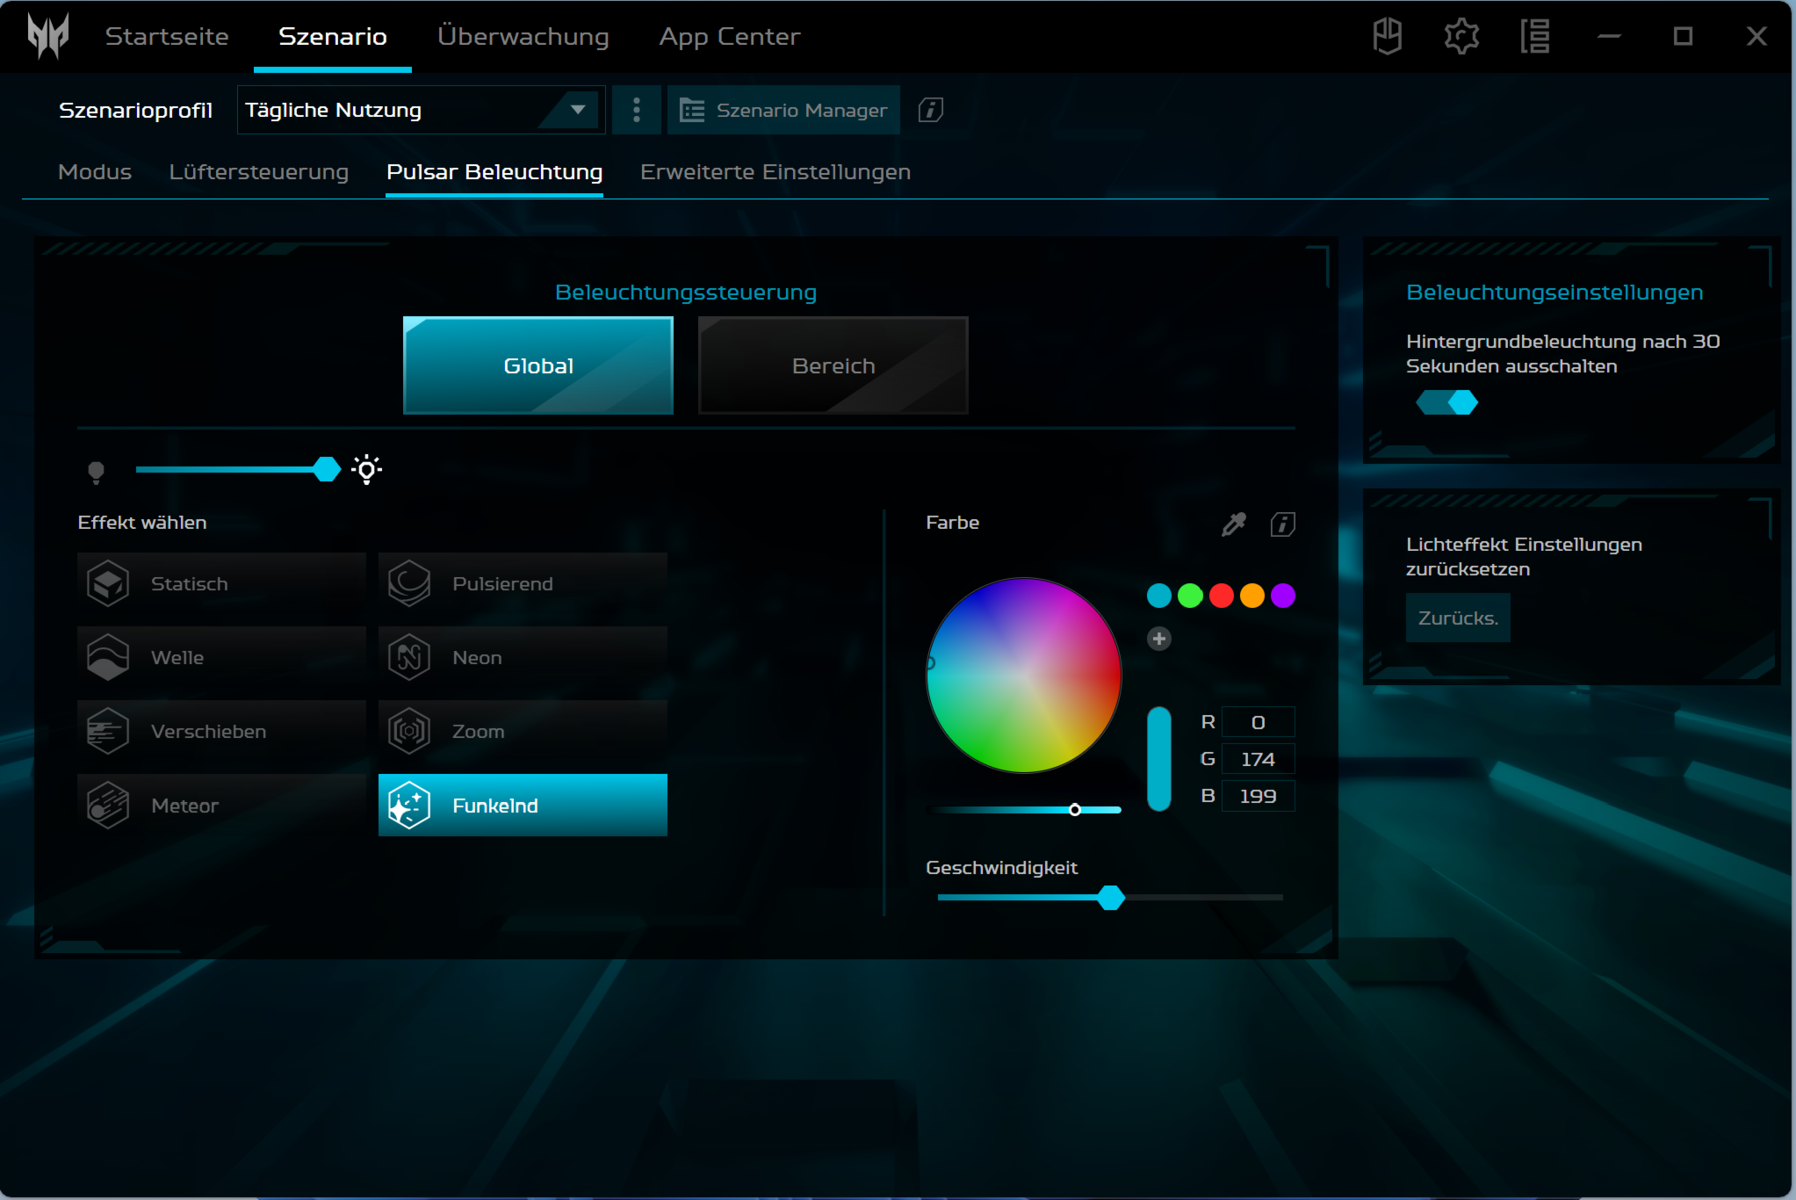
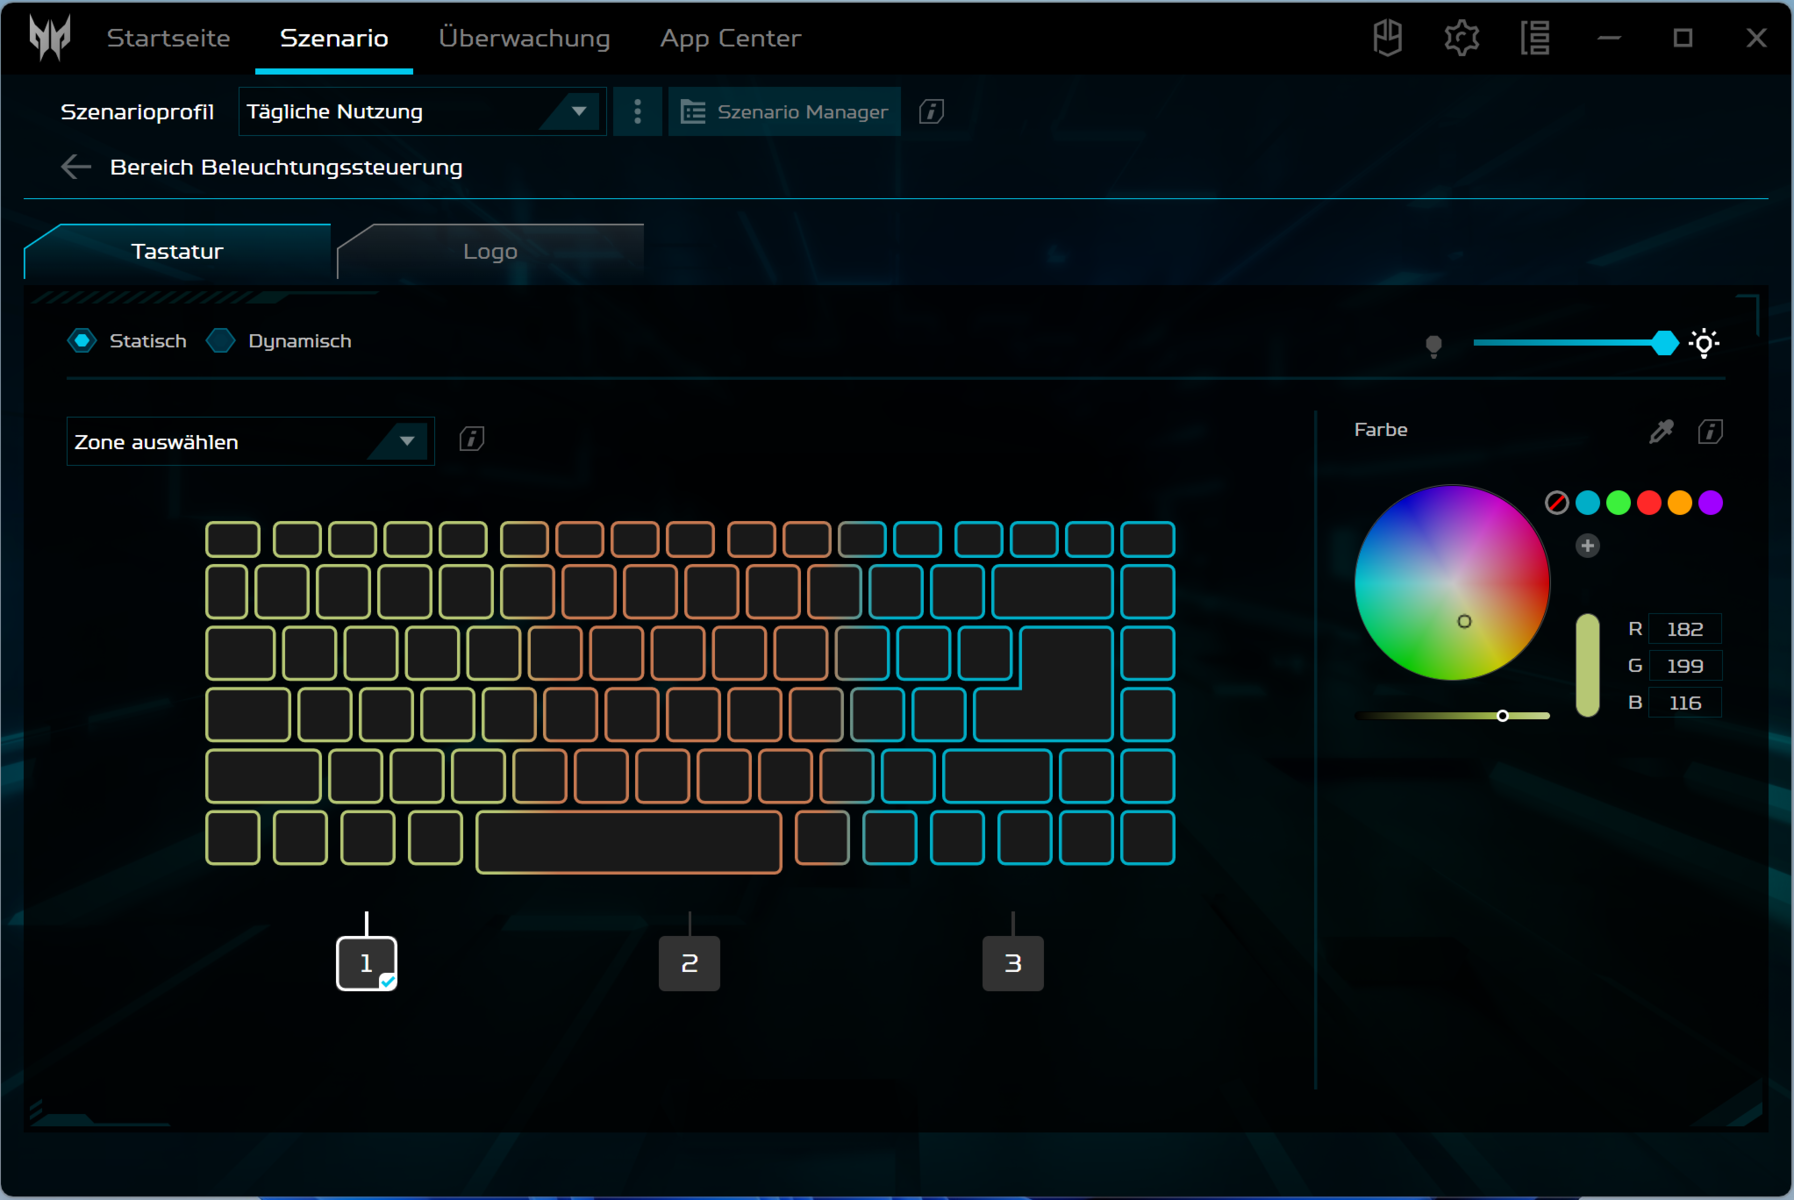
Urządzenia wejściowe - Acer Predator jest wyposażony w podświetlenie klawiszy RGB
Klawiatura
Płaskie, gładkie klawisze klawiatury typu chiclet (z podświetleniem RGB) mają krótki skok i wyraźnie zdefiniowany punkt nacisku oraz przyjemny opór klawiszy. Podczas pisania klawiatura nie chwieje się. Dobre: Wszystkie cztery klawisze strzałek są normalnej wielkości. Ogólnie rzecz biorąc, Acer dostarczył klawiaturę odpowiednią do codziennego użytku.
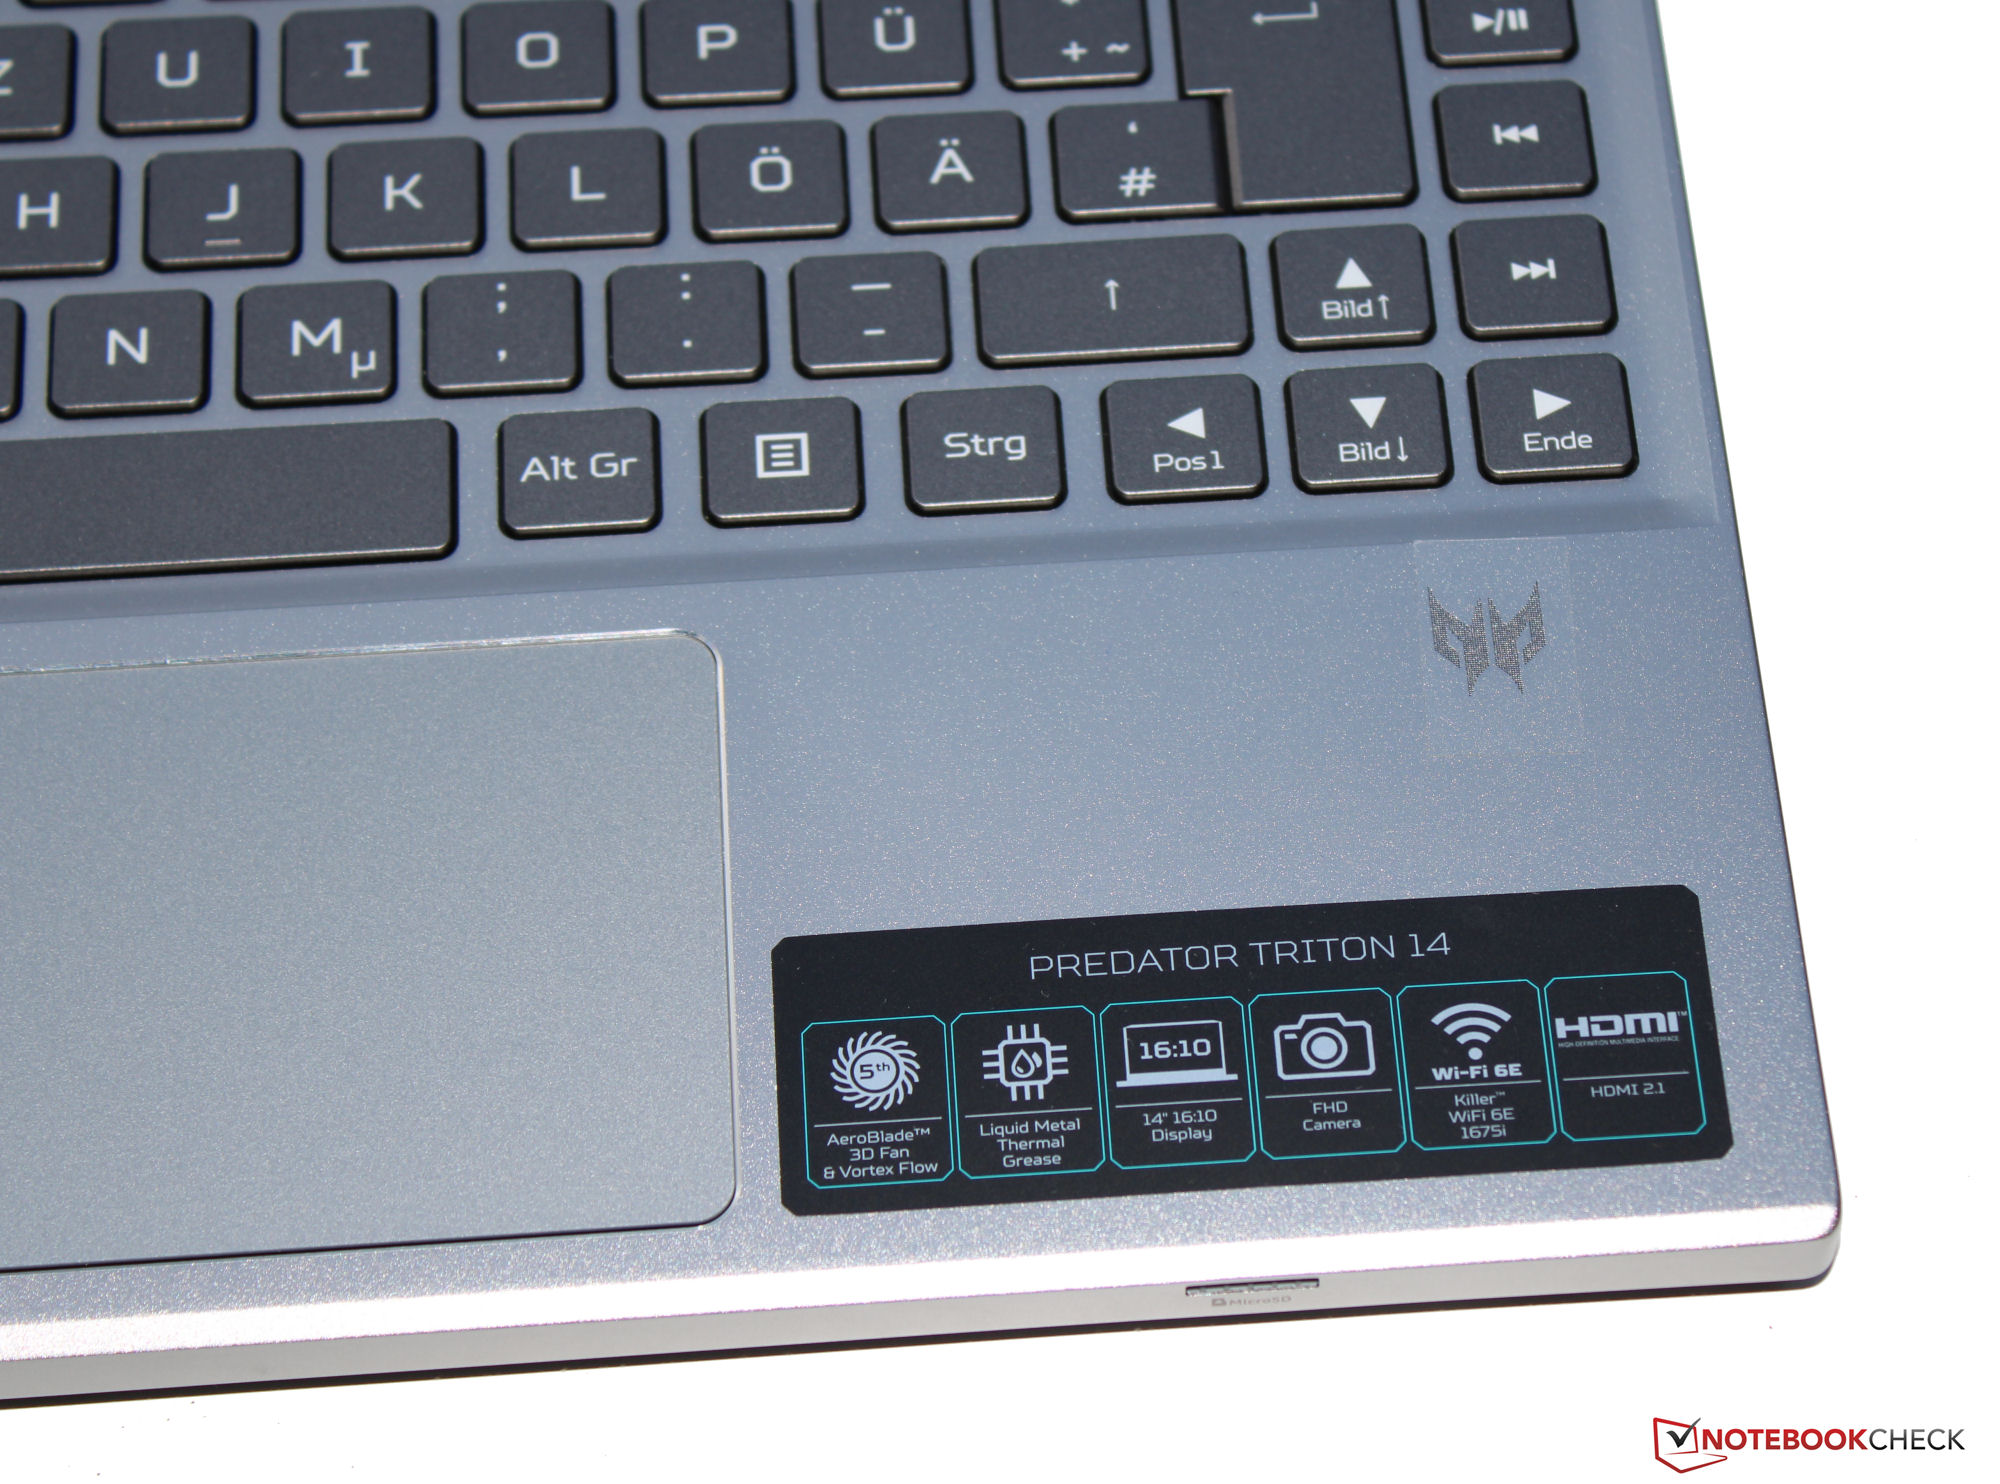
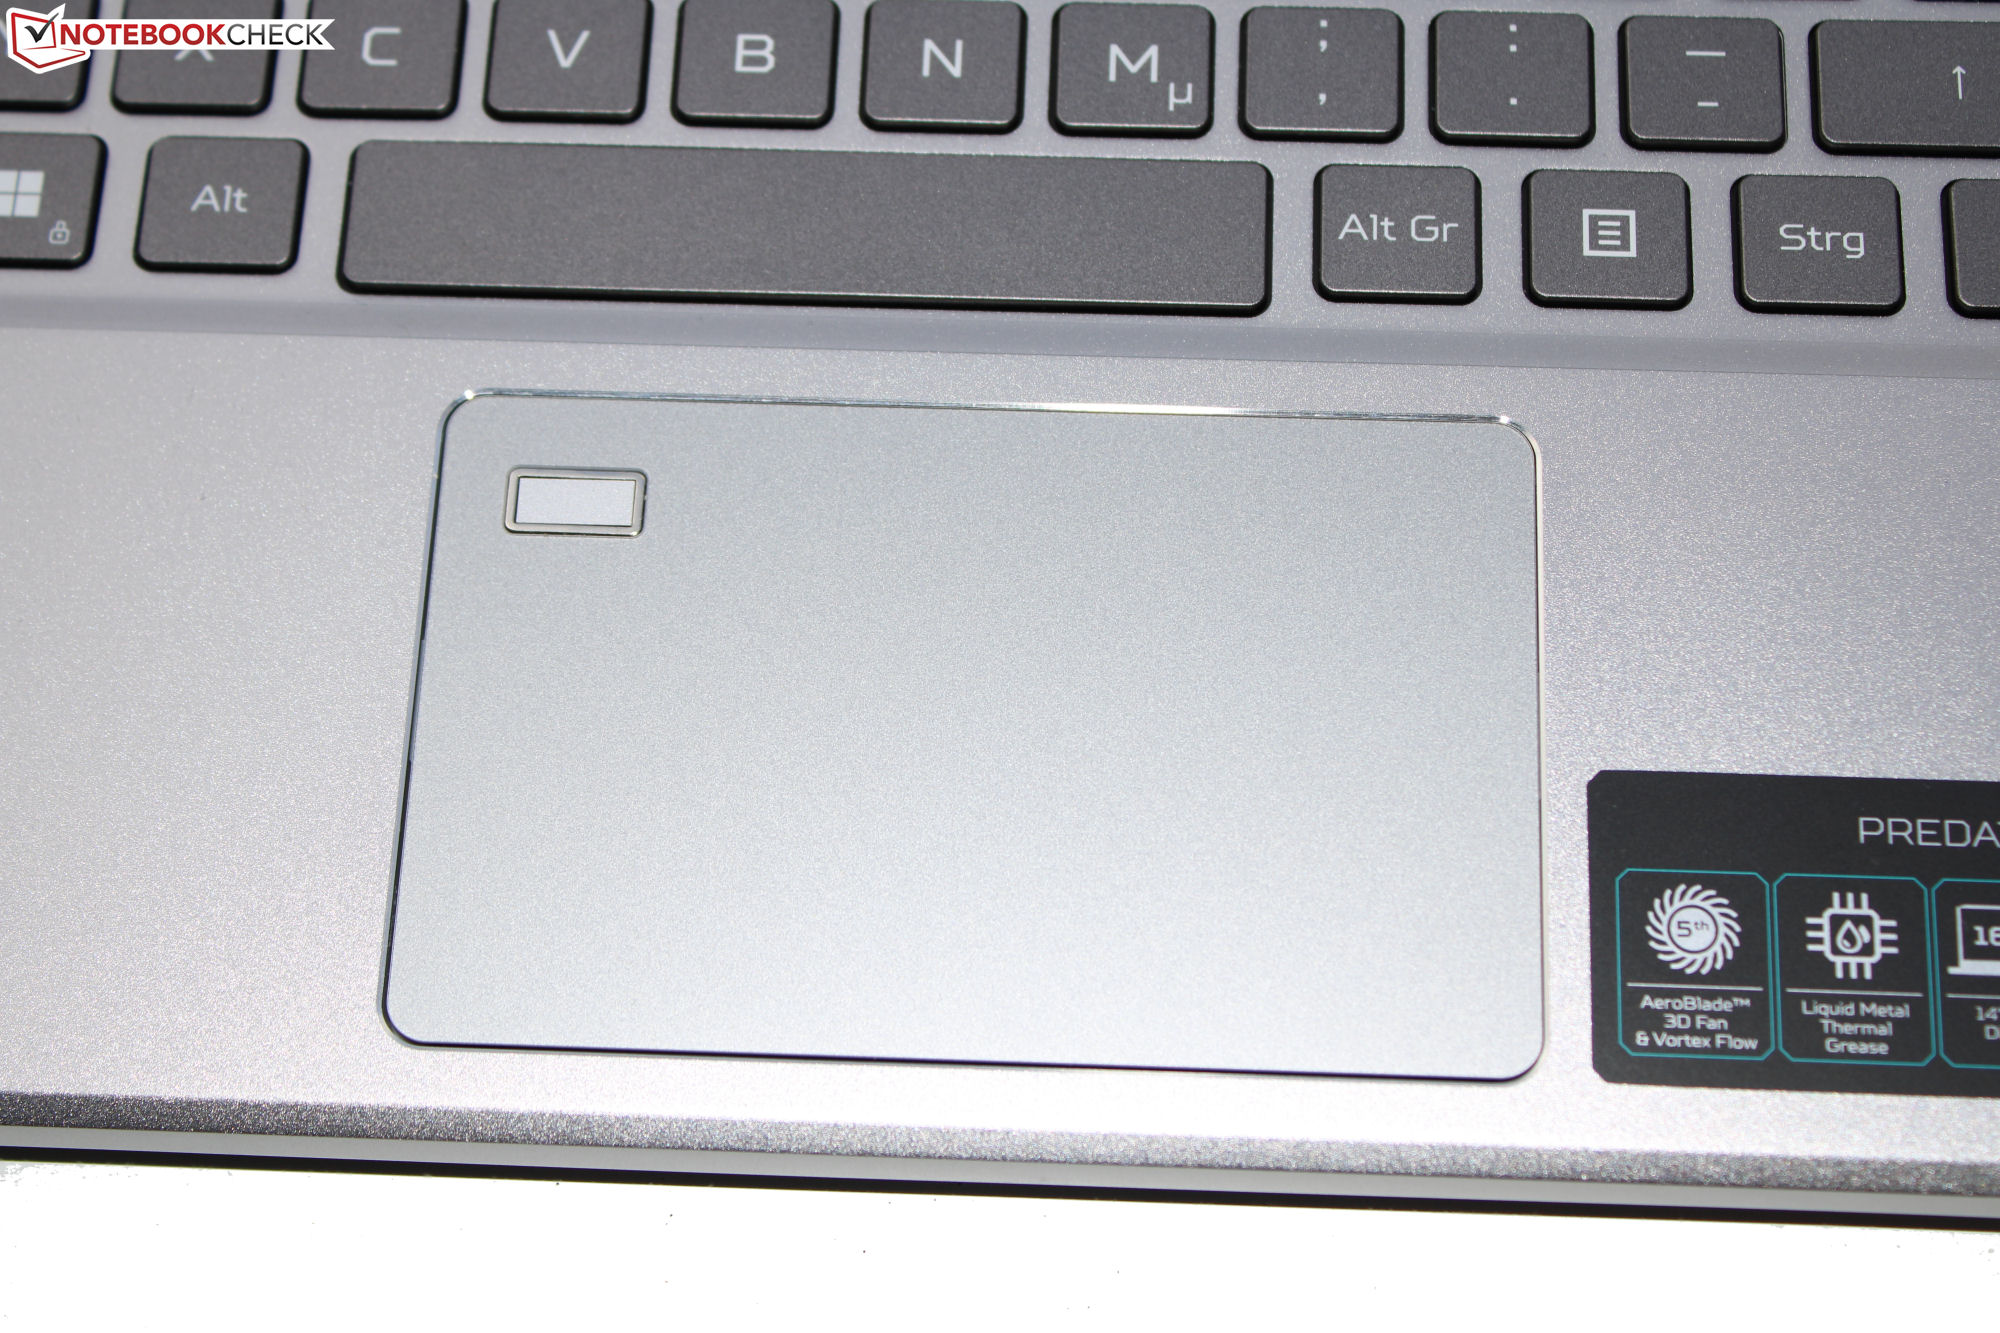
Touchpad
Alternatywą dla myszy jest wielodotykowy Clickpad (około 10,5 x 6,5 cm), po którym palce użytkownika przesuwają się bez wysiłku. Charakteryzuje się on krótkim skokiem i wyraźnie zdefiniowanym punktem nacisku.
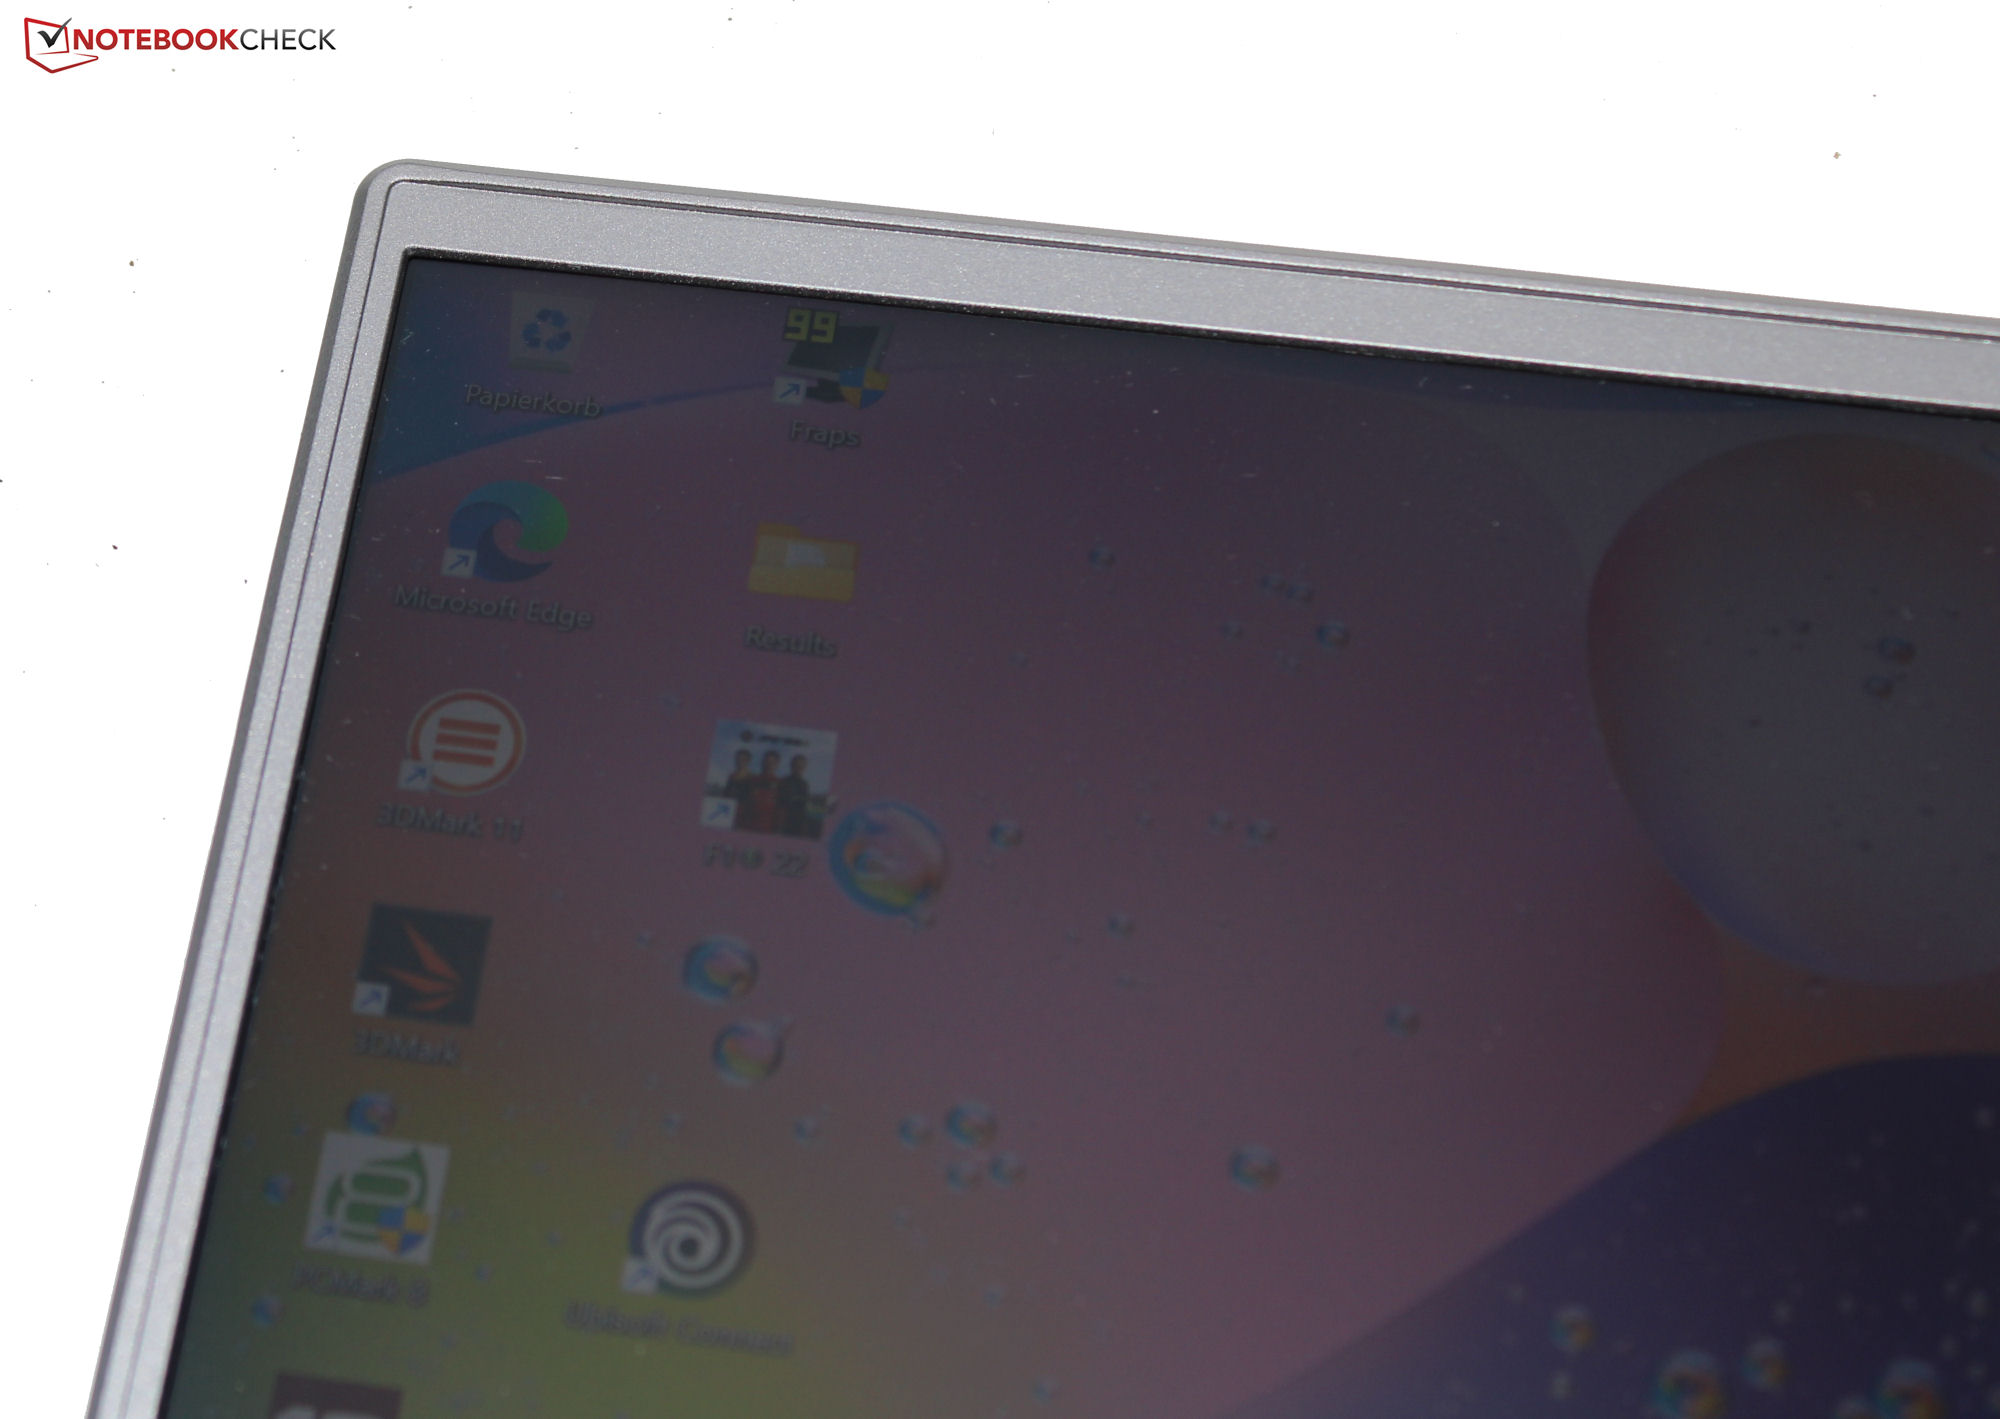
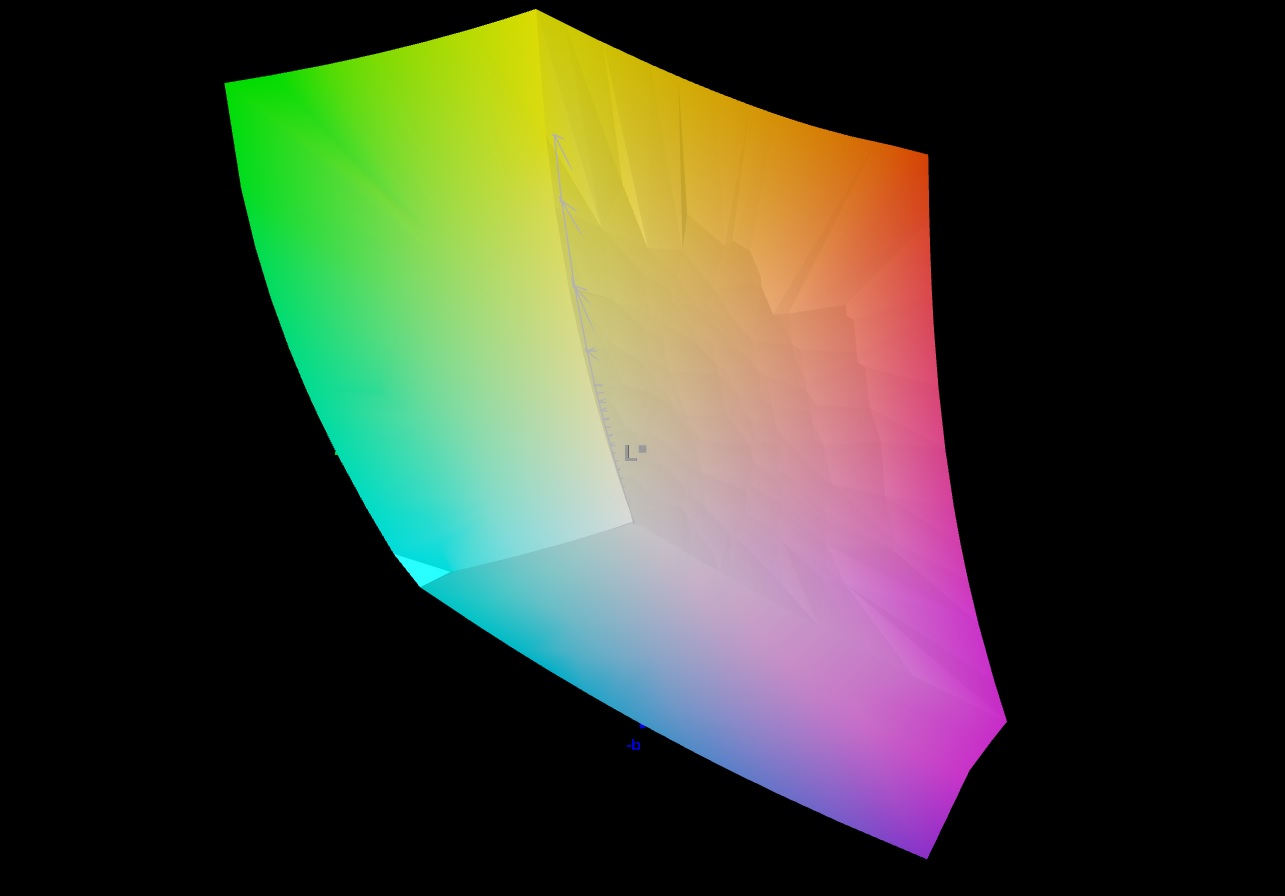
Wyświetlacz - bardzo jasny z pokryciem kolorów DCI P3
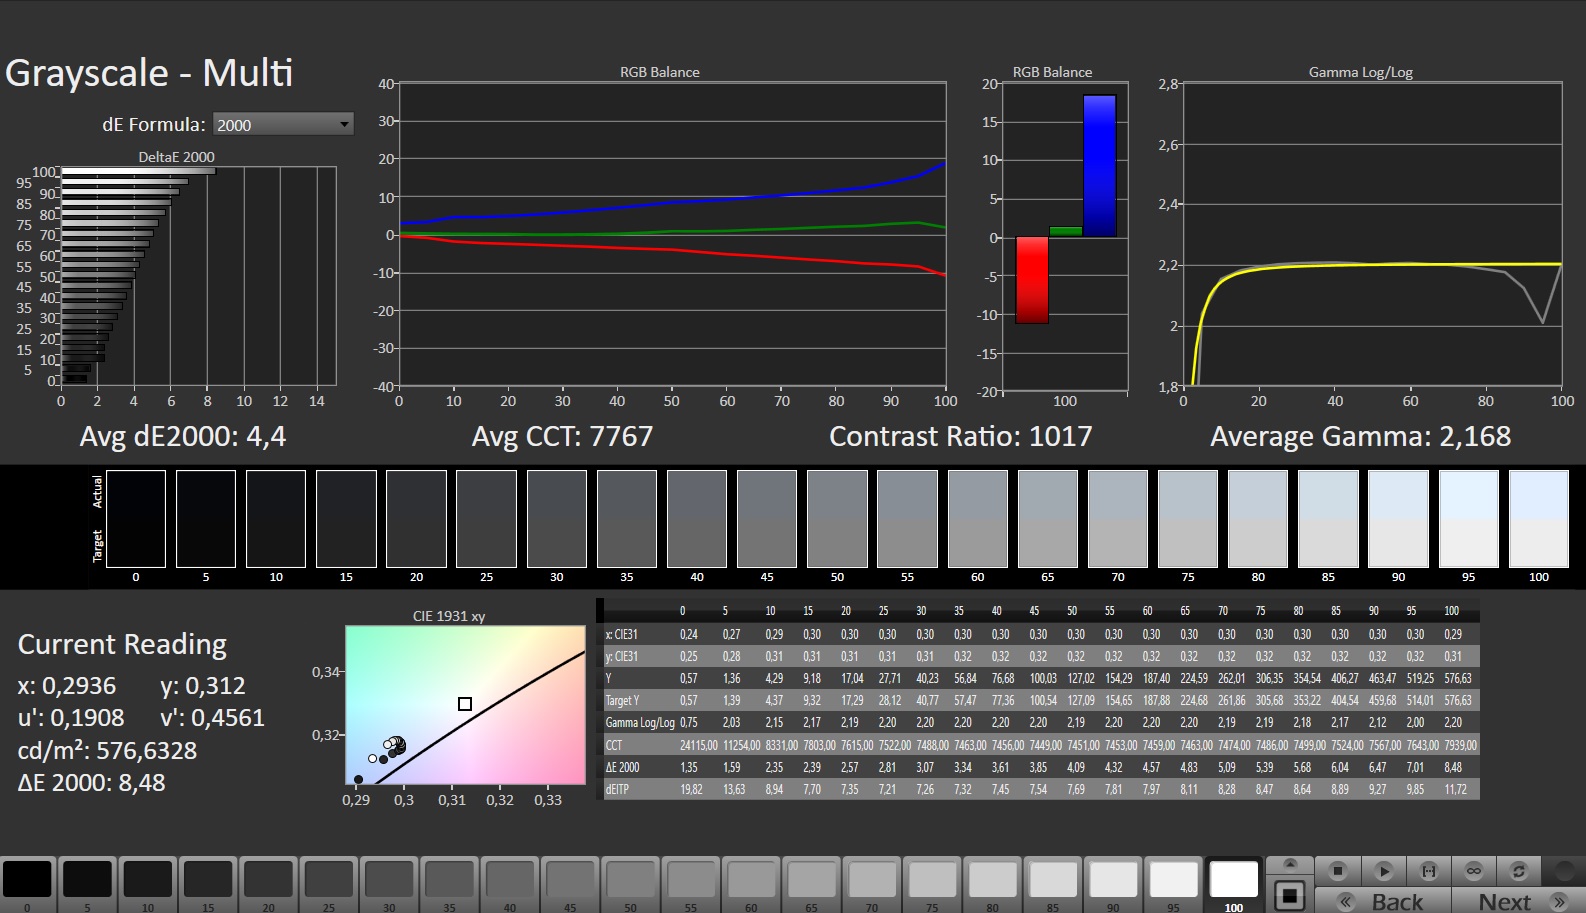
Acer wyposażył swojego Predatora w 14-calowy wyświetlacz (2560 x 1600 pikseli) o przyjaznych do pracy proporcjach 16:10. Na plus należy zaliczyć obsługę technologii G-Sync, brak migotania PWM, krótki czas reakcji oraz wysoką jasność (516,2 cd/m²). Współczynnik kontrastu (944:1) niewiele odbiega od wartości docelowej (> 1.000:1).
Alternatywnie dostępny wyświetlacz mini-LED (2560 x 1600 pikseli) powinien mieć znacznie wyższy kontrast i posiada certyfikat DisplayHDR 600.
| |||||||||||||||||||||||||
rozświetlenie: 88 %
na akumulatorze: 547 cd/m²
kontrast: 977:1 (czerń: 0.56 cd/m²)
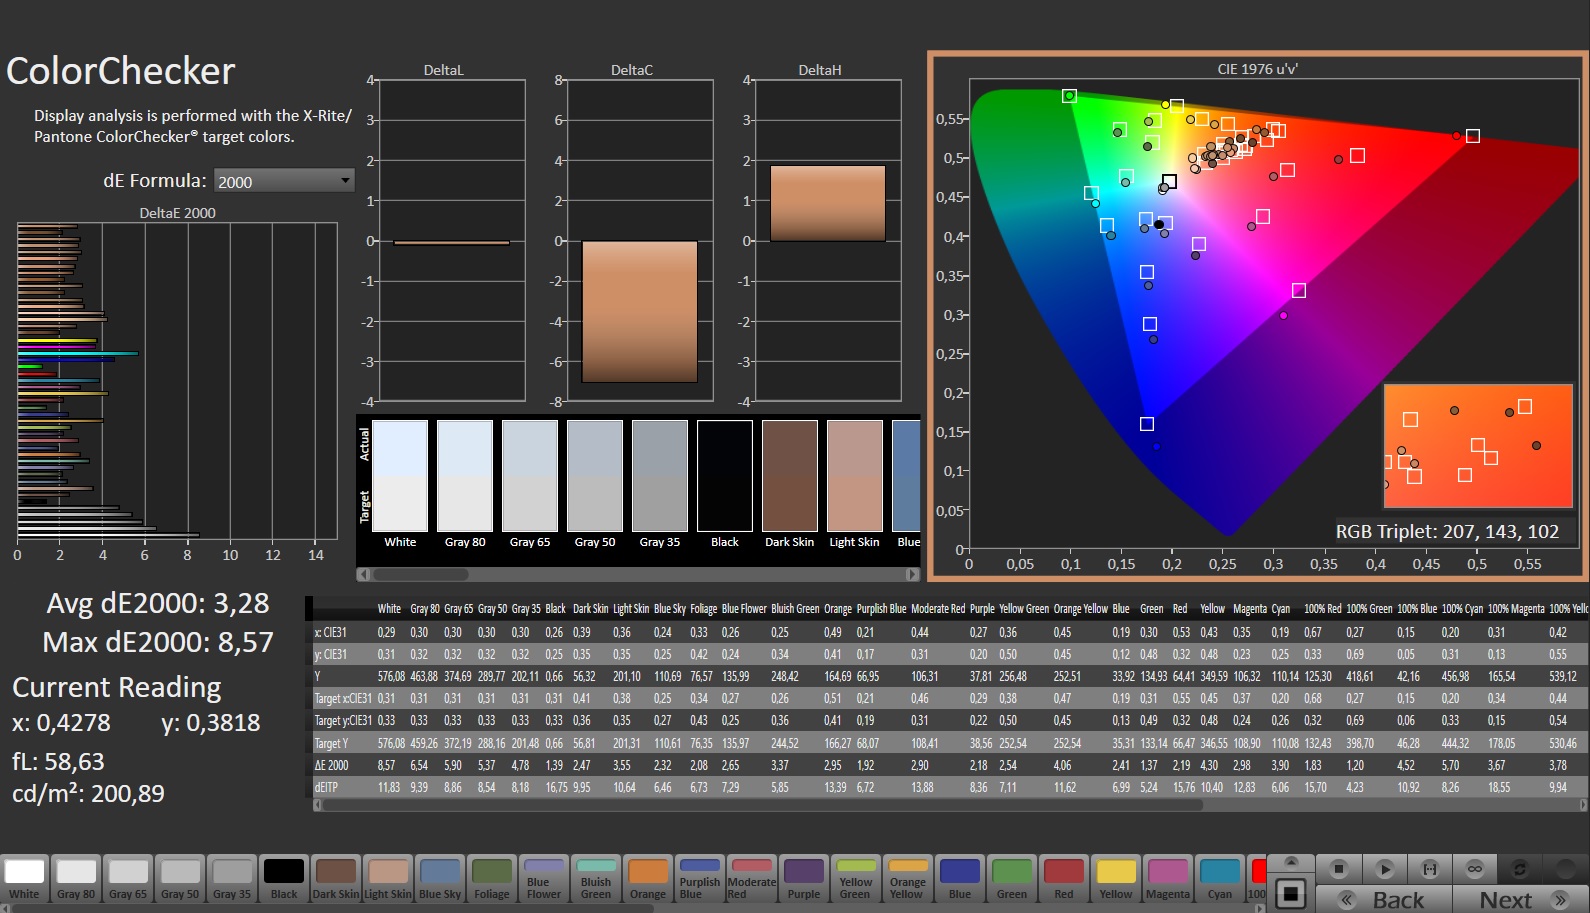
ΔE ColorChecker Calman: 3.28 | ∀{0.5-29.43 Ø4.73}
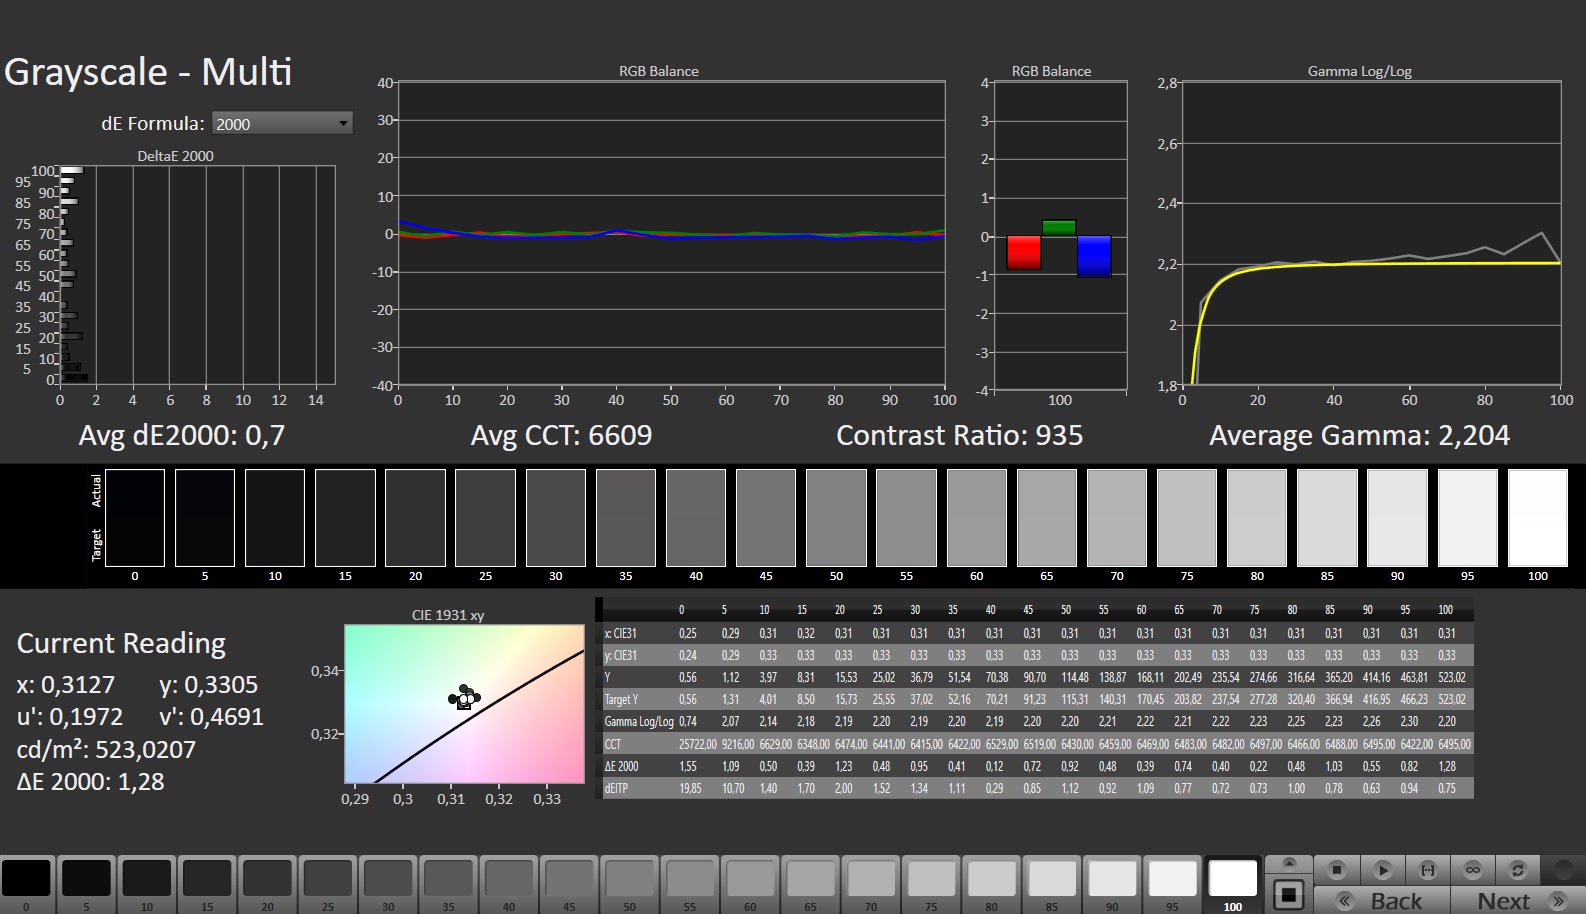
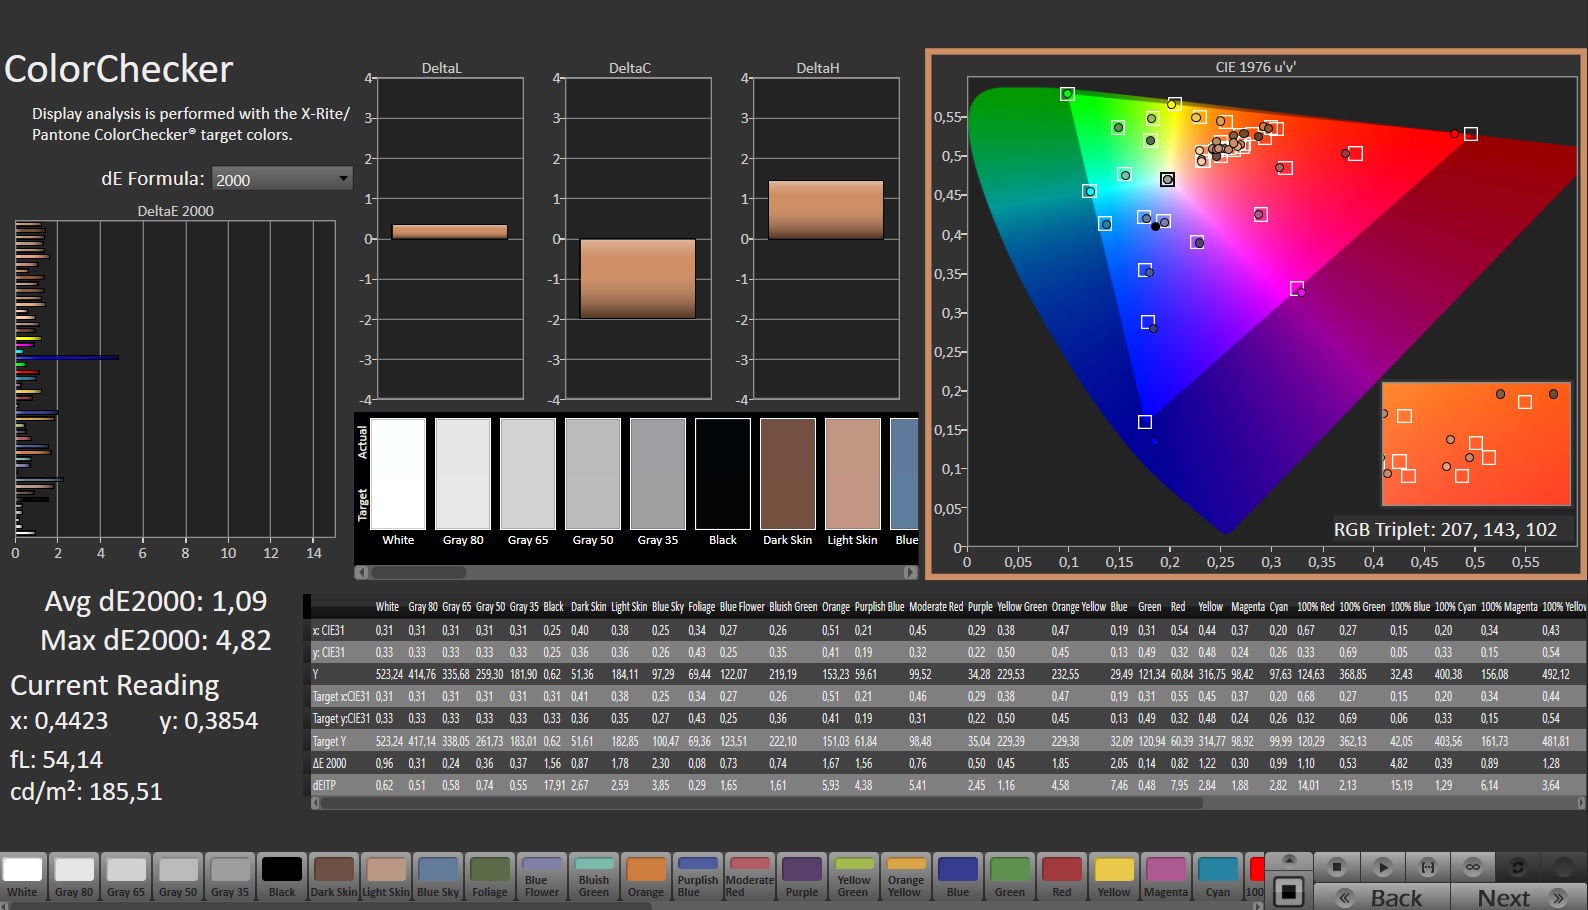
calibrated: 1.09
ΔE Greyscale Calman: 4.4 | ∀{0.09-98 Ø4.97}
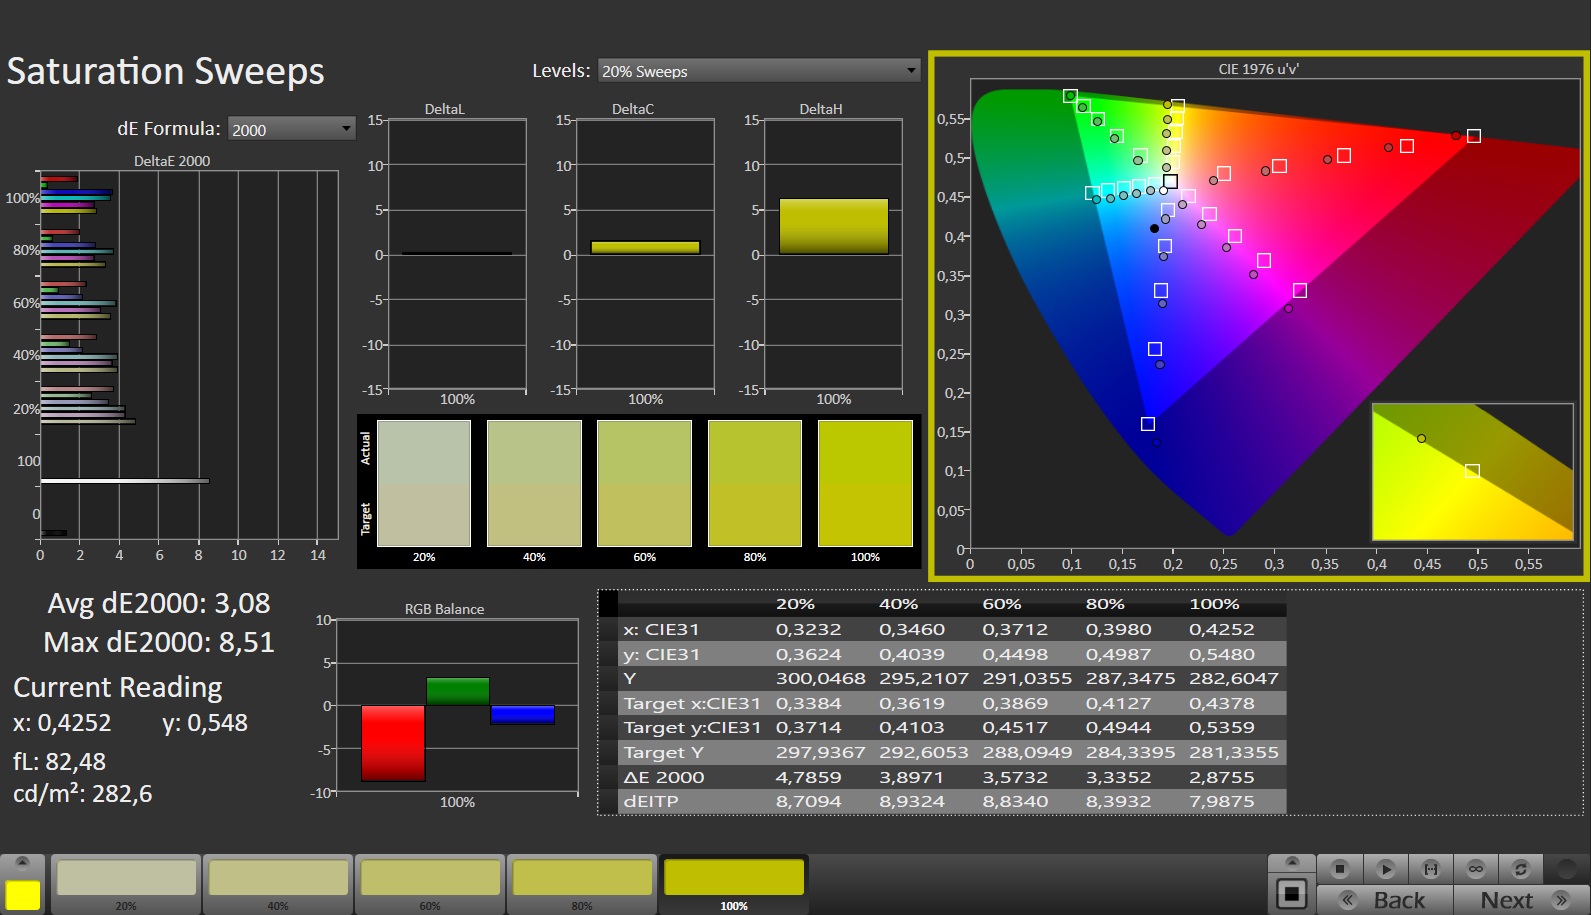
85.5% AdobeRGB 1998 (Argyll 3D)
99.9% sRGB (Argyll 3D)
96.9% Display P3 (Argyll 3D)
Gamma: 2.168
CCT: 7767 K
| Acer Predator Triton 14 PT14-51 BOE NE140QDM-NY1, IPS, 2560x1600, 14" | Razer Blade 14 RTX 4070 AU Optronics B140QAN06.U, IPS, 2560x1600, 14" | Asus ROG Zephyrus G14 GA402RJ BOEhydis NE140QDM-NX1, IPS, 2560x1600, 14" | MSI Stealth 14 Studio A13V B140QAN06.T, IPS, 2560x1600, 14" | Gigabyte Aero 14 OLED BMF Samsung SDC4192 (ATNA40YK14-0), OLED, 2880x1800, 14" | Apple MacBook Pro 14 2023 M2 Pro Entry Mini-LED, 3024x1964, 14.2" | |
|---|---|---|---|---|---|---|
| Display | 0% | 0% | -0% | 2% | ||
| Display P3 Coverage (%) | 96.9 | 97.3 0% | 97.6 1% | 96.2 -1% | 99.8 3% | |
| sRGB Coverage (%) | 99.9 | 99.8 0% | 99.9 0% | 99.6 0% | 100 0% | |
| AdobeRGB 1998 Coverage (%) | 85.5 | 85.3 0% | 85.6 0% | 85.3 0% | 88.7 4% | |
| Response Times | -9% | 21% | 32% | 72% | ||
| Response Time Grey 50% / Grey 80% * (ms) | 15.1 ? | 11.9 ? 21% | 8.3 ? 45% | 5.5 ? 64% | 2.4 ? 84% | |
| Response Time Black / White * (ms) | 5.8 ? | 8 ? -38% | 6 ? -3% | 5.8 ? -0% | 2.4 ? 59% | |
| PWM Frequency (Hz) | 26191 ? | 300 | ||||
| Screen | 3% | 12% | 9% | 70% | ||
| Brightness middle (cd/m²) | 547 | 559.3 2% | 500 -9% | 419 -23% | 423 -23% | |
| Brightness (cd/m²) | 516 | 560 9% | 470 -9% | 402 -22% | 427 -17% | |
| Brightness Distribution (%) | 88 | 88 0% | 85 -3% | 89 1% | 98 11% | |
| Black Level * (cd/m²) | 0.56 | 0.44 21% | 0.42 25% | 0.43 23% | 0.1 82% | |
| Contrast (:1) | 977 | 1271 30% | 1190 22% | 974 0% | 4230 333% | |
| Colorchecker dE 2000 * | 3.28 | 4.44 -35% | 2.45 25% | 2.3 30% | 0.55 83% | |
| Colorchecker dE 2000 max. * | 8.57 | 9.3 -9% | 5.34 38% | 5.8 32% | 1.15 87% | |
| Colorchecker dE 2000 calibrated * | 1.09 | 0.39 64% | 1.2 -10% | 0.9 17% | 1.15 -6% | |
| Greyscale dE 2000 * | 4.4 | 6.8 -55% | 3.1 30% | 3.3 25% | 0.69 84% | |
| Gamma | 2.168 101% | 2.3 96% | 2.213 99% | 2.14 103% | 2.42 91% | |
| CCT | 7767 84% | 6242 104% | 7251 90% | 6550 99% | 6479 100% | |
| Całkowita średnia (program / ustawienia) | -2% /
1% | 11% /
11% | 14% /
10% | 48% /
56% |
* ... im mniej tym lepiej
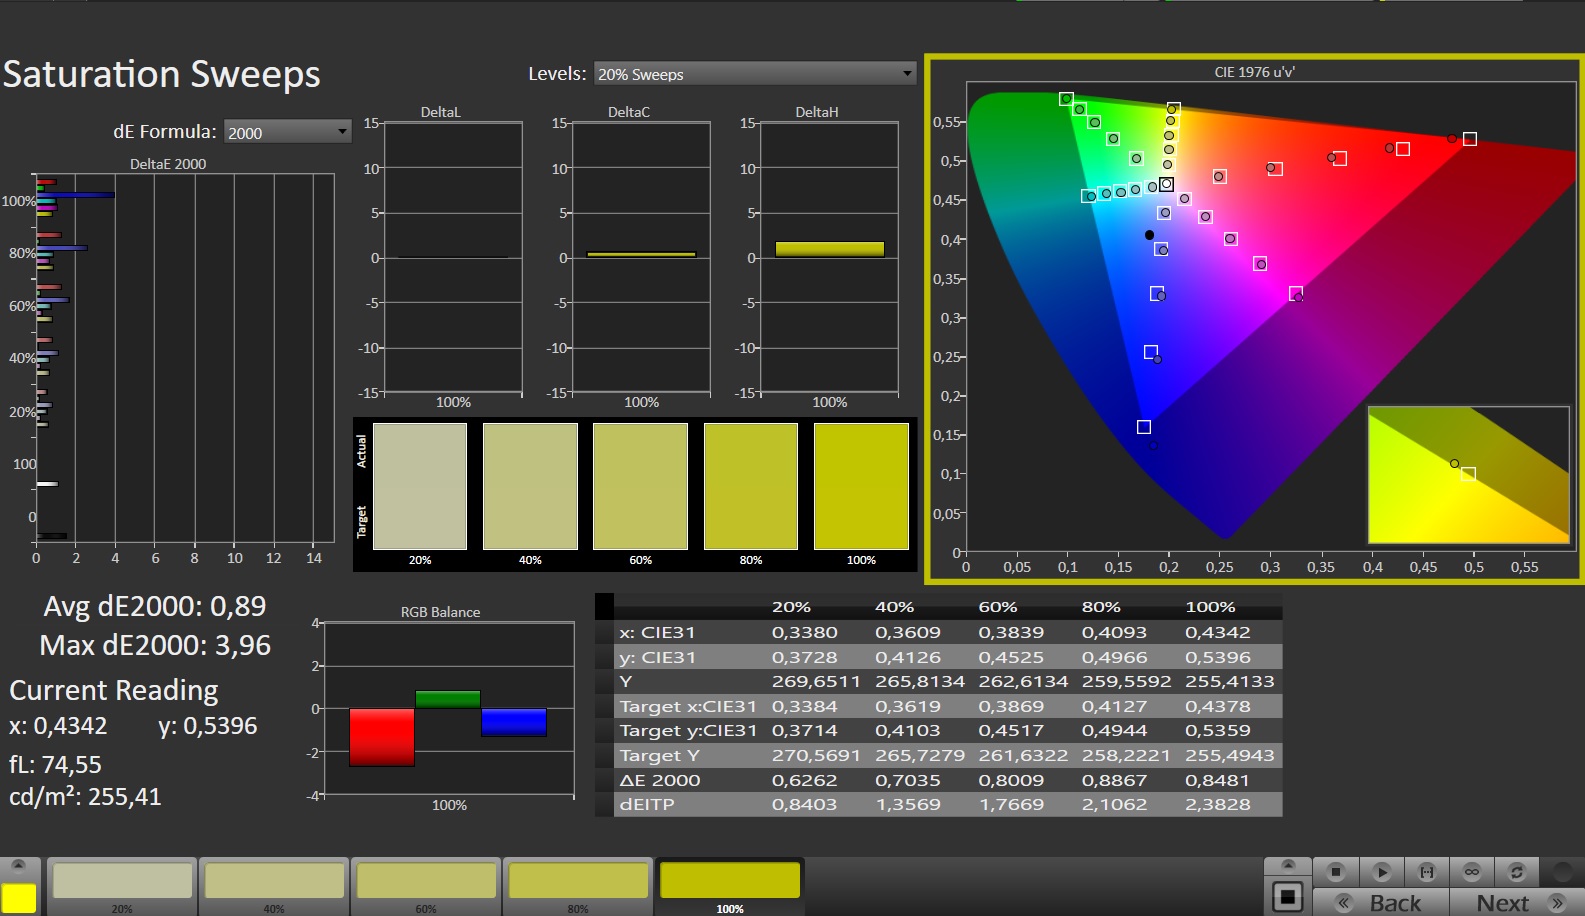
Po wyjęciu z pudełka ekran ma przyzwoite odwzorowanie kolorów: Przy odchyleniu wynoszącym około 3,3, wartość docelowa (DeltaE < 3) jest ledwo osiągnięta. Kalibracja zmniejsza tę wartość do 1,1 i zapewnia zrównoważone skale szarości. Podano dokładność kolorów: Panel całkowicie odwzorowuje przestrzenie barw sRGB i DCI P3, a przestrzeń AdobeRGB w 86 procentach. Ekrany konkurencji opowiadają tę samą historię.
Stworzyliśmy własny profil kolorów, który można pobrać i wykorzystać. Link do niego można znaleźć w skrzynce odbiorczej "Wyświetlacz".


Wyświetl czasy reakcji
| ↔ Czas reakcji od czerni do bieli | ||
|---|---|---|
| 5.8 ms ... wzrost ↗ i spadek ↘ łącznie | ↗ 2.1 ms wzrost | 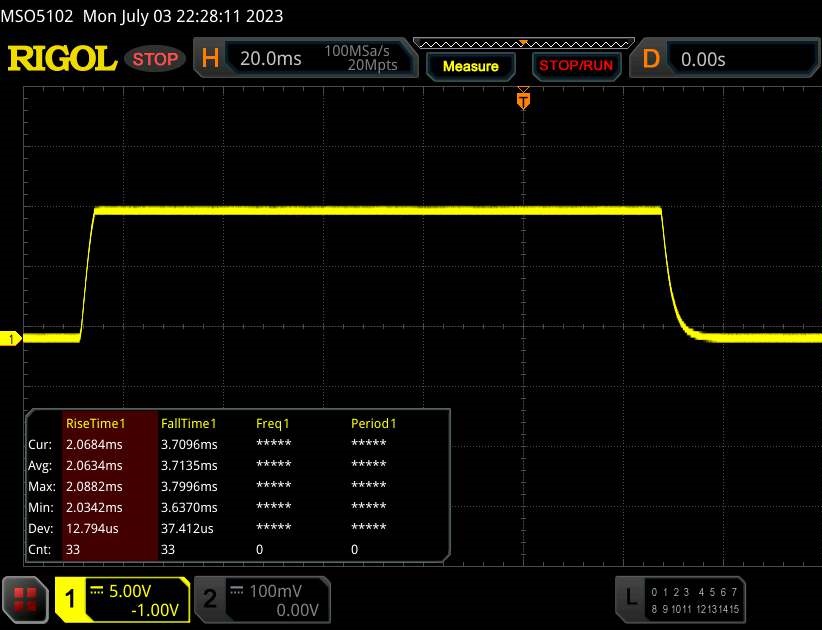 |
| ↘ 3.7 ms upadek | ||
| W naszych testach ekran wykazuje bardzo szybką reakcję i powinien bardzo dobrze nadawać się do szybkich gier. Dla porównania, wszystkie testowane urządzenia wahają się od 0.1 (minimum) do 240 (maksimum) ms. » 18 % wszystkich urządzeń jest lepszych. Oznacza to, że zmierzony czas reakcji jest lepszy od średniej wszystkich testowanych urządzeń (19.9 ms). | ||
| ↔ Czas reakcji 50% szarości do 80% szarości | ||
| 15.1 ms ... wzrost ↗ i spadek ↘ łącznie | ↗ 6.8 ms wzrost | 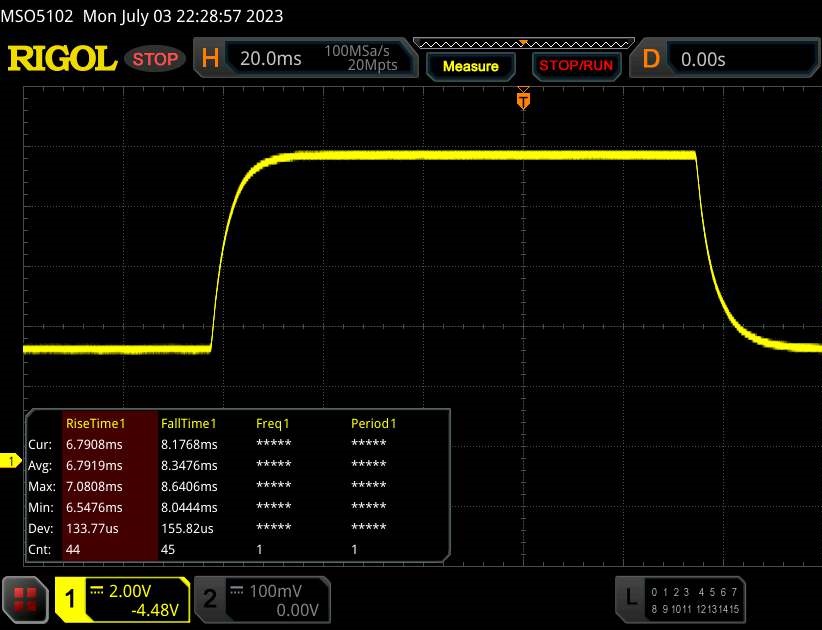 |
| ↘ 8.3 ms upadek | ||
| W naszych testach ekran wykazuje dobry współczynnik reakcji, ale może być zbyt wolny dla graczy rywalizujących ze sobą. Dla porównania, wszystkie testowane urządzenia wahają się od 0.165 (minimum) do 636 (maksimum) ms. » 29 % wszystkich urządzeń jest lepszych. Oznacza to, że zmierzony czas reakcji jest lepszy od średniej wszystkich testowanych urządzeń (31.1 ms). | ||
Migotanie ekranu / PWM (modulacja szerokości impulsu)
| Migotanie ekranu/nie wykryto PWM | 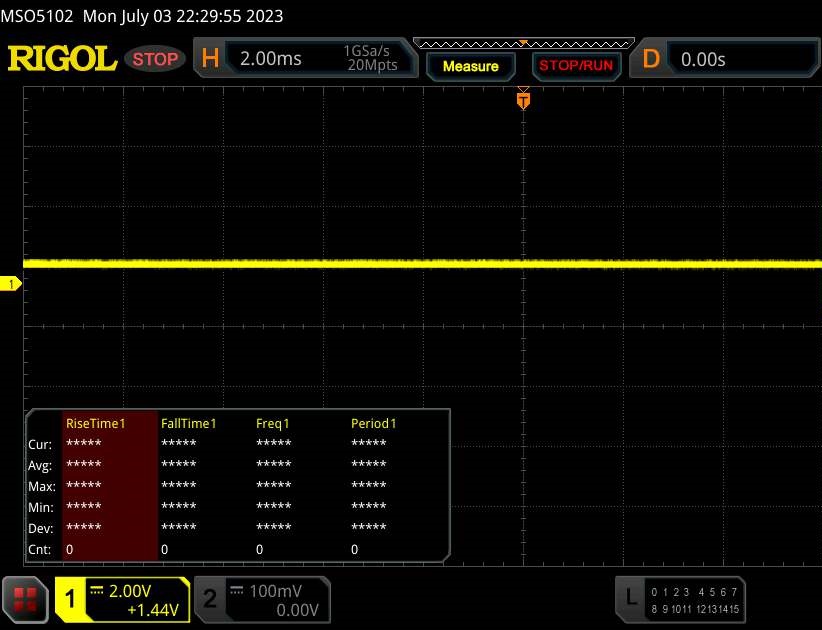 | ||
Dla porównania: 52 % wszystkich testowanych urządzeń nie używa PWM do przyciemniania wyświetlacza. Jeśli wykryto PWM, zmierzono średnio 7798 (minimum: 5 - maksimum: 343500) Hz. | |||
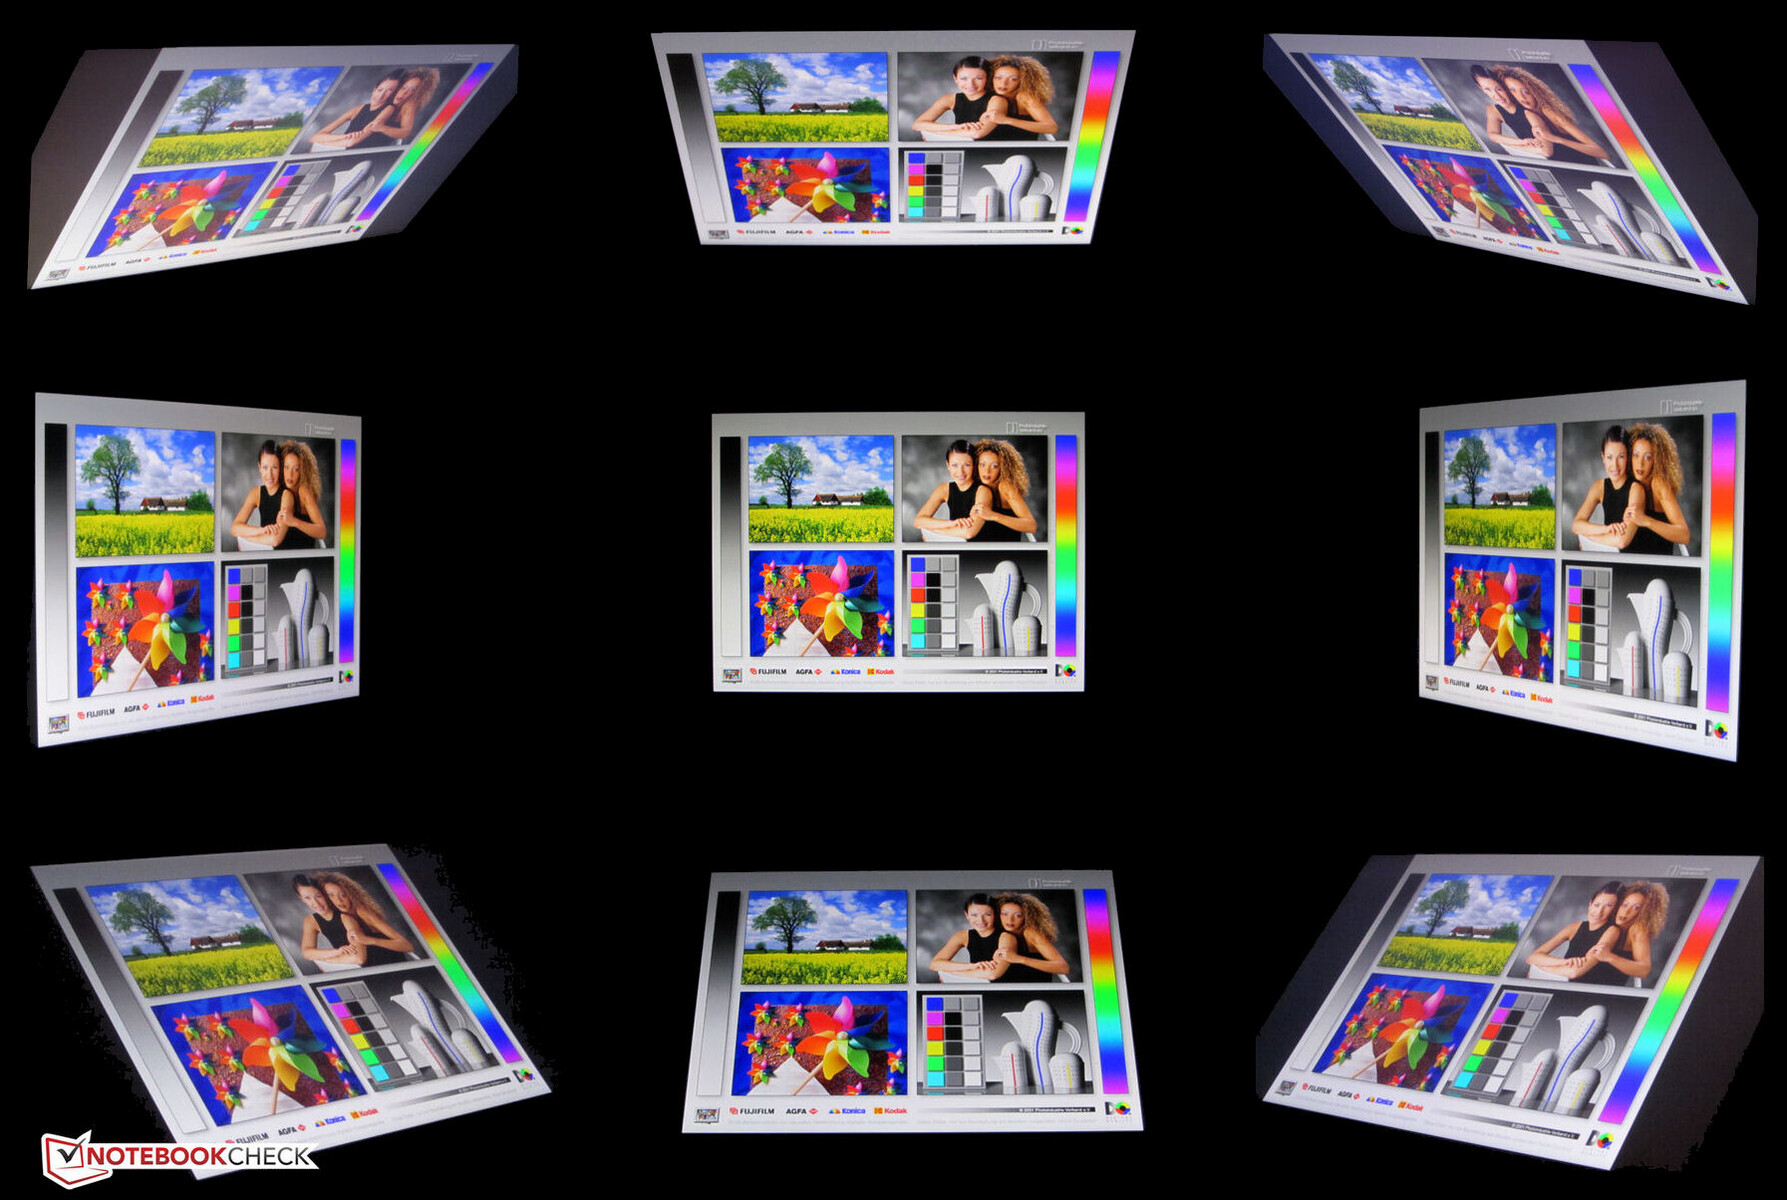
Panel IPS ma stabilne kąty widzenia i jest czytelny z każdej pozycji. Dzięki wysokiej jasności wyświetlacza, ekran może być również oglądany na zewnątrz.
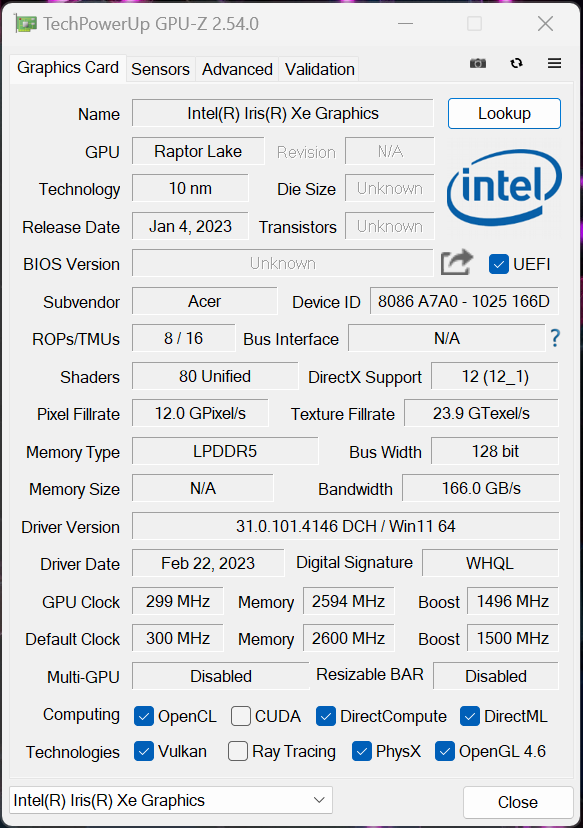
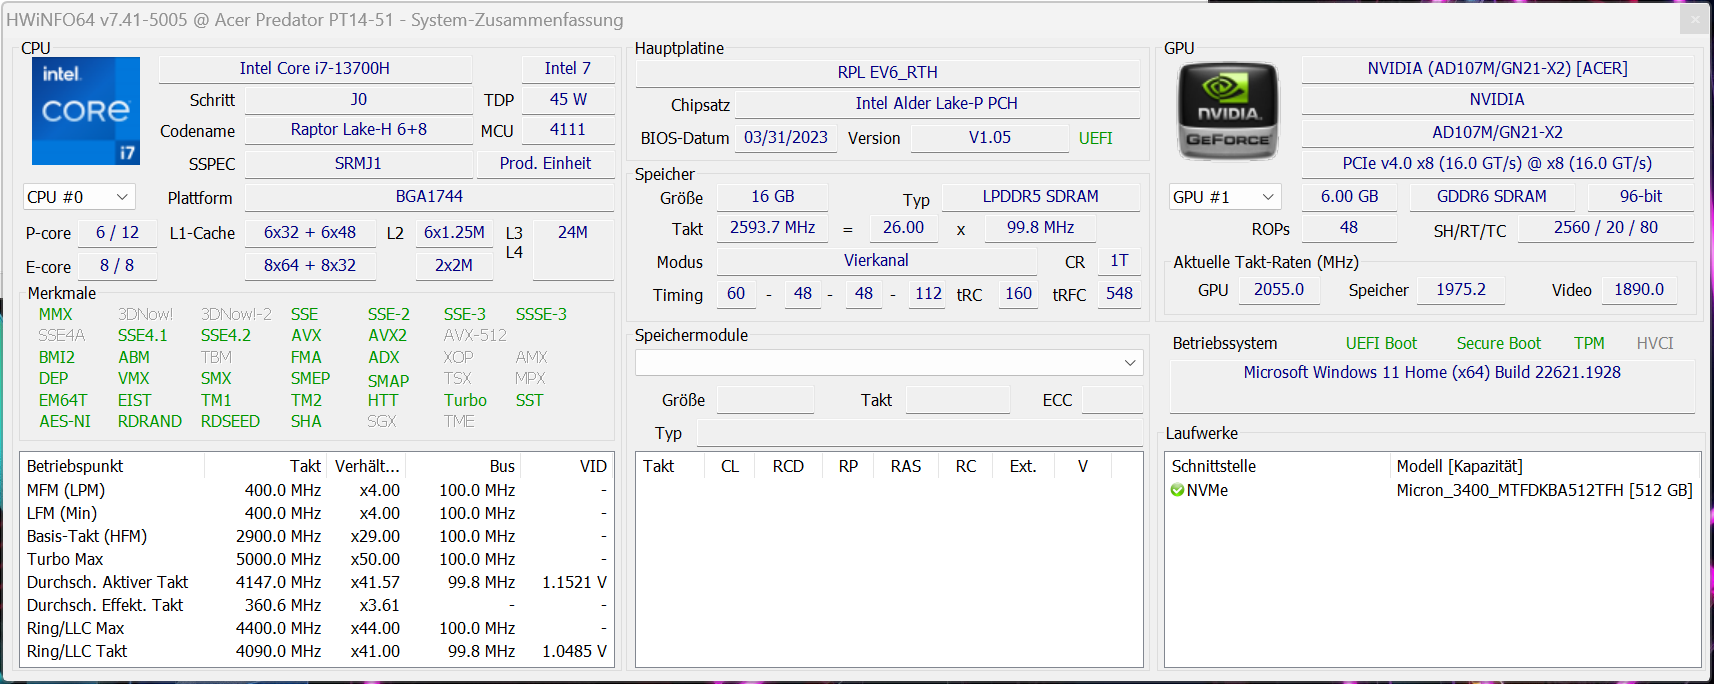
Wydajność - Raptor Lake i Ada Lovelace napędzają laptopa Acer
Predator Triton 14 to 14-calowy laptop stworzony z myślą o grach i renderowaniu. ProcesorCore i7-13700Hi GeForce RTX 4050zapewniają niezbędną moc obliczeniową. Bardziej wydajne warianty posiadają GeForce RTX 4070na pokładzie.
Warunki testowe
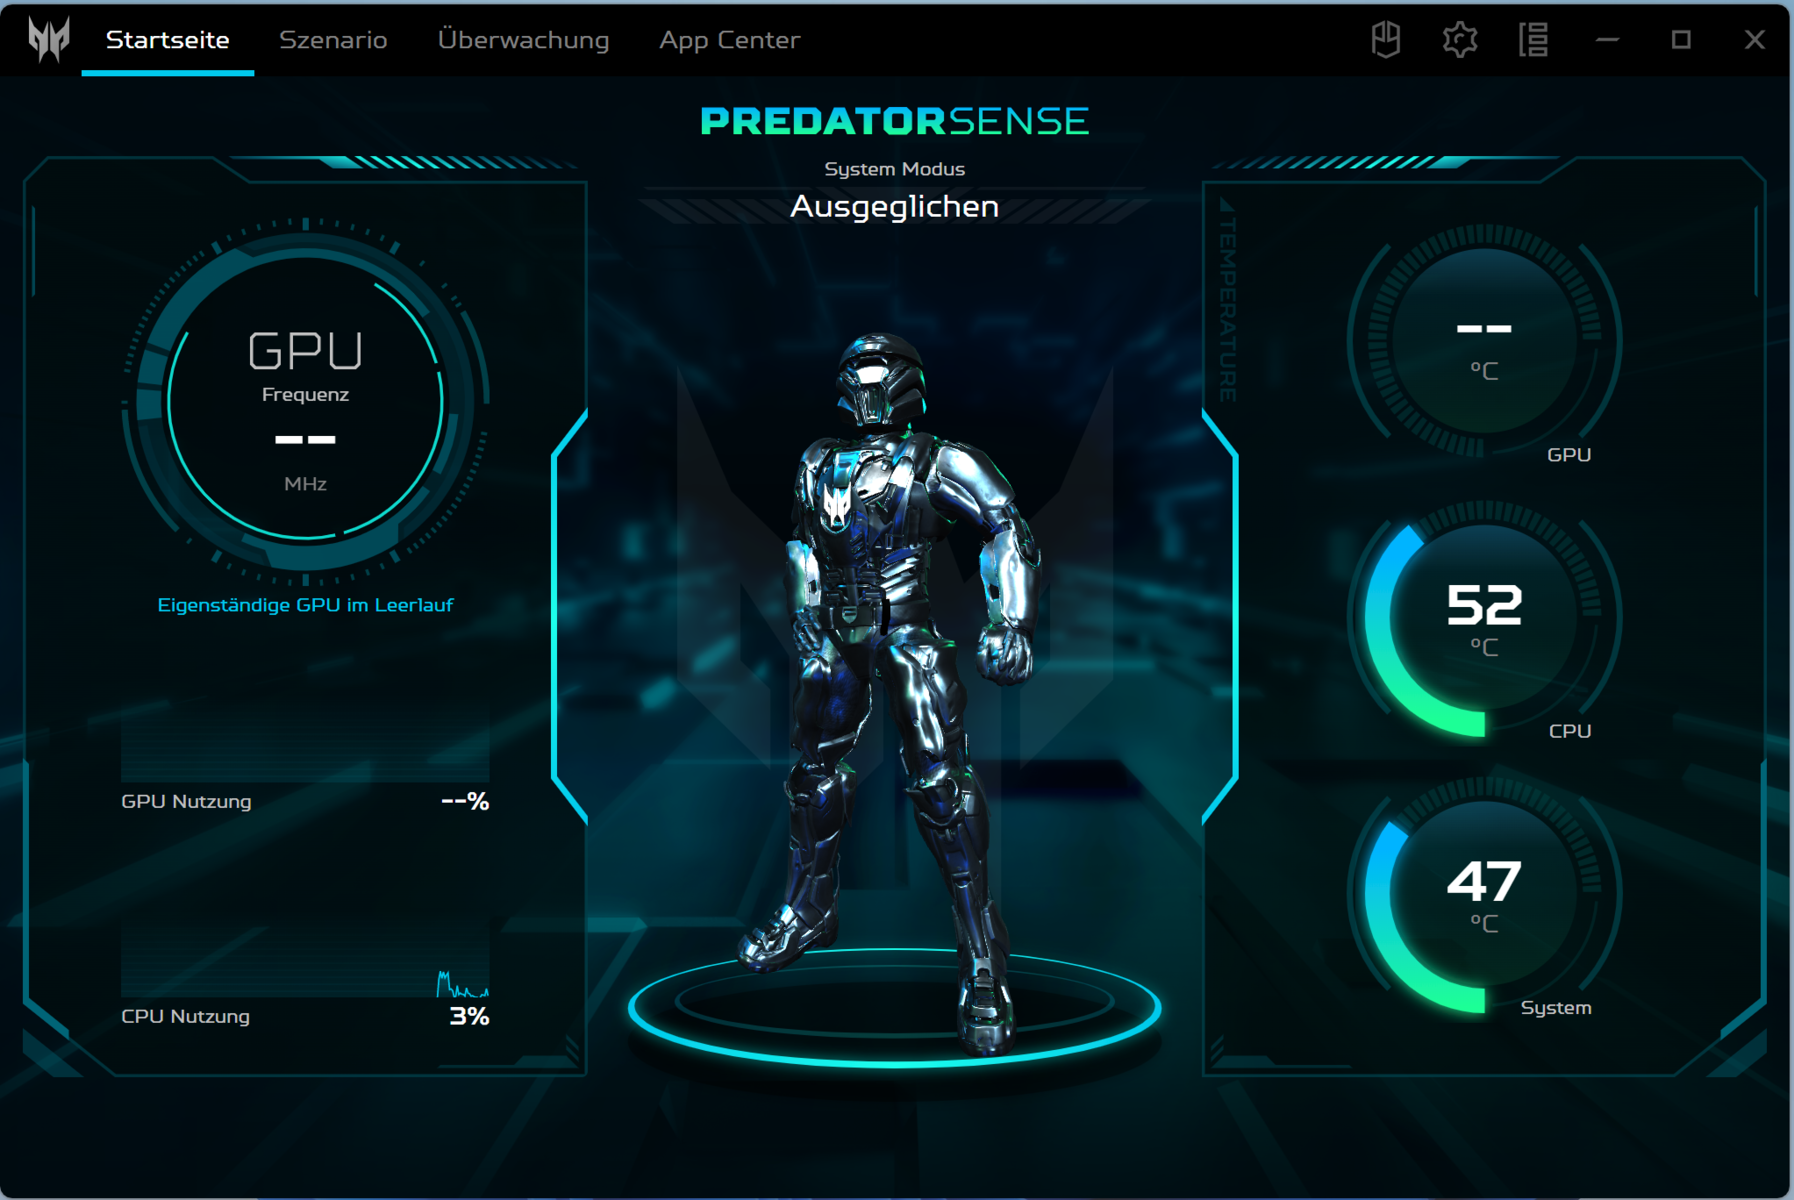
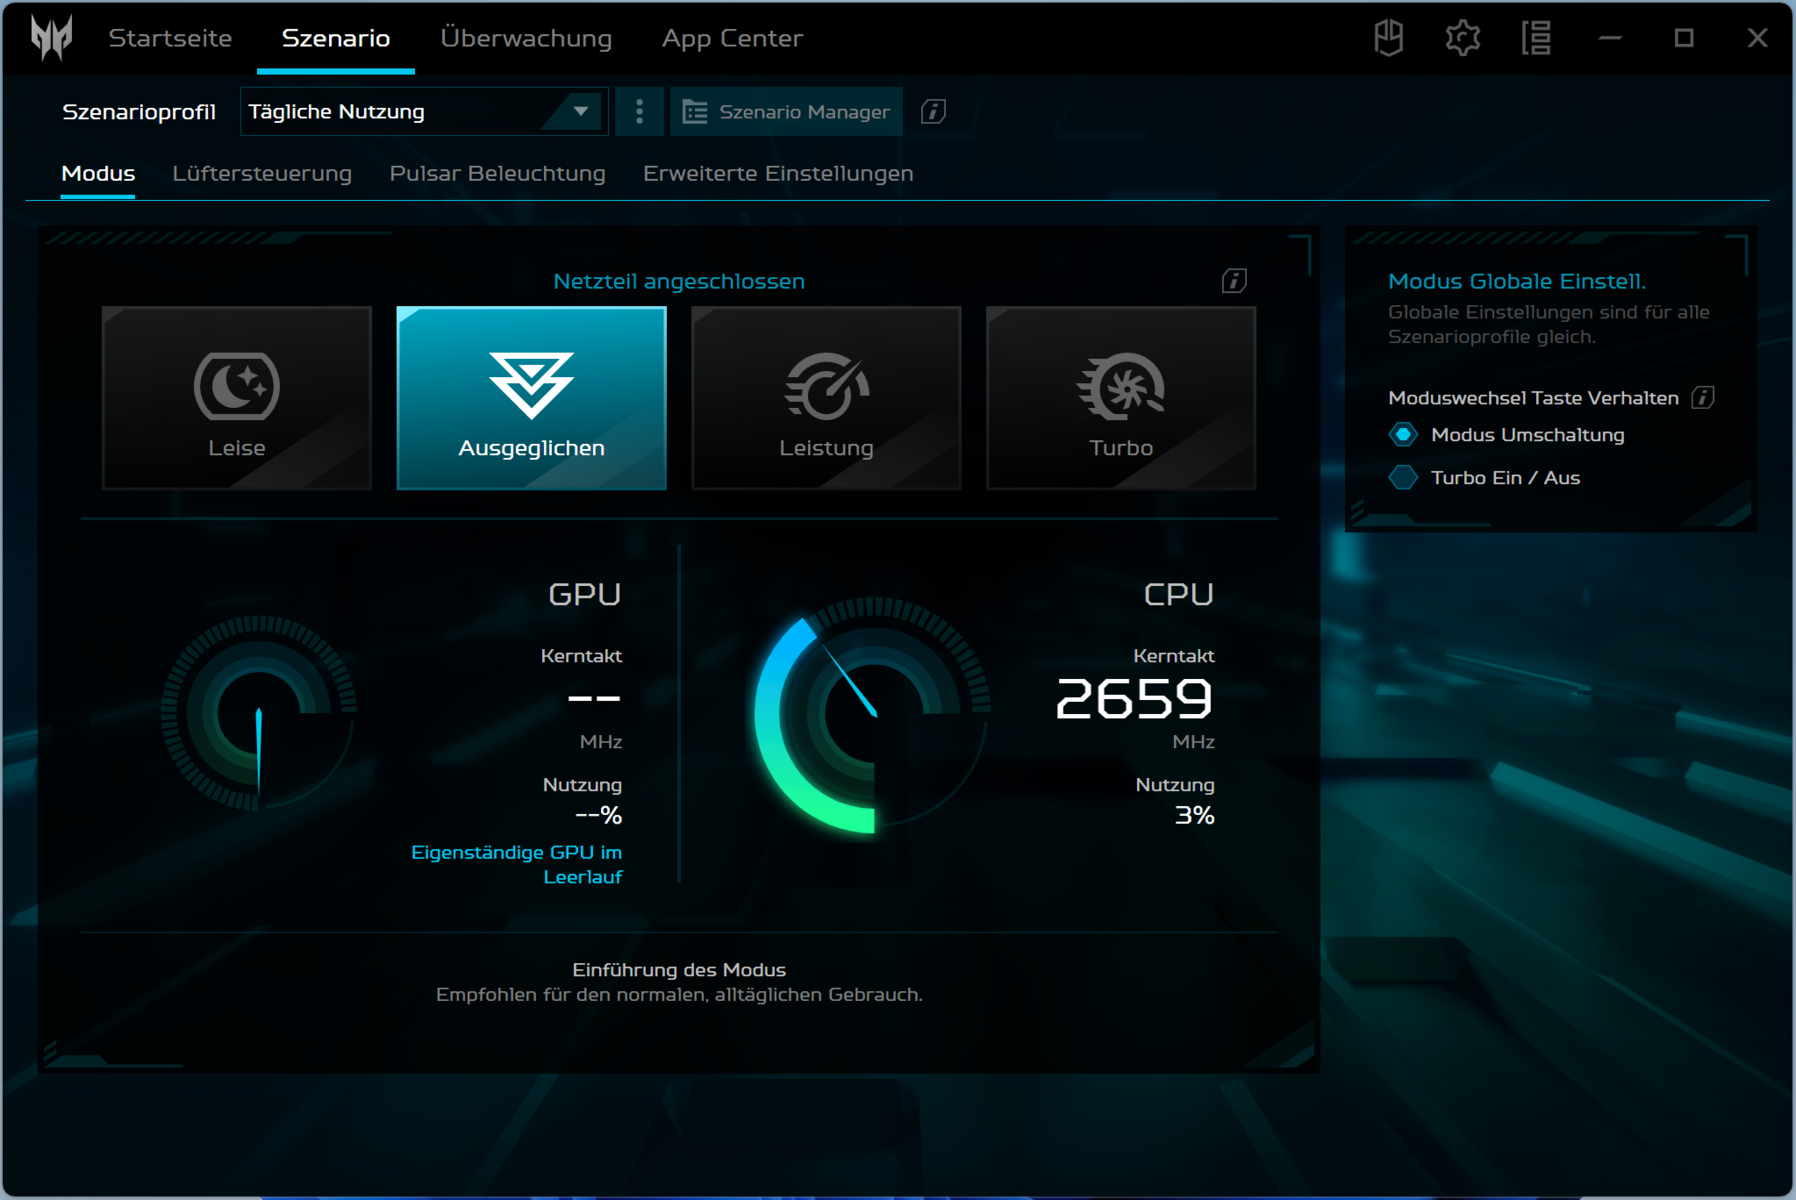
Laptop oferuje sześć trybów systemowych specyficznych dla producenta - cztery w trybie zasilania sieciowego i dwa w trybie bateryjnym (patrz tabela). My korzystaliśmy z trybów "Balanced" (benchmarki) i "Eco" (testy baterii). "Turbo" i "Wydajność" są dostępne tylko po podłączeniu do gniazdka (poziom naładowania baterii >30%).
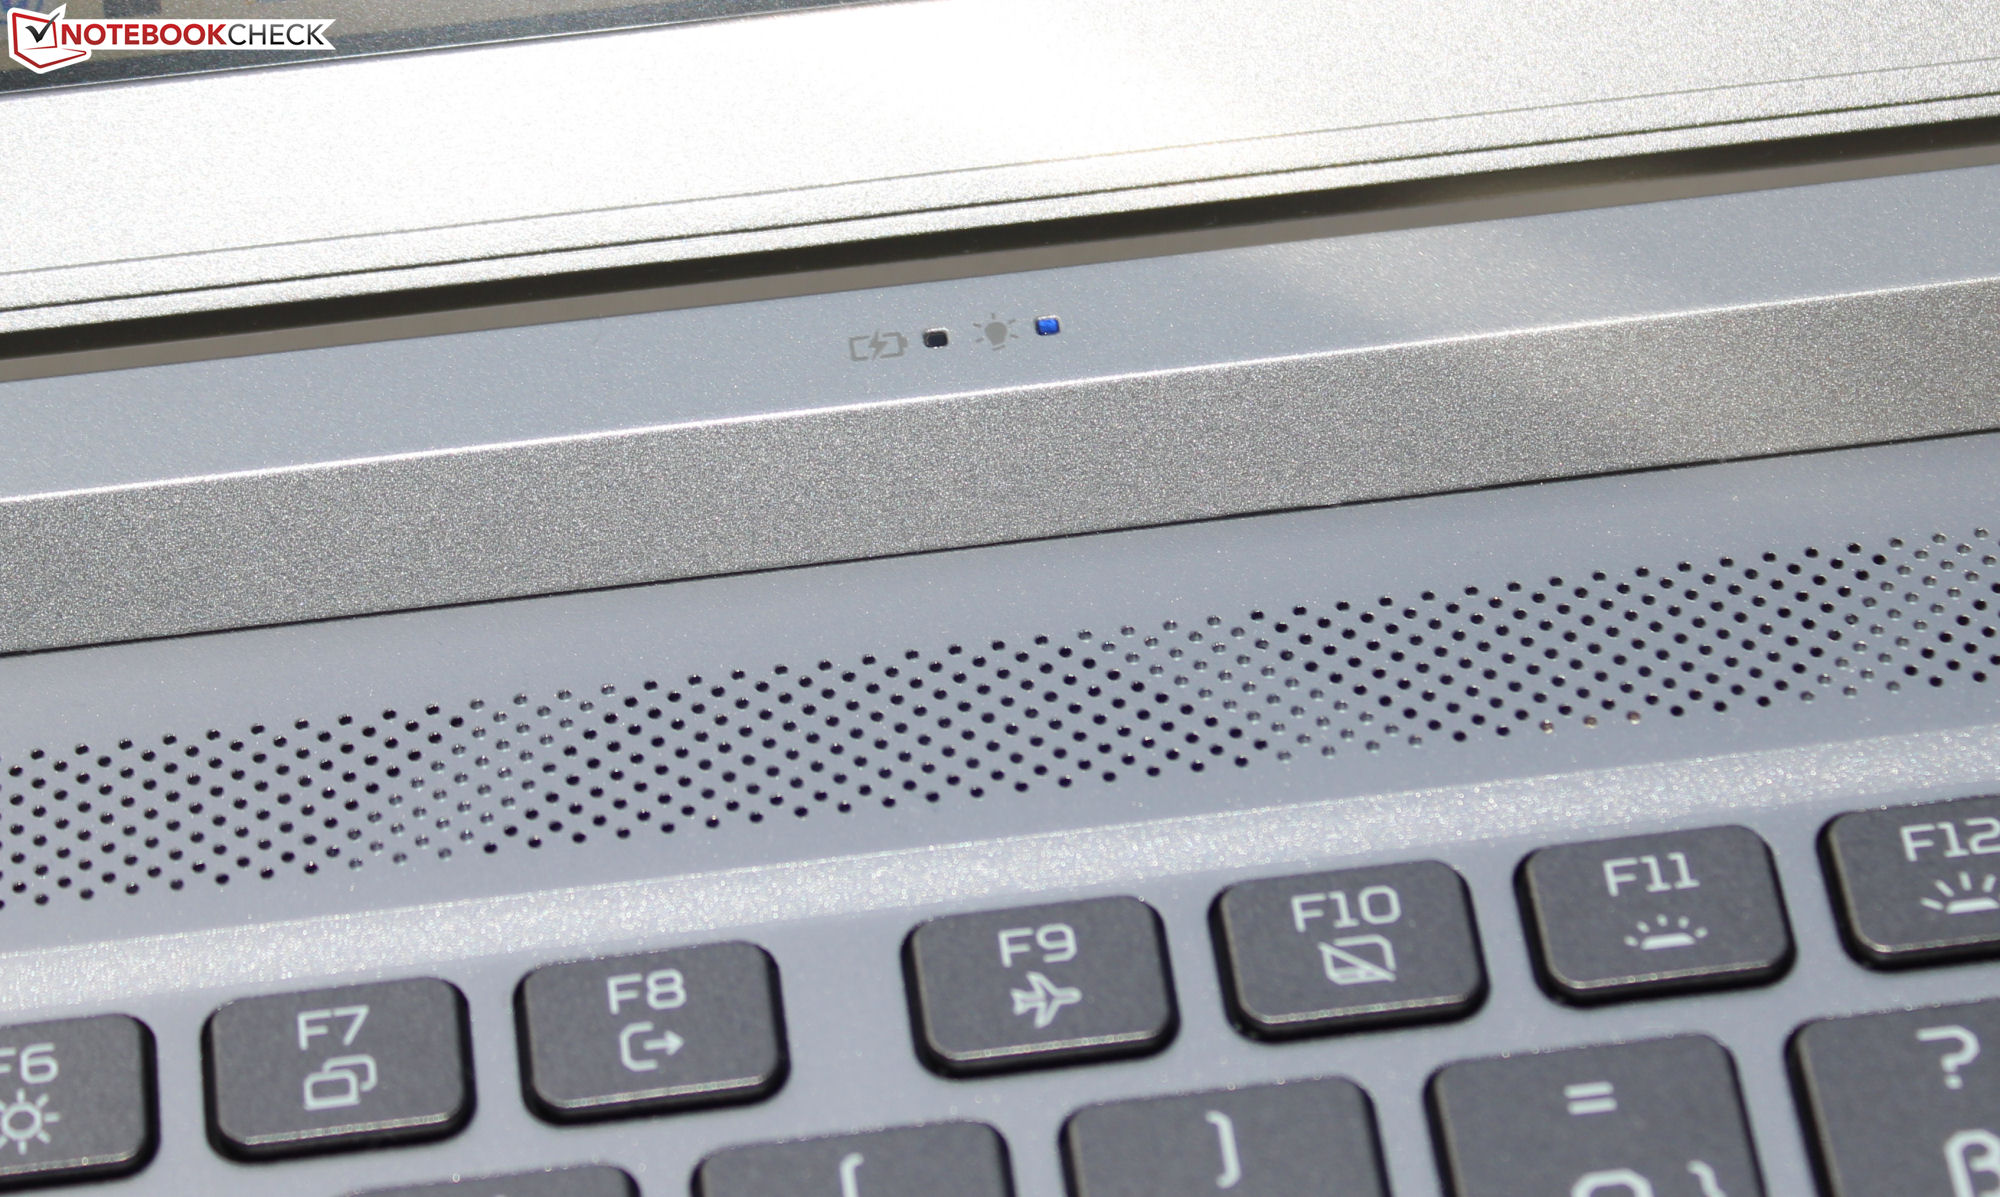
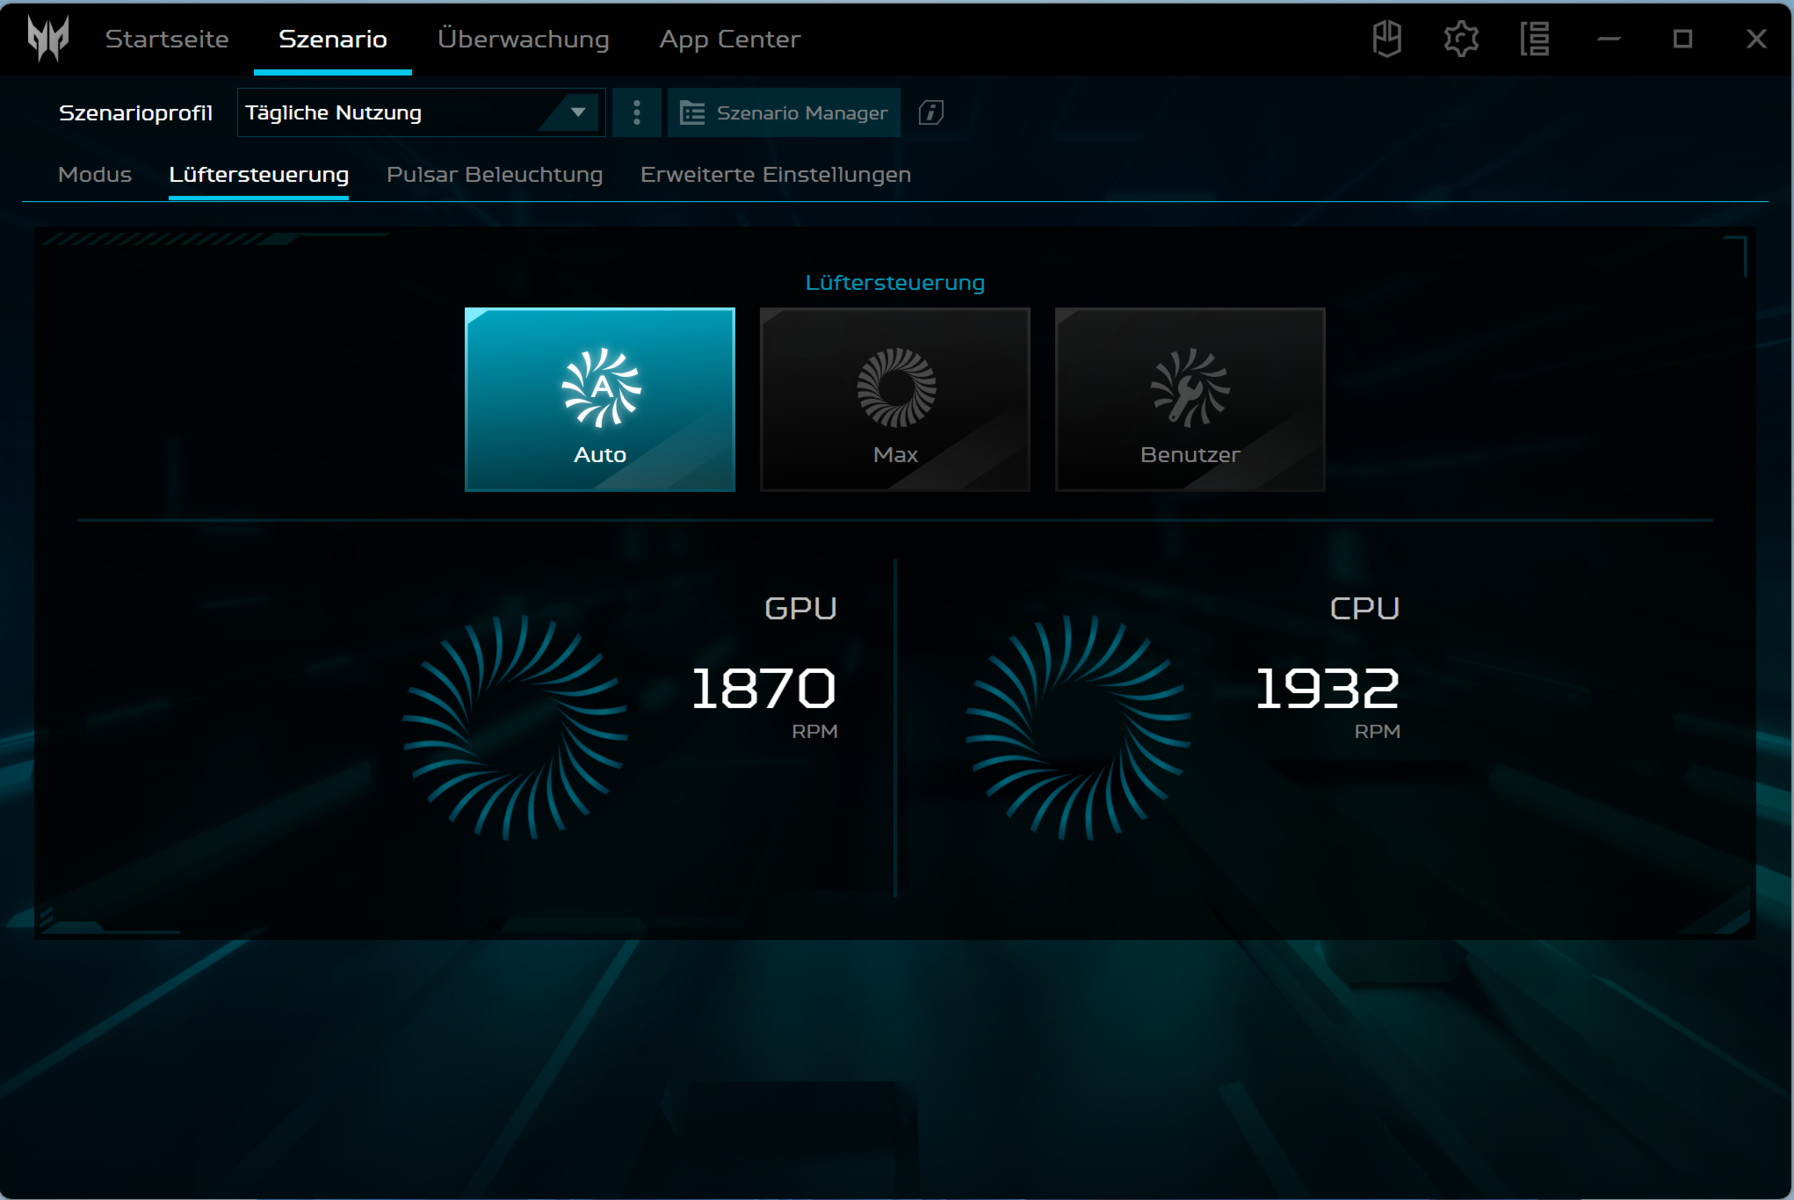
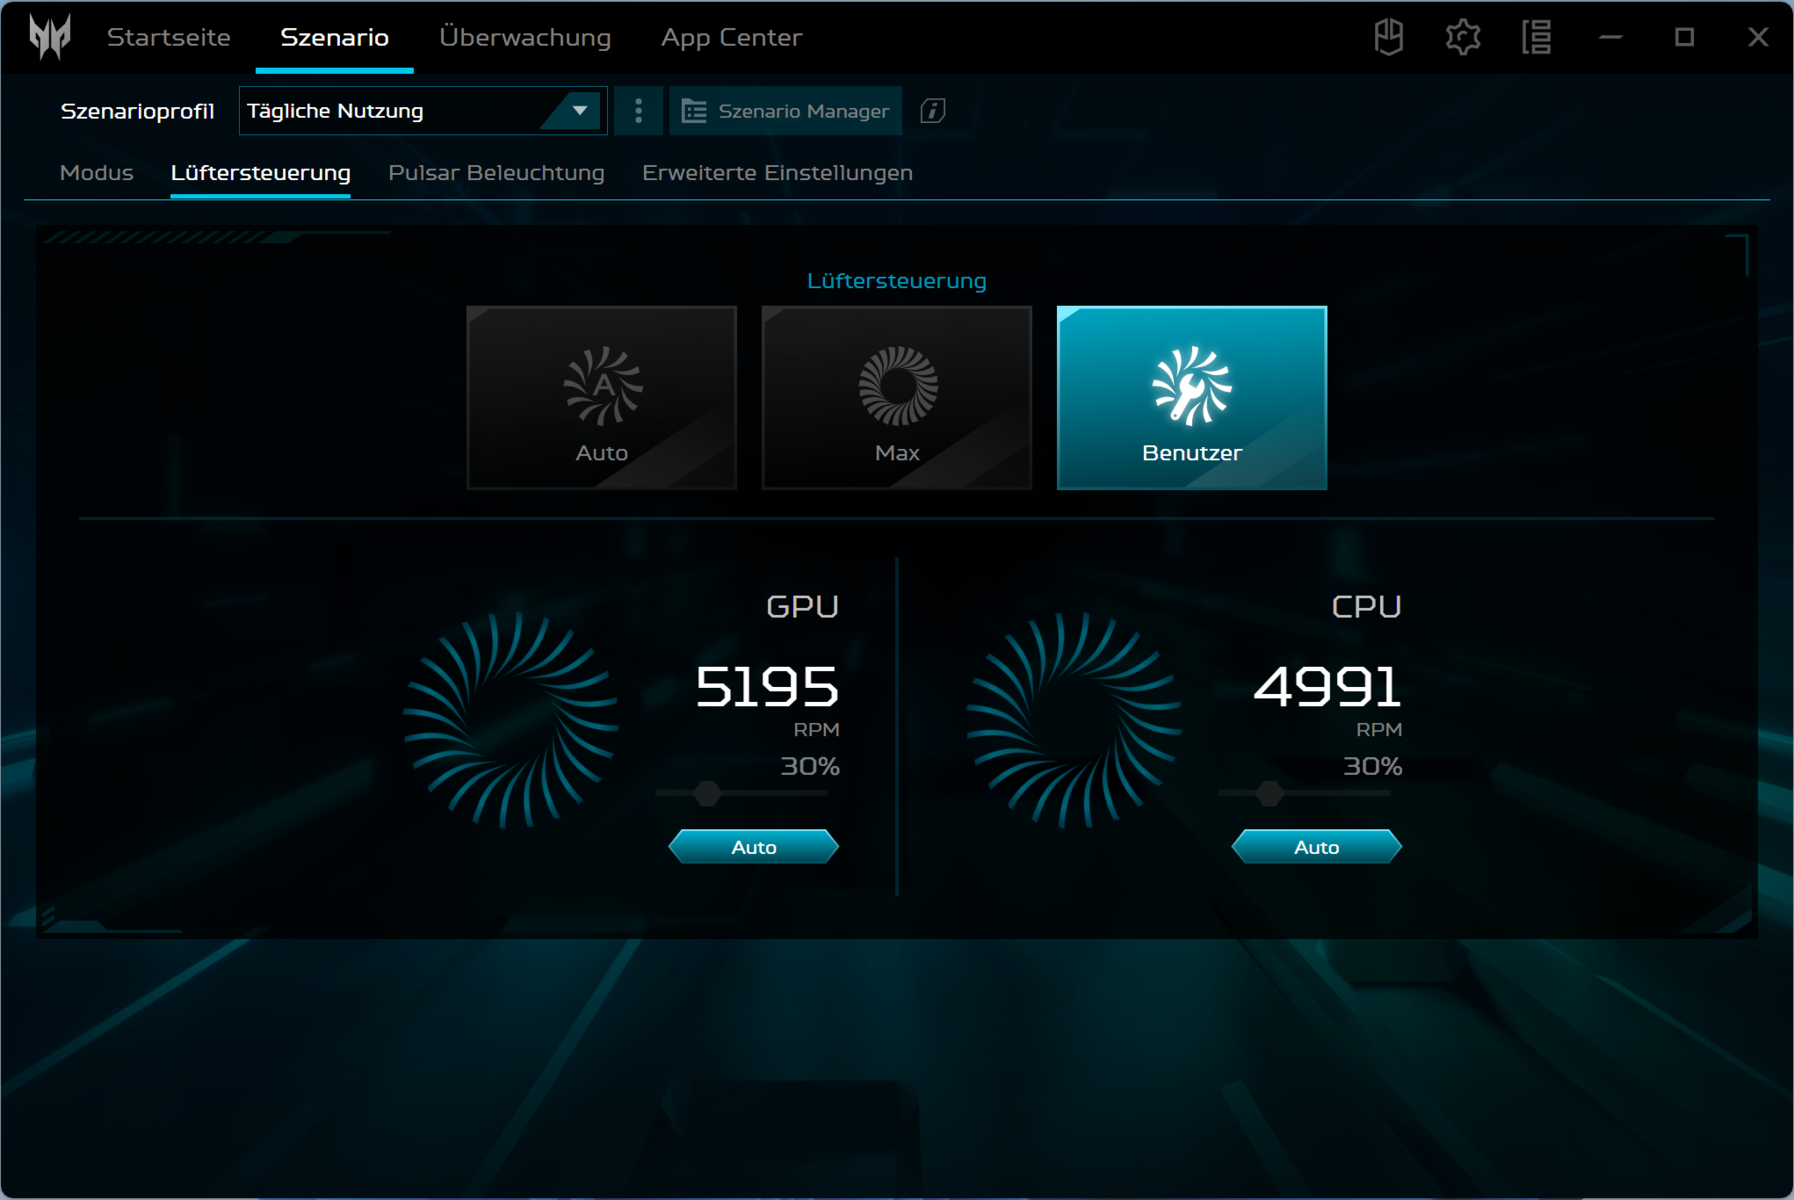
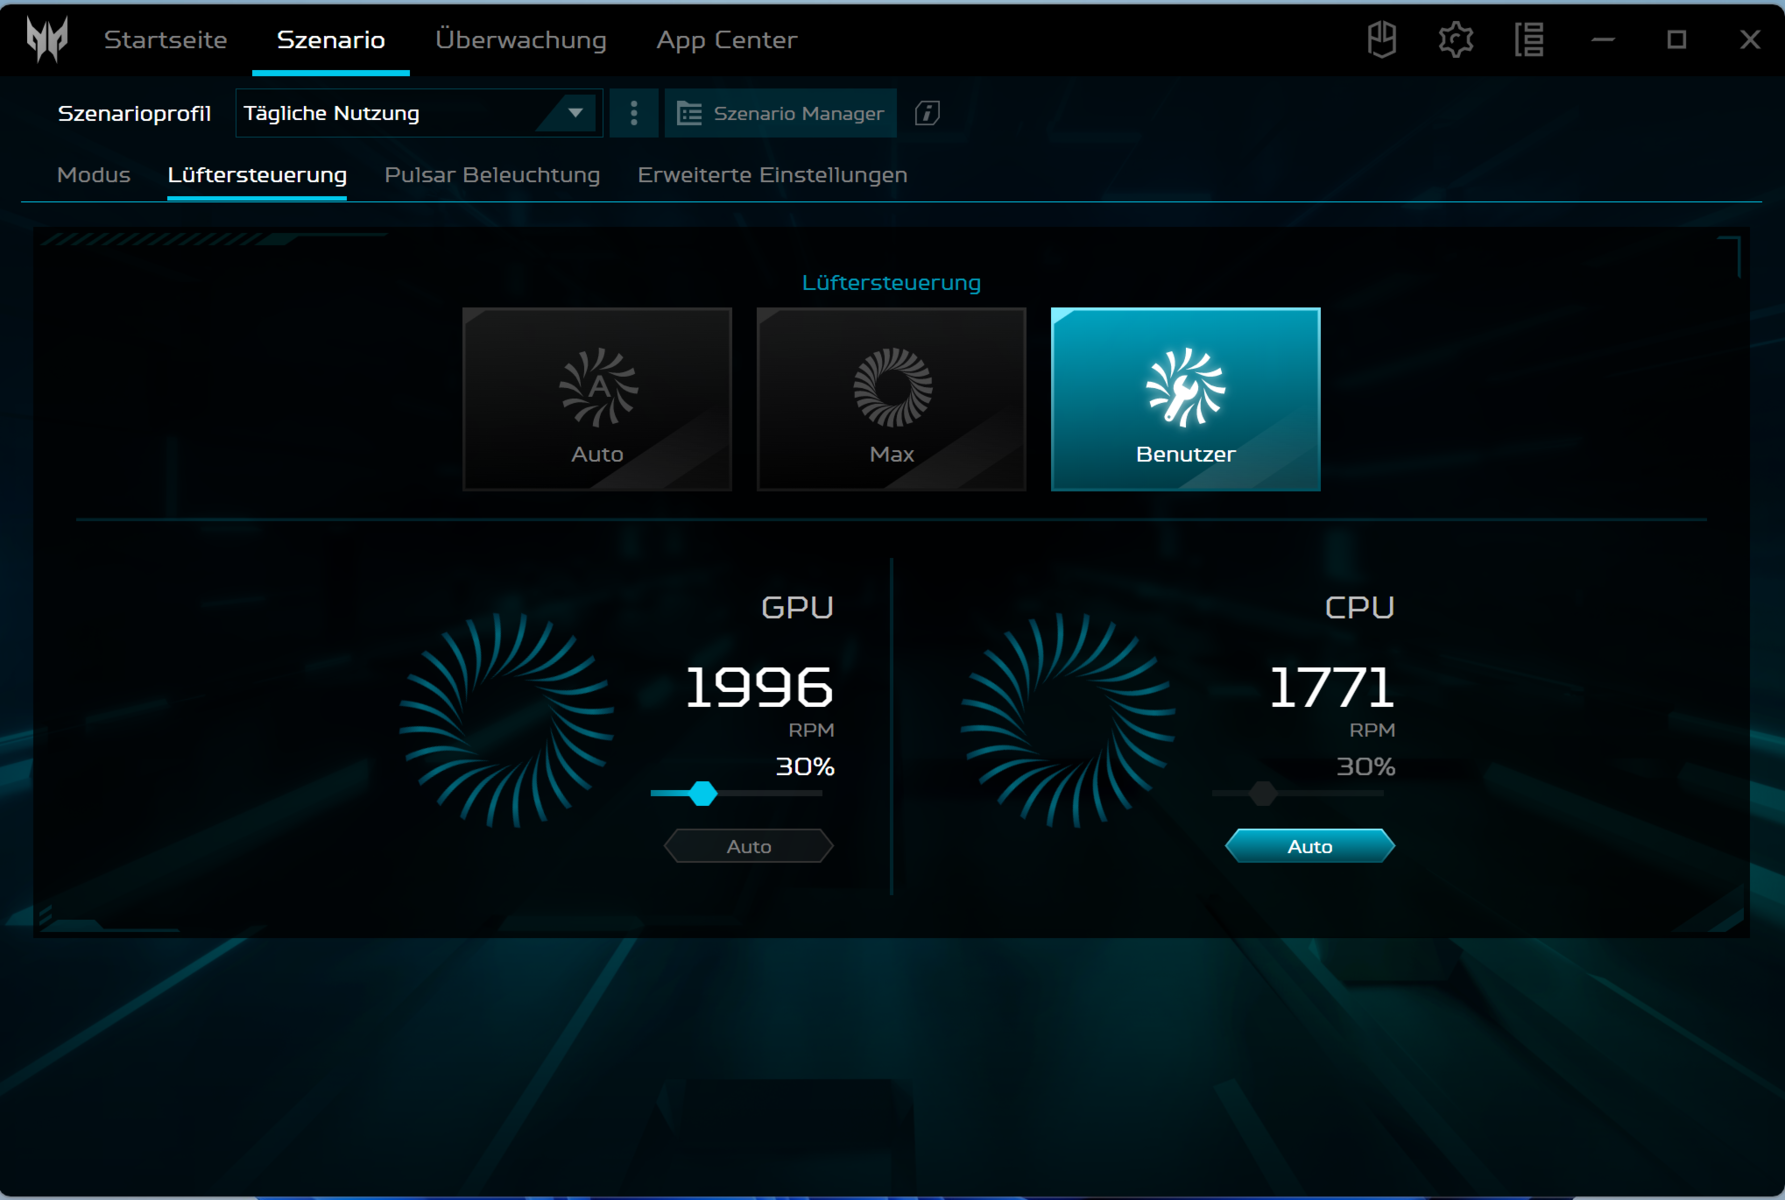
Za szybkie przełączanie pomiędzy trybami odpowiada jeden przycisk umieszczony nad klawiaturą. Alternatywnie można to zrobić za pomocą oprogramowania PredatorSense (centrum sterowania laptopa). Dioda LED wyświetla aktywny tryb.
| Turbo | Performance | Balanced | Quiet | Balanced (Battery) | Eco (Battery) | |
|---|---|---|---|---|---|---|
| Limit mocy 1 (HWInfo) | 80 watów | 75 watów | 60 watów | 50 watów | 60 watów | 25 watów |
| Limit mocy 2 (HWInfo) | 115 watów | 115 watów | 115 watów | 115 watów | 115 watów | 30 watów |
| Hałas (Witcher 3) | 56 dB(A) | 53 dB(A) | 43 dB(A) | 36 dB(A) | - | - |
| Wydajność (Witcher 3) | ~86 fps | ~83 fps | ~82 fps | ~58 fps | - | - |

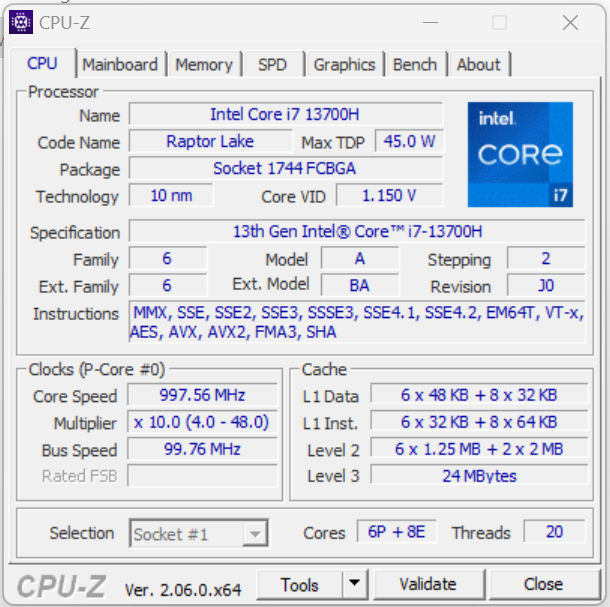
Procesor
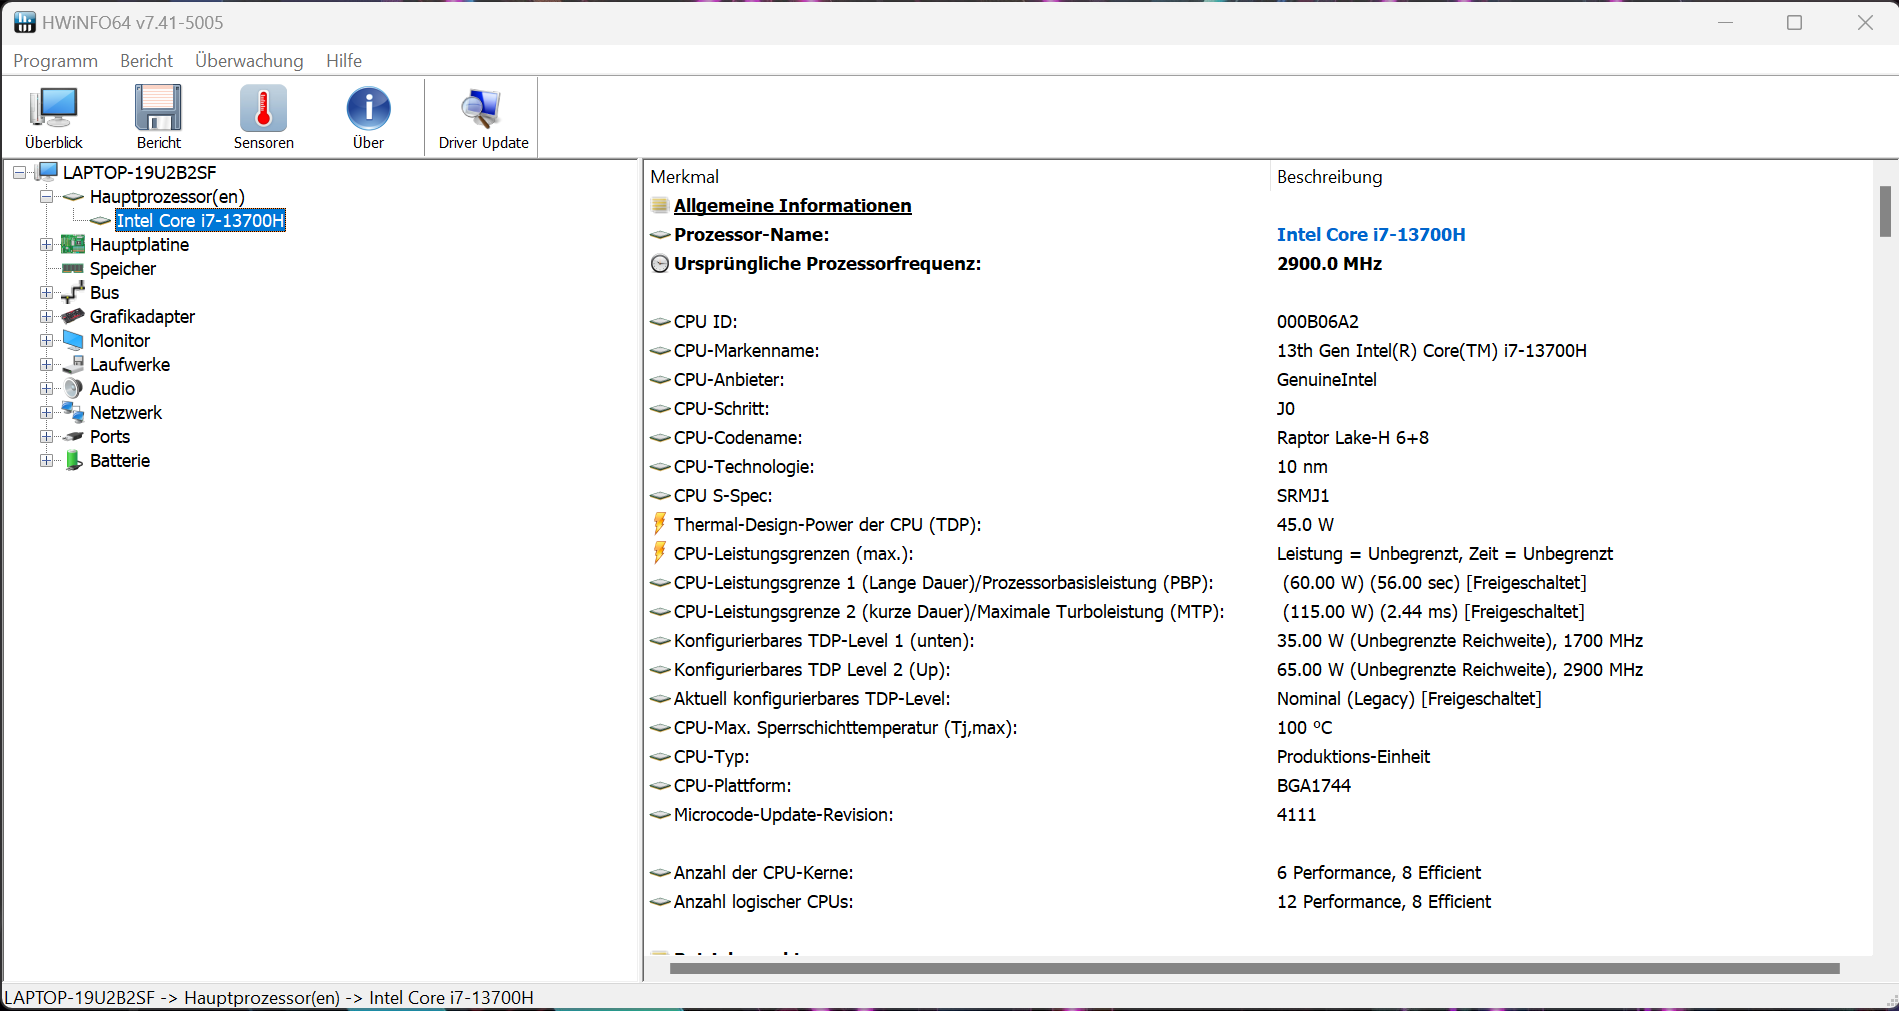
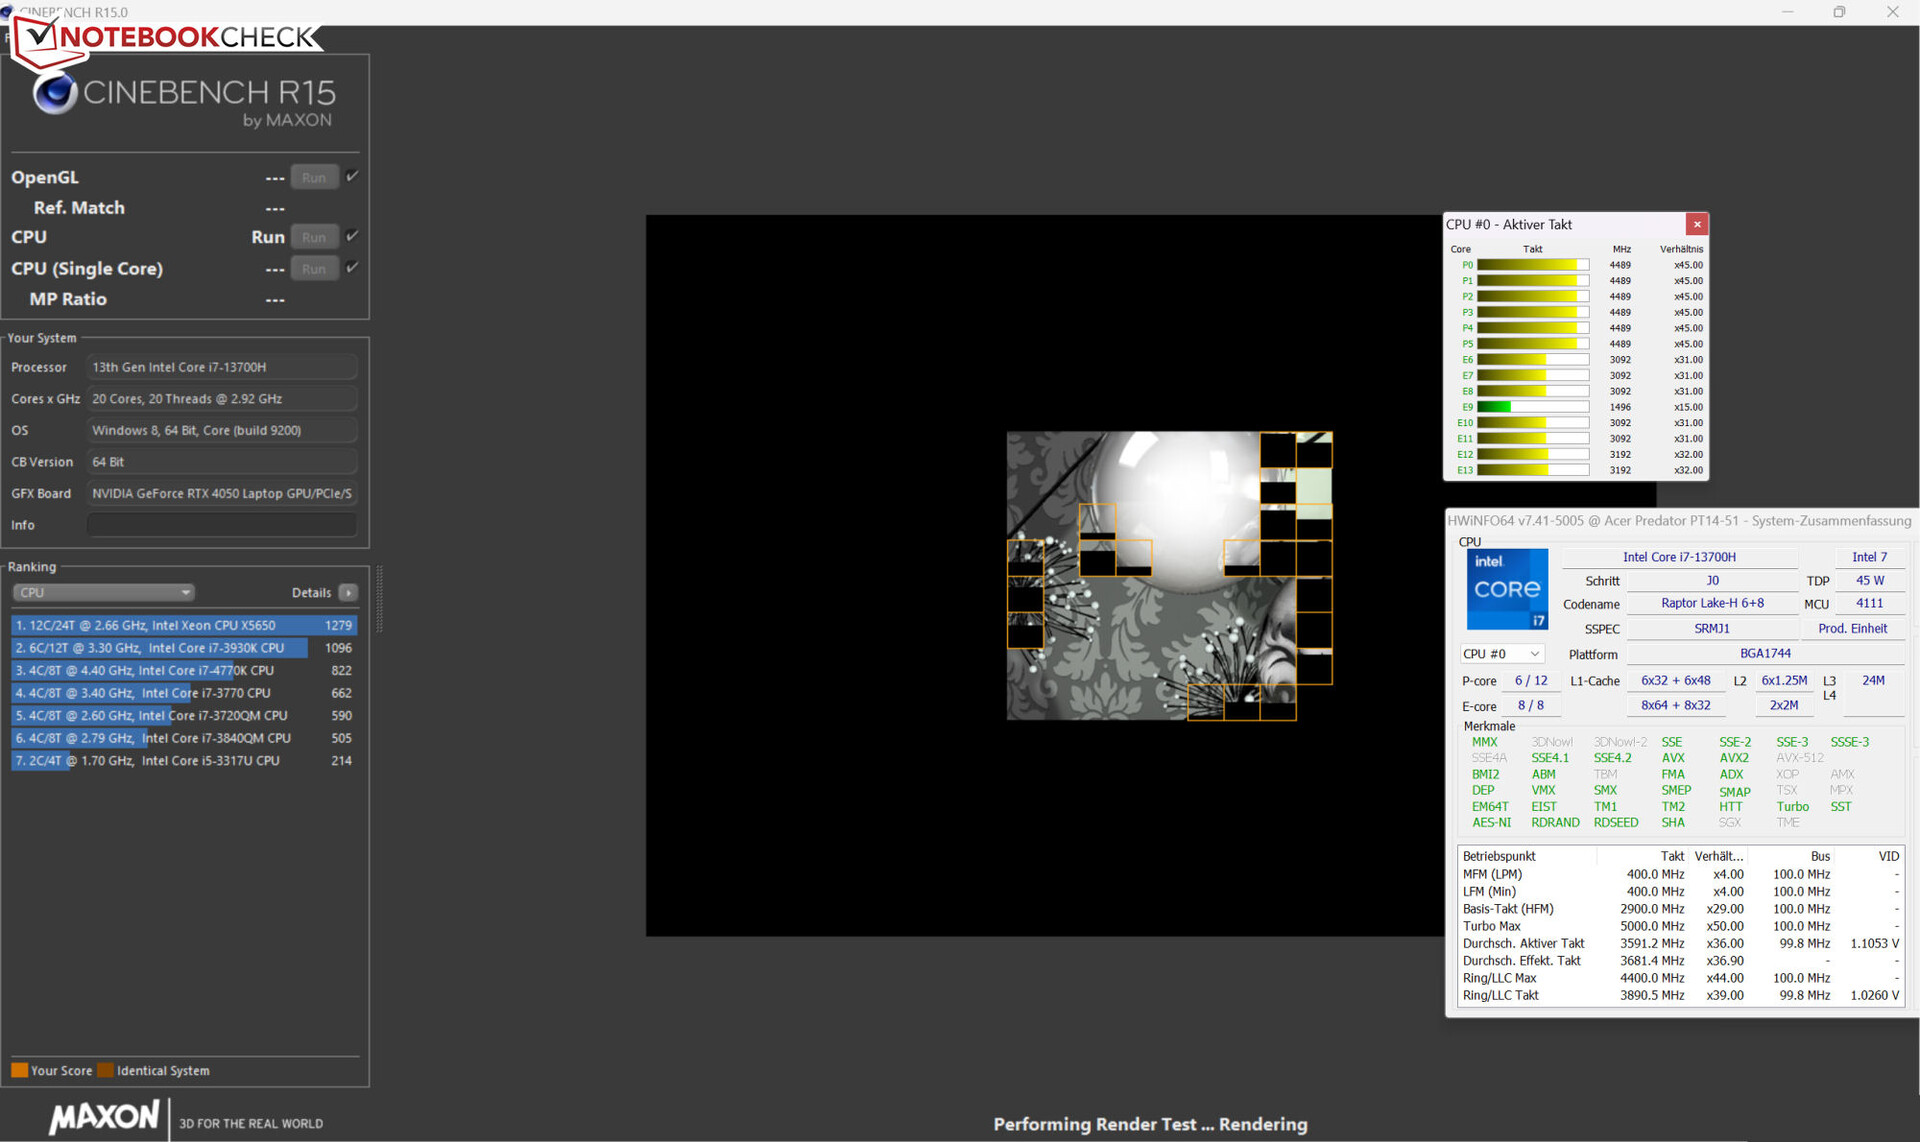
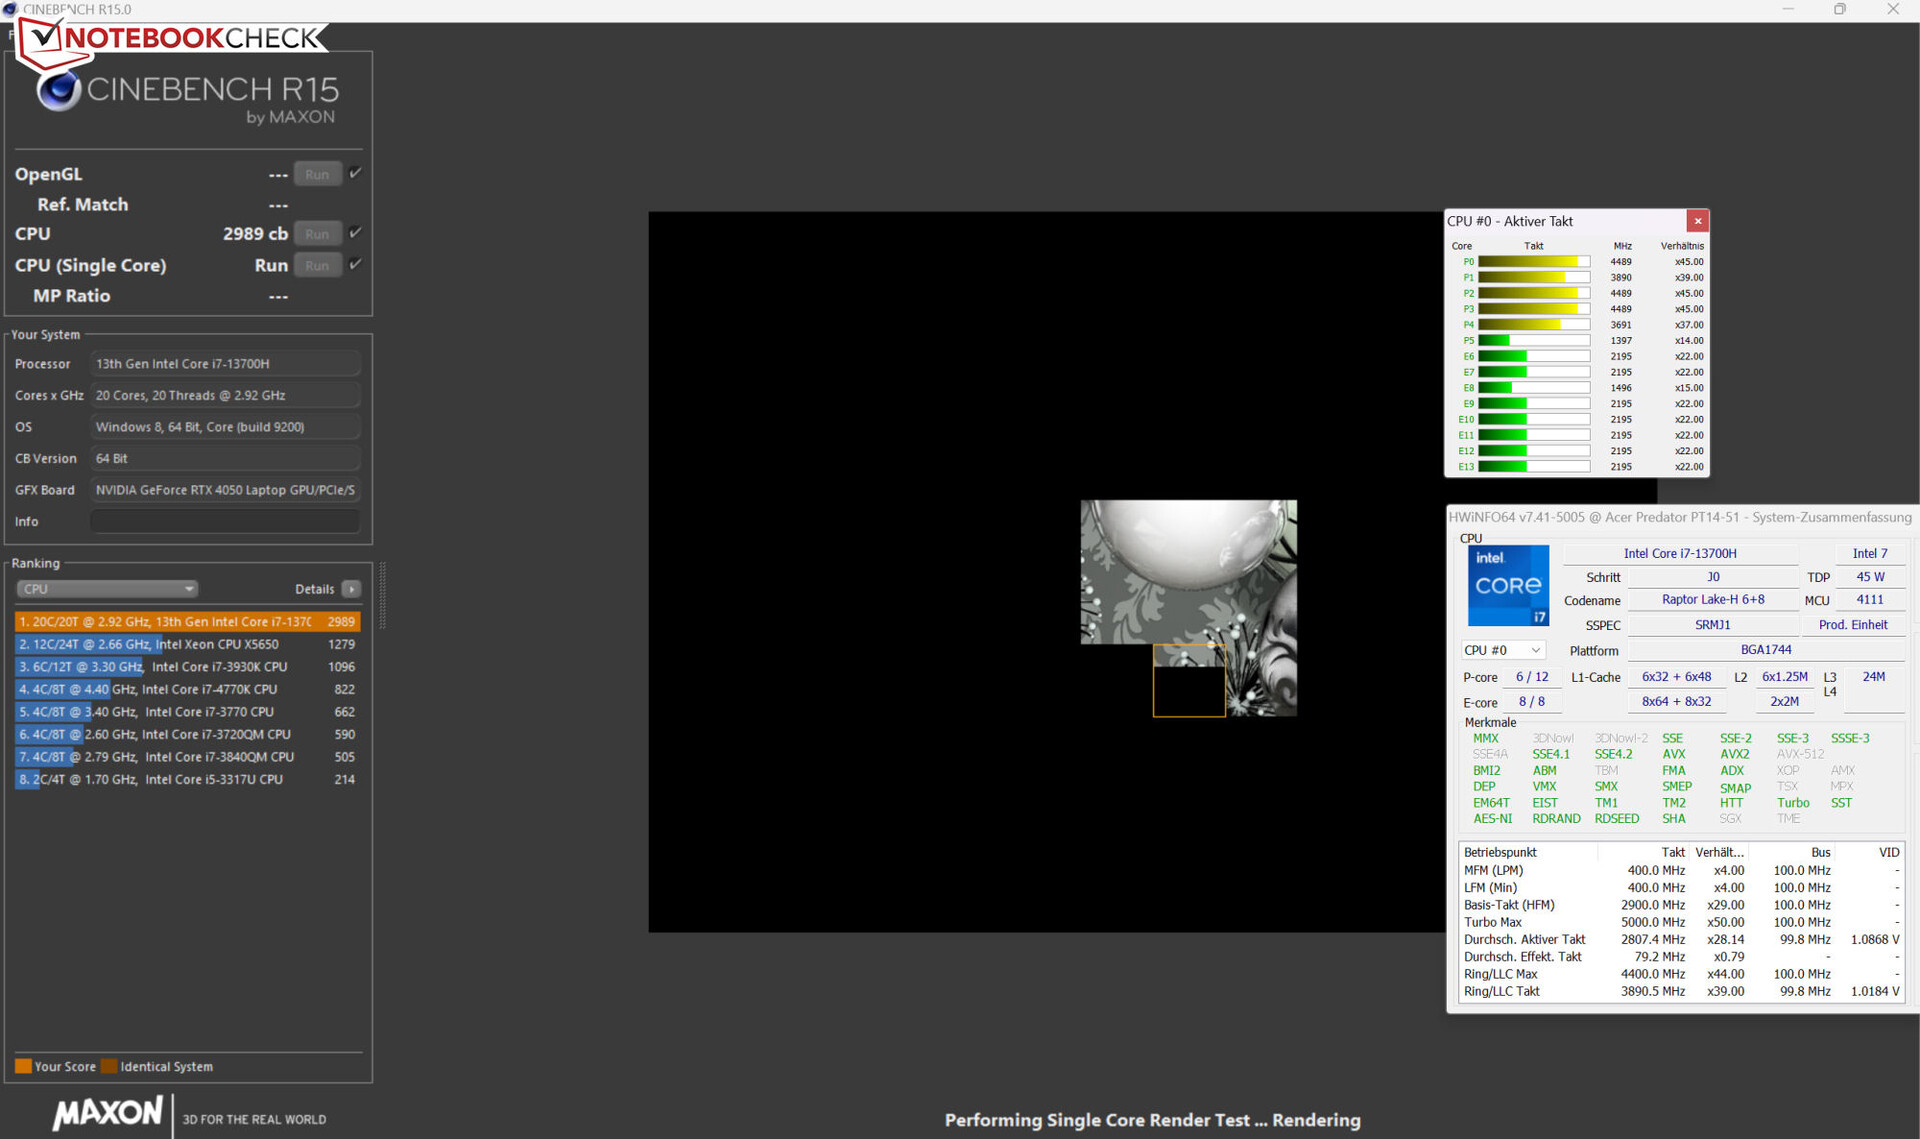
ProcesorCore-i7-13700H(Raptor Lake) składa się z ośmiu rdzeni wydajnościowych (bez hiperwątkowości, od 1,8 do 3,7 GHz) i sześciu rdzeni wydajnościowych (hiperwątkowość, od 2,4 do 5 GHz). Łącznie daje to 20 logicznych rdzeni CPU.
Wyniki benchmarków są powyżej typowej średniej CPU - niezależnie od wybranego trybu wydajności. Odpowiednia wydajność jednowątkowa (179 punktów) spada mniej w trybie baterii niż wydajność wielowątkowa (992 punkty).
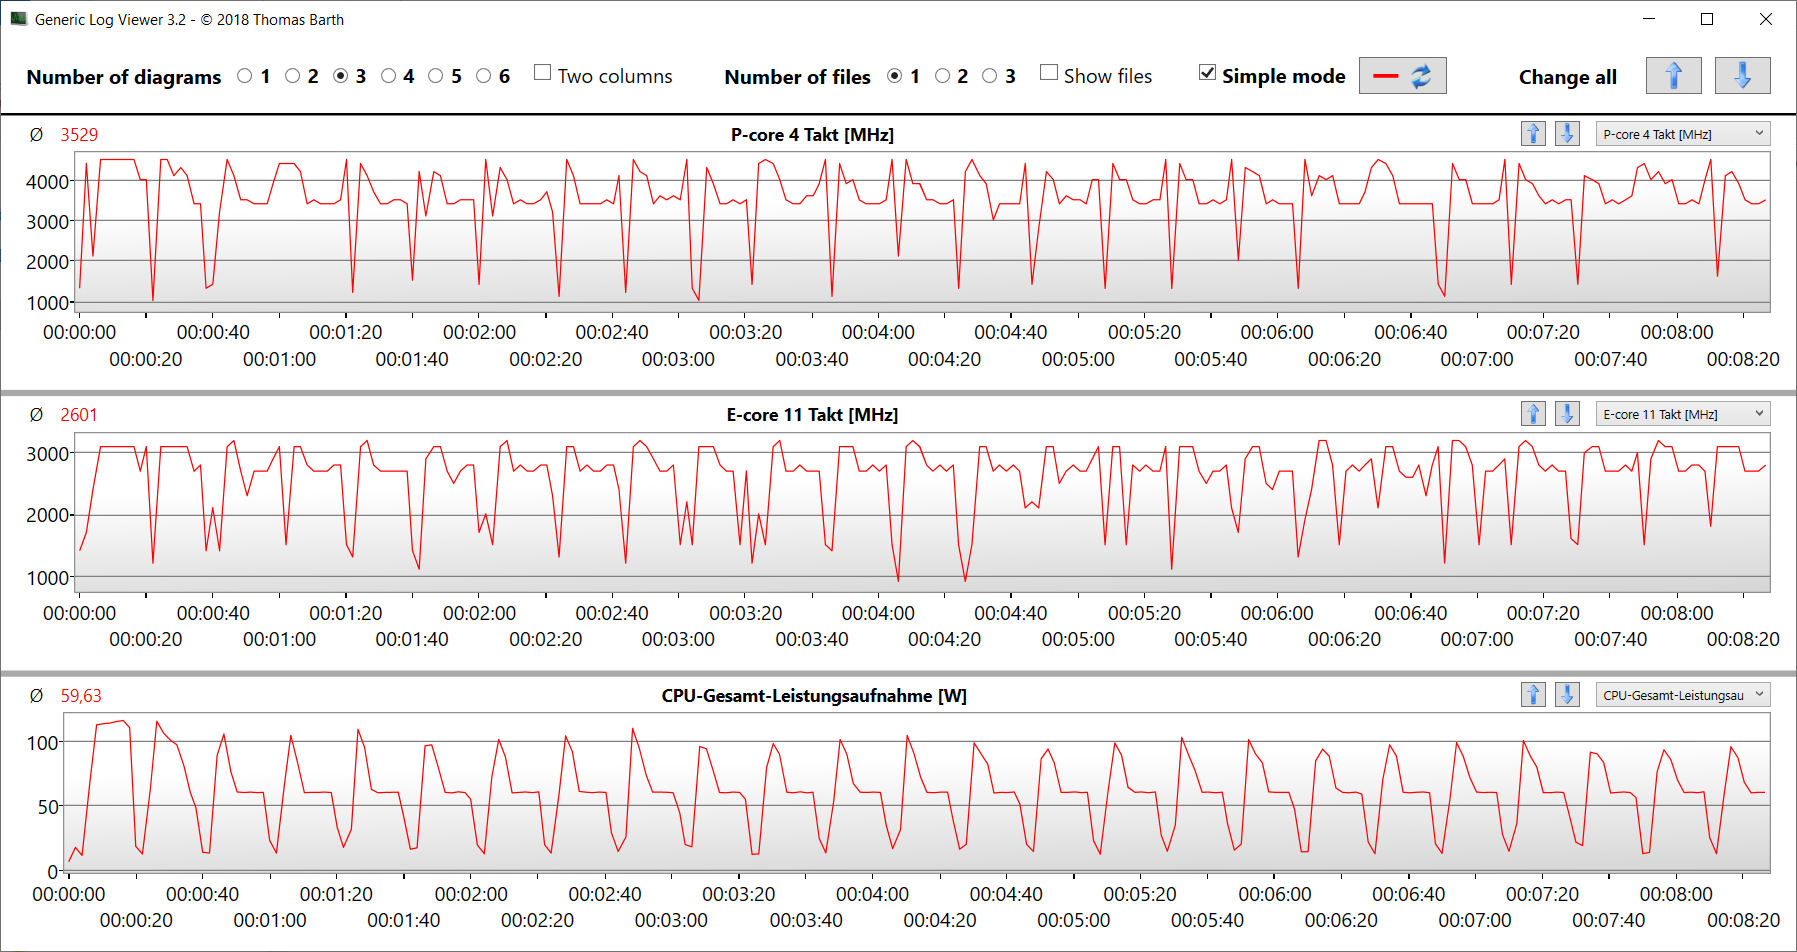
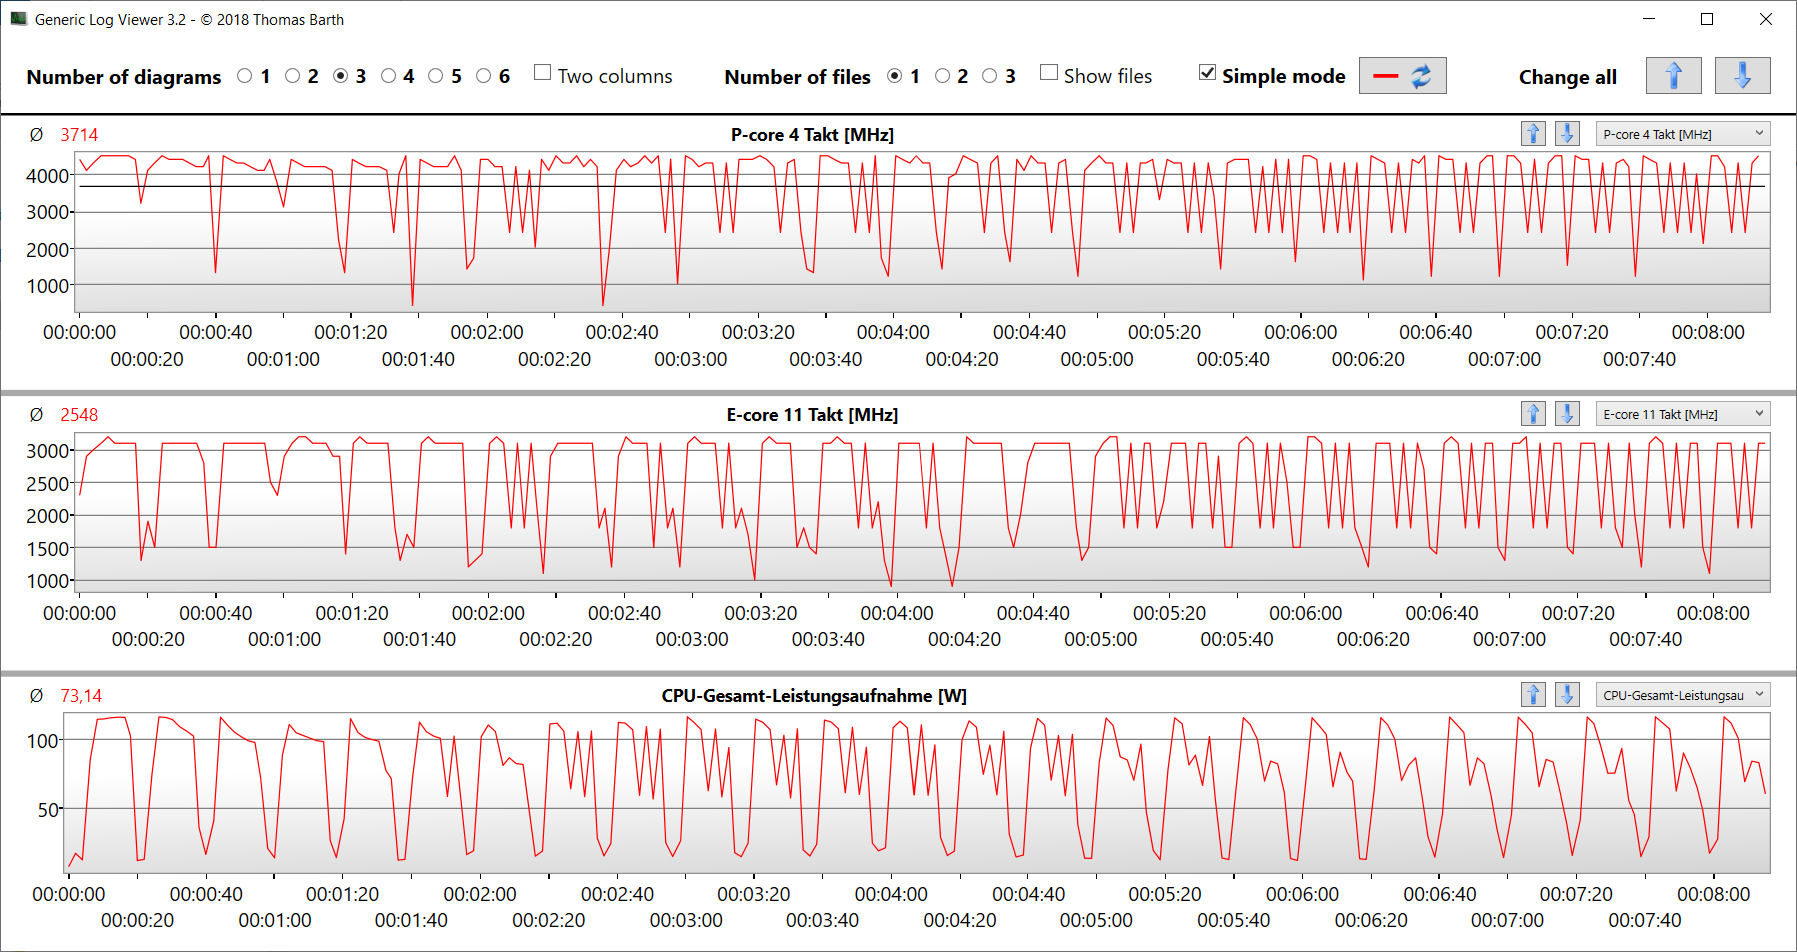
Przy ciągłym obciążeniu wielowątkowym (pętla CB15) prędkość zegara turbo spada od pierwszego do trzeciego uruchomienia. Następnie utrzymywany jest stały poziom. Profil "Turbo" zapewnia minimalnie wyższe wyniki. Generalnie różnica pomiędzy trybami jest bardzo niewielka.
Cinebench R15 Multi Continuous Test
* ... im mniej tym lepiej
AIDA64: FP32 Ray-Trace | FPU Julia | CPU SHA3 | CPU Queen | FPU SinJulia | FPU Mandel | CPU AES | CPU ZLib | FP64 Ray-Trace | CPU PhotoWorxx
| Performance rating | |
| Średnia w klasie Gaming | |
| Razer Blade 14 RTX 4070 | |
| Acer Predator Triton 14 PT14-51 | |
| MSI Stealth 14 Studio A13V | |
| Asus ROG Zephyrus G14 GA402RJ | |
| Gigabyte Aero 14 OLED BMF | |
| Przeciętny Intel Core i7-13700H | |
| AIDA64 / FP32 Ray-Trace | |
| Średnia w klasie Gaming (10227 - 85542, n=110, ostatnie 2 lata) | |
| Razer Blade 14 RTX 4070 | |
| MSI Stealth 14 Studio A13V | |
| Acer Predator Triton 14 PT14-51 | |
| Przeciętny Intel Core i7-13700H (4986 - 18908, n=29) | |
| Asus ROG Zephyrus G14 GA402RJ | |
| Gigabyte Aero 14 OLED BMF | |
| AIDA64 / FPU Julia | |
| Średnia w klasie Gaming (51376 - 238426, n=110, ostatnie 2 lata) | |
| Razer Blade 14 RTX 4070 | |
| Asus ROG Zephyrus G14 GA402RJ | |
| Acer Predator Triton 14 PT14-51 | |
| MSI Stealth 14 Studio A13V | |
| Przeciętny Intel Core i7-13700H (25360 - 92359, n=29) | |
| Gigabyte Aero 14 OLED BMF | |
| AIDA64 / CPU SHA3 | |
| Średnia w klasie Gaming (2180 - 9817, n=110, ostatnie 2 lata) | |
| Razer Blade 14 RTX 4070 | |
| Acer Predator Triton 14 PT14-51 | |
| MSI Stealth 14 Studio A13V | |
| Przeciętny Intel Core i7-13700H (1339 - 4224, n=29) | |
| Gigabyte Aero 14 OLED BMF | |
| Asus ROG Zephyrus G14 GA402RJ | |
| AIDA64 / CPU Queen | |
| Razer Blade 14 RTX 4070 | |
| Średnia w klasie Gaming (49785 - 173351, n=101, ostatnie 2 lata) | |
| Gigabyte Aero 14 OLED BMF | |
| MSI Stealth 14 Studio A13V | |
| Asus ROG Zephyrus G14 GA402RJ | |
| Acer Predator Triton 14 PT14-51 | |
| Przeciętny Intel Core i7-13700H (59324 - 107159, n=29) | |
| AIDA64 / FPU SinJulia | |
| Razer Blade 14 RTX 4070 | |
| Średnia w klasie Gaming (4424 - 33636, n=110, ostatnie 2 lata) | |
| Asus ROG Zephyrus G14 GA402RJ | |
| MSI Stealth 14 Studio A13V | |
| Acer Predator Triton 14 PT14-51 | |
| Przeciętny Intel Core i7-13700H (4800 - 11050, n=29) | |
| Gigabyte Aero 14 OLED BMF | |
| AIDA64 / FPU Mandel | |
| Średnia w klasie Gaming (25115 - 128721, n=110, ostatnie 2 lata) | |
| Razer Blade 14 RTX 4070 | |
| Asus ROG Zephyrus G14 GA402RJ | |
| MSI Stealth 14 Studio A13V | |
| Acer Predator Triton 14 PT14-51 | |
| Przeciętny Intel Core i7-13700H (12321 - 45118, n=29) | |
| Gigabyte Aero 14 OLED BMF | |
| AIDA64 / CPU AES | |
| Acer Predator Triton 14 PT14-51 | |
| Asus ROG Zephyrus G14 GA402RJ | |
| Gigabyte Aero 14 OLED BMF | |
| Średnia w klasie Gaming (39258 - 247074, n=110, ostatnie 2 lata) | |
| Razer Blade 14 RTX 4070 | |
| MSI Stealth 14 Studio A13V | |
| Przeciętny Intel Core i7-13700H (28769 - 151254, n=29) | |
| AIDA64 / CPU ZLib | |
| Średnia w klasie Gaming (574 - 2531, n=110, ostatnie 2 lata) | |
| Acer Predator Triton 14 PT14-51 | |
| Razer Blade 14 RTX 4070 | |
| MSI Stealth 14 Studio A13V | |
| Przeciętny Intel Core i7-13700H (389 - 1215, n=29) | |
| Gigabyte Aero 14 OLED BMF | |
| Asus ROG Zephyrus G14 GA402RJ | |
| AIDA64 / FP64 Ray-Trace | |
| Średnia w klasie Gaming (5509 - 45446, n=110, ostatnie 2 lata) | |
| Razer Blade 14 RTX 4070 | |
| MSI Stealth 14 Studio A13V | |
| Acer Predator Triton 14 PT14-51 | |
| Przeciętny Intel Core i7-13700H (2540 - 10135, n=29) | |
| Asus ROG Zephyrus G14 GA402RJ | |
| Gigabyte Aero 14 OLED BMF | |
| AIDA64 / CPU PhotoWorxx | |
| Gigabyte Aero 14 OLED BMF | |
| Acer Predator Triton 14 PT14-51 | |
| Średnia w klasie Gaming (12271 - 89891, n=110, ostatnie 2 lata) | |
| Przeciętny Intel Core i7-13700H (12872 - 52727, n=29) | |
| MSI Stealth 14 Studio A13V | |
| Razer Blade 14 RTX 4070 | |
| Asus ROG Zephyrus G14 GA402RJ | |
Wydajność systemu
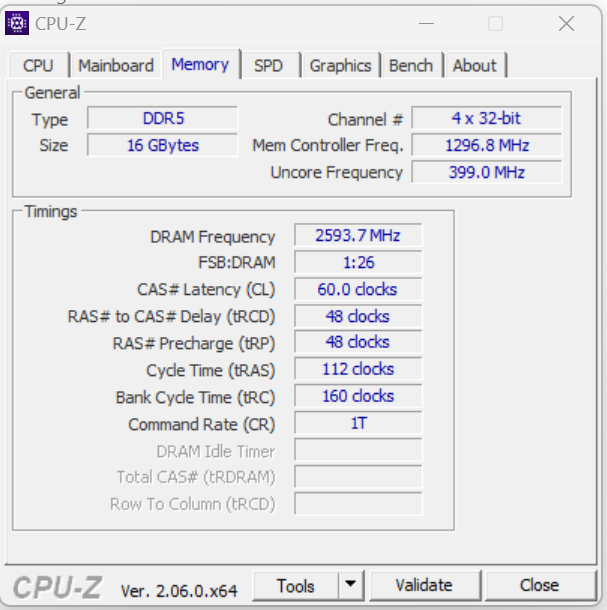
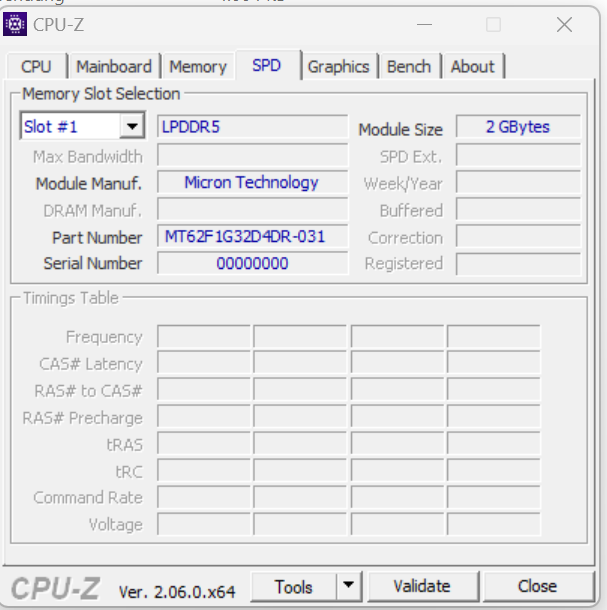
Płynnie działający system dysponuje wystarczającą mocą do wymagających zastosowań, takich jak renderowanie i gry - co potwierdzają dobre wyniki PC Mark. Prędkości transferu pamięci RAM mieszczą się w normalnym zakresie dla LPDDR5 6000 RAM.
CrossMark: Overall | Productivity | Creativity | Responsiveness
| PCMark 10 / Score | |
| Średnia w klasie Gaming (5828 - 11574, n=96, ostatnie 2 lata) | |
| Razer Blade 14 RTX 4070 | |
| Acer Predator Triton 14 PT14-51 | |
| Asus ROG Zephyrus G14 GA402RJ | |
| Gigabyte Aero 14 OLED BMF | |
| Przeciętny Intel Core i7-13700H, NVIDIA GeForce RTX 4050 Laptop GPU (6822 - 7556, n=7) | |
| MSI Stealth 14 Studio A13V | |
| PCMark 10 / Essentials | |
| Gigabyte Aero 14 OLED BMF | |
| Razer Blade 14 RTX 4070 | |
| Przeciętny Intel Core i7-13700H, NVIDIA GeForce RTX 4050 Laptop GPU (10283 - 11549, n=7) | |
| Średnia w klasie Gaming (8810 - 12600, n=100, ostatnie 2 lata) | |
| Acer Predator Triton 14 PT14-51 | |
| MSI Stealth 14 Studio A13V | |
| Asus ROG Zephyrus G14 GA402RJ | |
| PCMark 10 / Productivity | |
| Razer Blade 14 RTX 4070 | |
| Średnia w klasie Gaming (6845 - 18766, n=98, ostatnie 2 lata) | |
| Acer Predator Triton 14 PT14-51 | |
| Asus ROG Zephyrus G14 GA402RJ | |
| Gigabyte Aero 14 OLED BMF | |
| Przeciętny Intel Core i7-13700H, NVIDIA GeForce RTX 4050 Laptop GPU (8368 - 9836, n=7) | |
| MSI Stealth 14 Studio A13V | |
| PCMark 10 / Digital Content Creation | |
| Średnia w klasie Gaming (7602 - 19657, n=98, ostatnie 2 lata) | |
| Razer Blade 14 RTX 4070 | |
| Asus ROG Zephyrus G14 GA402RJ | |
| Acer Predator Triton 14 PT14-51 | |
| MSI Stealth 14 Studio A13V | |
| Przeciętny Intel Core i7-13700H, NVIDIA GeForce RTX 4050 Laptop GPU (9527 - 10643, n=7) | |
| Gigabyte Aero 14 OLED BMF | |
| CrossMark / Overall | |
| Średnia w klasie Gaming (1366 - 2409, n=98, ostatnie 2 lata) | |
| Acer Predator Triton 14 PT14-51 | |
| Gigabyte Aero 14 OLED BMF | |
| Razer Blade 14 RTX 4070 | |
| Apple MacBook Pro 14 2023 M2 Pro Entry | |
| MSI Stealth 14 Studio A13V | |
| Przeciętny Intel Core i7-13700H, NVIDIA GeForce RTX 4050 Laptop GPU (1205 - 1937, n=9) | |
| CrossMark / Productivity | |
| Średnia w klasie Gaming (1386 - 2254, n=98, ostatnie 2 lata) | |
| Gigabyte Aero 14 OLED BMF | |
| Razer Blade 14 RTX 4070 | |
| Acer Predator Triton 14 PT14-51 | |
| Przeciętny Intel Core i7-13700H, NVIDIA GeForce RTX 4050 Laptop GPU (1158 - 1877, n=9) | |
| MSI Stealth 14 Studio A13V | |
| Apple MacBook Pro 14 2023 M2 Pro Entry | |
| CrossMark / Creativity | |
| Apple MacBook Pro 14 2023 M2 Pro Entry | |
| Średnia w klasie Gaming (1343 - 2729, n=98, ostatnie 2 lata) | |
| Acer Predator Triton 14 PT14-51 | |
| Razer Blade 14 RTX 4070 | |
| Gigabyte Aero 14 OLED BMF | |
| MSI Stealth 14 Studio A13V | |
| Przeciętny Intel Core i7-13700H, NVIDIA GeForce RTX 4050 Laptop GPU (1293 - 2044, n=9) | |
| CrossMark / Responsiveness | |
| Acer Predator Triton 14 PT14-51 | |
| Gigabyte Aero 14 OLED BMF | |
| Średnia w klasie Gaming (1226 - 2334, n=98, ostatnie 2 lata) | |
| Przeciętny Intel Core i7-13700H, NVIDIA GeForce RTX 4050 Laptop GPU (1097 - 1929, n=9) | |
| Razer Blade 14 RTX 4070 | |
| MSI Stealth 14 Studio A13V | |
| Apple MacBook Pro 14 2023 M2 Pro Entry | |
| PCMark 8 Home Score Accelerated v2 | 5120 pkt. | |
| PCMark 8 Work Score Accelerated v2 | 5617 pkt. | |
| PCMark 10 Score | 7402 pkt. | |
Pomoc | ||
| AIDA64 / Memory Copy | |
| Gigabyte Aero 14 OLED BMF | |
| Acer Predator Triton 14 PT14-51 | |
| Średnia w klasie Gaming (21750 - 129946, n=110, ostatnie 2 lata) | |
| Przeciętny Intel Core i7-13700H (24334 - 78081, n=29) | |
| Razer Blade 14 RTX 4070 | |
| MSI Stealth 14 Studio A13V | |
| Asus ROG Zephyrus G14 GA402RJ | |
| AIDA64 / Memory Read | |
| Gigabyte Aero 14 OLED BMF | |
| Średnia w klasie Gaming (22956 - 118858, n=110, ostatnie 2 lata) | |
| MSI Stealth 14 Studio A13V | |
| Acer Predator Triton 14 PT14-51 | |
| Przeciętny Intel Core i7-13700H (23681 - 79656, n=29) | |
| Razer Blade 14 RTX 4070 | |
| Asus ROG Zephyrus G14 GA402RJ | |
| AIDA64 / Memory Write | |
| Gigabyte Aero 14 OLED BMF | |
| Acer Predator Triton 14 PT14-51 | |
| Razer Blade 14 RTX 4070 | |
| Średnia w klasie Gaming (22297 - 135096, n=110, ostatnie 2 lata) | |
| Przeciętny Intel Core i7-13700H (22986 - 99898, n=29) | |
| Asus ROG Zephyrus G14 GA402RJ | |
| MSI Stealth 14 Studio A13V | |
| AIDA64 / Memory Latency | |
| Średnia w klasie Gaming (75.3 - 259, n=110, ostatnie 2 lata) | |
| Acer Predator Triton 14 PT14-51 | |
| Przeciętny Intel Core i7-13700H (82.4 - 136.8, n=29) | |
| Gigabyte Aero 14 OLED BMF | |
| Asus ROG Zephyrus G14 GA402RJ | |
| Razer Blade 14 RTX 4070 | |
| MSI Stealth 14 Studio A13V | |
* ... im mniej tym lepiej
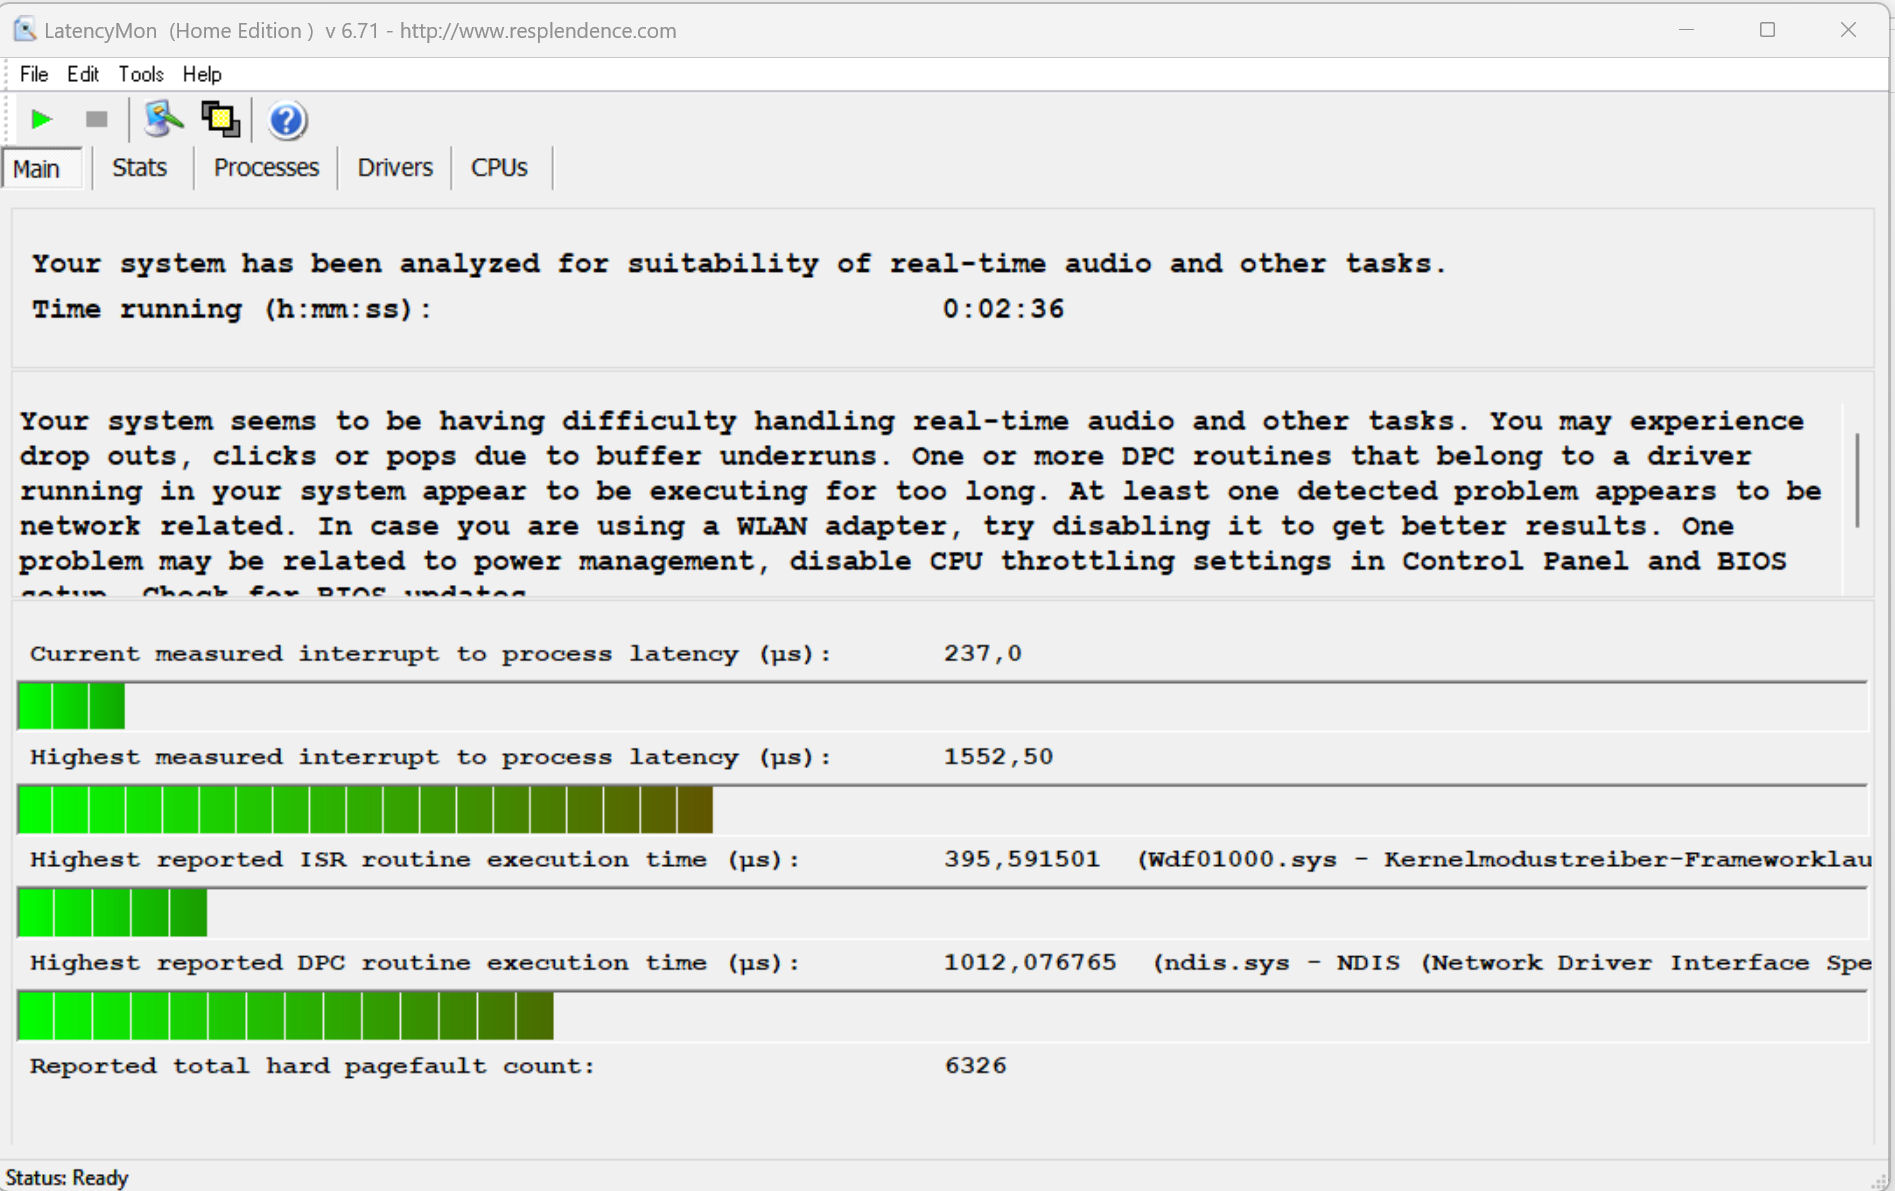
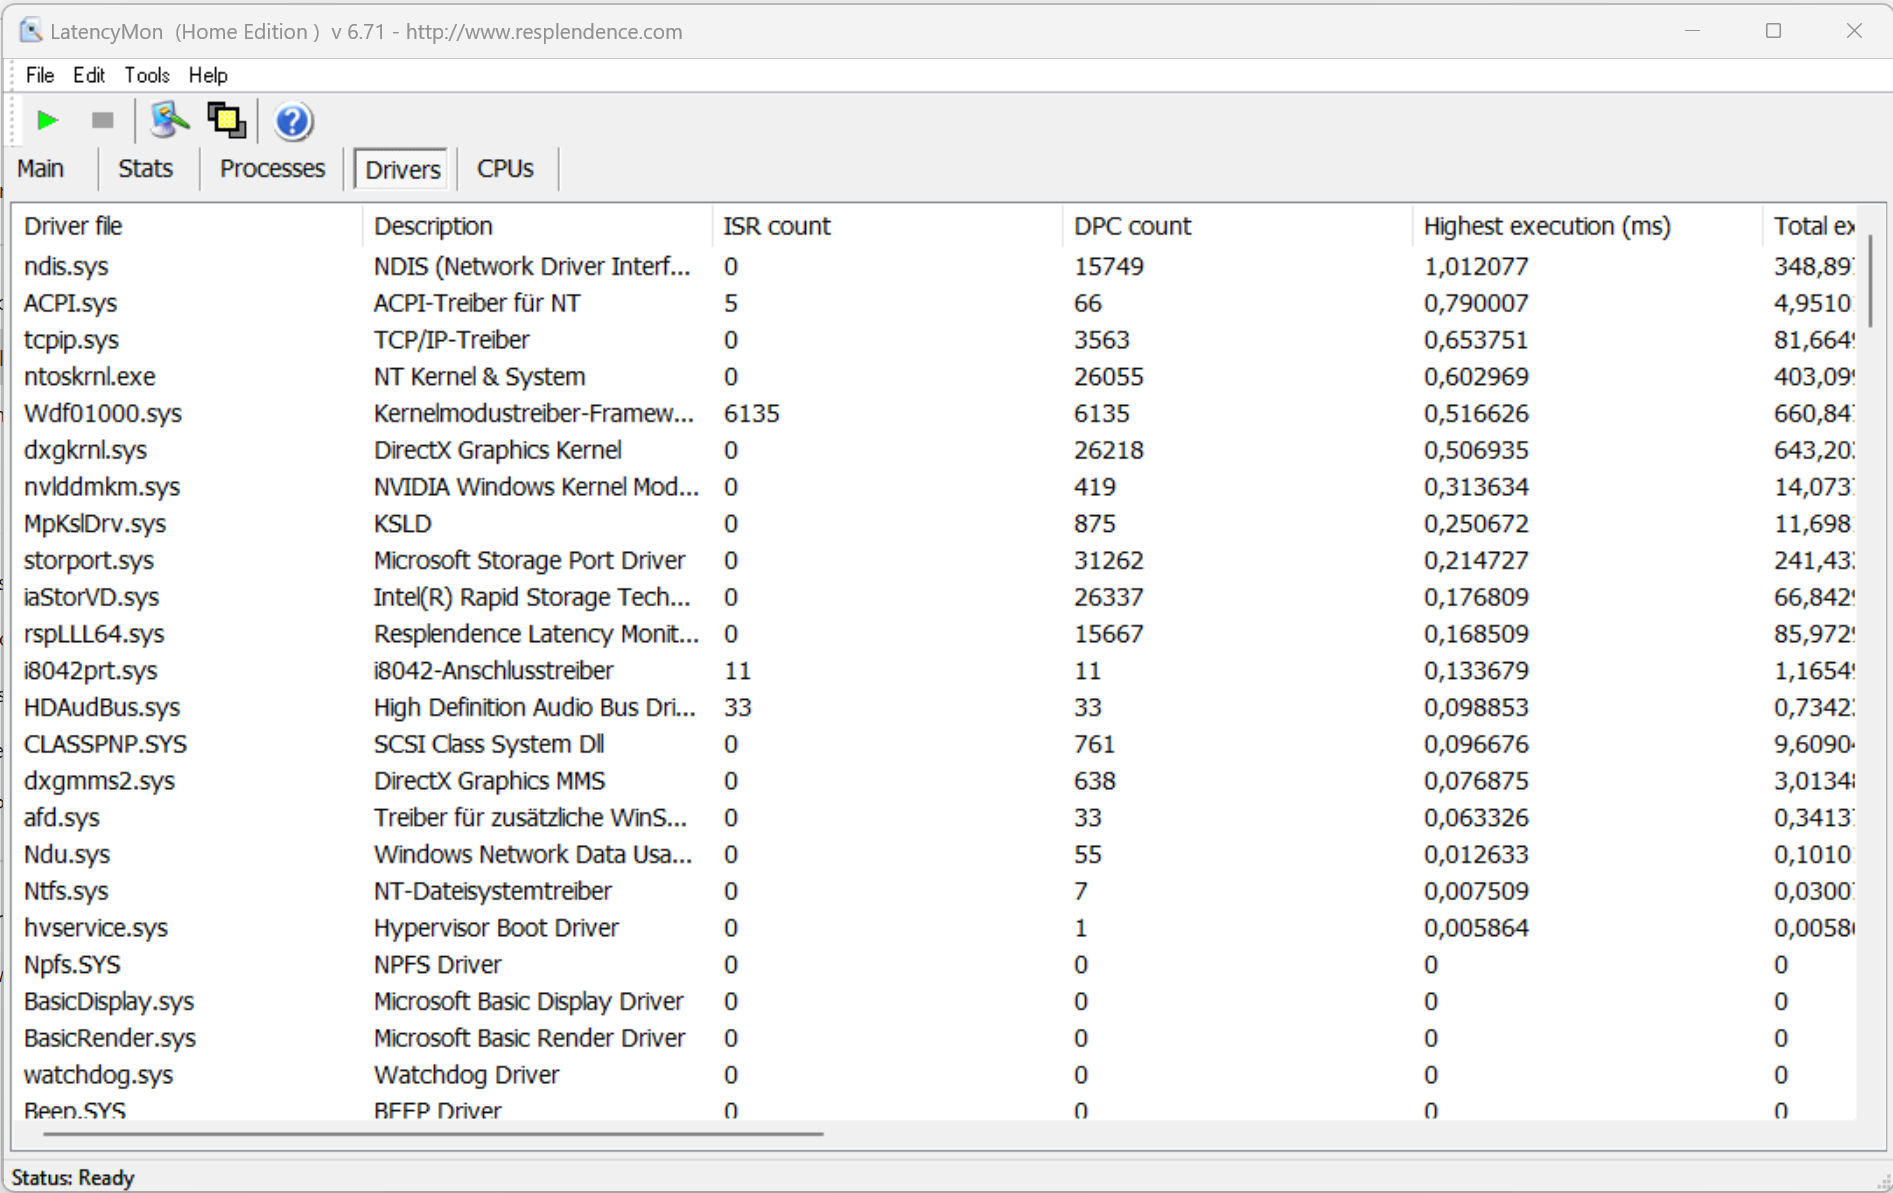
Opóźnienia DPC
Standardowy test Latency Monitor (surfowanie po Internecie, odtwarzanie wideo 4k, Prime95 High Load) wykazał nieprawidłowości. System nie wydaje się być odpowiedni do edycji wideo i audio w czasie rzeczywistym. Przyszłe aktualizacje oprogramowania mogą poprawić lub pogorszyć sytuację.
| DPC Latencies / LatencyMon - interrupt to process latency (max), Web, Youtube, Prime95 | |
| Gigabyte Aero 14 OLED BMF | |
| MSI Stealth 14 Studio A13V | |
| Acer Predator Triton 14 PT14-51 | |
| Asus ROG Zephyrus G14 GA402RJ | |
| Razer Blade 14 RTX 4070 | |
* ... im mniej tym lepiej
Pamięć masowa
Skąpstwo pamięci masowej w Acer: Zainstalowany dysk SSD PCIe 4 (M.2 2280) ma pojemność zaledwie 512 GB - to za mało jak na laptop do gier, a zwłaszcza taki w tej kategorii cenowej. Dysk SSD Micron jest bardzo przyzwoity, ale nie ma wybitnych prędkości transferu. Wady: W trakcie działania pętli DiskSpd występują spadki wydajności spowodowane dławieniem termicznym. Brak miejsca na dodatkowy nośnik danych.

* ... im mniej tym lepiej
Continuous Performance Read: DiskSpd Read Loop, Queue Depth 8
Karta graficzna
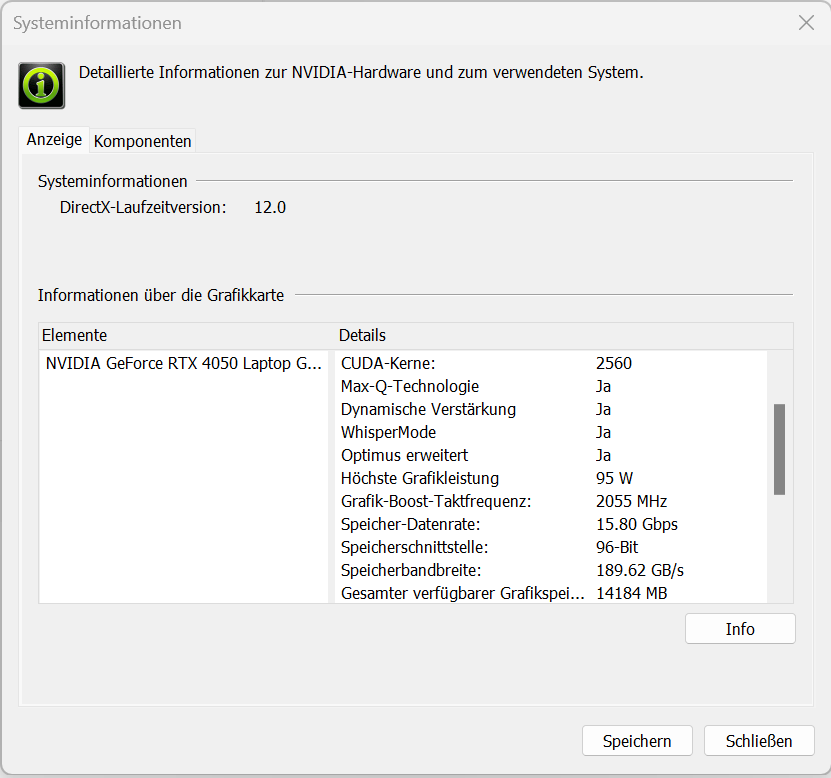
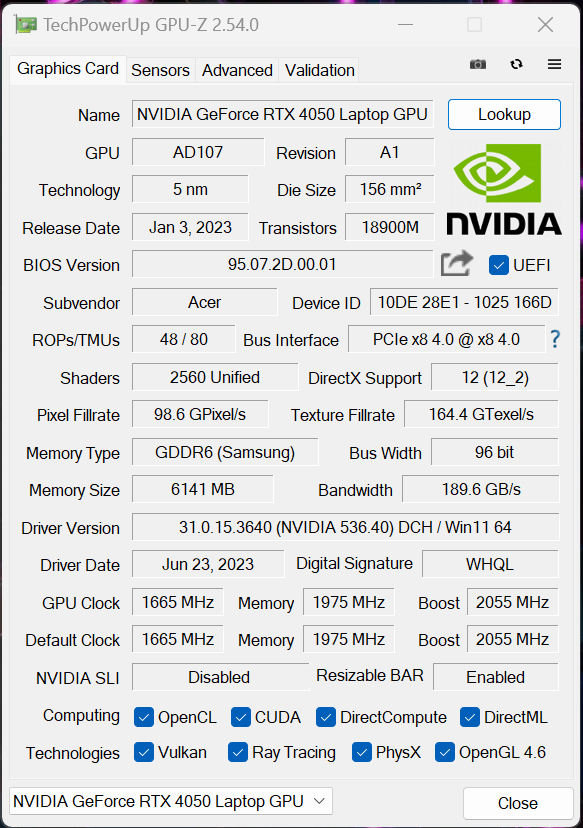
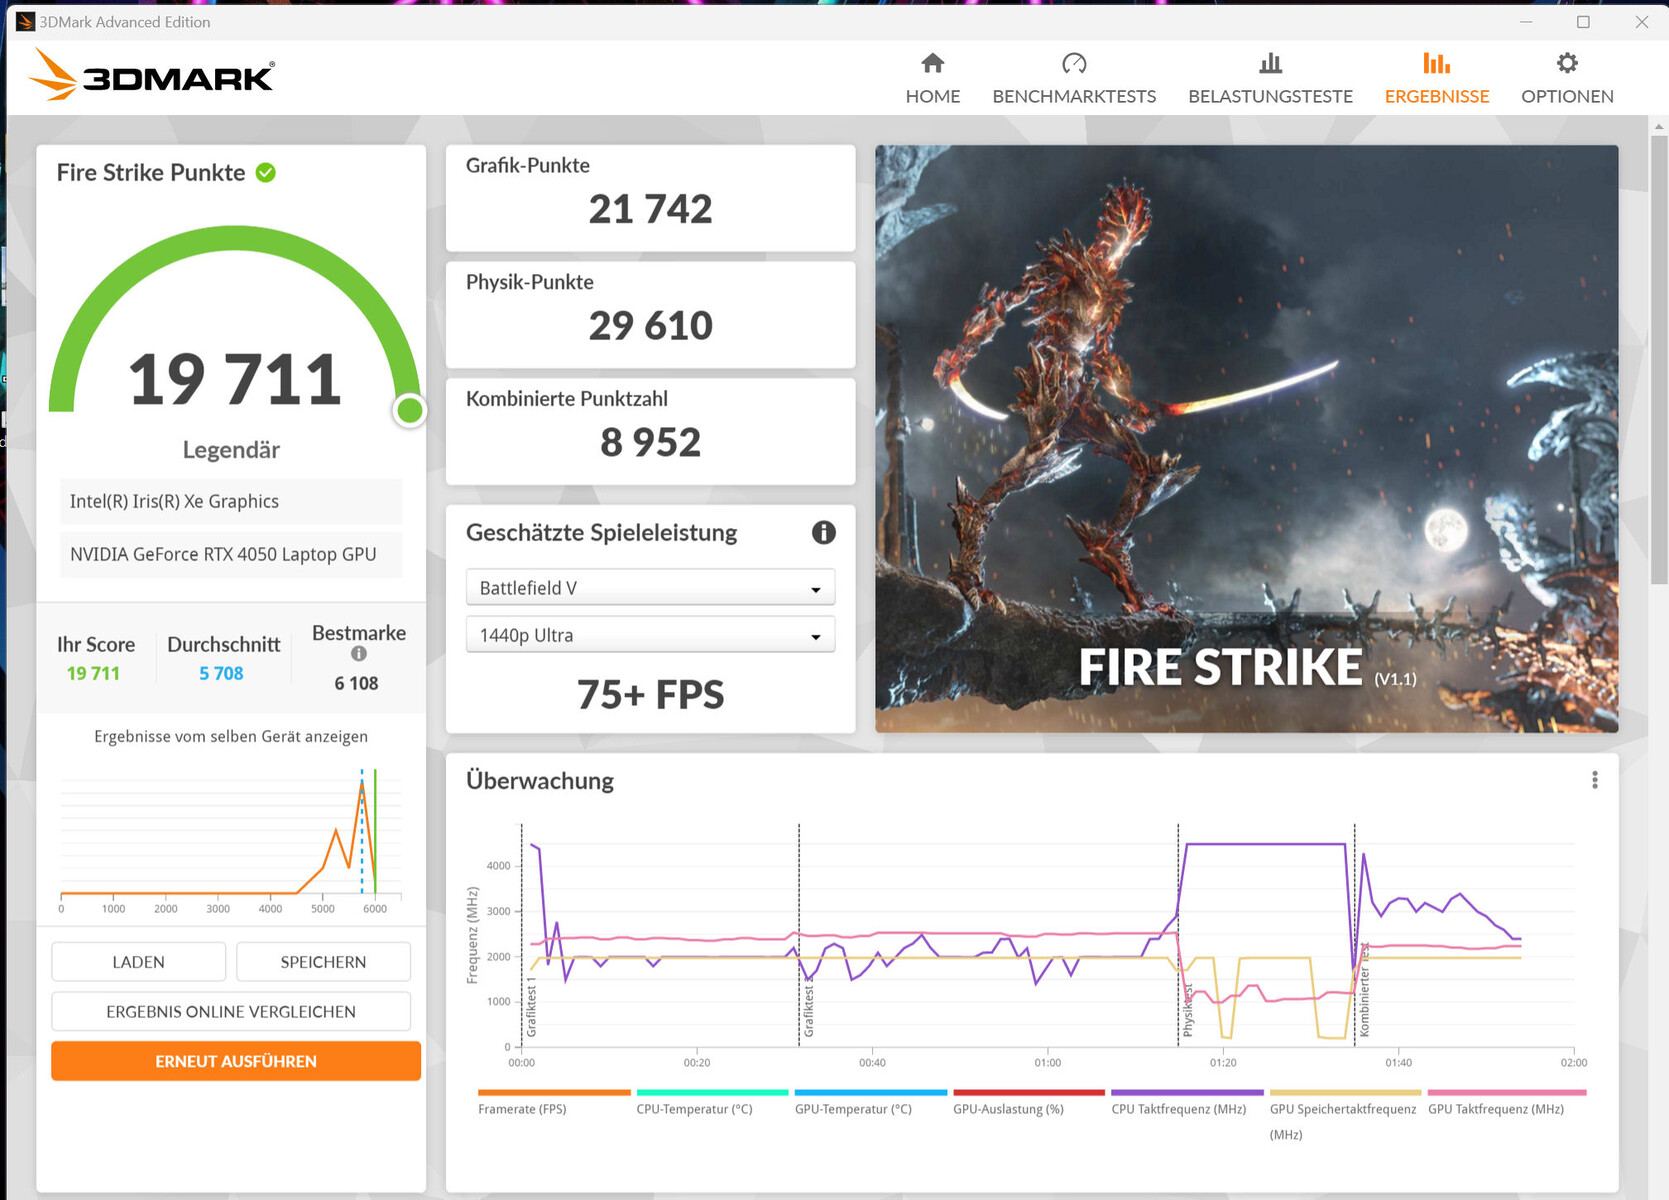
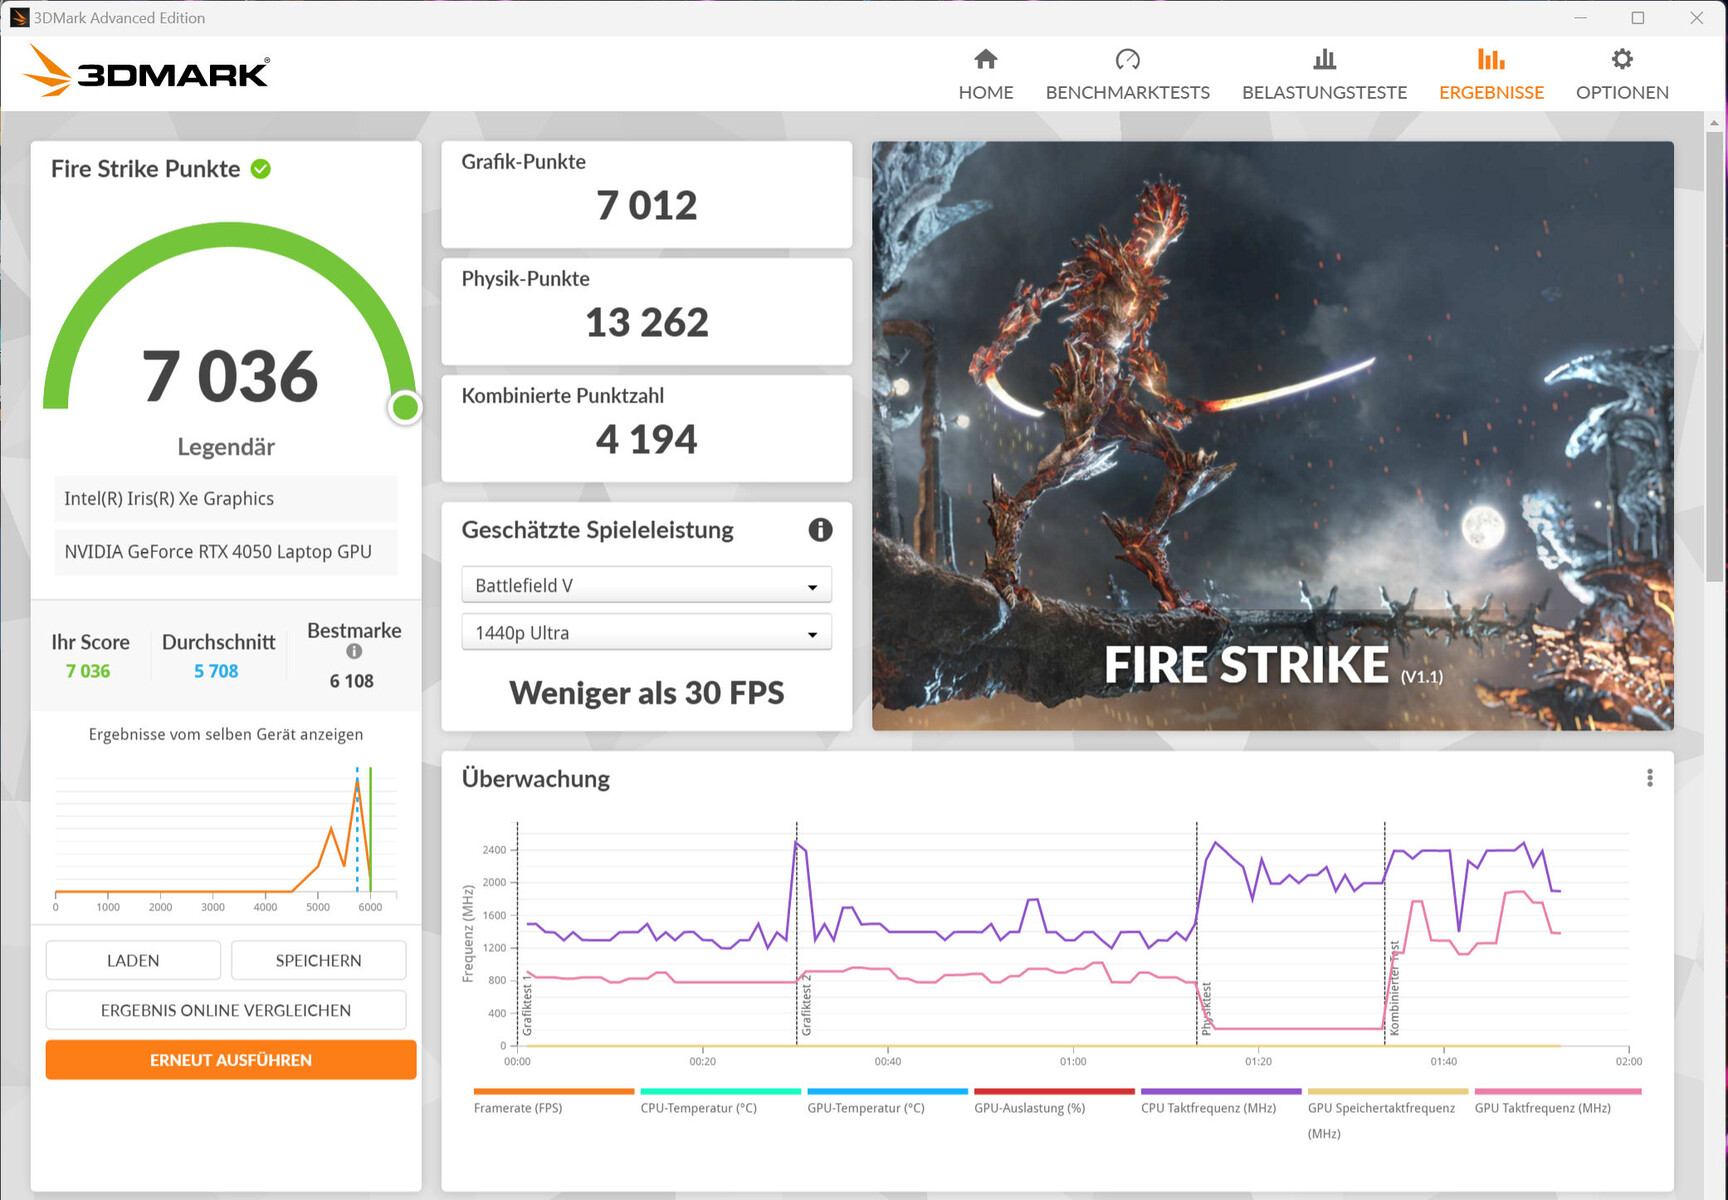
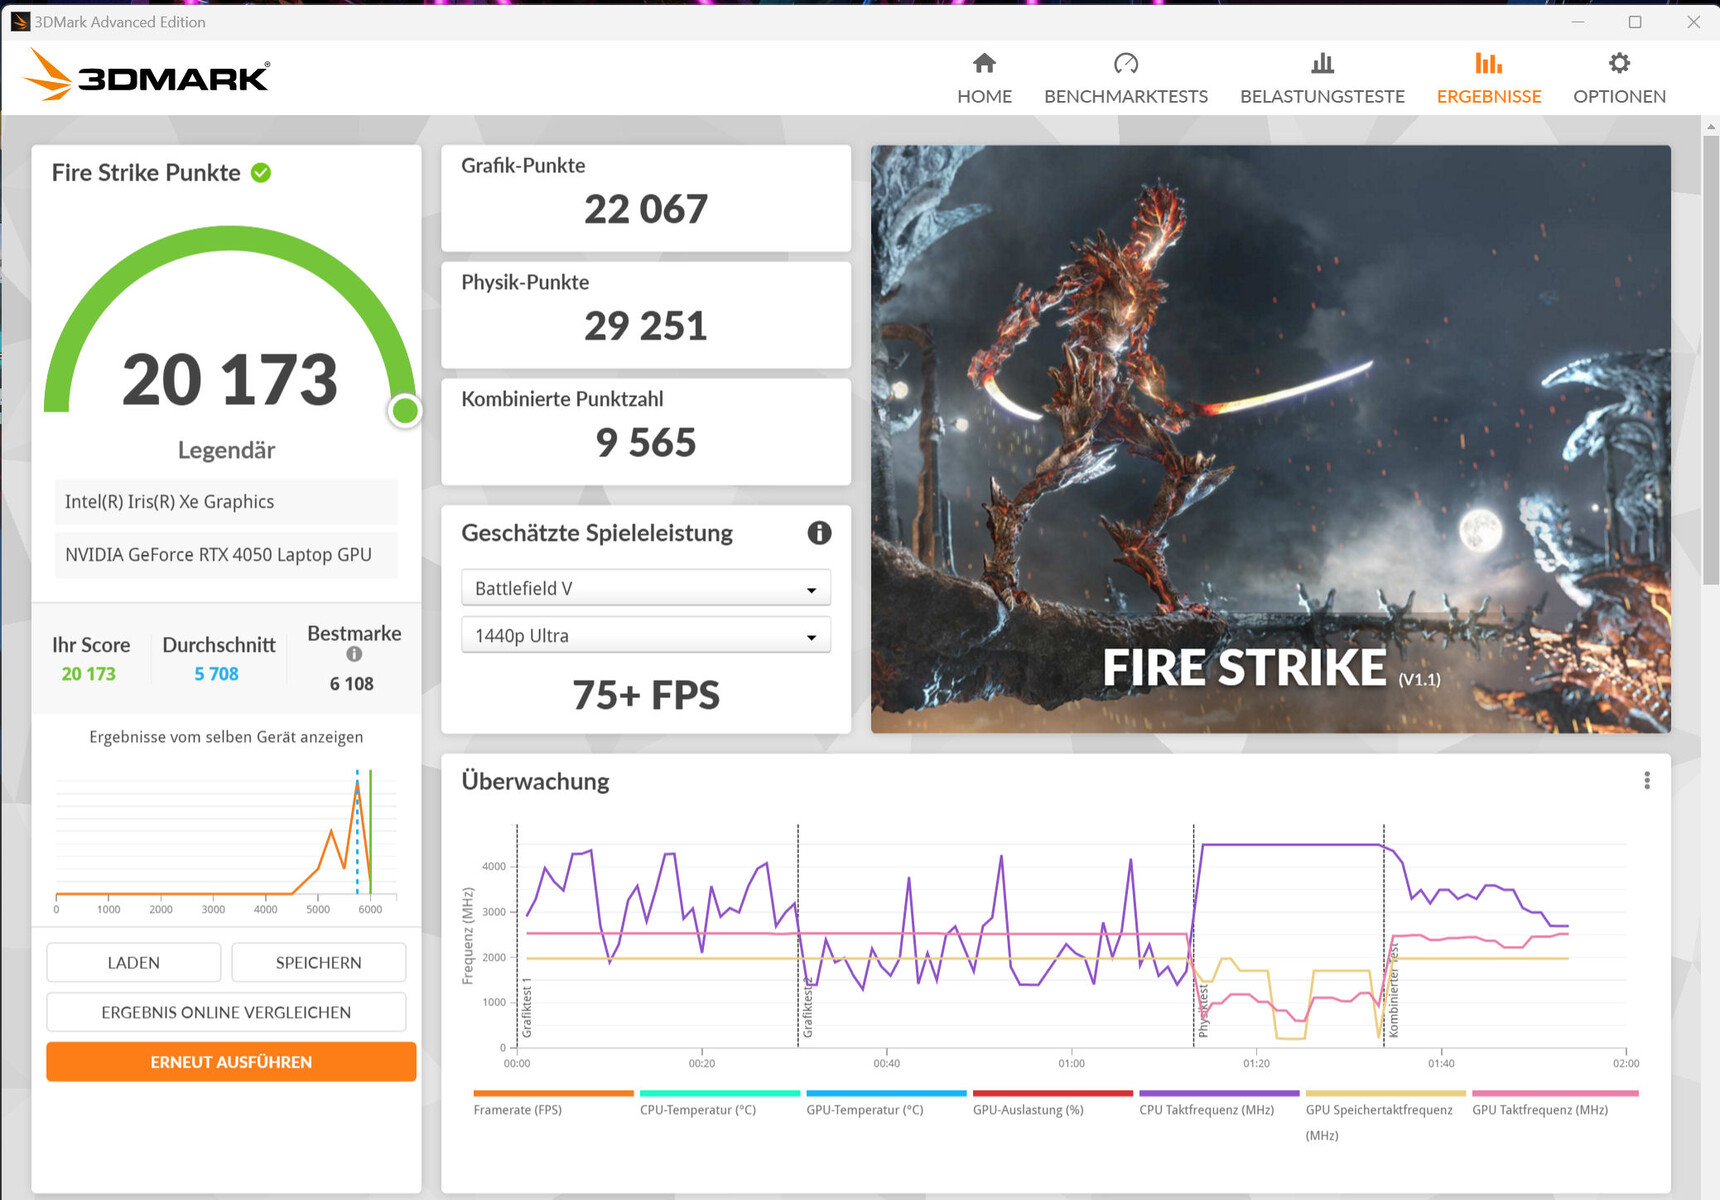
Karta graficznaGeForce RTX 4050oferuje 2560 jednostek cieniujących, 96-bitową magistralę i szybką pamięć RAM GDDR6 (6144 MB). Acer ustawił maksymalne TGP na 95 watów. Według testu Witcher 3, TGP nie jest maksymalne.
Wyniki benchmarków są powyżej średniej RTX 4050. Nie dotyczy to jednak korzystania z trybu "Quiet". Bezpośrednie wyjście wideo przez GPU GeForce nie zapewnia wzrostu wydajności, a przełączanie między dGPU i Optimus nie wymaga restartu - Advanced Optimus jest obsługiwany.

| 3DMark 06 Standard Score | 52667 pkt. | |
| 3DMark 11 Performance | 27364 pkt. | |
| 3DMark Cloud Gate Standard Score | 61034 pkt. | |
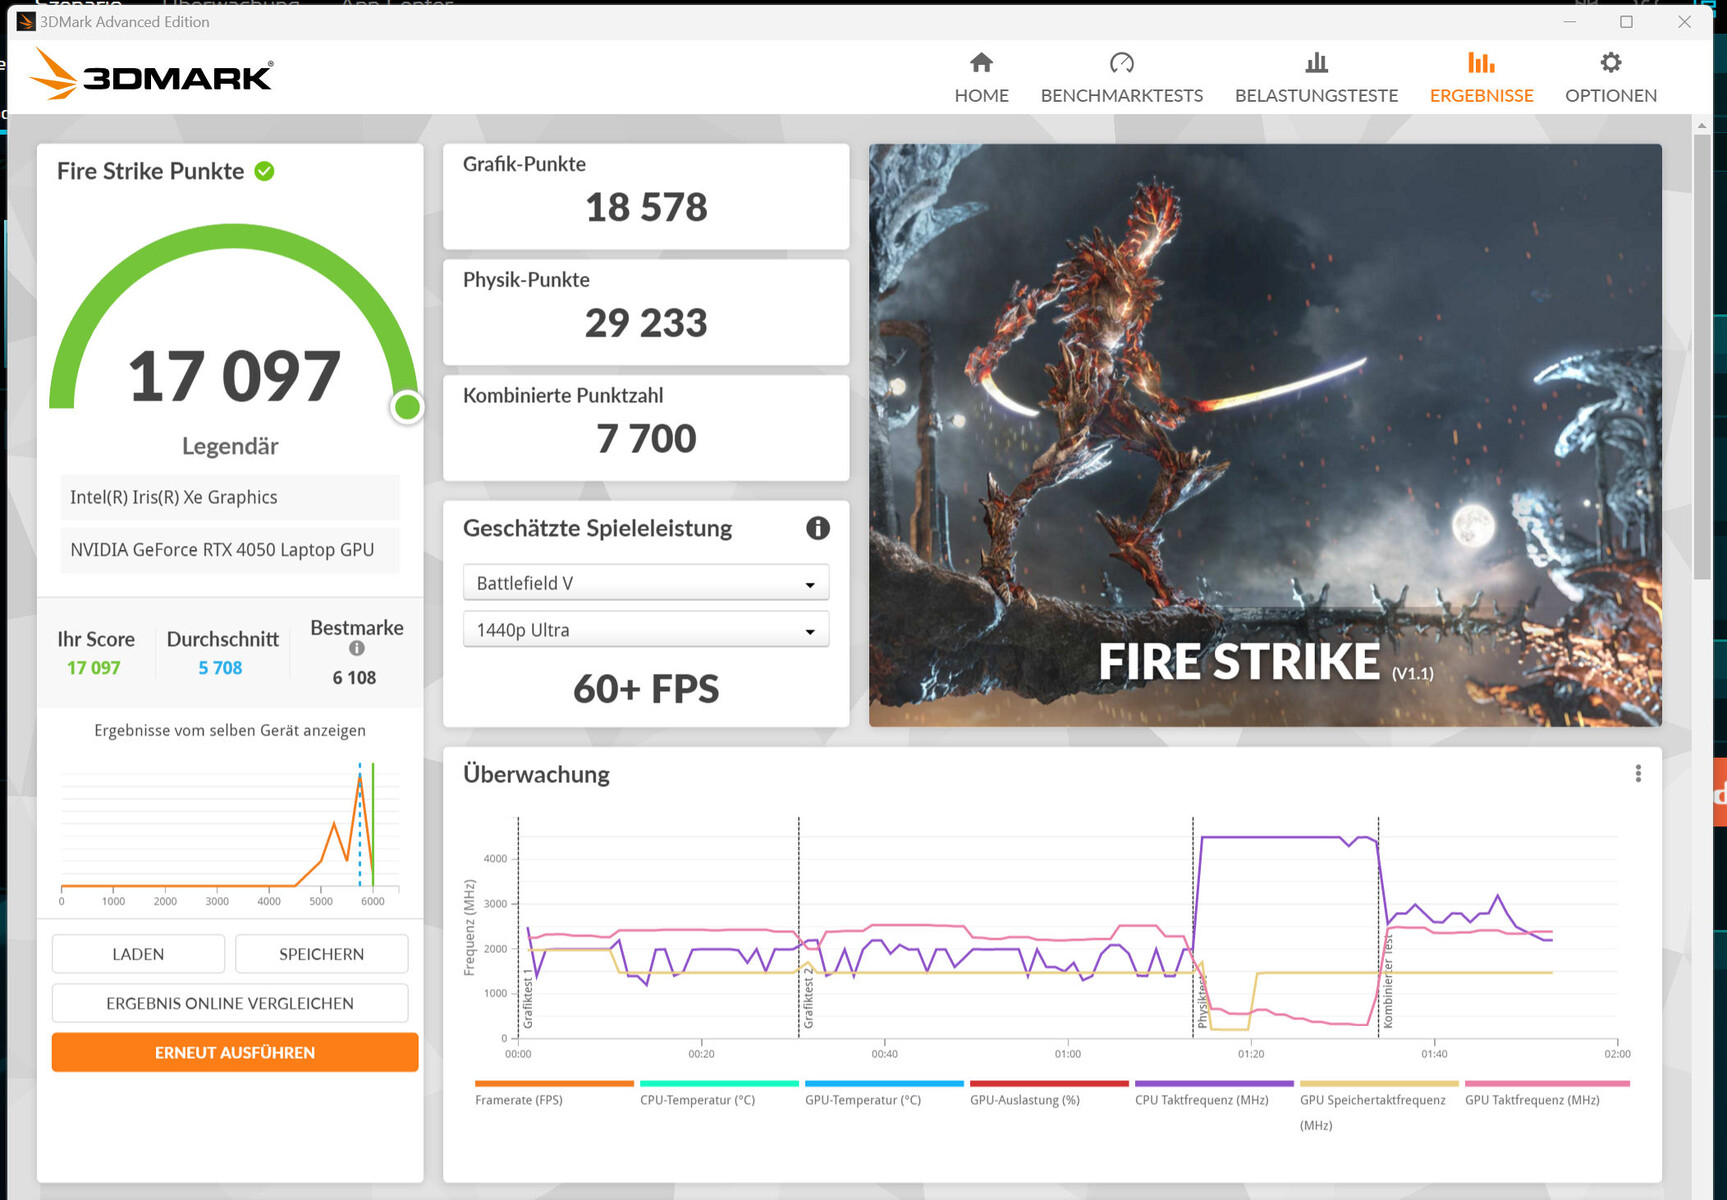
| 3DMark Fire Strike Score | 19711 pkt. | |
| 3DMark Time Spy Score | 8580 pkt. | |
Pomoc | ||
| Geekbench 6.7 - GPU OpenCL | |
| Średnia w klasie Gaming (67235 - 253130, n=109, ostatnie 2 lata) | |
| Acer Predator Triton 14 PT14-51 | |
| Przeciętny NVIDIA GeForce RTX 4050 Laptop GPU (60815 - 86892, n=21) | |
* ... im mniej tym lepiej
Wydajność w grach
Sprzęt Predatora jest przeznaczony do grania w rozdzielczości FHD przy wysokich i maksymalnych ustawieniach. Niemniej jednak można wykorzystać maksymalną rozdzielczość ekranu (2560 x 1600 pikseli) - czasami przy niższych ustawieniach. Zmierzyliśmy liczbę klatek na sekundę powyżej średniej RTX 4050.
| The Last of Us - 1920x1080 Ultra Preset | |
| Razer Blade 14 RTX 4070 | |
| Przeciętny NVIDIA GeForce RTX 4050 Laptop GPU (35.7 - 50.2, n=3) | |
| Acer Predator Triton 14 PT14-51 | |
| Gigabyte Aero 14 OLED BMF | |
| The Callisto Protocol | |
| 2560x1440 Ultra Preset (without FSR Upscaling) | |
| Acer Predator Triton 14 PT14-51 | |
| Przeciętny NVIDIA GeForce RTX 4050 Laptop GPU (29.5 - 46.7, n=3) | |
| 1920x1080 Ultra Preset (without FSR Upscaling) | |
| Acer Predator Triton 14 PT14-51 | |
| Przeciętny NVIDIA GeForce RTX 4050 Laptop GPU (41.4 - 63.1, n=3) | |
| 1920x1080 Ultra Preset (without FSR Upscaling) + Full Ray-Tracing | |
| Acer Predator Triton 14 PT14-51 | |
| Przeciętny NVIDIA GeForce RTX 4050 Laptop GPU (31 - 49.9, n=3) | |
| Star Wars Jedi Survivor | |
| 1920x1080 Epic Preset | |
| Przeciętny NVIDIA GeForce RTX 4050 Laptop GPU (48.4 - 56, n=7) | |
| Medion Erazer Scout E20 | |
| Acer Predator Triton 14 PT14-51 | |
| 2560x1440 Epic Preset | |
| Przeciętny NVIDIA GeForce RTX 4050 Laptop GPU (30.4 - 35, n=4) | |
| Acer Predator Triton 14 PT14-51 | |
| 1920x1080 Epic Preset + Ray Tracing | |
| Przeciętny NVIDIA GeForce RTX 4050 Laptop GPU (38.6 - 42, n=4) | |
| Medion Erazer Scout E20 | |
| Acer Predator Triton 14 PT14-51 | |
| F1 23 | |
| 1920x1080 Ultra High Preset AA:T AF:16x | |
| Średnia w klasie Gaming (n=1ostatnie 2 lata) | |
| Przeciętny NVIDIA GeForce RTX 4050 Laptop GPU (25.7 - 60.8, n=14) | |
| Acer Predator Triton 14 PT14-51 | |
| 2560x1440 Ultra High Preset AA:T AF:16x | |
| Średnia w klasie Gaming (n=1ostatnie 2 lata) | |
| Przeciętny NVIDIA GeForce RTX 4050 Laptop GPU (16.7 - 40.8, n=11) | |
| Acer Predator Triton 14 PT14-51 | |
| Dead Island 2 | |
| 2560x1440 Ultra Preset AA:High T | |
| Przeciętny NVIDIA GeForce RTX 4050 Laptop GPU (61.8 - 76.5, n=2) | |
| Acer Predator Triton 14 PT14-51 | |
| 1920x1080 Ultra Preset AA:High T | |
| Medion Erazer Scout E20 | |
| Przeciętny NVIDIA GeForce RTX 4050 Laptop GPU (90.9 - 133.5, n=3) | |
| Acer Predator Triton 14 PT14-51 | |
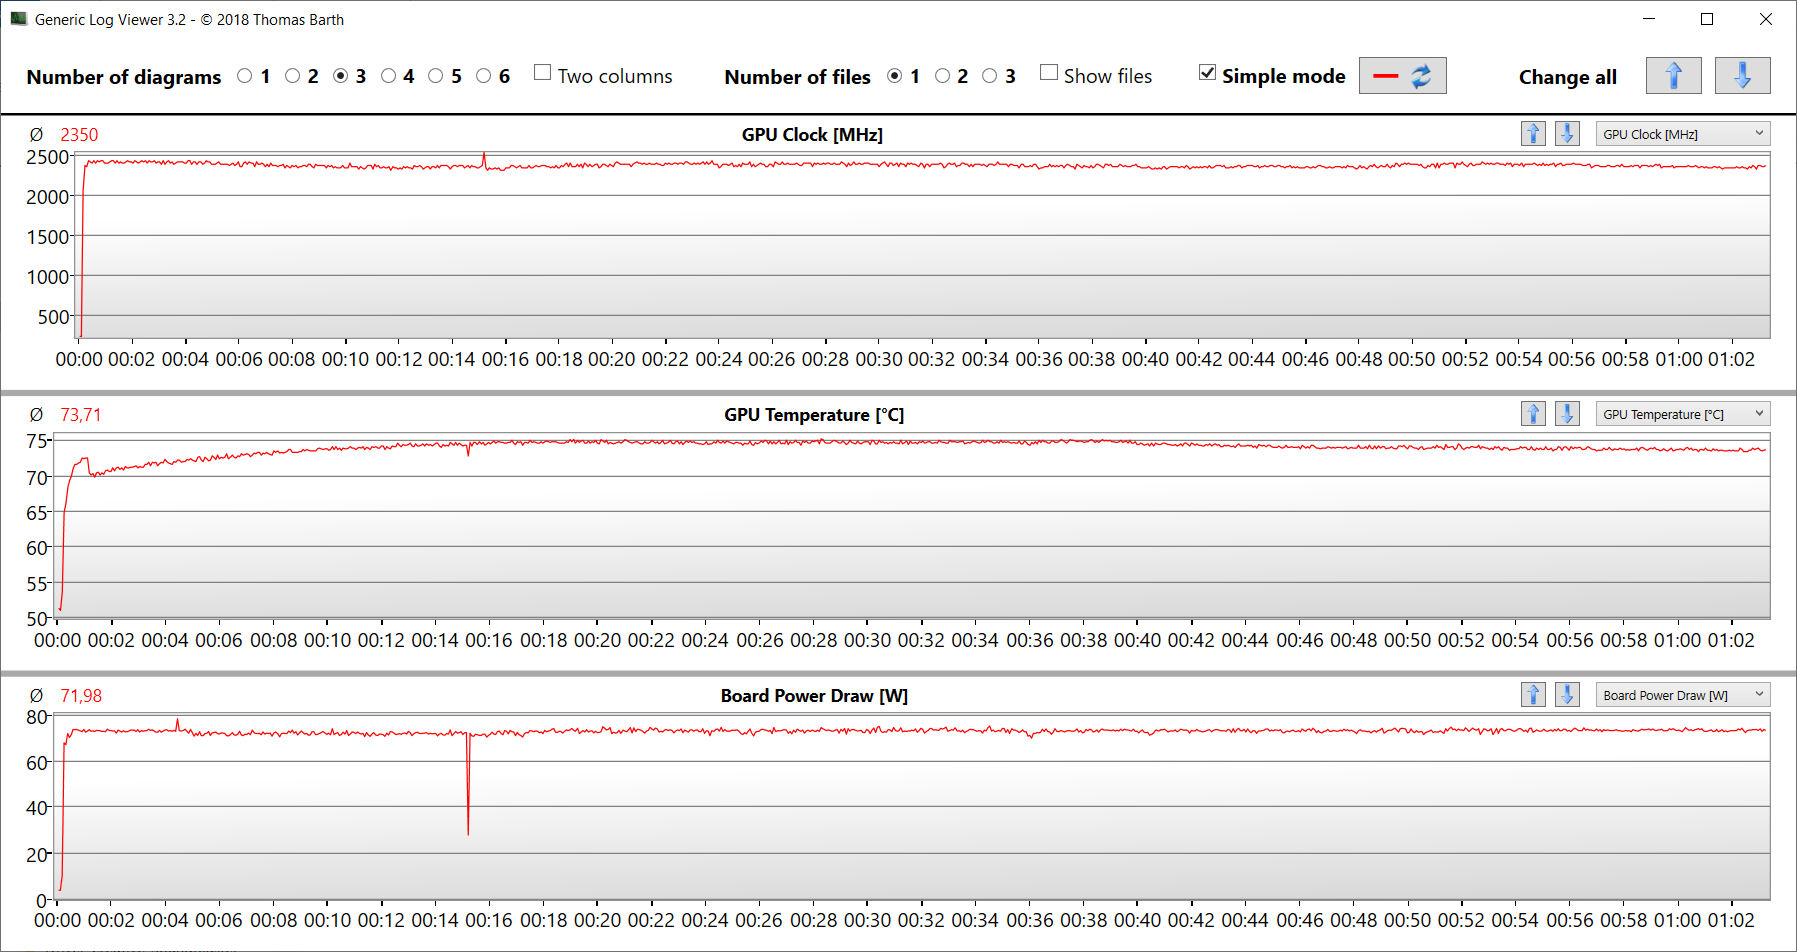
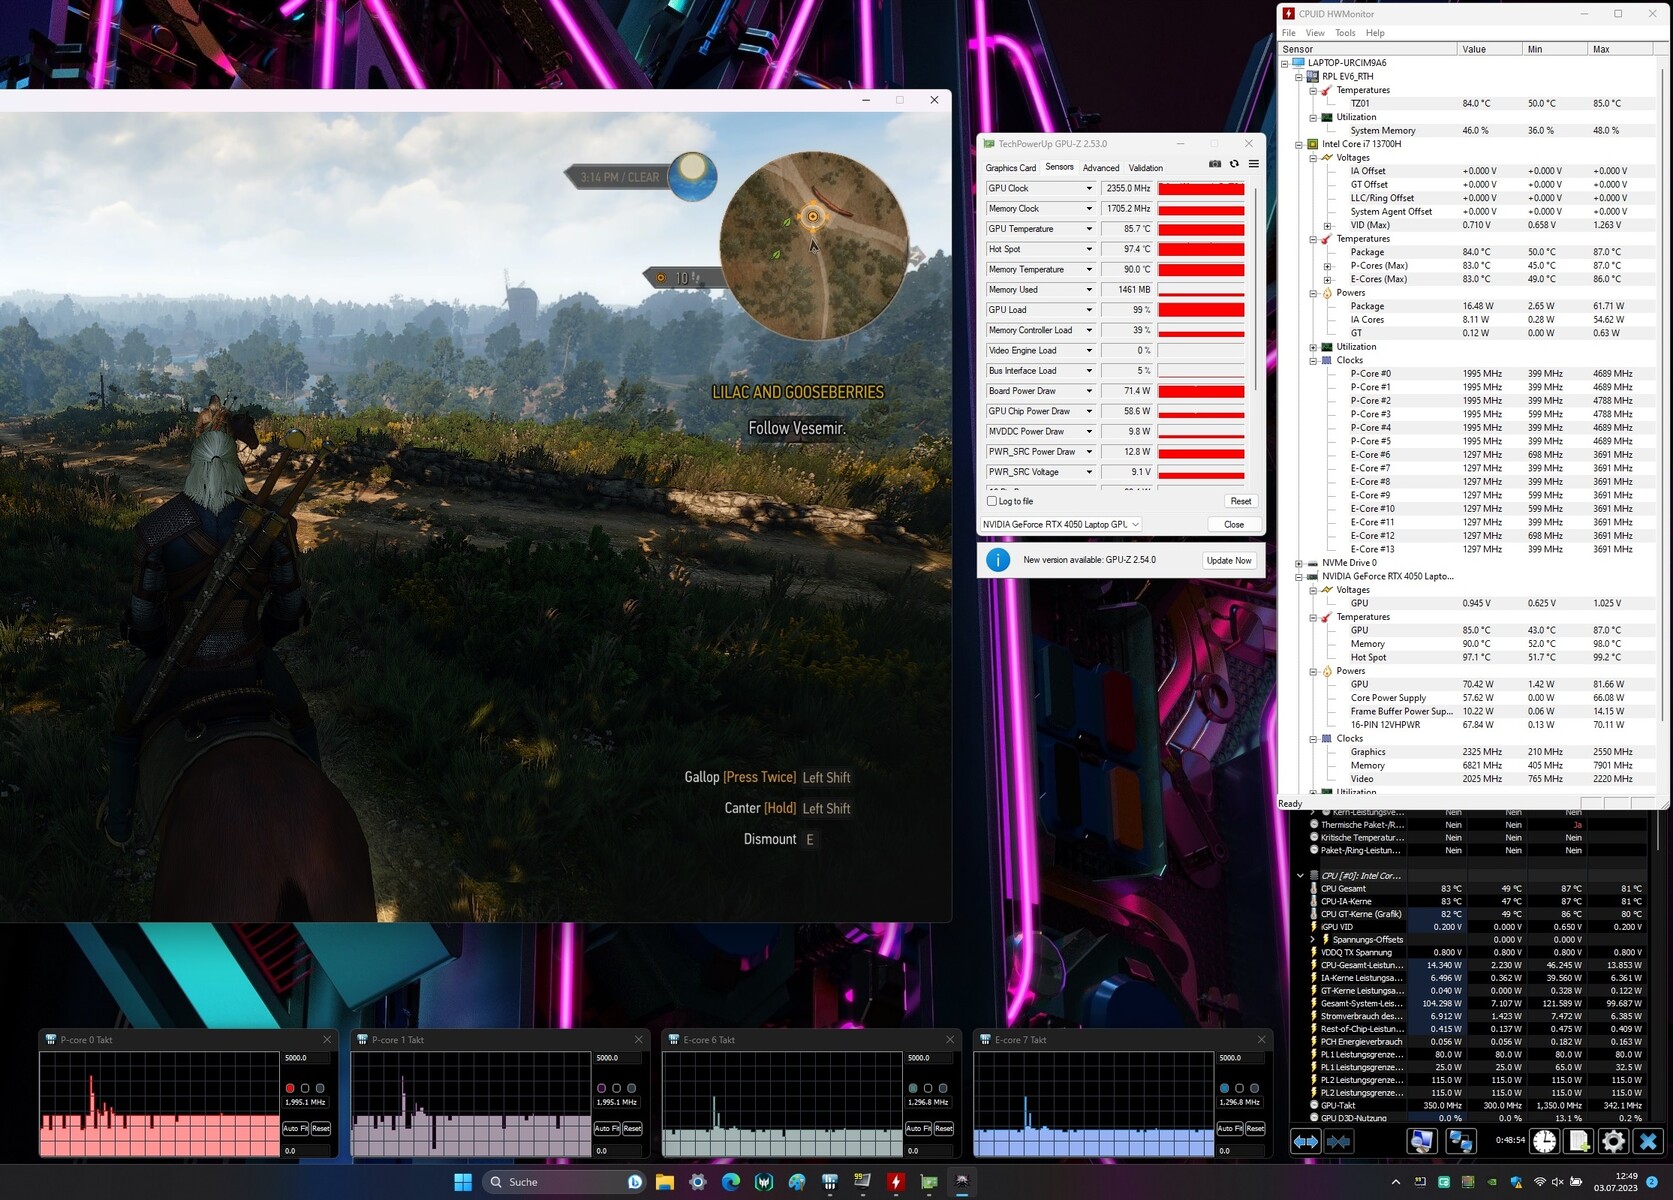
Aby sprawdzić, czy liczba klatek na sekundę pozostaje stabilna przez dłuższy czas, uruchomiliśmy grę Witcher 3 na około 60 minut w rozdzielczości FullHD i maksymalnych ustawieniach jakości. Postać w grze nie została poruszona i nie wykryliśmy spadku liczby klatek na sekundę.
Witcher 3 FPS diagram
| low | med. | high | ultra | QHD | |
|---|---|---|---|---|---|
| The Witcher 3 (2015) | 393.7 | 253.3 | 149.7 | 80.1 | |
| Dota 2 Reborn (2015) | 159.4 | 141.8 | 132.6 | 127.2 | |
| Final Fantasy XV Benchmark (2018) | 183 | 110.5 | 79.2 | 58.2 | |
| X-Plane 11.11 (2018) | 138.1 | 128.6 | 100.2 | ||
| Far Cry 5 (2018) | 174 | 131 | 122 | 113 | 79 |
| Strange Brigade (2018) | 467 | 194.8 | 159.4 | 137 | 94.9 |
| F1 22 (2022) | 210 | 194.4 | 147.2 | 48.5 | 31 |
| The Callisto Protocol (2022) | 119 | 96 | 93.3 | 63.1 | 46.7 |
| The Last of Us (2023) | 82.2 | 67.4 | 56.2 | 42.8 | |
| Dead Island 2 (2023) | 201 | 171.8 | 125.9 | 90.9 | 61.8 |
| Star Wars Jedi Survivor (2023) | 60.6 | 54.6 | 51.6 | 48.4 | 30.4 |
| F1 23 (2023) | 197.9 | 194.8 | 139.8 | 40.5 | 31 |
Emisje - laptop Acer może pracować cicho
Emisja hałasu
W codziennym użytkowaniu (biuro, Internet, ...) Triton zwykle pracuje cicho - niezależnie od wybranego trybu. Poziom hałasu może wzrosnąć odpowiednio do 56 dB(A) ("Turbo") i 53 dB(A) ("Performance"). My korzystaliśmy z trybu "Balanced" i odnotowaliśmy umiarkowane 43 dB(A). Ogólnie rzecz biorąc, niższy poziom hałasu można osiągnąć stosując tryb "Quiet" - przy stosunkowo niewielkim spadku wydajności.
Hałas
| luz |
| 27 / 29 / 31 dB |
| obciążenie |
| 42 / 45 dB |
 | ||
30 dB cichy 40 dB(A) słyszalny 50 dB(A) irytujący |
||
min: | ||
| Acer Predator Triton 14 PT14-51 i7-13700H, GeForce RTX 4050 Laptop GPU | Razer Blade 14 RTX 4070 R9 7940HS, GeForce RTX 4070 Laptop GPU | Asus ROG Zephyrus G14 GA402RJ R7 6800HS, Radeon RX 6700S | MSI Stealth 14 Studio A13V i7-13700H, GeForce RTX 4050 Laptop GPU | Gigabyte Aero 14 OLED BMF i7-13700H, GeForce RTX 4050 Laptop GPU | Apple MacBook Pro 14 2023 M2 Pro Entry M2 Pro 10-Core, M2 Pro 16-Core GPU | |
|---|---|---|---|---|---|---|
| Noise | 6% | 2% | -3% | 1% | 16% | |
| wyłączone / środowisko * (dB) | 25 | 22.7 9% | 25 -0% | 25.3 -1% | 24 4% | 23.6 6% |
| Idle Minimum * (dB) | 27 | 23.4 13% | 25 7% | 25.3 6% | 24 11% | 23.6 13% |
| Idle Average * (dB) | 29 | 23.4 19% | 26 10% | 25 14% | 24 17% | 23.6 19% |
| Idle Maximum * (dB) | 31 | 23.4 25% | 29 6% | 33.7 -9% | 35.71 -15% | 23.6 24% |
| Load Average * (dB) | 42 | 33 21% | 45 -7% | 42.2 -0% | 24.2 42% | |
| Witcher 3 ultra * (dB) | 43 | 51.8 -20% | 43 -0% | 51 -19% | 40.22 6% | |
| Load Maximum * (dB) | 45 | 55.6 -24% | 45 -0% | 51 -13% | 51.93 -15% | 47.5 -6% |
* ... im mniej tym lepiej
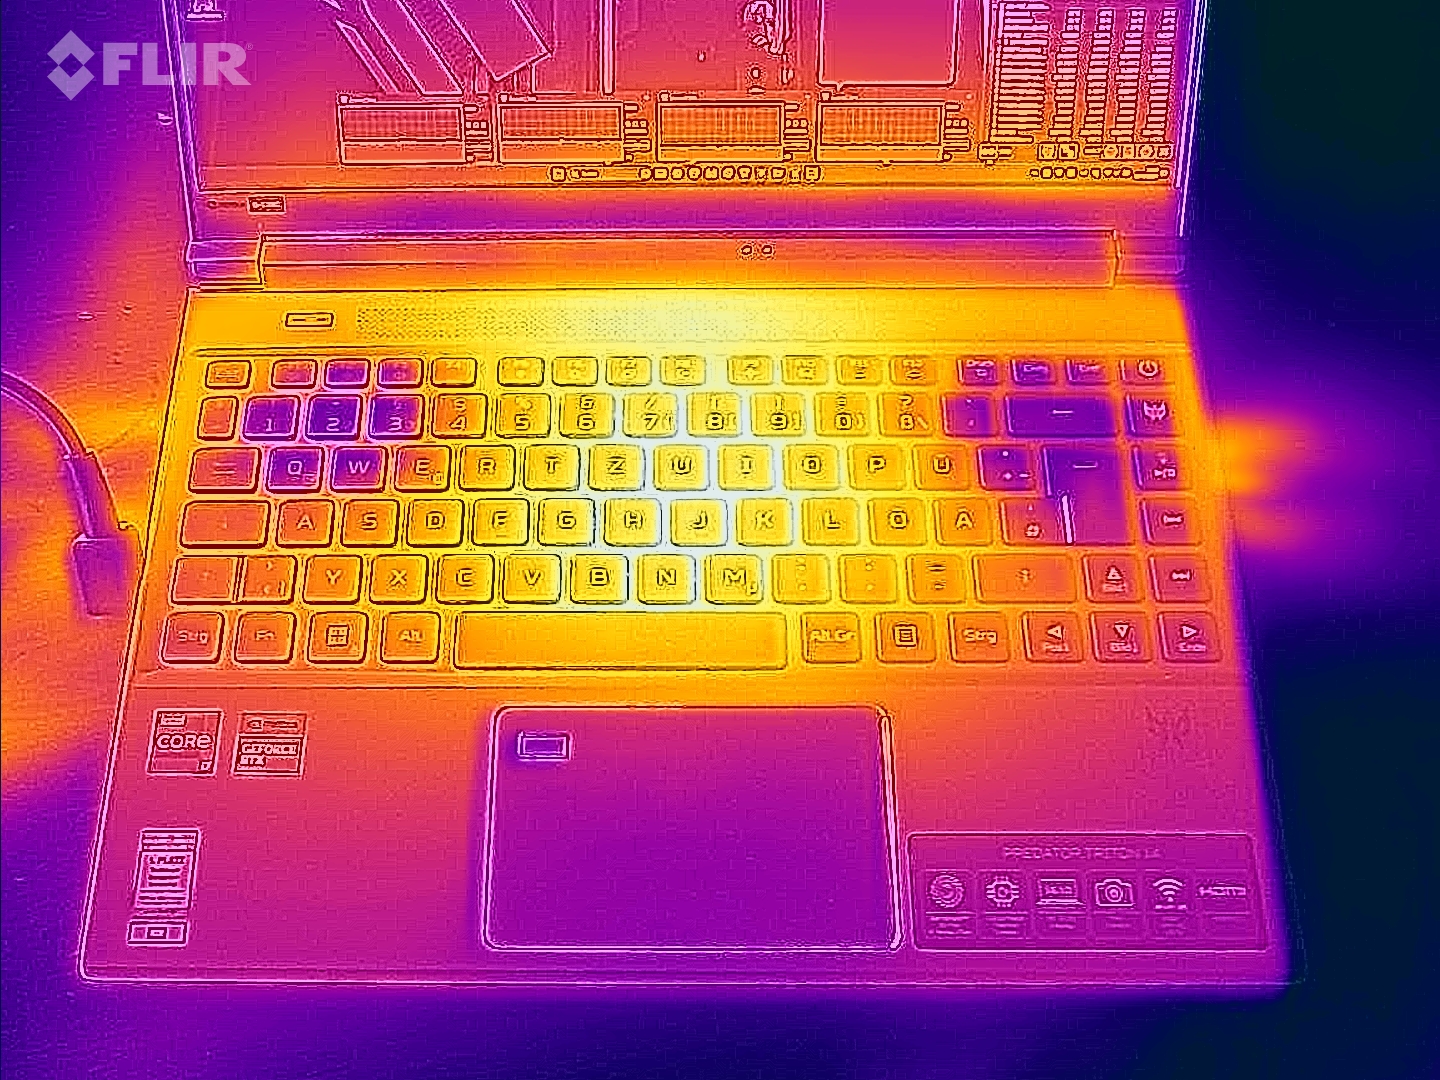
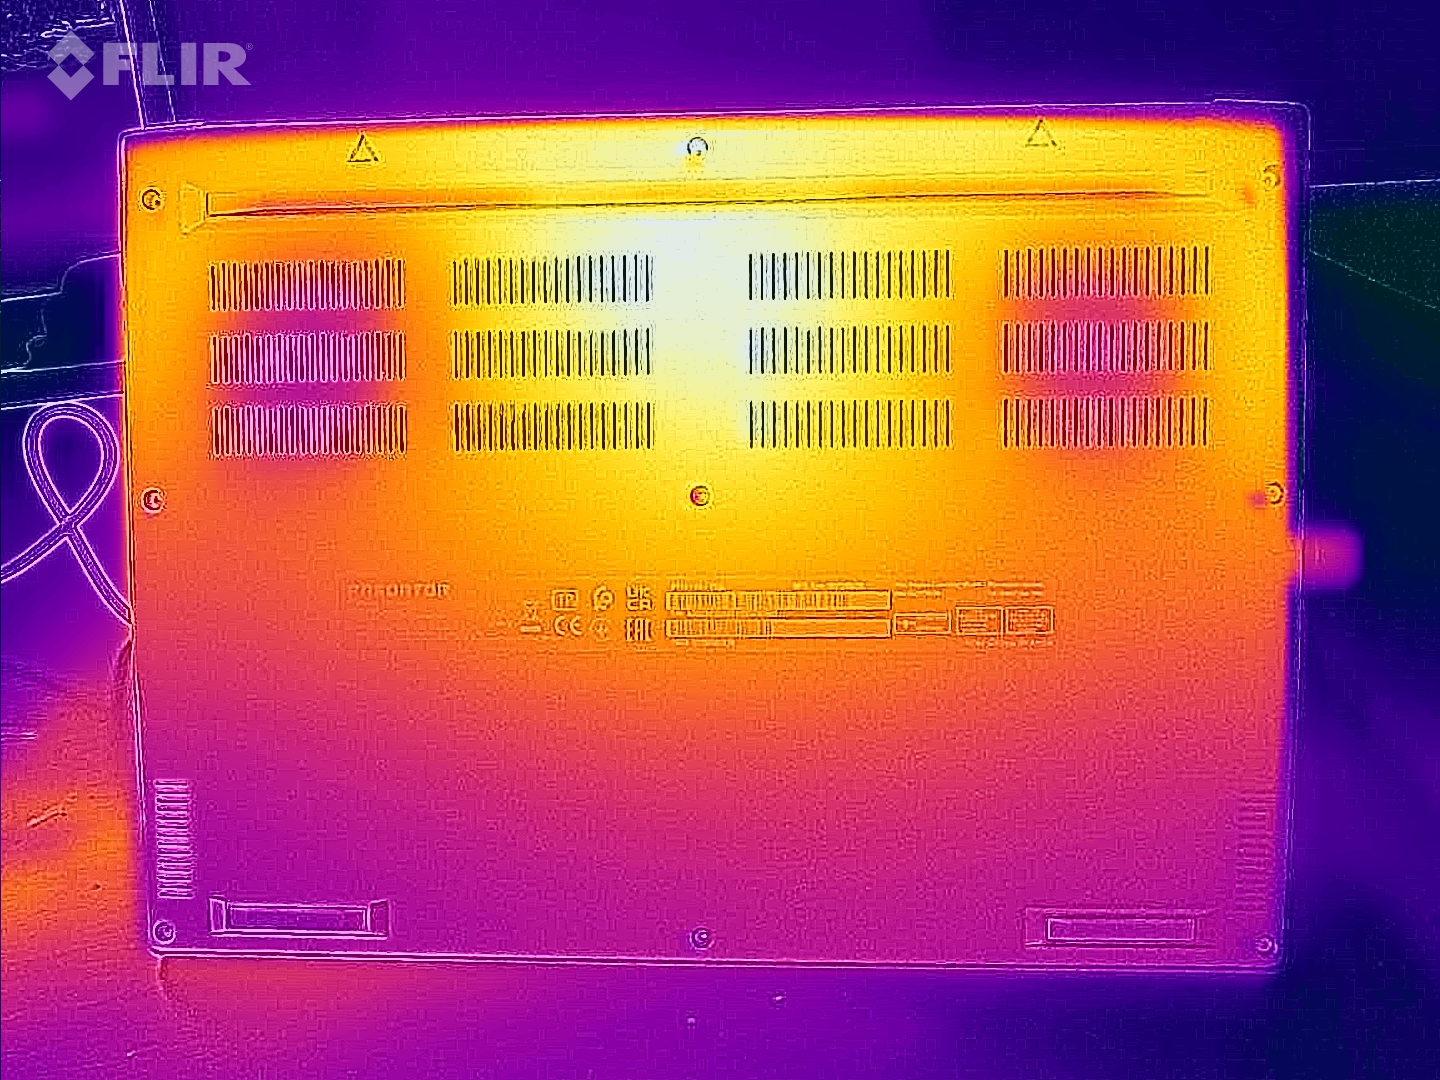
Temperatura
Pod obciążeniem laptop wyraźnie się nagrzewa. W kilku punktach pomiarowych odnotowaliśmy temperatury pomiędzy 50 a 56 °C. Jeśli chodzi o codzienne użytkowanie, liczby te znajdują się w zielonej strefie.
(-) Maksymalna temperatura w górnej części wynosi 54 °C / 129 F, w porównaniu do średniej 40.4 °C / 105 F , począwszy od 21.2 do 68.8 °C dla klasy Gaming.
(-) Dno nagrzewa się maksymalnie do 56 °C / 133 F, w porównaniu do średniej 43.2 °C / 110 F
(+) W stanie bezczynności średnia temperatura górnej części wynosi 29.1 °C / 84 F, w porównaniu ze średnią temperaturą urządzenia wynoszącą 33.9 °C / ### class_avg_f### F.
(-) Podczas gry w Wiedźmina 3 średnia temperatura górnej części wynosi 46.7 °C / 116 F, w porównaniu do średniej temperatury urządzenia wynoszącej 33.9 °C / ## #class_avg_f### F.
(-) Podpórki pod nadgarstki i touchpad mogą się bardzo nagrzać w dotyku, maksymalnie do 41 °C / 105.8 F.
(-) Średnia temperatura obszaru podparcia dłoni w podobnych urządzeniach wynosiła 28.8 °C / 83.8 F (-12.2 °C / -22 F).
| Acer Predator Triton 14 PT14-51 Intel Core i7-13700H, NVIDIA GeForce RTX 4050 Laptop GPU | Razer Blade 14 RTX 4070 AMD Ryzen 9 7940HS, NVIDIA GeForce RTX 4070 Laptop GPU | Asus ROG Zephyrus G14 GA402RJ AMD Ryzen 7 6800HS, AMD Radeon RX 6700S | MSI Stealth 14 Studio A13V Intel Core i7-13700H, NVIDIA GeForce RTX 4050 Laptop GPU | Gigabyte Aero 14 OLED BMF Intel Core i7-13700H, NVIDIA GeForce RTX 4050 Laptop GPU | Apple MacBook Pro 14 2023 M2 Pro Entry Apple M2 Pro 10-Core, Apple M2 Pro 16-Core GPU | |
|---|---|---|---|---|---|---|
| Heat | 11% | -7% | -5% | 15% | 24% | |
| Maximum Upper Side * (°C) | 54 | 37.4 31% | 53 2% | 46.9 13% | 42 22% | 47 13% |
| Maximum Bottom * (°C) | 56 | 35.2 37% | 54 4% | 56.1 -0% | 52 7% | 42.8 24% |
| Idle Upper Side * (°C) | 31 | 33.2 -7% | 34 -10% | 33.8 -9% | 26 16% | 22.3 28% |
| Idle Bottom * (°C) | 31 | 36.2 -17% | 38 -23% | 37.9 -22% | 27 13% | 21.7 30% |
* ... im mniej tym lepiej
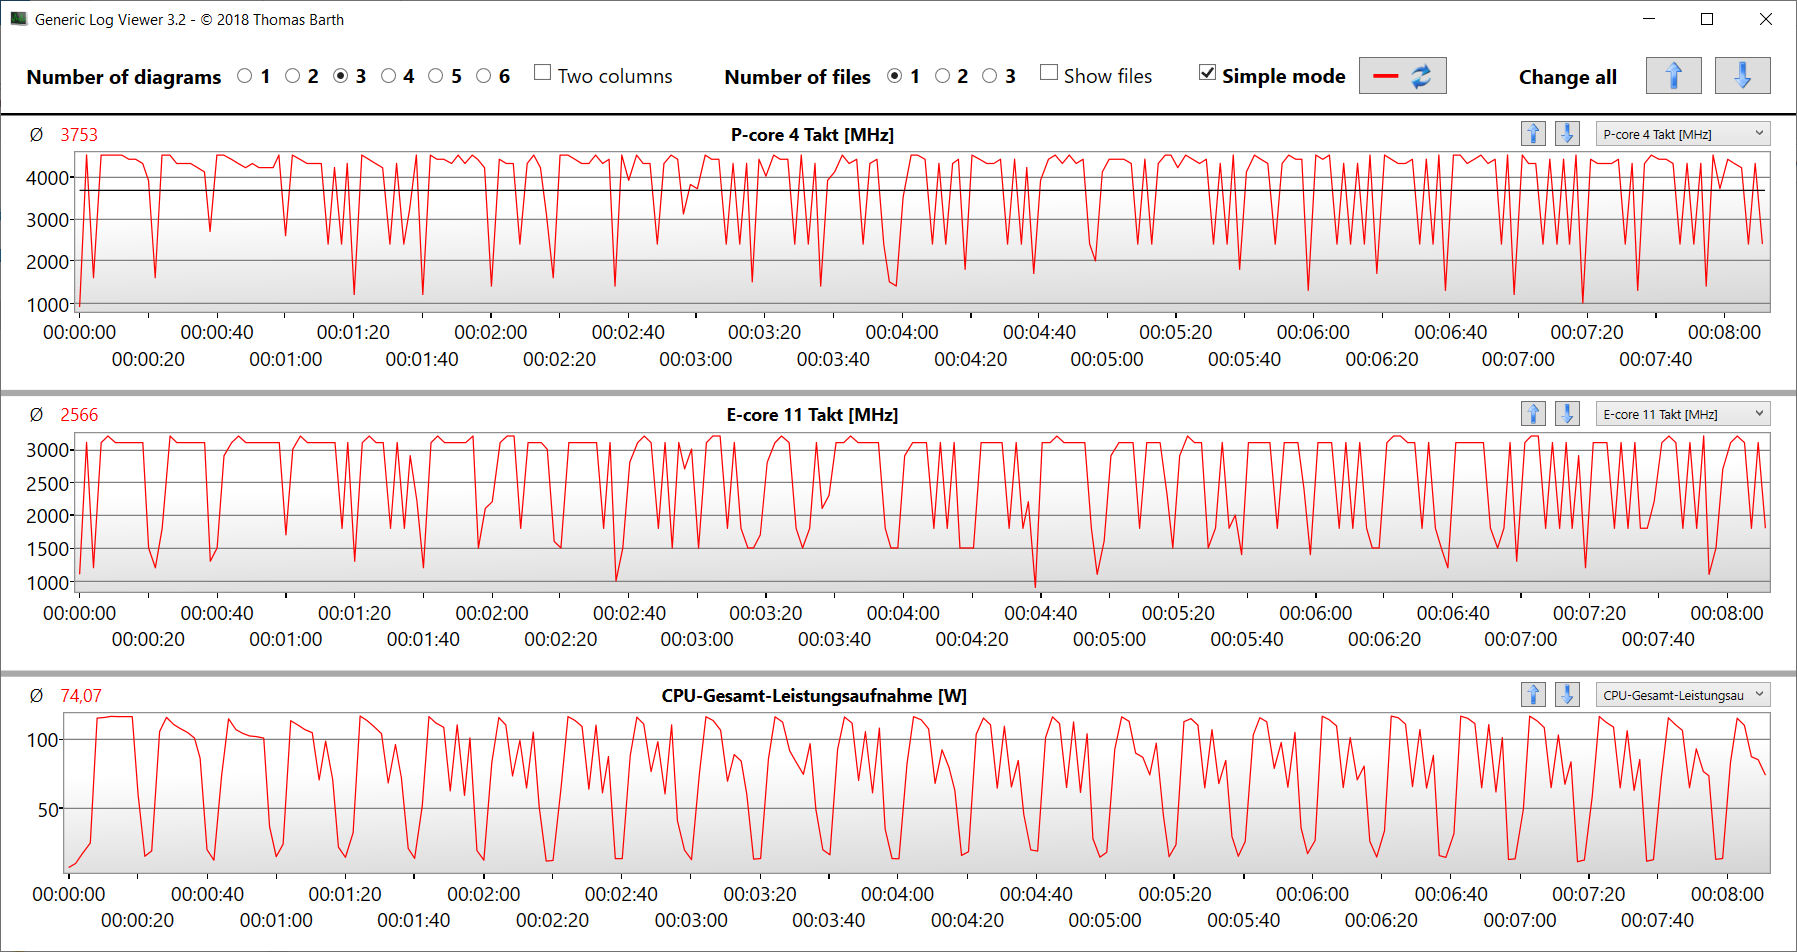
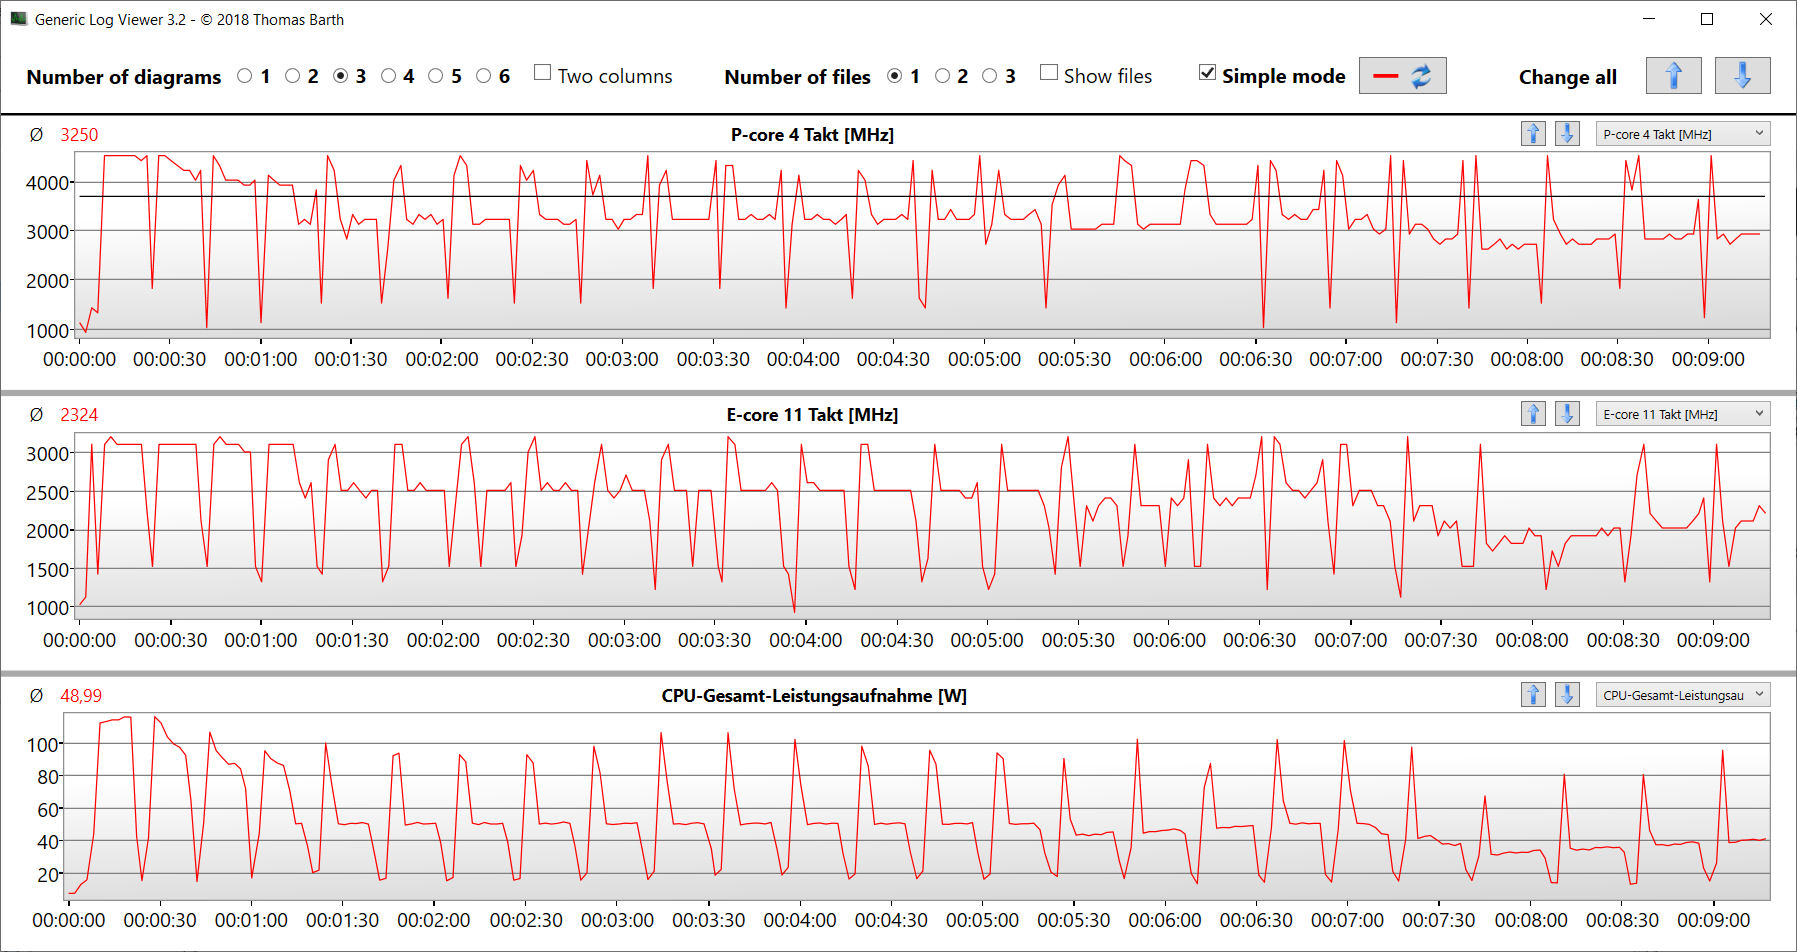
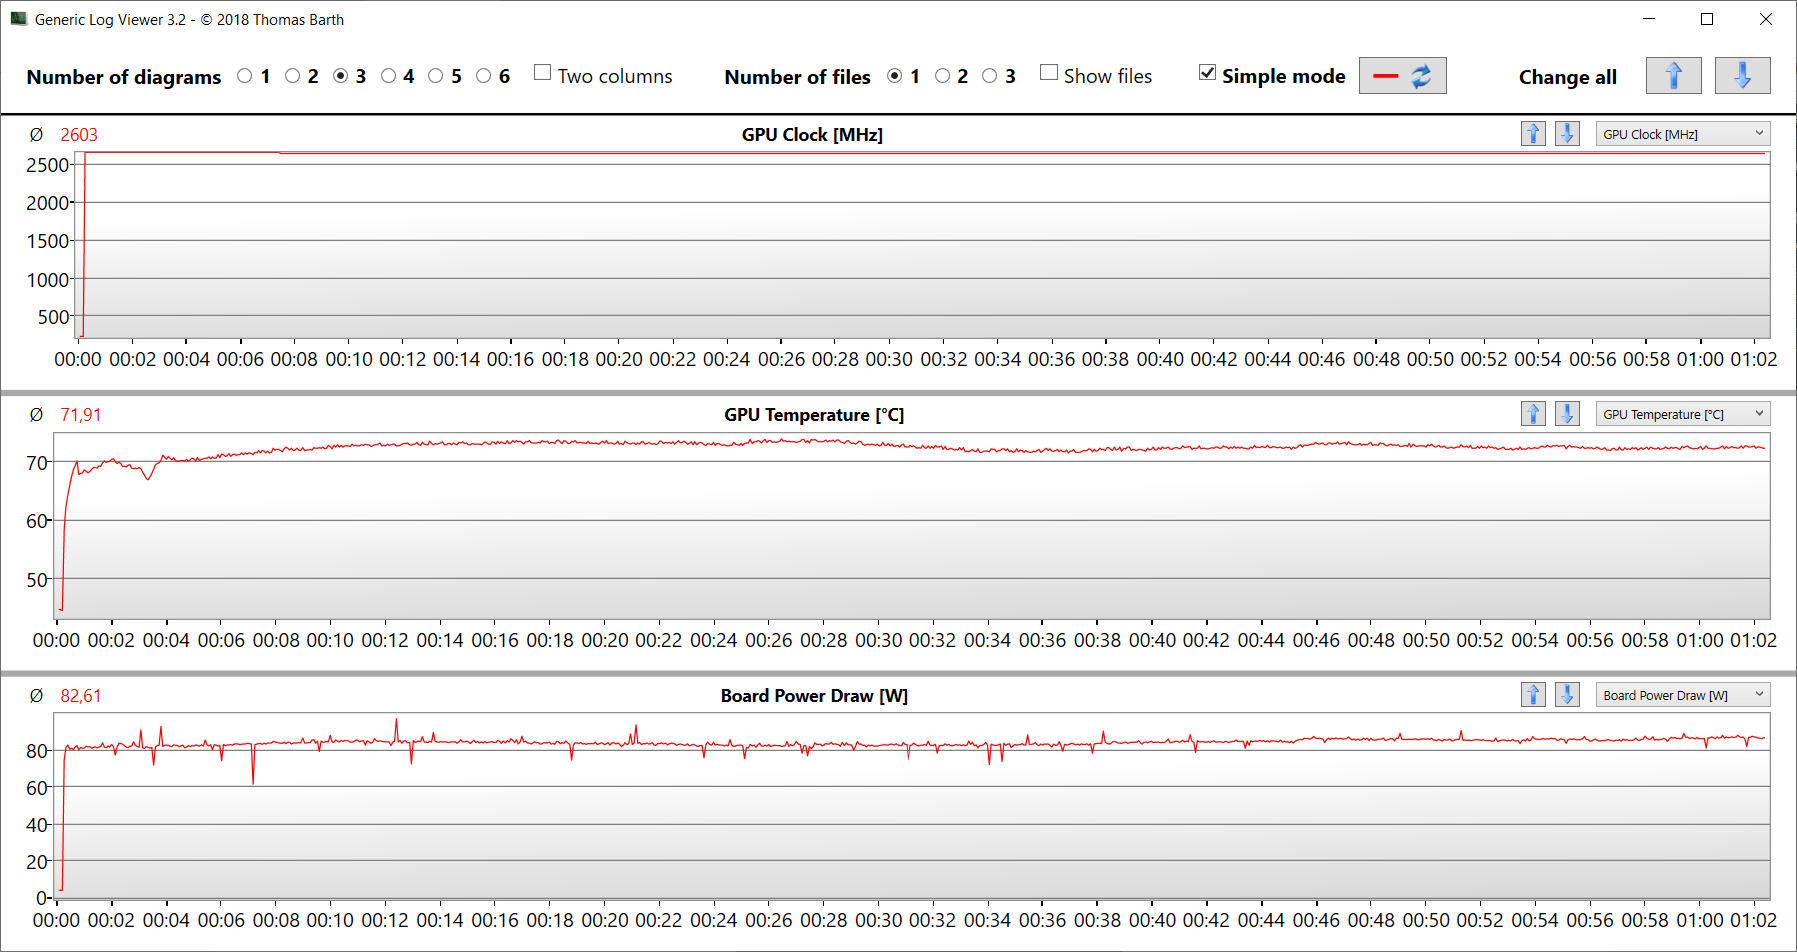
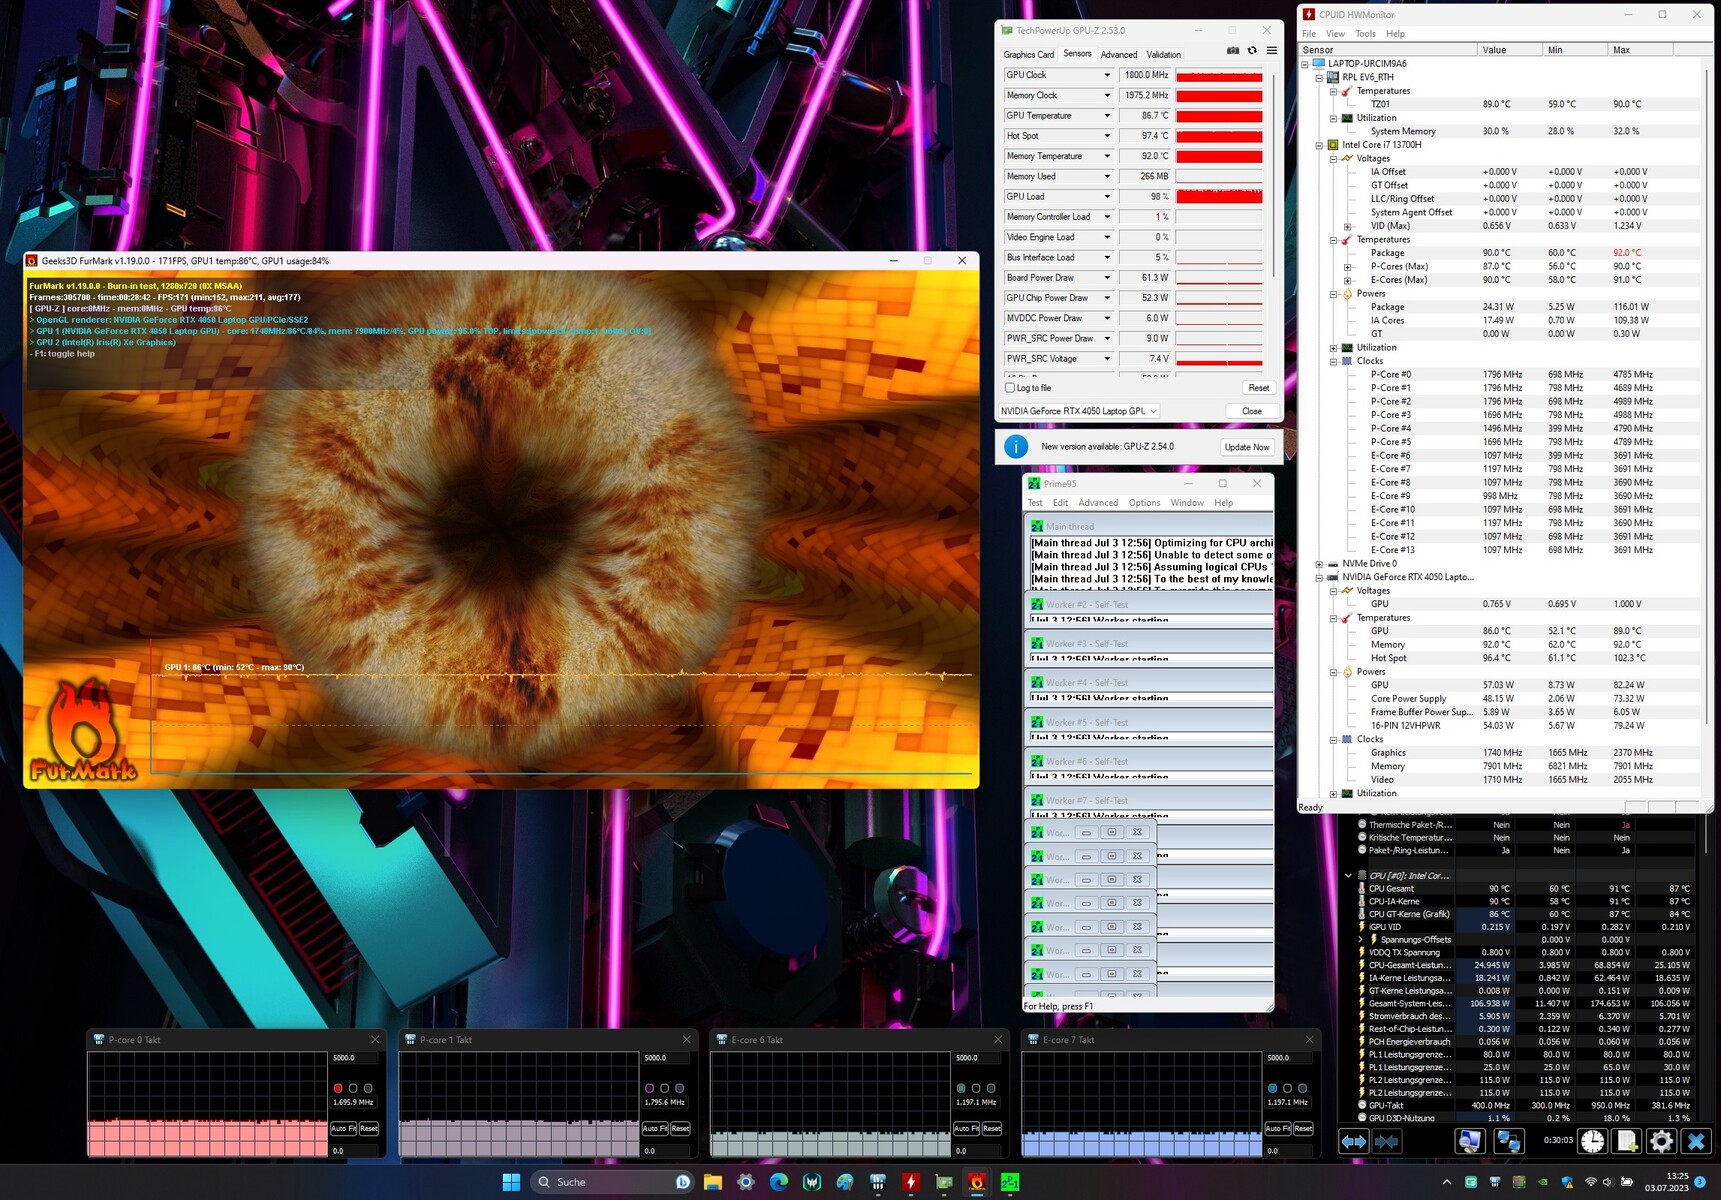
Test warunków skrajnych
Test warunków skrajnych (Prime95 i Furmark w trybie ciągłym) to ekstremalny scenariusz, który bada stabilność systemu pod pełnym obciążeniem. Prędkość zegara CPU spada początkowo z 4,4 do 4,5 GHz (P) i 3,1 GHz (E), a następnie stopniowo z 2,1 do 2,2 GHz (P) i 1,3 GHz (E). Częstotliwość taktowania GPU ustabilizowała się na poziomie 1750 i 1800 MHz.
Głośniki
Głośniki stereo generują przyzwoity dźwięk, który jest w większości pozbawiony basów. Lepsze wrażenia dźwiękowe można uzyskać, korzystając ze słuchawek lub zewnętrznego głośnika.
Acer Predator Triton 14 PT14-51 analiza dźwięku
(±) | głośność głośnika jest średnia, ale dobra (80 dB)
Bas 100 - 315 Hz
(-) | prawie brak basu - średnio 18% niższa od mediany
(±) | liniowość basu jest średnia (11.8% delta do poprzedniej częstotliwości)
Średnie 400 - 2000 Hz
(+) | zbalansowane środki średnie - tylko 3.7% od mediany
(+) | średnie są liniowe (4% delta do poprzedniej częstotliwości)
Wysokie 2–16 kHz
(+) | zrównoważone maksima - tylko 2.9% od mediany
(±) | liniowość wysokich wartości jest średnia (7.2% delta do poprzedniej częstotliwości)
Ogólnie 100 - 16.000 Hz
(±) | liniowość ogólnego dźwięku jest średnia (15.4% różnicy w stosunku do mediany)
W porównaniu do tej samej klasy
» 34% wszystkich testowanych urządzeń w tej klasie było lepszych, 7% podobnych, 59% gorszych
» Najlepszy miał deltę 6%, średnia wynosiła ###średnia###%, najgorsza wynosiła 132%
W porównaniu do wszystkich testowanych urządzeń
» 22% wszystkich testowanych urządzeń było lepszych, 4% podobnych, 73% gorszych
» Najlepszy miał deltę 4%, średnia wynosiła ###średnia###%, najgorsza wynosiła 134%
Razer Blade 14 RTX 4070 analiza dźwięku
(+) | głośniki mogą odtwarzać stosunkowo głośno (82.7 dB)
Bas 100 - 315 Hz
(-) | prawie brak basu - średnio 15.9% niższa od mediany
(±) | liniowość basu jest średnia (12.3% delta do poprzedniej częstotliwości)
Średnie 400 - 2000 Hz
(+) | zbalansowane środki średnie - tylko 4.3% od mediany
(+) | średnie są liniowe (3.1% delta do poprzedniej częstotliwości)
Wysokie 2–16 kHz
(±) | wyższe maksima - średnio 6.2% wyższe od mediany
(+) | wzloty są liniowe (5.5% delta do poprzedniej częstotliwości)
Ogólnie 100 - 16.000 Hz
(±) | liniowość ogólnego dźwięku jest średnia (16.7% różnicy w stosunku do mediany)
W porównaniu do tej samej klasy
» 43% wszystkich testowanych urządzeń w tej klasie było lepszych, 10% podobnych, 47% gorszych
» Najlepszy miał deltę 6%, średnia wynosiła ###średnia###%, najgorsza wynosiła 132%
W porównaniu do wszystkich testowanych urządzeń
» 29% wszystkich testowanych urządzeń było lepszych, 7% podobnych, 64% gorszych
» Najlepszy miał deltę 4%, średnia wynosiła ###średnia###%, najgorsza wynosiła 134%
Zarządzanie energią - komputer Acer osiąga przyzwoite poziomy wytrzymałości
Zużycie energii
Nie ma nic nienormalnego w zużyciu energii przez komputer. Wyniki mieszczą się w normalnym zakresie dla zainstalowanego sprzętu. Test obciążeniowy i test Witcher 3 zostały przeprowadzone przy spadającym lub stałym poborze mocy. Zasilacz (230 W) jest więcej niż wystarczający.
| wyłączony / stan wstrzymania | |
| luz | |
| obciążenie |
|
Legenda:
min: | |
| Acer Predator Triton 14 PT14-51 i7-13700H, GeForce RTX 4050 Laptop GPU | Razer Blade 14 RTX 4070 R9 7940HS, GeForce RTX 4070 Laptop GPU | Asus ROG Zephyrus G14 GA402RJ R7 6800HS, Radeon RX 6700S | MSI Stealth 14 Studio A13V i7-13700H, GeForce RTX 4050 Laptop GPU | Gigabyte Aero 14 OLED BMF i7-13700H, GeForce RTX 4050 Laptop GPU | Apple MacBook Pro 14 2023 M2 Pro Entry M2 Pro 10-Core, M2 Pro 16-Core GPU | Przeciętny NVIDIA GeForce RTX 4050 Laptop GPU | Średnia w klasie Gaming | |
|---|---|---|---|---|---|---|---|---|
| Power Consumption | -30% | -10% | -4% | 40% | 52% | 9% | -17% | |
| Idle Minimum * (Watt) | 12 | 19.5 -63% | 12 -0% | 10.4 13% | 7.4 38% | 2.5 79% | 9.95 ? 17% | 13.3 ? -11% |
| Idle Average * (Watt) | 14 | 24.7 -76% | 18 -29% | 19.1 -36% | 8.3 41% | 12.1 14% | 15.8 ? -13% | 19 ? -36% |
| Idle Maximum * (Watt) | 26 | 27 -4% | 26 -0% | 19.4 25% | 8.7 67% | 12.3 53% | 20.1 ? 23% | 24.5 ? 6% |
| Load Average * (Watt) | 88 | 83.2 5% | 88 -0% | 95.9 -9% | 76 14% | 49.8 43% | 88 ? -0% | 108.1 ? -23% |
| Witcher 3 ultra * (Watt) | 114.9 | 165.8 -44% | 157.7 -37% | 141.6 -23% | 70 39% | 46.6 59% | ||
| Load Maximum * (Watt) | 213 | 204.5 4% | 194 9% | 203 5% | 132 38% | 71.4 66% | 176.3 ? 17% | 254 ? -19% |
* ... im mniej tym lepiej
Power consumption Witcher 3 / stress test
Power consumption with an external monitor
Żywotność baterii
W teście Wi-Fi (ładowanie stron internetowych za pomocą skryptu) i teście wideo (krótki film Big Buck Bunny (kodowanie H.264, FHD) w pętli), 14-calowe urządzenie osiągnęło czasy pracy wynoszące odpowiednio 5 godzin i 2 minuty oraz 8 godzin i 59 minut. Podczas obu testów funkcje oszczędzania energii laptopa były wyłączone, a jasność wyświetlacza ustawiona na około 150 cd/m². Ponadto test wideo został przeprowadzony przy wyłączonym module radiowym.
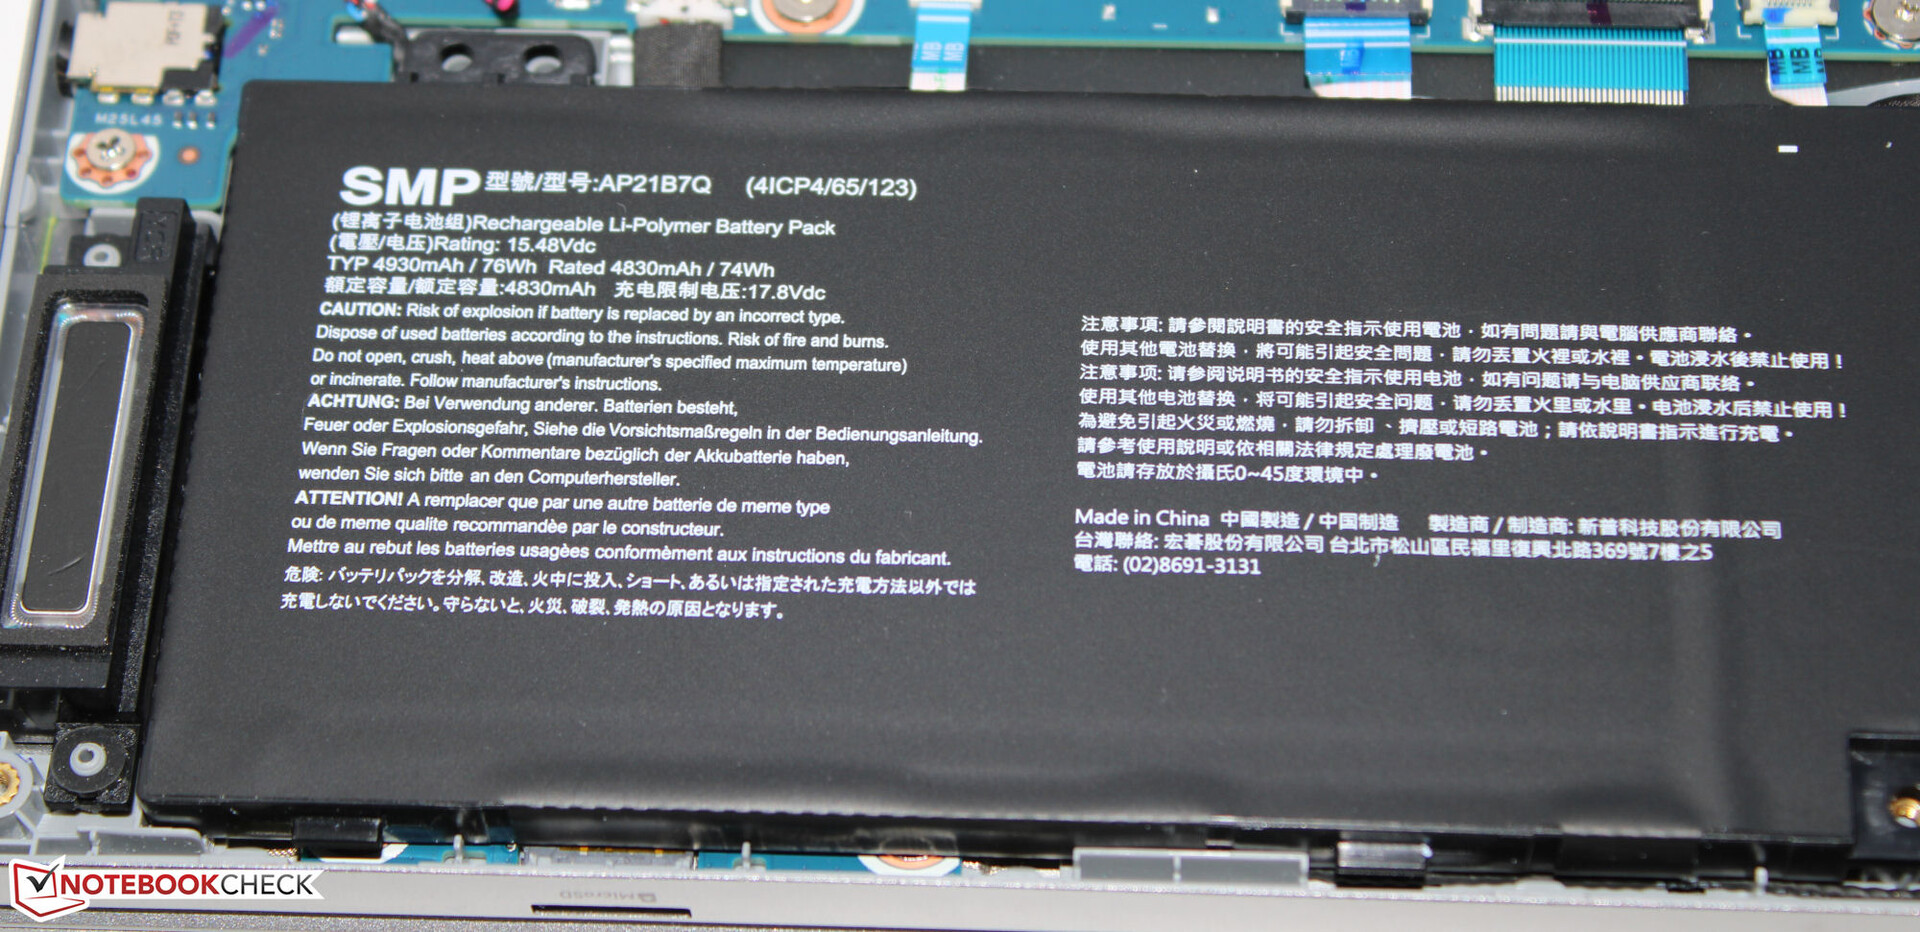
| Acer Predator Triton 14 PT14-51 i7-13700H, GeForce RTX 4050 Laptop GPU, 76.3 Wh | Razer Blade 14 RTX 4070 R9 7940HS, GeForce RTX 4070 Laptop GPU, 68 Wh | Asus ROG Zephyrus G14 GA402RJ R7 6800HS, Radeon RX 6700S, 76 Wh | MSI Stealth 14 Studio A13V i7-13700H, GeForce RTX 4050 Laptop GPU, 72 Wh | Gigabyte Aero 14 OLED BMF i7-13700H, GeForce RTX 4050 Laptop GPU, 63 Wh | Apple MacBook Pro 14 2023 M2 Pro Entry M2 Pro 10-Core, M2 Pro 16-Core GPU, 70 Wh | Średnia w klasie Gaming | |
|---|---|---|---|---|---|---|---|
| Czasy pracy | -14% | 104% | -11% | 12% | 120% | -2% | |
| Reader / Idle (h) | 11.2 | 8.6 -23% | 11.3 1% | 8.71 ? -22% | |||
| H.264 (h) | 9 | 6.6 -27% | 16.4 82% | 8.26 ? -8% | |||
| WiFi v1.3 (h) | 5 | 6.2 24% | 10.2 104% | 6.3 26% | 7.6 52% | 12.9 158% | 7.01 ? 40% |
| Load (h) | 1.8 | 1 -44% | 1.2 -33% | 1.5 -17% | 1.47 ? -18% |
Za
Przeciw
Werdykt - Kompaktowa moc
Główne zastosowania 14-calowego laptopa powinny dotyczyć renderowania i gier. Core i7-13700H i GeForce RTX 4050 zapewniają niezbędną moc, a oba układy działają ze stałą wysoką częstotliwością taktowania. Jeśli wymagana jest większa moc graficzna, Acer ma również w ofercie warianty GeForce RTX 4070.
Tona mocy obliczeniowej w 14-calowej obudowie: Wraz z Predator Triton 14, Acer dostarczył potężnego laptopa.
Laptop wyraźnie się nagrzewa i może wytwarzać znaczną ilość hałasu. Używaliśmy głównie trybu systemowego "Zrównoważony", który zapewniał jedynie umiarkowany hałas w tle przy stosunkowo niewielkiej utracie wydajności.
Ogólnie rzecz biorąc, wyświetlacz 16:10 (2560 x 1600 pikseli, IPS, 165 Hz, G-Sync) jest imponujący. Wyróżnia się wysoką jasnością i pokryciem DCI P3. Do tego dochodzi rzeczywisty czas pracy na baterii wynoszący od 5 do 9 godzin. Pozytywne: Akumulator można ładować za pomocą zasilacza sieciowego USB-C (min. 65 W, 20 V). Obsługiwane jest Power Delivery. Oznacza to, że nie musisz mieć ze sobą własnego zasilacza (230 W), gdziekolwiek jesteś.
Słabości Predatora leżą głównie w jego pamięci masowej: Skromna pojemność dysku SSD (512 GB), brak miejsca na dodatkowe dyski SSD, przylutowana pamięć RAM bez możliwości rozbudowy i bardzo wolno działający czytnik kart pamięci. Podsumowując, od laptopa w tej kategorii cenowej należy oczekiwać więcej.
Alternatywą może być modelMSI Stealth 14 Studio A13V. Jest wyposażony w ten sam procesor i kartę graficzną, oferując nieco więcej mocy niż Predator i zdobywa dodatkowe punkty za dwa banki pamięci RAM. Jednak przy cenie około 2000 USD nie jest to jedno z najtańszych urządzeń.
Cena i dostępność
Recenzowany wariant laptopa Acer można obecnie kupić na Amazon za 1440 USD.
Acer Predator Triton 14 PT14-51
- 24/07/2023 v7 (old)
Sascha Mölck
Przezroczystość
Wyboru urządzeń do recenzji dokonuje nasza redakcja. Próbka testowa została udostępniona autorowi jako pożyczka od producenta lub sprzedawcy detalicznego na potrzeby tej recenzji. Pożyczkodawca nie miał wpływu na tę recenzję, producent nie otrzymał też kopii tej recenzji przed publikacją. Nie było obowiązku publikowania tej recenzji. Jako niezależna firma medialna, Notebookcheck nie podlega władzy producentów, sprzedawców detalicznych ani wydawców.
Tak testuje Notebookcheck
Każdego roku Notebookcheck niezależnie sprawdza setki laptopów i smartfonów, stosując standardowe procedury, aby zapewnić porównywalność wszystkich wyników. Od około 20 lat stale rozwijamy nasze metody badawcze, ustanawiając przy tym standardy branżowe. W naszych laboratoriach testowych doświadczeni technicy i redaktorzy korzystają z wysokiej jakości sprzętu pomiarowego. Testy te obejmują wieloetapowy proces walidacji. Nasz kompleksowy system ocen opiera się na setkach uzasadnionych pomiarów i benchmarków, co pozwala zachować obiektywizm.Price comparison

