
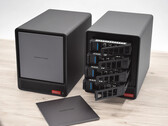
88 TB pamięci masowej w teście: Aoostar WTR Pro to NAS i mini PC w jednym
Wydajna hybryda NAS i Mini-PC, która może być używana elastycznie i nadaje się zarówno do prostych, jak i wymagających zadań - to właśnie obiecuje Aoostar WTR Pro. Dzięki dwóm wariantom procesorów, ekonomicznemu Intel N100 i potężnemu AMD Ryzen 7 5825U, urządzenie jest skierowane do różnych grup użytkowników. Przetestowaliśmy Aoostar WTR Pro i sprawdziliśmy jego wydajność, poziom hałasu i efektywność energetyczną.
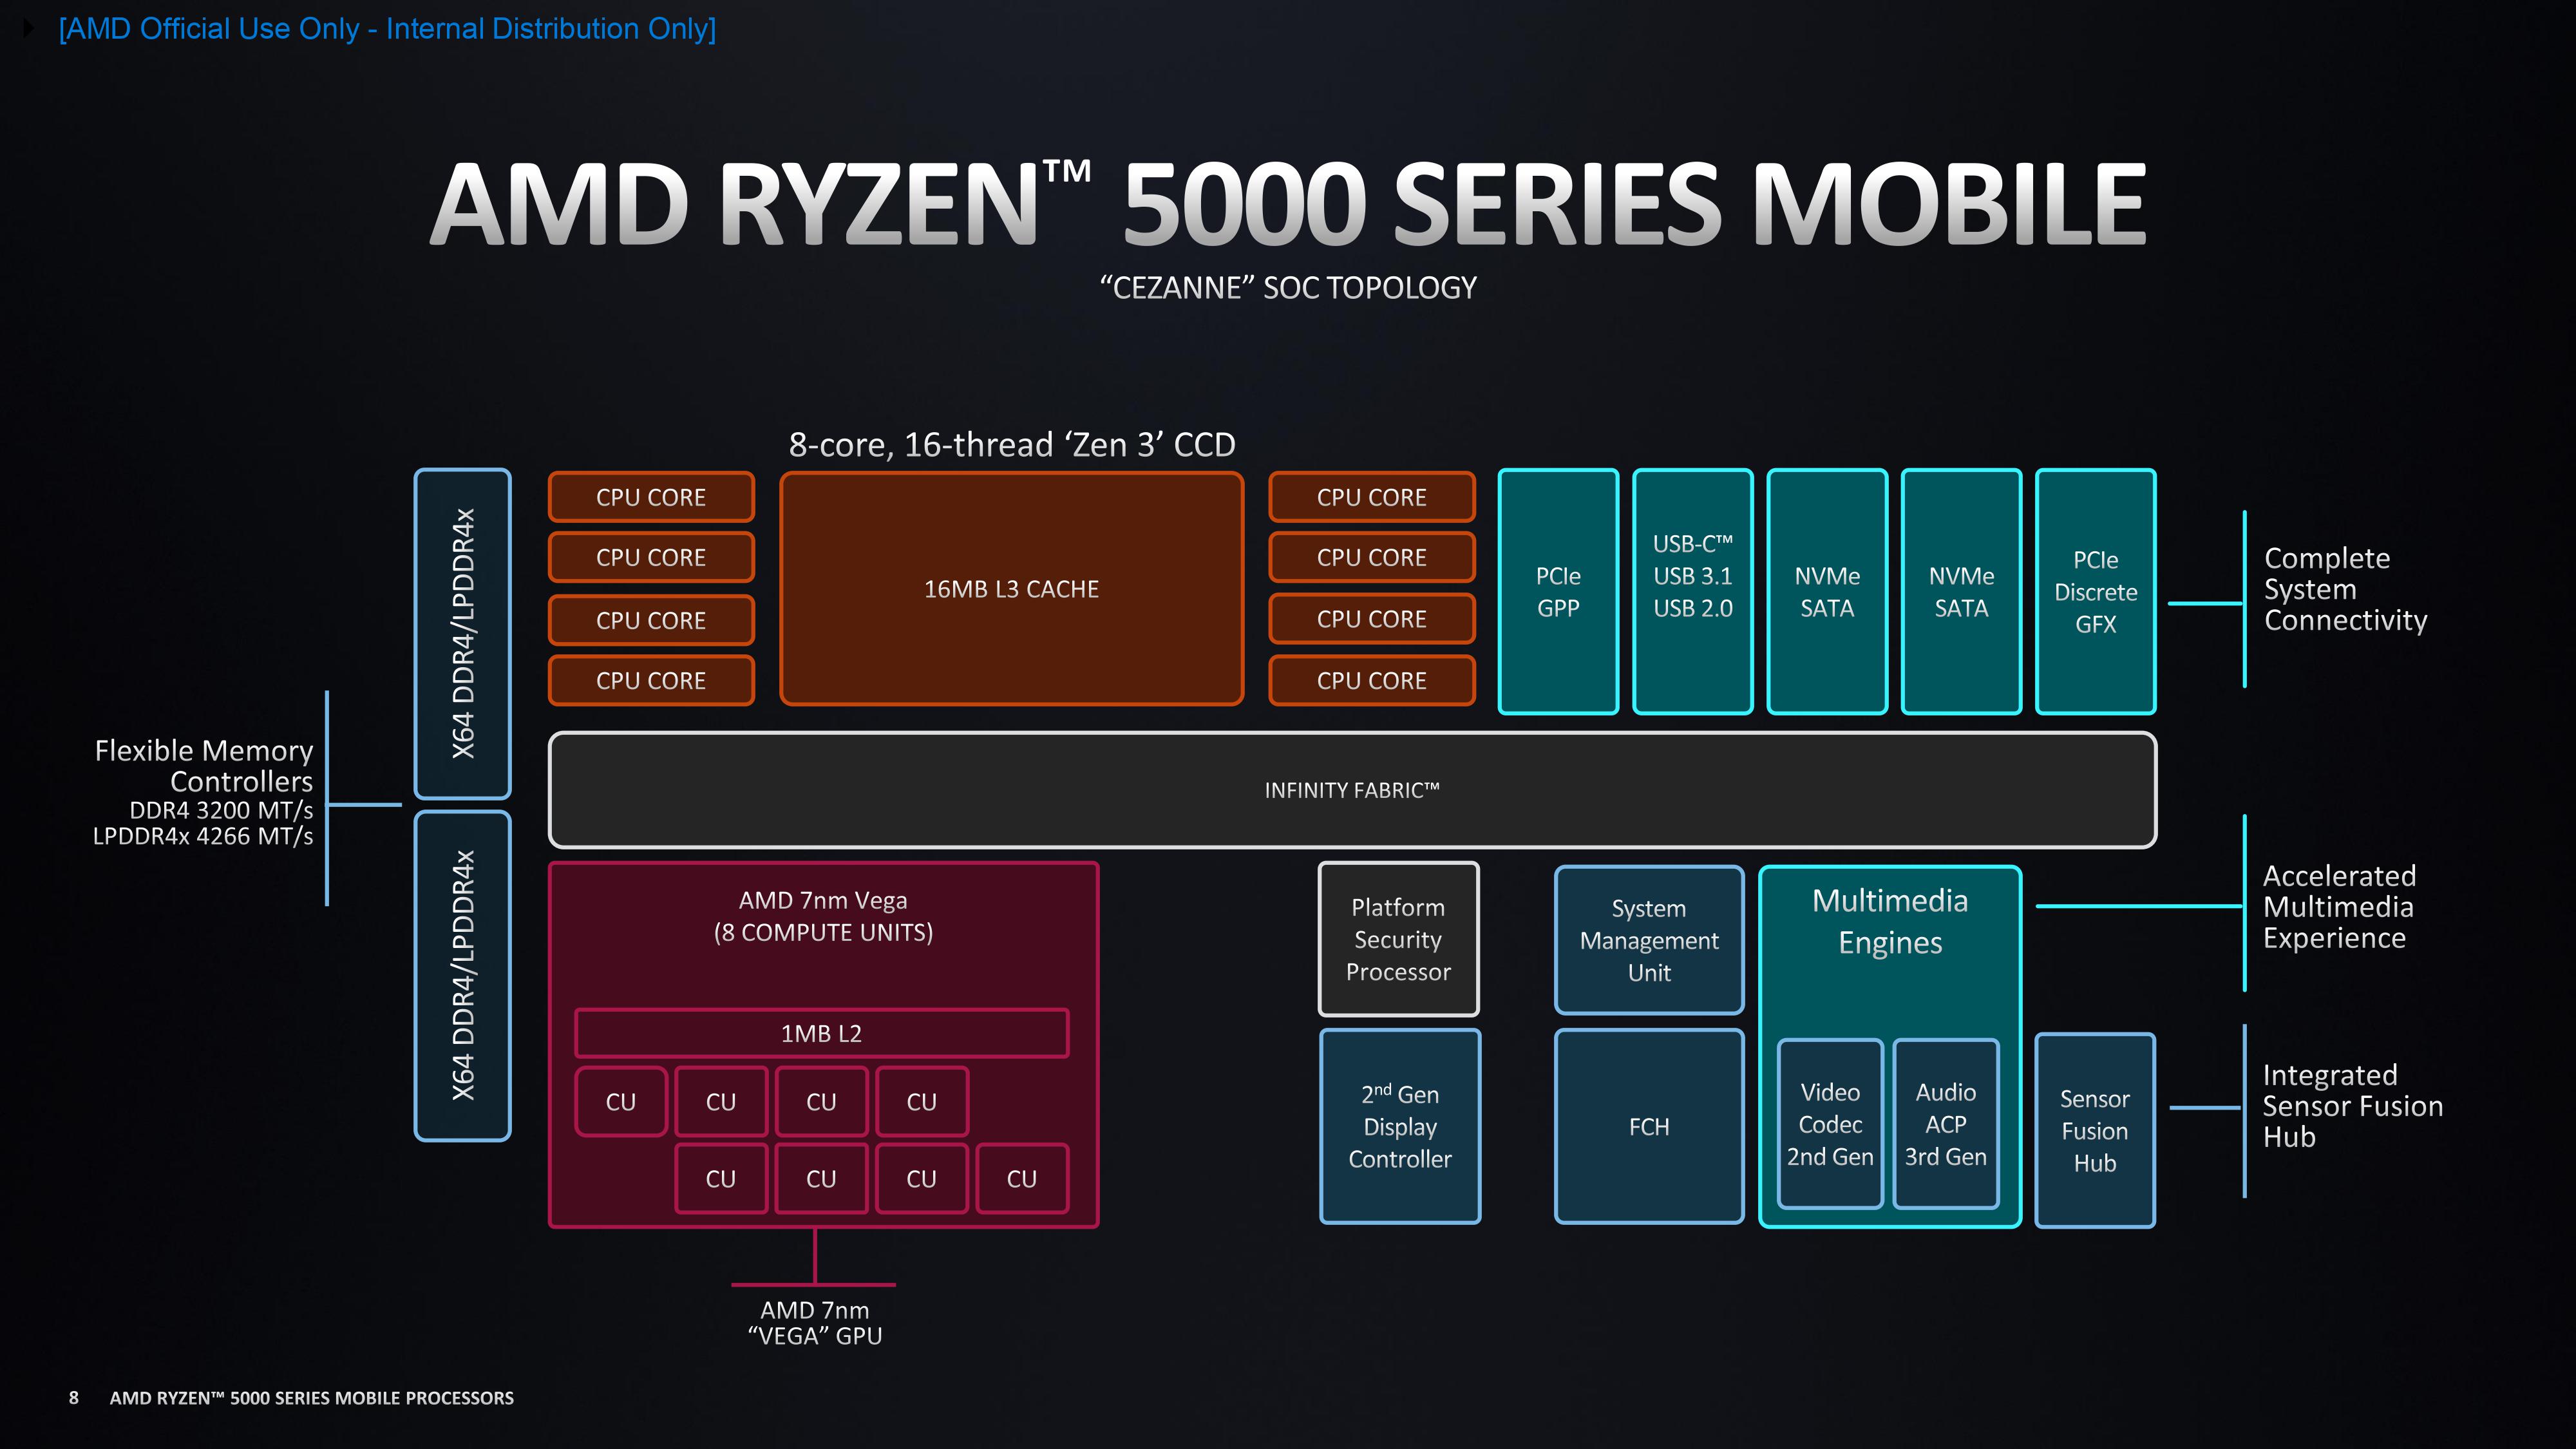
AMD Ryzen 7 5825U, Vega 8, 4.6 kg